UNITED STATES
SECURITIES AND EXCHANGE COMMISSION
Washington, D.C. 20549
FORM N-CSR
CERTIFIED SHAREHOLDER REPORT OF REGISTERED
MANAGEMENT INVESTMENT COMPANIES
Investment Company Act file number 811-04085
Fidelity Income Fund
(Exact name of registrant as specified in charter)
245 Summer St., Boston, Massachusetts 02210
(Address of principal executive offices) (Zip code)
Cynthia Lo Bessette, Secretary
245 Summer St.
Boston, Massachusetts 02210
(Name and address of agent for service)
Registrant's telephone number, including area code:
617-563-7000
| |
Date of fiscal year end: | August 31 |
|
|
Date of reporting period: | August 31, 2022 |
Item 1.
Reports to Stockholders
Fidelity® Government Income Fund
Annual Report
August 31, 2022
Includes Fidelity and Fidelity Advisor share classes


Contents
To view a fund's proxy voting guidelines and proxy voting record for the 12-month period ended June 30, visit http://www.fidelity.com/proxyvotingresults or visit the Securities and Exchange Commission's (SEC) web site at http://www.sec.gov.
You may also call 1-800-544-8544 if you’re an individual investing directly with Fidelity, call 1-800-835-5092 if you’re a plan sponsor or participant with Fidelity as your recordkeeper or call 1-877-208-0098 on institutional accounts or if you’re an advisor or invest through one to request a free copy of the proxy voting guidelines.
Standard & Poor's, S&P and S&P 500 are registered service marks of The McGraw-Hill Companies, Inc. and have been licensed for use by Fidelity Distributors Corporation.
Other third-party marks appearing herein are the property of their respective owners.
All other marks appearing herein are registered or unregistered trademarks or service marks of FMR LLC or an affiliated company. © 2022 FMR LLC. All rights reserved.
This report and the financial statements contained herein are submitted for the general information of the shareholders of the Fund. This report is not authorized for distribution to prospective investors in the Fund unless preceded or accompanied by an effective prospectus.
A fund files its complete schedule of portfolio holdings with the SEC for the first and third quarters of each fiscal year on Form N-PORT. Forms N-PORT are available on the SEC’s web site at http://www.sec.gov. A fund's Forms N-PORT may be reviewed and copied at the SEC’s Public Reference Room in Washington, DC. Information regarding the operation of the SEC's Public Reference Room may be obtained by calling 1-800-SEC-0330.
For a complete list of a fund's portfolio holdings, view the most recent holdings listing, semiannual report, or annual report on Fidelity's web site at http://www.fidelity.com, http://www.institutional.fidelity.com, or http://www.401k.com, as applicable.
NOT FDIC INSURED •MAY LOSE VALUE •NO BANK GUARANTEE
Neither the Fund nor Fidelity Distributors Corporation is a bank.
Performance: The Bottom Line
Average annual total return reflects the change in the value of an investment, assuming reinvestment of distributions from dividend income and capital gains (the profits earned upon the sale of securities that have grown in value, if any) and assuming a constant rate of performance each year. The hypothetical investment and the average annual total returns do not reflect the deduction of taxes that a shareholder would pay on fund distributions or the redemption of fund shares. During periods of reimbursement by Fidelity, a fund’s total return will be greater than it would be had the reimbursement not occurred. How a fund did yesterday is no guarantee of how it will do tomorrow.
Average Annual Total Returns
| For the periods ended August 31, 2022 | Past 1 year | Past 5 years | Past 10 years |
| Class A (incl. 4.00% sales charge) | (14.66)% | (1.09)% | (0.01)% |
| Class M (incl. 4.00% sales charge) | (14.57)% | (1.08)% | 0.01% |
| Class C (incl. contingent deferred sales charge) | (12.66)% | (1.05)% | (0.20)% |
| Fidelity® Government Income Fund | (10.84)% | 0.01% | 0.72% |
| Class I | (10.85)% | (0.01)% | 0.68% |
| Class Z | (10.74)% | 0.09% | 0.72% |
Class C shares' contingent deferred sales charges included in the past one year, past five years and past ten years total return figures are 1%, 0% and 0%, respectively.
The initial offering of Class Z shares took place on October 2, 2018. Returns prior to October 2, 2018, are those of Class I.
$10,000 Over 10 Years
Let's say hypothetically that $10,000 was invested in Fidelity® Government Income Fund, a class of the fund, on August 31, 2012.
The chart shows how the value of your investment would have changed, and also shows how the Bloomberg U.S. Government Bond Index performed over the same period.
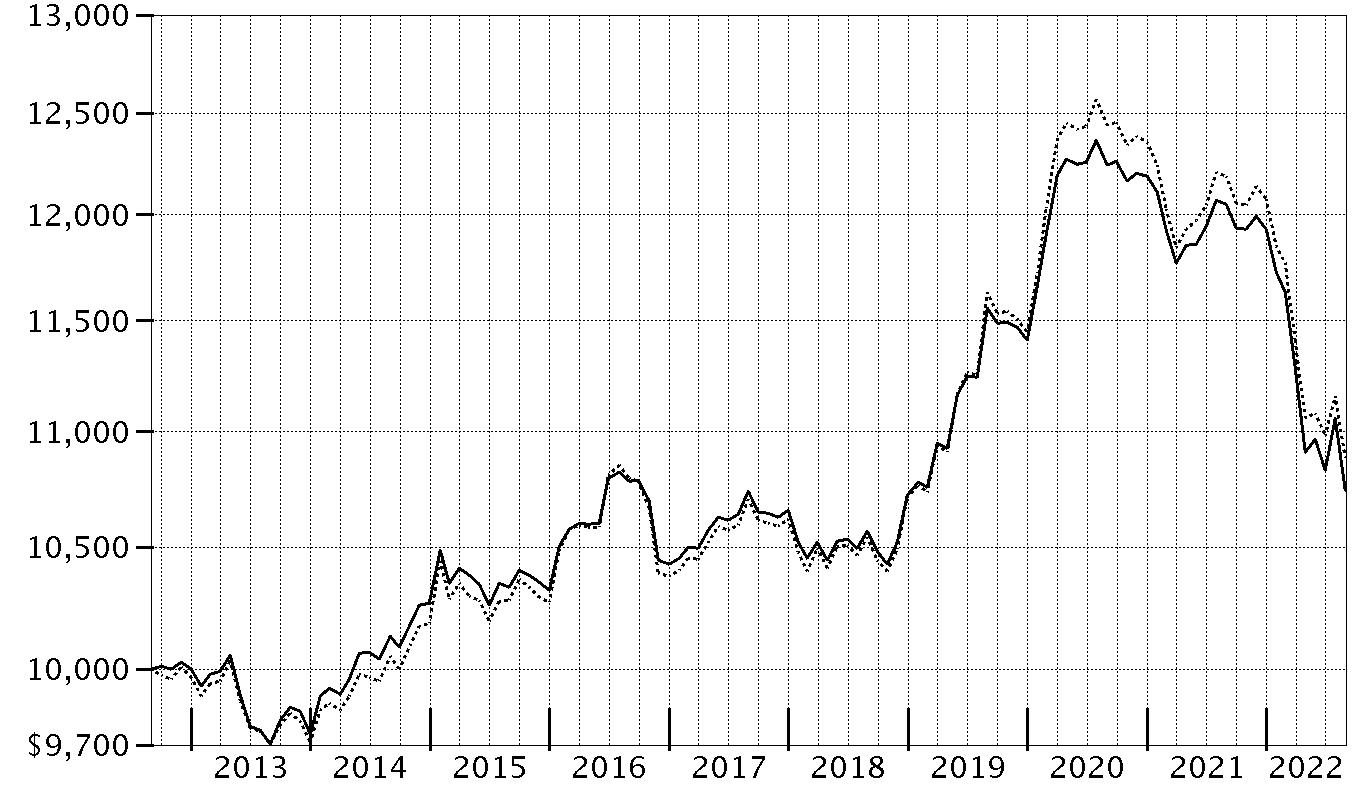
| Period Ending Values |
| $10,744 | Fidelity® Government Income Fund |
| $10,882 | Bloomberg U.S. Government Bond Index |
Management's Discussion of Fund Performance
Market Recap: U.S. taxable investment-grade bonds notably declined for the 12 months ending August 31, 2022, as the U.S. Federal Reserve took aggressive action to stymie high inflation. The Bloomberg U.S. Aggregate Bond Index returned -11.52% for the period. In late 2021, bond yields rose when the Fed pivoted from an “easy” to a “tight” monetary stance. Its first step was to cease its purchases of bonds, part of a quantitative easing program to support the U.S. economy that began in 2008. In the first half of 2022, the Fed took more aggressive steps to thwart inflation. The central bank raised the federal funds target rate by 25 basis points (0.25%) in mid-March, 50 basis points in May and 75 basis points in June – its largest increase since 1994 – and said it was becoming more difficult to achieve a soft landing, in which the economy slows enough to bring down inflation while avoiding a recession. It also began to allow up to billions in Treasuries and mortgage bonds to mature every month without investing the proceeds. Despite another rate hike of 75 basis points in July, the index rose 2.44% for the month, only to reverse course (-2.83%) in August, when the Fed dashed hopes that it would soon “pivot” to an easier policy stance. For the full 12 months, shorter-term securities outpaced longer-term bonds, and higher-quality issues held up better than lower-rated bonds. Within the index, corporate bonds posted a return of -14.61%, trailing the -10.80% result for U.S. Treasuries. Outside the index, U.S. corporate high-yield bonds returned -10.43%, while U.S. Treasury Inflation-Protected Securities had a return of -5.98%.
Comments from Co-Portfolio Managers Franco Castagliuolo and Sean Corcoran: For the fiscal year ending August 31, 2022, the fund’s share classes (excluding sales charges, if applicable) returned roughly -12% to -11%, net of fees, compared to -10.45% for the Bloomberg 75% U.S. Government/25% U.S. Mortgage-Backed Securities Blended Index. In managing the fund the past 12 months, we attempted to exploit market inefficiencies and identify attractively valued securities, in accordance with our longer-term strategy. Versus the index, yield-curve positioning contributed to performance, particularly the fund’s overweighting in bonds with a duration of five years and longer. Our decisions to periodically overweight and underweight agency debentures also aided relative performance. Underweighting mortgage-backed securities made up of 15- and 20-year mortgages, which failed to keep pace with the index, provided another relative performance boost. In contrast, overweighting 30-year MBS issued by Fannie Mae and Freddie Mac detracted from relative performance, given that they lagged the index. Overweighting Ginnie Mae securities with coupons of 3.5%, which likewise trailed the index, also crimped our relative result. Lastly, overweighting government agency commercial mortgage-backed securities, another segment that underperformed the index, detracted.
The views expressed above reflect those of the portfolio manager(s) only through the end of the period as stated on the cover of this report and do not necessarily represent the views of Fidelity or any other person in the Fidelity organization. Any such views are subject to change at any time based upon market or other conditions and Fidelity disclaims any responsibility to update such views. These views may not be relied on as investment advice and, because investment decisions for a Fidelity fund are based on numerous factors, may not be relied on as an indication of trading intent on behalf of any Fidelity fund.
Investment Summary (Unaudited)
The information in the following tables is based on the combined investments of the Fund and its pro-rata share of the investments of Fidelity's Fixed-Income Central Funds.
Coupon Distribution as of August 31, 2022
| | % of fund's investments |
| Zero coupon bonds | 0.0 |
| 0.01 - 0.99% | 12.2 |
| 1 - 1.99% | 14.3 |
| 2 - 2.99% | 34.6 |
| 3 - 3.99% | 11.9 |
| 4 - 4.99% | 5.5 |
| 5 - 5.99% | 2.2 |
| 6 - 6.99% | 0.1 |
| 7% and above | 0.0 |
Coupon distribution shows the range of stated interest rates on the fund's investments, excluding short-term investments.
Asset Allocation (% of fund's net assets)
| As of August 31, 2022*,** |
| | Mortgage Securities | 26.9% |
| | CMOs and Other Mortgage Related Securities | 5.7% |
| | U.S. Treasury Obligations | 63.0% |
| | U.S. Government Agency Obligations | 0.9% |
| | Foreign Government & Government Agency Obligations | 0.1% |
| | Short-Term Investments and Net Other Assets (Liabilities) | 3.4% |
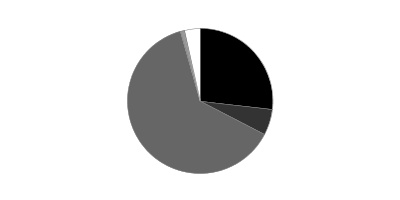
* Foreign investments - 0.1%
** Futures and Swaps - 12.6%
An unaudited holdings listing for the Fund, which presents direct holdings as well as the pro-rata share of any securities and other investments held indirectly through its investment in underlying non-money market Fidelity Central Funds, is available at fidelity.com and/or institutional.fidelity.com, as applicable.
Percentages in the above tables are adjusted for the effect of TBA Sale Commitments.
Percentages shown as 0.0% may reflect amounts less than 0.05%.
Schedule of Investments August 31, 2022
Showing Percentage of Net Assets
| U.S. Government and Government Agency Obligations - 63.9% | | | |
| | | Principal Amount (000s) | Value (000s) |
| U.S. Government Agency Obligations - 0.7% | | | |
| Freddie Mac 4% 11/25/24 | | 18,000 | 17,998 |
| Tennessee Valley Authority: | | | |
| 5.25% 9/15/39 | | $2,235 | $2,520 |
| 5.375% 4/1/56 | | 2,737 | 3,314 |
| | | | 23,832 |
| U.S. Treasury Obligations - 63.0% | | | |
| U.S. Treasury Bonds: | | | |
| 1.875% 11/15/51 | | 25,104 | 18,281 |
| 2% 11/15/41 | | 49,958 | 38,807 |
| 2% 8/15/51 | | 108,762 | 81,707 |
| 2.25% 2/15/52 | | 18,700 | 14,937 |
| 2.375% 2/15/42 | | 353 | 292 |
| 2.5% 2/15/45 (a)(b)(c) | | 141,861 | 117,268 |
| 2.875% 5/15/49 | | 4,458 | 4,054 |
| 2.875% 5/15/52 | | 10,785 | 9,939 |
| 3% 2/15/49 | | 95,774 | 89,040 |
| 3.25% 5/15/42 | | 50,666 | 48,465 |
| 3.375% 8/15/42 | | 2,500 | 2,439 |
| 4.75% 2/15/37 (a)(b) | | 55,003 | 65,112 |
| U.S. Treasury Notes: | | | |
| 0.125% 8/15/23 | | 4,413 | 4,275 |
| 0.25% 5/15/24 | | 4,258 | 4,032 |
| 0.25% 7/31/25 | | 34,133 | 31,088 |
| 0.25% 9/30/25 | | 870 | 788 |
| 0.25% 10/31/25 | | 17,700 | 15,992 |
| 0.375% 10/31/23 | | 58,000 | 55,975 |
| 0.375% 4/30/25 | | 236,870 | 218,207 |
| 0.5% 11/30/23 | | 63,200 | 60,924 |
| 0.625% 10/15/24 | | 25,100 | 23,647 |
| 0.75% 8/31/26 | | 30,000 | 27,002 |
| 0.875% 9/30/26 | | 93,224 | 84,218 |
| 1.125% 10/31/26 | | 47,300 | 43,098 |
| 1.125% 8/31/28 (a)(b)(c) | | 437,936 | 385,171 |
| 1.5% 9/30/24 | | 13,631 | 13,098 |
| 1.5% 10/31/24 | | 24,300 | 23,313 |
| 1.5% 1/31/27 | | 22,230 | 20,512 |
| 1.625% 11/15/22 | | 12,773 | 12,744 |
| 1.625% 9/30/26 | | 1,028 | 959 |
| 1.75% 7/31/24 | | 1,720 | 1,666 |
| 2% 8/15/25 | | 9,743 | 9,335 |
| 2.125% 7/31/24 | | 59,641 | 58,177 |
| 2.125% 5/15/25 | | 11,929 | 11,507 |
| 2.25% 4/30/24 | | 87,731 | 86,007 |
| 2.25% 12/31/24 | | 6,135 | 5,966 |
| 2.25% 3/31/26 | | 928 | 891 |
| 2.375% 3/31/29 | | 23,000 | 21,687 |
| 2.5% 2/28/26 | | 68,418 | 66,232 |
| 2.5% 3/31/27 | | 46,600 | 44,871 |
| 2.625% 6/30/23 | | 5,027 | 4,999 |
| 2.625% 5/31/27 | | 45,180 | 43,758 |
| 2.625% 7/31/29 | | 60,609 | 58,099 |
| 2.75% 2/15/24 | | 74,509 | 73,738 |
| 2.75% 4/30/27 | | 47,200 | 45,941 |
| 2.75% 7/31/27 | | 52,600 | 51,190 |
| 2.75% 5/31/29 | | 18,900 | 18,237 |
| 2.75% 8/15/32 (d) | | 60,911 | 58,760 |
| 2.875% 4/30/29 | | 7,778 | 7,564 |
| 2.875% 5/15/32 | | 34,392 | 33,522 |
| 3% 7/31/24 (d) | | 37,100 | 36,775 |
| 3.125% 11/15/28 | | 12,149 | 11,995 |
| | | | 2,266,301 |
| Other Government Related - 0.2% | | | |
| Private Export Funding Corp. Secured 1.75% 11/15/24 | | 8,660 | 8,308 |
| TOTAL U.S. GOVERNMENT AND GOVERNMENT AGENCY OBLIGATIONS | | | |
| (Cost $2,495,363) | | | 2,298,441 |
|
| U.S. Government Agency - Mortgage Securities - 32.9% | | | |
| Fannie Mae - 10.3% | | | |
| 12 month U.S. LIBOR + 1.360% 1.931% 10/1/35 (e)(f) | | 6 | 6 |
| 12 month U.S. LIBOR + 1.440% 1.945% 4/1/37 (e)(f) | | 1 | 1 |
| 12 month U.S. LIBOR + 1.460% 1.854% 1/1/35 (e)(f) | | 11 | 11 |
| 12 month U.S. LIBOR + 1.480% 3.787% 7/1/34 (e)(f) | | 18 | 18 |
| 12 month U.S. LIBOR + 1.530% 1.94% 3/1/36 (e)(f) | | 68 | 68 |
| 12 month U.S. LIBOR + 1.550% 1.984% 2/1/44 (e)(f) | | 27�� | 27 |
| 12 month U.S. LIBOR + 1.550% 3.181% 5/1/44 (e)(f) | | 40 | 40 |
| 12 month U.S. LIBOR + 1.550% 3.803% 6/1/36 (e)(f) | | 17 | 17 |
| 12 month U.S. LIBOR + 1.560% 1.935% 2/1/44 (e)(f) | | 58 | 58 |
| 12 month U.S. LIBOR + 1.560% 2.065% 3/1/37 (e)(f) | | 84 | 85 |
| 12 month U.S. LIBOR + 1.570% 2.139% 4/1/44 (e)(f) | | 128 | 130 |
| 12 month U.S. LIBOR + 1.570% 3.32% 5/1/44 (e)(f) | | 1 | 1 |
| 12 month U.S. LIBOR + 1.580% 1.83% 1/1/44 (e)(f) | | 59 | 60 |
| 12 month U.S. LIBOR + 1.580% 2.08% 4/1/44 (e)(f) | | 43 | 43 |
| 12 month U.S. LIBOR + 1.620% 2.245% 3/1/33 (e)(f) | | 14 | 14 |
| 12 month U.S. LIBOR + 1.620% 2.553% 5/1/35 (e)(f) | | 3 | 3 |
| 12 month U.S. LIBOR + 1.630% 1.815% 9/1/36 (e)(f) | | 1 | 1 |
| 12 month U.S. LIBOR + 1.630% 2.884% 11/1/36 (e)(f) | | 15 | 15 |
| 12 month U.S. LIBOR + 1.640% 1.895% 6/1/47 (e)(f) | | 15 | 15 |
| 12 month U.S. LIBOR + 1.640% 3.274% 5/1/36 (e)(f) | | 2 | 3 |
| 12 month U.S. LIBOR + 1.680% 2.704% 7/1/43 (e)(f) | | 27 | 28 |
| 12 month U.S. LIBOR + 1.700% 3.184% 6/1/42 (e)(f) | | 55 | 57 |
| 12 month U.S. LIBOR + 1.730% 2.012% 3/1/40 (e)(f) | | 155 | 157 |
| 12 month U.S. LIBOR + 1.730% 3.441% 5/1/36 (e)(f) | | 29 | 30 |
| 12 month U.S. LIBOR + 1.750% 2.434% 7/1/35 (e)(f) | | 32 | 32 |
| 12 month U.S. LIBOR + 1.750% 2.579% 8/1/41 (e)(f) | | 4 | 4 |
| 12 month U.S. LIBOR + 1.770% 2.071% 2/1/37 (e)(f) | | 37 | 38 |
| 12 month U.S. LIBOR + 1.800% 2.054% 1/1/42 (e)(f) | | 156 | 159 |
| 12 month U.S. LIBOR + 1.800% 2.498% 12/1/40 (e)(f) | | 88 | 90 |
| 12 month U.S. LIBOR + 1.800% 4.05% 7/1/41 (e)(f) | | 34 | 35 |
| 12 month U.S. LIBOR + 1.810% 2.06% 12/1/39 (e)(f) | | 2 | 2 |
| 12 month U.S. LIBOR + 1.810% 2.068% 9/1/41 (e)(f) | | 18 | 19 |
| 12 month U.S. LIBOR + 1.810% 2.304% 2/1/42 (e)(f) | | 90 | 92 |
| 12 month U.S. LIBOR + 1.810% 4.008% 7/1/41 (e)(f) | | 40 | 42 |
| 12 month U.S. LIBOR + 1.820% 2.293% 2/1/35 (e)(f) | | 4 | 4 |
| 12 month U.S. LIBOR + 1.830% 2.08% 10/1/41 (e)(f) | | 17 | 18 |
| 12 month U.S. LIBOR + 1.850% 2.429% 4/1/36 (e)(f) | | 20 | 20 |
| 12 month U.S. LIBOR + 1.890% 3.084% 8/1/35 (e)(f) | | 21 | 22 |
| 12 month U.S. LIBOR + 1.950% 3.771% 7/1/37 (e)(f) | | 4 | 5 |
| 6 month U.S. LIBOR + 1.470% 2.112% 10/1/33 (e)(f) | | 23 | 23 |
| 6 month U.S. LIBOR + 1.500% 2.736% 1/1/35 (e)(f) | | 5 | 5 |
| 6 month U.S. LIBOR + 1.510% 3.523% 2/1/33 (e)(f) | | 13 | 13 |
| 6 month U.S. LIBOR + 1.530% 2.258% 12/1/34 (e)(f) | | 23 | 23 |
| 6 month U.S. LIBOR + 1.530% 2.44% 3/1/35 (e)(f) | | 34 | 34 |
| 6 month U.S. LIBOR + 1.550% 2.278% 9/1/33 (e)(f) | | 29 | 30 |
| 6 month U.S. LIBOR + 1.550% 2.387% 10/1/33 (e)(f) | | 11 | 11 |
| 6 month U.S. LIBOR + 1.560% 3.64% 7/1/35 (e)(f) | | 17 | 18 |
| 6 month U.S. LIBOR + 1.960% 2.434% 9/1/35 (e)(f) | | 1 | 1 |
| U.S. TREASURY 1 YEAR INDEX + 2.180% 2.548% 7/1/36 (e)(f) | | 3 | 3 |
| U.S. TREASURY 1 YEAR INDEX + 2.200% 2.583% 3/1/35 (e)(f) | | 14 | 14 |
| U.S. TREASURY 1 YEAR INDEX + 2.270% 2.395% 6/1/36 (e)(f) | | 3 | 4 |
| U.S. TREASURY 1 YEAR INDEX + 2.280% 2.408% 10/1/33 (e)(f) | | 26 | 27 |
| U.S. TREASURY 1 YEAR INDEX + 2.460% 3.147% 7/1/34 (e)(f) | | 4 | 4 |
| 1.5% 11/1/40 to 10/1/51 | | 33,404 | 28,371 |
| 2% 12/1/36 to 3/1/52 | | 99,205 | 86,653 |
| 2.5% 5/1/31 to 3/1/52 | | 93,289 | 84,016 |
| 3% 1/1/28 to 5/1/52 | | 93,197 | 87,217 |
| 3.4% 8/1/42 to 9/1/42 | | 26 | 25 |
| 3.5% 5/1/36 to 3/1/52 | | 67,421 | 64,555 |
| 4% 3/1/36 to 4/1/49 | | 7,662 | 7,616 |
| 4.25% 11/1/41 | | 6 | 6 |
| 4.5% to 4.5% 6/1/24 to 2/1/49 | | 3,762 | 3,819 |
| 5% 3/1/23 to 2/1/49 | | 1,128 | 1,166 |
| 5.258% 8/1/41 (e) | | 66 | 68 |
| 5.5% 12/1/23 to 8/1/25 | | 3 | 3 |
| 6% to 6% 9/1/29 to 7/1/41 | | 2,054 | 2,190 |
| 6.5% 7/1/23 to 8/1/36 | | 548 | 586 |
| 6.645% 2/1/39 (e) | | 40 | 41 |
| 7% to 7% 4/1/23 to 6/1/33 | | 23 | 25 |
| 7.5% to 7.5% 9/1/25 to 11/1/31 | | 13 | 14 |
| | | | 368,051 |
| Freddie Mac - 4.9% | | | |
| 12 month U.S. LIBOR + 1.320% 1.575% 1/1/36 (e)(f) | | 8 | 8 |
| 12 month U.S. LIBOR + 1.370% 1.634% 3/1/36 (e)(f) | | 6 | 6 |
| 12 month U.S. LIBOR + 1.500% 1.824% 3/1/36 (e)(f) | | 3 | 3 |
| 12 month U.S. LIBOR + 1.600% 3.85% 7/1/35 (e)(f) | | 11 | 11 |
| 12 month U.S. LIBOR + 1.660% 2.04% 7/1/36 (e)(f) | | 21 | 21 |
| 12 month U.S. LIBOR + 1.750% 2% 12/1/40 (e)(f) | | 39 | 40 |
| 12 month U.S. LIBOR + 1.750% 2% 9/1/41 (e)(f) | | 292 | 298 |
| 12 month U.S. LIBOR + 1.750% 4% 7/1/41 (e)(f) | | 10 | 11 |
| 12 month U.S. LIBOR + 1.860% 3.239% 4/1/36 (e)(f) | | 2 | 2 |
| 12 month U.S. LIBOR + 1.880% 2.13% 9/1/41 (e)(f) | | 28 | 28 |
| 12 month U.S. LIBOR + 1.880% 2.13% 10/1/41 (e)(f) | | 398 | 406 |
| 12 month U.S. LIBOR + 1.880% 3.255% 4/1/41 (e)(f) | | 7 | 7 |
| 12 month U.S. LIBOR + 1.900% 3.058% 10/1/42 (e)(f) | | 133 | 136 |
| 12 month U.S. LIBOR + 1.910% 3.219% 5/1/41 (e)(f) | | 55 | 56 |
| 12 month U.S. LIBOR + 1.910% 3.568% 5/1/41 (e)(f) | | 57 | 58 |
| 12 month U.S. LIBOR + 1.910% 3.775% 6/1/41 (e)(f) | | 72 | 74 |
| 12 month U.S. LIBOR + 1.910% 4.16% 6/1/41 (e)(f) | | 18 | 19 |
| 12 month U.S. LIBOR + 2.020% 2.93% 4/1/38 (e)(f) | | 2 | 2 |
| 12 month U.S. LIBOR + 2.030% 2.158% 3/1/33 (e)(f) | | 2 | 2 |
| 12 month U.S. LIBOR + 2.040% 4.265% 7/1/36 (e)(f) | | 150 | 154 |
| 12 month U.S. LIBOR + 2.200% 2.45% 12/1/36 (e)(f) | | 4 | 4 |
| 6 month U.S. LIBOR + 1.120% 2.029% 8/1/37 (e)(f) | | 2 | 2 |
| 6 month U.S. LIBOR + 1.580% 3.08% 12/1/35 (e)(f) | | 0 | 0 |
| 6 month U.S. LIBOR + 1.660% 2.165% 1/1/37 (e)(f) | | 5 | 5 |
| 6 month U.S. LIBOR + 1.660% 3.54% 7/1/35 (e)(f) | | 4 | 4 |
| 6 month U.S. LIBOR + 1.880% 2.534% 10/1/36 (e)(f) | | 42 | 43 |
| 6 month U.S. LIBOR + 1.990% 3% 10/1/35 (e)(f) | | 19 | 19 |
| 6 month U.S. LIBOR + 2.010% 2.76% 5/1/37 (e)(f) | | 6 | 6 |
| 6 month U.S. LIBOR + 2.010% 2.76% 5/1/37 (e)(f) | | 6 | 6 |
| 6 month U.S. LIBOR + 2.020% 3.414% 6/1/37 (e)(f) | | 8 | 9 |
| 6 month U.S. LIBOR + 2.680% 3.655% 10/1/35 (e)(f) | | 16 | 16 |
| U.S. TREASURY 1 YEAR INDEX + 2.030% 2.86% 6/1/33 (e)(f) | | 29 | 29 |
| U.S. TREASURY 1 YEAR INDEX + 2.230% 3.069% 4/1/34 (e)(f) | | 9 | 9 |
| U.S. TREASURY 1 YEAR INDEX + 2.260% 3.227% 6/1/33 (e)(f) | | 8 | 8 |
| U.S. TREASURY 1 YEAR INDEX + 2.430% 2.981% 3/1/35 (e)(f) | | 16 | 17 |
| U.S. TREASURY 1 YEAR INDEX + 2.540% 4.046% 7/1/35 (e)(f) | | 229 | 236 |
| 1.5% 12/1/40 to 4/1/41 | | 7,395 | 6,310 |
| 2% 4/1/41 to 2/1/52 | | 59,541 | 51,552 |
| 2.5% 5/1/30 to 2/1/52 | | 42,946 | 38,849 |
| 3% 6/1/31 to 3/1/52 | | 31,716 | 29,676 |
| 3.5% 3/1/32 to 3/1/52 | | 39,373 | 37,953 |
| 3.5% 8/1/47 | | 659 | 637 |
| 4% 1/1/36 to 2/1/50 | | 7,110 | 7,081 |
| 4% 4/1/48 | | 2 | 2 |
| 4.5% 6/1/25 to 10/1/48 | | 2,151 | 2,194 |
| 5% 8/1/33 to 7/1/41 | | 611 | 634 |
| 6% 1/1/24 to 12/1/37 | | 111 | 115 |
| 6.5% 5/1/26 to 9/1/39 | | 92 | 100 |
| 7% 8/1/26 to 9/1/36 | | 28 | 30 |
| 7.5% 1/1/27 to 11/1/30 | | 0 | 0 |
| 8% 7/1/24 to 8/1/30 | | 0 | 0 |
| 8.5% 8/1/26 to 8/1/27 | | 0 | 0 |
| | | | 176,888 |
| Ginnie Mae - 8.1% | | | |
| 3.5% 11/15/40 to 11/20/50 | | 5,834 | 5,678 |
| 4% 8/15/39 to 6/20/49 | | 11,933 | 11,896 |
| 4.5% 6/20/33 to 6/20/41 | | 1,554 | 1,582 |
| 5.5% 10/15/35 to 9/15/39 | | 45 | 47 |
| 7% to 7% 11/15/27 to 8/15/32 | | 16 | 17 |
| 7.5% to 7.5% 11/15/22 to 1/15/31 | | 5 | 5 |
| 8% 12/15/23 to 12/15/27 | | 1 | 1 |
| 8.5% 8/15/29 to 1/15/31 | | 0 | 1 |
| 2% 9/1/52 (g) | | 54,300 | 47,975 |
| 2% 9/1/52 (g) | | 9,500 | 8,393 |
| 2% 9/1/52 (g) | | 9,550 | 8,438 |
| 2% 9/1/52 (g) | | 7,000 | 6,185 |
| 2% 9/1/52 (g) | | 7,000 | 6,185 |
| 2% 9/1/52 (g) | | 9,050 | 7,996 |
| 2% 9/1/52 (g) | | 5,050 | 4,462 |
| 2% 9/1/52 (g) | | 4,000 | 3,534 |
| 2% 9/1/52 (g) | | 3,200 | 2,827 |
| 2% 9/1/52 (g) | | 950 | 839 |
| 2% 10/1/52 (g) | | 20,350 | 17,976 |
| 2% 10/1/52 (g) | | 10,150 | 8,966 |
| 2% 10/1/52 (g) | | 7,150 | 6,316 |
| 2.5% 7/20/51 to 12/20/51 | | 835 | 764 |
| 2.5% 9/1/52 (g) | | 1,450 | 1,322 |
| 2.5% 9/1/52 (g) | | 11,100 | 10,121 |
| 2.5% 9/1/52 (g) | | 5,550 | 5,060 |
| 2.5% 9/1/52 (g) | | 5,550 | 5,060 |
| 2.5% 9/1/52 (g) | | 5,200 | 4,741 |
| 2.5% 9/1/52 (g) | | 5,925 | 5,402 |
| 2.5% 9/1/52 (g) | | 12,550 | 11,443 |
| 2.5% 10/1/52 (g) | | 22,800 | 20,783 |
| 3% 5/15/42 to 10/20/51 | | 6,423 | 6,067 |
| 3% 9/1/52 (g) | | 8,125 | 7,626 |
| 3% 9/1/52 (g) | | 11,000 | 10,324 |
| 3% 9/1/52 (g) | | 5,500 | 5,162 |
| 3% 9/1/52 (g) | | 8,250 | 7,743 |
| 3% 9/1/52 (g) | | 8,250 | 7,743 |
| 3% 9/1/52 (g) | | 9,525 | 8,940 |
| 3% 10/1/52 (g) | | 13,500 | 12,661 |
| 3% 10/1/52 (g) | | 8,100 | 7,597 |
| 5% 9/20/33 to 4/20/48 | | 894 | 929 |
| 5.47% 8/20/59 (e)(h) | | 1 | 1 |
| 6% 11/20/31 to 5/15/40 | | 1,644 | 1,756 |
| 6.5% 3/20/31 to 8/15/36 | | 8 | 8 |
| | | | 290,572 |
| Uniform Mortgage Backed Securities - 9.6% | | | |
| 1.5% 9/1/52 (g) | | 16,900 | 13,846 |
| 1.5% 9/1/52 (g) | | 4,000 | 3,277 |
| 1.5% 9/1/52 (g) | | 1,450 | 1,188 |
| 1.5% 9/1/52 (g) | | 3,450 | 2,827 |
| 2% 9/1/52 (g) | | 7,900 | 6,798 |
| 2% 9/1/52 (g) | | 8,025 | 6,906 |
| 2% 9/1/52 (g) | | 9,750 | 8,390 |
| 2% 9/1/52 (g) | | 5,750 | 4,948 |
| 2% 9/1/52 (g) | | 5,650 | 4,862 |
| 2% 9/1/52 (g) | | 3,900 | 3,356 |
| 2% 9/1/52 (g) | | 2,300 | 1,979 |
| 2% 9/1/52 (g) | | 1,225 | 1,054 |
| 2% 9/1/52 (g) | | 17,000 | 14,629 |
| 2% 9/1/52 (g) | | 8,500 | 7,315 |
| 2% 9/1/52 (g) | | 11,000 | 9,466 |
| 2% 9/1/52 (g) | | 28,900 | 24,870 |
| 2% 10/1/52 (g) | | 15,500 | 13,335 |
| 2% 10/1/52 (g) | | 12,900 | 11,098 |
| 2% 10/1/52 (g) | | 19,400 | 16,690 |
| 2.5% 9/1/52 (g) | | 12,800 | 11,432 |
| 2.5% 9/1/52 (g) | | 13,250 | 11,834 |
| 2.5% 9/1/52 (g) | | 5,550 | 4,957 |
| 2.5% 9/1/52 (g) | | 11,850 | 10,584 |
| 3% 9/1/52 (g) | | 13,200 | 12,215 |
| 3% 9/1/52 (g) | | 4,000 | 3,702 |
| 3% 9/1/52 (g) | | 3,200 | 2,961 |
| 3.5% 9/1/52 (g) | | 1,100 | 1,049 |
| 3.5% 9/1/52 (g) | | 1,050 | 1,001 |
| 4% 9/1/52 (g) | | 42,400 | 41,376 |
| 4% 9/1/52 (g) | | 33,200 | 32,399 |
| 4.5% 9/1/52 (g) | | 17,800 | 17,690 |
| 5% 9/1/52 (g) | | 7,300 | 7,366 |
| 5.5% 9/1/52 (g) | | 5,550 | 5,675 |
| 5.5% 9/1/52 (g) | | 11,150 | 11,402 |
| 5.5% 9/1/52 (g) | | 7,650 | 7,823 |
| 5.5% 9/1/52 (g) | | 5,550 | 5,675 |
| | | | 345,975 |
| TOTAL U.S. GOVERNMENT AGENCY - MORTGAGE SECURITIES | | | |
| (Cost $1,234,452) | | | 1,181,486 |
|
| Collateralized Mortgage Obligations - 4.3% | | | |
| U.S. Government Agency - 4.3% | | | |
| Fannie Mae: | | | |
| floater: | | | |
| Series 1994-42 Class FK, 10-Year Treasury Constant Maturity Rate - 0.500% 2.44% 4/25/24 (e)(f) | | 7 | 7 |
| Series 2001-38 Class QF, 1 month U.S. LIBOR + 0.980% 3.4237% 8/25/31 (e)(f) | | 29 | 30 |
| Series 2002-18 Class FD, 1 month U.S. LIBOR + 0.800% 3.2437% 2/25/32 (e)(f) | | 1 | 1 |
| Series 2002-39 Class FD, 1 month U.S. LIBOR + 1.000% 3.377% 3/18/32 (e)(f) | | 1 | 1 |
| Series 2002-49 Class FB, 1 month U.S. LIBOR + 0.600% 2.977% 11/18/31 (e)(f) | | 23 | 23 |
| Series 2002-60 Class FV, 1 month U.S. LIBOR + 1.000% 3.4437% 4/25/32 (e)(f) | | 12 | 12 |
| Series 2002-63 Class FN, 1 month U.S. LIBOR + 1.000% 3.4437% 10/25/32 (e)(f) | | 2 | 2 |
| Series 2002-7 Class FC, 1 month U.S. LIBOR + 0.750% 3.1937% 1/25/32 (e)(f) | | 1 | 1 |
| Series 2002-74 Class FV, 1 month U.S. LIBOR + 0.450% 2.8937% 11/25/32 (e)(f) | | 38 | 38 |
| Series 2002-75 Class FA, 1 month U.S. LIBOR + 1.000% 3.4437% 11/25/32 (e)(f) | | 22 | 23 |
| Series 2003-118 Class S, 8.100% - 1 month U.S. LIBOR 5.6563% 12/25/33 (e)(i)(j) | | 22 | 4 |
| Series 2006-104 Class GI, 6.680% - 1 month U.S. LIBOR 4.2363% 11/25/36 (e)(i)(j) | | 16 | 2 |
| Series 2010-15 Class FJ, 1 month U.S. LIBOR + 0.930% 3.3737% 6/25/36 (e)(f) | | 1,897 | 1,930 |
| planned amortization class: | | | |
| Series 1992-168 Class KB, 7% 10/25/22 | | 0 | 0 |
| Series 1993-207 Class H, 6.5% 11/25/23 | | 2 | 2 |
| Series 1996-28 Class PK, 6.5% 7/25/25 | | 1 | 1 |
| Series 1999-17 Class PG, 6% 4/25/29 | | 7 | 7 |
| Series 1999-32 Class PL, 6% 7/25/29 | | 8 | 8 |
| Series 1999-33 Class PK, 6% 7/25/29 | | 6 | 6 |
| Series 2001-52 Class YZ, 6.5% 10/25/31 | | 1 | 1 |
| Series 2003-28 Class KG, 5.5% 4/25/23 | | 1 | 1 |
| Series 2003-70 Class BJ, 5% 7/25/33 | | 35 | 35 |
| Series 2005-102 Class CO 11/25/35 (k) | | 5 | 4 |
| Series 2005-64 Class PX, 5.5% 6/25/35 | | 196 | 200 |
| Series 2005-68 Class CZ, 5.5% 8/25/35 | | 1,833 | 1,896 |
| Series 2005-73 Class SA, 17.500% - 1 month U.S. LIBOR 11.1964% 8/25/35 (e)(j) | | 1 | 1 |
| Series 2005-81 Class PC, 5.5% 9/25/35 | | 13 | 13 |
| Series 2006-12 Class BO 10/25/35 (k) | | 18 | 16 |
| Series 2006-15 Class OP 3/25/36 (k) | | 21 | 18 |
| Series 2006-37 Class OW 5/25/36 (k) | | 2 | 2 |
| Series 2006-45 Class OP 6/25/36 (k) | | 205 | 166 |
| Series 2006-62 Class KP 4/25/36 (k) | | 11 | 9 |
| Series 2010-118 Class PB, 4.5% 10/25/40 | | 1,905 | 1,919 |
| Series 2012-149: | | | |
| Class DA, 1.75% 1/25/43 | | 373 | 346 |
| Class GA, 1.75% 6/25/42 | | 401 | 371 |
| sequential payer: | | | |
| Series 1997-41 Class J, 7.5% 6/18/27 | | 1 | 1 |
| Series 1999-25 Class Z, 6% 6/25/29 | | 6 | 6 |
| Series 2001-20 Class Z, 6% 5/25/31 | | 8 | 8 |
| Series 2001-31 Class ZC, 6.5% 7/25/31 | | 4 | 4 |
| Series 2002-16 Class ZD, 6.5% 4/25/32 | | 3 | 3 |
| Series 2002-74 Class SV, 7.550% - 1 month U.S. LIBOR 5.1063% 11/25/32 (e)(i)(j) | | 8 | 0 |
| Series 2003-117 Class MD, 5% 12/25/23 | | 55 | 55 |
| Series 2004-52 Class KZ, 5.5% 7/25/34 | | 177 | 177 |
| Series 2004-91 Class Z, 5% 12/25/34 | | 1,694 | 1,669 |
| Series 2005-117 Class JN, 4.5% 1/25/36 | | 105 | 106 |
| Series 2005-14 Class ZB, 5% 3/25/35 | | 523 | 515 |
| Series 2006-72 Class CY, 6% 8/25/26 | | 546 | 562 |
| Series 2009-59 Class HB, 5% 8/25/39 | | 805 | 824 |
| Series 2012-67 Class AI, 4.5% 7/25/27 (i) | | 10 | 0 |
| Series 06-116 Class SG, 6.640% - 1 month U.S. LIBOR 4.1963% 12/25/36 (e)(i)(j) | | 10 | 2 |
| Series 07-40 Class SE, 6.440% - 1 month U.S. LIBOR 3.9963% 5/25/37 (e)(i)(j) | | 5 | 1 |
| Series 1993-165 Class SH, 19.800% - 1 month U.S. LIBOR 12.8877% 9/25/23 (e)(j) | | 0 | 0 |
| Series 2003-21 Class SK, 8.100% - 1 month U.S. LIBOR 5.6563% 3/25/33 (e)(i)(j) | | 1 | 0 |
| Series 2005-72 Class ZC, 5.5% 8/25/35 | | 85 | 89 |
| Series 2005-79 Class ZC, 5.9% 9/25/35 | | 48 | 50 |
| Series 2007-57 Class SA, 40.600% - 1 month U.S. LIBOR 25.9577% 6/25/37 (e)(j) | | 5 | 7 |
| Series 2007-66: | | | |
| Class SA, 39.600% - 1 month U.S. LIBOR 24.9377% 7/25/37 (e)(j) | | 7 | 11 |
| Class SB, 39.600% - 1 month U.S. LIBOR 24.9377% 7/25/37 (e)(j) | | 3 | 3 |
| Series 2008-12 Class SG, 6.350% - 1 month U.S. LIBOR 3.9063% 3/25/38 (e)(i)(j) | | 36 | 4 |
| Series 2010-135: | | | |
| Class LS, 6.050% - 1 month U.S. LIBOR 3.6063% 12/25/40 (e)(i)(j) | | 37 | 4 |
| Class ZA, 4.5% 12/25/40 | | 15 | 16 |
| Series 2010-139 Class NI, 4.5% 2/25/40 (i) | | 439 | 14 |
| Series 2010-150 Class ZC, 4.75% 1/25/41 | | 155 | 160 |
| Series 2010-39 Class FG, 1 month U.S. LIBOR + 0.920% 3.3637% 3/25/36 (e)(f) | | 1,280 | 1,310 |
| Series 2010-95 Class ZC, 5% 9/25/40 | | 358 | 374 |
| Series 2011-39 Class ZA, 6% 11/25/32 | | 26 | 27 |
| Series 2011-4 Class PZ, 5% 2/25/41 | | 47 | 48 |
| Series 2011-67 Class AI, 4% 7/25/26 (i) | | 30 | 1 |
| Series 2011-83 Class DI, 6% 9/25/26 (i) | | 0 | 0 |
| Series 2012-100 Class WI, 3% 9/25/27 (i) | | 80 | 4 |
| Series 2012-14 Class JS, 6.650% - 1 month U.S. LIBOR 4.2063% 12/25/30 (e)(i)(j) | | 12 | 0 |
| Series 2012-27 Class EZ, 4.25% 3/25/42 | | 2,393 | 2,390 |
| Series 2012-9 Class SH, 6.550% - 1 month U.S. LIBOR 4.1063% 6/25/41 (e)(i)(j) | | 9 | 0 |
| Series 2013-133 Class IB, 3% 4/25/32 (i) | | 30 | 1 |
| Series 2013-134 Class SA, 6.050% - 1 month U.S. LIBOR 3.6063% 1/25/44 (e)(i)(j) | | 23 | 3 |
| Series 2013-51 Class GI, 3% 10/25/32 (i) | | 29 | 2 |
| Series 2013-N1 Class A, 6.720% - 1 month U.S. LIBOR 4.2763% 6/25/35 (e)(i)(j) | | 30 | 3 |
| Series 2015-42 Class IL, 6% 6/25/45 (i) | | 155 | 28 |
| Series 2015-70 Class JC, 3% 10/25/45 | | 170 | 164 |
| Series 2016-26 Class CG, 3% 5/25/46 | | 5,605 | 5,419 |
| Series 2017-30 Class AI, 5.5% 5/25/47 (i) | | 85 | 16 |
| Series 2017-74 Class SH, 6.200% - 1 month U.S. LIBOR 3.7563% 10/25/47 (e)(i)(j) | | 674 | 86 |
| Series 2018-45 Class GI, 4% 6/25/48 (i) | | 925 | 175 |
| Fannie Mae Stripped Mortgage-Backed Securities: | | | |
| Series 339 Class 5, 5.5% 7/25/33 (i) | | 6 | 1 |
| Series 343 Class 16, 5.5% 5/25/34 (i) | | 5 | 1 |
| Series 348 Class 14, 6.5% 8/25/34 (e)(i) | | 4 | 1 |
| Series 351: | | | |
| Class 12, 5.5% 4/25/34 (e)(i) | | 2 | 0 |
| Class 13, 6% 3/25/34 (i) | | 3 | 1 |
| Series 359 Class 19, 6% 7/25/35 (e)(i) | | 2 | 0 |
| Series 384 Class 6, 5% 7/25/37 (i) | | 22 | 4 |
| Freddie Mac: | | | |
| floater: | | | |
| Series 2412 Class FK, 1 month U.S. LIBOR + 0.800% 3.191% 1/15/32 (e)(f) | | 0 | 0 |
| Series 2423 Class FA, 1 month U.S. LIBOR + 0.900% 3.291% 3/15/32 (e)(f) | | 1 | 1 |
| Series 2424 Class FM, 1 month U.S. LIBOR + 1.000% 3.391% 3/15/32 (e)(f) | | 1 | 1 |
| Series 2432: | | | |
| Class FE, 1 month U.S. LIBOR + 0.900% 3.291% 6/15/31 (e)(f) | | 1 | 1 |
| Class FG, 1 month U.S. LIBOR + 0.900% 3.291% 3/15/32 (e)(f) | | 0 | 0 |
| Series 2526 Class FC, 1 month U.S. LIBOR + 0.400% 2.791% 11/15/32 (e)(f) | | 8 | 8 |
| Series 2530 Class FE, 1 month U.S. LIBOR + 0.600% 2.991% 2/15/32 (e)(f) | | 13 | 13 |
| Series 2682 Class FB, 1 month U.S. LIBOR + 0.900% 3.291% 10/15/33 (e)(f) | | 703 | 715 |
| Series 2711 Class FC, 1 month U.S. LIBOR + 0.900% 3.291% 2/15/33 (e)(f) | | 490 | 499 |
| floater planned amortization class Series 2770 Class FH, 1 month U.S. LIBOR + 0.400% 2.791% 3/15/34 (e)(f) | | 177 | 177 |
| floater target amortization class Series 3366 Class FD, 1 month U.S. LIBOR + 0.250% 2.641% 5/15/37 (e)(f) | | 27 | 27 |
| planned amortization class: | | | |
| Series 2095 Class PE, 6% 11/15/28 | | 8 | 9 |
| Series 2101 Class PD, 6% 11/15/28 | | 4 | 4 |
| Series 2121 Class MG, 6% 2/15/29 | | 3 | 3 |
| Series 2131 Class BG, 6% 3/15/29 | | 24 | 25 |
| Series 2137 Class PG, 6% 3/15/29 | | 4 | 4 |
| Series 2154 Class PT, 6% 5/15/29 | | 7 | 7 |
| Series 2162 Class PH, 6% 6/15/29 | | 1 | 1 |
| Series 2520 Class BE, 6% 11/15/32 | | 11 | 12 |
| Series 2682 Class LD, 4.5% 10/15/33 | | 161 | 162 |
| Series 2693 Class MD, 5.5% 10/15/33 | | 24 | 24 |
| Series 2802 Class OB, 6% 5/15/34 | | 25 | 26 |
| Series 2996 Class MK, 5.5% 6/15/35 | | 7 | 8 |
| Series 3002 Class NE, 5% 7/15/35 | | 25 | 26 |
| Series 3110 Class OP 9/15/35 (k) | | 8 | 7 |
| Series 3119 Class PO 2/15/36 (k) | | 26 | 21 |
| Series 3121 Class KO 3/15/36 (k) | | 4 | 4 |
| Series 3123 Class LO 3/15/36 (k) | | 14 | 12 |
| Series 3145 Class GO 4/15/36 (k) | | 15 | 13 |
| Series 3189 Class PD, 6% 7/15/36 | | 21 | 23 |
| Series 3225 Class EO 10/15/36 (k) | | 8 | 6 |
| Series 3258 Class PM, 5.5% 12/15/36 | | 10 | 10 |
| Series 3415 Class PC, 5% 12/15/37 | | 215 | 218 |
| Series 3806 Class UP, 4.5% 2/15/41 | | 46 | 46 |
| Series 3832 Class PE, 5% 3/15/41 | | 99 | 101 |
| Series 3857 Class ZP, 5% 5/15/41 | | 3,639 | 3,692 |
| Series 4135 Class AB, 1.75% 6/15/42 | | 301 | 280 |
| Series 4765 Class PE, 3% 12/15/41 | | 1 | 1 |
| sequential payer: | | | |
| Series 1929 Class EZ, 7.5% 2/17/27 | | 12 | 12 |
| Series 2004-2802 Class ZG, 5.5% 5/15/34 | | 2,225 | 2,329 |
| Series 2004-2862 Class NE, 5% 9/15/24 | | 30 | 30 |
| Series 2135 Class JE, 6% 3/15/29 | | 2 | 2 |
| Series 2145 Class MZ, 6.5% 4/15/29 | | 24 | 25 |
| Series 2274 Class ZM, 6.5% 1/15/31 | | 2 | 2 |
| Series 2281 Class ZB, 6% 3/15/30 | | 5 | 5 |
| Series 2303 Class ZV, 6% 4/15/31 | | 14 | 15 |
| Series 2357 Class ZB, 6.5% 9/15/31 | | 38 | 40 |
| Series 2502 Class ZC, 6% 9/15/32 | | 5 | 5 |
| Series 2519 Class ZD, 5.5% 11/15/32 | | 7 | 7 |
| Series 2546 Class MJ, 5.5% 3/15/23 | | 0 | 0 |
| Series 2587 Class AD, 4.71% 3/15/33 | | 553 | 565 |
| Series 2601 Class TB, 5.5% 4/15/23 | | 0 | 0 |
| Series 2877 Class ZD, 5% 10/15/34 | | 2,110 | 2,080 |
| Series 2998 Class LY, 5.5% 7/15/25 | | 8 | 8 |
| Series 3007 Class EW, 5.5% 7/15/25 | | 657 | 671 |
| Series 3871 Class KB, 5.5% 6/15/41 | | 5,450 | 5,759 |
| Series 3889 Class DZ, 4% 1/15/41 | | 13,915 | 13,505 |
| Series 06-3115 Class SM, 6.600% - 1 month U.S. LIBOR 4.209% 2/15/36 (e)(i)(j) | | 7 | 1 |
| Series 2013-4281 Class AI, 4% 12/15/28 (i) | | 28 | 1 |
| Series 2017-4683 Class LM, 3% 5/15/47 | | 224 | 216 |
| Series 2018-4763 Class SC, 6.200% - 1 month U.S. LIBOR 3.809% 8/15/47 (e)(i)(j) | | 342 | 44 |
| Series 2933 Class ZM, 5.75% 2/15/35 | | 109 | 115 |
| Series 2935 Class ZK, 5.5% 2/15/35 | | 88 | 92 |
| Series 2947 Class XZ, 6% 3/15/35 | | 44 | 46 |
| Series 2996 Class ZD, 5.5% 6/15/35 | | 75 | 78 |
| Series 3237 Class C, 5.5% 11/15/36 | | 104 | 107 |
| Series 3244 Class SG, 6.660% - 1 month U.S. LIBOR 4.269% 11/15/36 (e)(i)(j) | | 33 | 4 |
| Series 3287 Class SD, 6.750% - 1 month U.S. LIBOR 4.359% 3/15/37 (e)(i)(j) | | 49 | 8 |
| Series 3297 Class BI, 6.760% - 1 month U.S. LIBOR 4.369% 4/15/37 (e)(i)(j) | | 70 | 10 |
| Series 3336 Class LI, 6.580% - 1 month U.S. LIBOR 4.189% 6/15/37 (e)(i)(j) | | 23 | 3 |
| Series 3843 Class PZ, 5% 4/15/41 | | 3,201 | 3,349 |
| Series 3949 Class MK, 4.5% 10/15/34 | | 18 | 18 |
| Series 4055 Class BI, 3.5% 5/15/31 (i) | | 34 | 1 |
| Series 4314 Class AI, 5% 3/15/34 (i) | | 11 | 0 |
| Series 4427 Class LI, 3.5% 2/15/34 (i) | | 87 | 7 |
| Series 4471 Class PA 4% 12/15/40 | | 91 | 90 |
| target amortization class Series 2156 Class TC, 6.25% 5/15/29 | | 3 | 3 |
| Freddie Mac Manufactured Housing participation certificates guaranteed: | | | |
| floater Series 1686 Class FA, 1 month U.S. LIBOR + 0.900% 2.8991% 2/15/24 (e)(f) | | 0 | 0 |
| sequential payer: | | | |
| Series 2043 Class ZH, 6% 4/15/28 | | 3 | 3 |
| Series 2056 Class Z, 6% 5/15/28 | | 7 | 7 |
| Freddie Mac Multi-family Structured pass-thru certificates: | | | |
| sequential payer Series 4341 Class ML, 3.5% 11/15/31 | | 2,735 | 2,689 |
| Series 4386 Class AZ, 4.5% 11/15/40 | | 212 | 213 |
| Freddie Mac Seasoned Credit Risk Transfer Trust Series 2018-3 Class M55D, 4% 8/25/57 | | 95 | 93 |
| Ginnie Mae guaranteed REMIC pass-thru certificates: | | | |
| floater: | | | |
| Series 2007-37 Class TS, 6.690% - 1 month U.S. LIBOR 4.3031% 6/16/37 (e)(i)(j) | | 13 | 2 |
| Series 2007-59 Class FC, 1 month U.S. LIBOR + 0.500% 2.8681% 7/20/37 (e)(f) | | 97 | 97 |
| Series 2008-2 Class FD, 1 month U.S. LIBOR + 0.480% 2.8481% 1/20/38 (e)(f) | | 97 | 97 |
| Series 2008-73 Class FA, 1 month U.S. LIBOR + 0.860% 3.2281% 8/20/38 (e)(f) | | 676 | 689 |
| Series 2008-83 Class FB, 1 month U.S. LIBOR + 0.900% 3.2681% 9/20/38 (e)(f) | | 499 | 509 |
| Series 2009-108 Class CF, 1 month U.S. LIBOR + 0.600% 2.9869% 11/16/39 (e)(f) | | 453 | 459 |
| Series 2009-116 Class KF, 1 month U.S. LIBOR + 0.530% 2.9169% 12/16/39 (e)(f) | | 77 | 78 |
| Series 2010-H03 Class FA, 1 month U.S. LIBOR + 0.550% 2.8497% 3/20/60 (e)(f)(h) | | 168 | 167 |
| Series 2010-H17 Class FA, 1 month U.S. LIBOR + 0.330% 2.6297% 7/20/60 (e)(f)(h) | | 1,065 | 1,054 |
| Series 2010-H18 Class AF, 1 month U.S. LIBOR + 0.300% 2.0976% 9/20/60 (e)(f)(h) | | 1,303 | 1,290 |
| Series 2010-H19 Class FG, 1 month U.S. LIBOR + 0.300% 2.0976% 8/20/60 (e)(f)(h) | | 1,076 | 1,066 |
| Series 2010-H27 Class FA, 1 month U.S. LIBOR + 0.380% 2.1776% 12/20/60 (e)(f)(h) | | 551 | 547 |
| Series 2011-H05 Class FA, 1 month U.S. LIBOR + 0.500% 2.2976% 12/20/60 (e)(f)(h) | | 576 | 573 |
| Series 2011-H07 Class FA, 1 month U.S. LIBOR + 0.500% 2.2976% 2/20/61 (e)(f)(h) | | 565 | 562 |
| Series 2011-H12 Class FA, 1 month U.S. LIBOR + 0.490% 2.2876% 2/20/61 (e)(f)(h) | | 810 | 805 |
| Series 2011-H13 Class FA, 1 month U.S. LIBOR + 0.500% 2.2976% 4/20/61 (e)(f)(h) | | 489 | 486 |
| Series 2011-H14: | | | |
| Class FB, 1 month U.S. LIBOR + 0.500% 2.2976% 5/20/61 (e)(f)(h) | | 776 | 771 |
| Class FC, 1 month U.S. LIBOR + 0.500% 2.2976% 5/20/61 (e)(f)(h) | | 577 | 573 |
| Series 2011-H17 Class FA, 1 month U.S. LIBOR + 0.530% 2.3276% 6/20/61 (e)(f)(h) | | 677 | 673 |
| Series 2011-H20 Class FA, 1 month U.S. LIBOR + 0.550% 2.3476% 9/20/61 (e)(f)(h) | | 3,142 | 3,125 |
| Series 2011-H21 Class FA, 1 month U.S. LIBOR + 0.600% 2.3976% 10/20/61 (e)(f)(h) | | 2,347 | 2,338 |
| Series 2012-98 Class FA, 1 month U.S. LIBOR + 0.400% 2.7681% 8/20/42 (e)(f) | | 102 | 102 |
| Series 2012-H01 Class FA, 1 month U.S. LIBOR + 0.700% 2.4976% 11/20/61 (e)(f)(h) | | 2,225 | 2,218 |
| Series 2012-H03 Class FA, 1 month U.S. LIBOR + 0.700% 2.4976% 1/20/62 (e)(f)(h) | | 1,347 | 1,343 |
| Series 2012-H06 Class FA, 1 month U.S. LIBOR + 0.630% 2.4276% 1/20/62 (e)(f)(h) | | 1,976 | 1,968 |
| Series 2012-H07 Class FA, 1 month U.S. LIBOR + 0.630% 2.4276% 3/20/62 (e)(f)(h) | | 1,168 | 1,164 |
| Series 2012-H21 Class DF, 1 month U.S. LIBOR + 0.650% 2.4476% 5/20/61 (e)(f)(h) | | 24 | 24 |
| Series 2013-H19: | | | |
| Class FC, 1 month U.S. LIBOR + 0.600% 2.3976% 8/20/63 (e)(f)(h) | | 287 | 286 |
| Class FD, 1 month U.S. LIBOR + 0.600% 2.3976% 8/20/63 (e)(f)(h) | | 662 | 660 |
| Series 2014-H02 Class FB, 1 month U.S. LIBOR + 0.650% 2.4476% 12/20/63 (e)(f)(h) | | 14,986 | 14,940 |
| Series 2014-H03 Class FA, 1 month U.S. LIBOR + 0.600% 2.3976% 1/20/64 (e)(f)(h) | | 3,047 | 3,035 |
| Series 2014-H05 Class FB, 1 month U.S. LIBOR + 0.600% 2.3976% 12/20/63 (e)(f)(h) | | 263 | 262 |
| Series 2014-H11 Class BA, 1 month U.S. LIBOR + 0.500% 2.2976% 6/20/64 (e)(f)(h) | | 181 | 180 |
| Series 2015-H07 Class FA, 1 month U.S. LIBOR + 0.300% 2.0976% 3/20/65 (e)(f)(h) | | 17 | 17 |
| Series 2015-H13 Class FL, 1 month U.S. LIBOR + 0.280% 2.0776% 5/20/63 (e)(f)(h) | | 62 | 61 |
| Series 2015-H19 Class FA, 1 month U.S. LIBOR + 0.200% 1.9976% 4/20/63 (e)(f)(h) | | 45 | 44 |
| Series 2016-H20 Class FM, 1 month U.S. LIBOR + 0.400% 2.1976% 12/20/62 (e)(f)(h) | | 44 | 43 |
| planned amortization class: | | | |
| Series 2010-158 Class MS, 10.000% - 1 month U.S. LIBOR 5.2637% 12/20/40 (e)(j) | | 133 | 121 |
| Series 2010-31 Class BP, 5% 3/20/40 | | 4,666 | 4,782 |
| Series 2011-136 Class WI, 4.5% 5/20/40 (i) | | 43 | 3 |
| Series 2011-68 Class EC, 3.5% 4/20/41 | | 61 | 60 |
| Series 2016-69 Class WA, 3% 2/20/46 | | 109 | 105 |
| Series 2017-134 Class BA, 2.5% 11/20/46 | | 417 | 397 |
| Series 2017-153 Class GA, 3% 9/20/47 | | 295 | 278 |
| Series 2017-182 Class KA, 3% 10/20/47 | | 228 | 216 |
| Series 2018-13 Class Q, 3% 4/20/47 | | 292 | 279 |
| sequential payer: | | | |
| Series 2004-24 Class ZM, 5% 4/20/34 | | 38 | 38 |
| Series 2010-160 Class DY, 4% 12/20/40 | | 273 | 266 |
| Series 2010-170 Class B, 4% 12/20/40 | | 61 | 59 |
| Series 2011-69 Class GX, 4.5% 5/16/40 | | 3,633 | 3,663 |
| Series 2014-H04 Class HA, 2.75% 2/20/64 (h) | | 1,999 | 1,963 |
| Series 2014-H12 Class KA, 2.75% 5/20/64 (h) | | 808 | 806 |
| Series 2017-139 Class BA, 3% 9/20/47 | | 4,048 | 3,871 |
| Series 2018-H12 Class HA, 3.25% 8/20/68 (h) | | 1,319 | 1,289 |
| Series 2004-22 Class M1, 5.5% 4/20/34 | | 768 | 857 |
| Series 2004-32 Class GS, 6.500% - 1 month U.S. LIBOR 4.1131% 5/16/34 (e)(i)(j) | | 8 | 1 |
| Series 2004-73 Class AL, 7.200% - 1 month U.S. LIBOR 4.8131% 8/17/34 (e)(i)(j) | | 8 | 1 |
| Series 2010-116 Class QB, 4% 9/16/40 | | 21 | 21 |
| Series 2010-14 Class SN, 5.950% - 1 month U.S. LIBOR 3.5631% 2/16/40 (e)(i)(j) | | 53 | 4 |
| Series 2010-169 Class Z, 4.5% 12/20/40 | | 3,892 | 3,691 |
| Series 2010-H10 Class FA, 1 month U.S. LIBOR + 0.330% 2.6297% 5/20/60 (e)(f)(h) | | 80 | 79 |
| Series 2010-H16 Class BA, 3.55% 7/20/60 (h) | | 121 | 119 |
| Series 2010-H18 Class PL, 5.01% 9/20/60 (e)(h) | | 58 | 58 |
| Series 2011-94 Class SA, 6.100% - 1 month U.S. LIBOR 3.7319% 7/20/41 (e)(i)(j) | | 25 | 3 |
| Series 2012-76 Class GS, 6.700% - 1 month U.S. LIBOR 4.3131% 6/16/42 (e)(i)(j) | | 29 | 3 |
| Series 2013-149 Class MA, 2.5% 5/20/40 | | 233 | 225 |
| Series 2013-H01 Class FA, 1.65% 1/20/63 (h) | | 0 | 0 |
| Series 2013-H04 Class BA, 1.65% 2/20/63 (h) | | 1 | 1 |
| Series 2013-H08 Class MA, 3% 3/20/63 (h) | | 7 | 7 |
| Series 2014-2 Class BA, 3% 1/20/44 | | 554 | 524 |
| Series 2014-21 Class HA, 3% 2/20/44 | | 202 | 192 |
| Series 2014-25 Class HC, 3% 2/20/44 | | 351 | 332 |
| Series 2014-5 Class A, 3% 1/20/44 | | 301 | 285 |
| Series 2015-H13 Class HA, 2.5% 8/20/64 (h) | | 3 | 2 |
| Series 2015-H30 Class HA, 1.75% 9/20/62 (e)(h) | | 374 | 360 |
| Series 2016-H13 Class FB, U.S. TREASURY 1 YEAR INDEX + 0.500% 3.35% 5/20/66 (e)(f)(h) | | 8,149 | 8,115 |
| Series 2017-186 Class HK, 3% 11/16/45 | | 295 | 280 |
| Series 2017-H06 Class FA, U.S. TREASURY 1 YEAR INDEX + 0.350% 3.2% 8/20/66 (e)(f)(h) | | 8,571 | 8,516 |
| Series 2090-118 Class XZ, 5% 12/20/39 | | 10,868 | 11,328 |
| | | | 155,399 |
| TOTAL COLLATERALIZED MORTGAGE OBLIGATIONS | | | |
| (Cost $161,337) | | | 155,399 |
|
| Commercial Mortgage Securities - 1.4% | | | |
| Freddie Mac: | | | |
| floater: | | | |
| Series 2021-F114 Class A/S, U.S. 30-Day Avg. Secured Overnight Fin. Rate (SOFR) Index + 0.220% 1.7749% 5/25/31 (e)(f) | | 5,137 | 5,051 |
| Series 2021-F120 Class A/S, U.S. 30-Day Avg. Secured Overnight Fin. Rate (SOFR) Index + 0.210% 1.7549% 8/25/31 (e)(f) | | 14,219 | 13,962 |
| Series 2021-F121 Class A/S, U.S. 30-Day Avg. Secured Overnight Fin. Rate (SOFR) Index + 0.180% 1.7349% 8/25/28 (e)(f) | | 13,081 | 12,852 |
| sequential payer: | | | |
| Series 2021-K135 Class A2, 2.154% 10/25/31 | | 13,000 | 11,362 |
| Series 2021-K136 Class A2, 2.127% 11/25/31 | | 5,140 | 4,478 |
| Series 2022-K150 Class A2, 3.71% 11/25/32 | | 2,200 | 2,177 |
| TOTAL COMMERCIAL MORTGAGE SECURITIES | | | |
| (Cost $53,340) | | | 49,882 |
|
| Foreign Government and Government Agency Obligations - 0.1% | | | |
| Israeli State: | | | |
| (guaranteed by U.S. Government through Agency for International Development) 5.5% 12/4/23 | | 38 | 39 |
| 5.5% 4/26/24 | | 4,828 | 4,960 |
| TOTAL FOREIGN GOVERNMENT AND GOVERNMENT AGENCY OBLIGATIONS | | | |
| (Cost $5,085) | | | 4,999 |
| | | Shares | Value (000s) |
|
| Money Market Funds - 17.0% | | | |
| Fidelity Cash Central Fund 2.33% (l) | | 529,478,931 | $529,585 |
| Fidelity Securities Lending Cash Central Fund 2.34% (l)(m) | | 80,576,792 | 80,585 |
| TOTAL MONEY MARKET FUNDS | | | |
| (Cost $610,168) | | | 610,170 |
| TOTAL INVESTMENT IN SECURITIES - 119.6% | | | |
| (Cost $4,559,745) | | | 4,300,377 |
| NET OTHER ASSETS (LIABILITIES) - (19.6)% | | | (704,581) |
| NET ASSETS - 100% | | | $3,595,796 |
| TBA Sale Commitments | | |
| | Principal Amount (000s) | Value (000s) |
| Ginnie Mae | | |
| 2% 9/1/52 | $(11,100) | $(9,807) |
| 2% 9/1/52 | (14,500) | (12,811) |
| 2% 9/1/52 | (28,900) | (25,534) |
| 2% 9/1/52 | (20,350) | (17,980) |
| 2% 9/1/52 | (10,150) | (8,968) |
| 2% 9/1/52 | (7,150) | (6,317) |
| 2.5% 9/1/52 | (22,800) | (20,789) |
| 3% 9/1/52 | (13,500) | (12,670) |
| 3% 9/1/52 | (8,100) | (7,602) |
|
| TOTAL GINNIE MAE | | (122,478) |
|
| Uniform Mortgage Backed Securities | | |
| 2% 9/1/52 | (5,500) | (4,733) |
| 2% 9/1/52 | (15,500) | (13,338) |
| 2% 9/1/52 | (28,900) | (24,870) |
| 2% 9/1/52 | (12,900) | (11,101) |
| 2% 9/1/52 | (19,400) | (16,695) |
| 3% 9/1/52 | (3,400) | (3,146) |
| 3% 9/1/52 | (17,000) | (15,731) |
|
| TOTAL UNIFORM MORTGAGE BACKED SECURITIES | | (89,614) |
|
| TOTAL TBA SALE COMMITMENTS | | |
| (Proceeds $215,854) | | $(212,092) |
| Futures Contracts | | | | | |
| | Number of contracts | Expiration Date | Notional Amount (000s) | Value (000s) | Unrealized Appreciation/(Depreciation) (000s) |
| Purchased | | | | | |
| Treasury Contracts | | | | | |
| CBOT 2-Year U.S. Treasury Note Contracts (United States) | 2,141 | Dec. 2022 | $446,031 | $(1,388) | $(1,388) |
| CBOT 5-Year U.S. Treasury Note Contracts (United States) | 76 | Dec. 2022 | 8,422 | (96) | (96) |
| CBOT Long Term U.S. Treasury Bond Contracts (United States) | 74 | Dec. 2022 | 10,052 | (6) | (6) |
|
| TOTAL PURCHASED | | | | | (1,490) |
|
| Sold | | | | | |
| Treasury Contracts | | | | | |
| CBOT 10-Year U.S. Treasury Note Contracts (United States) | 246 | Dec. 2022 | 28,759 | 421 | 421 |
| TOTAL FUTURES CONTRACTS | | | | | $(1,069) |
The notional amount of futures purchased as a percentage of Net Assets is 12.9%
The notional amount of futures sold as a percentage of Net Assets is 0.8%
For the period, the average monthly notional amount at value for futures contracts in the aggregate was $414,154,000.
Swaps
| Payment Received | Payment Frequency | Payment Paid | Payment Frequency | Clearinghouse / Counterparty(1) | Maturity Date | Notional Amount (000s) | Value (000s) | Upfront Premium Received/(Paid) (000s)(2) | Unrealized Appreciation/(Depreciation) (000s) |
| Interest Rate Swaps | | | | | | | | | |
| 2.75% | Annual | U.S. Secured Overnight Fin. Rate (SOFR) Index(3) | Annual | LCH | Sep. 2027 | $8,917 | $(93) | $0 | $(93) |
| 2.75% | Annual | U.S. Secured Overnight Fin. Rate (SOFR) Index(3) | Annual | LCH | Sep. 2032 | 5,817 | (42) | 0 | (42) |
| 2.5% | Annual | U.S. Secured Overnight Fin. Rate (SOFR) Index(3) | Annual | LCH | Sep. 2052 | 1,241 | (8) | 0 | (8) |
|
| TOTAL INTEREST RATE SWAPS | | | | | | | $(143) | $0 | $(143) |
|
(1) Swaps with LCH Clearnet Group (LCH) are centrally cleared over-the-counter (OTC) swaps.
(2) Any premiums for centrally cleared over-the-counter (OTC) swaps are recorded periodically throughout the term of the swap to variation margin and included in unrealized appreciation (depreciation).
(3) Represents floating rate.
Values shown as $0 in the Schedule of Investments may reflect amounts less than $500.
Legend
(a) Security or a portion of the security was pledged to cover margin requirements for futures contracts. At period end, the value of securities pledged amounted to $2,385,000.
(b) Security or a portion of the security was pledged to cover margin requirements for centrally cleared OTC swaps. At period end, the value of securities pledged amounted to $742,000.
(c) Security or a portion of the security has been segregated as collateral for mortgage-backed or asset-backed securities purchased on a delayed delivery or when-issued basis. At period end, the value of securities pledged amounted to $6,558,000.
(d) Security or a portion of the security is on loan at period end.
(e) Coupon rates for floating and adjustable rate securities reflect the rates in effect at period end.
(f) Coupon is indexed to a floating interest rate which may be multiplied by a specified factor and/or subject to caps or floors.
(g) Security or a portion of the security purchased on a delayed delivery or when-issued basis.
(h) Represents an investment in an underlying pool of reverse mortgages which typically do not require regular principal and interest payments as repayment is deferred until a maturity event.
(i) Interest Only (IO) security represents the right to receive only monthly interest payments on an underlying pool of mortgages or assets. Principal shown is the outstanding par amount of the pool as of the end of the period.
(j) Coupon is inversely indexed to a floating interest rate multiplied by a specified factor. The price may be considerably more volatile than the price of a comparable fixed rate security.
(k) Principal Only Strips represent the right to receive the monthly principal payments on an underlying pool of mortgage loans.
(l) Affiliated fund that is generally available only to investment companies and other accounts managed by Fidelity Investments. The rate quoted is the annualized seven-day yield of the fund at period end. A complete unaudited listing of the fund's holdings as of its most recent quarter end is available upon request. In addition, each Fidelity Central Fund's financial statements, which are not covered by the Fund's Report of Independent Registered Public Accounting Firm, are available on the SEC's website or upon request.
(m) Investment made with cash collateral received from securities on loan.
Affiliated Central Funds
Fiscal year to date information regarding the Fund's investments in Fidelity Central Funds, including the ownership percentage, is presented below.
| Fund (Amounts in thousands) | Value, beginning of period | Purchases | Sales Proceeds(a) | Dividend Income | Realized Gain/Loss | Change in Unrealized appreciation (depreciation) | Value, end of period | % ownership, end of period |
| Fidelity Cash Central Fund 2.33% | $82,211 | $1,801,426 | $1,354,052 | $2,213 | $-- | $-- | $529,585 | 1.0% |
| Fidelity Mortgage Backed Securities Central Fund | 594,108 | 28,866 | 585,420 | 9,304 | (2,399) | (35,155) | -- | 0.0% |
| Fidelity Securities Lending Cash Central Fund 2.34% | 31,859 | 1,329,792 | 1,281,066 | 123 | -- | -- | 80,585 | 0.2% |
| Total | $708,178 | $3,160,084 | $3,220,538 | $11,640 | $(2,399) | $(35,155) | $610,170 | |
(a) Includes the value of securities received through in-kind transactions, if applicable.
Amounts in the income column in the above table include any capital gain distributions from underlying funds, which are presented in the corresponding line-item in the Statement of Operations, if applicable. Amount for Fidelity Securities Lending Cash Central Fund represents the income earned on investing cash collateral, less rebates paid to borrowers and any lending agent fees associated with the loan, plus any premium payments received for lending certain types of securities.
Investment Valuation
The following is a summary of the inputs used, as of August 31, 2022, involving the Fund's assets and liabilities carried at fair value. The inputs or methodology used for valuing securities may not be an indication of the risk associated with investing in those securities. For more information on valuation inputs, and their aggregation into the levels used below, please refer to the Investment Valuation section in the accompanying Notes to Financial Statements.
| | Valuation Inputs at Reporting Date: |
| Description | Total | Level 1 | Level 2 | Level 3 |
| (Amounts in thousands) | | | | |
| Investments in Securities: | | | | |
| U.S. Government and Government Agency Obligations | $2,298,441 | $-- | $2,298,441 | $-- |
| U.S. Government Agency - Mortgage Securities | 1,181,486 | -- | 1,181,486 | -- |
| Collateralized Mortgage Obligations | 155,399 | -- | 155,399 | -- |
| Commercial Mortgage Securities | 49,882 | -- | 49,882 | -- |
| Foreign Government and Government Agency Obligations | 4,999 | -- | 4,999 | -- |
| Money Market Funds | 610,170 | 610,170 | -- | -- |
| Total Investments in Securities: | $4,300,377 | $610,170 | $3,690,207 | $-- |
| Derivative Instruments: | | | | |
| Assets | | | | |
| Futures Contracts | $421 | $421 | $-- | $-- |
| Total Assets | $421 | $421 | $-- | $-- |
| Liabilities | | | | |
| Futures Contracts | $(1,490) | $(1,490) | $-- | $-- |
| Swaps | (143) | -- | (143) | -- |
| Total Liabilities | $(1,633) | $(1,490) | $(143) | $-- |
| Total Derivative Instruments: | $(1,212) | $(1,069) | $(143) | $-- |
| Other Financial Instruments: | | | | |
| TBA Sale Commitments | $(212,092) | $-- | $(212,092) | $-- |
| Total Other Financial Instruments: | $(212,092) | $-- | $(212,092) | $-- |
Value of Derivative Instruments
The following table is a summary of the Fund's value of derivative instruments by primary risk exposure as of August 31, 2022. For additional information on derivative instruments, please refer to the Derivative Instruments section in the accompanying Notes to Financial Statements.
| Primary Risk Exposure / Derivative Type | Value |
| | Asset | Liability |
| (Amounts in thousands) | | |
| Interest Rate Risk | | |
| Futures Contracts(a) | $421 | $(1,490) |
| Swaps(b) | 0 | (143) |
| Total Interest Rate Risk | 421 | (1,633) |
| Total Value of Derivatives | $421 | $(1,633) |
(a) Reflects gross cumulative appreciation (depreciation) on futures contracts as presented in the Schedule of Investments. In the Statement of Assets and Liabilities, the period end daily variation margin is included in receivable or payable for daily variation margin on futures contracts, and the net cumulative appreciation (depreciation) is included in Total accumulated earnings (loss).
(b) For centrally cleared over-the-counter (OTC) swaps, reflects gross cumulative appreciation (depreciation) as presented in the Schedule of Investments. In the Statement of Assets and Liabilities, the period end daily variation margin for centrally cleared OTC swaps is included in receivable or payable for daily variation margin on centrally cleared OTC swaps, and the net cumulative appreciation (depreciation) for centrally cleared OTC swaps is included in Total accumulated earnings (loss).
See accompanying notes which are an integral part of the financial statements.
Financial Statements
Statement of Assets and Liabilities
| Amounts in thousands (except per-share amounts) | | August 31, 2022 |
| Assets | | |
Investment in securities, at value (including securities loaned of $78,745) — See accompanying schedule:
Unaffiliated issuers (cost $3,949,577) | $3,690,207 | |
| Fidelity Central Funds (cost $610,168) | 610,170 | |
| Total Investment in Securities (cost $4,559,745) | | $4,300,377 |
| Receivable for investments sold | | 63 |
| Receivable for TBA sale commitments | | 215,854 |
| Receivable for fund shares sold | | 1,599 |
| Interest receivable | | 8,650 |
| Distributions receivable from Fidelity Central Funds | | 1,047 |
| Receivable for daily variation margin on futures contracts | | 151 |
| Receivable from investment adviser for expense reductions | | 38 |
| Total assets | | 4,527,779 |
| Liabilities | | |
| Payable for investments purchased | | |
| Regular delivery | $14,985 | |
| Delayed delivery | 619,924 | |
| TBA sale commitments, at value | 212,092 | |
| Payable for fund shares redeemed | 2,734 | |
| Distributions payable | 205 | |
| Accrued management fee | 901 | |
| Distribution and service plan fees payable | 73 | |
| Payable for daily variation margin on centrally cleared OTC swaps | 60 | |
| Other affiliated payables | 424 | |
| Collateral on securities loaned | 80,585 | |
| Total liabilities | | 931,983 |
| Net Assets | | $3,595,796 |
| Net Assets consist of: | | |
| Paid in capital | | $4,001,288 |
| Total accumulated earnings (loss) | | (405,492) |
| Net Assets | | $3,595,796 |
| Net Asset Value and Maximum Offering Price | | |
| Class A: | | |
| Net Asset Value and redemption price per share ($119,339 ÷ 12,553 shares)(a) | | $9.51 |
| Maximum offering price per share (100/96.00 of $9.51) | | $9.91 |
| Class M: | | |
| Net Asset Value and redemption price per share ($95,430 ÷ 10,039 shares)(a) | | $9.51 |
| Maximum offering price per share (100/96.00 of $9.51) | | $9.91 |
| Class C: | | |
| Net Asset Value and offering price per share ($32,729 ÷ 3,464 shares)(a) | | $9.45 |
| Government Income: | | |
| Net Asset Value, offering price and redemption price per share ($1,755,646 ÷ 184,940 shares) | | $9.49 |
| Class I: | | |
| Net Asset Value, offering price and redemption price per share ($199,012 ÷ 20,932 shares) | | $9.51 |
| Class Z: | | |
| Net Asset Value, offering price and redemption price per share ($1,393,640 ÷ 146,511 shares) | | $9.51 |
(a) Redemption price per share is equal to net asset value less any applicable contingent deferred sales charge.
See accompanying notes which are an integral part of the financial statements.
Statement of Operations
| Amounts in thousands | | Year ended August 31, 2022 |
| Investment Income | | |
| Interest | | $47,781 |
| Income from Fidelity Central Funds (including $123 from security lending) | | 7,010 |
| Total income | | 54,791 |
| Expenses | | |
| Management fee | $10,773 | |
| Transfer agent fees | 3,330 | |
| Distribution and service plan fees | 1,046 | |
| Fund wide operations fee | 1,902 | |
| Independent trustees' fees and expenses | 11 | |
| Total expenses before reductions | 17,062 | |
| Expense reductions | (456) | |
| Total expenses after reductions | | 16,606 |
| Net investment income (loss) | | 38,185 |
| Realized and Unrealized Gain (Loss) | | |
| Net realized gain (loss) on: | | |
| Investment securities: | | |
| Unaffiliated issuers | (25,367) | |
| Fidelity Central Funds | (2,399) | |
| Futures contracts | (34,777) | |
| Swaps | (1,914) | |
| Capital gain distributions from Fidelity Central Funds | 4,630 | |
| Total net realized gain (loss) | | (59,827) |
| Change in net unrealized appreciation (depreciation) on: | | |
| Investment securities: | | |
| Unaffiliated issuers | (361,742) | |
| Fidelity Central Funds | (35,155) | |
| Futures contracts | (1,087) | |
| Swaps | (501) | |
| TBA sale commitments | 3,979 | |
| Total change in net unrealized appreciation (depreciation) | | (394,506) |
| Net gain (loss) | | (454,333) |
| Net increase (decrease) in net assets resulting from operations | | $(416,148) |
See accompanying notes which are an integral part of the financial statements.
Statement of Changes in Net Assets
| Amounts in thousands | Year ended August 31, 2022 | Year ended August 31, 2021 |
| Increase (Decrease) in Net Assets | | |
| Operations | | |
| Net investment income (loss) | $38,185 | $30,004 |
| Net realized gain (loss) | (59,827) | (43,533) |
| Change in net unrealized appreciation (depreciation) | (394,506) | (63,746) |
| Net increase (decrease) in net assets resulting from operations | (416,148) | (77,275) |
| Distributions to shareholders | (39,020) | (84,243) |
| Share transactions - net increase (decrease) | 543,547 | (868,115) |
| Total increase (decrease) in net assets | 88,379 | (1,029,633) |
| Net Assets | | |
| Beginning of period | 3,507,417 | 4,537,050 |
| End of period | $3,595,796 | $3,507,417 |
See accompanying notes which are an integral part of the financial statements.
Financial Highlights
Fidelity Government Income Fund Class A
| Years ended August 31, | 2022 | 2021 | 2020 | 2019 | 2018 |
| Selected Per–Share Data | | | | | |
| Net asset value, beginning of period | $10.78 | $11.17 | $10.70 | $10.00 | $10.36 |
| Income from Investment Operations | | | | | |
| Net investment income (loss)A,B | .076 | .052 | .117 | .199 | .166 |
| Net realized and unrealized gain (loss) | (1.269) | (.255) | .477 | .696 | (.362) |
| Total from investment operations | (1.193) | (.203) | .594 | .895 | (.196) |
| Distributions from net investment income | (.077) | (.046) | (.124) | (.195) | (.164) |
| Distributions from net realized gain | – | (.141) | – | – | – |
| Total distributions | (.077) | (.187) | (.124) | (.195) | (.164) |
| Net asset value, end of period | $9.51 | $10.78 | $11.17 | $10.70 | $10.00 |
| Total ReturnC,D | (11.11)% | (1.84)% | 5.59% | 9.06% | (1.89)% |
| Ratios to Average Net AssetsB,E,F | | | | | |
| Expenses before reductions | .77% | .76% | .77% | .78% | .77% |
| Expenses net of fee waivers, if any | .77% | .76% | .77% | .78% | .77% |
| Expenses net of all reductions | .77% | .76% | .77% | .78% | .77% |
| Net investment income (loss) | .74% | .48% | 1.08% | 1.96% | 1.64% |
| Supplemental Data | | | | | |
| Net assets, end of period (in millions) | $119 | $185 | $215 | $139 | $131 |
| Portfolio turnover rateG | 318% | 223% | 255%H | 246% | 123% |
A Calculated based on average shares outstanding during the period.
B Net investment income (loss) is affected by the timing of the declaration of dividends by any underlying mutual funds or exchange-traded funds (ETFs). Net investment income (loss) of any such underlying funds is not included in the Fund's net investment income (loss) ratio.
C Total returns would have been lower if certain expenses had not been reduced during the applicable periods shown.
D Total returns do not include the effect of the sales charges.
E Fees and expenses of any underlying mutual funds or exchange-traded funds (ETFs) are not included in the Fund's expense ratio. The Fund indirectly bears its proportionate share of these expenses. For additional expense information related to investments in Fidelity Central Funds, please refer to the "Investments in Fidelity Central Funds" note found in the Notes to Financial Statements section of the most recent Annual or Semi-Annual report.
F Expense ratios reflect operating expenses of the class. Expenses before reductions do not reflect amounts reimbursed, waived, or reduced through arrangements with the investment adviser, brokerage services, or other offset arrangements, if applicable, and do not represent the amount paid by the class during periods when reimbursements, waivers or reductions occur.
G Amount does not include the portfolio activity of any underlying mutual funds or exchange-traded funds (ETFs).
H Portfolio turnover rate excludes securities received or delivered in-kind.
See accompanying notes which are an integral part of the financial statements.
Fidelity Government Income Fund Class M
| Years ended August 31, | 2022 | 2021 | 2020 | 2019 | 2018 |
| Selected Per–Share Data | | | | | |
| Net asset value, beginning of period | $10.77 | $11.17 | $10.70 | $10.00 | $10.36 |
| Income from Investment Operations | | | | | |
| Net investment income (loss)A,B | .077 | .052 | .118 | .201 | .167 |
| Net realized and unrealized gain (loss) | (1.259) | (.265) | .477 | .696 | (.362) |
| Total from investment operations | (1.182) | (.213) | .595 | .897 | (.195) |
| Distributions from net investment income | (.078) | (.046) | (.125) | (.197) | (.165) |
| Distributions from net realized gain | – | (.141) | – | – | – |
| Total distributions | (.078) | (.187) | (.125) | (.197) | (.165) |
| Net asset value, end of period | $9.51 | $10.77 | $11.17 | $10.70 | $10.00 |
| Total ReturnC,D | (11.01)% | (1.92)% | 5.61% | 9.08% | (1.88)% |
| Ratios to Average Net AssetsB,E,F | | | | | |
| Expenses before reductions | .76% | .75% | .76% | .76% | .76% |
| Expenses net of fee waivers, if any | .76% | .75% | .76% | .76% | .76% |
| Expenses net of all reductions | .76% | .75% | .76% | .76% | .76% |
| Net investment income (loss) | .75% | .48% | 1.09% | 1.98% | 1.65% |
| Supplemental Data | | | | | |
| Net assets, end of period (in millions) | $95 | $128 | $151 | $131 | $137 |
| Portfolio turnover rateG | 318% | 223% | 255%H | 246% | 123% |
A Calculated based on average shares outstanding during the period.
B Net investment income (loss) is affected by the timing of the declaration of dividends by any underlying mutual funds or exchange-traded funds (ETFs). Net investment income (loss) of any such underlying funds is not included in the Fund's net investment income (loss) ratio.
C Total returns would have been lower if certain expenses had not been reduced during the applicable periods shown.
D Total returns do not include the effect of the sales charges.
E Fees and expenses of any underlying mutual funds or exchange-traded funds (ETFs) are not included in the Fund's expense ratio. The Fund indirectly bears its proportionate share of these expenses. For additional expense information related to investments in Fidelity Central Funds, please refer to the "Investments in Fidelity Central Funds" note found in the Notes to Financial Statements section of the most recent Annual or Semi-Annual report.
F Expense ratios reflect operating expenses of the class. Expenses before reductions do not reflect amounts reimbursed, waived, or reduced through arrangements with the investment adviser, brokerage services, or other offset arrangements, if applicable, and do not represent the amount paid by the class during periods when reimbursements, waivers or reductions occur.
G Amount does not include the portfolio activity of any underlying mutual funds or exchange-traded funds (ETFs).
H Portfolio turnover rate excludes securities received or delivered in-kind.
See accompanying notes which are an integral part of the financial statements.
Fidelity Government Income Fund Class C
| Years ended August 31, | 2022 | 2021 | 2020 | 2019 | 2018 |
| Selected Per–Share Data | | | | | |
| Net asset value, beginning of period | $10.73 | $11.16 | $10.70 | $10.00 | $10.36 |
| Income from Investment Operations | | | | | |
| Net investment income (loss)A,B | (.002) | (.032) | .034 | .122 | .088 |
| Net realized and unrealized gain (loss) | (1.261) | (.257) | .472 | .695 | (.361) |
| Total from investment operations | (1.263) | (.289) | .506 | .817 | (.273) |
| Distributions from net investment income | (.017) | –C | (.046) | (.117) | (.087) |
| Distributions from net realized gain | – | (.141) | – | – | – |
| Total distributions | (.017) | (.141) | (.046) | (.117) | (.087) |
| Net asset value, end of period | $9.45 | $10.73 | $11.16 | $10.70 | $10.00 |
| Total ReturnD,E | (11.78)% | (2.61)% | 4.75% | 8.24% | (2.64)% |
| Ratios to Average Net AssetsB,F,G | | | | | |
| Expenses before reductions | 1.53% | 1.53% | 1.53% | 1.54% | 1.54% |
| Expenses net of fee waivers, if any | 1.53% | 1.53% | 1.53% | 1.54% | 1.54% |
| Expenses net of all reductions | 1.53% | 1.53% | 1.53% | 1.54% | 1.54% |
| Net investment income (loss) | (.02)% | (.29)% | .31% | 1.20% | .87% |
| Supplemental Data | | | | | |
| Net assets, end of period (in millions) | $33 | $48 | $80 | $51 | $57 |
| Portfolio turnover rateH | 318% | 223% | 255%I | 246% | 123% |
A Calculated based on average shares outstanding during the period.
B Net investment income (loss) is affected by the timing of the declaration of dividends by any underlying mutual funds or exchange-traded funds (ETFs). Net investment income (loss) of any such underlying funds is not included in the Fund's net investment income (loss) ratio.
C Amount represents less than $.0005 per share.
D Total returns would have been lower if certain expenses had not been reduced during the applicable periods shown.
E Total returns do not include the effect of the contingent deferred sales charge.
F Fees and expenses of any underlying mutual funds or exchange-traded funds (ETFs) are not included in the Fund's expense ratio. The Fund indirectly bears its proportionate share of these expenses. For additional expense information related to investments in Fidelity Central Funds, please refer to the "Investments in Fidelity Central Funds" note found in the Notes to Financial Statements section of the most recent Annual or Semi-Annual report.
G Expense ratios reflect operating expenses of the class. Expenses before reductions do not reflect amounts reimbursed, waived, or reduced through arrangements with the investment adviser, brokerage services, or other offset arrangements, if applicable, and do not represent the amount paid by the class during periods when reimbursements, waivers or reductions occur.
H Amount does not include the portfolio activity of any underlying mutual funds or exchange-traded funds (ETFs).
I Portfolio turnover rate excludes securities received or delivered in-kind.
See accompanying notes which are an integral part of the financial statements.
Fidelity Government Income Fund
| Years ended August 31, | 2022 | 2021 | 2020 | 2019 | 2018 |
| Selected Per–Share Data | | | | | |
| Net asset value, beginning of period | $10.76 | $11.15 | $10.68 | $9.99 | $10.35 |
| Income from Investment Operations | | | | | |
| Net investment income (loss)A,B | .108 | .085 | .152 | .232 | .198 |
| Net realized and unrealized gain (loss) | (1.269) | (.257) | .476 | .686 | (.361) |
| Total from investment operations | (1.161) | (.172) | .628 | .918 | (.163) |
| Distributions from net investment income | (.109) | (.077) | (.158) | (.228) | (.197) |
| Distributions from net realized gain | – | (.141) | – | – | – |
| Total distributions | (.109) | (.218) | (.158) | (.228) | (.197) |
| Net asset value, end of period | $9.49 | $10.76 | $11.15 | $10.68 | $9.99 |
| Total ReturnC | (10.84)% | (1.56)% | 5.94% | 9.33% | (1.58)% |
| Ratios to Average Net AssetsB,D,E | | | | | |
| Expenses before reductions | .45% | .45% | .45% | .45% | .45% |
| Expenses net of fee waivers, if any | .45% | .45% | .45% | .45% | .45% |
| Expenses net of all reductions | .45% | .45% | .45% | .45% | .45% |
| Net investment income (loss) | 1.06% | .79% | 1.39% | 2.29% | 1.96% |
| Supplemental Data | | | | | |
| Net assets, end of period (in millions) | $1,756 | $2,130 | $2,743 | $2,633 | $2,964 |
| Portfolio turnover rateF | 318% | 223% | 255%G | 246% | 123% |
A Calculated based on average shares outstanding during the period.
B Net investment income (loss) is affected by the timing of the declaration of dividends by any underlying mutual funds or exchange-traded funds (ETFs). Net investment income (loss) of any such underlying funds is not included in the Fund's net investment income (loss) ratio.
C Total returns would have been lower if certain expenses had not been reduced during the applicable periods shown.
D Fees and expenses of any underlying mutual funds or exchange-traded funds (ETFs) are not included in the Fund's expense ratio. The Fund indirectly bears its proportionate share of these expenses. For additional expense information related to investments in Fidelity Central Funds, please refer to the "Investments in Fidelity Central Funds" note found in the Notes to Financial Statements section of the most recent Annual or Semi-Annual report.
E Expense ratios reflect operating expenses of the class. Expenses before reductions do not reflect amounts reimbursed, waived, or reduced through arrangements with the investment adviser, brokerage services, or other offset arrangements, if applicable, and do not represent the amount paid by the class during periods when reimbursements, waivers or reductions occur.
F Amount does not include the portfolio activity of any underlying mutual funds or exchange-traded funds (ETFs).
G Portfolio turnover rate excludes securities received or delivered in-kind.
See accompanying notes which are an integral part of the financial statements.
Fidelity Government Income Fund Class I
| Years ended August 31, | 2022 | 2021 | 2020 | 2019 | 2018 |
| Selected Per–Share Data | | | | | |
| Net asset value, beginning of period | $10.78 | $11.17 | $10.70 | $10.00 | $10.36 |
| Income from Investment Operations | | | | | |
| Net investment income (loss)A,B | .105 | .081 | .148 | .228 | .194 |
| Net realized and unrealized gain (loss) | (1.270) | (.257) | .477 | .696 | (.361) |
| Total from investment operations | (1.165) | (.176) | .625 | .924 | (.167) |
| Distributions from net investment income | (.105) | (.073) | (.155) | (.224) | (.193) |
| Distributions from net realized gain | – | (.141) | – | – | – |
| Total distributions | (.105) | (.214) | (.155) | (.224) | (.193) |
| Net asset value, end of period | $9.51 | $10.78 | $11.17 | $10.70 | $10.00 |
| Total ReturnC | (10.85)% | (1.59)% | 5.89% | 9.38% | (1.61)% |
| Ratios to Average Net AssetsB,D,E | | | | | |
| Expenses before reductions | .49% | .49% | .49% | .49% | .49% |
| Expenses net of fee waivers, if any | .49% | .49% | .49% | .49% | .49% |
| Expenses net of all reductions | .49% | .49% | .49% | .49% | .49% |
| Net investment income (loss) | 1.02% | .75% | 1.36% | 2.25% | 1.92% |
| Supplemental Data | | | | | |
| Net assets, end of period (in millions) | $199 | $280 | $411 | $407 | $411 |
| Portfolio turnover rateF | 318% | 223% | 255%G | 246% | 123% |
A Calculated based on average shares outstanding during the period.
B Net investment income (loss) is affected by the timing of the declaration of dividends by any underlying mutual funds or exchange-traded funds (ETFs). Net investment income (loss) of any such underlying funds is not included in the Fund's net investment income (loss) ratio.
C Total returns would have been lower if certain expenses had not been reduced during the applicable periods shown.
D Fees and expenses of any underlying mutual funds or exchange-traded funds (ETFs) are not included in the Fund's expense ratio. The Fund indirectly bears its proportionate share of these expenses. For additional expense information related to investments in Fidelity Central Funds, please refer to the "Investments in Fidelity Central Funds" note found in the Notes to Financial Statements section of the most recent Annual or Semi-Annual report.
E Expense ratios reflect operating expenses of the class. Expenses before reductions do not reflect amounts reimbursed, waived, or reduced through arrangements with the investment adviser, brokerage services, or other offset arrangements, if applicable, and do not represent the amount paid by the class during periods when reimbursements, waivers or reductions occur.
F Amount does not include the portfolio activity of any underlying mutual funds or exchange-traded funds (ETFs).
G Portfolio turnover rate excludes securities received or delivered in-kind.
See accompanying notes which are an integral part of the financial statements.
Fidelity Government Income Fund Class Z
| Years ended August 31, | 2022 | 2021 | 2020 | 2019 A |
| Selected Per–Share Data | | | | |
| Net asset value, beginning of period | $10.78 | $11.18 | $10.70 | $9.91 |
| Income from Investment Operations | | | | |
| Net investment income (loss)B,C | .116 | .095 | .163 | .198 |
| Net realized and unrealized gain (loss) | (1.268) | (.267) | .485 | .808 |
| Total from investment operations | (1.152) | (.172) | .648 | 1.006 |
| Distributions from net investment income | (.118) | (.087) | (.168) | (.216) |
| Distributions from net realized gain | – | (.141) | – | – |
| Total distributions | (.118) | (.228) | (.168) | (.216) |
| Net asset value, end of period | $9.51 | $10.78 | $11.18 | $10.70 |
| Total ReturnD,E | (10.74)% | (1.55)% | 6.12% | 10.27% |
| Ratios to Average Net AssetsC,F,G | | | | |
| Expenses before reductions | .40% | .40% | .40% | .40%H |
| Expenses net of fee waivers, if any | .36% | .36% | .36% | .36%H |
| Expenses net of all reductions | .36% | .36% | .36% | .36%H |
| Net investment income (loss) | 1.15% | .88% | 1.48% | 2.27%H |
| Supplemental Data | | | | |
| Net assets, end of period (in millions) | $1,394 | $735 | $937 | $139 |
| Portfolio turnover rateI | 318% | 223% | 255%J | 246% |
A For the period October 2, 2018 (commencement of sale of shares) through August 31, 2019.
B Calculated based on average shares outstanding during the period.
C Net investment income (loss) is affected by the timing of the declaration of dividends by any underlying mutual funds or exchange-traded funds (ETFs). Net investment income (loss) of any such underlying funds is not included in the Fund's net investment income (loss) ratio.
D Total returns for periods of less than one year are not annualized.
E Total returns would have been lower if certain expenses had not been reduced during the applicable periods shown.
F Fees and expenses of any underlying mutual funds or exchange-traded funds (ETFs) are not included in the Fund's expense ratio. The Fund indirectly bears its proportionate share of these expenses. For additional expense information related to investments in Fidelity Central Funds, please refer to the "Investments in Fidelity Central Funds" note found in the Notes to Financial Statements section of the most recent Annual or Semi-Annual report.
G Expense ratios reflect operating expenses of the class. Expenses before reductions do not reflect amounts reimbursed, waived, or reduced through arrangements with the investment adviser, brokerage services, or other offset arrangements, if applicable, and do not represent the amount paid by the class during periods when reimbursements, waivers or reductions occur.
H Annualized
I Amount does not include the portfolio activity of any underlying mutual funds or exchange-traded funds (ETFs).
J Portfolio turnover rate excludes securities received or delivered in-kind.
See accompanying notes which are an integral part of the financial statements.
Notes to Financial Statements
For the period ended August 31, 2022
(Amounts in thousands except percentages)
1. Organization.
Fidelity Government Income Fund (the Fund) is a fund of Fidelity Income Fund (the Trust) and is authorized to issue an unlimited number of shares. The Trust is registered under the Investment Company Act of 1940, as amended (the 1940 Act), as an open-end management investment company organized as a Massachusetts business trust. The Fund offers Class A, Class M, Class C, Government Income, Class I and Class Z shares, each of which has equal rights as to assets and voting privileges. Each class has exclusive voting rights with respect to matters that affect that class. Class C shares will automatically convert to Class A shares after a holding period of eight years from the initial date of purchase, with certain exceptions.
2. Investments in Fidelity Central Funds.
Funds may invest in Fidelity Central Funds, which are open-end investment companies generally available only to other investment companies and accounts managed by the investment adviser and its affiliates. The Schedule of Investments lists any Fidelity Central Funds held as an investment as of period end, but does not include the underlying holdings of each Fidelity Central Fund. An investing fund indirectly bears its proportionate share of the expenses of the underlying Fidelity Central Funds.
Based on its investment objective, each Fidelity Central Fund may invest or participate in various investment vehicles or strategies that are similar to those of the investing fund. These strategies are consistent with the investment objectives of the investing fund and may involve certain economic risks which may cause a decline in value of each of the Fidelity Central Funds and thus a decline in the value of the investing fund.
| Fidelity Central Fund | Investment Manager | Investment Objective | Investment Practices | Expense Ratio(a) |
| Fidelity Money Market Central Funds | Fidelity Management & Research Company LLC (FMR) | Each fund seeks to obtain a high level of current income consistent with the preservation of capital and liquidity. | Short-term Investments | Less than .005% |
(a) Expenses expressed as a percentage of average net assets and are as of each underlying Central Fund's most recent annual or semi-annual shareholder report.
A complete unaudited list of holdings for each Fidelity Central Fund is available upon request or at the Securities and Exchange Commission website at www.sec.gov. In addition, the financial statements of the Fidelity Central Funds which contain the significant accounting policies (including investment valuation policies) of those funds, and are not covered by the Report of Independent Registered Public Accounting Firm, are available on the Securities and Exchange Commission website or upon request.
3. Significant Accounting Policies.
The Fund is an investment company and applies the accounting and reporting guidance of the Financial Accounting Standards Board (FASB) Accounting Standards Codification Topic 946 Financial Services - Investment Companies. The financial statements have been prepared in conformity with accounting principles generally accepted in the United States of America (GAAP), which require management to make certain estimates and assumptions at the date of the financial statements. Actual results could differ from those estimates. Subsequent events, if any, through the date that the financial statements were issued have been evaluated in the preparation of the financial statements. The Fund's Schedule of Investments lists any underlying mutual funds or exchange-traded funds (ETFs) but does not include the underlying holdings of these funds. The following summarizes the significant accounting policies of the Fund:
Investment Valuation. Investments are valued as of 4:00 p.m. Eastern time on the last calendar day of the period. The Board of Trustees (the Board) has delegated the day to day responsibility for the valuation of the Fund's investments to the Fair Value Committee (the Committee) established by the Fund's investment adviser. In accordance with valuation policies and procedures approved by the Board, the Fund attempts to obtain prices from one or more third party pricing vendors or brokers to value its investments. When current market prices, quotations or currency exchange rates are not readily available or reliable, investments will be fair valued in good faith by the Committee, in accordance with procedures adopted by the Board. Factors used in determining fair value vary by investment type and may include market or investment specific events, changes in interest rates and credit quality. The frequency with which these procedures are used cannot be predicted and they may be utilized to a significant extent. The Committee oversees the Fund's valuation policies and procedures and reports to the Board on the Committee's activities and fair value determinations. The Board monitors the appropriateness of the procedures used in valuing the Fund's investments and ratifies the fair value determinations of the Committee.
The Fund categorizes the inputs to valuation techniques used to value its investments into a disclosure hierarchy consisting of three levels as shown below:
- Level 1 – unadjusted quoted prices in active markets for identical investments
- Level 2 – other significant observable inputs (including quoted prices for similar investments, interest rates, prepayment speeds, etc.)
- Level 3 – unobservable inputs (including the Fund's own assumptions based on the best information available)
Valuation techniques used to value the Fund's investments by major category are as follows:
Debt securities, including restricted securities, are valued based on evaluated prices received from third party pricing vendors or from brokers who make markets in such securities. Foreign government and government agency obligations and U.S. government and government agency obligations are valued by pricing vendors who utilize matrix pricing which considers yield or price of bonds of comparable quality, coupon, maturity and type or by broker-supplied prices. Collateralized mortgage obligations, commercial mortgage securities and U.S. government agency mortgage securities are valued by pricing vendors who utilize matrix pricing which considers prepayment speed assumptions, attributes of the collateral, yield or price of bonds of comparable quality, coupon, maturity and type or by broker-supplied prices. Swaps are marked-to-market daily based on valuations from third party pricing vendors, registered derivatives clearing organizations (clearinghouses) or broker-supplied valuations. These pricing sources may utilize inputs such as interest rate curves, credit spread curves, default possibilities and recovery rates. When independent prices are unavailable or unreliable, debt securities and swaps may be valued utilizing pricing methodologies which consider similar factors that would be used by third party pricing vendors. Debt securities and swaps are generally categorized as Level 2 in the hierarchy but may be Level 3 depending on the circumstances.
Futures contracts are valued at the settlement price established each day by the board of trade or exchange on which they are traded and are categorized as Level 1 in the hierarchy. Investments in open-end mutual funds, including the Fidelity Central Funds, are valued at their closing net asset value (NAV) each business day and are categorized as Level 1 in the hierarchy.
Changes in valuation techniques may result in transfers in or out of an assigned level within the disclosure hierarchy. The aggregate value of investments by input level as of August 31, 2022 is included at the end of the Fund's Schedule of Investments.
Investment Transactions and Income. For financial reporting purposes, the Fund's investment holdings and NAV include trades executed through the end of the last business day of the period. The NAV per share for processing shareholder transactions is calculated as of the close of business of the New York Stock Exchange (NYSE), normally 4:00 p.m. Eastern time and includes trades executed through the end of the prior business day. Gains and losses on securities sold are determined on the basis of identified cost and include proceeds received from litigation. Income and capital gain distributions from Fidelity Central Funds, if any, are recorded on the ex-dividend date. Interest income is accrued as earned and includes coupon interest and amortization of premium and accretion of discount on debt securities as applicable.
Class Allocations and Expenses. Investment income, realized and unrealized capital gains and losses, common expenses of a fund, and certain fund-level expense reductions, if any, are allocated daily on a pro-rata basis to each class based on the relative net assets of each class to the total net assets of a fund. Each class differs with respect to transfer agent and distribution and service plan fees incurred, as applicable. Certain expense reductions may also differ by class, if applicable. For the reporting period, the allocated portion of income and expenses to each class as a percent of its average net assets may vary due to the timing of recording these transactions in relation to fluctuating net assets of the classes. Expenses directly attributable to a fund are charged to that fund. Expenses attributable to more than one fund are allocated among the respective funds on the basis of relative net assets or other appropriate methods. Expenses included in the accompanying financial statements reflect the expenses of that fund and do not include any expenses associated with any underlying mutual funds or exchange-traded funds. Although not included in a fund's expenses, a fund indirectly bears its proportionate share of these expenses through the net asset value of each underlying mutual fund or exchange-traded fund. Expense estimates are accrued in the period to which they relate and adjustments are made when actual amounts are known.
Income Tax Information and Distributions to Shareholders. Each year, the Fund intends to qualify as a regulated investment company under Subchapter M of the Internal Revenue Code, including distributing substantially all of its taxable income and realized gains. As a result, no provision for U.S. Federal income taxes is required. As of August 31, 2022, the Fund did not have any unrecognized tax benefits in the financial statements; nor is the Fund aware of any tax positions for which it is reasonably possible that the total amounts of unrecognized tax benefits will significantly change in the next twelve months. The Fund files a U.S. federal tax return, in addition to state and local tax returns as required. The Fund's federal income tax returns are subject to examination by the Internal Revenue Service (IRS) for a period of three fiscal years after they are filed. State and local tax returns may be subject to examination for an additional fiscal year depending on the jurisdiction.
Distributions are declared and recorded daily and paid monthly from net investment income. Distributions from realized gains, if any, are declared and recorded on the ex-dividend date. Income and capital gain distributions are declared separately for each class. Income and capital gain distributions are determined in accordance with income tax regulations, which may differ from GAAP.
Capital accounts within the financial statements are adjusted for permanent book-tax differences. These adjustments have no impact on net assets or the results of operations. Capital accounts are not adjusted for temporary book-tax differences which will reverse in a subsequent period.
Book-tax differences are primarily due to futures contracts, swaps, market discount, short-term gain distributions from Underlying Funds, capital loss carryforwards and losses deferred due to wash sales and future contracts.
As of period end, the cost and unrealized appreciation (depreciation) in securities, and derivatives if applicable, for federal income tax purposes were as follows:
| Gross unrealized appreciation | $4,825 |
| Gross unrealized depreciation | (258,316) |
| Net unrealized appreciation (depreciation) | $(253,491) |
| Tax Cost | $4,557,487 |
The tax-based components of distributable earnings as of period end were as follows:
| Undistributed ordinary income | $72 |
| Capital loss carryforward | $(152,073) |
| Net unrealized appreciation (depreciation) on securities and other investments | $(253,491) |
Capital loss carryforwards are only available to offset future capital gains of the Fund to the extent provided by regulations and may be limited. The capital loss carryforward information presented below, including any applicable limitation, is estimated as of fiscal period end and is subject to adjustment.
| Short-term | $(106,096) |
| Long-term | (45,977) |
| Total capital loss carryforward | $(152,073) |
The tax character of distributions paid was as follows:
| | August 31, 2022 | August 31, 2021 |
| Ordinary Income | $39,020 | $ 83,266 |
| Long-term Capital Gains | – | 977 |
| Total | $39,020 | $ 84,243 |
Delayed Delivery Transactions and When-Issued Securities. During the period, certain Funds transacted in securities on a delayed delivery or when-issued basis. Payment and delivery may take place after the customary settlement period for that security. The price of the underlying securities and the date when the securities will be delivered and paid for are fixed at the time the transaction is negotiated. Securities purchased on a delayed delivery or when-issued basis are identified as such in the Schedule of Investments. Compensation for interest forgone in the purchase of a delayed delivery or when-issued debt security may be received. With respect to purchase commitments, each applicable Fund identifies securities as segregated in its records with a value at least equal to the amount of the commitment. Payables and receivables associated with the purchases and sales of delayed delivery securities having the same coupon, settlement date and broker are offset. Delayed delivery or when-issued securities that have been purchased from and sold to different brokers are reflected as both payables and receivables in the Statement of Assets and Liabilities under the caption "Delayed delivery", as applicable. Losses may arise due to changes in the value of the underlying securities or if the counterparty does not perform under the contract's terms, or if the issuer does not issue the securities due to political, economic, or other factors.
To-Be-Announced (TBA) Securities and Mortgage Dollar Rolls. TBA securities involve buying or selling mortgage-backed securities (MBS) on a forward commitment basis. A TBA transaction typically does not designate the actual security to be delivered and only includes an approximate principal amount; however delivered securities must meet specified terms defined by industry guidelines, including issuer, rate and current principal amount outstanding on underlying mortgage pools. Funds may enter into a TBA transaction with the intent to take possession of or deliver the underlying MBS, or a fund may elect to extend the settlement by entering into either a mortgage or reverse mortgage dollar roll. Mortgage dollar rolls are transactions where a fund sells TBA securities and simultaneously agrees to repurchase MBS on a later date at a lower price and with the same counterparty. Reverse mortgage dollar rolls involve the purchase and simultaneous agreement to sell TBA securities on a later date at a lower price. Transactions in mortgage dollar rolls and reverse mortgage dollar rolls are accounted for as purchases and sales and may result in an increase to a fund's portfolio turnover rate.
Purchases and sales of TBA securities involve risks similar to those discussed above for delayed delivery and when-issued securities. Also, if the counterparty in a mortgage dollar roll or a reverse mortgage dollar roll transaction files for bankruptcy or becomes insolvent, a fund's right to repurchase or sell securities may be limited. Additionally, when a fund sells TBA securities without already owning or having the right to obtain the deliverable securities (an uncovered forward commitment to sell), it incurs a risk of loss because it could have to purchase the securities at a price that is higher than the price at which it sold them. A fund may be unable to purchase the deliverable securities if the corresponding market is illiquid.
TBA securities subject to a forward commitment to sell at period end are included at the end of the Schedule of Investments under the caption "TBA Sale Commitments." The proceeds and value of these commitments are reflected in the Statement of Assets and Liabilities as "Receivable for TBA sale commitments" and "TBA sale commitments, at value," respectively.
4. Derivative Instruments.
Risk Exposures and the Use of Derivative Instruments. Investment objectives allow a fund to enter into various types of derivative contracts, including futures contracts, swaps and options. Derivatives are investments whose value is primarily derived from underlying assets, indices or reference rates and may be transacted on an exchange or over-the-counter (OTC). Derivatives may involve a future commitment to buy or sell a specified asset based on specified terms, to exchange future cash flows at periodic intervals based on a notional principal amount, or for one party to make one or more payments upon the occurrence of specified events in exchange for periodic payments from the other party.
Derivatives were used to increase returns, to gain exposure to certain types of assets and to manage exposure to certain risks as defined below. The success of any strategy involving derivatives depends on analysis of numerous economic factors, and if the strategies for investment do not work as intended, the objectives may not be achieved.
Derivatives were used to increase or decrease exposure to the following risk(s):
| Interest Rate Risk | Interest rate risk relates to the fluctuations in the value of interest-bearing securities due to changes in the prevailing levels of market interest rates. |
Funds are also exposed to additional risks from investing in derivatives, such as liquidity risk and counterparty credit risk. Liquidity risk is the risk that a fund will be unable to close out the derivative in the open market in a timely manner. Counterparty credit risk is the risk that the counterparty will not be able to fulfill its obligation to a fund. Derivative counterparty credit risk is managed through formal evaluation of the creditworthiness of all potential counterparties. On certain OTC derivatives such as options, a fund attempts to reduce its exposure to counterparty credit risk by entering into an International Swaps and Derivatives Association, Inc. (ISDA) Master Agreement with each of its counterparties. The ISDA Master Agreement gives a fund the right to terminate all transactions traded under such agreement upon the deterioration in the credit quality of the counterparty beyond specified levels. The ISDA Master Agreement gives each party the right, upon an event of default by the other party or a termination of the agreement, to close out all transactions traded under such agreement and to net amounts owed under each transaction to one net payable by one party to the other. To mitigate counterparty credit risk on bi-lateral OTC derivatives, a fund receives collateral in the form of cash or securities once net unrealized appreciation on outstanding derivative contracts under an ISDA Master Agreement exceeds certain applicable thresholds, subject to certain minimum transfer provisions. The collateral received is held in segregated accounts with the custodian bank in accordance with the collateral agreements entered into between a fund, the counterparty and the custodian bank. A fund could experience delays and costs in gaining access to the collateral even though it is held by the custodian bank. The maximum risk of loss to a fund from counterparty credit risk related to bi-lateral OTC derivatives is generally the aggregate unrealized appreciation and unpaid counterparty payments in excess of any collateral pledged by the counterparty to a fund. A fund may be required to pledge collateral for the benefit of the counterparties on bi-lateral OTC derivatives in an amount not less than each counterparty's unrealized appreciation on outstanding derivative contracts, subject to certain minimum transfer provisions, and any such pledged collateral is identified in the Schedule of Investments. Exchange-traded contracts are not covered by the ISDA Master Agreement; however counterparty credit risk related to these contracts may be mitigated by the protection provided by the exchange on which they trade. Counterparty credit risk related to centrally cleared OTC swaps may be mitigated by the protection provided by the clearinghouse.
Investing in derivatives may involve greater risks than investing in the underlying assets directly and, to varying degrees, may involve risk of loss in excess of any initial investment and collateral received and amounts recognized in the Statement of Assets and Liabilities. In addition, there may be the risk that the change in value of the derivative contract does not correspond to the change in value of the underlying instrument.
Net Realized Gain (Loss) and Change in Net Unrealized Appreciation (Depreciation) on Derivatives. The table below, which reflects the impacts of derivatives on the financial performance, summarizes the net realized gain (loss) and change in net unrealized appreciation (depreciation) for derivatives during the period as presented in the Statement of Operations.
| Primary Risk Exposure / Derivative Type | Net Realized Gain (Loss) | Change in Net Unrealized Appreciation (Depreciation) |
| Fidelity Government Income Fund | | |
| Interest Rate Risk | | |
| Futures Contracts | $(34,777) | $(1,087) |
| Purchased Options | (102) | 98 |
| Swaps | (1,914) | (501) |
| Total Interest Rate Risk | $(36,793) | $(1,490) |
If there are any open positions at period end, a summary of the value of derivatives by primary risk exposure is included at the end of the Schedule of Investments.
Futures Contracts. A futures contract is an agreement between two parties to buy or sell a specified underlying instrument for a fixed price at a specified future date. Futures contracts were used to manage exposure to the bond market and fluctuations in interest rates.
Upon entering into a futures contract, a fund is required to deposit either cash or securities (initial margin) with a clearing broker in an amount equal to a certain percentage of the face value of the contract. Futures contracts are marked-to-market daily and subsequent daily payments are made or received by a fund depending on the daily fluctuations in the value of the futures contracts and are recorded as unrealized appreciation or (depreciation). This receivable and/or payable, if any, is included in daily variation margin on futures contracts in the Statement of Assets and Liabilities. Realized gain or (loss) is recorded upon the expiration or closing of a futures contract. The net realized gain (loss) and change in net unrealized appreciation (depreciation) on futures contracts during the period is presented in the Statement of Operations.
Any open futures contracts at period end are presented in the Schedule of Investments under the caption "Futures Contracts". The notional amount at value reflects each contract's exposure to the underlying instrument or index at period end, and is representative of volume of activity during the period unless an average notional amount is presented. Any securities deposited to meet initial margin requirements are identified in the Schedule of Investments. Any cash deposited to meet initial margin requirements is presented as segregated cash with brokers for derivative instruments in the Statement of Assets and Liabilities.
Options. Options give the purchaser the right, but not the obligation, to buy (call) or sell (put) an underlying security or financial instrument at an agreed exercise or strike price between or on certain dates. Options obligate the seller (writer) to buy (put) or sell (call) an underlying instrument at the exercise or strike price or cash settle an underlying derivative instrument if the holder exercises the option on or before the expiration date. OTC options, such as swaptions, which are options where the underlying instrument is a swap, were used to manage exposure to fluctuations in interest rates.
Upon entering into an options contract, a fund will pay or receive a premium. Premiums paid on purchased options are reflected as cost of investments and premiums received on written options are reflected as a liability on the Statement of Assets and Liabilities. Certain options may be purchased or written with premiums to be paid or received on a future date. Options are valued daily and any unrealized appreciation (depreciation) is reflected on the Statement of Assets and Liabilities. When an option is exercised, the cost or proceeds of the underlying instrument purchased or sold is adjusted by the amount of the premium. When an option is closed, a gain or loss is realized depending on whether the proceeds or amount paid for the closing sale transaction is greater or less than the premium received or paid. When an option expires, gains and losses are realized to the extent of premiums received and paid, respectively. The net realized and unrealized gains (losses) on purchased options are included in the Statement of Operations in net realized gain (loss) and change in net unrealized appreciation (depreciation) on investment securities. The net realized gain (loss) and change in net unrealized appreciation (depreciation) on written options are presented in the Statement of Operations.
Any open options at period end are presented in the Schedule of Investments under the captions "Purchased Options," "Purchased Swaptions," "Written Options" and "Written Swaptions," as applicable, and are representative of volume of activity during the period unless an average notional amount is presented.
Writing puts and buying calls tend to increase exposure to the underlying instrument while buying puts and writing calls tend to decrease exposure to the underlying instrument. For purchased options, risk of loss is limited to the premium paid, and for written options, risk of loss is the change in value in excess of the premium received.
Swaps. A swap is a contract between two parties to exchange future cash flows at periodic intervals based on a notional principal amount. A centrally cleared OTC swap is a transaction executed between a fund and a dealer counterparty, then cleared by a futures commission merchant (FCM) through a clearinghouse. Once cleared, the clearinghouse serves as a central counterparty, with whom a fund exchanges cash flows for the life of the transaction, similar to transactions in futures contracts.
Centrally cleared OTC swaps require a fund to deposit either cash or securities (initial margin) with the FCM, at the instruction of and for the benefit of the clearinghouse. Any securities deposited to meet initial margin requirements are identified in the Schedule of Investments. Any cash deposited to meet initial margin requirements is presented in segregated cash with brokers for derivative instruments in the Statement of Assets and Liabilities. Centrally cleared OTC swaps are marked-to-market daily and subsequent payments (variation margin) are made or received depending on the daily fluctuations in the value of the swaps and are recorded as unrealized appreciation or (depreciation). These daily payments, if any, are included in receivable or payable for daily variation margin on centrally cleared OTC swaps in the Statement of Assets and Liabilities. Any premiums for centrally cleared OTC swaps are recorded periodically throughout the term of the swap to variation margin and included in unrealized appreciation (depreciation) in the Statement of Assets and Liabilities. Any premiums are recognized as realized gain (loss) upon termination or maturity of the swap.
Payments are exchanged at specified intervals, accrued daily commencing with the effective date of the contract and recorded as realized gain or (loss). Some swaps may be terminated prior to the effective date and realize a gain or loss upon termination. The net realized gain (loss) and change in net unrealized appreciation (depreciation) on swaps during the period is presented in the Statement of Operations.
Any open swaps at period end are included in the Schedule of Investments under the caption "Swaps", and are representative of volume of activity during the period unless an average notional amount is presented.
Interest Rate Swaps. Interest rate swaps are agreements between counterparties to exchange cash flows, one based on a fixed rate, and the other on a floating rate. A fund enters into interest rate swaps to manage its exposure to interest rate changes. Changes in interest rates can have an effect on both the value of bond holdings as well as the amount of interest income earned. In general, the value of bonds can fall when interest rates rise and can rise when interest rates fall.
5. Purchases and Sales of Investments.
Purchases and sales of securities, other than short-term securities, U.S. government securities and in-kind transactions, as applicable, are noted in the table below.
| | Purchases ($) | Sales ($) |
| Fidelity Government Income Fund | 5,364,865 | 5,842,818 |
6. Fees and Other Transactions with Affiliates.
Management Fee and Expense Contract. Fidelity Management & Research Company LLC (the investment adviser) and its affiliates provide the Fund with investment management related services for which the Fund pays a monthly management fee. The management fee is the sum of an individual fund fee rate that is based on an annual rate of .20% of the Fund's average net assets and an annualized group fee rate that averaged .10% during the period. The group fee rate is based upon the monthly average net assets of a group of registered investment companies with which the investment adviser has management contracts. The group fee rate decreases as assets under management increase and increases as assets under management decrease. For the reporting period, the total annual management fee rate was .30% of the Fund's average net assets.
In addition, under the expense contract, the investment adviser pays class-level expenses for Government Income, so that the total expenses, except the compensation of the independent Trustees and certain other expenses such as interest expense do not exceed .45% of the Class' average net assets. This agreement does not apply to any of the other classes and any change or modification that would increase expenses can only be made with shareholder approval.
Distribution and Service Plan Fees. In accordance with Rule 12b-1 of the 1940 Act, the Fund has adopted separate Distribution and Service Plans for each class of shares. Certain classes pay Fidelity Distributors Company LLC (FDC), an affiliate of the investment adviser, separate Distribution and Service Fees, each of which is based on an annual percentage of each class' average net assets. In addition, FDC may pay financial intermediaries for selling shares of the Fund and providing shareholder support services. For the period, the Distribution and Service Fee rates, total fees and amounts retained by FDC were as follows:
| | Distribution Fee | Service Fee | Total Fees | Retained by FDC |
| Class A | -% | .25% | $368 | $8 |
| Class M | -% | .25% | 273 | –(a) |
| Class C | .75% | .25% | 405 | 29 |
| | | | $1,046 | $37 |
(a) In the amount of less than five hundred dollars.
Sales Load. FDC may receive a front-end sales charge of up to 4.00% for selling Class A shares and Class M shares, some of which is paid to financial intermediaries for selling shares of the Fund. Depending on the holding period, FDC may receive contingent deferred sales charges levied on Class A, Class M and Class C redemptions. The deferred sales charges are 1.00% for Class C shares, .75% for certain purchases of Class A shares and .25% for certain purchases of Class M shares.
For the period, sales charge amounts retained by FDC were as follows:
| | Retained by FDC |
| Class A | $17 |
| Class M | 1 |
| Class C(a) | 1 |
| | $19 |
(a) When Class C shares are initially sold, FDC pays commissions from its own resources to financial intermediaries through which the sales are made.
Transfer Agent Fees. Fidelity Investments Institutional Operations Company LLC (FIIOC), an affiliate of the investment adviser, is the transfer, dividend disbursing and shareholder servicing agent for each class of the Fund. FIIOC receives account fees and asset-based fees that vary according to the account size and type of account of the shareholders of each respective class of the Fund, with the exception of Government Income and Class Z. FIIOC receives an asset-based fee of Government Income's and Class Z's average net assets. FIIOC pays for typesetting, printing and mailing of shareholder reports, except proxy statements. For the period, transfer agent fees for each class were as follows:
| | Amount | % of Class-Level Average Net Assets |
| Class A | $251 | .17 |
| Class M | 171 | .16 |
| Class C | 75 | .18 |
| Government Income | 1,927 | .10 |
| Class I | 324 | .14 |
| Class Z | 582 | .05 |
| | $3,330 | |
Fund Wide Operations Fee. Pursuant to the Fund Wide Operations and Expense Agreement (FWOE), the investment adviser has agreed to provide for fund-level expenses (which may not include transfer agent, the compensation of the independent Trustees, interest, taxes or extraordinary expenses, as applicable) in return for a FWOE fee equal to .35% of fund-level average net assets less the total amount of the management fee. The FWOE paid by a fund is reduced by an amount equal to the fees and expenses paid to the independent Trustees. For the period, the FWOE fees were equivalent to the following annual rate expressed as a percentage of average net assets:
| Fidelity Government Income Fund | .05% |
Interfund Trades. Funds may purchase from or sell securities to other Fidelity Funds under procedures adopted by the Board. The procedures have been designed to ensure these interfund trades are executed in accordance with Rule 17a-7 of the 1940 Act. Any interfund trades are included within the respective purchases and sales amounts shown in the Purchases and Sales of Investments note. During the period, there were no interfund trades.
Affiliated Exchanges In-Kind. During the period, the Fund redeemed 2,708 shares of Fidelity Mortgage Backed Securities Central Fund in exchange for investments, including accrued interest and cash, if any, with a value of $273,666. The net realized loss of $9,995 on the Fund's redemptions of Fidelity Mortgage Backed Securities Central Fund shares is included in "Net realized gain (loss) on Investment securities: Fidelity Central Funds" in the accompanying Statement of Operations. The Fund recognized a net loss on the exchanges for federal income tax purposes.
7. Committed Line of Credit.
Certain Funds participate with other funds managed by the investment adviser or an affiliate in a $4.25 billion credit facility (the "line of credit") to be utilized for temporary or emergency purposes to fund shareholder redemptions or for other short-term liquidity purposes. The commitment fees on the pro-rata portion of the line of credit are borne by the investment adviser. During the period, there were no borrowings on this line of credit.
8. Security Lending.
Funds lend portfolio securities from time to time in order to earn additional income. Lending agents are used, including National Financial Services (NFS), an affiliate of the investment adviser. Pursuant to a securities lending agreement, NFS will receive a fee, which is capped at 9.9% of a fund's daily lending revenue, for its services as lending agent. A fund may lend securities to certain qualified borrowers, including NFS. On the settlement date of the loan, a fund receives collateral (in the form of U.S. Treasury obligations, letters of credit and/or cash) against the loaned securities and maintains collateral in an amount not less than 100% of the market value of the loaned securities during the period of the loan. The market value of the loaned securities is determined at the close of business of a fund and any additional required collateral is delivered to a fund on the next business day. A fund or borrower may terminate the loan at any time, and if the borrower defaults on its obligation to return the securities loaned because of insolvency or other reasons, a fund may apply collateral received from the borrower against the obligation. A fund may experience delays and costs in recovering the securities loaned. Any cash collateral received is invested in the Fidelity Securities Lending Cash Central Fund. Any loaned securities are identified as such in the Schedule of Investments, and the value of loaned securities and cash collateral at period end, as applicable, are presented in the Statement of Assets and Liabilities. Security lending income represents the income earned on investing cash collateral, less rebates paid to borrowers and any lending agent fees associated with the loan, plus any premium payments received for lending certain types of securities. Security lending income is presented in the Statement of Operations as a component of income from Fidelity Central Funds. Affiliated security lending activity, if any, was as follows:
| | Total Security Lending Fees Paid to NFS | Security Lending Income From Securities Loaned to NFS | Value of Securities Loaned to NFS at Period End |
| Fidelity Government Income Fund | $13 | $– | $– |
9. Expense Reductions.
The investment adviser contractually agreed to reimburse expenses of each class to the extent annual operating expenses exceeded certain levels of class-level average net assets as noted in the table below. This reimbursement will remain in place through December 31, 2023. Some expenses, for example the compensation of the independent Trustees and certain other expenses such as interest expense, are excluded from this reimbursement.
The following classes were in reimbursement during the period:
| | Expense Limitations | Reimbursement |
| Class Z | .36% | $456 |
10. Distributions to Shareholders.
Distributions to shareholders of each class were as follows:
| | Year ended
August 31, 2022 | Year ended
August 31, 2021 |
| Fidelity Government Income Fund | | |
| Distributions to shareholders | | |
| Class A | $1,067 | $3,864 |
| Class M | 824 | 2,519 |
| Class C | 66 | 1,058 |
| Government Income | 20,606 | 52,075 |
| Class I | 2,410 | 7,431 |
| Class Z | 14,047 | 17,296 |
| Total | $39,020 | $84,243 |
11. Share Transactions.
Share transactions for each class were as follows and may contain in-kind transactions, automatic conversions between classes or exchanges between affiliated funds:
| | Shares | Shares | Dollars | Dollars |
| | Year ended August 31, 2022 | Year ended August 31, 2021 | Year ended August 31, 2022 | Year ended August 31, 2021 |
| Fidelity Government Income Fund | | | | |
| Class A | | | | |
| Shares sold | 2,041 | 8,228 | $20,884 | $90,171 |
| Reinvestment of distributions | 101 | 340 | 1,022 | 3,726 |
| Shares redeemed | (6,788) | (10,651) | (70,057) | (115,273) |
| Net increase (decrease) | (4,646) | (2,083) | $(48,151) | $(21,376) |
| Class M | | | | |
| Shares sold | 2,434 | 3,941 | $24,763 | $42,945 |
| Reinvestment of distributions | 75 | 212 | 755 | 2,321 |
| Shares redeemed | (4,360) | (5,750) | (44,736) | (62,403) |
| Net increase (decrease) | (1,851) | (1,597) | $(19,218) | $(17,137) |
| Class C | | | | |
| Shares sold | 388 | 1,595 | $3,951 | $17,510 |
| Reinvestment of distributions | 7 | 95 | 66 | 1,047 |
| Shares redeemed | (1,438) | (4,341) | (14,547) | (46,802) |
| Net increase (decrease) | (1,043) | (2,651) | $(10,530) | $(28,245) |
| Government Income | | | | |
| Shares sold | 45,717 | 54,380 | $462,305 | $591,713 |
| Reinvestment of distributions | 1,913 | 4,544 | 19,241 | 49,604 |
| Shares redeemed | (60,673) | (106,853) | (615,563) | (1,154,338) |
| Net increase (decrease) | (13,043) | (47,929) | $(134,017) | $(513,021) |
| Class I | | | | |
| Shares sold | 7,936 | 13,230 | $81,576 | $144,311 |
| Reinvestment of distributions | 229 | 645 | 2,318 | 7,061 |
| Shares redeemed | (13,237) | (24,629) | (136,001) | (266,674) |
| Net increase (decrease) | (5,072) | (10,754) | $(52,107) | $(115,302) |
| Class Z | | | | |
| Shares sold | 107,510 | 20,599 | $1,106,400 | $222,719 |
| Reinvestment of distributions | 1,383 | 1,555 | 13,887 | 17,008 |
| Shares redeemed | (30,583) | (37,830) | (312,717) | (412,761) |
| Net increase (decrease) | 78,310 | (15,676) | $807,570 | $(173,034) |
12. Other.
A fund's organizational documents provide former and current trustees and officers with a limited indemnification against liabilities arising in connection with the performance of their duties to the fund. In the normal course of business, a fund may also enter into contracts that provide general indemnifications. A fund's maximum exposure under these arrangements is unknown as this would be dependent on future claims that may be made against a fund. The risk of material loss from such claims is considered remote.
At the end of the period, the following mutual funds managed by the investment adviser or its affiliates were the owners of record of 10% or more of the total outstanding shares.
| | Strategic Advisers Fidelity Core Income Fund |
| Fidelity Government Income Fund | 17% |
13. Risk and Uncertainties.
Many factors affect a fund's performance. Developments that disrupt global economies and financial markets, such as pandemics, epidemics, outbreaks of infectious diseases, war, terrorism, and environmental disasters, may significantly affect a fund's investment performance. The effects of these developments to a fund will be impacted by the types of securities in which a fund invests, the financial condition, industry, economic sector, and geographic location of an issuer, and a fund's level of investment in the securities of that issuer.
Report of Independent Registered Public Accounting Firm
To the Board of Trustees of Fidelity Income Fund and Shareholders of Fidelity Government Income Fund
Opinion on the Financial Statements
We have audited the accompanying statement of assets and liabilities, including the schedule of investments, of Fidelity Government Income Fund (one of the funds constituting Fidelity Income Fund, referred to hereafter as the “Fund”) as of August 31, 2022, the related statement of operations for the year ended August 31, 2022, the statement of changes in net assets for each of the two years in the period ended August 31, 2022, including the related notes, and the financial highlights for each of the periods indicated therein (collectively referred to as the “financial statements”). In our opinion, the financial statements present fairly, in all material respects, the financial position of the Fund as of August 31, 2022, the results of its operations for the year then ended, the changes in its net assets for each of the two years in the period ended August 31, 2022 and the financial highlights for each of the periods indicated therein in conformity with accounting principles generally accepted in the United States of America.
Basis for Opinion
These financial statements are the responsibility of the Fund’s management. Our responsibility is to express an opinion on the Fund’s financial statements based on our audits. We are a public accounting firm registered with the Public Company Accounting Oversight Board (United States) (PCAOB) and are required to be independent with respect to the Fund in accordance with the U.S. federal securities laws and the applicable rules and regulations of the Securities and Exchange Commission and the PCAOB.
We conducted our audits of these financial statements in accordance with the standards of the PCAOB. Those standards require that we plan and perform the audit to obtain reasonable assurance about whether the financial statements are free of material misstatement, whether due to error or fraud.
Our audits included performing procedures to assess the risks of material misstatement of the financial statements, whether due to error or fraud, and performing procedures that respond to those risks. Such procedures included examining, on a test basis, evidence regarding the amounts and disclosures in the financial statements. Our audits also included evaluating the accounting principles used and significant estimates made by management, as well as evaluating the overall presentation of the financial statements. Our procedures included confirmation of securities owned as of August 31, 2022 by correspondence with the custodian and brokers; when replies were not received from brokers, we performed other auditing procedures. We believe that our audits provide a reasonable basis for our opinion.
/s/ PricewaterhouseCoopers LLP
Boston, Massachusetts
October 14, 2022
We have served as the auditor of one or more investment companies in the Fidelity group of funds since 1932.
Trustees and Officers
The Trustees, Members of the Advisory Board (if any), and officers of the trust and fund, as applicable, are listed below. The Board of Trustees governs the fund and is responsible for protecting the interests of shareholders. The Trustees are experienced executives who meet periodically throughout the year to oversee the fund's activities, review contractual arrangements with companies that provide services to the fund, oversee management of the risks associated with such activities and contractual arrangements, and review the fund's performance. Each of the Trustees oversees 297 funds.
The Trustees hold office without limit in time except that (a) any Trustee may resign; (b) any Trustee may be removed by written instrument, signed by at least two-thirds of the number of Trustees prior to such removal; (c) any Trustee who requests to be retired or who has become incapacitated by illness or injury may be retired by written instrument signed by a majority of the other Trustees; and (d) any Trustee may be removed at any special meeting of shareholders by a two-thirds vote of the outstanding voting securities of the trust. Each Trustee who is not an interested person (as defined in the 1940 Act) of the trust and the fund is referred to herein as an Independent Trustee. Each Independent Trustee shall retire not later than the last day of the calendar year in which his or her 75th birthday occurs. The Independent Trustees may waive this mandatory retirement age policy with respect to individual Trustees. Officers and Advisory Board Members hold office without limit in time, except that any officer or Advisory Board Member may resign or may be removed by a vote of a majority of the Trustees at any regular meeting or any special meeting of the Trustees. Except as indicated, each individual has held the office shown or other offices in the same company for the past five years.
The fund's Statement of Additional Information (SAI) includes more information about the Trustees. To request a free copy, call Fidelity at 1-800-544-8544 if you’re an individual investing directly with Fidelity, call 1-800-835-5092 if you’re a plan sponsor or participant with Fidelity as your recordkeeper or call 1-877-208-0098 on institutional accounts or if you’re an advisor or invest through one.
Experience, Skills, Attributes, and Qualifications of the Trustees. The Governance and Nominating Committee has adopted a statement of policy that describes the experience, qualifications, attributes, and skills that are necessary and desirable for potential Independent Trustee candidates (Statement of Policy). The Board believes that each Trustee satisfied at the time he or she was initially elected or appointed a Trustee, and continues to satisfy, the standards contemplated by the Statement of Policy. The Governance and Nominating Committee also engages professional search firms to help identify potential Independent Trustee candidates who have the experience, qualifications, attributes, and skills consistent with the Statement of Policy. From time to time, additional criteria based on the composition and skills of the current Independent Trustees, as well as experience or skills that may be appropriate in light of future changes to board composition, business conditions, and regulatory or other developments, have also been considered by the professional search firms and the Governance and Nominating Committee. In addition, the Board takes into account the Trustees' commitment and participation in Board and committee meetings, as well as their leadership of standing and ad hoc committees throughout their tenure.
In determining that a particular Trustee was and continues to be qualified to serve as a Trustee, the Board has considered a variety of criteria, none of which, in isolation, was controlling. The Board believes that, collectively, the Trustees have balanced and diverse experience, qualifications, attributes, and skills, which allow the Board to operate effectively in governing the fund and protecting the interests of shareholders. Information about the specific experience, skills, attributes, and qualifications of each Trustee, which in each case led to the Board's conclusion that the Trustee should serve (or continue to serve) as a trustee of the fund, is provided below.
Board Structure and Oversight Function. Abigail P. Johnson is an interested person and currently serves as Chairman. The Trustees have determined that an interested Chairman is appropriate and benefits shareholders because an interested Chairman has a personal and professional stake in the quality and continuity of services provided to the fund. Independent Trustees exercise their informed business judgment to appoint an individual of their choosing to serve as Chairman, regardless of whether the Trustee happens to be independent or a member of management. The Independent Trustees have determined that they can act independently and effectively without having an Independent Trustee serve as Chairman and that a key structural component for assuring that they are in a position to do so is for the Independent Trustees to constitute a substantial majority for the Board. The Independent Trustees also regularly meet in executive session. Michael E. Kenneally serves as Chairman of the Independent Trustees and as such (i) acts as a liaison between the Independent Trustees and management with respect to matters important to the Independent Trustees and (ii) with management prepares agendas for Board meetings.
Fidelity® funds are overseen by different Boards of Trustees. The fund's Board oversees Fidelity's investment-grade bond, money market, asset allocation and certain equity funds, and other Boards oversee Fidelity's high income and other equity funds. The asset allocation funds may invest in Fidelity® funds that are overseen by such other Boards. The use of separate Boards, each with its own committee structure, allows the Trustees of each group of Fidelity® funds to focus on the unique issues of the funds they oversee, including common research, investment, and operational issues. On occasion, the separate Boards establish joint committees to address issues of overlapping consequences for the Fidelity® funds overseen by each Board.
The Trustees operate using a system of committees to facilitate the timely and efficient consideration of all matters of importance to the Trustees, the fund, and fund shareholders and to facilitate compliance with legal and regulatory requirements and oversight of the fund's activities and associated risks. The Board, acting through its committees, has charged FMR and its affiliates with (i) identifying events or circumstances the occurrence of which could have demonstrably adverse effects on the fund's business and/or reputation; (ii) implementing processes and controls to lessen the possibility that such events or circumstances occur or to mitigate the effects of such events or circumstances if they do occur; and (iii) creating and maintaining a system designed to evaluate continuously business and market conditions in order to facilitate the identification and implementation processes described in (i) and (ii) above. Because the day-to-day operations and activities of the fund are carried out by or through FMR, its affiliates, and other service providers, the fund's exposure to risks is mitigated but not eliminated by the processes overseen by the Trustees. While each of the Board's committees has responsibility for overseeing different aspects of the fund's activities, oversight is exercised primarily through the Operations and Audit Committees. In addition, an ad hoc Board committee of Independent Trustees has worked with FMR to enhance the Board's oversight of investment and financial risks, legal and regulatory risks, technology risks, and operational risks, including the development of additional risk reporting to the Board. Appropriate personnel, including but not limited to the fund's Chief Compliance Officer (CCO), FMR's internal auditor, the independent accountants, the fund's Treasurer and portfolio management personnel, make periodic reports to the Board's committees, as appropriate, including an annual review of Fidelity's risk management program for the Fidelity® funds. The responsibilities of each standing committee, including their oversight responsibilities, are described further under "Standing Committees of the Trustees."
Interested Trustees*:
Correspondence intended for a Trustee who is an interested person may be sent to Fidelity Investments, 245 Summer Street, Boston, Massachusetts 02210.
Name, Year of Birth; Principal Occupations and Other Relevant Experience+
Abigail P. Johnson (1961)
Year of Election or Appointment: 2009
Trustee
Chairman of the Board of Trustees
Ms. Johnson also serves as Trustee of other Fidelity® funds. Ms. Johnson serves as Chairman (2016-present), Chief Executive Officer (2014-present), and Director (2007-present) of FMR LLC (diversified financial services company), President of Fidelity Financial Services (2012-present) and President of Personal, Workplace and Institutional Services (2005-present). Ms. Johnson is Chairman and Director of Fidelity Management & Research Company LLC (investment adviser firm, 2011-present). Previously, Ms. Johnson served as Chairman and Director of FMR Co., Inc. (investment adviser firm, 2011-2019), Vice Chairman (2007-2016) and President (2013-2016) of FMR LLC, President and a Director of Fidelity Management & Research Company (2001-2005), a Trustee of other investment companies advised by Fidelity Management & Research Company, Fidelity Investments Money Management, Inc. (investment adviser firm), and FMR Co., Inc. (2001-2005), Senior Vice President of the Fidelity® funds (2001-2005), and managed a number of Fidelity® funds. Ms. Abigail P. Johnson and Mr. Arthur E. Johnson are not related.
Jennifer Toolin McAuliffe (1959)
Year of Election or Appointment: 2016
Trustee
Ms. McAuliffe also serves as Trustee of other Fidelity® funds and as Trustee of Fidelity Charitable (2020-present). Previously, Ms. McAuliffe served as Co-Head of Fixed Income of Fidelity Investments Limited (now known as FIL Limited (FIL)) (diversified financial services company), Director of Research for FIL’s credit and quantitative teams in London, Hong Kong and Tokyo and Director of Research for taxable and municipal bonds at Fidelity Investments Money Management, Inc. Ms. McAuliffe previously served as a member of the Advisory Board of certain Fidelity® funds (2016). Ms. McAuliffe was previously a lawyer at Ropes & Gray LLP and currently serves as director or trustee of several not-for-profit entities.
* Determined to be an “Interested Trustee” by virtue of, among other things, his or her affiliation with the trust or various entities under common control with FMR.
+ The information includes the Trustee's principal occupation during the last five years and other information relating to the experience, attributes, and skills relevant to the Trustee's qualifications to serve as a Trustee, which led to the conclusion that the Trustee should serve as a Trustee for the fund.
Independent Trustees:
Correspondence intended for an Independent Trustee may be sent to Fidelity Investments, P.O. Box 55235, Boston, Massachusetts 02205-5235.
Name, Year of Birth; Principal Occupations and Other Relevant Experience+
Elizabeth S. Acton (1951)
Year of Election or Appointment: 2013
Trustee
Ms. Acton also serves as Trustee of other Fidelity® funds. Prior to her retirement, Ms. Acton served as Executive Vice President, Finance (2011-2012), Executive Vice President, Chief Financial Officer (2002-2011) and Treasurer (2004-2005) of Comerica Incorporated (financial services). Prior to joining Comerica, Ms. Acton held a variety of positions at Ford Motor Company (1983-2002), including Vice President and Treasurer (2000-2002) and Executive Vice President and Chief Financial Officer of Ford Motor Credit Company (1998-2000). Ms. Acton currently serves as a member of the Board and Audit and Finance Committees of Beazer Homes USA, Inc. (homebuilding, 2012-present). Ms. Acton previously served as a member of the Advisory Board of certain Fidelity® funds (2013-2016).
Ann E. Dunwoody (1953)
Year of Election or Appointment: 2018
Trustee
General Dunwoody also serves as Trustee of other Fidelity® funds. General Dunwoody (United States Army, Retired) was the first woman in U.S. military history to achieve the rank of four-star general and prior to her retirement in 2012 held a variety of positions within the U.S. Army, including Commanding General, U.S. Army Material Command (2008-2012). General Dunwoody currently serves as President of First to Four LLC (leadership and mentoring services, 2012-present), a member of the Board and Nomination and Corporate Governance Committees of Kforce Inc. (professional staffing services, 2016-present) and a member of the Board of Automattic Inc. (software engineering, 2018-present). Previously, General Dunwoody served as a member of the Advisory Board and Nominating and Corporate Governance Committee of L3 Technologies, Inc. (communication, electronic, sensor and aerospace systems, 2013-2019) and a member of the Board and Audit and Sustainability and Corporate Responsibility Committees of Republic Services, Inc. (waste collection, disposal and recycling, 2013-2016). Ms. Dunwoody also serves on several boards for non-profit organizations, including as a member of the Board, Chair of the Nomination and Governance Committee and a member of the Audit Committee of Logistics Management Institute (consulting non-profit, 2012-present), a member of the Council of Trustees for the Association of the United States Army (advocacy non-profit, 2013-present), a member of the Board of Florida Institute of Technology (2015-present) and a member of the Board of ThanksUSA (military family education non-profit, 2014-present). General Dunwoody previously served as a member of the Advisory Board of certain Fidelity® funds (2018).
John Engler (1948)
Year of Election or Appointment: 2014
Trustee
Mr. Engler also serves as Trustee of other Fidelity® funds. Previously, Mr. Engler served as Governor of Michigan (1991-2003), President of the Business Roundtable (2011-2017) and interim President of Michigan State University (2018-2019). Mr. Engler currently serves as a member of the Board of Stride, Inc. (formerly K12 Inc.) (technology-based education company, 2012-present). Previously, Mr. Engler served as a member of the Board of Universal Forest Products (manufacturer and distributor of wood and wood-alternative products, 2003-2019) and Trustee of The Munder Funds (2003-2014). Mr. Engler previously served as a member of the Advisory Board of certain Fidelity® funds (2014-2016).
Robert F. Gartland (1951)
Year of Election or Appointment: 2010
Trustee
Mr. Gartland also serves as Trustee of other Fidelity® funds. Prior to his retirement, Mr. Gartland held a variety of positions at Morgan Stanley (financial services, 1979-2007), including Managing Director (1987-2007) and Chase Manhattan Bank (1975-1978). Mr. Gartland previously served as Chairman and an investor in Gartland & Mellina Group Corp. (consulting, 2009-2019), as a member of the Board of National Securities Clearing Corporation (1993-1996) and as Chairman of TradeWeb (2003-2004).
Arthur E. Johnson (1947)
Year of Election or Appointment: 2008
Trustee
Mr. Johnson also serves as Trustee of other Fidelity® funds. Prior to his retirement, Mr. Johnson served as Senior Vice President of Corporate Strategic Development of Lockheed Martin Corporation (defense contractor, 1999-2009). Mr. Johnson currently serves as a member of the Board of Booz Allen Hamilton (management consulting, 2011-present). Mr. Johnson previously served as a member of the Board of Eaton Corporation plc (diversified power management, 2009-2019) and a member of the Board of AGL Resources, Inc. (holding company, 2002-2016). Mr. Johnson previously served as Chairman (2018-2021) and Vice Chairman (2015-2018) of the Independent Trustees of certain Fidelity® funds. Mr. Arthur E. Johnson is not related to Ms. Abigail P. Johnson.
Michael E. Kenneally (1954)
Year of Election or Appointment: 2009
Trustee
Chairman of the Independent Trustees
Mr. Kenneally also serves as Trustee of other Fidelity® funds and was Vice Chairman (2018-2021) of the Independent Trustees of certain Fidelity® funds. Prior to retirement in 2005, he was Chairman and Global Chief Executive Officer of Credit Suisse Asset Management, the worldwide fund management and institutional investment business of Credit Suisse Group. Previously, Mr. Kenneally was an Executive Vice President and the Chief Investment Officer for Bank of America. In this role, he was responsible for the investment management, strategy and products delivered to the bank’s institutional, high-net-worth and retail clients. Earlier, Mr. Kenneally directed the organization’s equity and quantitative research groups. He began his career as a research analyst and then spent more than a dozen years as a portfolio manager for endowments, pension plans and mutual funds. He earned the Chartered Financial Analyst (CFA) designation in 1991.
Marie L. Knowles (1946)
Year of Election or Appointment: 2001
Trustee
Ms. Knowles also serves as Trustee of other Fidelity® funds. Prior to her retirement, Ms. Knowles held several positions at Atlantic Richfield Company (diversified energy), including Executive Vice President and Chief Financial Officer (1996-2000), Senior Vice President (1993-1996) and President of ARCO Transportation Company (pipeline and tanker operations, 1993-1996). Ms. Knowles currently serves as a member of the Board of the Santa Catalina Island Company (real estate, 2009-present), a member of the Investment Company Institute Board of Governors and a member of the Governing Council of the Independent Directors Council (2014-present). Ms. Knowles also serves as a member of the Advisory Board for the School of Engineering of the University of Southern California. Ms. Knowles previously served as a member of the Board of McKesson Corporation (healthcare service, 2002-2021). In addition, Ms. Knowles previously served as Chairman (2015-2018) and Vice Chairman (2012-2015) of the Independent Trustees of certain Fidelity® funds.
Mark A. Murray (1954)
Year of Election or Appointment: 2016
Trustee
Mr. Murray also serves as Trustee of other Fidelity® funds. Previously, Mr. Murray served as Co-Chief Executive Officer (2013-2016), President (2006-2013) and Vice Chairman (2013-2020) of Meijer, Inc. Mr. Murray serves as a member of the Board (2009-present) and Public Policy and Responsibility Committee (2009-present) and Chair of the Nuclear Review Committee (2019-present) of DTE Energy Company (diversified energy company). Mr. Murray previously served as a member of the Board of Spectrum Health (not-for-profit health system, 2015-2019) and as a member of the Board and Audit Committee and Chairman of the Nominating and Corporate Governance Committee of Universal Forest Products, Inc. (manufacturer and distributor of wood and wood-alternative products, 2004-2016). Mr. Murray also serves as a member of the Board of many community and professional organizations. Mr. Murray previously served as a member of the Advisory Board of certain Fidelity® funds (2016).
+ The information includes the Trustee's principal occupation during the last five years and other information relating to the experience, attributes, and skills relevant to the Trustee's qualifications to serve as a Trustee, which led to the conclusion that the Trustee should serve as a Trustee for the fund.
Advisory Board Members and Officers:
Correspondence intended for an officer may be sent to Fidelity Investments, 245 Summer Street, Boston, Massachusetts 02210. Officers appear below in alphabetical order.
Name, Year of Birth; Principal Occupation
Laura M. Bishop (1961)
Year of Election or Appointment: 2022
Member of the Advisory Board
Ms. Bishop also serves as a Member of the Advisory Board of other funds. Prior to her retirement, Ms. Bishop held a variety of positions at United Services Automobile Association (2001-2020), including Executive Vice President and Chief Financial Officer (2014-2020) and Senior Vice President and Deputy Chief Financial Officer (2012-2014). Ms. Bishop currently serves as a member of the Audit Committee and Compensation and Personnel Committee (2021-present) of the Board of Directors of Korn Ferry (global organizational consulting).
Robert W. Helm (1957)
Year of Election or Appointment: 2021
Member of the Advisory Board
Mr. Helm also serves as a Member of the Advisory Board of other Fidelity® funds. Mr. Helm was formerly Deputy Chairman (2003-2020), partner (1991-2020) and an associate (1984-1991) of Dechert LLP (formerly Dechert Price & Rhoads). Mr. Helm currently serves on boards and committees of several not-for-profit organizations.
Craig S. Brown (1977)
Year of Election or Appointment: 2019
Assistant Treasurer
Mr. Brown also serves as an officer of other funds. Mr. Brown serves as Assistant Treasurer of FIMM, LLC (2021-present) and is an employee of Fidelity Investments (2013-present).
John J. Burke III (1964)
Year of Election or Appointment: 2018
Chief Financial Officer
Mr. Burke also serves as Chief Financial Officer of other funds. Mr. Burke serves as Head of Investment Operations for Fidelity Fund and Investment Operations (2018-present) and is an employee of Fidelity Investments (1998-present). Previously Mr. Burke served as head of Asset Management Investment Operations (2012-2018).
David J. Carter (1973)
Year of Election or Appointment: 2020
Assistant Secretary
Mr. Carter also serves as Assistant Secretary of other funds. Mr. Carter serves as Senior Vice President, Deputy General Counsel (2022-present) and is an employee of Fidelity Investments (2005-present).
Jonathan Davis (1968)
Year of Election or Appointment: 2010
Assistant Treasurer
Mr. Davis also serves as an officer of other funds. Mr. Davis serves as Assistant Treasurer of FIMM, LLC (2021-present), FMR Capital, Inc. (2017-present), FD Funds GP LLC (2021-present), FD Funds Holding LLC (2021-present), and FD Funds Management LLC (2021-present); and is an employee of Fidelity Investments. Previously, Mr. Davis served as Vice President and Associate General Counsel of FMR LLC (diversified financial services company, 2003-2010).
Laura M. Del Prato (1964)
Year of Election or Appointment: 2018
President and Treasurer
Ms. Del Prato also serves as an officer of other funds. Ms. Del Prato serves as Assistant Treasurer of FIMM, LLC (2021-present) and is an employee of Fidelity Investments (2017-present). Previously, Ms. Del Prato served as President and Treasurer of The North Carolina Capital Management Trust: Cash Portfolio and Term Portfolio (2018-2020). Prior to joining Fidelity Investments, Ms. Del Prato served as a Managing Director and Treasurer of the JPMorgan Mutual Funds (2014-2017). Prior to JPMorgan, Ms. Del Prato served as a partner at Cohen Fund Audit Services (accounting firm, 2012-2013) and KPMG LLP (accounting firm, 2004-2012).
Colm A. Hogan (1973)
Year of Election or Appointment: 2016
Assistant Treasurer
Mr. Hogan also serves as an officer of other funds. Mr. Hogan serves as Assistant Treasurer of FIMM, LLC (2021-present) and FMR Capital, Inc. (2017-present) and is an employee of Fidelity Investments (2005-present). Previously, Mr. Hogan served as Deputy Treasurer of certain Fidelity® funds (2016-2020) and Assistant Treasurer of certain Fidelity® funds (2016-2018).
Cynthia Lo Bessette (1969)
Year of Election or Appointment: 2019
Secretary and Chief Legal Officer (CLO)
Ms. Lo Bessette also serves as an officer of other funds. Ms. Lo Bessette serves as CLO, Secretary, and Senior Vice President of Fidelity Management & Research Company LLC (investment adviser firm, 2019-present); CLO of Fidelity Management & Research (Hong Kong) Limited, FMR Investment Management (UK) Limited, and Fidelity Management & Research (Japan) Limited (investment adviser firms, 2019-present); Secretary of FD Funds GP LLC (2021-present), FD Funds Holding LLC (2021-present), and FD Funds Management LLC (2021-present); and Assistant Secretary of FIMM, LLC (2019-present). She is a Senior Vice President and Deputy General Counsel of FMR LLC (diversified financial services company, 2019-present), and is an employee of Fidelity Investments. Previously, Ms. Lo Bessette served as CLO, Secretary, and Senior Vice President of FMR Co., Inc. (investment adviser firm, 2019); Secretary of Fidelity SelectCo, LLC and Fidelity Investments Money Management, Inc. (investment adviser firms, 2019). Prior to joining Fidelity Investments, Ms. Lo Bessette was Executive Vice President, General Counsel (2016-2019) and Senior Vice President, Deputy General Counsel (2015-2016) of OppenheimerFunds (investment management company) and Deputy Chief Legal Officer (2013-2015) of Jennison Associates LLC (investment adviser firm).
Chris Maher (1972)
Year of Election or Appointment: 2013
Assistant Treasurer
Mr. Maher also serves as an officer of other funds. Mr. Maher serves as Assistant Treasurer of FIMM, LLC (2021-present) and FMR Capital, Inc. (2017-present), and is an employee of Fidelity Investments (2008-present). Previously, Mr. Maher served as Assistant Treasurer of certain funds (2013-2020); Vice President of Asset Management Compliance (2013), Vice President of the Program Management Group of FMR (investment adviser firm, 2010-2013), and Vice President of Valuation Oversight (2008-2010).
Jamie Pagliocco (1964)
Year of Election or Appointment: 2020
Vice President
Mr. Pagliocco also serves as Vice President of other funds. Mr. Pagliocco serves as President of Fixed Income (2020-present), and is an employee of Fidelity Investments (2001-present). Previously, Mr. Pagliocco served as Co-Chief Investment Officer – Bond (2017-2020), Global Head of Bond Trading (2016-2019), and as a portfolio manager.
Kenneth B. Robins (1969)
Year of Election or Appointment: 2020
Chief Compliance Officer
Mr. Robins also serves as an officer of other funds. Mr. Robins serves as Compliance Officer of Fidelity Management & Research Company LLC (investment adviser firm, 2016-present) and is an employee of Fidelity Investments (2004-present). Previously, Mr. Robins served as Compliance Officer of FMR Co., Inc. (investment adviser firm, 2016-2019), as Executive Vice President of Fidelity Investments Money Management, Inc. (investment adviser firm, 2013-2016) and served in other fund officer roles.
Brett Segaloff (1972)
Year of Election or Appointment: 2021
Anti-Money Laundering (AML) Officer
Mr. Segaloff also serves as an AML Officer of other funds and other related entities. He is Director, Anti-Money Laundering (2007-present) of FMR LLC (diversified financial services company) and is an employee of Fidelity Investments (1996-present).
Stacie M. Smith (1974)
Year of Election or Appointment: 2013
Assistant Treasurer
Ms. Smith also serves as an officer of other funds. Ms. Smith serves as Assistant Treasurer of FIMM, LLC (2021-present) and FMR Capital, Inc. (2017-present), is an employee of Fidelity Investments (2009-present), and has served in other fund officer roles. Prior to joining Fidelity Investments, Ms. Smith served as Senior Audit Manager of Ernst & Young LLP (accounting firm, 1996-2009). Previously, Ms. Smith served as Assistant Treasurer (2013-2019) and Deputy Treasurer (2013-2016) of certain Fidelity® funds.
Jim Wegmann (1979)
Year of Election or Appointment: 2021
Deputy Treasurer
Mr. Wegmann also serves as an officer of other funds. Mr. Wegmann serves as Assistant Treasurer of FIMM, LLC (2021-present) and is an employee of Fidelity Investments (2011-present). Previously, Mr. Wegmann served as Assistant Treasurer of certain Fidelity® funds (2019-2021).
Shareholder Expense Example
As a shareholder, you incur two types of costs: (1) transaction costs, which may include sales charges (loads) on purchase payments or redemption proceeds, as applicable and (2) ongoing costs, which generally include management fees, distribution and/or service (12b-1) fees and other Fund expenses. This Example is intended to help you understand your ongoing costs (in dollars) of investing in a fund and to compare these costs with the ongoing costs of investing in other mutual funds.
The Example is based on an investment of $1,000 invested at the beginning of the period and held for the entire period (March 1, 2022 to August 31, 2022).
Actual Expenses
The first line of the accompanying table provides information about actual account values and actual expenses. You may use the information in this line, together with the amount you invested, to estimate the expenses that you paid over the period. Simply divide your account value by $1,000.00 (for example, an $8,600 account value divided by $1,000.00 = 8.6), then multiply the result by the number in the first line for a class/Fund under the heading entitled "Expenses Paid During Period" to estimate the expenses you paid on your account during this period. If any fund is a shareholder of any underlying mutual funds or exchange-traded funds (ETFs) (the Underlying Funds), such fund indirectly bears its proportional share of the expenses of the Underlying Funds in addition to the direct expenses incurred presented in the table. These fees and expenses are not included in the annualized expense ratio used to calculate the expense estimate in the table below.
Hypothetical Example for Comparison Purposes
The second line of the accompanying table provides information about hypothetical account values and hypothetical expenses based on the actual expense ratio and an assumed rate of return of 5% per year before expenses, which is not the actual return. The hypothetical account values and expenses may not be used to estimate the actual ending account balance or expenses you paid for the period. You may use this information to compare the ongoing costs of investing in the Fund and other funds. To do so, compare this 5% hypothetical example with the 5% hypothetical examples that appear in the shareholder reports of the other funds. If any fund is a shareholder of any Underlying Funds, such fund indirectly bears its proportional share of the expenses of the Underlying Funds in addition to the direct expenses as presented in the table. These fees and expenses are not included in the annualized expense ratio used to calculate the expense estimate in the table below.
Please note that the expenses shown in the table are meant to highlight your ongoing costs only and do not reflect any transaction costs. Therefore, the second line of the table is useful in comparing ongoing costs only, and will not help you determine the relative total costs of owning different funds. In addition, if these transactional costs were included, your costs would have been higher.
| | Annualized Expense Ratio-A | Beginning
Account Value
March 1, 2022 | Ending
Account Value
August 31, 2022 | Expenses Paid
During Period-B
March 1, 2022
to August 31, 2022 |
| Fidelity Government Income Fund | | | | |
| Class A | .77% | | | |
| Actual | | $1,000.00 | $922.30 | $3.73 |
| Hypothetical-C | | $1,000.00 | $1,021.32 | $3.92 |
| Class M | .75% | | | |
| Actual | | $1,000.00 | $922.40 | $3.63 |
| Hypothetical-C | | $1,000.00 | $1,021.42 | $3.82 |
| Class C | 1.52% | | | |
| Actual | | $1,000.00 | $918.50 | $7.35 |
| Hypothetical-C | | $1,000.00 | $1,017.54 | $7.73 |
| Government Income | .45% | | | |
| Actual | | $1,000.00 | $923.70 | $2.18 |
| Hypothetical-C | | $1,000.00 | $1,022.94 | $2.29 |
| Class I | .48% | | | |
| Actual | | $1,000.00 | $923.60 | $2.33 |
| Hypothetical-C | | $1,000.00 | $1,022.79 | $2.45 |
| Class Z | .36% | | | |
| Actual | | $1,000.00 | $923.30 | $1.75 |
| Hypothetical-C | | $1,000.00 | $1,023.39 | $1.84 |
A Annualized expense ratio reflects expenses net of applicable fee waivers.
B Expenses are equal to the annualized expense ratio, multiplied by the average account value over the period, multiplied by 184/ 365 (to reflect the one-half year period). The fees and expenses of any Underlying Funds are not included in each annualized expense ratio.
C 5% return per year before expenses
Distributions (Unaudited)
The dividend and capital gains distributions for the fund(s) are available on Fidelity.com or Institutional.Fidelity.com.
A total of 57.86% of the dividends distributed during the fiscal year was derived from interest on U.S. Government securities which is generally exempt from state income tax.
The fund designates $ 27,080,963 of distributions paid in the calendar year 2021 as qualifying to be taxed as interest-related dividends for nonresident alien shareholders.
The fund designates $24,949,939 of distributions paid in the calendar year 2021 as qualifying to be taxed as section 163(j) interest dividends.
The fund will notify shareholders in January 2023 of amounts for use in preparing 2022 income tax returns.

GOV-ANN-1022
1.537760.126
Fidelity® Intermediate Government Income Fund
Annual Report
August 31, 2022
Contents
To view a fund's proxy voting guidelines and proxy voting record for the 12-month period ended June 30, visit http://www.fidelity.com/proxyvotingresults or visit the Securities and Exchange Commission's (SEC) web site at http://www.sec.gov.
You may also call 1-800-544-8544 to request a free copy of the proxy voting guidelines.
Standard & Poor's, S&P and S&P 500 are registered service marks of The McGraw-Hill Companies, Inc. and have been licensed for use by Fidelity Distributors Corporation.
Other third-party marks appearing herein are the property of their respective owners.
All other marks appearing herein are registered or unregistered trademarks or service marks of FMR LLC or an affiliated company. © 2022 FMR LLC. All rights reserved.
This report and the financial statements contained herein are submitted for the general information of the shareholders of the Fund. This report is not authorized for distribution to prospective investors in the Fund unless preceded or accompanied by an effective prospectus.
A fund files its complete schedule of portfolio holdings with the SEC for the first and third quarters of each fiscal year on Form N-PORT. Forms N-PORT are available on the SEC’s web site at http://www.sec.gov. A fund's Forms N-PORT may be reviewed and copied at the SEC’s Public Reference Room in Washington, DC. Information regarding the operation of the SEC's Public Reference Room may be obtained by calling 1-800-SEC-0330.
For a complete list of a fund's portfolio holdings, view the most recent holdings listing, semiannual report, or annual report on Fidelity's web site at http://www.fidelity.com, http://www.institutional.fidelity.com, or http://www.401k.com, as applicable.
NOT FDIC INSURED •MAY LOSE VALUE •NO BANK GUARANTEE
Neither the Fund nor Fidelity Distributors Corporation is a bank.
Performance: The Bottom Line
Average annual total return reflects the change in the value of an investment, assuming reinvestment of distributions from dividend income and capital gains (the profits earned upon the sale of securities that have grown in value, if any) and assuming a constant rate of performance each year. The hypothetical investment and the average annual total returns do not reflect the deduction of taxes that a shareholder would pay on fund distributions or the redemption of fund shares. During periods of reimbursement by Fidelity, a fund’s total return will be greater than it would be had the reimbursement not occurred. How a fund did yesterday is no guarantee of how it will do tomorrow.
Average Annual Total Returns
| For the periods ended August 31, 2022 | Past 1 year | Past 5 years | Past 10 years |
| Fidelity® Intermediate Government Income Fund | (8.15)% | 0.18% | 0.61% |
$10,000 Over 10 Years
Let's say hypothetically that $10,000 was invested in Fidelity® Intermediate Government Income Fund on August 31, 2012
The chart shows how the value of your investment would have changed, and also shows how the Bloomberg U.S. Intermediate Government Bond Index performed over the same period.
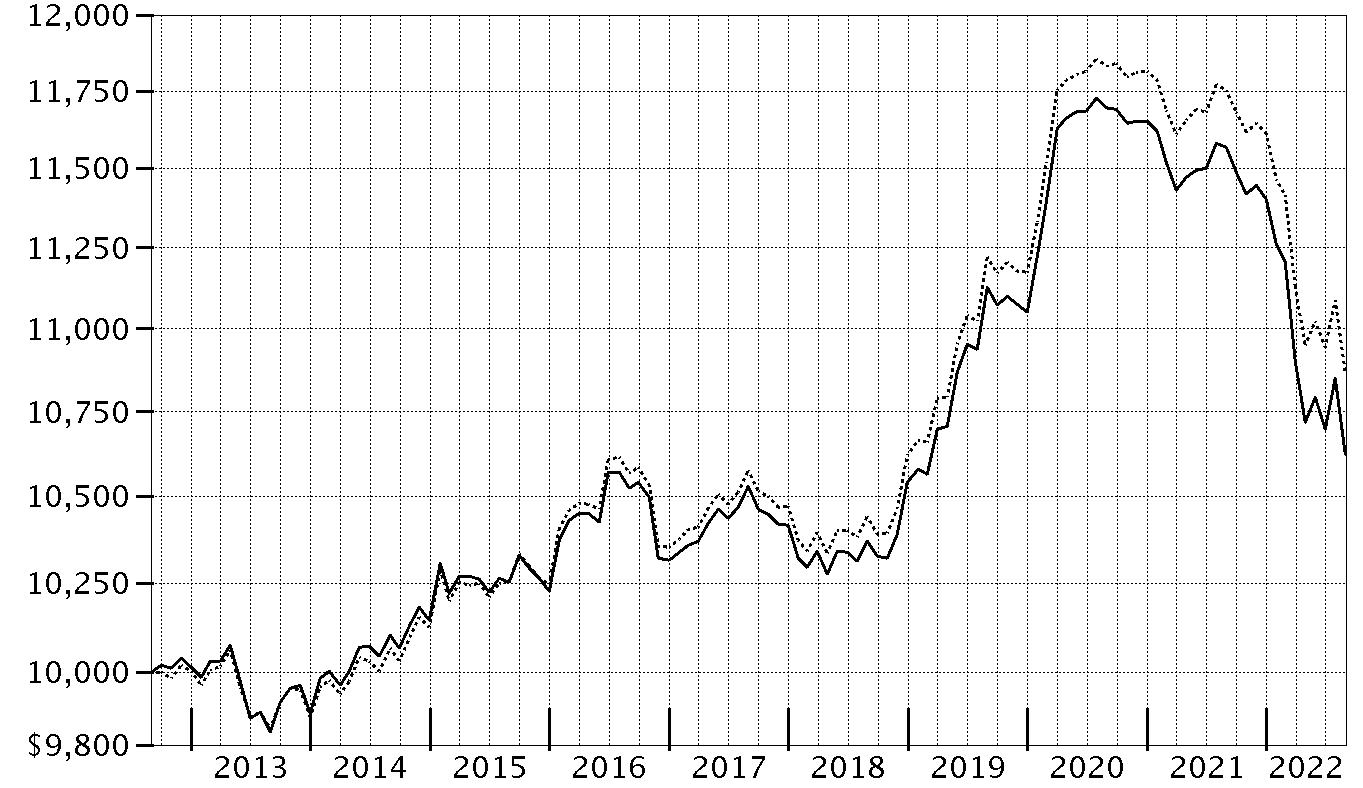
| Period Ending Values |
| $10,624 | Fidelity® Intermediate Government Income Fund |
| $10,867 | Bloomberg U.S. Intermediate Government Bond Index |
Management's Discussion of Fund Performance
Market Recap: U.S. taxable investment-grade bonds notably declined for the 12 months ending August 31, 2022, as the U.S. Federal Reserve took aggressive action to stymie high inflation. The Bloomberg U.S. Aggregate Bond Index returned -11.52% for the period. In late 2021, bond yields rose when the Fed pivoted from an “easy” to a “tight” monetary stance. Its first step was to cease its purchases of bonds, part of a quantitative easing program to support the U.S. economy that began in 2008. In the first half of 2022, the Fed took more aggressive steps to thwart inflation. The central bank raised the federal funds target rate by 25 basis points (0.25%) in mid-March, 50 basis points in May and 75 basis points in June – its largest increase since 1994 – and said it was becoming more difficult to achieve a soft landing, in which the economy slows enough to bring down inflation while avoiding a recession. It also began to allow up to billions in Treasuries and mortgage bonds to mature every month without investing the proceeds. Despite another rate hike of 75 basis points in July, the index rose 2.44% for the month, only to reverse course (-2.83%) in August, when the Fed dashed hopes that it would soon “pivot” to an easier policy stance. For the full 12 months, shorter-term securities outpaced longer-term bonds, and higher-quality issues held up better than lower-rated bonds. Within the index, corporate bonds posted a return of -14.61%, trailing the -10.80% result for U.S. Treasuries. Outside the index, U.S. corporate high-yield bonds returned -10.43%, while U.S. Treasury Inflation-Protected Securities had a return of -5.98%.
Comments from Co-Portfolio Managers Franco Castagliuolo and Sean Corcoran: For the fiscal year, the fund returned -8.15%, lagging, net of fees, the -7.53% result of the benchmark, the Bloomberg U.S. Intermediate Government Bond Index. In managing the fund the past 12 months, we attempted to exploit market inefficiencies and identify attractively valued securities, in accordance with our longer-term strategy. The fund had more sensitivity to interest rates than the benchmark this period, as measured by its slightly longer duration. This positioning detracted from the fund’s performance versus the benchmark because interest rates rose more than we expected. The fund’s overweighting in 30-year MBS issued by Fannie Mae and Freddie Mac, as well as overweighting in Ginnie Mae securities with coupons of 3.5%, also hurt our relative result, given that that they lagged the benchmark. Overweighting residential government agency commercial mortgage-backed securities, which also trailed the benchmark, hampered relative performance as well. Underweighting MBS comprised of 15- and 20-year mortgages modestly detracted. In contrast, our choices in the agency debenture segment added modest value versus the benchmark.
The views expressed above reflect those of the portfolio manager(s) only through the end of the period as stated on the cover of this report and do not necessarily represent the views of Fidelity or any other person in the Fidelity organization. Any such views are subject to change at any time based upon market or other conditions and Fidelity disclaims any responsibility to update such views. These views may not be relied on as investment advice and, because investment decisions for a Fidelity fund are based on numerous factors, may not be relied on as an indication of trading intent on behalf of any Fidelity fund.
Investment Summary (Unaudited)
The information in the following tables is based on the combined investments of the Fund and its pro-rata share of the investments of Fidelity’sFixed-Income Central Funds.
Coupon Distribution as of August 31, 2022
| | % of fund's investments |
| 0.01 - 0.99% | 16.1 |
| 1 - 1.99% | 24.4 |
| 2 - 2.99% | 40.4 |
| 3 - 3.99% | 5.1 |
| 4 - 4.99% | 0.5 |
| 5 - 5.99% | 3.3 |
Coupon distribution shows the range of stated interest rates on the fund's investments, excluding short-term investments.
Asset Allocation (% of fund's net assets)
| As of August 31, 2022*,** |
| | Mortgage Securities | 4.7% |
| | CMOs and Other Mortgage Related Securities | 1.8% |
| | U.S. Treasury Obligations | 83.9% |
| | U.S. Government Agency Obligations | 1.0% |
| | Foreign Government & Government Agency Obligations | 3.5% |
| | Short-Term Investments and Net Other Assets (Liabilities) | 5.1% |
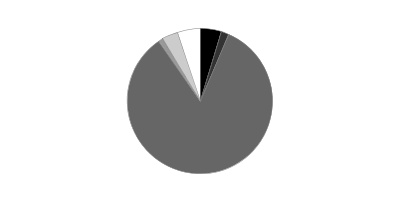
* Foreign investments - 3.5%
** Futures and Swaps - 13.0%
Percentages in the above tables are adjusted for the effect of TBA Sale Commitments.
Schedule of Investments August 31, 2022
Showing Percentage of Net Assets
| U.S. Government and Government Agency Obligations - 84.9% | | | |
| | | Principal Amount (000s) | Value (000s) |
| U.S. Government Agency Obligations - 0.6% | | | |
| Fannie Mae 0.625% 4/22/25 | | 375 | 347 |
| Freddie Mac 4% 11/25/24 | | 1,700 | 1,700 |
| | | | 2,047 |
| U.S. Treasury Obligations - 83.9% | | | |
| U.S. Treasury Bonds 3.25% 5/15/42 | | 600 | 574 |
| U.S. Treasury Notes: | | | |
| 0.25% 7/31/25 | | $23,839 | $21,712 |
| 0.25% 9/30/25 | | 1,660 | 1,504 |
| 0.25% 10/31/25 | | 3,300 | 2,982 |
| 0.375% 4/30/25 | | 2,186 | 2,014 |
| 0.375% 12/31/25 | | 4,210 | 3,800 |
| 0.5% 11/30/23 | | 12,100 | 11,664 |
| 0.75% 8/31/26 | | 6,800 | 6,121 |
| 0.875% 9/30/26 | | 10,000 | 9,034 |
| 1.125% 8/31/28 (a) | | 68,556 | 60,295 |
| 1.25% 12/31/26 | | 4,939 | 4,513 |
| 1.25% 9/30/28 | | 580 | 513 |
| 1.5% 9/30/24 | | 4,297 | 4,129 |
| 1.5% 1/31/27 | | 5,049 | 4,659 |
| 1.75% 7/31/24 | | 220 | 213 |
| 1.875% 2/28/27 | | 5,600 | 5,251 |
| 2% 8/15/25 (a) | | 39,301 | 37,657 |
| 2.125% 7/31/24 | | 5,667 | 5,528 |
| 2.125% 5/15/25 (b) | | 593 | 572 |
| 2.25% 4/30/24 | | 11,454 | 11,229 |
| 2.25% 12/31/24 | | 5,707 | 5,550 |
| 2.25% 3/31/26 | | 3,325 | 3,191 |
| 2.5% 2/28/26 | | 9,441 | 9,139 |
| 2.625% 6/30/23 | | 11,432 | 11,366 |
| 2.625% 7/31/29 | | 600 | 575 |
| 2.75% 2/15/24 | | 18,257 | 18,068 |
| 2.75% 6/30/25 | | 2,770 | 2,715 |
| 2.75% 7/31/27 | | 4,200 | 4,087 |
| 2.75% 5/31/29 | | 2,897 | 2,795 |
| 2.75% 8/15/32 (c) | | 19,283 | 18,602 |
| 2.875% 11/30/25 | | 8,513 | 8,354 |
| 2.875% 4/30/29 | | 600 | 583 |
| 2.875% 5/15/32 | | 3,160 | 3,080 |
| 3.125% 11/15/28 | | 9,210 | 9,093 |
| | | | 291,162 |
| Other Government Related - 0.4% | | | |
| Private Export Funding Corp. Secured 1.75% 11/15/24 | | 1,640 | 1,573 |
| TOTAL U.S. GOVERNMENT AND GOVERNMENT AGENCY OBLIGATIONS | | | |
| (Cost $313,889) | | | 294,782 |
|
| U.S. Government Agency - Mortgage Securities - 5.3% | | | |
| Fannie Mae - 3.0% | | | |
| 1.5% 11/1/40 to 11/1/41 | | 3,305 | 2,810 |
| 2.5% 9/1/51 to 12/1/51 | | 2,423 | 2,173 |
| 3% 11/1/34 to 2/1/52 | | 1,317 | 1,263 |
| 3.5% 11/1/51 to 3/1/52 | | 4,202 | 4,018 |
| | | | 10,264 |
| Freddie Mac - 1.5% | | | |
| 1.5% 12/1/40 to 4/1/41 | | 905 | 773 |
| 2.5% 5/1/41 to 12/1/51 | | 1,806 | 1,639 |
| 3% 9/1/34 | | 415 | 403 |
| 3.5% 5/1/51 to 3/1/52 | | 2,657 | 2,550 |
| | | | 5,365 |
| Ginnie Mae - 0.5% | | | |
| 2% 9/1/52 (d) | | 750 | 663 |
| 2% 9/1/52 (d) | | 250 | 221 |
| 2% 9/1/52 (d) | | 250 | 221 |
| 3.5% 11/20/50 | | 502 | 487 |
| | | | 1,592 |
| Uniform Mortgage Backed Securities - 0.3% | | | |
| 3% 9/1/52 (d) | | 1,200 | 1,110 |
| TOTAL U.S. GOVERNMENT AGENCY - MORTGAGE SECURITIES | | | |
| (Cost $19,756) | | | 18,331 |
|
| Commercial Mortgage Securities - 1.8% | | | |
| Freddie Mac: | | | |
| floater: | | | |
| Series 2021-F114 Class A/S, U.S. 30-Day Avg. Secured Overnight Fin. Rate (SOFR) Index + 0.220% 1.7749% 5/25/31 (e)(f) | | 367 | 361 |
| Series 2021-F120 Class A/S, U.S. 30-Day Avg. Secured Overnight Fin. Rate (SOFR) Index + 0.210% 1.7549% 8/25/31 (e)(f) | | 1,923 | 1,889 |
| Series 2021-F121 Class A/S, U.S. 30-Day Avg. Secured Overnight Fin. Rate (SOFR) Index + 0.180% 1.7349% 8/25/28 (e)(f) | | 2,523 | 2,478 |
| sequential payer Series 2021-K135 Class A2, 2.154% 10/25/31 | | 1,400 | 1,224 |
| Series 2022-K150 Class A2, 3.71% 11/25/32 | | 200 | 198 |
| TOTAL COMMERCIAL MORTGAGE SECURITIES | | | |
| (Cost $6,457) | | | 6,150 |
|
| Foreign Government and Government Agency Obligations - 3.5% | | | |
| Israeli State: | | | |
| (guaranteed by U.S. Government through Agency for International Development) 5.5% 12/4/23 | | 10,710 | 10,958 |
| 5.5% 4/26/24 | | 1,100 | 1,130 |
| TOTAL FOREIGN GOVERNMENT AND GOVERNMENT AGENCY OBLIGATIONS | | | |
| (Cost $12,037) | | | 12,088 |
| | | Shares | Value (000s) |
|
| Money Market Funds - 10.1% | | | |
| Fidelity Cash Central Fund 2.33% (g) | | 17,464,807 | $17,468 |
| Fidelity Securities Lending Cash Central Fund 2.34% (g)(h) | | 17,756,844 | 17,759 |
| TOTAL MONEY MARKET FUNDS | | | |
| (Cost $35,227) | | | 35,227 |
| TOTAL INVESTMENT IN SECURITIES - 105.6% | | | |
| (Cost $387,366) | | | 366,578 |
| NET OTHER ASSETS (LIABILITIES) - (5.6)% | | | (19,603) |
| NET ASSETS - 100% | | | $346,975 |
| TBA Sale Commitments | | |
| | Principal Amount (000s) | Value (000s) |
| Ginnie Mae | | |
| 2% 9/1/52 | $(1,250) | $(1,105) |
| Uniform Mortgage Backed Securities | | |
| 3% 9/1/52 | (1,200) | (1,110) |
| TOTAL TBA SALE COMMITMENTS | | |
| (Proceeds $2,290) | | $(2,215) |
| Futures Contracts | | | | | |
| | Number of contracts | Expiration Date | Notional Amount (000s) | Value (000s) | Unrealized Appreciation/(Depreciation) (000s) |
| Purchased | | | | | |
| Treasury Contracts | | | | | |
| CBOT 10-Year U.S. Treasury Note Contracts (United States) | 72 | Dec. 2022 | $8,417 | $(93) | $(93) |
| CBOT 2-Year U.S. Treasury Note Contracts (United States) | 134 | Dec. 2022 | 27,916 | (94) | (94) |
| CBOT 5-Year U.S. Treasury Note Contracts (United States) | 113 | Dec. 2022 | 12,523 | (138) | (138) |
| TOTAL PURCHASED | | | | | (325) |
| Sold | | | | | |
| Treasury Contracts | | | | | |
| CBOT Long Term U.S. Treasury Bond Contracts (United States) | 29 | Dec. 2022 | 3,939 | 117 | 117 |
| TOTAL FUTURES CONTRACTS | | | | | $(208) |
The notional amount of futures purchased as a percentage of Net Assets is 14.1%
The notional amount of futures sold as a percentage of Net Assets is 1.1%
For the period, the average monthly notional amount at value for futures contracts in the aggregate was $55,208,000.
Swaps
| Payment Received | Payment Frequency | Payment Paid | Payment Frequency | Clearinghouse / Counterparty(1) | Maturity Date | Notional Amount (000s) | Value (000s) | Upfront Premium Received/(Paid) (000s)(2) | Unrealized Appreciation/(Depreciation) (000s) |
| Interest Rate Swaps | | | | | | | | | |
| 2.75% | Annual | U.S. Secured Overnight Fin. Rate (SOFR) Index(3) | Annual | LCH | Sep. 2029 | $26 | $0 | $0 | $0 |
(1) Swaps with LCH Clearnet Group (LCH) are centrally cleared over-the-counter (OTC) swaps.
(2) Any premiums for centrally cleared over-the-counter (OTC) swaps are recorded periodically throughout the term of the swap to variation margin and included in unrealized appreciation (depreciation).
(3) Represents floating rate.
Values shown as $0 in the Schedule of Investments may reflect amounts less than $500.
Legend
(a) Security or a portion of the security was pledged to cover margin requirements for futures contracts. At period end, the value of securities pledged amounted to $345,000.
(b) Security or a portion of the security was pledged to cover margin requirements for centrally cleared OTC swaps. At period end, the value of securities pledged amounted to $10,000.
(c) Security or a portion of the security is on loan at period end.
(d) Security or a portion of the security purchased on a delayed delivery or when-issued basis.
(e) Coupon rates for floating and adjustable rate securities reflect the rates in effect at period end.
(f) Coupon is indexed to a floating interest rate which may be multiplied by a specified factor and/or subject to caps or floors.
(g) Affiliated fund that is generally available only to investment companies and other accounts managed by Fidelity Investments. The rate quoted is the annualized seven-day yield of the fund at period end. A complete unaudited listing of the fund's holdings as of its most recent quarter end is available upon request. In addition, each Fidelity Central Fund's financial statements, which are not covered by the Fund's Report of Independent Registered Public Accounting Firm, are available on the SEC's website or upon request.
(h) Investment made with cash collateral received from securities on loan.
Affiliated Central Funds
Fiscal year to date information regarding the Fund's investments in Fidelity Central Funds, including the ownership percentage, is presented below.
| Fund (Amounts in thousands) | Value, beginning of period | Purchases | Sales Proceeds | Dividend Income | Realized Gain/Loss | Change in Unrealized appreciation (depreciation) | Value, end of period | % ownership, end of period |
| Fidelity Cash Central Fund 2.33% | $33,854 | $129,120 | $145,506 | $140 | $-- | $-- | $17,468 | 0.0% |
| Fidelity Mortgage Backed Securities Central Fund | 2 | -- | 2 | -- | -- | -- | -- | 0.0% |
| Fidelity Securities Lending Cash Central Fund 2.34% | -- | 243,903 | 226,144 | 19 | -- | -- | 17,759 | 0.1% |
| Total | $33,856 | $373,023 | $371,652 | $159 | $-- | $-- | $35,227 | |
Amounts in the income column in the above table include any capital gain distributions from underlying funds, which are presented in the corresponding line-item in the Statement of Operations, if applicable. Amount for Fidelity Securities Lending Cash Central Fund represents the income earned on investing cash collateral, less rebates paid to borrowers and any lending agent fees associated with the loan, plus any premium payments received for lending certain types of securities.
Investment Valuation
The following is a summary of the inputs used, as of August 31, 2022, involving the Fund's assets and liabilities carried at fair value. The inputs or methodology used for valuing securities may not be an indication of the risk associated with investing in those securities. For more information on valuation inputs, and their aggregation into the levels used below, please refer to the Investment Valuation section in the accompanying Notes to Financial Statements.
| | Valuation Inputs at Reporting Date: |
| Description | Total | Level 1 | Level 2 | Level 3 |
| (Amounts in thousands) | | | | |
| Investments in Securities: | | | | |
| U.S. Government and Government Agency Obligations | $294,782 | $-- | $294,782 | $-- |
| U.S. Government Agency - Mortgage Securities | 18,331 | -- | 18,331 | -- |
| Commercial Mortgage Securities | 6,150 | -- | 6,150 | -- |
| Foreign Government and Government Agency Obligations | 12,088 | -- | 12,088 | -- |
| Money Market Funds | 35,227 | 35,227 | -- | -- |
| Total Investments in Securities: | $366,578 | $35,227 | $331,351 | $-- |
| Derivative Instruments: | | | | |
| Assets | | | | |
| Futures Contracts | $117 | $117 | $-- | $-- |
| Total Assets | $117 | $117 | $-- | $-- |
| Liabilities | | | | |
| Futures Contracts | $(325) | $(325) | $-- | $-- |
| Swaps | -- | -- | -- | -- |
| Total Liabilities | $(325) | $(325) | $-- | $-- |
| Total Derivative Instruments: | $(208) | $(208) | $-- | $-- |
| Other Financial Instruments: | | | | |
| TBA Sale Commitments | $(2,215) | $-- | $(2,215) | $-- |
| Total Other Financial Instruments: | $(2,215) | $-- | $(2,215) | $-- |
Value of Derivative Instruments
The following table is a summary of the Fund's value of derivative instruments by primary risk exposure as of August 31, 2022. For additional information on derivative instruments, please refer to the Derivative Instruments section in the accompanying Notes to Financial Statements.
| Primary Risk Exposure / Derivative Type | Value |
| | Asset | Liability |
| (Amounts in thousands) | | |
| Interest Rate Risk | | |
| Futures Contracts(a) | $117 | $(325) |
| Swaps(b) | 0(c) | 0(c) |
| Total Interest Rate Risk | 117 | (325) |
| Total Value of Derivatives | $117 | $(325) |
(a) Reflects gross cumulative appreciation (depreciation) on futures contracts as presented in the Schedule of Investments. In the Statement of Assets and Liabilities, the period end daily variation margin is included in receivable or payable for daily variation margin on futures contracts, and the net cumulative appreciation (depreciation) is included in Total accumulated earnings (loss).
(b) For centrally cleared over-the-counter (OTC) swaps, reflects gross cumulative appreciation (depreciation) as presented in the Schedule of Investments. In the Statement of Assets and Liabilities, the period end daily variation margin for centrally cleared OTC swaps is included in receivable or payable for daily variation margin on centrally cleared OTC swaps, and the net cumulative appreciation (depreciation) for centrally cleared OTC swaps is included in Total accumulated earnings (loss).
(c) Amount shown as $0 represents less than $500.
See accompanying notes which are an integral part of the financial statements.
Financial Statements
Statement of Assets and Liabilities
| Amounts in thousands (except per-share amount) | | August 31, 2022 |
| Assets | | |
Investment in securities, at value (including securities loaned of $17,355) — See accompanying schedule:
Unaffiliated issuers (cost $352,139) | $331,351 | |
| Fidelity Central Funds (cost $35,227) | 35,227 | |
| Total Investment in Securities (cost $387,366) | | $366,578 |
| Receivable for TBA sale commitments | | 2,290 |
| Receivable for fund shares sold | | 23 |
| Interest receivable | | 865 |
| Distributions receivable from Fidelity Central Funds | | 38 |
| Receivable for daily variation margin on futures contracts | | 15 |
| Total assets | | 369,809 |
| Liabilities | | |
| Payable for investments purchased | | |
| Regular delivery | $386 | |
| Delayed delivery | 2,241 | |
| TBA sale commitments, at value | 2,215 | |
| Payable for fund shares redeemed | 65 | |
| Distributions payable | 37 | |
| Accrued management fee | 88 | |
| Other affiliated payables | 43 | |
| Collateral on securities loaned | 17,759 | |
| Total liabilities | | 22,834 |
| Net Assets | | $346,975 |
| Net Assets consist of: | | |
| Paid in capital | | $377,509 |
| Total accumulated earnings (loss) | | (30,534) |
| Net Assets | | $346,975 |
| Net Asset Value, offering price and redemption price per share ($346,975 ÷ 35,460 shares)(a) | | $9.79 |
(a) Corresponding Net Asset Value does not calculate due to rounding of fractional net assets and/or shares.
See accompanying notes which are an integral part of the financial statements.
Statement of Operations
| Amounts in thousands | | Year ended August 31, 2022 |
| Investment Income | | |
| Interest | | $5,984 |
| Income from Fidelity Central Funds (including $19 from security lending) | | 159 |
| Total income | | 6,143 |
| Expenses | | |
| Management fee | $1,167 | |
| Transfer agent fees | 393 | |
| Fund wide operations fee | 206 | |
| Independent trustees' fees and expenses | 1 | |
| Total expenses before reductions | 1,767 | |
| Total expenses after reductions | | 1,767 |
| Net investment income (loss) | | 4,376 |
| Realized and Unrealized Gain (Loss) | | |
| Net realized gain (loss) on: | | |
| Investment securities: | | |
| Unaffiliated issuers | (2,647) | |
| Futures contracts | (3,597) | |
| Swaps | (1) | |
| Total net realized gain (loss) | | (6,245) |
| Change in net unrealized appreciation (depreciation) on: | | |
| Investment securities: | | |
| Unaffiliated issuers | (31,279) | |
| Futures contracts | (194) | |
| Swaps | (20) | |
| TBA sale commitments | 81 | |
| Total change in net unrealized appreciation (depreciation) | | (31,412) |
| Net gain (loss) | | (37,657) |
| Net increase (decrease) in net assets resulting from operations | | $(33,281) |
See accompanying notes which are an integral part of the financial statements.
Statement of Changes in Net Assets
| Amounts in thousands | Year ended August 31, 2022 | Year ended August 31, 2021 |
| Increase (Decrease) in Net Assets | | |
| Operations | | |
| Net investment income (loss) | $4,376 | $4,669 |
| Net realized gain (loss) | (6,245) | (3,491) |
| Change in net unrealized appreciation (depreciation) | (31,412) | (7,084) |
| Net increase (decrease) in net assets resulting from operations | (33,281) | (5,906) |
| Distributions to shareholders | (4,398) | (11,939) |
| Share transactions | | |
| Proceeds from sales of shares | 30,463 | 60,963 |
| Reinvestment of distributions | 4,023 | 11,094 |
| Cost of shares redeemed | (103,841) | (151,515) |
| Net increase (decrease) in net assets resulting from share transactions | (69,355) | (79,458) |
| Total increase (decrease) in net assets | (107,034) | (97,303) |
| Net Assets | | |
| Beginning of period | 454,009 | 551,312 |
| End of period | $346,975 | $454,009 |
| Other Information | | |
| Shares | | |
| Sold | 2,983 | 5,591 |
| Issued in reinvestment of distributions | 393 | 1,016 |
| Redeemed | (10,039) | (13,933) |
| Net increase (decrease) | (6,663) | (7,326) |
See accompanying notes which are an integral part of the financial statements.
Financial Highlights
Fidelity Intermediate Government Income Fund
| | | | | | |
| Years ended August 31, | 2022 | 2021 | 2020 | 2019 | 2018 |
| Selected Per–Share Data | | | | | |
| Net asset value, beginning of period | $10.78 | $11.15 | $10.77 | $10.23 | $10.57 |
| Income from Investment Operations | | | | | |
| Net investment income (loss)A,B | .115 | .102 | .166 | .214 | .181 |
| Net realized and unrealized gain (loss) | (.989) | (.220) | .376 | .524 | (.342) |
| Total from investment operations | (.874) | (.118) | .542 | .738 | (.161) |
| Distributions from net investment income | (.109) | (.091) | (.162) | (.198) | (.179) |
| Distributions from net realized gain | (.007) | (.161) | – | – | – |
| Total distributions | (.116) | (.252) | (.162) | (.198) | (.179) |
| Net asset value, end of period | $9.79 | $10.78 | $11.15 | $10.77 | $10.23 |
| Total ReturnC | (8.15)% | (1.07)% | 5.07% | 7.30% | (1.52)% |
| Ratios to Average Net AssetsB,D,E | | | | | |
| Expenses before reductions | .45% | .45% | .45% | .45% | .45% |
| Expenses net of fee waivers, if any | .45% | .45% | .45% | .45% | .45% |
| Expenses net of all reductions | .45% | .45% | .45% | .45% | .45% |
| Net investment income (loss) | 1.11% | .94% | 1.52% | 2.06% | 1.75% |
| Supplemental Data | | | | | |
| Net assets, end of period (in millions) | $347 | $454 | $551 | $529 | $541 |
| Portfolio turnover rateF | 159% | 220% | 287% | 244% | 132% |
A Calculated based on average shares outstanding during the period.
B Net investment income (loss) is affected by the timing of the declaration of dividends by any underlying mutual funds or exchange-traded funds (ETFs). Net investment income (loss) of any such underlying funds is not included in the Fund's net investment income (loss) ratio.
C Total returns would have been lower if certain expenses had not been reduced during the applicable periods shown.
D Fees and expenses of any underlying mutual funds or exchange-traded funds (ETFs) are not included in the Fund's expense ratio. The Fund indirectly bears its proportionate share of these expenses. For additional expense information related to investments in Fidelity Central Funds, please refer to the "Investments in Fidelity Central Funds" note found in the Notes to Financial Statements section of the most recent Annual or Semi-Annual report.
E Expense ratios reflect operating expenses of the class. Expenses before reductions do not reflect amounts reimbursed, waived, or reduced through arrangements with the investment adviser, brokerage services, or other offset arrangements, if applicable, and do not represent the amount paid by the class during periods when reimbursements, waivers or reductions occur.
F Amount does not include the portfolio activity of any underlying mutual funds or exchange-traded funds (ETFs).
See accompanying notes which are an integral part of the financial statements.
Notes to Financial Statements
For the period ended August 31, 2022
(Amounts in thousands except percentages)
1. Organization.
Fidelity Intermediate Government Income Fund (the Fund) is a fund of Fidelity Income Fund (the Trust) and is authorized to issue an unlimited number of shares. Share transactions on the Statement of Changes in Net Assets may contain exchanges between affiliated funds. The Trust is registered under the Investment Company Act of 1940, as amended (the 1940 Act), as an open-end management investment company organized as a Massachusetts business trust.
2. Investments in Fidelity Central Funds.
Funds may invest in Fidelity Central Funds, which are open-end investment companies generally available only to other investment companies and accounts managed by the investment adviser and its affiliates. The Schedule of Investments lists any Fidelity Central Funds held as an investment as of period end, but does not include the underlying holdings of each Fidelity Central Fund. An investing fund indirectly bears its proportionate share of the expenses of the underlying Fidelity Central Funds.
Based on its investment objective, each Fidelity Central Fund may invest or participate in various investment vehicles or strategies that are similar to those of the investing fund. These strategies are consistent with the investment objectives of the investing fund and may involve certain economic risks which may cause a decline in value of each of the Fidelity Central Funds and thus a decline in the value of the investing fund.
| Fidelity Central Fund | Investment Manager | Investment Objective | Investment Practices | Expense Ratio(a) |
| Fidelity Money Market Central Funds | Fidelity Management & Research Company LLC (FMR) | Each fund seeks to obtain a high level of current income consistent with the preservation of capital and liquidity. | Short-term Investments | Less than .005% |
(a) Expenses expressed as a percentage of average net assets and are as of each underlying Central Fund's most recent annual or semi-annual shareholder report.
An unaudited holdings listing for the investing fund, which presents direct holdings as well as the pro-rata share of any securities and other investments held indirectly through its investment in underlying non-money market Fidelity Central Funds, is available at fidelity.com and/or institutional.fidelity.com, as applicable. A complete unaudited list of holdings for each Fidelity Central Fund is available upon request or at the Securities and Exchange Commission website at www.sec.gov. In addition, the financial statements of the Fidelity Central Funds which contain the significant accounting policies (including investment valuation policies) of those funds, and are not covered by the Report of Independent Registered Public Accounting Firm, are available on the Securities and Exchange Commission website or upon request.
3. Significant Accounting Policies.
The Fund is an investment company and applies the accounting and reporting guidance of the Financial Accounting Standards Board (FASB) Accounting Standards Codification Topic 946 Financial Services - Investment Companies. The financial statements have been prepared in conformity with accounting principles generally accepted in the United States of America (GAAP), which require management to make certain estimates and assumptions at the date of the financial statements. Actual results could differ from those estimates. Subsequent events, if any, through the date that the financial statements were issued have been evaluated in the preparation of the financial statements. The Fund's Schedule of Investments lists any underlying mutual funds or exchange-traded funds (ETFs) but does not include the underlying holdings of these funds. The following summarizes the significant accounting policies of the Fund:
Investment Valuation. Investments are valued as of 4:00 p.m. Eastern time on the last calendar day of the period. The Board of Trustees (the Board) has delegated the day to day responsibility for the valuation of the Fund's investments to the Fair Value Committee (the Committee) established by the Fund's investment adviser. In accordance with valuation policies and procedures approved by the Board, the Fund attempts to obtain prices from one or more third party pricing vendors or brokers to value its investments. When current market prices, quotations or currency exchange rates are not readily available or reliable, investments will be fair valued in good faith by the Committee, in accordance with procedures adopted by the Board. Factors used in determining fair value vary by investment type and may include market or investment specific events, changes in interest rates and credit quality. The frequency with which these procedures are used cannot be predicted and they may be utilized to a significant extent. The Committee oversees the Fund's valuation policies and procedures and reports to the Board on the Committee's activities and fair value determinations. The Board monitors the appropriateness of the procedures used in valuing the Fund's investments and ratifies the fair value determinations of the Committee.
The Fund categorizes the inputs to valuation techniques used to value its investments into a disclosure hierarchy consisting of three levels as shown below:
- Level 1 – unadjusted quoted prices in active markets for identical investments
- Level 2 – other significant observable inputs (including quoted prices for similar investments, interest rates, prepayment speeds, etc.)
- Level 3 – unobservable inputs (including the Fund's own assumptions based on the best information available)
Valuation techniques used to value the Fund's investments by major category are as follows:
Debt securities, including restricted securities, are valued based on evaluated prices received from third party pricing vendors or from brokers who make markets in such securities. Foreign government and government agency obligations and U.S. government and government agency obligations are valued by pricing vendors who utilize matrix pricing which considers yield or price of bonds of comparable quality, coupon, maturity and type or by broker-supplied prices. Commercial mortgage securities and U.S. government agency mortgage securities are valued by pricing vendors who utilize matrix pricing which considers prepayment speed assumptions, attributes of the collateral, yield or price of bonds of comparable quality, coupon, maturity and type or by broker-supplied prices. Swaps are marked-to-market daily based on valuations from third party pricing vendors, registered derivatives clearing organizations (clearinghouses) or broker-supplied valuations. These pricing sources may utilize inputs such as interest rate curves, credit spread curves, default possibilities and recovery rates. When independent prices are unavailable or unreliable, debt securities and swaps may be valued utilizing pricing methodologies which consider similar factors that would be used by third party pricing vendors. Debt securities and swaps are generally categorized as Level 2 in the hierarchy but may be Level 3 depending on the circumstances.
Futures contracts are valued at the settlement price established each day by the board of trade or exchange on which they are traded and are categorized as Level 1 in the hierarchy. Investments in open-end mutual funds, including the Fidelity Central Funds, are valued at their closing net asset value (NAV) each business day and are categorized as Level 1 in the hierarchy.
Changes in valuation techniques may result in transfers in or out of an assigned level within the disclosure hierarchy. The aggregate value of investments by input level as of August 31, 2022 is included at the end of the Fund's Schedule of Investments.
Investment Transactions and Income. For financial reporting purposes, the Fund's investment holdings and NAV include trades executed through the end of the last business day of the period. The NAV per share for processing shareholder transactions is calculated as of the close of business of the New York Stock Exchange (NYSE), normally 4:00 p.m. Eastern time and includes trades executed through the end of the prior business day. Gains and losses on securities sold are determined on the basis of identified cost and include proceeds received from litigation. Income and capital gain distributions from Fidelity Central Funds, if any, are recorded on the ex-dividend date. Interest income is accrued as earned and includes coupon interest and amortization of premium and accretion of discount on debt securities as applicable.
Expenses. Expenses directly attributable to a fund are charged to that fund. Expenses attributable to more than one fund are allocated among the respective funds on the basis of relative net assets or other appropriate methods. Expenses included in the accompanying financial statements reflect the expenses of that fund and do not include any expenses associated with any underlying mutual funds or exchange-traded funds. Although not included in a fund's expenses, a fund indirectly bears its proportionate share of these expenses through the net asset value of each underlying mutual fund or exchange-traded fund. Expense estimates are accrued in the period to which they relate and adjustments are made when actual amounts are known.
Income Tax Information and Distributions to Shareholders. Each year, the Fund intends to qualify as a regulated investment company under Subchapter M of the Internal Revenue Code, including distributing substantially all of its taxable income and realized gains. As a result, no provision for U.S. Federal income taxes is required. As of August 31, 2022, the Fund did not have any unrecognized tax benefits in the financial statements; nor is the Fund aware of any tax positions for which it is reasonably possible that the total amounts of unrecognized tax benefits will significantly change in the next twelve months. The Fund files a U.S. federal tax return, in addition to state and local tax returns as required. The Fund's federal income tax returns are subject to examination by the Internal Revenue Service (IRS) for a period of three fiscal years after they are filed. State and local tax returns may be subject to examination for an additional fiscal year depending on the jurisdiction.
Distributions are declared and recorded daily and paid monthly from net investment income. Distributions from realized gains, if any, are declared and recorded on the ex-dividend date. Income and capital gain distributions are determined in accordance with income tax regulations, which may differ from GAAP.
Capital accounts within the financial statements are adjusted for permanent book-tax differences. These adjustments have no impact on net assets or the results of operations. Capital accounts are not adjusted for temporary book-tax differences which will reverse in a subsequent period.
Book-tax differences are primarily due to the short-term gain distributions from the underlying mutual funds, futures contracts, swaps, market discount, capital loss carryforwards and losses deferred due to wash sales and futures contracts.
As of period end, the cost and unrealized appreciation (depreciation) in securities, and derivatives if applicable, for federal income tax purposes were as follows:
| Gross unrealized appreciation | $146 |
| Gross unrealized depreciation | (20,186) |
| Net unrealized appreciation (depreciation) | $(20,040) |
| Tax Cost | $386,692 |
The tax-based components of distributable earnings as of period end were as follows:
| Undistributed ordinary income | $8 |
| Capital loss carryforward | $(10,504) |
| Net unrealized appreciation (depreciation) on securities and other investments | $(20,040) |
Capital loss carryforwards are only available to offset future capital gains of the Fund to the extent provided by regulations and may be limited. The capital loss carryforward information presented below, including any applicable limitation, is estimated as of fiscal period end and is subject to adjustment.
| Short-term | $(8,434) |
| Long-term | (2,070) |
| Total capital loss carryforward | $(10,504) |
The tax character of distributions paid was as follows:
| | August 31, 2022 | August 31, 2021 |
| Ordinary Income | $4,398 | $ 8,027 |
| Long-term Capital Gains | – | 3,912 |
| Total | $4,398 | $ 11,939 |
Delayed Delivery Transactions and When-Issued Securities. During the period, certain Funds transacted in securities on a delayed delivery or when-issued basis. Payment and delivery may take place after the customary settlement period for that security. The price of the underlying securities and the date when the securities will be delivered and paid for are fixed at the time the transaction is negotiated. Securities purchased on a delayed delivery or when-issued basis are identified as such in the Schedule of Investments. Compensation for interest forgone in the purchase of a delayed delivery or when-issued debt security may be received. With respect to purchase commitments, each applicable Fund identifies securities as segregated in its records with a value at least equal to the amount of the commitment. Payables and receivables associated with the purchases and sales of delayed delivery securities having the same coupon, settlement date and broker are offset. Delayed delivery or when-issued securities that have been purchased from and sold to different brokers are reflected as both payables and receivables in the Statement of Assets and Liabilities under the caption "Delayed delivery", as applicable. Losses may arise due to changes in the value of the underlying securities or if the counterparty does not perform under the contract's terms, or if the issuer does not issue the securities due to political, economic, or other factors.
To-Be-Announced (TBA) Securities and Mortgage Dollar Rolls. TBA securities involve buying or selling mortgage-backed securities (MBS) on a forward commitment basis. A TBA transaction typically does not designate the actual security to be delivered and only includes an approximate principal amount; however delivered securities must meet specified terms defined by industry guidelines, including issuer, rate and current principal amount outstanding on underlying mortgage pools. Funds may enter into a TBA transaction with the intent to take possession of or deliver the underlying MBS, or a fund may elect to extend the settlement by entering into either a mortgage or reverse mortgage dollar roll. Mortgage dollar rolls are transactions where a fund sells TBA securities and simultaneously agrees to repurchase MBS on a later date at a lower price and with the same counterparty. Reverse mortgage dollar rolls involve the purchase and simultaneous agreement to sell TBA securities on a later date at a lower price. Transactions in mortgage dollar rolls and reverse mortgage dollar rolls are accounted for as purchases and sales and may result in an increase to a fund's portfolio turnover rate.
Purchases and sales of TBA securities involve risks similar to those discussed above for delayed delivery and when-issued securities. Also, if the counterparty in a mortgage dollar roll or a reverse mortgage dollar roll transaction files for bankruptcy or becomes insolvent, a fund's right to repurchase or sell securities may be limited. Additionally, when a fund sells TBA securities without already owning or having the right to obtain the deliverable securities (an uncovered forward commitment to sell), it incurs a risk of loss because it could have to purchase the securities at a price that is higher than the price at which it sold them. A fund may be unable to purchase the deliverable securities if the corresponding market is illiquid.
TBA securities subject to a forward commitment to sell at period end are included at the end of the Schedule of Investments under the caption "TBA Sale Commitments." The proceeds and value of these commitments are reflected in the Statement of Assets and Liabilities as "Receivable for TBA sale commitments" and "TBA sale commitments, at value," respectively.
4. Derivative Instruments.
Risk Exposures and the Use of Derivative Instruments. Investment objectives allow a fund to enter into various types of derivative contracts, including futures contracts, swaps and options. Derivatives are investments whose value is primarily derived from underlying assets, indices or reference rates and may be transacted on an exchange or over-the-counter (OTC). Derivatives may involve a future commitment to buy or sell a specified asset based on specified terms, to exchange future cash flows at periodic intervals based on a notional principal amount, or for one party to make one or more payments upon the occurrence of specified events in exchange for periodic payments from the other party.
Derivatives were used to increase returns, to gain exposure to certain types of assets and to manage exposure to certain risks as defined below. The success of any strategy involving derivatives depends on analysis of numerous economic factors, and if the strategies for investment do not work as intended, the objectives may not be achieved.
Derivatives were used to increase or decrease exposure to the following risk(s):
| Interest Rate Risk | Interest rate risk relates to the fluctuations in the value of interest-bearing securities due to changes in the prevailing levels of market interest rates. |
Funds are also exposed to additional risks from investing in derivatives, such as liquidity risk and counterparty credit risk. Liquidity risk is the risk that a fund will be unable to close out the derivative in the open market in a timely manner. Counterparty credit risk is the risk that the counterparty will not be able to fulfill its obligation to a fund. Derivative counterparty credit risk is managed through formal evaluation of the creditworthiness of all potential counterparties. On certain OTC derivatives such as options, a fund attempts to reduce its exposure to counterparty credit risk by entering into an International Swaps and Derivatives Association, Inc. (ISDA) Master Agreement with each of its counterparties. The ISDA Master Agreement gives a fund the right to terminate all transactions traded under such agreement upon the deterioration in the credit quality of the counterparty beyond specified levels. The ISDA Master Agreement gives each party the right, upon an event of default by the other party or a termination of the agreement, to close out all transactions traded under such agreement and to net amounts owed under each transaction to one net payable by one party to the other. To mitigate counterparty credit risk on bi-lateral OTC derivatives, a fund receives collateral in the form of cash or securities once net unrealized appreciation on outstanding derivative contracts under an ISDA Master Agreement exceeds certain applicable thresholds, subject to certain minimum transfer provisions. The collateral received is held in segregated accounts with the custodian bank in accordance with the collateral agreements entered into between a fund, the counterparty and the custodian bank. A fund could experience delays and costs in gaining access to the collateral even though it is held by the custodian bank. The maximum risk of loss to a fund from counterparty credit risk related to bi-lateral OTC derivatives is generally the aggregate unrealized appreciation and unpaid counterparty payments in excess of any collateral pledged by the counterparty to a fund. A fund may be required to pledge collateral for the benefit of the counterparties on bi-lateral OTC derivatives in an amount not less than each counterparty's unrealized appreciation on outstanding derivative contracts, subject to certain minimum transfer provisions, and any such pledged collateral is identified in the Schedule of Investments. Exchange-traded contracts are not covered by the ISDA Master Agreement; however counterparty credit risk related to these contracts may be mitigated by the protection provided by the exchange on which they trade. Counterparty credit risk related to centrally cleared OTC swaps may be mitigated by the protection provided by the clearinghouse.
Investing in derivatives may involve greater risks than investing in the underlying assets directly and, to varying degrees, may involve risk of loss in excess of any initial investment and collateral received and amounts recognized in the Statement of Assets and Liabilities. In addition, there may be the risk that the change in value of the derivative contract does not correspond to the change in value of the underlying instrument.
Net Realized Gain (Loss) and Change in Net Unrealized Appreciation (Depreciation) on Derivatives. The table below, which reflects the impacts of derivatives on the financial performance, summarizes the net realized gain (loss) and change in net unrealized appreciation (depreciation) for derivatives during the period as presented in the Statement of Operations.
| Primary Risk Exposure / Derivative Type | Net Realized Gain (Loss) | Change in Net Unrealized Appreciation (Depreciation) |
| Fidelity Intermediate Government Income Fund | | |
| Interest Rate Risk | | |
| Futures Contracts | $(3,597) | $(194) |
| Purchased Options | (62) | 57 |
| Swaps | (1) | (20) |
| Total Interest Rate Risk | (3,660) | (157) |
| Totals | $(3,660) | $(157) |
If there are any open positions at period end, a summary of the value of derivatives by primary risk exposure is included at the end of the Schedule of Investments.
Futures Contracts. A futures contract is an agreement between two parties to buy or sell a specified underlying instrument for a fixed price at a specified future date. Futures contracts were used to manage exposure to the bond market and fluctuations in interest rates.
Upon entering into a futures contract, a fund is required to deposit either cash or securities (initial margin) with a clearing broker in an amount equal to a certain percentage of the face value of the contract. Futures contracts are marked-to-market daily and subsequent daily payments are made or received by a fund depending on the daily fluctuations in the value of the futures contracts and are recorded as unrealized appreciation or (depreciation). This receivable and/or payable, if any, is included in daily variation margin on futures contracts in the Statement of Assets and Liabilities. Realized gain or (loss) is recorded upon the expiration or closing of a futures contract. The net realized gain (loss) and change in net unrealized appreciation (depreciation) on futures contracts during the period is presented in the Statement of Operations.
Any open futures contracts at period end are presented in the Schedule of Investments under the caption "Futures Contracts". The notional amount at value reflects each contract's exposure to the underlying instrument or index at period end, and is representative of volume of activity during the period unless an average notional amount is presented. Any securities deposited to meet initial margin requirements are identified in the Schedule of Investments. Any cash deposited to meet initial margin requirements is presented as segregated cash with brokers for derivative instruments in the Statement of Assets and Liabilities.
Options. Options give the purchaser the right, but not the obligation, to buy (call) or sell (put) an underlying security or financial instrument at an agreed exercise or strike price between or on certain dates. Options obligate the seller (writer) to buy (put) or sell (call) an underlying instrument at the exercise or strike price or cash settle an underlying derivative instrument if the holder exercises the option on or before the expiration date. OTC options, such as swaptions, which are options where the underlying instrument is a swap, were used to manage exposure to fluctuations in interest rates.
Upon entering into an options contract, a fund will pay or receive a premium. Premiums paid on purchased options are reflected as cost of investments and premiums received on written options are reflected as a liability on the Statement of Assets and Liabilities. Certain options may be purchased or written with premiums to be paid or received on a future date. Options are valued daily and any unrealized appreciation (depreciation) is reflected on the Statement of Assets and Liabilities. When an option is exercised, the cost or proceeds of the underlying instrument purchased or sold is adjusted by the amount of the premium. When an option is closed, a gain or loss is realized depending on whether the proceeds or amount paid for the closing sale transaction is greater or less than the premium received or paid. When an option expires, gains and losses are realized to the extent of premiums received and paid, respectively. The net realized and unrealized gains (losses) on purchased options are included in the Statement of Operations in net realized gain (loss) and change in net unrealized appreciation (depreciation) on investment securities. The net realized gain (loss) and change in net unrealized appreciation (depreciation) on written options are presented in the Statement of Operations.
Any open options at period end are presented in the Schedule of Investments under the captions "Purchased Options," "Purchased Swaptions," "Written Options" and "Written Swaptions," as applicable, and are representative of volume of activity during the period unless an average notional amount is presented.
Writing puts and buying calls tend to increase exposure to the underlying instrument while buying puts and writing calls tend to decrease exposure to the underlying instrument. For purchased options, risk of loss is limited to the premium paid, and for written options, risk of loss is the change in value in excess of the premium received.
Swaps. A swap is a contract between two parties to exchange future cash flows at periodic intervals based on a notional principal amount. A centrally cleared OTC swap is a transaction executed between a fund and a dealer counterparty, then cleared by a futures commission merchant (FCM) through a clearinghouse. Once cleared, the clearinghouse serves as a central counterparty, with whom a fund exchanges cash flows for the life of the transaction, similar to transactions in futures contracts.
Centrally cleared OTC swaps require a fund to deposit either cash or securities (initial margin) with the FCM, at the instruction of and for the benefit of the clearinghouse. Any securities deposited to meet initial margin requirements are identified in the Schedule of Investments. Any cash deposited to meet initial margin requirements is presented in segregated cash with brokers for derivative instruments in the Statement of Assets and Liabilities. Centrally cleared OTC swaps are marked-to-market daily and subsequent payments (variation margin) are made or received depending on the daily fluctuations in the value of the swaps and are recorded as unrealized appreciation or (depreciation). These daily payments, if any, are included in receivable or payable for daily variation margin on centrally cleared OTC swaps in the Statement of Assets and Liabilities. Any premiums for centrally cleared OTC swaps are recorded periodically throughout the term of the swap to variation margin and included in unrealized appreciation (depreciation) in the Statement of Assets and Liabilities. Any premiums are recognized as realized gain (loss) upon termination or maturity of the swap.
Payments are exchanged at specified intervals, accrued daily commencing with the effective date of the contract and recorded as realized gain or (loss). Some swaps may be terminated prior to the effective date and realize a gain or loss upon termination. The net realized gain (loss) and change in net unrealized appreciation (depreciation) on swaps during the period is presented in the Statement of Operations.
Any open swaps at period end are included in the Schedule of Investments under the caption "Swaps", and are representative of volume of activity during the period unless an average notional amount is presented.
Interest Rate Swaps. Interest rate swaps are agreements between counterparties to exchange cash flows, one based on a fixed rate, and the other on a floating rate. A fund enters into interest rate swaps to manage its exposure to interest rate changes. Changes in interest rates can have an effect on both the value of bond holdings as well as the amount of interest income earned. In general, the value of bonds can fall when interest rates rise and can rise when interest rates fall.
5. Purchases and Sales of Investments.
Purchases and sales of securities, other than short-term securities, U.S. government securities and in-kind transactions, as applicable, are noted in the table below.
| | Purchases ($) | Sales ($) |
| Fidelity Intermediate Government Income Fund | 118,535 | 122,068 |
6. Fees and Other Transactions with Affiliates.
Management Fee. Fidelity Management & Research Company LLC (the investment adviser) and its affiliates provide the Fund with investment management related services for which the Fund pays a monthly management fee. The management fee is the sum of an individual fund fee rate that is based on an annual rate of .20% of the Fund's average net assets and an annualized group fee rate that averaged .10% during the period. The group fee rate is based upon the monthly average net assets of a group of registered investment companies with which the investment adviser has management contracts. The group fee rate decreases as assets under management increase and increases as assets under management decrease. For the reporting period, the total annual management fee rate was .30% of the Fund's average net assets.
Transfer Agent Fees. Fidelity Investments Institutional Operations Company LLC (FIIOC), an affiliate of the investment adviser, is the Fund's transfer, dividend disbursing and shareholder servicing agent. FIIOC receives an asset-based fee of .10% of the Fund's average net assets. FIIOC pays for typesetting, printing and mailing of shareholder reports, except proxy statements.
Fund Wide Operations Fee. Pursuant to the Fund Wide Operations and Expense Agreement (FWOE), the investment adviser has agreed to provide for fund-level expenses (which may not include transfer agent, the compensation of the independent Trustees, interest, taxes or extraordinary expenses, as applicable) in return for a FWOE fee equal to .35% of fund-level average net assets less the total amount of the management fee. The FWOE paid by a fund is reduced by an amount equal to the fees and expenses paid to the independent Trustees. For the period, the FWOE fees were equivalent to the following annual rate expressed as a percentage of average net assets:
| Fidelity Intermediate Government Income Fund | .05% |
Interfund Trades. Funds may purchase from or sell securities to other Fidelity Funds under procedures adopted by the Board. The procedures have been designed to ensure these interfund trades are executed in accordance with Rule 17a-7 of the 1940 Act. Any interfund trades are included within the respective purchases and sales amounts shown in the Purchases and Sales of Investments note. During the period, there were no interfund trades.
7. Committed Line of Credit.
Certain Funds participate with other funds managed by the investment adviser or an affiliate in a $4.25 billion credit facility (the "line of credit") to be utilized for temporary or emergency purposes to fund shareholder redemptions or for other short-term liquidity purposes. The commitment fees on the pro-rata portion of the line of credit are borne by the investment adviser. During the period, there were no borrowings on this line of credit.
8. Security Lending.
Funds lend portfolio securities from time to time in order to earn additional income. Lending agents are used, including National Financial Services (NFS), an affiliate of the investment adviser. Pursuant to a securities lending agreement, NFS will receive a fee, which is capped at 9.9% of a fund's daily lending revenue, for its services as lending agent. A fund may lend securities to certain qualified borrowers, including NFS. On the settlement date of the loan, a fund receives collateral (in the form of U.S. Treasury obligations, letters of credit and/or cash) against the loaned securities and maintains collateral in an amount not less than 100% of the market value of the loaned securities during the period of the loan. The market value of the loaned securities is determined at the close of business of a fund and any additional required collateral is delivered to a fund on the next business day. A fund or borrower may terminate the loan at any time, and if the borrower defaults on its obligation to return the securities loaned because of insolvency or other reasons, a fund may apply collateral received from the borrower against the obligation. A fund may experience delays and costs in recovering the securities loaned. Any cash collateral received is invested in the Fidelity Securities Lending Cash Central Fund. Any loaned securities are identified as such in the Schedule of Investments, and the value of loaned securities and cash collateral at period end, as applicable, are presented in the Statement of Assets and Liabilities. Security lending income represents the income earned on investing cash collateral, less rebates paid to borrowers and any lending agent fees associated with the loan, plus any premium payments received for lending certain types of securities. Security lending income is presented in the Statement of Operations as a component of income from Fidelity Central Funds. Affiliated security lending activity, if any, was as follows:
| | Total Security Lending Fees Paid to NFS | Security Lending Income From Securities Loaned to NFS | Value of Securities Loaned to NFS at Period End |
| Fidelity Intermediate Government Income Fund | $2 | $– | $– |
9. Other.
A fund's organizational documents provide former and current trustees and officers with a limited indemnification against liabilities arising in connection with the performance of their duties to the fund. In the normal course of business, a fund may also enter into contracts that provide general indemnifications. A fund's maximum exposure under these arrangements is unknown as this would be dependent on future claims that may be made against a fund. The risk of material loss from such claims is considered remote.
10. Risk and Uncertainties.
Many factors affect a fund's performance. Developments that disrupt global economies and financial markets, such as pandemics, epidemics, outbreaks of infectious diseases, war, terrorism, and environmental disasters, may significantly affect a fund's investment performance. The effects of these developments to a fund will be impacted by the types of securities in which a fund invests, the financial condition, industry, economic sector, and geographic location of an issuer, and a fund's level of investment in the securities of that issuer.
Report of Independent Registered Public Accounting Firm
To the Board of Trustees of Fidelity Income Fund and Shareholders of Fidelity Intermediate Government Income Fund
Opinion on the Financial Statements
We have audited the accompanying statement of assets and liabilities, including the schedule of investments, of Fidelity Intermediate Government Income Fund (one of the funds constituting Fidelity Income Fund, referred to hereafter as the “Fund”) as of August 31, 2022, the related statement of operations for the year ended August 31, 2022, the statement of changes in net assets for each of the two years in the period ended August 31, 2022, including the related notes, and the financial highlights for each of the five years in the period ended August 31, 2022 (collectively referred to as the “financial statements”). In our opinion, the financial statements present fairly, in all material respects, the financial position of the Fund as of August 31, 2022, the results of its operations for the year then ended, the changes in its net assets for each of the two years in the period ended August 31, 2022 and the financial highlights for each of the five years in the period ended August 31, 2022 in conformity with accounting principles generally accepted in the United States of America.
Basis for Opinion
These financial statements are the responsibility of the Fund’s management. Our responsibility is to express an opinion on the Fund’s financial statements based on our audits. We are a public accounting firm registered with the Public Company Accounting Oversight Board (United States) (PCAOB) and are required to be independent with respect to the Fund in accordance with the U.S. federal securities laws and the applicable rules and regulations of the Securities and Exchange Commission and the PCAOB.
We conducted our audits of these financial statements in accordance with the standards of the PCAOB. Those standards require that we plan and perform the audit to obtain reasonable assurance about whether the financial statements are free of material misstatement, whether due to error or fraud.
Our audits included performing procedures to assess the risks of material misstatement of the financial statements, whether due to error or fraud, and performing procedures that respond to those risks. Such procedures included examining, on a test basis, evidence regarding the amounts and disclosures in the financial statements. Our audits also included evaluating the accounting principles used and significant estimates made by management, as well as evaluating the overall presentation of the financial statements. Our procedures included confirmation of securities owned as of August 31, 2022 by correspondence with the custodian and brokers; when replies were not received from brokers, we performed other auditing procedures. We believe that our audits provide a reasonable basis for our opinion.
/s/ PricewaterhouseCoopers LLP
Boston, Massachusetts
October 14, 2022
We have served as the auditor of one or more investment companies in the Fidelity group of funds since 1932.
Trustees and Officers
The Trustees, Members of the Advisory Board (if any), and officers of the trust and fund, as applicable, are listed below. The Board of Trustees governs the fund and is responsible for protecting the interests of shareholders. The Trustees are experienced executives who meet periodically throughout the year to oversee the fund's activities, review contractual arrangements with companies that provide services to the fund, oversee management of the risks associated with such activities and contractual arrangements, and review the fund's performance. Each of the Trustees oversees 297 funds.
The Trustees hold office without limit in time except that (a) any Trustee may resign; (b) any Trustee may be removed by written instrument, signed by at least two-thirds of the number of Trustees prior to such removal; (c) any Trustee who requests to be retired or who has become incapacitated by illness or injury may be retired by written instrument signed by a majority of the other Trustees; and (d) any Trustee may be removed at any special meeting of shareholders by a two-thirds vote of the outstanding voting securities of the trust. Each Trustee who is not an interested person (as defined in the 1940 Act) of the trust and the fund is referred to herein as an Independent Trustee. Each Independent Trustee shall retire not later than the last day of the calendar year in which his or her 75th birthday occurs. The Independent Trustees may waive this mandatory retirement age policy with respect to individual Trustees. Officers and Advisory Board Members hold office without limit in time, except that any officer or Advisory Board Member may resign or may be removed by a vote of a majority of the Trustees at any regular meeting or any special meeting of the Trustees. Except as indicated, each individual has held the office shown or other offices in the same company for the past five years.
The fund’s Statement of Additional Information (SAI) includes more information about the Trustees. To request a free copy, call Fidelity at 1-800-544-8544.
Experience, Skills, Attributes, and Qualifications of the Trustees. The Governance and Nominating Committee has adopted a statement of policy that describes the experience, qualifications, attributes, and skills that are necessary and desirable for potential Independent Trustee candidates (Statement of Policy). The Board believes that each Trustee satisfied at the time he or she was initially elected or appointed a Trustee, and continues to satisfy, the standards contemplated by the Statement of Policy. The Governance and Nominating Committee also engages professional search firms to help identify potential Independent Trustee candidates who have the experience, qualifications, attributes, and skills consistent with the Statement of Policy. From time to time, additional criteria based on the composition and skills of the current Independent Trustees, as well as experience or skills that may be appropriate in light of future changes to board composition, business conditions, and regulatory or other developments, have also been considered by the professional search firms and the Governance and Nominating Committee. In addition, the Board takes into account the Trustees' commitment and participation in Board and committee meetings, as well as their leadership of standing and ad hoc committees throughout their tenure.
In determining that a particular Trustee was and continues to be qualified to serve as a Trustee, the Board has considered a variety of criteria, none of which, in isolation, was controlling. The Board believes that, collectively, the Trustees have balanced and diverse experience, qualifications, attributes, and skills, which allow the Board to operate effectively in governing the fund and protecting the interests of shareholders. Information about the specific experience, skills, attributes, and qualifications of each Trustee, which in each case led to the Board's conclusion that the Trustee should serve (or continue to serve) as a trustee of the fund, is provided below.
Board Structure and Oversight Function. Abigail P. Johnson is an interested person and currently serves as Chairman. The Trustees have determined that an interested Chairman is appropriate and benefits shareholders because an interested Chairman has a personal and professional stake in the quality and continuity of services provided to the fund. Independent Trustees exercise their informed business judgment to appoint an individual of their choosing to serve as Chairman, regardless of whether the Trustee happens to be independent or a member of management. The Independent Trustees have determined that they can act independently and effectively without having an Independent Trustee serve as Chairman and that a key structural component for assuring that they are in a position to do so is for the Independent Trustees to constitute a substantial majority for the Board. The Independent Trustees also regularly meet in executive session. Michael E. Kenneally serves as Chairman of the Independent Trustees and as such (i) acts as a liaison between the Independent Trustees and management with respect to matters important to the Independent Trustees and (ii) with management prepares agendas for Board meetings.
Fidelity® funds are overseen by different Boards of Trustees. The fund's Board oversees Fidelity's investment-grade bond, money market, asset allocation and certain equity funds, and other Boards oversee Fidelity's high income and other equity funds. The asset allocation funds may invest in Fidelity® funds that are overseen by such other Boards. The use of separate Boards, each with its own committee structure, allows the Trustees of each group of Fidelity® funds to focus on the unique issues of the funds they oversee, including common research, investment, and operational issues. On occasion, the separate Boards establish joint committees to address issues of overlapping consequences for the Fidelity® funds overseen by each Board.
The Trustees operate using a system of committees to facilitate the timely and efficient consideration of all matters of importance to the Trustees, the fund, and fund shareholders and to facilitate compliance with legal and regulatory requirements and oversight of the fund's activities and associated risks. The Board, acting through its committees, has charged FMR and its affiliates with (i) identifying events or circumstances the occurrence of which could have demonstrably adverse effects on the fund's business and/or reputation; (ii) implementing processes and controls to lessen the possibility that such events or circumstances occur or to mitigate the effects of such events or circumstances if they do occur; and (iii) creating and maintaining a system designed to evaluate continuously business and market conditions in order to facilitate the identification and implementation processes described in (i) and (ii) above. Because the day-to-day operations and activities of the fund are carried out by or through FMR, its affiliates, and other service providers, the fund's exposure to risks is mitigated but not eliminated by the processes overseen by the Trustees. While each of the Board's committees has responsibility for overseeing different aspects of the fund's activities, oversight is exercised primarily through the Operations and Audit Committees. In addition, an ad hoc Board committee of Independent Trustees has worked with FMR to enhance the Board's oversight of investment and financial risks, legal and regulatory risks, technology risks, and operational risks, including the development of additional risk reporting to the Board. Appropriate personnel, including but not limited to the fund's Chief Compliance Officer (CCO), FMR's internal auditor, the independent accountants, the fund's Treasurer and portfolio management personnel, make periodic reports to the Board's committees, as appropriate, including an annual review of Fidelity's risk management program for the Fidelity® funds. The responsibilities of each standing committee, including their oversight responsibilities, are described further under "Standing Committees of the Trustees."
Interested Trustees*:
Correspondence intended for a Trustee who is an interested person may be sent to Fidelity Investments, 245 Summer Street, Boston, Massachusetts 02210.
Name, Year of Birth; Principal Occupations and Other Relevant Experience+
Abigail P. Johnson (1961)
Year of Election or Appointment: 2009
Trustee
Chairman of the Board of Trustees
Ms. Johnson also serves as Trustee of other Fidelity® funds. Ms. Johnson serves as Chairman (2016-present), Chief Executive Officer (2014-present), and Director (2007-present) of FMR LLC (diversified financial services company), President of Fidelity Financial Services (2012-present) and President of Personal, Workplace and Institutional Services (2005-present). Ms. Johnson is Chairman and Director of Fidelity Management & Research Company LLC (investment adviser firm, 2011-present). Previously, Ms. Johnson served as Chairman and Director of FMR Co., Inc. (investment adviser firm, 2011-2019), Vice Chairman (2007-2016) and President (2013-2016) of FMR LLC, President and a Director of Fidelity Management & Research Company (2001-2005), a Trustee of other investment companies advised by Fidelity Management & Research Company, Fidelity Investments Money Management, Inc. (investment adviser firm), and FMR Co., Inc. (2001-2005), Senior Vice President of the Fidelity® funds (2001-2005), and managed a number of Fidelity® funds. Ms. Abigail P. Johnson and Mr. Arthur E. Johnson are not related.
Jennifer Toolin McAuliffe (1959)
Year of Election or Appointment: 2016
Trustee
Ms. McAuliffe also serves as Trustee of other Fidelity® funds and as Trustee of Fidelity Charitable (2020-present). Previously, Ms. McAuliffe served as Co-Head of Fixed Income of Fidelity Investments Limited (now known as FIL Limited (FIL)) (diversified financial services company), Director of Research for FIL’s credit and quantitative teams in London, Hong Kong and Tokyo and Director of Research for taxable and municipal bonds at Fidelity Investments Money Management, Inc. Ms. McAuliffe previously served as a member of the Advisory Board of certain Fidelity® funds (2016). Ms. McAuliffe was previously a lawyer at Ropes & Gray LLP and currently serves as director or trustee of several not-for-profit entities.
* Determined to be an “Interested Trustee” by virtue of, among other things, his or her affiliation with the trust or various entities under common control with FMR.
+ The information includes the Trustee's principal occupation during the last five years and other information relating to the experience, attributes, and skills relevant to the Trustee's qualifications to serve as a Trustee, which led to the conclusion that the Trustee should serve as a Trustee for the fund.
Independent Trustees:
Correspondence intended for an Independent Trustee may be sent to Fidelity Investments, P.O. Box 55235, Boston, Massachusetts 02205-5235.
Name, Year of Birth; Principal Occupations and Other Relevant Experience+
Elizabeth S. Acton (1951)
Year of Election or Appointment: 2013
Trustee
Ms. Acton also serves as Trustee of other Fidelity® funds. Prior to her retirement, Ms. Acton served as Executive Vice President, Finance (2011-2012), Executive Vice President, Chief Financial Officer (2002-2011) and Treasurer (2004-2005) of Comerica Incorporated (financial services). Prior to joining Comerica, Ms. Acton held a variety of positions at Ford Motor Company (1983-2002), including Vice President and Treasurer (2000-2002) and Executive Vice President and Chief Financial Officer of Ford Motor Credit Company (1998-2000). Ms. Acton currently serves as a member of the Board and Audit and Finance Committees of Beazer Homes USA, Inc. (homebuilding, 2012-present). Ms. Acton previously served as a member of the Advisory Board of certain Fidelity® funds (2013-2016).
Ann E. Dunwoody (1953)
Year of Election or Appointment: 2018
Trustee
General Dunwoody also serves as Trustee of other Fidelity® funds. General Dunwoody (United States Army, Retired) was the first woman in U.S. military history to achieve the rank of four-star general and prior to her retirement in 2012 held a variety of positions within the U.S. Army, including Commanding General, U.S. Army Material Command (2008-2012). General Dunwoody currently serves as President of First to Four LLC (leadership and mentoring services, 2012-present), a member of the Board and Nomination and Corporate Governance Committees of Kforce Inc. (professional staffing services, 2016-present) and a member of the Board of Automattic Inc. (software engineering, 2018-present). Previously, General Dunwoody served as a member of the Advisory Board and Nominating and Corporate Governance Committee of L3 Technologies, Inc. (communication, electronic, sensor and aerospace systems, 2013-2019) and a member of the Board and Audit and Sustainability and Corporate Responsibility Committees of Republic Services, Inc. (waste collection, disposal and recycling, 2013-2016). Ms. Dunwoody also serves on several boards for non-profit organizations, including as a member of the Board, Chair of the Nomination and Governance Committee and a member of the Audit Committee of Logistics Management Institute (consulting non-profit, 2012-present), a member of the Council of Trustees for the Association of the United States Army (advocacy non-profit, 2013-present), a member of the Board of Florida Institute of Technology (2015-present) and a member of the Board of ThanksUSA (military family education non-profit, 2014-present). General Dunwoody previously served as a member of the Advisory Board of certain Fidelity® funds (2018).
John Engler (1948)
Year of Election or Appointment: 2014
Trustee
Mr. Engler also serves as Trustee of other Fidelity® funds. Previously, Mr. Engler served as Governor of Michigan (1991-2003), President of the Business Roundtable (2011-2017) and interim President of Michigan State University (2018-2019). Mr. Engler currently serves as a member of the Board of Stride, Inc. (formerly K12 Inc.) (technology-based education company, 2012-present). Previously, Mr. Engler served as a member of the Board of Universal Forest Products (manufacturer and distributor of wood and wood-alternative products, 2003-2019) and Trustee of The Munder Funds (2003-2014). Mr. Engler previously served as a member of the Advisory Board of certain Fidelity® funds (2014-2016).
Robert F. Gartland (1951)
Year of Election or Appointment: 2010
Trustee
Mr. Gartland also serves as Trustee of other Fidelity® funds. Prior to his retirement, Mr. Gartland held a variety of positions at Morgan Stanley (financial services, 1979-2007), including Managing Director (1987-2007) and Chase Manhattan Bank (1975-1978). Mr. Gartland previously served as Chairman and an investor in Gartland & Mellina Group Corp. (consulting, 2009-2019), as a member of the Board of National Securities Clearing Corporation (1993-1996) and as Chairman of TradeWeb (2003-2004).
Arthur E. Johnson (1947)
Year of Election or Appointment: 2008
Trustee
Mr. Johnson also serves as Trustee of other Fidelity® funds. Prior to his retirement, Mr. Johnson served as Senior Vice President of Corporate Strategic Development of Lockheed Martin Corporation (defense contractor, 1999-2009). Mr. Johnson currently serves as a member of the Board of Booz Allen Hamilton (management consulting, 2011-present). Mr. Johnson previously served as a member of the Board of Eaton Corporation plc (diversified power management, 2009-2019) and a member of the Board of AGL Resources, Inc. (holding company, 2002-2016). Mr. Johnson previously served as Chairman (2018-2021) and Vice Chairman (2015-2018) of the Independent Trustees of certain Fidelity® funds. Mr. Arthur E. Johnson is not related to Ms. Abigail P. Johnson.
Michael E. Kenneally (1954)
Year of Election or Appointment: 2009
Trustee
Chairman of the Independent Trustees
Mr. Kenneally also serves as Trustee of other Fidelity® funds and was Vice Chairman (2018-2021) of the Independent Trustees of certain Fidelity® funds. Prior to retirement in 2005, he was Chairman and Global Chief Executive Officer of Credit Suisse Asset Management, the worldwide fund management and institutional investment business of Credit Suisse Group. Previously, Mr. Kenneally was an Executive Vice President and the Chief Investment Officer for Bank of America. In this role, he was responsible for the investment management, strategy and products delivered to the bank’s institutional, high-net-worth and retail clients. Earlier, Mr. Kenneally directed the organization’s equity and quantitative research groups. He began his career as a research analyst and then spent more than a dozen years as a portfolio manager for endowments, pension plans and mutual funds. He earned the Chartered Financial Analyst (CFA) designation in 1991.
Marie L. Knowles (1946)
Year of Election or Appointment: 2001
Trustee
Ms. Knowles also serves as Trustee of other Fidelity® funds. Prior to her retirement, Ms. Knowles held several positions at Atlantic Richfield Company (diversified energy), including Executive Vice President and Chief Financial Officer (1996-2000), Senior Vice President (1993-1996) and President of ARCO Transportation Company (pipeline and tanker operations, 1993-1996). Ms. Knowles currently serves as a member of the Board of the Santa Catalina Island Company (real estate, 2009-present), a member of the Investment Company Institute Board of Governors and a member of the Governing Council of the Independent Directors Council (2014-present). Ms. Knowles also serves as a member of the Advisory Board for the School of Engineering of the University of Southern California. Ms. Knowles previously served as a member of the Board of McKesson Corporation (healthcare service, 2002-2021). In addition, Ms. Knowles previously served as Chairman (2015-2018) and Vice Chairman (2012-2015) of the Independent Trustees of certain Fidelity® funds.
Mark A. Murray (1954)
Year of Election or Appointment: 2016
Trustee
Mr. Murray also serves as Trustee of other Fidelity® funds. Previously, Mr. Murray served as Co-Chief Executive Officer (2013-2016), President (2006-2013) and Vice Chairman (2013-2020) of Meijer, Inc. Mr. Murray serves as a member of the Board (2009-present) and Public Policy and Responsibility Committee (2009-present) and Chair of the Nuclear Review Committee (2019-present) of DTE Energy Company (diversified energy company). Mr. Murray previously served as a member of the Board of Spectrum Health (not-for-profit health system, 2015-2019) and as a member of the Board and Audit Committee and Chairman of the Nominating and Corporate Governance Committee of Universal Forest Products, Inc. (manufacturer and distributor of wood and wood-alternative products, 2004-2016). Mr. Murray also serves as a member of the Board of many community and professional organizations. Mr. Murray previously served as a member of the Advisory Board of certain Fidelity® funds (2016).
+ The information includes the Trustee's principal occupation during the last five years and other information relating to the experience, attributes, and skills relevant to the Trustee's qualifications to serve as a Trustee, which led to the conclusion that the Trustee should serve as a Trustee for the fund.
Advisory Board Members and Officers:
Correspondence intended for an officer may be sent to Fidelity Investments, 245 Summer Street, Boston, Massachusetts 02210. Officers appear below in alphabetical order.
Name, Year of Birth; Principal Occupation
Laura M. Bishop (1961)
Year of Election or Appointment: 2022
Member of the Advisory Board
Ms. Bishop also serves as a Member of the Advisory Board of other funds. Prior to her retirement, Ms. Bishop held a variety of positions at United Services Automobile Association (2001-2020), including Executive Vice President and Chief Financial Officer (2014-2020) and Senior Vice President and Deputy Chief Financial Officer (2012-2014). Ms. Bishop currently serves as a member of the Audit Committee and Compensation and Personnel Committee (2021-present) of the Board of Directors of Korn Ferry (global organizational consulting).
Robert W. Helm (1957)
Year of Election or Appointment: 2021
Member of the Advisory Board
Mr. Helm also serves as a Member of the Advisory Board of other Fidelity® funds. Mr. Helm was formerly Deputy Chairman (2003-2020), partner (1991-2020) and an associate (1984-1991) of Dechert LLP (formerly Dechert Price & Rhoads). Mr. Helm currently serves on boards and committees of several not-for-profit organizations.
Craig S. Brown (1977)
Year of Election or Appointment: 2019
Assistant Treasurer
Mr. Brown also serves as an officer of other funds. Mr. Brown serves as Assistant Treasurer of FIMM, LLC (2021-present) and is an employee of Fidelity Investments (2013-present).
John J. Burke III (1964)
Year of Election or Appointment: 2018
Chief Financial Officer
Mr. Burke also serves as Chief Financial Officer of other funds. Mr. Burke serves as Head of Investment Operations for Fidelity Fund and Investment Operations (2018-present) and is an employee of Fidelity Investments (1998-present). Previously Mr. Burke served as head of Asset Management Investment Operations (2012-2018).
David J. Carter (1973)
Year of Election or Appointment: 2020
Assistant Secretary
Mr. Carter also serves as Assistant Secretary of other funds. Mr. Carter serves as Senior Vice President, Deputy General Counsel (2022-present) and is an employee of Fidelity Investments (2005-present).
Jonathan Davis (1968)
Year of Election or Appointment: 2010
Assistant Treasurer
Mr. Davis also serves as an officer of other funds. Mr. Davis serves as Assistant Treasurer of FIMM, LLC (2021-present), FMR Capital, Inc. (2017-present), FD Funds GP LLC (2021-present), FD Funds Holding LLC (2021-present), and FD Funds Management LLC (2021-present); and is an employee of Fidelity Investments. Previously, Mr. Davis served as Vice President and Associate General Counsel of FMR LLC (diversified financial services company, 2003-2010).
Laura M. Del Prato (1964)
Year of Election or Appointment: 2018
President and Treasurer
Ms. Del Prato also serves as an officer of other funds. Ms. Del Prato serves as Assistant Treasurer of FIMM, LLC (2021-present) and is an employee of Fidelity Investments (2017-present). Previously, Ms. Del Prato served as President and Treasurer of The North Carolina Capital Management Trust: Cash Portfolio and Term Portfolio (2018-2020). Prior to joining Fidelity Investments, Ms. Del Prato served as a Managing Director and Treasurer of the JPMorgan Mutual Funds (2014-2017). Prior to JPMorgan, Ms. Del Prato served as a partner at Cohen Fund Audit Services (accounting firm, 2012-2013) and KPMG LLP (accounting firm, 2004-2012).
Colm A. Hogan (1973)
Year of Election or Appointment: 2016
Assistant Treasurer
Mr. Hogan also serves as an officer of other funds. Mr. Hogan serves as Assistant Treasurer of FIMM, LLC (2021-present) and FMR Capital, Inc. (2017-present) and is an employee of Fidelity Investments (2005-present). Previously, Mr. Hogan served as Deputy Treasurer of certain Fidelity® funds (2016-2020) and Assistant Treasurer of certain Fidelity® funds (2016-2018).
Cynthia Lo Bessette (1969)
Year of Election or Appointment: 2019
Secretary and Chief Legal Officer (CLO)
Ms. Lo Bessette also serves as an officer of other funds. Ms. Lo Bessette serves as CLO, Secretary, and Senior Vice President of Fidelity Management & Research Company LLC (investment adviser firm, 2019-present); CLO of Fidelity Management & Research (Hong Kong) Limited, FMR Investment Management (UK) Limited, and Fidelity Management & Research (Japan) Limited (investment adviser firms, 2019-present); Secretary of FD Funds GP LLC (2021-present), FD Funds Holding LLC (2021-present), and FD Funds Management LLC (2021-present); and Assistant Secretary of FIMM, LLC (2019-present). She is a Senior Vice President and Deputy General Counsel of FMR LLC (diversified financial services company, 2019-present), and is an employee of Fidelity Investments. Previously, Ms. Lo Bessette served as CLO, Secretary, and Senior Vice President of FMR Co., Inc. (investment adviser firm, 2019); Secretary of Fidelity SelectCo, LLC and Fidelity Investments Money Management, Inc. (investment adviser firms, 2019). Prior to joining Fidelity Investments, Ms. Lo Bessette was Executive Vice President, General Counsel (2016-2019) and Senior Vice President, Deputy General Counsel (2015-2016) of OppenheimerFunds (investment management company) and Deputy Chief Legal Officer (2013-2015) of Jennison Associates LLC (investment adviser firm).
Chris Maher (1972)
Year of Election or Appointment: 2013
Assistant Treasurer
Mr. Maher also serves as an officer of other funds. Mr. Maher serves as Assistant Treasurer of FIMM, LLC (2021-present) and FMR Capital, Inc. (2017-present), and is an employee of Fidelity Investments (2008-present). Previously, Mr. Maher served as Assistant Treasurer of certain funds (2013-2020); Vice President of Asset Management Compliance (2013), Vice President of the Program Management Group of FMR (investment adviser firm, 2010-2013), and Vice President of Valuation Oversight (2008-2010).
Jamie Pagliocco (1964)
Year of Election or Appointment: 2020
Vice President
Mr. Pagliocco also serves as Vice President of other funds. Mr. Pagliocco serves as President of Fixed Income (2020-present), and is an employee of Fidelity Investments (2001-present). Previously, Mr. Pagliocco served as Co-Chief Investment Officer – Bond (2017-2020), Global Head of Bond Trading (2016-2019), and as a portfolio manager.
Kenneth B. Robins (1969)
Year of Election or Appointment: 2020
Chief Compliance Officer
Mr. Robins also serves as an officer of other funds. Mr. Robins serves as Compliance Officer of Fidelity Management & Research Company LLC (investment adviser firm, 2016-present) and is an employee of Fidelity Investments (2004-present). Previously, Mr. Robins served as Compliance Officer of FMR Co., Inc. (investment adviser firm, 2016-2019), as Executive Vice President of Fidelity Investments Money Management, Inc. (investment adviser firm, 2013-2016) and served in other fund officer roles.
Brett Segaloff (1972)
Year of Election or Appointment: 2021
Anti-Money Laundering (AML) Officer
Mr. Segaloff also serves as an AML Officer of other funds and other related entities. He is Director, Anti-Money Laundering (2007-present) of FMR LLC (diversified financial services company) and is an employee of Fidelity Investments (1996-present).
Stacie M. Smith (1974)
Year of Election or Appointment: 2013
Assistant Treasurer
Ms. Smith also serves as an officer of other funds. Ms. Smith serves as Assistant Treasurer of FIMM, LLC (2021-present) and FMR Capital, Inc. (2017-present), is an employee of Fidelity Investments (2009-present), and has served in other fund officer roles. Prior to joining Fidelity Investments, Ms. Smith served as Senior Audit Manager of Ernst & Young LLP (accounting firm, 1996-2009). Previously, Ms. Smith served as Assistant Treasurer (2013-2019) and Deputy Treasurer (2013-2016) of certain Fidelity® funds.
Jim Wegmann (1979)
Year of Election or Appointment: 2021
Deputy Treasurer
Mr. Wegmann also serves as an officer of other funds. Mr. Wegmann serves as Assistant Treasurer of FIMM, LLC (2021-present) and is an employee of Fidelity Investments (2011-present). Previously, Mr. Wegmann served as Assistant Treasurer of certain Fidelity® funds (2019-2021).
Shareholder Expense Example
As a shareholder, you incur two types of costs: (1) transaction costs, which may include sales charges (loads) on purchase payments or redemption proceeds, as applicable and (2) ongoing costs, which generally include management fees, distribution and/or service (12b-1) fees and other Fund expenses. This Example is intended to help you understand your ongoing costs (in dollars) of investing in a fund and to compare these costs with the ongoing costs of investing in other mutual funds.
The Example is based on an investment of $1,000 invested at the beginning of the period and held for the entire period (March 1, 2022 to August 31, 2022).
Actual Expenses
The first line of the accompanying table provides information about actual account values and actual expenses. You may use the information in this line, together with the amount you invested, to estimate the expenses that you paid over the period. Simply divide your account value by $1,000.00 (for example, an $8,600 account value divided by $1,000.00 = 8.6), then multiply the result by the number in the first line for a class/Fund under the heading entitled "Expenses Paid During Period" to estimate the expenses you paid on your account during this period. If any fund is a shareholder of any underlying mutual funds or exchange-traded funds (ETFs) (the Underlying Funds), such fund indirectly bears its proportional share of the expenses of the Underlying Funds in addition to the direct expenses incurred presented in the table. These fees and expenses are not included in the annualized expense ratio used to calculate the expense estimate in the table below.
Hypothetical Example for Comparison Purposes
The second line of the accompanying table provides information about hypothetical account values and hypothetical expenses based on the actual expense ratio and an assumed rate of return of 5% per year before expenses, which is not the actual return. The hypothetical account values and expenses may not be used to estimate the actual ending account balance or expenses you paid for the period. You may use this information to compare the ongoing costs of investing in the Fund and other funds. To do so, compare this 5% hypothetical example with the 5% hypothetical examples that appear in the shareholder reports of the other funds. If any fund is a shareholder of any Underlying Funds, such fund indirectly bears its proportional share of the expenses of the Underlying Funds in addition to the direct expenses as presented in the table. These fees and expenses are not included in the annualized expense ratio used to calculate the expense estimate in the table below.
Please note that the expenses shown in the table are meant to highlight your ongoing costs only and do not reflect any transaction costs. Therefore, the second line of the table is useful in comparing ongoing costs only, and will not help you determine the relative total costs of owning different funds. In addition, if these transactional costs were included, your costs would have been higher.
| | Annualized Expense Ratio-A | Beginning
Account Value
March 1, 2022 | Ending
Account Value
August 31, 2022 | Expenses Paid
During Period-B
March 1, 2022
to August 31, 2022 |
| Fidelity Intermediate Government Income Fund | .45% | | | |
| Actual | | $1,000.00 | $948.20 | $2.21 |
| Hypothetical-C | | $1,000.00 | $1,022.94 | $2.29 |
A Annualized expense ratio reflects expenses net of applicable fee waivers.
B Expenses are equal to the annualized expense ratio, multiplied by the average account value over the period, multiplied by 184/ 365 (to reflect the one-half year period). The fees and expenses of any Underlying Funds are not included in each annualized expense ratio.
C 5% return per year before expenses
Distributions (Unaudited)
The dividend and capital gains distributions for the fund(s) are available on Fidelity.com or Institutional.Fidelity.com.
A total of 83.17% of the dividends distributed during the fiscal year was derived from interest on U.S. Government securities which is generally exempt from state income tax.
The fund designates $3,881,930 of distributions paid in the calendar year 2021 as qualifying to be taxed as interest-related dividends for nonresident alien shareholders.
The fund designates 78.14% of the short-term capital gain dividends distributed in October during the fiscal year as qualifying to be taxed as short-term capital gain dividends for nonresident alien shareholders.
The fund designates $3,974,914 of the distributions paid in the calendar year 2021 as qualifying to be taxed as section 163(j) interest dividends.
The fund will notify shareholders in January 2023 of amounts for use in preparing 2022 income tax returns.
SLM-ANN-1022
1.844593.117
Fidelity® Series Government Bond Index Fund
Annual Report
August 31, 2022
Contents
To view a fund's proxy voting guidelines and proxy voting record for the 12-month period ended June 30, visit http://www.fidelity.com/proxyvotingresults or visit the Securities and Exchange Commission's (SEC) web site at http://www.sec.gov.
You may also call 1-800-544-8544 to request a free copy of the proxy voting guidelines.
BLOOMBERG® is a trademark and service mark of Bloomberg Finance L.P. and its affiliates (collectively “Bloomberg”). Bloomberg or Bloomberg’s licensors own all proprietary rights in the Bloomberg Indices. Neither Bloomberg nor Bloomberg’s licensors approves or endorses this material, or guarantees the accuracy or completeness of any information herein, or makes any warranty, express or implied, as to the results to be obtained therefrom and, to the maximum extent allowed by law, neither shall have any liability or responsibility for injury or damages arising in connection therewith.
Standard & Poor's, S&P and S&P 500 are registered service marks of The McGraw-Hill Companies, Inc. and have been licensed for use by Fidelity Distributors Corporation.
Other third-party marks appearing herein are the property of their respective owners.
All other marks appearing herein are registered or unregistered trademarks or service marks of FMR LLC or an affiliated company. © 2022 FMR LLC. All rights reserved.
This report and the financial statements contained herein are submitted for the general information of the shareholders of the Fund. This report is not authorized for distribution to prospective investors in the Fund unless preceded or accompanied by an effective prospectus.
A fund files its complete schedule of portfolio holdings with the SEC for the first and third quarters of each fiscal year on Form N-PORT. Forms N-PORT are available on the SEC’s web site at http://www.sec.gov. A fund's Forms N-PORT may be reviewed and copied at the SEC’s Public Reference Room in Washington, DC. Information regarding the operation of the SEC's Public Reference Room may be obtained by calling 1-800-SEC-0330.
For a complete list of a fund's portfolio holdings, view the most recent holdings listing, semiannual report, or annual report on Fidelity's web site at http://www.fidelity.com, http://www.institutional.fidelity.com, or http://www.401k.com, as applicable.
NOT FDIC INSURED •MAY LOSE VALUE •NO BANK GUARANTEE
Neither the Fund nor Fidelity Distributors Corporation is a bank.
Performance: The Bottom Line
Average annual total return reflects the change in the value of an investment, assuming reinvestment of distributions from dividend income and capital gains (the profits earned upon the sale of securities that have grown in value, if any) and assuming a constant rate of performance each year. The hypothetical investment and the average annual total returns do not reflect the deduction of taxes that a shareholder would pay on fund distributions or the redemption of fund shares. During periods of reimbursement by Fidelity, a fund’s total return will be greater than it would be had the reimbursement not occurred. How a fund did yesterday is no guarantee of how it will do tomorrow.
Average Annual Total Returns
| For the periods ended August 31, 2022 | Past 1 year | Life of fundA |
| Fidelity® Series Government Bond Index Fund | (10.66)% | 0.81% |
A From August 17, 2018
$10,000 Over Life of Fund
Let's say hypothetically that $10,000 was invested in Fidelity® Series Government Bond Index Fund on August 17, 2018, when the fund started.
The chart shows how the value of your investment would have changed, and also shows how the Bloomberg U.S. Government Bond Index performed over the same period.
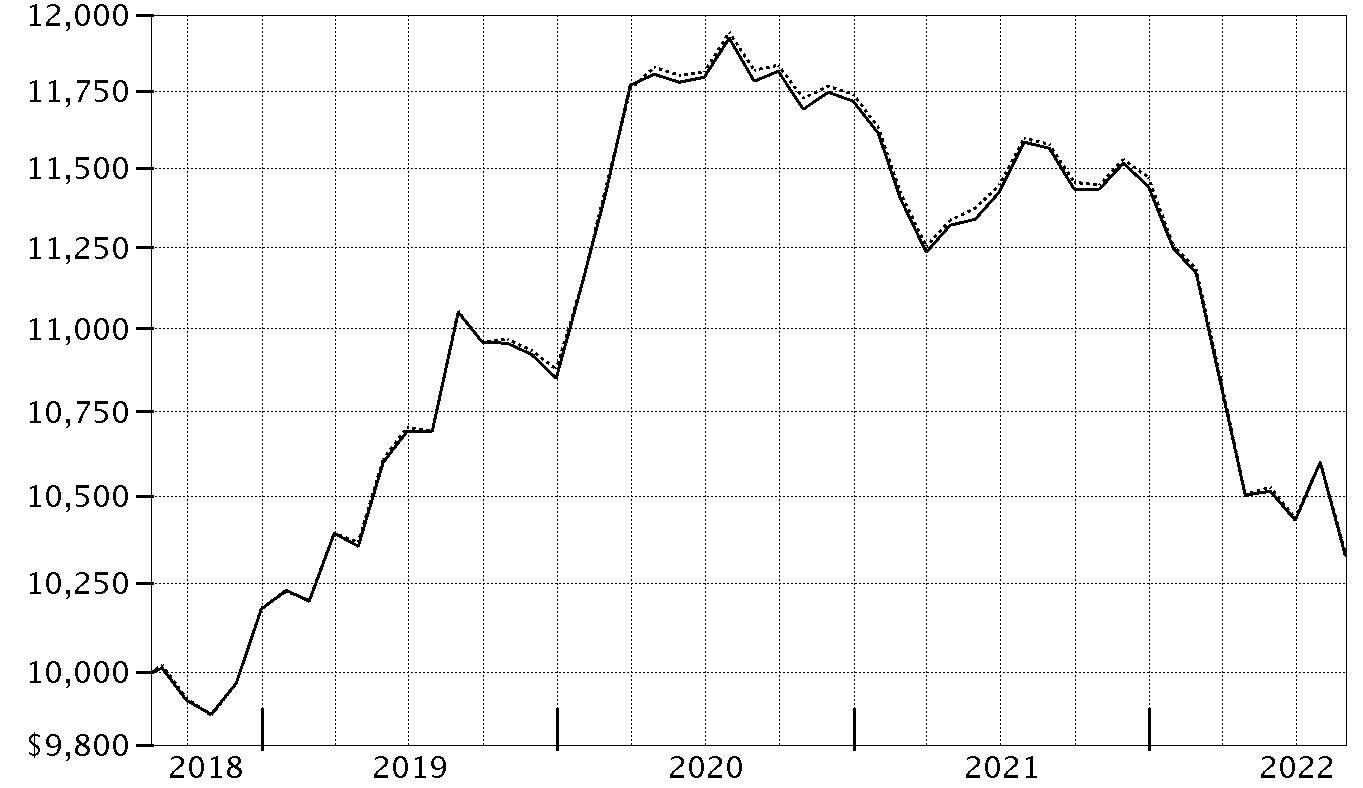
| Period Ending Values |
| $10,330 | Fidelity® Series Government Bond Index Fund |
| $10,340 | Bloomberg U.S. Government Bond Index |
Management's Discussion of Fund Performance
Market Recap: U.S. taxable investment-grade bonds notably declined for the 12 months ending August 31, 2022, as the Federal Reserve took aggressive action to stymie high inflation. The Bloomberg U.S. Aggregate Bond Index returned -11.52% for the period. In late 2021, bond yields rose when the Fed pivoted from an “easy” to a “tight” monetary stance. Its first step was to cease its purchases of bonds, part of a quantitative easing program to support the U.S. economy that began in 2008. In the first half of 2022, the Fed took more aggressive steps to thwart inflation. The central bank raised the federal funds target rate by 25 basis points (0.25%) in mid-March, 50 basis points in May and 75 basis points in June – its largest increase since 1994 – and said it was becoming more difficult to achieve a soft landing, in which the economy slows enough to bring down inflation while avoiding a recession. It also began to allow up to billions in Treasuries and mortgage bonds to mature every month without investing the proceeds. Despite another rate hike of 75 basis points in July, the index rose 2.44% for the month, only to reverse course )-2.83%) in August, when the Fed dashed hopes that it would soon “pivot” to an easier policy stance. For the full 12 months, shorter-term securities outpaced longer-term bonds, and higher-quality issues held up better than lower-rated bonds. Within the index, corporate bonds posted a return of -14.61%, trailing the -10.80% result for U.S. Treasuries. Outside the index, U.S. corporate high-yield bonds returned -10.43%, while U.S. Treasury Inflation-Protected Securities had a return of -5.98%.
Comments from Co-Portfolio Managers Brandon Bettencourt and Richard Munclinger: For the fiscal year ending August 31, 2022, the fund returned -10.66%, about in line, net of fees, with the -10.70% return of the benchmark, the Bloomberg U.S. Government Bond Index. These results met our goal of producing monthly returns, before expenses, that closely match the benchmark return. Given the large number of securities in the index (roughly 720) and the significant cost and liquidity challenges associated with full replication of the index, we use “stratified sampling techniques” in constructing the portfolio. This approach involves defining and maintaining a subset of constituent securities that, in aggregate, mirrors the chief characteristics of the index – including maturity, duration, sector allocation, credit quality and other factors. Returns for all categories of U.S. government bonds were solidly negative for the year. Bond yields rose as the Federal Reserve aggressively tightened monetary policy with interest rate hikes. The central bank raised the federal funds rate from zero at the start of the reporting period to a range of 2.25% to 2.50% by period end. U.S. agency securities outpaced comparable-duration U.S. Treasuries and government agency mortgage-backed securities (MBS). Longer-term government securities suffered steeper declines than their shorter-term counterparts.
The views expressed above reflect those of the portfolio manager(s) only through the end of the period as stated on the cover of this report and do not necessarily represent the views of Fidelity or any other person in the Fidelity organization. Any such views are subject to change at any time based upon market or other conditions and Fidelity disclaims any responsibility to update such views. These views may not be relied on as investment advice and, because investment decisions for a Fidelity fund are based on numerous factors, may not be relied on as an indication of trading intent on behalf of any Fidelity fund.
Investment Summary (Unaudited)
Coupon Distribution as of August 31, 2022
| | % of fund's investments |
| 0.01 - 0.99% | 40.8 |
| 1 - 1.99% | 22.5 |
| 2 - 2.99% | 21.9 |
| 3 - 3.99% | 10.8 |
| 4 - 4.99% | 0.6 |
| 5 - 5.99% | 1.2 |
| 6 - 6.99% | 0.3 |
| 7 - 7.99% | 0.2 |
Coupon distribution shows the range of stated interest rates on the fund's investments, excluding short-term investments.
Asset Allocation (% of fund's net assets)
| As of August 31, 2022 |
| | U.S. Treasury Obligations | 95.5% |
| | U.S. Government Agency Obligations | 4.1% |
| | Short-Term Investments and Net Other Assets (Liabilities) | 0.4% |

Schedule of Investments August 31, 2022
Showing Percentage of Net Assets
| U.S. Government and Government Agency Obligations - 99.6% | | | |
| | | Principal Amount | Value |
| U.S. Government Agency Obligations - 4.1% | | | |
| Fannie Mae: | | | |
| 0.25% 7/10/23 | | $1,490,000 | $1,449,306 |
| 0.25% 11/27/23 | | 3,332,000 | 3,202,371 |
| 0.5% 6/17/25 | | 5,000 | 4,596 |
| 0.625% 4/22/25 | | 814,000 | 753,710 |
| 0.875% 8/5/30 | | 727,000 | 598,556 |
| 1.625% 1/7/25 | | 15,000 | 14,385 |
| 1.875% 9/24/26 | | 674,000 | 634,166 |
| 2% 10/5/22 | | 5,000 | 4,997 |
| 2.125% 4/24/26 | | 221,000 | 210,806 |
| 2.5% 2/5/24 | | 690,000 | 681,084 |
| 2.625% 9/6/24 | | 9,000 | 8,848 |
| 5.625% 7/15/37 | | 163,000 | 197,113 |
| 6.25% 5/15/29 | | 71,000 | 83,101 |
| 7.125% 1/15/30 | | 6,000 | 7,430 |
| 7.25% 5/15/30 | | 866,000 | 1,088,880 |
| Federal Farm Credit Bank: | | | |
| 0.72% 10/27/26 | | 500,000 | 443,370 |
| 1% 10/7/26 | | 1,000,000 | 900,249 |
| 3% 8/3/26 | | 1,560,000 | 1,532,113 |
| Federal Home Loan Bank: | | | |
| 1% 12/20/24 | | 330,000 | 312,363 |
| 2.375% 9/8/23 | | 990,000 | 978,219 |
| 3.25% 11/16/28 | | 1,850,000 | 1,841,448 |
| 3.375% 3/8/24 | | 2,370,000 | 2,360,053 |
| Freddie Mac: | | | |
| 0.375% 4/20/23 | | 5,430,000 | 5,322,501 |
| 2.75% 6/19/23 | | 11,000 | 10,927 |
| 6.25% 7/15/32 | | 585,000 | 718,487 |
| 6.75% 9/15/29 | | 185,000 | 221,863 |
| 6.75% 3/15/31 | | 173,000 | 214,545 |
| Tennessee Valley Authority 4.875% 1/15/48 | | 630,000 | 691,389 |
| | | | 24,486,876 |
| U.S. Treasury Obligations - 95.5% | | | |
| U.S. Treasury Bonds: | | | |
| 1.125% 5/15/40 | | 301,000 | 204,868 |
| 1.125% 8/15/40 | | 1,824,000 | 1,230,202 |
| 1.25% 5/15/50 | | 5,371,000 | 3,320,998 |
| 1.375% 11/15/40 | | 12,447,000 | 8,756,659 |
| 1.375% 8/15/50 | | 2,035,000 | 1,301,287 |
| 1.625% 11/15/50 | | 8,694,000 | 5,948,258 |
| 1.75% 8/15/41 | | 2,948,000 | 2,190,272 |
| 1.875% 2/15/41 | | 6,716,000 | 5,145,348 |
| 1.875% 2/15/51 | | 3,943,000 | 2,877,004 |
| 1.875% 11/15/51 | | 5,009,000 | 3,647,569 |
| 2% 11/15/41 | | 4,351,000 | 3,379,843 |
| 2% 2/15/50 | | 2,973,000 | 2,248,796 |
| 2% 8/15/51 | | 5,091,000 | 3,824,614 |
| 2.25% 5/15/41 | | 3,180,000 | 2,593,191 |
| 2.25% 8/15/46 | | 830,000 | 649,734 |
| 2.25% 8/15/49 | | 3,514,000 | 2,814,220 |
| 2.25% 2/15/52 | | 4,220,000 | 3,370,725 |
| 2.375% 2/15/42 | | 1,830,000 | 1,513,467 |
| 2.375% 11/15/49 | | 19,000 | 15,658 |
| 2.375% 5/15/51 | | 7,199,000 | 5,926,802 |
| 2.5% 2/15/45 | | 160,000 | 132,263 |
| 2.75% 8/15/42 | | 3,058,000 | 2,686,501 |
| 2.75% 11/15/42 | | 550,000 | 482,174 |
| 2.75% 8/15/47 | | 5,261,000 | 4,571,521 |
| 2.875% 5/15/43 | | 2,299,000 | 2,048,984 |
| 2.875% 8/15/45 | | 66,000 | 58,356 |
| 2.875% 11/15/46 | | 2,801,000 | 2,482,605 |
| 2.875% 5/15/49 | | 1,675,000 | 1,523,334 |
| 3% 5/15/42 | | 2,828,000 | 2,598,777 |
| 3% 11/15/44 | | 265,000 | 239,639 |
| 3% 5/15/45 | | 303,000 | 273,765 |
| 3% 11/15/45 | | 732,000 | 662,317 |
| 3% 2/15/47 | | 5,955,000 | 5,401,371 |
| 3% 5/15/47 | | 808,000 | 734,144 |
| 3% 2/15/48 | | 856,000 | 784,009 |
| 3% 8/15/48 | | 519,000 | 478,068 |
| 3% 2/15/49 | | 420,000 | 390,469 |
| 3.125% 11/15/41 | | 1,240,000 | 1,167,392 |
| 3.125% 2/15/43 | | 137,000 | 127,335 |
| 3.125% 8/15/44 | | 233,000 | 215,461 |
| 3.125% 5/15/48 | | 5,311,000 | 4,997,527 |
| 3.375% 5/15/44 | | 1,939,000 | 1,870,605 |
| 3.375% 11/15/48 | | 10,000 | 9,904 |
| 3.625% 8/15/43 | | 481,000 | 483,330 |
| 3.625% 2/15/44 | | 600,000 | 601,805 |
| 3.75% 8/15/41 | | 275,000 | 283,809 |
| 3.75% 11/15/43 | | 6,095,000 | 6,240,709 |
| 3.875% 8/15/40 | | 1,136,000 | 1,202,429 |
| 4.25% 11/15/40 | | 92,000 | 102,210 |
| 4.375% 11/15/39 | | 523,000 | 594,586 |
| 4.5% 2/15/36 | | 1,391,000 | 1,603,780 |
| 4.625% 2/15/40 | | 409,000 | 479,089 |
| 4.75% 2/15/41 | | 12,000 | 14,202 |
| 5% 5/15/37 | | 1,801,000 | 2,184,205 |
| 5.25% 11/15/28 | | 505,000 | 557,887 |
| 5.25% 2/15/29 | | 3,824,000 | 4,246,582 |
| 5.5% 8/15/28 | | 147,000 | 163,710 |
| 6.125% 8/15/29 | | 443,000 | 520,785 |
| U.S. Treasury Notes: | | | |
| 0.125% 10/31/22 | | 11,000 | 10,954 |
| 0.125% 11/30/22 | | 24,000 | 23,842 |
| 0.125% 12/31/22 | | 11,000 | 10,895 |
| 0.125% 2/28/23 | | 11,000 | 10,831 |
| 0.125% 5/31/23 | | 10,000 | 9,762 |
| 0.125% 7/31/23 | | 4,470,000 | 4,335,900 |
| 0.125% 9/15/23 | | 2,365,000 | 2,284,812 |
| 0.125% 12/15/23 | | 4,274,000 | 4,096,028 |
| 0.125% 1/15/24 | | 8,513,000 | 8,131,910 |
| 0.125% 2/15/24 | | 175,000 | 166,729 |
| 0.25% 4/15/23 | | 22,000 | 21,588 |
| 0.25% 5/15/24 | | 17,808,000 | 16,863,341 |
| 0.25% 6/15/24 | | 18,735,000 | 17,693,590 |
| 0.25% 5/31/25 | | 1,615,000 | 1,478,545 |
| 0.25% 6/30/25 | | 3,891,000 | 3,555,249 |
| 0.25% 7/31/25 | | 5,195,000 | 4,731,509 |
| 0.25% 8/31/25 | | 7,120,000 | 6,465,016 |
| 0.25% 9/30/25 | | 448,000 | 405,965 |
| 0.25% 10/31/25 | | 2,642,000 | 2,387,088 |
| 0.375% 7/15/24 | | 11,356,000 | 10,726,097 |
| 0.375% 8/15/24 | | 18,160,000 | 17,105,159 |
| 0.375% 9/15/24 | | 8,936,000 | 8,394,255 |
| 0.375% 4/30/25 | | 7,678,000 | 7,073,058 |
| 0.375% 11/30/25 | | 1,170,000 | 1,058,484 |
| 0.375% 12/31/25 | | 10,554,000 | 9,526,222 |
| 0.375% 1/31/26 | | 5,750,000 | 5,176,123 |
| 0.375% 7/31/27 | | 16,032,000 | 13,900,871 |
| 0.375% 9/30/27 | | 1,530,000 | 1,318,788 |
| 0.5% 3/15/23 | | 95,000 | 93,631 |
| 0.5% 3/31/25 | | 3,222,000 | 2,986,265 |
| 0.5% 2/28/26 | | 8,512,000 | 7,680,085 |
| 0.5% 4/30/27 | | 3,017,000 | 2,645,885 |
| 0.5% 5/31/27 | | 3,605,000 | 3,155,079 |
| 0.5% 6/30/27 | | 2,645,000 | 2,309,932 |
| 0.5% 8/31/27 | | 3,933,000 | 3,421,249 |
| 0.5% 10/31/27 | | 5,860,000 | 5,073,249 |
| 0.625% 7/31/26 | | 3,440,000 | 3,086,594 |
| 0.625% 3/31/27 | | 4,626,000 | 4,090,938 |
| 0.625% 11/30/27 | | 4,558,000 | 3,962,611 |
| 0.625% 12/31/27 | | 2,957,000 | 2,564,389 |
| 0.625% 5/15/30 | | 1,227,000 | 1,011,412 |
| 0.625% 8/15/30 | | 7,308,000 | 5,995,129 |
| 0.75% 3/31/26 | | 9,444,000 | 8,581,128 |
| 0.75% 4/30/26 | | 7,936,000 | 7,198,510 |
| 0.75% 5/31/26 | | 640,000 | 579,325 |
| 0.75% 8/31/26 | | 6,342,000 | 5,708,295 |
| 0.75% 1/31/28 | | 2,797,000 | 2,437,651 |
| 0.875% 6/30/26 | | 5,006,000 | 4,545,292 |
| 0.875% 9/30/26 | | 5,616,000 | 5,073,486 |
| 0.875% 11/15/30 | | 3,309,000 | 2,765,988 |
| 1% 7/31/28 | | 310,000 | 270,996 |
| 1.125% 2/28/25 | | 8,407,000 | 7,936,405 |
| 1.125% 2/28/27 | | 478,000 | 433,617 |
| 1.125% 8/31/28 | | 1,748,000 | 1,537,352 |
| 1.125% 2/15/31 | | 7,389,000 | 6,282,670 |
| 1.25% 7/31/23 | | 4,964,000 | 4,865,302 |
| 1.25% 8/31/24 | | 953,000 | 912,684 |
| 1.25% 3/31/28 | | 520,000 | 464,141 |
| 1.25% 4/30/28 | | 573,000 | 510,753 |
| 1.25% 6/30/28 | | 5,360,000 | 4,762,863 |
| 1.25% 9/30/28 | | 920,000 | 813,733 |
| 1.25% 8/15/31 | | 3,684,000 | 3,135,573 |
| 1.375% 2/15/23 | | 7,000 | 6,941 |
| 1.375% 1/31/25 | | 66,000 | 62,795 |
| 1.375% 8/31/26 | | 3,658,000 | 3,379,078 |
| 1.375% 10/31/28 | | 2,290,000 | 2,038,637 |
| 1.375% 12/31/28 | | 4,460,000 | 3,966,961 |
| 1.375% 11/15/31 | | 10,833,000 | 9,279,565 |
| 1.5% 1/15/23 | | 16,000 | 15,907 |
| 1.5% 9/30/24 | | 1,066,000 | 1,024,276 |
| 1.5% 10/31/24 | | 641,000 | 614,959 |
| 1.5% 11/30/24 | | 4,023,000 | 3,852,337 |
| 1.5% 8/15/26 | | 192,000 | 178,230 |
| 1.5% 1/31/27 | | 4,376,000 | 4,037,886 |
| 1.5% 11/30/28 | | 10,436,000 | 9,350,411 |
| 1.5% 2/15/30 | | 8,802,000 | 7,807,649 |
| 1.625% 12/15/22 | | 16,000 | 15,946 |
| 1.625% 2/15/26 | | 10,000 | 9,393 |
| 1.625% 5/15/26 | | 222,000 | 207,943 |
| 1.625% 9/30/26 | | 199,000 | 185,630 |
| 1.625% 10/31/26 | | 3,500,000 | 3,257,734 |
| 1.625% 8/15/29 | | 908,000 | 816,987 |
| 1.625% 5/15/31 | | 6,273,000 | 5,541,558 |
| 1.75% 1/31/23 | | 11,000 | 10,935 |
| 1.75% 6/30/24 | | 1,098,000 | 1,064,631 |
| 1.75% 7/31/24 | | 720,000 | 697,359 |
| 1.75% 12/31/24 | | 1,000 | 962 |
| 1.75% 12/31/26 | | 2,030,000 | 1,897,178 |
| 1.75% 11/15/29 | | 2,449,000 | 2,223,137 |
| 1.875% 7/31/26 | | 105,000 | 99,057 |
| 1.875% 2/15/32 | | 5,020,000 | 4,483,880 |
| 2% 5/31/24 | | 928,000 | 905,054 |
| 2% 2/15/25 | | 56,000 | 54,058 |
| 2% 8/15/25 | | 422,000 | 404,345 |
| 2% 11/15/26 | | 2,382,000 | 2,248,943 |
| 2.125% 12/31/22 | | 69,000 | 68,787 |
| 2.125% 3/31/24 | | 2,417,000 | 2,367,244 |
| 2.125% 5/15/25 | | 734,000 | 708,052 |
| 2.25% 4/30/24 | | 2,642,000 | 2,590,089 |
| 2.25% 11/15/24 | | 196,000 | 190,970 |
| 2.25% 12/31/24 | | 894,000 | 869,380 |
| 2.25% 2/15/27 | | 1,829,000 | 1,741,622 |
| 2.25% 8/15/27 | | 1,597,000 | 1,516,526 |
| 2.25% 11/15/27 | | 1,113,000 | 1,054,394 |
| 2.375% 1/31/23 | | 92,000 | 91,702 |
| 2.375% 2/29/24 | | 6,467,000 | 6,362,922 |
| 2.375% 8/15/24 | | 200,000 | 195,891 |
| 2.375% 4/30/26 | | 626,000 | 603,405 |
| 2.375% 5/15/27 | | 2,224,000 | 2,126,613 |
| 2.375% 3/31/29 | | 3,930,000 | 3,705,714 |
| 2.375% 5/15/29 | | 3,505,000 | 3,305,242 |
| 2.5% 3/31/23 | | 67,000 | 66,712 |
| 2.5% 1/31/24 | | 7,562,000 | 7,458,613 |
| 2.5% 5/15/24 | | 200,000 | 196,805 |
| 2.5% 2/28/26 | | 1,670,000 | 1,616,638 |
| 2.625% 2/28/23 | | 2,000 | 1,994 |
| 2.625% 6/30/23 | | 3,308,000 | 3,289,005 |
| 2.625% 3/31/25 | | 1,463,000 | 1,432,083 |
| 2.625% 12/31/25 | | 5,827,000 | 5,672,220 |
| 2.625% 1/31/26 | | 998,000 | 970,711 |
| 2.625% 5/31/27 | | 1,000,000 | 968,516 |
| 2.625% 2/15/29 | | 2,771,000 | 2,657,562 |
| 2.75% 5/31/23 | | 237,000 | 235,991 |
| 2.75% 7/31/23 | | 425,000 | 422,560 |
| 2.75% 8/31/23 | | 23,000 | 22,830 |
| 2.75% 11/15/23 | | 202,000 | 200,272 |
| 2.75% 2/15/24 | | 207,000 | 204,857 |
| 2.75% 2/28/25 | | 971,000 | 953,742 |
| 2.75% 6/30/25 | | 1,403,000 | 1,375,324 |
| 2.75% 8/31/25 | | 17,000 | 16,641 |
| 2.75% 7/31/27 | | 830,000 | 807,759 |
| 2.75% 2/15/28 | | 1,089,000 | 1,054,969 |
| 2.75% 5/31/29 | | 880,000 | 849,131 |
| 2.75% 8/15/32 | | 1,970,000 | 1,900,434 |
| 2.875% 9/30/23 (a) | | 2,531,000 | 2,515,379 |
| 2.875% 10/31/23 | | 36,000 | 35,764 |
| 2.875% 11/30/23 | | 870,000 | 863,713 |
| 2.875% 4/30/25 | | 47,000 | 46,245 |
| 2.875% 5/31/25 | | 104,000 | 102,290 |
| 2.875% 7/31/25 | | 3,667,000 | 3,604,976 |
| 2.875% 11/30/25 | | 629,000 | 617,280 |
| 2.875% 5/15/28 | | 312,000 | 303,956 |
| 2.875% 8/15/28 | | 11,872,000 | 11,557,114 |
| 2.875% 4/30/29 | | 100,000 | 97,242 |
| 2.875% 5/15/32 | | 5,770,000 | 5,623,947 |
| 3% 6/30/24 | | 3,430,000 | 3,400,255 |
| 3% 7/31/24 (a) | | 4,110,000 | 4,074,038 |
| 3% 9/30/25 | | 2,655,000 | 2,617,146 |
| 3% 10/31/25 | | 3,689,000 | 3,635,250 |
| 3.125% 8/31/27 | | 1,610,000 | 1,595,661 |
| 3.125% 11/15/28 | | 7,048,000 | 6,958,523 |
| 3.125% 8/31/29 | | 2,150,000 | 2,128,836 |
| 3.25% 6/30/27 | | 2,060,000 | 2,050,183 |
| 3.25% 6/30/29 | | 3,680,000 | 3,665,050 |
| | | | 563,137,109 |
| TOTAL U.S. GOVERNMENT AND GOVERNMENT AGENCY OBLIGATIONS | | | |
| (Cost $647,912,758) | | | 587,623,985 |
| | | Shares | Value |
|
| Money Market Funds - 1.7% | | | |
| Fidelity Cash Central Fund 2.33% (b) | | 6,006,192 | $6,007,393 |
| Fidelity Securities Lending Cash Central Fund 2.34% (b)(c) | | 4,008,274 | 4,008,675 |
| TOTAL MONEY MARKET FUNDS | | | |
| (Cost $10,016,068) | | | 10,016,068 |
| TOTAL INVESTMENT IN SECURITIES - 101.3% | | | |
| (Cost $657,928,826) | | | 597,640,053 |
| NET OTHER ASSETS (LIABILITIES) - (1.3)% | | | (7,897,770) |
| NET ASSETS - 100% | | | $589,742,283 |
Legend
(a) Security or a portion of the security is on loan at period end.
(b) Affiliated fund that is generally available only to investment companies and other accounts managed by Fidelity Investments. The rate quoted is the annualized seven-day yield of the fund at period end. A complete unaudited listing of the fund's holdings as of its most recent quarter end is available upon request. In addition, each Fidelity Central Fund's financial statements, which are not covered by the Fund's Report of Independent Registered Public Accounting Firm, are available on the SEC's website or upon request.
(c) Investment made with cash collateral received from securities on loan.
Affiliated Central Funds
Fiscal year to date information regarding the Fund's investments in Fidelity Central Funds, including the ownership percentage, is presented below.
| Fund | Value, beginning of period | Purchases | Sales Proceeds | Dividend Income | Realized Gain/Loss | Change in Unrealized appreciation (depreciation) | Value, end of period | % ownership, end of period |
| Fidelity Cash Central Fund 2.33% | $1,571,790 | $75,283,202 | $70,847,599 | $13,188 | $-- | $-- | $6,007,393 | 0.0% |
| Fidelity Securities Lending Cash Central Fund 2.34% | 17,396,089 | 118,014,616 | 131,402,030 | 13,258 | -- | -- | 4,008,675 | 0.0% |
| Total | $18,967,879 | $193,297,818 | $202,249,629 | $26,446 | $-- | $-- | $10,016,068 | |
Amounts in the income column in the above table include any capital gain distributions from underlying funds, which are presented in the corresponding line-item in the Statement of Operations, if applicable. Amount for Fidelity Securities Lending Cash Central Fund represents the income earned on investing cash collateral, less rebates paid to borrowers and any lending agent fees associated with the loan, plus any premium payments received for lending certain types of securities.
Investment Valuation
The following is a summary of the inputs used, as of August 31, 2022, involving the Fund's assets and liabilities carried at fair value. The inputs or methodology used for valuing securities may not be an indication of the risk associated with investing in those securities. For more information on valuation inputs, and their aggregation into the levels used below, please refer to the Investment Valuation section in the accompanying Notes to Financial Statements.
| | Valuation Inputs at Reporting Date: |
| Description | Total | Level 1 | Level 2 | Level 3 |
| Investments in Securities: | | | | |
| U.S. Government and Government Agency Obligations | $587,623,985 | $-- | $587,623,985 | $-- |
| Money Market Funds | 10,016,068 | 10,016,068 | -- | -- |
| Total Investments in Securities: | $597,640,053 | $10,016,068 | $587,623,985 | $-- |
See accompanying notes which are an integral part of the financial statements.
Financial Statements
Statement of Assets and Liabilities
| | | August 31, 2022 |
| Assets | | |
Investment in securities, at value (including securities loaned of $3,898,922) — See accompanying schedule:
Unaffiliated issuers (cost $647,912,758) | $587,623,985 | |
| Fidelity Central Funds (cost $10,016,068) | 10,016,068 | |
| Total Investment in Securities (cost $657,928,826) | | $597,640,053 |
| Receivable for investments sold | | 7,657,037 |
| Receivable for fund shares sold | | 6,140,231 |
| Interest receivable | | 1,766,403 |
| Distributions receivable from Fidelity Central Funds | | 9,546 |
| Total assets | | 613,213,270 |
| Liabilities | | |
| Payable for investments purchased | $19,453,719 | |
| Payable for fund shares redeemed | 6,575 | |
| Other payables and accrued expenses | 2,018 | |
| Collateral on securities loaned | 4,008,675 | |
| Total liabilities | | 23,470,987 |
| Net Assets | | $589,742,283 |
| Net Assets consist of: | | |
| Paid in capital | | $660,513,999 |
| Total accumulated earnings (loss) | | (70,771,716) |
| Net Assets | | $589,742,283 |
| Net Asset Value, offering price and redemption price per share ($589,742,283 ÷ 62,330,226 shares) | | $9.46 |
See accompanying notes which are an integral part of the financial statements.
Statement of Operations
| | | Year ended August 31, 2022 |
| Investment Income | | |
| Interest | | $7,863,537 |
| Income from Fidelity Central Funds (including $13,258 from security lending) | | 26,446 |
| Total income | | 7,889,983 |
| Expenses | | |
| Custodian fees and expenses | $7,802 | |
| Independent trustees' fees and expenses | 1,911 | |
| Total expenses | | 9,713 |
| Net investment income (loss) | | 7,880,270 |
| Realized and Unrealized Gain (Loss) | | |
| Net realized gain (loss) on: | | |
| Investment securities: | | |
| Unaffiliated issuers | (10,304,626) | |
| Total net realized gain (loss) | | (10,304,626) |
| Change in net unrealized appreciation (depreciation) on investment securities | | (65,485,298) |
| Net gain (loss) | | (75,789,924) |
| Net increase (decrease) in net assets resulting from operations | | $(67,909,654) |
See accompanying notes which are an integral part of the financial statements.
Statement of Changes in Net Assets
| | Year ended August 31, 2022 | Year ended August 31, 2021 |
| Increase (Decrease) in Net Assets | | |
| Operations | | |
| Net investment income (loss) | $7,880,270 | $4,425,295 |
| Net realized gain (loss) | (10,304,626) | 107,692 |
| Change in net unrealized appreciation (depreciation) | (65,485,298) | (7,609,920) |
| Net increase (decrease) in net assets resulting from operations | (67,909,654) | (3,076,933) |
| Distributions to shareholders | (7,879,915) | (8,083,256) |
| Share transactions | | |
| Proceeds from sales of shares | 248,759,640 | 388,572,452 |
| Reinvestment of distributions | 7,879,915 | 8,082,881 |
| Cost of shares redeemed | (162,041,844) | (55,075,458) |
| Net increase (decrease) in net assets resulting from share transactions | 94,597,711 | 341,579,875 |
| Total increase (decrease) in net assets | 18,808,142 | 330,419,686 |
| Net Assets | | |
| Beginning of period | 570,934,141 | 240,514,455 |
| End of period | $589,742,283 | $570,934,141 |
| Other Information | | |
| Shares | | |
| Sold | 24,630,281 | 36,179,552 |
| Issued in reinvestment of distributions | 788,190 | 744,403 |
| Redeemed | (16,309,869) | (5,112,343) |
| Net increase (decrease) | 9,108,602 | 31,811,612 |
See accompanying notes which are an integral part of the financial statements.
Financial Highlights
Fidelity Series Government Bond Index Fund
| | | | | | |
| Years ended August 31, | 2022 | 2021 | 2020 | 2019 | 2018 A |
| Selected Per–Share Data | | | | | |
| Net asset value, beginning of period | $10.73 | $11.23 | $10.76 | $10.00 | $10.00 |
| Income from Investment Operations | | | | | |
| Net investment income (loss)B,C | .133 | .118 | .197 | .239 | .010 |
| Net realized and unrealized gain (loss) | (1.270) | (.323) | .504 | .782 | –D |
| Total from investment operations | (1.137) | (.205) | .701 | 1.021 | .010 |
| Distributions from net investment income | (.133) | (.125) | (.200) | (.261) | (.010) |
| Distributions from net realized gain | – | (.170) | (.031) | – | – |
| Total distributions | (.133) | (.295) | (.231) | (.261) | (.010) |
| Net asset value, end of period | $9.46 | $10.73 | $11.23 | $10.76 | $10.00 |
| Total ReturnE,F | (10.66)% | (1.85)% | 6.60% | 10.40% | .10% |
| Ratios to Average Net AssetsC,G,H | | | | | |
| Expenses before reductionsI | -% | -% | -% | -% | - %J |
| Expenses net of fee waivers, if anyI | -% | -% | -% | -% | - %J |
| Expenses net of all reductionsI | -% | -% | -% | -% | - %J |
| Net investment income (loss) | 1.32% | 1.11% | 1.80% | 2.37% | 2.54%J |
| Supplemental Data | | | | | |
| Net assets, end of period (000 omitted) | $589,742 | $570,934 | $240,514 | $138,041 | $1,491 |
| Portfolio turnover rateK | 41% | 23% | 37% | 59% | 4%L |
A For the period August 17, 2018 (commencement of operations) through August 31, 2018.
B Calculated based on average shares outstanding during the period.
C Net investment income (loss) is affected by the timing of the declaration of dividends by any underlying mutual funds or exchange-traded funds (ETFs). Net investment income (loss) of any such underlying funds is not included in the Fund's net investment income (loss) ratio.
D Amount represents less than $.0005 per share.
E Total returns for periods of less than one year are not annualized.
F Total returns would have been lower if certain expenses had not been reduced during the applicable periods shown.
G Fees and expenses of any underlying mutual funds or exchange-traded funds (ETFs) are not included in the Fund's expense ratio. The Fund indirectly bears its proportionate share of these expenses. For additional expense information related to investments in Fidelity Central Funds, please refer to the "Investments in Fidelity Central Funds" note found in the Notes to Financial Statements section of the most recent Annual or Semi-Annual report.
H Expense ratios reflect operating expenses of the class. Expenses before reductions do not reflect amounts reimbursed, waived, or reduced through arrangements with the investment adviser, brokerage services, or other offset arrangements, if applicable, and do not represent the amount paid by the class during periods when reimbursements, waivers or reductions occur.
I Amount represents less than .005%.
J Annualized
K Amount does not include the portfolio activity of any underlying mutual funds or exchange-traded funds (ETFs).
L Amount not annualized.
See accompanying notes which are an integral part of the financial statements.
Notes to Financial Statements
For the period ended August 31, 2022
1. Organization.
Fidelity Series Government Bond Index Fund (the Fund) is a fund of Fidelity Income Fund (the Trust) and is authorized to issue an unlimited number of shares. Shares are offered only to certain other Fidelity funds, Fidelity managed 529 plans, and Fidelity managed collective investment trusts. The Trust is registered under the Investment Company Act of 1940, as amended (the 1940 Act), as an open-end management investment company organized as a Massachusetts business trust.
2. Investments in Fidelity Central Funds.
Funds may invest in Fidelity Central Funds, which are open-end investment companies generally available only to other investment companies and accounts managed by the investment adviser and its affiliates. The Schedule of Investments lists any Fidelity Central Funds held as an investment as of period end, but does not include the underlying holdings of each Fidelity Central Fund. An investing fund indirectly bears its proportionate share of the expenses of the underlying Fidelity Central Funds.
Based on its investment objective, each Fidelity Central Fund may invest or participate in various investment vehicles or strategies that are similar to those of the investing fund. These strategies are consistent with the investment objectives of the investing fund and may involve certain economic risks which may cause a decline in value of each of the Fidelity Central Funds and thus a decline in the value of the investing fund.
| Fidelity Central Fund | Investment Manager | Investment Objective | Investment Practices | Expense Ratio(a) |
| Fidelity Money Market Central Funds | Fidelity Management & Research Company LLC (FMR) | Each fund seeks to obtain a high level of current income consistent with the preservation of capital and liquidity. | Short-term Investments | Less than .005% |
(a) Expenses expressed as a percentage of average net assets and are as of each underlying Central Fund's most recent annual or semi-annual shareholder report.
A complete unaudited list of holdings for each Fidelity Central Fund is available upon request or at the Securities and Exchange Commission website at www.sec.gov. In addition, the financial statements of the Fidelity Central Funds which contain the significant accounting policies (including investment valuation policies) of those funds, and are not covered by the Report of Independent Registered Public Accounting Firm, are available on the Securities and Exchange Commission website or upon request.
3. Significant Accounting Policies.
The Fund is an investment company and applies the accounting and reporting guidance of the Financial Accounting Standards Board (FASB) Accounting Standards Codification Topic 946 Financial Services - Investment Companies. The financial statements have been prepared in conformity with accounting principles generally accepted in the United States of America (GAAP), which require management to make certain estimates and assumptions at the date of the financial statements. Actual results could differ from those estimates. Subsequent events, if any, through the date that the financial statements were issued have been evaluated in the preparation of the financial statements. The Fund's Schedule of Investments lists any underlying mutual funds or exchange-traded funds (ETFs) but does not include the underlying holdings of these funds. The following summarizes the significant accounting policies of the Fund:
Investment Valuation. Investments are valued as of 4:00 p.m. Eastern time on the last calendar day of the period. The Board of Trustees (the Board) has delegated the day to day responsibility for the valuation of the Fund's investments to the Fair Value Committee (the Committee) established by the Fund's investment adviser. In accordance with valuation policies and procedures approved by the Board, the Fund attempts to obtain prices from one or more third party pricing vendors or brokers to value its investments. When current market prices, quotations or currency exchange rates are not readily available or reliable, investments will be fair valued in good faith by the Committee, in accordance with procedures adopted by the Board. Factors used in determining fair value vary by investment type and may include market or investment specific events, changes in interest rates and credit quality. The frequency with which these procedures are used cannot be predicted and they may be utilized to a significant extent. The Committee oversees the Fund's valuation policies and procedures and reports to the Board on the Committee's activities and fair value determinations. The Board monitors the appropriateness of the procedures used in valuing the Fund's investments and ratifies the fair value determinations of the Committee.
The Fund categorizes the inputs to valuation techniques used to value its investments into a disclosure hierarchy consisting of three levels as shown below:
- Level 1 – unadjusted quoted prices in active markets for identical investments
- Level 2 – other significant observable inputs (including quoted prices for similar investments, interest rates, prepayment speeds, etc.)
- Level 3 – unobservable inputs (including the Fund's own assumptions based on the best information available)
Valuation techniques used to value the Fund's investments by major category are as follows:
Debt securities, including restricted securities, are valued based on evaluated prices received from third party pricing vendors or from brokers who make markets in such securities. U.S. government and government agency obligations are valued by pricing vendors who utilize matrix pricing which considers yield or price of bonds of comparable quality, coupon, maturity and type or by broker-supplied prices. When independent prices are unavailable or unreliable, debt securities may be valued utilizing pricing methodologies which consider similar factors that would be used by third party pricing vendors. Debt securities are generally categorized as Level 2 in the hierarchy but may be Level 3 depending on the circumstances.
Investments in open-end mutual funds, including the Fidelity Central Funds, are valued at their closing net asset value (NAV) each business day and are categorized as Level 1 in the hierarchy.
Changes in valuation techniques may result in transfers in or out of an assigned level within the disclosure hierarchy. The aggregate value of investments by input level as of August 31, 2022 is included at the end of the Fund's Schedule of Investments.
Investment Transactions and Income. For financial reporting purposes, the Fund's investment holdings and NAV include trades executed through the end of the last business day of the period. The NAV per share for processing shareholder transactions is calculated as of the close of business of the New York Stock Exchange (NYSE), normally 4:00 p.m. Eastern time and includes trades executed through the end of the prior business day. Gains and losses on securities sold are determined on the basis of identified cost. Income and capital gain distributions from Fidelity Central Funds, if any, are recorded on the ex-dividend date. Interest income is accrued as earned and includes coupon interest and amortization of premium and accretion of discount on debt securities as applicable.
Expenses. Expenses directly attributable to a fund are charged to that fund. Expenses attributable to more than one fund are allocated among the respective funds on the basis of relative net assets or other appropriate methods. Expenses included in the accompanying financial statements reflect the expenses of that fund and do not include any expenses associated with any underlying mutual funds or exchange-traded funds. Although not included in a fund's expenses, a fund indirectly bears its proportionate share of these expenses through the net asset value of each underlying mutual fund or exchange-traded fund. Expense estimates are accrued in the period to which they relate and adjustments are made when actual amounts are known.
Income Tax Information and Distributions to Shareholders. Each year, the Fund intends to qualify as a regulated investment company under Subchapter M of the Internal Revenue Code, including distributing substantially all of its taxable income and realized gains. As a result, no provision for U.S. Federal income taxes is required. As of August 31, 2022, the Fund did not have any unrecognized tax benefits in the financial statements; nor is the Fund aware of any tax positions for which it is reasonably possible that the total amounts of unrecognized tax benefits will significantly change in the next twelve months. The Fund files a U.S. federal tax return, in addition to state and local tax returns as required. The Fund's federal income tax returns are subject to examination by the Internal Revenue Service (IRS) for a period of three fiscal years after they are filed. State and local tax returns may be subject to examination for an additional fiscal year depending on the jurisdiction.
Distributions are declared and recorded daily and paid monthly from net investment income. Distributions from realized gains, if any, are declared and recorded on the ex-dividend date. Income and capital gain distributions are determined in accordance with income tax regulations, which may differ from GAAP.
Capital accounts within the financial statements are adjusted for permanent book-tax differences. These adjustments have no impact on net assets or the results of operations. Capital accounts are not adjusted for temporary book-tax differences which will reverse in a subsequent period.
Book-tax differences are primarily due to losses deferred due to wash sales and excise tax regulations.
As of period end, the cost and unrealized appreciation (depreciation) in securities, and derivatives if applicable, for federal income tax purposes were as follows:
| Gross unrealized appreciation | $10,589 |
| Gross unrealized depreciation | (60,463,836) |
| Net unrealized appreciation (depreciation) | $(60,453,247) |
| Tax Cost | $658,093,300 |
The tax-based components of distributable earnings as of period end were as follows:
| Capital loss carryforward | $(10,287,636) |
| Net unrealized appreciation (depreciation) on securities and other investments | $(60,453,247) |
Capital loss carryforwards are only available to offset future capital gains of the Fund to the extent provided by regulations and may be limited. The capital loss carryforward information presented below, including any applicable limitation, is estimated as of fiscal period end and is subject to adjustment.
| Short-term | $(4,445,930) |
| Long-term | (5,841,706) |
| Total capital loss carryforward | $(10,287,636) |
The tax character of distributions paid was as follows:
| | August 31, 2022 | August 31, 2021 |
| Ordinary Income | $7,879,915 | $ 6,753,499 |
| Long-term Capital Gains | – | 1,329,757 |
| Total | $7,879,915 | $ 8,083,256 |
4. Fees and Other Transactions with Affiliates.
Management Fee. Fidelity Management & Research Company LLC (the investment adviser) and its affiliates provide the Fund with investment management related services for which the Fund does not pay a management fee. Under the management contract, the investment adviser or an affiliate pays all ordinary operating expenses of the Fund, except custody fees, fees and expenses of the independent Trustees, and certain miscellaneous expenses such as proxy and shareholder meeting expenses.
Interfund Trades. Funds may purchase from or sell securities to other Fidelity Funds under procedures adopted by the Board. The procedures have been designed to ensure these interfund trades are executed in accordance with Rule 17a-7 of the 1940 Act. Any interfund trades are included within the respective purchases and sales amounts shown in the Purchases and Sales of Investments note. During the period, there were no interfund trades.
5. Committed Line of Credit.
Certain Funds participate with other funds managed by the investment adviser or an affiliate in a $4.25 billion credit facility (the "line of credit") to be utilized for temporary or emergency purposes to fund shareholder redemptions or for other short-term liquidity purposes. The commitment fees on the pro-rata portion of the line of credit are borne by the investment adviser. During the period, there were no borrowings on this line of credit.
6. Security Lending.
Funds lend portfolio securities from time to time in order to earn additional income. Lending agents are used, including National Financial Services (NFS), an affiliate of the investment adviser. Pursuant to a securities lending agreement, NFS will receive a fee, which is capped at 9.9% of a fund's daily lending revenue, for its services as lending agent. A fund may lend securities to certain qualified borrowers, including NFS. On the settlement date of the loan, a fund receives collateral (in the form of U.S. Treasury obligations, letters of credit and/or cash) against the loaned securities and maintains collateral in an amount not less than 100% of the market value of the loaned securities during the period of the loan. The market value of the loaned securities is determined at the close of business of a fund and any additional required collateral is delivered to a fund on the next business day. A fund or borrower may terminate the loan at any time, and if the borrower defaults on its obligation to return the securities loaned because of insolvency or other reasons, a fund may apply collateral received from the borrower against the obligation. A fund may experience delays and costs in recovering the securities loaned. Any cash collateral received is invested in the Fidelity Securities Lending Cash Central Fund. Any loaned securities are identified as such in the Schedule of Investments, and the value of loaned securities and cash collateral at period end, as applicable, are presented in the Statement of Assets and Liabilities. Security lending income represents the income earned on investing cash collateral, less rebates paid to borrowers and any lending agent fees associated with the loan, plus any premium payments received for lending certain types of securities. Security lending income is presented in the Statement of Operations as a component of income from Fidelity Central Funds. Affiliated security lending activity, if any, was as follows:
| | Total Security Lending Fees Paid to NFS | Security Lending Income From Securities Loaned to NFS | Value of Securities Loaned to NFS at Period End |
| Fidelity Series Government Bond Index Fund | $1,410 | $– | $– |
7. Other.
A fund's organizational documents provide former and current trustees and officers with a limited indemnification against liabilities arising in connection with the performance of their duties to the fund. In the normal course of business, a fund may also enter into contracts that provide general indemnifications. A fund's maximum exposure under these arrangements is unknown as this would be dependent on future claims that may be made against a fund. The risk of material loss from such claims is considered remote.
At the end of the period, mutual funds and accounts managed by the investment adviser or its affiliates were the owners of record of all of the outstanding shares of the Fund.
8. Risk and Uncertainties.
Many factors affect a fund's performance. Developments that disrupt global economies and financial markets, such as pandemics, epidemics, outbreaks of infectious diseases, war, terrorism, and environmental disasters, may significantly affect a fund's investment performance. The effects of these developments to a fund will be impacted by the types of securities in which a fund invests, the financial condition, industry, economic sector, and geographic location of an issuer, and a fund's level of investment in the securities of that issuer.
Report of Independent Registered Public Accounting Firm
To the Board of Trustees of Fidelity Income Fund and Shareholders of Fidelity Series Government Bond Index Fund
Opinion on the Financial Statements
We have audited the accompanying statement of assets and liabilities, including the schedule of investments, of Fidelity Series Government Bond Index Fund (one of the funds constituting Fidelity Income Fund, referred to hereafter as the “Fund”) as of August 31, 2022, the related statement of operations for the year ended August 31, 2022, the statement of changes in net assets for each of the two years in the period ended August 31, 2022, including the related notes, and the financial highlights for each of the four years in the period ended August 31, 2022 and for the period August 17, 2018 (commencement of operations) through August 31, 2018 (collectively referred to as the “financial statements”). In our opinion, the financial statements present fairly, in all material respects, the financial position of the Fund as of August 31, 2022, the results of its operations for the year then ended, the changes in its net assets for each of the two years in the period ended August 31, 2022 and the financial highlights for each of the four years in the period ended August 31, 2022 and for the period August 17, 2018 (commencement of operations) through August 31, 2018 in conformity with accounting principles generally accepted in the United States of America.
Basis for Opinion
These financial statements are the responsibility of the Fund’s management. Our responsibility is to express an opinion on the Fund’s financial statements based on our audits. We are a public accounting firm registered with the Public Company Accounting Oversight Board (United States) (PCAOB) and are required to be independent with respect to the Fund in accordance with the U.S. federal securities laws and the applicable rules and regulations of the Securities and Exchange Commission and the PCAOB.
We conducted our audits of these financial statements in accordance with the standards of the PCAOB. Those standards require that we plan and perform the audit to obtain reasonable assurance about whether the financial statements are free of material misstatement, whether due to error or fraud.
Our audits included performing procedures to assess the risks of material misstatement of the financial statements, whether due to error or fraud, and performing procedures that respond to those risks. Such procedures included examining, on a test basis, evidence regarding the amounts and disclosures in the financial statements. Our audits also included evaluating the accounting principles used and significant estimates made by management, as well as evaluating the overall presentation of the financial statements. Our procedures included confirmation of securities owned as of August 31, 2022 by correspondence with the custodian and brokers; when replies were not received from brokers, we performed other auditing procedures. We believe that our audits provide a reasonable basis for our opinion.
/s/ PricewaterhouseCoopers LLP
Boston, Massachusetts
October 12, 2022
We have served as the auditor of one or more investment companies in the Fidelity group of funds since 1932.
Trustees and Officers
The Trustees, Members of the Advisory Board (if any), and officers of the trust and fund, as applicable, are listed below. The Board of Trustees governs the fund and is responsible for protecting the interests of shareholders. The Trustees are experienced executives who meet periodically throughout the year to oversee the fund's activities, review contractual arrangements with companies that provide services to the fund, oversee management of the risks associated with such activities and contractual arrangements, and review the fund's performance. Each of the Trustees oversees 297 funds.
The Trustees hold office without limit in time except that (a) any Trustee may resign; (b) any Trustee may be removed by written instrument, signed by at least two-thirds of the number of Trustees prior to such removal; (c) any Trustee who requests to be retired or who has become incapacitated by illness or injury may be retired by written instrument signed by a majority of the other Trustees; and (d) any Trustee may be removed at any special meeting of shareholders by a two-thirds vote of the outstanding voting securities of the trust. Each Trustee who is not an interested person (as defined in the 1940 Act) of the trust and the fund is referred to herein as an Independent Trustee. Each Independent Trustee shall retire not later than the last day of the calendar year in which his or her 75th birthday occurs. The Independent Trustees may waive this mandatory retirement age policy with respect to individual Trustees. Officers and Advisory Board Members hold office without limit in time, except that any officer or Advisory Board Member may resign or may be removed by a vote of a majority of the Trustees at any regular meeting or any special meeting of the Trustees. Except as indicated, each individual has held the office shown or other offices in the same company for the past five years.
The fund’s Statement of Additional Information (SAI) includes more information about the Trustees. To request a free copy, call Fidelity at 1-800-544-8544.
Experience, Skills, Attributes, and Qualifications of the Trustees. The Governance and Nominating Committee has adopted a statement of policy that describes the experience, qualifications, attributes, and skills that are necessary and desirable for potential Independent Trustee candidates (Statement of Policy). The Board believes that each Trustee satisfied at the time he or she was initially elected or appointed a Trustee, and continues to satisfy, the standards contemplated by the Statement of Policy. The Governance and Nominating Committee also engages professional search firms to help identify potential Independent Trustee candidates who have the experience, qualifications, attributes, and skills consistent with the Statement of Policy. From time to time, additional criteria based on the composition and skills of the current Independent Trustees, as well as experience or skills that may be appropriate in light of future changes to board composition, business conditions, and regulatory or other developments, have also been considered by the professional search firms and the Governance and Nominating Committee. In addition, the Board takes into account the Trustees' commitment and participation in Board and committee meetings, as well as their leadership of standing and ad hoc committees throughout their tenure.
In determining that a particular Trustee was and continues to be qualified to serve as a Trustee, the Board has considered a variety of criteria, none of which, in isolation, was controlling. The Board believes that, collectively, the Trustees have balanced and diverse experience, qualifications, attributes, and skills, which allow the Board to operate effectively in governing the fund and protecting the interests of shareholders. Information about the specific experience, skills, attributes, and qualifications of each Trustee, which in each case led to the Board's conclusion that the Trustee should serve (or continue to serve) as a trustee of the fund, is provided below.
Board Structure and Oversight Function. Abigail P. Johnson is an interested person and currently serves as Chairman. The Trustees have determined that an interested Chairman is appropriate and benefits shareholders because an interested Chairman has a personal and professional stake in the quality and continuity of services provided to the fund. Independent Trustees exercise their informed business judgment to appoint an individual of their choosing to serve as Chairman, regardless of whether the Trustee happens to be independent or a member of management. The Independent Trustees have determined that they can act independently and effectively without having an Independent Trustee serve as Chairman and that a key structural component for assuring that they are in a position to do so is for the Independent Trustees to constitute a substantial majority for the Board. The Independent Trustees also regularly meet in executive session. Michael E. Kenneally serves as Chairman of the Independent Trustees and as such (i) acts as a liaison between the Independent Trustees and management with respect to matters important to the Independent Trustees and (ii) with management prepares agendas for Board meetings.
Fidelity® funds are overseen by different Boards of Trustees. The fund's Board oversees Fidelity's investment-grade bond, money market, asset allocation and certain equity funds, and other Boards oversee Fidelity's high income and other equity funds. The asset allocation funds may invest in Fidelity® funds that are overseen by such other Boards. The use of separate Boards, each with its own committee structure, allows the Trustees of each group of Fidelity® funds to focus on the unique issues of the funds they oversee, including common research, investment, and operational issues. On occasion, the separate Boards establish joint committees to address issues of overlapping consequences for the Fidelity® funds overseen by each Board.
The Trustees operate using a system of committees to facilitate the timely and efficient consideration of all matters of importance to the Trustees, the fund, and fund shareholders and to facilitate compliance with legal and regulatory requirements and oversight of the fund's activities and associated risks. The Board, acting through its committees, has charged FMR and its affiliates with (i) identifying events or circumstances the occurrence of which could have demonstrably adverse effects on the fund's business and/or reputation; (ii) implementing processes and controls to lessen the possibility that such events or circumstances occur or to mitigate the effects of such events or circumstances if they do occur; and (iii) creating and maintaining a system designed to evaluate continuously business and market conditions in order to facilitate the identification and implementation processes described in (i) and (ii) above. Because the day-to-day operations and activities of the fund are carried out by or through FMR, its affiliates, and other service providers, the fund's exposure to risks is mitigated but not eliminated by the processes overseen by the Trustees. While each of the Board's committees has responsibility for overseeing different aspects of the fund's activities, oversight is exercised primarily through the Operations and Audit Committees. In addition, an ad hoc Board committee of Independent Trustees has worked with FMR to enhance the Board's oversight of investment and financial risks, legal and regulatory risks, technology risks, and operational risks, including the development of additional risk reporting to the Board. Appropriate personnel, including but not limited to the fund's Chief Compliance Officer (CCO), FMR's internal auditor, the independent accountants, the fund's Treasurer and portfolio management personnel, make periodic reports to the Board's committees, as appropriate, including an annual review of Fidelity's risk management program for the Fidelity® funds. The responsibilities of each standing committee, including their oversight responsibilities, are described further under "Standing Committees of the Trustees."
Interested Trustees*:
Correspondence intended for a Trustee who is an interested person may be sent to Fidelity Investments, 245 Summer Street, Boston, Massachusetts 02210.
Name, Year of Birth; Principal Occupations and Other Relevant Experience+
Abigail P. Johnson (1961)
Year of Election or Appointment: 2009
Trustee
Chairman of the Board of Trustees
Ms. Johnson also serves as Trustee of other Fidelity® funds. Ms. Johnson serves as Chairman (2016-present), Chief Executive Officer (2014-present), and Director (2007-present) of FMR LLC (diversified financial services company), President of Fidelity Financial Services (2012-present) and President of Personal, Workplace and Institutional Services (2005-present). Ms. Johnson is Chairman and Director of Fidelity Management & Research Company LLC (investment adviser firm, 2011-present). Previously, Ms. Johnson served as Chairman and Director of FMR Co., Inc. (investment adviser firm, 2011-2019), Vice Chairman (2007-2016) and President (2013-2016) of FMR LLC, President and a Director of Fidelity Management & Research Company (2001-2005), a Trustee of other investment companies advised by Fidelity Management & Research Company, Fidelity Investments Money Management, Inc. (investment adviser firm), and FMR Co., Inc. (2001-2005), Senior Vice President of the Fidelity® funds (2001-2005), and managed a number of Fidelity® funds. Ms. Abigail P. Johnson and Mr. Arthur E. Johnson are not related.
Jennifer Toolin McAuliffe (1959)
Year of Election or Appointment: 2016
Trustee
Ms. McAuliffe also serves as Trustee of other Fidelity® funds and as Trustee of Fidelity Charitable (2020-present). Previously, Ms. McAuliffe served as Co-Head of Fixed Income of Fidelity Investments Limited (now known as FIL Limited (FIL)) (diversified financial services company), Director of Research for FIL’s credit and quantitative teams in London, Hong Kong and Tokyo and Director of Research for taxable and municipal bonds at Fidelity Investments Money Management, Inc. Ms. McAuliffe previously served as a member of the Advisory Board of certain Fidelity® funds (2016). Ms. McAuliffe was previously a lawyer at Ropes & Gray LLP and currently serves as director or trustee of several not-for-profit entities.
* Determined to be an “Interested Trustee” by virtue of, among other things, his or her affiliation with the trust or various entities under common control with FMR.
+ The information includes the Trustee's principal occupation during the last five years and other information relating to the experience, attributes, and skills relevant to the Trustee's qualifications to serve as a Trustee, which led to the conclusion that the Trustee should serve as a Trustee for the fund.
Independent Trustees:
Correspondence intended for an Independent Trustee may be sent to Fidelity Investments, P.O. Box 55235, Boston, Massachusetts 02205-5235.
Name, Year of Birth; Principal Occupations and Other Relevant Experience+
Elizabeth S. Acton (1951)
Year of Election or Appointment: 2013
Trustee
Ms. Acton also serves as Trustee of other Fidelity® funds. Prior to her retirement, Ms. Acton served as Executive Vice President, Finance (2011-2012), Executive Vice President, Chief Financial Officer (2002-2011) and Treasurer (2004-2005) of Comerica Incorporated (financial services). Prior to joining Comerica, Ms. Acton held a variety of positions at Ford Motor Company (1983-2002), including Vice President and Treasurer (2000-2002) and Executive Vice President and Chief Financial Officer of Ford Motor Credit Company (1998-2000). Ms. Acton currently serves as a member of the Board and Audit and Finance Committees of Beazer Homes USA, Inc. (homebuilding, 2012-present). Ms. Acton previously served as a member of the Advisory Board of certain Fidelity® funds (2013-2016).
Ann E. Dunwoody (1953)
Year of Election or Appointment: 2018
Trustee
General Dunwoody also serves as Trustee of other Fidelity® funds. General Dunwoody (United States Army, Retired) was the first woman in U.S. military history to achieve the rank of four-star general and prior to her retirement in 2012 held a variety of positions within the U.S. Army, including Commanding General, U.S. Army Material Command (2008-2012). General Dunwoody currently serves as President of First to Four LLC (leadership and mentoring services, 2012-present), a member of the Board and Nomination and Corporate Governance Committees of Kforce Inc. (professional staffing services, 2016-present) and a member of the Board of Automattic Inc. (software engineering, 2018-present). Previously, General Dunwoody served as a member of the Advisory Board and Nominating and Corporate Governance Committee of L3 Technologies, Inc. (communication, electronic, sensor and aerospace systems, 2013-2019) and a member of the Board and Audit and Sustainability and Corporate Responsibility Committees of Republic Services, Inc. (waste collection, disposal and recycling, 2013-2016). Ms. Dunwoody also serves on several boards for non-profit organizations, including as a member of the Board, Chair of the Nomination and Governance Committee and a member of the Audit Committee of Logistics Management Institute (consulting non-profit, 2012-present), a member of the Council of Trustees for the Association of the United States Army (advocacy non-profit, 2013-present), a member of the Board of Florida Institute of Technology (2015-present) and a member of the Board of ThanksUSA (military family education non-profit, 2014-present). General Dunwoody previously served as a member of the Advisory Board of certain Fidelity® funds (2018).
John Engler (1948)
Year of Election or Appointment: 2014
Trustee
Mr. Engler also serves as Trustee of other Fidelity® funds. Previously, Mr. Engler served as Governor of Michigan (1991-2003), President of the Business Roundtable (2011-2017) and interim President of Michigan State University (2018-2019). Mr. Engler currently serves as a member of the Board of Stride, Inc. (formerly K12 Inc.) (technology-based education company, 2012-present). Previously, Mr. Engler served as a member of the Board of Universal Forest Products (manufacturer and distributor of wood and wood-alternative products, 2003-2019) and Trustee of The Munder Funds (2003-2014). Mr. Engler previously served as a member of the Advisory Board of certain Fidelity® funds (2014-2016).
Robert F. Gartland (1951)
Year of Election or Appointment: 2010
Trustee
Mr. Gartland also serves as Trustee of other Fidelity® funds. Prior to his retirement, Mr. Gartland held a variety of positions at Morgan Stanley (financial services, 1979-2007), including Managing Director (1987-2007) and Chase Manhattan Bank (1975-1978). Mr. Gartland previously served as Chairman and an investor in Gartland & Mellina Group Corp. (consulting, 2009-2019), as a member of the Board of National Securities Clearing Corporation (1993-1996) and as Chairman of TradeWeb (2003-2004).
Arthur E. Johnson (1947)
Year of Election or Appointment: 2008
Trustee
Mr. Johnson also serves as Trustee of other Fidelity® funds. Prior to his retirement, Mr. Johnson served as Senior Vice President of Corporate Strategic Development of Lockheed Martin Corporation (defense contractor, 1999-2009). Mr. Johnson currently serves as a member of the Board of Booz Allen Hamilton (management consulting, 2011-present). Mr. Johnson previously served as a member of the Board of Eaton Corporation plc (diversified power management, 2009-2019) and a member of the Board of AGL Resources, Inc. (holding company, 2002-2016). Mr. Johnson previously served as Chairman (2018-2021) and Vice Chairman (2015-2018) of the Independent Trustees of certain Fidelity® funds. Mr. Arthur E. Johnson is not related to Ms. Abigail P. Johnson.
Michael E. Kenneally (1954)
Year of Election or Appointment: 2009
Trustee
Chairman of the Independent Trustees
Mr. Kenneally also serves as Trustee of other Fidelity® funds and was Vice Chairman (2018-2021) of the Independent Trustees of certain Fidelity® funds. Prior to retirement in 2005, he was Chairman and Global Chief Executive Officer of Credit Suisse Asset Management, the worldwide fund management and institutional investment business of Credit Suisse Group. Previously, Mr. Kenneally was an Executive Vice President and the Chief Investment Officer for Bank of America. In this role, he was responsible for the investment management, strategy and products delivered to the bank’s institutional, high-net-worth and retail clients. Earlier, Mr. Kenneally directed the organization’s equity and quantitative research groups. He began his career as a research analyst and then spent more than a dozen years as a portfolio manager for endowments, pension plans and mutual funds. He earned the Chartered Financial Analyst (CFA) designation in 1991.
Marie L. Knowles (1946)
Year of Election or Appointment: 2001
Trustee
Ms. Knowles also serves as Trustee of other Fidelity® funds. Prior to her retirement, Ms. Knowles held several positions at Atlantic Richfield Company (diversified energy), including Executive Vice President and Chief Financial Officer (1996-2000), Senior Vice President (1993-1996) and President of ARCO Transportation Company (pipeline and tanker operations, 1993-1996). Ms. Knowles currently serves as a member of the Board of the Santa Catalina Island Company (real estate, 2009-present), a member of the Investment Company Institute Board of Governors and a member of the Governing Council of the Independent Directors Council (2014-present). Ms. Knowles also serves as a member of the Advisory Board for the School of Engineering of the University of Southern California. Ms. Knowles previously served as a member of the Board of McKesson Corporation (healthcare service, 2002-2021). In addition, Ms. Knowles previously served as Chairman (2015-2018) and Vice Chairman (2012-2015) of the Independent Trustees of certain Fidelity® funds.
Mark A. Murray (1954)
Year of Election or Appointment: 2016
Trustee
Mr. Murray also serves as Trustee of other Fidelity® funds. Previously, Mr. Murray served as Co-Chief Executive Officer (2013-2016), President (2006-2013) and Vice Chairman (2013-2020) of Meijer, Inc. Mr. Murray serves as a member of the Board (2009-present) and Public Policy and Responsibility Committee (2009-present) and Chair of the Nuclear Review Committee (2019-present) of DTE Energy Company (diversified energy company). Mr. Murray previously served as a member of the Board of Spectrum Health (not-for-profit health system, 2015-2019) and as a member of the Board and Audit Committee and Chairman of the Nominating and Corporate Governance Committee of Universal Forest Products, Inc. (manufacturer and distributor of wood and wood-alternative products, 2004-2016). Mr. Murray also serves as a member of the Board of many community and professional organizations. Mr. Murray previously served as a member of the Advisory Board of certain Fidelity® funds (2016).
+ The information includes the Trustee's principal occupation during the last five years and other information relating to the experience, attributes, and skills relevant to the Trustee's qualifications to serve as a Trustee, which led to the conclusion that the Trustee should serve as a Trustee for the fund.
Advisory Board Members and Officers:
Correspondence intended for an officer may be sent to Fidelity Investments, 245 Summer Street, Boston, Massachusetts 02210. Officers appear below in alphabetical order.
Name, Year of Birth; Principal Occupation
Laura M. Bishop (1961)
Year of Election or Appointment: 2022
Member of the Advisory Board
Ms. Bishop also serves as a Member of the Advisory Board of other funds. Prior to her retirement, Ms. Bishop held a variety of positions at United Services Automobile Association (2001-2020), including Executive Vice President and Chief Financial Officer (2014-2020) and Senior Vice President and Deputy Chief Financial Officer (2012-2014). Ms. Bishop currently serves as a member of the Audit Committee and Compensation and Personnel Committee (2021-present) of the Board of Directors of Korn Ferry (global organizational consulting).
Robert W. Helm (1957)
Year of Election or Appointment: 2021
Member of the Advisory Board
Mr. Helm also serves as a Member of the Advisory Board of other Fidelity® funds. Mr. Helm was formerly Deputy Chairman (2003-2020), partner (1991-2020) and an associate (1984-1991) of Dechert LLP (formerly Dechert Price & Rhoads). Mr. Helm currently serves on boards and committees of several not-for-profit organizations.
Craig S. Brown (1977)
Year of Election or Appointment: 2019
Assistant Treasurer
Mr. Brown also serves as an officer of other funds. Mr. Brown serves as Assistant Treasurer of FIMM, LLC (2021-present) and is an employee of Fidelity Investments (2013-present).
John J. Burke III (1964)
Year of Election or Appointment: 2018
Chief Financial Officer
Mr. Burke also serves as Chief Financial Officer of other funds. Mr. Burke serves as Head of Investment Operations for Fidelity Fund and Investment Operations (2018-present) and is an employee of Fidelity Investments (1998-present). Previously Mr. Burke served as head of Asset Management Investment Operations (2012-2018).
David J. Carter (1973)
Year of Election or Appointment: 2020
Assistant Secretary
Mr. Carter also serves as Assistant Secretary of other funds. Mr. Carter serves as Senior Vice President, Deputy General Counsel (2022-present) and is an employee of Fidelity Investments (2005-present).
Jonathan Davis (1968)
Year of Election or Appointment: 2010
Assistant Treasurer
Mr. Davis also serves as an officer of other funds. Mr. Davis serves as Assistant Treasurer of FIMM, LLC (2021-present), FMR Capital, Inc. (2017-present), FD Funds GP LLC (2021-present), FD Funds Holding LLC (2021-present), and FD Funds Management LLC (2021-present); and is an employee of Fidelity Investments. Previously, Mr. Davis served as Vice President and Associate General Counsel of FMR LLC (diversified financial services company, 2003-2010).
Laura M. Del Prato (1964)
Year of Election or Appointment: 2018
President and Treasurer
Ms. Del Prato also serves as an officer of other funds. Ms. Del Prato serves as Assistant Treasurer of FIMM, LLC (2021-present) and is an employee of Fidelity Investments (2017-present). Previously, Ms. Del Prato served as President and Treasurer of The North Carolina Capital Management Trust: Cash Portfolio and Term Portfolio (2018-2020). Prior to joining Fidelity Investments, Ms. Del Prato served as a Managing Director and Treasurer of the JPMorgan Mutual Funds (2014-2017). Prior to JPMorgan, Ms. Del Prato served as a partner at Cohen Fund Audit Services (accounting firm, 2012-2013) and KPMG LLP (accounting firm, 2004-2012).
Colm A. Hogan (1973)
Year of Election or Appointment: 2016
Assistant Treasurer
Mr. Hogan also serves as an officer of other funds. Mr. Hogan serves as Assistant Treasurer of FIMM, LLC (2021-present) and FMR Capital, Inc. (2017-present) and is an employee of Fidelity Investments (2005-present). Previously, Mr. Hogan served as Deputy Treasurer of certain Fidelity® funds (2016-2020) and Assistant Treasurer of certain Fidelity® funds (2016-2018).
Cynthia Lo Bessette (1969)
Year of Election or Appointment: 2019
Secretary and Chief Legal Officer (CLO)
Ms. Lo Bessette also serves as an officer of other funds. Ms. Lo Bessette serves as CLO, Secretary, and Senior Vice President of Fidelity Management & Research Company LLC (investment adviser firm, 2019-present); CLO of Fidelity Management & Research (Hong Kong) Limited, FMR Investment Management (UK) Limited, and Fidelity Management & Research (Japan) Limited (investment adviser firms, 2019-present); Secretary of FD Funds GP LLC (2021-present), FD Funds Holding LLC (2021-present), and FD Funds Management LLC (2021-present); and Assistant Secretary of FIMM, LLC (2019-present). She is a Senior Vice President and Deputy General Counsel of FMR LLC (diversified financial services company, 2019-present), and is an employee of Fidelity Investments. Previously, Ms. Lo Bessette served as CLO, Secretary, and Senior Vice President of FMR Co., Inc. (investment adviser firm, 2019); Secretary of Fidelity SelectCo, LLC and Fidelity Investments Money Management, Inc. (investment adviser firms, 2019). Prior to joining Fidelity Investments, Ms. Lo Bessette was Executive Vice President, General Counsel (2016-2019) and Senior Vice President, Deputy General Counsel (2015-2016) of OppenheimerFunds (investment management company) and Deputy Chief Legal Officer (2013-2015) of Jennison Associates LLC (investment adviser firm).
Chris Maher (1972)
Year of Election or Appointment: 2013
Assistant Treasurer
Mr. Maher also serves as an officer of other funds. Mr. Maher serves as Assistant Treasurer of FIMM, LLC (2021-present) and FMR Capital, Inc. (2017-present), and is an employee of Fidelity Investments (2008-present). Previously, Mr. Maher served as Assistant Treasurer of certain funds (2013-2020); Vice President of Asset Management Compliance (2013), Vice President of the Program Management Group of FMR (investment adviser firm, 2010-2013), and Vice President of Valuation Oversight (2008-2010).
Jamie Pagliocco (1964)
Year of Election or Appointment: 2020
Vice President
Mr. Pagliocco also serves as Vice President of other funds. Mr. Pagliocco serves as President of Fixed Income (2020-present), and is an employee of Fidelity Investments (2001-present). Previously, Mr. Pagliocco served as Co-Chief Investment Officer – Bond (2017-2020), Global Head of Bond Trading (2016-2019), and as a portfolio manager.
Kenneth B. Robins (1969)
Year of Election or Appointment: 2020
Chief Compliance Officer
Mr. Robins also serves as an officer of other funds. Mr. Robins serves as Compliance Officer of Fidelity Management & Research Company LLC (investment adviser firm, 2016-present) and is an employee of Fidelity Investments (2004-present). Previously, Mr. Robins served as Compliance Officer of FMR Co., Inc. (investment adviser firm, 2016-2019), as Executive Vice President of Fidelity Investments Money Management, Inc. (investment adviser firm, 2013-2016) and served in other fund officer roles.
Brett Segaloff (1972)
Year of Election or Appointment: 2021
Anti-Money Laundering (AML) Officer
Mr. Segaloff also serves as an AML Officer of other funds and other related entities. He is Director, Anti-Money Laundering (2007-present) of FMR LLC (diversified financial services company) and is an employee of Fidelity Investments (1996-present).
Stacie M. Smith (1974)
Year of Election or Appointment: 2013
Assistant Treasurer
Ms. Smith also serves as an officer of other funds. Ms. Smith serves as Assistant Treasurer of FIMM, LLC (2021-present) and FMR Capital, Inc. (2017-present), is an employee of Fidelity Investments (2009-present), and has served in other fund officer roles. Prior to joining Fidelity Investments, Ms. Smith served as Senior Audit Manager of Ernst & Young LLP (accounting firm, 1996-2009). Previously, Ms. Smith served as Assistant Treasurer (2013-2019) and Deputy Treasurer (2013-2016) of certain Fidelity® funds.
Jim Wegmann (1979)
Year of Election or Appointment: 2021
Deputy Treasurer
Mr. Wegmann also serves as an officer of other funds. Mr. Wegmann serves as Assistant Treasurer of FIMM, LLC (2021-present) and is an employee of Fidelity Investments (2011-present). Previously, Mr. Wegmann served as Assistant Treasurer of certain Fidelity® funds (2019-2021).
Shareholder Expense Example
As a shareholder, you incur two types of costs: (1) transaction costs, which may include sales charges (loads) on purchase payments or redemption proceeds, as applicable and (2) ongoing costs, which generally include management fees, distribution and/or service (12b-1) fees and other Fund expenses. This Example is intended to help you understand your ongoing costs (in dollars) of investing in a fund and to compare these costs with the ongoing costs of investing in other mutual funds.
The Example is based on an investment of $1,000 invested at the beginning of the period and held for the entire period (March 1, 2022 to August 31, 2022).
Actual Expenses
The first line of the accompanying table provides information about actual account values and actual expenses. You may use the information in this line, together with the amount you invested, to estimate the expenses that you paid over the period. Simply divide your account value by $1,000.00 (for example, an $8,600 account value divided by $1,000.00 = 8.6), then multiply the result by the number in the first line for a class/Fund under the heading entitled "Expenses Paid During Period" to estimate the expenses you paid on your account during this period. If any fund is a shareholder of any underlying mutual funds or exchange-traded funds (ETFs) (the Underlying Funds), such fund indirectly bears its proportional share of the expenses of the Underlying Funds in addition to the direct expenses incurred presented in the table. These fees and expenses are not included in the annualized expense ratio used to calculate the expense estimate in the table below.
Hypothetical Example for Comparison Purposes
The second line of the accompanying table provides information about hypothetical account values and hypothetical expenses based on the actual expense ratio and an assumed rate of return of 5% per year before expenses, which is not the actual return. The hypothetical account values and expenses may not be used to estimate the actual ending account balance or expenses you paid for the period. You may use this information to compare the ongoing costs of investing in the Fund and other funds. To do so, compare this 5% hypothetical example with the 5% hypothetical examples that appear in the shareholder reports of the other funds. If any fund is a shareholder of any Underlying Funds, such fund indirectly bears its proportional share of the expenses of the Underlying Funds in addition to the direct expenses as presented in the table. These fees and expenses are not included in the annualized expense ratio used to calculate the expense estimate in the table below.
Please note that the expenses shown in the table are meant to highlight your ongoing costs only and do not reflect any transaction costs. Therefore, the second line of the table is useful in comparing ongoing costs only, and will not help you determine the relative total costs of owning different funds. In addition, if these transactional costs were included, your costs would have been higher.
| | Annualized Expense Ratio-A | Beginning
Account Value
March 1, 2022 | Ending
Account Value
August 31, 2022 | Expenses Paid
During Period-B
March 1, 2022
to August 31, 2022 |
| Fidelity Series Government Bond Index Fund | - %-C | | | |
| Actual | | $1,000.00 | $924.70 | $--D |
| Hypothetical-E | | $1,000.00 | $1,025.21 | $--D |
A Annualized expense ratio reflects expenses net of applicable fee waivers.
B Expenses are equal to the annualized expense ratio, multiplied by the average account value over the period, multiplied by 184/ 365 (to reflect the one-half year period). The fees and expenses of any Underlying Funds are not included in each annualized expense ratio.
C Amount represents less than .005%.
D Amount represents less than $.005.
E 5% return per year before expenses
Distributions (Unaudited)
The dividend and capital gains distributions for the fund(s) are available on Fidelity.com or Institutional.Fidelity.com.
A total of 97.79% of the dividends distributed during the fiscal year was derived from interest on U.S. Government securities which is generally exempt from state income tax.
The fund designates $4,997,429 of distributions paid in the calendar year 2021 as qualifying to be taxed as section 163(j) interest dividends.
The fund will notify shareholders in January 2023 of amounts for use in preparing 2022 income tax returns.
XGB-ANN-1022
1.9891225.104
Fidelity® Environmental Bond Fund
Annual Report
August 31, 2022
Includes Fidelity and Fidelity Advisor share classes
Contents
To view a fund's proxy voting guidelines and proxy voting record for the 12-month period ended June 30, visit http://www.fidelity.com/proxyvotingresults or visit the Securities and Exchange Commission's (SEC) web site at http://www.sec.gov.
You may also call 1-800-544-8544 if you’re an individual investing directly with Fidelity, call 1-800-835-5092 if you’re a plan sponsor or participant with Fidelity as your recordkeeper or call 1-877-208-0098 on institutional accounts or if you’re an advisor or invest through one to request a free copy of the proxy voting guidelines.
Standard & Poor's, S&P and S&P 500 are registered service marks of The McGraw-Hill Companies, Inc. and have been licensed for use by Fidelity Distributors Corporation.
Other third-party marks appearing herein are the property of their respective owners.
All other marks appearing herein are registered or unregistered trademarks or service marks of FMR LLC or an affiliated company. © 2022 FMR LLC. All rights reserved.
This report and the financial statements contained herein are submitted for the general information of the shareholders of the Fund. This report is not authorized for distribution to prospective investors in the Fund unless preceded or accompanied by an effective prospectus.
A fund files its complete schedule of portfolio holdings with the SEC for the first and third quarters of each fiscal year on Form N-PORT. Forms N-PORT are available on the SEC’s web site at http://www.sec.gov. A fund's Forms N-PORT may be reviewed and copied at the SEC’s Public Reference Room in Washington, DC. Information regarding the operation of the SEC's Public Reference Room may be obtained by calling 1-800-SEC-0330.
For a complete list of a fund's portfolio holdings, view the most recent holdings listing, semiannual report, or annual report on Fidelity's web site at http://www.fidelity.com, http://www.institutional.fidelity.com, or http://www.401k.com, as applicable.
NOT FDIC INSURED •MAY LOSE VALUE •NO BANK GUARANTEE
Neither the Fund nor Fidelity Distributors Corporation is a bank.
Performance: The Bottom Line
Average annual total return reflects the change in the value of an investment, assuming reinvestment of distributions from dividend income and capital gains (the profits earned upon the sale of securities that have grown in value, if any) and assuming a constant rate of performance each year. The hypothetical investment and the average annual total returns do not reflect the deduction of taxes that a shareholder would pay on fund distributions or the redemption of fund shares. During periods of reimbursement by Fidelity, a fund’s total return will be greater than it would be had the reimbursement not occurred. How a fund did yesterday is no guarantee of how it will do tomorrow.
Average Annual Total Returns
| For the periods ended August 31, 2022 | Past 1 year | Life of fundA |
| Class A (incl. 4.00% sales charge) | (16.28)% | (12.86)% |
| Class M (incl. 4.00% sales charge) | (16.27)% | (12.85)% |
| Class C (incl. contingent deferred sales charge) | (14.28)% | (10.56)% |
| Fidelity® Environmental Bond Fund | (12.60)% | (9.67)% |
| Class I | (12.58)% | (9.65)% |
| Class Z | (12.52)% | (9.59)% |
A From June 15, 2021
Class C shares' contingent deferred sales charges included in the past one year and life of fund total return figures are 1% and 0%, respectively.
$10,000 Over Life of Fund
Let's say hypothetically that $10,000 was invested in Fidelity® Environmental Bond Fund, a class of the fund, on June 15, 2021, when the fund started.
The chart shows how the value of your investment would have changed, and also shows how the Bloomberg U.S. Aggregate Bond Index performed over the same period.
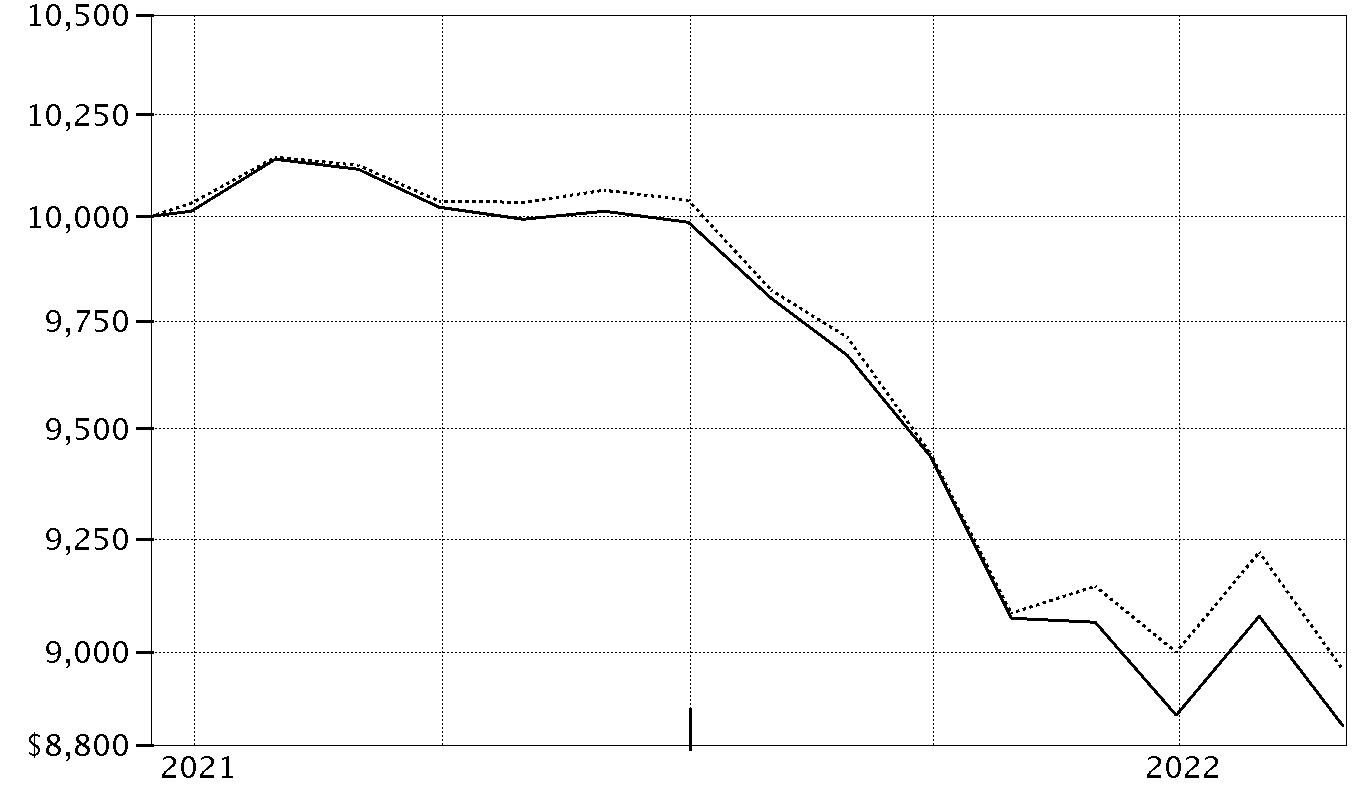
| Period Ending Values |
| $8,841 | Fidelity® Environmental Bond Fund |
| $8,960 | Bloomberg U.S. Aggregate Bond Index |
Management's Discussion of Fund Performance
Market Recap: U.S. taxable investment-grade bonds notably declined for the 12 months ending August 31, 2022, as the U.S. Federal Reserve took aggressive action to stymie high inflation. The Bloomberg U.S. Aggregate Bond Index returned -11.52% for the period. In late 2021, bond yields rose when the Fed pivoted from an “easy” to a “tight” monetary stance. Its first step was to cease its purchases of bonds, part of a quantitative easing program to support the U.S. economy that began in 2008. In the first half of 2022, the Fed took more aggressive steps to thwart inflation. The central bank raised the federal funds target rate by 25 basis points (0.25%) in mid-March, 50 basis points in May and 75 basis points in June – its largest increase since 1994 – and said it was becoming more difficult to achieve a soft landing, in which the economy slows enough to bring down inflation while avoiding a recession. It also began to allow up to billions in Treasuries and mortgage bonds to mature every month without investing the proceeds. Despite another rate hike of 75 basis points in July, the index rose 2.44% for the month, only to reverse course (-2.83%) in August, when the Fed dashed hopes that it would soon “pivot” to an easier policy stance. For the full 12 months, shorter-term securities outpaced longer-term bonds, and higher-quality issues held up better than lower-rated bonds. Within the index, corporate bonds posted a return of -14.61%, trailing the -10.80% result for U.S. Treasuries. Outside the index, U.S. corporate high-yield bonds returned -10.43%, while U.S. Treasury Inflation-Protected Securities had a return of -5.98%.
Comments from Co-Portfolio Manager John Houston: For the fiscal year ending August 31, 2022, the fund’s share classes (excluding sales charges, if applicable) posted returns in the range of -13% to -12.5%, net of fees, lagging the -11.85% result of the supplemental index, the Bloomberg MSCI Global Green Bond USD Index, as well as the -11.52% result of the primary benchmark, the Bloomberg U.S. Aggregate Bond Index. In managing the fund the past 12 months, the portfolio management team attempted to exploit market inefficiencies and identify attractively valued environmental securities, in accordance with its longer-term strategy. Versus the supplemental index, security selection among financials detracted. Specifically, certain European property and banking holdings, including Allied Irish Bank (AIB), the Bank of Ireland and Dutch property company CTP, hurt the relative result, as they underperformed in the wake of Russia’s invasion of Ukraine. Underweighting utilities, one of the best-performing industry sectors this period that compromises roughly 20% of the supplemental index, also hampered relative performance. Underweighting index component Berkshire Hathaway Energy, the company’s utility subsidiary, was the biggest individual relative detractor. Conversely, yield-curve positioning contributed, specifically timely underweighting certain shorter-term bonds that were disproportionately hurt by the U.S. Federal Reserve’s actions to push short-term policy interest rates higher. The team also added value by overweighting U.S. Treasuries, which outpaced riskier segments of the bond market. Underweighting Chinese property developers and bonds from Chile also boosted the relative result. Our purchases of “green” mortgage-backed securities issued by U.S. government agencies notably contributed as well.
The views expressed above reflect those of the portfolio manager(s) only through the end of the period as stated on the cover of this report and do not necessarily represent the views of Fidelity or any other person in the Fidelity organization. Any such views are subject to change at any time based upon market or other conditions and Fidelity disclaims any responsibility to update such views. These views may not be relied on as investment advice and, because investment decisions for a Fidelity fund are based on numerous factors, may not be relied on as an indication of trading intent on behalf of any Fidelity fund.
Investment Summary (Unaudited)
Quality Diversification (% of fund's net assets)
| As of August 31, 2022 |
| | U.S. Government and U.S. Government Agency Obligations | 45.6% |
| | AAA | 0.1% |
| | AA | 3.2% |
| | A | 12.0% |
| | BBB | 20.3% |
| | BB and Below | 6.8% |
| | Not Rated | 3.3% |
| | Short-Term Investments and Net Other Assets | 8.7% |
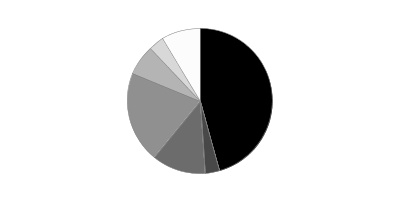
We have used ratings from Moody's Investors Service, Inc. Where Moody's® ratings are not available, we have used S&P® ratings. All ratings are as of the date indicated and do not reflect subsequent changes.
Asset Allocation (% of fund's net assets)
| As of August 31, 2022* |
| | Corporate Bonds | 39.1% |
| | U.S. Government and U.S. Government Agency Obligations | 45.6% |
| | Asset-Backed Securities | 2.3% |
| | Other Investments | 4.3% |
| | Short-Term Investments and Net Other Assets (Liabilities) | 8.7% |
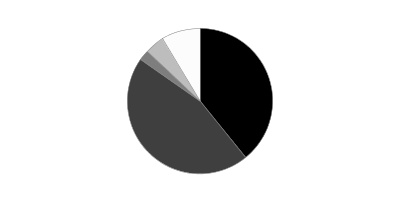
* Foreign investments - 22.1%
Geographic Diversification (% of fund's net assets)
| As of August 31, 2022 |
| | United States of America* | 77.9% |
| | Netherlands | 5.8% |
| | Germany | 3.9% |
| | Canada | 2.4% |
| | United Kingdom | 2.0% |
| | France | 1.5% |
| | Luxembourg | 1.4% |
| | Spain | 1.2% |
| | Ireland | 1.1% |
| | Other | 2.8% |

* Includes Short-Term investments and Net Other Assets (Liabilities).
Percentages are based on country or territory of incorporation and are adjusted for the effect of futures contracts, if applicable.
Schedule of Investments August 31, 2022
Showing Percentage of Net Assets
| Nonconvertible Bonds - 39.1% | | | |
| | | Principal Amount(a) | Value |
| COMMUNICATION SERVICES - 1.9% | | | |
| Diversified Telecommunication Services - 1.9% | | | |
| NTT Finance Corp. 4.372% 7/27/27 (b) | | $100,000 | $100,265 |
| TELUS Corp. 3.4% 5/13/32 | | 200,000 | 177,353 |
| Verizon Communications, Inc. 3.875% 2/8/29 | | 300,000 | 288,742 |
| | | | 566,360 |
| CONSUMER DISCRETIONARY - 4.8% | | | |
| Auto Components - 1.0% | | | |
| Valeo SA 1% 8/3/28 (Reg. S) | EUR | 200,000 | 157,852 |
| ZF Finance GmbH 2% 5/6/27 (Reg. S) | EUR | 200,000 | 159,959 |
| | | | 317,811 |
| Automobiles - 3.2% | | | |
| Ford Motor Co.: | | | |
| 3.25% 2/12/32 | | 500,000 | 391,460 |
| 6.1% 8/19/32 | | 200,000 | 194,752 |
| General Motors Co.: | | | |
| 5.4% 10/15/29 | | 200,000 | 195,128 |
| 5.6% 10/15/32 | | 200,000 | 191,463 |
| | | | 972,803 |
| Household Durables - 0.3% | | | |
| The Berkeley Group PLC 2.5% 8/11/31 (Reg. S) | GBP | 100,000 | 81,281 |
| Textiles, Apparel & Luxury Goods - 0.3% | | | |
| AXA Logistics Europe Master SCA 0.375% 11/15/26 (Reg. S) | EUR | 100,000 | 87,671 |
|
| TOTAL CONSUMER DISCRETIONARY | | | 1,459,566 |
|
| CONSUMER STAPLES - 2.9% | | | |
| Beverages - 0.3% | | | |
| PepsiCo, Inc. 3.9% 7/18/32 | | 100,000 | 97,995 |
| Food & Staples Retailing - 0.8% | | | |
| Walmart, Inc. 1.8% 9/22/31 | | 300,000 | 252,237 |
| Food Products - 1.8% | | | |
| General Mills, Inc. 2.25% 10/14/31 | | 650,000 | 537,971 |
|
| TOTAL CONSUMER STAPLES | | | 888,203 |
|
| FINANCIALS - 13.2% | | | |
| Banks - 6.1% | | | |
| ABN AMRO Bank NV 2.47% 12/13/29 (b)(c) | | 200,000 | 167,178 |
| AIB Group PLC 2.875% 5/30/31 (Reg. S) (c) | EUR | 225,000 | 206,777 |
| Bank of Ireland Group PLC 0.375% 5/10/27 (Reg. S) (c) | EUR | 155,000 | 135,753 |
| Bank of Nova Scotia 0.65% 7/31/24 | | 250,000 | 234,136 |
| BNP Paribas SA 0.5% 5/30/28 (Reg. S)(c) | EUR | 100,000 | 86,086 |
| BPCE SA 0.5% 1/14/28 (Reg. S) (c) | EUR | 100,000 | 87,534 |
| CaixaBank SA 1.25% 6/18/31 (Reg. S) (c) | EUR | 100,000 | 86,332 |
| Canadian Imperial Bank of Commerce 0.95% 10/23/25 | | 325,000 | 293,585 |
| Fifth Third Bancorp 1.707% 11/1/27 (c) | | 200,000 | 179,234 |
| ING Groep NV: | | | |
| 0.875% 6/9/32 (Reg. S) (c) | EUR | 100,000 | 84,379 |
| 2.125% 5/23/26 (Reg. S) (c) | EUR | 100,000 | 97,416 |
| NatWest Group PLC 2.057% 11/9/28 (Reg. S) (c) | GBP | 100,000 | 98,278 |
| Wells Fargo & Co. 4.54% 8/15/26 (c) | | 100,000 | 99,322 |
| | | | 1,856,010 |
| Capital Markets - 1.5% | | | |
| Deutsche Bank AG 3.25% 5/24/28 (Reg. S) (c) | EUR | 100,000 | 93,660 |
| S&P Global, Inc. 2.7% 3/1/29 (b) | | 400,000 | 363,971 |
| | | | 457,631 |
| Diversified Financial Services - 2.5% | | | |
| Acciona Energia Financiacion Filiales SA 0.375% 10/7/27 (Reg. S) | EUR | 100,000 | 87,161 |
| ACEF Holding SCA 1.25% 4/26/30 (Reg. S) | EUR | 100,000 | 78,288 |
| CBRE Global Investors Pan European Core Fund 0.9% 10/12/29 (Reg. S) | EUR | 100,000 | 80,728 |
| Hitachi Finance (UK) PLC 0% 10/29/24 (Reg. S) | EUR | 100,000 | 92,904 |
| Rexford Industrial Realty LP 2.15% 9/1/31 | | 314,000 | 250,459 |
| VMED O2 UK Financing I PLC 4.75% 7/15/31 (b) | | 200,000 | 164,625 |
| | | | 754,165 |
| Insurance - 3.1% | | | |
| Metropolitan Life Global Funding I 0.95% 7/2/25 (b) | | 250,000 | 228,198 |
| Muenchener Rueckversicherungs-Gesellschaft AG in Muenchen 5.875% 5/23/42 (b)(c) | | 200,000 | 206,000 |
| Pacific Life Global Funding II 1.375% 4/14/26 (b) | | 250,000 | 224,966 |
| Prudential Financial, Inc. 1.5% 3/10/26 | | 325,000 | 297,580 |
| | | | 956,744 |
|
| TOTAL FINANCIALS | | | 4,024,550 |
|
| HEALTH CARE - 1.0% | | | |
| Health Care Providers & Services - 0.1% | | | |
| Kaiser Foundation Hospitals 3.15% 5/1/27 | | 50,000 | 48,246 |
| Pharmaceuticals - 0.9% | | | |
| Merck & Co., Inc. 1.9% 12/10/28 | | 300,000 | 264,669 |
|
| TOTAL HEALTH CARE | | | 312,915 |
|
| INDUSTRIALS - 0.3% | | | |
| Transportation Infrastructure - 0.3% | | | |
| Holding d'Infrastructures et des Metiers de l'Environnement 0.125% 9/16/25 (Reg. S) | EUR | 100,000 | 89,420 |
| INFORMATION TECHNOLOGY - 4.0% | | | |
| Semiconductors & Semiconductor Equipment - 3.2% | | | |
| Analog Devices, Inc. 1.7% 10/1/28 | | 500,000 | 437,572 |
| ASML Holding NV 2.25% 5/17/32 (Reg. S) | EUR | 100,000 | 95,647 |
| Micron Technology, Inc. 2.703% 4/15/32 | | 200,000 | 155,452 |
| NXP BV/NXP Funding LLC/NXP U.S.A., Inc.: | | | |
| 2.5% 5/11/31 | | 100,000 | 80,325 |
| 5% 1/15/33 | | 200,000 | 192,397 |
| | | | 961,393 |
| Software - 0.8% | | | |
| Autodesk, Inc. 2.4% 12/15/31 | | 300,000 | 248,184 |
|
| TOTAL INFORMATION TECHNOLOGY | | | 1,209,577 |
|
| MATERIALS - 0.3% | | | |
| Chemicals - 0.3% | | | |
| Evonik Industries AG 1.375% 9/2/81 (Reg. S) (c) | EUR | 100,000 | 78,386 |
| REAL ESTATE - 3.3% | | | |
| Equity Real Estate Investment Trusts (REITs) - 1.8% | | | |
| UDR, Inc. 1.9% 3/15/33 | | 375,000 | 280,289 |
| WP Carey, Inc. 2.45% 2/1/32 | | 350,000 | 278,678 |
| | | | 558,967 |
| Real Estate Management & Development - 1.5% | | | |
| Blackstone Property Partners Europe LP 1.625% 4/20/30 (Reg. S) | EUR | 100,000 | 77,670 |
| CTP BV 0.5% 6/21/25 (Reg. S) | EUR | 200,000 | 176,517 |
| Lend Lease Finance Ltd. 3.4% 10/27/27 (Reg. S) | AUD | 50,000 | 30,735 |
| NE Property BV 2% 1/20/30 (Reg. S) | EUR | 100,000 | 73,487 |
| P3 Group SARL 0.875% 1/26/26 (Reg. S) | EUR | 100,000 | 86,941 |
| | | | 445,350 |
|
| TOTAL REAL ESTATE | | | 1,004,317 |
|
| UTILITIES - 7.4% | | | |
| Electric Utilities - 5.3% | | | |
| Clearway Energy Operating LLC 3.75% 1/15/32 (b) | | 100,000 | 83,154 |
| EnBW Energie Baden-Wuerttemberg AG 1.875% 6/29/80 (Reg. S) (c) | EUR | 200,000 | 173,605 |
| ENEL Finance International NV 1.375% 7/12/26 (b) | | 600,000 | 522,705 |
| Energias de Portugal SA 1.7% 7/20/80 (Reg. S) (c) | EUR | 200,000 | 180,137 |
| Northern States Power Co. 2.25% 4/1/31 | | 300,000 | 259,865 |
| Public Service Co. of Colorado: | | | |
| 2.7% 1/15/51 | | 100,000 | 70,881 |
| 3.7% 6/15/28 | | 325,000 | 315,147 |
| | | | 1,605,494 |
| Independent Power and Renewable Electricity Producers - 1.7% | | | |
| Atlantica Sustainable Infrastructure PLC 4.125% 6/15/28 (b) | | 200,000 | 179,000 |
| RWE AG 2.125% 5/24/26 (Reg. S) | EUR | 100,000 | 97,031 |
| The AES Corp. 2.45% 1/15/31 | | 200,000 | 164,797 |
| Vestas Wind Systems Finance BV 1.5% 6/15/29 (Reg. S) | EUR | 100,000 | 91,054 |
| | | | 531,882 |
| Multi-Utilities - 0.4% | | | |
| Consolidated Edison Co. of New York, Inc. 3.35% 4/1/30 | | 125,000 | 117,355 |
|
| TOTAL UTILITIES | | | 2,254,731 |
|
| TOTAL NONCONVERTIBLE BONDS | | | |
| (Cost $13,701,879) | | | 11,888,025 |
|
| U.S. Government and Government Agency Obligations - 36.9% | | | |
| U.S. Government Agency Obligations - 0.6% | | | |
| Tennessee Valley Authority 1.5% 9/15/31 | | 200,000 | 167,456 |
| U.S. Treasury Obligations - 36.3% | | | |
| U.S. Treasury Bills, yield at date of purchase 2.2% 9/27/22 | | 1,000,000 | 998,359 |
| U.S. Treasury Bonds: | | | |
| 1.875% 11/15/51 | | $750,000 | $546,152 |
| 2% 11/15/41 (d) | | 2,970,000 | 2,307,087 |
| 2.25% 2/15/52 | | 170,000 | 135,788 |
| 2.875% 5/15/52 | | 1,780,000 | 1,640,381 |
| 3% 8/15/52 | | 150,000 | 142,195 |
| U.S. Treasury Notes: | | | |
| 0.25% 6/15/24 (d) | | 150,000 | 141,662 |
| 2.75% 8/15/32 | | 183,000 | 176,538 |
| 2.875% 5/15/32 | | 350,000 | 341,141 |
| 3% 7/15/25 | | 1,625,000 | 1,603,291 |
| 3.125% 8/31/27 | | 250,000 | 247,773 |
| 3.25% 6/30/27 | | 2,770,000 | 2,756,798 |
|
| TOTAL U.S. TREASURY OBLIGATIONS | | | 11,037,165 |
|
| TOTAL U.S. GOVERNMENT AND GOVERNMENT AGENCY OBLIGATIONS | | | |
| (Cost $12,098,664) | | | 11,204,621 |
|
| U.S. Government Agency - Mortgage Securities - 10.9% | | | |
| Fannie Mae - 4.3% | | | |
| 2% 6/1/36 to 11/1/41 | | 404,350 | 364,042 |
| 3% 1/1/52 | | 1,000,001 | 927,159 |
|
| TOTAL FANNIE MAE | | | 1,291,201 |
|
| Freddie Mac - 6.6% | | | |
| 2% 4/1/51 to 1/1/52 | | 566,816 | 488,769 |
| 2.5% 2/1/52 to 3/1/52 | | 1,377,921 | 1,233,030 |
| 1.5% 12/1/31 | | 321,288 | 296,530 |
|
| TOTAL FREDDIE MAC | | | 2,018,329 |
|
| TOTAL U.S. GOVERNMENT AGENCY - MORTGAGE SECURITIES | | | |
| (Cost $3,526,168) | | | 3,309,530 |
|
| Asset-Backed Securities - 2.3% | | | |
| GoodLeap Sustainable Home Solutions Trust Series 2021-5CS Class A, 2.31% 10/20/48 (b) | | $355,405 | $305,078 |
| Sunnova Helios Viii Issuer LLC Series 2022-A Class A, 2.79% 2/22/49 (b) | | 239,358 | 218,803 |
| Sunrun Callisto Issuer, LLC Series 2021-2A Class A, 2.27% 1/30/57 (b) | | 192,921 | 162,359 |
| Tesla Series 2020-A Class A3, 0.68% 12/20/23 (b) | | 31,106 | 30,779 |
| TOTAL ASSET-BACKED SECURITIES | | | |
| (Cost $815,577) | | | 717,019 |
|
| Commercial Mortgage Securities - 1.1% | | | |
| Freddie Mac sequential payer: | | | |
| Series 2020-KG03 Class A2, 1.297% 6/25/30 | | 160,000 | 133,816 |
| Series 2022-KG07 Class A2, 3.123% 8/25/32 | | 200,000 | 188,694 |
| TOTAL COMMERCIAL MORTGAGE SECURITIES | | | |
| (Cost $352,215) | | | 322,510 |
|
| Foreign Government and Government Agency Obligations - 1.2% | | | |
German Federal Republic 0% 8/15/31
(Cost $375,375)(d) | EUR | 401,000 | 354,140 |
|
| Preferred Securities - 3.1% | | | |
| COMMUNICATION SERVICES - 0.6% | | | |
| Diversified Telecommunication Services - 0.6% | | | |
| Telefonica Europe BV 2.502% (Reg. S) (c)(e) | EUR | 200,000 | 169,111 |
| FINANCIALS - 0.6% | | | |
| Banks - 0.6% | | | |
| Banco Bilbao Vizcaya Argentaria SA 6% (Reg. S) (c)(e) | EUR | 200,000 | 190,018 |
| REAL ESTATE - 0.3% | | | |
| Real Estate Management & Development - 0.3% | | | |
| Citycon Oyj 4.496% (Reg. S) (c)(e) | EUR | 100,000 | 76,824 |
| UTILITIES - 1.6% | | | |
| Electric Utilities - 1.6% | | | |
| Iberdrola International BV 3.25% (Reg. S) (c)(e) | EUR | 200,000 | 197,364 |
| ORSTED A/S 2.25% (Reg. S) (c)(e) | EUR | 100,000 | 98,816 |
| TenneT Holding BV 2.995% (Reg. S) (c)(e) | EUR | 125,000 | 123,417 |
| Terna - Rete Elettrica Nazionale 2.375% (Reg. S) (c)(e) | EUR | 100,000 | 80,097 |
| | | | 499,694 |
| TOTAL PREFERRED SECURITIES | | | |
| (Cost $1,279,025) | | | 935,647 |
| | | Shares | Value |
|
| Money Market Funds - 5.9% | | | |
| Fidelity Cash Central Fund 2.33% (f) | | | |
| (Cost $1,783,992) | | 1,783,635 | 1,783,992 |
| TOTAL INVESTMENT IN SECURITIES - 100.5% | | | |
| (Cost $33,932,895) | | | 30,515,484 |
| NET OTHER ASSETS (LIABILITIES) - (0.5)% | | | (138,002) |
| NET ASSETS - 100% | | | $30,377,482 |
| Futures Contracts | | | | | |
| | Number of contracts | Expiration Date | Notional Amount | Value | Unrealized Appreciation/(Depreciation) |
| Sold | | | | | |
| Bond Index Contracts | | | | | |
| Eurex Euro-Bobl Contracts (Germany) | 17 | Sept. 2022 | $2,102,717 | $36,343 | $36,343 |
| Eurex Euro-Bund Contracts (Germany) | 3 | Sept. 2022 | 446,107 | 12,487 | 12,487 |
| Eurex Euro-Schatz Contracts (Germany) | 15 | Sept. 2022 | 1,637,214 | (6,307) | (6,307) |
| TOTAL FUTURES CONTRACTS | | | | | $42,523 |
The notional amount of futures sold as a percentage of Net Assets is 13.8%
For the period, the average monthly notional amount at value for futures contracts in the aggregate was $6,672,406.
| Forward Foreign Currency Contracts | | | | | | |
| Currency Purchased | Currency Sold | Counterparty | Settlement Date | Unrealized Appreciation/(Depreciation) |
| EUR | 53,000 | USD | 53,290 | JPMorgan Chase Bank, N.A. | 9/2/22 | $(28) |
| EUR | 6,000 | USD | 6,142 | BNP Paribas S.A. | 9/15/22 | (107) |
| EUR | 4,000 | USD | 4,073 | BNP Paribas S.A. | 9/15/22 | (50) |
| EUR | 28,000 | USD | 28,050 | BNP Paribas S.A. | 9/15/22 | 114 |
| EUR | 23,000 | USD | 22,970 | Canadian Imperial Bk. of Comm. | 9/15/22 | 164 |
| EUR | 10,000 | USD | 10,055 | Goldman Sachs Bank USA | 9/15/22 | 3 |
| EUR | 3,000 | USD | 3,045 | JPMorgan Chase Bank, N.A. | 9/15/22 | (28) |
| EUR | 29,000 | USD | 28,947 | JPMorgan Chase Bank, N.A. | 9/15/22 | 222 |
| EUR | 13,000 | USD | 12,950 | JPMorgan Chase Bank, N.A. | 9/15/22 | 126 |
| EUR | 27,000 | USD | 27,392 | State Street Bank and Trust Co | 9/15/22 | (234) |
| GBP | 3,000 | USD | 3,543 | Brown Brothers Harriman & Co | 9/15/22 | (57) |
| GBP | 2,000 | USD | 2,401 | Citibank, N. A. | 9/15/22 | (77) |
| GBP | 2,000 | USD | 2,410 | Goldman Sachs Bank USA | 9/15/22 | (86) |
| GBP | 3,000 | USD | 3,553 | JPMorgan Chase Bank, N.A. | 9/15/22 | (67) |
| USD | 32,594 | AUD | 47,000 | BNP Paribas S.A. | 9/15/22 | 427 |
| USD | 4,335,337 | EUR | 4,237,000 | BNP Paribas S.A. | 9/15/22 | 73,609 |
| USD | 3,111 | EUR | 3,000 | BNP Paribas S.A. | 9/15/22 | 93 |
| USD | 11,086 | EUR | 11,000 | Bank of America, N.A. | 9/15/22 | 22 |
| USD | 8,197 | EUR | 8,000 | Citibank, N. A. | 9/15/22 | 150 |
| USD | 37,234 | EUR | 37,000 | JPMorgan Chase Bank, N.A. | 9/15/22 | 18 |
| USD | 16,331 | EUR | 16,000 | State Street Bank and Trust Co | 9/15/22 | 237 |
| USD | 227,495 | GBP | 186,000 | Goldman Sachs Bank USA | 9/15/22 | 11,364 |
| TOTAL FORWARD FOREIGN CURRENCY CONTRACTS | | | | | | $85,815 |
| | | | | | Unrealized Appreciation | 86,549 |
| | | | | | Unrealized Depreciation | (734) |
For the period, the average contract value for forward foreign currency contracts was $14,011,205. Contract value represents contract amount in United States dollars plus or minus unrealized appreciation or depreciation, respectively
Currency Abbreviations
EUR – European Monetary Unit
GBP – British pound sterling
AUD – Australian dollar
USD – United States dollar
Legend
(a) Amount is stated in United States dollars unless otherwise noted.
(b) Security exempt from registration under Rule 144A of the Securities Act of 1933. These securities may be resold in transactions exempt from registration, normally to qualified institutional buyers. At the end of the period, the value of these securities amounted to $2,957,081 or 9.7% of net assets.
(c) Coupon rates for floating and adjustable rate securities reflect the rates in effect at period end.
(d) Security or a portion of the security was pledged to cover margin requirements for futures contracts. At period end, the value of securities pledged amounted to $112,735.
(e) Security is perpetual in nature with no stated maturity date.
(f) Affiliated fund that is generally available only to investment companies and other accounts managed by Fidelity Investments. The rate quoted is the annualized seven-day yield of the fund at period end. A complete unaudited listing of the fund's holdings as of its most recent quarter end is available upon request. In addition, each Fidelity Central Fund's financial statements, which are not covered by the Fund's Report of Independent Registered Public Accounting Firm, are available on the SEC's website or upon request.
Affiliated Central Funds
Fiscal year to date information regarding the Fund's investments in Fidelity Central Funds, including the ownership percentage, is presented below.
| Fund | Value, beginning of period | Purchases | Sales Proceeds | Dividend Income | Realized Gain/Loss | Change in Unrealized appreciation (depreciation) | Value, end of period | % ownership, end of period |
| Fidelity Cash Central Fund 2.33% | $1,205,498 | $149,805,449 | $149,226,955 | $19,166 | $-- | $-- | $1,783,992 | 0.0% |
| Total | $1,205,498 | $149,805,449 | $149,226,955 | $19,166 | $-- | $-- | $1,783,992 | |
Amounts in the income column in the above table include any capital gain distributions from underlying funds, which are presented in the corresponding line-item in the Statement of Operations, if applicable.
Investment Valuation
The following is a summary of the inputs used, as of August 31, 2022, involving the Fund's assets and liabilities carried at fair value. The inputs or methodology used for valuing securities may not be an indication of the risk associated with investing in those securities. For more information on valuation inputs, and their aggregation into the levels used below, please refer to the Investment Valuation section in the accompanying Notes to Financial Statements.
| | Valuation Inputs at Reporting Date: |
| Description | Total | Level 1 | Level 2 | Level 3 |
| Investments in Securities: | | | | |
| Corporate Bonds | $11,888,025 | $-- | $11,888,025 | $-- |
| U.S. Government and Government Agency Obligations | 11,204,621 | -- | 11,204,621 | -- |
| U.S. Government Agency - Mortgage Securities | 3,309,530 | -- | 3,309,530 | -- |
| Asset-Backed Securities | 717,019 | -- | 717,019 | -- |
| Commercial Mortgage Securities | 322,510 | -- | 322,510 | -- |
| Foreign Government and Government Agency Obligations | 354,140 | -- | 354,140 | -- |
| Preferred Securities | 935,647 | -- | 935,647 | -- |
| Money Market Funds | 1,783,992 | 1,783,992 | -- | -- |
| Total Investments in Securities: | $30,515,484 | $1,783,992 | $28,731,492 | $-- |
| Derivative Instruments: | | | | |
| Assets | | | | |
| Forward Foreign Currency Contracts | $86,549 | $-- | $86,549 | $-- |
| Futures Contracts | 48,830 | 48,830 | -- | -- |
| Total Assets | $135,379 | $48,830 | $86,549 | $-- |
| Liabilities | | | | |
| Forward Foreign Currency Contracts | $(734) | $-- | $(734) | $-- |
| Futures Contracts | (6,307) | (6,307) | -- | -- |
| Total Liabilities | $(7,041) | $(6,307) | $(734) | $-- |
| Total Derivative Instruments: | $128,338 | $42,523 | $85,815 | $-- |
Value of Derivative Instruments
The following table is a summary of the Fund's value of derivative instruments by primary risk exposure as of August 31, 2022. For additional information on derivative instruments, please refer to the Derivative Instruments section in the accompanying Notes to Financial Statements.
| Primary Risk Exposure / Derivative Type | Value |
| | Asset | Liability |
| Foreign Exchange Risk | | |
| Forward Foreign Currency Contracts(a) | $86,549 | $(734) |
| Total Foreign Exchange Risk | 86,549 | (734) |
| Interest Rate Risk | | |
| Futures Contracts(b) | 48,830 | (6,307) |
| Total Interest Rate Risk | 48,830 | (6,307) |
| Total Value of Derivatives | $135,379 | $(7,041) |
(a) Gross value is presented in the Statement of Assets and Liabilities in the unrealized appreciation/depreciation on forward foreign currency contracts line-items.
(b) Reflects gross cumulative appreciation (depreciation) on futures contracts as presented in the Schedule of Investments. In the Statement of Assets and Liabilities, the period end daily variation margin is included in receivable or payable for daily variation margin on futures contracts, and the net cumulative appreciation (depreciation) is included in Total accumulated earnings (loss).
See accompanying notes which are an integral part of the financial statements.
Financial Statements
Statement of Assets and Liabilities
| | | August 31, 2022 |
| Assets | | |
Investment in securities, at value — See accompanying schedule:
Unaffiliated issuers (cost $32,148,903) | $28,731,492 | |
| Fidelity Central Funds (cost $1,783,992) | 1,783,992 | |
| Total Investment in Securities (cost $33,932,895) | | $30,515,484 |
| Cash | | 49,853 |
| Foreign currency held at value (cost $43,577) | | 42,816 |
| Unrealized appreciation on forward foreign currency contracts | | 86,549 |
| Receivable for fund shares sold | | 4,878 |
| Dividends receivable | | 15 |
| Interest receivable | | 152,596 |
| Distributions receivable from Fidelity Central Funds | | 2,976 |
| Receivable for daily variation margin on futures contracts | | 6,908 |
| Receivable from investment adviser for expense reductions | | 447 |
| Total assets | | 30,862,522 |
| Liabilities | | |
| Payable for investments purchased | $442,137 | |
| Unrealized depreciation on forward foreign currency contracts | 734 | |
| Payable for fund shares redeemed | 2,383 | |
| Distributions payable | 28,020 | |
| Accrued management fee | 8,900 | |
| Distribution and service plan fees payable | 944 | |
| Other affiliated payables | 1,922 | |
| Total liabilities | | 485,040 |
| Net Assets | | $30,377,482 |
| Net Assets consist of: | | |
| Paid in capital | | $41,685,764 |
| Total accumulated earnings (loss) | | (11,308,282) |
| Net Assets | | $30,377,482 |
| Net Asset Value and Maximum Offering Price | | |
| Class A: | | |
| Net Asset Value and redemption price per share ($777,714 ÷ 89,288 shares)(a) | | $8.71 |
| Maximum offering price per share (100/96.00 of $8.71) | | $9.07 |
| Class M: | | |
| Net Asset Value and redemption price per share ($736,121 ÷ 84,514 shares)(a) | | $8.71 |
| Maximum offering price per share (100/96.00 of $8.71) | | $9.07 |
| Class C: | | |
| Net Asset Value and offering price per share ($740,586 ÷ 85,107 shares)(a) | | $8.70 |
| Fidelity Environmental Bond Fund: | | |
| Net Asset Value, offering price and redemption price per share ($10,795,909 ÷ 1,239,461 shares) | | $8.71 |
| Class I: | | |
| Net Asset Value, offering price and redemption price per share ($996,442 ÷ 114,495 shares) | | $8.70 |
| Class Z: | | |
| Net Asset Value, offering price and redemption price per share ($16,330,710 ÷ 1,874,975 shares) | | $8.71 |
(a) Redemption price per share is equal to net asset value less any applicable contingent deferred sales charge.
See accompanying notes which are an integral part of the financial statements.
Statement of Operations
| | | Year ended August 31, 2022 |
| Investment Income | | |
| Dividends | | $74,593 |
| Interest | | 1,080,613 |
| Income from Fidelity Central Funds | | 19,166 |
| Total income | | 1,174,372 |
| Expenses | | |
| Management fee | $237,156 | |
| Transfer agent fees | 71,651 | |
| Distribution and service plan fees | 11,746 | |
| Independent trustees' fees and expenses | 191 | |
| Total expenses before reductions | 320,744 | |
| Expense reductions | (15,833) | |
| Total expenses after reductions | | 304,911 |
| Net investment income (loss) | | 869,461 |
| Realized and Unrealized Gain (Loss) | | |
| Net realized gain (loss) on: | | |
| Investment securities: | | |
| Unaffiliated issuers | (10,315,653) | |
| Forward foreign currency contracts | 1,705,367 | |
| Foreign currency transactions | (62,921) | |
| Futures contracts | 603,807 | |
| Total net realized gain (loss) | | (8,069,400) |
| Change in net unrealized appreciation (depreciation) on: | | |
| Investment securities: | | |
| Unaffiliated issuers | (3,441,272) | |
| Forward foreign currency contracts | 75,103 | |
| Assets and liabilities in foreign currencies | (1,957) | |
| Futures contracts | 41,162 | |
| Total change in net unrealized appreciation (depreciation) | | (3,326,964) |
| Net gain (loss) | | (11,396,364) |
| Net increase (decrease) in net assets resulting from operations | | $(10,526,903) |
See accompanying notes which are an integral part of the financial statements.
Statement of Changes in Net Assets
| | Year ended August 31, 2022 | For the period
June 15, 2021 (commencement of operations) through August 31, 2021 |
| Increase (Decrease) in Net Assets | | |
| Operations | | |
| Net investment income (loss) | $869,461 | $12,997 |
| Net realized gain (loss) | (8,069,400) | 58,686 |
| Change in net unrealized appreciation (depreciation) | (3,326,964) | 35,810 |
| Net increase (decrease) in net assets resulting from operations | (10,526,903) | 107,493 |
| Distributions to shareholders | (874,786) | (14,086) |
| Share transactions - net increase (decrease) | 30,072,001 | 11,613,763 |
| Total increase (decrease) in net assets | 18,670,312 | 11,707,170 |
| Net Assets | | |
| Beginning of period | 11,707,170 | – |
| End of period | $30,377,482 | $11,707,170 |
See accompanying notes which are an integral part of the financial statements.
Financial Highlights
Fidelity Environmental Bond Fund Class A
| Years ended August 31, | 2022 | 2021 A |
| Selected Per–Share Data | | |
| Net asset value, beginning of period | $10.10 | $10.00 |
| Income from Investment Operations | | |
| Net investment income (loss)B,C | .101 | .010 |
| Net realized and unrealized gain (loss) | (1.386) | .101 |
| Total from investment operations | (1.285) | .111 |
| Distributions from net investment income | (.100)D | (.011) |
| Distributions from net realized gain | (.005)D | – |
| Total distributions | (.105) | (.011) |
| Net asset value, end of period | $8.71 | $10.10 |
| Total ReturnE,F,G | (12.79)% | 1.11% |
| Ratios to Average Net AssetsC,H,I | | |
| Expenses before reductions | .67% | .65%J |
| Expenses net of fee waivers, if any | .67% | .65%J |
| Expenses net of all reductions | .67% | .65%J |
| Net investment income (loss) | 1.07% | .50%J |
| Supplemental Data | | |
| Net assets, end of period (000 omitted) | $778 | $809 |
| Portfolio turnover rateK | 198% | 12%L |
A For the period June 15, 2021 (commencement of operations) through August 31, 2021.
B Calculated based on average shares outstanding during the period.
C Net investment income (loss) is affected by the timing of the declaration of dividends by any underlying mutual funds or exchange-traded funds (ETFs). Net investment income (loss) of any such underlying funds is not included in the Fund's net investment income (loss) ratio.
D The amount shown reflects reclassifications related to book to tax differences that were made in the year shown.
E Total returns for periods of less than one year are not annualized.
F Total returns would have been lower if certain expenses had not been reduced during the applicable periods shown.
G Total returns do not include the effect of the sales charges.
H Fees and expenses of any underlying mutual funds or exchange-traded funds (ETFs) are not included in the Fund's expense ratio. The Fund indirectly bears its proportionate share of these expenses. For additional expense information related to investments in Fidelity Central Funds, please refer to the "Investments in Fidelity Central Funds" note found in the Notes to Financial Statements section of the most recent Annual or Semi-Annual report.
I Expense ratios reflect operating expenses of the class. Expenses before reductions do not reflect amounts reimbursed, waived, or reduced through arrangements with the investment adviser, brokerage services, or other offset arrangements, if applicable, and do not represent the amount paid by the class during periods when reimbursements, waivers or reductions occur.
J Annualized
K Amount does not include the portfolio activity of any underlying mutual funds or exchange-traded funds (ETFs).
L Amount not annualized.
See accompanying notes which are an integral part of the financial statements.
Fidelity Environmental Bond Fund Class M
| Years ended August 31, | 2022 | 2021 A |
| Selected Per–Share Data | | |
| Net asset value, beginning of period | $10.10 | $10.00 |
| Income from Investment Operations | | |
| Net investment income (loss)B,C | .101 | .010 |
| Net realized and unrealized gain (loss) | (1.386) | .101 |
| Total from investment operations | (1.285) | .111 |
| Distributions from net investment income | (.100)D | (.011) |
| Distributions from net realized gain | (.005)D | – |
| Total distributions | (.105) | (.011) |
| Net asset value, end of period | $8.71 | $10.10 |
| Total ReturnE,F,G | (12.78)% | 1.11% |
| Ratios to Average Net AssetsC,H,I | | |
| Expenses before reductions | .67% | .65%J |
| Expenses net of fee waivers, if any | .67% | .65%J |
| Expenses net of all reductions | .66% | .65%J |
| Net investment income (loss) | 1.07% | .50%J |
| Supplemental Data | | |
| Net assets, end of period (000 omitted) | $736 | $809 |
| Portfolio turnover rateK | 198% | 12%L |
A For the period June 15, 2021 (commencement of operations) through August 31, 2021.
B Calculated based on average shares outstanding during the period.
C Net investment income (loss) is affected by the timing of the declaration of dividends by any underlying mutual funds or exchange-traded funds (ETFs). Net investment income (loss) of any such underlying funds is not included in the Fund's net investment income (loss) ratio.
D The amount shown reflects reclassifications related to book to tax differences that were made in the year shown.
E Total returns for periods of less than one year are not annualized.
F Total returns would have been lower if certain expenses had not been reduced during the applicable periods shown.
G Total returns do not include the effect of the sales charges.
H Fees and expenses of any underlying mutual funds or exchange-traded funds (ETFs) are not included in the Fund's expense ratio. The Fund indirectly bears its proportionate share of these expenses. For additional expense information related to investments in Fidelity Central Funds, please refer to the "Investments in Fidelity Central Funds" note found in the Notes to Financial Statements section of the most recent Annual or Semi-Annual report.
I Expense ratios reflect operating expenses of the class. Expenses before reductions do not reflect amounts reimbursed, waived, or reduced through arrangements with the investment adviser, brokerage services, or other offset arrangements, if applicable, and do not represent the amount paid by the class during periods when reimbursements, waivers or reductions occur.
J Annualized
K Amount does not include the portfolio activity of any underlying mutual funds or exchange-traded funds (ETFs).
L Amount not annualized.
See accompanying notes which are an integral part of the financial statements.
Fidelity Environmental Bond Fund Class C
| Years ended August 31, | 2022 | 2021 A |
| Selected Per–Share Data | | |
| Net asset value, beginning of period | $10.09 | $10.00 |
| Income from Investment Operations | | |
| Net investment income (loss)B,C | .030 | (.005) |
| Net realized and unrealized gain (loss) | (1.382) | .095 |
| Total from investment operations | (1.352) | .090 |
| Distributions from net investment income | (.033)D | –E |
| Distributions from net realized gain | (.005)D | – |
| Total distributions | (.038) | –E |
| Net asset value, end of period | $8.70 | $10.09 |
| Total ReturnF,G,H | (13.42)% | .90% |
| Ratios to Average Net AssetsC,I,J | | |
| Expenses before reductions | 1.42% | 1.39%K |
| Expenses net of fee waivers, if any | 1.42% | 1.39%K |
| Expenses net of all reductions | 1.42% | 1.39%K |
| Net investment income (loss) | .32% | (.25)%K |
| Supplemental Data | | |
| Net assets, end of period (000 omitted) | $741 | $808 |
| Portfolio turnover rateL | 198% | 12%M |
A For the period June 15, 2021 (commencement of operations) through August 31, 2021.
B Calculated based on average shares outstanding during the period.
C Net investment income (loss) is affected by the timing of the declaration of dividends by any underlying mutual funds or exchange-traded funds (ETFs). Net investment income (loss) of any such underlying funds is not included in the Fund's net investment income (loss) ratio.
D The amount shown reflects reclassifications related to book to tax differences that were made in the year shown.
E Amount represents less than $.0005 per share.
F Total returns for periods of less than one year are not annualized.
G Total returns would have been lower if certain expenses had not been reduced during the applicable periods shown.
H Total returns do not include the effect of the contingent deferred sales charge.
I Fees and expenses of any underlying mutual funds or exchange-traded funds (ETFs) are not included in the Fund's expense ratio. The Fund indirectly bears its proportionate share of these expenses. For additional expense information related to investments in Fidelity Central Funds, please refer to the "Investments in Fidelity Central Funds" note found in the Notes to Financial Statements section of the most recent Annual or Semi-Annual report.
J Expense ratios reflect operating expenses of the class. Expenses before reductions do not reflect amounts reimbursed, waived, or reduced through arrangements with the investment adviser, brokerage services, or other offset arrangements, if applicable, and do not represent the amount paid by the class during periods when reimbursements, waivers or reductions occur.
K Annualized
L Amount does not include the portfolio activity of any underlying mutual funds or exchange-traded funds (ETFs).
M Amount not annualized.
See accompanying notes which are an integral part of the financial statements.
Fidelity Environmental Bond Fund
| Years ended August 31, | 2022 | 2021 A |
| Selected Per–Share Data | | |
| Net asset value, beginning of period | $10.10 | $10.00 |
| Income from Investment Operations | | |
| Net investment income (loss)B,C | .120 | .015 |
| Net realized and unrealized gain (loss) | (1.385) | .101 |
| Total from investment operations | (1.265) | .116 |
| Distributions from net investment income | (.120)D | (.016) |
| Distributions from net realized gain | (.005)D | – |
| Total distributions | (.125) | (.016) |
| Net asset value, end of period | $8.71 | $10.10 |
| Total ReturnE,F | (12.60)% | 1.16% |
| Ratios to Average Net AssetsC,G,H | | |
| Expenses before reductions | .45% | .45%I |
| Expenses net of fee waivers, if any | .45% | .45%I |
| Expenses net of all reductions | .45% | .45%I |
| Net investment income (loss) | 1.29% | .70%I |
| Supplemental Data | | |
| Net assets, end of period (000 omitted) | $10,796 | $7,663 |
| Portfolio turnover rateJ | 198% | 12%K |
A For the period June 15, 2021 (commencement of operations) through August 31, 2021.
B Calculated based on average shares outstanding during the period.
C Net investment income (loss) is affected by the timing of the declaration of dividends by any underlying mutual funds or exchange-traded funds (ETFs). Net investment income (loss) of any such underlying funds is not included in the Fund's net investment income (loss) ratio.
D The amount shown reflects reclassifications related to book to tax differences that were made in the year shown.
E Total returns for periods of less than one year are not annualized.
F Total returns would have been lower if certain expenses had not been reduced during the applicable periods shown.
G Fees and expenses of any underlying mutual funds or exchange-traded funds (ETFs) are not included in the Fund's expense ratio. The Fund indirectly bears its proportionate share of these expenses. For additional expense information related to investments in Fidelity Central Funds, please refer to the "Investments in Fidelity Central Funds" note found in the Notes to Financial Statements section of the most recent Annual or Semi-Annual report.
H Expense ratios reflect operating expenses of the class. Expenses before reductions do not reflect amounts reimbursed, waived, or reduced through arrangements with the investment adviser, brokerage services, or other offset arrangements, if applicable, and do not represent the amount paid by the class during periods when reimbursements, waivers or reductions occur.
I Annualized
J Amount does not include the portfolio activity of any underlying mutual funds or exchange-traded funds (ETFs).
K Amount not annualized.
See accompanying notes which are an integral part of the financial statements.
Fidelity Environmental Bond Fund Class I
| Years ended August 31, | 2022 | 2021 A |
| Selected Per–Share Data | | |
| Net asset value, beginning of period | $10.10 | $10.00 |
| Income from Investment Operations | | |
| Net investment income (loss)B,C | .109 | .016 |
| Net realized and unrealized gain (loss) | (1.372) | .100 |
| Total from investment operations | (1.263) | .116 |
| Distributions from net investment income | (.132)D | (.016) |
| Distributions from net realized gain | (.005)D | – |
| Total distributions | (.137) | (.016) |
| Net asset value, end of period | $8.70 | $10.10 |
| Total ReturnE,F | (12.58)% | 1.16% |
| Ratios to Average Net AssetsC,G,H | | |
| Expenses before reductions | .60% | .40%I |
| Expenses net of fee waivers, if any | .60% | .40%I |
| Expenses net of all reductions | .59% | .40%I |
| Net investment income (loss) | 1.14% | .74%I |
| Supplemental Data | | |
| Net assets, end of period (000 omitted) | $996 | $809 |
| Portfolio turnover rateJ | 198% | 12%K |
A For the period June 15, 2021 (commencement of operations) through August 31, 2021.
B Calculated based on average shares outstanding during the period.
C Net investment income (loss) is affected by the timing of the declaration of dividends by any underlying mutual funds or exchange-traded funds (ETFs). Net investment income (loss) of any such underlying funds is not included in the Fund's net investment income (loss) ratio.
D The amount shown reflects reclassifications related to book to tax differences that were made in the year shown.
E Total returns for periods of less than one year are not annualized.
F Total returns would have been lower if certain expenses had not been reduced during the applicable periods shown.
G Fees and expenses of any underlying mutual funds or exchange-traded funds (ETFs) are not included in the Fund's expense ratio. The Fund indirectly bears its proportionate share of these expenses. For additional expense information related to investments in Fidelity Central Funds, please refer to the "Investments in Fidelity Central Funds" note found in the Notes to Financial Statements section of the most recent Annual or Semi-Annual report.
H Expense ratios reflect operating expenses of the class. Expenses before reductions do not reflect amounts reimbursed, waived, or reduced through arrangements with the investment adviser, brokerage services, or other offset arrangements, if applicable, and do not represent the amount paid by the class during periods when reimbursements, waivers or reductions occur.
I Annualized
J Amount does not include the portfolio activity of any underlying mutual funds or exchange-traded funds (ETFs).
K Amount not annualized.
See accompanying notes which are an integral part of the financial statements.
Fidelity Environmental Bond Fund Class Z
| Years ended August 31, | 2022 | 2021 A |
| Selected Per–Share Data | | |
| Net asset value, beginning of period | $10.10 | $10.00 |
| Income from Investment Operations | | |
| Net investment income (loss)B,C | .130 | .017 |
| Net realized and unrealized gain (loss) | (1.386) | .101 |
| Total from investment operations | (1.256) | .118 |
| Distributions from net investment income | (.129)D | (.018) |
| Distributions from net realized gain | (.005)D | – |
| Total distributions | (.134) | (.018) |
| Net asset value, end of period | $8.71 | $10.10 |
| Total ReturnE,F | (12.52)% | 1.18% |
| Ratios to Average Net AssetsC,G,H | | |
| Expenses before reductions | .40% | .40%I |
| Expenses net of fee waivers, if any | .36% | .36%I |
| Expenses net of all reductions | .36% | .36%I |
| Net investment income (loss) | 1.38% | .78%I |
| Supplemental Data | | |
| Net assets, end of period (000 omitted) | $16,331 | $809 |
| Portfolio turnover rateJ | 198% | 12%K |
A For the period June 15, 2021 (commencement of operations) through August 31, 2021.
B Calculated based on average shares outstanding during the period.
C Net investment income (loss) is affected by the timing of the declaration of dividends by any underlying mutual funds or exchange-traded funds (ETFs). Net investment income (loss) of any such underlying funds is not included in the Fund's net investment income (loss) ratio.
D The amount shown reflects reclassifications related to book to tax differences that were made in the year shown.
E Total returns for periods of less than one year are not annualized.
F Total returns would have been lower if certain expenses had not been reduced during the applicable periods shown.
G Fees and expenses of any underlying mutual funds or exchange-traded funds (ETFs) are not included in the Fund's expense ratio. The Fund indirectly bears its proportionate share of these expenses. For additional expense information related to investments in Fidelity Central Funds, please refer to the "Investments in Fidelity Central Funds" note found in the Notes to Financial Statements section of the most recent Annual or Semi-Annual report.
H Expense ratios reflect operating expenses of the class. Expenses before reductions do not reflect amounts reimbursed, waived, or reduced through arrangements with the investment adviser, brokerage services, or other offset arrangements, if applicable, and do not represent the amount paid by the class during periods when reimbursements, waivers or reductions occur.
I Annualized
J Amount does not include the portfolio activity of any underlying mutual funds or exchange-traded funds (ETFs).
K Amount not annualized.
See accompanying notes which are an integral part of the financial statements.
Notes to Financial Statements
For the period ended August 31, 2022
1. Organization.
Fidelity Environmental Bond Fund (the Fund) is a fund of Fidelity Income Fund (the Trust) and is authorized to issue an unlimited number of shares. The Trust is registered under the Investment Company Act of 1940, as amended (the 1940 Act), as an open-end management investment company organized as a Massachusetts business trust. The Fund offers Class A, Class M, Class C, Fidelity Environmental Bond Fund, Class I and Class Z shares, each of which has equal rights as to assets and voting privileges. Each class has exclusive voting rights with respect to matters that affect that class. Class C shares will automatically convert to Class A shares after a holding period of eight years from the initial date of purchase, with certain exceptions. The Fund normally invests in issuers whose products or services are intended or likely to have a positive environmental impact. Some industries and sectors might be more likely to issue environmental bonds, and events or factors impacting these sectors may have a greater effect on, and may more adversely affect, the Fund than they would a fund that does not invest in issuers with a common purpose. The Fund also will be affected by a decrease in governmental or other support for environmental initiatives. Application of FMR's environmental, social, and governance (ESG) ratings process and/or its sustainable investing exclusion criteria may affect the Fund's exposure to certain issuers, sectors, regions, and countries and may affect the Fund's performance depending on whether certain investments are in or out of favor. The criteria related to the Fund's ESG ratings process and/or adherence to its sustainable investing exclusion criteria may result in the Fund forgoing opportunities to buy certain securities when it might otherwise be advantageous to do so, or selling securities for ESG reasons when it might be otherwise disadvantageous for it to do so. As a result, the Fund's performance may at times be better or worse than the performance of funds that do not use ESG or sustainability criteria. There are significant differences in interpretations of what it means for an issuer to have positive ESG factors. While the investment adviser believes its definitions are reasonable, the portfolio decisions it makes may differ with other investors' or advisers' views.
2. Investments in Fidelity Central Funds.
Funds may invest in Fidelity Central Funds, which are open-end investment companies generally available only to other investment companies and accounts managed by the investment adviser and its affiliates. The Schedule of Investments lists any Fidelity Central Funds held as an investment as of period end, but does not include the underlying holdings of each Fidelity Central Fund. An investing fund indirectly bears its proportionate share of the expenses of the underlying Fidelity Central Funds.
Based on its investment objective, each Fidelity Central Fund may invest or participate in various investment vehicles or strategies that are similar to those of the investing fund. These strategies are consistent with the investment objectives of the investing fund and may involve certain economic risks which may cause a decline in value of each of the Fidelity Central Funds and thus a decline in the value of the investing fund.
| Fidelity Central Fund | Investment Manager | Investment Objective | Investment Practices | Expense Ratio(a) |
| Fidelity Money Market Central Funds | Fidelity Management & Research Company LLC (FMR) | Each fund seeks to obtain a high level of current income consistent with the preservation of capital and liquidity. | Short-term Investments | Less than .005% |
(a) Expenses expressed as a percentage of average net assets and are as of each underlying Central Fund's most recent annual or semi-annual shareholder report.
A complete unaudited list of holdings for each Fidelity Central Fund is available upon request or at the Securities and Exchange Commission website at www.sec.gov. In addition, the financial statements of the Fidelity Central Funds which contain the significant accounting policies (including investment valuation policies) of those funds, and are not covered by the Report of Independent Registered Public Accounting Firm, are available on the Securities and Exchange Commission website or upon request.
3. Significant Accounting Policies.
The Fund is an investment company and applies the accounting and reporting guidance of the Financial Accounting Standards Board (FASB) Accounting Standards Codification Topic 946 Financial Services - Investment Companies. The financial statements have been prepared in conformity with accounting principles generally accepted in the United States of America (GAAP), which require management to make certain estimates and assumptions at the date of the financial statements. Actual results could differ from those estimates. Subsequent events, if any, through the date that the financial statements were issued have been evaluated in the preparation of the financial statements. The Fund's Schedule of Investments lists any underlying mutual funds or exchange-traded funds (ETFs) but does not include the underlying holdings of these funds. The following summarizes the significant accounting policies of the Fund:
Investment Valuation. Investments are valued as of 4:00 p.m. Eastern time on the last calendar day of the period. The Board of Trustees (the Board) has delegated the day to day responsibility for the valuation of the Fund's investments to the Fair Value Committee (the Committee) established by the Fund's investment adviser. In accordance with valuation policies and procedures approved by the Board, the Fund attempts to obtain prices from one or more third party pricing vendors or brokers to value its investments. When current market prices, quotations or currency exchange rates are not readily available or reliable, investments will be fair valued in good faith by the Committee, in accordance with procedures adopted by the Board. Factors used in determining fair value vary by investment type and may include market or investment specific events, changes in interest rates and credit quality. The frequency with which these procedures are used cannot be predicted and they may be utilized to a significant extent. The Committee oversees the Fund's valuation policies and procedures and reports to the Board on the Committee's activities and fair value determinations. The Board monitors the appropriateness of the procedures used in valuing the Fund's investments and ratifies the fair value determinations of the Committee.
The Fund categorizes the inputs to valuation techniques used to value its investments into a disclosure hierarchy consisting of three levels as shown below:
- Level 1 – unadjusted quoted prices in active markets for identical investments
- Level 2 – other significant observable inputs (including quoted prices for similar investments, interest rates, prepayment speeds, etc.)
- Level 3 – unobservable inputs (including the Fund's own assumptions based on the best information available)
Valuation techniques used to value the Fund's investments by major category are as follows:
Debt securities, including restricted securities, are valued based on evaluated prices received from third party pricing vendors or from brokers who make markets in such securities. Corporate bonds, foreign government and government agency obligations, preferred securities and U.S. government and government agency obligations are valued by pricing vendors who utilize matrix pricing which considers yield or price of bonds of comparable quality, coupon, maturity and type or by broker-supplied prices. Asset backed securities, collateralized mortgage obligations, commercial mortgage securities and U.S. government agency mortgage securities are valued by pricing vendors who utilize matrix pricing which considers prepayment speed assumptions, attributes of the collateral, yield or price of bonds of comparable quality, coupon, maturity and type or by broker-supplied prices. When independent prices are unavailable or unreliable, debt securities may be valued utilizing pricing methodologies which consider similar factors that would be used by third party pricing vendors. For foreign debt securities, when significant market or security specific events arise, valuations may be determined in good faith in accordance with procedures adopted by the Board. Debt securities are generally categorized as Level 2 in the hierarchy but may be Level 3 depending on the circumstances.
Equity securities, including restricted securities, for which market quotations are readily available, are valued at the last reported sale price or official closing price as reported by a third party pricing vendor on the primary market or exchange on which they are traded and are categorized as Level 1 in the hierarchy. In the event there were no sales during the day or closing prices are not available, securities are valued at the last quoted bid price or may be valued using the last available price and are generally categorized as Level 2 in the hierarchy. For foreign equity securities, when market or security specific events arise, comparisons to the valuation of American Depositary Receipts (ADRs), futures contracts, ETFs and certain indexes as well as quoted prices for similar securities may be used and would be categorized as Level 2 in the hierarchy. For equity securities, including restricted securities, where observable inputs are limited, assumptions about market activity and risk are used and these securities may be categorized as Level 3 in the hierarchy.
The U.S. dollar value of foreign currency contracts is determined using currency exchange rates supplied by a pricing service and are categorized as Level 2 in the hierarchy. Futures contracts are valued at the settlement price established each day by the board of trade or exchange on which they are traded and are categorized as Level 1 in the hierarchy. Investments in open-end mutual funds, including the Fidelity Central Funds, are valued at their closing net asset value (NAV) each business day and are categorized as Level 1 in the hierarchy.
Changes in valuation techniques may result in transfers in or out of an assigned level within the disclosure hierarchy. The aggregate value of investments by input level as of August 31, 2022 is included at the end of the Fund's Schedule of Investments.
Foreign Currency. Foreign-denominated assets, including investment securities, and liabilities are translated into U.S. dollars at the exchange rates at period end. Purchases and sales of investment securities, income and dividends received, and expenses denominated in foreign currencies are translated into U.S. dollars at the exchange rate in effect on the transaction date.
The effects of exchange rate fluctuations on investments are included with the net realized and unrealized gain (loss) on investment securities. Other foreign currency transactions resulting in realized and unrealized gain (loss) are disclosed separately.
Realized gains and losses on foreign currency transactions arise from the disposition of foreign currency, realized changes in the value of foreign currency between the trade and settlement dates on security transactions, and the difference between the amounts of dividends, interest and foreign withholding taxes recorded on transaction date and the U.S. dollar equivalent of the amounts actually received or paid. Unrealized gains and losses on assets and liabilities in foreign currencies arise from changes in the value of foreign currency, and from assets and liabilities denominated in foreign currencies, other than investments, which are held at period end.
Investment Transactions and Income. For financial reporting purposes, the Fund's investment holdings and NAV include trades executed through the end of the last business day of the period. The NAV per share for processing shareholder transactions is calculated as of the close of business of the New York Stock Exchange (NYSE), normally 4:00 p.m. Eastern time and includes trades executed through the end of the prior business day. Gains and losses on securities sold are determined on the basis of identified cost. Dividend income is recorded on the ex-dividend date. Income and capital gain distributions from Fidelity Central Funds, if any, are recorded on the ex-dividend date. Interest income is accrued as earned and includes coupon interest and amortization of premium and accretion of discount on debt securities as applicable. Investment income is recorded net of foreign taxes withheld where recovery of such taxes is uncertain. Debt obligations may be placed on non-accrual status and related interest income may be reduced by ceasing current accruals and writing off interest receivables when the collection of all or a portion of interest has become doubtful based on consistently applied procedures. A debt obligation is removed from non-accrual status when the issuer resumes interest payments or when collectability of interest is reasonably assured.
Class Allocations and Expenses. Investment income, realized and unrealized capital gains and losses, common expenses of a fund, and certain fund-level expense reductions, if any, are allocated daily on a pro-rata basis to each class based on the relative net assets of each class to the total net assets of a fund. Each class differs with respect to transfer agent and distribution and service plan fees incurred, as applicable. Certain expense reductions may also differ by class, if applicable. For the reporting period, the allocated portion of income and expenses to each class as a percent of its average net assets may vary due to the timing of recording these transactions in relation to fluctuating net assets of the classes. Expenses directly attributable to a fund are charged to that fund. Expenses attributable to more than one fund are allocated among the respective funds on the basis of relative net assets or other appropriate methods. Expenses included in the accompanying financial statements reflect the expenses of that fund and do not include any expenses associated with any underlying mutual funds or exchange-traded funds. Although not included in a fund's expenses, a fund indirectly bears its proportionate share of these expenses through the net asset value of each underlying mutual fund or exchange-traded fund. Expense estimates are accrued in the period to which they relate and adjustments are made when actual amounts are known.
Income Tax Information and Distributions to Shareholders. Each year, the Fund intends to qualify as a regulated investment company under Subchapter M of the Internal Revenue Code, including distributing substantially all of its taxable income and realized gains. As a result, no provision for U.S. Federal income taxes is required. As of August 31, 2022, the Fund did not have any unrecognized tax benefits in the financial statements; nor is the Fund aware of any tax positions for which it is reasonably possible that the total amounts of unrecognized tax benefits will significantly change in the next twelve months. The Fund files a U.S. federal tax return, in addition to state and local tax returns as required. The Fund's federal income tax returns are subject to examination by the Internal Revenue Service (IRS) for a period of three fiscal years after they are filed. State and local tax returns may be subject to examination for an additional fiscal year depending on the jurisdiction. Foreign taxes are provided for based on the Fund's understanding of the tax rules and rates that exist in the foreign markets in which it invests.
Distributions are declared and recorded daily and paid monthly from net investment income. Distributions from realized gains, if any, are declared and recorded on the ex-dividend date. Income and capital gain distributions are declared separately for each class. Income and capital gain distributions are determined in accordance with income tax regulations, which may differ from GAAP. These differences resulted in distribution reclassifications.
Capital accounts within the financial statements are adjusted for permanent book-tax differences. These adjustments have no impact on net assets or the results of operations. Capital accounts are not adjusted for temporary book-tax differences which will reverse in a subsequent period.
Book-tax differences are primarily due to futures contracts, foreign currency transactions, market discount, capital loss carryforwards and losses deferred due to wash sales.
As of period end, the cost and unrealized appreciation (depreciation) in securities, and derivatives if applicable, for federal income tax purposes were as follows:
| Gross unrealized appreciation | $49,289 |
| Gross unrealized depreciation | (3,276,730) |
| Net unrealized appreciation (depreciation) | $(3,227,441) |
| Tax Cost | $34,253,661 |
The tax-based components of distributable earnings as of period end were as follows:
| Undistributed ordinary income | $323,212 |
| Capital loss carryforward | $(8,401,974) |
| Net unrealized appreciation (depreciation) on securities and other investments | $(3,143,707) |
Capital loss carryforwards are only available to offset future capital gains of the Fund to the extent provided by regulations and may be limited. The capital loss carryforward information presented below, including any applicable limitation, is estimated as of fiscal period end and is subject to adjustment.
| Short-term | $(8,304,797) |
| Long-term | (97,177) |
| Total capital loss carryforward | $(8,401,974) |
The tax character of distributions paid was as follows:
| | August 31, 2022 | August 31, 2021(a) |
| Ordinary Income | $874,786 | $ 14,086 |
(a) For the period June 15, 2021 (commencement of operations) through August 31, 2021.
Restricted Securities (including Private Placements). Funds may invest in securities that are subject to legal or contractual restrictions on resale. These securities generally may be resold in transactions exempt from registration or to the public if the securities are registered. Disposal of these securities may involve time-consuming negotiations and expense, and prompt sale at an acceptable price may be difficult. Information regarding restricted securities held at period end is included at the end of the Schedule of Investments, if applicable.
4. Derivative Instruments.
Risk Exposures and the Use of Derivative Instruments. Investment objectives allow a fund to enter into various types of derivative contracts, including futures contracts and forward foreign currency contracts. Derivatives are investments whose value is primarily derived from underlying assets, indices or reference rates and may be transacted on an exchange or over-the-counter (OTC). Derivatives may involve a future commitment to buy or sell a specified asset based on specified terms, to exchange future cash flows at periodic intervals based on a notional principal amount, or for one party to make one or more payments upon the occurrence of specified events in exchange for periodic payments from the other party.
Derivatives were used to increase returns, to facilitate transactions in foreign-denominated securities and to manage exposure to certain risks as defined below. The success of any strategy involving derivatives depends on analysis of numerous economic factors, and if the strategies for investment do not work as intended, the objectives may not be achieved.
Derivatives were used to increase or decrease exposure to the following risk(s):
| Foreign Exchange Risk | Foreign exchange rate risk relates to fluctuations in the value of an asset or liability due to changes in currency exchange rates.
|
| Interest Rate Risk | Interest rate risk relates to the fluctuations in the value of interest-bearing securities due to changes in the prevailing levels of market interest rates. |
Funds are also exposed to additional risks from investing in derivatives, such as liquidity risk and counterparty credit risk. Liquidity risk is the risk that a fund will be unable to close out the derivative in the open market in a timely manner. Counterparty credit risk is the risk that the counterparty will not be able to fulfill its obligation to a fund. Derivative counterparty credit risk is managed through formal evaluation of the creditworthiness of all potential counterparties. On certain OTC derivatives such as forward foreign currency contracts, a fund attempts to reduce its exposure to counterparty credit risk by entering into an International Swaps and Derivatives Association, Inc. (ISDA) Master Agreement with each of its counterparties. The ISDA Master Agreement gives a fund the right to terminate all transactions traded under such agreement upon the deterioration in the credit quality of the counterparty beyond specified levels. The ISDA Master Agreement gives each party the right, upon an event of default by the other party or a termination of the agreement, to close out all transactions traded under such agreement and to net amounts owed under each transaction to one net payable by one party to the other. To mitigate counterparty credit risk on bi-lateral OTC derivatives, a fund receives collateral in the form of cash or securities once net unrealized appreciation on outstanding derivative contracts under an ISDA Master Agreement exceeds certain applicable thresholds, subject to certain minimum transfer provisions. The collateral received is held in segregated accounts with the custodian bank in accordance with the collateral agreements entered into between a fund, the counterparty and the custodian bank. A fund could experience delays and costs in gaining access to the collateral even though it is held by the custodian bank. The maximum risk of loss to a fund from counterparty credit risk related to bi-lateral OTC derivatives is generally the aggregate unrealized appreciation and unpaid counterparty payments in excess of any collateral pledged by the counterparty to a fund. A fund may be required to pledge collateral for the benefit of the counterparties on bi-lateral OTC derivatives in an amount not less than each counterparty's unrealized appreciation on outstanding derivative contracts, subject to certain minimum transfer provisions, and any such pledged collateral is identified in the Schedule of Investments. Exchange-traded contracts are not covered by the ISDA Master Agreement; however counterparty credit risk related to these contracts may be mitigated by the protection provided by the exchange on which they trade.
Investing in derivatives may involve greater risks than investing in the underlying assets directly and, to varying degrees, may involve risk of loss in excess of any initial investment and collateral received and amounts recognized in the Statement of Assets and Liabilities. In addition, there may be the risk that the change in value of the derivative contract does not correspond to the change in value of the underlying instrument.
Net Realized Gain (Loss) and Change in Net Unrealized Appreciation (Depreciation) on Derivatives. The table below, which reflects the impacts of derivatives on the financial performance, summarizes the net realized gain (loss) and change in net unrealized appreciation (depreciation) for derivatives during the period as presented in the Statement of Operations.
| Primary Risk Exposure / Derivative Type | Net Realized Gain (Loss) | Change in Net Unrealized Appreciation (Depreciation) |
| Fidelity Environmental Bond Fund | | |
| Foreign Exchange Risk | | |
| Forward Foreign Currency Contracts | $1,705,367 | $75,103 |
| Total Foreign Exchange Risk | 1,705,367 | 75,103 |
| Interest Rate Risk | | |
| Futures Contracts | 603,807 | 41,162 |
| Total Interest Rate Risk | 603,807 | 41,162 |
| Totals | $2,309,174 | $116,265 |
If there are any open positions at period end, a summary of the value of derivatives by primary risk exposure is included at the end of the Schedule of Investments.
Forward Foreign Currency Contracts. Forward foreign currency contracts represent obligations to purchase or sell foreign currency on a specified future date at a price fixed at the time the contracts are entered into. Forward foreign currency contracts were used to facilitate transactions in foreign-denominated securities and to manage exposure to certain foreign currencies.
Forward foreign currency contracts are valued daily and fluctuations in exchange rates on open contracts are recorded as unrealized appreciation or (depreciation) and reflected in the Statement of Assets and Liabilities. When the contract is closed, a gain or loss is realized equal to the difference between the closing value and the value at the time it was opened. Non-deliverable forward foreign currency exchange contracts are settled with the counterparty in cash without the delivery of foreign currency. The net realized gain (loss) and change in net unrealized appreciation (depreciation) on forward foreign currency contracts during the period is presented in the Statement of Operations.
Any open forward foreign currency contracts at period end are presented in the Schedule of Investments under the caption "Forward Foreign Currency Contracts." The contract amount and unrealized appreciation (depreciation) reflects each contract's exposure to the underlying currency at period end, and is representative of volume of activity during the period unless an average contract value is presented.
Futures Contracts. A futures contract is an agreement between two parties to buy or sell a specified underlying instrument for a fixed price at a specified future date. Futures contracts were used to manage exposure to the bond market and fluctuations in interest rates.
Upon entering into a futures contract, a fund is required to deposit either cash or securities (initial margin) with a clearing broker in an amount equal to a certain percentage of the face value of the contract. Futures contracts are marked-to-market daily and subsequent daily payments are made or received by a fund depending on the daily fluctuations in the value of the futures contracts and are recorded as unrealized appreciation or (depreciation). This receivable and/or payable, if any, is included in daily variation margin on futures contracts in the Statement of Assets and Liabilities. Realized gain or (loss) is recorded upon the expiration or closing of a futures contract. The net realized gain (loss) and change in net unrealized appreciation (depreciation) on futures contracts during the period is presented in the Statement of Operations.
Any open futures contracts at period end are presented in the Schedule of Investments under the caption "Futures Contracts". The notional amount at value reflects each contract's exposure to the underlying instrument or index at period end, and is representative of volume of activity during the period unless an average notional amount is presented. Any securities deposited to meet initial margin requirements are identified in the Schedule of Investments. Any cash deposited to meet initial margin requirements is presented as segregated cash with brokers for derivative instruments in the Statement of Assets and Liabilities.
5. Purchases and Sales of Investments.
Purchases and sales of securities, other than short-term securities, U.S. government securities and in-kind transactions, as applicable, are noted in the table below.
| | Purchases ($) | Sales ($) |
| Fidelity Environmental Bond Fund | 63,064,021 | 46,992,806 |
6. Fees and Other Transactions with Affiliates.
Management Fee. Fidelity Management & Research Company LLC (the investment adviser) and its affiliates provide the Fund with investment management related services for which the Fund pays a monthly management fee that is based on an annual rate of .35% of the Fund's average net assets. Under the management contract, the investment adviser pays all other expenses, except the compensation of the independent Trustees and certain other expenses such as transfer agent and distribution and service plan fees and other expenses such as interest expense.
Distribution and Service Plan Fees. In accordance with Rule 12b-1 of the 1940 Act, the Fund has adopted separate Distribution and Service Plans for each class of shares. Certain classes pay Fidelity Distributors Company LLC (FDC), an affiliate of the investment adviser, separate Distribution and Service Fees, each of which is based on an annual percentage of each class' average net assets. In addition, FDC may pay financial intermediaries for selling shares of the Fund and providing shareholder support services. For the period, the Distribution and Service Fee rates, total fees and amounts retained by FDC were as follows:
| | Distribution Fee | Service Fee | Total Fees | Retained by FDC |
| Class A | -% | .25% | $2,037 | $1,881 |
| Class M | -% | .25% | 1,916 | 1,899 |
| Class C | .75% | .25% | 7,793 | 7,740 |
| | | | $11,746 | $11,520 |
Sales Load. FDC may receive a front-end sales charge of up to 4.00% for selling Class A shares and Class M shares, some of which is paid to financial intermediaries for selling shares of the Fund. Depending on the holding period, FDC may receive contingent deferred sales charges levied on Class A, Class M and Class C redemptions. The deferred sales charges are 1.00% for Class C shares, .75% for certain purchases of Class A shares and .25% for certain purchases of Class M shares.
For the period, sales charge amounts retained by FDC were as follows:
| | Retained by FDC |
| Class A | $15 |
| Class M | 2 |
| | $17 |
Transfer Agent Fees. Fidelity Investments Institutional Operations Company LLC (FIIOC), an affiliate of the investment adviser, is the transfer, dividend disbursing and shareholder servicing agent for each class of the Fund. FIIOC receives account fees and asset-based fees that vary according to the account size and type of account of the shareholders of the respective classes of the Fund, except for Class Z. FIIOC receives an asset-based fee of Class Z's average net assets. FIIOC pays for typesetting, printing and mailing of shareholder reports, except proxy statements.
For the period, transfer agent fees for each class were as follows:
| | Amount | % of Class-Level Average Net Assets |
| Class A | $565 | .07 |
| Class M | 489 | .06 |
| Class C | 526 | .07 |
| Fidelity Environmental Bond Fund | 10,211 | .10 |
| Class I | 40,640 | .24 |
| Class Z | 19,220 | .05 |
| | $71,651 | |
Interfund Trades. Funds may purchase from or sell securities to other Fidelity Funds under procedures adopted by the Board. The procedures have been designed to ensure these interfund trades are executed in accordance with Rule 17a-7 of the 1940 Act. Any interfund trades are included within the respective purchases and sales amounts shown in the Purchases and Sales of Investments note. During the period, there were no interfund trades.
7. Committed Line of Credit.
Certain Funds participate with other funds managed by the investment adviser or an affiliate in a $4.25 billion credit facility (the "line of credit") to be utilized for temporary or emergency purposes to fund shareholder redemptions or for other short-term liquidity purposes. The participating funds have agreed to pay commitment fees on their pro-rata portion of the line of credit, which are reflected in Miscellaneous expenses on the Statement of Operations, and are listed below. During the period, there were no borrowings on this line of credit.
8. Expense Reductions.
The investment adviser contractually agreed to reimburse expenses of each class to the extent annual operating expenses exceeded certain levels of class-level average net assets as noted in the table below. This reimbursement will remain in place through December 31, 2023. Some expenses, for example the compensation of the independent Trustees, and certain miscellaneous expenses such as proxy and shareholder meeting expenses, are excluded from this reimbursement.
The following classes were in reimbursement during the period:
| | Expense Limitations | Reimbursement |
| Class Z | .36% | 15,751 |
Through arrangements with the Fund's custodian, credits realized as a result of certain uninvested cash balances were used to reduce the Fund's expenses. During the period, custodian credits reduced the Fund's expenses by $82.
9. Distributions to Shareholders.
Distributions to shareholders of each class were as follows:
| | Year ended
August 31, 2022 | Year ended
August 31, 2021(a) |
| Fidelity Environmental Bond Fund | | |
| Distributions to shareholders | | |
| Class A | $9,091 | $866 |
| Class M | 8,571 | 865 |
| Class C | 3,199 | 9 |
| Fidelity Environmental Bond Fund | 137,201 | 9,655 |
| Class I | 186,400 | 1,288 |
| Class Z | 530,324 | 1,403 |
| Total | $874,786 | $14,086 |
(a) For the period June 15, 2021 (commencement of operations) through August 31, 2021.
10. Share Transactions.
Share transactions for each class were as follows and may contain in-kind transactions, automatic conversions between classes or exchanges between affiliated funds:
| | Shares | Shares | Dollars | Dollars |
| | Year ended August 31, 2022 | Year ended August 31, 2021(a) | Year ended August 31, 2022 | Year ended August 31, 2021(a) |
| Fidelity Environmental Bond Fund | | | | |
| Class A | | | | |
| Shares sold | 8,862 | 80,000 | $86,250 | $800,000 |
| Reinvestment of distributions | 975 | 86 | 9,091 | 866 |
| Shares redeemed | (635) | – | (5,913) | – |
| Net increase (decrease) | 9,202 | 80,086 | $89,428 | $800,866 |
| Class M | | | | |
| Shares sold | 3,509 | 80,000 | $31,738 | $800,000 |
| Reinvestment of distributions | 919 | 86 | 8,571 | 865 |
| Net increase (decrease) | 4,428 | 80,086 | $40,309 | $800,865 |
| Class C | | | | |
| Shares sold | 4,759 | 80,000 | $45,195 | $800,000 |
| Reinvestment of distributions | 347 | 1 | 3,199 | 9 |
| Shares redeemed | – | – | (4) | – |
| Net increase (decrease) | 5,106 | 80,001 | $48,390 | $800,009 |
| Fidelity Environmental Bond Fund | | | | |
| Shares sold | 633,009 | 769,013 | $6,136,270 | $7,712,325 |
| Reinvestment of distributions | 13,467 | 936 | 125,175 | 9,450 |
| Shares redeemed | (165,841) | (11,123) | (1,556,252) | (112,443) |
| Net increase (decrease) | 480,635 | 758,826 | $4,705,193 | $7,609,332 |
| Class I | | | | |
| Shares sold | 3,876,416 | 80,000 | $38,185,205 | $800,000 |
| Reinvestment of distributions | 18,854 | 128 | 179,111 | 1,288 |
| Shares redeemed | (3,860,903) | – | (35,321,990) | – |
| Net increase (decrease) | 34,367 | 80,128 | $3,042,326 | $801,288 |
| Class Z | | | | |
| Shares sold | 7,890,789 | 80,000 | $77,233,768 | $800,000 |
| Reinvestment of distributions | 38,714 | 139 | 366,403 | 1,403 |
| Shares redeemed | (6,134,667) | – | (55,453,816) | – |
| Net increase (decrease) | 1,794,836 | 80,139 | $22,146,355 | $801,403 |
(a) For the period June 15, 2021 (commencement of operations) through August 31, 2021.
11. Other.
A fund's organizational documents provide former and current trustees and officers with a limited indemnification against liabilities arising in connection with the performance of their duties to the fund. In the normal course of business, a fund may also enter into contracts that provide general indemnifications. A fund's maximum exposure under these arrangements is unknown as this would be dependent on future claims that may be made against a fund. The risk of material loss from such claims is considered remote.
At the end of the period, the investment adviser or its affiliates were owners of record of more than 10% of the outstanding shares as follows:
| Fund | Affiliated % |
| Fidelity Environmental Bond Fund | 22% |
12. Risk and Uncertainties.
Many factors affect a fund's performance. Developments that disrupt global economies and financial markets, such as pandemics, epidemics, outbreaks of infectious diseases, war, terrorism, and environmental disasters, may significantly affect a fund's investment performance. The effects of these developments to a fund will be impacted by the types of securities in which a fund invests, the financial condition, industry, economic sector, and geographic location of an issuer, and a fund's level of investment in the securities of that issuer.
Report of Independent Registered Public Accounting Firm
To the Board of Trustees of Fidelity Income Fund and Shareholders of Fidelity Environmental Bond Fund
Opinion on the Financial Statements
We have audited the accompanying statement of assets and liabilities, including the schedule of investments, of Fidelity Environmental Bond Fund (one of the funds constituting Fidelity Income Fund, referred to hereafter as the "Fund”) as of August 31, 2022, the related statement of operations for the year ended August 31, 2022, and the statement of changes in net assets and the financialhighlights for the year ended August 31, 2022 and for the period June 15, 2021 (commencement of operations) through August 31, 2021, including the related notes (collectively referred to as the “financial statements”). In our opinion, the financial statements present fairly, in all material respects, the financial position of the Fund as of August 31, 2022, the results of its operations for the year then ended, and the changes in its net assets and thefinancial highlights for the year ended August 31, 2022 and for the period June 15, 2021 (commencement of operations) through August 31, 2021 in conformity with accounting principles generally accepted in the United States of America.
Basis for Opinion
These financial statements are the responsibility of the Fund’s management. Our responsibility is to express an opinion on the Fund’s financial statements based on our audits. We are a public accounting firm registered with the Public Company Accounting Oversight Board (United States) (PCAOB) and are required to be independent with respect to the Fund in accordance with the U.S. federal securities laws and the applicable rules and regulations of the Securities and Exchange Commission and the PCAOB.
We conducted our audits of these financial statements in accordance with the standards of the PCAOB. Those standards require that we plan and perform the audit to obtain reasonable assurance about whether the financial statements are free of material misstatement, whether due to error or fraud.
Our audits included performing procedures to assess the risks of material misstatement of the financial statements, whether due to error or fraud, and performing procedures that respond to those risks. Such procedures included examining, on a test basis, evidence regarding the amounts and disclosures in the financial statements. Our audits also included evaluating the accounting principles used and significant estimates made by management, as well as evaluating the overall presentation of the financial statements. Our procedures included confirmation of securities owned as of August 31, 2022 by correspondence with the custodian and brokers; when replies were not received from brokers, we performed other auditing procedures. We believe that our audits provide a reasonable basis for our opinion.
/s/ PricewaterhouseCoopers LLP
Boston, Massachusetts
October 17, 2022
We have served as the auditor of one or more investment companies in the Fidelity group of funds since 1932.
Trustees and Officers
The Trustees, Members of the Advisory Board (if any), and officers of the trust and fund, as applicable, are listed below. The Board of Trustees governs the fund and is responsible for protecting the interests of shareholders. The Trustees are experienced executives who meet periodically throughout the year to oversee the fund's activities, review contractual arrangements with companies that provide services to the fund, oversee management of the risks associated with such activities and contractual arrangements, and review the fund's performance. Each of the Trustees oversees 297 funds.
The Trustees hold office without limit in time except that (a) any Trustee may resign; (b) any Trustee may be removed by written instrument, signed by at least two-thirds of the number of Trustees prior to such removal; (c) any Trustee who requests to be retired or who has become incapacitated by illness or injury may be retired by written instrument signed by a majority of the other Trustees; and (d) any Trustee may be removed at any special meeting of shareholders by a two-thirds vote of the outstanding voting securities of the trust. Each Trustee who is not an interested person (as defined in the 1940 Act) of the trust and the fund is referred to herein as an Independent Trustee. Each Independent Trustee shall retire not later than the last day of the calendar year in which his or her 75th birthday occurs. The Independent Trustees may waive this mandatory retirement age policy with respect to individual Trustees. Officers and Advisory Board Members hold office without limit in time, except that any officer or Advisory Board Member may resign or may be removed by a vote of a majority of the Trustees at any regular meeting or any special meeting of the Trustees. Except as indicated, each individual has held the office shown or other offices in the same company for the past five years.
The fund's Statement of Additional Information (SAI) includes more information about the Trustees. To request a free copy, call Fidelity at 1-800-544-8544 if you’re an individual investing directly with Fidelity, call 1-800-835-5092 if you’re a plan sponsor or participant with Fidelity as your recordkeeper or call 1-877-208-0098 on institutional accounts or if you’re an advisor or invest through one.
Experience, Skills, Attributes, and Qualifications of the Trustees. The Governance and Nominating Committee has adopted a statement of policy that describes the experience, qualifications, attributes, and skills that are necessary and desirable for potential Independent Trustee candidates (Statement of Policy). The Board believes that each Trustee satisfied at the time he or she was initially elected or appointed a Trustee, and continues to satisfy, the standards contemplated by the Statement of Policy. The Governance and Nominating Committee also engages professional search firms to help identify potential Independent Trustee candidates who have the experience, qualifications, attributes, and skills consistent with the Statement of Policy. From time to time, additional criteria based on the composition and skills of the current Independent Trustees, as well as experience or skills that may be appropriate in light of future changes to board composition, business conditions, and regulatory or other developments, have also been considered by the professional search firms and the Governance and Nominating Committee. In addition, the Board takes into account the Trustees' commitment and participation in Board and committee meetings, as well as their leadership of standing and ad hoc committees throughout their tenure.
In determining that a particular Trustee was and continues to be qualified to serve as a Trustee, the Board has considered a variety of criteria, none of which, in isolation, was controlling. The Board believes that, collectively, the Trustees have balanced and diverse experience, qualifications, attributes, and skills, which allow the Board to operate effectively in governing the fund and protecting the interests of shareholders. Information about the specific experience, skills, attributes, and qualifications of each Trustee, which in each case led to the Board's conclusion that the Trustee should serve (or continue to serve) as a trustee of the fund, is provided below.
Board Structure and Oversight Function. Abigail P. Johnson is an interested person and currently serves as Chairman. The Trustees have determined that an interested Chairman is appropriate and benefits shareholders because an interested Chairman has a personal and professional stake in the quality and continuity of services provided to the fund. Independent Trustees exercise their informed business judgment to appoint an individual of their choosing to serve as Chairman, regardless of whether the Trustee happens to be independent or a member of management. The Independent Trustees have determined that they can act independently and effectively without having an Independent Trustee serve as Chairman and that a key structural component for assuring that they are in a position to do so is for the Independent Trustees to constitute a substantial majority for the Board. The Independent Trustees also regularly meet in executive session. Michael E. Kenneally serves as Chairman of the Independent Trustees and as such (i) acts as a liaison between the Independent Trustees and management with respect to matters important to the Independent Trustees and (ii) with management prepares agendas for Board meetings.
Fidelity® funds are overseen by different Boards of Trustees. The fund's Board oversees Fidelity's investment-grade bond, money market, asset allocation and certain equity funds, and other Boards oversee Fidelity's high income and other equity funds. The asset allocation funds may invest in Fidelity® funds that are overseen by such other Boards. The use of separate Boards, each with its own committee structure, allows the Trustees of each group of Fidelity® funds to focus on the unique issues of the funds they oversee, including common research, investment, and operational issues. On occasion, the separate Boards establish joint committees to address issues of overlapping consequences for the Fidelity® funds overseen by each Board.
The Trustees operate using a system of committees to facilitate the timely and efficient consideration of all matters of importance to the Trustees, the fund, and fund shareholders and to facilitate compliance with legal and regulatory requirements and oversight of the fund's activities and associated risks. The Board, acting through its committees, has charged FMR and its affiliates with (i) identifying events or circumstances the occurrence of which could have demonstrably adverse effects on the fund's business and/or reputation; (ii) implementing processes and controls to lessen the possibility that such events or circumstances occur or to mitigate the effects of such events or circumstances if they do occur; and (iii) creating and maintaining a system designed to evaluate continuously business and market conditions in order to facilitate the identification and implementation processes described in (i) and (ii) above. Because the day-to-day operations and activities of the fund are carried out by or through FMR, its affiliates, and other service providers, the fund's exposure to risks is mitigated but not eliminated by the processes overseen by the Trustees. While each of the Board's committees has responsibility for overseeing different aspects of the fund's activities, oversight is exercised primarily through the Operations and Audit Committees. In addition, an ad hoc Board committee of Independent Trustees has worked with FMR to enhance the Board's oversight of investment and financial risks, legal and regulatory risks, technology risks, and operational risks, including the development of additional risk reporting to the Board. Appropriate personnel, including but not limited to the fund's Chief Compliance Officer (CCO), FMR's internal auditor, the independent accountants, the fund's Treasurer and portfolio management personnel, make periodic reports to the Board's committees, as appropriate, including an annual review of Fidelity's risk management program for the Fidelity® funds. The responsibilities of each standing committee, including their oversight responsibilities, are described further under "Standing Committees of the Trustees."
Interested Trustees*:
Correspondence intended for a Trustee who is an interested person may be sent to Fidelity Investments, 245 Summer Street, Boston, Massachusetts 02210.
Name, Year of Birth; Principal Occupations and Other Relevant Experience+
Abigail P. Johnson (1961)
Year of Election or Appointment: 2009
Trustee
Chairman of the Board of Trustees
Ms. Johnson also serves as Trustee of other Fidelity® funds. Ms. Johnson serves as Chairman (2016-present), Chief Executive Officer (2014-present), and Director (2007-present) of FMR LLC (diversified financial services company), President of Fidelity Financial Services (2012-present) and President of Personal, Workplace and Institutional Services (2005-present). Ms. Johnson is Chairman and Director of Fidelity Management & Research Company LLC (investment adviser firm, 2011-present). Previously, Ms. Johnson served as Chairman and Director of FMR Co., Inc. (investment adviser firm, 2011-2019), Vice Chairman (2007-2016) and President (2013-2016) of FMR LLC, President and a Director of Fidelity Management & Research Company (2001-2005), a Trustee of other investment companies advised by Fidelity Management & Research Company, Fidelity Investments Money Management, Inc. (investment adviser firm), and FMR Co., Inc. (2001-2005), Senior Vice President of the Fidelity® funds (2001-2005), and managed a number of Fidelity® funds. Ms. Abigail P. Johnson and Mr. Arthur E. Johnson are not related.
Jennifer Toolin McAuliffe (1959)
Year of Election or Appointment: 2016
Trustee
Ms. McAuliffe also serves as Trustee of other Fidelity® funds and as Trustee of Fidelity Charitable (2020-present). Previously, Ms. McAuliffe served as Co-Head of Fixed Income of Fidelity Investments Limited (now known as FIL Limited (FIL)) (diversified financial services company), Director of Research for FIL’s credit and quantitative teams in London, Hong Kong and Tokyo and Director of Research for taxable and municipal bonds at Fidelity Investments Money Management, Inc. Ms. McAuliffe previously served as a member of the Advisory Board of certain Fidelity® funds (2016). Ms. McAuliffe was previously a lawyer at Ropes & Gray LLP and currently serves as director or trustee of several not-for-profit entities.
* Determined to be an “Interested Trustee” by virtue of, among other things, his or her affiliation with the trust or various entities under common control with FMR.
+ The information includes the Trustee's principal occupation during the last five years and other information relating to the experience, attributes, and skills relevant to the Trustee's qualifications to serve as a Trustee, which led to the conclusion that the Trustee should serve as a Trustee for the fund.
Independent Trustees:
Correspondence intended for an Independent Trustee may be sent to Fidelity Investments, P.O. Box 55235, Boston, Massachusetts 02205-5235.
Name, Year of Birth; Principal Occupations and Other Relevant Experience+
Elizabeth S. Acton (1951)
Year of Election or Appointment: 2013
Trustee
Ms. Acton also serves as Trustee of other Fidelity® funds. Prior to her retirement, Ms. Acton served as Executive Vice President, Finance (2011-2012), Executive Vice President, Chief Financial Officer (2002-2011) and Treasurer (2004-2005) of Comerica Incorporated (financial services). Prior to joining Comerica, Ms. Acton held a variety of positions at Ford Motor Company (1983-2002), including Vice President and Treasurer (2000-2002) and Executive Vice President and Chief Financial Officer of Ford Motor Credit Company (1998-2000). Ms. Acton currently serves as a member of the Board and Audit and Finance Committees of Beazer Homes USA, Inc. (homebuilding, 2012-present). Ms. Acton previously served as a member of the Advisory Board of certain Fidelity® funds (2013-2016).
Ann E. Dunwoody (1953)
Year of Election or Appointment: 2018
Trustee
General Dunwoody also serves as Trustee of other Fidelity® funds. General Dunwoody (United States Army, Retired) was the first woman in U.S. military history to achieve the rank of four-star general and prior to her retirement in 2012 held a variety of positions within the U.S. Army, including Commanding General, U.S. Army Material Command (2008-2012). General Dunwoody currently serves as President of First to Four LLC (leadership and mentoring services, 2012-present), a member of the Board and Nomination and Corporate Governance Committees of Kforce Inc. (professional staffing services, 2016-present) and a member of the Board of Automattic Inc. (software engineering, 2018-present). Previously, General Dunwoody served as a member of the Advisory Board and Nominating and Corporate Governance Committee of L3 Technologies, Inc. (communication, electronic, sensor and aerospace systems, 2013-2019) and a member of the Board and Audit and Sustainability and Corporate Responsibility Committees of Republic Services, Inc. (waste collection, disposal and recycling, 2013-2016). Ms. Dunwoody also serves on several boards for non-profit organizations, including as a member of the Board, Chair of the Nomination and Governance Committee and a member of the Audit Committee of Logistics Management Institute (consulting non-profit, 2012-present), a member of the Council of Trustees for the Association of the United States Army (advocacy non-profit, 2013-present), a member of the Board of Florida Institute of Technology (2015-present) and a member of the Board of ThanksUSA (military family education non-profit, 2014-present). General Dunwoody previously served as a member of the Advisory Board of certain Fidelity® funds (2018).
John Engler (1948)
Year of Election or Appointment: 2014
Trustee
Mr. Engler also serves as Trustee of other Fidelity® funds. Previously, Mr. Engler served as Governor of Michigan (1991-2003), President of the Business Roundtable (2011-2017) and interim President of Michigan State University (2018-2019). Mr. Engler currently serves as a member of the Board of Stride, Inc. (formerly K12 Inc.) (technology-based education company, 2012-present). Previously, Mr. Engler served as a member of the Board of Universal Forest Products (manufacturer and distributor of wood and wood-alternative products, 2003-2019) and Trustee of The Munder Funds (2003-2014). Mr. Engler previously served as a member of the Advisory Board of certain Fidelity® funds (2014-2016).
Robert F. Gartland (1951)
Year of Election or Appointment: 2010
Trustee
Mr. Gartland also serves as Trustee of other Fidelity® funds. Prior to his retirement, Mr. Gartland held a variety of positions at Morgan Stanley (financial services, 1979-2007), including Managing Director (1987-2007) and Chase Manhattan Bank (1975-1978). Mr. Gartland previously served as Chairman and an investor in Gartland & Mellina Group Corp. (consulting, 2009-2019), as a member of the Board of National Securities Clearing Corporation (1993-1996) and as Chairman of TradeWeb (2003-2004).
Arthur E. Johnson (1947)
Year of Election or Appointment: 2008
Trustee
Mr. Johnson also serves as Trustee of other Fidelity® funds. Prior to his retirement, Mr. Johnson served as Senior Vice President of Corporate Strategic Development of Lockheed Martin Corporation (defense contractor, 1999-2009). Mr. Johnson currently serves as a member of the Board of Booz Allen Hamilton (management consulting, 2011-present). Mr. Johnson previously served as a member of the Board of Eaton Corporation plc (diversified power management, 2009-2019) and a member of the Board of AGL Resources, Inc. (holding company, 2002-2016). Mr. Johnson previously served as Chairman (2018-2021) and Vice Chairman (2015-2018) of the Independent Trustees of certain Fidelity® funds. Mr. Arthur E. Johnson is not related to Ms. Abigail P. Johnson.
Michael E. Kenneally (1954)
Year of Election or Appointment: 2009
Trustee
Chairman of the Independent Trustees
Mr. Kenneally also serves as Trustee of other Fidelity® funds and was Vice Chairman (2018-2021) of the Independent Trustees of certain Fidelity® funds. Prior to retirement in 2005, he was Chairman and Global Chief Executive Officer of Credit Suisse Asset Management, the worldwide fund management and institutional investment business of Credit Suisse Group. Previously, Mr. Kenneally was an Executive Vice President and the Chief Investment Officer for Bank of America. In this role, he was responsible for the investment management, strategy and products delivered to the bank’s institutional, high-net-worth and retail clients. Earlier, Mr. Kenneally directed the organization’s equity and quantitative research groups. He began his career as a research analyst and then spent more than a dozen years as a portfolio manager for endowments, pension plans and mutual funds. He earned the Chartered Financial Analyst (CFA) designation in 1991.
Marie L. Knowles (1946)
Year of Election or Appointment: 2001
Trustee
Ms. Knowles also serves as Trustee of other Fidelity® funds. Prior to her retirement, Ms. Knowles held several positions at Atlantic Richfield Company (diversified energy), including Executive Vice President and Chief Financial Officer (1996-2000), Senior Vice President (1993-1996) and President of ARCO Transportation Company (pipeline and tanker operations, 1993-1996). Ms. Knowles currently serves as a member of the Board of the Santa Catalina Island Company (real estate, 2009-present), a member of the Investment Company Institute Board of Governors and a member of the Governing Council of the Independent Directors Council (2014-present). Ms. Knowles also serves as a member of the Advisory Board for the School of Engineering of the University of Southern California. Ms. Knowles previously served as a member of the Board of McKesson Corporation (healthcare service, 2002-2021). In addition, Ms. Knowles previously served as Chairman (2015-2018) and Vice Chairman (2012-2015) of the Independent Trustees of certain Fidelity® funds.
Mark A. Murray (1954)
Year of Election or Appointment: 2016
Trustee
Mr. Murray also serves as Trustee of other Fidelity® funds. Previously, Mr. Murray served as Co-Chief Executive Officer (2013-2016), President (2006-2013) and Vice Chairman (2013-2020) of Meijer, Inc. Mr. Murray serves as a member of the Board (2009-present) and Public Policy and Responsibility Committee (2009-present) and Chair of the Nuclear Review Committee (2019-present) of DTE Energy Company (diversified energy company). Mr. Murray previously served as a member of the Board of Spectrum Health (not-for-profit health system, 2015-2019) and as a member of the Board and Audit Committee and Chairman of the Nominating and Corporate Governance Committee of Universal Forest Products, Inc. (manufacturer and distributor of wood and wood-alternative products, 2004-2016). Mr. Murray also serves as a member of the Board of many community and professional organizations. Mr. Murray previously served as a member of the Advisory Board of certain Fidelity® funds (2016).
+ The information includes the Trustee's principal occupation during the last five years and other information relating to the experience, attributes, and skills relevant to the Trustee's qualifications to serve as a Trustee, which led to the conclusion that the Trustee should serve as a Trustee for the fund.
Advisory Board Members and Officers:
Correspondence intended for an officer may be sent to Fidelity Investments, 245 Summer Street, Boston, Massachusetts 02210. Officers appear below in alphabetical order.
Name, Year of Birth; Principal Occupation
Laura M. Bishop (1961)
Year of Election or Appointment: 2022
Member of the Advisory Board
Ms. Bishop also serves as a Member of the Advisory Board of other funds. Prior to her retirement, Ms. Bishop held a variety of positions at United Services Automobile Association (2001-2020), including Executive Vice President and Chief Financial Officer (2014-2020) and Senior Vice President and Deputy Chief Financial Officer (2012-2014). Ms. Bishop currently serves as a member of the Audit Committee and Compensation and Personnel Committee (2021-present) of the Board of Directors of Korn Ferry (global organizational consulting).
Robert W. Helm (1957)
Year of Election or Appointment: 2021
Member of the Advisory Board
Mr. Helm also serves as a Member of the Advisory Board of other Fidelity® funds. Mr. Helm was formerly Deputy Chairman (2003-2020), partner (1991-2020) and an associate (1984-1991) of Dechert LLP (formerly Dechert Price & Rhoads). Mr. Helm currently serves on boards and committees of several not-for-profit organizations.
Craig S. Brown (1977)
Year of Election or Appointment: 2019
Assistant Treasurer
Mr. Brown also serves as an officer of other funds. Mr. Brown serves as Assistant Treasurer of FIMM, LLC (2021-present) and is an employee of Fidelity Investments (2013-present).
John J. Burke III (1964)
Year of Election or Appointment: 2018
Chief Financial Officer
Mr. Burke also serves as Chief Financial Officer of other funds. Mr. Burke serves as Head of Investment Operations for Fidelity Fund and Investment Operations (2018-present) and is an employee of Fidelity Investments (1998-present). Previously Mr. Burke served as head of Asset Management Investment Operations (2012-2018).
David J. Carter (1973)
Year of Election or Appointment: 2020
Assistant Secretary
Mr. Carter also serves as Assistant Secretary of other funds. Mr. Carter serves as Senior Vice President, Deputy General Counsel (2022-present) and is an employee of Fidelity Investments (2005-present).
Jonathan Davis (1968)
Year of Election or Appointment: 2010
Assistant Treasurer
Mr. Davis also serves as an officer of other funds. Mr. Davis serves as Assistant Treasurer of FIMM, LLC (2021-present), FMR Capital, Inc. (2017-present), FD Funds GP LLC (2021-present), FD Funds Holding LLC (2021-present), and FD Funds Management LLC (2021-present); and is an employee of Fidelity Investments. Previously, Mr. Davis served as Vice President and Associate General Counsel of FMR LLC (diversified financial services company, 2003-2010).
Laura M. Del Prato (1964)
Year of Election or Appointment: 2018
President and Treasurer
Ms. Del Prato also serves as an officer of other funds. Ms. Del Prato serves as Assistant Treasurer of FIMM, LLC (2021-present) and is an employee of Fidelity Investments (2017-present). Previously, Ms. Del Prato served as President and Treasurer of The North Carolina Capital Management Trust: Cash Portfolio and Term Portfolio (2018-2020). Prior to joining Fidelity Investments, Ms. Del Prato served as a Managing Director and Treasurer of the JPMorgan Mutual Funds (2014-2017). Prior to JPMorgan, Ms. Del Prato served as a partner at Cohen Fund Audit Services (accounting firm, 2012-2013) and KPMG LLP (accounting firm, 2004-2012).
Colm A. Hogan (1973)
Year of Election or Appointment: 2016
Assistant Treasurer
Mr. Hogan also serves as an officer of other funds. Mr. Hogan serves as Assistant Treasurer of FIMM, LLC (2021-present) and FMR Capital, Inc. (2017-present) and is an employee of Fidelity Investments (2005-present). Previously, Mr. Hogan served as Deputy Treasurer of certain Fidelity® funds (2016-2020) and Assistant Treasurer of certain Fidelity® funds (2016-2018).
Cynthia Lo Bessette (1969)
Year of Election or Appointment: 2019
Secretary and Chief Legal Officer (CLO)
Ms. Lo Bessette also serves as an officer of other funds. Ms. Lo Bessette serves as CLO, Secretary, and Senior Vice President of Fidelity Management & Research Company LLC (investment adviser firm, 2019-present); CLO of Fidelity Management & Research (Hong Kong) Limited, FMR Investment Management (UK) Limited, and Fidelity Management & Research (Japan) Limited (investment adviser firms, 2019-present); Secretary of FD Funds GP LLC (2021-present), FD Funds Holding LLC (2021-present), and FD Funds Management LLC (2021-present); and Assistant Secretary of FIMM, LLC (2019-present). She is a Senior Vice President and Deputy General Counsel of FMR LLC (diversified financial services company, 2019-present), and is an employee of Fidelity Investments. Previously, Ms. Lo Bessette served as CLO, Secretary, and Senior Vice President of FMR Co., Inc. (investment adviser firm, 2019); Secretary of Fidelity SelectCo, LLC and Fidelity Investments Money Management, Inc. (investment adviser firms, 2019). Prior to joining Fidelity Investments, Ms. Lo Bessette was Executive Vice President, General Counsel (2016-2019) and Senior Vice President, Deputy General Counsel (2015-2016) of OppenheimerFunds (investment management company) and Deputy Chief Legal Officer (2013-2015) of Jennison Associates LLC (investment adviser firm).
Chris Maher (1972)
Year of Election or Appointment: 2013
Assistant Treasurer
Mr. Maher also serves as an officer of other funds. Mr. Maher serves as Assistant Treasurer of FIMM, LLC (2021-present) and FMR Capital, Inc. (2017-present), and is an employee of Fidelity Investments (2008-present). Previously, Mr. Maher served as Assistant Treasurer of certain funds (2013-2020); Vice President of Asset Management Compliance (2013), Vice President of the Program Management Group of FMR (investment adviser firm, 2010-2013), and Vice President of Valuation Oversight (2008-2010).
Kenneth B. Robins (1969)
Year of Election or Appointment: 2020
Chief Compliance Officer
Mr. Robins also serves as an officer of other funds. Mr. Robins serves as Compliance Officer of Fidelity Management & Research Company LLC (investment adviser firm, 2016-present) and is an employee of Fidelity Investments (2004-present). Previously, Mr. Robins served as Compliance Officer of FMR Co., Inc. (investment adviser firm, 2016-2019), as Executive Vice President of Fidelity Investments Money Management, Inc. (investment adviser firm, 2013-2016) and served in other fund officer roles.
Brett Segaloff (1972)
Year of Election or Appointment: 2021
Anti-Money Laundering (AML) Officer
Mr. Segaloff also serves as an AML Officer of other funds and other related entities. He is Director, Anti-Money Laundering (2007-present) of FMR LLC (diversified financial services company) and is an employee of Fidelity Investments (1996-present).
Stacie M. Smith (1974)
Year of Election or Appointment: 2013
Assistant Treasurer
Ms. Smith also serves as an officer of other funds. Ms. Smith serves as Assistant Treasurer of FIMM, LLC (2021-present) and FMR Capital, Inc. (2017-present), is an employee of Fidelity Investments (2009-present), and has served in other fund officer roles. Prior to joining Fidelity Investments, Ms. Smith served as Senior Audit Manager of Ernst & Young LLP (accounting firm, 1996-2009). Previously, Ms. Smith served as Assistant Treasurer (2013-2019) and Deputy Treasurer (2013-2016) of certain Fidelity® funds.
Jim Wegmann (1979)
Year of Election or Appointment: 2021
Deputy Treasurer
Mr. Wegmann also serves as an officer of other funds. Mr. Wegmann serves as Assistant Treasurer of FIMM, LLC (2021-present) and is an employee of Fidelity Investments (2011-present). Previously, Mr. Wegmann served as Assistant Treasurer of certain Fidelity® funds (2019-2021).
Shareholder Expense Example
As a shareholder, you incur two types of costs: (1) transaction costs, which may include sales charges (loads) on purchase payments or redemption proceeds, as applicable and (2) ongoing costs, which generally include management fees, distribution and/or service (12b-1) fees and other Fund expenses. This Example is intended to help you understand your ongoing costs (in dollars) of investing in a fund and to compare these costs with the ongoing costs of investing in other mutual funds.
The Example is based on an investment of $1,000 invested at the beginning of the period and held for the entire period (March 1, 2022 to August 31, 2022).
Actual Expenses
The first line of the accompanying table provides information about actual account values and actual expenses. You may use the information in this line, together with the amount you invested, to estimate the expenses that you paid over the period. Simply divide your account value by $1,000.00 (for example, an $8,600 account value divided by $1,000.00 = 8.6), then multiply the result by the number in the first line for a class/Fund under the heading entitled "Expenses Paid During Period" to estimate the expenses you paid on your account during this period. If any fund is a shareholder of any underlying mutual funds or exchange-traded funds (ETFs) (the Underlying Funds), such fund indirectly bears its proportional share of the expenses of the Underlying Funds in addition to the direct expenses incurred presented in the table. These fees and expenses are not included in the annualized expense ratio used to calculate the expense estimate in the table below.
Hypothetical Example for Comparison Purposes
The second line of the accompanying table provides information about hypothetical account values and hypothetical expenses based on the actual expense ratio and an assumed rate of return of 5% per year before expenses, which is not the actual return. The hypothetical account values and expenses may not be used to estimate the actual ending account balance or expenses you paid for the period. You may use this information to compare the ongoing costs of investing in the Fund and other funds. To do so, compare this 5% hypothetical example with the 5% hypothetical examples that appear in the shareholder reports of the other funds. If any fund is a shareholder of any Underlying Funds, such fund indirectly bears its proportional share of the expenses of the Underlying Funds in addition to the direct expenses as presented in the table. These fees and expenses are not included in the annualized expense ratio used to calculate the expense estimate in the table below.
Please note that the expenses shown in the table are meant to highlight your ongoing costs only and do not reflect any transaction costs. Therefore, the second line of the table is useful in comparing ongoing costs only, and will not help you determine the relative total costs of owning different funds. In addition, if these transactional costs were included, your costs would have been higher.
| | Annualized Expense Ratio-A | Beginning
Account Value
March 1, 2022 | Ending
Account Value
August 31, 2022 | Expenses Paid
During Period-B
March 1, 2022
to August 31, 2022 |
| Fidelity Environmental Bond Fund | | | | |
| Class A | .67% | | | |
| Actual | | $1,000.00 | $913.20 | $3.23 |
| Hypothetical-C | | $1,000.00 | $1,021.83 | $3.41 |
| Class M | .66% | | | |
| Actual | | $1,000.00 | $913.20 | $3.18 |
| Hypothetical-C | | $1,000.00 | $1,021.88 | $3.36 |
| Class C | 1.42% | | | |
| Actual | | $1,000.00 | $909.60 | $6.83 |
| Hypothetical-C | | $1,000.00 | $1,018.05 | $7.22 |
| Fidelity Environmental Bond Fund | .45% | | | |
| Actual | | $1,000.00 | $914.20 | $2.17 |
| Hypothetical-C | | $1,000.00 | $1,022.94 | $2.29 |
| Class I | .58% | | | |
| Actual | | $1,000.00 | $914.90 | $2.80 |
| Hypothetical-C | | $1,000.00 | $1,022.28 | $2.96 |
| Class Z | .36% | | | |
| Actual | | $1,000.00 | $914.60 | $1.74 |
| Hypothetical-C | | $1,000.00 | $1,023.39 | $1.84 |
A Annualized expense ratio reflects expenses net of applicable fee waivers.
B Expenses are equal to the annualized expense ratio, multiplied by the average account value over the period, multiplied by 184/ 365 (to reflect the one-half year period). The fees and expenses of any Underlying Funds are not included in each annualized expense ratio.
C 5% return per year before expenses
Distributions (Unaudited)
The dividend and capital gains distributions for the fund(s) are available on Fidelity.com or Institutional.Fidelity.com.
A total of 28.45% of the dividends distributed during the fiscal year was derived from interest on U.S. Government securities which is generally exempt from state income tax.
The fund designates 75.89% and 45.74% of the short-term capital gain dividends distributed in October and December, respectively during the fiscal year as qualifying to be taxed as short-term capital gain dividends for nonresident alien shareholders.
The fund designates $154,447 of distributions paid in the calendar year 2021 as qualifying to be taxed as interest-related dividends for nonresident alien shareholders.
The fund designates $179,571 of distributions paid in the calendar year 2021 as qualifying to be taxed as section 163(j) interest dividends.
The fund will notify shareholders in January 2023 of amounts for use in preparing 2022 income tax returns.
ENB-ANN-1022
1.9901918.101
Fidelity® Total Bond Fund
Annual Report
August 31, 2022
Includes Fidelity and Fidelity Advisor share classes
Contents
To view a fund's proxy voting guidelines and proxy voting record for the 12-month period ended June 30, visit http://www.fidelity.com/proxyvotingresults or visit the Securities and Exchange Commission's (SEC) web site at http://www.sec.gov.
You may also call 1-800-544-8544 if you’re an individual investing directly with Fidelity, call 1-800-835-5092 if you’re a plan sponsor or participant with Fidelity as your recordkeeper or call 1-877-208-0098 on institutional accounts or if you’re an advisor or invest through one to request a free copy of the proxy voting guidelines.
Standard & Poor's, S&P and S&P 500 are registered service marks of The McGraw-Hill Companies, Inc. and have been licensed for use by Fidelity Distributors Corporation.
Other third-party marks appearing herein are the property of their respective owners.
All other marks appearing herein are registered or unregistered trademarks or service marks of FMR LLC or an affiliated company. © 2022 FMR LLC. All rights reserved.
This report and the financial statements contained herein are submitted for the general information of the shareholders of the Fund. This report is not authorized for distribution to prospective investors in the Fund unless preceded or accompanied by an effective prospectus.
A fund files its complete schedule of portfolio holdings with the SEC for the first and third quarters of each fiscal year on Form N-PORT. Forms N-PORT are available on the SEC’s web site at http://www.sec.gov. A fund's Forms N-PORT may be reviewed and copied at the SEC’s Public Reference Room in Washington, DC. Information regarding the operation of the SEC's Public Reference Room may be obtained by calling 1-800-SEC-0330.
For a complete list of a fund's portfolio holdings, view the most recent holdings listing, semiannual report, or annual report on Fidelity's web site at http://www.fidelity.com, http://www.institutional.fidelity.com, or http://www.401k.com, as applicable.
NOT FDIC INSURED •MAY LOSE VALUE •NO BANK GUARANTEE
Neither the Fund nor Fidelity Distributors Corporation is a bank.
Performance: The Bottom Line
Average annual total return reflects the change in the value of an investment, assuming reinvestment of distributions from dividend income and capital gains (the profits earned upon the sale of securities that have grown in value, if any) and assuming a constant rate of performance each year. The hypothetical investment and the average annual total returns do not reflect the deduction of taxes that a shareholder would pay on fund distributions or the redemption of fund shares. During periods of reimbursement by Fidelity, a fund’s total return will be greater than it would be had the reimbursement not occurred. How a fund did yesterday is no guarantee of how it will do tomorrow.
Average Annual Total Returns
| For the periods ended August 31, 2022 | Past 1 year | Past 5 years | Past 10 years |
| Class A (incl. 4.00% sales charge) | (15.13)% | 0.13% | 1.40% |
| Class M (incl. 4.00% sales charge) | (15.15)% | 0.13% | 1.39% |
| Class C (incl. contingent deferred sales charge) | (13.21)% | 0.19% | 1.21% |
| Fidelity® Total Bond Fund | (11.42)% | 1.26% | 2.11% |
| Class I | (11.40)% | 1.21% | 2.07% |
| Class Z | (11.27)% | 1.35% | 2.18% |
Class C shares' contingent deferred sales charges included in the past one year, past five years and past ten years total return figures are 1%, 0% and 0%, respectively.
The initial offering of Class Z shares took place on December 22, 2014. Returns prior to December 22, 2014, are those of Class I.
$10,000 Over 10 Years
Let's say hypothetically that $10,000 was invested in Fidelity® Total Bond Fund, a class of the fund, on August 31, 2012.
The chart shows how the value of your investment would have changed, and also shows how the Bloomberg U.S. Aggregate Bond Index performed over the same period.
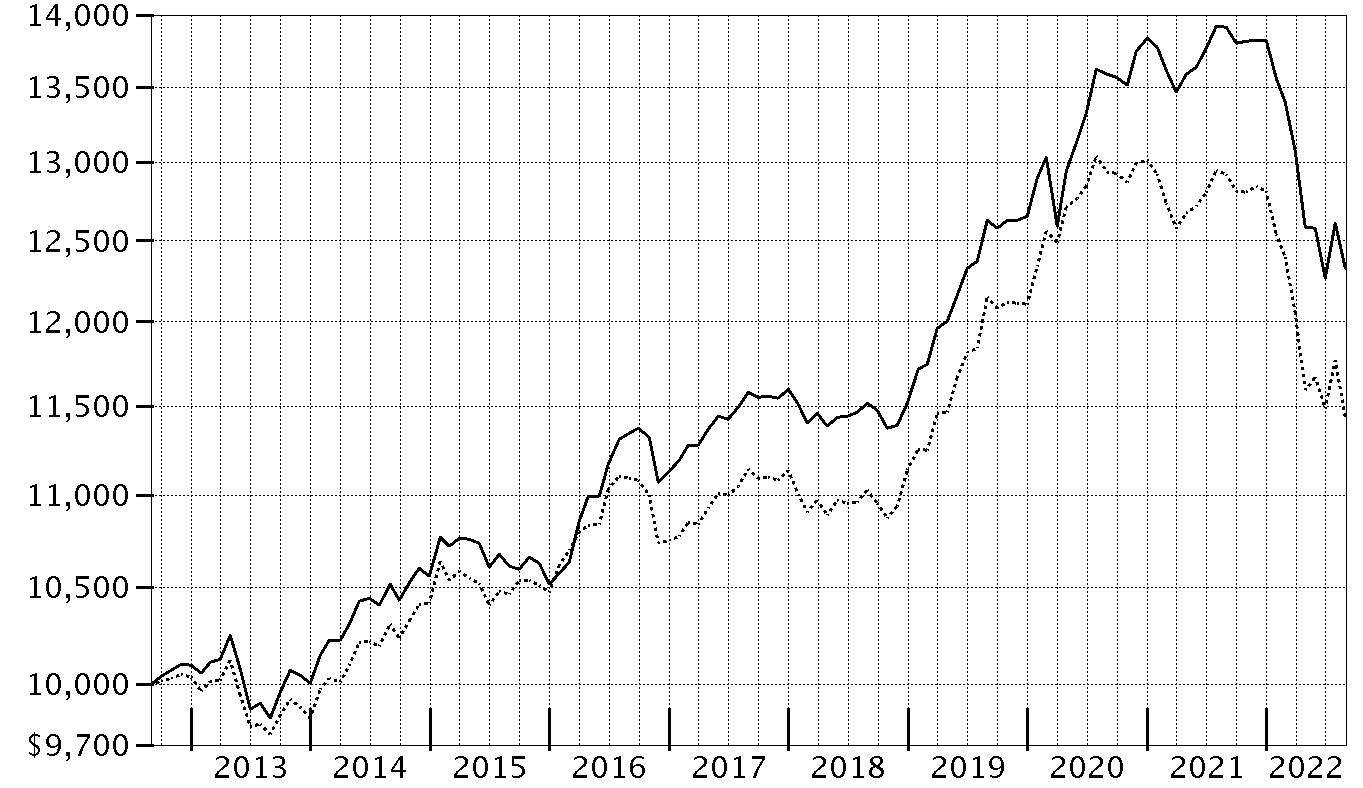
| Period Ending Values |
| $12,328 | Fidelity® Total Bond Fund |
| $11,436 | Bloomberg U.S. Aggregate Bond Index |
Management's Discussion of Fund Performance
Market Recap: U.S. taxable investment-grade bonds notably declined for the 12 months ending August 31, 2022, as the U.S. Federal Reserve took aggressive action to stymie high inflation. The Bloomberg U.S. Aggregate Bond Index returned -11.52% for the period. In late 2021, bond yields rose when the Fed pivoted from an “easy” to a “tight” monetary stance. Its first step was to cease its purchases of bonds, part of a quantitative easing program to support the U.S. economy that began in 2008. In the first half of 2022, the Fed took more aggressive steps to thwart inflation. The central bank raised the federal funds target rate by 25 basis points (0.25%) in mid-March, 50 basis points in May and 75 basis points in June – its largest increase since 1994 – and said it was becoming more difficult to achieve a soft landing, in which the economy slows enough to bring down inflation while avoiding a recession. It also began to allow up to billions in Treasuries and mortgage bonds to mature every month without investing the proceeds. Despite another rate hike of 75 basis points in July, the index rose 2.44% for the month, only to reverse course (-2.83%) in August, when the Fed dashed hopes that it would soon “pivot” to an easier policy stance. For the full 12 months, shorter-term securities outpaced longer-term bonds, and higher-quality issues held up better than lower-rated bonds. Within the index, corporate bonds posted a return of -14.61%, trailing the -10.80% result for U.S. Treasuries. Outside the index, U.S. corporate high-yield bonds returned -10.43%, while U.S. Treasury Inflation-Protected Securities had a return of -5.98%.
Comments from Lead Portfolio Manager Ford O’Neil: For the fiscal year ending August 31, 2022, the fund’s share classes (excluding sales charges, if applicable) returned -12% to -11%, net of fees, compared with the -11.52% result of the benchmark, the Bloomberg U.S. Aggregate Bond Index. The fund had a shorter duration (less interest-rate sensitivity), which boosted relative performance as interest rates rose. Underweighting mortgage-backed securities also aided the fund’s relative return, as did non-index exposure to Treasury Inflation-Protected Securities (TIPS), which we owned early in the period. In contrast, allocations to “plus” sectors – including high-yield bonds, leveraged loans and emerging markets debt – detracted, given that these segments underperformed the benchmark in an environment that favored higher-quality sectors. Likewise, among investment-grade holdings, overweighting BBB-rated corporate bonds detracted, as these lower-quality securities lagged high-quality corporate bonds. Overweighting asset-backed securities, including collateralized loan obligations (CLOs), and commercial mortgage-backed securities also hindered the relative result. A stake in international credit was another performance headwind.
The views expressed above reflect those of the portfolio manager(s) only through the end of the period as stated on the cover of this report and do not necessarily represent the views of Fidelity or any other person in the Fidelity organization. Any such views are subject to change at any time based upon market or other conditions and Fidelity disclaims any responsibility to update such views. These views may not be relied on as investment advice and, because investment decisions for a Fidelity fund are based on numerous factors, may not be relied on as an indication of trading intent on behalf of any Fidelity fund.
Note to shareholders: On October 1, 2021, Lisa Easterbrook assumed co-management responsibilities for the fund’s International Investment Grade sub-portfolio.
On January 3, 2022, Benjamin Harrison assumed co-management responsibilities for the fund’s High Income sub-portfolio.
On October 1, 2022, Matthew Torchia assumed co-management responsibilities for the fund’s real estate high income sleeve.
On October 1, 2022, Celso Munoz became co-lead manager alongside Ford O’Neil. In addition, Franco Castagliuolo assumed co-management responsibilities for the fund.
Investment Summary (Unaudited)
Quality Diversification (% of fund's net assets)
| As of August 31, 2022 |
| | U.S. Government and U.S. Government Agency Obligations | 37.9% |
| | AAA | 7.7% |
| | AA | 2.2% |
| | A | 9.3% |
| | BBB | 22.4% |
| | BB and Below | 15.9% |
| | Not Rated | 2.7% |
| | Equities | 0.2% |
| | Short-Term Investments and Net Other Assets | 1.7% |

We have used ratings from Moody’s Investors Service, Inc. Where Moody’s® ratings are not available, we have used S&P® ratings. All ratings are as of the date indicated and do not reflect subsequent changes. Securities rated BB or below were rated investment grade at the time of acquisition.
Asset Allocation (% of fund's net assets)
| As of August 31, 2022* |
| | Corporate Bonds | 38.6% |
| | U.S. Government and U.S. Government Agency Obligations | 37.9% |
| | Asset-Backed Securities | 6.3% |
| | CMOs and Other Mortgage Related Securities | 5.7% |
| | Municipal Bonds | 0.5% |
| | Stocks | 0.2% |
| | Other Investments | 9.1% |
| | Short-Term Investments and Net Other Assets (Liabilities) | 1.7% |
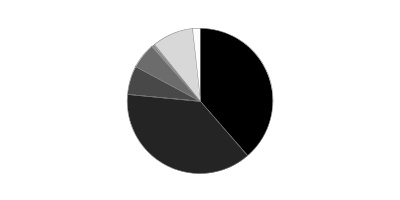
* Futures and Swaps – 0.6%
Geographic Diversification (% of fund's net assets)
| As of August 31, 2022 |
| | United States of America* | 84.2% |
| | Cayman Islands | 5.4% |
| | United Kingdom | 1.6% |
| | Mexico | 1.3% |
| | Ireland | 0.5% |
| | Canada | 1.0% |
| | France | 0.7% |
| | Luxembourg | 0.7% |
| | Switzerland | 0.7% |
| | Other | 3.9% |

* Includes Short-Term investments and Net Other Assets (Liabilities).
Percentages are based on country or territory of incorporation and are adjusted for the effect of futures contracts, if applicable.
Percentages in the above tables are adjusted for the effect of TBA Sale Commitments.
Schedule of Investments August 31, 2022
Showing Percentage of Net Assets
| Corporate Bonds - 38.6% | | | |
| | | Principal Amount(a) | Value |
| Convertible Bonds - 0.1% | | | |
| COMMUNICATION SERVICES - 0.0% | | | |
| Media - 0.0% | | | |
| DISH Network Corp.: | | | |
| 2.375% 3/15/24 | | $7,513,000 | $6,780,483 |
| 3.375% 8/15/26 | | 10,200,000 | 7,339,526 |
| | | | 14,120,009 |
| ENERGY - 0.1% | | | |
| Oil, Gas & Consumable Fuels - 0.1% | | | |
| Mesquite Energy, Inc. 15% 7/15/23 (b)(c) | | 894,620 | 6,071,160 |
| Mesquite Energy, Inc. 15% 7/15/23 (b)(c) | | 1,544,200 | 10,479,404 |
| | | | 16,550,564 |
|
| TOTAL CONVERTIBLE BONDS | | | 30,670,573 |
|
| Nonconvertible Bonds - 38.5% | | | |
| COMMUNICATION SERVICES - 3.9% | | | |
| Diversified Telecommunication Services - 1.0% | | | |
| Altice France SA: | | | |
| 5.125% 1/15/29 (d) | | 13,750,000 | 10,677,948 |
| 5.125% 7/15/29 (d) | | 5,125,000 | 3,893,258 |
| 5.5% 1/15/28 (d) | | 4,280,000 | 3,483,214 |
| 5.5% 10/15/29 (d) | | 35,000 | 27,640 |
| AT&T, Inc.: | | | |
| 2.55% 12/1/33 | | 6,621,000 | 5,275,392 |
| 3.8% 12/1/57 | | 15,250,000 | 11,543,781 |
| 4.3% 2/15/30 | | 10,373,000 | 9,949,662 |
| 5.15% 11/15/46 | | 12,000,000 | 11,591,953 |
| Axtel S.A.B. de CV 6.375% 11/14/24 (d) | | 276,000 | 209,381 |
| C&W Senior Financing Designated Activity Co. 6.875% 9/15/27 (d) | | 27,297,000 | 24,089,603 |
| Cablevision Lightpath LLC: | | | |
| 3.875% 9/15/27 (d) | | 1,135,000 | 990,549 |
| 5.625% 9/15/28 (d) | | 895,000 | 729,260 |
| Colombia Telecomunicaciones SA 4.95% 7/17/30 (d) | | 560,000 | 464,030 |
| Consolidated Communications, Inc. 5% 10/1/28 (d) | | 1,385,000 | 1,066,884 |
| Frontier Communications Holdings LLC: | | | |
| 5% 5/1/28 (d) | | 8,390,000 | 7,353,499 |
| 5.875% 10/15/27 (d) | | 2,511,000 | 2,342,135 |
| 5.875% 11/1/29 | | 3,395,000 | 2,771,169 |
| 6% 1/15/30 (d) | | 2,920,000 | 2,406,138 |
| 8.75% 5/15/30 (d) | | 2,730,000 | 2,810,207 |
| IHS Holding Ltd. 5.625% 11/29/26 (d) | | 1,535,000 | 1,321,827 |
| Iliad SA: | | | |
| 0.75% 2/11/24 (Reg. S) | EUR | 13,900,000 | 13,322,748 |
| 1.5% 10/14/24 (Reg. S) | EUR | 1,800,000 | 1,723,537 |
| 1.875% 2/11/28 (Reg. S) | EUR | 1,800,000 | 1,508,269 |
| Level 3 Financing, Inc.: | | | |
| 3.625% 1/15/29 (d) | | 840,000 | 674,192 |
| 4.25% 7/1/28 (d) | | 8,820,000 | 7,331,625 |
| Liquid Telecommunications Financing PLC 5.5% 9/4/26 (d) | | 1,630,000 | 1,320,300 |
| Lumen Technologies, Inc.: | | | |
| 4.5% 1/15/29 (d) | | 14,110,000 | 10,525,919 |
| 5.125% 12/15/26 (d) | | 8,365,000 | 7,228,071 |
| Qtel International Finance Ltd.: | | | |
| 2.625% 4/8/31 (d) | | 1,235,000 | 1,100,694 |
| 3.25% 2/21/23 (d) | | 1,185,000 | 1,180,853 |
| 5% 10/19/25 (d) | | 660,000 | 676,211 |
| Sable International Finance Ltd. 5.75% 9/7/27 (d) | | 2,050,000 | 1,870,625 |
| Sprint Capital Corp.: | | | |
| 6.875% 11/15/28 | | 4,865,000 | 5,137,172 |
| 8.75% 3/15/32 | | 4,150,000 | 5,009,963 |
| Telecom Italia Capital SA: | | | |
| 6% 9/30/34 | | 2,030,000 | 1,639,225 |
| 7.2% 7/18/36 | | 2,599,000 | 2,217,857 |
| 7.721% 6/4/38 | | 605,000 | 517,336 |
| Telefonica Celular del Paraguay SA 5.875% 4/15/27 (d) | | 1,260,000 | 1,195,110 |
| Telenet Finance Luxembourg Notes SARL 5.5% 3/1/28 (d) | | 7,800,000 | 7,098,000 |
| Turk Telekomunikasyon A/S 6.875% 2/28/25 (d) | | 2,050,000 | 1,825,525 |
| Verizon Communications, Inc.: | | | |
| 2.1% 3/22/28 | | 22,884,000 | 20,224,212 |
| 2.55% 3/21/31 | | 21,181,000 | 17,902,260 |
| 2.987% 10/30/56 | | 39,193,000 | 26,345,421 |
| 3% 3/22/27 | | 5,131,000 | 4,853,427 |
| 4.862% 8/21/46 | | 26,720,000 | 25,980,637 |
| 5.012% 4/15/49 | | 569,000 | 564,842 |
| Windstream Escrow LLC 7.75% 8/15/28 (d) | | 12,530,000 | 10,770,549 |
| Zayo Group Holdings, Inc.: | | | |
| 4% 3/1/27 (d) | | 2,850,000 | 2,429,625 |
| 6.125% 3/1/28 (d) | | 2,415,000 | 1,849,359 |
| | | | 287,021,094 |
| Entertainment - 0.3% | | | |
| Roblox Corp. 3.875% 5/1/30 (d) | | 5,810,000 | 4,846,531 |
| The Walt Disney Co.: | | | |
| 3.8% 3/22/30 | | 39,850,000 | 38,520,969 |
| 4.7% 3/23/50 | | 29,296,000 | 29,297,646 |
| Universal Music Group NV 3.75% 6/30/32 (Reg. S) | EUR | 1,625,000 | 1,627,122 |
| | | | 74,292,268 |
| Interactive Media & Services - 0.0% | | | |
| Baidu, Inc.: | | | |
| 1.72% 4/9/26 | | 1,135,000 | 1,029,791 |
| 2.375% 10/9/30 | | 635,000 | 524,129 |
| Tencent Holdings Ltd.: | | | |
| 1.81% 1/26/26 (d) | | 645,000 | 591,426 |
| 2.39% 6/3/30 (d) | | 800,000 | 666,416 |
| 2.88% 4/22/31 (d) | | 530,000 | 453,102 |
| 3.975% 4/11/29 (d) | | 480,000 | 451,680 |
| | | | 3,716,544 |
| Media - 2.1% | | | |
| Advantage Sales & Marketing, Inc. 6.5% 11/15/28 (d) | | 12,095,000 | 10,401,700 |
| Altice Financing SA: | | | |
| 5% 1/15/28 (d) | | 5,435,000 | 4,385,448 |
| 5.75% 8/15/29 (d) | | 21,675,000 | 17,483,271 |
| Altice France Holding SA 6% 2/15/28 (d) | | 11,415,000 | 7,762,200 |
| Cable Onda SA 4.5% 1/30/30 (d) | | 1,795,000 | 1,573,991 |
| CCO Holdings LLC/CCO Holdings Capital Corp.: | | | |
| 4.25% 2/1/31 (d) | | 7,995,000 | 6,523,480 |
| 4.25% 1/15/34 (d) | | 4,085,000 | 3,110,156 |
| 4.5% 8/15/30 (d) | | 3,170,000 | 2,665,891 |
| 4.5% 5/1/32 | | 6,775,000 | 5,497,777 |
| 4.5% 6/1/33 (d) | | 4,740,000 | 3,720,900 |
| 4.75% 3/1/30 (d) | | 11,600,000 | 9,970,606 |
| 5% 2/1/28 (d) | | 5,814,000 | 5,312,949 |
| 5.375% 6/1/29 (d) | | 3,411,000 | 3,116,307 |
| Charter Communications Operating LLC/Charter Communications Operating Capital Corp.: | | | |
| 3.85% 4/1/61 | | 3,000,000 | 1,918,765 |
| 3.9% 6/1/52 | | 4,000,000 | 2,710,209 |
| 4.4% 4/1/33 | | 24,687,000 | 21,823,619 |
| 4.8% 3/1/50 | | 8,000,000 | 6,279,367 |
| 4.908% 7/23/25 | | 13,008,000 | 12,963,412 |
| 5.25% 4/1/53 | | 46,711,000 | 39,078,000 |
| 5.375% 5/1/47 | | 32,692,000 | 27,862,994 |
| 5.5% 4/1/63 | | 36,711,000 | 30,718,040 |
| 6.484% 10/23/45 | | 9,078,000 | 8,665,279 |
| 6.834% 10/23/55 | | 3,000,000 | 2,998,333 |
| Comcast Corp.: | | | |
| 3.9% 3/1/38 | | 3,341,000 | 3,003,470 |
| 4.65% 7/15/42 | | 7,870,000 | 7,410,873 |
| 6.45% 3/15/37 | | 1,399,000 | 1,613,874 |
| CSC Holdings LLC: | | | |
| 4.125% 12/1/30 (d) | | 3,005,000 | 2,434,050 |
| 4.5% 11/15/31 (d) | | 950,000 | 762,120 |
| 4.625% 12/1/30 (d) | | 9,945,000 | 7,110,675 |
| 5.375% 2/1/28 (d) | | 8,050,000 | 7,312,298 |
| 5.75% 1/15/30 (d) | | 4,775,000 | 3,697,951 |
| 7.5% 4/1/28 (d) | | 7,611,000 | 6,765,342 |
| Diamond Sports Group LLC/Diamond Sports Finance Co. 5.375% 8/15/26 (d) | | 15,945,000 | 3,029,550 |
| Discovery Communications LLC: | | | |
| 3.625% 5/15/30 | | 13,528,000 | 11,852,043 |
| 4.65% 5/15/50 | | 36,524,000 | 27,747,059 |
| Dolya Holdco 18 DAC 5% 7/15/28 (d) | | 2,335,000 | 1,994,194 |
| Fox Corp.: | | | |
| 4.03% 1/25/24 | | 4,055,000 | 4,044,508 |
| 4.709% 1/25/29 | | 5,868,000 | 5,807,270 |
| 5.476% 1/25/39 | | 5,787,000 | 5,688,839 |
| 5.576% 1/25/49 | | 3,840,000 | 3,712,699 |
| Lagardere S.C.A. 2.125% 10/16/26 (Reg. S) | EUR | 4,800,000 | 4,580,073 |
| LCPR Senior Secured Financing DAC 5.125% 7/15/29 (d) | | 1,905,000 | 1,638,300 |
| Magallanes, Inc.: | | | |
| 3.428% 3/15/24 (d) | | 14,745,000 | 14,413,968 |
| 3.638% 3/15/25 (d) | | 8,076,000 | 7,797,508 |
| 3.755% 3/15/27 (d) | | 15,793,000 | 14,751,945 |
| 4.054% 3/15/29 (d) | | 5,474,000 | 4,984,588 |
| 4.279% 3/15/32 (d) | | 42,020,000 | 36,613,449 |
| 5.05% 3/15/42 (d) | | 11,773,000 | 9,624,563 |
| 5.141% 3/15/52 (d) | | 59,938,000 | 47,974,182 |
| News Corp. 5.125% 2/15/32 (d) | | 2,385,000 | 2,194,200 |
| Radiate Holdco LLC/Radiate Financial Service Ltd.: | | | |
| 4.5% 9/15/26 (d) | | 7,020,000 | 6,051,240 |
| 6.5% 9/15/28 (d) | | 11,867,000 | 8,837,830 |
| Sinclair Television Group, Inc. 5.5% 3/1/30 (d) | | 2,530,000 | 1,983,157 |
| Sirius XM Radio, Inc.: | | | |
| 4% 7/15/28 (d) | | 8,390,000 | 7,309,997 |
| 4.125% 7/1/30 (d) | | 1,175,000 | 995,542 |
| 5.5% 7/1/29 (d) | | 1,410,000 | 1,318,463 |
| TEGNA, Inc.: | | | |
| 4.625% 3/15/28 | | 2,830,000 | 2,711,480 |
| 5% 9/15/29 | | 1,100,000 | 1,052,931 |
| Time Warner Cable LLC: | | | |
| 4.5% 9/15/42 | | 18,291,000 | 13,825,238 |
| 5.5% 9/1/41 | | 8,265,000 | 7,096,291 |
| 5.875% 11/15/40 | | 10,540,000 | 9,442,324 |
| 6.55% 5/1/37 | | 29,622,000 | 29,096,281 |
| 7.3% 7/1/38 | | 24,672,000 | 25,345,453 |
| TV Azteca SA de CV 8.25% 8/9/24 (Reg. S) (e) | | 4,321,000 | 2,192,367 |
| Univision Communications, Inc.: | | | |
| 4.5% 5/1/29 (d) | | 3,215,000 | 2,812,321 |
| 6.625% 6/1/27 (d) | | 3,245,000 | 3,131,491 |
| Virgin Media Secured Finance PLC 4.5% 8/15/30 (d) | | 4,925,000 | 4,101,048 |
| VTR Finance BV 6.375% 7/15/28 (d) | | 830,000 | 364,837 |
| Ziggo Bond Co. BV 5.125% 2/28/30 (d) | | 2,505,000 | 2,005,253 |
| Ziggo BV 4.875% 1/15/30 (d) | | 2,545,000 | 2,148,485 |
| | | | 616,924,314 |
| Wireless Telecommunication Services - 0.5% | | | |
| AXIAN Telecom 7.375% 2/16/27 (d) | | 1,350,000 | 1,235,250 |
| Bharti Airtel International BV 5.35% 5/20/24 (d) | | 1,560,000 | 1,574,918 |
| CT Trust 5.125% 2/3/32 (d) | | 1,755,000 | 1,511,274 |
| Digicel Group Ltd. 6.75% 3/1/23 (d) | | 731,000 | 461,371 |
| Intelsat Jackson Holdings SA 6.5% 3/15/30 (d) | | 8,635,000 | 7,827,455 |
| Millicom International Cellular SA: | | | |
| 4.5% 4/27/31 (d) | | 7,330,000 | 6,016,556 |
| 5.125% 1/15/28 (d) | | 711,000 | 652,168 |
| MTN (Mauritius) Investments Ltd.: | | | |
| 4.755% 11/11/24 (d) | | 745,000 | 743,510 |
| 6.5% 10/13/26 (d) | | 819,000 | 832,462 |
| Rogers Communications, Inc.: | | | |
| 3.2% 3/15/27 (d) | | 17,146,000 | 16,313,276 |
| 3.8% 3/15/32 (d) | | 14,963,000 | 13,656,820 |
| T-Mobile U.S.A., Inc.: | | | |
| 2.25% 11/15/31 | | 35,000,000 | 28,078,717 |
| 3.75% 4/15/27 | | 23,850,000 | 22,869,781 |
| 3.875% 4/15/30 | | 42,000,000 | 38,817,529 |
| 4.375% 4/15/40 | | 5,147,000 | 4,539,954 |
| 4.5% 4/15/50 | | 10,111,000 | 8,822,959 |
| VimpelCom Holdings BV 7.25% 4/26/23 (d) | | 1,155,000 | 913,172 |
| Vodafone Group PLC: | | | |
| 4.875% 10/3/78 (Reg. S) (f) | GBP | 5,150,000 | 5,549,005 |
| 6.25% 10/3/78 (Reg. S) (f) | | 1,000,000 | 967,200 |
| VTR Comunicaciones SpA: | | | |
| 4.375% 4/15/29 (d) | | 565,000 | 342,531 |
| 5.125% 1/15/28 (d) | | 1,568,000 | 1,047,424 |
| | | | 162,773,332 |
| TOTAL COMMUNICATION SERVICES | | | 1,144,727,552 |
| CONSUMER DISCRETIONARY - 1.7% | | | |
| Auto Components - 0.0% | | | |
| Metalsa SA de CV 3.75% 5/4/31 (d) | | 1,225,000 | 917,831 |
| Tupy Overseas SA 4.5% 2/16/31 (d) | | 1,220,000 | 998,341 |
| Valeo SA 1% 8/3/28 (Reg. S) | EUR | 3,300,000 | 2,604,550 |
| ZF Europe Finance BV 2% 2/23/26 (Reg. S) | EUR | 1,600,000 | 1,358,692 |
| ZF Finance GmbH 2% 5/6/27 (Reg. S) | EUR | 2,600,000 | 2,079,463 |
| | | | 7,958,877 |
| Automobiles - 0.1% | | | |
| General Motors Financial Co., Inc.: | | | |
| 4% 1/15/25 | | 11,521,000 | 11,376,560 |
| 4.25% 5/15/23 | | 3,453,000 | 3,454,508 |
| Rivian Holdco & Rivian LLC & Rivian Automotive LLC 6 month U.S. LIBOR + 5.620% 7.1766% 10/15/26 (d)(f)(g) | | 12,815,000 | 11,885,913 |
| Volkswagen Group of America Finance LLC 3.125% 5/12/23 (d) | | 19,413,000 | 19,310,462 |
| | | | 46,027,443 |
| Diversified Consumer Services - 0.2% | | | |
| Adtalem Global Education, Inc. 5.5% 3/1/28 (d) | | 6,993,000 | 6,643,350 |
| GEMS MENASA Cayman Ltd. 7.125% 7/31/26 (d) | | 12,755,000 | 12,063,838 |
| Ingersoll-Rand Global Holding Co. Ltd. 4.25% 6/15/23 | | 5,393,000 | 5,407,679 |
| Service Corp. International: | | | |
| 4% 5/15/31 | | 3,715,000 | 3,175,454 |
| 5.125% 6/1/29 | | 4,485,000 | 4,249,134 |
| Sotheby's 7.375% 10/15/27 (d) | | 11,468,000 | 10,811,113 |
| WASH Multifamily Acquisition, Inc. 5.75% 4/15/26 (d) | | 9,925,000 | 9,567,402 |
| | | | 51,917,970 |
| Hotels, Restaurants & Leisure - 0.6% | | | |
| 1011778 BC Unlimited Liability Co./New Red Finance, Inc.: | | | |
| 4% 10/15/30 (d) | | 3,260,000 | 2,645,702 |
| 4.375% 1/15/28 (d) | | 4,880,000 | 4,362,540 |
| 5.75% 4/15/25 (d) | | 110,000 | 110,550 |
| Accor SA 2.375% 11/29/28 (Reg. S) | EUR | 2,600,000 | 2,175,214 |
| Affinity Gaming LLC 6.875% 12/15/27 (d) | | 7,520,000 | 6,530,255 |
| Aramark Services, Inc.: | | | |
| 5% 2/1/28 (d) | | 2,324,000 | 2,138,824 |
| 6.375% 5/1/25 (d) | | 480,000 | 475,800 |
| Caesars Entertainment, Inc.: | | | |
| 6.25% 7/1/25 (d) | | 4,730,000 | 4,618,419 |
| 8.125% 7/1/27 (d) | | 24,080,000 | 23,657,878 |
| Carnival Corp.: | | | |
| 5.75% 3/1/27 (d) | | 10,365,000 | 8,078,377 |
| 6% 5/1/29 (d) | | 7,535,000 | 5,691,568 |
| 6.65% 1/15/28 | | 450,000 | 322,695 |
| 7.625% 3/1/26 (d) | | 11,355,000 | 9,651,750 |
| Fertitta Entertainment LLC / Fertitta Entertainment Finance Co., Inc. 6.75% 1/15/30 (d) | | 6,295,000 | 5,133,195 |
| Garden SpinCo Corp. 8.625% 7/20/30 (d) | | 935,000 | 995,775 |
| GENM Capital Labuan Ltd. 3.882% 4/19/31 (d) | | 1,585,000 | 1,227,682 |
| Golden Entertainment, Inc. 7.625% 4/15/26 (d) | | 5,841,000 | 5,972,423 |
| Hilton Domestic Operating Co., Inc.: | | | |
| 3.625% 2/15/32 (d) | | 5,580,000 | 4,504,818 |
| 3.75% 5/1/29 (d) | | 750,000 | 647,078 |
| 4% 5/1/31 (d) | | 2,700,000 | 2,281,901 |
| 5.75% 5/1/28 (d) | | 420,000 | 410,630 |
| Hilton Grand Vacations Borrower Escrow LLC 4.875% 7/1/31 (d) | | 1,425,000 | 1,176,338 |
| InterContinental Hotel Group PLC 3.375% 10/8/28 (Reg. S) | GBP | 6,990,000 | 7,164,363 |
| Jacobs Entertainment, Inc. 6.75% 2/15/29 (d) | | 1,370,000 | 1,215,875 |
| MajorDrive Holdings IV LLC 6.375% 6/1/29 (d) | | 2,105,000 | 1,617,229 |
| Marriott Ownership Resorts, Inc.: | | | |
| 4.5% 6/15/29 (d) | | 400,000 | 337,238 |
| 4.75% 1/15/28 | | 1,395,000 | 1,219,651 |
| 6.125% 9/15/25 (d) | | 683,000 | 680,731 |
| McDonald's Corp.: | | | |
| 3.5% 7/1/27 | | 6,642,000 | 6,447,754 |
| 3.6% 7/1/30 | | 7,896,000 | 7,486,409 |
| 4.2% 4/1/50 | | 3,991,000 | 3,532,901 |
| NagaCorp Ltd. 7.95% 7/6/24 (Reg. S) | | 2,050,000 | 1,851,150 |
| NCL Corp. Ltd.: | | | |
| 3.625% 12/15/24 (d) | | 5,315,000 | 4,605,822 |
| 5.875% 3/15/26 (d) | | 1,345,000 | 1,087,628 |
| 7.75% 2/15/29 (d) | | 2,845,000 | 2,311,773 |
| NCL Finance Ltd. 6.125% 3/15/28 (d) | | 960,000 | 745,430 |
| Premier Entertainment Sub LLC: | | | |
| 5.625% 9/1/29 (d) | | 3,770,000 | 2,784,597 |
| 5.875% 9/1/31 (d) | | 1,790,000 | 1,250,906 |
| Royal Caribbean Cruises Ltd.: | | | |
| 4.25% 7/1/26 (d) | | 5,550,000 | 4,263,893 |
| 5.375% 7/15/27 (d) | | 2,130,000 | 1,647,842 |
| 5.5% 8/31/26 (d) | | 5,685,000 | 4,544,248 |
| 5.5% 4/1/28 (d) | | 7,300,000 | 5,614,284 |
| 9.125% 6/15/23 (d) | | 225,000 | 227,243 |
| 10.875% 6/1/23 (d) | | 1,070,000 | 1,089,399 |
| 11.625% 8/15/27 (d) | | 870,000 | 854,914 |
| Station Casinos LLC 4.5% 2/15/28 (d) | | 2,371,000 | 2,042,445 |
| Sugarhouse HSP Gaming Prop Mezz LP/Sugarhouse HSP Gaming Finance Corp. 5.875% 5/15/25 (d) | | 618,000 | 572,520 |
| Times Square Hotel Trust 8.528% 8/1/26 (d) | | 776,358 | 789,797 |
| Viking Ocean Cruises Ship VII Ltd. 5.625% 2/15/29 (d) | | 950,000 | 776,397 |
| Voc Escrow Ltd. 5% 2/15/28 (d) | | 2,170,000 | 1,833,650 |
| Whitbread PLC: | | | |
| 2.375% 5/31/27 (Reg. S) | GBP | 1,850,000 | 1,862,260 |
| 3.375% 10/16/25 (Reg. S) | GBP | 6,600,000 | 7,194,413 |
| Wyndham Hotels & Resorts, Inc. 4.375% 8/15/28 (d) | | 2,700,000 | 2,414,782 |
| Wynn Las Vegas LLC/Wynn Las Vegas Capital Corp. 5.25% 5/15/27 (d) | | 4,848,000 | 4,372,557 |
| Yum! Brands, Inc. 4.625% 1/31/32 | | 5,170,000 | 4,567,540 |
| | | | 181,817,053 |
| Household Durables - 0.0% | | | |
| Adams Homes, Inc. 7.5% 2/15/25 (d) | | 505,000 | 437,818 |
| Ashton Woods U.S.A. LLC/Ashton Woods Finance Co. 4.625% 8/1/29 (d) | | 1,345,000 | 1,055,588 |
| The Berkeley Group PLC 2.5% 8/11/31 (Reg. S) | GBP | 3,350,000 | 2,722,924 |
| TopBuild Corp. 4.125% 2/15/32 (d) | | 5,005,000 | 4,122,111 |
| | | | 8,338,441 |
| Internet & Direct Marketing Retail - 0.1% | | | |
| Alibaba Group Holding Ltd. 2.125% 2/9/31 | | 1,100,000 | 915,321 |
| B2W Digital Lux SARL 4.375% 12/20/30 (d) | | 2,335,000 | 1,791,091 |
| JD.com, Inc. 3.375% 1/14/30 | | 2,255,000 | 2,049,186 |
| Match Group Holdings II LLC: | | | |
| 4.125% 8/1/30 (d) | | 2,650,000 | 2,192,724 |
| 5% 12/15/27 (d) | | 2,650,000 | 2,444,625 |
| Meituan: | | | |
| 2.125% 10/28/25 (d) | | 1,375,000 | 1,216,875 |
| 3.05% 10/28/30 (d) | | 1,235,000 | 890,975 |
| Prosus NV: | | | |
| 3.257% 1/19/27 (d) | | 850,000 | 735,250 |
| 3.68% 1/21/30 (d) | | 1,145,000 | 922,790 |
| 4.027% 8/3/50 (d) | | 1,605,000 | 1,015,463 |
| Terrier Media Buyer, Inc. 8.875% 12/15/27 (d) | | 1,835,000 | 1,578,147 |
| Uber Technologies, Inc. 8% 11/1/26 (d) | | 7,245,000 | 7,319,425 |
| | | | 23,071,872 |
| Leisure Products - 0.1% | | | |
| Hasbro, Inc. 3% 11/19/24 | | 16,110,000 | 15,705,446 |
| Mattel, Inc.: | | | |
| 3.375% 4/1/26 (d) | | 3,230,000 | 2,934,697 |
| 3.75% 4/1/29 (d) | | 7,105,000 | 6,330,555 |
| 5.875% 12/15/27 (d) | | 2,650,000 | 2,638,711 |
| | | | 27,609,409 |
| Multiline Retail - 0.1% | | | |
| John Lewis PLC 6.125% 1/21/25 | GBP | 7,718,000 | 9,004,375 |
| Marks & Spencer PLC: | | | |
| 3.75% 5/19/26 (Reg. S) | GBP | 5,980,000 | 6,069,981 |
| 4.5% 7/10/27 (Reg. S) | GBP | 2,400,000 | 2,401,234 |
| Nordstrom, Inc.: | | | |
| 4.25% 8/1/31 | | 2,260,000 | 1,655,450 |
| 4.375% 4/1/30 | | 1,505,000 | 1,146,524 |
| | | | 20,277,564 |
| Specialty Retail - 0.5% | | | |
| AutoNation, Inc. 4.75% 6/1/30 | | 2,958,000 | 2,768,824 |
| AutoZone, Inc.: | | | |
| 3.625% 4/15/25 | | 4,471,000 | 4,402,276 |
| 4% 4/15/30 | | 20,750,000 | 19,696,844 |
| Bath & Body Works, Inc. 6.694% 1/15/27 | | 955,000 | 929,119 |
| Carvana Co.: | | | |
| 4.875% 9/1/29 (d) | | 1,850,000 | 1,051,744 |
| 5.5% 4/15/27 (d) | | 3,025,000 | 1,960,655 |
| 5.875% 10/1/28 (d) | | 760,000 | 456,000 |
| 10.25% 5/1/30 (d) | | 440,000 | 350,359 |
| Foot Locker, Inc. 4% 10/1/29 (d) | | 4,845,000 | 3,948,675 |
| LBM Acquisition LLC 6.25% 1/15/29 (d) | | 3,310,000 | 2,473,433 |
| Lowe's Companies, Inc.: | | | |
| 3.35% 4/1/27 | | 2,389,000 | 2,302,772 |
| 3.75% 4/1/32 | | 17,354,000 | 15,981,671 |
| 4.25% 4/1/52 | | 29,879,000 | 25,447,573 |
| 4.45% 4/1/62 | | 33,905,000 | 28,633,032 |
| 4.5% 4/15/30 | | 15,047,000 | 14,827,962 |
| Michaels Companies, Inc.: | | | |
| 5.25% 5/1/28 (d) | | 1,985,000 | 1,521,900 |
| 7.875% 5/1/29 (d) | | 1,530,000 | 1,017,450 |
| O'Reilly Automotive, Inc. 4.2% 4/1/30 | | 4,640,000 | 4,461,148 |
| VIA Outlets 1.75% 11/15/28 (Reg. S) | EUR | 3,850,000 | 3,129,750 |
| | | | 135,361,187 |
| Textiles, Apparel & Luxury Goods - 0.0% | | | |
| Kontoor Brands, Inc. 4.125% 11/15/29 (d) | | 800,000 | 682,278 |
| Levi Strauss & Co. 3.5% 3/1/31 (d) | | 3,360,000 | 2,822,165 |
| Wolverine World Wide, Inc. 4% 8/15/29 (d) | | 4,440,000 | 3,614,157 |
| | | | 7,118,600 |
| TOTAL CONSUMER DISCRETIONARY | | | 509,498,416 |
| CONSUMER STAPLES - 2.3% | | | |
| Beverages - 1.1% | | | |
| Anheuser-Busch Companies LLC / Anheuser-Busch InBev Worldwide, Inc. 4.9% 2/1/46 | | 10,000,000 | 9,493,581 |
| Anheuser-Busch InBev Finance, Inc.: | | | |
| 4.7% 2/1/36 | | 23,011,000 | 22,262,862 |
| 4.9% 2/1/46 | | 28,689,000 | 27,236,133 |
| Anheuser-Busch InBev Worldwide, Inc.: | | | |
| 3.5% 6/1/30 | | 33,300,000 | 31,302,195 |
| 4.35% 6/1/40 | | 13,754,000 | 12,510,937 |
| 4.5% 6/1/50 | | 35,000,000 | 31,734,211 |
| 4.6% 6/1/60 | | 14,912,000 | 13,227,904 |
| 4.75% 4/15/58 | | 17,929,000 | 16,360,228 |
| 5.45% 1/23/39 | | 18,170,000 | 18,730,121 |
| 5.55% 1/23/49 | | 34,229,000 | 35,588,336 |
| 5.8% 1/23/59 (Reg. S) | | 36,395,000 | 38,817,273 |
| Central American Bottling Corp. 5.25% 4/27/29 (d) | | 1,195,000 | 1,100,894 |
| Primo Water Holdings, Inc. 4.375% 4/30/29 (d) | | 7,475,000 | 6,389,600 |
| The Coca-Cola Co.: | | | |
| 3.375% 3/25/27 | | 24,915,000 | 24,619,382 |
| 3.45% 3/25/30 | | 13,895,000 | 13,374,798 |
| Triton Water Holdings, Inc. 6.25% 4/1/29 (d) | | 13,045,000 | 10,699,509 |
| | | | 313,447,964 |
| Food & Staples Retailing - 0.2% | | | |
| Albertsons Companies LLC/Safeway, Inc./New Albertson's, Inc./Albertson's LLC: | | | |
| 3.5% 3/15/29 (d) | | 14,635,000 | 12,027,043 |
| 4.875% 2/15/30 (d) | | 3,660,000 | 3,205,245 |
| C&S Group Enterprises LLC 5% 12/15/28 (d) | | 9,765,000 | 7,219,174 |
| NBM U.S. Holdings, Inc. 6.625% 8/6/29 (d) | | 3,100,000 | 3,011,456 |
| Performance Food Group, Inc. 5.5% 10/15/27 (d) | | 2,247,000 | 2,118,090 |
| Sysco Corp.: | | | |
| 5.95% 4/1/30 | | 8,801,000 | 9,466,526 |
| 6.6% 4/1/50 | | 13,280,000 | 15,395,315 |
| U.S. Foods, Inc.: | | | |
| 4.625% 6/1/30 (d) | | 1,130,000 | 974,625 |
| 4.75% 2/15/29 (d) | | 3,290,000 | 2,932,097 |
| | | | 56,349,571 |
| Food Products - 0.5% | | | |
| Adecoagro SA 6% 9/21/27 (d) | | 2,090,000 | 1,954,777 |
| Camposol SA 6% 2/3/27 (d) | | 605,000 | 519,090 |
| Darling Ingredients, Inc. 6% 6/15/30 (d) | | 1,365,000 | 1,366,720 |
| JBS U.S.A. Lux SA / JBS Food Co.: | | | |
| 2.5% 1/15/27 (d) | | 33,645,000 | 30,193,359 |
| 3% 5/15/32 (d) | | 33,235,000 | 27,461,416 |
| 3.625% 1/15/32 (d) | | 9,085,000 | 7,853,256 |
| 5.125% 2/1/28 (d) | | 11,235,000 | 11,220,955 |
| 5.5% 1/15/30 (d) | | 10,315,000 | 10,315,000 |
| 5.75% 4/1/33 (d) | | 23,135,000 | 23,046,393 |
| 6.5% 4/15/29 (d) | | 1,639,000 | 1,700,315 |
| JDE Peet's BV 2.25% 9/24/31 (d) | | 7,550,000 | 5,805,588 |
| Lamb Weston Holdings, Inc. 4.125% 1/31/30 (d) | | 6,450,000 | 5,813,063 |
| Post Holdings, Inc.: | | | |
| 4.625% 4/15/30 (d) | | 2,555,000 | 2,218,928 |
| 5.5% 12/15/29 (d) | | 3,595,000 | 3,294,476 |
| TreeHouse Foods, Inc. 4% 9/1/28 | | 1,280,000 | 1,073,152 |
| | | | 133,836,488 |
| Personal Products - 0.0% | | | |
| GSK Consumer Healthcare Capital 2.125% 3/29/34 (Reg. S) | EUR | 3,650,000 | 3,116,684 |
| Natura Cosmeticos SA 4.125% 5/3/28 (d) | | 1,800,000 | 1,480,838 |
| | | | 4,597,522 |
| Tobacco - 0.5% | | | |
| Altria Group, Inc.: | | | |
| 3.875% 9/16/46 | | 28,850,000 | 20,007,378 |
| 4.25% 8/9/42 | | 17,795,000 | 13,334,602 |
| 4.5% 5/2/43 | | 11,887,000 | 9,041,776 |
| 4.8% 2/14/29 | | 3,305,000 | 3,200,381 |
| 5.375% 1/31/44 | | 21,453,000 | 18,939,373 |
| 5.95% 2/14/49 | | 14,275,000 | 12,812,018 |
| BAT International Finance PLC 2.25% 6/26/28 (Reg. S) | GBP | 10,974,000 | 10,298,235 |
| Imperial Tobacco Finance PLC: | | | |
| 3.5% 7/26/26 (d) | | 12,260,000 | 11,348,377 |
| 4.25% 7/21/25 (d) | | 11,765,000 | 11,512,643 |
| 6.125% 7/27/27 (d) | | 12,116,000 | 12,299,050 |
| Reynolds American, Inc.: | | | |
| 4.45% 6/12/25 | | 9,399,000 | 9,310,160 |
| 5.7% 8/15/35 | | 2,699,000 | 2,488,605 |
| 5.85% 8/15/45 | | 22,737,000 | 19,210,665 |
| 6.15% 9/15/43 | | 2,874,000 | 2,655,527 |
| 7.25% 6/15/37 | | 3,221,000 | 3,310,162 |
| | | | 159,768,952 |
| TOTAL CONSUMER STAPLES | | | 668,000,497 |
| ENERGY - 5.0% | | | |
| Energy Equipment & Services - 0.1% | | | |
| Guara Norte SARL 5.198% 6/15/34 (d) | | 1,287,206 | 1,073,047 |
| Halliburton Co.: | | | |
| 3.8% 11/15/25 | | 152,000 | 150,383 |
| 4.85% 11/15/35 | | 5,447,000 | 5,175,846 |
| Oleoducto Central SA 4% 7/14/27 (d) | | 2,385,000 | 2,039,175 |
| Southern Gas Corridor CJSC 6.875% 3/24/26 (d) | | 3,041,000 | 3,192,670 |
| State Oil Co. of Azerbaijan Republic: | | | |
| 4.75% 3/13/23 (Reg. S) | | 435,000 | 433,043 |
| 6.95% 3/18/30 (Reg. S) | | 750,000 | 772,406 |
| Technip Energies NV 1.125% 5/28/28 | EUR | 5,000,000 | 4,038,056 |
| The Oil and Gas Holding Co.: | | | |
| 7.5% 10/25/27 (d) | | 1,677,000 | 1,706,348 |
| 7.625% 11/7/24 (d) | | 2,315,000 | 2,347,265 |
| 8.375% 11/7/28 (d) | | 485,000 | 509,038 |
| Transocean Guardian Ltd. 5.875% 1/15/24 (d) | | 1,655,523 | 1,568,608 |
| Transocean Phoenix 2 Ltd. 7.75% 10/15/24 (d) | | 341,999 | 335,159 |
| Transocean Pontus Ltd. 6.125% 8/1/25 (d) | | 854,000 | 817,705 |
| Transocean Poseidon Ltd. 6.875% 2/1/27 (d) | | 1,898,750 | 1,784,825 |
| Transocean Proteus Ltd. 6.25% 12/1/24 (d) | | 378,000 | 366,660 |
| Transocean Sentry Ltd. 5.375% 5/15/23 (d) | | 2,092,567 | 2,015,001 |
| | | | 28,325,235 |
| Oil, Gas & Consumable Fuels - 4.9% | | | |
| Apache Corp. 4.25% 1/15/30 | | 1,080,000 | 975,370 |
| Canacol Energy Ltd. 5.75% 11/24/28 (d) | | 985,000 | 848,208 |
| Canadian Natural Resources Ltd.: | | | |
| 2.95% 7/15/30 | | 23,000,000 | 20,034,190 |
| 3.9% 2/1/25 | | 15,925,000 | 15,665,948 |
| 5.85% 2/1/35 | | 6,942,000 | 6,913,538 |
| Cenovus Energy, Inc.: | | | |
| 3.75% 2/15/52 | | 3,670,000 | 2,834,510 |
| 4.25% 4/15/27 | | 22,916,000 | 22,572,610 |
| 5.4% 6/15/47 | | 4,073,000 | 3,946,853 |
| 6.75% 11/15/39 | | 7,587,000 | 8,293,736 |
| Citgo Holding, Inc. 9.25% 8/1/24 (d) | | 1,165,000 | 1,161,039 |
| Citgo Petroleum Corp.: | | | |
| 6.375% 6/15/26 (d) | | 10,100,000 | 9,612,141 |
| 7% 6/15/25 (d) | | 4,818,000 | 4,685,360 |
| Colgate Energy Partners III LLC: | | | |
| 5.875% 7/1/29 (d) | | 4,795,000 | 4,471,338 |
| 7.75% 2/15/26 (d) | | 1,465,000 | 1,463,725 |
| Columbia Pipeline Group, Inc. 4.5% 6/1/25 | | 2,999,000 | 2,986,814 |
| Comstock Resources, Inc.: | | | |
| 5.875% 1/15/30 (d) | | 4,680,000 | 4,281,796 |
| 6.75% 3/1/29 (d) | | 6,100,000 | 5,822,298 |
| Crestwood Midstream Partners LP/Crestwood Midstream Finance Corp.: | | | |
| 5.625% 5/1/27 (d) | | 18,087,000 | 16,866,128 |
| 5.75% 4/1/25 | | 6,889,000 | 6,639,446 |
| 6% 2/1/29 (d) | | 9,815,000 | 9,066,606 |
| CrownRock LP/CrownRock Finance, Inc.: | | | |
| 5% 5/1/29 (d) | | 1,835,000 | 1,685,351 |
| 5.625% 10/15/25 (d) | | 335,000 | 329,875 |
| CVR Energy, Inc.: | | | |
| 5.25% 2/15/25 (d) | | 6,560,000 | 6,188,450 |
| 5.75% 2/15/28 (d) | | 10,030,000 | 9,127,300 |
| DCP Midstream Operating LP: | | | |
| 3.875% 3/15/23 | | 3,524,000 | 3,515,190 |
| 5.85% 5/21/43 (d)(f) | | 16,107,000 | 15,694,661 |
| 6.45% 11/3/36 (d) | | 8,754,000 | 8,825,608 |
| Delek Logistics Partners LP 7.125% 6/1/28 (d) | | 7,075,000 | 6,610,173 |
| Delek Overriding Royalty Levia 7.494% 12/30/23 (Reg. S) (d) | | 2,345,000 | 2,350,863 |
| DT Midstream, Inc. 4.125% 6/15/29 (d) | | 2,270,000 | 1,993,015 |
| EG Global Finance PLC: | | | |
| 6.75% 2/7/25 (d) | | 5,870,000 | 5,546,033 |
| 8.5% 10/30/25 (d) | | 8,795,000 | 8,212,771 |
| EIG Pearl Holdings SARL 3.545% 8/31/36 (d) | | 2,835,000 | 2,469,285 |
| Empresa Nacional de Petroleo 4.375% 10/30/24 (d) | | 5,762,000 | 5,714,464 |
| Enbridge, Inc.: | | | |
| 4% 10/1/23 | | 9,942,000 | 9,913,151 |
| 4.25% 12/1/26 | | 4,925,000 | 4,847,790 |
| Endeavor Energy Resources LP/EER Finance, Inc. 5.75% 1/30/28 (d) | | 4,367,000 | 4,307,609 |
| Energean Israel Finance Ltd. 4.875% 3/30/26 (Reg. S) (d) | | 1,555,000 | 1,430,600 |
| Energean PLC 6.5% 4/30/27 (d) | | 1,420,000 | 1,281,550 |
| Energy Transfer LP: | | | |
| 3.75% 5/15/30 | | 18,703,000 | 16,808,517 |
| 3.9% 5/15/24 (f) | | 2,707,000 | 2,669,529 |
| 4.2% 9/15/23 | | 3,683,000 | 3,675,282 |
| 4.25% 3/15/23 | | 3,594,000 | 3,595,414 |
| 4.5% 4/15/24 | | 4,042,000 | 4,027,427 |
| 4.95% 6/15/28 | | 12,566,000 | 12,350,607 |
| 5% 5/15/50 | | 30,850,000 | 26,475,180 |
| 5.25% 4/15/29 | | 6,576,000 | 6,411,323 |
| 5.4% 10/1/47 | | 33,221,000 | 29,596,300 |
| 5.8% 6/15/38 | | 7,006,000 | 6,560,644 |
| 6% 6/15/48 | | 6,263,000 | 5,952,458 |
| 6.25% 4/15/49 | | 4,516,000 | 4,425,075 |
| EnLink Midstream LLC 5.625% 1/15/28 (d) | | 4,085,000 | 3,924,255 |
| EQM Midstream Partners LP: | | | |
| 6% 7/1/25 (d) | | 239,000 | 230,496 |
| 6.5% 7/1/27 (d) | | 2,915,000 | 2,813,700 |
| 7.5% 6/1/27 (d) | | 1,100,000 | 1,087,724 |
| 7.5% 6/1/30 (d) | | 1,100,000 | 1,092,091 |
| Exxon Mobil Corp. 3.482% 3/19/30 | | 61,580,000 | 58,934,863 |
| FEL Energy VI SARL 5.75% 12/1/40 (d) | | 725,254 | 548,836 |
| Galaxy Pipeline Assets BidCo Ltd.: | | | |
| 2.16% 3/31/34 (d) | | 960,860 | 835,948 |
| 2.625% 3/31/36 (d) | | 2,795,000 | 2,333,825 |
| GeoPark Ltd. 6.5% 9/21/24 (d) | | 766,000 | 775,479 |
| Global Partners LP/GLP Finance Corp.: | | | |
| 6.875% 1/15/29 | | 3,210,000 | 2,937,856 |
| 7% 8/1/27 | | 5,189,000 | 4,902,580 |
| Golar LNG Ltd. 7% 10/20/25 (d) | | 2,435,000 | 2,386,300 |
| Harvest Midstream I LP 7.5% 9/1/28 (d) | | 1,490,000 | 1,409,746 |
| Hess Corp.: | | | |
| 4.3% 4/1/27 | | 20,911,000 | 20,415,832 |
| 5.6% 2/15/41 | | 19,538,000 | 18,850,228 |
| 5.8% 4/1/47 | | 15,757,000 | 15,637,234 |
| 7.125% 3/15/33 | | 3,656,000 | 4,051,071 |
| 7.3% 8/15/31 | | 8,054,000 | 8,998,257 |
| 7.875% 10/1/29 | | 13,500,000 | 15,400,737 |
| Hess Midstream Partners LP: | | | |
| 4.25% 2/15/30 (d) | | 1,520,000 | 1,304,909 |
| 5.125% 6/15/28 (d) | | 4,372,000 | 4,060,495 |
| Hilcorp Energy I LP/Hilcorp Finance Co.: | | | |
| 5.75% 2/1/29 (d) | | 1,080,000 | 983,106 |
| 6.25% 11/1/28 (d) | | 1,080,000 | 1,020,535 |
| Holly Energy Partners LP/Holly Energy Finance Corp. 5% 2/1/28 (d) | | 3,570,000 | 3,324,277 |
| Indika Energy Capital IV Pte Ltd. 8.25% 10/22/25 (d) | | 935,000 | 897,133 |
| KazMunaiGaz National Co.: | | | |
| 3.5% 4/14/33 (d) | | 915,000 | 716,903 |
| 4.75% 4/24/25 (d) | | 283,000 | 275,005 |
| 5.75% 4/19/47 (d) | | 460,000 | 376,970 |
| Kinder Morgan Energy Partners LP: | | | |
| 3.45% 2/15/23 | | 6,689,000 | 6,673,947 |
| 5.5% 3/1/44 | | 27,364,000 | 25,547,347 |
| 6.55% 9/15/40 | | 1,203,000 | 1,246,205 |
| Kinder Morgan, Inc.: | | | |
| 5.05% 2/15/46 | | 3,092,000 | 2,819,310 |
| 5.55% 6/1/45 | | 7,786,000 | 7,573,177 |
| Kosmos Energy Ltd. 7.125% 4/4/26 (d) | | 4,270,000 | 3,768,275 |
| Leviathan Bond Ltd.: | | | |
| 5.75% 6/30/23 (Reg. S) (d) | | 990,000 | 986,721 |
| 6.125% 6/30/25 (Reg. S) (d) | | 1,635,000 | 1,602,300 |
| MC Brazil Downstream Trading SARL 7.25% 6/30/31 (d) | | 1,650,000 | 1,379,813 |
| Medco Laurel Tree Pte Ltd. 6.95% 11/12/28 (d) | | 1,645,000 | 1,385,913 |
| Medco Oak Tree Pte Ltd. 7.375% 5/14/26 (d) | | 290,000 | 272,687 |
| Medco Platinum Road Pte Ltd. 6.75% 1/30/25 (d) | | 1,295,000 | 1,234,135 |
| Mesquite Energy, Inc. 7.25% 2/15/23 (c)(d)(e) | | 7,883,000 | 1 |
| MPLX LP: | | | |
| 4.5% 7/15/23 | | 6,299,000 | 6,321,980 |
| 4.8% 2/15/29 | | 3,672,000 | 3,584,567 |
| 4.875% 12/1/24 | | 8,532,000 | 8,609,072 |
| 4.95% 9/1/32 | | 22,661,000 | 21,955,707 |
| 5.5% 2/15/49 | | 11,018,000 | 10,490,112 |
| Murphy Oil U.S.A., Inc. 3.75% 2/15/31 (d) | | 1,020,000 | 861,614 |
| NAK Naftogaz Ukraine: | | | |
| 7.375% 7/19/24 (Reg. S) (e) | | 1,605,000 | 401,250 |
| 7.625% 11/8/26 (d) | | 565,000 | 111,517 |
| New Fortress Energy, Inc.: | | | |
| 6.5% 9/30/26 (d) | | 27,825,000 | 26,360,014 |
| 6.75% 9/15/25 (d) | | 19,717,000 | 19,073,240 |
| NGL Energy Operating LLC/NGL Energy Finance Corp. 7.5% 2/1/26 (d) | | 6,830,000 | 6,249,450 |
| Nostrum Oil & Gas Finance BV 8% 12/31/49 (d)(e) | | 7,356,000 | 1,901,066 |
| Occidental Petroleum Corp.: | | | |
| 5.55% 3/15/26 | | 15,687,000 | 16,067,174 |
| 6.45% 9/15/36 | | 16,266,000 | 17,383,312 |
| 6.6% 3/15/46 | | 18,160,000 | 19,988,621 |
| 7.5% 5/1/31 | | 25,260,000 | 28,452,738 |
| 7.875% 9/15/31 | | 935,000 | 1,077,634 |
| 8.875% 7/15/30 | | 3,205,000 | 3,744,081 |
| Petrobras Global Finance BV: | | | |
| 6.75% 6/3/50 | | 1,195,000 | 1,092,902 |
| 6.875% 1/20/40 | | 890,000 | 874,314 |
| Petroleos de Venezuela SA: | | | |
| 5.375% 4/12/27 (e) | | 621,100 | 20,807 |
| 6% 5/16/24 (d)(e) | | 3,207,669 | 96,230 |
| 6% 11/15/26 (d)(e) | | 2,790,167 | 83,705 |
| 12.75% 12/31/49 (d)(e) | | 172,000 | 5,762 |
| Petroleos Mexicanos: | | | |
| 2.5% 11/24/22 (Reg. S) | EUR | 1,954,000 | 1,957,781 |
| 3.5% 1/30/23 | | 1,850,000 | 1,825,025 |
| 4.5% 1/23/26 | | 22,915,000 | 20,543,298 |
| 4.875% 1/18/24 | | 4,231,000 | 4,167,535 |
| 5.35% 2/12/28 | | 650,000 | 528,190 |
| 5.95% 1/28/31 | | 68,072,000 | 50,934,874 |
| 6.35% 2/12/48 | | 43,373,000 | 26,158,256 |
| 6.49% 1/23/27 | | 36,590,000 | 32,418,740 |
| 6.5% 3/13/27 | | 75,388,000 | 66,401,750 |
| 6.5% 6/2/41 | | 380,000 | 241,775 |
| 6.625% 6/15/35 | | 5,003,000 | 3,577,395 |
| 6.7% 2/16/32 | | 20,512,000 | 15,891,672 |
| 6.75% 9/21/47 | | 31,543,000 | 19,805,850 |
| 6.84% 1/23/30 | | 71,806,000 | 58,162,860 |
| 6.875% 10/16/25 | | 1,060,000 | 1,026,637 |
| 6.95% 1/28/60 | | 24,897,000 | 15,498,383 |
| 7.69% 1/23/50 | | 53,530,000 | 36,534,225 |
| Petronas Capital Ltd.: | | | |
| 3.404% 4/28/61 (d) | | 765,000 | 586,893 |
| 3.5% 4/21/30 (d) | | 625,000 | 600,038 |
| Phillips 66 Co.: | | | |
| 3.7% 4/6/23 | | 1,863,000 | 1,862,712 |
| 3.85% 4/9/25 | | 2,401,000 | 2,381,001 |
| Plains All American Pipeline LP/PAA Finance Corp.: | | | |
| 3.55% 12/15/29 | | 4,919,000 | 4,305,307 |
| 3.6% 11/1/24 | | 4,912,000 | 4,794,893 |
| PT Adaro Indonesia 4.25% 10/31/24 (d) | | 2,000,000 | 1,937,875 |
| Qatar Petroleum: | | | |
| 1.375% 9/12/26 (d) | | 2,965,000 | 2,681,843 |
| 2.25% 7/12/31 (d) | | 2,990,000 | 2,601,300 |
| 3.125% 7/12/41 (d) | | 1,630,000 | 1,318,568 |
| 3.3% 7/12/51 (d) | | 1,665,000 | 1,320,865 |
| Rockies Express Pipeline LLC: | | | |
| 4.8% 5/15/30 (d) | | 220,000 | 184,525 |
| 4.95% 7/15/29 (d) | | 2,610,000 | 2,354,140 |
| 6.875% 4/15/40 (d) | | 990,000 | 823,987 |
| SA Global Sukuk Ltd. 1.602% 6/17/26 (d) | | 3,550,000 | 3,258,545 |
| Sabine Pass Liquefaction LLC 4.5% 5/15/30 | | 31,000,000 | 29,677,277 |
| Saudi Arabian Oil Co.: | | | |
| 1.625% 11/24/25 (d) | | 2,495,000 | 2,307,875 |
| 3.5% 4/16/29 (d) | | 5,525,000 | 5,310,906 |
| 3.5% 11/24/70 (d) | | 830,000 | 596,563 |
| 4.25% 4/16/39 (d) | | 3,090,000 | 2,881,425 |
| 4.375% 4/16/49 (d) | | 1,025,000 | 944,025 |
| Sibur Securities DAC 2.95% 7/8/25 (d) | | 610,000 | 320,250 |
| Sinopec Group Overseas Development Ltd.: | | | |
| 1.45% 1/8/26 (d) | | 980,000 | 900,326 |
| 2.7% 5/13/30 (d) | | 600,000 | 542,064 |
| SM Energy Co. 5.625% 6/1/25 | | 2,785,000 | 2,708,413 |
| Southwestern Energy Co. 4.75% 2/1/32 | | 2,275,000 | 2,027,849 |
| SUEK Securities DAC 3.375% 9/15/26 (c)(d)(e) | | 2,305,000 | 345,750 |
| Sunoco LP/Sunoco Finance Corp.: | | | |
| 4.5% 5/15/29 | | 2,900,000 | 2,463,808 |
| 5.875% 3/15/28 | | 2,625,000 | 2,440,795 |
| Tallgrass Energy Partners LP / Tallgrass Energy Finance Corp.: | | | |
| 5.5% 1/15/28 (d) | | 5,665,000 | 4,898,222 |
| 6% 3/1/27 (d) | | 12,515,000 | 11,419,938 |
| 6% 12/31/30 (d) | | 12,460,000 | 10,905,788 |
| 6% 9/1/31 (d) | | 5,080,000 | 4,445,000 |
| 7.5% 10/1/25 (d) | | 2,030,000 | 2,032,538 |
| Tengizchevroil Finance Co. International Ltd. 3.25% 8/15/30 (d) | | 1,777,000 | 1,338,081 |
| The Williams Companies, Inc.: | | | |
| 3.5% 11/15/30 | | 32,834,000 | 29,536,064 |
| 3.9% 1/15/25 | | 16,989,000 | 16,776,653 |
| 4% 9/15/25 | | 1,911,000 | 1,890,004 |
| 4.3% 3/4/24 | | 26,077,000 | 26,084,498 |
| 4.5% 11/15/23 | | 4,667,000 | 4,679,690 |
| 4.55% 6/24/24 | | 21,661,000 | 21,708,216 |
| 4.65% 8/15/32 | | 23,596,000 | 22,747,666 |
| 5.3% 8/15/52 | | 5,344,000 | 5,145,523 |
| 5.75% 6/24/44 | | 12,223,000 | 12,338,645 |
| Transcontinental Gas Pipe Line Co. LLC: | | | |
| 3.25% 5/15/30 | | 3,952,000 | 3,532,490 |
| 3.95% 5/15/50 | | 12,733,000 | 10,552,546 |
| Tullow Oil PLC: | | | |
| 7% 3/1/25 (d) | | 470,000 | 373,650 |
| 10.25% 5/15/26 (d) | | 2,575,000 | 2,374,408 |
| Uzbekneftegaz JSC 4.75% 11/16/28 (d) | | 265,000 | 194,908 |
| Valero Energy Corp. 2.85% 4/15/25 | | 914,000 | 884,896 |
| Venture Global Calcasieu Pass LLC: | | | |
| 3.875% 8/15/29 (d) | | 2,920,000 | 2,547,700 |
| 4.125% 8/15/31 (d) | | 2,890,000 | 2,508,322 |
| Western Gas Partners LP: | | | |
| 3.95% 6/1/25 | | 3,216,000 | 3,072,503 |
| 4.65% 7/1/26 | | 5,039,000 | 4,795,465 |
| 4.75% 8/15/28 | | 3,701,000 | 3,484,010 |
| YPF SA: | | | |
| 8.5% 3/23/25 (d) | | 1,180,500 | 959,378 |
| 8.75% 4/4/24 (d) | | 3,051,300 | 2,539,826 |
| | | | 1,455,476,932 |
| TOTAL ENERGY | | | 1,483,802,167 |
| FINANCIALS - 15.3% | | | |
| Banks - 6.5% | | | |
| Access Bank PLC 6.125% 9/21/26 (d) | | 1,615,000 | 1,323,593 |
| AIB Group PLC: | | | |
| 1.875% 11/19/29 (Reg. S) (f) | EUR | 8,020,000 | 7,434,266 |
| 2.25% 4/4/28 (Reg. S) (f) | EUR | 10,100,000 | 9,273,329 |
| 2.875% 5/30/31 (Reg. S) (f) | EUR | 2,100,000 | 1,929,914 |
| Alpha Bank SA 4.25% 2/13/30 (Reg. S) (f) | EUR | 3,600,000 | 3,009,007 |
| Banco de Reservas de La Republica Dominicana 7% 2/1/23 (d) | | 262,000 | 261,836 |
| Banco Espirito Santo SA 4% 12/31/49 (Reg. S) (c)(e) | EUR | 1,300,000 | 189,433 |
| Bank of America Corp.: | | | |
| 2.299% 7/21/32 (f) | | 34,460,000 | 27,507,736 |
| 2.496% 2/13/31 (f) | | 10,000,000 | 8,389,913 |
| 3.3% 1/11/23 | | 574,000 | 573,549 |
| 3.419% 12/20/28 (f) | | 14,844,000 | 13,749,417 |
| 3.5% 4/19/26 | | 13,098,000 | 12,745,526 |
| 3.705% 4/24/28 (f) | | 20,736,000 | 19,697,316 |
| 3.864% 7/23/24 (f) | | 43,427,000 | 43,193,811 |
| 3.95% 4/21/25 | | 10,930,000 | 10,820,788 |
| 4.1% 7/24/23 | | 7,314,000 | 7,326,383 |
| 4.2% 8/26/24 | | 25,822,000 | 25,780,057 |
| 4.25% 10/22/26 | | 9,380,000 | 9,238,521 |
| 4.45% 3/3/26 | | 4,916,000 | 4,896,009 |
| 4.571% 4/27/33 (f) | | 10,000,000 | 9,547,665 |
| 5.015% 7/22/33 (f) | | 202,394,000 | 200,504,895 |
| Bank of Ireland Group PLC: | | | |
| 1.375% 8/11/31 (Reg. S) (f) | EUR | 6,600,000 | 5,656,182 |
| 2.029% 9/30/27 (d)(f) | | 7,550,000 | 6,492,204 |
| 2.375% 10/14/29 (Reg. S) (f) | EUR | 5,940,000 | 5,579,637 |
| 3.125% 9/19/27 (Reg. S) (f) | GBP | 8,840,000 | 10,260,185 |
| Barclays PLC: | | | |
| 2% 2/7/28 (Reg. S) (f) | EUR | 2,350,000 | 2,330,563 |
| 2.852% 5/7/26 (f) | | 31,500,000 | 29,491,014 |
| 4.375% 1/12/26 | | 15,982,000 | 15,665,056 |
| 5.088% 6/20/30 (f) | | 26,155,000 | 24,416,258 |
| 5.2% 5/12/26 | | 12,530,000 | 12,434,189 |
| 5.746% 8/9/33 (f) | | 1,801,000 | 1,764,679 |
| BNP Paribas SA: | | | |
| 2.159% 9/15/29 (d)(f) | | 10,072,000 | 8,288,702 |
| 2.219% 6/9/26 (d)(f) | | 27,762,000 | 25,590,483 |
| 2.5% 3/31/32 (Reg. S) (f) | EUR | 7,600,000 | 6,893,746 |
| BPCE SA 1.5% 1/13/42 (Reg. S) (f) | EUR | 7,000,000 | 6,087,294 |
| Citigroup, Inc.: | | | |
| 2.666% 1/29/31 (f) | | 10,000,000 | 8,431,008 |
| 3.352% 4/24/25 (f) | | 17,534,000 | 17,184,113 |
| 4.3% 11/20/26 | | 5,384,000 | 5,308,157 |
| 4.4% 6/10/25 | | 31,901,000 | 31,761,690 |
| 4.412% 3/31/31 (f) | | 42,031,000 | 40,108,108 |
| 4.45% 9/29/27 | | 19,254,000 | 18,772,171 |
| 4.6% 3/9/26 | | 8,567,000 | 8,546,740 |
| 4.91% 5/24/33 (f) | | 72,011,000 | 70,442,767 |
| 5.5% 9/13/25 | | 14,874,000 | 15,259,110 |
| Citizens Financial Group, Inc. 2.638% 9/30/32 | | 10,185,000 | 8,101,034 |
| Commonwealth Bank of Australia 3.61% 9/12/34 (d)(f) | | 9,644,000 | 8,417,430 |
| Credit Suisse Group Funding Guernsey Ltd. 3.8% 9/15/22 | | 19,558,000 | 19,558,396 |
| Danske Bank A/S: | | | |
| 2.25% 1/14/28 (Reg. S) (f) | GBP | 3,450,000 | 3,490,233 |
| 5.375% 1/12/24 (Reg. S) | | 6,050,000 | 6,094,910 |
| Development Bank of Mongolia 7.25% 10/23/23 (d) | | 306,000 | 297,356 |
| Discover Bank 4.2% 8/8/23 | | 11,373,000 | 11,380,952 |
| First Citizens Bank & Trust Co. 3.929% 6/19/24 (f) | | 4,855,000 | 4,807,854 |
| Georgia Bank Joint Stock Co. 6% 7/26/23 (d) | | 2,368,000 | 2,385,760 |
| HSBC Holdings PLC: | | | |
| 4.25% 3/14/24 | | 3,945,000 | 3,933,229 |
| 4.95% 3/31/30 | | 5,616,000 | 5,448,580 |
| 5.402% 8/11/33 (f) | | 900,000 | 856,327 |
| Intesa Sanpaolo SpA: | | | |
| 3.875% 7/14/27 (d) | | 5,666,000 | 5,172,402 |
| 4.198% 6/1/32 (d)(f) | | 4,469,000 | 3,251,751 |
| 5.017% 6/26/24 (d) | | 16,671,000 | 15,948,368 |
| 5.71% 1/15/26 (d) | | 65,914,000 | 61,827,493 |
| JPMorgan Chase & Co.: | | | |
| 2.739% 10/15/30 (f) | | 10,000,000 | 8,660,120 |
| 2.956% 5/13/31 (f) | | 16,800,000 | 14,399,238 |
| 3.25% 9/23/22 | | 11,737,000 | 11,738,298 |
| 3.797% 7/23/24 (f) | | 44,260,000 | 44,010,405 |
| 3.875% 9/10/24 | | 22,801,000 | 22,701,417 |
| 4.125% 12/15/26 | | 20,651,000 | 20,391,063 |
| 4.452% 12/5/29 (f) | | 40,200,000 | 38,726,865 |
| 4.493% 3/24/31 (f) | | 60,900,000 | 59,173,861 |
| 4.586% 4/26/33 (f) | | 89,633,000 | 86,307,609 |
| 4.912% 7/25/33 (f) | | 89,141,000 | 88,151,697 |
| Lloyds Banking Group PLC: | | | |
| 1.985% 12/15/31 (f) | GBP | 3,200,000 | 3,132,352 |
| 4.976% 8/11/33 (f) | | 900,000 | 854,908 |
| National Bank of Uzbekistan 4.85% 10/21/25 (Reg. S) | | 625,000 | 550,508 |
| NatWest Group PLC: | | | |
| 2.105% 11/28/31 (Reg. S) (f) | GBP | 5,300,000 | 5,194,780 |
| 3.073% 5/22/28 (f) | | 17,464,000 | 15,776,776 |
| 3.619% 3/29/29 (Reg. S) (f) | GBP | 4,700,000 | 4,921,176 |
| 3.622% 8/14/30 (Reg. S) (f) | GBP | 2,250,000 | 2,421,181 |
| 4.8% 4/5/26 | | 15,141,000 | 15,056,563 |
| 5.125% 5/28/24 | | 44,276,000 | 44,283,585 |
| NatWest Markets PLC 2.375% 5/21/23 (d) | | 33,596,000 | 33,148,698 |
| Oschadbank Via SSB #1 PLC 9.375% 3/10/23 (d) | | 195,500 | 107,525 |
| PNC Financial Services Group, Inc. U.S. Secured Overnight Fin. Rate (SOFR) Averages Index + 0.000% 4.626% 6/6/33 (f)(g) | | 25,000,000 | 23,669,807 |
| Rabobank Nederland 4.375% 8/4/25 | | 16,524,000 | 16,247,577 |
| Societe Generale: | | | |
| 1.038% 6/18/25 (d)(f) | | 70,150,000 | 65,428,145 |
| 1.488% 12/14/26 (d)(f) | | 37,622,000 | 32,786,264 |
| 4.25% 4/14/25 (d) | | 2,700,000 | 2,643,745 |
| 4.75% 11/24/25 (d) | | 1,750,000 | 1,709,719 |
| Synchrony Bank: | | | |
| 5.4% 8/22/25 | | 21,633,000 | 21,600,085 |
| 5.625% 8/23/27 | | 19,587,000 | 19,430,413 |
| UniCredit SpA: | | | |
| 2.731% 1/15/32 (Reg. S) (f) | EUR | 5,050,000 | 4,261,374 |
| 5.861% 6/19/32 (d)(f) | | 4,900,000 | 4,225,570 |
| Virgin Money UK PLC 5.125% 12/11/30 (Reg. S) (f) | GBP | 3,250,000 | 3,571,911 |
| Wells Fargo & Co.: | | | |
| 2.406% 10/30/25 (f) | | 18,129,000 | 17,322,638 |
| 2.572% 2/11/31 (f) | | 10,000,000 | 8,469,807 |
| 3.526% 3/24/28 (f) | | 33,177,000 | 31,341,494 |
| 4.478% 4/4/31 (f) | | 58,414,000 | 56,177,312 |
| 4.897% 7/25/33 (f) | | 35,000,000 | 34,438,678 |
| 5.013% 4/4/51 (f) | | 83,211,000 | 81,268,948 |
| Westpac Banking Corp. 4.11% 7/24/34 (f) | | 13,519,000 | 12,160,200 |
| | | | 1,911,591,407 |
| Capital Markets - 3.8% | | | |
| Affiliated Managers Group, Inc.: | | | |
| 3.5% 8/1/25 | | 13,384,000 | 13,141,669 |
| 4.25% 2/15/24 | | 9,340,000 | 9,347,784 |
| Ares Capital Corp.: | | | |
| 3.875% 1/15/26 | | 47,916,000 | 45,063,303 |
| 4.2% 6/10/24 | | 31,505,000 | 31,222,635 |
| AssuredPartners, Inc. 5.625% 1/15/29 (d) | | 2,035,000 | 1,691,513 |
| Coinbase Global, Inc.: | | | |
| 3.375% 10/1/28 (d) | | 6,190,000 | 4,000,323 |
| 3.625% 10/1/31(d) | | 7,660,000 | 4,663,676 |
| Credit Suisse Group AG: | | | |
| 2.125% 11/15/29 (Reg. S) (f) | GBP | 3,900,000 | 3,433,475 |
| 2.593% 9/11/25 (d)(f) | | 38,976,000 | 36,061,684 |
| 3.75% 3/26/25 | | 12,391,000 | 11,840,052 |
| 3.8% 6/9/23 | | 23,347,000 | 23,232,004 |
| 3.869% 1/12/29 (d)(f) | | 11,793,000 | 10,215,680 |
| 4.194% 4/1/31 (d)(f) | | 40,588,000 | 34,102,956 |
| 4.207% 6/12/24 (d)(f) | | 18,061,000 | 17,777,673 |
| 4.282% 1/9/28 (d) | | 6,700,000 | 6,014,630 |
| 6.5% 8/8/23 (Reg. S) | | 13,305,000 | 13,339,939 |
| 6.537% 8/12/33 (d)(f) | | 450,000 | 429,704 |
| Deutsche Bank AG: | | | |
| 3.25% 5/24/28 (Reg. S) (f) | EUR | 3,100,000 | 2,903,470 |
| 4% 6/24/32 (Reg. S) (f) | EUR | 6,900,000 | 6,262,097 |
| 4.1% 1/13/26 | | 5,495,000 | 5,362,559 |
| 4.5% 4/1/25 | | 82,560,000 | 79,884,183 |
| Deutsche Bank AG New York Branch: | | | |
| 3.3% 11/16/22 | | 30,321,000 | 30,269,542 |
| 3.729% 1/14/32 (f) | | 60,841,000 | 44,755,143 |
| 5.882% 7/8/31 (f) | | 10,000,000 | 8,706,180 |
| Goldman Sachs Group, Inc.: | | | |
| 2.383% 7/21/32 (f) | | 34,782,000 | 28,155,312 |
| 2.6% 2/7/30 | | 10,000,000 | 8,566,582 |
| 3.102% 2/24/33 (f) | | 32,036,000 | 27,254,307 |
| 3.2% 2/23/23 | | 10,830,000 | 10,810,423 |
| 3.691% 6/5/28 (f) | | 128,004,000 | 120,996,704 |
| 3.75% 5/22/25 | | 12,741,000 | 12,515,113 |
| 3.8% 3/15/30 | | 70,690,000 | 65,184,466 |
| 6.75% 10/1/37 | | 6,976,000 | 7,732,359 |
| Hightower Holding LLC 6.75% 4/15/29 (d) | | 3,180,000 | 2,672,654 |
| Jane Street Group LLC/JSG Finance, Inc. 4.5% 11/15/29 (d) | | 1,320,000 | 1,196,039 |
| Moody's Corp.: | | | |
| 3.25% 1/15/28 | | 7,339,000 | 6,912,815 |
| 3.75% 3/24/25 | | 20,324,000 | 20,128,308 |
| 4.875% 2/15/24 | | 6,892,000 | 6,969,734 |
| Morgan Stanley: | | | |
| 2.699% 1/22/31 (f) | | 10,000,000 | 8,652,080 |
| 3.125% 1/23/23 | | 8,282,000 | 8,270,293 |
| 3.125% 7/27/26 | | 69,344,000 | 66,065,182 |
| 3.622% 4/1/31 (f) | | 39,278,000 | 35,990,188 |
| 3.737% 4/24/24 (f) | | 79,634,000 | 79,283,864 |
| 4.431% 1/23/30 (f) | | 14,132,000 | 13,766,536 |
| 4.875% 11/1/22 | | 16,717,000 | 16,759,649 |
| 4.889% 7/20/33 (f) | | 69,805,000 | 69,488,035 |
| 5% 11/24/25 | | 27,517,000 | 27,945,568 |
| UBS Group AG: | | | |
| 1.494% 8/10/27 (d)(f) | | 21,621,000 | 18,778,186 |
| 4.125% 9/24/25 (d) | | 12,029,000 | 11,897,869 |
| 4.988% 8/5/33 (Reg. S) (f) | | 900,000 | 867,431 |
| | | | 1,120,581,571 |
| Consumer Finance - 2.7% | | | |
| AerCap Ireland Capital Ltd./AerCap Global Aviation Trust: | | | |
| 1.65% 10/29/24 | | 41,390,000 | 38,298,581 |
| 2.45% 10/29/26 | | 15,103,000 | 13,317,119 |
| 2.875% 8/14/24 | | 22,114,000 | 21,124,322 |
| 3% 10/29/28 | | 15,819,000 | 13,448,028 |
| 3.3% 1/30/32 | | 26,922,000 | 21,726,902 |
| 4.125% 7/3/23 | | 13,016,000 | 12,983,965 |
| 4.45% 4/3/26 | | 10,546,000 | 10,133,674 |
| 4.875% 1/16/24 | | 16,603,000 | 16,523,296 |
| 6.5% 7/15/25 | | 13,775,000 | 14,105,239 |
| Ally Financial, Inc.: | | | |
| 1.45% 10/2/23 | | 8,643,000 | 8,381,078 |
| 3.05% 6/5/23 | | 36,615,000 | 36,338,151 |
| 5.125% 9/30/24 | | 8,417,000 | 8,523,190 |
| 5.75% 11/20/25 | | 20,763,000 | 20,985,984 |
| 5.8% 5/1/25 | | 20,531,000 | 21,001,986 |
| 8% 11/1/31 | | 20,441,000 | 22,746,527 |
| Capital One Financial Corp.: | | | |
| 2.6% 5/11/23 | | 29,071,000 | 28,857,676 |
| 2.636% 3/3/26 (f) | | 17,584,000 | 16,664,533 |
| 3.273% 3/1/30 (f) | | 22,490,000 | 19,792,857 |
| 3.65% 5/11/27 | | 52,443,000 | 50,130,648 |
| 3.8% 1/31/28 | | 24,176,000 | 22,843,841 |
| 4.985% 7/24/26 (f) | | 22,984,000 | 22,951,788 |
| 5.247% 7/26/30 (f) | | 35,910,000 | 35,326,291 |
| 5.268% 5/10/33 (f) | | 10,000,000 | 9,808,045 |
| Discover Financial Services: | | | |
| 3.85% 11/21/22 | | 22,201,000 | 22,223,060 |
| 3.95% 11/6/24 | | 9,389,000 | 9,294,203 |
| 4.1% 2/9/27 | | 11,988,000 | 11,508,361 |
| 4.5% 1/30/26 | | 15,184,000 | 14,870,785 |
| Ford Motor Credit Co. LLC: | | | |
| 2.9% 2/10/29 | | 3,780,000 | 3,058,965 |
| 3.815% 11/2/27 | | 2,280,000 | 2,006,856 |
| 4.063% 11/1/24 | | 77,591,000 | 75,319,911 |
| 5.584% 3/18/24 | | 20,831,000 | 20,731,038 |
| OneMain Finance Corp.: | | | |
| 3.5% 1/15/27 | | 4,520,000 | 3,730,765 |
| 3.875% 9/15/28 | | 8,155,000 | 6,360,900 |
| 6.875% 3/15/25 | | 2,910,000 | 2,828,592 |
| 7.125% 3/15/26 | | 6,935,000 | 6,523,859 |
| Shriram Transport Finance Co. Ltd.: | | | |
| 4.15% 7/18/25 (d) | | 1,290,000 | 1,177,367 |
| 5.1% 7/16/23 (d) | | 305,000 | 298,138 |
| Synchrony Financial: | | | |
| 3.95% 12/1/27 | | 24,512,000 | 22,284,129 |
| 4.25% 8/15/24 | | 23,318,000 | 23,053,374 |
| 4.375% 3/19/24 | | 19,957,000 | 19,873,055 |
| 5.15% 3/19/29 | | 36,585,000 | 34,795,237 |
| Toyota Motor Credit Corp. 2.9% 3/30/23 | | 30,215,000 | 30,112,095 |
| | | | 796,064,411 |
| Diversified Financial Services - 0.9% | | | |
| 1MDB Global Investments Ltd. 4.4% 3/9/23 | | 9,800,000 | 9,365,468 |
| Altus Midstream LP 5.875% 6/15/30 (d) | | 2,300,000 | 2,188,013 |
| Blackstone Private Credit Fund: | | | |
| 4.7% 3/24/25 | | 63,655,000 | 61,597,702 |
| 4.875% 4/14/26 | GBP | 6,500,000 | 6,790,705 |
| Brixmor Operating Partnership LP: | | | |
| 3.85% 2/1/25 | | 9,126,000 | 8,898,768 |
| 4.05% 7/1/30 | | 19,581,000 | 17,405,292 |
| 4.125% 6/15/26 | | 15,162,000 | 14,657,569 |
| 4.125% 5/15/29 | | 18,497,000 | 17,025,937 |
| Equitable Holdings, Inc. 3.9% 4/20/23 | | 2,109,000 | 2,111,539 |
| Icahn Enterprises LP/Icahn Enterprises Finance Corp.: | | | |
| 4.375% 2/1/29 | | 4,780,000 | 4,065,533 |
| 5.25% 5/15/27 | | 16,575,000 | 15,062,531 |
| 6.25% 5/15/26 | | 10,791,000 | 10,344,630 |
| Intercement Financial Operatio 5.75% 7/17/24 (d) | | 1,002,000 | 743,985 |
| Jackson Financial, Inc.: | | | |
| 5.17% 6/8/27 | | 10,301,000 | 10,168,959 |
| 5.67% 6/8/32 | | 12,953,000 | 12,574,228 |
| Leighton Finance U.S.A. Pty Ltd. 1.5% 5/28/29 (Reg. S) | EUR | 5,600,000 | 4,133,673 |
| M&G PLC: | | | |
| 5.625% 10/20/51 (Reg. S) (f) | GBP | 5,300,000 | 5,719,271 |
| 6.5% 10/20/48 (Reg. S) (f) | | 4,150,000 | 4,231,971 |
| MDGH GMTN RSC Ltd. 2.875% 11/7/29 (d) | | 1,375,000 | 1,292,758 |
| OEC Finance Ltd. 4.375% 10/25/29 pay-in-kind (d) | | 29,036 | 769 |
| Park Aerospace Holdings Ltd. 5.5% 2/15/24 (d) | | 22,337,000 | 22,056,911 |
| Pine Street Trust I 4.572% 2/15/29 (d) | | 19,248,000 | 18,360,300 |
| Pine Street Trust II 5.568% 2/15/49 (d) | | 19,200,000 | 18,576,965 |
| PTT Treasury Center Co. Ltd. 3.7% 7/16/70 (d) | | 620,000 | 424,816 |
| Sparc Em Spc 0% 12/5/22 (d) | | 25,425 | 24,897 |
| VMED O2 UK Financing I PLC 4.25% 1/31/31 (d) | | 5,560,000 | 4,483,806 |
| | | | 272,306,996 |
| Insurance - 1.4% | | | |
| AIA Group Ltd.: | | | |
| 0.88% 9/9/33 (Reg. S) (f) | EUR | 2,000,000 | 1,630,326 |
| 3.2% 9/16/40 (d) | | 13,571,000 | 10,777,999 |
| 3.375% 4/7/30 (d) | | 28,695,000 | 26,614,477 |
| Alliant Holdings Intermediate LLC 4.25% 10/15/27 (d) | | 6,756,000 | 6,085,600 |
| American International Group, Inc. 2.5% 6/30/25 | | 55,000,000 | 52,430,464 |
| AmWINS Group, Inc. 4.875% 6/30/29 (d) | | 7,460,000 | 6,490,399 |
| Cloverie PLC 4.5% 9/11/44 (Reg. S) (f) | | 4,198,000 | 4,072,984 |
| Credit Agricole Assurances SA 4.75% 9/27/48 (f) | EUR | 3,300,000 | 3,308,207 |
| Demeter Investments BV: | | | |
| 5.625% 8/15/52 (Reg. S) (f) | | 6,561,000 | 6,249,353 |
| 5.75% 8/15/50 (Reg. S) (f) | | 14,850,000 | 14,471,919 |
| Fidelidade-Companhia de Seguros SA 4.25% 9/4/31 (Reg. S) (f) | EUR | 2,400,000 | 2,177,879 |
| Five Corners Funding Trust II 2.85% 5/15/30 (d) | | 42,017,000 | 36,429,065 |
| Liberty Mutual Group, Inc. 4.569% 2/1/29 (d) | | 8,055,000 | 7,835,979 |
| Marsh & McLennan Companies, Inc.: | | | |
| 4.375% 3/15/29 | | 12,747,000 | 12,669,376 |
| 4.75% 3/15/39 | | 5,849,000 | 5,694,968 |
| Massachusetts Mutual Life Insurance Co. 3.729% 10/15/70 (d) | | 21,378,000 | 15,996,395 |
| Metropolitan Life Global Funding I 3% 1/10/23 (d) | | 5,030,000 | 5,024,088 |
| Pacific LifeCorp 5.125% 1/30/43 (d) | | 21,516,000 | 20,672,786 |
| Pricoa Global Funding I 5.375% 5/15/45 (f) | | 11,144,000 | 10,951,455 |
| Prudential PLC 2.95% 11/3/33 (Reg. S) (f) | | 11,200,000 | 9,532,589 |
| QBE Insurance Group Ltd.: | | | |
| 2.5% 9/13/38 (Reg. S) (f) | GBP | 5,100,000 | 4,665,678 |
| 6.75% 12/2/44 (Reg. S) (f) | | 6,610,000 | 6,634,788 |
| Sagicor Financial Co. Ltd. 5.3% 5/13/28 (d) | | 900,000 | 846,900 |
| SunAmerica, Inc.: | | | |
| 3.5% 4/4/25 (d) | | 7,079,000 | 6,817,652 |
| 3.65% 4/5/27 (d) | | 24,155,000 | 22,710,744 |
| 3.85% 4/5/29 (d) | | 9,902,000 | 9,113,810 |
| 3.9% 4/5/32 (d) | | 11,788,000 | 10,588,947 |
| 4.35% 4/5/42 (d) | | 2,681,000 | 2,272,921 |
| 4.4% 4/5/52 (d) | | 7,930,000 | 6,615,218 |
| Swiss Re Finance Luxembourg SA 5% 4/2/49 (d)(f) | | 7,600,000 | 7,220,000 |
| Teachers Insurance & Annuity Association of America 4.9% 9/15/44 (d) | | 11,520,000 | 11,152,336 |
| TIAA Asset Management Finance LLC 4.125% 11/1/24 (d) | | 3,853,000 | 3,808,040 |
| Unum Group: | | | |
| 3.875% 11/5/25 | | 13,752,000 | 13,429,789 |
| 4% 3/15/24 | | 12,741,000 | 12,799,241 |
| 4% 6/15/29 | | 15,636,000 | 14,513,373 |
| 5.75% 8/15/42 | | 16,274,000 | 15,057,476 |
| Zurich Finance (Ireland) DAC 3.5% 5/2/52 (Reg. S) (f) | | 4,950,000 | 4,034,646 |
| | | | 411,397,867 |
| TOTAL FINANCIALS | | | 4,511,942,252 |
| HEALTH CARE - 1.9% | | | |
| Biotechnology - 0.0% | | | |
| Emergent BioSolutions, Inc. 3.875% 8/15/28 (d) | | 6,930,000 | 4,851,000 |
| Grifols Escrow Issuer SA 4.75% 10/15/28 (d) | | 4,140,000 | 3,451,313 |
| | | | 8,302,313 |
| Health Care Equipment & Supplies - 0.1% | | | |
| Avantor Funding, Inc.: | | | |
| 3.875% 11/1/29 (d) | | 5,680,000 | 4,914,228 |
| 4.625% 7/15/28 (d) | | 2,570,000 | 2,338,392 |
| Embecta Corp. 5% 2/15/30 (d) | | 1,560,000 | 1,367,746 |
| Hologic, Inc.: | | | |
| 3.25% 2/15/29 (d) | | 5,065,000 | 4,317,685 |
| 4.625% 2/1/28 (d) | | 443,000 | 412,544 |
| Teleflex, Inc. 4.25% 6/1/28 (d) | | 1,370,000 | 1,244,702 |
| | | | 14,595,297 |
| Health Care Providers & Services - 1.4% | | | |
| 180 Medical, Inc. 3.875% 10/15/29 (d) | | 3,525,000 | 3,068,844 |
| AMN Healthcare 4% 4/15/29 (d) | | 4,420,000 | 3,801,200 |
| Cano Health, Inc. 6.25% 10/1/28 (d) | | 3,795,000 | 3,408,295 |
| Centene Corp.: | | | |
| 2.45% 7/15/28 | | 29,620,000 | 24,981,212 |
| 2.625% 8/1/31 | | 13,830,000 | 11,064,830 |
| 3% 10/15/30 | | 2,650,000 | 2,211,067 |
| 3.375% 2/15/30 | | 24,530,000 | 21,034,475 |
| 4.25% 12/15/27 | | 18,995,000 | 18,038,792 |
| 4.625% 12/15/29 | | 28,835,000 | 27,163,723 |
| Cigna Corp.: | | | |
| 3.05% 10/15/27 | | 10,400,000 | 9,703,451 |
| 4.375% 10/15/28 | | 19,595,000 | 19,296,836 |
| 4.8% 8/15/38 | | 12,201,000 | 11,760,264 |
| 4.9% 12/15/48 | | 12,189,000 | 11,571,608 |
| Community Health Systems, Inc.: | | | |
| 4.75% 2/15/31 (d) | | 5,290,000 | 3,906,136 |
| 5.25% 5/15/30 (d) | | 5,380,000 | 4,075,511 |
| 5.625% 3/15/27 (d) | | 7,615,000 | 6,457,482 |
| 6% 1/15/29 (d) | | 3,545,000 | 2,909,593 |
| 6.125% 4/1/30 (d) | | 4,265,000 | 2,643,021 |
| 6.875% 4/15/29 (d) | | 5,185,000 | 3,240,625 |
| 8% 3/15/26 (d) | | 3,460,000 | 3,235,100 |
| CVS Health Corp.: | | | |
| 3% 8/15/26 | | 2,303,000 | 2,214,748 |
| 3.625% 4/1/27 | | 7,027,000 | 6,834,051 |
| 4.78% 3/25/38 | | 18,481,000 | 17,567,238 |
| DaVita HealthCare Partners, Inc.: | | | |
| 3.75% 2/15/31 (d) | | 1,425,000 | 1,048,479 |
| 4.625% 6/1/30 (d) | | 12,270,000 | 9,877,841 |
| Elevance Health, Inc. 3.3% 1/15/23 | | 4,104,000 | 4,098,283 |
| HCA Holdings, Inc.: | | | |
| 3.5% 9/1/30 | | 20,891,000 | 18,230,379 |
| 3.625% 3/15/32 (d) | | 3,086,000 | 2,666,269 |
| 5.625% 9/1/28 | | 16,701,000 | 16,785,925 |
| 5.875% 2/1/29 | | 15,195,000 | 15,488,567 |
| HealthEquity, Inc. 4.5% 10/1/29 (d) | | 7,250,000 | 6,376,665 |
| Humana, Inc. 3.7% 3/23/29 | | 9,378,000 | 8,855,327 |
| ModivCare Escrow Issuer, Inc. 5% 10/1/29 (d) | | 1,075,000 | 947,976 |
| Molina Healthcare, Inc. 3.875% 11/15/30 (d) | | 2,205,000 | 1,908,538 |
| Option Care Health, Inc. 4.375% 10/31/29 (d) | | 4,520,000 | 3,975,204 |
| Owens & Minor, Inc. 4.5% 3/31/29 (d) | | 1,505,000 | 1,282,681 |
| Pediatrix Medical Group, Inc. 5.375% 2/15/30 (d) | | 4,600,000 | 3,921,362 |
| Radiology Partners, Inc. 9.25% 2/1/28 (d) | | 5,605,000 | 4,176,798 |
| RP Escrow Issuer LLC 5.25% 12/15/25 (d) | | 8,005,000 | 7,145,739 |
| Sabra Health Care LP 3.2% 12/1/31 | | 36,074,000 | 28,684,189 |
| Tenet Healthcare Corp.: | | | |
| 4.25% 6/1/29 (d) | | 5,960,000 | 5,139,576 |
| 4.375% 1/15/30 (d) | | 7,560,000 | 6,615,000 |
| 4.625% 7/15/24 | | 787,000 | 770,638 |
| 4.625% 6/15/28 (d) | | 5,865,000 | 5,331,256 |
| 6.125% 10/1/28 (d) | | 18,860,000 | 17,304,050 |
| 6.125% 6/15/30 (d) | | 4,220,000 | 4,051,622 |
| 6.25% 2/1/27 (d) | | 2,030,000 | 1,957,519 |
| Toledo Hospital 5.325% 11/15/28 | | 6,970,000 | 4,556,840 |
| | | | 401,384,825 |
| Health Care Technology - 0.0% | | | |
| Minerva Merger Sub, Inc. 6.5% 2/15/30 (d) | | 1,140,000 | 967,900 |
| Life Sciences Tools & Services - 0.0% | | | |
| Charles River Laboratories International, Inc.: | | | |
| 3.75% 3/15/29 (d) | | 1,715,000 | 1,478,107 |
| 4.25% 5/1/28 (d) | | 515,000 | 471,982 |
| | | | 1,950,089 |
| Pharmaceuticals - 0.4% | | | |
| Bausch Health Companies, Inc.: | | | |
| 5% 1/30/28 (d) | | 3,695,000 | 1,385,625 |
| 7% 1/15/28 (d) | | 5,945,000 | 2,288,825 |
| Bayer AG 3.75% 7/1/74 (Reg. S) (f) | EUR | 3,300,000 | 3,191,972 |
| Bayer U.S. Finance II LLC 4.25% 12/15/25 (d) | | 13,965,000 | 13,736,542 |
| Catalent Pharma Solutions 3.5% 4/1/30 (d) | | 5,800,000 | 4,776,909 |
| Elanco Animal Health, Inc.: | | | |
| 5.772% 8/28/23 (h) | | 10,157,000 | 10,139,733 |
| 6.4% 8/28/28 (f) | | 4,279,000 | 3,979,470 |
| Jazz Securities DAC 4.375% 1/15/29 (d) | | 7,695,000 | 6,938,889 |
| Mylan NV 4.55% 4/15/28 | | 13,507,000 | 12,680,015 |
| Organon & Co. / Organon Foreign Debt Co-Issuer BV: | | | |
| 4.125% 4/30/28 (d) | | 12,300,000 | 11,035,191 |
| 5.125% 4/30/31 (d) | | 3,205,000 | 2,804,375 |
| Teva Pharmaceutical Finance Co. BV 2.95% 12/18/22 | | 669,000 | 664,377 |
| Teva Pharmaceutical Finance Netherlands III BV 4.75% 5/9/27 | | 720,000 | 629,806 |
| Utah Acquisition Sub, Inc. 3.95% 6/15/26 | | 7,088,000 | 6,660,902 |
| Valeant Pharmaceuticals International, Inc. 8.5% 1/31/27 (d) | | 1,555,000 | 746,400 |
| Viatris, Inc.: | | | |
| 1.65% 6/22/25 | | 3,717,000 | 3,388,075 |
| 2.7% 6/22/30 | | 28,896,000 | 22,760,114 |
| 3.85% 6/22/40 | | 8,232,000 | 5,718,882 |
| 4% 6/22/50 | | 14,216,000 | 9,185,460 |
| Zoetis, Inc. 3.25% 2/1/23 | | 3,117,000 | 3,113,769 |
| | | | 125,825,331 |
| TOTAL HEALTH CARE | | | 553,025,755 |
| INDUSTRIALS - 1.7% | | | |
| Aerospace & Defense - 0.5% | | | |
| BAE Systems Holdings, Inc. 3.8% 10/7/24 (d) | | 5,811,000 | 5,733,833 |
| Bombardier, Inc. 7.875% 4/15/27 (d) | | 9,110,000 | 8,723,281 |
| BWX Technologies, Inc.: | | | |
| 4.125% 6/30/28 (d) | | 6,645,000 | 6,113,400 |
| 4.125% 4/15/29 (d) | | 2,565,000 | 2,289,263 |
| DAE Funding LLC: | | | |
| 1.55% 8/1/24 (d) | | 1,670,000 | 1,558,110 |
| 1.625% 2/15/24 (d) | | 810,000 | 768,488 |
| Embraer Netherlands Finance BV 5.05% 6/15/25 | | 1,920,000 | 1,889,760 |
| Moog, Inc. 4.25% 12/15/27 (d) | | 5,155,000 | 4,718,629 |
| Rolls-Royce PLC 3.375% 6/18/26 | GBP | 3,160,000 | 3,183,650 |
| The Boeing Co.: | | | |
| 5.04% 5/1/27 | | 13,707,000 | 13,665,773 |
| 5.15% 5/1/30 | | 13,707,000 | 13,490,572 |
| 5.705% 5/1/40 | | 13,710,000 | 13,076,590 |
| 5.805% 5/1/50 | | 23,700,000 | 22,731,345 |
| 5.93% 5/1/60 | | 13,710,000 | 13,092,766 |
| TransDigm, Inc.: | | | |
| 4.625% 1/15/29 | | 8,195,000 | 6,929,856 |
| 5.5% 11/15/27 | | 24,802,000 | 22,321,800 |
| 6.25% 3/15/26 (d) | | 7,865,000 | 7,727,363 |
| 7.5% 3/15/27 | | 1,917,000 | 1,869,075 |
| 8% 12/15/25 (d) | | 4,080,000 | 4,178,736 |
| | | | 154,062,290 |
| Air Freight & Logistics - 0.0% | | | |
| Aeropuerto Internacional de Tocumen SA: | | | |
| 4% 8/11/41 (d) | | 740,000 | 601,620 |
| 5.125% 8/11/61 (d) | | 545,000 | 437,294 |
| | | | 1,038,914 |
| Airlines - 0.0% | | | |
| American Airlines, Inc. / AAdvantage Loyalty IP Ltd. 5.5% 4/20/26 (d) | | 3,025,000 | 2,877,622 |
| Azul Investments LLP: | | | |
| 5.875% 10/26/24 (d) | | 2,048,000 | 1,571,840 |
| 7.25% 6/15/26 (d) | | 695,000 | 488,672 |
| Delta Air Lines, Inc. / SkyMiles IP Ltd. 4.5% 10/20/25 (d) | | 680,000 | 666,058 |
| | | | 5,604,192 |
| Building Products - 0.0% | | | |
| Advanced Drain Systems, Inc. 5% 9/30/27 (d) | | 11,540,000 | 10,963,000 |
| Builders FirstSource, Inc. 4.25% 2/1/32 (d) | | 3,090,000 | 2,466,546 |
| | | | 13,429,546 |
| Commercial Services & Supplies - 0.3% | | | |
| ADT Corp. 4.125% 8/1/29 (d) | | 2,555,000 | 2,194,055 |
| APX Group, Inc. 6.75% 2/15/27 (d) | | 2,091,000 | 2,030,877 |
| Brand Energy & Infrastructure Services, Inc. 8.5% 7/15/25 (d) | | 13,117,000 | 10,624,770 |
| CoreCivic, Inc.: | | | |
| 4.75% 10/15/27 | | 6,275,000 | 5,277,744 |
| 8.25% 4/15/26 | | 12,900,000 | 12,752,822 |
| Covanta Holding Corp. 4.875% 12/1/29 (d) | | 2,575,000 | 2,172,656 |
| Legends Hospitality Holding Co. LLC/Legends Hospitality Co-Issuer, Inc. 5% 2/1/26 (d) | | 7,795,000 | 7,112,938 |
| Madison IAQ LLC: | | | |
| 4.125% 6/30/28 (d) | | 5,505,000 | 4,720,538 |
| 5.875% 6/30/29 (d) | | 16,845,000 | 13,857,371 |
| Nielsen Finance LLC/Nielsen Finance Co.: | | | |
| 4.5% 7/15/29 (d) | | 2,830,000 | 2,840,697 |
| 5.625% 10/1/28 (d) | | 5,175,000 | 5,186,799 |
| 5.875% 10/1/30 (d) | | 2,235,000 | 2,236,692 |
| PowerTeam Services LLC 9.033% 12/4/25 (d) | | 1,270,000 | 1,043,584 |
| Rentokil Initial PLC 5% 6/27/32 (Reg. S) | GBP | 2,300,000 | 2,637,462 |
| Stericycle, Inc.: | | | |
| 3.875% 1/15/29 (d) | | 4,180,000 | 3,620,925 |
| 5.375% 7/15/24 (d) | | 835,000 | 817,093 |
| The Bidvest Group UK PLC 3.625% 9/23/26 (d) | | 875,000 | 799,313 |
| The GEO Group, Inc. 9.5% 12/31/28 (d) | | 2,299,000 | 2,057,605 |
| | | | 81,983,941 |
| Construction & Engineering - 0.1% | | | |
| Great Lakes Dredge & Dock Corp. 5.25% 6/1/29 (d) | | 1,510,000 | 1,287,924 |
| Pike Corp. 5.5% 9/1/28 (d) | | 16,438,000 | 13,589,490 |
| Railworks Holdings LP 8.25% 11/15/28 (d) | | 3,935,000 | 3,630,038 |
| SRS Distribution, Inc.: | | | |
| 4.625% 7/1/28 (d) | | 1,980,000 | 1,752,609 |
| 6% 12/1/29 (d) | | 1,695,000 | 1,380,031 |
| | | | 21,640,092 |
| Electrical Equipment - 0.0% | | | |
| Sensata Technologies BV 4% 4/15/29 (d) | | 2,595,000 | 2,243,222 |
| Industrial Conglomerates - 0.0% | | | |
| Ladder Capital Finance Holdings LLLP/Ladder Capital Finance Corp. 4.75% 6/15/29 (d) | | 1,900,000 | 1,609,962 |
| Turk Sise ve Cam Fabrikalari A/S 6.95% 3/14/26 (d) | | 1,235,000 | 1,140,291 |
| | | | 2,750,253 |
| Machinery - 0.1% | | | |
| Mueller Water Products, Inc. 4% 6/15/29 (d) | | 2,825,000 | 2,541,653 |
| Vertical Holdco GmbH 7.625% 7/15/28 (d) | | 3,440,000 | 3,078,800 |
| Vertical U.S. Newco, Inc. 5.25% 7/15/27 (d) | | 12,585,000 | 11,452,350 |
| | | | 17,072,803 |
| Marine - 0.0% | | | |
| MISC Capital Two (Labuan) Ltd.: | | | |
| 3.625% 4/6/25 (d) | | 915,000 | 888,694 |
| 3.75% 4/6/27 (d) | | 1,460,000 | 1,365,356 |
| Navios South American Logistics, Inc./Navios Logistics Finance U.S., Inc. 10.75% 7/1/25 (d) | | 575,000 | 545,172 |
| Seaspan Corp. 5.5% 8/1/29 (d) | | 7,650,000 | 6,300,043 |
| | | | 9,099,265 |
| Professional Services - 0.1% | | | |
| ASGN, Inc. 4.625% 5/15/28 (d) | | 2,650,000 | 2,342,007 |
| Booz Allen Hamilton, Inc. 3.875% 9/1/28 (d) | | 13,905,000 | 12,368,498 |
| Thomson Reuters Corp. 3.85% 9/29/24 | | 2,221,000 | 2,195,660 |
| TriNet Group, Inc. 3.5% 3/1/29 (d) | | 5,700,000 | 4,888,121 |
| | | | 21,794,286 |
| Road & Rail - 0.0% | | | |
| Alpha Trains Finance SA 2.064% 6/30/30 | EUR | 4,151,000 | 4,046,217 |
| Kazakhstan Temir Zholy Finance BV 6.95% 7/10/42 (d) | | 320,000 | 295,860 |
| | | | 4,342,077 |
| Trading Companies & Distributors - 0.2% | | | |
| Air Lease Corp.: | | | |
| 2.25% 1/15/23 | | 4,831,000 | 4,795,367 |
| 3% 9/15/23 | | 2,041,000 | 2,012,406 |
| 3.375% 7/1/25 | | 24,376,000 | 23,147,679 |
| 4.25% 2/1/24 | | 18,355,000 | 18,307,002 |
| 4.25% 9/15/24 | | 7,664,000 | 7,575,608 |
| Travis Perkins PLC: | | | |
| 3.75% 2/17/26 (Reg. S) | GBP | 1,383,000 | 1,437,212 |
| 4.5% 9/7/23 (Reg. S) | GBP | 2,666,000 | 3,006,657 |
| | | | 60,281,931 |
| Transportation Infrastructure - 0.4% | | | |
| Aeroporti di Roma SPA: | | | |
| 1.625% 2/2/29 (Reg. S) | EUR | 2,040,000 | 1,692,527 |
| 1.75% 7/30/31 (Reg. S) | EUR | 1,500,000 | 1,131,675 |
| Autostrade per L'italia SpA 2.25% 1/25/32 (Reg. S) | EUR | 5,500,000 | 4,284,937 |
| Avolon Holdings Funding Ltd.: | | | |
| 2.875% 2/15/25 (d) | | 37,550,000 | 34,432,033 |
| 3.95% 7/1/24 (d) | | 7,125,000 | 6,803,276 |
| 4.25% 4/15/26 (d) | | 5,430,000 | 5,004,574 |
| 4.375% 5/1/26 (d) | | 16,881,000 | 15,605,146 |
| 5.25% 5/15/24 (d) | | 13,457,000 | 13,193,454 |
| 5.5% 1/15/26 (d) | | 14,454,000 | 13,937,038 |
| DP World Crescent Ltd.: | | | |
| 3.7495% 1/30/30 (d) | | 2,070,000 | 1,977,885 |
| 3.875% 7/18/29 (Reg. S) | | 1,545,000 | 1,483,200 |
| DP World Ltd. 5.625% 9/25/48 (d) | | 1,080,000 | 1,056,240 |
| First Student Bidco, Inc./First Transit Parent, Inc. 4% 7/31/29 (d) | | 7,095,000 | 6,124,120 |
| Heathrow Funding Ltd.: | | | |
| 2.625% 3/16/28 (Reg. S) | GBP | 5,300,000 | 5,218,682 |
| 7.125% 2/14/24 | GBP | 6,290,000 | 7,417,713 |
| Holding d'Infrastructures et des Metiers de l'Environnement 0.625% 9/16/28 (Reg. S) | EUR | 1,900,000 | 1,537,453 |
| | | | 120,899,953 |
| TOTAL INDUSTRIALS | | | 516,242,765 |
| INFORMATION TECHNOLOGY - 1.5% | | | |
| Communications Equipment - 0.1% | | | |
| Cellnex Finance Co. SA 1% 9/15/27 (Reg. S) | EUR | 6,900,000 | 5,754,794 |
| CommScope, Inc.: | | | |
| 4.75% 9/1/29 (d) | | 1,960,000 | 1,667,862 |
| 6% 3/1/26 (d) | | 4,260,000 | 4,026,126 |
| 7.125% 7/1/28 (d) | | 3,475,000 | 2,858,188 |
| 8.25% 3/1/27 (d) | | 1,060,000 | 908,436 |
| HTA Group Ltd. 7% 12/18/25 (d) | | 1,565,000 | 1,465,525 |
| | | | 16,680,931 |
| Electronic Equipment & Components - 0.2% | | | |
| Dell International LLC/EMC Corp.: | | | |
| 5.45% 6/15/23 | | 3,920,000 | 3,960,118 |
| 5.85% 7/15/25 | | 5,060,000 | 5,239,358 |
| 6.02% 6/15/26 | | 5,064,000 | 5,259,728 |
| 6.1% 7/15/27 | | 9,288,000 | 9,766,432 |
| 6.2% 7/15/30 | | 8,040,000 | 8,354,534 |
| II-VI, Inc. 5% 12/15/29 (d) | | 6,070,000 | 5,404,546 |
| TTM Technologies, Inc. 4% 3/1/29 (d) | | 11,095,000 | 9,597,201 |
| | | | 47,581,917 |
| IT Services - 0.1% | | | |
| Acuris Finance U.S. 5% 5/1/28 (d) | | 8,995,000 | 7,533,313 |
| Arches Buyer, Inc. 4.25% 6/1/28 (d) | | 3,085,000 | 2,483,425 |
| CA Magnum Holdings 5.375% (d)(i) | | 1,585,000 | 1,418,575 |
| Gartner, Inc.: | | | |
| 3.625% 6/15/29 (d) | | 1,330,000 | 1,143,800 |
| 3.75% 10/1/30 (d) | | 2,385,000 | 2,045,138 |
| 4.5% 7/1/28 (d) | | 3,690,000 | 3,405,686 |
| Go Daddy Operating Co. LLC / GD Finance Co., Inc.: | | | |
| 3.5% 3/1/29 (d) | | 2,720,000 | 2,301,623 |
| 5.25% 12/1/27 (d) | | 3,305,000 | 3,106,700 |
| Rackspace Hosting, Inc.: | | | |
| 3.5% 2/15/28 (d) | | 4,380,000 | 3,163,324 |
| 5.375% 12/1/28 (d) | | 31,459,000 | 17,349,614 |
| Twilio, Inc. 3.875% 3/15/31 | | 1,890,000 | 1,525,098 |
| | | | 45,476,296 |
| Semiconductors & Semiconductor Equipment - 0.5% | | | |
| Broadcom, Inc.: | | | |
| 1.95% 2/15/28 (d) | | 6,532,000 | 5,602,630 |
| 2.45% 2/15/31 (d) | | 63,710,000 | 50,799,360 |
| 2.6% 2/15/33 (d) | | 56,472,000 | 43,423,736 |
| 3.5% 2/15/41 (d) | | 44,880,000 | 33,667,014 |
| 3.75% 2/15/51 (d) | | 21,062,000 | 15,440,393 |
| Entegris Escrow Corp.: | | | |
| 4.75% 4/15/29 (d) | | 3,345,000 | 3,076,196 |
| 5.95% 6/15/30 (d) | | 5,040,000 | 4,782,103 |
| onsemi 3.875% 9/1/28 (d) | | 2,785,000 | 2,483,663 |
| | | | 159,275,095 |
| Software - 0.6% | | | |
| Black Knight InfoServ LLC 3.625% 9/1/28 (d) | | 6,285,000 | 5,499,375 |
| Clarivate Science Holdings Corp.: | | | |
| 3.875% 7/1/28 (d) | | 1,210,000 | 1,035,765 |
| 4.875% 7/1/29 (d) | | 1,225,000 | 1,012,585 |
| Elastic NV 4.125% 7/15/29 (d) | | 5,485,000 | 4,641,572 |
| Fair Isaac Corp. 4% 6/15/28 (d) | | 2,835,000 | 2,504,364 |
| ION Trading Technologies Ltd. 5.75% 5/15/28 (d) | | 8,438,000 | 7,203,141 |
| MicroStrategy, Inc. 6.125% 6/15/28 (d) | | 7,360,000 | 6,141,763 |
| Open Text Corp.: | | | |
| 3.875% 2/15/28 (d) | | 3,090,000 | 2,634,225 |
| 3.875% 12/1/29 (d) | | 6,025,000 | 4,858,753 |
| Oracle Corp.: | | | |
| 1.65% 3/25/26 | | 24,761,000 | 22,328,747 |
| 2.3% 3/25/28 | | 39,119,000 | 34,000,818 |
| 2.8% 4/1/27 | | 26,554,000 | 24,307,750 |
| 2.875% 3/25/31 | | 49,210,000 | 40,793,607 |
| 3.6% 4/1/40 | | 26,550,000 | 19,308,337 |
| | | | 176,270,802 |
| Technology Hardware, Storage & Peripherals - 0.0% | | | |
| Lenovo Group Ltd.: | | | |
| 3.421% 11/2/30 (d) | | 1,305,000 | 1,057,295 |
| 5.875% 4/24/25 (Reg. S) | | 305,000 | 305,680 |
| | | | 1,362,975 |
| TOTAL INFORMATION TECHNOLOGY | | | 446,648,016 |
| MATERIALS - 0.8% | | | |
| Chemicals - 0.4% | | | |
| Braskem Idesa SAPI 7.45% 11/15/29 (d) | | 330,000 | 284,419 |
| Chevron Phillips Chemical Co. LLC / Chevron Phillips Chemical Co. LP 5.125% 4/1/25 (d) | | 22,824,000 | 23,344,302 |
| CVR Partners LP 6.125% 6/15/28 (d) | | 2,870,000 | 2,620,380 |
| Element Solutions, Inc. 3.875% 9/1/28 (d) | | 3,445,000 | 2,992,844 |
| ENN Clean Energy International Investment Ltd. 3.375% 5/12/26 (d) | | 1,645,000 | 1,452,535 |
| Equate Petrochemical BV: | | | |
| 2.625% 4/28/28 (d) | | 735,000 | 655,804 |
| 4.25% 11/3/26 (d) | | 605,000 | 592,900 |
| Kronos Acquisition Holdings, Inc. / KIK Custom Products, Inc.: | | | |
| 5% 12/31/26 (d) | | 6,495,000 | 5,883,496 |
| 7% 12/31/27 (d) | | 665,000 | 548,625 |
| LSB Industries, Inc. 6.25% 10/15/28 (d) | | 5,675,000 | 5,252,496 |
| MEGlobal Canada, Inc. 5% 5/18/25 (d) | | 1,160,000 | 1,165,800 |
| Methanex Corp.: | | | |
| 5.125% 10/15/27 | | 7,417,000 | 6,753,179 |
| 5.65% 12/1/44 | | 3,217,000 | 2,348,328 |
| NOVA Chemicals Corp.: | | | |
| 4.25% 5/15/29 (d) | | 2,885,000 | 2,372,913 |
| 4.875% 6/1/24 (d) | | 2,621,000 | 2,504,558 |
| 5% 5/1/25 (d) | | 1,650,000 | 1,551,817 |
| 5.25% 6/1/27 (d) | | 7,895,000 | 6,970,456 |
| Nufarm Australia Ltd. 5% 1/27/30 (d) | | 3,605,000 | 2,992,150 |
| OCP SA: | | | |
| 3.75% 6/23/31 (d) | | 1,380,000 | 1,124,528 |
| 4.5% 10/22/25 (d) | | 305,000 | 296,765 |
| 5.625% 4/25/24 (d) | | 1,710,000 | 1,715,643 |
| 6.875% 4/25/44 (d) | | 275,000 | 241,192 |
| Olympus Water U.S. Holding Corp.: | | | |
| 4.25% 10/1/28 (d) | | 2,755,000 | 2,239,815 |
| 6.25% 10/1/29 (d) | | 3,180,000 | 2,400,900 |
| Orbia Advance Corp. S.A.B. de CV: | | | |
| 1.875% 5/11/26 (d) | | 1,640,000 | 1,462,593 |
| 2.875% 5/11/31 (d) | | 875,000 | 719,031 |
| Sabic Capital I BV 2.15% 9/14/30 (Reg. S) | | 665,000 | 573,563 |
| SABIC Capital II BV 4% 10/10/23 (d) | | 1,583,000 | 1,578,593 |
| Sasol Financing U.S.A. LLC: | | | |
| 4.375% 9/18/26 | | 1,685,000 | 1,565,260 |
| 5.875% 3/27/24 | | 1,800,000 | 1,793,700 |
| SCIL IV LLC / SCIL U.S.A. Holdings LLC 5.375% 11/1/26 (d) | | 2,140,000 | 1,776,200 |
| The Chemours Co. LLC: | | | |
| 4.625% 11/15/29 (d) | | 4,970,000 | 4,100,250 |
| 5.375% 5/15/27 | | 5,878,000 | 5,421,632 |
| 5.75% 11/15/28 (d) | | 14,555,000 | 13,026,725 |
| Valvoline, Inc. 4.25% 2/15/30 (d) | | 2,385,000 | 2,325,137 |
| W.R. Grace Holding LLC 5.625% 8/15/29 (d) | | 4,290,000 | 3,389,100 |
| | | | 116,037,629 |
| Construction Materials - 0.0% | | | |
| CEMEX S.A.B. de CV 3.875% 7/11/31 (d) | | 635,000 | 531,733 |
| Containers & Packaging - 0.1% | | | |
| Ardagh Metal Packaging Finance U.S.A. LLC/Ardagh Metal Packaging Finance PLC: | | | |
| 3.25% 9/1/28 (d) | | 850,000 | 733,125 |
| 4% 9/1/29 (d) | | 1,745,000 | 1,413,450 |
| 6% 6/15/27 (d) | | 2,965,000 | 2,906,092 |
| Ardagh Packaging Finance PLC/Ardagh MP Holdings U.S.A., Inc. 4.125% 8/15/26 (d) | | 2,500,000 | 2,156,675 |
| Berry Global, Inc. 4.875% 7/15/26 (d) | | 2,605,000 | 2,536,048 |
| Clydesdale Acquisition Holdings, Inc. 6.625% 4/15/29 (d) | | 1,175,000 | 1,127,900 |
| Graphic Packaging International, Inc. 3.75% 2/1/30 (d) | | 1,190,000 | 1,022,781 |
| Sealed Air Corp. 5% 4/15/29 (d) | | 3,275,000 | 3,111,250 |
| Trivium Packaging Finance BV: | | | |
| 5.5% 8/15/26 (d) | | 7,114,000 | 6,829,440 |
| 8.5% 8/15/27 (d) | | 9,484,000 | 9,010,464 |
| | | | 30,847,225 |
| Metals & Mining - 0.3% | | | |
| Antofagasta PLC: | | | |
| 2.375% 10/14/30 (d) | | 1,860,000 | 1,469,400 |
| 5.625% 5/13/32 (d) | | 665,000 | 658,350 |
| ATI, Inc.: | | | |
| 4.875% 10/1/29 | | 2,005,000 | 1,793,684 |
| 5.875% 12/1/27 | | 17,810,000 | 16,925,696 |
| Celtic Resources Holdings DAC 4.125% 10/9/24 (d)(e) | | 1,205,000 | 141,437 |
| Commercial Metals Co. 4.125% 1/15/30 | | 2,295,000 | 2,007,195 |
| Compania de Minas Buenaventura SA 5.5% 7/23/26 (d) | | 675,000 | 591,806 |
| Corporacion Nacional del Cobre de Chile (Codelco): | | | |
| 3% 9/30/29 (d) | | 290,000 | 255,617 |
| 3.15% 1/14/30 (d) | | 750,000 | 661,547 |
| 3.7% 1/30/50 (d) | | 1,755,000 | 1,273,801 |
| Eldorado Gold Corp. 6.25% 9/1/29 (d) | | 1,420,000 | 1,135,556 |
| Endeavour Mining PLC 5% 10/14/26 (d) | | 900,000 | 769,106 |
| ERO Copper Corp. 6.5% 2/15/30 (d) | | 6,755,000 | 5,002,922 |
| First Quantum Minerals Ltd.: | | | |
| 6.875% 3/1/26 (d) | | 1,455,000 | 1,396,618 |
| 6.875% 10/15/27 (d) | | 5,745,000 | 5,498,654 |
| 7.5% 4/1/25 (d) | | 2,150,000 | 2,121,781 |
| Fresnillo PLC 4.25% 10/2/50 (d) | | 940,000 | 726,033 |
| Gcm Mining Corp. 6.875% 8/9/26 (d) | | 1,725,000 | 1,362,750 |
| Gold Fields Orogen Holding BVI Ltd. 5.125% 5/15/24 (d) | | 420,000 | 422,179 |
| HudBay Minerals, Inc. 4.5% 4/1/26 (d) | | 1,290,000 | 1,170,675 |
| JSW Steel Ltd. 3.95% 4/5/27 (d) | | 1,195,000 | 997,825 |
| Kaiser Aluminum Corp.: | | | |
| 4.5% 6/1/31 (d) | | 1,235,000 | 972,353 |
| 4.625% 3/1/28 (d) | | 6,232,000 | 5,367,842 |
| Metinvest BV: | | | |
| 7.75% 4/23/23 (d) | | 1,602,000 | 841,050 |
| 8.5% 4/23/26 (Reg. S) | | 435,000 | 193,249 |
| Mineral Resources Ltd. 8.5% 5/1/30 (d) | | 3,130,000 | 3,152,911 |
| PMHC II, Inc. 9% 2/15/30 (d) | | 3,010,000 | 2,192,758 |
| PT Freeport Indonesia: | | | |
| 4.763% 4/14/27 (d) | | 580,000 | 563,325 |
| 5.315% 4/14/32 (d) | | 985,000 | 911,125 |
| 6.2% 4/14/52 (d) | | 670,000 | 589,600 |
| PT Indonesia Asahan Aluminium Tbk: | | | |
| 4.75% 5/15/25 (d) | | 320,000 | 321,168 |
| 5.45% 5/15/30 (d) | | 1,225,000 | 1,196,948 |
| Roller Bearing Co. of America, Inc. 4.375% 10/15/29 (d) | | 4,060,000 | 3,643,850 |
| Stillwater Mining Co. 4% 11/16/26 (d) | | 2,115,000 | 1,863,579 |
| TMK Capital SA 4.3% 2/12/27 (Reg. S) (c) | | 990,000 | 198,000 |
| Usiminas International SARL 5.875% 7/18/26 (d) | | 1,530,000 | 1,493,949 |
| VM Holding SA 6.5% 1/18/28 (d) | | 1,405,000 | 1,393,233 |
| Volcan Compania Minera SAA 4.375% 2/11/26 (d) | | 505,000 | 437,393 |
| | | | 71,714,965 |
| Paper & Forest Products - 0.0% | | | |
| Glatfelter Corp. 4.75% 11/15/29 (d) | | 1,910,000 | 1,184,200 |
| SPA Holdings 3 OY 4.875% 2/4/28 (d) | | 6,520,000 | 5,296,790 |
| | | | 6,480,990 |
| TOTAL MATERIALS | | | 225,612,542 |
| REAL ESTATE - 2.7% | | | |
| Equity Real Estate Investment Trusts (REITs) - 2.2% | | | |
| Alexandria Real Estate Equities, Inc. 4.9% 12/15/30 | | 16,606,000 | 16,510,480 |
| American Finance Trust, Inc./American Finance Operating Partnership LP 4.5% 9/30/28 (d) | | 1,420,000 | 1,139,337 |
| American Homes 4 Rent LP: | | | |
| 2.375% 7/15/31 | | 2,770,000 | 2,222,965 |
| 3.625% 4/15/32 | | 10,838,000 | 9,459,308 |
| Boston Properties, Inc.: | | | |
| 3.25% 1/30/31 | | 15,144,000 | 13,044,204 |
| 4.5% 12/1/28 | | 12,665,000 | 12,326,019 |
| Corporate Office Properties LP: | | | |
| 2% 1/15/29 | | 2,119,000 | 1,673,775 |
| 2.25% 3/15/26 | | 6,484,000 | 5,811,676 |
| 2.75% 4/15/31 | | 6,131,000 | 4,814,863 |
| CTR Partnership LP/CareTrust Capital Corp. 3.875% 6/30/28 (d) | | 3,340,000 | 2,829,770 |
| Global Net Lease, Inc. / Global Net Lease Operating Partnership LP 3.75% 12/15/27 (d) | | 1,115,000 | 959,588 |
| Healthcare Trust of America Holdings LP: | | | |
| 3.1% 2/15/30 | | 4,838,000 | 4,168,949 |
| 3.5% 8/1/26 | | 5,039,000 | 4,806,312 |
| Healthpeak Properties, Inc.: | | | |
| 3.25% 7/15/26 | | 2,056,000 | 1,975,038 |
| 3.5% 7/15/29 | | 2,351,000 | 2,162,603 |
| Hudson Pacific Properties LP 4.65% 4/1/29 | | 27,154,000 | 25,492,011 |
| Invitation Homes Operating Partnership LP 4.15% 4/15/32 | | 16,356,000 | 14,703,342 |
| iStar Financial, Inc.: | | | |
| 4.25% 8/1/25 | | 1,005,000 | 1,003,020 |
| 4.75% 10/1/24 | | 1,225,000 | 1,225,478 |
| Kimco Realty Corp. 3.375% 10/15/22 | | 1,739,000 | 1,739,008 |
| Kite Realty Group Trust 4.75% 9/15/30 | | 1,467,000 | 1,331,992 |
| LXP Industrial Trust (REIT): | | | |
| 2.7% 9/15/30 | | 7,113,000 | 5,738,630 |
| 4.4% 6/15/24 | | 2,936,000 | 2,896,625 |
| MPT Operating Partnership LP/MPT Finance Corp.: | | | |
| 2.5% 3/24/26 | GBP | 2,850,000 | 2,835,322 |
| 4.625% 8/1/29 | | 3,780,000 | 3,220,359 |
| 5% 10/15/27 | | 23,696,000 | 21,286,980 |
| Omega Healthcare Investors, Inc.: | | | |
| 3.25% 4/15/33 | | 23,679,000 | 17,982,116 |
| 3.375% 2/1/31 | | 13,097,000 | 10,668,175 |
| 3.625% 10/1/29 | | 39,642,000 | 33,884,417 |
| 4.375% 8/1/23 | | 5,521,000 | 5,485,189 |
| 4.5% 1/15/25 | | 6,808,000 | 6,747,102 |
| 4.5% 4/1/27 | | 32,478,000 | 31,103,863 |
| 4.75% 1/15/28 | | 18,782,000 | 17,962,762 |
| 4.95% 4/1/24 | | 11,105,000 | 11,133,863 |
| 5.25% 1/15/26 | | 18,623,000 | 18,463,731 |
| Park Intermediate Holdings LLC 7.5% 6/1/25 (d) | | 1,000,000 | 1,008,900 |
| Piedmont Operating Partnership LP 2.75% 4/1/32 | | 5,512,000 | 4,197,920 |
| Realty Income Corp.: | | | |
| 2.2% 6/15/28 | | 3,122,000 | 2,740,052 |
| 2.85% 12/15/32 | | 3,841,000 | 3,293,372 |
| 3.25% 1/15/31 | | 3,878,000 | 3,476,310 |
| 3.4% 1/15/28 | | 6,031,000 | 5,657,694 |
| Retail Opportunity Investments Partnership LP: | | | |
| 4% 12/15/24 | | 2,151,000 | 2,093,575 |
| 5% 12/15/23 | | 1,293,000 | 1,295,362 |
| RLJ Lodging Trust LP 3.75% 7/1/26 (d) | | 660,000 | 592,112 |
| SBA Communications Corp. 3.125% 2/1/29 | | 4,890,000 | 4,028,993 |
| Senior Housing Properties Trust 9.75% 6/15/25 | | 341,000 | 335,220 |
| Service Properties Trust 7.5% 9/15/25 | | 510,000 | 489,427 |
| Simon Property Group LP 2.45% 9/13/29 | | 6,352,000 | 5,482,548 |
| SITE Centers Corp.: | | | |
| 3.625% 2/1/25 | | 5,451,000 | 5,246,159 |
| 4.25% 2/1/26 | | 18,338,000 | 17,857,286 |
| Store Capital Corp.: | | | |
| 2.7% 12/1/31 | | 7,899,000 | 6,272,664 |
| 2.75% 11/18/30 | | 7,730,000 | 6,274,418 |
| 4.625% 3/15/29 | | 5,948,000 | 5,749,344 |
| Sun Communities Operating LP: | | | |
| 2.3% 11/1/28 | | 6,226,000 | 5,256,786 |
| 2.7% 7/15/31 | | 15,891,000 | 12,792,672 |
| Uniti Group LP / Uniti Group Finance, Inc.: | | | |
| 4.75% 4/15/28 (d) | | 12,375,000 | 10,340,352 |
| 6.5% 2/15/29 (d) | | 37,205,000 | 28,345,745 |
| Uniti Group, Inc.: | | | |
| 6% 1/15/30 (d) | | 10,595,000 | 7,470,585 |
| 7.875% 2/15/25 (d) | | 8,135,000 | 8,036,526 |
| Ventas Realty LP: | | | |
| 3% 1/15/30 | | 28,128,000 | 24,482,465 |
| 3.5% 2/1/25 | | 3,798,000 | 3,706,857 |
| 3.75% 5/1/24 | | 15,927,000 | 15,751,441 |
| 4% 3/1/28 | | 6,996,000 | 6,659,321 |
| 4.125% 1/15/26 | | 3,540,000 | 3,472,294 |
| 4.75% 11/15/30 | | 39,136,000 | 37,947,303 |
| VICI Properties LP: | | | |
| 4.375% 5/15/25 | | 2,699,000 | 2,635,493 |
| 4.75% 2/15/28 | | 21,253,000 | 20,394,542 |
| 4.95% 2/15/30 | | 33,145,000 | 31,823,208 |
| 5.125% 5/15/32 | | 6,542,000 | 6,234,330 |
| VICI Properties LP / VICI Note Co.: | | | |
| 3.5% 2/15/25 (d) | | 155,000 | 145,989 |
| 4.25% 12/1/26 (d) | | 225,000 | 210,751 |
| 4.625% 12/1/29 (d) | | 485,000 | 448,019 |
| Vornado Realty LP 2.15% 6/1/26 | | 6,904,000 | 6,076,483 |
| WP Carey, Inc.: | | | |
| 3.85% 7/15/29 | | 4,522,000 | 4,193,590 |
| 4% 2/1/25 | | 21,671,000 | 21,458,539 |
| | | | 652,783,519 |
| Real Estate Management & Development - 0.5% | | | |
| ACCENTRO Real Estate AG 3.625% 2/13/23 (Reg. S) | EUR | 4,540,000 | 2,363,361 |
| ADLER Group SA: | | | |
| 1.875% 1/14/26 (Reg. S) | EUR | 16,200,000 | 8,750,602 |
| 2.25% 4/27/27 (Reg. S) | EUR | 1,800,000 | 958,903 |
| Akelius Residential Property AB 3.875% 10/5/78 (Reg. S) (f) | EUR | 1,956,000 | 1,906,712 |
| Blackstone Property Partners Europe LP: | | | |
| 1% 5/4/28 (Reg. S) | EUR | 8,500,000 | 6,766,707 |
| 1.75% 3/12/29 (Reg. S) | EUR | 4,975,000 | 4,022,649 |
| 2.625% 10/20/28 (Reg. S) | GBP | 1,900,000 | 1,802,234 |
| Brandywine Operating Partnership LP: | | | |
| 3.95% 2/15/23 | | 18,541,000 | 18,533,249 |
| 3.95% 11/15/27 | | 14,429,000 | 13,299,602 |
| 4.1% 10/1/24 | | 13,139,000 | 12,890,592 |
| 4.55% 10/1/29 | | 15,790,000 | 14,861,584 |
| CBRE Group, Inc. 2.5% 4/1/31 | | 21,262,000 | 17,067,245 |
| Deutsche Annington Finance BV 5% 10/2/23 (d) | | 3,695,000 | 3,701,072 |
| DTZ U.S. Borrower LLC 6.75% 5/15/28 (d) | | 315,000 | 312,244 |
| Essex Portfolio LP 3.875% 5/1/24 | | 5,607,000 | 5,567,157 |
| Greystar Real Estate Partners 5.75% 12/1/25 (d) | | 459,000 | 452,496 |
| GTC Aurora Luxembourg SA 2.25% 6/23/26 (Reg. S) | EUR | 4,150,000 | 3,193,176 |
| Heimstaden AB 4.375% 3/6/27 (Reg. S) | EUR | 4,100,000 | 3,210,946 |
| Howard Hughes Corp.: | | | |
| 4.125% 2/1/29 (d) | | 1,995,000 | 1,646,655 |
| 4.375% 2/1/31 (d) | | 1,995,000 | 1,595,342 |
| Kennedy-Wilson, Inc. 4.75% 2/1/30 | | 8,025,000 | 6,600,563 |
| Post Apartment Homes LP 3.375% 12/1/22 | | 819,000 | 819,000 |
| Realogy Group LLC/Realogy Co-Issuer Corp. 5.75% 1/15/29 (d) | | 190,000 | 148,438 |
| Samhallsbyggnadsbolaget I Norden AB: | | | |
| 1% 8/12/27 (Reg. S) | EUR | 2,000,000 | 1,366,732 |
| 1.75% 1/14/25 (Reg. S) | EUR | 1,711,000 | 1,430,179 |
| Sirius Real Estate Ltd. 1.125% 6/22/26 (Reg. S) | EUR | 2,300,000 | 1,973,821 |
| Tanger Properties LP: | | | |
| 2.75% 9/1/31 | | 16,274,000 | 12,376,357 |
| 3.125% 9/1/26 | | 8,723,000 | 8,100,171 |
| Tritax EuroBox PLC 0.95% 6/2/26 (Reg. S) | EUR | 1,580,000 | 1,389,580 |
| | | | 157,107,369 |
| TOTAL REAL ESTATE | | | 809,890,888 |
| UTILITIES - 1.7% | | | |
| Electric Utilities - 0.9% | | | |
| Adani Electricity Mumbai Ltd. 3.867% 7/22/31 (d) | | 865,000 | 686,438 |
| Alabama Power Co. 3.05% 3/15/32 | | 23,863,000 | 21,711,448 |
| American Electric Power Co., Inc. 2.95% 12/15/22 | | 3,144,000 | 3,137,536 |
| AusNet Services Holdings Pty Ltd. 1.625% 3/11/81 (Reg. S) (f) | EUR | 1,050,000 | 817,124 |
| CEZ A/S 2.375% 4/6/27 (Reg. S) | EUR | 1,250,000 | 1,159,335 |
| Clearway Energy Operating LLC: | | | |
| 3.75% 2/15/31 (d) | | 2,595,000 | 2,166,885 |
| 4.75% 3/15/28 (d) | | 1,030,000 | 964,338 |
| Cleco Corporate Holdings LLC 3.375% 9/15/29 | | 12,555,000 | 11,115,756 |
| Comision Federal de Electricid: | | | |
| 3.348% 2/9/31 (d) | | 325,000 | 254,170 |
| 4.688% 5/15/29 (d) | | 1,450,000 | 1,302,100 |
| Duke Energy Corp.: | | | |
| 2.45% 6/1/30 | | 10,750,000 | 9,074,777 |
| 3.85% 6/15/34 | EUR | 4,500,000 | 4,294,895 |
| Duquesne Light Holdings, Inc.: | | | |
| 2.532% 10/1/30 (d) | | 5,172,000 | 4,219,873 |
| 2.775% 1/7/32 (d) | | 16,845,000 | 13,735,757 |
| EnBW Energie Baden-Wuerttemberg AG 1.375% 8/31/81 (Reg. S) (f) | EUR | 3,700,000 | 2,776,942 |
| Enel SpA 3.375% (Reg. S) (f)(i) | EUR | 4,075,000 | 3,649,821 |
| Entergy Corp. 2.8% 6/15/30 | | 11,033,000 | 9,443,622 |
| Eskom Holdings SOC Ltd.: | | | |
| 6.35% 8/10/28 (d) | | 925,000 | 876,148 |
| 6.75% 8/6/23 (d) | | 4,740,000 | 4,595,726 |
| 7.125% 2/11/25 (d) | | 250,000 | 234,500 |
| Eversource Energy 2.8% 5/1/23 | | 9,622,000 | 9,547,814 |
| Exelon Corp.: | | | |
| 2.75% 3/15/27 (d) | | 5,281,000 | 4,933,736 |
| 3.35% 3/15/32 (d) | | 16,412,000 | 14,720,182 |
| 4.05% 4/15/30 | | 6,798,000 | 6,537,690 |
| 4.1% 3/15/52 (d) | | 4,750,000 | 4,107,169 |
| 4.7% 4/15/50 | | 3,027,000 | 2,846,819 |
| Exgen Texas Power LLC 3 month U.S. LIBOR + 6.750% 9.0429% 10/8/26 (c)(f)(g) | | 1,456,170 | 1,456,170 |
| FirstEnergy Corp. 7.375% 11/15/31 | | 37,147,000 | 43,595,162 |
| InterGen NV 7% 6/30/23 (d) | | 7,075,000 | 6,721,250 |
| IPALCO Enterprises, Inc.: | | | |
| 3.7% 9/1/24 | | 6,665,000 | 6,574,418 |
| 4.25% 5/1/30 | | 8,975,000 | 8,277,683 |
| Israel Electric Corp. Ltd. 3.75% 2/22/32 (Reg. S) (d) | | 1,545,000 | 1,429,236 |
| Lamar Funding Ltd. 3.958% 5/7/25 (d) | | 1,545,000 | 1,476,730 |
| Mong Duong Finance Holdings BV 5.125% 5/7/29 (d) | | 1,695,000 | 1,398,163 |
| Monongahela Power Co. 4.1% 4/15/24 (d) | | 2,537,000 | 2,514,955 |
| NGG Finance PLC 2.125% 9/5/82 (Reg. S) (f) | EUR | 8,200,000 | 6,715,619 |
| NRG Energy, Inc.: | | | |
| 3.375% 2/15/29 (d) | | 3,565,000 | 2,928,586 |
| 5.25% 6/15/29 (d) | | 3,295,000 | 2,945,071 |
| NSG Holdings II LLC/NSG Holdings, Inc. 7.75% 12/15/25 (d) | | 2,416,383 | 2,337,851 |
| PG&E Corp.: | | | |
| 5% 7/1/28 | | 6,600,000 | 5,860,569 |
| 5.25% 7/1/30 | | 11,820,000 | 10,218,390 |
| Southern Co. 1.875% 9/15/81 (f) | EUR | 8,500,000 | 6,210,089 |
| Vistra Operations Co. LLC: | | | |
| 5% 7/31/27 (d) | | 3,800,000 | 3,536,584 |
| 5.625% 2/15/27 (d) | | 3,370,000 | 3,243,625 |
| | | | 256,350,752 |
| Gas Utilities - 0.0% | | | |
| ENN Energy Holdings Ltd. 4.625% 5/17/27 (d) | | 1,645,000 | 1,637,548 |
| Nakilat, Inc. 6.067% 12/31/33 (d) | | 1,157,461 | 1,226,040 |
| Promigas SA ESP/Gases del Pacifico SAC 3.75% 10/16/29 (d) | | 900,000 | 767,250 |
| Superior Plus LP / Superior General Partner, Inc. 4.5% 3/15/29 (d) | | 1,725,000 | 1,521,122 |
| | | | 5,151,960 |
| Independent Power and Renewable Electricity Producers - 0.3% | | | |
| Atlantica Sustainable Infrastructure PLC 4.125% 6/15/28 (d) | | 3,600,000 | 3,222,003 |
| Aydem Yenilenebilir Enerji A/S 7.75% 2/2/27 (d) | | 640,000 | 473,120 |
| Emera U.S. Finance LP 3.55% 6/15/26 | | 5,152,000 | 4,935,410 |
| Energo-Pro A/S 8.5% 2/4/27 (d) | | 630,000 | 587,987 |
| EnfraGen Energia Sur SA 5.375% 12/30/30 (d) | | 2,620,000 | 1,830,031 |
| Investment Energy Resources Ltd. 6.25% 4/26/29 (d) | | 1,300,000 | 1,165,125 |
| RWE AG 2.75% 5/24/30 (Reg. S) | EUR | 10,050,000 | 9,557,088 |
| Termocandelaria Power Ltd. 7.875% 1/30/29 (d) | | 1,326,000 | 1,234,257 |
| The AES Corp.: | | | |
| 2.45% 1/15/31 | | 18,564,000 | 15,296,426 |
| 3.3% 7/15/25 (d) | | 33,229,000 | 31,517,707 |
| 3.95% 7/15/30 (d) | | 28,974,000 | 26,467,749 |
| | | | 96,286,903 |
| Multi-Utilities - 0.5% | | | |
| Abu Dhabi National Energy Co. PJSC: | | | |
| 4% 10/3/49 (d) | | 1,540,000 | 1,436,050 |
| 4.875% 4/23/30 (d) | | 250,000 | 263,250 |
| Berkshire Hathaway Energy Co. 4.05% 4/15/25 | | 49,782,000 | 49,848,202 |
| Consolidated Edison Co. of New York, Inc. 3.35% 4/1/30 | | 3,091,000 | 2,901,948 |
| NiSource, Inc.: | | | |
| 2.95% 9/1/29 | | 31,524,000 | 28,052,599 |
| 5.25% 2/15/43 | | 8,116,000 | 7,919,219 |
| 5.8% 2/1/42 | | 4,036,000 | 4,026,241 |
| 5.95% 6/15/41 | | 5,760,000 | 5,941,877 |
| Puget Energy, Inc.: | | | |
| 4.1% 6/15/30 | | 21,032,000 | 19,374,322 |
| 4.224% 3/15/32 | | 21,626,000 | 19,923,672 |
| Sempra Energy 6% 10/15/39 | | 9,562,000 | 10,231,306 |
| WEC Energy Group, Inc. 3 month U.S. LIBOR + 2.610% 5.0176% 5/15/67 (f)(g) | | 2,459,000 | 2,041,708 |
| | | | 151,960,394 |
| Water Utilities - 0.0% | | | |
| Anglian Water (Osprey) Financing PLC 2% 7/31/28 (Reg. S) | GBP | 1,450,000 | 1,394,615 |
| Southern Water Services Finance Ltd. 1.625% 3/30/27 (Reg. S) | GBP | 1,765,000 | 1,811,098 |
| | | | 3,205,713 |
| TOTAL UTILITIES | | | 512,955,722 |
|
| TOTAL NONCONVERTIBLE BONDS | | | 11,382,346,572 |
|
| TOTAL CORPORATE BONDS | | | |
| (Cost $12,580,781,780) | | | 11,413,017,145 |
|
| U.S. Treasury Obligations - 24.7% | | | |
| U.S. Treasury Bonds: | | | |
| 1.125% 5/15/40 | | $207,334,000 | $141,116,704 |
| 1.75% 8/15/41 | | 208,680,000 | 155,042,719 |
| 1.875% 11/15/51 | | 400,075,000 | 291,335,863 |
| 2% 11/15/41 (j)(k)(l) | | 203,400,000 | 158,000,485 |
| 2% 8/15/51 | | 1,286,676,000 | 966,615,345 |
| 2.25% 2/15/52 | | 299,670,000 | 239,361,413 |
| 2.875% 5/15/52 | | 387,911,000 | 357,484,231 |
| 3% 2/15/47 | | 396,205,000 | 359,370,316 |
| 3.25% 5/15/42 (j)(k)(l) | | 159,181,000 | 152,266,575 |
| 3.375% 8/15/42 | | 4,200,000 | 4,098,281 |
| U.S. Treasury Notes: | | | |
| 0.75% 3/31/26 (j) | | 15,751,000 | 14,311,875 |
| 0.875% 6/30/26 | | 620,620,000 | 563,503,566 |
| 1.125% 8/31/28 | | 253,740,000 | 223,162,348 |
| 1.25% 5/31/28 | | 1,472,696,000 | 1,311,389,715 |
| 1.25% 9/30/28 | | 344,070,000 | 304,327,228 |
| 1.625% 9/30/26 | | 183,928,000 | 171,570,338 |
| 2.625% 5/31/27 | | 150,000,000 | 145,277,343 |
| 2.625% 7/31/29 (j)(l) | | 4,009,000 | 3,843,002 |
| 2.75% 5/31/29 | | 500,000,000 | 482,460,940 |
| 2.75% 8/15/32 (m) | | 770,411,000 | 743,205,862 |
| 2.875% 5/15/32 | | 528,778,000 | 515,393,307 |
| TOTAL U.S. TREASURY OBLIGATIONS | | | |
| (Cost $8,461,863,226) | | | 7,303,137,456 |
|
| U.S. Government Agency - Mortgage Securities - 14.9% | | | |
| Fannie Mae - 4.4% | | | |
| 12 month U.S. LIBOR + 1.440% 1.945% 4/1/37 (f)(g) | | 11,806 | 11,885 |
| 12 month U.S. LIBOR + 1.460% 1.854% 1/1/35 (f)(g) | | 12,593 | 12,731 |
| 12 month U.S. LIBOR + 1.480% 3.787% 7/1/34 (f)(g) | | 4,069 | 4,142 |
| 12 month U.S. LIBOR + 1.550% 3.803% 6/1/36 (f)(g) | | 9,369 | 9,601 |
| 12 month U.S. LIBOR + 1.560% 2.065% 3/1/37 (f)(g) | | 13,095 | 13,236 |
| 12 month U.S. LIBOR + 1.620% 2.245% 3/1/33 (f)(g) | | 17,389 | 17,581 |
| 12 month U.S. LIBOR + 1.620% 2.553% 5/1/35 (f)(g) | | 24,315 | 24,809 |
| 12 month U.S. LIBOR + 1.630% 1.815% 9/1/36 (f)(g) | | 11,477 | 11,735 |
| 12 month U.S. LIBOR + 1.630% 2.884% 11/1/36 (f)(g) | | 7,125 | 7,246 |
| 12 month U.S. LIBOR + 1.640% 1.895% 6/1/47 (f)(g) | | 17,735 | 18,171 |
| 12 month U.S. LIBOR + 1.640% 3.274% 5/1/36 (f)(g) | | 20,779 | 21,192 |
| 12 month U.S. LIBOR + 1.700% 3.184% 6/1/42 (f)(g) | | 24,008 | 24,518 |
| 12 month U.S. LIBOR + 1.730% 2.012% 3/1/40 (f)(g) | | 25,290 | 25,724 |
| 12 month U.S. LIBOR + 1.730% 3.441% 5/1/36 (f)(g) | | 19,895 | 20,376 |
| 12 month U.S. LIBOR + 1.750% 2.434% 7/1/35 (f)(g) | | 8,755 | 8,876 |
| 12 month U.S. LIBOR + 1.750% 2.579% 8/1/41 (f)(g) | | 35,710 | 36,638 |
| 12 month U.S. LIBOR + 1.780% 2.163% 2/1/36 (f)(g) | | 18,065 | 18,322 |
| 12 month U.S. LIBOR + 1.800% 2.054% 1/1/42 (f)(g) | | 87,683 | 89,176 |
| 12 month U.S. LIBOR + 1.800% 2.498% 12/1/40 (f)(g) | | 869,159 | 889,703 |
| 12 month U.S. LIBOR + 1.800% 4.05% 7/1/41 (f)(g) | | 14,901 | 15,254 |
| 12 month U.S. LIBOR + 1.810% 2.06% 12/1/39 (f)(g) | | 20,129 | 20,456 |
| 12 month U.S. LIBOR + 1.810% 2.068% 9/1/41 (f)(g) | | 8,136 | 8,356 |
| 12 month U.S. LIBOR + 1.810% 2.304% 2/1/42 (f)(g) | | 39,059 | 39,701 |
| 12 month U.S. LIBOR + 1.810% 4.008% 7/1/41 (f)(g) | | 17,617 | 18,092 |
| 12 month U.S. LIBOR + 1.820% 2.195% 12/1/35 (f)(g) | | 15,606 | 15,905 |
| 12 month U.S. LIBOR + 1.830% 2.08% 10/1/41 (f)(g) | | 7,669 | 7,721 |
| 12 month U.S. LIBOR + 1.950% 3.771% 7/1/37 (f)(g) | | 17,643 | 18,147 |
| 6 month U.S. LIBOR + 1.470% 2.112% 10/1/33 (f)(g) | | 496 | 503 |
| 6 month U.S. LIBOR + 1.500% 2.736% 1/1/35 (f)(g) | | 39,102 | 39,758 |
| 6 month U.S. LIBOR + 1.510% 3.523% 2/1/33 (f)(g) | | 254 | 260 |
| 6 month U.S. LIBOR + 1.530% 2.258% 12/1/34 (f)(g) | | 5,016 | 5,092 |
| 6 month U.S. LIBOR + 1.530% 2.44% 3/1/35 (f)(g) | | 7,306 | 7,423 |
| 6 month U.S. LIBOR + 1.550% 2.387% 10/1/33 (f)(g) | | 2,535 | 2,598 |
| 6 month U.S. LIBOR + 1.560% 3.64% 7/1/35 (f)(g) | | 3,890 | 4,003 |
| 6 month U.S. LIBOR + 1.740% 2.865% 12/1/34 (f)(g) | | 714 | 731 |
| 6 month U.S. LIBOR + 1.960% 2.434% 9/1/35 (f)(g) | | 5,251 | 5,397 |
| U.S. TREASURY 1 YEAR INDEX + 1.940% 2.643% 10/1/33 (f)(g) | | 36,113 | 37,206 |
| U.S. TREASURY 1 YEAR INDEX + 2.200% 2.583% 3/1/35 (f)(g) | | 7,340 | 7,510 |
| U.S. TREASURY 1 YEAR INDEX + 2.270% 2.395% 6/1/36 (f)(g) | | 28,949 | 29,847 |
| U.S. TREASURY 1 YEAR INDEX + 2.280% 2.408% 10/1/33 (f)(g) | | 15,255 | 15,734 |
| U.S. TREASURY 1 YEAR INDEX + 2.460% 3.147% 7/1/34 (f)(g) | | 33,018 | 34,011 |
| 1.5% 11/1/40 to 10/1/51 | | 37,222,407 | 31,490,631 |
| 2% 10/1/35 to 3/1/52 (j)(l) | | 369,313,150 | 321,232,222 |
| 2.5% 5/1/31 to 3/1/52 (j) | | 322,707,379 | 292,204,994 |
| 3% 5/1/30 to 5/1/52 | | 256,765,246 | 240,936,627 |
| 3.5% 5/1/36 to 3/1/52 | | 174,952,781 | 168,913,970 |
| 4% 3/1/36 to 11/1/49 | | 78,955,635 | 78,516,722 |
| 4.5% to 4.5% 6/1/33 to 7/1/52 (l) | | 79,168,489 | 80,343,982 |
| 5% 11/1/22 to 2/1/49 | | 54,970,090 | 56,809,718 |
| 5.258% 8/1/41 (f) | | 646,593 | 665,725 |
| 5.5% 12/1/23 to 5/1/49 | | 7,204,298 | 7,519,461 |
| 6% to 6% 9/1/29 to 1/1/42 | | 2,696,067 | 2,883,973 |
| 6.5% 7/1/23 to 4/1/37 | | 1,110,146 | 1,188,454 |
| 6.645% 2/1/39 (f) | | 372,088 | 387,881 |
| 7% to 7% 4/1/23 to 7/1/37 | | 228,088 | 244,144 |
| 7.5% to 7.5% 6/1/25 to 11/1/31 | | 110,587 | 117,440 |
| 8% 3/1/37 | | 6,472 | 7,306 |
|
| TOTAL FANNIE MAE | | | 1,285,062,617 |
|
| Freddie Mac - 2.9% | | | |
| 12 month U.S. LIBOR + 1.320% 1.575% 1/1/36 (f)(g) | | 10,791 | 10,777 |
| 12 month U.S. LIBOR + 1.370% 1.634% 3/1/36 (f)(g) | | 47,115 | 47,336 |
| 12 month U.S. LIBOR + 1.500% 1.824% 3/1/36 (f)(g) | | 27,337 | 27,501 |
| 12 month U.S. LIBOR + 1.750% 2% 12/1/40 (f)(g) | | 388,882 | 393,627 |
| 12 month U.S. LIBOR + 1.750% 2% 9/1/41 (f)(g) | | 124,262 | 126,730 |
| 12 month U.S. LIBOR + 1.750% 4% 7/1/41 (f)(g) | | 86,340 | 88,366 |
| 12 month U.S. LIBOR + 1.860% 3.239% 4/1/36 (f)(g) | | 18,371 | 18,733 |
| 12 month U.S. LIBOR + 1.880% 2.13% 9/1/41 (f)(g) | | 12,065 | 12,317 |
| 12 month U.S. LIBOR + 1.880% 3.255% 4/1/41 (f)(g) | | 3,016 | 3,072 |
| 12 month U.S. LIBOR + 1.900% 3.058% 10/1/42 (f)(g) | | 94,157 | 96,350 |
| 12 month U.S. LIBOR + 1.910% 3.219% 5/1/41 (f)(g) | | 23,973 | 24,424 |
| 12 month U.S. LIBOR + 1.910% 3.568% 5/1/41 (f)(g) | | 24,790 | 25,343 |
| 12 month U.S. LIBOR + 1.910% 3.775% 6/1/41 (f)(g) | | 31,341 | 32,082 |
| 12 month U.S. LIBOR + 1.910% 4.16% 6/1/41 (f)(g) | | 7,989 | 8,199 |
| 12 month U.S. LIBOR + 2.020% 2.93% 4/1/38 (f)(g) | | 15,833 | 16,016 |
| 12 month U.S. LIBOR + 2.030% 2.158% 3/1/33 (f)(g) | | 353 | 359 |
| 12 month U.S. LIBOR + 2.040% 4.265% 7/1/36 (f)(g) | | 24,131 | 24,764 |
| 12 month U.S. LIBOR + 2.200% 2.45% 12/1/36 (f)(g) | | 36,118 | 36,765 |
| 6 month U.S. LIBOR + 1.120% 2.029% 8/1/37 (f)(g) | | 17,484 | 17,489 |
| 6 month U.S. LIBOR + 1.580% 3.08% 12/1/35 (f)(g) | | 831 | 853 |
| 6 month U.S. LIBOR + 1.880% 2.534% 10/1/36 (f)(g) | | 51,368 | 52,382 |
| 6 month U.S. LIBOR + 1.990% 3% 10/1/35 (f)(g) | | 22,245 | 22,725 |
| 6 month U.S. LIBOR + 2.020% 3.414% 6/1/37 (f)(g) | | 11,638 | 12,016 |
| 6 month U.S. LIBOR + 2.680% 3.655% 10/1/35 (f)(g) | | 8,688 | 9,023 |
| U.S. TREASURY 1 YEAR INDEX + 2.030% 2.86% 6/1/33 (f)(g) | | 34,097 | 34,741 |
| U.S. TREASURY 1 YEAR INDEX + 2.260% 3.227% 6/1/33 (f)(g) | | 68,537 | 69,895 |
| U.S. TREASURY 1 YEAR INDEX + 2.430% 2.981% 3/1/35 (f)(g) | | 136,104 | 140,039 |
| 1.5% 12/1/40 to 10/1/51 | | 13,400,079 | 11,283,569 |
| 2% 8/1/35 to 4/1/52 | | 273,605,506 | 236,999,747 |
| 2.5% 6/1/31 to 2/1/52 | | 223,326,675 | 202,038,698 |
| 3% 6/1/31 to 4/1/52 | | 137,275,659 | 128,417,685 |
| 3.5% 1/1/32 to 3/1/52 (j)(k) | | 153,064,812 | 148,666,635 |
| 3.5% 8/1/47 | | 44,901 | 43,417 |
| 4% 5/1/37 to 6/1/48 | | 104,733,757 | 104,293,812 |
| 4% 4/1/48 | | 38,605 | 38,175 |
| 4.5% 6/1/25 to 7/1/49 | | 21,616,764 | 21,995,774 |
| 5% 8/1/33 to 7/1/41 | | 4,821,007 | 4,999,943 |
| 6% 1/1/23 to 12/1/37 | | 499,535 | 531,826 |
| 6.5% 5/1/26 to 9/1/39 | | 570,206 | 619,007 |
| 7% 3/1/26 to 9/1/36 | | 243,217 | 262,640 |
| 7.5% 1/1/27 to 11/1/31 | | 1,755 | 1,891 |
| 8% 7/1/24 to 4/1/32 | | 5,205 | 5,635 |
| 8.5% 12/1/22 to 1/1/28 | | 3,856 | 4,090 |
|
| TOTAL FREDDIE MAC | | | 861,554,468 |
|
| Freddie Mac Multi-family Structured pass-thru certificates - 0.0% | | | |
| 3% 10/1/31 | | 314,668 | 306,124 |
| Ginnie Mae - 3.3% | | | |
| 3.5% 6/20/34 to 5/20/50 | | 59,224,753 | 57,837,174 |
| 4% 5/20/33 to 5/20/49 | | 89,594,713 | 89,213,118 |
| 4.5% 6/20/33 to 8/15/41 | | 10,695,533 | 10,909,775 |
| 5% 12/15/32 to 4/20/48 | | 10,818,708 | 11,236,883 |
| 5.5% 7/15/33 to 9/15/39 | | 349,281 | 367,842 |
| 6% to 6% 10/15/30 to 11/15/39 | | 137,271 | 146,117 |
| 7% to 7% 11/15/22 to 3/15/33 | | 286,402 | 304,719 |
| 7.5% to 7.5% 11/15/22 to 9/15/31 | | 68,175 | 71,430 |
| 8% 12/15/23 to 11/15/29 | | 12,099 | 12,651 |
| 8.5% 11/15/27 to 1/15/31 | | 4,251 | 4,627 |
| 2% 10/20/50 | | 6,727,121 | 5,991,583 |
| 2% 9/1/52 (n) | | 93,450,000 | 82,564,645 |
| 2% 9/1/52 (n) | | 20,000,000 | 17,670,336 |
| 2% 9/1/52 (n) | | 20,100,000 | 17,758,688 |
| 2% 9/1/52 (n) | | 21,500,000 | 18,995,611 |
| 2% 9/1/52 (n) | | 21,500,000 | 18,995,611 |
| 2% 9/1/52 (n) | | 33,050,000 | 29,200,230 |
| 2% 9/1/52 (n) | | 18,300,000 | 16,168,357 |
| 2% 9/1/52 (n) | | 14,600,000 | 12,899,345 |
| 2% 9/1/52 (n) | | 11,650,000 | 10,292,971�� |
| 2% 9/1/52 (n) | | 3,450,000 | 3,048,133 |
| 2% 10/1/52 (n) | | 83,150,000 | 73,448,183 |
| 2% 10/1/52 (n) | | 41,550,000 | 36,702,008 |
| 2% 10/1/52 (n) | | 29,100,000 | 25,704,656 |
| 2.5% 7/20/51 to 12/20/51 | | 35,506,309 | 32,532,289 |
| 2.5% 9/1/52 (n) | | 42,550,000 | 38,796,928 |
| 2.5% 9/1/52 (n) | | 3,900,000 | 3,556,005 |
| 2.5% 9/1/52 (n) | | 38,950,000 | 35,514,462 |
| 2.5% 9/1/52 (n) | | 19,450,000 | 17,734,436 |
| 2.5% 9/1/52 (n) | | 19,600,000 | 17,871,206 |
| 2.5% 9/1/52 (n) | | 18,450,000 | 16,822,640 |
| 2.5% 9/1/52 (n) | | 20,950,000 | 19,102,130 |
| 2.5% 10/1/52 (n) | | 78,950,000 | 71,964,717 |
| 3% 5/20/42 to 10/20/51 | | 80,359,799 | 75,922,057 |
| 3% 9/1/52 (n) | | 9,625,000 | 9,033,464 |
| 3% 9/1/52 (n) | | 13,050,000 | 12,247,969 |
| 3% 9/1/52 (n) | | 6,500,000 | 6,100,521 |
| 3% 9/1/52 (n) | | 9,775,000 | 9,174,245 |
| 3% 9/1/52 (n) | | 9,775,000 | 9,174,245 |
| 3% 9/1/52 (n) | | 11,275,000 | 10,582,058 |
| 3% 10/1/52 (n) | | 15,950,000 | 14,959,149 |
| 3% 10/1/52 (n) | | 9,550,000 | 8,956,732 |
| 3.5% 9/1/52 (n) | | 26,300,000 | 25,356,716 |
| 6.5% 3/20/31 to 6/15/37 | | 102,710 | 110,602 |
|
| TOTAL GINNIE MAE | | | 975,057,264 |
|
| Uniform Mortgage Backed Securities - 4.3% | | | |
| 1.5% 9/1/37 (n) | | 9,500,000 | 8,533,125 |
| 1.5% 9/1/37 (n) | | 19,600,000 | 17,605,185 |
| 1.5% 9/1/37 (n) | | 16,800,000 | 15,090,158 |
| 1.5% 10/1/37 (n) | | 14,850,000 | 13,340,361 |
| 1.5% 10/1/37 (n) | | 11,150,000 | 10,016,500 |
| 1.5% 9/1/52 (n) | | 62,150,000 | 50,919,570 |
| 1.5% 9/1/52 (n) | | 22,800,000 | 18,680,067 |
| 1.5% 9/1/52 (n) | | 8,400,000 | 6,882,130 |
| 1.5% 9/1/52 (n) | | 19,575,000 | 16,037,821 |
| 2% 9/1/37 (n) | | 50,100,000 | 46,164,805 |
| 2% 9/1/37 (n) | | 22,050,000 | 20,318,043 |
| 2% 9/1/37 (n) | | 26,050,000 | 24,003,856 |
| 2% 9/1/37 (n) | | 11,050,000 | 10,182,058 |
| 2% 9/1/37 (n) | | 7,950,000 | 7,325,553 |
| 2% 9/1/37 (n) | | 7,950,000 | 7,325,553 |
| 2% 9/1/37 (n) | | 8,700,000 | 8,016,643 |
| 2% 10/1/37 (n) | | 23,950,000 | 22,065,061 |
| 2% 10/1/37 (n) | | 11,950,000 | 11,009,498 |
| 2% 10/1/37 (n) | | 12,000,000 | 11,055,563 |
| 2% 9/1/52 (n) | | 58,800,000 | 50,600,181 |
| 2% 9/1/52 (n) | | 51,850,000 | 44,619,378 |
| 2% 9/1/52 (n) | | 63,450,000 | 54,601,726 |
| 2% 9/1/52 (n) | | 45,300,000 | 38,982,793 |
| 2% 9/1/52 (n) | | 48,400,000 | 41,650,489 |
| 2% 9/1/52 (n) | | 23,600,000 | 20,308,916 |
| 2% 9/1/52 (n) | | 13,950,000 | 12,004,635 |
| 2% 9/1/52 (n) | | 7,525,000 | 6,475,618 |
| 2% 9/1/52 (n) | | 9,300,000 | 8,003,090 |
| 2% 9/1/52 (n) | | 17,700,000 | 15,231,687 |
| 2% 9/1/52 (n) | | 7,000,000 | 6,023,831 |
| 2% 9/1/52 (n) | | 11,900,000 | 10,240,513 |
| 2% 9/1/52 (n) | | 5,850,000 | 5,034,202 |
| 2% 9/1/52 (n) | | 5,900,000 | 5,077,229 |
| 2% 9/1/52 (n) | | 5,850,000 | 5,034,202 |
| 2% 10/1/52 (n) | | 64,800,000 | 55,748,276 |
| 2% 10/1/52 (n) | | 44,300,000 | 38,111,861 |
| 2% 10/1/52 (n) | | 66,550,000 | 57,253,824 |
| 2.5% 9/1/37 (n) | | 8,700,000 | 8,226,933 |
| 2.5% 9/1/37 (n) | | 5,800,000 | 5,484,622 |
| 2.5% 9/1/37 (n) | | 5,800,000 | 5,484,622 |
| 2.5% 9/1/52 (n) | | 64,750,000 | 57,829,857 |
| 2.5% 9/1/52 (n) | | 67,150,000 | 59,973,357 |
| 2.5% 9/1/52 (n) | | 28,100,000 | 25,096,818 |
| 2.5% 9/1/52 (n) | | 34,675,000 | 30,969,116 |
| 2.5% 9/1/52 (n) | | 2,900,000 | 2,590,063 |
| 3% 9/1/52 (n) | | 40,900,000 | 37,848,488 |
| 3% 9/1/52 (n) | | 19,950,000 | 18,461,548 |
| 3% 9/1/52 (n) | | 15,900,000 | 14,713,715 |
| 3.5% 9/1/52 (n) | | 9,700,000 | 9,246,828 |
| 3.5% 9/1/52 (n) | | 9,600,000 | 9,151,500 |
| 4% 9/1/52 (n) | | 49,150,000 | 47,963,465 |
| 4% 9/1/52 (n) | | 38,450,000 | 37,521,775 |
| 4.5% 9/1/52 (n) | | 28,400,000 | 28,224,727 |
| 4.5% 9/1/52 (n) | | 15,400,000 | 15,304,957 |
| 4.5% 9/1/52 (n) | | 1,200,000 | 1,192,594 |
| 4.5% 9/1/52 (n) | | 1,300,000 | 1,291,977 |
| 4.5% 9/1/52 (n) | | 1,300,000 | 1,291,977 |
| 5% 9/1/52 (n) | | 35,000,000 | 35,317,205 |
| 5.5% 9/1/52 (n) | | 3,750,000 | 3,834,752 |
| 5.5% 9/1/52 (n) | | 3,750,000 | 3,834,752 |
| 5.5% 9/1/52 (n) | | 7,500,000 | 7,669,504 |
| 5.5% 9/1/52 (n) | | 5,200,000 | 5,317,523 |
|
| TOTAL UNIFORM MORTGAGE BACKED SECURITIES | | | 1,273,416,676 |
|
| TOTAL U.S. GOVERNMENT AGENCY - MORTGAGE SECURITIES | | | |
| (Cost $4,677,086,129) | | | 4,395,397,149 |
|
| Asset-Backed Securities - 6.3% | | | |
| AASET Trust: | | | |
| Series 2018-1A Class A, 3.844% 1/16/38 (d) | | $8,849,545 | $5,959,517 |
| Series 2019-1 Class A, 3.844% 5/15/39 (d) | | 8,924,281 | 6,180,065 |
| Series 2019-2: | | | |
| Class A, 3.376% 10/16/39 (d) | | 19,460,062 | 14,235,931 |
| Class B, 4.458% 10/16/39 (c)(d) | | 3,803,418 | 1,825,717 |
| Series 2021-1A Class A, 2.95% 11/16/41 (d) | | 21,860,629 | 18,235,758 |
| Series 2021-2A Class A, 2.798% 1/15/47 (d) | | 41,834,766 | 34,896,466 |
| Affirm, Inc. Series 2021-A Class A, 0.88% 8/15/25 (d) | | 8,740,651 | 8,678,980 |
| Aimco Series 2021-BA Class AR, 3 month U.S. LIBOR + 1.100% 3.612% 1/15/32 (d)(f)(g) | | 6,384,000 | 6,271,559 |
| AIMCO CLO Series 2021-AA Class AR2, 3 month U.S. LIBOR + 1.140% 3.8803% 10/17/34 (d)(f)(g) | | 2,687,000 | 2,614,787 |
| AIMCO CLO Ltd. Series 2021-11A Class AR, 3 month U.S. LIBOR + 1.130% 3.8703% 10/17/34 (d)(f)(g) | | 15,632,000 | 15,253,315 |
| AIMCO CLO Ltd. / AIMCO CLO LLC Series 2021-14A Class A, 3 month U.S. LIBOR + 0.990% 3.6999% 4/20/34 (d)(f)(g) | | 39,309,000 | 38,163,379 |
| Allegro CLO XV, Ltd. / Allegro CLO VX LLC Series 2022-1A Class A, CME TERM SOFR 3 MONTH INDEX + 1.500% 3.1807% 7/20/35 (d)(f)(g) | | 18,066,000 | 17,712,485 |
| Allegro CLO, Ltd. Series 2021-1A Class A, 3 month U.S. LIBOR + 1.140% 3.8499% 7/20/34 (d)(f)(g) | | 18,308,000 | 17,761,964 |
| American Express Credit Account Master Trust Series 2022-3 Class A, 3.75% 8/16/27 | | 13,700,000 | 13,647,974 |
| American Homes 4 Rent: | | | |
| Series 2014-SFR3 Class E, 6.418% 12/17/36 (d) | | 478,000 | 485,484 |
| Series 2015-SFR1 Class E, 5.639% 4/17/52 (d) | | 1,082,438 | 1,087,764 |
| Series 2015-SFR2: | | | |
| Class E, 6.07% 10/17/52 (d) | | 1,118,000 | 1,134,700 |
| Class XS, 0% 10/17/52 (c)(d)(f)(o) | | 751,094 | 8 |
| Apollo Aviation Securitization Equity Trust Series 2020-1A: | | | |
| Class A, 3.351% 1/16/40 (d) | | 6,210,598 | 5,130,327 |
| Class B, 4.335% 1/16/40 (d) | | 1,174,570 | 513,842 |
| Ares CLO Series 2019-54A Class A, 3 month U.S. LIBOR + 1.320% 3.832% 10/15/32 (d)(f)(g) | | 20,251,000 | 19,912,849 |
| Ares LIX CLO Ltd. Series 2021-59A Class A, 3 month U.S. LIBOR + 1.030% 3.813% 4/25/34 (d)(f)(g) | | 13,014,000 | 12,654,254 |
| Ares LV CLO Ltd. Series 2021-55A Class A1R, 3 month U.S. LIBOR + 1.130% 3.642% 7/15/34 (d)(f)(g) | | 23,175,000 | 22,658,545 |
| Ares LVIII CLO LLC Series 2022-58A Class AR, CME TERM SOFR 3 MONTH INDEX + 1.330% 3.6579% 1/15/35 (d)(f)(g) | | 30,273,000 | 29,221,255 |
| Ares XLI CLO Ltd. / Ares XLI CLO LLC Series 2021-41A Class AR2, 3 month U.S. LIBOR + 1.070% 3.582% 4/15/34 (d)(f)(g) | | 27,448,000 | 26,729,823 |
| Ares XXXIV CLO Ltd. Series 2020-2A Class AR2, 3 month U.S. LIBOR + 1.250% 3.9903% 4/17/33 (d)(f)(g) | | 8,282,000 | 8,109,014 |
| Babson CLO Ltd. Series 2021-1A Class AR, 3 month U.S. LIBOR + 1.150% 3.662% 10/15/36 (d)(f)(g) | | 15,712,000 | 15,346,665 |
| Barings CLO Ltd.: | | | |
| Series 2021-1A Class A, 3 month U.S. LIBOR + 1.020% 3.803% 4/25/34 (d)(f)(g) | | 28,623,000 | 27,880,577 |
| Series 2021-4A Class A, 3 month U.S. LIBOR + 1.220% 3.9299% 1/20/32 (d)(f)(g) | | 31,300,000 | 30,808,027 |
| Beechwood Park CLO Ltd. Series 2022-1A Class A1R, CME TERM SOFR 3 MONTH INDEX + 1.300% 3.7808% 1/17/35 (d)(f)(g) | | 31,025,000 | 30,081,747 |
| BETHP Series 2021-1A Class A, 3 month U.S. LIBOR + 1.130% 3.642% 1/15/35 (d)(f)(g) | | 23,740,000 | 23,148,281 |
| Blackbird Capital Aircraft: | | | |
| Series 2016-1A: | | | |
| Class A, 4.213% 12/16/41 (d) | | 19,767,011 | 17,469,373 |
| Class AA, 2.487% 12/16/41 (d)(f) | | 2,030,717 | 1,896,334 |
| Series 2021-1A Class A, 2.443% 7/15/46 (d) | | 30,082,518 | 25,475,925 |
| Bristol Park CLO, Ltd. Series 2020-1A Class AR, 3 month U.S. LIBOR + 0.990% 3.502% 4/15/29 (d)(f)(g) | | 23,988,142 | 23,731,637 |
| Capital Trust RE CDO Ltd. Series 2005-1A Class E, 1 month U.S. LIBOR + 2.100% 3.9464% 3/20/50 (c)(d)(f)(g) | | 330,000 | 33 |
| Castlelake Aircraft Securitization Trust Series 2019-1A: | | | |
| Class A, 3.967% 4/15/39 (d) | | 14,002,511 | 12,501,022 |
| Class B, 5.095% 4/15/39 (d) | | 7,616,545 | 6,033,975 |
| Castlelake Aircraft Structured Trust: | | | |
| Series 2018-1 Class A, 4.125% 6/15/43 (d) | | 9,039,536 | 8,125,264 |
| Series 2021-1A Class A, 3.474% 1/15/46 (d) | | 6,533,375 | 5,805,099 |
| Cedar Funding Ltd.: | | | |
| Series 2021-10A Class AR, 3 month U.S. LIBOR + 1.100% 3.8099% 10/20/32 (d)(f)(g) | | 18,972,000 | 18,631,927 |
| Series 2022-15A Class A, CME TERM SOFR 3 MONTH INDEX + 1.320% 3.7973% 4/20/35 (d)(f)(g) | | 28,708,000 | 27,942,071 |
| Cedar Funding XII CLO Ltd. / Cedar Funding XII CLO LLC Series 2021-12A Class A1R, 3 month U.S. LIBOR + 1.130% 3.913% 10/25/34 (d)(f)(g) | | 14,593,000 | 14,168,475 |
| CEDF Series 2021-6A Class ARR, 3 month U.S. LIBOR + 1.050% 3.7599% 4/20/34 (d)(f)(g) | | 23,812,000 | 23,002,511 |
| Cent CLO Ltd. / Cent CLO Series 2021-29A Class AR, 3 month U.S. LIBOR + 1.170% 3.8799% 10/20/34 (d)(f)(g) | | 23,751,000 | 23,046,308 |
| Citi Mortgage Loan Trust Series 2007-1 Class 1A, 1 month U.S. LIBOR + 1.350% 3.7937% 10/25/37 (d)(f)(g) | | 2,004,938 | 1,998,397 |
| Columbia Cent CLO 31 Ltd. Series 2021-31A Class A1, 3 month U.S. LIBOR + 1.200% 3.9099% 4/20/34 (d)(f)(g) | | 31,300,000 | 30,341,062 |
| Columbia Cent Clo 32 Ltd. / Coliseum Series 2022-32A Class A1, CME TERM SOFR 3 MONTH INDEX + 1.700% 4.197% 7/24/34 (d)(f)(g) | | 27,015,000 | 26,513,358 |
| Columbia Cent CLO Ltd. / Columbia Cent CLO Corp. Series 2021-30A Class A1, 3 month U.S. LIBOR + 1.310% 4.0199% 1/20/34 (d)(f)(g) | | 41,300,000 | 40,097,840 |
| Crest Ltd. Series 2004-1A Class H1, 3 month U.S. LIBOR + 3.690% 3.8138% 1/28/40 (c)(d)(f)(g) | | 411,268 | 41 |
| DB Master Finance LLC: | | | |
| Series 2017-1A Class A2II, 4.03% 11/20/47 (d) | | 17,901,475 | 16,806,048 |
| Series 2019-1A Class A23, 4.352% 5/20/49 (d) | | 6,527,130 | 6,179,639 |
| Diamond Infrastructure Funding LLC Series 2021-1A Class C, 3.475% 4/15/49 (d) | | 382,000 | 314,417 |
| DigitalBridge Issuer, LLC / DigitalBridge Co.-Issuer, LLC Series 2021-1A Class A2, 3.933% 9/25/51 (d) | | 994,000 | 888,722 |
| Dryden 98 CLO Ltd. Series 2022-98A Class A, CME TERM SOFR 3 MONTH INDEX + 1.300% 2.204% 4/20/35 (d)(f)(g) | | 16,182,000 | 15,636,990 |
| Dryden CLO, Ltd.: | | | |
| Series 2021-76A Class A1R, 3 month U.S. LIBOR + 1.150% 3.8599% 10/20/34 (d)(f)(g) | | 15,763,000 | 15,392,995 |
| Series 2021-83A Class A, 3 month U.S. LIBOR + 1.220% 3.9603% 1/18/32 (d)(f)(g) | | 22,617,000 | 22,266,165 |
| Dryden Senior Loan Fund: | | | |
| Series 2018-58A Class A1, 3 month U.S. LIBOR + 1.000% 3.7403% 7/17/31 (d)(f)(g) | | 6,587,000 | 6,470,041 |
| Series 2020-78A Class A, 3 month U.S. LIBOR + 1.180% 3.9203% 4/17/33 (d)(f)(g) | | 16,400,000 | 16,064,308 |
| Series 2021-85A Class AR, 3 month U.S. LIBOR + 1.150% 3.662% 10/15/35 (d)(f)(g) | | 21,145,000 | 20,636,907 |
| Series 2021-90A Class A1A, 3 month U.S. LIBOR + 1.130% 4.114% 2/20/35 (d)(f)(g) | | 12,306,000 | 11,971,880 |
| Eaton Vance CLO, Ltd.: | | | |
| Series 2021-1A Class AR, 3 month U.S. LIBOR + 1.100% 3.612% 4/15/31 (d)(f)(g) | | 10,674,000 | 10,471,087 |
| Series 2021-2A Class AR, 3 month U.S. LIBOR + 1.150% 3.662% 1/15/35 (d)(f)(g) | | 36,609,000 | 35,801,515 |
| Eaton Vance CLO, Ltd. / Eaton Vance CLO LLC Series 2021-1A Class A13R, 3 month U.S. LIBOR + 1.250% 3.762% 1/15/34 (d)(f)(g) | | 6,600,000 | 6,463,255 |
| Enterprise Fleet Financing LLC Series 2021-1 Class A2, 0.44% 12/21/26 (d) | | 8,406,911 | 8,137,084 |
| FirstKey Homes Trust: | | | |
| Series 2020-SFR1 Class F2, 4.284% 8/17/37 (d) | | 756,000 | 703,948 |
| Series 2021-SFR1 Class F1, 3.238% 8/17/38 (d) | | 473,000 | 404,648 |
| Flatiron CLO Ltd. Series 2021-1A: | | | |
| Class A1, 3 month U.S. LIBOR + 1.110% 3.8476% 7/19/34 (d)(f)(g) | | 16,641,000 | 16,163,137 |
| Class AR, 3 month U.S. LIBOR + 1.080% 4.0016% 11/16/34 (d)(f)(g) | | 23,750,000 | 23,194,084 |
| Flatiron CLO Ltd. / Flatiron CLO LLC Series 2020-1A Class A, 3 month U.S. LIBOR + 1.300% 4.284% 11/20/33 (d)(f)(g) | | 35,773,000 | 35,036,649 |
| Home Partners of America Trust: | | | |
| Series 2019-2 Class F, 3.866% 10/19/39 (d) | | 896,168 | 774,514 |
| Series 2021-2 Class G, 4.505% 12/17/26 (d) | | 4,054,465 | 3,502,944 |
| Series 2021-3 Class F, 4.242% 1/17/41 (d) | | 601,140 | 520,614 |
| Horizon Aircraft Finance I Ltd. Series 2018-1 Class A, 4.458% 12/15/38 (d) | | 7,933,903 | 6,903,738 |
| Horizon Aircraft Finance Ltd. Series 2019-1 Class A, 3.721% 7/15/39 (d) | | 8,682,560 | 7,562,475 |
| Invesco CLO Ltd. Series 2021-3A Class A, 3 month U.S. LIBOR + 1.130% 3.889% 10/22/34 (d)(f)(g) | | 16,712,000 | 16,207,331 |
| KKR CLO Ltd. Series 2022-41A Class A1, CME TERM SOFR 3 MONTH INDEX + 1.330% 2.0223% 4/15/35 (d)(f)(g) | | 37,587,000 | 36,316,146 |
| Lucali CLO Ltd. Series 2021-1A Class A, 3 month U.S. LIBOR + 1.210% 3.722% 1/15/33 (d)(f)(g) | | 15,100,000 | 14,823,625 |
| Madison Park Funding Series 2020-19A Class A1R2, 3 month U.S. LIBOR + 0.920% 3.679% 1/22/28 (d)(f)(g) | | 16,956,712 | 16,748,721 |
| Madison Park Funding L Ltd. / Madison Park Funding L LLC Series 2021-50A Class A, 3 month U.S. LIBOR + 1.140% 3.8776% 4/19/34 (d)(f)(g) | | 33,250,000 | 32,537,453 |
| Madison Park Funding LII Ltd. / Madison Park Funding LII LLC Series 2021-52A Class A, 3 month U.S. LIBOR + 1.100% 3.859% 1/22/35 (d)(f)(g) | | 26,843,000 | 26,096,738 |
| Madison Park Funding XLV Ltd./Madison Park Funding XLV LLC Series 2021-45A Class AR, 3 month U.S. LIBOR + 1.120% 3.632% 7/15/34 (d)(f)(g) | | 16,653,000 | 16,209,631 |
| Madison Park Funding XXXII, Ltd. / Madison Park Funding XXXII LLC Series 2021-32A Class A2R, 3 month U.S. LIBOR + 1.200% 3.959% 1/22/31 (d)(f)(g) | | 7,234,000 | 7,013,602 |
| Magnetite CLO Ltd. Series 2021-27A Class AR, 3 month U.S. LIBOR + 1.140% 3.8499% 10/20/34 (d)(f)(g) | | 5,653,000 | 5,523,524 |
| Magnetite IX, Ltd. / Magnetite IX LLC Series 2021-30A Class A, 3 month U.S. LIBOR + 1.130% 3.913% 10/25/34 (d)(f)(g) | | 28,658,000 | 27,998,665 |
| Magnetite XXI Ltd. Series 2021-21A Class AR, 3 month U.S. LIBOR + 1.020% 3.7299% 4/20/34 (d)(f)(g) | | 23,008,000 | 22,495,589 |
| Magnetite XXIII, Ltd. Series 2021-23A Class AR, 3 month U.S. LIBOR + 1.130% 3.913% 1/25/35 (d)(f)(g) | | 19,791,000 | 19,307,783 |
| Magnetite XXIX, Ltd. / Magnetite XXIX LLC Series 2021-29A Class A, 3 month U.S. LIBOR + 0.990% 3.502% 1/15/34 (d)(f)(g) | | 28,450,000 | 27,930,987 |
| Merit Securities Corp. Series 13 Class M1, 7.88% 12/28/33 (f) | | 75,942 | 75,663 |
| Milos CLO, Ltd. Series 2020-1A Class AR, 3 month U.S. LIBOR + 1.070% 3.7799% 10/20/30 (d)(f)(g) | | 25,105,000 | 24,707,563 |
| Park Place Securities, Inc. Series 2005-WCH1 Class M4, 1 month U.S. LIBOR + 1.240% 3.6887% 1/25/36 (f)(g) | | 325,608 | 323,392 |
| Peace Park CLO, Ltd. Series 2021-1A Class A, 3 month U.S. LIBOR + 1.130% 3.8399% 10/20/34 (d)(f)(g) | | 21,089,000 | 20,632,107 |
| Planet Fitness Master Issuer LLC: | | | |
| Series 2018-1A Class A2II, 4.666% 9/5/48 (d) | | 36,257,375 | 34,989,128 |
| Series 2019-1A Class A2, 3.858% 12/5/49 (d) | | 17,390,100 | 14,831,477 |
| Series 2022-1A: | | | |
| Class A2I, 3.251% 12/5/51 (d) | | 23,049,233 | 20,741,198 |
| Class A2II, 4.008% 12/5/51 (d) | | 16,714,110 | 13,872,410 |
| Progress Residential: | | | |
| Series 2022-SFR3 Class F, 6.6% 4/17/39 (d) | | 1,450,000 | 1,364,904 |
| Series 2022-SFR4 Class E1, 6.121% 5/17/41 (d) | | 1,423,000 | 1,359,522 |
| Series 2022-SFR5 Class E2, 6.863% 6/17/39 (d) | | 1,544,000 | 1,527,404 |
| Progress Residential Trust: | | | |
| Series 2019-SFR3: | | | |
| Class F, 3.867% 9/17/36 (d) | | 546,000 | 528,921 |
| Class G, 4.116% 9/17/36 (d) | | 466,000 | 452,484 |
| Series 2019-SFR4 Class F, 3.684% 10/17/36 (d) | | 1,943,000 | 1,876,755 |
| Series 2020-SFR1: | | | |
| Class G, 4.028% 4/17/37 (d) | | 674,000 | 631,457 |
| Class H, 5.268% 4/17/37 (d) | | 189,000 | 179,507 |
| Series 2020-SFR3 Class H, 6.234% 10/17/27 (d) | | 483,000 | 468,361 |
| Series 2021-SFR2 Class H, 4.998% 4/19/38 (d) | | 735,000 | 642,720 |
| Series 2021-SFR6: | | | |
| Class F, 3.422% 7/17/38 (d) | | 546,000 | 482,573 |
| Class G, 4.003% 7/17/38 (d) | | 273,000 | 242,710 |
| Series 2021-SFR8: | | | |
| Class F, 3.181% 10/17/38 (d) | | 361,000 | 312,065 |
| Class G, 4.005% 10/17/38 (d) | | 2,380,000 | 2,054,852 |
| Series 2022-SFR2 Class E2, 4.8% 4/17/27 | | 1,225,000 | 1,111,697 |
| Series 2022-SFR5 Class E1, 6.618% 6/17/39 (d) | | 922,000 | 912,079 |
| Project Silver Series 2019-1 Class A, 3.967% 7/15/44 (d) | | 16,376,799 | 13,984,295 |
| Rockland Park CLO Ltd. Series 2021-1A Class A, 3 month U.S. LIBOR + 1.120% 3.8299% 4/20/34 (d)(f)(g) | | 31,749,000 | 31,059,507 |
| RR 7 Ltd. Series 2022-7A Class A1AB, CME TERM SOFR 3 MONTH INDEX + 1.340% 3.6679% 1/15/37 (d)(f)(g) | | 31,230,000 | 30,244,225 |
| Sapphire Aviation Finance Series 2020-1A: | | | |
| Class A, 3.228% 3/15/40 (d) | | 17,833,035 | 15,461,226 |
| Class B, 4.335% 3/15/40 (d) | | 1,975,003 | 1,282,080 |
| SBA Tower Trust: | | | |
| Series 2019, 2.836% 1/15/50 (d) | | 22,598,000 | 21,603,306 |
| 1.884% 7/15/50 (d) | | 9,101,000 | 8,201,121 |
| 2.328% 7/15/52 (d) | | 6,959,000 | 6,069,502 |
| Starwood Mortgage Residential Trust Series 2022-SFR3 Class F, CME Term SOFR 1 Month Index + 4.500% 6.797% 5/17/24 (d)(f)(g) | | 2,884,000 | 2,843,422 |
| Stratus CLO, Ltd. Series 2022-1A Class A, CME TERM SOFR 3 MONTH INDEX + 1.750% 4.032% 7/20/30 (d)(f)(g) | | 4,321,000 | 4,281,852 |
| SYMP Series 2022-32A Class A1, CME TERM SOFR 3 MONTH INDEX + 1.320% 1.6326% 4/23/35 (d)(f)(g) | | 32,177,000 | 30,944,331 |
| Symphony CLO XIX, Ltd. / Symphony CLO XIX LLC Series 2018-19A Class A, 3 month U.S. LIBOR + 0.960% 3.7003% 4/16/31 (d)(f)(g) | | 11,913,000 | 11,727,503 |
| Symphony CLO XXI, Ltd. Series 2021-21A Class AR, 3 month U.S. LIBOR + 1.060% 3.572% 7/15/32 (d)(f)(g) | | 3,095,000 | 3,031,206 |
| Symphony CLO XXV Ltd. / Symphony CLO XXV LLC Series 2021-25A Class A, 3 month U.S. LIBOR + 0.980% 3.7176% 4/19/34 (d)(f)(g) | | 28,855,000 | 28,041,116 |
| Symphony CLO XXVI Ltd. / Symphony CLO XXVI LLC Series 2021-26A Class AR, 3 month U.S. LIBOR + 1.080% 3.7899% 4/20/33 (d)(f)(g) | | 30,048,000 | 29,248,513 |
| Taberna Preferred Funding VI Ltd. Series 2006-6A Class F1, 3 month U.S. LIBOR + 4.500% 7.3323% 12/5/36 (c)(d)(f)(g) | | 759,906 | 57 |
| Terwin Mortgage Trust Series 2003-4HE Class A1, 1 month U.S. LIBOR + 0.860% 3.3037% 9/25/34 (f)(g) | | 13,543 | 13,582 |
| Thunderbolt Aircraft Lease Ltd.: | | | |
| Series 2017-A Class A, 4.212% 5/17/32 (d) | | 9,887,089 | 8,587,036 |
| Series 2018-A Class A, 4.147% 9/15/38 (d)(f) | | 16,876,359 | 14,816,524 |
| Thunderbolt III Aircraft Lease Ltd. Series 2019-1 Class A, 3.671% 11/15/39 (d) | | 26,375,760 | 22,622,120 |
| Towd Point Mortgage Trust Series 2019-1 Class A1, 3.6794% 3/25/58 (d)(f) | | 3,980,344 | 3,836,922 |
| Trapeza CDO XII Ltd./Trapeza CDO XII, Inc. Series 2007-12A Class B, 3 month U.S. LIBOR + 0.560% 2.8817% 4/6/42 (d)(f)(g) | | 1,639,000 | 1,221,965 |
| Tricon American Homes: | | | |
| Series 2017-SFR2 Class F, 5.104% 1/17/36 (d) | | 280,000 | 277,463 |
| Series 2019-SFR1 Class F, 3.745% 3/17/38 (d) | | 924,000 | 864,858 |
| Series 2020-SFR1 Class F, 4.882% 7/17/38 (d) | | 269,000 | 255,705 |
| Tricon Residential Series 2022-SFR1: | | | |
| Class E1, 5.344% 4/17/39 (d) | | 1,931,000 | 1,834,991 |
| Class E2, 5.739% 4/17/39 (d) | | 2,399,000 | 2,280,820 |
| Tricon Residential Trust Series 2021-SFR1 Class G, 4.133% 7/17/38 (d) | | 315,000 | 275,277 |
| Upstart Securitization Trust Series 2021-1 Class A, 0.87% 3/20/31(d) | | 591,939 | 586,993 |
| Verizon Master Trust Series 2021-1 Class B, 0.69% 5/20/27 | | 17,242,000 | 16,188,324 |
| Voya CLO Ltd. Series 2019-2A Class A, 3 month U.S. LIBOR + 1.270% 3.9799% 7/20/32 (d)(f)(g) | | 23,497,000 | 23,082,724 |
| Voya CLO Ltd./Voya CLO LLC: | | | |
| Series 2021-2A Class A1R, 3 month U.S. LIBOR + 1.160% 3.8976% 7/19/34 (d)(f)(g) | | 15,449,000 | 15,049,535 |
| Series 2021-3A Class AR, 3 month U.S. LIBOR + 1.150% 3.8599% 10/20/34 (d)(f)(g) | | 31,775,000 | 30,897,470 |
| Voya CLO, Ltd. Series 2021-1A Class AR, 3 month U.S. LIBOR + 1.150% 3.8903% 7/16/34 (d)(f)(g) | | 15,502,000 | 15,071,882 |
| TOTAL ASSET-BACKED SECURITIES | | | |
| (Cost $1,956,384,627) | | | 1,860,707,712 |
|
| Collateralized Mortgage Obligations - 0.7% | | | |
| Private Sponsor - 0.3% | | | |
| Ajax Mortgage Loan Trust sequential payer Series 2021-E Class A1, 1.74% 12/25/60 (d) | | 12,511,781 | 11,035,479 |
| Brass PLC Series 2021-10A Class A1, 0.669% 4/16/69 (d)(f) | | 11,151,660 | 10,696,471 |
| Cascade Funding Mortgage Trust: | | | |
| Series 2021-HB5 Class A, 0.8006% 2/25/31 (d) | | 11,185,189 | 10,941,902 |
| Series 2021-HB6 Class A, 0.8983% 6/25/36 (d) | | 14,058,800 | 13,420,568 |
| CFMT LLC Series 2020-HB4 Class A, 0.9461% 12/26/30 (d) | | 7,858,278 | 7,743,226 |
| Citigroup Mortgage Loan Trust sequential payer Series 2014-8 Class 2A1, 3.45% 6/27/37 (d)(f) | | 291,513 | 286,317 |
| Countrywide Home Loans, Inc. Series 2003-R1 Class 2B4, 3.3614% 2/25/43 (d)(f) | | 3,789 | 570 |
| CSMC: | | | |
| floater Series 2015-1R Class 6A1, 1 month U.S. LIBOR + 0.280% 2.819% 5/27/37 (d)(f)(g) | | 1,015,234 | 995,201 |
| Series 2014-3R Class 2A1, 1 month U.S. LIBOR + 0.700% 0% 5/27/37 (c)(d)(f)(g) | | 153,098 | 15 |
| MFA Trust sequential payer Series 2022-RPL1 Class A1, 3.3% 8/25/61 (d) | | 9,201,697 | 8,567,360 |
| Oceanview Trust sequential payer Series 2021-1 Class A, 1.2187% 12/29/51 (d)(f) | | 8,610,145 | 8,515,822 |
| RMF Buyout Issuance Trust: | | | |
| sequential payer Series 2021-HB1 Class A, 1.2586% 11/25/31 (d) | | 11,923,212 | 11,392,712 |
| Series 2020-HB1 Class A1, 1.7188% 10/25/50 (d) | | 6,198,587 | 5,901,545 |
| Sequoia Mortgage Trust floater Series 2004-6 Class A3B, 6 month U.S. LIBOR + 0.880% 3.6276% 7/20/34 (f)(g) | | 3,131 | 2,871 |
| Thornburg Mortgage Securities Trust floater Series 2003-4 Class A1, 1 month U.S. LIBOR + 0.640% 3.0837% 9/25/43 (f)(g) | | 1,524,880 | 1,455,617 |
| Towd Point Mortgage Trust sequential payer Series 2022-K147 Class A2, 3.75% 7/25/62 (d) | | 13,141,663 | 12,421,652 |
|
| TOTAL PRIVATE SPONSOR | | | 103,377,328 |
|
| U.S. Government Agency - 0.4% | | | |
| Fannie Mae: | | | |
| floater: | | | |
| Series 2002-18 Class FD, 1 month U.S. LIBOR + 0.800% 3.2437% 2/25/32 (f)(g) | | 4,961 | 5,032 |
| Series 2002-39 Class FD, 1 month U.S. LIBOR + 1.000% 3.377% 3/18/32 (f)(g) | | 9,353 | 9,528 |
| Series 2002-60 Class FV, 1 month U.S. LIBOR + 1.000% 3.4437% 4/25/32 (f)(g) | | 10,872 | 11,094 |
| Series 2002-63 Class FN, 1 month U.S. LIBOR + 1.000% 3.4437% 10/25/32 (f)(g) | | 13,429 | 13,691 |
| Series 2002-7 Class FC, 1 month U.S. LIBOR + 0.750% 3.1937% 1/25/32 (f)(g) | | 4,905 | 4,966 |
| Series 2003-118 Class S, 8.100% - 1 month U.S. LIBOR 5.6563% 12/25/33 (f)(o)(p) | | 182,218 | 31,324 |
| Series 2006-104 Class GI, 6.680% - 1 month U.S. LIBOR 4.2363% 11/25/36 (f)(o)(p) | | 130,456 | 14,915 |
| planned amortization class: | | | |
| Series 1992-168 Class KB, 7% 10/25/22 | | 60 | 60 |
| Series 1993-207 Class H, 6.5% 11/25/23 | | 14,888 | 14,960 |
| Series 1996-28 Class PK, 6.5% 7/25/25 | | 6,135 | 6,173 |
| Series 1999-17 Class PG, 6% 4/25/29 | | 54,700 | 56,357 |
| Series 1999-32 Class PL, 6% 7/25/29 | | 63,268 | 65,324 |
| Series 1999-33 Class PK, 6% 7/25/29 | | 46,869 | 48,371 |
| Series 2001-52 Class YZ, 6.5% 10/25/31 | | 7,178 | 7,365 |
| Series 2003-28 Class KG, 5.5% 4/25/23 | | 3,602 | 3,610 |
| Series 2005-102 Class CO 11/25/35 (q) | | 33,056 | 28,494 |
| Series 2005-73 Class SA, 17.500% - 1 month U.S. LIBOR 11.1964% 8/25/35 (f)(p) | | 7,787 | 8,411 |
| Series 2005-81 Class PC, 5.5% 9/25/35 | | 93,507 | 97,491 |
| Series 2006-12 Class BO 10/25/35 (q) | | 150,955 | 131,133 |
| Series 2006-15 Class OP 3/25/36 (q) | | 175,334 | 150,890 |
| Series 2006-37 Class OW 5/25/36 (q) | | 17,579 | 14,156 |
| Series 2006-45 Class OP 6/25/36 (q) | | 55,384 | 44,810 |
| Series 2006-62 Class KP 4/25/36 (q) | | 90,303 | 75,303 |
| Series 2012-149: | | | |
| Class DA, 1.75% 1/25/43 | | 1,696,797 | 1,576,101 |
| Class GA, 1.75% 6/25/42 | | 1,826,164 | 1,692,751 |
| sequential payer: | | | |
| Series 1997-41 Class J, 7.5% 6/18/27 | | 11,907 | 12,393 |
| Series 1999-25 Class Z, 6% 6/25/29 | | 52,513 | 53,756 |
| Series 2001-20 Class Z, 6% 5/25/31 | | 63,246 | 65,459 |
| Series 2001-31 Class ZC, 6.5% 7/25/31 | | 33,139 | 34,278 |
| Series 2002-16 Class ZD, 6.5% 4/25/32 | | 22,760 | 23,327 |
| Series 2002-74 Class SV, 7.550% - 1 month U.S. LIBOR 5.1063% 11/25/32 (f)(o)(p) | | 65,840 | 3,689 |
| Series 2012-67 Class AI, 4.5% 7/25/27 (o) | | 168,351 | 6,626 |
| Series 06-116 Class SG, 6.640% - 1 month U.S. LIBOR 4.1963% 12/25/36 (f)(o)(p) | | 86,398 | 13,371 |
| Series 07-40 Class SE, 6.440% - 1 month U.S. LIBOR 3.9963% 5/25/37 (f)(o)(p) | | 44,929 | 6,484 |
| Series 1993-165 Class SH, 19.800% - 1 month U.S. LIBOR 12.8877% 9/25/23 (f)(p) | | 670 | 680 |
| Series 2003-21 Class SK, 8.100% - 1 month U.S. LIBOR 5.6563% 3/25/33 (f)(o)(p) | | 11,331 | 1,638 |
| Series 2005-72 Class ZC, 5.5% 8/25/35 | | 713,385 | 741,335 |
| Series 2005-79 Class ZC, 5.9% 9/25/35 | | 543,260 | 566,707 |
| Series 2007-57 Class SA, 40.600% - 1 month U.S. LIBOR 25.9577% 6/25/37 (f)(p) | | 40,857 | 58,724 |
| Series 2007-66: | | | |
| Class SA, 39.600% - 1 month U.S. LIBOR 24.9377% 7/25/37 (f)(p) | | 60,798 | 90,454 |
| Class SB, 39.600% - 1 month U.S. LIBOR 24.9377% 7/25/37 (f)(p) | | 19,267 | 24,679 |
| Series 2007-75 Class JI, 6.540% - 1 month U.S. LIBOR 4.1013% 8/25/37 (f)(o)(p) | | 1,805,521 | 232,851 |
| Series 2008-12 Class SG, 6.350% - 1 month U.S. LIBOR 3.9063% 3/25/38 (f)(o)(p) | | 301,740 | 36,762 |
| Series 2010-135: | | | |
| Class LS, 6.050% - 1 month U.S. LIBOR 3.6063% 12/25/40 (f)(o)(p) | | 310,358 | 30,926 |
| Class ZA, 4.5% 12/25/40 | | 873,790 | 919,248 |
| Series 2010-139 Class NI, 4.5% 2/25/40 (o) | | 100,317 | 3,225 |
| Series 2010-150 Class ZC, 4.75% 1/25/41 | | 1,621,033 | 1,675,957 |
| Series 2010-95 Class ZC, 5% 9/25/40 | | 3,751,387 | 3,915,858 |
| Series 2011-39 Class ZA, 6% 11/25/32 | | 215,137 | 224,941 |
| Series 2011-4 Class PZ, 5% 2/25/41 | | 527,301 | 532,747 |
| Series 2011-67 Class AI, 4% 7/25/26 (o) | | 30,405 | 966 |
| Series 2011-83 Class DI, 6% 9/25/26 (o) | | 781 | 6 |
| Series 2012-100 Class WI, 3% 9/25/27 (o) | | 872,279 | 47,529 |
| Series 2012-14 Class JS, 6.650% - 1 month U.S. LIBOR 4.2063% 12/25/30 (f)(o)(p) | | 122,357 | 1,885 |
| Series 2012-9 Class SH, 6.550% - 1 month U.S. LIBOR 4.1063% 6/25/41 (f)(o)(p) | | 88,521 | 1,660 |
| Series 2013-133 Class IB, 3% 4/25/32 (o) | | 302,245 | 10,730 |
| Series 2013-134 Class SA, 6.050% - 1 month U.S. LIBOR 3.6063% 1/25/44 (f)(o)(p) | | 264,462 | 31,671 |
| Series 2013-51 Class GI, 3% 10/25/32 (o) | | 1,136,845 | 75,152 |
| Series 2013-N1 Class A, 6.720% - 1 month U.S. LIBOR 4.2763% 6/25/35 (f)(o)(p) | | 254,954 | 25,911 |
| Series 2015-42 Class IL, 6% 6/25/45 (o) | | 1,735,943 | 317,338 |
| Series 2015-70 Class JC, 3% 10/25/45 | | 1,511,648 | 1,461,596 |
| Series 2017-30 Class AI, 5.5% 5/25/47 (o) | | 1,015,913 | 190,337 |
| Fannie Mae Stripped Mortgage-Backed Securities: | | | |
| Series 339 Class 5, 5.5% 7/25/33 (o) | | 46,111 | 7,901 |
| Series 343 Class 16, 5.5% 5/25/34 (o) | | 42,177 | 7,224 |
| Series 348 Class 14, 6.5% 8/25/34 (f)(o) | | 29,317 | 6,037 |
| Series 351: | | | |
| Class 12, 5.5% 4/25/34 (f)(o) | | 18,202 | 3,222 |
| Class 13, 6% 3/25/34 (o) | | 27,165 | 5,204 |
| Series 359 Class 19, 6% 7/25/35 (f)(o) | | 15,668 | 3,060 |
| Series 384 Class 6, 5% 7/25/37 (o) | | 180,049 | 31,693 |
| Freddie Mac: | | | |
| floater: | | | |
| Series 2412 Class FK, 1 month U.S. LIBOR + 0.800% 3.191% 1/15/32 (f)(g) | | 3,697 | 3,752 |
| Series 2423 Class FA, 1 month U.S. LIBOR + 0.900% 3.291% 3/15/32 (f)(g) | | 5,730 | 5,831 |
| Series 2424 Class FM, 1 month U.S. LIBOR + 1.000% 3.391% 3/15/32 (f)(g) | | 5,357 | 5,460 |
| Series 2432: | | | |
| Class FE, 1 month U.S. LIBOR + 0.900% 3.291% 6/15/31 (f)(g) | | 9,941 | 10,095 |
| Class FG, 1 month U.S. LIBOR + 0.900% 3.291% 3/15/32 (f)(g) | | 3,207 | 3,261 |
| floater target amortization class Series 3366 Class FD, 1 month U.S. LIBOR + 0.250% 2.641% 5/15/37 (f)(g) | | 224,229 | 222,934 |
| planned amortization class: | | | |
| Series 2095 Class PE, 6% 11/15/28 | | 69,221 | 71,561 |
| Series 2101 Class PD, 6% 11/15/28 | | 5,739 | 5,934 |
| Series 2121 Class MG, 6% 2/15/29 | | 28,142 | 29,088 |
| Series 2131 Class BG, 6% 3/15/29 | | 203,739 | 210,811 |
| Series 2137 Class PG, 6% 3/15/29 | | 31,309 | 32,383 |
| Series 2154 Class PT, 6% 5/15/29 | | 54,423 | 56,306 |
| Series 2162 Class PH, 6% 6/15/29 | | 11,207 | 11,563 |
| Series 2520 Class BE, 6% 11/15/32 | | 91,641 | 96,181 |
| Series 2693 Class MD, 5.5% 10/15/33 | | 844,040 | 847,504 |
| Series 2802 Class OB, 6% 5/15/34 | | 78,100 | 80,944 |
| Series 3002 Class NE, 5% 7/15/35 | | 209,139 | 213,597 |
| Series 3110 Class OP 9/15/35 (q) | | 66,590 | 61,071 |
| Series 3119 Class PO 2/15/36 (q) | | 214,654 | 176,007 |
| Series 3121 Class KO 3/15/36 (q) | | 32,819 | 27,378 |
| Series 3123 Class LO 3/15/36 (q) | | 120,690 | 99,739 |
| Series 3145 Class GO 4/15/36 (q) | | 128,970 | 107,172 |
| Series 3189 Class PD, 6% 7/15/36 | | 178,923 | 189,218 |
| Series 3225 Class EO 10/15/36 (q) | | 64,715 | 52,466 |
| Series 3258 Class PM, 5.5% 12/15/36 | | 80,721 | 84,247 |
| Series 3415 Class PC, 5% 12/15/37 | | 84,853 | 86,139 |
| Series 3806 Class UP, 4.5% 2/15/41 | | 388,213 | 386,303 |
| Series 3832 Class PE, 5% 3/15/41 | | 826,051 | 844,237 |
| Series 4135 Class AB, 1.75% 6/15/42 | | 1,371,076 | 1,278,970 |
| sequential payer: | | | |
| Series 2135 Class JE, 6% 3/15/29 | | 13,639 | 14,110 |
| Series 2274 Class ZM, 6.5% 1/15/31 | | 19,788 | 20,458 |
| Series 2281 Class ZB, 6% 3/15/30 | | 38,797 | 40,060 |
| Series 2303 Class ZV, 6% 4/15/31 | | 20,371 | 21,108 |
| Series 2357 Class ZB, 6.5% 9/15/31 | | 156,203 | 163,738 |
| Series 2502 Class ZC, 6% 9/15/32 | | 37,719 | 39,564 |
| Series 2519 Class ZD, 5.5% 11/15/32 | | 55,447 | 57,664 |
| Series 2546 Class MJ, 5.5% 3/15/23 | | 2,568 | 2,577 |
| Series 2601 Class TB, 5.5% 4/15/23 | | 1,163 | 1,168 |
| Series 2998 Class LY, 5.5% 7/15/25 | | 21,768 | 22,259 |
| Series 3871 Class KB, 5.5% 6/15/41 | | 1,329,278 | 1,404,555 |
| Series 06-3115 Class SM, 6.600% - 1 month U.S. LIBOR 4.209% 2/15/36 (f)(o)(p) | | 60,059 | 6,627 |
| Series 2013-4281 Class AI, 4% 12/15/28 (o) | | 234,102 | 5,984 |
| Series 2017-4683 Class LM, 3% 5/15/47 | | 2,398,691 | 2,315,839 |
| Series 2933 Class ZM, 5.75% 2/15/35 | | 1,123,086 | 1,191,237 |
| Series 2935 Class ZK, 5.5% 2/15/35 | | 891,345 | 934,001 |
| Series 2947 Class XZ, 6% 3/15/35 | | 364,435 | 384,061 |
| Series 2996 Class ZD, 5.5% 6/15/35 | | 780,427 | 815,933 |
| Series 3237 Class C, 5.5% 11/15/36 | | 1,007,722 | 1,037,525 |
| Series 3244 Class SG, 6.660% - 1 month U.S. LIBOR 4.269% 11/15/36 (f)(o)(p) | | 272,979 | 36,796 |
| Series 3287 Class SD, 6.750% - 1 month U.S. LIBOR 4.359% 3/15/37 (f)(o)(p) | | 410,773 | 63,727 |
| Series 3297 Class BI, 6.760% - 1 month U.S. LIBOR 4.369% 4/15/37 (f)(o)(p) | | 586,870 | 80,956 |
| Series 3336 Class LI, 6.580% - 1 month U.S. LIBOR 4.189% 6/15/37 (f)(o)(p) | | 189,727 | 23,393 |
| Series 3949 Class MK, 4.5% 10/15/34 | | 148,918 | 150,351 |
| Series 4055 Class BI, 3.5% 5/15/31 (o) | | 320,547 | 11,221 |
| Series 4149 Class IO, 3% 1/15/33 (o) | | 605,030 | 52,220 |
| Series 4314 Class AI, 5% 3/15/34 (o) | | 101,219 | 3,999 |
| Series 4427 Class LI, 3.5% 2/15/34 (o) | | 924,770 | 70,188 |
| Series 4471 Class PA 4% 12/15/40 | | 773,767 | 767,853 |
| target amortization class Series 2156 Class TC, 6.25% 5/15/29 | | 28,308 | 29,142 |
| Freddie Mac Manufactured Housing participation certificates guaranteed: | | | |
| floater Series 1686 Class FA, 1 month U.S. LIBOR + 0.900% 2.8991% 2/15/24 (f)(g) | | 4,004 | 4,012 |
| sequential payer: | | | |
| Series 2043 Class ZH, 6% 4/15/28 | | 22,509 | 23,208 |
| Series 2056 Class Z, 6% 5/15/28 | | 55,342 | 57,165 |
| Freddie Mac Multi-family Structured pass-thru certificates Series 4386 Class AZ, 4.5% 11/15/40 | | 1,877,718 | 1,884,800 |
| Freddie Mac Seasoned Credit Risk Transfer Trust Series 2018-3 Class M55D, 4% 8/25/57 | | 4,940,587 | 4,855,282 |
| Ginnie Mae guaranteed REMIC pass-thru certificates: | | | |
| floater: | | | |
| Series 2007-37 Class TS, 6.690% - 1 month U.S. LIBOR 4.3031% 6/16/37 (f)(o)(p) | | 112,819 | 14,457 |
| Series 2010-H03 Class FA, 1 month U.S. LIBOR + 0.550% 2.8497% 3/20/60 (f)(g)(r) | | 1,405,895 | 1,399,496 |
| Series 2010-H17 Class FA, 1 month U.S. LIBOR + 0.330% 2.6297% 7/20/60 (f)(g)(r) | | 214,267 | 212,160 |
| Series 2010-H18 Class AF, 1 month U.S. LIBOR + 0.300% 2.0976% 9/20/60 (f)(g)(r) | | 265,042 | 262,447 |
| Series 2010-H19 Class FG, 1 month U.S. LIBOR + 0.300% 2.0976% 8/20/60 (f)(g)(r) | | 220,732 | 218,634 |
| Series 2010-H27 Class FA, 1 month U.S. LIBOR + 0.380% 2.1776% 12/20/60 (f)(g)(r) | | 563,348 | 558,584 |
| Series 2011-H05 Class FA, 1 month U.S. LIBOR + 0.500% 2.2976% 12/20/60 (f)(g)(r) | | 548,377 | 545,232 |
| Series 2011-H07 Class FA, 1 month U.S. LIBOR + 0.500% 2.2976% 2/20/61 (f)(g)(r) | | 537,919 | 534,789 |
| Series 2011-H12 Class FA, 1 month U.S. LIBOR + 0.490% 2.2876% 2/20/61 (f)(g)(r) | | 836,289 | 831,537 |
| Series 2011-H13 Class FA, 1 month U.S. LIBOR + 0.500% 2.2976% 4/20/61 (f)(g)(r) | | 505,704 | 502,631 |
| Series 2011-H14: | | | |
| Class FB, 1 month U.S. LIBOR + 0.500% 2.2976% 5/20/61 (f)(g)(r) | | 791,776 | 787,211 |
| Class FC, 1 month U.S. LIBOR + 0.500% 2.2976% 5/20/61 (f)(g)(r) | | 589,748 | 586,175 |
| Series 2011-H17 Class FA, 1 month U.S. LIBOR + 0.530% 2.3276% 6/20/61 (f)(g)(r) | | 694,307 | 690,655 |
| Series 2011-H21 Class FA, 1 month U.S. LIBOR + 0.600% 2.3976% 10/20/61 (f)(g)(r) | | 1,393,276 | 1,387,374 |
| Series 2012-H01 Class FA, 1 month U.S. LIBOR + 0.700% 2.4976% 11/20/61 (f)(g)(r) | | 760,013 | 757,864 |
| Series 2012-H03 Class FA, 1 month U.S. LIBOR + 0.700% 2.4976% 1/20/62 (f)(g)(r) | | 463,138 | 461,879 |
| Series 2012-H06 Class FA, 1 month U.S. LIBOR + 0.630% 2.4276% 1/20/62 (f)(g)(r) | | 681,147 | 678,434 |
| Series 2012-H07 Class FA, 1 month U.S. LIBOR + 0.630% 2.4276% 3/20/62 (f)(g)(r) | | 403,060 | 401,543 |
| Series 2012-H21 Class DF, 1 month U.S. LIBOR + 0.650% 2.4476% 5/20/61 (f)(g)(r) | | 14,761 | 14,704 |
| Series 2012-H23 Class WA, 1 month U.S. LIBOR + 0.520% 2.3176% 10/20/62 (f)(g)(r) | | 333,844 | 331,995 |
| Series 2013-H07 Class BA, 1 month U.S. LIBOR + 0.360% 2.1576% 3/20/63 (f)(g)(r) | | 595,098 | 589,922 |
| Series 2014-H03 Class FA, 1 month U.S. LIBOR + 0.600% 2.3976% 1/20/64 (f)(g)(r) | | 496,476 | 494,503 |
| Series 2014-H05 Class FB, 1 month U.S. LIBOR + 0.600% 2.3976% 12/20/63 (f)(g)(r) | | 2,196,704 | 2,189,026 |
| Series 2014-H11 Class BA, 1 month U.S. LIBOR + 0.500% 2.2976% 6/20/64 (f)(g)(r) | | 2,689,405 | 2,673,799 |
| Series 2014-H20 Class BF, 1 month U.S. LIBOR + 0.500% 2.2976% 9/20/64 (f)(g)(r) | | 9,076,711 | 9,023,275 |
| Series 2016-H20 Class FM, 1 month U.S. LIBOR + 0.400% 2.1976% 12/20/62 (f)(g)(r) | | 31,616 | 31,226 |
| Series 2019-11 Class F, 1 month U.S. LIBOR + 0.400% 2.7681% 1/20/49 (f)(g) | | 4,612,528 | 4,624,980 |
| Series 2019-128 Class FH, 1 month U.S. LIBOR + 0.500% 2.8681% 10/20/49 (f)(g) | | 1,321,937 | 1,322,376 |
| Series 2019-23 Class NF, 1 month U.S. LIBOR + 0.450% 2.8181% 2/20/49 (f)(g) | | 2,783,632 | 2,801,869 |
| planned amortization class: | | | |
| Series 2010-158 Class MS, 10.000% - 1 month U.S. LIBOR 5.2637% 12/20/40 (f)(p) | | 1,567,342 | 1,427,365 |
| Series 2011-136 Class WI, 4.5% 5/20/40 (o) | | 43,580 | 2,990 |
| Series 2016-69 Class WA, 3% 2/20/46 | | 1,278,320 | 1,223,464 |
| Series 2017-134 Class BA, 2.5% 11/20/46 | | 1,945,495 | 1,851,913 |
| sequential payer: | | | |
| Series 2004-24 Class ZM, 5% 4/20/34 | | 318,259 | 320,594 |
| Series 2010-160 Class DY, 4% 12/20/40 | | 3,064,528 | 2,993,995 |
| Series 2010-170 Class B, 4% 12/20/40 | | 684,413 | 668,954 |
| Series 2017-139 Class BA, 3% 9/20/47 | | 5,974,026 | 5,713,023 |
| Series 2004-32 Class GS, 6.500% - 1 month U.S. LIBOR 4.1131% 5/16/34 (f)(o)(p) | | 66,424 | 6,471 |
| Series 2004-73 Class AL, 7.200% - 1 month U.S. LIBOR 4.8131% 8/17/34 (f)(o)(p) | | 63,847 | 8,852 |
| Series 2007-35 Class SC, 40.200% - 1 month U.S. LIBOR 25.8788% 6/16/37 (f)(p) | | 5,360 | 6,834 |
| Series 2010-116 Class QB, 4% 9/16/40 | | 6,953,865 | 6,905,536 |
| Series 2010-H10 Class FA, 1 month U.S. LIBOR + 0.330% 2.6297% 5/20/60 (f)(g)(r) | | 670,384 | 664,317 |
| Series 2011-94 Class SA, 6.100% - 1 month U.S. LIBOR 3.7319% 7/20/41 (f)(o)(p) | | 263,935 | 28,277 |
| Series 2012-76 Class GS, 6.700% - 1 month U.S. LIBOR 4.3131% 6/16/42 (f)(o)(p) | | 246,321 | 29,227 |
| Series 2013-149 Class MA, 2.5% 5/20/40 | | 2,608,193 | 2,528,571 |
| Series 2014-2 Class BA, 3% 1/20/44 | | 3,877,076 | 3,669,271 |
| Series 2014-21 Class HA, 3% 2/20/44 | | 1,410,395 | 1,338,992 |
| Series 2014-25 Class HC, 3% 2/20/44 | | 2,461,610 | 2,326,351 |
| Series 2014-5 Class A, 3% 1/20/44 | | 2,105,414 | 1,993,304 |
| Series 2015-H13 Class HA, 2.5% 8/20/64 (r) | | 21,122 | 20,190 |
| Series 2017-186 Class HK, 3% 11/16/45 | | 3,459,025 | 3,289,415 |
| Series 2017-H06 Class FA, U.S. TREASURY 1 YEAR INDEX + 0.350% 3.2% 8/20/66 (f)(g)(r) | | 5,857,651 | 5,819,991 |
|
| TOTAL U.S. GOVERNMENT AGENCY | | | 115,277,154 |
|
| TOTAL COLLATERALIZED MORTGAGE OBLIGATIONS | | | |
| (Cost $227,556,400) | | | 218,654,482 |
|
| Commercial Mortgage Securities - 5.4% | | | |
| ALEN Mortgage Trust floater Series 2021-ACEN Class F, 1 month U.S. LIBOR + 5.000% 7.391% 4/15/34 (d)(f)(g) | | 1,031,000 | 868,966 |
| Ashford Hospitality Trust floater Series 2018-ASHF Class E, 1 month U.S. LIBOR + 3.100% 5.491% 4/15/35 (d)(f)(g) | | 710,000 | 656,629 |
| Atrium Hotel Portfolio Trust floater Series 2018-ATRM Class D, 1 month U.S. LIBOR + 2.300% 4.691% 6/15/35 (d)(f)(g) | | 304,000 | 291,186 |
| BAMLL Commercial Mortgage Securities Trust: | | | |
| floater: | | | |
| Series 2019-AHT Class E, 1 month U.S. LIBOR + 3.200% 5.591% 3/15/34 (d)(f)(g) | | 987,000 | 937,135 |
| Series 2019-RLJ Class D, 1 month U.S. LIBOR + 1.950% 4.341% 4/15/36 (d)(f)(g) | | 1,880,000 | 1,808,596 |
| Series 2021-JACX Class E, 1 month U.S. LIBOR + 3.750% 6.141% 9/15/38 (d)(f)(g) | | 1,120,000 | 1,044,213 |
| Series 2022-DKLX: | | | |
| Class A, CME Term SOFR 1 Month Index + 1.150% 3.458% 1/15/39 (d)(f)(g) | | 16,838,000 | 16,430,046 |
| Class B, CME Term SOFR 1 Month Index + 1.550% 3.858% 1/15/39 (d)(f)(g) | | 3,181,000 | 3,087,059 |
| Class C, CME Term SOFR 1 Month Index + 2.150% 4.458% 1/15/39 (d)(f)(g) | | 2,271,000 | 2,189,889 |
| sequential payer Series 2019-BPR: | | | |
| Class AMP, 3.287% 11/5/32 (d) | | 11,600,000 | 10,824,764 |
| Class ANM, 3.112% 11/5/32 (d) | | 14,236,000 | 13,261,500 |
| Series 2015-200P Class F, 3.7157% 4/14/33 (d)(f) | | 831,000 | 743,887 |
| Series 2019-BPR: | | | |
| Class BNM, 3.465% 11/5/32 (d) | | 3,196,000 | 2,866,500 |
| Class CNM, 3.8425% 11/5/32 (d)(f) | | 1,322,000 | 1,126,863 |
| BANK: | | | |
| sequential payer: | | | |
| Series 2019-BN21 Class A5, 2.851% 10/17/52 | | 2,606,000 | 2,358,007 |
| Series 2021-BN35 Class A5, 2.285% 6/15/64 | | 9,500,000 | 8,033,482 |
| Series 2022-BNK42: | | | |
| Class D, 2.5% 6/15/55 (d) | | 943,000 | 626,283 |
| Class E, 2.5% 6/15/55 (d) | | 738,000 | 449,597 |
| Series 2022-BNK42, Class A5, 4.493% 6/15/55 (f) | | 3,700,000 | 3,733,702 |
| Series 2022-BNK43 Class A5, 4.399% 8/15/55 | | 7,800,000 | 7,817,200 |
| Series 2017-BNK4 Class D, 3.357% 5/15/50 (d) | | 1,426,000 | 1,167,669 |
| Series 2017-BNK6 Class D, 3.1% 7/15/60 (d) | | 830,000 | 646,568 |
| Series 2017-BNK8: | | | |
| Class D, 2.6% 11/15/50 (d) | | 1,738,000 | 1,289,184 |
| Class E, 2.8% 11/15/50 (d) | | 1,092,000 | 662,806 |
| Series 2018-BN12 Class D, 3% 5/15/61 (d) | | 866,000 | 623,751 |
| Series 2018-BN15: | | | |
| Class D, 3% 11/15/61 (d) | | 735,000 | 536,512 |
| Class E, 3% 11/15/61 (d) | | 735,000 | 499,492 |
| Series 2019-BN18 Class D, 3% 5/15/62 (d) | | 1,150,000 | 868,340 |
| Series 2019-BN19 Class D, 3% 8/15/61 (d) | | 1,680,000 | 1,206,213 |
| Series 2020-BN25 Class C, 3.4675% 1/15/63 (f) | | 1,375,000 | 1,130,946 |
| Series 2020-BN27 Class D, 2.5% 4/15/63 (d) | | 430,000 | 302,960 |
| Series 2020-BN28 Class E, 2.5% 3/15/63 (d) | | 441,000 | 284,698 |
| Series 2020-BN29 Class E, 2.5% 11/15/53 (d) | | 525,000 | 336,450 |
| Series 2020-BN30: | | | |
| Class E, 2.5% 12/15/53 (d) | | 357,000 | 228,786 |
| Class MCDG, 3.0155% 12/15/53 (f) | | 3,731,000 | 2,542,816 |
| Series 2021-BN38 Class C, 3.3242% 12/15/64 (f) | | 260,000 | 206,714 |
| Series 2022-BNK43 Class D, 3% 8/15/55 (d) | | 1,759,000 | 1,198,274 |
| Bank of America Commercial Mortgage Securities Trust Series 2017-BNK3: | | | |
| Class C, 4.352% 2/15/50 (f) | | 610,000 | 547,388 |
| Class D, 3.25% 2/15/50 (d) | | 1,222,000 | 979,452 |
| Bank of America Commercial Mortgage Trust Series 2016-UB10: | | | |
| Class D, 3% 7/15/49 (d) | | 1,617,000 | 1,326,346 |
| Class XA, 1.9141% 7/15/49 (f)(o) | | 16,134,981 | 779,126 |
| Barclays Commercial Mortgage Securities LLC Series 2019-C5 Class D, 2.5% 11/15/52 (d) | | 333,000 | 236,490 |
| BBCMS Series 2022-C15 Class C, 3.959% 4/15/55 (f) | | 230,000 | 190,692 |
| BBCMS Mortgage Trust: | | | |
| sequential payer: | | | |
| Series 2020-C8 Class E, 2.25% 10/15/53 (d) | | 1,476,000 | 930,819 |
| Series 2022-C17 Class D, 2.5% 9/15/55 (d) | | 3,429,000 | 2,270,044 |
| Series 2016-ETC: | | | |
| Class D, 3.7292% 8/14/36 (d)(f) | | 868,000 | 724,477 |
| Class E, 3.7292% 8/14/36 (d)(f) | | 637,000 | 500,893 |
| Series 2019-C3 Class C, 4.178% 5/15/52 | | 477,000 | 423,145 |
| Series 2020-C6 Class E, 2.4% 2/15/53 (d) | | 628,000 | 414,337 |
| Series 2020-C7 Class D, 3.7171% 4/15/53 (d)(f) | | 393,000 | 286,034 |
| BCP Trust floater Series 2021-330N Class F, 1 month U.S. LIBOR + 4.630% 7.025% 6/15/38 (d)(f)(g) | | 1,066,000 | 953,759 |
| Benchmark Mortgage Trust: | | | |
| sequential payer: | | | |
| Series 2018-B4 Class A5, 4.121% 7/15/51 | | 2,953,000 | 2,903,694 |
| Series 2019-B14: | | | |
| Class 225D, 3.4041% 12/15/62 (d)(f) | | 719,000 | 611,768 |
| Class 225E, 3.4041% 12/15/62 (d)(f) | | 485,000 | 408,181 |
| Series 2020-B20 Class E, 2% 10/15/53 (d) | | 1,029,000 | 625,660 |
| Series 2018-B6 Class D, 3.2592% 10/10/51 (d)(f) | | 1,089,000 | 837,100 |
| Series 2018-B7: | | | |
| Class D, 3% 5/15/53 (d)(f) | | 614,000 | 470,040 |
| Class E, 3% 5/15/53 (d)(f) | | 614,000 | 438,988 |
| Series 2019-B13 Class D, 2.5% 8/15/57 (d) | | 1,197,000 | 854,499 |
| Series 2019-B14 Class XA, 0.9053% 12/15/62 (f)(o) | | 33,328,506 | 1,155,499 |
| Series 2020-B18: | | | |
| Class AGNG, 4.5348% 7/15/53 (d)(f) | | 1,995,000 | 1,622,141 |
| Class D, 2.25% 7/15/53 (d) | | 1,365,000 | 925,687 |
| Series 2020-B21: | | | |
| Class D, 2% 12/17/53 (d) | | 798,000 | 531,625 |
| Class E, 2% 12/17/53 (d) | | 737,000 | 444,273 |
| Series 2020-B22 Class E, 2% 1/15/54 (d) | | 894,000 | 544,350 |
| Series 2020-IG2: | | | |
| Class C, 3.4028% 9/15/48 (d)(f) | | 546,000 | 434,770 |
| Class D, 3.4028% 9/15/48 (d)(f) | | 2,679,000 | 1,539,585 |
| Series 2020-IG3 Class 825E, 3.0763% 9/15/48 (d)(f) | | 1,400,000 | 1,017,997 |
| Series 2021-B25: | | | |
| Class 300D, 3.094% 4/15/54 (d)(f) | | 1,520,000 | 1,118,802 |
| Class 300E, 2.9942% 4/15/54 (d)(f) | | 504,000 | 360,671 |
| Series 2022-B35: | | | |
| Class C, 4.4457% 5/15/55 (f) | | 1,281,000 | 1,113,478 |
| Class D, 2.5% 5/15/55 (d) | | 1,701,000 | 1,085,437 |
| Series 2022-B36 Class D, 2.5% 7/15/55 (d) | | 1,259,000 | 816,603 |
| BFLD Trust: | | | |
| floater Series 2020-EYP Class G, 1 month U.S. LIBOR + 4.850% 7.241% 10/15/35 (d)(f)(g) | | 993,000 | 908,938 |
| floater sequential payer Series 2020-OBRK Class A, 1 month U.S. LIBOR + 2.050% 4.441% 11/15/28 (d)(f)(g) | | 13,834,000 | 13,686,174 |
| BHP Trust floater Series 2019-BXHP Class F, 1 month U.S. LIBOR + 2.930% 5.329% 8/15/36 (d)(f)(g) | | 570,500 | 531,279 |
| BMO Mortgage Trust Series 2022-C1: | | | |
| Class 360D, 4.0699% 2/15/42 (d)(f) | | 798,000 | 585,668 |
| Class 360E, 4.0699% 2/15/42 (d)(f) | | 966,000 | 729,139 |
| BPR Trust floater Series 2022-OANA: | | | |
| Class A, CME Term SOFR 1 Month Index + 1.890% 4.2054% 4/15/37 (d)(f)(g) | | 53,633,000 | 52,828,414 |
| Class B, CME Term SOFR 1 Month Index + 2.440% 4.7544% 4/15/37 (d)(f)(g) | | 17,226,000 | 16,902,714 |
| Class D, CME Term SOFR 1 Month Index + 3.690% 6.0024% 4/15/37 (d)(f)(g) | | 2,373,000 | 2,305,961 |
| Braemar Hotels & Resorts Trust floater Series 2018-PRME Class E, 1 month U.S. LIBOR + 2.400% 4.791% 6/15/35 (d)(f)(g) | | 294,000 | 274,986 |
| Bx 2021-Xl2 floater Series 2021-XL2 Class J, 1 month U.S. LIBOR + 3.890% 6.281% 10/15/38 (d)(f)(g) | | 6,974,828 | 6,607,208 |
| BX Commercial Mortgage Trust: | | | |
| floater: | | | |
| Series 2021-CIP Class G, 1 month U.S. LIBOR + 3.960% 6.36% 12/15/38 (d)(f)(g) | | 8,125,000 | 7,537,831 |
| Series 2021-MC Class G, 1 month U.S. LIBOR + 3.080% 5.4778% 4/15/34 (d)(f)(g) | | 709,000 | 656,597 |
| Series 2021-PAC: | | | |
| Class A, 1 month U.S. LIBOR + 0.680% 3.0811% 10/15/36 (d)(f)(g) | | 32,338,000 | 31,156,538 |
| Class B, 1 month U.S. LIBOR + 0.890% 3.2908% 10/15/36 (d)(f)(g) | | 4,838,000 | 4,573,360 |
| Class C, 1 month U.S. LIBOR + 1.090% 3.4906% 10/15/36 (d)(f)(g) | | 6,475,000 | 6,093,022 |
| Class D, 1 month U.S. LIBOR + 1.290% 3.6903% 10/15/36 (d)(f)(g) | | 6,286,000 | 5,853,528 |
| Class E, 1 month U.S. LIBOR + 1.940% 4.3395% 10/15/36 (d)(f)(g) | | 21,856,000 | 20,551,356 |
| Class G, 1 month U.S. LIBOR + 2.940% 5.3381% 10/15/36 (d)(f)(g) | | 1,428,000 | 1,332,209 |
| Series 2021-VINO Class G, 1 month U.S. LIBOR + 3.950% 6.3433% 5/15/38 (d)(f)(g) | | 3,531,000 | 3,303,202 |
| Series 2022-LP2: | | | |
| Class A, CME Term SOFR 1 Month Index + 1.010% 3.3099% 2/15/39 (d)(f)(g) | | 39,809,895 | 38,486,431 |
| Class B, CME Term SOFR 1 Month Index + 1.310% 3.6093% 2/15/39 (d)(f)(g) | | 11,994,982 | 11,425,212 |
| Class C, CME Term SOFR 1 Month Index + 1.560% 3.8587% 2/15/39 (d)(f)(g) | | 11,994,982 | 11,320,858 |
| Class D, CME Term SOFR 1 Month Index + 1.960% 4.2578% 2/15/39 (d)(f)(g) | | 11,994,982 | 11,289,655 |
| floater sequential payer Series 2019-CALM Class A, 1 month U.S. LIBOR + 0.870% 3.267% 11/15/32 (d)(f)(g) | | 1,061,625 | 1,043,048 |
| Series 2020-VIVA: | | | |
| Class D, 3.667% 3/11/44 (d)(f) | | 5,234,000 | 4,158,698 |
| Class E, 3.667% 3/11/44 (d)(f) | | 5,065,000 | 3,901,127 |
| Bx Commercial Mortgage Trust 2 floater Series 2022-LP2 Class G, CME Term SOFR 1 Month Index + 4.100% 6.4028% 2/15/39 (d)(f)(g) | | 3,235,704 | 2,994,578 |
| BX Trust: | | | |
| floater: | | | |
| Series 2017-APPL Class F, 1 month U.S. LIBOR + 4.250% 6.766% 7/15/34 (d)(f)(g) | | 1,145,800 | 1,115,831 |
| Series 2018-EXCL Class D, 1 month U.S. LIBOR + 2.620% 5.017% 9/15/37 (d)(f)(g) | | 4,860,100 | 4,256,611 |
| Series 2019-ATL Class E, 1 month U.S. LIBOR + 2.230% 4.6276% 10/15/36 (d)(f)(g) | | 972,000 | 903,960 |
| Series 2019-IMC: | | | |
| Class B, 1 month U.S. LIBOR + 1.300% 3.691% 4/15/34 (d)(f)(g) | | 11,328,000 | 10,874,886 |
| Class C, 1 month U.S. LIBOR + 1.600% 3.991% 4/15/34 (d)(f)(g) | | 7,490,000 | 7,190,399 |
| Class D, 1 month U.S. LIBOR + 1.900% 4.291% 4/15/34 (d)(f)(g) | | 7,862,000 | 7,488,560 |
| Class G, 1 month U.S. LIBOR + 3.600% 5.991% 4/15/34 (d)(f)(g) | | 1,533,000 | 1,424,480 |
| Series 2019-XL: | | | |
| Class B, 1 month U.S. LIBOR + 1.080% 3.471% 10/15/36 (d)(f)(g) | | 9,759,700 | 9,588,913 |
| Class C, 1 month U.S. LIBOR + 1.250% 3.641% 10/15/36 (d)(f)(g) | | 12,268,900 | 12,023,523 |
| Class D, 1 month U.S. LIBOR + 1.450% 3.841% 10/15/36 (d)(f)(g) | | 21,584,900 | 21,099,220 |
| Class E, 1 month U.S. LIBOR + 1.800% 4.191% 10/15/36 (d)(f)(g) | | 24,417,950 | 23,746,471 |
| Class J, 1 month U.S. LIBOR + 2.650% 5.041% 10/15/36 (d)(f)(g) | | 7,225,000 | 6,910,120 |
| Series 2021-21M Class H, 1 month U.S. LIBOR + 4.010% 6.401% 10/15/36 (d)(f)(g) | | 1,008,000 | 922,712 |
| Series 2021-ACNT Class G, 1 month U.S. LIBOR + 3.290% 5.687% 11/15/38 (d)(f)(g) | | 1,197,000 | 1,106,146 |
| Series 2021-ARIA: | | | |
| Class F, 1 month U.S. LIBOR + 2.590% 4.9845% 10/15/36 (d)(f)(g) | | 2,468,000 | 2,264,489 |
| Class G, 1 month U.S. LIBOR + 3.140% 5.5331% 10/15/36 (d)(f)(g) | | 3,750,000 | 3,461,138 |
| Series 2021-BXMF Class G, 1 month U.S. LIBOR + 3.340% 5.7405% 10/15/26 (d)(f)(g) | | 3,318,000 | 2,998,934 |
| Series 2021-LBA: | | | |
| Class FJV, 1 month U.S. LIBOR + 2.400% 4.792% 2/15/36 (d)(f)(g) | | 589,000 | 534,519 |
| Class FV, 1 month U.S. LIBOR + 2.400% 4.792% 2/15/36 (d)(f)(g) | | 342,000 | 310,366 |
| Series 2021-MFM1: | | | |
| Class F, 1 month U.S. LIBOR + 3.000% 5.391% 1/15/34 (d)(f)(g) | | 3,772,000 | 3,558,823 |
| Class G, 1 month U.S. LIBOR + 3.900% 6.291% 1/15/34 (d)(f)(g) | | 204,000 | 191,732 |
| Series 2021-SDMF Class F, 1 month U.S. LIBOR + 1.930% 4.328% 9/15/34 (d)(f)(g) | | 798,000 | 746,129 |
| Series 2021-SOAR: | | | |
| Class F, 4.742% 6/15/38 (d)(f) | | 2,325,385 | 2,150,982 |
| Class G, 5.192% 6/15/38 (d)(f) | | 562,737 | 519,607 |
| Class J, 6.142% 6/15/38 (d)(f) | | 1,125,474 | 1,052,865 |
| Series 2021-VOLT: | | | |
| Class F, 1 month U.S. LIBOR + 2.400% 4.791% 9/15/36 (d)(f)(g) | | 405,000 | 383,532 |
| Class G, 1 month U.S. LIBOR + 2.850% 5.241% 9/15/36 (d)(f)(g) | | 2,573,000 | 2,421,373 |
| Series 2022-IND: | | | |
| Class A, CME Term SOFR 1 Month Index + 1.490% 3.7877% 4/15/37 (d)(f)(g) | | 28,860,000 | 28,361,643 |
| Class B, CME Term SOFR 1 Month Index + 1.940% 4.2367% 4/15/37 (d)(f)(g) | | 14,711,000 | 14,258,712 |
| Class C, CME Term SOFR 1 Month Index + 2.290% 4.5867% 4/15/37 (d)(f)(g) | | 3,320,000 | 3,219,919 |
| Class D, CME Term SOFR 1 Month Index + 2.830% 5.1357% 4/15/37 (d)(f)(g) | | 2,779,000 | 2,676,352 |
| Class F, CME Term SOFR 1 Month Index + 4.780% 7.0827% 4/15/37 (d)(f)(g) | | 4,166,000 | 4,035,405 |
| Series 2022-LBA6: | | | |
| Class F, CME Term SOFR 1 Month Index + 3.350% 5.6574% 1/15/39 (d)(f)(g) | | 2,072,000 | 1,960,679 |
| Class G, CME Term SOFR 1 Month Index + 4.200% 6.5074% 1/15/39 (d)(f)(g) | | 651,000 | 615,945 |
| Series 2022-VAMF Class F, CME Term SOFR 1 Month Index + 3.290% 5.6064% 1/15/39 (d)(f)(g) | | 160,000 | 149,753 |
| floater sequential payer Series 2021-LGCY Class J, 1 month U.S. LIBOR + 3.190% 5.584% 10/15/23 (d)(f)(g) | | 616,000 | 554,774 |
| floater, sequential payer: | | | |
| Series 2019-IMC Class A, 1 month U.S. LIBOR + 1.000% 3.391% 4/15/34 (d)(f)(g) | | 21,476,240 | 20,965,116 |
| Series 2019-XL Class A, 1 month U.S. LIBOR + 0.920% 3.311% 10/15/36 (d)(f)(g) | | 9,120,258 | 9,011,720 |
| Series 2019-OC11: | | | |
| Class D, 4.0755% 12/9/41 (d)(f) | | 168,000 | 146,224 |
| Class E, 4.0755% 12/9/41 (d)(f) | | 5,303,000 | 4,381,292 |
| BXP Trust Series 2021-601L Class E, 2.868% 1/15/44 (d)(f) | | 336,000 | 219,114 |
| BXSC Commercial Mortgage Trust floater Series 2022-WSS Class F, 7.637% 3/15/35 (d)(f) | | 2,721,000 | 2,571,338 |
| CALI Mortgage Trust Series 2019-101C Class F, 4.4686% 3/10/39 (d)(f) | | 1,743,000 | 1,367,804 |
| CAMB Commercial Mortgage Trust floater Series 2019-LIFE: | | | |
| Class E, 1 month U.S. LIBOR + 2.150% 4.541% 12/15/37 (d)(f)(g) | | 4,468,000 | 4,334,186 |
| Class F, 1 month U.S. LIBOR + 2.550% 4.941% 12/15/37 (d)(f)(g) | | 151,000 | 145,634 |
| Class G, 1 month U.S. LIBOR + 3.250% 5.641% 12/15/37 (d)(f)(g) | | 5,311,000 | 5,118,741 |
| CD Mortgage Trust Series 2017-CD3: | | | |
| Class C, 4.6989% 2/10/50 (f) | | 1,482,000 | 1,345,341 |
| Class D, 3.25% 2/10/50 (d) | | 1,340,000 | 942,978 |
| CEDR Commercial Mortgage Trust floater Series 2022-SNAI Class F, CME Term SOFR 1 Month Index + 3.610% 5.9209% 2/15/39 (d)(f)(g) | | 3,948,000 | 3,574,202 |
| CF Hippolyta Issuer LLC sequential payer Series 2021-1A Class A1, 1.53% 3/15/61 (d) | | 37,287,777 | 32,949,206 |
| CGDB Commercial Mortgage Trust floater Series 2019-MOB: | | | |
| Class A, 1 month U.S. LIBOR + 0.950% 3.341% 11/15/36 (d)(f)(g) | | 10,499,000 | 10,289,027 |
| Class B, 1 month U.S. LIBOR + 1.250% 3.641% 11/15/36 (d)(f)(g) | | 2,800,000 | 2,737,001 |
| CHC Commercial Mortgage Trust floater Series 2019-CHC: | | | |
| Class A, 1 month U.S. LIBOR + 1.120% 3.511% 6/15/34 (d)(f)(g) | | 28,452,154 | 27,958,845 |
| Class B, 1 month U.S. LIBOR + 1.500% 3.891% 6/15/34 (d)(f)(g) | | 5,600,708 | 5,433,807 |
| Class C, 1 month U.S. LIBOR + 1.750% 4.141% 6/15/34 (d)(f)(g) | | 6,328,215 | 6,080,100 |
| Class E, 1 month U.S. LIBOR + 2.350% 4.741% 6/15/34 (d)(f)(g) | | 2,938,809 | 2,769,874 |
| Class F, 1 month U.S. LIBOR + 2.600% 4.9992% 6/15/34 (d)(f)(g) | | 3,793,356 | 3,473,729 |
| CIM Retail Portfolio Trust floater Series 2021-RETL: | | | |
| Class C, 1 month U.S. LIBOR + 2.300% 4.692% 8/15/36 (d)(f)(g) | | 1,273,100 | 1,209,363 |
| Class D, 1 month U.S. LIBOR + 3.050% 5.442% 8/15/36 (d)(f)(g) | | 4,240,500 | 3,992,543 |
| Citigroup Commercial Mortgage Trust: | | | |
| Series 2013-375P Class E, 3.6348% 5/10/35 (d)(f) | | 1,306,000 | 1,199,291 |
| Series 2013-GC15 Class D, 5.3353% 9/10/46 (d)(f) | | 2,196,000 | 2,099,697 |
| Series 2015-GC29 Class XA, 1.157% 4/10/48 (f)(o) | | 32,490,472 | 688,402 |
| Series 2015-GC33 Class XA, 1.0285% 9/10/58 (f)(o) | | 52,560,015 | 1,128,290 |
| Series 2016-C3 Class D, 3% 11/15/49 (d) | | 1,507,000 | 1,078,309 |
| Series 2016-P6 Class XA, 0.703% 12/10/49 (f)(o) | | 37,733,892 | 731,592 |
| Series 2019-GC41: | | | |
| Class D, 3% 8/10/56 (d) | | 378,000 | 278,714 |
| Class E, 3% 8/10/56 (d) | | 834,000 | 569,798 |
| Series 2019-GC43 Class E, 3% 11/10/52 (d) | | 1,196,000 | 837,609 |
| Series 2020-420K Class E, 3.4222% 11/10/42 (d)(f) | | 1,029,000 | 784,496 |
| Series 2020-GC46: | | | |
| Class D, 2.6% 2/15/53 (d) | | 1,208,000 | 863,359 |
| Class E, 2.6% 2/15/53 (d) | | 136,000 | 90,067 |
| Series 2022-GC48: | | | |
| Class D, 2.5% 6/15/55 (d) | | 1,806,000 | 1,163,850 |
| Class E, 2.5% 6/15/55 (d) | | 1,491,000 | 876,651 |
| COMM Mortgage Trust: | | | |
| floater Series 2018-HCLV: | | | |
| Class F, 1 month U.S. LIBOR + 3.050% 5.441% 9/15/33 (d)(f)(g) | | 468,000 | 417,073 |
| Class G, 1 month U.S. LIBOR + 5.050% 7.4473% 9/15/33 (d)(f)(g) | | 544,000 | 464,649 |
| sequential payer: | | | |
| Series 2013-CR7 Class AM, 3.314% 3/10/46 (d) | | 5,924,751 | 5,852,989 |
| Series 2013-LC6 Class E, 3.5% 1/10/46 (d) | | 959,000 | 824,740 |
| Series 2014-CR18 Class A5, 3.828% 7/15/47 | | 5,007,100 | 4,931,982 |
| Series 2015-3BP Class A, 3.178% 2/10/35 (d) | | 7,500,000 | 7,121,500 |
| Series 2012-CR1: | | | |
| Class C, 5.4575% 5/15/45 (f) | | 769,000 | 708,249 |
| Class D, 5.4575% 5/15/45 (d)(f) | | 2,108,000 | 1,844,500 |
| Class G, 2.462% 5/15/45 (d) | | 774,000 | 199,280 |
| Series 2012-LC4 Class C, 5.4554% 12/10/44 (f) | | 166,000 | 149,911 |
| Series 2013-CR10 Class D, 5.0315% 8/10/46 (d)(f) | | 1,490,000 | 1,434,967 |
| Series 2013-CR9 Class C, 4.4347% 7/10/45 (d)(f) | | 334,462 | 320,132 |
| Series 2013-LC6 Class D, 4.4323% 1/10/46 (d)(f) | | 1,664,000 | 1,618,211 |
| Series 2014-CR15 Class D, 4.8203% 2/10/47 (d)(f) | | 298,000 | 287,259 |
| Series 2014-CR17 Class E, 5.0069% 5/10/47 (d)(f) | | 255,000 | 192,162 |
| Series 2014-CR20 Class XA, 1.1301% 11/10/47 (f)(o) | | 59,853,589 | 919,495 |
| Series 2014-LC17 Class XA, 0.8174% 10/10/47 (f)(o) | | 37,462,141 | 411,334 |
| Series 2014-UBS2 Class D, 5.1458% 3/10/47 (d)(f) | | 994,000 | 931,639 |
| Series 2014-UBS6 Class XA, 0.9997% 12/10/47 (f)(o) | | 74,966,232 | 1,118,181 |
| Series 2015-3BP Class F, 3.3463% 2/10/35 (d)(f) | | 1,538,000 | 1,384,904 |
| Series 2015-LC19 Class D, 2.867% 2/10/48 (d) | | 2,184,000 | 1,904,743 |
| Series 2017-CD4 Class D, 3.3% 5/10/50 (d) | | 1,751,000 | 1,393,005 |
| Series 2019-CD4 Class C, 4.3497% 5/10/50 (f) | | 1,316,000 | 1,160,095 |
| COMM Trust Series 2017-COR2 Class D, 3% 9/10/50 (d) | | 368,000 | 284,889 |
| Commercial Mortgage Trust Series 2016-CD2: | | | |
| Class C, 4.1139% 11/10/49 (f) | | 619,000 | 530,394 |
| Class D, 2.8639% 11/10/49 (f) | | 546,000 | 317,663 |
| Commercial Mortgage Trust pass-thru certificates: | | | |
| Series 2012-CR2: | | | |
| Class D, 5.0672% 8/15/45 (d)(f) | | 105,000 | 103,255 |
| Class E, 5.0672% 8/15/45 (d)(f) | | 1,835,100 | 1,638,744 |
| Class F, 4.25% 8/15/45 (d) | | 2,033,000 | 1,621,724 |
| Series 2014-CR2 Class G, 4.25% 8/15/45 (c)(d) | | 522,000 | 288,457 |
| Core Industrial Trust floater Series 2019-CORE Class E, 1 month U.S. LIBOR + 1.900% 4.291% 12/15/31 (d)(f)(g) | | 1,175,200 | 1,101,599 |
| CPT Mortgage Trust sequential payer Series 2019-CPT Class F, 3.0967% 11/13/39 (d)(f) | | 1,196,000 | 886,723 |
| Credit Suisse Commercial Mortgage Trust floater Series 2021-SOP2 Class F, 1 month U.S. LIBOR + 4.210% 6.6079% 6/15/34 (d)(g) | | 1,135,200 | 1,061,056 |
| Credit Suisse First Boston Mortgage Securities Corp. Series 1998-C1 Class H, 6% 5/17/40 (d) | | 9,807 | 9,811 |
| Credit Suisse Mortgage Trust: | | | |
| floater: | | | |
| Series 2019-ICE4: | | | |
| Class B, 1 month U.S. LIBOR + 1.230% 3.621% 5/15/36 (d)(f)(g) | | 15,845,000 | 15,572,476 |
| Class C, 1 month U.S. LIBOR + 1.430% 3.821% 5/15/36 (d)(f)(g) | | 3,089,000 | 3,030,926 |
| Class F, 1 month U.S. LIBOR + 2.650% 5.041% 5/15/36 (d)(f)(g) | | 693,000 | 668,745 |
| Series 2020-FACT Class F, 1 month U.S. LIBOR + 6.150% 8.548% 10/15/37 (d)(f)(g) | | 1,029,000 | 969,648 |
| Series 2021-4SZN Class A, CME Term SOFR 1 Month Index + 3.960% 6.2745% 11/15/23 (d)(f)(g) | | 4,746,000 | 4,599,775 |
| sequential payer Series 2020-NET Class A, 2.2569% 8/15/37 (d) | | 7,443,053 | 6,921,720 |
| Series 2018-SITE: | | | |
| Class A, 4.284% 4/15/36 (d) | | 11,930,000 | 11,511,744 |
| Class B, 4.5349% 4/15/36 (d) | | 3,730,000 | 3,568,521 |
| Class C, 4.9414% 4/15/36 (d)(f) | | 2,462,000 | 2,343,786 |
| Class D, 4.9414% 4/15/36 (d)(f) | | 4,923,000 | 4,593,232 |
| Series 2019-UVIL Class E, 3.3928% 12/15/41 (d)(f) | | 952,000 | 693,903 |
| Series 2021-BRIT Class A, CME Term SOFR 1 Month Index + 3.570% 5.8807% 5/15/23 (d)(f)(g) | | 1,656,480 | 1,577,209 |
| CRSNT Trust floater Series 2021-MOON: | | | |
| Class F, 1 month U.S. LIBOR + 3.500% 5.9% 4/15/36 (d)(f)(g) | | 399,000 | 377,254 |
| Class G, 1 month U.S. LIBOR + 4.500% 6.9% 4/15/36 (d)(f)(g) | | 231,000 | 218,631 |
| CSAIL Commercial Mortgage Trust: | | | |
| Series 2017-C8 Class D, 4.5882% 6/15/50 (d)(f) | | 1,278,000 | 984,055 |
| Series 2017-CX9 Class D, 4.1476% 9/15/50 (d)(f) | | 518,000 | 398,472 |
| Series 2018-CX11 Class C, 5.0053% 4/15/51 (f) | | 495,000 | 453,779 |
| Series 2019-C16 Class C, 4.2371% 6/15/52 (f) | | 1,113,000 | 975,868 |
| CSMC Trust floater Series 2017-CHOP Class F, 1 month U.S. LIBOR + 4.350% 6.741% 7/15/32 (d)(f)(g) | | 1,319,000 | 1,239,117 |
| DBCCRE Mortgage Trust Series 2014-ARCP: | | | |
| Class D, 5.099% 1/10/34 (d)(f) | | 458,000 | 433,722 |
| Class E, 5.099% 1/10/34 (d)(f) | | 1,487,000 | 1,374,477 |
| DBGS Mortgage Trust: | | | |
| floater Series 2018-BIOD Class G, 1 month U.S. LIBOR + 2.500% 4.869% 5/15/35 (d)(f)(g) | | 1,151,341 | 1,106,828 |
| Series 2018-C1: | | | |
| Class C, 4.7812% 10/15/51 (f) | | 355,000 | 322,923 |
| Class D, 3.0312% 10/15/51 (d)(f) | | 1,512,000 | 1,150,805 |
| Series 2019-1735 Class F, 4.3344% 4/10/37 (d)(f) | | 1,188,000 | 869,322 |
| DBJPM Mortgage Trust Series 2020-C9 Class D, 2.25% 9/15/53 (d) | | 377,000 | 256,719 |
| DBUBS Mortgage Trust Series 2011-LC3A Class D, 5.5389% 8/10/44 (d)(f) | | 728,113 | 683,553 |
| DC Office Trust Series 2019-MTC Class E, 3.1744% 9/15/45 (d)(f) | | 449,000 | 337,979 |
| Deutsche Bank Commercial Mortgage Trust Series 2016-C3 Class C, 3.6239% 8/10/49(f) | | 382,000 | 337,812 |
| ELP Commercial Mortgage Trust floater Series 2021-ELP: | | | |
| Class A, 1 month U.S. LIBOR + 0.700% 3.093% 11/15/38 (d)(f)(g) | | 44,186,000 | 42,615,859 |
| Class F, 1 month U.S. LIBOR + 2.660% 5.059% 11/15/38 (d)(f)(g) | | 2,343,000 | 2,212,495 |
| Class G, 1 month U.S. LIBOR + 3.110% 5.508% 11/15/38 (d)(f)(g) | | 150,000 | 140,926 |
| Class J, 1 month U.S. LIBOR + 3.610% 6.0069% 11/15/38 (d)(f)(g) | | 2,107,000 | 1,976,001 |
| Extended Stay America Trust floater Series 2021-ESH: | | | |
| Class A, 1 month U.S. LIBOR + 1.080% 3.472% 7/15/38 (d)(f)(g) | | 17,040,126 | 16,695,222 |
| Class B, 1 month U.S. LIBOR + 1.380% 3.772% 7/15/38 (d)(f)(g) | | 20,230,491 | 19,674,177 |
| Class C, 1 month U.S. LIBOR + 1.700% 4.092% 7/15/38 (d)(f)(g) | | 6,070,638 | 5,888,515 |
| Class D, 1 month U.S. LIBOR + 2.250% 4.642% 7/15/38 (d)(f)(g) | | 12,264,518 | 11,873,263 |
| Class F, 1 month U.S. LIBOR + 3.700% 6.092% 7/15/38 (d)(f)(g) | | 3,382,184 | 3,263,334 |
| Freddie Mac: | | | |
| sequential payer: | | | |
| Series 2022-K144 Class A2, 2.45% 4/25/32 | | 10,200,000 | 9,110,780 |
| Series 2022-K145 Class A2, 2.58% 6/25/55 | | 4,900,000 | 4,425,115 |
| Series 2022-K146 Class A2, 2.92% 6/25/32 | | 8,800,000 | 8,185,758 |
| Series 2022-K147 Class A2, 3% 6/25/32 | | 950,000 | 889,732 |
| Series 2022-K150 Class A2, 3.71% 11/25/32 | | 7,200,000 | 7,125,723 |
| GS Mortgage Securities Corp. II Series 2010-C1: | | | |
| Class B, 5.148% 8/10/43 (d) | | 104,829 | 103,718 |
| Class X, 0.5804% 8/10/43 (d)(f)(o) | | 401,092 | 1,428 |
| GS Mortgage Securities Corp. Trust floater: | | | |
| Series 2019-70P Class F, 1 month U.S. LIBOR + 2.650% 5.041% 10/15/36 (d)(f)(g) | | 3,075,000 | 2,801,466 |
| Series 2022-SHIP Class D, CME Term SOFR 1 Month Index + 1.600% 3.9143% 8/15/24 (d)(f)(g) | | 1,680,000 | 1,627,212 |
| GS Mortgage Securities Trust: | | | |
| floater: | | | |
| Series 2018-3PCK Class A, 1 month U.S. LIBOR + 1.700% 4.091% 9/15/31 (d)(f)(g) | | 21,606,248 | 21,699,209 |
| Series 2018-HART Class A, 1 month U.S. LIBOR + 1.090% 3.49% 10/15/31 (d)(f)(g) | | 10,027,000 | 9,930,925 |
| Series 2021-IP: | | | |
| Class A, 1 month U.S. LIBOR + 0.950% 3.341% 10/15/36 (d)(f)(g) | | 18,953,000 | 18,037,909 |
| Class B, 1 month U.S. LIBOR + 1.150% 3.541% 10/15/36 (d)(f)(g) | | 2,930,000 | 2,760,522 |
| Class C, 1 month U.S. LIBOR + 1.550% 3.941% 10/15/36 (d)(f)(g) | | 2,414,000 | 2,271,035 |
| Series 2011-GC5: | | | |
| Class C, 5.3022% 8/10/44 (d)(f) | | 908,923 | 754,406 |
| Class D, 5.3022% 8/10/44 (d)(f) | | 623,936 | 265,797 |
| Class E, 5.3022% 8/10/44 (c)(d)(f) | | 773,957 | 68,108 |
| Class F, 4.5% 8/10/44 (c)(d) | | 1,339,218 | 4,698 |
| Series 2012-GC6I Class F, 5% 1/10/45 (f) | | 359,181 | 299,178 |
| Series 2012-GCJ7 Class F, 5% 5/10/45 (d) | | 375,377 | 69,684 |
| Series 2012-GCJ9: | | | |
| Class D, 4.7797% 11/10/45 (d)(f) | | 1,910,000 | 1,864,781 |
| Class E, 4.7797% 11/10/45 (d)(f) | | 896,000 | 744,598 |
| Series 2013-GC10 Class D, 4.5431% 2/10/46 (d)(f) | | 586,000 | 526,363 |
| Series 2013-GC12 Class D, 4.5895% 6/10/46 (d)(f) | | 254,518 | 244,570 |
| Series 2013-GC16: | | | |
| Class C, 5.4881% 11/10/46 (f) | | 421,844 | 414,238 |
| Class D, 5.4881% 11/10/46 (d)(f) | | 1,161,000 | 1,121,606 |
| Class F, 3.5% 11/10/46 (c)(d) | | 970,000 | 751,560 |
| Series 2014-GC20 Class XA, 1.1797% 4/10/47 (f)(o) | | 62,904,318 | 732,559 |
| Series 2015-GC34 Class XA, 1.3729% 10/10/48 (f)(o) | | 16,422,646 | 488,672 |
| Series 2016-GS2 Class D, 2.753% 5/10/49 (d) | | 703,000 | 565,980 |
| Series 2016-GS4 Class C, 4.0796% 11/10/49 (f) | | 464,000 | 411,052 |
| Series 2017-GS6 Class D, 3.243% 5/10/50 (d) | | 1,720,000 | 1,325,049 |
| Series 2018-GS9 Class D, 3% 3/10/51 (d) | | 835,000 | 628,625 |
| Series 2019-GC38 Class D, 3% 2/10/52 (d) | | 446,000 | 340,723 |
| Series 2019-GC39 Class D, 3% 5/10/52 (d) | | 1,176,000 | 875,263 |
| Series 2019-GC40: | | | |
| Class D, 3% 7/10/52 (d) | | 924,000 | 697,566 |
| Class DBF, 3.668% 7/10/52 (d)(f) | | 1,107,500 | 1,088,785 |
| Series 2019-GC42: | | | |
| Class D, 2.8% 9/1/52 (d) | | 408,000 | 298,223 |
| Class E, 2.8% 9/1/52 (d) | | 1,092,000 | 758,570 |
| Series 2019-GS5 Class C, 4.299% 3/10/50 (f) | | 1,155,000 | 1,049,338 |
| Series 2019-GSA1 Class E, 2.8% 11/10/52 (d) | | 693,000 | 479,671 |
| Series 2020-GC45: | | | |
| Class D, 2.85% 2/13/53 (d) | | 952,000 | 685,304 |
| Class SWD, 3.3258% 12/13/39 (d)(f) | | 735,000 | 523,112 |
| Series 2020-GC47 Class D, 3.5698% 5/12/53 (d)(f) | | 336,000 | 256,124 |
| Series 2021-RENT Class G, 1 month U.S. LIBOR + 5.700% 8.0681% 11/21/35 (d)(f)(g) | | 3,076,128 | 2,839,753 |
| Hilton U.S.A. Trust: | | | |
| Series 2016-HHV: | | | |
| Class E, 4.3333% 11/5/38 (d)(f) | | 3,339,000 | 2,923,365 |
| Class F, 4.3333% 11/5/38 (d)(f) | | 2,022,000 | 1,713,033 |
| Series 2016-SFP: | | | |
| Class D, 4.9269% 11/5/35 (d) | | 714,000 | 688,912 |
| Class F, 6.1552% 11/5/35 (d) | | 1,531,000 | 1,464,580 |
| Home Partners of America Trust Series 2019-1: | | | |
| Class E, 3.604% 9/17/39 (d) | | 579,593 | 516,276 |
| Class F, 4.101% 9/17/39 (d) | | 94,296 | 84,231 |
| Hudson Yards Mortgage Trust: | | | |
| Series 2019-30HY Class E, 3.5579% 7/10/39 (d)(f) | | 861,000 | 709,740 |
| Series 2019-55HY Class F, 3.0409% 12/10/41 (d)(f) | | 693,000 | 523,319 |
| Independence Plaza Trust Series 2018-INDP Class E, 4.996% 7/10/35 (d) | | 1,064,000 | 965,407 |
| Intown Mortgage Trust: | | | |
| floater Series 2022-STAY Class E, CME Term SOFR 1 Month Index + 5.030% 7.2814% 8/15/37 (d)(f)(g) | | 1,087,000 | 1,078,193 |
| floater sequential payer Series 2022-STAY Class A, CME Term SOFR 1 Month Index + 2.480% 4.7386% 8/15/37 (d)(f)(g) | | 24,860,000 | 24,720,782 |
| JPMBB Commercial Mortgage Securities Trust: | | | |
| Series 2014-C19 Class XA, 0.7866% 4/15/47 (f)(o) | | 6,062,975 | 51,802 |
| Series 2014-C23 Class UH5, 4.7094% 9/15/47 (d) | | 194,000 | 146,701 |
| Series 2014-C26 Class D, 4.0201% 1/15/48 (d)(f) | | 3,811,000 | 3,377,649 |
| Series 2015-C30 Class XA, 0.5787% 7/15/48 (f)(o) | | 39,204,448 | 417,241 |
| Series 2015-C32 Class C, 4.8055% 11/15/48 (f) | | 1,942,000 | 1,505,443 |
| JPMCC Commercial Mortgage Securities Trust Series 2016-JP4 Class D, 3.5212% 12/15/49 (d)(f) | | 1,251,000 | 977,004 |
| JPMDB Commercial Mortgage Securities Trust: | | | |
| Series 2016-C4: | | | |
| Class C, 3.1963% 12/15/49 (f) | | 603,000 | 524,101 |
| Class D, 3.1963% 12/15/49 (d)(f) | | 1,242,000 | 942,901 |
| Series 2017-C7 Class D, 3% 10/15/50 (d) | | 2,471,000 | 1,890,408 |
| Series 2018-C8 Class D, 3.3742% 6/15/51 (d)(f) | | 406,000 | 292,946 |
| Series 2019-COR6: | | | |
| Class D, 2.5% 11/13/52 (d) | | 567,000 | 406,110 |
| Class E, 2.5% 11/13/52 (d) | | 1,092,000 | 728,869 |
| Series 2020-COR7 Class D, 1.75% 5/13/53 (d) | | 714,000 | 470,629 |
| JPMorgan Chase Commercial Mortgage Securities Trust: | | | |
| floater Series 2019-MFP: | | | |
| Class E, 1 month U.S. LIBOR + 2.160% 4.551% 7/15/36 (d)(f)(g) | | 1,029,000 | 971,197 |
| Class F, 1 month U.S. LIBOR + 3.000% 5.391% 7/15/36 (d)(f)(g) | | 336,000 | 310,631 |
| Series 2011-C3: | | | |
| Class E, 5.7086% 2/15/46 (d)(f) | | 1,156,000 | 409,695 |
| Class G, 4.409% 2/15/46 (d)(f) | | 368,000 | 28,416 |
| Class H, 4.409% 2/15/46 (c)(d)(f) | | 828,000 | 35,657 |
| Class J, 4.409% 2/15/46 (c)(d)(f) | | 106,000 | 205 |
| Series 2011-C4: | | | |
| Class D, 5.7417% 7/15/46 (d)(f) | | 2,033,000 | 1,981,341 |
| Class E, 5.7417% 7/15/46 (d)(f) | | 1,464,000 | 1,411,203 |
| Class F, 3.873% 7/15/46 (d) | | 166,000 | 156,153 |
| Class H, 3.873% 7/15/46 (d) | | 784,250 | 735,655 |
| Class NR, 3.873% 7/15/46 (d) | | 420,000 | 391,571 |
| Series 2012-CBX: | | | |
| Class E, 4.8545% 6/15/45 (d)(f) | | 1,001,757 | 925,523 |
| Class F, 4% 6/15/45 (c)(d) | | 1,124,000 | 224,758 |
| Class G 4% 6/15/45 (c)(d) | | 1,233,000 | 92,562 |
| Series 2013-LC11: | | | |
| Class C, 3.9582% 4/15/46 (f) | | 1,025,000 | 961,391 |
| Class D, 4.3028% 4/15/46 (f) | | 1,638,000 | 1,285,317 |
| Class F, 3.25% 4/15/46 (d)(f) | | 1,851,000 | 589,358 |
| Series 2014-DSTY: | | | |
| Class D, 3.9314% 6/10/27 (d)(f) | | 945,000 | 2,363 |
| Class E, 3.9314% 6/10/27 (c)(d)(f) | | 1,519,000 | 3,798 |
| Series 2018-AON Class F, 4.767% 7/5/31 (d)(f) | | 743,000 | 601,909 |
| Series 2018-WPT: | | | |
| Class AFX, 4.2475% 7/5/33 (d) | | 8,593,000 | 8,484,042 |
| Class CFX, 4.9498% 7/5/33 (d) | | 2,322,000 | 2,281,018 |
| Class DFX, 5.3503% 7/5/33 (d) | | 4,241,000 | 4,160,804 |
| Class EFX, 5.5422% 7/5/33 (d) | | 4,886,000 | 4,733,605 |
| Class XAFX, 1.2948% 7/5/33 (d)(f)(o) | | 35,039,000 | 232,883 |
| Series 2019-OSB Class E, 3.9089% 6/5/39 (d)(f) | | 1,071,000 | 906,414 |
| Series 2020-NNN: | | | |
| Class EFX, 3.972% 1/16/37 (d) | | 723,000 | 659,273 |
| Class FFX, 4.6254% 1/16/37 (d) | | 1,145,000 | 1,028,342 |
| Class GFX, 4.8445% 1/16/37 (d)(f) | | 441,000 | 392,475 |
| KNDL Mortgage Trust floater Series 2019-KNSQ Class F, 1 month U.S. LIBOR + 2.000% 4.391% 5/15/36 (d)(f)(g) | | 1,638,000 | 1,578,096 |
| KNDR Trust floater Series 2021-KIND Class F, 1 month U.S. LIBOR + 3.950% 6.341% 8/15/38 (d)(f)(g) | | 1,981,070 | 1,859,626 |
| La Quita Mortgage Trust floater Series 2022-LAQ Class F, CME Term SOFR 1 Month Index + 5.970% 8.2676% 3/15/39 (d)(f)(g) | | 1,086,160 | 1,061,761 |
| Liberty Street Trust Series 2016-225L: | | | |
| Class D, 4.8035% 2/10/36 (d)(f) | | 375,000 | 342,356 |
| Class E, 4.8035% 2/10/36 (d)(f) | | 942,000 | 835,448 |
| Life Financial Services Trust floater Series 2022-BMR2: | | | |
| Class A1, CME Term SOFR 1 Month Index + 1.290% 3.6027% 5/15/39 (d)(f)(g) | | 41,422,000 | 40,643,213 |
| Class B, CME Term SOFR 1 Month Index + 1.790% 4.1013% 5/15/39 (d)(f)(g) | | 24,765,000 | 24,231,064 |
| Class C, CME Term SOFR 1 Month Index + 2.090% 4.4005% 5/15/39 (d)(f)(g) | | 13,877,000 | 13,460,646 |
| Class D, CME Term SOFR 1 Month Index + 2.540% 4.8493% 5/15/39 (d)(f)(g) | | 12,332,000 | 11,869,539 |
| Class E, CME Term SOFR 1 Month Index + 3.240% 5.5474% 5/15/39 (d)(f)(g) | | 2,310,000 | 2,224,259 |
| LIFE Mortgage Trust floater Series 2021-BMR: | | | |
| Class A, 1 month U.S. LIBOR + 0.700% 3.091% 3/15/38 (d)(f)(g) | | 27,348,195 | 26,474,437 |
| Class B, 1 month U.S. LIBOR + 0.880% 3.271% 3/15/38 (d)(f)(g) | | 6,599,662 | 6,356,128 |
| Class C, 1 month U.S. LIBOR + 1.100% 3.491% 3/15/38 (d)(f)(g) | | 4,152,066 | 3,996,366 |
| Class D, 1 month U.S. LIBOR + 1.400% 3.791% 3/15/38 (d)(f)(g) | | 5,774,950 | 5,529,898 |
| Class E, 1 month U.S. LIBOR + 1.750% 4.141% 3/15/38 (d)(f)(g) | | 5,045,586 | 4,781,103 |
| Class F, 1 month U.S. LIBOR + 2.350% 4.741% 3/15/38 (d)(f)(g) | | 2,510,506 | 2,380,410 |
| Class G, 1 month U.S. LIBOR + 2.950% 5.341% 3/15/38 (d)(f)(g) | | 6,564,275 | 6,064,081 |
| Market Mortgage Trust Series 2020-525M Class F, 3.0386% 2/12/40 (d)(f) | | 819,000 | 549,511 |
| MED Trust floater Series 2021-MDLN: | | | |
| Class F, 1 month U.S. LIBOR + 4.000% 6.392% 11/15/38 (d)(f)(g) | | 1,921,000 | 1,796,134 |
| Class G, 1 month U.S. LIBOR + 5.250% 7.642% 11/15/38 (d)(f)(g) | | 5,822,000 | 5,536,989 |
| Merit floater Series 2021-STOR: | | | |
| Class G, 1 month U.S. LIBOR + 2.750% 5.141% 7/15/38 (d)(f)(g) | | 315,000 | 291,375 |
| Class J, 1 month U.S. LIBOR + 3.950% 6.341% 7/15/38 (d)(f)(g) | | 307,000 | 289,305 |
| MFT Trust Series 2020-B6 Class C, 3.3922% 8/10/40 (d)(f) | | 707,000 | 544,510 |
| MHC Commercial Mortgage Trust floater Series 2021-MHC: | | | |
| Class F, 1 month U.S. LIBOR + 2.600% 4.992% 4/15/38 (d)(f)(g) | | 168,000 | 159,667 |
| Class G, 1 month U.S. LIBOR + 3.200% 5.592% 4/15/38 (d)(f)(g) | | 4,491,000 | 4,267,307 |
| MHC Trust floater Series 2021-MHC2 Class F, 1 month U.S. LIBOR + 2.400% 4.791% 5/15/38 (d)(f)(g) | | 1,817,000 | 1,689,809 |
| MHP Commercial Mortgage Trust floater Series 2022-MHIL: | | | |
| Class F, CME Term SOFR 1 Month Index + 3.250% 5.5666% 1/15/27 (d)(f)(g) | | 380,000 | 354,349 |
| Class G, CME Term SOFR 1 Month Index + 3.950% 6.2649% 1/15/27 (d)(f)(g) | | 1,134,000 | 1,056,655 |
| MOFT Trust Series 2020-ABC: | | | |
| Class D, 3.5926% 2/10/42 (d)(f) | | 475,000 | 369,238 |
| Class E, 3.5926% 2/10/42 (d)(f) | | 349,000 | 251,259 |
| Morgan Stanley BAML Trust: | | | |
| sequential payer Series 2014-C18 Class 300E, 4.6896% 8/15/31 | | 698,000 | 605,348 |
| Series 2012-C5 Class E, 4.807% 8/15/45 (d)(f) | | 288,000 | 285,880 |
| Series 2012-C6 Class D, 4.7609% 11/15/45 (d)(f) | | 1,469,000 | 1,455,176 |
| Series 2012-C6, Class F, 4.7609% 11/15/45 (c)(d)(f) | | 693,000 | 646,928 |
| Series 2013-C12 Class D, 4.9208% 10/15/46 (d)(f) | | 1,299,000 | 1,187,905 |
| Series 2013-C13: | | | |
| Class D, 5.0591% 11/15/46 (d)(f) | | 1,747,000 | 1,604,605 |
| Class E, 5.0591% 11/15/46 (d)(f) | | 785,081 | 669,043 |
| Series 2013-C7 Class C, 4.2266% 2/15/46 (f) | | 308,000 | 294,990 |
| Series 2013-C8 Class D, 4.2868% 12/15/48 (d)(f) | | 504,000 | 493,080 |
| Series 2013-C9: | | | |
| Class C, 4.1536% 5/15/46 (f) | | 920,000 | 892,632 |
| Class D, 4.2416% 5/15/46 (d)(f) | | 1,700,000 | 1,584,047 |
| Class E, 4.2416% 5/15/46 (d)(f) | | 722,000 | 644,551 |
| Series 2014-C17 Class XA, 1.1856% 8/15/47 (f)(o) | | 58,064,881 | 734,799 |
| Series 2015-C25 Class XA, 1.1955% 10/15/48 (f)(o) | | 25,892,535 | 590,438 |
| Series 2016-C30: | | | |
| Class C, 4.2336% 9/15/49 (f) | | 266,000 | 233,865 |
| Class D, 3% 9/15/49 (d) | | 252,000 | 170,415 |
| Series 2016-C31 Class C, 4.4088% 11/15/49 (f) | | 603,000 | 522,054 |
| Series 2016-C32 Class C, 4.4179% 12/15/49 (f) | | 415,000 | 365,753 |
| Series 2017-C33 Class D, 3.356% 5/15/50 (d) | | 947,000 | 752,260 |
| Morgan Stanley Capital I Trust: | | | |
| sequential payer Series 2019-MEAD Class A, 3.17% 11/10/36 (d) | | 30,766,000 | 28,817,758 |
| Series 1998-CF1 Class G, 7.35% 7/15/32 (d)(f) | | 3,945 | 3,908 |
| Series 2011-C2: | | | |
| Class D, 5.385% 6/15/44 (d)(f) | | 1,208,218 | 1,146,205 |
| Class F, 5.385% 6/15/44 (c)(d)(f) | | 748,000 | 486,200 |
| Class XB, 0.4843% 6/15/44 (d)(f)(o) | | 2,628,958 | 10,311 |
| Series 2011-C3: | | | |
| Class C, 5.2534% 7/15/49 (d)(f) | | 159,521 | 157,996 |
| Class D, 5.2534% 7/15/49 (d)(f) | | 2,163,000 | 2,083,052 |
| Class E, 5.2534% 7/15/49 (c)(d)(f) | | 1,210,000 | 1,084,856 |
| Class F, 5.2534% 7/15/49 (c)(d)(f) | | 332,000 | 231,569 |
| Class G, 5.2534% 7/15/49 (c)(d)(f) | | 1,123,200 | 593,187 |
| Series 2012-C4 Class D, 5.3359% 3/15/45 (d)(f) | | 245,121 | 234,397 |
| Series 2014-150E: | | | |
| Class C, 4.4382% 9/9/32 (d)(f) | | 418,000 | 392,425 |
| Class F, 4.4382% 9/9/32 (d)(f) | | 734,000 | 651,925 |
| Series 2015-MS1: | | | |
| Class C, 4.1581% 5/15/48 (f) | | 468,000 | 429,566 |
| Class D, 4.1581% 5/15/48 (d)(f) | | 1,371,000 | 1,158,785 |
| Series 2015-UBS8 Class D, 3.18% 12/15/48 (d) | | 543,000 | 396,508 |
| Series 2016-BNK2: | | | |
| Class C, 3% 11/15/49 (d) | | 1,456,000 | 1,132,636 |
| Class D, 4.0193% 11/15/49 (f) | | 603,000 | 531,107 |
| Series 2017-CLS Class F, 1 month U.S. LIBOR + 2.600% 4.991% 11/15/34 (d)(f)(g) | | 822,000 | 806,206 |
| Series 2017-H1: | | | |
| Class C, 4.281% 6/15/50 | | 1,129,000 | 1,038,734 |
| Class D, 2.546% 6/15/50 (d) | | 1,621,000 | 1,234,242 |
| Series 2018-H4 Class A4, 4.31% 12/15/51 | | 7,706,000 | 7,561,039 |
| Series 2018-MP Class E, 4.4185% 7/11/40 (d)(f) | | 1,318,000 | 1,021,225 |
| Series 2019-MEAD: | | | |
| Class B, 3.283% 11/10/36 (d)(f) | | 4,445,000 | 4,095,613 |
| Class C, 3.283% 11/10/36 (d)(f) | | 4,265,000 | 3,848,794 |
| Series 2020-CNP Class D, 2.5085% 4/5/42 (d)(f) | | 462,000 | 330,087 |
| Series 2020-HR8 Class D, 2.5% 7/15/53 (d) | | 756,000 | 525,986 |
| Series 2020-L4, Class C, 3.536% 2/15/53 | | 205,000 | 171,660 |
| Series 2021-L6 Class XA, 1.3474% 6/15/54 (f)(o) | | 26,922,616 | 1,836,233 |
| Motel 6 Trust floater Series 2021-MTL6 Class H, 1 month U.S. LIBOR + 6.000% 8.391% 9/15/38 (d)(f)(g) | | 518,760 | 512,056 |
| MRCD Mortgage Trust Series 2019-PARK: | | | |
| Class G, 2.7175% 12/15/36 (d) | | 4,861,000 | 4,182,096 |
| Class J, 4.25% 12/15/36 (d) | | 2,552,000 | 2,225,619 |
| MSCCG Trust floater sequential payer Series 2018-SELF Class F, 1 month U.S. LIBOR + 3.050% 5.441% 10/15/37 (d)(f)(g) | | 671,000 | 632,015 |
| MSJP Commercial Securities Mortgage Trust Series 2015-HAUL Class E, 5.0127% 9/5/47 (d)(f) | | 311,000 | 227,658 |
| MTN Commercial Mortgage Trust floater Series 2022-LPFL Class F, CME Term SOFR 1 Month Index + 5.280% 7.5926% 3/15/39 (d)(f)(g) | | 3,549,000 | 3,387,021 |
| Natixis Commercial Mortgage Securities Trust: | | | |
| floater Series 2018-FL1 Class WAN2, 1 month U.S. LIBOR + 3.750% 6.141% 6/15/35 (d)(f)(g) | | 128,000 | 99,731 |
| Series 2018-285M Class F, 3.9167% 11/15/32 (d)(f) | | 307,000 | 285,503 |
| Series 2018-TECH Class F, 1 month U.S. LIBOR + 3.000% 5.392% 11/15/34 (d)(f)(g) | | 245,000 | 233,054 |
| Series 2019-10K: | | | |
| Class E, 4.2724% 5/15/39 (d)(f) | | 399,000 | 306,489 |
| Class F, 4.2724% 5/15/39 (d)(f) | | 1,374,000 | 994,096 |
| Series 2020-2PAC: | | | |
| Class AMZ2, 3.6167% 1/15/37 (d)(f) | | 735,000 | 668,237 |
| Class AMZ3, 3.6167% 1/15/37 (d)(f) | | 336,000 | 303,146 |
| Class MSK3, 3.3583% 12/15/36 (d)(f) | | 1,630,000 | 1,433,721 |
| NYT Mortgage Trust floater Series 2019-NYT Class F, 1 month U.S. LIBOR + 3.000% 5.391% 12/15/35 (d)(f)(g) | | 1,385,000 | 1,251,710 |
| OPG Trust floater Series 2021-PORT Class J, 1 month U.S. LIBOR + 3.340% 5.737% 10/15/36 (d)(f)(g) | | 730,577 | 681,934 |
| PKHL Commercial Mortgage Trust floater Series 2021-MF: | | | |
| Class F, 1 month U.S. LIBOR + 3.350% 5.742% 7/15/38 (d)(f)(g) | | 986,000 | 929,667 |
| Class NR, 1 month U.S. LIBOR + 6.000% 8.392% 7/15/38 (d)(f)(g) | | 280,000 | 266,745 |
| Prima Capital CRE Securitization Ltd. Series 2020-8A Class C, 3% 12/1/70 (d) | | 3,045,000 | 2,309,155 |
| Prima Capital Ltd.: | | | |
| floater Series 2021-9A: | | | |
| Class B, 1 month U.S. LIBOR + 1.800% 4.1681% 12/15/37 (d)(f)(g) | | 8,051,000 | 7,919,932 |
| Class C, 1 month U.S. LIBOR + 2.350% 4.7181% 12/15/37 (d)(f)(g) | | 3,150,000 | 2,971,125 |
| floater sequential payer Series 2021-9A Class A, 1 month U.S. LIBOR + 1.450% 3.5764% 12/15/37 (d)(f)(g) | | 1,761,333 | 1,761,333 |
| Providence Place Group Ltd. Partnership Series 2000-C1 Class A2, 7.75% 7/20/28 (d) | | 889,973 | 950,865 |
| SFO Commercial Mortgage Trust floater Series 2021-555 Class F, 1 month U.S. LIBOR + 3.650% 6.041% 5/15/38 (d)(f)(g) | | 961,000 | 885,937 |
| SG Commercial Mortgage Securities Trust: | | | |
| Series 2019-PREZ Class F, 3.593% 9/15/39 (d)(f) | | 1,360,000 | 1,029,713 |
| Series 2020-COVE: | | | |
| Class F, 3.8518% 3/15/37 (d)(f) | | 2,364,000 | 2,070,271 |
| Class G, 3.8518% 3/15/37 (d)(f) | | 860,000 | 719,277 |
| SLG Office Trust Series 2021-OVA Class G, 2.8506% 7/15/41 (d) | | 3,764,000 | 2,588,626 |
| SMRT Commercial Mortgage Trust floater Series 2022-MINI: | | | |
| Class E, CME Term SOFR 1 Month Index + 2.700% 5.008% 1/15/39 (d)(f)(g) | | 2,039,000 | 1,891,170 |
| Class F, CME Term SOFR 1 Month Index + 3.350% 5.658% 1/15/39 (d)(f)(g) | | 1,617,000 | 1,490,369 |
| SOHO Trust Series 2021-SOHO Class D, 2.6966% 8/10/38 (d)(f) | | 1,113,000 | 817,245 |
| SPGN Mortgage Trust floater Series 2022-TFLM: | | | |
| Class B, CME Term SOFR 1 Month Index + 2.000% 4.3074% 2/15/39 (d)(f)(g) | | 7,618,000 | 7,292,699 |
| Class C, CME Term SOFR 1 Month Index + 2.650% 4.9574% 2/15/39 (d)(f)(g) | | 3,962,000 | 3,789,122 |
| SREIT Trust floater: | | | |
| Series 2021-FLWR Class A, 1 month U.S. LIBOR + 0.570% 2.9676% 7/15/36 (d)(f)(g) | | 4,344,000 | 4,176,917 |
| Series 2021-IND Class G, 1 month U.S. LIBOR + 3.260% 5.6568% 10/15/38 (d)(f)(g) | | 1,487,000 | 1,353,219 |
| Series 2021-MFP: | | | |
| Class A, 1 month U.S. LIBOR + 0.730% 3.1218% 11/15/38 (d)(f)(g) | | 29,791,000 | 28,708,556 |
| Class B, 1 month U.S. LIBOR + 1.070% 3.4708% 11/15/38 (d)(f)(g) | | 17,063,000 | 16,295,146 |
| Class C, 1 month U.S. LIBOR + 1.320% 3.72% 11/15/38 (d)(f)(g) | | 10,597,000 | 10,093,636 |
| Class D, 1 month U.S. LIBOR + 1.570% 3.9692% 11/15/38 (d)(f)(g) | | 6,964,000 | 6,598,389 |
| Class G, 1 month U.S. LIBOR + 2.970% 5.3648% 11/15/38 (d)(f)(g) | | 4,308,000 | 4,034,361 |
| Series 2021-MFP2 Class J, 1 month U.S. LIBOR + 3.910% 6.3065% 11/15/36 (d)(f)(g) | | 3,205,000 | 2,987,194 |
| Series 2021-PALM Class G, 1 month U.S. LIBOR + 3.610% 6.0071% 10/15/34 (d)(f)(g) | | 798,000 | 719,796 |
| STWD Trust floater sequential payer Series 2021-LIH: | | | |
| Class E, 1 month U.S. LIBOR + 2.900% 5.294% 11/15/36 (d)(f)(g) | | 2,268,000 | 2,101,074 |
| Class F, 1 month U.S. LIBOR + 3.550% 5.942% 11/15/36 (d)(f)(g) | | 1,000,000 | 925,597 |
| Class G, 1 month U.S. LIBOR + 4.200% 6.591% 11/15/36 (d)(f)(g) | | 525,000 | 487,312 |
| SUMIT Mortgage Trust Series 2022-BVUE Class F, 2.9889% 2/12/41 (d)(f) | | 185,000 | 134,938 |
| TPGI Trust floater Series 2021-DGWD: | | | |
| Class E, 1 month U.S. LIBOR + 2.350% 4.74% 6/15/26 (d)(f)(g) | | 2,456,000 | 2,284,076 |
| Class G, 1 month U.S. LIBOR + 3.850% 6.24% 6/15/26 (d)(f)(g) | | 459,000 | 421,693 |
| Tricon Residential Trust Series 2022-SFR2 Class E, 7.507% 7/17/40 (d) | | 2,499,000 | 2,497,449 |
| UBS Commercial Mortgage Trust: | | | |
| Series 2012-C1: | | | |
| Class D, 6.6596% 5/10/45 (d)(f) | | 138,382 | 125,927 |
| Class E, 5% 5/10/45 (c)(d)(f) | | 595,000 | 232,050 |
| Class F, 5% 5/10/45 (d)(f) | | 762,700 | 39,668 |
| Series 2017-C7 Class XA, 1.1575% 12/15/50 (f)(o) | | 51,384,492 | 1,911,426 |
| Series 2018-C8 Class C, 4.8657% 2/15/51 (f) | | 336,000 | 309,365 |
| UBS-BAMLL Trust: | | | |
| Series 12-WRM Class D, 4.3793% 6/10/30 (c)(d)(f) | | 746,000 | 671,403 |
| Series 2012-WRM: | | | |
| Class C, 4.3793% 6/10/30 (d)(f) | | 110,000 | 104,508 |
| Class E, 4.3793% 6/10/30 (c)(d)(f) | | 849,000 | 662,283 |
| UBS-Citigroup Commercial Mortgage Trust Series 2011-C1 Class C, 6.6633% 1/10/45 (d)(f) | | 214,792 | 199,757 |
| VASA Trust: | | | |
| floater Series 2021-VASA Class G, 1 month U.S. LIBOR + 5.000% 7.391% 7/15/39 (d)(f)(g) | | 315,000 | 300,159 |
| floater sequential payer Series 2021-VASA Class F, 1 month U.S. LIBOR + 3.900% 6.291% 7/15/39 (d)(f)(g) | | 1,383,000 | 1,316,147 |
| VLS Commercial Mortgage Trust: | | | |
| sequential payer Series 2020-LAB Class A, 2.13% 10/10/42 (d) | | 25,554,000 | 20,881,167 |
| Series 2020-LAB: | | | |
| Class B, 2.453% 10/10/42 (d) | | 1,600,000 | 1,290,583 |
| Class X, 0.5162% 10/10/42 (d)(f)(o) | | 35,000,000 | 997,098 |
| VMC Finance Ltd. floater Series 2021-HT1 Class B, 1 month U.S. LIBOR + 4.500% 6.877% 1/18/37 (d)(f)(g) | | 4,431,000 | 4,238,306 |
| Wells Fargo Commercial Mortgage Trust: | | | |
| floater: | | | |
| Series 2021-FCMT Class A, 1 month U.S. LIBOR + 1.200% 3.591% 5/15/31 (d)(f)(g) | | 17,572,000 | 16,748,328 |
| Series 2021-SAVE: | | | |
| Class D, 1 month U.S. LIBOR + 2.500% 4.891% 2/15/40 (d)(f)(g) | | 352,700 | 328,154 |
| Class E, 1 month U.S. LIBOR + 3.650% 6.041% 2/15/40 (d)(f)(g) | | 250,890 | 232,752 |
| sequential payer Series 2020-C57 Class D, 2.5% 8/15/53 (d) | | 1,034,000 | 721,359 |
| Series 2012-LC5 Class F, 4.9565% 10/15/45 (d)(f) | | 108,402 | 100,272 |
| Series 2015-C31 Class XA, 1.1096% 11/15/48 (f)(o) | | 20,532,019 | 496,366 |
| Series 2015-NXS4 Class D, 3.8416% 12/15/48(f) | | 861,000 | 758,528 |
| Series 2016-BNK1: | | | |
| Class C, 3.071% 8/15/49 | | 446,000 | 370,483 |
| Class D, 3% 8/15/49 (d) | | 487,000 | 303,313 |
| Series 2016-C34 Class XA, 2.256% 6/15/49 (f)(o) | | 17,674,686 | 876,334 |
| Series 2016-LC25 Class C, 4.4836% 12/15/59 (f) | | 575,000 | 521,384 |
| Series 2016-NXS6 Class D, 3.059% 11/15/49 (d) | | 1,337,000 | 1,057,167 |
| Series 2017-RB1 Class D, 3.401% 3/15/50 (d) | | 595,000 | 469,312 |
| Series 2018-C43 Class C, 4.514% 3/15/51 | | 401,000 | 356,238 |
| Series 2018-C46 Class XA, 1.1007% 8/15/51 (f)(o) | | 54,489,844 | 1,734,466 |
| Series 2018-C48 Class A5, 4.302% 1/15/52 | | 6,748,000 | 6,657,710 |
| WF-RBS Commercial Mortgage Trust: | | | |
| sequential payer Series 2011-C4I Class G, 5% 6/15/44 (c)(f) | | 372,000 | 12,826 |
| Series 2011-C3: | | | |
| Class D, 5.4196% 3/15/44 (d)(f) | | 1,342,632 | 545,109 |
| Class E, 5% 3/15/44 (c)(d) | | 733,000 | 3,665 |
| Class F, 5% 3/15/44 (c)(d) | | 435,145 | 40 |
| Series 2011-C4: | | | |
| Class D, 4.9868% 6/15/44 (d)(f) | | 474,000 | 419,415 |
| Class E, 4.9868% 6/15/44 (d)(f) | | 335,432 | 262,303 |
| Series 2011-C5: | | | |
| Class E, 5.7035% 11/15/44 (d)(f) | | 791,129 | 788,879 |
| Class F, 5.25% 11/15/44 (d)(f) | | 1,146,000 | 1,051,152 |
| Class G, 5.25% 11/15/44 (d)(f) | | 376,000 | 333,502 |
| Series 2012-C7: | | | |
| Class C, 4.8144% 6/15/45 (f) | | 1,226,000 | 870,460 |
| Class E, 4.8144% 6/15/45 (c)(d)(f) | | 861,000 | 77,490 |
| Class F, 4.5% 6/15/45 (c)(d) | | 419,071 | 2,095 |
| Series 2013-C11: | | | |
| Class D, 4.3655% 3/15/45 (d)(f) | | 801,251 | 778,685 |
| Class E, 4.3655% 3/15/45 (c)(d)(f) | | 1,774,872 | 1,686,848 |
| Series 2013-C13 Class D, 4.2834% 5/15/45 (d)(f) | | 580,000 | 555,289 |
| Series 2013-C16 Class D, 5.1481% 9/15/46 (d)(f) | | 211,000 | 196,644 |
| Series 2013-UBS1 Class D, 5.1917% 3/15/46 (d)(f) | | 830,625 | 802,582 |
| Series 2014-C21 Class XA, 1.1659% 8/15/47 (f)(o) | | 46,904,043 | 684,832 |
| Series 2014-C24 Class XA, 0.9882% 11/15/47 (f)(o) | | 17,877,412 | 254,549 |
| Series 2014-LC14 Class XA, 1.4192% 3/15/47 (f)(o) | | 25,848,733 | 320,201 |
| WFCM Series 2022-C62: | | | |
| Class C, 4.3504% 4/15/55 (f) | | 1,923,000 | 1,654,735 |
| Class D, 2.5% 4/15/55 (d) | | 1,365,000 | 884,096 |
| Worldwide Plaza Trust Series 2017-WWP: | | | |
| Class E, 3.7154% 11/10/36 (d)(f) | | 348,000 | 277,203 |
| Class F, 3.7154% 11/10/36 (d)(f) | | 1,960,000 | 1,479,899 |
| WP Glimcher Mall Trust Series 2015-WPG: | | | |
| Class PR1, 3.6332% 6/5/35 (d)(f) | | 528,000 | 430,522 |
| Class PR2, 3.6332% 6/5/35 (d)(f) | | 1,378,000 | 1,046,868 |
| TOTAL COMMERCIAL MORTGAGE SECURITIES | | | |
| (Cost $1,700,507,611) | | | 1,607,394,984 |
|
| Municipal Securities - 0.5% | | | |
| California Gen. Oblig.: | | | |
| Series 2009: | | $ | $ |
| 7.3% 10/1/39 | | 17,580,000 | 22,344,083 |
| 7.35% 11/1/39 | | 1,690,000 | 2,158,768 |
| 7.55% 4/1/39 | | 11,940,000 | 15,862,544 |
| Series 2010, 7.625% 3/1/40 | | 6,440,000 | 8,525,824 |
| Chicago Gen. Oblig. (Taxable Proj.) Series 2010 C1, 7.781% 1/1/35 | | 8,885,000 | 9,835,315 |
| Illinois Gen. Oblig.: | | | |
| Series 2003: | | | |
| 4.95% 6/1/23 | | 4,212,273 | 4,232,102 |
| 5.1% 6/1/33 | | 40,165,000 | 39,972,875 |
| Series 2010-1, 6.63% 2/1/35 | | 7,610,000 | 8,061,122 |
| Series 2010-3: | | | |
| 6.725% 4/1/35 | | 11,345,000 | 12,075,073 |
| 7.35% 7/1/35 | | 4,828,571 | 5,298,942 |
| New Jersey Econ. Dev. Auth. State Pension Fdg. Rev. Series 1997, 7.425% 2/15/29 (Nat'l. Pub. Fin. Guarantee Corp. Insured) | | 27,425,000 | 30,387,734 |
| TOTAL MUNICIPAL SECURITIES | | | |
| (Cost $163,823,789) | | | 158,754,382 |
|
| Foreign Government and Government Agency Obligations - 1.2% | | | |
| Angola Republic: | | | |
| 8.25% 5/9/28 (d) | | $1,370,000 | $1,188,475 |
| 8.75% 4/14/32 (d) | | 795,000 | 647,925 |
| 9.375% 5/8/48 (d) | | 225,000 | 171,000 |
| 9.5% 11/12/25 (d) | | 3,130,000 | 2,981,325 |
| Arab Republic of Egypt: | | | |
| 5.8% 9/30/27 (d) | | 1,000,000 | 772,500 |
| 7.0529% 1/15/32 (d) | | 385,000 | 269,019 |
| 7.5% 1/31/27 (d) | | 6,142,000 | 5,159,280 |
| 7.6003% 3/1/29 (d) | | 1,440,000 | 1,130,400 |
| 7.903% 2/21/48 (d) | | 941,000 | 562,248 |
| 8.5% 1/31/47 (d) | | 1,586,000 | 1,007,110 |
| 8.7002% 3/1/49 (d) | | 835,000 | 528,138 |
| Argentine Republic: | | | |
| 0.5% 7/9/30 (h) | | 18,255,686 | 4,326,598 |
| 1% 7/9/29 | | 1,948,999 | 453,142 |
| 1.5% 7/9/35 (h) | | 5,213,323 | 1,170,391 |
| 3.875% 1/9/38 (h) | | 2,257,281 | 631,051 |
| Barbados Government 6.5% 10/1/29 (d) | | 1,530,000 | 1,409,419 |
| Bermuda Government: | | | |
| 2.375% 8/20/30 (d) | | 185,000 | 155,666 |
| 3.375% 8/20/50 (d) | | 430,000 | 313,712 |
| 3.717% 1/25/27 (d) | | 1,720,000 | 1,674,098 |
| 4.75% 2/15/29 (d) | | 965,000 | 966,387 |
| 5% 7/15/32 (d) | | 490,000 | 489,326 |
| Brazilian Federative Republic: | | | |
| 2.875% 6/6/25 | | 3,145,000 | 3,006,620 |
| 3.875% 6/12/30 | | 2,310,000 | 2,011,577 |
| 7.125% 1/20/37 | | 1,550,000 | 1,615,681 |
| 8.25% 1/20/34 | | 2,809,000 | 3,180,841 |
| Buenos Aires Province 3.9% 9/1/37 (d)(h) | | 1,430,000 | 495,853 |
| Cameroon Republic 9.5% 11/19/25 (d) | | 1,180,000 | 1,143,346 |
| Chilean Republic: | | | |
| 2.45% 1/31/31 | | 3,505,000 | 2,953,620 |
| 2.75% 1/31/27 | | 790,000 | 731,145 |
| 3.5% 1/31/34 | | 520,000 | 452,140 |
| 4% 1/31/52 | | 455,000 | 359,450 |
| 4.34% 3/7/42 | | 665,000 | 570,238 |
| Colombian Republic: | | | |
| 3% 1/30/30 | | 2,720,000 | 2,106,810 |
| 3.125% 4/15/31 | | 1,455,000 | 1,096,979 |
| 3.25% 4/22/32 | | 745,000 | 548,693 |
| 4.125% 5/15/51 | | 600,000 | 355,238 |
| 5% 6/15/45 | | 2,520,000 | 1,688,085 |
| 5.2% 5/15/49 | | 1,660,000 | 1,128,074 |
| 6.125% 1/18/41 | | 105,000 | 83,724 |
| 7.375% 9/18/37 | | 380,000 | 359,884 |
| Costa Rican Republic: | | | |
| 5.625% 4/30/43 (d) | | 680,000 | 509,915 |
| 6.125% 2/19/31 (d) | | 600,000 | 559,425 |
| 7% 4/4/44 (d) | | 140,000 | 121,389 |
| Democratic Socialist Republic of Sri Lanka: | | | |
| 6.2% 5/11/27 (d)(e) | | 635,000 | 203,914 |
| 6.825% 7/18/26 (d)(e) | | 210,000 | 70,061 |
| 7.55% 3/28/30 (d)(e) | | 615,000 | 196,339 |
| 7.85% 3/14/29 (d)(e) | | 1,345,000 | 431,073 |
| Dominican Republic: | | | |
| 4.5% 1/30/30 (d) | | 665,000 | 557,270 |
| 4.875% 9/23/32 (d) | | 2,060,000 | 1,659,330 |
| 5.875% 1/30/60 (d) | | 1,035,000 | 731,163 |
| 5.95% 1/25/27 (d) | | 1,181,000 | 1,152,435 |
| 6% 7/19/28 (d) | | 1,011,000 | 964,747 |
| 6.4% 6/5/49 (d) | | 425,000 | 333,439 |
| 6.5% 2/15/48 (d) | | 635,000 | 508,714 |
| 6.85% 1/27/45 (d) | | 1,143,000 | 967,121 |
| 6.875% 1/29/26 (d) | | 1,332,000 | 1,361,804 |
| 7.45% 4/30/44 (d) | | 794,000 | 723,185 |
| Ecuador Republic: | | | |
| 2.5% 7/31/35 (d)(h) | | 1,850,000 | 708,550 |
| 5.5% 7/31/30 (d)(h) | | 3,355,000 | 1,758,859 |
| El Salvador Republic: | | | |
| 6.375% 1/18/27 (d) | | 195,000 | 73,344 |
| 7.1246% 1/20/50 (d) | | 750,000 | 249,516 |
| 7.625% 2/1/41 (d) | | 230,000 | 76,878 |
| 7.75% 1/24/23 (d) | | 1,595,000 | 1,425,830 |
| Emirate of Abu Dhabi: | | | |
| 1.7% 3/2/31 (d) | | 1,560,000 | 1,331,655 |
| 3% 9/15/51 (d) | | 645,000 | 496,973 |
| 3.125% 4/16/30 (d) | | 2,010,000 | 1,939,399 |
| 3.125% 9/30/49 (d) | | 2,460,000 | 1,933,868 |
| 3.875% 4/16/50 (d) | | 18,260,000 | 16,460,249 |
| Emirate of Dubai 3.9% 9/9/50 (Reg. S) | | 2,050,000 | 1,502,650 |
| Gabonese Republic 7% 11/24/31 (d) | | 1,245,000 | 936,863 |
| Georgia Republic 2.75% 4/22/26 (d) | | 1,280,000 | 1,107,200 |
| German Federal Republic: | | | |
| 0% 2/15/31 (Reg. S) | EUR | 500,000 | 445,329 |
| 0% 2/15/32 (Reg. S) | EUR | 2,620,000 | 2,291,462 |
| 0% 5/15/35 (Reg. S) (j) | EUR | 27,640,000 | 22,585,726 |
| Ghana Republic: | | | |
| 7.75% 4/7/29 (d) | | 1,500,000 | 567,469 |
| 8.627% 6/16/49 (d) | | 525,000 | 183,028 |
| 10.75% 10/14/30 (d) | | 965,000 | 692,388 |
| Guatemalan Republic: | | | |
| 4.9% 6/1/30 (d) | | 590,000 | 559,689 |
| 5.375% 4/24/32 (d) | | 910,000 | 872,064 |
| 6.125% 6/1/50 (d) | | 615,000 | 559,573 |
| Hungarian Republic: | | | |
| 2.125% 9/22/31 (d) | | 530,000 | 386,006 |
| 5.25% 6/16/29 (d) | | 755,000 | 725,682 |
| 5.5% 6/16/34 (d) | | 790,000 | 735,280 |
| Indonesian Republic: | | | |
| 3.85% 10/15/30 | | 855,000 | 832,717 |
| 4.1% 4/24/28 | | 1,775,000 | 1,774,778 |
| 4.2% 10/15/50 | | 44,910,000 | 38,964,365 |
| 4.35% 1/11/48 | | 1,225,000 | 1,099,572 |
| 4.4% 6/6/27(d) | | 890,000 | 896,675 |
| 5.125% 1/15/45 (d) | | 2,740,000 | 2,678,651 |
| 5.25% 1/17/42 (d) | | 660,000 | 657,030 |
| 5.95% 1/8/46 (d) | | 985,000 | 1,051,980 |
| 6.75% 1/15/44 (d) | | 690,000 | 795,301 |
| 7.75% 1/17/38 (d) | | 1,728,000 | 2,113,884 |
| 8.5% 10/12/35 (d) | | 2,680,000 | 3,444,303 |
| Islamic Republic of Pakistan: | | | |
| 6% 4/8/26 (d) | | 1,770,000 | 1,097,595 |
| 6.875% 12/5/27 (d) | | 330,000 | 202,986 |
| 8.25% 4/15/24 (d) | | 611,000 | 433,877 |
| Israeli State: | | | |
| 3.375% 1/15/50 | | 1,600,000 | 1,330,000 |
| 3.8% 5/13/60 (Reg. S) | | 675,000 | 574,817 |
| Ivory Coast: | | | |
| 6.125% 6/15/33 (d) | | 2,490,000 | 2,093,623 |
| 6.375% 3/3/28 (d) | | 2,920,000 | 2,710,673 |
| Jamaican Government: | | | |
| 6.75% 4/28/28 | | 495,000 | 535,002 |
| 7.875% 7/28/45 | | 430,000 | 495,387 |
| Jordanian Kingdom: | | | |
| 4.95% 7/7/25 (d) | | 1,535,000 | 1,449,424 |
| 7.375% 10/10/47 (d) | | 290,000 | 234,900 |
| 7.75% 1/15/28 (d) | | 825,000 | 815,616 |
| Kingdom of Saudi Arabia: | | | |
| 2.25% 2/2/33 (d) | | 1,835,000 | 1,568,925 |
| 3.25% 10/22/30 (d) | | 10,790,000 | 10,385,375 |
| 3.625% 3/4/28 (d) | | 785,000 | 779,113 |
| 3.75% 1/21/55 (d) | | 1,250,000 | 1,031,250 |
| 4.5% 10/26/46 (d) | | 1,665,000 | 1,550,531 |
| 4.5% 4/22/60 (d) | | 7,675,000 | 7,137,750 |
| 4.625% 10/4/47 (d) | | 680,000 | 636,650 |
| Korean Republic 1% 9/16/30 | | 1,585,000 | 1,306,753 |
| Lebanese Republic: | | | |
| 5.8% 12/31/49 (e) | | 1,814,000 | 125,053 |
| 6.375% 12/31/49 (e) | | 1,956,000 | 134,842 |
| Ministry of Finance of the Russian Federation: | | | |
| 4.375% 3/21/29(Reg. S) (e) | | 1,000,000 | 470,000 |
| 5.1% 3/28/35(Reg. S) (e) | | 2,000,000 | 940,000 |
| Mongolia Government 5.125% 4/7/26 (d) | | 1,010,000 | 926,786 |
| Moroccan Kingdom: | | | |
| 2.375% 12/15/27 (d) | | 2,375,000 | 2,039,234 |
| 4% 12/15/50 (d) | | 335,000 | 215,824 |
| 5.5% 12/11/42 (d) | | 200,000 | 162,788 |
| Panamanian Republic: | | | |
| 2.252% 9/29/32 | | 1,065,000 | 825,242 |
| 3.16% 1/23/30 | | 1,135,000 | 996,530 |
| 3.298% 1/19/33 | | 1,135,000 | 961,913 |
| 3.87% 7/23/60 | | 1,530,000 | 1,050,249 |
| 3.875% 3/17/28 | | 1,430,000 | 1,372,621 |
| 4.5% 5/15/47 | | 645,000 | 516,323 |
| 4.5% 4/16/50 | | 2,015,000 | 1,586,561 |
| Peoples Republic of China 1.2% 10/21/30 (d) | | 1,150,000 | 980,479 |
| Peruvian Republic: | | | |
| 2.783% 1/23/31 | | 5,060,000 | 4,322,505 |
| 3% 1/15/34 | | 1,130,000 | 921,515 |
| 3.3% 3/11/41 | | 1,285,000 | 974,030 |
| Province of Santa Fe 7% 3/23/23 (d) | | 1,042,000 | 971,014 |
| Provincia de Cordoba: | | | |
| 6.875% 12/10/25 (d) | | 3,111,474 | 2,370,554 |
| 6.99% 6/1/27 (d) | | 1,110,721 | 697,533 |
| Republic of Armenia 7.15% 3/26/25 (d) | | 645,000 | 643,508 |
| Republic of Iraq 5.8% 1/15/28 (Reg. S) | | 657,250 | 546,462 |
| Republic of Kenya: | | | |
| 6.875% 6/24/24 (d) | | 1,445,000 | 1,264,375 |
| 7% 5/22/27 (d) | | 1,265,000 | 1,005,675 |
| Republic of Nigeria: | | | |
| 6.125% 9/28/28 (d) | | 2,020,000 | 1,452,254 |
| 6.375% 7/12/23 (d) | | 440,000 | 424,600 |
| 7.143% 2/23/30 (d) | | 1,285,000 | 944,475 |
| 7.625% 11/21/25 (d) | | 4,915,000 | 4,337,488 |
| Republic of Paraguay: | | | |
| 2.739% 1/29/33 (d) | | 595,000 | 468,302 |
| 4.95% 4/28/31 (d) | | 1,525,000 | 1,466,192 |
| 5.4% 3/30/50 (d) | | 890,000 | 743,039 |
| Republic of Serbia 2.125% 12/1/30 (d) | | 1,705,000 | 1,223,124 |
| Republic of Uzbekistan: | | | |
| 3.7% 11/25/30 (d) | | 725,000 | 557,706 |
| 3.9% 10/19/31 (d) | | 1,045,000 | 795,702 |
| 4.75% 2/20/24 (d) | | 580,000 | 566,878 |
| Romanian Republic: | | | |
| 3% 2/27/27 (d) | | 1,206,000 | 1,086,003 |
| 3% 2/14/31 (d) | | 1,721,000 | 1,362,602 |
| 3.625% 3/27/32 (d) | | 1,206,000 | 970,302 |
| 4% 2/14/51 (d) | | 615,000 | 421,967 |
| 4.375% 8/22/23 (d) | | 550,000 | 549,072 |
| Rwanda Republic 5.5% 8/9/31 (d) | | 1,545,000 | 1,170,627 |
| South African Republic 4.85% 9/30/29 | | 620,000 | 548,041 |
| State of Qatar: | | | |
| 3.75% 4/16/30 (d) | | 4,850,000 | 4,850,000 |
| 4% 3/14/29 (d) | | 1,570,000 | 1,595,513 |
| 4.4% 4/16/50 (d) | | 30,490,000 | 29,613,413 |
| 4.817% 3/14/49 (d) | | 1,980,000 | 2,031,975 |
| 5.103% 4/23/48 (d) | | 1,815,000 | 1,939,781 |
| 9.75% 6/15/30 (d) | | 722,000 | 1,008,093 |
| Sultanate of Oman: | | | |
| 5.375% 3/8/27 (d) | | 315,000 | 310,275 |
| 5.625% 1/17/28 (d) | | 3,575,000 | 3,507,969 |
| 6% 8/1/29 (d) | | 1,185,000 | 1,180,556 |
| 6.25% 1/25/31 (d) | | 895,000 | 901,713 |
| 6.75% 1/17/48 (d) | | 2,509,000 | 2,229,874 |
| Turkish Republic: | | | |
| 4.25% 3/13/25 | | 2,225,000 | 1,941,313 |
| 4.25% 4/14/26 | | 1,210,000 | 1,004,300 |
| 4.75% 1/26/26 | | 2,780,000 | 2,376,900 |
| 4.875% 10/9/26 | | 1,840,000 | 1,527,200 |
| 4.875% 4/16/43 | | 1,825,000 | 1,031,125 |
| 5.125% 2/17/28 | | 1,395,000 | 1,088,100 |
| 5.75% 3/22/24 | | 705,000 | 669,750 |
| 5.75% 5/11/47 | | 1,008,000 | 604,800 |
| 6% 1/14/41 | | 445,000 | 285,913 |
| 6.125% 10/24/28 | | 945,000 | 765,450 |
| 6.35% 8/10/24 | | 755,000 | 713,475 |
| 7.25% 12/23/23 | | 1,605,000 | 1,607,006 |
| Ukraine Government: | | | |
| 0% 5/31/41 (d)(f) | | 975,000 | 292,500 |
| 6.876% 5/21/31 (d) | | 455,000 | 86,450 |
| 7.253% 3/15/35 (d) | | 1,570,000 | 274,750 |
| 7.375% 9/25/34 (d) | | 780,000 | 138,450 |
| 7.75% 9/1/24 (d) | | 2,254,000 | 644,221 |
| 7.75% 9/1/25 (d) | | 2,985,000 | 716,400 |
| 7.75% 9/1/26 (d) | | 3,955,000 | 800,888 |
| 7.75% 9/1/28 (d) | | 575,000 | 116,438 |
| 7.75% 9/1/29 (d) | | 270,000 | 54,675 |
| United Arab Emirates 4.05% 7/7/32 (d) | | 1,135,000 | 1,149,755 |
| United Mexican States: | | | |
| 2.659% 5/24/31 | | 1,235,000 | 1,021,963 |
| 3.25% 4/16/30 | | 1,660,000 | 1,479,268 |
| 3.5% 2/12/34 | | 1,565,000 | 1,303,645 |
| 3.75% 1/11/28 | | 1,515,000 | 1,456,673 |
| 3.75% 4/19/71 | | 2,225,000 | 1,457,792 |
| 4.5% 4/22/29 | | 905,000 | 884,185 |
| 4.875% 5/19/33 | | 895,000 | 856,963 |
| 5.75% 10/12/2110 | | 2,265,000 | 1,940,539 |
| 6.05% 1/11/40 | | 1,810,000 | 1,812,036 |
| Uruguay Republic 5.1% 6/18/50 | | 1,810,000 | 1,837,489 |
| Venezuelan Republic: | | | |
| 9.25% 9/15/27 (e) | | 7,846,000 | 666,910 |
| 11.95% 8/5/31 (Reg. S) (e) | | 1,641,700 | 139,545 |
| 12.75% 12/31/49 (e) | | 350,400 | 30,222 |
| Vietnamese Socialist Republic 5.5% 3/12/28 | | 3,585,450 | 3,540,184 |
| TOTAL FOREIGN GOVERNMENT AND GOVERNMENT AGENCY OBLIGATIONS | | | |
| (Cost $433,542,733) | | | 343,827,990 |
|
| Supranational Obligations - 0.1% | | | |
Corporacion Andina de Fomento 2.375% 5/12/23
(Cost $27,385,562) | | 27,400,000 | 27,107,094 |
| | | Shares | Value |
|
| Common Stocks - 0.2% | | | |
| COMMUNICATION SERVICES - 0.0% | | | |
| Entertainment - 0.0% | | | |
| Cineworld Group PLC warrants 11/23/25 (s) | | 255,224 | 3 |
| Media - 0.0% | | | |
| Altice U.S.A., Inc. Class A (s) | | 146,500 | 1,465,000 |
| Wireless Telecommunication Services - 0.0% | | | |
| CUI Acquisition Corp. Class E (c)(s) | | 1 | 34,600 |
|
| TOTAL COMMUNICATION SERVICES | | | 1,499,603 |
|
| CONSUMER DISCRETIONARY - 0.0% | | | |
| Hotels, Restaurants & Leisure - 0.0% | | | |
| Caesars Entertainment, Inc. (s) | | 85,500 | 3,686,760 |
| CEC Entertainment, Inc. (c)(s) | | 65,301 | 1,306,020 |
| | | | 4,992,780 |
| Specialty Retail - 0.0% | | | |
| David's Bridal, Inc. rights (c)(s) | | 518 | 0 |
|
| TOTAL CONSUMER DISCRETIONARY | | | 4,992,780 |
|
| ENERGY - 0.2% | | | |
| Energy Equipment & Services - 0.0% | | | |
| Jonah Energy Parent LLC (c)(s) | | 74,805 | 5,260,288 |
| Oil, Gas & Consumable Fuels - 0.2% | | | |
| California Resources Corp. | | 159,023 | 7,944,789 |
| California Resources Corp. warrants 10/27/24 (s) | | 6,440 | 118,174 |
| Chesapeake Energy Corp. | | 119,159 | 11,974,288 |
| Chesapeake Energy Corp. (b)(s) | | 619 | 62,203 |
| Denbury, Inc. (s) | | 27,140 | 2,413,560 |
| EP Energy Corp. (c)(s) | | 6,556 | 61,299 |
| EQT Corp. | | 104,300 | 4,985,540 |
| Mesquite Energy, Inc. (c)(s) | | 113,725 | 7,215,859 |
| New Fortress Energy, Inc. | | 81,800 | 4,691,230 |
| Pioneer Natural Resources Co. | | 15,900 | 4,026,198 |
| | | | 43,493,140 |
|
| TOTAL ENERGY | | | 48,753,428 |
|
| FINANCIALS - 0.0% | | | |
| Diversified Financial Services - 0.0% | | | |
| ACNR Holdings, Inc. (c)(s) | | 8,987 | 880,726 |
| Lime Tree Bay Ltd. (c) | | 809 | 27,288 |
| | | | 908,014 |
| INDUSTRIALS - 0.0% | | | |
| Machinery - 0.0% | | | |
| TNT Crane & Rigging LLC (c)(s) | | 83,132 | 650,924 |
| TNT Crane & Rigging LLC warrants 10/31/25 (c)(s) | | 3,648 | 1,788 |
| | | | 652,712 |
| INFORMATION TECHNOLOGY - 0.0% | | | |
| IT Services - 0.0% | | | |
| GTT Communications, Inc. rights (c)(s) | | 311,584 | 311,584 |
| UTILITIES - 0.0% | | | |
| Electric Utilities - 0.0% | | | |
| TexGen Power LLC (c)(s) | | 88,700 | 2,337,245 |
| TOTAL COMMON STOCKS | | | |
| (Cost $33,116,449) | | | 59,455,366 |
|
| Preferred Stocks - 0.0% | | | |
| Convertible Preferred Stocks - 0.0% | | | |
| REAL ESTATE - 0.0% | | | |
| Equity Real Estate Investment Trusts (REITs) - 0.0% | | | |
| RLJ Lodging Trust Series A, 1.95% | | 20,725 | 533,669 |
| Nonconvertible Preferred Stocks - 0.0% | | | |
| FINANCIALS - 0.0% | | | |
| Diversified Financial Services - 0.0% | | | |
| ACNR Holdings, Inc. (c)(s) | | 5,145 | 3,035,550 |
| Mortgage Real Estate Investment Trusts - 0.0% | | | |
| AGNC Investment Corp. Series E, 6.50% (f) | | 66,700 | 1,478,739 |
| Arbor Realty Trust, Inc. Series F, 6.25% (f) | | 40,700 | 865,282 |
| Dynex Capital, Inc. Series C 6.90% (f) | | 20,200 | 459,752 |
| Franklin BSP Realty Trust, Inc. 7.50% | | 34,000 | 695,980 |
| MFA Financial, Inc. Series B, 7.50% | | 24,975 | 540,959 |
| | | | 4,040,712 |
| TOTAL FINANCIALS | | | 7,076,262 |
| REAL ESTATE - 0.0% | | | |
| Equity Real Estate Investment Trusts (REITs) - 0.0% | | | |
| Cedar Realty Trust, Inc.: | | | |
| 7.25% | | 1,166 | 12,663 |
| Series C, 6.50% | | 26,075 | 281,089 |
| DiamondRock Hospitality Co. 8.25% | | 12,600 | 331,254 |
| iStar Financial, Inc. Series G, 7.65% | | 34,900 | 876,339 |
| National Storage Affiliates Trust Series A, 6.00% | | 12,600 | 312,228 |
| Rexford Industrial Realty, Inc. Series B, 5.875% | | 30,100 | 760,176 |
| Spirit Realty Capital, Inc. Series A, 6.00% | | 18,100 | 448,156 |
| | | | 3,021,905 |
| Real Estate Management & Development - 0.0% | | | |
| Digitalbridge Group, Inc.: | | | |
| Series H, 7.125% | | 22,855 | 543,492 |
| Series I, 7.15% | | 30,500 | 720,410 |
| | | | 1,263,902 |
| TOTAL REAL ESTATE | | | 4,285,807 |
|
| TOTAL NONCONVERTIBLE PREFERRED STOCKS | | | 11,362,069 |
|
| TOTAL PREFERRED STOCKS | | | |
| (Cost $10,121,358) | | | 11,895,738 |
| | | Principal Amount | Value |
|
| Bank Loan Obligations - 6.9% | | | |
| COMMUNICATION SERVICES - 0.7% | | | |
| Diversified Telecommunication Services - 0.2% | | | |
| Cablevision Lightpath LLC Tranche B 1LN, term loan 1 month U.S. LIBOR + 3.250% 5.641% 11/30/27 (f)(g)(t) | | 1,251,728 | 1,229,297 |
| Cincinnati Bell, Inc. Tranche B2 1LN, term loan CME Term SOFR 1 Month Index + 3.250% 5.8053% 11/23/28 (f)(g)(t) | | 2,049,700 | 2,004,012 |
| Connect U.S. Finco LLC Tranche B 1LN, term loan 1 month U.S. LIBOR + 3.500% 6.03% 12/12/26 (f)(g)(t) | | 2,020,448 | 1,957,309 |
| Consolidated Communications, Inc. Tranche B 1LN, term loan 1 month U.S. LIBOR + 3.500% 6.0625% 10/2/27 (f)(g)(t) | | 1,592,230 | 1,418,088 |
| Frontier Communications Holdings LLC Tranche B 1LN, term loan 1 month U.S. LIBOR + 3.750% 6.0625% 5/1/28 (f)(g)(t) | | 11,258,432 | 10,884,090 |
| Level 3 Financing, Inc. Tranche B 1LN, term loan 1 month U.S. LIBOR + 1.750% 4.2739% 3/1/27 (f)(g)(t) | | 2,678,811 | 2,553,951 |
| Lumen Technologies, Inc. Tranche B 1LN, term loan 1 month U.S. LIBOR + 2.250% 4.7739% 3/15/27 (f)(g)(t) | | 1,664,042 | 1,564,200 |
| Northwest Fiber LLC Tranche B 1LN, term loan 1 month U.S. LIBOR + 3.750% 6.127% 4/30/27 (f)(g)(t) | | 4,783,544 | 4,500,502 |
| Patagonia Holdco LLC Tranche B 1LN, term loan CME Term SOFR 1 Month Index + 5.750% 8.386% 8/1/29 (f)(g)(t) | | 3,680,000 | 3,112,654 |
| Securus Technologies Holdings Tranche B, term loan: | | | |
| 3 month U.S. LIBOR + 4.500% 6.7504% 11/1/24 (f)(g)(t) | | 6,483,817 | 5,808,722 |
| 3 month U.S. LIBOR + 8.250% 11.0559% 11/1/25 (f)(g)(t) | | 3,586,000 | 3,165,398 |
| Windstream Services LLC Tranche B 1LN, term loan 1 month U.S. LIBOR + 6.250% 8.7739% 9/21/27 (f)(g)(t) | | 4,582,528 | 4,406,879 |
| Zayo Group Holdings, Inc. 1LN, term loan: | | | |
| 1 month U.S. LIBOR + 3.000% 5.3723% 3/9/27 (f)(g)(t) | | 13,429,224 | 12,212,267 |
| CME Term SOFR 1 Month Index + 4.250% 6.7053% 3/9/27 (f)(g)(t) | | 1,072,313 | 1,005,486 |
| | | | 55,822,855 |
| Entertainment - 0.0% | | | |
| Allen Media LLC Tranche B 1LN, term loan 1 month U.S. LIBOR + 5.500% 7.7044% 2/10/27 (f)(g)(t) | | 9,245,915 | 8,069,372 |
| AP Core Holdings II LLC: | | | |
| Tranche B1 1LN, term loan 1 month U.S. LIBOR + 5.500% 8.0239% 9/1/27 (f)(g)(t) | | 1,386,000 | 1,308,384 |
| Tranche B2 1LN, term loan 1 month U.S. LIBOR + 5.500% 8.0239% 9/1/27 (f)(g)(t) | | 3,520,000 | 3,329,322 |
| Crown Finance U.S., Inc. Tranche B 1LN, term loan: | | | |
| 1 month U.S. LIBOR + 2.500% 3.9997% 2/28/25 (f)(g)(t) | | 4,962,658 | 3,176,945 |
| 1 month U.S. LIBOR + 2.750% 4.2497% 9/30/26 (f)(g)(t) | | 731,236 | 460,013 |
| 1 month U.S. LIBOR + 8.250% 10.0763% 5/23/24 (f)(g)(t) | | 547,085 | 579,226 |
| 15.25% 5/23/24 (t) | | 908,659 | 1,044,530 |
| Playtika Holding Corp. Tranche B 1LN, term loan 1 month U.S. LIBOR + 2.750% 5.2739% 3/11/28 (f)(g)(t) | | 2,216,674 | 2,165,424 |
| Sweetwater Borrower LLC Tranche B 1LN, term loan 1 month U.S. LIBOR + 4.250% 6.8125% 8/5/28 (c)(f)(g)(t) | | 2,780,090 | 2,599,384 |
| | | | 22,732,600 |
| Media - 0.4% | | | |
| Advantage Sales & Marketing, Inc. Tranche B 1LN, term loan 1 month U.S. LIBOR + 4.500% 6.8763% 10/28/27 (f)(g)(t) | | 7,659,499 | 7,174,423 |
| Altice Financing SA Tranche B, term loan 3 month U.S. LIBOR + 2.750% 5.262% 1/31/26 (f)(g)(t) | | 2,415,886 | 2,322,271 |
| Cengage Learning, Inc. Tranche B 1LN, term loan 1 month U.S. LIBOR + 4.750% 7.8144% 7/14/26 (f)(g)(t) | | 1,850,602 | 1,745,506 |
| Charter Communication Operating LLC Tranche B2 1LN, term loan 1 month U.S. LIBOR + 1.750% 4.28% 2/1/27 (f)(g)(t) | | 16,373,466 | 15,850,170 |
| Coral-U.S. Co.-Borrower LLC: | | | |
| Tranche B, term loan 1 month U.S. LIBOR + 2.250% 4.641% 1/31/28 (f)(g)(t) | | 6,820,000 | 6,552,315 |
| Tranche B6 1LN, term loan 1 month U.S. LIBOR + 3.000% 5.391% 10/15/29 (f)(g)(t) | | 1,415,000 | 1,372,904 |
| CSC Holdings LLC: | | | |
| Tranche B 5LN, term loan 1 month U.S. LIBOR + 2.500% 4.891% 4/15/27 (f)(g)(t) | | 4,265,625 | 4,106,560 |
| Tranche B3 1LN, term loan 3 month U.S. LIBOR + 2.250% 4.641% 1/15/26 (f)(g)(t) | | 3,412,745 | 3,298,999 |
| Diamond Sports Group LLC: | | | |
| 1LN, term loan CME Term SOFR 1 Month Index + 8.000% 10.3874% 5/25/26 (f)(g)(t) | | 4,563,417 | 4,288,197 |
| 2LN, term loan CME Term SOFR 1 Month Index + 3.250% 5.6374% 8/24/26 (f)(g)(t) | | 17,307,943 | 3,140,180 |
| DIRECTV Financing LLC 1LN, term loan 1 month U.S. LIBOR + 5.000% 7.5239% 8/2/27 (f)(g)(t) | | 5,772,175 | 5,510,984 |
| Dotdash Meredith, Inc. Tranche B 1LN, term loan CME Term SOFR 1 Month Index + 4.000% 6.4074% 12/1/28 (c)(f)(g)(t) | | 6,834,024 | 6,338,557 |
| Entercom Media Corp. Tranche B 2LN, term loan 1 month U.S. LIBOR + 2.500% 4.9934% 11/17/24 (f)(g)(t) | | 1,502,053 | 1,307,252 |
| Gray Television, Inc. Tranche D 1LN, term loan 1 month U.S. LIBOR + 3.000% 5.3731% 12/1/28 (f)(g)(t) | | 1,795,489 | 1,765,989 |
| LCPR Loan Financing LLC 1LN, term loan 1 month U.S. LIBOR + 3.750% 6.141% 9/25/28 (f)(g)(t) | | 1,810,000 | 1,764,750 |
| MJH Healthcare Holdings LLC Tranche B 1LN, term loan CME Term SOFR 1 Month Index + 3.500% 6.0553% 1/28/29 (f)(g)(t) | | 1,501,238 | 1,426,176 |
| Neptune Finco Corp. Tranche B, term loan 3 month U.S. LIBOR + 2.250% 4.641% 7/17/25 (f)(g)(t) | | 4,510,033 | 4,360,661 |
| Nexstar Broadcasting, Inc. Tranche B, term loan 1 month U.S. LIBOR + 2.500% 5.0239% 9/19/26 (f)(g)(t) | | 4,272,122 | 4,232,092 |
| Numericable LLC: | | | |
| Tranche B 11LN, term loan 3 month U.S. LIBOR + 2.750% 5.5559% 7/31/25 (f)(g)(t) | | 8,748,562 | 8,445,074 |
| Tranche B 12LN, term loan 3 month U.S. LIBOR + 3.680% 6.1995% 1/31/26 (f)(g)(t) | | 4,679,314 | 4,516,988 |
| Tranche B 13LN, term loan 3 month U.S. LIBOR + 4.000% 6.9051% 8/14/26 (f)(g)(t) | | 2,452,450 | 2,371,519 |
| Recorded Books, Inc. Tranche B 1LN, term loan 1 month U.S. LIBOR + 4.000% 6.3134% 8/29/25 (f)(g)(t) | | 1,922,846 | 1,890,792 |
| Scripps (E.W.) Co. Tranche B 1LN, term loan 1 month U.S. LIBOR + 2.750% 5.2739% 1/7/28 (f)(g)(t) | | 2,303,925 | 2,268,122 |
| Sinclair Television Group, Inc. Tranche B 1LN, term loan 1 month U.S. LIBOR + 2.500% 5.03% 9/30/26 (f)(g)(t) | | 2,144,363 | 2,056,808 |
| Springer Nature Deutschland GmbH Tranche B18 1LN, term loan 1 month U.S. LIBOR + 3.500% 5.5239% 8/14/26 (f)(g)(t) | | 2,786,832 | 2,743,636 |
| Univision Communications, Inc.: | | | |
| 1LN, term loan CME Term SOFR 1 Month Index + 4.250% 6.2543% 6/10/29 (f)(g)(t) | | 1,225,000 | 1,200,500 |
| Tranche B 1LN, term loan: | | | |
| 1 month U.S. LIBOR + 3.250% 5.6223% 1/31/29 (f)(g)(t) | | 5,326,650 | 5,157,529 |
| 1 month U.S. LIBOR + 3.250% 5.7739% 3/24/26 (f)(g)(t) | | 3,730,455 | 3,638,536 |
| Virgin Media Bristol LLC Tranche N, term loan 1 month U.S. LIBOR + 2.500% 4.891% 1/31/28 (f)(g)(t) | | 3,500,000 | 3,416,875 |
| | | | 114,264,365 |
| Wireless Telecommunication Services - 0.1% | | | |
| Crown Subsea Communications Holding, Inc. Tranche B 1LN, term loan 1 month U.S. LIBOR + 4.750% 7.1231% 4/27/27 (f)(g)(t) | | 1,358,322 | 1,322,095 |
| Intelsat Jackson Holdings SA 1LN, term loan CME Term SOFR 1 Month Index + 4.250% 7.4449% 2/1/29 (f)(g)(t) | | 22,953,512 | 21,710,120 |
| SBA Senior Finance II, LLC Tranche B, term loan 1 month U.S. LIBOR + 1.750% 4.28% 4/11/25 (f)(g)(t) | | 2,202,727 | 2,149,179 |
| | | | 25,181,394 |
|
| TOTAL COMMUNICATION SERVICES | | | 218,001,214 |
|
| CONSUMER DISCRETIONARY - 1.7% | | | |
| Auto Components - 0.1% | | | |
| American Trailer World Corp. Tranche B 1LN, term loan CME Term SOFR 1 Month Index + 3.750% 6.3053% 3/5/28 (f)(g)(t) | | 3,982,967 | 3,708,142 |
| Avis Budget Car Rental LLC 1LN, term loan CME Term SOFR 1 Month Index + 3.500% 6.0553% 3/16/29 (f)(g)(t) | | 1,591,013 | 1,556,217 |
| Clarios Global LP Tranche B 1LN, term loan 1 month U.S. LIBOR + 3.250% 5.7739% 4/30/26 (f)(g)(t) | | 3,253,413 | 3,162,318 |
| Les Schwab Tire Centers Tranche B 1LN, term loan 1 month U.S. LIBOR + 3.250% 6.5799% 11/2/27 (f)(g)(t) | | 3,629,725 | 3,528,383 |
| Novae LLC: | | | |
| 1LN, term loan CME Term SOFR 1 Month Index + 5.000% 7.7267% 12/22/28 (f)(g)(t) | | 1,528,392 | 1,421,404 |
| Tranche DD 1LN, term loan CME Term SOFR 1 Month Index + 5.000% 7.7267% 12/22/28 (f)(g)(t) | | 436,683 | 406,116 |
| PECF USS Intermediate Holding III Corp. Tranche B 1LN, term loan 1 month U.S. LIBOR + 4.250% 6.7739% 12/17/28 (f)(g)(t) | | 2,999,925 | 2,787,680 |
| Power Stop LLC 1LN, term loan 1 month U.S. LIBOR + 4.750% 7.8196% 1/26/29 (f)(g)(t) | | 1,226,925 | 920,194 |
| Rough Country LLC Tranche B 1LN, term loan 1 month U.S. LIBOR + 3.500% 5.7504% 7/28/28 (f)(g)(t) | | 1,431,875 | 1,359,565 |
| Truck Hero, Inc. Tranche B 1LN, term loan 1 month U.S. LIBOR + 3.500% 5.8723% 1/29/28 (f)(g)(t) | | 2,942,750 | 2,671,546 |
| | | | 21,521,565 |
| Automobiles - 0.0% | | | |
| Bombardier Recreational Products, Inc. Tranche B 1LN, term loan 1 month U.S. LIBOR + 2.000% 4.5739% 5/23/27 (f)(g)(t) | | 1,295,076 | 1,247,482 |
| CWGS Group LLC Tranche B 1LN, term loan 1 month U.S. LIBOR + 2.500% 4.9% 6/3/28 (f)(g)(t) | | 6,952,306 | 6,487,405 |
| HarbourVest Partners LLC Tranche B 1LN, term loan 3 month U.S. LIBOR + 2.250% 4.762% 3/1/25 (f)(g)(t) | | 3,384,534 | 3,318,265 |
| Thor Industries, Inc. Tranche B 1LN, term loan 1 month U.S. LIBOR + 3.000% 5.5% 2/1/26 (f)(g)(t) | | 540,043 | 534,642 |
| | | | 11,587,794 |
| Distributors - 0.0% | | | |
| BCPE Empire Holdings, Inc. 1LN, term loan: | | | |
| CME Term SOFR 1 Month Index + 4.000% 6.3723% 6/11/26 (f)(g)(t) | | 2,540,997 | 2,444,134 |
| CME Term SOFR 1 Month Index + 4.620% 7.1803% 6/11/26 (f)(g)(t) | | 2,304,225 | 2,229,338 |
| Gloves Buyer, Inc. Tranche B 1LN, term loan 1 month U.S. LIBOR + 4.000% 6.5239% 1/6/28 (f)(g)(t) | | 1,244,248 | 1,171,149 |
| | | | 5,844,621 |
| Diversified Consumer Services - 0.2% | | | |
| Adtalem Global Education, Inc. Tranche B 1LN, term loan 1 month U.S. LIBOR + 4.000% 6.3681% 8/12/28 (f)(g)(t) | | 2,453,091 | 2,425,493 |
| GEMS MENASA Cayman Ltd. Tranche B 1LN, term loan 1 month U.S. LIBOR + 5.000% 8.5664% 7/30/26 (f)(g)(t) | | 4,860,128 | 4,736,195 |
| KUEHG Corp.: | | | |
| Tranche B 2LN, term loan 3 month U.S. LIBOR + 8.250% 10.5004% 8/22/25 (f)(g)(t) | | 637,000 | 620,011 |
| Tranche B, term loan 3 month U.S. LIBOR + 3.750% 6.0004% 2/21/25 (f)(g)(t) | | 4,751,577 | 4,637,254 |
| Lakeshore Intermediate LLC 1LN, term loan 1 month U.S. LIBOR + 3.500% 5.8763% 10/1/28 (f)(g)(t) | | 1,333,300 | 1,284,968 |
| Learning Care Group (U.S.) No 2, Inc. Tranche B 1LN, term loan 1 month U.S. LIBOR + 8.500% 11.3899% 3/13/25 (c)(f)(g)(t) | | 1,930,600 | 1,901,641 |
| Mckissock Investment Holdings Tranche B 1LN, term loan CME Term SOFR 1 Month Index + 5.000% 6% 3/10/29 (f)(g)(t) | | 1,785,525 | 1,735,316 |
| Ring Container Technologies Group LLC Tranche B 1LN, term loan 1 month U.S. LIBOR + 3.750% 6.1223% 8/12/28 (f)(g)(t) | | 2,164,125 | 2,119,934 |
| Signal Parent, Inc. Tranche B 1LN, term loan 1 month U.S. LIBOR + 3.500% 6.0239% 4/3/28 (f)(g)(t) | | 3,969,900 | 2,977,425 |
| Sotheby's Tranche B 1LN, term loan 1 month U.S. LIBOR + 4.500% 7.012% 1/15/27 (f)(g)(t) | | 1,642,266 | 1,625,843 |
| Spin Holdco, Inc. Tranche B 1LN, term loan 1 month U.S. LIBOR + 4.000% 5.6107% 3/4/28 (f)(g)(t) | | 18,497,125 | 17,341,055 |
| SSH Group Holdings, Inc. Tranche B 1LN, term loan 3 month U.S. LIBOR + 4.250% 6.5004% 7/30/25 (f)(g)(t) | | 1,076,412 | 1,029,997 |
| TKC Holdings, Inc. 1LN, term loan 1 month U.S. LIBOR + 5.500% 7% 5/3/28 (f)(g)(t) | | 2,200,533 | 1,955,042 |
| | | | 44,390,174 |
| Hotels, Restaurants & Leisure - 0.7% | | | |
| 19Th Holdings Golf LLC Tranche B 1LN, term loan CME Term SOFR 1 Month Index + 3.250% 5.3874% 2/7/29 (c)(f)(g)(t) | | 3,385,000 | 3,148,050 |
| Aimbridge Acquisition Co., Inc.: | | | |
| Tranche B 1LN, term loan 1 month U.S. LIBOR + 4.750% 7.127% 2/1/26 (f)(g)(t) | | 782,590 | 727,809 |
| Tranche B, term loan 3 month U.S. LIBOR + 3.750% 6.1223% 2/1/26 (f)(g)(t) | | 1,661,446 | 1,528,530 |
| Alterra Mountain Co. Tranche B 1LN, term loan 1 month U.S. LIBOR + 3.500% 6.0239% 8/17/28 (f)(g)(t) | | 4,531,928 | 4,401,635 |
| Aramark Services, Inc.: | | | |
| Tranche B 3LN, term loan 1 month U.S. LIBOR + 1.750% 4.2739% 3/11/25 (f)(g)(t) | | 3,416,809 | 3,365,557 |
| Tranche B-4 1LN, term loan 1 month U.S. LIBOR + 1.750% 4.2739% 1/15/27 (f)(g)(t) | | 2,289,288 | 2,228,621 |
| Arcis Golf LLC Tranche B 1LN, term loan 1 month U.S. LIBOR + 4.250% 6.7739% 11/24/28 (c)(f)(g)(t) | | 1,775,550 | 1,748,917 |
| Aristocrat Technologies, Inc. Tranche B 1LN, term loan CME Term SOFR 1 Month Index + 2.250% 4.4044% 5/24/29 (f)(g)(t) | | 1,420,000 | 1,401,952 |
| Bally's Corp. Tranche B 1LN, term loan 1 month U.S. LIBOR + 3.250% 5.6227% 10/1/28 (f)(g)(t) | | 6,442,625 | 6,130,158 |
| BRE/Everbright M6 Borrower LLC Tranche B 1LN, term loan 1 month U.S. LIBOR + 5.000% 7.4437% 9/9/26 (f)(g)(t) | | 1,383,065 | 1,348,488 |
| Burger King Worldwide, Inc. Tranche B 1LN, term loan 1 month U.S. LIBOR + 1.750% 4.2739% 11/19/26 (f)(g)(t) | | 2,925,000 | 2,836,636 |
| Caesars Resort Collection LLC: | | | |
| Tranche B 1LN, term loan 1 month U.S. LIBOR + 3.500% 6.0239% 7/20/25 (f)(g)(t) | | 6,579,304 | 6,516,801 |
| Tranche B 1LN, term loan 3 month U.S. LIBOR + 2.750% 5.2739% 12/22/24 (f)(g)(t) | | 20,699,020 | 20,407,370 |
| Carnival Finance LLC Tranche B 1LN, term loan: | | | |
| 1 month U.S. LIBOR + 3.000% 5.8769% 6/30/25 (f)(g)(t) | | 4,356,076 | 4,141,016 |
| 1 month U.S. LIBOR + 3.250% 6.1269% 10/18/28 (f)(g)(t) | | 4,198,900 | 3,904,977 |
| City Football Group Ltd. Tranche B 1LN, term loan 1 month U.S. LIBOR + 3.500% 6.484% 7/21/28 (f)(g)(t) | | 17,740,077 | 17,000,848 |
| Dave & Buster's, Inc. Tranche B 1LN, term loan CME Term SOFR 1 Month Index + 5.000% 7.5625% 6/29/29 (f)(g)(t) | | 1,935,000 | 1,888,231 |
| Delta 2 SARL Tranche B, term loan 3 month U.S. LIBOR + 2.500% 5.0239% 2/1/24 (f)(g)(t) | | 10,275,709 | 10,177,267 |
| Equinox Holdings, Inc.: | | | |
| Tranche 2LN, term loan 3 month U.S. LIBOR + 7.000% 9.2504% 9/8/24 (f)(g)(t) | | 794,000 | 524,937 |
| Tranche B-1, term loan 3 month U.S. LIBOR + 3.000% 5.2504% 3/8/24 (f)(g)(t) | | 3,535,694 | 2,700,386 |
| Fertitta Entertainment LLC NV Tranche B 1LN, term loan CME Term SOFR 1 Month Index + 4.000% 6.4553% 1/27/29 (f)(g)(t) | | 33,615,120 | 32,253,708 |
| Flynn Restaurant Group LP Tranche B 1LN, term loan 1 month U.S. LIBOR + 4.250% 6.7739% 11/22/28 (f)(g)(t) | | 1,109,425 | 1,046,554 |
| Four Seasons Holdings, Inc. Tranche B, term loan 3 month U.S. LIBOR + 2.000% 4.5239% 11/30/23 (f)(g)(t) | | 4,721,703 | 4,702,014 |
| Golden Entertainment, Inc. Tranche B, term loan 3 month U.S. LIBOR + 3.000% 5.46% 10/20/24 (f)(g)(t) | | 7,606,505 | 7,513,781 |
| GVC Holdings Gibraltar Ltd. Tranche B4 1LN, term loan 1 month U.S. LIBOR + 2.250% 3.7427% 3/16/27 (f)(g)(t) | | 1,881,000 | 1,841,424 |
| Herschend Entertainment Co. LLC Tranche B 1LN, term loan 1 month U.S. LIBOR + 3.750% 6.31% 8/27/28 (f)(g)(t) | | 1,364,688 | 1,332,849 |
| Hilton Grand Vacations Borrower LLC Tranche B 1LN, term loan 1 month U.S. LIBOR + 3.000% 5.5239% 8/2/28 (f)(g)(t) | | 12,660,884 | 12,365,505 |
| Hilton Worldwide Finance LLC Tranche B 1LN, term loan 1 month U.S. LIBOR + 1.750% 4.1937% 6/21/26 (f)(g)(t) | | 2,928,862 | 2,861,498 |
| J&J Ventures Gaming LLC 1LN, term loan 1 month U.S. LIBOR + 4.000% 6.2504% 4/26/28 (f)(g)(t) | | 2,050,134 | 1,952,753 |
| MajorDrive Holdings IV LLC 1LN, term loan 1 month U.S. LIBOR + 4.000% 5.625% 5/12/28 (f)(g)(t) | | 3,623,400 | 3,458,535 |
| Marriott Ownership Resorts, Inc. Tranche B 1LN, term loan 1 month U.S. LIBOR + 1.750% 4.2739% 8/31/25 (f)(g)(t) | | 1,807,416 | 1,758,616 |
| Oravel Stays Singapore Pte Ltd. Tranche B 1LN, term loan 1 month U.S. LIBOR + 8.250% 10.44% 6/23/26 (f)(g)(t) | | 1,806,750 | 1,601,991 |
| Pacific Bells LLC Tranche B 1LN, term loan 1 month U.S. LIBOR + 4.500% 6.8161% 10/20/28 (f)(g)(t) | | 1,507,503 | 1,439,665 |
| PCI Gaming Authority 1LN, term loan 1 month U.S. LIBOR + 2.500% 5.0239% 5/29/26 (f)(g)(t) | | 2,297,125 | 2,244,154 |
| PFC Acquisition Corp. Tranche B 1LN, term loan 3 month U.S. LIBOR + 6.500% 9.57% 3/1/26 (f)(g)(t) | | 2,937,798 | 2,619,047 |
| Playa Resorts Holding BV Tranche B, term loan 3 month U.S. LIBOR + 2.750% 5.27% 4/27/24 (f)(g)(t) | | 280,914 | 274,745 |
| PlayPower, Inc. Tranche B 1LN, term loan 3 month U.S. LIBOR + 5.500% 7.7504% 5/10/26 (f)(g)(t) | | 673,918 | 601,472 |
| Restaurant Technologies, Inc. Tranche B 1LN, term loan CME Term SOFR 1 Month Index + 4.250% 6.3044% 4/1/29 (f)(g)(t) | | 1,566,075 | 1,528,489 |
| Ryman Hospitality Properties, Inc. Tranche B, term loan 1 month U.S. LIBOR + 2.000% 4.53% 5/11/24 (f)(g)(t) | | 559,661 | 553,129 |
| Scientific Games Corp. 1LN, term loan CME Term SOFR 1 Month Index + 3.000% 5.4074% 4/7/29 (f)(g)(t) | | 3,565,000 | 3,502,613 |
| Scientific Games Holdings LP term loan CME Term SOFR 1 Month Index + 3.500% 5.6165% 4/4/29 (f)(g)(t) | | 4,610,000 | 4,433,944 |
| SeaWorld Parks & Entertainment, Inc. Tranche B 1LN, term loan 1 month U.S. LIBOR + 3.000% 5.5625% 8/25/28 (f)(g)(t) | | 2,133,875 | 2,095,465 |
| Stars Group Holdings BV Tranche B 1LN, term loan 1 month U.S. LIBOR + 2.250% 4.5004% 7/16/26 (f)(g)(t) | | 6,464,098 | 6,305,210 |
| Station Casinos LLC Tranche B 1LN, term loan 1 month U.S. LIBOR + 2.250% 4.78% 2/7/27 (f)(g)(t) | | 6,281,672 | 6,125,949 |
| Travelport Finance Luxembourg SARL 1LN, term loan: | | | |
| 1 month U.S. LIBOR + 3.750% 11.0004% 2/28/25 (f)(g)(t) | | 3,513,022 | 3,432,890 |
| 3 month U.S. LIBOR + 6.750% 9.0004% 5/30/26 (f)(g)(t) | | 3,166,959 | 2,340,921 |
| United PF Holdings LLC: | | | |
| 1LN, term loan 1 month U.S. LIBOR + 4.000% 6.2504% 12/30/26 (f)(g)(t) | | 5,395,700 | 4,734,726 |
| 2LN, term loan 3 month U.S. LIBOR + 8.500% 10.7504% 12/30/27 (f)(g)(t) | | 500,000 | 477,500 |
| Tranche B 1LN, term loan 1 month U.S. LIBOR + 8.500% 10.7504% 12/30/26 (c)(f)(g)(t) | | 761,438 | 735,739 |
| Whatabrands LLC Tranche B 1LN, term loan 1 month U.S. LIBOR + 3.250% 5.7739% 7/21/28 (f)(g)(t) | | 7,233,650 | 6,847,084 |
| Wyndham Hotels & Resorts, Inc. Tranche B, term loan 3 month U.S. LIBOR + 1.750% 4.2739% 5/30/25 (f)(g)(t) | | 1,472,607 | 1,450,518 |
| | | | 220,560,674 |
| Household Durables - 0.0% | | | |
| Mattress Firm, Inc. Tranche B 1LN, term loan 1 month U.S. LIBOR + 4.250% 5.64% 9/24/28 (f)(g)(t) | | 2,575,538 | 2,205,948 |
| Osmosis Debt Merger Sub, Inc. Tranche B 1LN, term loan CME Term SOFR 1 Month Index + 4.000% 6.0374% 7/30/28 (f)(g)(t) | | 2,145,000 | 2,057,184 |
| Runner Buyer, Inc. Tranche B 1LN, term loan 1 month U.S. LIBOR + 5.500% 8.5696% 10/20/28 (f)(g)(t) | | 1,815,450 | 1,304,092 |
| TGP Holdings III LLC: | | | |
| Tranche B 1LN, term loan 1 month U.S. LIBOR + 3.250% 5.7739% 6/29/28 (f)(g)(t) | | 1,344,129 | 1,069,348 |
| Tranche DD 1LN, term loan 1 month U.S. LIBOR + 3.250% 3.881% 6/29/28 (f)(g)(t)(u) | | 177,232 | 141,001 |
| Weber-Stephen Products LLC Tranche B 1LN, term loan 1 month U.S. LIBOR + 3.250% 5.7739% 10/30/27 (f)(g)(t) | | 2,188,129 | 1,852,885 |
| | | | 8,630,458 |
| Internet & Direct Marketing Retail - 0.3% | | | |
| Bass Pro Group LLC Tranche B 1LN, term loan 1 month U.S. LIBOR + 3.750% 6.1223% 3/5/28 (f)(g)(t) | | 61,999,033 | 59,891,066 |
| CNT Holdings I Corp. Tranche B 1LN, term loan 1 month U.S. LIBOR + 3.500% 5.812% 11/8/27 (f)(g)(t) | | 3,619,188 | 3,531,929 |
| Harbor Freight Tools U.S.A., Inc. Tranche B 1LN, term loan 1 month U.S. LIBOR + 2.750% 5.2739% 10/19/27 (f)(g)(t) | | 8,351,250 | 7,960,662 |
| Red Ventures LLC Tranche B 1LN, term loan 1 month U.S. LIBOR + 2.500% 4.8723% 11/8/24 (f)(g)(t) | | 2,891,429 | 2,831,807 |
| Terrier Media Buyer, Inc. Tranche B 1LN, term loan 1 month U.S. LIBOR + 3.500% 5.8723% 12/17/26 (f)(g)(t) | | 14,042,259 | 13,603,438 |
| Uber Technologies, Inc. Tranche B 1LN, term loan: | | | |
| 1 month U.S. LIBOR + 3.500% 6.5696% 4/4/25 (f)(g)(t) | | 5,021,538 | 4,980,312 |
| 1 month U.S. LIBOR + 3.500% 6.5696% 2/25/27 (f)(g)(t) | | 6,507,135 | 6,409,528 |
| | | | 99,208,742 |
| Leisure Products - 0.1% | | | |
| Callaway Golf Co. Tranche B, term loan 3 month U.S. LIBOR + 4.500% 7.0239% 1/4/26 (f)(g)(t) | | 3,295,687 | 3,284,712 |
| Hayward Industries, Inc. Tranche B 1LN, term loan 1 month U.S. LIBOR + 2.500% 5.0239% 5/28/28 (f)(g)(t) | | 2,598,750 | 2,509,093 |
| Lids Holdings, Inc. 1LN, term loan CME Term SOFR 1 Month Index + 5.500% 7.326% 12/14/26 (c)(f)(g)(t) | | 2,929,688 | 2,871,094 |
| SP PF Buyer LLC Tranche B 1LN, term loan 3 month U.S. LIBOR + 4.500% 7.0239% 12/21/25 (f)(g)(t) | | 2,480,753 | 2,080,037 |
| SRAM LLC. Tranche B 1LN, term loan 1 month U.S. LIBOR + 2.750% 5.37% 5/12/28 (f)(g)(t) | | 3,218,182 | 3,137,727 |
| | | | 13,882,663 |
| Multiline Retail - 0.0% | | | |
| Franchise Group, Inc. Tranche B 1LN, term loan 3 month U.S. LIBOR + 4.750% 6.5% 3/10/26 (f)(g)(t) | | 4,071,434 | 3,945,912 |
| Specialty Retail - 0.2% | | | |
| Academy Ltd. Tranche B 1LN, term loan 1 month U.S. LIBOR + 3.750% 6.1231% 11/6/27 (f)(g)(t) | | 4,263,905 | 4,175,088 |
| Adient U.S. LLC Tranche B 1LN, term loan 1 month U.S. LIBOR + 3.250% 5.7739% 4/8/28 (f)(g)(t) | | 1,262,250 | 1,234,645 |
| Ambience Merger Sub, Inc. Tranche B 1LN, term loan 1 month U.S. LIBOR + 4.000% 6.2771% 7/24/28 (f)(g)(t) | | 1,786,500 | 1,418,588 |
| Driven Holdings LLC Tranche B 1LN, term loan 1 month U.S. LIBOR + 3.000% 3.5169% 11/17/28 (c)(f)(g)(t) | | 897,750 | 870,818 |
| Empire Today LLC Tranche B 1LN, term loan 1 month U.S. LIBOR + 5.000% 7.3727% 4/1/28 (f)(g)(t) | | 1,485,000 | 1,195,425 |
| Jo-Ann Stores LLC Tranche B 1LN, term loan 1 month U.S. LIBOR + 4.750% 7.5163% 7/7/28 (f)(g)(t) | | 2,324,634 | 1,503,271 |
| LBM Acquisition LLC Tranche B 1LN, term loan 1 month U.S. LIBOR + 3.750% 7.1207% 12/18/27 (f)(g)(t) | | 10,601,195 | 9,649,738 |
| Michaels Companies, Inc. 1LN, term loan 1 month U.S. LIBOR + 4.250% 6.5004% 4/15/28 (f)(g)(t) | | 5,414,653 | 4,472,179 |
| New Sk Holdco Sub LLC 1LN, term loan CME Term SOFR 1 Month Index + 6.750% 12.1574% 6/30/27 (f)(g)(t) | | 1,667,508 | 1,529,939 |
| Petco Health & Wellness Co., Inc. Tranche B 1LN, term loan 1 month U.S. LIBOR + 3.250% 5.5004% 3/4/28 (f)(g)(t) | | 2,113,250 | 2,045,901 |
| RH: | | | |
| Tranche B 1LN, term loan 1 month U.S. LIBOR + 2.500% 5.0239% 10/20/28 (f)(g)(t) | | 3,309,988 | 3,041,879 |
| Tranche B2 1LN, term loan CME Term SOFR 1 Month Index + 3.250% 5.8053% 10/20/28 (f)(g)(t) | | 7,985,000 | 7,382,771 |
| RVR Dealership Holdings LLC Tranche B 1LN, term loan 1 month U.S. LIBOR + 4.000% 6.147% 2/8/28 (f)(g)(t) | | 1,325,000 | 1,228,938 |
| Tory Burch LLC Tranche B 1LN, term loan 1 month U.S. LIBOR + 3.000% 5.5239% 4/14/28 (f)(g)(t) | | 3,141,180 | 2,947,464 |
| Victoria's Secret & Co. Tranche B 1LN, term loan 1 month U.S. LIBOR + 3.250% 5.6169% 8/2/28 (f)(g)(t) | | 1,905,600 | 1,838,904 |
| Woof Holdings LLC Tranche B 1LN, term loan 1 month U.S. LIBOR + 3.750% 5.8134% 12/21/27 (f)(g)(t) | | 2,756,521 | 2,673,826 |
| | | | 47,209,374 |
| Textiles, Apparel & Luxury Goods - 0.1% | | | |
| Birkenstock GmbH & Co. KG Tranche B 1LN, term loan 1 month U.S. LIBOR + 3.250% 5.0981% 4/28/28 (f)(g)(t) | | 1,089,584 | 1,050,087 |
| Canada Goose, Inc. Tranche B 1LN, term loan 1 month U.S. LIBOR + 3.500% 5.7504% 10/7/27 (f)(g)(t) | | 1,467,697 | 1,436,053 |
| Crocs, Inc. Tranche B1 LN, term loan CME Term SOFR 1 Month Index + 3.500% 4.4495% 2/17/29 (f)(g)(t) | | 11,928,863 | 11,466,619 |
| Samsonite IP Holdings SARL Tranche B2 1LN, term loan 1 month U.S. LIBOR + 3.000% 5.5239% 4/25/25 (f)(g)(t) | | 2,186,711 | 2,138,297 |
| | | | 16,091,056 |
|
| TOTAL CONSUMER DISCRETIONARY | | | 492,873,033 |
|
| CONSUMER STAPLES - 0.2% | | | |
| Beverages - 0.0% | | | |
| Bengal Debt Merger Sub LLC: | | | |
| 1LN, term loan CME TERM SOFR 3 MONTH INDEX + 3.250% 5.4051% 1/24/29 (f)(g)(t) | | 4,175,000 | 3,996,060 |
| 2LN, term loan CME Term SOFR 1 Month Index + 6.000% 8.1544% 1/24/30 (f)(g)(t) | | 1,370,000 | 1,251,262 |
| Triton Water Holdings, Inc. Tranche B 1LN, term loan 1 month U.S. LIBOR + 3.500% 5.7504% 3/31/28 (f)(g)(t) | | 7,896,154 | 7,369,086 |
| | | | 12,616,408 |
| Food & Staples Retailing - 0.1% | | | |
| 8th Avenue Food & Provisions, Inc.: | | | |
| 2LN, term loan 3 month U.S. LIBOR + 7.750% 10.2739% 10/1/26 (f)(g)(t) | | 172,000 | 142,416 |
| Tranche B 1LN, term loan 3 month U.S. LIBOR + 3.750% 6.2739% 10/1/25 (f)(g)(t) | | 488,290 | 428,474 |
| BJ's Wholesale Club, Inc. Tranche B 1LN, term loan 3 month U.S. LIBOR + 2.000% 4.391% 2/3/24 (f)(g)(t) | | 2,023,030 | 2,019,752 |
| Cardenas Merger Sub LLC 1LN, term loan CME Term SOFR 1 Month Index + 6.750% 9.7949% 7/20/29 (f)(g)(t) | | 1,645,000 | 1,588,461 |
| Froneri U.S., Inc. Tranche B 1LN, term loan 1 month U.S. LIBOR + 2.250% 4.7739% 1/29/27 (f)(g)(t) | | 2,969,245 | 2,856,651 |
| GOBP Holdings, Inc. Tranche B 1LN, term loan 1 month U.S. LIBOR + 2.750% 5.2739% 10/22/25 (f)(g)(t) | | 1,249,355 | 1,234,912 |
| JP Intermediate B LLC Tranche B, term loan 3 month U.S. LIBOR + 5.500% 8.3059% 11/20/25 (f)(g)(t) | | 4,424,203 | 3,548,830 |
| Shearer's Foods, Inc. Tranche B 1LN, term loan 1 month U.S. LIBOR + 3.500% 5.8723% 9/23/27 (f)(g)(t) | | 3,904,754 | 3,769,923 |
| U.S. Foods, Inc. 1LN, term loan 3 month U.S. LIBOR + 2.000% 4.5239% 9/13/26 (f)(g)(t) | | 2,917,500 | 2,839,924 |
| | | | 18,429,343 |
| Food Products - 0.1% | | | |
| Chobani LLC Tranche B 1LN, term loan 1 month U.S. LIBOR + 3.500% 6.0239% 10/23/27 (f)(g)(t) | | 4,332,825 | 4,151,410 |
| Del Monte Foods, Inc. Tranche B 1LN, term loan CME Term SOFR 1 Month Index + 4.250% 6.647% 5/16/29 (f)(g)(t) | | 5,110,000 | 4,915,207 |
| JBS U.S.A. Lux SA Tranche B 1LN, term loan 1 month U.S. LIBOR + 2.000% 5.0696% 5/1/26 (f)(g)(t) | | 5,169,343 | 5,145,822 |
| | | | 14,212,439 |
| Household Products - 0.0% | | | |
| Diamond BC BV Tranche B 1LN, term loan 1 month U.S. LIBOR + 2.750% 5.56% 9/29/28 (f)(g)(t) | | 3,004,900 | 2,890,954 |
| Energizer Holdings, Inc. Tranche B 1LN, term loan 1 month U.S. LIBOR + 2.250% 4.625% 12/16/27 (f)(g)(t) | | 2,329,525 | 2,277,111 |
| Kronos Acquisition Holdings, Inc. Tranche B 1LN, term loan 1 month U.S. LIBOR + 3.750% 6.8196% 12/22/26 (f)(g)(t) | | 4,318,759 | 4,155,725 |
| | | | 9,323,790 |
| Personal Products - 0.0% | | | |
| Conair Holdings LLC Tranche B 1LN, term loan 1 month U.S. LIBOR + 3.750% 6.0004% 5/17/28 (f)(g)(t) | | 3,811,200 | 3,277,632 |
| Knowlton Development Corp., Inc. Tranche B 1LN, term loan 1 month U.S. LIBOR + 3.750% 6.2739% 12/21/25 (f)(g)(t) | | 1,870,767 | 1,777,229 |
| | | | 5,054,861 |
|
| TOTAL CONSUMER STAPLES | | | 59,636,841 |
|
| ENERGY - 0.2% | | | |
| Energy Equipment & Services - 0.0% | | | |
| Brazos Delaware II LLC Tranche B, term loan 3 month U.S. LIBOR + 4.000% 6.3681% 5/21/25 (f)(g)(t) | | 1,063,315 | 1,051,884 |
| Oil, Gas & Consumable Fuels - 0.2% | | | |
| Apro LLC Tranche B 1LN, term loan 1 month U.S. LIBOR + 3.750% 5.376% 11/14/26 (f)(g)(t) | | 3,426,893 | 3,324,086 |
| BCP Renaissance Parent LLC Tranche B3 1LN, term loan U.S. Secured Overnight Fin. Rate (SOFR) Index + 3.500% 5.57% 10/31/26 (f)(g)(t) | | 1,887,781 | 1,854,744 |
| BW Gas & Convenience Holdings LLC Tranche B 1LN, term loan 1 month U.S. LIBOR + 3.500% 6.0239% 3/17/28 (c)(f)(g)(t) | | 1,782,000 | 1,710,720 |
| Citgo Holding, Inc. Tranche B 1LN, term loan 1 month U.S. LIBOR + 7.000% 9.5239% 8/1/23 (f)(g)(t) | | 1,370,759 | 1,367,757 |
| Citgo Petroleum Corp. Tranche B 1LN, term loan 1 month U.S. LIBOR + 6.250% 8.7739% 3/28/24 (f)(g)(t) | | 5,935,078 | 5,923,980 |
| CQP Holdco LP / BIP-V Chinook Holdco LLC Tranche B 1LN, term loan 1 month U.S. LIBOR + 3.750% 6.0004% 6/4/28 (f)(g)(t) | | 15,377,156 | 15,058,080 |
| Delek U.S. Holdings, Inc. Tranche B 1LN, term loan 3 month U.S. LIBOR + 2.250% 4.7739% 3/30/25 (f)(g)(t) | | 2,196,090 | 2,139,629 |
| EG America LLC Tranche B 1LN, term loan 3 month U.S. LIBOR + 4.000% 6.2504% 2/6/25 (f)(g)(t) | | 9,832,306 | 9,586,499 |
| EG Finco Ltd. Tranche B, term loan 3 month U.S. LIBOR + 4.000% 6.2504% 2/6/25 (f)(g)(t) | | 4,022,398 | 3,921,838 |
| Epic Crude Services LP Tranche B 1LN, term loan 3 month U.S. LIBOR + 5.000% 7.08% 3/1/26 (f)(g)(t) | | 2,005,738 | 1,699,361 |
| GIP II Blue Holding LP Tranche B 1LN, term loan 1 month U.S. LIBOR + 4.500% 6.7504% 9/29/28 (f)(g)(t) | | 5,779,138 | 5,714,122 |
| GIP III Stetson I LP Tranche B, term loan 3 month U.S. LIBOR + 4.250% 6.7739% 7/18/25 (f)(g)(t) | | 4,780,312 | 4,567,205 |
| ITT Holdings LLC Tranche B 1LN, term loan 1 month U.S. LIBOR + 2.750% 5.2739% 7/30/28 (f)(g)(t) | | 1,488,750 | 1,436,644 |
| Limetree Bay Terminals LLC Tranche B 1LN, term loan 3 month U.S. LIBOR + 4.000% 7.0544% 2/15/24 (f)(g)(t) | | 4,649,071 | 3,112,925 |
| Mesquite Energy, Inc.: | | | |
| 1LN, term loan 3 month U.S. LIBOR + 8.000% 0% (c)(e)(g)(t) | | 2,102,309 | 0 |
| term loan 3 month U.S. LIBOR + 0.000% 0% (c)(e)(g)(t) | | 907,000 | 0 |
| WaterBridge Operating LLC Tranche B 1LN, term loan 3 month U.S. LIBOR + 5.750% 9.1274% 6/21/26 (f)(g)(t) | | 1,701,875 | 1,667,225 |
| | | | 63,084,815 |
|
| TOTAL ENERGY | | | 64,136,699 |
|
| FINANCIALS - 0.6% | | | |
| Capital Markets - 0.1% | | | |
| AssuredPartners, Inc. Tranche B 1LN, term loan: | | | |
| 1 month U.S. LIBOR + 3.500% 6.0239% 2/13/27 (f)(g)(t) | | 1,964,625 | 1,908,633 |
| 1 month U.S. LIBOR + 3.500% 6.0239% 2/13/27 (f)(g)(t) | | 1,872,152 | 1,816,568 |
| Broadstreet Partners, Inc. Tranche B 1LN, term loan 1 month U.S. LIBOR + 3.250% 5.7739% 1/27/27 (f)(g)(t) | | 1,300,175 | 1,259,545 |
| Citadel Securities LP Tranche B 1LN, term loan: | | | |
| 1 month U.S. LIBOR + 2.500% 5.0698% 2/27/28 (f)(g)(t) | | 5,594,188 | 5,464,850 |
| CME Term SOFR 1 Month Index + 3.000% 2/2/28 (g)(t)(v) | | 1,110,000 | 1,088,721 |
| Cypress Intermediate Holdings, Inc. Tranche B 1LN, term loan 3 month U.S. LIBOR + 2.250% 4.5004% 9/21/28 (f)(g)(t) | | 1,492,500 | 1,460,158 |
| Deerfield Dakota Holding LLC Tranche B 1LN, term loan CME Term SOFR 1 Month Index + 3.750% 6.2053% 4/9/27 (f)(g)(t) | | 2,480,197 | 2,413,554 |
| Franklin Square Holdings LP Tranche B, term loan 3 month U.S. LIBOR + 2.250% 4.8125% 8/3/25 (c)(f)(g)(t) | | 1,871,250 | 1,838,503 |
| Hightower Holding LLC Tranche B 1LN, term loan 1 month U.S. LIBOR + 4.000% 6.7317% 4/21/28 (f)(g)(t) | | 1,985,000 | 1,922,969 |
| Superannuation & Investments U.S. LLC 1LN, term loan 1 month U.S. LIBOR + 3.750% 6.1223% 12/1/28 (f)(g)(t) | | 1,308,425 | 1,282,257 |
| | | | 20,455,758 |
| Diversified Financial Services - 0.2% | | | |
| ACNR Holdings, Inc. term loan 18.4437% 9/16/25 (c)(f)(t) | | 408,181 | 409,201 |
| Agellan Portfolio 9% 8/7/25 (c)(f)(t) | | 424,000 | 424,000 |
| Finco I LLC Tranche B 1LN, term loan 1 month U.S. LIBOR + 2.500% 5.0239% 6/27/25 (f)(g)(t) | | 1,411,582 | 1,395,264 |
| Focus Financial Partners LLC Tranche B3 1LN, term loan 1 month U.S. LIBOR + 2.000% 4.5239% 7/3/24 (f)(g)(t) | | 4,344,416 | 4,277,425 |
| GT Polaris, Inc. Tranche B 1LN, term loan 1 month U.S. LIBOR + 3.750% 6.5559% 9/24/27 (f)(g)(t) | | 3,181,651 | 3,062,339 |
| KREF Holdings X LLC Tranche B 1LN, term loan 1 month U.S. LIBOR + 3.500% 5.9375% 9/1/27 (c)(f)(g)(t) | | 2,192,333 | 2,137,525 |
| LHS Borrower LLC Tranche B 1LN, term loan CME Term SOFR 1 Month Index + 4.750% 7.3053% 2/18/29 (f)(g)(t) | | 3,990,000 | 3,586,013 |
| Mhp 2022-Mhil Mezz U.S. Secured Overnight Fin. Rate (SOFR) Index + 5.000% 7.3074% 1/9/24 (c)(f)(g)(t) | | 6,607,220 | 6,409,003 |
| Nexus Buyer LLC: | | | |
| 2LN, term loan 1 month U.S. LIBOR + 6.250% 8.6301% 11/5/29 (f)(g)(t) | | 1,555,000 | 1,468,184 |
| Tranche B 1LN, term loan 1 month U.S. LIBOR + 3.750% 6.1223% 11/8/26 (f)(g)(t) | | 1,310,000 | 1,270,150 |
| Recess Holdings, Inc. Tranche B, term loan 3 month U.S. LIBOR + 3.750% 6.5511% 9/29/24 (f)(g)(t) | | 754,746 | 734,617 |
| Sunbelt Mezz U.S. Secured Overnight Fin. Rate (SOFR) Index + 4.450% 6.8719% 1/21/27 (c)(f)(g)(t) | | 4,040,817 | 4,040,817 |
| TransUnion LLC: | | | |
| Tranche B5 1LN, term loan 1 month U.S. LIBOR + 1.750% 4.2739% 11/16/26 (f)(g)(t) | | 2,898,361 | 2,833,148 |
| Tranche B6 1LN, term loan 1 month U.S. LIBOR + 2.250% 4.7739% 12/1/28 (f)(g)(t) | | 2,635,059 | 2,582,832 |
| UFC Holdings LLC Tranche B 1LN, term loan 1 month U.S. LIBOR + 2.750% 5.52% 4/29/26 (f)(g)(t) | | 2,857,724 | 2,771,992 |
| Veritas Multifamily Portfolio 1 month U.S. LIBOR + 8.500% 10.891% 11/15/22 (c)(f)(g)(t) | | 5,457,455 | 5,386,508 |
| WH Borrower LLC Tranche B 1LN, term loan CME Term SOFR 1 Month Index + 5.500% 7.7967% 2/9/27 (f)(g)(t) | | 3,690,000 | 3,533,175 |
| | | | 46,322,193 |
| Insurance - 0.3% | | | |
| Acrisure LLC Tranche B 1LN, term loan: | | | |
| 1 month U.S. LIBOR + 3.500% 6.0239% 2/13/27 (f)(g)(t) | | 10,388,993 | 9,932,293 |
| 1 month U.S. LIBOR + 4.250% 6.6223% 2/15/27 (f)(g)(t) | | 3,212,242 | 3,113,208 |
| Alliant Holdings Intermediate LLC: | | | |
| Tranche B, term loan 1 month U.S. LIBOR + 3.250% 5.7739% 5/10/25 (f)(g)(t) | | 3,303,707 | 3,234,527 |
| Tranche B-2 1LN, term loan 1 month U.S. LIBOR + 3.250% 5.7739% 5/9/25 (f)(g)(t) | | 970,000 | 948,582 |
| Tranche B3 1LN, term loan 1 month U.S. LIBOR + 3.500% 5.877% 11/12/27 (f)(g)(t) | | 6,699,375 | 6,511,793 |
| AmWINS Group, Inc. Tranche B 1LN, term loan 1 month U.S. LIBOR + 2.250% 4.7739% 2/19/28 (f)(g)(t) | | 5,567,485 | 5,429,579 |
| Asurion LLC: | | | |
| 1LN, term loan CME Term SOFR 1 Month Index + 4.000% 6.4011% 8/16/28 (f)(g)(t) | | 4,611,470 | 4,296,368 |
| Tranche B 7LN, term loan 1 month U.S. LIBOR + 3.000% 5.5239% 11/3/24 (f)(g)(t) | | 4,636,167 | 4,451,555 |
| Tranche B3 2LN, term loan 1 month U.S. LIBOR + 5.250% 7.7739% 1/31/28 (f)(g)(t) | | 10,925,000 | 9,340,875 |
| Tranche B4 2LN, term loan 1 month U.S. LIBOR + 5.250% 7.7739% 1/20/29 (f)(g)(t) | | 3,760,000 | 3,191,300 |
| Tranche B8 1LN, term loan 1 month U.S. LIBOR + 3.250% 5.7739% 12/23/26 (f)(g)(t) | | 14,262,576 | 13,040,131 |
| Tranche B9 1LN, term loan 1 month U.S. LIBOR + 3.250% 5.7739% 7/31/27 (f)(g)(t) | | 3,885,813 | 3,549,029 |
| HUB International Ltd.: | | | |
| Tranche B 1LN, term loan 1 month U.S. LIBOR + 3.250% 5.98% 4/25/25 (f)(g)(t) | | 2,569,520 | 2,527,509 |
| Tranche B, term loan 1 month U.S. LIBOR + 3.000% 5.77% 4/25/25 (f)(g)(t) | | 19,289,484 | 18,863,572 |
| Ryan Specialty Group LLC Tranche B 1LN, term loan 1 month U.S. LIBOR + 3.000% 5.5553% 9/1/27 (f)(g)(t) | | 3,854,717 | 3,796,896 |
| USI, Inc.: | | | |
| 1LN, term loan 1 month U.S. LIBOR + 3.250% 5.5004% 12/2/26 (f)(g)(t) | | 121,878 | 119,974 |
| Tranche B, term loan 3 month U.S. LIBOR + 3.000% 5.2504% 5/16/24 (f)(g)(t) | | 7,795,804 | 7,696,719 |
| | | | 100,043,910 |
| Thrifts & Mortgage Finance - 0.0% | | | |
| Walker & Dunlop, Inc. Tranche B 1LN, term loan CME Term SOFR 1 Month Index + 2.250% 4.8053% 12/16/28 (c)(f)(g)(t) | | 1,313,400 | 1,293,699 |
|
| TOTAL FINANCIALS | | | 168,115,560 |
|
| HEALTH CARE - 0.6% | | | |
| Health Care Equipment & Supplies - 0.1% | | | |
| Avantor Funding, Inc. Tranche B5 1LN, term loan 1 month U.S. LIBOR + 2.250% 4.7739% 11/6/27 (f)(g)(t) | | 6,174,225 | 6,064,262 |
| Embecta Corp. Tranche B 1LN, term loan CME TERM SOFR 3 MONTH INDEX + 3.000% 5.0544% 3/31/29 (f)(g)(t) | | 1,306,725 | 1,275,141 |
| ICU Medical, Inc. Tranche B 1LN, term loan CME Term SOFR 1 Month Index + 2.500% 4.4544% 1/6/29 (f)(g)(t) | | 2,369,063 | 2,312,205 |
| Insulet Corp. Tranche B 1LN, term loan 1 month U.S. LIBOR + 3.250% 5.7739% 5/4/28 (f)(g)(t) | | 5,056,656 | 4,930,239 |
| Maravai Intermediate Holdings LLC Tranche B 1LN, term loan CME Term SOFR 1 Month Index + 3.000% 5.5532% 10/19/27 (f)(g)(t) | | 4,821,719 | 4,746,404 |
| Mozart Borrower LP Tranche B 1LN, term loan 1 month U.S. LIBOR + 3.250% 5.7739% 10/23/28 (f)(g)(t) | | 5,251,838 | 5,001,430 |
| Packaging Coordinators Midco, Inc. Tranche B 1LN, term loan 3 month U.S. LIBOR + 3.750% 6.0004% 11/30/27 (f)(g)(t) | | 2,241,625 | 2,179,285 |
| Pathway Vet Alliance LLC Tranche B 1LN, term loan 1 month U.S. LIBOR + 3.750% 6.0004% 3/31/27 (f)(g)(t) | | 3,586,955 | 3,377,118 |
| | | | 29,886,084 |
| Health Care Providers & Services - 0.3% | | | |
| Accelerated Health Systems LLC Tranche B1 LN, term loan CME Term SOFR 1 Month Index + 4.250% 7.1117% 2/2/29 (f)(g)(t) | | 1,300,000 | 1,224,171 |
| AHP Health Partners, Inc. Tranche B 1LN, term loan 1 month U.S. LIBOR + 3.500% 6.0239% 8/23/28 (f)(g)(t) | | 2,303,750 | 2,212,314 |
| Charlotte Buyer, Inc. Tranche B 1LN, term loan CME Term SOFR 1 Month Index + 5.250% 7.9803% 2/12/28 (f)(g)(t) | | 1,485,000 | 1,421,888 |
| Da Vinci Purchaser Corp. Tranche B 1LN, term loan 1 month U.S. LIBOR + 4.000% 6.35% 12/13/26 (f)(g)(t) | | 6,516,666 | 6,353,750 |
| Electron BidCo, Inc. Tranche B 1LN, term loan 1 month U.S. LIBOR + 3.000% 5.5239% 11/1/28 (f)(g)(t) | | 2,398,988 | 2,335,270 |
| Gainwell Acquisition Corp. Tranche B 1LN, term loan 1 month U.S. LIBOR + 4.000% 6.2504% 10/1/27 (f)(g)(t) | | 24,745,644 | 24,142,593 |
| HAH Group Holding Co. LLC: | | | |
| 1LN, term loan 1 month U.S. LIBOR + 5.000% 7.21% 10/29/27 (f)(g)(t) | | 1,099,622 | 1,039,143 |
| Tranche DD 1LN, term loan 1 month U.S. LIBOR + 5.000% 7.21% 10/29/27 (f)(g)(t) | | 139,139 | 131,486 |
| Horizon Pharma U.S.A., Inc. Tranche B 1LN, term loan 1 month U.S. LIBOR + 1.750% 4.3125% 3/15/28 (f)(g)(t) | | 2,686,000 | 2,614,042 |
| Icon Luxembourg Sarl Tranche B 1LN, term loan 1 month U.S. LIBOR + 2.250% 4.5625% 7/3/28 (f)(g)(t) | | 9,417,401 | 9,259,660 |
| Mamba Purchaser, Inc. Tranche B 1LN, term loan 1 month U.S. LIBOR + 3.500% 5.8681% 10/14/28 (f)(g)(t) | | 1,461,338 | 1,424,804 |
| MED ParentCo LP: | | | |
| 1LN, term loan 1 month U.S. LIBOR + 4.250% 6.6223% 8/31/26 (f)(g)(t) | | 2,721,904 | 2,407,198 |
| 2LN, term loan 1 month U.S. LIBOR + 8.250% 10.7739% 8/30/27 (f)(g)(t) | | 810,000 | 716,850 |
| National Mentor Holdings, Inc. Tranche B 1LN, term loan 1 month U.S. LIBOR + 3.750% 6.13% 3/2/28 (f)(g)(t) | | 1,146,442 | 968,743 |
| Phoenix Newco, Inc. Tranche B 1LN, term loan 1 month U.S. LIBOR + 3.250% 5.7739% 11/15/28 (f)(g)(t) | | 8,124,638 | 7,901,210 |
| Pluto Acquisition I, Inc. term loan 1 month U.S. LIBOR + 4.000% 6.0757% 6/20/26 (f)(g)(t) | | 2,871,000 | 2,461,883 |
| Surgery Center Holdings, Inc. 1LN, term loan 1 month U.S. LIBOR + 3.750% 6.14% 8/31/26 (f)(g)(t) | | 3,372,899 | 3,268,103 |
| U.S. Anesthesia Partners, Inc.: | | | |
| 2LN, term loan 1 month U.S. LIBOR + 7.500% 9.8731% 10/1/29 (f)(g)(t) | | 565,000 | 533,925 |
| Tranche B 1LN, term loan 1 month U.S. LIBOR + 4.250% 6.6231% 10/1/28 (f)(g)(t) | | 4,486,100 | 4,295,889 |
| Upstream Newco, Inc. 1LN, term loan 1 month U.S. LIBOR + 4.250% 6.8198% 11/20/26 (f)(g)(t) | | 3,558,741 | 3,377,850 |
| | | | 78,090,772 |
| Health Care Technology - 0.1% | | | |
| Athenahealth Group, Inc.: | | | |
| Tranche B 1LN, term loan CME Term SOFR 1 Month Index + 3.500% 5.7998% 2/15/29 (f)(g)(t) | | 28,456,812 | 27,176,255 |
| Tranche DD 1LN, term loan CME Term SOFR 1 Month Index + 3.500% 2/15/29 (g)(t)(u) | | 4,823,188 | 4,606,145 |
| Emerald TopCo, Inc. 1LN, term loan 1 month U.S. LIBOR + 3.500% 6.0239% 7/25/26 (f)(g)(t) | | 795,774 | 761,158 |
| Imprivata, Inc. Tranche B 1LN, term loan 1 month U.S. LIBOR + 3.750% 6.2739% 12/1/27 (f)(g)(t) | | 3,002,000 | 2,919,925 |
| PointClickCare Technologies, Inc. Tranche B 1LN, term loan 1 month U.S. LIBOR + 3.000% 5.9375% 12/29/27 (f)(g)(t) | | 1,496,063 | 1,458,661 |
| Virgin Pulse, Inc. Tranche B 1LN, term loan 1 month U.S. LIBOR + 4.000% 6.5239% 4/6/28 (f)(g)(t) | | 2,931,613 | 2,576,154 |
| Zelis Payments Buyer, Inc. Tranche B 1LN, term loan 1 month U.S. LIBOR + 3.500% 5.8731% 9/30/26 (f)(g)(t) | | 4,938,659 | 4,816,723 |
| | | | 44,315,021 |
| Life Sciences Tools & Services - 0.0% | | | |
| PRA Health Sciences, Inc. Tranche B 1LN, term loan 1 month U.S. LIBOR + 2.250% 4.5625% 7/3/28 (f)(g)(t) | | 2,346,351 | 2,307,050 |
| Pharmaceuticals - 0.1% | | | |
| Elanco Animal Health, Inc. Tranche B 1LN, term loan 1 month U.S. LIBOR + 1.750% 4.1231% 8/1/27 (f)(g)(t) | | 9,081,119 | 8,756,197 |
| Jazz Financing Lux SARL Tranche B 1LN, term loan 1 month U.S. LIBOR + 3.500% 6.0239% 5/5/28 (f)(g)(t) | | 9,839,528 | 9,639,195 |
| Organon & Co. Tranche B 1LN, term loan 1 month U.S. LIBOR + 3.000% 4.625% 6/2/28 (f)(g)(t) | | 7,981,896 | 7,882,122 |
| Perrigo Investments LLC Tranche B 1LN, term loan CME Term SOFR 1 Month Index + 2.500% 4.9074% 4/20/29 (c)(f)(g)(t) | | 1,735,000 | 1,717,650 |
| PetIQ, Inc. Tranche B 1LN, term loan 1 month U.S. LIBOR + 4.250% 6.641% 4/13/28 (c)(f)(g)(t) | | 1,980,000 | 1,782,000 |
| | | | 29,777,164 |
|
| TOTAL HEALTH CARE | | | 184,376,091 |
|
| INDUSTRIALS - 1.0% | | | |
| Aerospace & Defense - 0.1% | | | |
| Gemini HDPE LLC Tranche B 1LN, term loan 1 month U.S. LIBOR + 3.000% 5.81% 12/31/27 (f)(g)(t) | | 1,943,638 | 1,905,737 |
| Maxar Technologies, Inc. Tranche B 1LN, term loan CME Term SOFR 1 Month Index + 4.250% 6.8053% 6/9/29 (f)(g)(t) | | 2,320,000 | 2,223,720 |
| TransDigm, Inc.: | | | |
| Tranche E 1LN, term loan 1 month U.S. LIBOR + 2.250% 4.7739% 5/30/25 (f)(g)(t) | | 4,684,943 | 4,568,288 |
| Tranche F 1LN, term loan 1 month U.S. LIBOR + 2.250% 4.6223% 12/9/25 (f)(g)(t) | | 12,889,194 | 12,536,417 |
| Tranche G 1LN, term loan 1 month U.S. LIBOR + 2.250% 4.6223% 8/22/24 (f)(g)(t) | | 2,422,349 | 2,374,726 |
| WP CPP Holdings LLC Tranche B 2LN, term loan 3 month U.S. LIBOR + 7.750% 10.56% 4/30/26 (f)(g)(t) | | 319,000 | 262,113 |
| | | | 23,871,001 |
| Air Freight & Logistics - 0.0% | | | |
| Dynasty Acquisition Co., Inc.: | | | |
| Tranche B 1LN, term loan 1 month U.S. LIBOR + 3.500% 6.0239% 4/8/26 (f)(g)(t) | | 2,004,656 | 1,928,980 |
| Tranche B2 1LN, term loan 1 month U.S. LIBOR + 3.500% 6.0239% 4/4/26 (f)(g)(t) | | 1,077,772 | 1,037,086 |
| Echo Global Logistics, Inc. 1LN, term loan 1 month U.S. LIBOR + 3.500% 6.0239% 11/23/28 (f)(g)(t) | | 1,805,475 | 1,698,049 |
| Hanjin International Corp. 1LN, term loan 1 month U.S. LIBOR + 5.000% 7.16% 12/23/22 (c)(f)(g)(t) | | 3,755,000 | 3,642,350 |
| STG Logistics, Inc. 1LN, term loan CME Term SOFR 1 Month Index + 6.000% 8.23% 3/24/28 (f)(g)(t) | | 1,860,338 | 1,790,575 |
| | | | 10,097,040 |
| Airlines - 0.1% | | | |
| AAdvantage Loyalty IP Ltd. Tranche B 1LN, term loan 1 month U.S. LIBOR + 4.750% 7.4599% 4/20/28 (f)(g)(t) | | 6,440,000 | 6,330,005 |
| Air Canada Tranche B 1LN, term loan 1 month U.S. LIBOR + 3.500% 6.421% 8/11/28 (f)(g)(t) | | 2,750,000 | 2,654,245 |
| Mileage Plus Holdings LLC Tranche B 1LN, term loan 1 month U.S. LIBOR + 5.250% 7.3134% 7/2/27 (f)(g)(t) | | 5,495,000 | 5,573,139 |
| SkyMiles IP Ltd. Tranche B 1LN, term loan 3 month U.S. LIBOR + 3.750% 6.4599% 10/20/27 (f)(g)(t) | | 5,040,000 | 5,100,278 |
| United Airlines, Inc. Tranche B 1LN, term loan 1 month U.S. LIBOR + 3.750% 6.533% 4/21/28 (f)(g)(t) | | 9,356,563 | 9,081,105 |
| WestJet Airlines Ltd. 1LN, term loan 3 month U.S. LIBOR + 3.000% 5.0296% 12/11/26 (f)(g)(t) | | 1,102,489 | 1,005,823 |
| | | | 29,744,595 |
| Building Products - 0.1% | | | |
| Acproducts Holdings, Inc. Tranche B 1LN, term loan 1 month U.S. LIBOR + 4.250% 6.97% 5/17/28 (f)(g)(t) | | 6,571,106 | 5,365,308 |
| APi Group DE, Inc. Tranche B 1LN, term loan: | | | |
| 1 month U.S. LIBOR + 2.500% 5.0239% 10/1/26 (f)(g)(t) | | 2,430,073 | 2,389,831 |
| 1 month U.S. LIBOR + 2.750% 5.2739% 1/3/29 (f)(g)(t) | | 833,457 | 819,705 |
| DiversiTech Holdings, Inc.: | | | |
| Tranche B 1LN, term loan 1 month U.S. LIBOR + 3.750% 6.0004% 12/22/28 (f)(g)(t) | | 1,421,580 | 1,359,386 |
| Tranche B-DD 1LN, term loan 1 month U.S. LIBOR + 3.750% 3.75% 12/22/28 (f)(g)(t)(u) | | 294,857 | 281,957 |
| Griffon Corp. Tranche B 1LN, term loan CME Term SOFR 1 Month Index + 2.750% 5.49% 1/24/29 (f)(g)(t) | | 3,212,100 | 3,118,403 |
| Hunter Douglas, Inc. Tranche B 1LN, term loan CME Term SOFR 1 Month Index + 3.500% 6.3399% 2/25/29 (f)(g)(t) | | 13,805,000 | 12,031,058 |
| Ingersoll-Rand Services Co. Tranche B 1LN, term loan 1 month U.S. LIBOR + 1.750% 4.3053% 2/28/27 (f)(g)(t) | | 2,516,839 | 2,472,341 |
| Oscar AcquisitionCo LLC 1LN, term loan CME Term SOFR 1 Month Index + 4.500% 6.1085% 4/29/29 (f)(g)(t) | | 5,155,000 | 4,806,419 |
| Specialty Building Products Holdings LLC Tranche B 1LN, term loan 1 month U.S. LIBOR + 3.750% 6.1181% 10/15/28 (f)(g)(t) | | 1,411,463 | 1,340,494 |
| Standard Industries, Inc./New Jersey Tranche B 1LN, term loan 1 month U.S. LIBOR + 2.500% 3.7876% 9/22/28 (f)(g)(t) | | 1,934,336 | 1,912,923 |
| | | | 35,897,825 |
| Commercial Services & Supplies - 0.4% | | | |
| ABG Intermediate Holdings 2 LLC: | | | |
| Tranche B 2LN, term loan CME Term SOFR 1 Month Index + 6.000% 8.5553% 12/20/29 (f)(g)(t) | | 1,725,000 | 1,604,250 |
| Tranche B1 LN, term loan CME Term SOFR 1 Month Index + 3.500% 6.0553% 12/21/28 (f)(g)(t) | | 10,940,000 | 10,666,500 |
| ADS Tactical, Inc. Tranche B 1LN, term loan 1 month U.S. LIBOR + 5.750% 8.1181% 3/19/26 (f)(g)(t) | | 3,834,375 | 3,470,109 |
| All-Star Bidco AB: | | | |
| Tranche B 1LN, term loan 1 month U.S. LIBOR + 4.000% 7.0696% 11/16/28 (f)(g)(t) | | 1,164,150 | 1,131,170 |
| Tranche B1 1LN, term loan 1 month U.S. LIBOR + 3.500% 6.5696% 11/16/28 (f)(g)(t) | | 2,243,725 | 2,168,942 |
| Allied Universal Holdco LLC Tranche B 1LN, term loan 1 month U.S. LIBOR + 3.750% 6.2739% 5/14/28 (f)(g)(t) | | 6,428,740 | 6,124,210 |
| APX Group, Inc. Tranche B 1LN, term loan 1 month U.S. LIBOR + 3.500% 5.63% 7/9/28 (f)(g)(t) | | 2,977,500 | 2,895,142 |
| AVSC Holding Corp. Tranche B2 1LN, term loan 3 month U.S. LIBOR + 5.500% 7.1107% 10/15/26 (f)(g)(t) | | 2,676,009 | 2,489,170 |
| Brand Energy & Infrastructure Services, Inc. Tranche B, term loan 3 month U.S. LIBOR + 4.250% 6.9444% 6/21/24 (f)(g)(t) | | 14,910,176 | 13,585,407 |
| Cimpress U.S.A., Inc. Tranche B 1LN, term loan 1 month U.S. LIBOR + 3.500% 6.0239% 5/17/28 (f)(g)(t) | | 947,501 | 902,495 |
| Clean Harbors, Inc. Tranche B 1LN, term loan 1 month U.S. LIBOR + 2.000% 4.5239% 10/8/28 (f)(g)(t) | | 1,004,950 | 998,046 |
| Congruex Group LLC Tranche B 1LN, term loan CME Term SOFR 1 Month Index + 5.750% 8.4751% 5/3/29 (f)(g)(t) | | 2,750,000 | 2,619,375 |
| Covanta Holding Corp.: | | | |
| Tranche B 1LN, term loan 1 month U.S. LIBOR + 2.500% 5.0239% 11/30/28 (f)(g)(t) | | 2,867,482 | 2,804,168 |
| Tranche C 1LN, term loan 1 month U.S. LIBOR + 2.500% 5.0239% 11/30/28 (f)(g)(t) | | 215,331 | 210,577 |
| Eagle 4 Ltd. Tranche B 1LN, term loan 1 month U.S. LIBOR + 3.250% 5.7739% 7/12/28 (f)(g)(t) | | 2,279,521 | 2,231,788 |
| Ensemble RCM LLC 1LN, term loan 3 month U.S. LIBOR + 3.750% 6.5559% 8/1/26 (f)(g)(t) | | 2,875,756 | 2,804,466 |
| Filtration Group Corp.: | | | |
| Tranche B 1LN, term loan 1 month U.S. LIBOR + 3.500% 6.0239% 10/21/28 (f)(g)(t) | | 620,313 | 602,944 |
| Tranche B, term loan 3 month U.S. LIBOR + 3.000% 5.5239% 3/29/25 (f)(g)(t) | | 3,213,156 | 3,154,419 |
| Gateway Merger Sub 2021, Inc. Tranche B 1LN, term loan 1 month U.S. LIBOR + 5.250% 7.95% 6/30/28 (f)(g)(t) | | 1,172,048 | 1,101,725 |
| Harland Clarke Holdings Corp.: | | | |
| 1LN, term loan 1 month U.S. LIBOR + 7.750% 10.0004% 6/16/26 (f)(g)(t) | | 1,944,683 | 1,461,215 |
| Tranche B 7LN, term loan 3 month U.S. LIBOR + 4.750% 7.0004% 11/3/23 (f)(g)(t) | | 359,481 | 280,395 |
| Indy U.S. Bidco LLC Tranche B 1LN, term loan 1 month U.S. LIBOR + 3.750% 6.2183% 3/5/28 (f)(g)(t) | | 2,162,707 | 2,063,590 |
| KNS Acquisitions, Inc. Tranche B 1LN, term loan 1 month U.S. LIBOR + 6.250% 8.5004% 4/21/27 (f)(g)(t) | | 2,902,281 | 2,737,229 |
| Madison IAQ LLC Tranche B 1LN, term loan 1 month U.S. LIBOR + 3.250% 4.5244% 6/21/28 (f)(g)(t) | | 5,118,300 | 4,930,612 |
| Maverick Purchaser Sub LLC: | | | |
| Tranche B 1LN, term loan: | | | |
| 1 month U.S. LIBOR + 4.000% 6.3723% 1/23/27 (f)(g)(t) | | 3,738,700 | 3,626,539 |
| CME Term SOFR 1 Month Index + 4.000% 5.16% 2/16/29 (f)(g)(t) | | 3,990,000 | 3,877,801 |
| Tranche B 2LN, term loan 1 month U.S. LIBOR + 8.750% 11.0004% 1/31/28 (c)(f)(g)(t) | | 2,880,000 | 2,721,600 |
| MHI Holdings LLC Tranche B 1LN, term loan 3 month U.S. LIBOR + 5.000% 7.5239% 9/20/26 (f)(g)(t) | | 2,587,762 | 2,568,354 |
| Pilot Travel Centers LLC Tranche B 1LN, term loan 1 month U.S. LIBOR + 2.000% 4.5553% 8/4/28 (f)(g)(t) | | 5,955,000 | 5,830,600 |
| PowerTeam Services LLC Tranche B 1LN, term loan 1 month U.S. LIBOR + 3.500% 5.7504% 3/6/25 (f)(g)(t) | | 3,420,923 | 2,766,055 |
| RLG Holdings LLC Tranche B 1LN, term loan 1 month U.S. LIBOR + 4.250% 6.2739% 7/8/28 (f)(g)(t) | | 1,999,950 | 1,927,452 |
| Sabert Corp. Tranche B 1LN, term loan 1 month U.S. LIBOR + 4.500% 6.875% 12/10/26 (c)(f)(g)(t) | | 3,163,519 | 3,116,066 |
| SuperMoose Borrower LLC Tranche B 1LN, term loan 3 month U.S. LIBOR + 3.750% 6.0004% 8/29/25 (f)(g)(t) | | 1,475,485 | 1,301,112 |
| The Brickman Group, Ltd. Tranche B 1LN, term loan CME Term SOFR 1 Month Index + 3.250% 5.7053% 4/14/29 (f)(g)(t) | | 3,018,740 | 2,931,951 |
| The GEO Group, Inc. Tranche 1B 1LN, term loan CME Term SOFR 1 Month Index + 7.120% 4.38% 3/23/27 (f)(g)(t) | | 1,391,604 | 1,341,158 |
| Wmb Holdings, Inc. Tranche B 1LN, term loan CME Term SOFR 1 Month Index + 3.250% 8/9/29 (g)(t)(v) | | 1,890,000 | 1,856,925 |
| WTG Holdings III Corp. Tranche B 1LN, term loan 1 month U.S. LIBOR + 2.500% 5.0625% 4/1/28 (f)(g)(t) | | 1,133,550 | 1,117,964 |
| | | | 108,021,521 |
| Construction & Engineering - 0.1% | | | |
| JMC Steel Group, Inc. 1LN, term loan 1 month U.S. LIBOR + 2.000% 4.1846% 1/24/27 (f)(g)(t) | | 1,930,385 | 1,871,508 |
| Pike Corp. Tranche B 1LN, term loan: | | | |
| 1 month U.S. LIBOR + 3.000% 5.53% 1/21/28 (f)(g)(t) | | 2,397,260 | 2,340,709 |
| CME Term SOFR 1 Month Index + 3.500% 5.8074% 1/21/28 (f)(g)(t) | | 1,755,000 | 1,724,288 |
| Rockwood Service Corp. Tranche B 1LN, term loan 1 month U.S. LIBOR + 4.250% 6.7434% 1/23/27 (f)(g)(t) | | 4,064,013 | 3,972,572 |
| SRS Distribution, Inc. Tranche B 1LN, term loan 1 month U.S. LIBOR + 3.500% 6.3059% 6/4/28 (f)(g)(t) | | 7,395,574 | 7,136,729 |
| Traverse Midstream Partners Ll Tranche B, term loan CME Term SOFR 1 Month Index + 4.250% 5.9499% 9/27/24 (f)(g)(t) | | 1,469,766 | 1,456,905 |
| USIC Holdings, Inc. Tranche B 1LN, term loan 1 month U.S. LIBOR + 3.500% 6.0239% 5/7/28 (f)(g)(t) | | 2,540,800 | 2,454,413 |
| | | | 20,957,124 |
| Electrical Equipment - 0.1% | | | |
| Alliance Laundry Systems LLC Tranche B 1LN, term loan 1 month U.S. LIBOR + 3.500% 5.9551% 10/8/27 (f)(g)(t) | | 2,815,686 | 2,753,741 |
| Array Technologies, Inc. Tranche B 1LN, term loan 1 month U.S. LIBOR + 3.250% 6.2077% 10/14/27 (f)(g)(t) | | 6,670,642 | 6,420,493 |
| AZZ, Inc. Tranche B 1LN, term loan CME Term SOFR 1 Month Index + 4.250% 6.91% 5/13/29 (f)(g)(t) | | 3,416,712 | 3,376,839 |
| Global IID Parent LLC Tranche B 1LN, term loan 1 month U.S. LIBOR + 4.500% 6.7504% 12/16/28 (f)(g)(t) | | 1,353,200 | 1,296,542 |
| Vertiv Group Corp. Tranche B 1LN, term loan 1 month U.S. LIBOR + 2.750% 5.1123% 3/2/27 (f)(g)(t) | | 6,929,620 | 6,666,849 |
| | | | 20,514,464 |
| Machinery - 0.0% | | | |
| Ali Group North America Corp. Tranche B 1LN, term loan 1 month U.S. LIBOR + 2.000% 4.5698% 7/23/29 (f)(g)(t) | | 2,916,178 | 2,832,338 |
| CPM Holdings, Inc.: | | | |
| 2LN, term loan 3 month U.S. LIBOR + 8.250% 10.6231% 11/15/26 (f)(g)(t) | | 223,434 | 217,848 |
| Tranche B 1LN, term loan 3 month U.S. LIBOR + 3.500% 5.8731% 11/15/25 (f)(g)(t) | | 1,139,299 | 1,118,291 |
| TNT Crane & Rigging LLC 2LN, term loan 3 month U.S. LIBOR + 8.750% 11.0271% 4/16/25 (c)(f)(g)(t) | | 714,831 | 680,877 |
| | | | 4,849,354 |
| Professional Services - 0.1% | | | |
| AlixPartners LLP Tranche B 1LN, term loan 1 month U.S. LIBOR + 2.750% 6.7739% 2/4/28 (f)(g)(t) | | 3,042,765 | 2,968,857 |
| Cast & Crew Payroll LLC Tranche B 1LN, term loan: | | | |
| 1 month U.S. LIBOR + 3.500% 6.0239% 2/7/26 (f)(g)(t) | | 5,580,135 | 5,462,450 |
| CME Term SOFR 1 Month Index + 3.750% 6.2053% 12/30/28 (f)(g)(t) | | 2,009,950 | 1,966,394 |
| CHG Healthcare Services, Inc. 1LN, term loan 1 month U.S. LIBOR + 3.250% 4.7497% 9/30/28 (f)(g)(t) | | 1,441,494 | 1,403,208 |
| CoreLogic, Inc. Tranche B 1LN, term loan 1 month U.S. LIBOR + 3.500% 6.0625% 6/2/28 (f)(g)(t) | | 9,506,925 | 8,140,305 |
| EAB Global, Inc. Tranche B 1LN, term loan 1 month U.S. LIBOR + 3.500% 6.31% 8/16/28 (f)(g)(t) | | 2,059,650 | 1,977,779 |
| EmployBridge LLC Tranche B 1LN, term loan 1 month U.S. LIBOR + 4.750% 7.0004% 7/19/28 (f)(g)(t) | | 4,036,557 | 3,638,956 |
| Galaxy U.S. Opco, Inc. 1LN, term loan CME Term SOFR 1 Month Index + 4.750% 7.2053% 4/29/29 (f)(g)(t) | | 2,185,000 | 2,097,600 |
| Sitel Worldwide Corp. Tranche B 1LN, term loan 1 month U.S. LIBOR + 3.750% 6.01% 8/27/28 (f)(g)(t) | | 955,000 | 933,990 |
| Vaco Holdings LLC 1LN, term loan CME Term SOFR 1 Month Index + 5.000% 7.2044% 1/21/29 (f)(g)(t) | | 1,502,450 | 1,466,767 |
| | | | 30,056,306 |
| Road & Rail - 0.0% | | | |
| Genesee & Wyoming, Inc. 1LN, term loan 3 month U.S. LIBOR + 2.000% 4.2504% 12/30/26 (f)(g)(t) | | 3,665,625 | 3,582,305 |
| Trading Companies & Distributors - 0.0% | | | |
| Beacon Roofing Supply, Inc. Tranche B 1LN, term loan 1 month U.S. LIBOR + 2.250% 4.7739% 5/19/28 (f)(g)(t) | | 1,915,650 | 1,869,253 |
| Fly Funding II SARL Tranche B 1LN, term loan 1 month U.S. LIBOR + 1.750% 4.62% 8/9/25 (f)(g)(t) | | 1,489,698 | 1,354,388 |
| | | | 3,223,641 |
| Transportation Infrastructure - 0.0% | | | |
| AIT Worldwide Logistics Holdings, Inc. 1LN, term loan 1 month U.S. LIBOR + 4.750% 7.0429% 4/6/28 (f)(g)(t) | | 3,245,475 | 3,058,860 |
| ASP LS Acquisition Corp.: | | | |
| 2LN, term loan 1 month U.S. LIBOR + 7.500% 10.3769% 5/7/29 (c)(f)(g)(t) | | 575,000 | 460,000 |
| Tranche B 1LN, term loan 1 month U.S. LIBOR + 4.500% 7.3769% 4/30/28 (f)(g)(t) | | 2,451,475 | 2,169,555 |
| Brown Group Holding LLC Tranche B2 1LN, term loan CME Term SOFR 1 Month Index + 3.750% 6.2053% 6/9/29 (f)(g)(t) | | 850,000 | 837,097 |
| Einstein Merger Sub, Inc. 2LN, term loan 3 month U.S. LIBOR + 7.000% 9.8059% 11/23/29 (c)(f)(g)(t) | | 1,525,000 | 1,517,375 |
| First Student Bidco, Inc.: | | | |
| Tranche B 1LN, term loan: | | | |
| 1 month U.S. LIBOR + 3.000% 5.2316% 7/21/28 (f)(g)(t) | | 3,048,675 | 2,926,728 |
| CME Term SOFR 1 Month Index + 4.000% 6.1544% 7/21/28 (f)(g)(t) | | 205,714 | 198,193 |
| Tranche C 1LN, term loan: | | | |
| 1 month U.S. LIBOR + 3.000% 5.2316% 7/21/28 (f)(g)(t) | | 1,131,005 | 1,085,765 |
| CME Term SOFR 1 Month Index + 4.000% 6.1544% 7/21/28 (f)(g)(t) | | 14,286 | 13,763 |
| Worldwide Express, Inc. 1LN, term loan 1 month U.S. LIBOR + 4.000% 6.2504% 7/22/28 (f)(g)(t) | | 3,089,475 | 2,941,767 |
| | | | 15,209,103 |
|
| TOTAL INDUSTRIALS | | | 306,024,279 |
|
| INFORMATION TECHNOLOGY - 1.2% | | | |
| Communications Equipment - 0.1% | | | |
| Anastasia Parent LLC Tranche B, term loan 3 month U.S. LIBOR + 3.750% 6.0004% 8/10/25 (f)(g)(t) | | 5,807,422 | 4,704,012 |
| CommScope, Inc. Tranche B 1LN, term loan 3 month U.S. LIBOR + 3.250% 5.7739% 4/4/26 (f)(g)(t) | | 10,670,046 | 10,213,262 |
| Eos U.S. Finco LLC 1LN, term loan CME Term SOFR 1 Month Index + 6.000% 8/3/29 (c)(g)(t)(v) | | 2,005,000 | 1,904,750 |
| Radiate Holdco LLC Tranche B 1LN, term loan 1 month U.S. LIBOR + 3.250% 5.7739% 9/25/26 (f)(g)(t) | | 7,886,392 | 7,510,842 |
| | | | 24,332,866 |
| Electronic Equipment & Components - 0.1% | | | |
| DG Investment Intermediate Holdings, Inc.: | | | |
| 2LN, term loan 1 month U.S. LIBOR + 6.750% 9.2739% 3/31/29 (f)(g)(t) | | 600,000 | 554,502 |
| Tranche B 1LN, term loan 1 month U.S. LIBOR + 3.750% 6.2739% 3/31/28 (f)(g)(t) | | 2,603,786 | 2,544,264 |
| Go Daddy Operating Co. LLC: | | | |
| Tranche B 1LN, term loan 1 month U.S. LIBOR + 2.000% 4.3723% 8/10/27 (f)(g)(t) | | 3,185,000 | 3,124,612 |
| Tranche B, term loan 1 month U.S. LIBOR + 1.750% 4.2739% 2/15/24 (f)(g)(t) | | 3,083,759 | 3,050,732 |
| II-VI, Inc. Tranche B 1LN, term loan 3 month U.S. LIBOR + 2.750% 5.1231% 7/1/29 (f)(g)(t) | | 5,070,000 | 4,953,796 |
| TTM Technologies, Inc. Tranche B, term loan 3 month U.S. LIBOR + 2.500% 4.8731% 9/28/24 (f)(g)(t) | | 3,094,221 | 3,074,882 |
| | | | 17,302,788 |
| IT Services - 0.3% | | | |
| Acuris Finance U.S., Inc. 1LN, term loan CME Term SOFR 1 Month Index + 4.000% 6.2044% 2/16/28 (f)(g)(t) | | 4,050,260 | 3,965,893 |
| AEA International Holdings Luxembourg SARL Tranche B 1LN, term loan 1 month U.S. LIBOR + 3.750% 6.0625% 9/7/28 (c)(f)(g)(t) | | 1,512,400 | 1,474,590 |
| Arches Buyer, Inc. Tranche B 1LN, term loan 1 month U.S. LIBOR + 3.250% 5.7739% 12/4/27 (f)(g)(t) | | 2,958,500 | 2,789,008 |
| Camelot Finance SA: | | | |
| Tranche B 1LN, term loan 1 month U.S. LIBOR + 3.000% 5.5239% 10/31/26 (f)(g)(t) | | 8,128,737 | 7,905,197 |
| Tranche B, term loan 1 month U.S. LIBOR + 3.000% 5.5239% 10/31/26 (f)(g)(t) | | 3,845,901 | 3,747,369 |
| Constant Contact, Inc. Tranche B 1LN, term loan 1 month U.S. LIBOR + 4.000% 6.423% 2/10/28 (f)(g)(t) | | 1,924,708 | 1,832,091 |
| GTT Communications, Inc. Tranche B, term loan 3 month U.S. LIBOR + 4.750% 9.25% 5/31/25 (f)(g)(t) | | 12,164,264 | 9,400,300 |
| Hunter U.S. Bidco, Inc. Tranche B 1LN, term loan 1 month U.S. LIBOR + 4.250% 6.5004% 8/19/28 (c)(f)(g)(t) | | 2,110,463 | 2,062,977 |
| Ion Trading Finance Ltd. Tranche B 1LN, term loan 1 month U.S. LIBOR + 4.750% 7.0004% 3/26/28 (f)(g)(t) | | 7,845,750 | 7,616,889 |
| Park Place Technologies LLC 1LN, term loan 1 month U.S. LIBOR + 5.000% 7.5553% 11/10/27 (f)(g)(t) | | 2,589,853 | 2,486,259 |
| Peraton Corp. Tranche B 1LN, term loan 1 month U.S. LIBOR + 3.750% 6.2739% 2/1/28 (f)(g)(t) | | 15,975,812 | 15,496,537 |
| Sabre GLBL, Inc.: | | | |
| Tranche B 1LN, term loan CME Term SOFR 1 Month Index + 5.000% 7.5553% 6/30/28 (f)(g)(t) | | 1,850,000 | 1,780,625 |
| Tranche B-1 1LN, term loan 1 month U.S. LIBOR + 3.500% 6.0239% 12/17/27 (f)(g)(t) | | 473,235 | 442,475 |
| Tranche B-2 1LN, term loan 1 month U.S. LIBOR + 3.500% 5.8723% 12/17/27 (f)(g)(t) | | 754,365 | 705,331 |
| Tempo Acquisition LLC: | | | |
| 1LN, term loan U.S. Secured Overnight Fin. Rate (SOFR) Index + 3.000% 5.4553% 8/31/28 (f)(g)(t) | | 4,280,445 | 4,207,678 |
| Tranche B, term loan 1 month U.S. LIBOR + 2.750% 5.1223% 5/1/24 (f)(g)(t) | | 396,308 | 391,355 |
| Verscend Holding Corp. Tranche B 1LN, term loan 1 month U.S. LIBOR + 4.000% 6.3723% 8/27/25 (f)(g)(t) | | 6,607,104 | 6,550,679 |
| VFH Parent LLC Tranche B 1LN, term loan CME Term SOFR 1 Month Index + 3.000% 5.397% 1/13/29 (f)(g)(t) | | 5,265,000 | 5,118,001 |
| WEX, Inc. Tranche B 1LN, term loan 1 month U.S. LIBOR + 2.250% 4.7739% 4/1/28 (f)(g)(t) | | 563,688 | 551,005 |
| | | | 78,524,259 |
| Semiconductors & Semiconductor Equipment - 0.0% | | | |
| Entegris, Inc. Tranche B 1LN, term loan CME Term SOFR 1 Month Index + 3.000% 5.57% 7/6/29 (f)(g)(t) | | 4,995,000 | 4,978,966 |
| MKS Instruments, Inc. Tranche B 1LN, term loan CME Term SOFR 1 Month Index + 2.750% 5.1463% 8/17/29 (f)(g)(t) | | 5,360,000 | 5,293,000 |
| | | | 10,271,966 |
| Software - 0.6% | | | |
| A&V Holdings Midco LLC Tranche B 1LN, term loan 1 month U.S. LIBOR + 5.370% 6.8747% 3/10/27 (c)(f)(g)(t) | | 2,156,607 | 2,108,084 |
| Applied Systems, Inc. Tranche B, term loan 1 month U.S. LIBOR + 3.000% 5.2504% 9/19/24 (f)(g)(t) | | 1,000,000 | 990,500 |
| AppLovin Corp. Tranche B, term loan 1 month U.S. LIBOR + 3.250% 5.5004% 8/15/25 (f)(g)(t) | | 8,404,977 | 8,233,851 |
| Aptean, Inc. 1LN, term loan 1 month U.S. LIBOR + 4.250% 7.3196% 4/23/26 (f)(g)(t) | | 2,475,323 | 2,360,319 |
| Ascend Learning LLC: | | | |
| 2LN, term loan 1 month U.S. LIBOR + 5.750% 8.2739% 12/10/29 (f)(g)(t) | | 820,000 | 734,720 |
| Tranche B 1LN, term loan 1 month U.S. LIBOR + 3.500% 6.0239% 12/10/28 (f)(g)(t) | | 8,154,050 | 7,760,943 |
| Byju's Alpha, Inc. Tranche B 1LN, term loan 1 month U.S. LIBOR + 5.500% 8.9797% 11/24/26 (f)(g)(t) | | 3,529,500 | 2,564,782 |
| Central Parent, Inc. 1LN, term loan CME Term SOFR 1 Month Index + 4.500% 6.6095% 7/6/29 (f)(g)(t) | | 9,445,000 | 9,194,424 |
| Ceridian HCM Holding, Inc. Tranche B, term loan 1 month U.S. LIBOR + 2.500% 5.0239% 4/30/25 (f)(g)(t) | | 4,499,829 | 4,380,583 |
| ConnectWise LLC Tranche B 1LN, term loan 1 month U.S. LIBOR + 3.500% 5.7504% 9/30/28 (f)(g)(t) | | 4,636,700 | 4,499,036 |
| DCert Buyer, Inc.: | | | |
| 1LN, term loan 3 month U.S. LIBOR + 4.000% 6.9027% 10/16/26 (f)(g)(t) | | 10,238,829 | 9,945,896 |
| Tranche B 2LN, term loan 1 month U.S. LIBOR + 7.000% 9.9027% 2/19/29 (f)(g)(t) | | 2,493,409 | 2,363,752 |
| Epicor Software Corp. Tranche B 1LN, term loan 1 month U.S. LIBOR + 3.250% 5.6223% 7/31/27 (f)(g)(t) | | 3,586,125 | 3,474,812 |
| Finastra U.S.A., Inc.: | | | |
| Tranche 2LN, term loan 3 month U.S. LIBOR + 7.250% 10.6207% 6/13/25 (f)(g)(t) | | 1,363,000 | 1,212,688 |
| Tranche B 1LN, term loan 3 month U.S. LIBOR + 3.500% 6.8707% 6/13/24 (f)(g)(t) | | 4,066,205 | 3,796,331 |
| Flexera Software LLC Tranche B 1LN, term loan 1 month U.S. LIBOR + 3.750% 5.37% 3/3/28 (f)(g)(t) | | 1,601,481 | 1,546,294 |
| Greeneden U.S. Holdings II LLC Tranche B 1LN, term loan 1 month U.S. LIBOR + 4.000% 6.5239% 12/1/27 (f)(g)(t) | | 4,186,250 | 4,108,511 |
| Hyland Software, Inc.: | | | |
| 2LN, term loan 1 month U.S. LIBOR + 6.250% 8.7739% 7/10/25 (f)(g)(t) | | 194,480 | 191,077 |
| Tranche B 1LN, term loan 1 month U.S. LIBOR + 3.500% 6.0239% 7/1/24 (f)(g)(t) | | 6,198,705 | 6,112,357 |
| MA FinanceCo. LLC Tranche B 1LN, term loan 1 month U.S. LIBOR + 4.250% 5.915% 6/5/25 (f)(g)(t) | | 938,231 | 924,749 |
| McAfee Corp. Tranche B 1LN, term loan CME Term SOFR 1 Month Index + 3.750% 6.1574% 3/1/29 (f)(g)(t) | | 1,680,000 | 1,589,700 |
| MH Sub I LLC: | | | |
| 1LN, term loan 1 month U.S. LIBOR + 3.750% 6.1223% 9/15/24 (f)(g)(t) | | 6,649,858 | 6,478,092 |
| Tranche B 2LN, term loan 1 month U.S. LIBOR + 6.250% 8.7053% 2/23/29 (f)(g)(t) | | 2,065,000 | 1,976,205 |
| Tranche B, term loan 3 month U.S. LIBOR + 3.750% 6.2739% 9/15/24 (f)(g)(t) | | 5,167,999 | 5,032,908 |
| Motus Group LLC Tranche B 1LN, term loan 1 month U.S. LIBOR + 4.000% 6.5239% 12/10/28 (f)(g)(t) | | 1,187,025 | 1,112,836 |
| NAVEX TopCo, Inc.: | | | |
| 2LN, term loan 3 month U.S. LIBOR + 7.000% 9.38% 9/4/26 (f)(g)(t) | | 175,000 | 169,167 |
| Tranche B 1LN, term loan 3 month U.S. LIBOR + 3.250% 5.63% 9/5/25 (f)(g)(t) | | 1,238,961 | 1,209,535 |
| NortonLifeLock, Inc. Tranche B 1LN, term loan CME Term SOFR 1 Month Index + 2.000% 1/28/29 (g)(t)(v) | | 8,995,000 | 8,713,906 |
| Polaris Newco LLC Tranche B 1LN, term loan 1 month U.S. LIBOR + 4.000% 6.5239% 6/2/28 (f)(g)(t) | | 11,021,862 | 10,563,132 |
| Project Boost Purchaser LLC 1LN, term loan 3 month U.S. LIBOR + 3.500% 6.0239% 5/30/26 (f)(g)(t) | | 3,019,933 | 2,924,292 |
| Proofpoint, Inc. Tranche B 1LN, term loan 1 month U.S. LIBOR + 3.250% 6.3196% 8/31/28 (f)(g)(t) | | 8,765,950 | 8,421,886 |
| Rackspace Technology Global, Inc. Tranche B 1LN, term loan 1 month U.S. LIBOR + 2.750% 5.6167% 2/15/28 (f)(g)(t) | | 7,621,174 | 6,133,978 |
| RealPage, Inc. Tranche B 1LN, term loan 1 month U.S. LIBOR + 3.000% 5.5239% 4/22/28 (f)(g)(t) | | 4,957,538 | 4,762,657 |
| Red Planet Borrower LLC Tranche B 1LN, term loan 1 month U.S. LIBOR + 3.750% 6.2739% 9/30/28 (f)(g)(t) | | 2,632,544 | 2,160,345 |
| Renaissance Holdings Corp.: | | | |
| 1LN, term loan CME Term SOFR 1 Month Index + 4.000% 6.7874% 3/17/29 (f)(g)(t) | | 1,000,000 | 974,500 |
| Tranche B 1LN, term loan 3 month U.S. LIBOR + 3.250% 5.7739% 5/31/25 (f)(g)(t) | | 3,093,812 | 3,005,360 |
| Sophia LP: | | | |
| 1LN, term loan CME Term SOFR 1 Month Index + 4.250% 6.4593% 10/7/27 (f)(g)(t) | | 620,000 | 604,500 |
| Tranche B 1LN, term loan 1 month U.S. LIBOR + 3.250% 5.1934% 10/7/27 (f)(g)(t) | | 5,639,447 | 5,438,570 |
| SS&C Technologies, Inc.: | | | |
| Tranche B 3LN, term loan 1 month U.S. LIBOR + 1.750% 4.1223% 4/16/25 (f)(g)(t) | | 2,556,707 | 2,497,187 |
| Tranche B 4LN, term loan 1 month U.S. LIBOR + 1.750% 4.1223% 4/16/25 (f)(g)(t) | | 2,075,574 | 2,027,255 |
| Tranche B 5LN, term loan 1 month U.S. LIBOR + 1.750% 4.2739% 4/16/25 (f)(g)(t) | | 7,015,255 | 6,843,802 |
| STG-Fairway Holdings LLC Tranche B 1LN, term loan 1 month U.S. LIBOR + 2.750% 5.1223% 1/31/27 (f)(g)(t) | | 1,216,644 | 1,192,822 |
| UKG, Inc. 1LN, term loan 3 month U.S. LIBOR + 3.750% 6.1223% 5/4/26 (f)(g)(t) | | 4,934,378 | 4,799,324 |
| Ultimate Software Group, Inc.: | | | |
| 1LN, term loan 1 month U.S. LIBOR + 3.250% 5.5351% 5/3/26 (f)(g)(t) | | 17,830,789 | 17,248,079 |
| 2LN, term loan 1 month U.S. LIBOR + 5.250% 7.5351% 5/3/27 (f)(g)(t) | | 5,210,000 | 5,062,661 |
| VS Buyer LLC Tranche B 1LN, term loan 1 month U.S. LIBOR + 3.000% 5.3723% 2/28/27 (f)(g)(t) | | 4,594,864 | 4,497,223 |
| | | | 191,943,631 |
| Technology Hardware, Storage & Peripherals - 0.1% | | | |
| Seattle Spinco, Inc.: | | | |
| Tranche B 1LN, term loan CME Term SOFR 1 Month Index + 4.000% 6.3998% 3/1/27 (c)(f)(g)(t) | | 8,233,625 | 8,110,121 |
| Tranche B 3LN, term loan 3 month U.S. LIBOR + 2.750% 5.2739% 6/21/24 (f)(g)(t) | | 8,204,327 | 8,081,262 |
| | | | 16,191,383 |
|
| TOTAL INFORMATION TECHNOLOGY | | | 338,566,893 |
|
| MATERIALS - 0.5% | | | |
| Chemicals - 0.3% | | | |
| ARC Falcon I, Inc.: | | | |
| Tranche B 1LN, term loan 1 month U.S. LIBOR + 3.750% 6.2739% 9/30/28 (f)(g)(t) | | 2,806,284 | 2,649,609 |
| Tranche B 2LN, term loan 1 month U.S. LIBOR + 7.000% 9.5239% 9/22/29 (c)(f)(g)(t) | | 675,000 | 644,625 |
| Tranche DD 1LN, term loan 1 month U.S. LIBOR + 3.750% 1% 9/30/28 (f)(g)(t)(u) | | 411,735 | 388,748 |
| Aruba Investment Holdings LLC: | | | |
| 2LN, term loan 1 month U.S. LIBOR + 7.750% 10.1937% 11/24/28 (f)(g)(t) | | 935,000 | 875,394 |
| Tranche B 1LN, term loan 1 month U.S. LIBOR + 4.000% 6.4437% 11/24/27 (f)(g)(t) | | 3,299,765 | 3,167,774 |
| Avient Corp. Tranche B 1LN, term loan CME Term SOFR 1 Month Index + 3.250% 7/27/29 (g)(t)(v) | | 1,365,000 | 1,358,175 |
| Bakelite U.S. Holding Ltd. 1LN, term loan CME Term SOFR 1 Month Index + 4.000% 6.1632% 5/27/29 (c)(f)(g)(t) | | 1,740,000 | 1,661,700 |
| Consolidated Energy Finance SA: | | | |
| Tranche B 1LN, term loan 1 month U.S. LIBOR + 3.500% 6.3633% 5/7/25 (c)(f)(g)(t) | | 6,082,195 | 5,869,319 |
| Tranche B, term loan 3 month U.S. LIBOR + 2.500% 5.2929% 5/7/25 (f)(g)(t) | | 3,058,045 | 2,966,304 |
| Discovery Purchaser Corp. 1LN, term loan CME Term SOFR 1 Month Index + 4.370% 8/3/29 (g)(t)(v) | | 7,355,000 | 6,886,119 |
| Element Solutions, Inc. Tranche B 1LN, term loan 1 month U.S. LIBOR + 2.000% 4.5239% 1/31/26 (f)(g)(t) | | 1,235,464 | 1,224,963 |
| Groupe Solmax, Inc. Tranche B 1LN, term loan 1 month U.S. LIBOR + 4.750% 7.0004% 5/27/28 (f)(g)(t) | | 1,660,806 | 1,471,192 |
| Herens U.S. Holdco Corp. Tranche B 1LN, term loan 1 month U.S. LIBOR + 4.000% 6.2504% 7/3/28 (f)(g)(t) | | 3,106,192 | 2,855,118 |
| Hexion Holdings Corp. 1LN, term loan CME Term SOFR 1 Month Index + 4.500% 7.4125% 3/15/29 (f)(g)(t) | | 5,080,000 | 4,660,900 |
| Hexion, Inc. 2LN, term loan CME Term SOFR 1 Month Index + 7.000% 9.8345% 2/9/30 (c)(f)(g)(t) | | 1,320,000 | 1,135,200 |
| INEOS U.S. Petrochem LLC Tranche B 1LN, term loan 1 month U.S. LIBOR + 2.750% 5.2739% 1/20/26 (f)(g)(t) | | 6,282,236 | 6,119,966 |
| Luxembourg Investment Co. 428 SARL Tranche B 1LN, term loan CME Term SOFR 1 Month Index + 5.000% 7.0544% 1/3/29 (f)(g)(t) | | 1,505,000 | 1,290,538 |
| Manchester Acquisition Sub LLC Tranche B 1LN, term loan CME Term SOFR 1 Month Index + 5.750% 7.2995% 12/1/26 (c)(f)(g)(t) | | 1,179,075 | 1,072,958 |
| Messer Industries U.S.A., Inc. Tranche B 1LN, term loan 3 month U.S. LIBOR + 2.500% 4.7504% 3/1/26 (f)(g)(t) | | 3,199,771 | 3,134,976 |
| Olympus Water U.S. Holding Corp. Tranche B 1LN, term loan 1 month U.S. LIBOR + 3.750% 6.0625% 11/9/28 (f)(g)(t) | | 7,097,075 | 6,816,528 |
| Oxea Corp. Tranche B2, term loan 3 month U.S. LIBOR + 3.250% 5.6875% 10/11/24 (f)(g)(t) | | 1,750,817 | 1,678,596 |
| Starfruit U.S. Holdco LLC Tranche B, term loan 1 month U.S. LIBOR + 3.000% 5.2504% 10/1/25 (f)(g)(t) | | 5,169,028 | 5,030,757 |
| The Chemours Co. LLC Tranche B 1LN, term loan 3 month U.S. LIBOR + 1.750% 4.13% 4/3/25 (f)(g)(t) | | 3,975,596 | 3,871,236 |
| W.R. Grace Holding LLC Tranche B 1LN, term loan 3 month U.S. LIBOR + 3.750% 6.0625% 9/22/28 (f)(g)(t) | | 1,820,426 | 1,782,507 |
| | | | 68,613,202 |
| Construction Materials - 0.0% | | | |
| Smyrna Ready Mix LLC Tranche B 1lN, term loan CME Term SOFR 1 Month Index + 4.250% 6.8053% 4/1/29 (c)(f)(g)(t) | | 1,120,000 | 1,089,200 |
| VM Consolidated, Inc. Tranche B 1LN, term loan 1 month U.S. LIBOR + 3.250% 6.1253% 3/27/28 (f)(g)(t) | | 4,400,084 | 4,334,083 |
| White Capital Buyer LLC Tranche B 1LN, term loan 1 month U.S. LIBOR + 4.000% 6.2053% 10/19/27 (f)(g)(t) | | 3,684,609 | 3,553,143 |
| | | | 8,976,426 |
| Containers & Packaging - 0.2% | | | |
| AOT Packaging Products AcquisitionCo LLC 1LN, term loan 1 month U.S. LIBOR + 3.250% 5.7739% 3/3/28 (f)(g)(t) | | 4,265,368 | 4,126,232 |
| Berlin Packaging, LLC Tranche B 1LN, term loan: | | | |
| 1 month U.S. LIBOR + 3.250% 5.62% 3/11/28 (f)(g)(t) | | 565,656 | 544,682 |
| 1 month U.S. LIBOR + 3.750% 6.12% 3/11/28 (f)(g)(t) | | 6,411,550 | 6,181,439 |
| Berry Global, Inc. Tranche Z 1LN, term loan 1 month U.S. LIBOR + 1.750% 4.1776% 7/1/26 (f)(g)(t) | | 3,960,899 | 3,867,462 |
| BWAY Holding Co. Tranche B, term loan 3 month U.S. LIBOR + 3.250% 5.6231% 4/3/24 (f)(g)(t) | | 605,595 | 591,860 |
| Canister International Group, Inc. 1LN, term loan 1 month U.S. LIBOR + 4.750% 7.2739% 12/21/26 (f)(g)(t) | | 3,401,700 | 3,325,162 |
| Charter NEX U.S., Inc. 1LN, term loan 1 month U.S. LIBOR + 3.750% 6.5559% 12/1/27 (f)(g)(t) | | 3,954,651 | 3,834,588 |
| Clydesdale Acquisition Holdings, Inc. 1LN, term loan CME Term SOFR 1 Month Index + 4.170% 6.7303% 4/13/29 (f)(g)(t) | | 17,090,000 | 16,467,582 |
| Graham Packaging Co., Inc. Tranche B 1LN, term loan 1 month U.S. LIBOR + 3.000% 5.3723% 8/4/27 (f)(g)(t) | | 4,556,526 | 4,442,613 |
| Kloeckner Pentaplast of America, Inc. Tranche B 1LN, term loan 1 month U.S. LIBOR + 4.750% 8.3164% 2/9/26 (f)(g)(t) | | 2,029,313 | 1,858,505 |
| Pregis TopCo Corp. 1LN, term loan: | | | |
| 1 month U.S. LIBOR + 4.000% 6.8% 7/31/26 (f)(g)(t) | | 1,512,720 | 1,468,473 |
| 1 month U.S. LIBOR + 4.000% 6.8% 8/1/26 (f)(g)(t) | | 1,736,875 | 1,680,427 |
| Proampac PG Borrower LLC Tranche B 1LN, term loan 1 month U.S. LIBOR + 3.750% 6.46% 11/18/25 (f)(g)(t) | | 1,175,170 | 1,140,890 |
| Reynolds Consumer Products LLC Tranche B 1LN, term loan 1 month U.S. LIBOR + 1.750% 4.1223% 1/30/27 (f)(g)(t) | | 3,960,331 | 3,874,313 |
| Reynolds Group Holdings, Inc. Tranche B 1LN, term loan: | | | |
| 1 month U.S. LIBOR + 3.250% 5.6223% 2/5/26 (f)(g)(t) | | 3,092,900 | 3,013,010 |
| 1 month U.S. LIBOR + 3.500% 6.0239% 9/24/28 (f)(g)(t) | | 3,007,275 | 2,921,357 |
| | | | 59,338,595 |
| Metals & Mining - 0.0% | | | |
| Atkore International, Inc. Tranche B1LN, term loan 1 month U.S. LIBOR + 2.000% 4.3125% 5/26/28 (f)(g)(t) | | 1,953,588 | 1,938,330 |
| Tiger Acquisition LLC Tranche B 1LN, term loan 1 month U.S. LIBOR + 3.250% 5.7739% 6/1/28 (f)(g)(t) | | 2,608,650 | 2,485,548 |
| | | | 4,423,878 |
| Paper & Forest Products - 0.0% | | | |
| Ahlstrom-Munksjo OYJ 1LN, term loan 1 month U.S. LIBOR + 3.750% 6.0004% 2/4/28 (f)(g)(t) | | 2,301,020 | 2,185,969 |
| Journey Personal Care Corp. Tranche B 1LN, term loan 1 month U.S. LIBOR + 4.250% 6.5004% 3/1/28 (f)(g)(t) | | 1,210,827 | 826,389 |
| | | | 3,012,358 |
|
| TOTAL MATERIALS | | | 144,364,459 |
|
| REAL ESTATE - 0.0% | | | |
| Real Estate Management & Development - 0.0% | | | |
| DTZ U.S. Borrower LLC Tranche B 1LN, term loan 1 month U.S. LIBOR + 2.750% 5.2739% 8/21/25 (f)(g)(t) | | 8,488,608 | 8,255,171 |
| Lightstone Holdco LLC: | | | |
| Tranche B 1LN, term loan CME Term SOFR 1 Month Index + 5.750% 8.0511% 1/30/27 (f)(g)(t) | | 3,084,526 | 2,765,062 |
| Tranche C 1LN, term loan CME Term SOFR 1 Month Index + 5.750% 8.0511% 1/30/27 (f)(g)(t) | | 174,459 | 156,390 |
| | | | 11,176,623 |
| UTILITIES - 0.2% | | | |
| Electric Utilities - 0.2% | | | |
| Brookfield WEC Holdings, Inc.: | | | |
| 1LN, term loan CME Term SOFR 1 Month Index + 3.750% 6.1905% 8/1/25 (f)(g)(t) | | 2,530,000 | 2,486,990 |
| Tranche B 1LN, term loan 1 month U.S. LIBOR + 2.750% 5.2739% 8/1/25 (f)(g)(t) | | 12,021,436 | 11,719,457 |
| ExGen Renewables IV, LLC Tranche B 1LN, term loan 3 month U.S. LIBOR + 2.500% 5.57% 12/15/27 (f)(g)(t) | | 1,784,988 | 1,758,856 |
| Granite Generation LLC 1LN, term loan 1 month U.S. LIBOR + 3.750% 6.1% 11/1/26 (f)(g)(t) | | 1,798,857 | 1,717,459 |
| PG&E Corp. Tranche B 1LN, term loan 1 month U.S. LIBOR + 3.000% 5.5625% 6/23/25 (f)(g)(t) | | 14,318,272 | 14,023,029 |
| Vistra Operations Co. LLC Tranche B 3LN, term loan 1 month U.S. LIBOR + 1.750% 4.12% 12/31/25 (f)(g)(t) | | 5,325,378 | 5,213,066 |
| | | | 36,918,857 |
| Independent Power and Renewable Electricity Producers - 0.0% | | | |
| Esdec Solar Group BV Tranche B 1LN, term loan 1 month U.S. LIBOR + 4.750% 6.4434% 8/27/28 (c)(f)(g)(t) | | 1,727,688 | 1,641,303 |
| Granite Acquisition, Inc. Tranche B 1LN, term loan 1 month U.S. LIBOR + 2.750% 5.0004% 3/25/28 (f)(g)(t) | | 1,980,000 | 1,936,064 |
| Natgasoline LLC Tranche B, term loan 3 month U.S. LIBOR + 3.500% 5.875% 11/14/25 (c)(f)(g)(t) | | 1,741,825 | 1,689,570 |
| TerraForm Power Operating LLC Tranche B 1LN, term loan CME Term SOFR 1 Month Index + 2.750% 5.2154% 5/20/29 (f)(g)(t) | | 1,110,000 | 1,098,900 |
| | | | 6,365,837 |
| Multi-Utilities - 0.0% | | | |
| Osmose Utilities Services, Inc. Tranche B 1LN, term loan 1 month U.S. LIBOR + 3.250% 5.6223% 6/17/28 (f)(g)(t) | | 180,000 | 171,128 |
|
| TOTAL UTILITIES | | | 43,455,822 |
|
| TOTAL BANK LOAN OBLIGATIONS | | | |
| (Cost $2,110,771,867) | | | 2,030,727,514 |
|
| Bank Notes - 0.1% | | | |
| Discover Bank 4.682% 8/9/28 (f) | | 8,844,000 | 8,556,290 |
| KeyBank NA 6.95% 2/1/28 | | 1,259,000 | 1,352,446 |
| Regions Bank 6.45% 6/26/37 | | 15,683,000 | 17,451,533 |
| TOTAL BANK NOTES | | | |
| (Cost $25,774,965) | | | 27,360,269 |
|
| Preferred Securities - 0.8% | | | |
| COMMUNICATION SERVICES - 0.0% | | | |
| Diversified Telecommunication Services - 0.0% | | | |
| CAS Capital No 1 Ltd. 4% (Reg. S) (f)(i) | | $1,630,000 | $1,354,601 |
| Telefonica Europe BV: | | | |
| 2.625% (Reg. S) (f)(i) | EUR | 4,700,000 | 4,646,582 |
| 3.875% (Reg. S) (f)(i) | EUR | 3,600,000 | 3,389,248 |
| | | | 9,390,431 |
| CONSUMER DISCRETIONARY - 0.1% | | | |
| Automobiles - 0.1% | | | |
| Volkswagen International Finance NV: | | | |
| 3.748% (Reg. S) (f)(i) | EUR | 1,700,000 | 1,509,592 |
| 3.875% (Reg. S) (f)(i) | EUR | 19,900,000 | 17,212,147 |
| 4.625% (Reg. S) (f)(i) | EUR | 7,600,000 | 7,618,928 |
| | | | 26,340,667 |
| CONSUMER STAPLES - 0.1% | | | |
| Food Products - 0.0% | | | |
| Cosan Overseas Ltd. 8.25% (i) | | 3,658,000 | 3,670,540 |
| Danone SA 1.75% (Reg. S) (f)(i) | EUR | 3,700,000 | 3,629,574 |
| | | | 7,300,114 |
| Tobacco - 0.1% | | | |
| British American Tobacco PLC 3% (Reg. S) (f)(i) | EUR | 15,700,000 | 12,470,447 |
|
| TOTAL CONSUMER STAPLES | | | 19,770,561 |
|
| ENERGY - 0.0% | | | |
| Oil, Gas & Consumable Fuels - 0.0% | | | |
| Gazprom PJSC Via Gaz Finance PLC 4.5985% (Reg. S) (f)(i) | | 1,520,000 | 577,503 |
| FINANCIALS - 0.3% | | | |
| Banks - 0.2% | | | |
| AIB Group PLC 6.25% (Reg. S) (f)(i) | EUR | 3,600,000 | 3,489,338 |
| Banco Bilbao Vizcaya Argentaria SA 5.875% (Reg. S) (f)(i) | EUR | 3,400,000 | 3,329,039 |
| Banco Do Brasil SA 6.25% (d)(f)(i) | | 1,545,000 | 1,389,677 |
| Banco Mercantil del Norte SA: | | | |
| 6.75% (d)(f)(i) | | 935,000 | 910,485 |
| 7.625% (d)(f)(i) | | 608,000 | 577,295 |
| Bank of America Corp. 5.125% (f)(i) | | 920,000 | 890,199 |
| Bank of Nova Scotia: | | | |
| 4.65% (f)(i) | | 4,078,000 | 3,667,309 |
| 4.9% (f)(i) | | 1,650,000 | 1,582,620 |
| Barclays Bank PLC 7.625% 11/21/22 | | 5,362,000 | 5,503,713 |
| Barclays PLC: | | | |
| 5.875% (Reg. S) (f)(i) | GBP | 2,950,000 | 3,163,186 |
| 7.125% (f)(i) | GBP | 645,000 | 726,050 |
| 8.875% (f)(i) | GBP | 1,600,000 | 1,903,617 |
| BBVA Bancomer SA Texas Branch: | | | |
| 5.125% 1/18/33 (d)(f) | | 900,000 | 807,990 |
| 5.35% 11/12/29 (d)(f) | | 485,000 | 471,769 |
| BNP Paribas SA 6.625% (Reg. S) (f)(i) | | 4,470,000 | 4,453,480 |
| Emirates NBD Bank PJSC 6.125% (Reg. S) (f)(i) | | 1,451,000 | 1,479,085 |
| Georgia Bank Joint Stock Co. 11.125% (Reg. S) (f)(i) | | 300,000 | 299,927 |
| HSBC Holdings PLC 6.375% (f)(i) | | 4,650,000 | 4,611,566 |
| Itau Unibanco Holding SA 6.125% (d)(f)(i) | | 2,015,000 | 1,865,511 |
| JPMorgan Chase & Co.: | | | |
| 3 month U.S. LIBOR + 3.320% 5.5971% (f)(g)(i) | | 1,080,000 | 1,076,911 |
| 3 month U.S. LIBOR + 3.470% 6.2759% (f)(g)(i) | | 1,065,000 | 1,064,656 |
| Lloyds Banking Group PLC 5.125% (f)(i) | GBP | 435,000 | 467,069 |
| NBK Tier 1 Financing 2 Ltd. 4.5% (d)(f)(i) | | 1,210,000 | 1,131,560 |
| NBK Tier 1 Ltd. 3.625% (d)(f)(i) | | 635,000 | 558,030 |
| Societe Generale 7.875% (Reg. S) (f)(i) | | 1,800,000 | 1,810,622 |
| Stichting AK Rabobank Certificaten 6.5% (Reg. S) (f)(g)(i) | EUR | 2,480,725 | 2,524,303 |
| Tinkoff Credit Systems 6% (d)(f)(i) | | 715,000 | 231,724 |
| | | | 49,986,731 |
| Capital Markets - 0.0% | | | |
| Credit Suisse Group AG 7.5% (Reg. S) (f)(i) | | 15,540,000 | 14,986,091 |
| UBS Group AG 7% (Reg. S) (f)(i) | | 940,000 | 979,672 |
| | | | 15,965,763 |
| Insurance - 0.1% | | | |
| Aviva PLC 6.125% (f)(i) | GBP | 4,780,000 | 5,876,036 |
| QBE Insurance Group Ltd.: | | | |
| 5.25% (Reg. S) (f)(i) | | 7,527,000 | 7,120,056 |
| 5.875% (d)(f)(i) | | 3,175,000 | 3,140,189 |
| | | | 16,136,281 |
|
| TOTAL FINANCIALS | | | 82,088,775 |
|
| HEALTH CARE - 0.1% | | | |
| Pharmaceuticals - 0.1% | | | |
| Bayer AG 2.375% 11/12/79 (Reg. S) (f) | EUR | 21,300,000 | 19,381,929 |
| INDUSTRIALS - 0.0% | | | |
| Marine - 0.0% | | | |
| DP World Salaam 6% (Reg. S) (f)(i) | | 1,510,000 | 1,514,411 |
| Road & Rail - 0.0% | | | |
| National Express Group PLC 4.25% (Reg. S) (f)(i) | GBP | 1,540,000 | 1,637,621 |
| Trading Companies & Distributors - 0.0% | | | |
| AerCap Holdings NV 5.875% 10/10/79 (f) | | 5,250,000 | 4,875,746 |
|
| TOTAL INDUSTRIALS | | | 8,027,778 |
|
| INFORMATION TECHNOLOGY - 0.0% | | | |
| IT Services - 0.0% | | | |
| Network i2i Ltd.: | | | |
| 3.975% (d)(f)(i) | | 645,000 | 560,924 |
| 5.65% (d)(f)(i) | | 1,495,000 | 1,465,924 |
| | | | 2,026,848 |
| MATERIALS - 0.0% | | | |
| Construction Materials - 0.0% | | | |
| CEMEX S.A.B. de CV 5.125% (d)(f)(i) | | 1,580,000 | 1,348,372 |
| REAL ESTATE - 0.1% | | | |
| Real Estate Management & Development - 0.1% | | | |
| Aroundtown SA 3.375% (Reg. S) (f)(i) | EUR | 6,200,000 | 5,031,602 |
| AT Securities BV 5.25% (Reg. S) (f)(i) | | 13,000,000 | 11,648,534 |
| Citycon Oyj 4.496% (Reg. S) (f)(i) | EUR | 2,550,000 | 1,958,999 |
| CPI Property Group SA 3.75% (Reg. S) (f)(i) | EUR | 6,840,000 | 4,244,254 |
| Grand City Properties SA 1.5% (Reg. S) (f)(i) | EUR | 10,500,000 | 8,116,495 |
| Heimstaden Bostad AB: | | | |
| 3.248% (Reg. S) (f)(i) | EUR | 11,640,000 | 9,311,125 |
| 3.625% (Reg. S) (f)(i) | EUR | 600,000 | 456,894 |
| Samhallsbyggnadsbolaget I Norden AB 2.624% (Reg. S) (f)(i) | EUR | 5,240,000 | 2,382,702 |
| | | | 43,150,605 |
| UTILITIES - 0.1% | | | |
| Electric Utilities - 0.1% | | | |
| EDF SA: | | | |
| 5.25% (Reg. S) (f)(i) | | 18,550,000 | 17,967,540 |
| 5.625% (Reg. S) (f)(i) | | 950,000 | 894,204 |
| Enel SpA 2.5% (Reg. S) (f)(i) | EUR | 7,585,000 | 7,483,408 |
| SSE PLC: | | | |
| 3.74% (Reg. S) (f)(i) | GBP | 3,300,000 | 3,596,828 |
| 4% (Reg. S) (f)(i) | EUR | 4,600,000 | 4,309,140 |
| | | | 34,251,120 |
| Multi-Utilities - 0.0% | | | |
| Veolia Environnement SA 2% (Reg. S) (f)(i) | EUR | 7,100,000 | 5,979,554 |
|
| TOTAL UTILITIES | | | 40,230,674 |
|
| TOTAL PREFERRED SECURITIES | | | |
| (Cost $322,031,668) | | | 252,334,143 |
| | | Shares | Value |
|
| Money Market Funds - 8.2% | | | |
| Fidelity Cash Central Fund 2.33% (w) | | 1,748,737,099 | 1,749,086,847 |
| Fidelity Securities Lending Cash Central Fund 2.34% (w)(x) | | 676,340,956 | 676,408,590 |
| TOTAL MONEY MARKET FUNDS | | | |
| (Cost $2,425,439,481) | | | 2,425,495,437 |
| Purchased Swaptions - 0.0% | | | | |
| | | Expiration Date | Notional Amount | Value |
| Put Options - 0.0% | | | | |
| Option with an exercise rate of 5.75% on a credit default swap with Barclays Bank PLC to buy protection on the 5-Year iTraxx Europe Crossover Series 37 Index expiring June 2027, paying 5% quarterly. | | 9/21/22 | EUR 49,900,000 | $901,156 |
| Option with an exercise rate of 6.00% on a credit default swap with BNP Paribas S.A. to buy protection on the 5-Year iTraxx Europe Crossover Series 37 Index expiring June 2027, paying 5% quarterly. | | 10/19/22 | EUR 42,700,000 | 960,918 |
|
| TOTAL PUT OPTIONS | | | | 1,862,074 |
|
| TOTAL PURCHASED SWAPTIONS | | | | |
| (Cost $2,461,913) | | | | 1,862,074 |
| TOTAL INVESTMENT IN SECURITIES - 108.6% | | | | |
| (Cost $35,158,649,558) | | | | 32,137,128,935 |
| NET OTHER ASSETS (LIABILITIES) - (8.6)% | | | | (2,546,081,602) |
| NET ASSETS - 100% | | | | $29,591,047,333 |
| TBA Sale Commitments | | |
| | Principal Amount | Value |
| Ginnie Mae | | |
| 2% 9/1/52 | $(23,300,000) | $(20,585,941) |
| 2% 9/1/52 | (9,200,000) | (8,128,355) |
| 2% 9/1/52 | (83,150,000) | (73,464,422) |
| 2% 9/1/52 | (41,550,000) | (36,710,123) |
| 2% 9/1/52 | (29,100,000) | (25,710,339) |
| 2.5% 9/1/52 | (78,950,000) | (71,986,310) |
| 3% 9/1/52 | (15,950,000) | (14,969,740) |
| 3% 9/1/52 | (9,550,000) | (8,963,073) |
|
| TOTAL GINNIE MAE | | (260,518,303) |
|
| Uniform Mortgage Backed Securities | | |
| 1.5% 9/1/37 | (14,850,000) | (13,338,622) |
| 1.5% 9/1/37 | (11,150,000) | (10,015,194) |
| 2% 9/1/37 | (23,950,000) | (22,068,804) |
| 2% 9/1/37 | (11,950,000) | (11,011,366) |
| 2% 9/1/37 | (12,000,000) | (11,057,438) |
| 2% 9/1/52 | (11,800,000) | (10,154,458) |
| 2% 9/1/52 | (5,450,000) | (4,689,983) |
| 2% 9/1/52 | (5,300,000) | (4,560,901) |
| 2% 9/1/52 | (6,050,000) | (5,206,311) |
| 2% 9/1/52 | (5,600,000) | (4,819,065) |
| 2% 9/1/52 | (12,550,000) | (10,799,869) |
| 2% 9/1/52 | (12,200,000) | (10,498,677) |
| 2% 9/1/52 | (29,200,000) | (25,127,981) |
| 2% 9/1/52 | (64,800,000) | (55,763,465) |
| 2% 9/1/52 | (44,300,000) | (38,122,245) |
| 2% 9/1/52 | (66,550,000) | (57,269,423) |
| 2.5% 9/1/37 | (13,250,000) | (12,529,525) |
| 2.5% 9/1/37 | (7,050,000) | (6,666,653) |
| 2.5% 9/1/52 | (9,900,000) | (8,841,939) |
| 2.5% 9/1/52 | (7,700,000) | (6,877,064) |
| 2.5% 9/1/52 | (2,900,000) | (2,590,063) |
| 3% 9/1/52 | (11,000,000) | (10,179,300) |
| 3% 9/1/52 | (9,300,000) | (8,606,135) |
| 3% 9/1/52 | (10,900,000) | (10,086,761) |
|
| TOTAL UNIFORM MORTGAGE BACKED SECURITIES | | (360,881,242) |
|
| TOTAL TBA SALE COMMITMENTS | | |
| (Proceeds $631,253,566) | | $(621,399,545) |
| Futures Contracts | | | | | |
| | Number of contracts | Expiration Date | Notional Amount | Value | Unrealized Appreciation/(Depreciation) |
| Purchased | | | | | |
| Bond Index Contracts | | | | | |
| ASX 10 Year Treasury Bond Index Contracts (Australia) | 64 | Sept. 2022 | $5,253,254 | $(12,388) | $(12,388) |
| Eurex Euro-Bund Contracts (Germany) | 1 | Dec. 2022 | 146,291 | (131) | (131) |
| Eurex Euro-Bund Contracts (Germany) | 66 | Sept. 2022 | 9,814,362 | (313,980) | (313,980) |
| Eurex Euro-Buxl 30 Year Bond Contracts (Germany) | 1 | Dec. 2022 | 163,445 | (744) | (744) |
| Eurex Euro-Buxl 30 Year Bond Contracts (Germany) | 76 | Sept. 2022 | 12,571,523 | (776,293) | (776,293) |
| TME 10 Year Canadian Note Contracts (Canada) | 304 | Dec. 2022 | 28,838,741 | (31,050) | (31,050) |
| TOTAL BOND INDEX CONTRACTS | | | | | (1,134,586) |
| Treasury Contracts | | | | | |
| CBOT 2-Year U.S. Treasury Note Contracts (United States) | 1,132 | Dec. 2022 | 235,827,438 | (803,267) | (803,267) |
| CBOT 5-Year U.S. Treasury Note Contracts (United States) | 672 | Dec. 2022 | 74,471,250 | (828,846) | (828,846) |
| CBOT Long Term U.S. Treasury Bond Contracts (United States) | 735 | Dec. 2022 | 99,845,156 | (2,881,653) | (2,881,653) |
| TOTAL TREASURY CONTRACTS | | | | | (4,513,766) |
|
| TOTAL PURCHASED | | | | | (5,648,352) |
|
| Sold | | | | | |
| Bond Index Contracts | | | | | |
| Eurex Euro-Bobl Contracts (Germany) | 193 | Sept. 2022 | 23,872,025 | 336,697 | 336,697 |
| ICE Long Gilt Contracts (United Kingdom) | 136 | Dec. 2022 | 17,051,990 | 435,056 | 435,056 |
| TOTAL BOND INDEX CONTRACTS | | | | | 771,753 |
| Treasury Contracts | | | | | |
| CBOT 10-Year U.S. Treasury Note Contracts (United States) | 590 | Dec. 2022 | 68,974,688 | 1,136,588 | 1,136,588 |
| CBOT 5-Year U.S. Treasury Note Contracts (United States) | 278 | Dec. 2022 | 30,808,047 | 351,286 | 351,286 |
| CBOT Long Term U.S. Treasury Bond Contracts (United States) | 828 | Dec. 2022 | 112,478,625 | 2,945,672 | 2,945,672 |
| CBOT Ultra Long Term U.S. Treasury Bond Contracts (United States) | 7 | Dec. 2022 | 1,046,500 | 22,297 | 22,297 |
| TOTAL TREASURY CONTRACTS | | | | | 4,455,843 |
|
| TOTAL SOLD | | | | | 5,227,596 |
|
| TOTAL FUTURES CONTRACTS | | | | | $(420,756) |
The notional amount of futures purchased as a percentage of Net Assets is 1.5%
The notional amount of futures sold as a percentage of Net Assets is 0.9%
| Forward Foreign Currency Contracts | | | | | | |
| Currency Purchased | Currency Sold | Counterparty | Settlement Date | Unrealized Appreciation/(Depreciation) |
| EUR | 50,000 | USD | 50,240 | BNP Paribas S.A. | 9/2/22 | $7 |
| CAD | 1,036,000 | USD | 790,918 | Brown Brothers Harriman & Co | 9/15/22 | (2,181) |
| EUR | 542,000 | USD | 562,038 | BNP Paribas S.A. | 9/15/22 | (16,875) |
| EUR | 859,000 | USD | 860,520 | BNP Paribas S.A. | 9/15/22 | 3,493 |
| EUR | 11,806,000 | USD | 11,872,810 | BNP Paribas S.A. | 9/15/22 | 2,092 |
| EUR | 1,446,000 | USD | 1,443,381 | JPMorgan Chase Bank, N.A. | 9/15/22 | 11,058 |
| EUR | 628,000 | USD | 625,579 | JPMorgan Chase Bank, N.A. | 9/15/22 | 6,086 |
| EUR | 375,000 | USD | 382,751 | State Street Bank and Trust Co | 9/15/22 | (5,563) |
| GBP | 488,000 | USD | 578,166 | BNP Paribas S.A. | 9/15/22 | (11,113) |
| GBP | 668,000 | USD | 788,721 | Brown Brothers Harriman & Co | 9/15/22 | (12,509) |
| GBP | 253,000 | USD | 303,770 | Citibank, N. A. | 9/15/22 | (9,785) |
| GBP | 2,780,000 | USD | 3,235,240 | Goldman Sachs Bank USA | 9/15/22 | (4,895) |
| GBP | 292,000 | USD | 358,379 | HSBC Bank | 9/15/22 | (19,077) |
| GBP | 259,000 | USD | 305,866 | Royal Bank of Canada | 9/15/22 | (4,909) |
| USD | 233,011 | AUD | 336,000 | BNP Paribas S.A. | 9/15/22 | 3,053 |
| USD | 182,996 | AUD | 260,000 | BNP Paribas S.A. | 9/15/22 | 5,052 |
| USD | 525,780 | CAD | 676,000 | BNP Paribas S.A. | 9/15/22 | 11,121 |
| USD | 176,165 | CAD | 227,000 | Goldman Sachs Bank USA | 9/15/22 | 3,343 |
| USD | 228,199 | CAD | 295,000 | Goldman Sachs Bank USA | 9/15/22 | 3,607 |
| USD | 326,677 | CAD | 424,000 | State Street Bank and Trust Co | 9/15/22 | 3,873 |
| USD | 388,034,619 | EUR | 379,233,000 | BNP Paribas S.A. | 9/15/22 | 6,588,351 |
| USD | 881,414 | EUR | 861,000 | BNP Paribas S.A. | 9/15/22 | 15,389 |
| USD | 998,654 | EUR | 971,000 | BNP Paribas S.A. | 9/15/22 | 21,987 |
| USD | 747,454 | EUR | 734,000 | BNP Paribas S.A. | 9/15/22 | 9,170 |
| USD | 295,595 | EUR | 296,000 | Canadian Imperial Bk. of Comm. | 9/15/22 | (2,132) |
| USD | 1,697,087 | EUR | 1,658,000 | JPMorgan Chase Bank, N.A. | 9/15/22 | 29,411 |
| USD | 1,016,442 | EUR | 1,019,000 | JPMorgan Chase Bank, N.A. | 9/15/22 | (8,505) |
| USD | 171,626,716 | GBP | 140,322,000 | Goldman Sachs Bank USA | 9/15/22 | 8,573,300 |
| USD | 560,623 | GBP | 464,000 | Goldman Sachs Bank USA | 9/15/22 | 21,458 |
| USD | 185,317 | GBP | 153,000 | State Street Bank and Trust Co | 9/15/22 | 7,532 |
| TOTAL FORWARD FOREIGN CURRENCY CONTRACTS | | | | | | $15,221,839 |
| | | | | | Unrealized Appreciation | 15,319,383 |
| | | | | | Unrealized Depreciation | (97,544) |
Swaps
| Underlying Reference | Maturity Date | Clearinghouse / Counterparty | Fixed Payment Received/(Paid) | Payment Frequency | Notional Amount | Value | Upfront Premium Received/(Paid) | Unrealized Appreciation/(Depreciation) |
| Credit Default Swaps | | | | | | | | |
| Buy Protection | | | | | | | | |
| CMBX N.A. AAA Index Series 12 | Aug. 2061 | Citigroup Global Markets Ltd. | (0.5%) | Monthly | $35,680,000 | $225,601 | $(467) | $225,134 |
| CMBX N.A. AAA Index Series 13 | Dec. 2072 | Citigroup Global Markets Ltd. | (0.5%) | Monthly | 2,280,000 | 27,241 | (33,734) | (6,493) |
| CMBX N.A. AAA Index Series 13 | Dec. 2072 | Citigroup Global Markets Ltd. | (0.5%) | Monthly | 9,300,000 | 111,115 | (105,906) | 5,209 |
| CMBX N.A. AAA Index Series 13 | Dec. 2072 | Citigroup Global Markets Ltd. | (0.5%) | Monthly | 3,090,000 | 36,919 | (26,943) | 9,976 |
| CMBX N.A. AAA Index Series 13 | Dec. 2072 | Citigroup Global Markets Ltd. | (0.5%) | Monthly | 6,120,000 | 73,121 | (68,090) | 5,031 |
| CMBX N.A. AAA Index Series 13 | Dec. 2072 | Citigroup Global Markets Ltd. | (0.5%) | Monthly | 1,920,000 | 22,940 | 11,024 | 33,964 |
| CMBX N.A. AAA Index Series 13 | Dec. 2072 | Citigroup Global Markets Ltd. | (0.5%) | Monthly | 10,070,000 | 120,315 | 45,129 | 165,444 |
| CMBX N.A. AAA Index Series 13 | Dec. 2072 | Citigroup Global Markets Ltd. | (0.5%) | Monthly | 2,830,000 | 33,813 | (9,667) | 24,146 |
| CMBX N.A. AAA Index Series 13 | Dec. 2072 | Citigroup Global Markets Ltd. | (0.5%) | Monthly | 3,930,000 | 46,955 | (12,091) | 34,864 |
| CMBX N.A. AAA Index Series 13 | Dec. 2072 | Citigroup Global Markets Ltd. | (0.5%) | Monthly | 5,200,000 | 62,129 | 4,873 | 67,002 |
| CMBX N.A. AAA Index Series 13 | Dec. 2072 | Goldman Sachs & Co. LLC | (0.5%) | Monthly | 6,110,000 | 73,002 | (73,190) | (188) |
| CMBX N.A. AAA Index Series 13 | Dec. 2072 | Goldman Sachs & Co. LLC | (0.5%) | Monthly | 2,600,000 | 31,065 | (3,899) | 27,166 |
| CMBX N.A. AAA Index Series 13 | Dec. 2072 | JPMorgan Securities LLC | (0.5%) | Monthly | 2,920,000 | 34,888 | (11,731) | 23,157 |
| CMBX N.A. AAA Index Series 13 | Dec. 2072 | JPMorgan Securities LLC | (0.5%) | Monthly | 5,870,000 | 70,134 | (7,244) | 62,890 |
| CMBX N.A. AAA Index Series 13 | Dec. 2072 | Morgan Stanley Capital Services LLC | (0.5%) | Monthly | 2,990,000 | 35,724 | (51,153) | (15,429) |
| CMBX N.A. AAA Index Series 13 | Dec. 2072 | Morgan Stanley Capital Services LLC | (0.5%) | Monthly | 2,150,000 | 25,688 | 11,580 | 37,268 |
| CMBX N.A. AAA Index Series 13 | Dec. 2072 | Morgan Stanley Capital Services LLC | (0.5%) | Monthly | 9,330,000 | 111,474 | (67,074) | 44,400 |
| CMBX N.A. AAA Index Series 13 | Dec. 2072 | Morgan Stanley Capital Services LLC | (0.5%) | Monthly | 5,530,000 | 66,072 | (52,713) | 13,359 |
| CMBX N.A. AAA Index Series 13 | Dec. 2072 | Morgan Stanley Capital Services LLC | (0.5%) | Monthly | 4,960,000 | 59,262 | (26,877) | 32,385 |
| Intesa Sanpaolo SpA | Dec. 2026 | JPMorgan Chase Bank, N.A. | (1%) | Quarterly | EUR 8,300,000 | 62,309 | 186,042 | 248,351 |
|
| TOTAL CREDIT DEFAULT SWAPS | | | | | | $1,329,767 | $(292,131) | $1,037,636 |
|
Swaps
| Payment Received | Payment Frequency | Payment Paid | Payment Frequency | Clearinghouse / Counterparty(1) | Maturity Date | Notional Amount | Value | Upfront Premium Received/(Paid)(2) | Unrealized Appreciation/(Depreciation) |
| Interest Rate Swaps | | | | | | | | | |
| 2.75% | Annual | U.S. Secured Overnight Fin. Rate (SOFR) Index(3) | Annual | LCH | Sep. 2024 | $43,262,000 | $(281,047) | $0 | $(281,047) |
| 2.75% | Annual | U.S. Secured Overnight Fin. Rate (SOFR) Index(3) | Annual | LCH | Sep. 2027 | 20,897,000 | (217,646) | 0 | (217,646) |
| 2.75% | Annual | U.S. Secured Overnight Fin. Rate (SOFR) Index(3) | Annual | LCH | Sep. 2032 | 5,827,000 | (41,637) | 0 | (41,637) |
|
| TOTAL INTEREST RATE SWAPS | | | | | | | $(540,330) | $0 | $(540,330) |
|
(1) Swaps with LCH Clearnet Group (LCH) are centrally cleared over-the-counter (OTC) swaps.
(2) Any premiums for centrally cleared over-the-counter (OTC) swaps are recorded periodically throughout the term of the swap to variation margin and included in unrealized appreciation (depreciation).
(3) Represents floating rate.
Currency Abbreviations
AUD – Australian dollar
CAD – Canadian dollar
EUR – European Monetary Unit
GBP – British pound sterling
Legend
(a) Amount is stated in United States dollars unless otherwise noted.
(b) Restricted securities (including private placements) - Investment in securities not registered under the Securities Act of 1933 (excluding 144A issues). At the end of the period, the value of restricted securities (excluding 144A issues) amounted to $16,612,767 or 0.1% of net assets.
(c) Level 3 security
(d) Security exempt from registration under Rule 144A of the Securities Act of 1933. These securities may be resold in transactions exempt from registration, normally to qualified institutional buyers. At the end of the period, the value of these securities amounted to $6,788,783,775 or 22.9% of net assets.
(e) Non-income producing - Security is in default.
(f) Coupon rates for floating and adjustable rate securities reflect the rates in effect at period end.
(g) Coupon is indexed to a floating interest rate which may be multiplied by a specified factor and/or subject to caps or floors.
(h) Security initially issued at one coupon which converts to a higher coupon at a specified date. The rate shown is the rate at period end.
(i) Security is perpetual in nature with no stated maturity date.
(j) Security or a portion of the security was pledged to cover margin requirements for futures contracts. At period end, the value of securities pledged amounted to $11,325,559.
(k) Security or a portion of the security was pledged to cover margin requirements for centrally cleared OTC swaps. At period end, the value of securities pledged amounted to $1,600,302.
(l) Security or a portion of the security has been segregated as collateral for mortgage-backed or asset-backed securities purchased on a delayed delivery or when-issued basis. At period end, the value of securities pledged amounted to $26,925,436.
(m) Security or a portion of the security is on loan at period end.
(n) Security or a portion of the security purchased on a delayed delivery or when-issued basis.
(o) Interest Only (IO) security represents the right to receive only monthly interest payments on an underlying pool of mortgages or assets. Principal shown is the outstanding par amount of the pool as of the end of the period.
(p) Coupon is inversely indexed to a floating interest rate multiplied by a specified factor. The price may be considerably more volatile than the price of a comparable fixed rate security.
(q) Principal Only Strips represent the right to receive the monthly principal payments on an underlying pool of mortgage loans.
(r) Represents an investment in an underlying pool of reverse mortgages which typically do not require regular principal and interest payments as repayment is deferred until a maturity event.
(s) Non-income producing
(t) Remaining maturities of bank loan obligations may be less than the stated maturities shown as a result of contractual or optional prepayments by the borrower. Such prepayments cannot be predicted with certainty.
(u) Position or a portion of the position represents an unfunded loan commitment. At period end, the total principal amount and market value of unfunded commitments totaled $5,662,705 and $5,382,600, respectively.
(v) The coupon rate will be determined upon settlement of the loan after period end.
(w) Affiliated fund that is generally available only to investment companies and other accounts managed by Fidelity Investments. The rate quoted is the annualized seven-day yield of the fund at period end. A complete unaudited listing of the fund's holdings as of its most recent quarter end is available upon request. In addition, each Fidelity Central Fund's financial statements, which are not covered by the Fund's Report of Independent Registered Public Accounting Firm, are available on the SEC's website or upon request.
(x) Investment made with cash collateral received from securities on loan.
Additional information on each restricted holding is as follows:
| Security | Acquisition Date | Acquisition Cost |
| Chesapeake Energy Corp. | 2/10/21 | $5,862 |
| Mesquite Energy, Inc. 15% 7/15/23 | 7/10/20 - 1/18/22 | $894,620 |
| Mesquite Energy, Inc. 15% 7/15/23 | 11/5/20 - 1/18/22 | $1,544,200 |
Affiliated Central Funds
Fiscal year to date information regarding the Fund's investments in Fidelity Central Funds, including the ownership percentage, is presented below.
| Fund | Value, beginning of period | Purchases | Sales Proceeds | Dividend Income | Realized Gain/Loss | Change in Unrealized appreciation (depreciation) | Value, end of period | % ownership, end of period |
| Fidelity Cash Central Fund 2.33% | $2,352,819,415 | $11,052,123,403 | $11,655,855,972 | $8,915,392 | $-- | $1 | $1,749,086,847 | 3.4% |
| Fidelity Securities Lending Cash Central Fund 2.34% | 411,194,230 | 5,446,553,607 | 5,181,339,247 | 413,374 | -- | -- | 676,408,590 | 2.0% |
| Total | $2,764,013,645 | $16,498,677,010 | $16,837,195,219 | $9,328,766 | $-- | $1 | $2,425,495,437 | |
Amounts in the income column in the above table include any capital gain distributions from underlying funds, which are presented in the corresponding line-item in the Statement of Operations, if applicable. Amount for Fidelity Securities Lending Cash Central Fund represents the income earned on investing cash collateral, less rebates paid to borrowers and any lending agent fees associated with the loan, plus any premium payments received for lending certain types of securities.
Investment Valuation
The following is a summary of the inputs used, as of August 31, 2022, involving the Fund's assets and liabilities carried at fair value. The inputs or methodology used for valuing securities may not be an indication of the risk associated with investing in those securities. For more information on valuation inputs, and their aggregation into the levels used below, please refer to the Investment Valuation section in the accompanying Notes to Financial Statements.
| | Valuation Inputs at Reporting Date: |
| Description | Total | Level 1 | Level 2 | Level 3 |
| Investments in Securities: | | | | |
| Equities: | | | | |
| Communication Services | $1,499,603 | $1,465,000 | $3 | $34,600 |
| Consumer Discretionary | 4,992,780 | 3,686,760 | -- | 1,306,020 |
| Energy | 48,753,428 | 36,215,982 | -- | 12,537,446 |
| Financials | 7,984,276 | 4,040,712 | -- | 3,943,564 |
| Industrials | 652,712 | -- | -- | 652,712 |
| Information Technology | 311,584 | -- | -- | 311,584 |
| Real Estate | 4,819,476 | 4,285,807 | 533,669 | -- |
| Utilities | 2,337,245 | -- | -- | 2,337,245 |
| Corporate Bonds | 11,413,017,145 | -- | 11,394,277,227 | 18,739,918 |
| U.S. Government and Government Agency Obligations | 7,303,137,456 | -- | 7,303,137,456 | -- |
| U.S. Government Agency - Mortgage Securities | 4,395,397,149 | -- | 4,395,397,149 | -- |
| Asset-Backed Securities | 1,860,707,712 | -- | 1,858,881,856 | 1,825,856 |
| Collateralized Mortgage Obligations | 218,654,482 | -- | 218,654,467 | 15 |
| Commercial Mortgage Securities | 1,607,394,984 | -- | 1,600,205,144 | 7,189,840 |
| Municipal Securities | 158,754,382 | -- | 158,754,382 | -- |
| Foreign Government and Government Agency Obligations | 343,827,990 | -- | 343,827,990 | -- |
| Supranational Obligations | 27,107,094 | -- | 27,107,094 | -- |
| Bank Loan Obligations | 2,030,727,514 | -- | 1,940,761,023 | 89,966,491 |
| Bank Notes | 27,360,269 | -- | 27,360,269 | -- |
| Preferred Securities | 252,334,143 | -- | 252,334,143 | -- |
| Money Market Funds | 2,425,495,437 | 2,425,495,437 | -- | -- |
| Purchased Swaptions | 1,862,074 | -- | 1,862,074 | -- |
| Total Investments in Securities: | $32,137,128,935 | $2,475,189,698 | $29,523,093,946 | $138,845,291 |
| Derivative Instruments: | | | | |
| Assets | | | | |
| Futures Contracts | $5,227,596 | $5,227,596 | $-- | $-- |
| Forward Foreign Currency Contracts | 15,319,383 | -- | 15,319,383 | -- |
| Swaps | 1,329,767 | -- | 1,329,767 | -- |
| Total Assets | $21,876,746 | $5,227,596 | $16,649,150 | $-- |
| Liabilities | | | | |
| Futures Contracts | $(5,648,352) | $(5,648,352) | $-- | $-- |
| Forward Foreign Currency Contracts | (97,544) | -- | (97,544) | -- |
| Swaps | (540,330) | -- | (540,330) | -- |
| Total Liabilities | $(6,286,226) | $(5,648,352) | $(637,874) | $-- |
| Total Derivative Instruments: | $15,590,520 | $(420,756) | $16,011,276 | $-- |
| Other Financial Instruments: | | | | |
| TBA Sale Commitments | $(621,399,545) | $-- | $(621,399,545) | $-- |
| Total Other Financial Instruments: | $(621,399,545) | $-- | $(621,399,545) | $-- |
Value of Derivative Instruments
The following table is a summary of the Fund's value of derivative instruments by primary risk exposure as of August 31, 2022. For additional information on derivative instruments, please refer to the Derivative Instruments section in the accompanying Notes to Financial Statements.
| Primary Risk Exposure / Derivative Type | Value |
| | Asset | Liability |
| Credit Risk | | |
| Purchased Swaptions(a) | $1,862,074 | $-- |
| Swaps(b) | 1,329,767 | -- |
| Total Credit Risk | 3,191,841 | -- |
| Foreign Exchange Risk | | |
| Forward Foreign Currency Contracts(c) | 15,319,383 | (97,544) |
| Total Foreign Exchange Risk | 15,319,383 | (97,544) |
| Interest Rate Risk | | |
| Futures Contracts(d) | 5,227,596 | (5,648,352) |
| Swaps(e) | -- | (540,330) |
| Total Interest Rate Risk | 5,227,596 | (6,188,682) |
| Total Value of Derivatives | $23,738,820 | $(6,286,226) |
(a) Gross value is included in the Statement of Assets and Liabilities in the investments in securities, at value line-item.
(b) For bi-lateral over-the-counter (OTC) swaps, reflects gross value which is presented in the Statement of Assets and Liabilities in the bi-lateral OTC swaps, at value line-items.
(c) Gross value is presented in the Statement of Assets and Liabilities in the unrealized appreciation/depreciation on forward foreign currency contracts line-items.
(d) Reflects gross cumulative appreciation (depreciation) on futures contracts as presented in the Schedule of Investments. In the Statement of Assets and Liabilities, the period end daily variation margin is included in receivable or payable for daily variation margin on futures contracts, and the net cumulative appreciation (depreciation) is included in Total accumulated earnings (loss).
(e) For centrally cleared over-the-counter (OTC) swaps, reflects gross cumulative appreciation (depreciation) as presented in the Schedule of Investments. In the Statement of Assets and Liabilities, the period end daily variation margin for centrally cleared OTC swaps is included in receivable or payable for daily variation margin on centrally cleared OTC swaps, and the net cumulative appreciation (depreciation) for centrally cleared OTC swaps is included in Total accumulated earnings (loss).
See accompanying notes which are an integral part of the financial statements.
Financial Statements
Statement of Assets and Liabilities
| | | August 31, 2022 |
| Assets | | |
Investment in securities, at value (including securities loaned of $661,035,668) — See accompanying schedule:
Unaffiliated issuers (cost $32,733,210,077) | $29,711,633,498 | |
| Fidelity Central Funds (cost $2,425,439,481) | 2,425,495,437 | |
| Total Investment in Securities (cost $35,158,649,558) | | $32,137,128,935 |
| Segregated cash with brokers for derivative instruments | | 6,740 |
| Cash | | 2,335,576 |
| Foreign currency held at value (cost $1,482,464) | | 1,472,341 |
| Receivable for investments sold | | |
| Regular delivery | | 16,480,048 |
| Delayed delivery | | 55,909 |
| Receivable for TBA sale commitments | | 631,253,566 |
| Unrealized appreciation on forward foreign currency contracts | | 15,319,383 |
| Receivable for fund shares sold | | 25,803,033 |
| Dividends receivable | | 340,288 |
| Interest receivable | | 221,109,391 |
| Distributions receivable from Fidelity Central Funds | | 3,557,791 |
| Receivable for daily variation margin on futures contracts | | 436,560 |
| Receivable for daily variation margin on centrally cleared OTC swaps | | 46,481 |
| Bi-lateral OTC swaps, at value | | 1,329,767 |
| Receivable from investment adviser for expense reductions | | 182,844 |
| Other receivables | | 350,827 |
| Total assets | | 33,057,209,480 |
| Liabilities | | |
| Payable for investments purchased | | |
| Regular delivery | $70,166,081 | |
| Delayed delivery | 2,041,875,152 | |
| TBA sale commitments, at value | 621,399,545 | |
| Unrealized depreciation on forward foreign currency contracts | 97,544 | |
| Payable for fund shares redeemed | 35,320,771 | |
| Distributions payable | 8,784,263 | |
| Accrued management fee | 7,468,488 | |
| Distribution and service plan fees payable | 314,578 | |
| Other affiliated payables | 3,853,329 | |
| Other payables and accrued expenses | 473,806 | |
| Collateral on securities loaned | 676,408,590 | |
| Total liabilities | | 3,466,162,147 |
| Net Assets | | $29,591,047,333 |
| Net Assets consist of: | | |
| Paid in capital | | $32,940,629,094 |
| Total accumulated earnings (loss) | | (3,349,581,761) |
| Net Assets | | $29,591,047,333 |
| Net Asset Value and Maximum Offering Price | | |
| Class A: | | |
| Net Asset Value and redemption price per share ($729,405,492 ÷ 75,231,454 shares)(a) | | $9.70 |
| Maximum offering price per share (100/96.00 of $9.70) | | $10.10 |
| Class M: | | |
| Net Asset Value and redemption price per share ($301,767,732 ÷ 31,182,328 shares)(a) | | $9.68 |
| Maximum offering price per share (100/96.00 of $9.68) | | $10.08 |
| Class C: | | |
| Net Asset Value and offering price per share ($112,310,999 ÷ 11,580,702 shares)(a) | | $9.70 |
| Total Bond: | | |
| Net Asset Value, offering price and redemption price per share ($14,816,562,636 ÷ 1,528,921,555 shares) | | $9.69 |
| Class I: | | |
| Net Asset Value, offering price and redemption price per share ($7,251,750,651 ÷ 749,490,706 shares) | | $9.68 |
| Class Z: | | |
| Net Asset Value, offering price and redemption price per share ($6,379,249,823 ÷ 659,257,982 shares) | | $9.68 |
(a) Redemption price per share is equal to net asset value less any applicable contingent deferred sales charge.
See accompanying notes which are an integral part of the financial statements.
Statement of Operations
| | | Year ended August 31, 2022 |
| Investment Income | | |
| Dividends | | $16,173,836 |
| Interest | | 930,806,624 |
| Income from Fidelity Central Funds (including $413,374 from security lending) | | 9,328,766 |
| Total income | | 956,309,226 |
| Expenses | | |
| Management fee | $94,727,444 | |
| Transfer agent fees | 32,572,235 | |
| Distribution and service plan fees | 4,330,177 | |
| Fund wide operations fee | 16,729,996 | |
| Independent trustees' fees and expenses | 106,042 | |
| Legal | 366,923 | |
| Miscellaneous | 792 | |
| Total expenses before reductions | 148,833,609 | |
| Expense reductions | (3,045,810) | |
| Total expenses after reductions | | 145,787,799 |
| Net investment income (loss) | | 810,521,427 |
| Realized and Unrealized Gain (Loss) | | |
| Net realized gain (loss) on: | | |
| Investment securities: | | |
| Unaffiliated issuers | (328,660,769) | |
| Forward foreign currency contracts | 93,039,867 | |
| Foreign currency transactions | (1,429,223) | |
| Futures contracts | (15,646,179) | |
| Swaps | (3,391,583) | |
| Total net realized gain (loss) | | (256,087,887) |
| Change in net unrealized appreciation (depreciation) on: | | |
| Investment securities: | | |
| Unaffiliated issuers | (4,388,859,701) | |
| Fidelity Central Funds | 1 | |
| Forward foreign currency contracts | 10,866,272 | |
| Assets and liabilities in foreign currencies | (531,747) | |
| Futures contracts | (34,030) | |
| Swaps | 1,316,114 | |
| TBA sale commitments | 11,044,836 | |
| Total change in net unrealized appreciation (depreciation) | | (4,366,198,255) |
| Net gain (loss) | | (4,622,286,142) |
| Net increase (decrease) in net assets resulting from operations | | $(3,811,764,715) |
See accompanying notes which are an integral part of the financial statements.
Statement of Changes in Net Assets
| | Year ended August 31, 2022 | Year ended August 31, 2021 |
| Increase (Decrease) in Net Assets | | |
| Operations | | |
| Net investment income (loss) | $810,521,427 | $749,373,128 |
| Net realized gain (loss) | (256,087,887) | (81,642,153) |
| Change in net unrealized appreciation (depreciation) | (4,366,198,255) | 88,549,830 |
| Net increase (decrease) in net assets resulting from operations | (3,811,764,715) | 756,280,805 |
| Distributions to shareholders | (828,469,006) | (1,559,103,812) |
| Share transactions - net increase (decrease) | 79,472,472 | 4,064,508,405 |
| Total increase (decrease) in net assets | (4,560,761,249) | 3,261,685,398 |
| Net Assets | | |
| Beginning of period | 34,151,808,582 | 30,890,123,184 |
| End of period | $29,591,047,333 | $34,151,808,582 |
See accompanying notes which are an integral part of the financial statements.
Financial Highlights
Fidelity Total Bond Fund Class A
| Years ended August 31, | 2022 | 2021 | 2020 | 2019 | 2018 |
| Selected Per–Share Data | | | | | |
| Net asset value, beginning of period | $11.23 | $11.52 | $11.00 | $10.38 | $10.77 |
| Income from Investment Operations | | | | | |
| Net investment income (loss)A,B | .237 | .224 | .269 | .300 | .273 |
| Net realized and unrealized gain (loss) | (1.524) | .006 | .521 | .646 | (.375) |
| Total from investment operations | (1.287) | .230 | .790 | .946 | (.102) |
| Distributions from net investment income | (.238) | (.214) | (.260) | (.326) | (.263) |
| Distributions from net realized gain | (.005) | (.306) | (.010) | – | (.025) |
| Total distributions | (.243) | (.520) | (.270) | (.326) | (.288) |
| Net asset value, end of period | $9.70 | $11.23 | $11.52 | $11.00 | $10.38 |
| Total ReturnC,D | (11.59)% | 2.09% | 7.30% | 9.32% | (.95)% |
| Ratios to Average Net AssetsB,E,F | | | | | |
| Expenses before reductions | .75% | .75% | .75% | .75% | .75% |
| Expenses net of fee waivers, if any | .75% | .75% | .75% | .75% | .75% |
| Expenses net of all reductions | .75% | .75% | .75% | .75% | .75% |
| Net investment income (loss) | 2.25% | 2.01% | 2.42% | 2.87% | 2.60% |
| Supplemental Data | | | | | |
| Net assets, end of period (000 omitted) | $729,405 | $900,239 | $803,222 | $614,156 | $475,569 |
| Portfolio turnover rateG | 129% | 195% | 222% | 170%H | 109% |
A Calculated based on average shares outstanding during the period.
B Net investment income (loss) is affected by the timing of the declaration of dividends by any underlying mutual funds or exchange-traded funds (ETFs). Net investment income (loss) of any such underlying funds is not included in the Fund's net investment income (loss) ratio.
C Total returns would have been lower if certain expenses had not been reduced during the applicable periods shown.
D Total returns do not include the effect of the sales charges.
E Fees and expenses of any underlying mutual funds or exchange-traded funds (ETFs) are not included in the Fund's expense ratio. The Fund indirectly bears its proportionate share of these expenses. For additional expense information related to investments in Fidelity Central Funds, please refer to the "Investments in Fidelity Central Funds" note found in the Notes to Financial Statements section of the most recent Annual or Semi-Annual report.
F Expense ratios reflect operating expenses of the class. Expenses before reductions do not reflect amounts reimbursed, waived, or reduced through arrangements with the investment adviser, brokerage services, or other offset arrangements, if applicable, and do not represent the amount paid by the class during periods when reimbursements, waivers or reductions occur.
G Amount does not include the portfolio activity of any underlying mutual funds or exchange-traded funds (ETFs).
H Portfolio turnover rate excludes securities received or delivered in-kind.
See accompanying notes which are an integral part of the financial statements.
Fidelity Total Bond Fund Class M
| Years ended August 31, | 2022 | 2021 | 2020 | 2019 | 2018 |
| Selected Per–Share Data | | | | | |
| Net asset value, beginning of period | $11.21 | $11.50 | $10.98 | $10.36 | $10.75 |
| Income from Investment Operations | | | | | |
| Net investment income (loss)A,B | .237 | .224 | .268 | .300 | .272 |
| Net realized and unrealized gain (loss) | (1.525) | .006 | .522 | .646 | (.375) |
| Total from investment operations | (1.288) | .230 | .790 | .946 | (.103) |
| Distributions from net investment income | (.237) | (.214) | (.260) | (.326) | (.262) |
| Distributions from net realized gain | (.005) | (.306) | (.010) | – | (.025) |
| Total distributions | (.242) | (.520) | (.270) | (.326) | (.287) |
| Net asset value, end of period | $9.68 | $11.21 | $11.50 | $10.98 | $10.36 |
| Total ReturnC,D | (11.62)% | 2.09% | 7.31% | 9.33% | (.96)% |
| Ratios to Average Net AssetsB,E,F | | | | | |
| Expenses before reductions | .75% | .75% | .75% | .75% | .76% |
| Expenses net of fee waivers, if any | .75% | .75% | .75% | .75% | .76% |
| Expenses net of all reductions | .75% | .75% | .75% | .75% | .76% |
| Net investment income (loss) | 2.25% | 2.01% | 2.42% | 2.86% | 2.60% |
| Supplemental Data | | | | | |
| Net assets, end of period (000 omitted) | $301,768 | $373,315 | $369,850 | $343,191 | $307,837 |
| Portfolio turnover rateG | 129% | 195% | 222% | 170%H | 109% |
A Calculated based on average shares outstanding during the period.
B Net investment income (loss) is affected by the timing of the declaration of dividends by any underlying mutual funds or exchange-traded funds (ETFs). Net investment income (loss) of any such underlying funds is not included in the Fund's net investment income (loss) ratio.
C Total returns would have been lower if certain expenses had not been reduced during the applicable periods shown.
D Total returns do not include the effect of the sales charges.
E Fees and expenses of any underlying mutual funds or exchange-traded funds (ETFs) are not included in the Fund's expense ratio. The Fund indirectly bears its proportionate share of these expenses. For additional expense information related to investments in Fidelity Central Funds, please refer to the "Investments in Fidelity Central Funds" note found in the Notes to Financial Statements section of the most recent Annual or Semi-Annual report.
F Expense ratios reflect operating expenses of the class. Expenses before reductions do not reflect amounts reimbursed, waived, or reduced through arrangements with the investment adviser, brokerage services, or other offset arrangements, if applicable, and do not represent the amount paid by the class during periods when reimbursements, waivers or reductions occur.
G Amount does not include the portfolio activity of any underlying mutual funds or exchange-traded funds (ETFs).
H Portfolio turnover rate excludes securities received or delivered in-kind.
See accompanying notes which are an integral part of the financial statements.
Fidelity Total Bond Fund Class C
| Years ended August 31, | 2022 | 2021 | 2020 | 2019 | 2018 |
| Selected Per–Share Data | | | | | |
| Net asset value, beginning of period | $11.24 | $11.53 | $11.01 | $10.39 | $10.77 |
| Income from Investment Operations | | | | | |
| Net investment income (loss)A,B | .157 | .139 | .184 | .220 | .193 |
| Net realized and unrealized gain (loss) | (1.535) | .006 | .521 | .646 | (.365) |
| Total from investment operations | (1.378) | .145 | .705 | .866 | (.172) |
| Distributions from net investment income | (.157) | (.129) | (.175) | (.246) | (.183) |
| Distributions from net realized gain | (.005) | (.306) | (.010) | – | (.025) |
| Total distributions | (.162) | (.435) | (.185) | (.246) | (.208) |
| Net asset value, end of period | $9.70 | $11.24 | $11.53 | $11.01 | $10.39 |
| Total ReturnC,D | (12.35)% | 1.31% | 6.49% | 8.49% | (1.60)% |
| Ratios to Average Net AssetsB,E,F | | | | | |
| Expenses before reductions | 1.52% | 1.51% | 1.51% | 1.52% | 1.52% |
| Expenses net of fee waivers, if any | 1.52% | 1.51% | 1.51% | 1.52% | 1.52% |
| Expenses net of all reductions | 1.52% | 1.51% | 1.51% | 1.52% | 1.52% |
| Net investment income (loss) | 1.49% | 1.24% | 1.66% | 2.10% | 1.84% |
| Supplemental Data | | | | | |
| Net assets, end of period (000 omitted) | $112,311 | $171,689 | $205,949 | $153,944 | $168,366 |
| Portfolio turnover rateG | 129% | 195% | 222% | 170%H | 109% |
A Calculated based on average shares outstanding during the period.
B Net investment income (loss) is affected by the timing of the declaration of dividends by any underlying mutual funds or exchange-traded funds (ETFs). Net investment income (loss) of any such underlying funds is not included in the Fund's net investment income (loss) ratio.
C Total returns would have been lower if certain expenses had not been reduced during the applicable periods shown.
D Total returns do not include the effect of the contingent deferred sales charge.
E Fees and expenses of any underlying mutual funds or exchange-traded funds (ETFs) are not included in the Fund's expense ratio. The Fund indirectly bears its proportionate share of these expenses. For additional expense information related to investments in Fidelity Central Funds, please refer to the "Investments in Fidelity Central Funds" note found in the Notes to Financial Statements section of the most recent Annual or Semi-Annual report.
F Expense ratios reflect operating expenses of the class. Expenses before reductions do not reflect amounts reimbursed, waived, or reduced through arrangements with the investment adviser, brokerage services, or other offset arrangements, if applicable, and do not represent the amount paid by the class during periods when reimbursements, waivers or reductions occur.
G Amount does not include the portfolio activity of any underlying mutual funds or exchange-traded funds (ETFs).
H Portfolio turnover rate excludes securities received or delivered in-kind.
See accompanying notes which are an integral part of the financial statements.
Fidelity Total Bond Fund
| Years ended August 31, | 2022 | 2021 | 2020 | 2019 | 2018 |
| Selected Per–Share Data | | | | | |
| Net asset value, beginning of period | $11.23 | $11.52 | $11.00 | $10.38 | $10.76 |
| Income from Investment Operations | | | | | |
| Net investment income (loss)A,B | .267 | .258 | .301 | .333 | .305 |
| Net realized and unrealized gain (loss) | (1.533) | .005 | .522 | .645 | (.365) |
| Total from investment operations | (1.266) | .263 | .823 | .978 | (.060) |
| Distributions from net investment income | (.269) | (.247) | (.293) | (.358) | (.295) |
| Distributions from net realized gain | (.005) | (.306) | (.010) | – | (.025) |
| Total distributions | (.274) | (.553) | (.303) | (.358) | (.320) |
| Net asset value, end of period | $9.69 | $11.23 | $11.52 | $11.00 | $10.38 |
| Total ReturnC | (11.42)% | 2.39% | 7.62% | 9.65% | (.55)% |
| Ratios to Average Net AssetsB,D,E | | | | | |
| Expenses before reductions | .45% | .45% | .45% | .45% | .45% |
| Expenses net of fee waivers, if any | .45% | .45% | .45% | .45% | .45% |
| Expenses net of all reductions | .45% | .45% | .45% | .45% | .45% |
| Net investment income (loss) | 2.55% | 2.30% | 2.72% | 3.17% | 2.90% |
| Supplemental Data | | | | | |
| Net assets, end of period (000 omitted) | $14,816,563 | $16,260,424 | $16,158,697 | $14,074,694 | $23,868,572 |
| Portfolio turnover rateF | 129% | 195% | 222% | 170%G | 109% |
A Calculated based on average shares outstanding during the period.
B Net investment income (loss) is affected by the timing of the declaration of dividends by any underlying mutual funds or exchange-traded funds (ETFs). Net investment income (loss) of any such underlying funds is not included in the Fund's net investment income (loss) ratio.
C Total returns would have been lower if certain expenses had not been reduced during the applicable periods shown.
D Fees and expenses of any underlying mutual funds or exchange-traded funds (ETFs) are not included in the Fund's expense ratio. The Fund indirectly bears its proportionate share of these expenses. For additional expense information related to investments in Fidelity Central Funds, please refer to the "Investments in Fidelity Central Funds" note found in the Notes to Financial Statements section of the most recent Annual or Semi-Annual report.
E Expense ratios reflect operating expenses of the class. Expenses before reductions do not reflect amounts reimbursed, waived, or reduced through arrangements with the investment adviser, brokerage services, or other offset arrangements, if applicable, and do not represent the amount paid by the class during periods when reimbursements, waivers or reductions occur.
F Amount does not include the portfolio activity of any underlying mutual funds or exchange-traded funds (ETFs).
G Portfolio turnover rate excludes securities received or delivered in-kind.
See accompanying notes which are an integral part of the financial statements.
Fidelity Total Bond Fund Class I
| Years ended August 31, | 2022 | 2021 | 2020 | 2019 | 2018 |
| Selected Per–Share Data | | | | | |
| Net asset value, beginning of period | $11.21 | $11.50 | $10.98 | $10.36 | $10.75 |
| Income from Investment Operations | | | | | |
| Net investment income (loss)A,B | .262 | .252 | .296 | .326 | .299 |
| Net realized and unrealized gain (loss) | (1.524) | .006 | .521 | .646 | (.374) |
| Total from investment operations | (1.262) | .258 | .817 | .972 | (.075) |
| Distributions from net investment income | (.263) | (.242) | (.287) | (.352) | (.290) |
| Distributions from net realized gain | (.005) | (.306) | (.010) | – | (.025) |
| Total distributions | (.268) | (.548) | (.297) | (.352) | (.315) |
| Net asset value, end of period | $9.68 | $11.21 | $11.50 | $10.98 | $10.36 |
| Total ReturnC | (11.40)% | 2.34% | 7.58% | 9.61% | (.70)% |
| Ratios to Average Net AssetsB,D,E | | | | | |
| Expenses before reductions | .50% | .50% | .50% | .50% | .50% |
| Expenses net of fee waivers, if any | .50% | .50% | .50% | .50% | .50% |
| Expenses net of all reductions | .50% | .50% | .50% | .50% | .50% |
| Net investment income (loss) | 2.50% | 2.25% | 2.67% | 3.12% | 2.85% |
| Supplemental Data | | | | | |
| Net assets, end of period (000 omitted) | $7,251,751 | $8,422,197 | $7,629,091 | $6,348,237 | $4,959,911 |
| Portfolio turnover rateF | 129% | 195% | 222% | 170%G | 109% |
A Calculated based on average shares outstanding during the period.
B Net investment income (loss) is affected by the timing of the declaration of dividends by any underlying mutual funds or exchange-traded funds (ETFs). Net investment income (loss) of any such underlying funds is not included in the Fund's net investment income (loss) ratio.
C Total returns would have been lower if certain expenses had not been reduced during the applicable periods shown.
D Fees and expenses of any underlying mutual funds or exchange-traded funds (ETFs) are not included in the Fund's expense ratio. The Fund indirectly bears its proportionate share of these expenses. For additional expense information related to investments in Fidelity Central Funds, please refer to the "Investments in Fidelity Central Funds" note found in the Notes to Financial Statements section of the most recent Annual or Semi-Annual report.
E Expense ratios reflect operating expenses of the class. Expenses before reductions do not reflect amounts reimbursed, waived, or reduced through arrangements with the investment adviser, brokerage services, or other offset arrangements, if applicable, and do not represent the amount paid by the class during periods when reimbursements, waivers or reductions occur.
F Amount does not include the portfolio activity of any underlying mutual funds or exchange-traded funds (ETFs).
G Portfolio turnover rate excludes securities received or delivered in-kind.
See accompanying notes which are an integral part of the financial statements.
Fidelity Total Bond Fund Class Z
| Years ended August 31, | 2022 | 2021 | 2020 | 2019 | 2018 |
| Selected Per–Share Data | | | | | |
| Net asset value, beginning of period | $11.21 | $11.50 | $10.98 | $10.36 | $10.75 |
| Income from Investment Operations | | | | | |
| Net investment income (loss)A,B | .278 | .267 | .311 | .340 | .312 |
| Net realized and unrealized gain (loss) | (1.525) | .006 | .522 | .647 | (.373) |
| Total from investment operations | (1.247) | .273 | .833 | .987 | (.061) |
| Distributions from net investment income | (.278) | (.257) | (.303) | (.367) | (.304) |
| Distributions from net realized gain | (.005) | (.306) | (.010) | – | (.025) |
| Total distributions | (.283) | (.563) | (.313) | (.367) | (.329) |
| Net asset value, end of period | $9.68 | $11.21 | $11.50 | $10.98 | $10.36 |
| Total ReturnC | (11.27)% | 2.48% | 7.73% | 9.76% | (.56)% |
| Ratios to Average Net AssetsB,D,E | | | | | |
| Expenses before reductions | .40% | .40% | .40% | .40% | .36% |
| Expenses net of fee waivers, if any | .36% | .36% | .36% | .36% | .36% |
| Expenses net of all reductions | .36% | .36% | .36% | .36% | .36% |
| Net investment income (loss) | 2.64% | 2.39% | 2.81% | 3.26% | 2.99% |
| Supplemental Data | | | | | |
| Net assets, end of period (000 omitted) | $6,379,250 | $8,023,946 | $5,723,315 | $3,774,546 | $2,490,230 |
| Portfolio turnover rateF | 129% | 195% | 222% | 170%G | 109% |
A Calculated based on average shares outstanding during the period.
B Net investment income (loss) is affected by the timing of the declaration of dividends by any underlying mutual funds or exchange-traded funds (ETFs). Net investment income (loss) of any such underlying funds is not included in the Fund's net investment income (loss) ratio.
C Total returns would have been lower if certain expenses had not been reduced during the applicable periods shown.
D Fees and expenses of any underlying mutual funds or exchange-traded funds (ETFs) are not included in the Fund's expense ratio. The Fund indirectly bears its proportionate share of these expenses. For additional expense information related to investments in Fidelity Central Funds, please refer to the "Investments in Fidelity Central Funds" note found in the Notes to Financial Statements section of the most recent Annual or Semi-Annual report.
E Expense ratios reflect operating expenses of the class. Expenses before reductions do not reflect amounts reimbursed, waived, or reduced through arrangements with the investment adviser, brokerage services, or other offset arrangements, if applicable, and do not represent the amount paid by the class during periods when reimbursements, waivers or reductions occur.
F Amount does not include the portfolio activity of any underlying mutual funds or exchange-traded funds (ETFs).
G Portfolio turnover rate excludes securities received or delivered in-kind.
See accompanying notes which are an integral part of the financial statements.
Notes to Financial Statements
For the period ended August 31, 2022
1. Organization.
Fidelity Total Bond Fund (the Fund) is a fund of Fidelity Income Fund (the Trust) and is authorized to issue an unlimited number of shares. The Trust is registered under the Investment Company Act of 1940, as amended (the 1940 Act), as an open-end management investment company organized as a Massachusetts business trust. The Fund offers Class A, Class M, Class C, Total Bond, Class I and Class Z shares, each of which has equal rights as to assets and voting privileges. Each class has exclusive voting rights with respect to matters that affect that class. Class C shares will automatically convert to Class A shares after a holding period of eight years from the initial date of purchase, with certain exceptions.
2. Investments in Fidelity Central Funds.
Funds may invest in Fidelity Central Funds, which are open-end investment companies generally available only to other investment companies and accounts managed by the investment adviser and its affiliates. The Schedule of Investments lists any Fidelity Central Funds held as an investment as of period end, but does not include the underlying holdings of each Fidelity Central Fund. An investing fund indirectly bears its proportionate share of the expenses of the underlying Fidelity Central Funds.
Based on its investment objective, each Fidelity Central Fund may invest or participate in various investment vehicles or strategies that are similar to those of the investing fund. These strategies are consistent with the investment objectives of the investing fund and may involve certain economic risks which may cause a decline in value of each of the Fidelity Central Funds and thus a decline in the value of the investing fund.
| Fidelity Central Fund | Investment Manager | Investment Objective | Investment Practices | Expense Ratio(a) |
| Fidelity Money Market Central Funds | Fidelity Management & Research Company LLC (FMR) | Each fund seeks to obtain a high level of current income consistent with the preservation of capital and liquidity. | Short-term Investments | Less than .005% |
(a) Expenses expressed as a percentage of average net assets and are as of each underlying Central Fund's most recent annual or semi-annual shareholder report.
A complete unaudited list of holdings for each Fidelity Central Fund is available upon request or at the Securities and Exchange Commission website at www.sec.gov. In addition, the financial statements of the Fidelity Central Funds which contain the significant accounting policies (including investment valuation policies) of those funds, and are not covered by the Report of Independent Registered Public Accounting Firm, are available on the Securities and Exchange Commission website or upon request.
3. Significant Accounting Policies.
The Fund is an investment company and applies the accounting and reporting guidance of the Financial Accounting Standards Board (FASB) Accounting Standards Codification Topic 946 Financial Services - Investment Companies. The financial statements have been prepared in conformity with accounting principles generally accepted in the United States of America (GAAP), which require management to make certain estimates and assumptions at the date of the financial statements. Actual results could differ from those estimates. Subsequent events, if any, through the date that the financial statements were issued have been evaluated in the preparation of the financial statements. The Fund's Schedule of Investments lists any underlying mutual funds or exchange-traded funds (ETFs) but does not include the underlying holdings of these funds. The following summarizes the significant accounting policies of the Fund:
Investment Valuation. Investments are valued as of 4:00 p.m. Eastern time on the last calendar day of the period. The Board of Trustees (the Board) has delegated the day to day responsibility for the valuation of the Fund's investments to the Fair Value Committee (the Committee) established by the Fund's investment adviser. In accordance with valuation policies and procedures approved by the Board, Fund attempts to obtain prices from one or more third party pricing vendors or brokers to value its investments. When current market prices, quotations or currency exchange rates are not readily available or reliable, investments will be fair valued in good faith by the Committee, in accordance with procedures adopted by the Board. Factors used in determining fair value vary by investment type and may include market or investment specific events, changes in interest rates and credit quality. The frequency with which these procedures are used cannot be predicted and they may be utilized to a significant extent. The Committee oversees the Fund's valuation policies and procedures and reports to the Board on the Committee's activities and fair value determinations. The Board monitors the appropriateness of the procedures used in valuing the Fund's investments and ratifies the fair value determinations of the Committee.
The Fund categorizes the inputs to valuation techniques used to value its investments into a disclosure hierarchy consisting of three levels as shown below:
- Level 1 – unadjusted quoted prices in active markets for identical investments
- Level 2 – other significant observable inputs (including quoted prices for similar investments, interest rates, prepayment speeds, etc.)
- Level 3 – unobservable inputs (including the Fund's own assumptions based on the best information available)
Valuation techniques used to value the Fund's investments by major category are as follows:
Debt securities, including restricted securities, are valued based on evaluated prices received from third party pricing vendors or from brokers who make markets in such securities. Corporate bonds, bank notes, bank loan obligations, foreign government and government agency obligations, municipal securities, preferred securities, supranational obligations and U.S. government and government agency obligations are valued by pricing vendors who utilize matrix pricing which considers yield or price of bonds of comparable quality, coupon, maturity and type or by broker-supplied prices. Asset backed securities, collateralized mortgage obligations, commercial mortgage securities and U.S. government agency mortgage securities are valued by pricing vendors who utilize matrix pricing which considers prepayment speed assumptions, attributes of the collateral, yield or price of bonds of comparable quality, coupon, maturity and type or by broker-supplied prices. Swaps are marked-to-market daily based on valuations from third party pricing vendors, registered derivatives clearing organizations (clearinghouses) or broker-supplied valuations. These pricing sources may utilize inputs such as interest rate curves, credit spread curves, default possibilities and recovery rates. When independent prices are unavailable or unreliable, debt securities and swaps may be valued utilizing pricing methodologies which consider similar factors that would be used by third party pricing vendors. For foreign debt securities, when significant market or security specific events arise, valuations may be determined in good faith in accordance with procedures adopted by the Board. Debt securities and swaps are generally categorized as Level 2 in the hierarchy but may be Level 3 depending on the circumstances.
Equity securities, including restricted securities, for which market quotations are readily available, are valued at the last reported sale price or official closing price as reported by a third party pricing vendor on the primary market or exchange on which they are traded and are categorized as Level 1 in the hierarchy. In the event there were no sales during the day or closing prices are not available, securities are valued at the last quoted bid price or may be valued using the last available price and are generally categorized as Level 2 in the hierarchy. For foreign equity securities, when market or security specific events arise, comparisons to the valuation of American Depositary Receipts (ADRs), futures contracts, ETFs and certain indexes as well as quoted prices for similar securities may be used and would be categorized as Level 2 in the hierarchy. For equity securities, including restricted securities, where observable inputs are limited, assumptions about market activity and risk are used and these securities may be categorized as Level 3 in the hierarchy.
The U.S. dollar value of foreign currency contracts is determined using currency exchange rates supplied by a pricing service and are categorized as Level 2 in the hierarchy. Futures contracts are valued at the settlement price or official closing price established each day by the board of trade or exchange on which they are traded and are categorized as Level 1 in the hierarchy. Options traded over-the-counter are valued using vendor or broker-supplied valuations and are categorized as Level 2 in the hierarchy. Investments in open-end mutual funds, including the Fidelity Central Funds, are valued at their closing net asset value (NAV) each business day and are categorized as Level 1 in the hierarchy.
Changes in valuation techniques may result in transfers in or out of an assigned level within the disclosure hierarchy. The aggregate value of investments by input level as of August 31, 2022 is included at the end of the Fund's Schedule of Investments.
Foreign Currency. Foreign-denominated assets, including investment securities, and liabilities are translated into U.S. dollars at the exchange rates at period end. Purchases and sales of investment securities, income and dividends received, and expenses denominated in foreign currencies are translated into U.S. dollars at the exchange rate in effect on the transaction date.
The effects of exchange rate fluctuations on investments are included with the net realized and unrealized gain (loss) on investment securities. Other foreign currency transactions resulting in realized and unrealized gain (loss) are disclosed separately.
Realized gains and losses on foreign currency transactions arise from the disposition of foreign currency, realized changes in the value of foreign currency between the trade and settlement dates on security transactions, and the difference between the amounts of dividends, interest and foreign withholding taxes recorded on transaction date and the U.S. dollar equivalent of the amounts actually received or paid. Unrealized gains and losses on assets and liabilities in foreign currencies arise from changes in the value of foreign currency, and from assets and liabilities denominated in foreign currencies, other than investments, which are held at period end.
Investment Transactions and Income. For financial reporting purposes, the Fund's investment holdings and NAV include trades executed through the end of the last business day of the period. The NAV per share for processing shareholder transactions is calculated as of the close of business of the New York Stock Exchange (NYSE), normally 4:00 p.m. Eastern time and includes trades executed through the end of the prior business day. Gains and losses on securities sold are determined on the basis of identified cost and include proceeds received from litigation. Commissions paid to certain brokers with whom the investment adviser, or its affiliates, places trades on behalf of a fund include an amount in addition to trade execution, which may be rebated back to a fund. Any such rebates are included in net realized gain (loss) on investments in the Statement of Operations. Dividend income is recorded on the ex-dividend date, except for certain dividends from foreign securities where the ex-dividend date may have passed, which are recorded as soon as the Fund is informed of the ex-dividend date. Non-cash dividends included in dividend income, if any, are recorded at the fair market value of the securities received. Income and capital gain distributions from Fidelity Central Funds, if any, are recorded on the ex-dividend date. Certain distributions received by the Fund represent a return of capital or capital gain. The Fund determines the components of these distributions subsequent to the ex-dividend date, based upon receipt of tax filings or other correspondence relating to the underlying investment. These distributions are recorded as a reduction of cost of investments and/or as a realized gain. Interest income is accrued as earned and includes coupon interest and amortization of premium and accretion of discount on debt securities as applicable. Paid in Kind (PIK) income is recorded at the fair market value of the securities received. Investment income is recorded net of foreign taxes withheld where recovery of such taxes is uncertain. Debt obligations may be placed on non-accrual status and related interest income may be reduced by ceasing current accruals and writing off interest receivables when the collection of all or a portion of interest has become doubtful based on consistently applied procedures. A debt obligation is removed from non-accrual status when the issuer resumes interest payments or when collectability of interest is reasonably assured. Funds may file withholding tax reclaims in certain jurisdictions to recover a portion of amounts previously withheld. Any withholding tax reclaims income is included in the Statement of Operations in interest. Any receivables for withholding tax reclaims are included in the Statement of Assets and Liabilities in interest receivable.
Class Allocations and Expenses. Investment income, realized and unrealized capital gains and losses, common expenses of a fund, and certain fund-level expense reductions, if any, are allocated daily on a pro-rata basis to each class based on the relative net assets of each class to the total net assets of a fund. Each class differs with respect to transfer agent and distribution and service plan fees incurred, as applicable. Certain expense reductions may also differ by class, if applicable. For the reporting period, the allocated portion of income and expenses to each class as a percent of its average net assets may vary due to the timing of recording these transactions in relation to fluctuating net assets of the classes. Expenses directly attributable to a fund are charged to that fund. Expenses attributable to more than one fund are allocated among the respective funds on the basis of relative net assets or other appropriate methods. Expenses included in the accompanying financial statements reflect the expenses of that fund and do not include any expenses associated with any underlying mutual funds or exchange-traded funds. Although not included in a fund's expenses, a fund indirectly bears its proportionate share of these expenses through the net asset value of each underlying mutual fund or exchange-traded fund. Expense estimates are accrued in the period to which they relate and adjustments are made when actual amounts are known.
Deferred Trustee Compensation. Under a Deferred Compensation Plan (the Plan) for certain Funds, certain independent Trustees have elected to defer receipt of a portion of their annual compensation. Deferred amounts are invested in affiliated mutual funds, are marked-to-market and remain in a fund until distributed in accordance with the Plan. The investment of deferred amounts and the offsetting payable to the Trustees presented below are included in the accompanying Statement of Assets and Liabilities in other receivables and other payables and accrued expenses, as applicable.
| Fidelity Total Bond Fund | $349,983 |
Income Tax Information and Distributions to Shareholders. Each year, the Fund intends to qualify as a regulated investment company under Subchapter M of the Internal Revenue Code, including distributing substantially all of its taxable income and realized gains. As a result, no provision for U.S. Federal income taxes is required. As of August 31, 2022, the Fund did not have any unrecognized tax benefits in the financial statements; nor is the Fund aware of any tax positions for which it is reasonably possible that the total amounts of unrecognized tax benefits will significantly change in the next twelve months. The Fund files a U.S. federal tax return, in addition to state and local tax returns as required. The Fund's federal income tax returns are subject to examination by the Internal Revenue Service (IRS) for a period of three fiscal years after they are filed. State and local tax returns may be subject to examination for an additional fiscal year depending on the jurisdiction. Foreign taxes are provided for based on the Fund's understanding of the tax rules and rates that exist in the foreign markets in which it invests.
Distributions are declared and recorded daily and paid monthly from net investment income. Distributions from realized gains, if any, are declared and recorded on the ex-dividend date. Income and capital gain distributions are declared separately for each class. Income and capital gain distributions are determined in accordance with income tax regulations, which may differ from GAAP.
Capital accounts within the financial statements are adjusted for permanent book-tax differences. These adjustments have no impact on net assets or the results of operations. Capital accounts are not adjusted for temporary book-tax differences which will reverse in a subsequent period.
Book-tax differences are primarily due to swaps, futures and options transactions, foreign currency transactions, defaulted bonds, market discount, deferred trustees compensation, capital loss carryforwards and losses deferred due to wash sales, excise tax regulations and futures contracts.
As of period end, the cost and unrealized appreciation (depreciation) in securities, and derivatives if applicable, for federal income tax purposes were as follows:
| Gross unrealized appreciation | $151,355,476 |
| Gross unrealized depreciation | (3,051,778,863) |
| Net unrealized appreciation (depreciation) | $(2,900,423,387) |
| Tax Cost | $35,120,101,587 |
The tax-based components of distributable earnings as of period end were as follows:
| Undistributed ordinary income | $29,903,432 |
| Net unrealized appreciation (depreciation) on securities and other investments | $(2,904,168,583) |
The Fund intends to elect to defer to its next fiscal year $475,481,235 of capital losses recognized during the period November 1,2021 to August 31, 2022.
The tax character of distributions paid was as follows:
| | August 31, 2022 | August 31, 2021 |
| Ordinary Income | $812,978,824 | $ 1,174,782,997 |
| Long-term Capital Gains | 15,490,182 | 384,320,815 |
| Total | $828,469,006 | $ 1,559,103,812 |
Delayed Delivery Transactions and When-Issued Securities. During the period, certain Funds transacted in securities on a delayed delivery or when-issued basis. Payment and delivery may take place after the customary settlement period for that security. The price of the underlying securities and the date when the securities will be delivered and paid for are fixed at the time the transaction is negotiated. Securities purchased on a delayed delivery or when-issued basis are identified as such in the Schedule of Investments. Compensation for interest forgone in the purchase of a delayed delivery or when-issued debt security may be received. With respect to purchase commitments, each applicable Fund identifies securities as segregated in its records with a value at least equal to the amount of the commitment. Payables and receivables associated with the purchases and sales of delayed delivery securities having the same coupon, settlement date and broker are offset. Delayed delivery or when-issued securities that have been purchased from and sold to different brokers are reflected as both payables and receivables in the Statement of Assets and Liabilities under the caption "Delayed delivery", as applicable. Losses may arise due to changes in the value of the underlying securities or if the counterparty does not perform under the contract's terms, or if the issuer does not issue the securities due to political, economic, or other factors.
To-Be-Announced (TBA) Securities and Mortgage Dollar Rolls. TBA securities involve buying or selling mortgage-backed securities (MBS) on a forward commitment basis. A TBA transaction typically does not designate the actual security to be delivered and only includes an approximate principal amount; however delivered securities must meet specified terms defined by industry guidelines, including issuer, rate and current principal amount outstanding on underlying mortgage pools. Funds may enter into a TBA transaction with the intent to take possession of or deliver the underlying MBS, or a fund may elect to extend the settlement by entering into either a mortgage or reverse mortgage dollar roll. Mortgage dollar rolls are transactions where a fund sells TBA securities and simultaneously agrees to repurchase MBS on a later date at a lower price and with the same counterparty. Reverse mortgage dollar rolls involve the purchase and simultaneous agreement to sell TBA securities on a later date at a lower price. Transactions in mortgage dollar rolls and reverse mortgage dollar rolls are accounted for as purchases and sales and may result in an increase to a fund's portfolio turnover rate.
Purchases and sales of TBA securities involve risks similar to those discussed above for delayed delivery and when-issued securities. Also, if the counterparty in a mortgage dollar roll or a reverse mortgage dollar roll transaction files for bankruptcy or becomes insolvent, a fund's right to repurchase or sell securities may be limited. Additionally, when a fund sells TBA securities without already owning or having the right to obtain the deliverable securities (an uncovered forward commitment to sell), it incurs a risk of loss because it could have to purchase the securities at a price that is higher than the price at which it sold them. A fund may be unable to purchase the deliverable securities if the corresponding market is illiquid.
TBA securities subject to a forward commitment to sell at period end are included at the end of the Schedule of Investments under the caption "TBA Sale Commitments." The proceeds and value of these commitments are reflected in the Statement of Assets and Liabilities as "Receivable for TBA sale commitments" and "TBA sale commitments, at value," respectively.
Restricted Securities (including Private Placements). Funds may invest in securities that are subject to legal or contractual restrictions on resale. These securities generally may be resold in transactions exempt from registration or to the public if the securities are registered. Disposal of these securities may involve time-consuming negotiations and expense, and prompt sale at an acceptable price may be difficult. Information regarding restricted securities held at period end is included at the end of the Schedule of Investments, if applicable.
Loans and Other Direct Debt Instruments. Direct debt instruments are interests in amounts owed to lenders by corporate or other borrowers. These instruments may be in the form of loans, trade claims or other receivables and may include standby financing commitments such as revolving credit facilities that obligate a fund to supply additional cash to the borrower on demand. Loans may be acquired through assignment, participation, or may be made directly to a borrower. Such instruments are presented in the Bank Loan Obligations section in the Schedule of Investments. Certain funds may also invest in unfunded loan commitments, which are contractual obligations for future funding. Information regarding unfunded commitments is included at the end of the Schedule of Investments, if applicable.
4. Derivative Instruments.
Risk Exposures and the Use of Derivative Instruments. Investment objectives allow a fund to enter into various types of derivative contracts, including futures contracts, forward foreign currency contracts, options and swaps. Derivatives are investments whose value is primarily derived from underlying assets, indices or reference rates and may be transacted on an exchange or over-the-counter (OTC). Derivatives may involve a future commitment to buy or sell a specified asset based on specified terms, to exchange future cash flows at periodic intervals based on a notional principal amount, or for one party to make one or more payments upon the occurrence of specified events in exchange for periodic payments from the other party.
Derivatives were used to increase returns, to gain exposure to certain types of assets, to facilitate transactions in foreign-denominated securities and to manage exposure to certain risks as defined below. The success of any strategy involving derivatives depends on analysis of numerous economic factors, and if the strategies for investment do not work as intended, the objectives may not be achieved.
Derivatives were used to increase or decrease exposure to the following risk(s):
| Credit Risk | Credit risk relates to the ability of the issuer of a financial instrument to make further principal or interest payments on an obligation or commitment that it has to a fund.
|
| Foreign Exchange Risk | Foreign exchange rate risk relates to fluctuations in the value of an asset or liability due to changes in currency exchange rates.
|
| Interest Rate Risk | Interest rate risk relates to the fluctuations in the value of interest-bearing securities due to changes in the prevailing levels of market interest rates. |
Funds are also exposed to additional risks from investing in derivatives, such as liquidity risk and counterparty credit risk. Liquidity risk is the risk that a fund will be unable to close out the derivative in the open market in a timely manner. Counterparty credit risk is the risk that the counterparty will not be able to fulfill its obligation to a fund. Derivative counterparty credit risk is managed through formal evaluation of the creditworthiness of all potential counterparties. On certain OTC derivatives such as forward foreign currency contracts, options and bi-lateral swaps, a fund attempts to reduce its exposure to counterparty credit risk by entering into an International Swaps and Derivatives Association, Inc. (ISDA) Master Agreement with each of its counterparties. The ISDA Master Agreement gives a fund the right to terminate all transactions traded under such agreement upon the deterioration in the credit quality of the counterparty beyond specified levels. The ISDA Master Agreement gives each party the right, upon an event of default by the other party or a termination of the agreement, to close out all transactions traded under such agreement and to net amounts owed under each transaction to one net payable by one party to the other. To mitigate counterparty credit risk on bi-lateral OTC derivatives, a fund receives collateral in the form of cash or securities once net unrealized appreciation on outstanding derivative contracts under an ISDA Master Agreement exceeds certain applicable thresholds, subject to certain minimum transfer provisions. The collateral received is held in segregated accounts with the custodian bank in accordance with the collateral agreements entered into between a fund, the counterparty and the custodian bank. A fund could experience delays and costs in gaining access to the collateral even though it is held by the custodian bank. The maximum risk of loss to a fund from counterparty credit risk related to bi-lateral OTC derivatives is generally the aggregate unrealized appreciation and unpaid counterparty payments in excess of any collateral pledged by the counterparty to a fund. A fund may be required to pledge collateral for the benefit of the counterparties on bi-lateral OTC derivatives in an amount not less than each counterparty's unrealized appreciation on outstanding derivative contracts, subject to certain minimum transfer provisions, and any such pledged collateral is identified in the Schedule of Investments. Exchange-traded contracts are not covered by the ISDA Master Agreement; however counterparty credit risk related to these contracts may be mitigated by the protection provided by the exchange on which they trade. Counterparty credit risk related to centrally cleared OTC swaps may be mitigated by the protection provided by the clearinghouse.
Investing in derivatives may involve greater risks than investing in the underlying assets directly and, to varying degrees, may involve risk of loss in excess of any initial investment and collateral received and amounts recognized in the Statement of Assets and Liabilities. In addition, there may be the risk that the change in value of the derivative contract does not correspond to the change in value of the underlying instrument.
Net Realized Gain (Loss) and Change in Net Unrealized Appreciation (Depreciation) on Derivatives. The table below, which reflects the impacts of derivatives on the financial performance, summarizes the net realized gain (loss) and change in net unrealized appreciation (depreciation) for derivatives during the period as presented in the Statement of Operations.
| Primary Risk Exposure / Derivative Type | Net Realized Gain (Loss) | Change in Net Unrealized Appreciation (Depreciation) |
| Fidelity Total Bond Fund | | |
| Credit Risk | | |
| Purchased Options | $(546,057) | $905,528 |
| Swaps | (169,748) | 2,161,372 |
| Total Credit Risk | (715,805) | 3,066,900 |
| Foreign Exchange Risk | | |
| Forward Foreign Currency Contracts | 93,039,867 | 10,866,272 |
| Total Foreign Exchange Risk | 93,039,867 | 10,866,272 |
| Interest Rate Risk | | |
| Futures Contracts | (15,646,179) | (34,030) |
| Swaps | (3,221,835) | (845,258) |
| Total Interest Rate Risk | (18,868,014) | (879,288) |
| Totals | $73,456,048 | $13,053,884 |
If there are any open positions at period end, a summary of the value of derivatives by primary risk exposure is included at the end of the Schedule of Investments.
Forward Foreign Currency Contracts. Forward foreign currency contracts represent obligations to purchase or sell foreign currency on a specified future date at a price fixed at the time the contracts are entered into. Forward foreign currency contracts were used to facilitate transactions in foreign-denominated securities and to manage exposure to certain foreign currencies.
Forward foreign currency contracts are valued daily and fluctuations in exchange rates on open contracts are recorded as unrealized appreciation or (depreciation) and reflected in the Statement of Assets and Liabilities. When the contract is closed, a gain or loss is realized equal to the difference between the closing value and the value at the time it was opened. Non-deliverable forward foreign currency exchange contracts are settled with the counterparty in cash without the delivery of foreign currency. The net realized gain (loss) and change in net unrealized appreciation (depreciation) on forward foreign currency contracts during the period is presented in the Statement of Operations.
Any open forward foreign currency contracts at period end are presented in the Schedule of Investments under the caption "Forward Foreign Currency Contracts." The contract amount and unrealized appreciation (depreciation) reflects each contract's exposure to the underlying currency at period end, and is representative of volume of activity during the period unless an average contract value is presented.
Futures Contracts. A futures contract is an agreement between two parties to buy or sell a specified underlying instrument for a fixed price at a specified future date. Futures contracts were used to manage exposure to the bond market and fluctuations in interest rates.
Upon entering into a futures contract, a fund is required to deposit either cash or securities (initial margin) with a clearing broker in an amount equal to a certain percentage of the face value of the contract. Futures contracts are marked-to-market daily and subsequent daily payments are made or received by a fund depending on the daily fluctuations in the value of the futures contracts and are recorded as unrealized appreciation or (depreciation). This receivable and/or payable, if any, is included in daily variation margin on futures contracts in the Statement of Assets and Liabilities. Realized gain or (loss) is recorded upon the expiration or closing of a futures contract. The net realized gain (loss) and change in net unrealized appreciation (depreciation) on futures contracts during the period is presented in the Statement of Operations.
Any open futures contracts at period end are presented in the Schedule of Investments under the caption "Futures Contracts". The notional amount at value reflects each contract's exposure to the underlying instrument or index at period end, and is representative of volume of activity during the period unless an average notional amount is presented. Any securities deposited to meet initial margin requirements are identified in the Schedule of Investments. Any cash deposited to meet initial margin requirements is presented as segregated cash with brokers for derivative instruments in the Statement of Assets and Liabilities.
Options. Options give the purchaser the right, but not the obligation, to buy (call) or sell (put) an underlying security or financial instrument at an agreed exercise or strike price between or on certain dates. Options obligate the seller (writer) to buy (put) or sell (call) an underlying instrument at the exercise or strike price or cash settle an underlying derivative instrument if the holder exercises the option on or before the expiration date. OTC options, such as swaptions, which are options where the underlying instrument is a swap, were used to manage exposure to potential credit events.
Upon entering into an options contract, a fund will pay or receive a premium. Premiums paid on purchased options are reflected as cost of investments and premiums received on written options are reflected as a liability on the Statement of Assets and Liabilities. Certain options may be purchased or written with premiums to be paid or received on a future date. Options are valued daily and any unrealized appreciation (depreciation) is reflected on the Statement of Assets and Liabilities. When an option is exercised, the cost or proceeds of the underlying instrument purchased or sold is adjusted by the amount of the premium. When an option is closed, a gain or loss is realized depending on whether the proceeds or amount paid for the closing sale transaction is greater or less than the premium received or paid. When an option expires, gains and losses are realized to the extent of premiums received and paid, respectively. The net realized and unrealized gains (losses) on purchased options are included in the Statement of Operations in net realized gain (loss) and change in net unrealized appreciation (depreciation) on investment securities. The net realized gain (loss) and change in net unrealized appreciation (depreciation) on written options are presented in the Statement of Operations.
Any open options at period end are presented in the Schedule of Investments under the captions "Purchased Options," "Purchased Swaptions," "Written Options" and "Written Swaptions," as applicable, and are representative of volume of activity during the period unless an average notional amount is presented.
Writing puts and buying calls tend to increase exposure to the underlying instrument while buying puts and writing calls tend to decrease exposure to the underlying instrument. For purchased options, risk of loss is limited to the premium paid, and for written options, risk of loss is the change in value in excess of the premium received.
Swaps. A swap is a contract between two parties to exchange future cash flows at periodic intervals based on a notional principal amount. A bi-lateral OTC swap is a transaction between a fund and a dealer counterparty where cash flows are exchanged between the two parties for the life of the swap. A centrally cleared OTC swap is a transaction executed between a fund and a dealer counterparty, then cleared by a futures commission merchant (FCM) through a clearinghouse. Once cleared, the clearinghouse serves as a central counterparty, with whom a fund exchanges cash flows for the life of the transaction, similar to transactions in futures contracts.
Bi-lateral OTC swaps are marked-to-market daily and changes in value are reflected in the Statement of Assets and Liabilities in the bi-lateral OTC swaps at value line items. Any upfront premiums paid or received upon entering a bi-lateral OTC swap to compensate for differences between stated terms of the swap and prevailing market conditions (e.g. credit spreads, interest rates or other factors) are recorded in net unrealized appreciation (depreciation) in the Statement of Assets and Liabilities and amortized to realized gain or (loss) ratably over the term of the swap. Any unamortized upfront premiums are presented in the Schedule of Investments.
Centrally cleared OTC swaps require a fund to deposit either cash or securities (initial margin) with the FCM, at the instruction of and for the benefit of the clearinghouse. Any securities deposited to meet initial margin requirements are identified in the Schedule of Investments. Any cash deposited to meet initial margin requirements is presented in segregated cash with brokers for derivative instruments in the Statement of Assets and Liabilities. Centrally cleared OTC swaps are marked-to-market daily and subsequent payments (variation margin) are made or received depending on the daily fluctuations in the value of the swaps and are recorded as unrealized appreciation or (depreciation). These daily payments, if any, are included in receivable or payable for daily variation margin on centrally cleared OTC swaps in the Statement of Assets and Liabilities. Any premiums for centrally cleared OTC swaps are recorded periodically throughout the term of the swap to variation margin and included in unrealized appreciation (depreciation) in the Statement of Assets and Liabilities. Any premiums are recognized as realized gain (loss) upon termination or maturity of the swap.
For both bi-lateral and centrally cleared OTC swaps, payments are exchanged at specified intervals, accrued daily commencing with the effective date of the contract and recorded as realized gain or (loss). Some swaps may be terminated prior to the effective date and realize a gain or loss upon termination. The net realized gain (loss) and change in net unrealized appreciation (depreciation) on swaps during the period is presented in the Statement of Operations.
Any open swaps at period end are included in the Schedule of Investments under the caption "Swaps", and are representative of volume of activity during the period unless an average notional amount is presented.
Credit Default Swaps. Credit default swaps enable a fund to buy or sell protection against specified credit events on a single-name issuer or a traded credit index. Under the terms of a credit default swap the buyer of protection (buyer) receives credit protection in exchange for making periodic payments to the seller of protection (seller) based on a fixed percentage applied to a notional principal amount. In return for these payments, the seller will be required to make a payment upon the occurrence of one or more specified credit events. A fund enters into credit default swaps as a seller to gain credit exposure to an issuer and/or as a buyer to obtain a measure of protection against defaults of an issuer. Periodic payments are made over the life of the contract by the buyer provided that no credit event occurs.
For credit default swaps on most corporate and sovereign issuers, credit events include bankruptcy, failure to pay or repudiation/moratorium. For credit default swaps on corporate or sovereign issuers, the obligation that may be put to the seller is not limited to the specific reference obligation described in the Schedule of Investments. For credit default swaps on asset-backed securities, a credit event may be triggered by events such as failure to pay principal, maturity extension, rating downgrade or write-down. For credit default swaps on asset-backed securities, the reference obligation described represents the security that may be put to the seller. For credit default swaps on a traded credit index, a specified credit event may affect all or individual underlying securities included in the index.
As a seller, if an underlying credit event occurs, a fund will pay a net settlement amount of cash equal to the notional amount of the swap less the recovery value of the reference obligation or underlying securities comprising an index. Only in the event of the industry's inability to value the underlying asset will a fund be required to take delivery of the reference obligation or underlying securities comprising an index and pay an amount equal to the notional amount of the swap.
As a buyer, if an underlying credit event occurs, a fund will receive a net settlement amount of cash equal to the notional amount of the swap less the recovery value of the reference obligation or underlying securities comprising an index. Only in the event of the industry's inability to value the underlying asset will a fund be required to deliver the reference obligation or underlying securities comprising an index in exchange for payment of an amount equal to the notional amount of the swap.
Typically, the value of each credit default swap and credit rating disclosed for each reference obligation in the Schedule of Investments, where a fund is the seller, can be used as measures of the current payment/performance risk of the swap. As the value of the swap changes as a positive or negative percentage of the total notional amount, the payment/performance risk may decrease or increase, respectively. In addition to these measures, the investment adviser monitors a variety of factors including cash flow assumptions, market activity and market sentiment as part of its ongoing process of assessing payment/performance risk.
Interest Rate Swaps. Interest rate swaps are agreements between counterparties to exchange cash flows, one based on a fixed rate, and the other on a floating rate. A fund enters into interest rate swaps to manage its exposure to interest rate changes. Changes in interest rates can have an effect on both the value of bond holdings as well as the amount of interest income earned. In general, the value of bonds can fall when interest rates rise and can rise when interest rates fall.
5. Purchases and Sales of Investments.
Purchases and sales of securities, other than short-term securities and in-kind transactions, as applicable, are noted in the table below.
| | Purchases ($) | Sales ($) |
| Fidelity Total Bond Fund | 23,133,361,258 | 20,820,628,693 |
6. Fees and Other Transactions with Affiliates.
Management Fee. Fidelity Management & Research Company LLC (the investment adviser) and its affiliates provide the Fund with investment management related services for which the Fund pays a monthly management fee. The management fee is the sum of an individual fund fee rate that is based on an annual rate of .20% of the Fund's average net assets and an annualized group fee rate that averaged .10% during the period. The group fee rate is based upon the monthly average net assets of a group of registered investment companies with which the investment adviser has management contracts. The group fee rate decreases as assets under management increase and increases as assets under management decrease. For the reporting period, the total annual management fee rate was .30% of the Fund's average net assets.
Distribution and Service Plan Fees. In accordance with Rule 12b-1 of the 1940 Act, the Fund has adopted separate Distribution and Service Plans for each class of shares. Certain classes pay Fidelity Distributors Company LLC (FDC), an affiliate of the investment adviser, separate Distribution and Service Fees, each of which is based on an annual percentage of each class' average net assets. In addition, FDC may pay financial intermediaries for selling shares of the Fund and providing shareholder support services. For the period, the Distribution and Service Fee rates, total fees and amounts retained by FDC were as follows:
| | Distribution Fee | Service Fee | Total Fees | Retained by FDC |
| Class A | -% | .25% | $2,059,467 | $91,820 |
| Class M | -% | .25% | 859,214 | 25 |
| Class C | .75% | .25% | 1,411,496 | 168,219 |
| | | | $4,330,177 | $260,064 |
Sales Load. FDC may receive a front-end sales charge of up to 4.00% for selling Class A shares and Class M shares, some of which is paid to financial intermediaries for selling shares of the Fund. Depending on the holding period, FDC may receive contingent deferred sales charges levied on Class A, Class M and Class C redemptions. The deferred sales charges are 1.00% for Class C shares, .75% for certain purchases of Class A shares and .25% for certain purchases of Class M shares.
For the period, sales charge amounts retained by FDC were as follows:
| | Retained by FDC |
| Class A | $91,817 |
| Class M | 12,369 |
| Class C(a) | 1,568 |
| | $105,754 |
(a) When Class C shares are initially sold, FDC pays commissions from its own resources to financial intermediaries through which the sales are made.
Transfer Agent Fees. Fidelity Investments Institutional Operations Company LLC (FIIOC), an affiliate of the investment adviser, is the transfer, dividend disbursing and shareholder servicing agent for each class of the Fund. FIIOC receives account fees and asset-based fees that vary according to the account size and type of account of the shareholders of each respective class of the Fund, with the exception of Total Bond and Class Z. FIIOC receives an asset-based fee of Total Bond's and Class Z's average net assets. FIIOC pays for typesetting, printing and mailing of shareholder reports, except proxy statements. For the period, transfer agent fees for each class were as follows:
| | Amount | % of Class-Level Average Net Assets |
| Class A | $1,208,247 | .15 |
| Class M | 504,821 | .15 |
| Class C | 230,836 | .16 |
| Total Bond | 15,211,656 | .10 |
| Class I | 11,665,094 | .15 |
| Class Z | 3,751,581 | .05 |
| | $32,572,235 | |
Fund Wide Operations Fee. Pursuant to the Fund Wide Operations and Expense Agreement (FWOE), the investment adviser has agreed to provide for fund-level expenses (which may not include transfer agent, the compensation of the independent Trustees, interest, taxes or extraordinary expenses, as applicable) in return for a FWOE fee equal to .35% of fund-level average net assets less the total amount of the management fee. The FWOE paid by a fund is reduced by an amount equal to the fees and expenses paid to the independent Trustees. For the period, the FWOE fees were equivalent to the following annual rate expressed as a percentage of average net assets:
| Fidelity Total Bond Fund | .05% |
Brokerage Commissions. A portion of portfolio transactions were placed with brokerage firms which are affiliates of the investment adviser. Brokerage commissions are included in net realized gain (loss) and change in net unrealized appreciation (depreciation) in the Statement of Operations. The commissions paid to these affiliated firms were as follows:
| | Amount |
| Fidelity Total Bond Fund | $253 |
Interfund Trades. Funds may purchase from or sell securities to other Fidelity Funds under procedures adopted by the Board. The procedures have been designed to ensure these interfund trades are executed in accordance with Rule 17a-7 of the 1940 Act. Any interfund trades are included within the respective purchases and sales amounts shown in the Purchases and Sales of Investments note. Interfund trades during the period are noted in the table below.
| | Purchases ($) | Sales ($) | Realized Gain (Loss) ($) |
| Fidelity Total Bond Fund | 7,495 | – | – |
7. Committed Line of Credit.
Certain Funds participate with other funds managed by the investment adviser or an affiliate in a $4.25 billion credit facility (the "line of credit") to be utilized for temporary or emergency purposes to fund shareholder redemptions or for other short-term liquidity purposes. The commitment fees on the pro-rata portion of the line of credit are borne by the investment adviser. During the period, there were no borrowings on this line of credit.
8. Security Lending.
Funds lend portfolio securities from time to time in order to earn additional income. Lending agents are used, including National Financial Services (NFS), an affiliate of the investment adviser. Pursuant to a securities lending agreement, NFS will receive a fee, which is capped at 9.9% of a fund's daily lending revenue, for its services as lending agent. A fund may lend securities to certain qualified borrowers, including NFS. On the settlement date of the loan, a fund receives collateral (in the form of U.S. Treasury obligations, letters of credit and/or cash) against the loaned securities and maintains collateral in an amount not less than 100% of the market value of the loaned securities during the period of the loan. The market value of the loaned securities is determined at the close of business of a fund and any additional required collateral is delivered to a fund on the next business day. A fund or borrower may terminate the loan at any time, and if the borrower defaults on its obligation to return the securities loaned because of insolvency or other reasons, a fund may apply collateral received from the borrower against the obligation. A fund may experience delays and costs in recovering the securities loaned. Any cash collateral received is invested in the Fidelity Securities Lending Cash Central Fund. Any loaned securities are identified as such in the Schedule of Investments, and the value of loaned securities and cash collateral at period end, as applicable, are presented in the Statement of Assets and Liabilities. Security lending income represents the income earned on investing cash collateral, less rebates paid to borrowers and any lending agent fees associated with the loan, plus any premium payments received for lending certain types of securities. Security lending income is presented in the Statement of Operations as a component of income from Fidelity Central Funds. Affiliated security lending activity, if any, was as follows:
| | Total Security Lending Fees Paid to NFS | Security Lending Income From Securities Loaned to NFS | Value of Securities Loaned to NFS at Period End |
| Fidelity Total Bond Fund | $44,020 | $– | $– |
9. Expense Reductions.
The investment adviser contractually agreed to reimburse expenses of each class to the extent annual operating expenses exceeded certain levels of class-level average net assets as noted in the table below. This reimbursement will remain in place through December 31, 2023. Some expenses, for example the compensation of the independent Trustees and certain other expenses such as interest expense, are excluded from this reimbursement.
The following classes were in reimbursement during the period:
| | Expense Limitations | Reimbursement |
| Class Z | .36% | $3,036,965 |
Through arrangements with the Fund's custodian, credits realized as a result of certain uninvested cash balances were used to reduce the Fund's expenses. During the period, custodian credits reduced the Fund's expenses by $8,845.
10. Distributions to Shareholders.
Distributions to shareholders of each class were as follows:
| | Year ended
August 31, 2022 | Year ended
August 31, 2021 |
| Fidelity Total Bond Fund | | |
| Distributions to shareholders | | |
| Class A | $18,978,754 | $38,691,421 |
| Class M | 7,923,873 | 17,400,085 |
| Class C | 2,143,669 | 8,023,101 |
| Total Bond | 397,399,649 | 802,122,412 |
| Class I | 200,685,515 | 384,229,224 |
| Class Z | 201,337,546 | 308,637,569 |
| Total | $828,469,006 | $1,559,103,812 |
11. Share Transactions.
Share transactions for each class were as follows and may contain in-kind transactions, automatic conversions between classes or exchanges between affiliated funds:
| | Shares | Shares | Dollars | Dollars |
| | Year ended August 31, 2022 | Year ended August 31, 2021 | Year ended August 31, 2022 | Year ended August 31, 2021 |
| Fidelity Total Bond Fund | | | | |
| Class A | | | | |
| Shares sold | 16,666,627 | 30,648,384 | $176,364,750 | $343,524,412 |
| Reinvestment of distributions | 1,771,072 | 3,376,953 | 18,485,086 | 37,777,873 |
| Shares redeemed | (23,343,223) | (23,585,502) | (244,762,728) | (263,517,061) |
| Net increase (decrease) | (4,905,524) | 10,439,835 | $(49,912,892) | $117,785,224 |
| Class M | | | | |
| Shares sold | 8,195,741 | 12,828,125 | $87,497,942 | $143,664,293 |
| Reinvestment of distributions | 756,846 | 1,551,772 | 7,884,425 | 17,328,514 |
| Shares redeemed | (11,063,455) | (13,237,420) | (116,365,253) | (147,741,647) |
| Net increase (decrease) | (2,110,868) | 1,142,477 | $(20,982,886) | $13,251,160 |
| Class C | | | | |
| Shares sold | 1,532,704 | 5,121,794 | $16,248,853 | $57,670,060 |
| Reinvestment of distributions | 199,758 | 694,559 | 2,087,377 | 7,775,895 |
| Shares redeemed | (5,430,823) | (8,403,114) | (57,187,283) | (93,930,394) |
| Net increase (decrease) | (3,698,361) | (2,586,761) | $(38,851,053) | $(28,484,439) |
| Total Bond | | | | |
| Shares sold | 615,269,221 | 451,924,550 | $6,288,570,907 | $5,065,079,623 |
| Reinvestment of distributions | 33,962,376 | 65,931,531 | 353,838,883 | 737,445,426 |
| Shares redeemed | (568,466,680) | (472,458,240) | (5,903,672,470) | (5,276,957,150) |
| Net increase (decrease) | 80,764,917 | 45,397,841 | $738,737,320 | $525,567,899 |
| Class I | | | | |
| Shares sold | 256,144,611 | 264,054,948 | $2,659,006,174 | $2,953,374,208 |
| Reinvestment of distributions | 18,429,174 | 32,616,071 | 191,846,600 | 364,148,469 |
| Shares redeemed | (276,345,429) | (208,717,411) | (2,864,282,651) | (2,326,594,104) |
| Net increase (decrease) | (1,771,644) | 87,953,608 | $(13,429,877) | $990,928,573 |
| Class Z | | | | |
| Shares sold | 266,380,048 | 336,155,354 | $2,802,215,358 | $3,760,025,609 |
| Reinvestment of distributions | 15,081,006 | 21,266,104 | 157,427,587 | 237,422,475 |
| Shares redeemed | (337,880,305) | (139,318,942) | (3,495,731,085) | (1,551,988,096) |
| Net increase (decrease) | (56,419,251) | 218,102,516 | $(536,088,140) | $2,445,459,988 |
12. Other.
A fund's organizational documents provide former and current trustees and officers with a limited indemnification against liabilities arising in connection with the performance of their duties to the fund. In the normal course of business, a fund may also enter into contracts that provide general indemnifications. A fund's maximum exposure under these arrangements is unknown as this would be dependent on future claims that may be made against a fund. The risk of material loss from such claims is considered remote.
13. Credit Risk.
The Fund invests a significant portion of its assets in structured securities of issuers backed by commercial and residential mortgage loans, credit card receivables and automotive loans. The value and related income of these securities is sensitive to changes in economic conditions, including delinquencies and/or defaults.
14. Risk and Uncertainties.
Many factors affect a fund's performance. Developments that disrupt global economies and financial markets, such as pandemics, epidemics, outbreaks of infectious diseases, war, terrorism, and environmental disasters, may significantly affect a fund's investment performance. The effects of these developments to a fund will be impacted by the types of securities in which a fund invests, the financial condition, industry, economic sector, and geographic location of an issuer, and a fund's level of investment in the securities of that issuer.
Report of Independent Registered Public Accounting Firm
To the Board of Trustees of Fidelity Income Fund and Shareholders of Fidelity Total Bond Fund
Opinion on the Financial Statements
We have audited the accompanying statement of assets and liabilities, including the schedule of investments, of Fidelity Total Bond Fund (one of the funds constituting Fidelity Income Fund, referred to hereafter as the “Fund”) as of August 31, 2022, the related statement of operations for the year ended August 31, 2022, the statement of changes in net assets for each of the two years in the period ended August 31, 2022, including the related notes, and the financial highlights for each of the five years in the period ended August 31, 2022 (collectively referred to as the “financial statements”). In our opinion, the financial statements present fairly, in all material respects, the financial position of the Fund as of August 31, 2022, the results of its operations for the year then ended, the changes in its net assets for each of the two years in the period ended August 31, 2022 and the financial highlights for each of the five years in the period ended August 31, 2022 in conformity with accounting principles generally accepted in the United States of America.
Basis for Opinion
These financial statements are the responsibility of the Fund’s management. Our responsibility is to express an opinion on the Fund’s financial statements based on our audits. We are a public accounting firm registered with the Public Company Accounting Oversight Board (United States) (PCAOB) and are required to be independent with respect to the Fund in accordance with the U.S. federal securities laws and the applicable rules and regulations of the Securities and Exchange Commission and the PCAOB.
We conducted our audits of these financial statements in accordance with the standards of the PCAOB. Those standards require that we plan and perform the audit to obtain reasonable assurance about whether the financial statements are free of material misstatement, whether due to error or fraud.
Our audits included performing procedures to assess the risks of material misstatement of the financial statements, whether due to error or fraud, and performing procedures that respond to those risks. Such procedures included examining, on a test basis, evidence regarding the amounts and disclosures in the financial statements. Our audits also included evaluating the accounting principles used and significant estimates made by management, as well as evaluating the overall presentation of the financial statements. Our procedures included confirmation of securities owned as of August 31, 2022 by correspondence with the custodian, issuers of privately offered securities, agent banks and brokers; when replies were not received from brokers, we performed other auditing procedures. We believe that our audits provide a reasonable basis for our opinion.
/s/ PricewaterhouseCoopers LLP
Boston, Massachusetts
October 17, 2022
We have served as the auditor of one or more investment companies in the Fidelity group of funds since 1932.
Trustees and Officers
The Trustees, Members of the Advisory Board (if any), and officers of the trust and fund, as applicable, are listed below. The Board of Trustees governs the fund and is responsible for protecting the interests of shareholders. The Trustees are experienced executives who meet periodically throughout the year to oversee the fund's activities, review contractual arrangements with companies that provide services to the fund, oversee management of the risks associated with such activities and contractual arrangements, and review the fund's performance. Each of the Trustees oversees 297 funds.
The Trustees hold office without limit in time except that (a) any Trustee may resign; (b) any Trustee may be removed by written instrument, signed by at least two-thirds of the number of Trustees prior to such removal; (c) any Trustee who requests to be retired or who has become incapacitated by illness or injury may be retired by written instrument signed by a majority of the other Trustees; and (d) any Trustee may be removed at any special meeting of shareholders by a two-thirds vote of the outstanding voting securities of the trust. Each Trustee who is not an interested person (as defined in the 1940 Act) of the trust and the fund is referred to herein as an Independent Trustee. Each Independent Trustee shall retire not later than the last day of the calendar year in which his or her 75th birthday occurs. The Independent Trustees may waive this mandatory retirement age policy with respect to individual Trustees. Officers and Advisory Board Members hold office without limit in time, except that any officer or Advisory Board Member may resign or may be removed by a vote of a majority of the Trustees at any regular meeting or any special meeting of the Trustees. Except as indicated, each individual has held the office shown or other offices in the same company for the past five years.
The fund's Statement of Additional Information (SAI) includes more information about the Trustees. To request a free copy, call Fidelity at 1-800-544-8544 if you’re an individual investing directly with Fidelity, call 1-800-835-5092 if you’re a plan sponsor or participant with Fidelity as your recordkeeper or call 1-877-208-0098 on institutional accounts or if you’re an advisor or invest through one.
Experience, Skills, Attributes, and Qualifications of the Trustees. The Governance and Nominating Committee has adopted a statement of policy that describes the experience, qualifications, attributes, and skills that are necessary and desirable for potential Independent Trustee candidates (Statement of Policy). The Board believes that each Trustee satisfied at the time he or she was initially elected or appointed a Trustee, and continues to satisfy, the standards contemplated by the Statement of Policy. The Governance and Nominating Committee also engages professional search firms to help identify potential Independent Trustee candidates who have the experience, qualifications, attributes, and skills consistent with the Statement of Policy. From time to time, additional criteria based on the composition and skills of the current Independent Trustees, as well as experience or skills that may be appropriate in light of future changes to board composition, business conditions, and regulatory or other developments, have also been considered by the professional search firms and the Governance and Nominating Committee. In addition, the Board takes into account the Trustees' commitment and participation in Board and committee meetings, as well as their leadership of standing and ad hoc committees throughout their tenure.
In determining that a particular Trustee was and continues to be qualified to serve as a Trustee, the Board has considered a variety of criteria, none of which, in isolation, was controlling. The Board believes that, collectively, the Trustees have balanced and diverse experience, qualifications, attributes, and skills, which allow the Board to operate effectively in governing the fund and protecting the interests of shareholders. Information about the specific experience, skills, attributes, and qualifications of each Trustee, which in each case led to the Board's conclusion that the Trustee should serve (or continue to serve) as a trustee of the fund, is provided below.
Board Structure and Oversight Function. Abigail P. Johnson is an interested person and currently serves as Chairman. The Trustees have determined that an interested Chairman is appropriate and benefits shareholders because an interested Chairman has a personal and professional stake in the quality and continuity of services provided to the fund. Independent Trustees exercise their informed business judgment to appoint an individual of their choosing to serve as Chairman, regardless of whether the Trustee happens to be independent or a member of management. The Independent Trustees have determined that they can act independently and effectively without having an Independent Trustee serve as Chairman and that a key structural component for assuring that they are in a position to do so is for the Independent Trustees to constitute a substantial majority for the Board. The Independent Trustees also regularly meet in executive session. Michael E. Kenneally serves as Chairman of the Independent Trustees and as such (i) acts as a liaison between the Independent Trustees and management with respect to matters important to the Independent Trustees and (ii) with management prepares agendas for Board meetings.
Fidelity® funds are overseen by different Boards of Trustees. The fund's Board oversees Fidelity's investment-grade bond, money market, asset allocation and certain equity funds, and other Boards oversee Fidelity's high income and other equity funds. The asset allocation funds may invest in Fidelity® funds that are overseen by such other Boards. The use of separate Boards, each with its own committee structure, allows the Trustees of each group of Fidelity® funds to focus on the unique issues of the funds they oversee, including common research, investment, and operational issues. On occasion, the separate Boards establish joint committees to address issues of overlapping consequences for the Fidelity® funds overseen by each Board.
The Trustees operate using a system of committees to facilitate the timely and efficient consideration of all matters of importance to the Trustees, the fund, and fund shareholders and to facilitate compliance with legal and regulatory requirements and oversight of the fund's activities and associated risks. The Board, acting through its committees, has charged FMR and its affiliates with (i) identifying events or circumstances the occurrence of which could have demonstrably adverse effects on the fund's business and/or reputation; (ii) implementing processes and controls to lessen the possibility that such events or circumstances occur or to mitigate the effects of such events or circumstances if they do occur; and (iii) creating and maintaining a system designed to evaluate continuously business and market conditions in order to facilitate the identification and implementation processes described in (i) and (ii) above. Because the day-to-day operations and activities of the fund are carried out by or through FMR, its affiliates, and other service providers, the fund's exposure to risks is mitigated but not eliminated by the processes overseen by the Trustees. While each of the Board's committees has responsibility for overseeing different aspects of the fund's activities, oversight is exercised primarily through the Operations and Audit Committees. In addition, an ad hoc Board committee of Independent Trustees has worked with FMR to enhance the Board's oversight of investment and financial risks, legal and regulatory risks, technology risks, and operational risks, including the development of additional risk reporting to the Board. Appropriate personnel, including but not limited to the fund's Chief Compliance Officer (CCO), FMR's internal auditor, the independent accountants, the fund's Treasurer and portfolio management personnel, make periodic reports to the Board's committees, as appropriate, including an annual review of Fidelity's risk management program for the Fidelity® funds. The responsibilities of each standing committee, including their oversight responsibilities, are described further under "Standing Committees of the Trustees."
Interested Trustees*:
Correspondence intended for a Trustee who is an interested person may be sent to Fidelity Investments, 245 Summer Street, Boston, Massachusetts 02210.
Name, Year of Birth; Principal Occupations and Other Relevant Experience+
Abigail P. Johnson (1961)
Year of Election or Appointment: 2009
Trustee
Chairman of the Board of Trustees
Ms. Johnson also serves as Trustee of other Fidelity® funds. Ms. Johnson serves as Chairman (2016-present), Chief Executive Officer (2014-present), and Director (2007-present) of FMR LLC (diversified financial services company), President of Fidelity Financial Services (2012-present) and President of Personal, Workplace and Institutional Services (2005-present). Ms. Johnson is Chairman and Director of Fidelity Management & Research Company LLC (investment adviser firm, 2011-present). Previously, Ms. Johnson served as Chairman and Director of FMR Co., Inc. (investment adviser firm, 2011-2019), Vice Chairman (2007-2016) and President (2013-2016) of FMR LLC, President and a Director of Fidelity Management & Research Company (2001-2005), a Trustee of other investment companies advised by Fidelity Management & Research Company, Fidelity Investments Money Management, Inc. (investment adviser firm), and FMR Co., Inc. (2001-2005), Senior Vice President of the Fidelity® funds (2001-2005), and managed a number of Fidelity® funds. Ms. Abigail P. Johnson and Mr. Arthur E. Johnson are not related.
Jennifer Toolin McAuliffe (1959)
Year of Election or Appointment: 2016
Trustee
Ms. McAuliffe also serves as Trustee of other Fidelity® funds and as Trustee of Fidelity Charitable (2020-present). Previously, Ms. McAuliffe served as Co-Head of Fixed Income of Fidelity Investments Limited (now known as FIL Limited (FIL)) (diversified financial services company), Director of Research for FIL’s credit and quantitative teams in London, Hong Kong and Tokyo and Director of Research for taxable and municipal bonds at Fidelity Investments Money Management, Inc. Ms. McAuliffe previously served as a member of the Advisory Board of certain Fidelity® funds (2016). Ms. McAuliffe was previously a lawyer at Ropes & Gray LLP and currently serves as director or trustee of several not-for-profit entities.
* Determined to be an “Interested Trustee” by virtue of, among other things, his or her affiliation with the trust or various entities under common control with FMR.
+ The information includes the Trustee's principal occupation during the last five years and other information relating to the experience, attributes, and skills relevant to the Trustee's qualifications to serve as a Trustee, which led to the conclusion that the Trustee should serve as a Trustee for the fund.
Independent Trustees:
Correspondence intended for an Independent Trustee may be sent to Fidelity Investments, P.O. Box 55235, Boston, Massachusetts 02205-5235.
Name, Year of Birth; Principal Occupations and Other Relevant Experience+
Elizabeth S. Acton (1951)
Year of Election or Appointment: 2013
Trustee
Ms. Acton also serves as Trustee of other Fidelity® funds. Prior to her retirement, Ms. Acton served as Executive Vice President, Finance (2011-2012), Executive Vice President, Chief Financial Officer (2002-2011) and Treasurer (2004-2005) of Comerica Incorporated (financial services). Prior to joining Comerica, Ms. Acton held a variety of positions at Ford Motor Company (1983-2002), including Vice President and Treasurer (2000-2002) and Executive Vice President and Chief Financial Officer of Ford Motor Credit Company (1998-2000). Ms. Acton currently serves as a member of the Board and Audit and Finance Committees of Beazer Homes USA, Inc. (homebuilding, 2012-present). Ms. Acton previously served as a member of the Advisory Board of certain Fidelity® funds (2013-2016).
Ann E. Dunwoody (1953)
Year of Election or Appointment: 2018
Trustee
General Dunwoody also serves as Trustee of other Fidelity® funds. General Dunwoody (United States Army, Retired) was the first woman in U.S. military history to achieve the rank of four-star general and prior to her retirement in 2012 held a variety of positions within the U.S. Army, including Commanding General, U.S. Army Material Command (2008-2012). General Dunwoody currently serves as President of First to Four LLC (leadership and mentoring services, 2012-present), a member of the Board and Nomination and Corporate Governance Committees of Kforce Inc. (professional staffing services, 2016-present) and a member of the Board of Automattic Inc. (software engineering, 2018-present). Previously, General Dunwoody served as a member of the Advisory Board and Nominating and Corporate Governance Committee of L3 Technologies, Inc. (communication, electronic, sensor and aerospace systems, 2013-2019) and a member of the Board and Audit and Sustainability and Corporate Responsibility Committees of Republic Services, Inc. (waste collection, disposal and recycling, 2013-2016). Ms. Dunwoody also serves on several boards for non-profit organizations, including as a member of the Board, Chair of the Nomination and Governance Committee and a member of the Audit Committee of Logistics Management Institute (consulting non-profit, 2012-present), a member of the Council of Trustees for the Association of the United States Army (advocacy non-profit, 2013-present), a member of the Board of Florida Institute of Technology (2015-present) and a member of the Board of ThanksUSA (military family education non-profit, 2014-present). General Dunwoody previously served as a member of the Advisory Board of certain Fidelity® funds (2018).
John Engler (1948)
Year of Election or Appointment: 2014
Trustee
Mr. Engler also serves as Trustee of other Fidelity® funds. Previously, Mr. Engler served as Governor of Michigan (1991-2003), President of the Business Roundtable (2011-2017) and interim President of Michigan State University (2018-2019). Mr. Engler currently serves as a member of the Board of Stride, Inc. (formerly K12 Inc.) (technology-based education company, 2012-present). Previously, Mr. Engler served as a member of the Board of Universal Forest Products (manufacturer and distributor of wood and wood-alternative products, 2003-2019) and Trustee of The Munder Funds (2003-2014). Mr. Engler previously served as a member of the Advisory Board of certain Fidelity® funds (2014-2016).
Robert F. Gartland (1951)
Year of Election or Appointment: 2010
Trustee
Mr. Gartland also serves as Trustee of other Fidelity® funds. Prior to his retirement, Mr. Gartland held a variety of positions at Morgan Stanley (financial services, 1979-2007), including Managing Director (1987-2007) and Chase Manhattan Bank (1975-1978). Mr. Gartland previously served as Chairman and an investor in Gartland & Mellina Group Corp. (consulting, 2009-2019), as a member of the Board of National Securities Clearing Corporation (1993-1996) and as Chairman of TradeWeb (2003-2004).
Arthur E. Johnson (1947)
Year of Election or Appointment: 2008
Trustee
Mr. Johnson also serves as Trustee of other Fidelity® funds. Prior to his retirement, Mr. Johnson served as Senior Vice President of Corporate Strategic Development of Lockheed Martin Corporation (defense contractor, 1999-2009). Mr. Johnson currently serves as a member of the Board of Booz Allen Hamilton (management consulting, 2011-present). Mr. Johnson previously served as a member of the Board of Eaton Corporation plc (diversified power management, 2009-2019) and a member of the Board of AGL Resources, Inc. (holding company, 2002-2016). Mr. Johnson previously served as Chairman (2018-2021) and Vice Chairman (2015-2018) of the Independent Trustees of certain Fidelity® funds. Mr. Arthur E. Johnson is not related to Ms. Abigail P. Johnson.
Michael E. Kenneally (1954)
Year of Election or Appointment: 2009
Trustee
Chairman of the Independent Trustees
Mr. Kenneally also serves as Trustee of other Fidelity® funds and was Vice Chairman (2018-2021) of the Independent Trustees of certain Fidelity® funds. Prior to retirement in 2005, he was Chairman and Global Chief Executive Officer of Credit Suisse Asset Management, the worldwide fund management and institutional investment business of Credit Suisse Group. Previously, Mr. Kenneally was an Executive Vice President and the Chief Investment Officer for Bank of America. In this role, he was responsible for the investment management, strategy and products delivered to the bank’s institutional, high-net-worth and retail clients. Earlier, Mr. Kenneally directed the organization’s equity and quantitative research groups. He began his career as a research analyst and then spent more than a dozen years as a portfolio manager for endowments, pension plans and mutual funds. He earned the Chartered Financial Analyst (CFA) designation in 1991.
Marie L. Knowles (1946)
Year of Election or Appointment: 2001
Trustee
Ms. Knowles also serves as Trustee of other Fidelity® funds. Prior to her retirement, Ms. Knowles held several positions at Atlantic Richfield Company (diversified energy), including Executive Vice President and Chief Financial Officer (1996-2000), Senior Vice President (1993-1996) and President of ARCO Transportation Company (pipeline and tanker operations, 1993-1996). Ms. Knowles currently serves as a member of the Board of the Santa Catalina Island Company (real estate, 2009-present), a member of the Investment Company Institute Board of Governors and a member of the Governing Council of the Independent Directors Council (2014-present). Ms. Knowles also serves as a member of the Advisory Board for the School of Engineering of the University of Southern California. Ms. Knowles previously served as a member of the Board of McKesson Corporation (healthcare service, 2002-2021). In addition, Ms. Knowles previously served as Chairman (2015-2018) and Vice Chairman (2012-2015) of the Independent Trustees of certain Fidelity® funds.
Mark A. Murray (1954)
Year of Election or Appointment: 2016
Trustee
Mr. Murray also serves as Trustee of other Fidelity® funds. Previously, Mr. Murray served as Co-Chief Executive Officer (2013-2016), President (2006-2013) and Vice Chairman (2013-2020) of Meijer, Inc. Mr. Murray serves as a member of the Board (2009-present) and Public Policy and Responsibility Committee (2009-present) and Chair of the Nuclear Review Committee (2019-present) of DTE Energy Company (diversified energy company). Mr. Murray previously served as a member of the Board of Spectrum Health (not-for-profit health system, 2015-2019) and as a member of the Board and Audit Committee and Chairman of the Nominating and Corporate Governance Committee of Universal Forest Products, Inc. (manufacturer and distributor of wood and wood-alternative products, 2004-2016). Mr. Murray also serves as a member of the Board of many community and professional organizations. Mr. Murray previously served as a member of the Advisory Board of certain Fidelity® funds (2016).
+ The information includes the Trustee's principal occupation during the last five years and other information relating to the experience, attributes, and skills relevant to the Trustee's qualifications to serve as a Trustee, which led to the conclusion that the Trustee should serve as a Trustee for the fund.
Advisory Board Members and Officers:
Correspondence intended for an officer may be sent to Fidelity Investments, 245 Summer Street, Boston, Massachusetts 02210. Officers appear below in alphabetical order.
Name, Year of Birth; Principal Occupation
Laura M. Bishop (1961)
Year of Election or Appointment: 2022
Member of the Advisory Board
Ms. Bishop also serves as a Member of the Advisory Board of other funds. Prior to her retirement, Ms. Bishop held a variety of positions at United Services Automobile Association (2001-2020), including Executive Vice President and Chief Financial Officer (2014-2020) and Senior Vice President and Deputy Chief Financial Officer (2012-2014). Ms. Bishop currently serves as a member of the Audit Committee and Compensation and Personnel Committee (2021-present) of the Board of Directors of Korn Ferry (global organizational consulting).
Robert W. Helm (1957)
Year of Election or Appointment: 2021
Member of the Advisory Board
Mr. Helm also serves as a Member of the Advisory Board of other Fidelity® funds. Mr. Helm was formerly Deputy Chairman (2003-2020), partner (1991-2020) and an associate (1984-1991) of Dechert LLP (formerly Dechert Price & Rhoads). Mr. Helm currently serves on boards and committees of several not-for-profit organizations.
Craig S. Brown (1977)
Year of Election or Appointment: 2019
Assistant Treasurer
Mr. Brown also serves as an officer of other funds. Mr. Brown serves as Assistant Treasurer of FIMM, LLC (2021-present) and is an employee of Fidelity Investments (2013-present).
John J. Burke III (1964)
Year of Election or Appointment: 2018
Chief Financial Officer
Mr. Burke also serves as Chief Financial Officer of other funds. Mr. Burke serves as Head of Investment Operations for Fidelity Fund and Investment Operations (2018-present) and is an employee of Fidelity Investments (1998-present). Previously Mr. Burke served as head of Asset Management Investment Operations (2012-2018).
David J. Carter (1973)
Year of Election or Appointment: 2020
Assistant Secretary
Mr. Carter also serves as Assistant Secretary of other funds. Mr. Carter serves as Senior Vice President, Deputy General Counsel (2022-present) and is an employee of Fidelity Investments (2005-present).
Jonathan Davis (1968)
Year of Election or Appointment: 2010
Assistant Treasurer
Mr. Davis also serves as an officer of other funds. Mr. Davis serves as Assistant Treasurer of FIMM, LLC (2021-present), FMR Capital, Inc. (2017-present), FD Funds GP LLC (2021-present), FD Funds Holding LLC (2021-present), and FD Funds Management LLC (2021-present); and is an employee of Fidelity Investments. Previously, Mr. Davis served as Vice President and Associate General Counsel of FMR LLC (diversified financial services company, 2003-2010).
Laura M. Del Prato (1964)
Year of Election or Appointment: 2018
President and Treasurer
Ms. Del Prato also serves as an officer of other funds. Ms. Del Prato serves as Assistant Treasurer of FIMM, LLC (2021-present) and is an employee of Fidelity Investments (2017-present). Previously, Ms. Del Prato served as President and Treasurer of The North Carolina Capital Management Trust: Cash Portfolio and Term Portfolio (2018-2020). Prior to joining Fidelity Investments, Ms. Del Prato served as a Managing Director and Treasurer of the JPMorgan Mutual Funds (2014-2017). Prior to JPMorgan, Ms. Del Prato served as a partner at Cohen Fund Audit Services (accounting firm, 2012-2013) and KPMG LLP (accounting firm, 2004-2012).
Colm A. Hogan (1973)
Year of Election or Appointment: 2016
Assistant Treasurer
Mr. Hogan also serves as an officer of other funds. Mr. Hogan serves as Assistant Treasurer of FIMM, LLC (2021-present) and FMR Capital, Inc. (2017-present) and is an employee of Fidelity Investments (2005-present). Previously, Mr. Hogan served as Deputy Treasurer of certain Fidelity® funds (2016-2020) and Assistant Treasurer of certain Fidelity® funds (2016-2018).
Cynthia Lo Bessette (1969)
Year of Election or Appointment: 2019
Secretary and Chief Legal Officer (CLO)
Ms. Lo Bessette also serves as an officer of other funds. Ms. Lo Bessette serves as CLO, Secretary, and Senior Vice President of Fidelity Management & Research Company LLC (investment adviser firm, 2019-present); CLO of Fidelity Management & Research (Hong Kong) Limited, FMR Investment Management (UK) Limited, and Fidelity Management & Research (Japan) Limited (investment adviser firms, 2019-present); Secretary of FD Funds GP LLC (2021-present), FD Funds Holding LLC (2021-present), and FD Funds Management LLC (2021-present); and Assistant Secretary of FIMM, LLC (2019-present). She is a Senior Vice President and Deputy General Counsel of FMR LLC (diversified financial services company, 2019-present), and is an employee of Fidelity Investments. Previously, Ms. Lo Bessette served as CLO, Secretary, and Senior Vice President of FMR Co., Inc. (investment adviser firm, 2019); Secretary of Fidelity SelectCo, LLC and Fidelity Investments Money Management, Inc. (investment adviser firms, 2019). Prior to joining Fidelity Investments, Ms. Lo Bessette was Executive Vice President, General Counsel (2016-2019) and Senior Vice President, Deputy General Counsel (2015-2016) of OppenheimerFunds (investment management company) and Deputy Chief Legal Officer (2013-2015) of Jennison Associates LLC (investment adviser firm).
Chris Maher (1972)
Year of Election or Appointment: 2013
Assistant Treasurer
Mr. Maher also serves as an officer of other funds. Mr. Maher serves as Assistant Treasurer of FIMM, LLC (2021-present) and FMR Capital, Inc. (2017-present), and is an employee of Fidelity Investments (2008-present). Previously, Mr. Maher served as Assistant Treasurer of certain funds (2013-2020); Vice President of Asset Management Compliance (2013), Vice President of the Program Management Group of FMR (investment adviser firm, 2010-2013), and Vice President of Valuation Oversight (2008-2010).
Jamie Pagliocco (1964)
Year of Election or Appointment: 2020
Vice President
Mr. Pagliocco also serves as Vice President of other funds. Mr. Pagliocco serves as President of Fixed Income (2020-present), and is an employee of Fidelity Investments (2001-present). Previously, Mr. Pagliocco served as Co-Chief Investment Officer – Bond (2017-2020), Global Head of Bond Trading (2016-2019), and as a portfolio manager.
Kenneth B. Robins (1969)
Year of Election or Appointment: 2020
Chief Compliance Officer
Mr. Robins also serves as an officer of other funds. Mr. Robins serves as Compliance Officer of Fidelity Management & Research Company LLC (investment adviser firm, 2016-present) and is an employee of Fidelity Investments (2004-present). Previously, Mr. Robins served as Compliance Officer of FMR Co., Inc. (investment adviser firm, 2016-2019), as Executive Vice President of Fidelity Investments Money Management, Inc. (investment adviser firm, 2013-2016) and served in other fund officer roles.
Brett Segaloff (1972)
Year of Election or Appointment: 2021
Anti-Money Laundering (AML) Officer
Mr. Segaloff also serves as an AML Officer of other funds and other related entities. He is Director, Anti-Money Laundering (2007-present) of FMR LLC (diversified financial services company) and is an employee of Fidelity Investments (1996-present).
Stacie M. Smith (1974)
Year of Election or Appointment: 2013
Assistant Treasurer
Ms. Smith also serves as an officer of other funds. Ms. Smith serves as Assistant Treasurer of FIMM, LLC (2021-present) and FMR Capital, Inc. (2017-present), is an employee of Fidelity Investments (2009-present), and has served in other fund officer roles. Prior to joining Fidelity Investments, Ms. Smith served as Senior Audit Manager of Ernst & Young LLP (accounting firm, 1996-2009). Previously, Ms. Smith served as Assistant Treasurer (2013-2019) and Deputy Treasurer (2013-2016) of certain Fidelity® funds.
Jim Wegmann (1979)
Year of Election or Appointment: 2021
Deputy Treasurer
Mr. Wegmann also serves as an officer of other funds. Mr. Wegmann serves as Assistant Treasurer of FIMM, LLC (2021-present) and is an employee of Fidelity Investments (2011-present). Previously, Mr. Wegmann served as Assistant Treasurer of certain Fidelity® funds (2019-2021).
Shareholder Expense Example
As a shareholder, you incur two types of costs: (1) transaction costs, which may include sales charges (loads) on purchase payments or redemption proceeds, as applicable and (2) ongoing costs, which generally include management fees, distribution and/or service (12b-1) fees and other Fund expenses. This Example is intended to help you understand your ongoing costs (in dollars) of investing in a fund and to compare these costs with the ongoing costs of investing in other mutual funds.
The Example is based on an investment of $1,000 invested at the beginning of the period and held for the entire period (March 1, 2022 to August 31, 2022).
Actual Expenses
The first line of the accompanying table provides information about actual account values and actual expenses. You may use the information in this line, together with the amount you invested, to estimate the expenses that you paid over the period. Simply divide your account value by $1,000.00 (for example, an $8,600 account value divided by $1,000.00 = 8.6), then multiply the result by the number in the first line for a class/Fund under the heading entitled "Expenses Paid During Period" to estimate the expenses you paid on your account during this period. If any fund is a shareholder of any underlying mutual funds or exchange-traded funds (ETFs) (the Underlying Funds), such fund indirectly bears its proportional share of the expenses of the Underlying Funds in addition to the direct expenses incurred presented in the table. These fees and expenses are not included in the annualized expense ratio used to calculate the expense estimate in the table below.
Hypothetical Example for Comparison Purposes
The second line of the accompanying table provides information about hypothetical account values and hypothetical expenses based on the actual expense ratio and an assumed rate of return of 5% per year before expenses, which is not the actual return. The hypothetical account values and expenses may not be used to estimate the actual ending account balance or expenses you paid for the period. You may use this information to compare the ongoing costs of investing in the Fund and other funds. To do so, compare this 5% hypothetical example with the 5% hypothetical examples that appear in the shareholder reports of the other funds. If any fund is a shareholder of any Underlying Funds, such fund indirectly bears its proportional share of the expenses of the Underlying Funds in addition to the direct expenses as presented in the table. These fees and expenses are not included in the annualized expense ratio used to calculate the expense estimate in the table below.
Please note that the expenses shown in the table are meant to highlight your ongoing costs only and do not reflect any transaction costs. Therefore, the second line of the table is useful in comparing ongoing costs only, and will not help you determine the relative total costs of owning different funds. In addition, if these transactional costs were included, your costs would have been higher.
| | Annualized Expense Ratio-A | Beginning
Account Value
March 1, 2022 | Ending
Account Value
August 31, 2022 | Expenses Paid
During Period-B
March 1, 2022
to August 31, 2022 |
| Fidelity Total Bond Fund | | | | |
| Class A | .74% | | | |
| Actual | | $1,000.00 | $918.90 | $3.58 |
| Hypothetical-C | | $1,000.00 | $1,021.48 | $3.77 |
| Class M | .74% | | | |
| Actual | | $1,000.00 | $918.70 | $3.58 |
| Hypothetical-C | | $1,000.00 | $1,021.48 | $3.77 |
| Class C | 1.50% | | | |
| Actual | | $1,000.00 | $915.40 | $7.24 |
| Hypothetical-C | | $1,000.00 | $1,017.64 | $7.63 |
| Total Bond | .45% | | | |
| Actual | | $1,000.00 | $920.20 | $2.18 |
| Hypothetical-C | | $1,000.00 | $1,022.94 | $2.29 |
| Class I | .50% | | | |
| Actual | | $1,000.00 | $919.90 | $2.42 |
| Hypothetical-C | | $1,000.00 | $1,022.68 | $2.55 |
| Class Z | .36% | | | |
| Actual | | $1,000.00 | $920.50 | $1.74 |
| Hypothetical-C | | $1,000.00 | $1,023.39 | $1.84 |
A Annualized expense ratio reflects expenses net of applicable fee waivers.
B Expenses are equal to the annualized expense ratio, multiplied by the average account value over the period, multiplied by 184/ 365 (to reflect the one-half year period). The fees and expenses of any Underlying Funds are not included in each annualized expense ratio.
C 5% return per year before expenses
Distributions (Unaudited)
The dividend and capital gains distributions for the fund(s) are available on Fidelity.com or Institutional.Fidelity.com.
The fund hereby designates as a capital gain dividend with respect to the taxable year ended August 31, 2022, $9,880,852, or, if subsequently determined to be different, the net capital gain of such year.
A total of 16.92% of the dividends distributed during the fiscal year was derived from interest on U.S. Government securities which is generally exempt from state income tax.
The fund designates $562,024,313 of distributions paid in the calendar year 2021 as qualifying to be taxed as interest-related dividends for nonresident alien shareholders.
The fund designates $717,338,195 of distributions paid in the calendar year 2021 as qualifying to be taxed as section 163(j) interest dividends.
The fund will notify shareholders in January 2023 of amounts for use in preparing 2022 income tax returns.
TBD-ANN-1022
1.789692.120
Fidelity® Total Bond K6 Fund
Annual Report
August 31, 2022
Contents
To view a fund's proxy voting guidelines and proxy voting record for the 12-month period ended June 30, visit http://www.fidelity.com/proxyvotingresults or visit the Securities and Exchange Commission's (SEC) web site at http://www.sec.gov.
You may also call 1-800-835-5092 to request a free copy of the proxy voting guidelines.
Standard & Poor's, S&P and S&P 500 are registered service marks of The McGraw-Hill Companies, Inc. and have been licensed for use by Fidelity Distributors Corporation.
Other third-party marks appearing herein are the property of their respective owners.
All other marks appearing herein are registered or unregistered trademarks or service marks of FMR LLC or an affiliated company. © 2022 FMR LLC. All rights reserved.
This report and the financial statements contained herein are submitted for the general information of the shareholders of the Fund. This report is not authorized for distribution to prospective investors in the Fund unless preceded or accompanied by an effective prospectus.
A fund files its complete schedule of portfolio holdings with the SEC for the first and third quarters of each fiscal year on Form N-PORT. Forms N-PORT are available on the SEC’s web site at http://www.sec.gov. A fund's Forms N-PORT may be reviewed and copied at the SEC’s Public Reference Room in Washington, DC. Information regarding the operation of the SEC's Public Reference Room may be obtained by calling 1-800-SEC-0330.
For a complete list of a fund's portfolio holdings, view the most recent holdings listing, semiannual report, or annual report on Fidelity's web site at http://www.fidelity.com, http://www.institutional.fidelity.com, or http://www.401k.com, as applicable.
NOT FDIC INSURED •MAY LOSE VALUE •NO BANK GUARANTEE
Neither the Fund nor Fidelity Distributors Corporation is a bank.
Performance: The Bottom Line
Average annual total return reflects the change in the value of an investment, assuming reinvestment of distributions from dividend income and capital gains (the profits earned upon the sale of securities that have grown in value, if any) and assuming a constant rate of performance each year. The hypothetical investment and the average annual total returns do not reflect the deduction of taxes that a shareholder would pay on fund distributions or the redemption of fund shares. During periods of reimbursement by Fidelity, a fund’s total return will be greater than it would be had the reimbursement not occurred. How a fund did yesterday is no guarantee of how it will do tomorrow.
Average Annual Total Returns
| For the periods ended August 31, 2022 | Past 1 year | Past 5 years | Life of fundA |
| Fidelity® Total Bond K6 Fund | (11.07)% | 1.38% | 1.57% |
A From May 25, 2017
$10,000 Over Life of Fund
Let's say hypothetically that $10,000 was invested in Fidelity® Total Bond K6 Fund on May 25, 2017, when the fund started.
The chart shows how the value of your investment would have changed, and also shows how the Bloomberg U.S. Aggregate Bond Index performed over the same period.
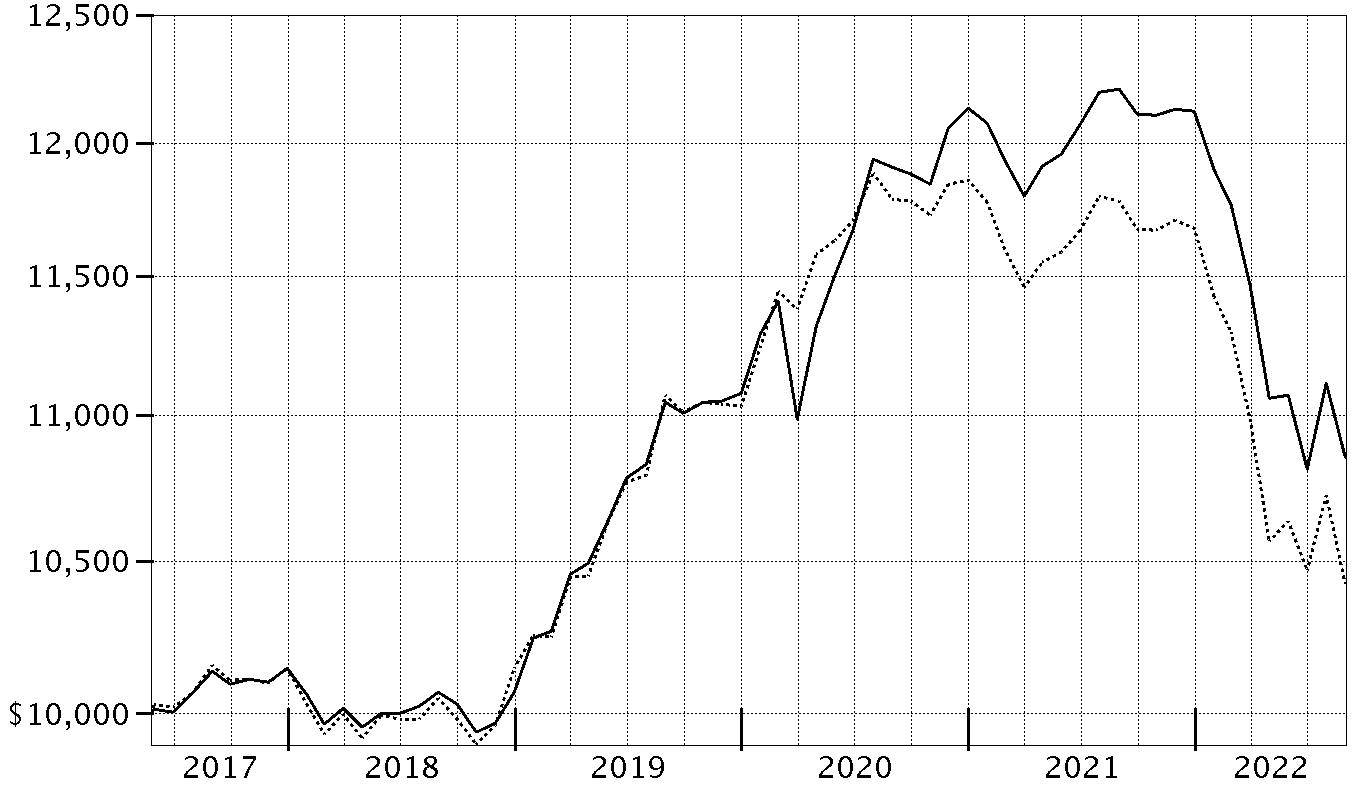
| Period Ending Values |
| $10,854 | Fidelity® Total Bond K6 Fund |
| $10,420 | Bloomberg U.S. Aggregate Bond Index |
Management's Discussion of Fund Performance
Market Recap: U.S. taxable investment-grade bonds notably declined for the 12 months ending August 31, 2022, as the U.S. Federal Reserve took aggressive action to stymie high inflation. The Bloomberg U.S. Aggregate Bond Index returned -11.52% for the period. In late 2021, bond yields rose when the Fed pivoted from an “easy” to a “tight” monetary stance. Its first step was to cease its purchases of bonds, part of a quantitative easing program to support the U.S. economy that began in 2008. In the first half of 2022, the Fed took more aggressive steps to thwart inflation. The central bank raised the federal funds target rate by 25 basis points (0.25%) in mid-March, 50 basis points in May and 75 basis points in June – its largest increase since 1994 – and said it was becoming more difficult to achieve a soft landing, in which the economy slows enough to bring down inflation while avoiding a recession. It also began to allow up to billions in Treasuries and mortgage bonds to mature every month without investing the proceeds. Despite another rate hike of 75 basis points in July, the index rose 2.44% for the month, only to reverse course (-2.83%) in August, when the Fed dashed hopes that it would soon “pivot” to an easier policy stance. For the full 12 months, shorter-term securities outpaced longer-term bonds, and higher-quality issues held up better than lower-rated bonds. Within the index, corporate bonds posted a return of -14.61%, trailing the -10.80% result for U.S. Treasuries. Outside the index, U.S. corporate high-yield bonds returned -10.43%, while U.S. Treasury Inflation-Protected Securities had a return of -5.98%.
Comments from Co=Portfolio Managers Ford O’Neil and Celso Munoz: For the fiscal year ending August 31, 2022, the fund returned -11.07%, net of fees, slightly trailing the -11.52% result of the benchmark Bloomberg U.S. Aggregate Bond Index. The fund had a shorter duration (less interest-rate sensitivity), which boosted relative performance as interest rates rose. Underweighting mortgage-backed securities also aided the fund’s relative return, as did non-index exposure to Treasury Inflation-Protected Securities (TIPS), which we owned early in the period. In contrast, allocations to “plus” sectors – including high-yield bonds, leveraged loans and emerging markets debt – detracted, given that these segments underperformed the benchmark in an environment that favored higher-quality sectors. Likewise, among investment-grade holdings, overweighting BBB-rated corporate bonds detracted, as these lower-quality securities lagged high-quality corporate bonds. Overweighting asset-backed securities, including collateralized loan obligations (CLOs) and commercial mortgage-backed securities, also hindered the relative result. A stake in international credit was another performance headwind.
The views expressed above reflect those of the portfolio manager(s) only through the end of the period as stated on the cover of this report and do not necessarily represent the views of Fidelity or any other person in the Fidelity organization. Any such views are subject to change at any time based upon market or other conditions and Fidelity disclaims any responsibility to update such views. These views may not be relied on as investment advice and, because investment decisions for a Fidelity fund are based on numerous factors, may not be relied on as an indication of trading intent on behalf of any Fidelity fund.
Note to shareholders: On October 1, 2021, Lisa Easterbrook assumed co-management responsibilities for the fund’s International Investment Grade subportfolio.
On June 1, 2022, Sean Corcoran assumed co-management responsibilities for the fund.
Investment Summary (Unaudited)
The information in the following tables is based on the combined investments of the Fund and its pro-rata share of the investments of Fidelity's Fixed-Income Central Funds.
Quality Diversification (% of fund's net assets)
| As of August 31, 2022 |
| | U.S. Government and U.S. Government Agency Obligations | 42.3% |
| | AAA | 6.3% |
| | AA | 1.3% |
| | A | 8.1% |
| | BBB | 20.6% |
| | BB and Below | 17.0% |
| | Not Rated | 2.3% |
| | Equities | 0.1% |
| | Short-Term Investments and Net Other Assets | 2.0% |
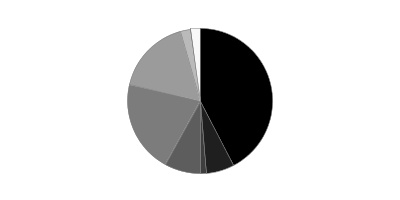
We have used ratings from Moody’s Investors Service, Inc. Where Moody’s® ratings are not available, we have used S&P® ratings. All ratings are as of the date indicated and do not reflect subsequent changes. Securities rated BB or below were rated investment grade at the time of acquisition.
Asset Allocation (% of fund's net assets)
| As of August 31, 2022* |
| | Corporate Bonds | 37.0% |
| | U.S. Government and U.S. Government Agency Obligations | 42.3% |
| | Asset-Backed Securities | 5.7% |
| | CMOs and Other Mortgage Related Securities | 4.1% |
| | Municipal Bonds | 0.2% |
| | Stocks | 0.1% |
| | Other Investments | 8.6% |
| | Short-Term Investments and Net Other Assets (Liabilities) | 2.0% |
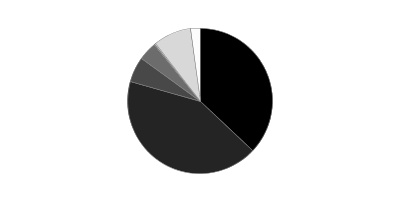
* Futures and Swaps – 2.3%
An unaudited holdings listing for the Fund, which presents direct holdings as well as the pro-rata share of any securities and other investments held indirectly through its investment in underlying non-money market Fidelity Central Funds, is available at fidelity.com and/or institutional.fidelity.com, as applicable.
Geographic Diversification (% of fund's net assets)
| As of August 31, 2022 |
| | United States of America* | 84.1% |
| | Cayman Islands | 4.9% |
| | United Kingdom | 1.4% |
| | Mexico | 1.1% |
| | Canada | 1.0% |
| | Switzerland | 0.9% |
| | Ireland | 0.7% |
| | Luxembourg | 0.7% |
| | France | 0.7% |
| | Other | 4.5% |

* Includes Short-Term investments and Net Other Assets (Liabilities).
Percentages are based on country or territory of incorporation and are adjusted for the effect of futures contracts, if applicable.
Percentages in the above tables are adjusted for the effect of TBA Sale Commitments.
Schedule of Investments August 31, 2022
Showing Percentage of Net Assets
| Nonconvertible Bonds - 28.2% | | | |
| | | Principal Amount | Value |
| COMMUNICATION SERVICES - 2.2% | | | |
| Diversified Telecommunication Services - 0.5% | | | |
| AT&T, Inc.: | | | |
| 2.55% 12/1/33 | | $339,000 | $270,104 |
| 3.8% 12/1/57 | | 4,105,000 | 3,107,359 |
| 4.3% 2/15/30 | | 559,000 | 536,186 |
| 5.15% 11/15/46 | | 1,000,000 | 965,996 |
| Verizon Communications, Inc.: | | | |
| 2.1% 3/22/28 | | 1,151,000 | 1,017,220 |
| 2.55% 3/21/31 | | 1,065,000 | 900,142 |
| 3% 3/22/27 | | 263,000 | 248,772 |
| 4.862% 8/21/46 | | 1,250,000 | 1,215,412 |
| 5.012% 4/15/49 | | 16,000 | 15,883 |
| | | | 8,277,074 |
| Entertainment - 0.1% | | | |
| The Walt Disney Co. 3.8% 3/22/30 | | 2,050,000 | 1,981,631 |
| Media - 1.2% | | | |
| Charter Communications Operating LLC/Charter Communications Operating Capital Corp.: | | | |
| 4.4% 4/1/33 | | 1,526,000 | 1,349,003 |
| 4.908% 7/23/25 | | 945,000 | 941,761 |
| 5.25% 4/1/53 | | 2,499,000 | 2,090,641 |
| 5.375% 5/1/47 | | 2,000,000 | 1,704,576 |
| 5.5% 4/1/63 | | 2,499,000 | 2,091,046 |
| 5.75% 4/1/48 | | 861,000 | 766,114 |
| Comcast Corp. 6.45% 3/15/37 | | 365,000 | 421,061 |
| Discovery Communications LLC: | | | |
| 3.625% 5/15/30 | | 708,000 | 620,287 |
| 4.65% 5/15/50 | | 1,913,000 | 1,453,294 |
| Fox Corp.: | | | |
| 4.03% 1/25/24 | | 216,000 | 215,441 |
| 4.709% 1/25/29 | | 312,000 | 308,771 |
| 5.476% 1/25/39 | | 308,000 | 302,776 |
| Magallanes, Inc.: | | | |
| 3.428% 3/15/24 (a) | | 909,000 | 888,593 |
| 3.638% 3/15/25 (a) | | 498,000 | 480,827 |
| 3.755% 3/15/27 (a) | | 973,000 | 908,861 |
| 4.054% 3/15/29 (a) | | 337,000 | 306,870 |
| 4.279% 3/15/32 (a) | | 3,816,000 | 3,325,010 |
| 5.05% 3/15/42 (a) | | 738,000 | 603,324 |
| 5.141% 3/15/52 (a) | | 1,091,000 | 873,233 |
| Time Warner Cable LLC: | | | |
| 6.75% 6/15/39 | | 545,000 | 529,897 |
| 7.3% 7/1/38 | | 2,420,000 | 2,486,057 |
| | | | 22,667,443 |
| Wireless Telecommunication Services - 0.4% | | | |
| Millicom International Cellular SA 6.25% 3/25/29 (a) | | 1,440,000 | 1,365,570 |
| Rogers Communications, Inc.: | | | |
| 3.2% 3/15/27 (a) | | 1,051,000 | 999,956 |
| 3.8% 3/15/32 (a) | | 917,000 | 836,951 |
| T-Mobile U.S.A., Inc.: | | | |
| 3.75% 4/15/27 | | 1,250,000 | 1,198,626 |
| 3.875% 4/15/30 | | 2,100,000 | 1,940,876 |
| 4.375% 4/15/40 | | 269,000 | 237,274 |
| 4.5% 4/15/50 | | 528,000 | 460,738 |
| | | | 7,039,991 |
|
| TOTAL COMMUNICATION SERVICES | | | 39,966,139 |
|
| CONSUMER DISCRETIONARY - 0.5% | | | |
| Automobiles - 0.1% | | | |
| Volkswagen Group of America Finance LLC 3.125% 5/12/23 (a) | | 1,017,000 | 1,011,628 |
| Hotels, Restaurants & Leisure - 0.0% | | | |
| McDonald's Corp.: | | | |
| 3.5% 7/1/27 | | 353,000 | 342,677 |
| 3.6% 7/1/30 | | 419,000 | 397,265 |
| | | | 739,942 |
| Leisure Products - 0.0% | | | |
| Hasbro, Inc. 3% 11/19/24 | | 890,000 | 867,650 |
| Specialty Retail - 0.4% | | | |
| AutoNation, Inc. 4.75% 6/1/30 | | 156,000 | 146,023 |
| AutoZone, Inc.: | | | |
| 3.625% 4/15/25 | | 239,000 | 235,326 |
| 4% 4/15/30 | | 1,110,000 | 1,053,663 |
| Lowe's Companies, Inc.: | | | |
| 3.35% 4/1/27 | | 149,000 | 143,622 |
| 3.75% 4/1/32 | | 459,000 | 422,703 |
| 4.25% 4/1/52 | | 1,870,000 | 1,592,656 |
| 4.45% 4/1/62 | | 2,116,000 | 1,786,978 |
| 4.5% 4/15/30 | | 798,000 | 786,384 |
| O'Reilly Automotive, Inc. 4.2% 4/1/30 | | 246,000 | 236,518 |
| | | | 6,403,873 |
|
| TOTAL CONSUMER DISCRETIONARY | | | 9,023,093 |
|
| CONSUMER STAPLES - 2.0% | | | |
| Beverages - 1.0% | | | |
| Anheuser-Busch InBev Finance, Inc.: | | | |
| 4.7% 2/1/36 | | 2,133,000 | 2,063,651 |
| 4.9% 2/1/46 | | 4,500,000 | 4,272,111 |
| Anheuser-Busch InBev Worldwide, Inc.: | | | |
| 3.5% 6/1/30 | | 900,000 | 846,005 |
| 4.35% 6/1/40 | | 720,000 | 654,928 |
| 4.5% 6/1/50 | | 1,000,000 | 906,692 |
| 4.75% 4/15/58 | | 613,000 | 559,363 |
| 5.45% 1/23/39 | | 800,000 | 824,661 |
| 5.55% 1/23/49 | | 1,824,000 | 1,896,436 |
| 5.8% 1/23/59 (Reg. S) | | 1,933,000 | 2,061,651 |
| Molson Coors Beverage Co. 5% 5/1/42 | | 2,945,000 | 2,731,238 |
| The Coca-Cola Co.: | | | |
| 3.375% 3/25/27 | | 1,279,000 | 1,263,825 |
| 3.45% 3/25/30 | | 713,000 | 686,307 |
| | | | 18,766,868 |
| Food & Staples Retailing - 0.1% | | | |
| Sysco Corp.: | | | |
| 5.95% 4/1/30 | | 471,000 | 506,617 |
| 6.6% 4/1/50 | | 710,000 | 823,093 |
| | | | 1,329,710 |
| Food Products - 0.4% | | | |
| JBS U.S.A. Lux SA / JBS Food Co.: | | | |
| 2.5% 1/15/27 (a) | | 1,945,000 | 1,745,462 |
| 3% 5/15/32 (a) | | 1,955,000 | 1,615,377 |
| 3.625% 1/15/32 (a) | | 353,000 | 305,140 |
| 5.125% 2/1/28 (a) | | 735,000 | 734,081 |
| 5.5% 1/15/30 (a) | | 342,000 | 342,000 |
| 5.75% 4/1/33 (a) | | 1,515,000 | 1,509,198 |
| 6.5% 4/15/29 (a) | | 320,000 | 331,971 |
| | | | 6,583,229 |
| Tobacco - 0.5% | | | |
| Altria Group, Inc.: | | | |
| 3.875% 9/16/46 | | 1,521,000 | 1,054,808 |
| 4.25% 8/9/42 | | 932,000 | 698,390 |
| 4.5% 5/2/43 | | 632,000 | 480,727 |
| 4.8% 2/14/29 | | 173,000 | 167,524 |
| 5.375% 1/31/44 | | 1,137,000 | 1,003,779 |
| 5.95% 2/14/49 | | 600,000 | 538,509 |
| BAT Capital Corp.: | | | |
| 4.7% 4/2/27 | | 1,252,000 | 1,218,246 |
| 4.906% 4/2/30 | | 1,500,000 | 1,412,632 |
| 5.282% 4/2/50 | | 1,500,000 | 1,208,331 |
| Imperial Tobacco Finance PLC: | | | |
| 4.25% 7/21/25 (a) | | 1,564,000 | 1,530,452 |
| 6.125% 7/27/27 (a) | | 764,000 | 775,543 |
| Reynolds American, Inc. 7.25% 6/15/37 | | 75,000 | 77,076 |
| | | | 10,166,017 |
|
| TOTAL CONSUMER STAPLES | | | 36,845,824 |
|
| ENERGY - 4.0% | | | |
| Oil, Gas & Consumable Fuels - 4.0% | | | |
| Canadian Natural Resources Ltd.: | | | |
| 2.05% 7/15/25 | | 5,400,000 | 5,027,456 |
| 3.85% 6/1/27 | | 2,700,000 | 2,577,391 |
| 3.9% 2/1/25 | | 525,000 | 516,460 |
| 5.85% 2/1/35 | | 525,000 | 522,848 |
| Cenovus Energy, Inc.: | | | |
| 3.75% 2/15/52 | | 210,000 | 162,193 |
| 4.25% 4/15/27 | | 1,203,000 | 1,184,973 |
| 5.4% 6/15/47 | | 244,000 | 236,443 |
| 6.75% 11/15/39 | | 450,000 | 491,918 |
| Columbia Pipeline Group, Inc.: | | | |
| 4.5% 6/1/25 | | 25,000 | 24,898 |
| 5.8% 6/1/45 | | 10,000 | 10,361 |
| DCP Midstream Operating LP: | | | |
| 3.875% 3/15/23 | | 520,000 | 518,700 |
| 5.85% 5/21/43 (a)(b) | | 2,820,000 | 2,747,808 |
| Enbridge, Inc. 4.25% 12/1/26 | | 525,000 | 516,769 |
| Energy Transfer LP: | | | |
| 3.75% 5/15/30 | | 481,000 | 432,278 |
| 4.2% 9/15/23 | | 145,000 | 144,696 |
| 4.25% 3/15/23 | | 195,000 | 195,077 |
| 4.5% 4/15/24 | | 215,000 | 214,225 |
| 4.95% 6/15/28 | | 494,000 | 485,532 |
| 5% 5/15/50 | | 1,804,000 | 1,548,176 |
| 5.25% 4/15/29 | | 350,000 | 341,235 |
| 5.4% 10/1/47 | | 1,023,000 | 911,382 |
| 5.8% 6/15/38 | | 275,000 | 257,519 |
| 6% 6/15/48 | | 1,279,000 | 1,215,583 |
| 6.25% 4/15/49 | | 241,000 | 236,148 |
| Exxon Mobil Corp. 3.482% 3/19/30 | | 3,150,000 | 3,014,693 |
| Hess Corp.: | | | |
| 4.3% 4/1/27 | | 1,146,000 | 1,118,863 |
| 5.6% 2/15/41 | | 549,000 | 529,674 |
| 5.8% 4/1/47 | | 874,000 | 867,357 |
| 7.125% 3/15/33 | | 201,000 | 222,720 |
| 7.3% 8/15/31 | | 2,102,000 | 2,348,440 |
| Kinder Morgan Energy Partners LP: | | | |
| 3.45% 2/15/23 | | 362,000 | 361,185 |
| 6.55% 9/15/40 | | 1,365,000 | 1,414,023 |
| Kinder Morgan, Inc. 5.55% 6/1/45 | | 415,000 | 403,656 |
| MPLX LP: | | | |
| 4.5% 7/15/23 | | 274,000 | 275,000 |
| 4.8% 2/15/29 | | 175,000 | 170,833 |
| 4.875% 12/1/24 | | 272,000 | 274,457 |
| 4.95% 9/1/32 | | 1,463,000 | 1,417,466 |
| 5.5% 2/15/49 | | 525,000 | 499,847 |
| Occidental Petroleum Corp.: | | | |
| 5.55% 3/15/26 | | 831,000 | 851,139 |
| 6.2% 3/15/40 | | 700,000 | 710,500 |
| 6.45% 9/15/36 | | 600,000 | 641,214 |
| 6.6% 3/15/46 | | 807,000 | 888,261 |
| 7.5% 5/1/31 | | 927,000 | 1,044,168 |
| Ovintiv, Inc.: | | | |
| 5.15% 11/15/41 | | 1,916,000 | 1,800,388 |
| 6.625% 8/15/37 | | 350,000 | 359,328 |
| 7.375% 11/1/31 | | 435,000 | 474,179 |
| 8.125% 9/15/30 | | 1,083,000 | 1,203,705 |
| Petroleos Mexicanos: | | | |
| 5.95% 1/28/31 | | 3,510,000 | 2,626,358 |
| 6.35% 2/12/48 | | 3,548,000 | 2,139,799 |
| 6.49% 1/23/27 | | 570,000 | 505,020 |
| 6.5% 3/13/27 | | 20,000 | 17,616 |
| 6.75% 9/21/47 | | 5,720,000 | 3,591,588 |
| 6.84% 1/23/30 | | 6,742,000 | 5,461,020 |
| 6.95% 1/28/60 | | 989,000 | 615,653 |
| 7.69% 1/23/50 | | 2,090,000 | 1,426,425 |
| Phillips 66 Co.: | | | |
| 3.7% 4/6/23 | | 97,000 | 96,985 |
| 3.85% 4/9/25 | | 125,000 | 123,959 |
| Plains All American Pipeline LP/PAA Finance Corp.: | | | |
| 3.55% 12/15/29 | | 4,767,000 | 4,172,271 |
| 3.6% 11/1/24 | | 266,000 | 259,658 |
| Sabine Pass Liquefaction LLC 4.5% 5/15/30 | | 1,622,000 | 1,552,792 |
| The Williams Companies, Inc.: | | | |
| 3.5% 11/15/30 | | 1,727,000 | 1,553,535 |
| 3.7% 1/15/23 | | 2,000,000 | 2,000,912 |
| 4.3% 3/4/24 | | 2,000,000 | 2,000,575 |
| 4.55% 6/24/24 | | 70,000 | 70,153 |
| 4.65% 8/15/32 | | 1,526,000 | 1,471,137 |
| 5.3% 8/15/52 | | 346,000 | 333,150 |
| 5.75% 6/24/44 | | 35,000 | 35,331 |
| Transcontinental Gas Pipe Line Co. LLC 3.25% 5/15/30 | | 207,000 | 185,027 |
| Valero Energy Corp. 2.85% 4/15/25 | | 48,000 | 46,472 |
| Western Gas Partners LP: | | | |
| 3.95% 6/1/25 | | 174,000 | 166,236 |
| 4.5% 3/1/28 | | 200,000 | 185,650 |
| 4.65% 7/1/26 | | 138,000 | 131,330 |
| 4.75% 8/15/28 | | 168,000 | 158,150 |
| | | | 72,337,967 |
| FINANCIALS - 13.6% | | | |
| Banks - 5.6% | | | |
| Bank of America Corp.: | | | |
| 2.299% 7/21/32 (b) | | 1,880,000 | 1,500,712 |
| 3.5% 4/19/26 | | 2,630,000 | 2,559,225 |
| 3.705% 4/24/28 (b) | | 528,000 | 501,552 |
| 4.376% 4/27/28 (b) | | 10,000,000 | 9,747,072 |
| 4.45% 3/3/26 | | 245,000 | 244,004 |
| 5.015% 7/22/33 (b) | | 9,817,000 | 9,725,370 |
| Barclays PLC: | | | |
| 2.852% 5/7/26 (b) | | 1,652,000 | 1,546,640 |
| 4.375% 1/12/26 | | 900,000 | 882,152 |
| 5.088% 6/20/30 (b) | | 1,421,000 | 1,326,534 |
| 5.2% 5/12/26 | | 1,318,000 | 1,307,922 |
| BNP Paribas SA 2.219% 6/9/26 (a)(b) | | 1,520,000 | 1,401,107 |
| Citigroup, Inc.: | | | |
| 3.352% 4/24/25 (b) | | 953,000 | 933,983 |
| 4.3% 11/20/26 | | 6,314,000 | 6,225,057 |
| 4.4% 6/10/25 | | 2,266,000 | 2,256,105 |
| 4.412% 3/31/31 (b) | | 2,221,000 | 2,119,391 |
| 4.45% 9/29/27 | | 4,372,000 | 4,262,591 |
| 4.91% 5/24/33 (b) | | 624,000 | 610,411 |
| 5.5% 9/13/25 | | 566,000 | 580,655 |
| Commonwealth Bank of Australia 3.61% 9/12/34 (a)(b) | | 517,000 | 451,245 |
| First Citizens Bank & Trust Co.: | | | |
| 3.929% 6/19/24 (b) | | 270,000 | 267,378 |
| 6.125% 3/9/28 | | 210,000 | 216,589 |
| HSBC Holdings PLC 4.95% 3/31/30 | | 298,000 | 289,116 |
| Intesa Sanpaolo SpA: | | | |
| 4.198% 6/1/32 (a)(b) | | 242,000 | 176,085 |
| 5.017% 6/26/24 (a) | | 200,000 | 191,331 |
| 5.71% 1/15/26 (a) | | 3,773,000 | 3,539,083 |
| JPMorgan Chase & Co.: | | | |
| 2.956% 5/13/31 (b) | | 880,000 | 754,246 |
| 3.797% 7/23/24 (b) | | 35,000 | 34,803 |
| 3.882% 7/24/38 (b) | | 1,000,000 | 878,556 |
| 4.323% 4/26/28 (b) | | 5,000,000 | 4,884,330 |
| 4.452% 12/5/29 (b) | | 5,500,000 | 5,298,452 |
| 4.493% 3/24/31 (b) | | 3,000,000 | 2,914,969 |
| 4.586% 4/26/33 (b) | | 2,682,000 | 2,582,498 |
| 4.912% 7/25/33 (b) | | 6,834,000 | 6,758,155 |
| NatWest Group PLC: | | | |
| 3.073% 5/22/28 (b) | | 951,000 | 859,122 |
| 5.125% 5/28/24 | | 1,000,000 | 1,000,171 |
| NatWest Markets PLC 2.375% 5/21/23 (a) | | 1,767,000 | 1,743,474 |
| Rabobank Nederland 4.375% 8/4/25 | | 500,000 | 491,636 |
| Societe Generale: | | | |
| 1.038% 6/18/25 (a)(b) | | 3,800,000 | 3,544,219 |
| 1.488% 12/14/26 (a)(b) | | 1,953,000 | 1,701,972 |
| Synchrony Bank: | | | |
| 5.4% 8/22/25 | | 1,384,000 | 1,381,894 |
| 5.625% 8/23/27 | | 1,253,000 | 1,242,983 |
| Wells Fargo & Co.: | | | |
| 2.406% 10/30/25 (b) | | 927,000 | 885,768 |
| 3.526% 3/24/28 (b) | | 2,047,000 | 1,933,750 |
| 4.478% 4/4/31 (b) | | 3,026,000 | 2,910,134 |
| 4.897% 7/25/33 (b) | | 4,711,000 | 4,635,446 |
| 5.013% 4/4/51 (b) | | 2,880,000 | 2,812,784 |
| Westpac Banking Corp. 4.11% 7/24/34 (b) | | 744,000 | 669,220 |
| | | | 102,779,892 |
| Capital Markets - 3.7% | | | |
| Affiliated Managers Group, Inc. 4.25% 2/15/24 | | 390,000 | 390,325 |
| Ares Capital Corp.: | | | |
| 3.875% 1/15/26 | | 2,603,000 | 2,448,029 |
| 4.2% 6/10/24 | | 1,716,000 | 1,700,620 |
| Credit Suisse Group AG: | | | |
| 2.593% 9/11/25 (a)(b) | | 2,086,000 | 1,930,025 |
| 3.75% 3/26/25 | | 1,200,000 | 1,146,644 |
| 3.8% 6/9/23 | | 1,250,000 | 1,243,843 |
| 3.869% 1/12/29 (a)(b) | | 1,570,000 | 1,360,012 |
| 4.194% 4/1/31 (a)(b) | | 2,010,000 | 1,688,847 |
| 4.207% 6/12/24 (a)(b) | | 500,000 | 492,156 |
| 4.55% 4/17/26 | | 388,000 | 371,919 |
| 6.537% 8/12/33 (a)(b) | | 5,000,000 | 4,774,487 |
| Deutsche Bank AG 4.5% 4/1/25 | | 3,804,000 | 3,680,710 |
| Deutsche Bank AG New York Branch: | | | |
| 4.1% 1/13/26 | | 1,100,000 | 1,073,543 |
| 5.882% 7/8/31 (b) | | 5,000,000 | 4,353,090 |
| Goldman Sachs Group, Inc.: | | | |
| 2.383% 7/21/32 (b) | | 1,922,000 | 1,555,819 |
| 3.102% 2/24/33 (b) | | 1,472,000 | 1,252,289 |
| 3.2% 2/23/23 | | 3,000,000 | 2,994,577 |
| 3.691% 6/5/28 (b) | | 4,660,000 | 4,404,899 |
| 3.75% 5/22/25 | | 525,000 | 515,692 |
| 3.8% 3/15/30 | | 3,630,000 | 3,347,286 |
| 3.814% 4/23/29 (b) | | 1,025,000 | 959,151 |
| 4.017% 10/31/38 (b) | | 1,000,000 | 871,664 |
| 4.223% 5/1/29 (b) | | 2,500,000 | 2,390,415 |
| 6.75% 10/1/37 | | 278,000 | 308,142 |
| Moody's Corp.: | | | |
| 3.25% 1/15/28 | | 10,000 | 9,419 |
| 3.75% 3/24/25 | | 1,044,000 | 1,033,948 |
| 4.875% 2/15/24 | | 9,000 | 9,102 |
| Morgan Stanley: | | | |
| 3.125% 7/27/26 | | 2,621,000 | 2,497,070 |
| 3.622% 4/1/31 (b) | | 2,099,000 | 1,923,301 |
| 3.737% 4/24/24 (b) | | 2,500,000 | 2,489,008 |
| 4.431% 1/23/30 (b) | | 2,242,000 | 2,184,020 |
| 4.889% 7/20/33 (b) | | 4,447,000 | 4,426,807 |
| 5% 11/24/25 | | 5,722,000 | 5,811,118 |
| UBS Group AG: | | | |
| 1.494% 8/10/27 (a)(b) | | 1,190,000 | 1,033,534 |
| 4.125% 9/24/25 (a) | | 500,000 | 494,549 |
| | | | 67,166,060 |
| Consumer Finance - 2.6% | | | |
| AerCap Ireland Capital Ltd./AerCap Global Aviation Trust: | | | |
| 1.65% 10/29/24 | | 2,378,000 | 2,200,387 |
| 2.45% 10/29/26 | | 868,000 | 765,362 |
| 2.875% 8/14/24 | | 1,196,000 | 1,142,475 |
| 3% 10/29/28 | | 909,000 | 772,758 |
| 3.3% 1/30/32 | | 972,000 | 784,435 |
| 4.125% 7/3/23 | | 512,000 | 510,740 |
| 4.45% 4/3/26 | | 561,000 | 539,066 |
| 4.875% 1/16/24 | | 843,000 | 838,953 |
| 6.5% 7/15/25 | | 731,000 | 748,525 |
| Ally Financial, Inc.: | | | |
| 1.45% 10/2/23 | | 462,000 | 447,999 |
| 3.05% 6/5/23 | | 1,940,000 | 1,925,331 |
| 4.75% 6/9/27 | | 2,500,000 | 2,438,743 |
| 5.125% 9/30/24 | | 465,000 | 470,866 |
| 5.75% 11/20/25 | | 1,560,000 | 1,576,754 |
| 5.8% 5/1/25 | | 1,072,000 | 1,096,592 |
| 8% 11/1/31 | | 549,000 | 610,921 |
| Capital One Financial Corp.: | | | |
| 2.6% 5/11/23 | | 1,522,000 | 1,510,832 |
| 2.636% 3/3/26 (b) | | 1,062,000 | 1,006,468 |
| 3.273% 3/1/30 (b) | | 1,358,000 | 1,195,140 |
| 3.65% 5/11/27 | | 2,746,000 | 2,624,922 |
| 3.8% 1/31/28 | | 877,000 | 828,675 |
| 4.927% 5/10/28 (b) | | 2,786,000 | 2,754,988 |
| 4.985% 7/24/26 (b) | | 1,448,000 | 1,445,971 |
| 5.247% 7/26/30 (b) | | 2,210,000 | 2,174,077 |
| Discover Financial Services: | | | |
| 3.95% 11/6/24 | | 4,380,000 | 4,335,777 |
| 4.1% 2/9/27 | | 284,000 | 272,637 |
| 4.5% 1/30/26 | | 803,000 | 786,436 |
| Ford Motor Credit Co. LLC: | | | |
| 4.063% 11/1/24 | | 4,206,000 | 4,082,890 |
| 5.584% 3/18/24 | | 1,113,000 | 1,107,659 |
| Synchrony Financial: | | | |
| 3.95% 12/1/27 | | 3,042,000 | 2,765,516 |
| 4.375% 3/19/24 | | 1,056,000 | 1,051,558 |
| 5.15% 3/19/29 | | 1,958,000 | 1,862,213 |
| Toyota Motor Credit Corp. 2.9% 3/30/23 | | 1,619,000 | 1,613,486 |
| | | | 48,289,152 |
| Diversified Financial Services - 0.9% | | | |
| Blackstone Private Credit Fund 4.7% 3/24/25 | | 3,937,000 | 3,809,758 |
| Brixmor Operating Partnership LP: | | | |
| 3.85% 2/1/25 | | 2,100,000 | 2,047,711 |
| 4.05% 7/1/30 | | 1,055,000 | 937,776 |
| 4.125% 5/15/29 | | 1,000,000 | 920,470 |
| Equitable Holdings, Inc. 3.9% 4/20/23 | | 72,000 | 72,087 |
| Jackson Financial, Inc.: | | | |
| 5.17% 6/8/27 | | 682,000 | 673,258 |
| 5.67% 6/8/32 | | 861,000 | 835,823 |
| Park Aerospace Holdings Ltd. 5.5% 2/15/24 (a) | | 5,175,000 | 5,110,109 |
| Pine Street Trust I 4.572% 2/15/29 (a) | | 1,030,000 | 982,497 |
| Pine Street Trust II 5.568% 2/15/49 (a) | | 1,000,000 | 967,550 |
| | | | 16,357,039 |
| Insurance - 0.8% | | | |
| AIA Group Ltd. 3.375% 4/7/30 (a) | | 1,502,000 | 1,393,098 |
| American International Group, Inc. 2.5% 6/30/25 | | 2,900,000 | 2,764,515 |
| Five Corners Funding Trust II 2.85% 5/15/30 (a) | | 2,287,000 | 1,982,847 |
| Marsh & McLennan Companies, Inc. 4.375% 3/15/29 | | 678,000 | 673,871 |
| Pacific LifeCorp 5.125% 1/30/43 (a) | | 950,000 | 912,769 |
| Pricoa Global Funding I 5.375% 5/15/45 (b) | | 1,045,000 | 1,026,945 |
| SunAmerica, Inc.: | | | |
| 3.5% 4/4/25 (a) | | 445,000 | 428,571 |
| 3.65% 4/5/27 (a) | | 1,551,000 | 1,458,264 |
| 3.85% 4/5/29 (a) | | 623,000 | 573,410 |
| 3.9% 4/5/32 (a) | | 741,000 | 665,627 |
| 4.35% 4/5/42 (a) | | 169,000 | 143,276 |
| 4.4% 4/5/52 (a) | | 498,000 | 415,432 |
| Swiss Re Finance Luxembourg SA 5% 4/2/49 (a)(b) | | 400,000 | 380,000 |
| TIAA Asset Management Finance LLC 4.125% 11/1/24 (a) | | 80,000 | 79,067 |
| Unum Group: | | | |
| 3.875% 11/5/25 | | 50,000 | 48,828 |
| 4% 6/15/29 | | 852,000 | 790,828 |
| | | | 13,737,348 |
|
| TOTAL FINANCIALS | | | 248,329,491 |
|
| HEALTH CARE - 1.2% | | | |
| Health Care Providers & Services - 0.8% | | | |
| Centene Corp.: | | | |
| 2.45% 7/15/28 | | 1,670,000 | 1,408,461 |
| 2.625% 8/1/31 | | 800,000 | 640,048 |
| 3.375% 2/15/30 | | 815,000 | 698,863 |
| 4.25% 12/15/27 | | 880,000 | 835,701 |
| 4.625% 12/15/29 | | 1,370,000 | 1,290,595 |
| Cigna Corp.: | | | |
| 3.05% 10/15/27 | | 500,000 | 466,512 |
| 4.375% 10/15/28 | | 884,000 | 870,549 |
| 4.8% 8/15/38 | | 550,000 | 530,132 |
| CVS Health Corp.: | | | |
| 3% 8/15/26 | | 125,000 | 120,210 |
| 3.625% 4/1/27 | | 375,000 | 364,703 |
| 4.78% 3/25/38 | | 2,092,000 | 1,988,565 |
| HCA Holdings, Inc.: | | | |
| 3.5% 9/1/30 | | 709,000 | 618,704 |
| 3.625% 3/15/32 (a) | | 195,000 | 168,478 |
| 5.625% 9/1/28 | | 1,054,000 | 1,059,360 |
| 5.875% 2/1/29 | | 981,000 | 999,953 |
| Humana, Inc. 3.7% 3/23/29 | | 585,000 | 552,396 |
| Sabra Health Care LP 3.2% 12/1/31 | | 1,971,000 | 1,567,238 |
| Toledo Hospital 5.325% 11/15/28 | | 319,000 | 208,556 |
| | | | 14,389,024 |
| Pharmaceuticals - 0.4% | | | |
| Bayer U.S. Finance II LLC 4.25% 12/15/25 (a) | | 3,209,000 | 3,156,503 |
| Elanco Animal Health, Inc.: | | | |
| 5.772% 8/28/23 (b) | | 459,000 | 458,220 |
| 6.4% 8/28/28 (b) | | 194,000 | 180,420 |
| Mylan NV 4.55% 4/15/28 | | 450,000 | 422,448 |
| Utah Acquisition Sub, Inc. 3.95% 6/15/26 | | 1,370,000 | 1,287,449 |
| Viatris, Inc.: | | | |
| 1.65% 6/22/25 | | 197,000 | 179,567 |
| 2.7% 6/22/30 | | 1,003,000 | 790,019 |
| 3.85% 6/22/40 | | 437,000 | 303,590 |
| | | | 6,778,216 |
|
| TOTAL HEALTH CARE | | | 21,167,240 |
|
| INDUSTRIALS - 0.5% | | | |
| Aerospace & Defense - 0.2% | | | |
| BAE Systems Holdings, Inc. 3.8% 10/7/24 (a) | | 1,040,000 | 1,026,189 |
| The Boeing Co.: | | | |
| 5.04% 5/1/27 | | 723,000 | 720,825 |
| 5.15% 5/1/30 | | 723,000 | 711,584 |
| 5.705% 5/1/40 | | 720,000 | 686,736 |
| 5.805% 5/1/50 | | 700,000 | 671,390 |
| 5.93% 5/1/60 | | 720,000 | 687,585 |
| | | | 4,504,309 |
| Trading Companies & Distributors - 0.2% | | | |
| Air Lease Corp.: | | | |
| 2.25% 1/15/23 | | 259,000 | 257,090 |
| 3.375% 7/1/25 | | 1,294,000 | 1,228,795 |
| 3.875% 7/3/23 | | 877,000 | 874,067 |
| 4.25% 2/1/24 | | 977,000 | 974,445 |
| | | | 3,334,397 |
| Transportation Infrastructure - 0.1% | | | |
| Avolon Holdings Funding Ltd.: | | | |
| 3.95% 7/1/24 (a) | | 380,000 | 362,841 |
| 4.25% 4/15/26 (a) | | 290,000 | 267,279 |
| 4.375% 5/1/26 (a) | | 880,000 | 813,490 |
| 5.25% 5/15/24 (a) | | 730,000 | 715,703 |
| | | | 2,159,313 |
|
| TOTAL INDUSTRIALS | | | 9,998,019 |
|
| INFORMATION TECHNOLOGY - 0.9% | | | |
| Electronic Equipment & Components - 0.1% | | | |
| Dell International LLC/EMC Corp.: | | | |
| 5.45% 6/15/23 | | 214,000 | 216,190 |
| 5.85% 7/15/25 | | 263,000 | 272,322 |
| 6.02% 6/15/26 | | 258,000 | 267,972 |
| 6.1% 7/15/27 | | 483,000 | 507,880 |
| 6.2% 7/15/30 | | 418,000 | 434,353 |
| | | | 1,698,717 |
| Semiconductors & Semiconductor Equipment - 0.5% | | | |
| Broadcom, Inc.: | | | |
| 1.95% 2/15/28 (a) | | 351,000 | 301,060 |
| 2.45% 2/15/31 (a) | | 3,421,000 | 2,727,745 |
| 2.6% 2/15/33 (a) | | 3,032,000 | 2,331,434 |
| 3.5% 2/15/41 (a) | | 2,410,000 | 1,807,877 |
| 3.75% 2/15/51 (a) | | 1,131,000 | 829,128 |
| | | | 7,997,244 |
| Software - 0.3% | | | |
| Oracle Corp.: | | | |
| 1.65% 3/25/26 | | 1,241,000 | 1,119,098 |
| 2.3% 3/25/28 | | 1,961,000 | 1,704,430 |
| 2.8% 4/1/27 | | 1,423,000 | 1,302,626 |
| 2.875% 3/25/31 | | 2,460,000 | 2,039,266 |
| | | | 6,165,420 |
|
| TOTAL INFORMATION TECHNOLOGY | | | 15,861,381 |
|
| MATERIALS - 0.1% | | | |
| Chemicals - 0.1% | | | |
| Chevron Phillips Chemical Co. LLC / Chevron Phillips Chemical Co. LP 5.125% 4/1/25 (a) | | 1,206,000 | 1,233,492 |
| REAL ESTATE - 1.9% | | | |
| Equity Real Estate Investment Trusts (REITs) - 1.6% | | | |
| Alexandria Real Estate Equities, Inc. 4.9% 12/15/30 | | 857,000 | 852,070 |
| American Homes 4 Rent LP: | | | |
| 2.375% 7/15/31 | | 153,000 | 122,785 |
| 3.625% 4/15/32 | | 681,000 | 594,371 |
| Boston Properties, Inc.: | | | |
| 3.25% 1/30/31 | | 792,000 | 682,185 |
| 4.5% 12/1/28 | | 605,000 | 588,807 |
| Corporate Office Properties LP: | | | |
| 2.25% 3/15/26 | | 348,000 | 311,916 |
| 2.75% 4/15/31 | | 235,000 | 184,553 |
| Healthcare Trust of America Holdings LP: | | | |
| 3.1% 2/15/30 | | 260,000 | 224,044 |
| 3.5% 8/1/26 | | 270,000 | 257,532 |
| Healthpeak Properties, Inc.: | | | |
| 3.25% 7/15/26 | | 113,000 | 108,550 |
| 3.5% 7/15/29 | | 129,000 | 118,663 |
| Hudson Pacific Properties LP 4.65% 4/1/29 | | 1,473,000 | 1,382,843 |
| Invitation Homes Operating Partnership LP 4.15% 4/15/32 | | 1,026,000 | 922,330 |
| Kite Realty Group Trust 4.75% 9/15/30 | | 79,000 | 71,730 |
| LXP Industrial Trust (REIT) 2.7% 9/15/30 | | 387,000 | 312,224 |
| Omega Healthcare Investors, Inc.: | | | |
| 3.25% 4/15/33 | | 1,242,000 | 943,190 |
| 3.375% 2/1/31 | | 701,000 | 571,000 |
| 3.625% 10/1/29 | | 1,155,000 | 987,248 |
| 4.375% 8/1/23 | | 343,000 | 340,775 |
| 4.75% 1/15/28 | | 3,349,000 | 3,202,922 |
| 4.95% 4/1/24 | | 2,400,000 | 2,406,238 |
| Piedmont Operating Partnership LP 2.75% 4/1/32 | | 297,000 | 226,194 |
| Realty Income Corp.: | | | |
| 2.2% 6/15/28 | | 172,000 | 150,957 |
| 2.85% 12/15/32 | | 211,000 | 180,917 |
| 3.25% 1/15/31 | | 213,000 | 190,937 |
| 3.4% 1/15/28 | | 320,000 | 300,193 |
| Simon Property Group LP 2.45% 9/13/29 | | 333,000 | 287,419 |
| Store Capital Corp.: | | | |
| 2.75% 11/18/30 | | 424,000 | 344,160 |
| 4.625% 3/15/29 | | 315,000 | 304,479 |
| Sun Communities Operating LP: | | | |
| 2.3% 11/1/28 | | 341,000 | 287,916 |
| 2.7% 7/15/31 | | 880,000 | 708,423 |
| Ventas Realty LP: | | | |
| 3% 1/15/30 | | 1,531,000 | 1,332,574 |
| 3.5% 2/1/25 | | 1,265,000 | 1,234,643 |
| 4% 3/1/28 | | 218,000 | 207,509 |
| 4.75% 11/15/30 | | 2,100,000 | 2,036,216 |
| VICI Properties LP: | | | |
| 4.375% 5/15/25 | | 176,000 | 171,859 |
| 4.75% 2/15/28 | | 1,390,000 | 1,333,855 |
| 4.95% 2/15/30 | | 2,092,000 | 2,008,573 |
| 5.125% 5/15/32 | | 420,000 | 400,247 |
| Vornado Realty LP 2.15% 6/1/26 | | 374,000 | 329,172 |
| WP Carey, Inc.: | | | |
| 3.85% 7/15/29 | | 246,000 | 228,134 |
| 4% 2/1/25 | | 489,000 | 484,206 |
| 4.6% 4/1/24 | | 1,250,000 | 1,253,528 |
| | | | 29,188,087 |
| Real Estate Management & Development - 0.3% | | | |
| Brandywine Operating Partnership LP: | | | |
| 3.95% 2/15/23 | | 560,000 | 559,766 |
| 3.95% 11/15/27 | | 421,000 | 388,047 |
| 4.1% 10/1/24 | | 995,000 | 976,188 |
| 4.55% 10/1/29 | | 260,000 | 244,713 |
| CBRE Group, Inc. 2.5% 4/1/31 | | 1,070,000 | 858,901 |
| Tanger Properties LP: | | | |
| 2.75% 9/1/31 | | 897,000 | 682,167 |
| 3.125% 9/1/26 | | 2,775,000 | 2,576,863 |
| | | | 6,286,645 |
|
| TOTAL REAL ESTATE | | | 35,474,732 |
|
| UTILITIES - 1.3% | | | |
| Electric Utilities - 0.7% | | | |
| Alabama Power Co. 3.05% 3/15/32 | | 1,447,000 | 1,316,535 |
| Cleco Corporate Holdings LLC: | | | |
| 3.375% 9/15/29 | | 2,173,000 | 1,923,898 |
| 3.743% 5/1/26 | | 1,337,000 | 1,281,372 |
| Duke Energy Corp. 2.45% 6/1/30 | | 565,000 | 476,953 |
| Duquesne Light Holdings, Inc.: | | | |
| 2.532% 10/1/30 (a) | | 276,000 | 225,190 |
| 2.775% 1/7/32 (a) | | 935,000 | 762,418 |
| Edison International 5.75% 6/15/27 | | 2,985,000 | 3,024,515 |
| Entergy Corp. 2.8% 6/15/30 | | 580,000 | 496,447 |
| Exelon Corp.: | | | |
| 2.75% 3/15/27 (a) | | 320,000 | 298,958 |
| 3.35% 3/15/32 (a) | | 389,000 | 348,900 |
| 4.05% 4/15/30 | | 365,000 | 351,023 |
| 4.1% 3/15/52 (a) | | 288,000 | 249,024 |
| FirstEnergy Corp. 7.375% 11/15/31 | | 1,805,000 | 2,118,321 |
| IPALCO Enterprises, Inc. 3.7% 9/1/24 | | 172,000 | 169,662 |
| | | | 13,043,216 |
| Independent Power and Renewable Electricity Producers - 0.3% | | | |
| The AES Corp.: | | | |
| 3.3% 7/15/25 (a) | | 3,530,000 | 3,348,205 |
| 3.95% 7/15/30 (a) | | 1,523,000 | 1,391,261 |
| | | | 4,739,466 |
| Multi-Utilities - 0.3% | | | |
| Berkshire Hathaway Energy Co. 4.05% 4/15/25 | | 2,556,000 | 2,559,399 |
| Consolidated Edison Co. of New York, Inc. 3.35% 4/1/30 | | 165,000 | 154,908 |
| NiSource, Inc. 2.95% 9/1/29 | | 1,708,000 | 1,519,916 |
| Puget Energy, Inc.: | | | |
| 4.1% 6/15/30 | | 683,000 | 629,168 |
| 4.224% 3/15/32 | | 1,329,000 | 1,224,385 |
| | | | 6,087,776 |
|
| TOTAL UTILITIES | | | 23,870,458 |
|
| TOTAL NONCONVERTIBLE BONDS | | | |
| (Cost $555,825,889) | | | 514,107,836 |
|
| U.S. Treasury Obligations - 29.6% | | | |
| U.S. Treasury Bonds: | | | |
| 1.125% 5/15/40 | | $8,834,000 | $6,012,641 |
| 1.75% 8/15/41 | | 11,769,000 | 8,743,999 |
| 1.875% 11/15/51 | | 34,881,000 | 25,400,453 |
| 2% 11/15/41 | | 11,460,200 | 8,902,248 |
| 2% 8/15/51 | | 74,158,000 | 55,711,198 |
| 2.25% 2/15/52 | | 24,090,000 | 19,241,888 |
| 2.375% 2/15/42 | | 180,700 | 149,445 |
| 2.875% 5/15/52 | | 21,453,600 | 19,770,833 |
| 3% 2/15/47 | | 24,645,000 | 22,353,785 |
| 3.25% 5/15/42 | | 10,703,600 | 10,238,662 |
| 3.375% 8/15/42 | | 300,000 | 292,734 |
| U.S. Treasury Notes: | | | |
| 0.75% 3/31/26 | | 33,344,000 | 30,297,452 |
| 0.875% 9/30/26 | | 50,421,700 | 45,550,885 |
| 1.25% 5/31/28 | | 95,952,000 | 85,442,261 |
| 1.5% 1/31/27 | | 32,740,000 | 30,210,324 |
| 1.75% 1/31/29 | | 29,322,000 | 26,660,112 |
| 2.5% 3/31/27 | | 40,000,000 | 38,515,625 |
| 2.625% 7/31/29 | | 504,000 | 483,131 |
| 2.75% 4/30/27 | | 700,000 | 681,324 |
| 2.75% 8/15/32 (c) | | 51,025,000 | 49,223,180 |
| 2.875% 4/30/29 (d) | | 5,411,700 | 5,262,455 |
| 2.875% 5/15/32 | | 51,215,400 | 49,919,010 |
| TOTAL U.S. TREASURY OBLIGATIONS | | | |
| (Cost $615,913,898) | | | 539,063,645 |
|
| U.S. Government Agency - Mortgage Securities - 13.6% | | | |
| Fannie Mae - 3.6% | | | |
| 12 month U.S. LIBOR + 1.360% 1.931% 10/1/35 (b)(e) | | 3,078 | 3,120 |
| 12 month U.S. LIBOR + 1.440% 1.945% 4/1/37 (b)(e) | | 723 | 728 |
| 12 month U.S. LIBOR + 1.460% 1.854% 1/1/35 (b)(e) | | 5,551 | 5,612 |
| 12 month U.S. LIBOR + 1.480% 3.787% 7/1/34 (b)(e) | | 532 | 541 |
| 12 month U.S. LIBOR + 1.550% 3.181% 5/1/44 (b)(e) | | 786 | 797 |
| 12 month U.S. LIBOR + 1.550% 3.803% 6/1/36 (b)(e) | | 1,840 | 1,886 |
| 12 month U.S. LIBOR + 1.560% 2.065% 3/1/37 (b)(e) | | 5,743 | 5,805 |
| 12 month U.S. LIBOR + 1.570% 2.139% 4/1/44 (b)(e) | | 2,529 | 2,553 |
| 12 month U.S. LIBOR + 1.570% 3.32% 5/1/44 (b)(e) | | 23 | 24 |
| 12 month U.S. LIBOR + 1.580% 1.83% 1/1/44 (b)(e) | | 1,170 | 1,183 |
| 12 month U.S. LIBOR + 1.580% 2.08% 4/1/44 (b)(e) | | 837 | 844 |
| 12 month U.S. LIBOR + 1.620% 2.245% 3/1/33 (b)(e) | | 7,237 | 7,317 |
| 12 month U.S. LIBOR + 1.620% 2.553% 5/1/35 (b)(e) | | 1,486 | 1,516 |
| 12 month U.S. LIBOR + 1.630% 1.815% 9/1/36 (b)(e) | | 702 | 717 |
| 12 month U.S. LIBOR + 1.630% 2.884% 11/1/36 (b)(e) | | 2,604 | 2,648 |
| 12 month U.S. LIBOR + 1.640% 1.895% 6/1/47 (b)(e) | | 7,705 | 7,895 |
| 12 month U.S. LIBOR + 1.640% 3.274% 5/1/36 (b)(e) | | 1,271 | 1,296 |
| 12 month U.S. LIBOR + 1.680% 2.704% 7/1/43 (b)(e) | | 13,963 | 14,238 |
| 12 month U.S. LIBOR + 1.700% 3.184% 6/1/42 (b)(e) | | 9,569 | 9,772 |
| 12 month U.S. LIBOR + 1.730% 2.012% 3/1/40 (b)(e) | | 5,735 | 5,834 |
| 12 month U.S. LIBOR + 1.730% 3.441% 5/1/36 (b)(e) | | 2,896 | 2,966 |
| 12 month U.S. LIBOR + 1.750% 2.434% 7/1/35 (b)(e) | | 4,561 | 4,624 |
| 12 month U.S. LIBOR + 1.750% 2.579% 8/1/41 (b)(e) | | 2,185 | 2,242 |
| 12 month U.S. LIBOR + 1.770% 2.071% 2/1/37 (b)(e) | | 19,182 | 19,505 |
| 12 month U.S. LIBOR + 1.800% 2.054% 1/1/42 (b)(e) | | 27,797 | 28,270 |
| 12 month U.S. LIBOR + 1.800% 2.498% 12/1/40 (b)(e) | | 45,235 | 46,304 |
| 12 month U.S. LIBOR + 1.800% 4.05% 7/1/41 (b)(e) | | 5,945 | 6,086 |
| 12 month U.S. LIBOR + 1.810% 2.06% 12/1/39 (b)(e) | | 1,230 | 1,250 |
| 12 month U.S. LIBOR + 1.810% 2.068% 9/1/41 (b)(e) | | 3,202 | 3,288 |
| 12 month U.S. LIBOR + 1.810% 2.304% 2/1/42 (b)(e) | | 16,413 | 16,682 |
| 12 month U.S. LIBOR + 1.810% 4.008% 7/1/41 (b)(e) | | 7,076 | 7,266 |
| 12 month U.S. LIBOR + 1.820% 2.293% 2/1/35 (b)(e) | | 2,050 | 2,079 |
| 12 month U.S. LIBOR + 1.830% 2.08% 10/1/41 (b)(e) | | 3,102 | 3,123 |
| 12 month U.S. LIBOR + 1.850% 2.429% 4/1/36 (b)(e) | | 10,010 | 10,171 |
| 12 month U.S. LIBOR + 1.890% 3.084% 8/1/35 (b)(e) | | 10,776 | 11,005 |
| 12 month U.S. LIBOR + 1.950% 3.771% 7/1/37 (b)(e) | | 2,269 | 2,334 |
| 6 month U.S. LIBOR + 1.500% 2.736% 1/1/35 (b)(e) | | 2,396 | 2,436 |
| 6 month U.S. LIBOR + 1.510% 3.523% 2/1/33 (b)(e) | | 200 | 205 |
| 6 month U.S. LIBOR + 1.530% 2.258% 12/1/34 (b)(e) | | 572 | 581 |
| 6 month U.S. LIBOR + 1.550% 2.278% 9/1/33 (b)(e) | | 15,086 | 15,460 |
| 6 month U.S. LIBOR + 1.960% 2.434% 9/1/35 (b)(e) | | 321 | 330 |
| U.S. TREASURY 1 YEAR INDEX + 2.180% 2.548% 7/1/36 (b)(e) | | 1,501 | 1,531 |
| U.S. TREASURY 1 YEAR INDEX + 2.200% 2.583% 3/1/35 (b)(e) | | 637 | 652 |
| U.S. TREASURY 1 YEAR INDEX + 2.270% 2.395% 6/1/36 (b)(e) | | 1,773 | 1,828 |
| U.S. TREASURY 1 YEAR INDEX + 2.280% 2.408% 10/1/33 (b)(e) | | 1,308 | 1,349 |
| U.S. TREASURY 1 YEAR INDEX + 2.460% 3.147% 7/1/34 (b)(e) | | 2,018 | 2,078 |
| 1.5% 11/1/40 to 10/1/51 | | 2,178,577 | 1,839,118 |
| 2% 10/1/35 to 3/1/52 | | 15,820,386 | 13,753,097 |
| 2.5% 5/1/31 to 3/1/52 | | 20,538,995 | 18,621,527 |
| 3% 8/1/32 to 2/1/52 | | 17,449,772 | 16,388,553 |
| 3.5% 5/1/36 to 3/1/52 | | 7,488,291 | 7,230,463 |
| 4% 3/1/36 to 4/1/49 | | 3,923,034 | 3,899,048 |
| 4.5% to 4.5% 6/1/24 to 7/1/52 | | 2,778,248 | 2,814,696 |
| 5% 3/1/23 to 2/1/49 | | 570,691 | 589,652 |
| 5.258% 8/1/41 (b) | | 33,787 | 34,787 |
| 5.5% 12/1/23 to 8/1/25 | | 1,375 | 1,383 |
| 6% to 6% 9/1/29 to 7/1/41 | | 341,983 | 364,990 |
| 6.5% 12/1/23 to 8/1/36 | | 256,632 | 275,590 |
| 6.645% 2/1/39 (b) | | 20,317 | 21,179 |
| 7% to 7% 4/1/23 to 6/1/32 | | 7,319 | 7,808 |
| 7.5% 3/1/26 to 11/1/31 | | 5,877 | 6,236 |
|
| TOTAL FANNIE MAE | | | 66,116,098 |
|
| Freddie Mac - 2.1% | | | |
| 12 month U.S. LIBOR + 1.320% 1.575% 1/1/36 (b)(e) | | 3,924 | 3,919 |
| 12 month U.S. LIBOR + 1.370% 1.634% 3/1/36 (b)(e) | | 2,879 | 2,893 |
| 12 month U.S. LIBOR + 1.500% 1.824% 3/1/36 (b)(e) | | 1,673 | 1,683 |
| 12 month U.S. LIBOR + 1.600% 3.85% 7/1/35 (b)(e) | | 5,471 | 5,580 |
| 12 month U.S. LIBOR + 1.660% 2.04% 7/1/36 (b)(e) | | 10,639 | 10,707 |
| 12 month U.S. LIBOR + 1.750% 2% 12/1/40 (b)(e) | | 20,133 | 20,378 |
| 12 month U.S. LIBOR + 1.750% 2% 9/1/41 (b)(e) | | 55,186 | 56,282 |
| 12 month U.S. LIBOR + 1.750% 4% 7/1/41 (b)(e) | | 5,283 | 5,407 |
| 12 month U.S. LIBOR + 1.860% 3.239% 4/1/36 (b)(e) | | 1,124 | 1,146 |
| 12 month U.S. LIBOR + 1.880% 2.13% 9/1/41 (b)(e) | | 4,832 | 4,933 |
| 12 month U.S. LIBOR + 1.880% 2.13% 10/1/41 (b)(e) | | 36,349 | 37,077 |
| 12 month U.S. LIBOR + 1.880% 3.255% 4/1/41 (b)(e) | | 1,199 | 1,221 |
| 12 month U.S. LIBOR + 1.900% 3.058% 10/1/42 (b)(e) | | 24,484 | 25,055 |
| 12 month U.S. LIBOR + 1.910% 3.219% 5/1/41 (b)(e) | | 9,598 | 9,779 |
| 12 month U.S. LIBOR + 1.910% 3.568% 5/1/41 (b)(e) | | 9,851 | 10,071 |
| 12 month U.S. LIBOR + 1.910% 3.775% 6/1/41 (b)(e) | | 12,506 | 12,801 |
| 12 month U.S. LIBOR + 1.910% 4.16% 6/1/41 (b)(e) | | 3,179 | 3,263 |
| 12 month U.S. LIBOR + 2.020% 2.93% 4/1/38 (b)(e) | | 968 | 979 |
| 12 month U.S. LIBOR + 2.030% 2.158% 3/1/33 (b)(e) | | 43 | 44 |
| 12 month U.S. LIBOR + 2.040% 4.265% 7/1/36 (b)(e) | | 10,636 | 10,915 |
| 12 month U.S. LIBOR + 2.200% 2.45% 12/1/36 (b)(e) | | 2,209 | 2,249 |
| 6 month U.S. LIBOR + 1.580% 3.08% 12/1/35 (b)(e) | | 51 | 52 |
| 6 month U.S. LIBOR + 1.660% 2.165% 1/1/37 (b)(e) | | 2,569 | 2,611 |
| 6 month U.S. LIBOR + 1.660% 3.54% 7/1/35 (b)(e) | | 1,872 | 1,921 |
| 6 month U.S. LIBOR + 1.880% 2.534% 10/1/36 (b)(e) | | 21,356 | 21,778 |
| 6 month U.S. LIBOR + 1.990% 3% 10/1/35 (b)(e) | | 9,657 | 9,865 |
| 6 month U.S. LIBOR + 2.010% 2.76% 5/1/37 (b)(e) | | 3,009 | 3,098 |
| 6 month U.S. LIBOR + 2.010% 2.76% 5/1/37 (b)(e) | | 3,201 | 3,295 |
| 6 month U.S. LIBOR + 2.020% 3.414% 6/1/37 (b)(e) | | 4,336 | 4,477 |
| 6 month U.S. LIBOR + 2.680% 3.655% 10/1/35 (b)(e) | | 1,733 | 1,800 |
| U.S. TREASURY 1 YEAR INDEX + 2.030% 2.86% 6/1/33 (b)(e) | | 14,801 | 15,081 |
| U.S. TREASURY 1 YEAR INDEX + 2.230% 3.069% 4/1/34 (b)(e) | | 4,465 | 4,571 |
| U.S. TREASURY 1 YEAR INDEX + 2.260% 3.227% 6/1/33 (b)(e) | | 4,193 | 4,276 |
| U.S. TREASURY 1 YEAR INDEX + 2.430% 2.981% 3/1/35 (b)(e) | | 8,330 | 8,571 |
| U.S. TREASURY 1 YEAR INDEX + 2.540% 4.046% 7/1/35 (b)(e) | | 12,298 | 12,669 |
| 1.5% 12/1/40 to 3/1/51 | | 1,546,954 | 1,277,676 |
| 2% 4/1/41 to 2/1/52 | | 13,601,511 | 11,778,148 |
| 2.5% 1/1/31 to 1/1/52 | | 10,298,502 | 9,311,733 |
| 3% 6/1/31 to 3/1/52 | | 5,513,201 | 5,153,853 |
| 3.5% 3/1/32 to 3/1/52 | | 5,913,648 | 5,748,648 |
| 3.5% 8/1/47 | | 337,021 | 325,883 |
| 4% 1/1/36 to 2/1/50 | | 3,467,014 | 3,452,693 |
| 4% 4/1/48 | | 1,162 | 1,149 |
| 4.5% 7/1/25 to 10/1/48 | | 1,044,844 | 1,065,613 |
| 5% 8/1/33 to 7/1/41 | | 297,145 | 308,257 |
| 6% 1/1/24 to 12/1/37 | | 37,446 | 39,403 |
| 6.5% 1/1/32 to 9/1/39 | | 46,878 | 50,867 |
| 7% 8/1/26 to 9/1/36 | | 13,753 | 14,901 |
| 7.5% 1/1/27 | | 25 | 26 |
| 8% 7/1/24 to 8/1/30 | | 195 | 212 |
| 8.5% 8/1/27 | | 135 | 143 |
|
| TOTAL FREDDIE MAC | | | 38,849,652 |
|
| Ginnie Mae - 3.0% | | | |
| 3.5% 11/20/41 to 5/20/50 | | 1,589,550 | 1,551,472 |
| 4% 8/15/39 to 6/20/49 | | 3,858,151 | 3,844,455 |
| 4.5% 6/20/33 to 6/20/41 | | 754,825 | 768,187 |
| 5.5% 10/15/35 to 9/15/39 | | 22,220 | 23,422 |
| 7% to 7% 4/15/28 to 8/15/32 | | 6,089 | 6,495 |
| 7.5% to 7.5% 11/15/22 to 1/15/31 | | 1,663 | 1,752 |
| 8% 12/15/23 to 7/15/27 | | 371 | 380 |
| 8.5% 8/15/29 to 7/15/30 | | 76 | 81 |
| 2% 9/1/52 (f) | | 4,800,000 | 4,240,881 |
| 2% 9/1/52 (f) | | 1,150,000 | 1,016,044 |
| 2% 9/1/52 (f) | | 1,150,000 | 1,016,044 |
| 2% 9/1/52 (f) | | 1,250,000 | 1,104,396 |
| 2% 9/1/52 (f) | | 1,250,000 | 1,104,396 |
| 2% 9/1/52 (f) | | 2,150,000 | 1,899,561 |
| 2% 9/1/52 (f) | | 1,200,000 | 1,060,220 |
| 2% 9/1/52 (f) | | 950,000 | 839,341 |
| 2% 9/1/52 (f) | | 750,000 | 662,638 |
| 2% 9/1/52 (f) | | 200,000 | 176,703 |
| 2% 10/1/52 (f) | | 4,500,000 | 3,974,947 |
| 2% 10/1/52 (f) | | 2,250,000 | 1,987,473 |
| 2% 10/1/52 (f) | | 1,550,000 | 1,369,148 |
| 2.5% 7/20/51 to 12/20/51 | | 1,813,409 | 1,661,538 |
| 2.5% 9/1/52 (f) | | 2,300,000 | 2,097,131 |
| 2.5% 9/1/52 (f) | | 200,000 | 182,359 |
| 2.5% 9/1/52 (f) | | 2,400,000 | 2,188,311 |
| 2.5% 9/1/52 (f) | | 1,200,000 | 1,094,155 |
| 2.5% 9/1/52 (f) | | 1,200,000 | 1,094,155 |
| 2.5% 9/1/52 (f) | | 1,150,000 | 1,048,566 |
| 2.5% 9/1/52 (f) | | 1,250,000 | 1,139,745 |
| 2.5% 10/1/52 (f) | | 4,650,000 | 4,238,581 |
| 3% 5/15/42 to 10/20/51 | | 3,234,713 | 3,054,971 |
| 3% 9/1/52 (f) | | 675,000 | 633,516 |
| 3% 9/1/52 (f) | | 900,000 | 844,688 |
| 3% 9/1/52 (f) | | 450,000 | 422,344 |
| 3% 9/1/52 (f) | | 700,000 | 656,979 |
| 3% 9/1/52 (f) | | 675,000 | 633,516 |
| 3% 9/1/52 (f) | | 800,000 | 750,833 |
| 3% 10/1/52 (f) | | 1,100,000 | 1,031,665 |
| 3% 10/1/52 (f) | | 650,000 | 609,621 |
| 3.5% 9/1/52 (f) | | 2,900,000 | 2,795,988 |
| 5% 9/20/33 to 4/20/48 | | 425,493 | 442,169 |
| 5.47% 8/20/59 (b)(g) | | 171 | 161 |
| 6% 11/20/31 to 5/15/40 | | 251,692 | 269,021 |
| 6.5% 3/20/31 to 9/15/34 | | 769 | 823 |
|
| TOTAL GINNIE MAE | | | 53,538,872 |
|
| Uniform Mortgage Backed Securities - 4.9% | | | |
| 1.5% 9/1/37 (f) | | 1,050,000 | 943,135 |
| 1.5% 9/1/37 (f) | | 2,150,000 | 1,931,181 |
| 1.5% 9/1/37 (f) | | 700,000 | 628,757 |
| 1.5% 10/1/37 (f) | | 1,250,000 | 1,122,926 |
| 1.5% 10/1/37 (f) | | 950,000 | 853,424 |
| 1.5% 9/1/52 (f) | | 4,000,000 | 3,277,205 |
| 1.5% 9/1/52 (f) | | 1,100,000 | 901,231 |
| 1.5% 9/1/52 (f) | | 400,000 | 327,720 |
| 1.5% 9/1/52 (f) | | 900,000 | 737,371 |
| 2% 9/1/37 (f) | | 4,750,000 | 4,376,903 |
| 2% 9/1/37 (f) | | 1,650,000 | 1,520,398 |
| 2% 9/1/37 (f) | | 1,900,000 | 1,750,761 |
| 2% 9/1/37 (f) | | 800,000 | 737,163 |
| 2% 9/1/37 (f) | | 500,000 | 460,727 |
| 2% 9/1/37 (f) | | 500,000 | 460,727 |
| 2% 9/1/37 (f) | | 500,000 | 460,727 |
| 2% 10/1/37 (f) | | 1,700,000 | 1,566,205 |
| 2% 10/1/37 (f) | | 850,000 | 783,102 |
| 2% 10/1/37 (f) | | 850,000 | 783,102 |
| 2% 9/1/52 (f) | | 3,000,000 | 2,581,642 |
| 2% 9/1/52 (f) | | 3,700,000 | 3,184,025 |
| 2% 9/1/52 (f) | | 4,800,000 | 4,130,627 |
| 2% 9/1/52 (f) | | 3,250,000 | 2,796,779 |
| 2% 9/1/52 (f) | | 3,350,000 | 2,882,833 |
| 2% 9/1/52 (f) | | 2,100,000 | 1,807,149 |
| 2% 9/1/52 (f) | | 1,250,000 | 1,075,684 |
| 2% 9/1/52 (f) | | 700,000 | 602,383 |
| 2% 9/1/52 (f) | | 1,300,000 | 1,118,711 |
| 2% 9/1/52 (f) | | 500,000 | 430,274 |
| 2% 9/1/52 (f) | | 700,000 | 602,383 |
| 2% 9/1/52 (f) | | 700,000 | 602,383 |
| 2% 9/1/52 (f) | | 100,000 | 86,055 |
| 2% 9/1/52 (f) | | 100,000 | 86,055 |
| 2% 9/1/52 (f) | | 100,000 | 86,055 |
| 2% 10/1/52 (f) | | 5,100,000 | 4,387,596 |
| 2% 10/1/52 (f) | | 3,150,000 | 2,709,986 |
| 2% 10/1/52 (f) | | 4,750,000 | 4,086,486 |
| 2.5% 9/1/37 (f) | | 250,000 | 236,406 |
| 2.5% 9/1/37 (f) | | 150,000 | 141,844 |
| 2.5% 9/1/37 (f) | | 150,000 | 141,844 |
| 2.5% 9/1/52 (f) | | 3,850,000 | 3,438,532 |
| 2.5% 9/1/52 (f) | | 4,000,000 | 3,572,501 |
| 2.5% 9/1/52 (f) | | 1,700,000 | 1,518,313 |
| 2.5% 9/1/52 (f) | | 1,200,000 | 1,071,750 |
| 2.5% 9/1/52 (f) | | 500,000 | 446,563 |
| 3% 9/1/52 (f) | | 1,900,000 | 1,758,243 |
| 3.5% 9/1/52 (f) | | 2,250,000 | 2,144,883 |
| 3.5% 9/1/52 (f) | | 2,250,000 | 2,144,883 |
| 4% 9/1/52 (f) | | 3,050,000 | 2,976,370 |
| 4% 9/1/52 (f) | | 2,350,000 | 2,293,268 |
| 4% 9/1/52 (f) | | 1,000,000 | 975,859 |
| 4.5% 9/1/52 (f) | | 3,275,000 | 3,254,788 |
| 4.5% 9/1/52 (f) | | 1,000,000 | 993,828 |
| 4.5% 9/1/52 (f) | | 250,000 | 248,457 |
| 4.5% 9/1/52 (f) | | 300,000 | 298,149 |
| 4.5% 9/1/52 (f) | | 250,000 | 248,457 |
| 5% 9/1/52 (f) | | 1,500,000 | 1,513,595 |
| 5% 9/1/52 (f) | | 400,000 | 403,625 |
| 5% 9/1/52 (f) | | 500,000 | 504,532 |
| 5.5% 9/1/52 (f) | | 200,000 | 204,520 |
| 5.5% 9/1/52 (f) | | 200,000 | 204,520 |
| 5.5% 9/1/52 (f) | | 400,000 | 409,040 |
| 5.5% 9/1/52 (f) | | 300,000 | 306,780 |
|
| TOTAL UNIFORM MORTGAGE BACKED SECURITIES | | | 88,331,421 |
|
| TOTAL U.S. GOVERNMENT AGENCY - MORTGAGE SECURITIES | | | |
| (Cost $254,024,155) | | | 246,836,043 |
|
| Asset-Backed Securities - 5.7% | | | |
| AASET Trust: | | | |
| Series 2018-1A Class A, 3.844% 1/16/38 (a) | | $333,856 | $224,828 |
| Series 2019-1 Class A, 3.844% 5/15/39 (a) | | 485,397 | 336,137 |
| Series 2019-2: | | | |
| Class A, 3.376% 10/16/39 (a) | | 1,039,276 | 760,278 |
| Class B, 4.458% 10/16/39 (a)(h) | | 220,258 | 105,728 |
| Series 2021-1A Class A, 2.95% 11/16/41 (a) | | 1,259,213 | 1,050,413 |
| Series 2021-2A Class A, 2.798% 1/15/47 (a) | | 2,398,545 | 2,000,746 |
| AASET, Ltd. Series 2022-1A Class A, 6% 5/16/47 (a) | | 1,569,700 | 1,520,595 |
| Affirm, Inc. Series 2021-A Class A, 0.88% 8/15/25 (a) | | 447,836 | 444,676 |
| Aimco Series 2021-BA Class AR, 3 month U.S. LIBOR + 1.100% 3.612% 1/15/32 (a)(b)(e) | | 365,000 | 358,571 |
| AIMCO CLO Ltd. Series 2021-11A Class AR, 3 month U.S. LIBOR + 1.130% 3.8703% 10/17/34 (a)(b)(e) | | 869,000 | 847,948 |
| AIMCO CLO Ltd. / AIMCO CLO LLC Series 2021-14A Class A, 3 month U.S. LIBOR + 0.990% 3.6999% 4/20/34 (a)(b)(e) | | 1,972,000 | 1,914,528 |
| Allegro CLO XV, Ltd. / Allegro CLO VX LLC Series 2022-1A Class A, CME TERM SOFR 3 MONTH INDEX + 1.500% 3.1807% 7/20/35 (a)(b)(e) | | 1,188,000 | 1,164,753 |
| Allegro CLO, Ltd. Series 2021-1A Class A, 3 month U.S. LIBOR + 1.140% 3.8499% 7/20/34 (a)(b)(e) | | 992,000 | 962,414 |
| American Express Credit Account Master Trust Series 2022-3 Class A, 3.75% 8/16/27 | | 800,000 | 796,962 |
| American Money Management Corp. Series 2012-11A Class A1R2, 3 month U.S. LIBOR + 1.010% 3.7923% 4/30/31 (a)(b)(e) | | 1,700,000 | 1,668,468 |
| Apollo Aviation Securitization Equity Trust Series 2020-1A: | | | |
| Class A, 3.351% 1/16/40 (a) | | 348,571 | 287,940 |
| Class B, 4.335% 1/16/40 (a) | | 160,110 | 70,044 |
| Ares CLO Series 2019-54A Class A, 3 month U.S. LIBOR + 1.320% 3.832% 10/15/32 (a)(b)(e) | | 1,101,000 | 1,082,616 |
| Ares LIX CLO Ltd. Series 2021-59A Class A, 3 month U.S. LIBOR + 1.030% 3.813% 4/25/34 (a)(b)(e) | | 657,000 | 638,839 |
| Ares LV CLO Ltd. Series 2021-55A Class A1R, 3 month U.S. LIBOR + 1.130% 3.642% 7/15/34 (a)(b)(e) | | 1,286,000 | 1,257,341 |
| Ares LVIII CLO LLC Series 2022-58A Class AR, CME TERM SOFR 3 MONTH INDEX + 1.330% 3.6579% 1/15/35 (a)(b)(e) | | 1,808,000 | 1,745,186 |
| Ares XLI CLO Ltd. / Ares XLI CLO LLC Series 2021-41A Class AR2, 3 month U.S. LIBOR + 1.070% 3.582% 4/15/34 (a)(b)(e) | | 1,398,000 | 1,361,421 |
| Ares XXXIV CLO Ltd. Series 2020-2A Class AR2, 3 month U.S. LIBOR + 1.250% 3.9903% 4/17/33 (a)(b)(e) | | 460,000 | 450,392 |
| Babson CLO Ltd. Series 2021-1A Class AR, 3 month U.S. LIBOR + 1.150% 3.662% 10/15/36 (a)(b)(e) | | 860,000 | 840,003 |
| Barings CLO Ltd.: | | | |
| Series 2021-1A Class A, 3 month U.S. LIBOR + 1.020% 3.803% 4/25/34 (a)(b)(e) | | 1,437,000 | 1,399,727 |
| Series 2021-4A Class A, 3 month U.S. LIBOR + 1.220% 3.9299% 1/20/32 (a)(b)(e) | | 1,680,000 | 1,653,594 |
| Beechwood Park CLO Ltd. Series 2022-1A Class A1R, CME TERM SOFR 3 MONTH INDEX + 1.300% 3.7808% 1/17/35 (a)(b)(e) | | 1,857,000 | 1,800,542 |
| BETHP Series 2021-1A Class A, 3 month U.S. LIBOR + 1.130% 3.642% 1/15/35 (a)(b)(e) | | 1,299,000 | 1,266,622 |
| Blackbird Capital Aircraft Series 2021-1A Class A, 2.443% 7/15/46 (a) | | 2,070,122 | 1,753,120 |
| Bristol Park CLO, Ltd. Series 2020-1A Class AR, 3 month U.S. LIBOR + 0.990% 3.502% 4/15/29 (a)(b)(e) | | 1,347,398 | 1,332,990 |
| Castlelake Aircraft Securitization Trust Series 2019-1A: | | | |
| Class A, 3.967% 4/15/39 (a) | | 746,260 | 666,238 |
| Class B, 5.095% 4/15/39 (a) | | 488,890 | 387,308 |
| Castlelake Aircraft Structured Trust: | | | |
| Series 2018-1 Class A, 4.125% 6/15/43 (a) | | 343,293 | 308,572 |
| Series 2021-1A Class A, 3.474% 1/15/46 (a) | | 348,333 | 309,505 |
| Cedar Funding Ltd.: | | | |
| Series 2021-10A Class AR, 3 month U.S. LIBOR + 1.100% 3.8099% 10/20/32 (a)(b)(e) | | 1,037,000 | 1,018,412 |
| Series 2022-15A Class A, CME TERM SOFR 3 MONTH INDEX + 1.320% 3.7973% 4/20/35 (a)(b)(e) | | 1,721,000 | 1,675,084 |
| Cedar Funding XII CLO Ltd. / Cedar Funding XII CLO LLC Series 2021-12A Class A1R, 3 month U.S. LIBOR + 1.130% 3.913% 10/25/34 (a)(b)(e) | | 838,000 | 813,622 |
| CEDF Series 2021-6A Class ARR, 3 month U.S. LIBOR + 1.050% 3.7599% 4/20/34 (a)(b)(e) | | 1,199,000 | 1,158,240 |
| Cent CLO Ltd. / Cent CLO Series 2021-29A Class AR, 3 month U.S. LIBOR + 1.170% 3.8799% 10/20/34 (a)(b)(e) | | 1,364,000 | 1,323,530 |
| Columbia Cent CLO 31 Ltd. Series 2021-31A Class A1, 3 month U.S. LIBOR + 1.200% 3.9099% 4/20/34 (a)(b)(e) | | 1,620,000 | 1,570,368 |
| Columbia Cent Clo 32 Ltd. / Coliseum Series 2022-32A Class A1, CME TERM SOFR 3 MONTH INDEX + 1.700% 4.197% 7/24/34 (a)(b)(e) | | 1,758,000 | 1,725,356 |
| Columbia Cent CLO Ltd. / Columbia Cent CLO Corp. Series 2021-30A Class A1, 3 month U.S. LIBOR + 1.310% 4.0199% 1/20/34 (a)(b)(e) | | 2,220,000 | 2,155,380 |
| DB Master Finance LLC Series 2017-1A Class A2II, 4.03% 11/20/47 (a) | | 456,490 | 428,556 |
| Dryden 98 CLO Ltd. Series 2022-98A Class A, CME TERM SOFR 3 MONTH INDEX + 1.300% 2.204% 4/20/35 (a)(b)(e) | | 969,000 | 936,364 |
| Dryden CLO, Ltd.: | | | |
| Series 2021-76A Class A1R, 3 month U.S. LIBOR + 1.150% 3.8599% 10/20/34 (a)(b)(e) | | 875,000 | 854,461 |
| Series 2021-83A Class A, 3 month U.S. LIBOR + 1.220% 3.9603% 1/18/32 (a)(b)(e) | | 1,259,000 | 1,239,470 |
| Dryden Senior Loan Fund: | | | |
| Series 2020-78A Class A, 3 month U.S. LIBOR + 1.180% 3.9203% 4/17/33 (a)(b)(e) | | 900,000 | 881,578 |
| Series 2021-85A Class AR, 3 month U.S. LIBOR + 1.150% 3.662% 10/15/35 (a)(b)(e) | | 1,156,000 | 1,128,222 |
| Series 2021-90A Class A1A, 3 month U.S. LIBOR + 1.130% 4.114% 2/20/35 (a)(b)(e) | | 707,000 | 687,804 |
| Eaton Vance CLO, Ltd.: | | | |
| Series 2021-1A Class AR, 3 month U.S. LIBOR + 1.100% 3.612% 4/15/31 (a)(b)(e) | | 610,000 | 598,404 |
| Series 2021-2A Class AR, 3 month U.S. LIBOR + 1.150% 3.662% 1/15/35 (a)(b)(e) | | 1,578,000 | 1,543,194 |
| Eaton Vance CLO, Ltd. / Eaton Vance CLO LLC Series 2021-1A Class A13R, 3 month U.S. LIBOR + 1.250% 3.762% 1/15/34 (a)(b)(e) | | 350,000 | 342,748 |
| Enterprise Fleet Financing LLC Series 2021-1 Class A2, 0.44% 12/21/26 (a) | | 391,019 | 378,469 |
| Flatiron CLO Ltd. Series 2021-1A: | | | |
| Class A1, 3 month U.S. LIBOR + 1.110% 3.8476% 7/19/34 (a)(b)(e) | | 902,000 | 876,098 |
| Class AR, 3 month U.S. LIBOR + 1.080% 4.0016% 11/16/34 (a)(b)(e) | | 1,250,000 | 1,220,741 |
| Flatiron CLO Ltd. / Flatiron CLO LLC Series 2020-1A Class A, 3 month U.S. LIBOR + 1.300% 4.284% 11/20/33 (a)(b)(e) | | 1,956,000 | 1,915,738 |
| Horizon Aircraft Finance I Ltd. Series 2018-1 Class A, 4.458% 12/15/38 (a) | | 378,642 | 329,478 |
| Horizon Aircraft Finance Ltd. Series 2019-1 Class A, 3.721% 7/15/39 (a) | | 476,553 | 415,076 |
| Invesco CLO Ltd. Series 2021-3A Class A, 3 month U.S. LIBOR + 1.130% 3.889% 10/22/34 (a)(b)(e) | | 960,000 | 931,010 |
| KKR CLO Ltd. Series 2022-41A Class A1, CME TERM SOFR 3 MONTH INDEX + 1.330% 2.0223% 4/15/35 (a)(b)(e) | | 2,253,000 | 2,176,824 |
| Lucali CLO Ltd. Series 2021-1A Class A, 3 month U.S. LIBOR + 1.210% 3.722% 1/15/33 (a)(b)(e) | | 820,000 | 804,992 |
| Madison Park Funding Series 2020-19A Class A1R2, 3 month U.S. LIBOR + 0.920% 3.679% 1/22/28 (a)(b)(e) | | 905,689 | 894,580 |
| Madison Park Funding L Ltd. / Madison Park Funding L LLC Series 2021-50A Class A, 3 month U.S. LIBOR + 1.140% 3.8776% 4/19/34 (a)(b)(e) | | 1,690,000 | 1,653,783 |
| Madison Park Funding LII Ltd. / Madison Park Funding LII LLC Series 2021-52A Class A, 3 month U.S. LIBOR + 1.100% 3.859% 1/22/35 (a)(b)(e) | | 1,540,000 | 1,497,186 |
| Madison Park Funding XLV Ltd./Madison Park Funding XLV LLC Series 2021-45A Class AR, 3 month U.S. LIBOR + 1.120% 3.632% 7/15/34 (a)(b)(e) | | 923,000 | 898,426 |
| Madison Park Funding XXXII, Ltd. / Madison Park Funding XXXII LLC Series 2021-32A Class A2R, 3 month U.S. LIBOR + 1.200% 3.959% 1/22/31 (a)(b)(e) | | 364,000 | 352,910 |
| Magnetite CLO Ltd. Series 2021-27A Class AR, 3 month U.S. LIBOR + 1.140% 3.8499% 10/20/34 (a)(b)(e) | | 305,000 | 298,014 |
| Magnetite IX, Ltd. / Magnetite IX LLC Series 2021-30A Class A, 3 month U.S. LIBOR + 1.130% 3.913% 10/25/34 (a)(b)(e) | | 1,565,000 | 1,528,994 |
| Magnetite XXI Ltd. Series 2021-21A Class AR, 3 month U.S. LIBOR + 1.020% 3.7299% 4/20/34 (a)(b)(e) | | 1,158,000 | 1,132,210 |
| Magnetite XXIII, Ltd. Series 2021-23A Class AR, 3 month U.S. LIBOR + 1.130% 3.913% 1/25/35 (a)(b)(e) | | 1,132,000 | 1,104,361 |
| Magnetite XXIX, Ltd. / Magnetite XXIX LLC Series 2021-29A Class A, 3 month U.S. LIBOR + 0.990% 3.502% 1/15/34 (a)(b)(e) | | 1,480,000 | 1,453,000 |
| Metlife Securitization Trust Series 2019-1A Class A1A, 3.75% 4/25/58 (a) | | 171,497 | 168,792 |
| Milos CLO, Ltd. Series 2020-1A Class AR, 3 month U.S. LIBOR + 1.070% 3.7799% 10/20/30 (a)(b)(e) | | 1,391,000 | 1,368,979 |
| Peace Park CLO, Ltd. Series 2021-1A Class A, 3 month U.S. LIBOR + 1.130% 3.8399% 10/20/34 (a)(b)(e) | | 1,254,000 | 1,226,832 |
| Planet Fitness Master Issuer LLC: | | | |
| Series 2018-1A Class A2II, 4.666% 9/5/48 (a) | | 1,923,075 | 1,855,808 |
| Series 2019-1A Class A2, 3.858% 12/5/49 (a) | | 943,800 | 804,938 |
| Series 2022-1A: | | | |
| Class A2I, 3.251% 12/5/51 (a) | | 1,120,193 | 1,008,022 |
| Class A2II, 4.008% 12/5/51 (a) | | 1,001,490 | 831,219 |
| Project Silver Series 2019-1 Class A, 3.967% 7/15/44 (a) | | 894,752 | 764,037 |
| Rockland Park CLO Ltd. Series 2021-1A Class A, 3 month U.S. LIBOR + 1.120% 3.8299% 4/20/34 (a)(b)(e) | | 1,717,000 | 1,679,712 |
| RR 7 Ltd. Series 2022-7A Class A1AB, CME TERM SOFR 3 MONTH INDEX + 1.340% 3.6679% 1/15/37 (a)(b)(e) | | 1,862,000 | 1,803,226 |
| Sapphire Aviation Finance Series 2020-1A: | | | |
| Class A, 3.228% 3/15/40 (a) | | 1,000,257 | 867,222 |
| Class B, 4.335% 3/15/40 (a) | | 233,783 | 151,761 |
| SBA Tower Trust: | | | |
| Series 2019, 2.836% 1/15/50 (a) | | 1,211,000 | 1,157,696 |
| 1.884% 7/15/50 (a) | | 498,000 | 448,759 |
| 2.328% 7/15/52 (a) | | 381,000 | 332,301 |
| Stratus CLO, Ltd. Series 2022-1A Class A, CME TERM SOFR 3 MONTH INDEX + 1.750% 4.032% 7/20/30 (a)(b)(e) | | 281,000 | 278,454 |
| SYMP Series 2022-32A Class A1, CME TERM SOFR 3 MONTH INDEX + 1.320% 1.6326% 4/23/35 (a)(b)(e) | | 1,936,000 | 1,861,834 |
| Symphony CLO Ltd. Series 2020-22A Class A1A, 3 month U.S. LIBOR + 1.290% 4.0303% 4/18/33 (a)(b)(e) | | 3,000,000 | 2,950,623 |
| Symphony CLO XIX, Ltd. / Symphony CLO XIX LLC Series 2018-19A Class A, 3 month U.S. LIBOR + 0.960% 3.7003% 4/16/31 (a)(b)(e) | | 777,000 | 764,901 |
| Symphony CLO XXV Ltd. / Symphony CLO XXV LLC Series 2021-25A Class A, 3 month U.S. LIBOR + 0.980% 3.7176% 4/19/34 (a)(b)(e) | | 1,453,000 | 1,412,017 |
| Symphony CLO XXVI Ltd. / Symphony CLO XXVI LLC Series 2021-26A Class AR, 3 month U.S. LIBOR + 1.080% 3.7899% 4/20/33 (a)(b)(e) | | 1,903,000 | 1,852,367 |
| Thunderbolt Aircraft Lease Ltd. Series 2018-A Class A, 4.147% 9/15/38 (a)(b) | | 751,676 | 659,930 |
| Thunderbolt III Aircraft Lease Ltd. Series 2019-1 Class A, 3.671% 11/15/39 (a) | | 1,432,877 | 1,228,959 |
| Towd Point Mortgage Trust Series 2019-1 Class A1, 3.6794% 3/25/58 (a)(b) | | 213,997 | 206,286 |
| Voya CLO Ltd. Series 2019-2A Class A, 3 month U.S. LIBOR + 1.270% 3.9799% 7/20/32 (a)(b)(e) | | 1,290,000 | 1,267,256 |
| Voya CLO Ltd./Voya CLO LLC: | | | |
| Series 2021-2A Class A1R, 3 month U.S. LIBOR + 1.160% 3.8976% 7/19/34 (a)(b)(e) | | 851,000 | 828,996 |
| Series 2021-3A Class AR, 3 month U.S. LIBOR + 1.150% 3.8599% 10/20/34 (a)(b)(e) | | 1,736,000 | 1,688,057 |
| Voya CLO, Ltd. Series 2021-1A Class AR, 3 month U.S. LIBOR + 1.150% 3.8903% 7/16/34 (a)(b)(e) | | 860,000 | 836,138 |
| TOTAL ASSET-BACKED SECURITIES | | | |
| (Cost $108,161,142) | | | 103,016,850 |
|
| Collateralized Mortgage Obligations - 1.3% | | | |
| Private Sponsor - 0.2% | | | |
| Brass PLC Series 2021-10A Class A1, 0.669% 4/16/69 (a)(b) | | 559,869 | 537,016 |
| Cascade Funding Mortgage Trust: | | | |
| Series 2021-HB5 Class A, 0.8006% 2/25/31 (a) | | 537,749 | 526,053 |
| Series 2021-HB6 Class A, 0.8983% 6/25/36 (a) | | 779,920 | 744,513 |
| CSMC Trust sequential payer Series 2020-RPL4 Class A1, 2% 1/25/60 (a) | | 402,710 | 363,171 |
| MFA Trust sequential payer Series 2022-RPL1 Class A1, 3.3% 8/25/61 (a) | | 479,255 | 446,217 |
| New Residential Mortgage Loan Trust Series 2020-1A Class A1B, 3.5% 10/25/59 (a) | | 496,426 | 477,138 |
| Preston Ridge Partners Mortgage Trust Series 2021-RPL2 Class A1, 1.455% 10/25/51 (a)(b) | | 398,880 | 359,787 |
| Towd Point Mortgage Trust sequential payer Series 2022-K147 Class A2, 3.75% 7/25/62 (a) | | 784,577 | 741,591 |
|
| TOTAL PRIVATE SPONSOR | | | 4,195,486 |
|
| U.S. Government Agency - 1.1% | | | |
| Fannie Mae: | | | |
| floater: | | | |
| Series 1994-42 Class FK, 10-Year Treasury Constant Maturity Rate - 0.500% 2.44% 4/25/24 (b)(e) | | 3,792 | 3,761 |
| Series 2001-38 Class QF, 1 month U.S. LIBOR + 0.980% 3.4237% 8/25/31 (b)(e) | | 2,825 | 2,877 |
| Series 2002-18 Class FD, 1 month U.S. LIBOR + 0.800% 3.2437% 2/25/32 (b)(e) | | 304 | 308 |
| Series 2002-39 Class FD, 1 month U.S. LIBOR + 1.000% 3.377% 3/18/32 (b)(e) | | 572 | 583 |
| Series 2002-60 Class FV, 1 month U.S. LIBOR + 1.000% 3.4437% 4/25/32 (b)(e) | | 1,275 | 1,301 |
| Series 2002-63 Class FN, 1 month U.S. LIBOR + 1.000% 3.4437% 10/25/32 (b)(e) | | 822 | 838 |
| Series 2002-7 Class FC, 1 month U.S. LIBOR + 0.750% 3.1937% 1/25/32 (b)(e) | | 300 | 304 |
| Series 2002-74 Class FV, 1 month U.S. LIBOR + 0.450% 2.8937% 11/25/32 (b)(e) | | 19,334 | 19,380 |
| Series 2002-75 Class FA, 1 month U.S. LIBOR + 1.000% 3.4437% 11/25/32 (b)(e) | | 1,249 | 1,274 |
| Series 2003-118 Class S, 8.100% - 1 month U.S. LIBOR 5.6563% 12/25/33 (b)(i)(j) | | 11,149 | 1,917 |
| Series 2006-104 Class GI, 6.680% - 1 month U.S. LIBOR 4.2363% 11/25/36 (b)(i)(j) | | 7,988 | 913 |
| Series 2010-15 Class FJ, 1 month U.S. LIBOR + 0.930% 3.3737% 6/25/36 (b)(e) | | 230,421 | 234,352 |
| planned amortization class: | | | |
| Series 1992-168 Class KB, 7% 10/25/22 | | 4 | 4 |
| Series 1993-207 Class H, 6.5% 11/25/23 | | 910 | 915 |
| Series 1996-28 Class PK, 6.5% 7/25/25 | | 375 | 377 |
| Series 1999-17 Class PG, 6% 4/25/29 | | 3,347 | 3,448 |
| Series 1999-32 Class PL, 6% 7/25/29 | | 3,871 | 3,997 |
| Series 1999-33 Class PK, 6% 7/25/29 | | 2,867 | 2,959 |
| Series 2001-52 Class YZ, 6.5% 10/25/31 | | 500 | 513 |
| Series 2003-28 Class KG, 5.5% 4/25/23 | | 639 | 640 |
| Series 2003-70 Class BJ, 5% 7/25/33 | | 18,157 | 17,875 |
| Series 2005-64 Class PX, 5.5% 6/25/35 | | 23,837 | 24,268 |
| Series 2005-68 Class CZ, 5.5% 8/25/35 | | 256,586 | 265,436 |
| Series 2005-81 Class PC, 5.5% 9/25/35 | | 6,522 | 6,800 |
| Series 2006-12 Class BO 10/25/35 (k) | | 9,236 | 8,023 |
| Series 2006-15 Class OP 3/25/36 (k) | | 10,724 | 9,229 |
| Series 2006-45 Class OP 6/25/36 (k) | | 3,393 | 2,745 |
| Series 2006-62 Class KP 4/25/36 (k) | | 5,523 | 4,605 |
| Series 2010-118 Class PB, 4.5% 10/25/40 | | 183,115 | 184,511 |
| Series 2012-149: | | | |
| Class DA, 1.75% 1/25/43 | | 63,799 | 59,261 |
| Class GA, 1.75% 6/25/42 | | 68,662 | 63,646 |
| sequential payer: | | | |
| Series 1997-41 Class J, 7.5% 6/18/27 | | 728 | 758 |
| Series 1999-25 Class Z, 6% 6/25/29 | | 3,212 | 3,288 |
| Series 2001-20 Class Z, 6% 5/25/31 | | 3,871 | 4,006 |
| Series 2001-31 Class ZC, 6.5% 7/25/31 | | 2,028 | 2,097 |
| Series 2002-16 Class ZD, 6.5% 4/25/32 | | 1,392 | 1,427 |
| Series 2002-74 Class SV, 7.550% - 1 month U.S. LIBOR 5.1063% 11/25/32 (b)(i)(j) | | 4,029 | 226 |
| Series 2003-117 Class MD, 5% 12/25/23 | | 7,861 | 7,900 |
| Series 2004-52 Class KZ, 5.5% 7/25/34 | | 90,414 | 90,532 |
| Series 2004-91 Class Z, 5% 12/25/34 | | 197,517 | 194,513 |
| Series 2005-117 Class JN, 4.5% 1/25/36 | | 20,265 | 20,449 |
| Series 2005-14 Class ZB, 5% 3/25/35 | | 61,039 | 60,092 |
| Series 2006-72 Class CY, 6% 8/25/26 | | 28,896 | 29,767 |
| Series 2009-59 Class HB, 5% 8/25/39 | | 107,689 | 110,165 |
| Series 2012-67 Class AI, 4.5% 7/25/27 (i) | | 5,344 | 210 |
| Series 06-116 Class SG, 6.640% - 1 month U.S. LIBOR 4.1963% 12/25/36 (b)(i)(j) | | 5,288 | 818 |
| Series 07-40 Class SE, 6.440% - 1 month U.S. LIBOR 3.9963% 5/25/37 (b)(i)(j) | | 2,748 | 397 |
| Series 1993-165 Class SH, 19.800% - 1 month U.S. LIBOR 12.8877% 9/25/23 (b)(j) | | 41 | 41 |
| Series 2003-21 Class SK, 8.100% - 1 month U.S. LIBOR 5.6563% 3/25/33 (b)(i)(j) | | 693 | 100 |
| Series 2005-72 Class ZC, 5.5% 8/25/35 | | 43,656 | 45,366 |
| Series 2005-79 Class ZC, 5.9% 9/25/35 | | 24,764 | 25,833 |
| Series 2007-66 Class SA, 39.600% - 1 month U.S. LIBOR 24.9377% 7/25/37 (b)(j) | | 3,722 | 5,537 |
| Series 2008-12 Class SG, 6.350% - 1 month U.S. LIBOR 3.9063% 3/25/38 (b)(i)(j) | | 18,459 | 2,249 |
| Series 2010-135: | | | |
| Class LS, 6.050% - 1 month U.S. LIBOR 3.6063% 12/25/40 (b)(i)(j) | | 18,985 | 1,892 |
| Class ZA, 4.5% 12/25/40 | | 7,832 | 8,239 |
| Series 2010-139 Class NI, 4.5% 2/25/40 (i) | | 53,870 | 1,732 |
| Series 2010-150 Class ZC, 4.75% 1/25/41 | | 79,330 | 82,018 |
| Series 2010-39 Class FG, 1 month U.S. LIBOR + 0.920% 3.3637% 3/25/36 (b)(e) | | 155,735 | 159,310 |
| Series 2010-95 Class ZC, 5% 9/25/40 | | 183,266 | 191,301 |
| Series 2011-39 Class ZA, 6% 11/25/32 | | 13,161 | 13,761 |
| Series 2011-4 Class PZ, 5% 2/25/41 | | 24,275 | 24,526 |
| Series 2011-67 Class AI, 4% 7/25/26 (i) | | 15,134 | 481 |
| Series 2011-83 Class DI, 6% 9/25/26 (i) | | 48 | 0 |
| Series 2012-100 Class WI, 3% 9/25/27 (i) | | 40,939 | 2,231 |
| Series 2012-14 Class JS, 6.650% - 1 month U.S. LIBOR 4.2063% 12/25/30 (b)(i)(j) | | 6,263 | 97 |
| Series 2012-9 Class SH, 6.550% - 1 month U.S. LIBOR 4.1063% 6/25/41 (b)(i)(j) | | 4,856 | 91 |
| Series 2013-133 Class IB, 3% 4/25/32 (i) | | 15,547 | 552 |
| Series 2013-134 Class SA, 6.050% - 1 month U.S. LIBOR 3.6063% 1/25/44 (b)(i)(j) | | 11,670 | 1,398 |
| Series 2013-N1 Class A, 6.720% - 1 month U.S. LIBOR 4.2763% 6/25/35 (b)(i)(j) | | 15,600 | 1,585 |
| Series 2015-42 Class IL, 6% 6/25/45 (i) | | 79,370 | 14,509 |
| Series 2015-70 Class JC, 3% 10/25/45 | | 86,859 | 83,983 |
| Series 2017-30 Class AI, 5.5% 5/25/47 (i) | | 43,274 | 8,108 |
| Series 2017-74 Class SH, 6.200% - 1 month U.S. LIBOR 3.7563% 10/25/47 (b)(i)(j) | | 344,883 | 43,870 |
| Series 2018-45 Class GI, 4% 6/25/48 (i) | | 473,615 | 89,392 |
| Fannie Mae Stripped Mortgage-Backed Securities: | | | |
| Series 339 Class 5, 5.5% 7/25/33 (i) | | 2,822 | 483 |
| Series 343 Class 16, 5.5% 5/25/34 (i) | | 2,581 | 442 |
| Series 348 Class 14, 6.5% 8/25/34 (b)(i) | | 1,794 | 369 |
| Series 351 Class 13, 6% 3/25/34 (i) | | 1,664 | 319 |
| Series 384 Class 6, 5% 7/25/37 (i) | | 11,015 | 1,939 |
| Freddie Mac: | | | |
| floater: | | | |
| Series 2412 Class FK, 1 month U.S. LIBOR + 0.800% 3.191% 1/15/32 (b)(e) | | 226 | 230 |
| Series 2423 Class FA, 1 month U.S. LIBOR + 0.900% 3.291% 3/15/32 (b)(e) | | 351 | 357 |
| Series 2424 Class FM, 1 month U.S. LIBOR + 1.000% 3.391% 3/15/32 (b)(e) | | 328 | 334 |
| Series 2432: | | | |
| Class FE, 1 month U.S. LIBOR + 0.900% 3.291% 6/15/31 (b)(e) | | 608 | 618 |
| Class FG, 1 month U.S. LIBOR + 0.900% 3.291% 3/15/32 (b)(e) | | 196 | 200 |
| Series 2526 Class FC, 1 month U.S. LIBOR + 0.400% 2.791% 11/15/32 (b)(e) | | 4,058 | 4,071 |
| Series 2711 Class FC, 1 month U.S. LIBOR + 0.900% 3.291% 2/15/33 (b)(e) | | 62,843 | 64,028 |
| floater planned amortization class Series 2770 Class FH, 1 month U.S. LIBOR + 0.400% 2.791% 3/15/34 (b)(e) | | 90,370 | 90,784 |
| floater target amortization class Series 3366 Class FD, 1 month U.S. LIBOR + 0.250% 2.641% 5/15/37 (b)(e) | | 13,720 | 13,641 |
| planned amortization class: | | | |
| Series 2095 Class PE, 6% 11/15/28 | | 4,234 | 4,377 |
| Series 2101 Class PD, 6% 11/15/28 | | 2,047 | 2,117 |
| Series 2121 Class MG, 6% 2/15/29 | | 1,722 | 1,779 |
| Series 2131 Class BG, 6% 3/15/29 | | 12,465 | 12,897 |
| Series 2137 Class PG, 6% 3/15/29 | | 1,914 | 1,980 |
| Series 2154 Class PT, 6% 5/15/29 | | 3,330 | 3,445 |
| Series 2162 Class PH, 6% 6/15/29 | | 686 | 708 |
| Series 2520 Class BE, 6% 11/15/32 | | 5,610 | 5,888 |
| Series 2693 Class MD, 5.5% 10/15/33 | | 12,155 | 12,205 |
| Series 2802 Class OB, 6% 5/15/34 | | 12,790 | 13,256 |
| Series 2996 Class MK, 5.5% 6/15/35 | | 3,799 | 3,925 |
| Series 3002 Class NE, 5% 7/15/35 | | 12,802 | 13,075 |
| Series 3110 Class OP 9/15/35 (k) | | 4,073 | 3,736 |
| Series 3119 Class PO 2/15/36 (k) | | 13,136 | 10,771 |
| Series 3123 Class LO 3/15/36 (k) | | 7,386 | 6,103 |
| Series 3189 Class PD, 6% 7/15/36 | | 10,954 | 11,584 |
| Series 3258 Class PM, 5.5% 12/15/36 | | 4,944 | 5,160 |
| Series 3415 Class PC, 5% 12/15/37 | | 39,352 | 39,948 |
| Series 3806 Class UP, 4.5% 2/15/41 | | 23,756 | 23,640 |
| Series 3832 Class PE, 5% 3/15/41 | | 50,548 | 51,660 |
| Series 3857 Class ZP, 5% 5/15/41 | | 298,845 | 303,190 |
| Series 4135 Class AB, 1.75% 6/15/42 | | 51,539 | 48,077 |
| Series 4765 Class PE, 3% 12/15/41 | | 451 | 451 |
| sequential payer: | | | |
| Series 1929 Class EZ, 7.5% 2/17/27 | | 5,952 | 6,161 |
| Series 2004-2862 Class NE, 5% 9/15/24 | | 15,344 | 15,433 |
| Series 2135 Class JE, 6% 3/15/29 | | 834 | 863 |
| Series 2145 Class MZ, 6.5% 4/15/29 | | 12,357 | 12,811 |
| Series 2274 Class ZM, 6.5% 1/15/31 | | 1,213 | 1,254 |
| Series 2281 Class ZB, 6% 3/15/30 | | 2,374 | 2,451 |
| Series 2303 Class ZV, 6% 4/15/31 | | 7,228 | 7,489 |
| Series 2357 Class ZB, 6.5% 9/15/31 | | 19,668 | 20,617 |
| Series 2502 Class ZC, 6% 9/15/32 | | 2,312 | 2,425 |
| Series 2519 Class ZD, 5.5% 11/15/32 | | 3,398 | 3,533 |
| Series 2546 Class MJ, 5.5% 3/15/23 | | 157 | 158 |
| Series 2601 Class TB, 5.5% 4/15/23 | | 81 | 82 |
| Series 2877 Class ZD, 5% 10/15/34 | | 246,375 | 242,763 |
| Series 2998 Class LY, 5.5% 7/15/25 | | 4,046 | 4,137 |
| Series 3007 Class EW, 5.5% 7/15/25 | | 10,190 | 10,403 |
| Series 3871 Class KB, 5.5% 6/15/41 | | 65,788 | 69,514 |
| Series 06-3115 Class SM, 6.600% - 1 month U.S. LIBOR 4.209% 2/15/36 (b)(i)(j) | | 3,677 | 406 |
| Series 2013-4281 Class AI, 4% 12/15/28 (i) | | 14,326 | 366 |
| Series 2017-4683 Class LM, 3% 5/15/47 | | 114,563 | 110,606 |
| Series 2018-4763 Class SC, 6.200% - 1 month U.S. LIBOR 3.809% 8/15/47 (b)(i)(j) | | 174,874 | 22,573 |
| Series 2933 Class ZM, 5.75% 2/15/35 | | 55,700 | 59,080 |
| Series 2935 Class ZK, 5.5% 2/15/35 | | 45,096 | 47,254 |
| Series 2947 Class XZ, 6% 3/15/35 | | 22,306 | 23,507 |
| Series 2996 Class ZD, 5.5% 6/15/35 | | 38,248 | 39,988 |
| Series 3237 Class C, 5.5% 11/15/36 | | 53,142 | 54,714 |
| Series 3244 Class SG, 6.660% - 1 month U.S. LIBOR 4.269% 11/15/36 (b)(i)(j) | | 16,698 | 2,251 |
| Series 3287 Class SD, 6.750% - 1 month U.S. LIBOR 4.359% 3/15/37 (b)(i)(j) | | 25,137 | 3,900 |
| Series 3297 Class BI, 6.760% - 1 month U.S. LIBOR 4.369% 4/15/37 (b)(i)(j) | | 35,903 | 4,953 |
| Series 3336 Class LI, 6.580% - 1 month U.S. LIBOR 4.189% 6/15/37 (b)(i)(j) | | 11,607 | 1,431 |
| Series 3843 Class PZ, 5% 4/15/41 | | 299,883 | 313,766 |
| Series 3949 Class MK, 4.5% 10/15/34 | | 9,114 | 9,202 |
| Series 4055 Class BI, 3.5% 5/15/31 (i) | | 17,305 | 606 |
| Series 4314 Class AI, 5% 3/15/34 (i) | | 5,759 | 228 |
| Series 4427 Class LI, 3.5% 2/15/34 (i) | | 44,685 | 3,392 |
| Series 4471 Class PA 4% 12/15/40 | | 46,331 | 45,977 |
| target amortization class Series 2156 Class TC, 6.25% 5/15/29 | | 1,732 | 1,783 |
| Freddie Mac Manufactured Housing participation certificates guaranteed: | | | |
| floater Series 1686 Class FA, 1 month U.S. LIBOR + 0.900% 2.8991% 2/15/24 (b)(e) | | 245 | 245 |
| sequential payer: | | | |
| Series 2043 Class ZH, 6% 4/15/28 | | 1,376 | 1,419 |
| Series 2056 Class Z, 6% 5/15/28 | | 3,387 | 3,498 |
| Freddie Mac Multi-family Structured pass-thru certificates: | | | |
| sequential payer Series 4341 Class ML, 3.5% 11/15/31 | | 238,228 | 234,255 |
| Series 4386 Class AZ, 4.5% 11/15/40 | | 108,494 | 108,903 |
| Freddie Mac Seasoned Credit Risk Transfer Trust Series 2018-3 Class M55D, 4% 8/25/57 | | 48,464 | 47,627 |
| Ginnie Mae guaranteed REMIC pass-thru certificates: | | | |
| floater: | | | |
| Series 2007-37 Class TS, 6.690% - 1 month U.S. LIBOR 4.3031% 6/16/37 (b)(i)(j) | | 6,903 | 885 |
| Series 2007-59 Class FC, 1 month U.S. LIBOR + 0.500% 2.8681% 7/20/37 (b)(e) | | 49,425 | 49,865 |
| Series 2008-2 Class FD, 1 month U.S. LIBOR + 0.480% 2.8481% 1/20/38 (b)(e) | | 12,781 | 12,882 |
| Series 2008-73 Class FA, 1 month U.S. LIBOR + 0.860% 3.2281% 8/20/38 (b)(e) | | 71,174 | 72,527 |
| Series 2008-83 Class FB, 1 month U.S. LIBOR + 0.900% 3.2681% 9/20/38 (b)(e) | | 52,564 | 53,626 |
| Series 2009-108 Class CF, 1 month U.S. LIBOR + 0.600% 2.9869% 11/16/39 (b)(e) | | 61,850 | 62,636 |
| Series 2009-116 Class KF, 1 month U.S. LIBOR + 0.530% 2.9169% 12/16/39 (b)(e) | | 39,420 | 39,829 |
| Series 2010-H03 Class FA, 1 month U.S. LIBOR + 0.550% 2.8497% 3/20/60(b)(e)(g) | | 86,002 | 85,610 |
| Series 2010-H17 Class FA, 1 month U.S. LIBOR + 0.330% 2.6297% 7/20/60 (b)(e)(g) | | 544,873 | 539,514 |
| Series 2010-H18 Class AF, 1 month U.S. LIBOR + 0.300% 2.0976% 9/20/60 (b)(e)(g) | | 666,623 | 660,096 |
| Series 2010-H19 Class FG, 1 month U.S. LIBOR + 0.300% 2.0976% 8/20/60 (b)(e)(g) | | 550,633 | 545,400 |
| Series 2010-H27 Class FA, 1 month U.S. LIBOR + 0.380% 2.1776% 12/20/60 (b)(e)(g) | | 282,114 | 279,729 |
| Series 2011-H05 Class FA, 1 month U.S. LIBOR + 0.500% 2.2976% 12/20/60 (b)(e)(g) | | 294,823 | 293,132 |
| Series 2011-H07 Class FA, 1 month U.S. LIBOR + 0.500% 2.2976% 2/20/61 (b)(e)(g) | | 289,226 | 287,543 |
| Series 2011-H12 Class FA, 1 month U.S. LIBOR + 0.490% 2.2876% 2/20/61 (b)(e)(g) | | 414,428 | 412,073 |
| Series 2011-H13 Class FA, 1 month U.S. LIBOR + 0.500% 2.2976% 4/20/61 (b)(e)(g) | | 250,279 | 248,758 |
| Series 2011-H14: | | | |
| Class FB, 1 month U.S. LIBOR + 0.500% 2.2976% 5/20/61 (b)(e)(g) | | 396,987 | 394,698 |
| Class FC, 1 month U.S. LIBOR + 0.500% 2.2976% 5/20/61 (b)(e)(g) | | 295,029 | 293,242 |
| Series 2011-H17 Class FA, 1 month U.S. LIBOR + 0.530% 2.3276% 6/20/61 (b)(e)(g) | | 346,434 | 344,612 |
| Series 2011-H20 Class FA, 1 month U.S. LIBOR + 0.550% 2.3476% 9/20/61 (b)(e)(g) | | 116,217 | 115,612 |
| Series 2011-H21 Class FA, 1 month U.S. LIBOR + 0.600% 2.3976% 10/20/61 (b)(e)(g) | | 381,797 | 380,179 |
| Series 2012-98 Class FA, 1 month U.S. LIBOR + 0.400% 2.7681% 8/20/42 (b)(e) | | 52,334 | 52,263 |
| Series 2012-H01 Class FA, 1 month U.S. LIBOR + 0.700% 2.4976% 11/20/61 (b)(e)(g) | | 363,814 | 362,785 |
| Series 2012-H03 Class FA, 1 month U.S. LIBOR + 0.700% 2.4976% 1/20/62 (b)(e)(g) | | 222,554 | 221,949 |
| Series 2012-H06 Class FA, 1 month U.S. LIBOR + 0.630% 2.4276% 1/20/62 (b)(e)(g) | | 328,722 | 327,412 |
| Series 2012-H07 Class FA, 1 month U.S. LIBOR + 0.630% 2.4276% 3/20/62 (b)(e)(g) | | 195,297 | 194,562 |
| Series 2012-H21 Class DF, 1 month U.S. LIBOR + 0.650% 2.4476% 5/20/61 (b)(e)(g) | | 2,856 | 2,845 |
| Series 2013-H19: | | | |
| Class FC, 1 month U.S. LIBOR + 0.600% 2.3976% 8/20/63 (b)(e)(g) | | 25,646 | 25,561 |
| Class FD, 1 month U.S. LIBOR + 0.600% 2.3976% 8/20/63 (b)(e)(g) | | 62,798 | 62,627 |
| Series 2014-H03 Class FA, 1 month U.S. LIBOR + 0.600% 2.3976% 1/20/64 (b)(e)(g) | | 30,367 | 30,247 |
| Series 2014-H05 Class FB, 1 month U.S. LIBOR + 0.600% 2.3976% 12/20/63 (b)(e)(g) | | 134,392 | 133,922 |
| Series 2014-H11 Class BA, 1 month U.S. LIBOR + 0.500% 2.2976% 6/20/64 (b)(e)(g) | | 92,484 | 91,947 |
| Series 2015-H07 Class FA, 1 month U.S. LIBOR + 0.300% 2.0976% 3/20/65 (b)(e)(g) | | 434 | 431 |
| Series 2015-H13 Class FL, 1 month U.S. LIBOR + 0.280% 2.0776% 5/20/63 (b)(e)(g) | | 7,318 | 7,215 |
| Series 2015-H19 Class FA, 1 month U.S. LIBOR + 0.200% 1.9976% 4/20/63 (b)(e)(g) | | 5,481 | 5,412 |
| Series 2016-H20 Class FM, 1 month U.S. LIBOR + 0.400% 2.1976% 12/20/62 (b)(e)(g) | | 1,998 | 1,973 |
| planned amortization class: | | | |
| Series 2010-158 Class MS, 10.000% - 1 month U.S. LIBOR 5.2637% 12/20/40 (b)(j) | | 67,918 | 61,852 |
| Series 2010-31 Class BP, 5% 3/20/40 | | 288,438 | 295,652 |
| Series 2011-136 Class WI, 4.5% 5/20/40 (i) | | 22,031 | 1,511 |
| Series 2011-68 Class EC, 3.5% 4/20/41 | | 31,398 | 30,937 |
| Series 2016-69 Class WA, 3% 2/20/46 | | 56,001 | 53,598 |
| Series 2017-134 Class BA, 2.5% 11/20/46 | | 76,430 | 72,754 |
| Series 2017-153 Class GA, 3% 9/20/47 | | 150,908 | 142,505 |
| Series 2017-182 Class KA, 3% 10/20/47 | | 116,822 | 110,499 |
| Series 2018-13 Class Q, 3% 4/20/47 | | 149,211 | 142,924 |
| sequential payer: | | | |
| Series 2004-24 Class ZM, 5% 4/20/34 | | 19,458 | 19,601 |
| Series 2010-160 Class DY, 4% 12/20/40 | | 139,481 | 136,271 |
| Series 2010-170 Class B, 4% 12/20/40 | | 31,057 | 30,356 |
| Series 2011-69 Class GX, 4.5% 5/16/40 | | 359,257 | 362,225 |
| Series 2014-H04 Class HA, 2.75% 2/20/64 (g) | | 446,017 | 437,856 |
| Series 2014-H12 Class KA, 2.75% 5/20/64 (g) | | 82,750 | 82,573 |
| Series 2017-139 Class BA, 3% 9/20/47 | | 261,278 | 249,863 |
| Series 2018-H12 Class HA, 3.25% 8/20/68 (g) | | 674,977 | 659,588 |
| Series 2004-22 Class M1, 5.5% 4/20/34 | | 79,621 | 88,841 |
| Series 2004-32 Class GS, 6.500% - 1 month U.S. LIBOR 4.1131% 5/16/34 (b)(i)(j) | | 4,065 | 396 |
| Series 2010-116 Class QB, 4% 9/16/40 | | 10,618 | 10,544 |
| Series 2010-14 Class SN, 5.950% - 1 month U.S. LIBOR 3.5631% 2/16/40 (b)(i)(j) | | 27,003 | 2,152 |
| Series 2010-169 Class Z, 4.5% 12/20/40 | | 361,917 | 343,181 |
| Series 2010-H10 Class FA, 1 month U.S. LIBOR + 0.330% 2.6297% 5/20/60 (b)(e)(g) | | 41,010 | 40,639 |
| Series 2010-H16 Class BA, 3.55% 7/20/60 (g) | | 62,029 | 60,990 |
| Series 2010-H18 Class PL, 5.01% 9/20/60 (b)(g) | | 7,706 | 7,718 |
| Series 2011-94 Class SA, 6.100% - 1 month U.S. LIBOR 3.7319% 7/20/41 (b)(i)(j) | | 12,906 | 1,383 |
| Series 2012-76 Class GS, 6.700% - 1 month U.S. LIBOR 4.3131% 6/16/42 (b)(i)(j) | | 15,085 | 1,790 |
| Series 2013-149 Class MA, 2.5% 5/20/40 | | 119,031 | 115,398 |
| Series 2013-H01 Class FA, 1.65% 1/20/63 (g) | | 154 | 150 |
| Series 2013-H04 Class BA, 1.65% 2/20/63 (g) | | 590 | 574 |
| Series 2013-H08 Class MA, 3% 3/20/63 (g) | | 3,670 | 3,491 |
| Series 2014-2 Class BA, 3% 1/20/44 | | 283,296 | 268,112 |
| Series 2014-21 Class HA, 3% 2/20/44 | | 103,292 | 98,063 |
| Series 2014-25 Class HC, 3% 2/20/44 | | 179,859 | 169,976 |
| Series 2014-5 Class A, 3% 1/20/44 | | 154,190 | 145,979 |
| Series 2015-H13 Class HA, 2.5% 8/20/64 (g) | | 1,289 | 1,232 |
| Series 2015-H30 Class HA, 1.75% 9/20/62 (b)(g) | | 38,105 | 36,680 |
| Series 2016-H13 Class FB, U.S. TREASURY 1 YEAR INDEX + 0.500% 3.35% 5/20/66 (b)(e)(g) | | 937,802 | 933,922 |
| Series 2017-186 Class HK, 3% 11/16/45 | | 150,750 | 143,358 |
| Series 2017-H06 Class FA, U.S. TREASURY 1 YEAR INDEX + 0.350% 3.2% 8/20/66 (b)(e)(g) | | 1,123,653 | 1,116,429 |
| Series 2090-118 Class XZ, 5% 12/20/39 | | 1,060,694 | 1,105,581 |
|
| TOTAL U.S. GOVERNMENT AGENCY | | | 18,842,461 |
|
| TOTAL COLLATERALIZED MORTGAGE OBLIGATIONS | | | |
| (Cost $23,509,440) | | | 23,037,947 |
|
| Commercial Mortgage Securities - 4.0% | | | |
| BAMLL Commercial Mortgage Securities Trust: | | | |
| floater Series 2022-DKLX: | | | |
| Class A, CME Term SOFR 1 Month Index + 1.150% 3.458% 1/15/39 (a)(b)(e) | | 1,005,000 | 980,651 |
| Class B, CME Term SOFR 1 Month Index + 1.550% 3.858% 1/15/39 (a)(b)(e) | | 190,000 | 184,389 |
| Class C, CME Term SOFR 1 Month Index + 2.150% 4.458% 1/15/39 (a)(b)(e) | | 136,000 | 131,143 |
| sequential payer Series 2019-BPR: | | | |
| Class AMP, 3.287% 11/5/32 (a) | | 1,500,000 | 1,399,754 |
| Class ANM, 3.112% 11/5/32 (a) | | 778,000 | 724,743 |
| Series 2019-BPR: | | | |
| Class BNM, 3.465% 11/5/32 (a) | | 132,000 | 118,391 |
| Class CNM, 3.8425% 11/5/32 (a)(b) | | 100,000 | 85,239 |
| BANK sequential payer: | | | |
| Series 2019-BN21 Class A5, 2.851% 10/17/52 | | 134,000 | 121,248 |
| Series 2021-BN35 Class A5, 2.285% 6/15/64 | | 400,000 | 338,252 |
| Series 2022-BNK43 Class A5, 4.399% 8/15/55 | | 600,000 | 601,323 |
| Benchmark Mortgage Trust: | | | |
| sequential payer Series 2018-B4 Class A5, 4.121% 7/15/51 | | 151,000 | 148,479 |
| Series 2019-B12 Class XA, 1.1787% 8/15/52 (b)(i) | | 7,834,631 | 353,764 |
| Series 2019-B14 Class XA, 0.9053% 12/15/62 (b)(i) | | 4,549,292 | 157,724 |
| BFLD Trust floater sequential payer Series 2020-OBRK Class A, 1 month U.S. LIBOR + 2.050% 4.441% 11/15/28 (a)(b)(e) | | 760,000 | 751,879 |
| BPR Trust floater Series 2022-OANA: | | | |
| Class A, CME Term SOFR 1 Month Index + 1.890% 4.2054% 4/15/37 (a)(b)(e) | | 3,387,000 | 3,336,189 |
| Class B, CME Term SOFR 1 Month Index + 2.440% 4.7544% 4/15/37 (a)(b)(e) | | 900,000 | 883,109 |
| BX Commercial Mortgage Trust floater: | | | |
| Series 2021-PAC: | | | |
| Class A, 1 month U.S. LIBOR + 0.680% 3.0811% 10/15/36 (a)(b)(e) | | 1,794,000 | 1,728,457 |
| Class B, 1 month U.S. LIBOR + 0.890% 3.2908% 10/15/36 (a)(b)(e) | | 268,000 | 253,340 |
| Class C, 1 month U.S. LIBOR + 1.090% 3.4906% 10/15/36 (a)(b)(e) | | 359,000 | 337,822 |
| Class D, 1 month U.S. LIBOR + 1.290% 3.6903% 10/15/36 (a)(b)(e) | | 349,000 | 324,989 |
| Class E, 1 month U.S. LIBOR + 1.940% 4.3395% 10/15/36 (a)(b)(e) | | 1,213,000 | 1,140,593 |
| Series 2022-LP2: | | | |
| Class A, CME Term SOFR 1 Month Index + 1.010% 3.3099% 2/15/39 (a)(b)(e) | | 2,384,055 | 2,304,798 |
| Class B, CME Term SOFR 1 Month Index + 1.310% 3.6093% 2/15/39 (a)(b)(e) | | 718,111 | 684,001 |
| Class C, CME Term SOFR 1 Month Index + 1.560% 3.8587% 2/15/39 (a)(b)(e) | | 718,111 | 677,753 |
| Class D, CME Term SOFR 1 Month Index + 1.960% 4.2578% 2/15/39 (a)(b)(e) | | 718,111 | 675,885 |
| BX Trust: | | | |
| floater: | | | |
| Series 2018-EXCL Class D, 1 month U.S. LIBOR + 2.620% 5.017% 9/15/37 (a)(b)(e) | | 201,600 | 176,567 |
| Series 2019-IMC: | | | |
| Class B, 1 month U.S. LIBOR + 1.300% 3.691% 4/15/34 (a)(b)(e) | | 614,000 | 589,440 |
| Class C, 1 month U.S. LIBOR + 1.600% 3.991% 4/15/34 (a)(b)(e) | | 406,000 | 389,760 |
| Class D, 1 month U.S. LIBOR + 1.900% 4.291% 4/15/34 (a)(b)(e) | | 426,000 | 405,765 |
| Series 2019-XL: | | | |
| Class B, 1 month U.S. LIBOR + 1.080% 3.471% 10/15/36 (a)(b)(e) | | 534,650 | 525,294 |
| Class C, 1 month U.S. LIBOR + 1.250% 3.641% 10/15/36 (a)(b)(e) | | 672,350 | 658,903 |
| Class D, 1 month U.S. LIBOR + 1.450% 3.841% 10/15/36 (a)(b)(e) | | 952,850 | 931,410 |
| Class E, 1 month U.S. LIBOR + 1.800% 4.191% 10/15/36 (a)(b)(e) | | 4,313,750 | 4,195,124 |
| Series 2022-IND: | | | |
| Class A, CME Term SOFR 1 Month Index + 1.490% 3.7877% 4/15/37 (a)(b)(e) | | 1,823,000 | 1,791,520 |
| Class B, CME Term SOFR 1 Month Index + 1.940% 4.2367% 4/15/37 (a)(b)(e) | | 929,000 | 900,438 |
| Class C, CME Term SOFR 1 Month Index + 2.290% 4.5867% 4/15/37 (a)(b)(e) | | 210,000 | 203,670 |
| Class D, CME Term SOFR 1 Month Index + 2.830% 5.1357% 4/15/37 (a)(b)(e) | | 176,000 | 169,499 |
| floater, sequential payer: | | | |
| Series 2019-IMC Class A, 1 month U.S. LIBOR + 1.000% 3.391% 4/15/34 (a)(b)(e) | | 814,000 | 794,627 |
| Series 2019-XL Class A, 1 month U.S. LIBOR + 0.920% 3.311% 10/15/36 (a)(b)(e) | | 1,124,074 | 1,110,697 |
| CF Hippolyta Issuer LLC sequential payer Series 2021-1A Class A1, 1.53% 3/15/61 (a) | | 1,875,963 | 1,657,688 |
| CGDB Commercial Mortgage Trust floater Series 2019-MOB: | | | |
| Class A, 1 month U.S. LIBOR + 0.950% 3.341% 11/15/36 (a)(b)(e) | | 580,000 | 568,400 |
| Class B, 1 month U.S. LIBOR + 1.250% 3.641% 11/15/36 (a)(b)(e) | | 200,000 | 195,500 |
| CHC Commercial Mortgage Trust floater Series 2019-CHC: | | | |
| Class A, 1 month U.S. LIBOR + 1.120% 3.511% 6/15/34 (a)(b)(e) | | 1,556,249 | 1,529,266 |
| Class B, 1 month U.S. LIBOR + 1.500% 3.891% 6/15/34 (a)(b)(e) | | 306,684 | 297,545 |
| Class C, 1 month U.S. LIBOR + 1.750% 4.141% 6/15/34 (a)(b)(e) | | 346,384 | 332,803 |
| CIM Retail Portfolio Trust floater Series 2021-RETL: | | | |
| Class C, 1 month U.S. LIBOR + 2.300% 4.692% 8/15/36 (a)(b)(e) | | 70,326 | 66,805 |
| Class D, 1 month U.S. LIBOR + 3.050% 5.442% 8/15/36 (a)(b)(e) | | 234,000 | 220,317 |
| Citigroup Commercial Mortgage Trust Series 2015-GC29 Class XA, 1.157% 4/10/48 (b)(i) | | 2,744,190 | 58,143 |
| COMM Mortgage Trust: | | | |
| sequential payer: | | | |
| Series 2013-CR7 Class AM, 3.314% 3/10/46 (a) | | 273,000 | 269,693 |
| Series 2014-CR18 Class A5, 3.828% 7/15/47 | | 257,000 | 253,144 |
| Series 2014-CR17 Class XA, 1.1127% 5/10/47 (b)(i) | | 1,390,048 | 16,265 |
| Series 2014-LC17 Class XA, 0.8174% 10/10/47 (b)(i) | | 2,260,951 | 24,825 |
| Credit Suisse Mortgage Trust: | | | |
| floater Series 2019-ICE4: | | | |
| Class B, 1 month U.S. LIBOR + 1.230% 3.621% 5/15/36 (a)(b)(e) | | 863,000 | 848,157 |
| Class C, 1 month U.S. LIBOR + 1.430% 3.821% 5/15/36 (a)(b)(e) | | 162,000 | 158,954 |
| sequential payer Series 2020-NET Class A, 2.2569% 8/15/37 (a) | | 404,258 | 375,943 |
| Series 2018-SITE: | | | |
| Class A, 4.284% 4/15/36 (a) | | 594,000 | 573,175 |
| Class B, 4.5349% 4/15/36 (a) | | 107,000 | 102,368 |
| Class C, 4.9414% 4/15/36 (a)(b) | | 123,000 | 117,094 |
| Class D, 4.9414% 4/15/36 (a)(b) | | 245,000 | 228,589 |
| CSMC Trust Series 2017-PFHP Class D, 1 month U.S. LIBOR + 2.250% 4.641% 12/15/30 (a)(b)(e) | | 1,296,000 | 1,245,126 |
| ELP Commercial Mortgage Trust floater Series 2021-ELP Class A, 1 month U.S. LIBOR + 0.700% 3.093% 11/15/38 (a)(b)(e) | | 2,537,000 | 2,446,848 |
| Extended Stay America Trust floater Series 2021-ESH: | | | |
| Class A, 1 month U.S. LIBOR + 1.080% 3.472% 7/15/38 (a)(b)(e) | | 803,058 | 786,803 |
| Class B, 1 month U.S. LIBOR + 1.380% 3.772% 7/15/38 (a)(b)(e) | | 457,186 | 444,614 |
| Class C, 1 month U.S. LIBOR + 1.700% 4.092% 7/15/38 (a)(b)(e) | | 336,926 | 326,818 |
| Class D, 1 month U.S. LIBOR + 2.250% 4.642% 7/15/38 (a)(b)(e) | | 677,828 | 656,205 |
| Freddie Mac: | | | |
| sequential payer: | | | |
| Series 2022-K144 Class A2, 2.45% 4/25/32 | | 600,000 | 535,928 |
| Series 2022-K145 Class A2, 2.58% 6/25/55 | | 300,000 | 270,925 |
| Series 2022-K146 Class A2, 2.92% 6/25/32 | | 400,000 | 372,080 |
| Series 2022-K147 Class A2, 3% 6/25/32 | | 130,000 | 121,753 |
| Series 2022-K150 Class A2, 3.71% 11/25/32 | | 400,000 | 395,874 |
| GS Mortgage Securities Trust floater: | | | |
| Series 2018-3PCK Class A, 1 month U.S. LIBOR + 1.700% 4.091% 9/15/31 (a)(b)(e) | | 1,042,665 | 1,047,151 |
| Series 2018-HART Class A, 1 month U.S. LIBOR + 1.090% 3.49% 10/15/31 (a)(b)(e) | | 457,000 | 452,621 |
| Series 2021-IP: | | | |
| Class A, 1 month U.S. LIBOR + 0.950% 3.341% 10/15/36 (a)(b)(e) | | 1,036,000 | 985,980 |
| Class B, 1 month U.S. LIBOR + 1.150% 3.541% 10/15/36 (a)(b)(e) | | 160,000 | 150,745 |
| Class C, 1 month U.S. LIBOR + 1.550% 3.941% 10/15/36 (a)(b)(e) | | 132,000 | 124,183 |
| Intown Mortgage Trust floater sequential payer Series 2022-STAY Class A, CME Term SOFR 1 Month Index + 2.480% 4.7386% 8/15/37 (a)(b)(e) | | 1,566,000 | 1,557,230 |
| JPMorgan Chase Commercial Mortgage Securities Trust Series 2018-WPT: | | | |
| Class AFX, 4.2475% 7/5/33 (a) | | 476,000 | 469,964 |
| Class CFX, 4.9498% 7/5/33 (a) | | 103,000 | 101,182 |
| Class DFX, 5.3503% 7/5/33 (a) | | 159,000 | 155,993 |
| Class EFX, 5.5422% 7/5/33 (a) | | 218,000 | 211,201 |
| Class XAFX, 1.2948% 7/5/33 (a)(b)(i) | | 2,000,000 | 13,293 |
| Life Financial Services Trust floater Series 2022-BMR2: | | | |
| Class A1, CME Term SOFR 1 Month Index + 1.290% 3.6027% 5/15/39 (a)(b)(e) | | 2,726,000 | 2,674,748 |
| Class B, CME Term SOFR 1 Month Index + 1.790% 4.1013% 5/15/39 (a)(b)(e) | | 1,630,000 | 1,594,857 |
| Class C, CME Term SOFR 1 Month Index + 2.090% 4.4005% 5/15/39 (a)(b)(e) | | 913,000 | 885,607 |
| Class D, CME Term SOFR 1 Month Index + 2.540% 4.8493% 5/15/39 (a)(b)(e) | | 812,000 | 781,549 |
| LIFE Mortgage Trust floater Series 2021-BMR: | | | |
| Class A, 1 month U.S. LIBOR + 0.700% 3.091% 3/15/38 (a)(b)(e) | | 1,375,175 | 1,331,239 |
| Class B, 1 month U.S. LIBOR + 0.880% 3.271% 3/15/38 (a)(b)(e) | | 331,261 | 319,037 |
| Class C, 1 month U.S. LIBOR + 1.100% 3.491% 3/15/38 (a)(b)(e) | | 208,390 | 200,575 |
| Class D, 1 month U.S. LIBOR + 1.400% 3.791% 3/15/38 (a)(b)(e) | | 289,976 | 277,671 |
| Class E, 1 month U.S. LIBOR + 1.750% 4.141% 3/15/38 (a)(b)(e) | | 253,606 | 240,313 |
| Morgan Stanley Capital I Trust: | | | |
| floater Series 2018-BOP: | | | |
| Class B, 1 month U.S. LIBOR + 1.250% 3.641% 8/15/33 (a)(b)(e) | | 507,190 | 501,031 |
| Class C, 1 month U.S. LIBOR + 1.500% 3.891% 8/15/33 (a)(b)(e) | | 1,221,463 | 1,202,702 |
| sequential payer Series 2019-MEAD Class A, 3.17% 11/10/36 (a) | | 1,698,000 | 1,590,475 |
| Series 2018-H4 Class A4, 4.31% 12/15/51 | | 385,000 | 377,758 |
| Series 2019-MEAD: | | | |
| Class B, 3.283% 11/10/36 (a)(b) | | 246,000 | 226,664 |
| Class C, 3.283% 11/10/36 (a)(b) | | 235,000 | 212,067 |
| Prima Capital Ltd.: | | | |
| floater Series 2021-9A Class B, 1 month U.S. LIBOR + 1.800% 4.1681% 12/15/37 (a)(b)(e) | | 444,000 | 436,772 |
| floater sequential payer Series 2021-9A Class A, 1 month U.S. LIBOR + 1.450% 3.5764% 12/15/37 (a)(b)(e) | | 88,682 | 88,682 |
| SPGN Mortgage Trust floater Series 2022-TFLM: | | | |
| Class B, CME Term SOFR 1 Month Index + 2.000% 4.3074% 2/15/39 (a)(b)(e) | | 457,000 | 437,485 |
| Class C, CME Term SOFR 1 Month Index + 2.650% 4.9574% 2/15/39 (a)(b)(e) | | 237,000 | 226,659 |
| SREIT Trust floater Series 2021-MFP: | | | |
| Class A, 1 month U.S. LIBOR + 0.730% 3.1218% 11/15/38 (a)(b)(e) | | 1,701,000 | 1,639,195 |
| Class B, 1 month U.S. LIBOR + 1.070% 3.4708% 11/15/38 (a)(b)(e) | | 974,000 | 930,169 |
| Class C, 1 month U.S. LIBOR + 1.320% 3.72% 11/15/38 (a)(b)(e) | | 605,000 | 576,262 |
| Class D, 1 month U.S. LIBOR + 1.570% 3.9692% 11/15/38 (a)(b)(e) | | 398,000 | 377,105 |
| UBS Commercial Mortgage Trust Series 2017-C7 Class XA, 1.1575% 12/15/50 (b)(i) | | 1,411,739 | 52,515 |
| UBS-Barclays Commercial Mortgage Trust floater Series 2013-C6 Class A3, 1 month U.S. LIBOR + 0.790% 3.1904% 4/10/46 (a)(b)(e) | | 717,833 | 716,464 |
| VLS Commercial Mortgage Trust: | | | |
| sequential payer Series 2020-LAB Class A, 2.13% 10/10/42 (a) | | 1,382,000 | 1,129,286 |
| Series 2020-LAB Class B, 2.453% 10/10/42 (a) | | 90,000 | 72,595 |
| Wells Fargo Commercial Mortgage Trust: | | | |
| floater Series 2021-FCMT Class A, 1 month U.S. LIBOR + 1.200% 3.591% 5/15/31 (a)(b)(e) | | 953,000 | 908,329 |
| Series 2017-C42 Class XA, 1.0144% 12/15/50 (b)(i) | | 3,608,295 | 132,489 |
| Series 2018-C46 Class XA, 1.1007% 8/15/51 (b)(i) | | 2,987,514 | 95,096 |
| Series 2018-C48 Class A5, 4.302% 1/15/52 | | 339,000 | 334,464 |
| WF-RBS Commercial Mortgage Trust: | | | |
| Series 2014-C21 Class XA, 1.1659% 8/15/47 (b)(i) | | 873,558 | 12,755 |
| Series 2014-LC14 Class XA, 1.4192% 3/15/47 (b)(i) | | 1,068,446 | 13,235 |
| TOTAL COMMERCIAL MORTGAGE SECURITIES | | | |
| (Cost $76,012,524) | | | 72,649,670 |
|
| Municipal Securities - 0.2% | | | |
| California Gen. Oblig. Series 2009, 7.35% 11/1/39 | | 90,000 | 114,964 |
| Illinois Gen. Oblig. Series 2003, 5.1% 6/1/33 | | 2,525,000 | 2,512,922 |
| New Jersey Econ. Dev. Auth. State Pension Fdg. Rev. Series 1997, 7.425% 2/15/29 (Nat'l. Pub. Fin. Guarantee Corp. Insured) | | 1,550,000 | 1,717,447 |
| TOTAL MUNICIPAL SECURITIES | | | |
| (Cost $4,515,487) | | | 4,345,333 |
|
| Foreign Government and Government Agency Obligations - 0.5% | | | |
| Argentine Republic: | | | |
| 0.5% 7/9/30 (l) | | $685,010 | $162,347 |
| 1% 7/9/29 | | 75,245 | 17,494 |
| 1.5% 7/9/35 (l) | | 1,254,989 | 281,745 |
| Dominican Republic: | | | |
| 4.5% 1/30/30 (a) | | 1,200,000 | 1,005,600 |
| 5.95% 1/25/27 (a) | | 2,850,000 | 2,781,066 |
| 6% 7/19/28 (a) | | 550,000 | 524,838 |
| Emirate of Abu Dhabi 3.875% 4/16/50 (a) | | 915,000 | 824,815 |
| Indonesian Republic 4.2% 10/15/50 | | 2,100,000 | 1,821,981 |
| Kingdom of Saudi Arabia: | | | |
| 3.25% 10/22/30 (a) | | 595,000 | 572,688 |
| 4.5% 4/22/60 (a) | | 390,000 | 362,700 |
| State of Qatar 4.4% 4/16/50 (a) | | 1,390,000 | 1,350,038 |
| TOTAL FOREIGN GOVERNMENT AND GOVERNMENT AGENCY OBLIGATIONS | | | |
| (Cost $11,176,422) | | | 9,705,312 |
|
| Supranational Obligations - 0.1% | | | |
Corporacion Andina de Fomento 2.375% 5/12/23
(Cost $1,399,262) | | 1,400,000 | 1,385,034 |
|
| Bank Notes - 0.0% | | | |
| Discover Bank 4.682% 8/9/28 (b) | | 401,000 | 387,955 |
| Regions Bank 6.45% 6/26/37 | | 250,000 | 278,192 |
| TOTAL BANK NOTES | | | |
| (Cost $697,454) | | | 666,147 |
| | | Shares | Value |
|
| Fixed-Income Funds - 18.6% | | | |
| Fidelity Emerging Markets Debt Central Fund (m) | | 5,237,128 | $39,645,062 |
| Fidelity Floating Rate Central Fund (m) | | 1,223,923 | 118,573,646 |
| Fidelity International Credit Central Fund (m) | | 613,464 | 52,040,145 |
| Fidelity Specialized High Income Central Fund (m) | | 1,523,073 | 127,572,572 |
| TOTAL FIXED-INCOME FUNDS | | | |
| (Cost $377,541,353) | | | 337,831,425 |
| | | Principal Amount | Value |
|
| Preferred Securities - 0.0% | | | |
| FINANCIALS - 0.0% | | | |
| Banks - 0.0% | | | |
Barclays Bank PLC 7.625% 11/21/22
(Cost $372,373) | | 330,000 | 338,722 |
| | | Shares | Value |
|
| Money Market Funds - 7.4% | | | |
| Fidelity Cash Central Fund 2.33% (n) | | 87,503,796 | 87,521,297 |
| Fidelity Securities Lending Cash Central Fund 2.34% (n)(o) | | 47,983,472 | 47,988,270 |
| TOTAL MONEY MARKET FUNDS | | | |
| (Cost $135,508,822) | | | 135,509,567 |
| TOTAL INVESTMENT IN SECURITIES - 109.2% | | | |
| (Cost $2,164,658,221) | | | 1,988,493,531 |
| NET OTHER ASSETS (LIABILITIES) - (9.2)% | | | (168,193,865) |
| NET ASSETS - 100% | | | $1,820,299,666 |
| TBA Sale Commitments | | |
| | Principal Amount | Value |
| Ginnie Mae | | |
| 2% 9/1/52 | $(1,300,000) | $(1,148,572) |
| 2% 9/1/52 | (500,000) | (441,758) |
| 2% 9/1/52 | (900,000) | (795,165) |
| 2% 9/1/52 | (4,500,000) | (3,975,826) |
| 2% 9/1/52 | (2,250,000) | (1,987,913) |
| 2% 9/1/52 | (1,550,000) | (1,369,451) |
| 2.5% 9/1/52 | (4,650,000) | (4,239,852) |
| 3% 9/1/52 | (1,100,000) | (1,032,396) |
| 3% 9/1/52 | (650,000) | (610,052) |
| 4% 9/1/52 | (1,000,000) | (985,249) |
|
| TOTAL GINNIE MAE | | (16,586,234) |
|
| Uniform Mortgage Backed Securities | | |
| 1.5% 9/1/37 | (1,250,000) | (1,122,780) |
| 1.5% 9/1/37 | (950,000) | (853,313) |
| 2% 9/1/37 | (1,000,000) | (921,453) |
| 2% 9/1/37 | (1,700,000) | (1,566,470) |
| 2% 9/1/37 | (850,000) | (783,235) |
| 2% 9/1/37 | (850,000) | (783,235) |
| 2% 9/1/52 | (700,000) | (602,383) |
| 2% 9/1/52 | (300,000) | (258,164) |
| 2% 9/1/52 | (350,000) | (301,192) |
| 2% 9/1/52 | (350,000) | (301,192) |
| 2% 9/1/52 | (1,300,000) | (1,118,711) |
| 2% 9/1/52 | (500,000) | (430,274) |
| 2% 9/1/52 | (700,000) | (602,383) |
| 2% 9/1/52 | (100,000) | (86,055) |
| 2% 9/1/52 | (1,300,000) | (1,118,711) |
| 2% 9/1/52 | (5,100,000) | (4,388,791) |
| 2% 9/1/52 | (3,150,000) | (2,710,724) |
| 2% 9/1/52 | (4,750,000) | (4,087,600) |
| 2.5% 9/1/37 | (600,000) | (567,375) |
| 2.5% 9/1/37 | (300,000) | (283,687) |
| 2.5% 9/1/52 | (200,000) | (178,625) |
| 2.5% 9/1/52 | (400,000) | (357,250) |
| 3% 9/1/52 | (400,000) | (370,156) |
|
| TOTAL UNIFORM MORTGAGE BACKED SECURITIES | | (23,793,759) |
|
| TOTAL TBA SALE COMMITMENTS | | |
| (Proceeds $41,001,982) | | $(40,379,993) |
| Futures Contracts | | | | | |
| | Number of contracts | Expiration Date | Notional Amount | Value | Unrealized Appreciation/(Depreciation) |
| Purchased | | | | | |
| Treasury Contracts | | | | | |
| CBOT 2-Year U.S. Treasury Note Contracts (United States) | 7 | Dec. 2022 | $1,458,297 | $(4,920) | $(4,920) |
| Sold | | | | | |
| Treasury Contracts | | | | | |
| CBOT 10-Year U.S. Treasury Note Contracts (United States) | 82 | Dec. 2022 | 9,586,313 | 162,772 | 162,772 |
| CBOT 5-Year U.S. Treasury Note Contracts (United States) | 45 | Dec. 2022 | 4,986,914 | 45,382 | 45,382 |
| CBOT Long Term U.S. Treasury Bond Contracts (United States) | 70 | Dec. 2022 | 9,509,063 | 269,883 | 269,883 |
| TOTAL SOLD | | | | | 478,037 |
| TOTAL FUTURES CONTRACTS | | | | | $473,117 |
The notional amount of futures purchased as a percentage of Net Assets is 0.1%
The notional amount of futures sold as a percentage of Net Assets is 1.3
Swaps
| Underlying Reference | Maturity Date | Clearinghouse / Counterparty | Fixed Payment Received/(Paid) | Payment Frequency | Notional Amount | Value | Upfront Premium Received/(Paid) | Unrealized Appreciation/(Depreciation) |
| Credit Default Swaps | | | | | | | | |
| Buy Protection | | | | | | | | |
| CMBX N.A. AAA Index Series 12 | Aug. 2061 | Citigroup Global Markets Ltd. | (0.5%) | Monthly | $2,370,000 | $14,985 | $(31) | $14,954 |
| CMBX N.A. AAA Index Series 13 | Dec. 2072 | Citigroup Global Markets Ltd. | (0.5%) | Monthly | 300,000 | 3,584 | 1,722 | 5,306 |
| CMBX N.A. AAA Index Series 13 | Dec. 2072 | Citigroup Global Markets Ltd. | (0.5%) | Monthly | 310,000 | 3,704 | (1,059) | 2,645 |
| CMBX N.A. AAA Index Series 13 | Dec. 2072 | Citigroup Global Markets Ltd. | (0.5%) | Monthly | 560,000 | 6,691 | (1,723) | 4,968 |
| CMBX N.A. AAA Index Series 13 | Dec. 2072 | Citigroup Global Markets Ltd. | (0.5%) | Monthly | 100,000 | 1,195 | (1,480) | (285) |
| CMBX N.A. AAA Index Series 13 | Dec. 2072 | Citigroup Global Markets Ltd. | (0.5%) | Monthly | 340,000 | 4,062 | (3,783) | 279 |
| CMBX N.A. AAA Index Series 13 | Dec. 2072 | Goldman Sachs & Co. LLC | (0.5%) | Monthly | 10,000 | 119 | 27 | 146 |
| CMBX N.A. AAA Index Series 13 | Dec. 2072 | Goldman Sachs & Co. LLC | (0.5%) | Monthly | 510,000 | 6,093 | (6,109) | (16) |
| CMBX N.A. AAA Index Series 13 | Dec. 2072 | JPMorgan Securities LLC | (0.5%) | Monthly | 170,000 | 2,031 | (210) | 1,821 |
| CMBX N.A. AAA Index Series 13 | Dec. 2072 | Morgan Stanley Capital Services LLC | (0.5%) | Monthly | 80,000 | 956 | 431 | 1,387 |
| CMBX N.A. AAA Index Series 13 | Dec. 2072 | Morgan Stanley Capital Services LLC | (0.5%) | Monthly | 270,000 | 3,226 | (1,463) | 1,763 |
| CMBX N.A. AAA Index Series 13 | Dec. 2072 | Morgan Stanley Capital Services LLC | (0.5%) | Monthly | 170,000 | 2,031 | (2,383) | (352) |
| CMBX N.A. AAA Index Series 13 | Dec. 2072 | Morgan Stanley Capital Services LLC | (0.5%) | Monthly | 400,000 | 4,779 | (2,763) | 2,016 |
| CMBX N.A. AAA Index Series 13 | Dec. 2072 | Morgan Stanley Capital Services LLC | (0.5%) | Monthly | 350,000 | 4,182 | (2,516) | 1,666 |
| CMBX N.A. AAA Index Series 13 | Dec. 2072 | Morgan Stanley Capital Services LLC | (0.5%) | Monthly | 340,000 | 4,062 | (3,241) | 821 |
|
| TOTAL CREDIT DEFAULT SWAPS | | | | | | $61,700 | $(24,581) | $37,119 |
|
Swaps
| Payment Received | Payment Frequency | Payment Paid | Payment Frequency | Clearinghouse / Counterparty(1) | Maturity Date | Notional Amount | Value | Upfront Premium Received/(Paid)(2) | Unrealized Appreciation/(Depreciation) |
| Interest Rate Swaps | | | | | | | | | |
| 2.75% | Annual | U.S. Secured Overnight Fin. Rate (SOFR) Index(3) | Annual | LCH | Sep. 2024 | $6,229,000 | $(61,656) | $0 | $(61,656) |
| 2.75% | Annual | U.S. Secured Overnight Fin. Rate (SOFR) Index(3) | Annual | LCH | Sep. 2027 | 936,000 | (10,848) | 0 | (10,848) |
| 2.75% | Annual | U.S. Secured Overnight Fin. Rate (SOFR) Index(3) | Annual | LCH | Sep. 2029 | 340,000 | (7,398) | 0 | (7,398) |
|
| TOTAL INTEREST RATE SWAPS | | | | | | | $(79,902) | $0 | $(79,902) |
|
(1) Swaps with LCH Clearnet Group (LCH) are centrally cleared over-the-counter (OTC) swaps.
(2) Any premiums for centrally cleared over-the-counter (OTC) swaps are recorded periodically throughout the term of the swap to variation margin and included in unrealized appreciation (depreciation).
(3) Represents floating rate.
Legend
(a) Security exempt from registration under Rule 144A of the Securities Act of 1933. These securities may be resold in transactions exempt from registration, normally to qualified institutional buyers. At the end of the period, the value of these securities amounted to $267,316,423 or 14.7% of net assets.
(b) Coupon rates for floating and adjustable rate securities reflect the rates in effect at period end.
(c) Security or a portion of the security is on loan at period end.
(d) Security or a portion of the security has been segregated as collateral for mortgage-backed or asset-backed securities purchased on a delayed delivery or when-issued basis. At period end, the value of securities pledged amounted to $1,410,014.
(e) Coupon is indexed to a floating interest rate which may be multiplied by a specified factor and/or subject to caps or floors.
(f) Security or a portion of the security purchased on a delayed delivery or when-issued basis.
(g) Represents an investment in an underlying pool of reverse mortgages which typically do not require regular principal and interest payments as repayment is deferred until a maturity event.
(h) Level 3 security
(i) Interest Only (IO) security represents the right to receive only monthly interest payments on an underlying pool of mortgages or assets. Principal shown is the outstanding par amount of the pool as of the end of the period.
(j) Coupon is inversely indexed to a floating interest rate multiplied by a specified factor. The price may be considerably more volatile than the price of a comparable fixed rate security.
(k) Principal Only Strips represent the right to receive the monthly principal payments on an underlying pool of mortgage loans.
(l) Security initially issued at one coupon which converts to a higher coupon at a specified date. The rate shown is the rate at period end.
(m) Affiliated fund that is generally available only to investment companies and other accounts managed by Fidelity Investments. A complete unaudited schedule of portfolio holdings for each Fidelity Central Fund is filed with the SEC for the first and third quarters of each fiscal year on Form N-PORT and is available upon request or at the SEC's website at www.sec.gov. An unaudited holdings listing for the Fund, which presents direct holdings as well as the pro-rata share of securities and other investments held indirectly through its investment in underlying non-money market Fidelity Central Funds, is available at fidelity.com and/or institutional.fidelity.com, as applicable. In addition, each Fidelity Central Fund's financial statements, which are not covered by the Fund's Report of Independent Registered Public Accounting Firm, are available on the SEC's website or upon request.
(n) Affiliated fund that is generally available only to investment companies and other accounts managed by Fidelity Investments. The rate quoted is the annualized seven-day yield of the fund at period end. A complete unaudited listing of the fund's holdings as of its most recent quarter end is available upon request. In addition, each Fidelity Central Fund's financial statements, which are not covered by the Fund's Report of Independent Registered Public Accounting Firm, are available on the SEC's website or upon request.
(o) Investment made with cash collateral received from securities on loan.
Affiliated Central Funds
Fiscal year to date information regarding the Fund's investments in Fidelity Central Funds, including the ownership percentage, is presented below.
| Fund | Value, beginning of period | Purchases | Sales Proceeds(a) | Dividend Income | Realized Gain/Loss | Change in Unrealized appreciation (depreciation) | Value, end of period | % ownership, end of period |
| Fidelity Cash Central Fund 2.33% | $51,429,217 | $992,209,320 | $956,117,240 | $456,936 | $-- | $-- | $87,521,297 | 0.2% |
| Fidelity Emerging Markets Debt Central Fund | 46,303,339 | 2,010,070 | -- | 2,010,090 | -- | (8,668,347) | 39,645,062 | 1.7% |
| Fidelity Floating Rate Central Fund | 107,325,493 | 15,134,312 | -- | 5,134,312 | -- | (3,886,159) | 118,573,646 | 4.3% |
| Fidelity International Credit Central Fund | -- | 61,068,407 | -- | 1,348,157 | -- | (9,028,262) | 52,040,145 | 11.4% |
| Fidelity Mortgage Backed Securities Central Fund | 182,301,525 | 3,102,558 | 168,866,136 | 3,318,541 | (9,327,066) | (7,210,881) | -- | 0.0% |
| Fidelity Securities Lending Cash Central Fund 2.34% | 58,854,720 | 745,240,326 | 756,106,776 | 55,115 | -- | -- | 47,988,270 | 0.1% |
| Fidelity Specialized High Income Central Fund | 127,541,730 | 23,708,259 | -- | 10,208,203 | -- | (23,677,417) | 127,572,572 | 38.3% |
| Total | $573,756,024 | $1,842,473,252 | $1,881,090,152 | $22,531,354 | $(9,327,066) | $(52,471,066) | $473,340,992 | |
(a) Includes the value of shares redeemed through in-kind transactions, if applicable.
Amounts in the income column in the above table include any capital gain distributions from underlying funds, which are presented in the corresponding line-item in the Statement of Operations, if applicable. Amount for Fidelity Securities Lending Cash Central Fund represents the income earned on investing cash collateral, less rebates paid to borrowers and any lending agent fees associated with the loan, plus any premium payments received for lending certain types of securities.
Investment Valuation
The following is a summary of the inputs used, as of August 31, 2022, involving the Fund's assets and liabilities carried at fair value. The inputs or methodology used for valuing securities may not be an indication of the risk associated with investing in those securities. For more information on valuation inputs, and their aggregation into the levels used below, please refer to the Investment Valuation section in the accompanying Notes to Financial Statements.
| | Valuation Inputs at Reporting Date: |
| Description | Total | Level 1 | Level 2 | Level 3 |
| Investments in Securities: | | | | |
| Corporate Bonds | $514,107,836 | $-- | $514,107,836 | $-- |
| U.S. Government and Government Agency Obligations | 539,063,645 | -- | 539,063,645 | -- |
| U.S. Government Agency - Mortgage Securities | 246,836,043 | -- | 246,836,043 | -- |
| Asset-Backed Securities | 103,016,850 | -- | 102,911,122 | 105,728 |
| Collateralized Mortgage Obligations | 23,037,947 | -- | 23,037,947 | -- |
| Commercial Mortgage Securities | 72,649,670 | -- | 72,649,670 | -- |
| Municipal Securities | 4,345,333 | -- | 4,345,333 | -- |
| Foreign Government and Government Agency Obligations | 9,705,312 | -- | 9,705,312 | -- |
| Supranational Obligations | 1,385,034 | -- | 1,385,034 | -- |
| Bank Notes | 666,147 | -- | 666,147 | -- |
| Fixed-Income Funds | 337,831,425 | 337,831,425 | -- | -- |
| Preferred Securities | 338,722 | -- | 338,722 | -- |
| Money Market Funds | 135,509,567 | 135,509,567 | -- | -- |
| Total Investments in Securities: | $1,988,493,531 | $473,340,992 | $1,515,046,811 | $105,728 |
| Derivative Instruments: | | | | |
| Assets | | | | |
| Futures Contracts | $478,037 | $478,037 | $-- | $-- |
| Swaps | 61,700 | -- | 61,700 | -- |
| Total Assets | $539,737 | $478,037 | $61,700 | $-- |
| Liabilities | | | | |
| Futures Contracts | $(4,920) | $(4,920) | $-- | $-- |
| Swaps | (79,902) | -- | (79,902) | -- |
| Total Liabilities | $(84,822) | $(4,920) | $(79,902) | $-- |
| Total Derivative Instruments: | $454,915 | $473,117 | $(18,202) | $-- |
| Other Financial Instruments: | | | | |
| TBA Sale Commitments | $(40,379,993) | $-- | $(40,379,993) | $-- |
| Total Other Financial Instruments: | $(40,379,993) | $-- | $(40,379,993) | $-- |
Value of Derivative Instruments
The following table is a summary of the Fund's value of derivative instruments by primary risk exposure as of August 31, 2022. For additional information on derivative instruments, please refer to the Derivative Instruments section in the accompanying Notes to Financial Statements.
| Primary Risk Exposure / Derivative Type | Value |
| | Asset | Liability |
| Credit Risk | | |
| Swaps(a) | $61,700 | $0 |
| Total Credit Risk | 61,700 | 0 |
| Interest Rate Risk | | |
| Futures Contracts(b) | 478,037 | (4,920) |
| Swaps(c) | 0 | (79,902) |
| Total Interest Rate Risk | 478,037 | (84,822) |
| Total Value of Derivatives | $539,737 | $(84,822) |
(a) For bi-lateral over-the-counter (OTC) swaps, reflects gross value which is presented in the Statement of Assets and Liabilities in the bi-lateral OTC swaps, at value line-items.
(b) Reflects gross cumulative appreciation (depreciation) on futures contracts as presented in the Schedule of Investments. In the Statement of Assets and Liabilities, the period end daily variation margin is included in receivable or payable for daily variation margin on futures contracts, and the net cumulative appreciation (depreciation) is included in Total accumulated earnings (loss).
(c) For centrally cleared over-the-counter (OTC) swaps, reflects gross cumulative appreciation (depreciation) as presented in the Schedule of Investments. In the Statement of Assets and Liabilities, the period end daily variation margin for centrally cleared OTC swaps is included in receivable or payable for daily variation margin on centrally cleared OTC swaps, and the net cumulative appreciation (depreciation) for centrally cleared OTC swaps is included in Total accumulated earnings (loss).
See accompanying notes which are an integral part of the financial statements.
Financial Statements
Statement of Assets and Liabilities
| | | August 31, 2022 |
| Assets | | |
Investment in securities, at value (including securities loaned of $46,897,628) — See accompanying schedule:
Unaffiliated issuers (cost $1,651,608,046) | $1,515,152,539 | |
| Fidelity Central Funds (cost $513,050,175) | 473,340,992 | |
| Total Investment in Securities (cost $2,164,658,221) | | $1,988,493,531 |
| Segregated cash with brokers for derivative instruments | | 594,111 |
| Cash | | 94,368 |
| Receivable for investments sold | | 28,736 |
| Receivable for TBA sale commitments | | 41,001,982 |
| Receivable for fund shares sold | | 4,054,065 |
| Interest receivable | | 9,792,892 |
| Distributions receivable from Fidelity Central Funds | | 185,133 |
| Receivable for daily variation margin on futures contracts | | 34,651 |
| Receivable for daily variation margin on centrally cleared OTC swaps | | 3,933 |
| Bi-lateral OTC swaps, at value | | 61,700 |
| Total assets | | 2,044,345,102 |
| Liabilities | | |
| Payable for investments purchased | | |
| Regular delivery | $1,180,227 | |
| Delayed delivery | 133,002,964 | |
| TBA sale commitments, at value | 40,379,993 | |
| Payable for fund shares redeemed | 1,019,741 | |
| Accrued management fee | 467,197 | |
| Other payables and accrued expenses | 7,044 | |
| Collateral on securities loaned | 47,988,270 | |
| Total liabilities | | 224,045,436 |
| Net Assets | | $1,820,299,666 |
| Net Assets consist of: | | |
| Paid in capital | | $2,022,089,056 |
| Total accumulated earnings (loss) | | (201,789,390) |
| Net Assets | | $1,820,299,666 |
| Net Asset Value, offering price and redemption price per share ($1,820,299,666 ÷ 201,643,897 shares) | | $9.03 |
See accompanying notes which are an integral part of the financial statements.
Statement of Operations
| | | Year ended August 31, 2022 |
| Investment Income | | |
| Dividends | | $25,163 |
| Interest | | 37,070,227 |
| Income from Fidelity Central Funds (including $55,115 from security lending) | | 16,465,806 |
| Total income | | 53,561,196 |
| Expenses | | |
| Management fee | $5,646,320 | |
| Independent trustees' fees and expenses | 6,101 | |
| Total expenses before reductions | 5,652,421 | |
| Expense reductions | (345) | |
| Total expenses after reductions | | 5,652,076 |
| Net investment income (loss) | | 47,909,120 |
| Realized and Unrealized Gain (Loss) | | |
| Net realized gain (loss) on: | | |
| Investment securities: | | |
| Unaffiliated issuers | (14,765,430) | |
| Fidelity Central Funds | (9,327,066) | |
| Futures contracts | 639,045 | |
| Swaps | (289,247) | |
| Written options | 942 | |
| Capital gain distributions from Fidelity Central Funds | 6,065,548 | |
| Total net realized gain (loss) | | (17,676,208) |
| Change in net unrealized appreciation (depreciation) on: | | |
| Investment securities: | | |
| Unaffiliated issuers | (202,159,573) | |
| Fidelity Central Funds | (52,471,066) | |
| Futures contracts | 474,975 | |
| Swaps | 9,815 | |
| Written options | (1,566) | |
| TBA sale commitments | 656,365 | |
| Total change in net unrealized appreciation (depreciation) | | (253,491,050) |
| Net gain (loss) | | (271,167,258) |
| Net increase (decrease) in net assets resulting from operations | | $(223,258,138) |
See accompanying notes which are an integral part of the financial statements.
Statement of Changes in Net Assets
| | Year ended August 31, 2022 | Year ended August 31, 2021 |
| Increase (Decrease) in Net Assets | | |
| Operations | | |
| Net investment income (loss) | $47,909,120 | $41,222,277 |
| Net realized gain (loss) | (17,676,208) | (396,365) |
| Change in net unrealized appreciation (depreciation) | (253,491,050) | 3,932,120 |
| Net increase (decrease) in net assets resulting from operations | (223,258,138) | 44,758,032 |
| Distributions to shareholders | (54,048,620) | (100,526,521) |
| Share transactions | | |
| Proceeds from sales of shares | 940,705,508 | 878,123,657 |
| Reinvestment of distributions | 54,048,457 | 100,512,120 |
| Cost of shares redeemed | (730,224,884) | (737,399,962) |
| Net increase (decrease) in net assets resulting from share transactions | 264,529,081 | 241,235,815 |
| Total increase (decrease) in net assets | (12,777,677) | 185,467,326 |
| Net Assets | | |
| Beginning of period | 1,833,077,343 | 1,647,610,017 |
| End of period | $1,820,299,666 | $1,833,077,343 |
| Other Information | | |
| Shares | | |
| Sold | 96,159,686 | 84,256,567 |
| Issued in reinvestment of distributions | 5,546,683 | 9,643,812 |
| Redeemed | (75,535,111) | (70,690,814) |
| Net increase (decrease) | 26,171,258 | 23,209,565 |
See accompanying notes which are an integral part of the financial statements.
Financial Highlights
Fidelity Total Bond K6 Fund
| | | | | | |
| Years ended August 31, | 2022 | 2021 | 2020 | 2019 | 2018 |
| Selected Per–Share Data | | | | | |
| Net asset value, beginning of period | $10.45 | $10.82 | $10.34 | $9.73 | $10.07 |
| Income from Investment Operations | | | | | |
| Net investment income (loss)A,B | .248 | .247 | .293 | .315 | .280 |
| Net realized and unrealized gain (loss) | (1.388) | .013 | .494 | .610 | (.347) |
| Total from investment operations | (1.140) | .260 | .787 | .925 | (.067) |
| Distributions from net investment income | (.244) | (.240) | (.287) | (.315) | (.261) |
| Distributions from net realized gain | (.036) | (.390) | (.020) | – | (.012) |
| Total distributions | (.280) | (.630) | (.307) | (.315) | (.273) |
| Net asset value, end of period | $9.03 | $10.45 | $10.82 | $10.34 | $9.73 |
| Total ReturnC | (11.07)% | 2.53% | 7.77% | 9.72% | (.66)% |
| Ratios to Average Net AssetsB,D,E | | | | | |
| Expenses before reductions | .30% | .30% | .30% | .30% | .30% |
| Expenses net of fee waivers, if any | .30% | .30% | .30% | .30% | .30% |
| Expenses net of all reductions | .30% | .30% | .30% | .30% | .30% |
| Net investment income (loss) | 2.55% | 2.37% | 2.82% | 3.20% | 2.87% |
| Supplemental Data | | | | | |
| Net assets, end of period (000 omitted) | $1,820,300 | $1,833,077 | $1,647,610 | $1,344,694 | $913,155 |
| Portfolio turnover rateF | 108% | 137% | 167% | 83% | 44% |
A Calculated based on average shares outstanding during the period.
B Net investment income (loss) is affected by the timing of the declaration of dividends by any underlying mutual funds or exchange-traded funds (ETFs). Net investment income (loss) of any such underlying funds is not included in the Fund's net investment income (loss) ratio.
C Total returns would have been lower if certain expenses had not been reduced during the applicable periods shown.
D Fees and expenses of any underlying mutual funds or exchange-traded funds (ETFs) are not included in the Fund's expense ratio. The Fund indirectly bears its proportionate share of these expenses. For additional expense information related to investments in Fidelity Central Funds, please refer to the "Investments in Fidelity Central Funds" note found in the Notes to Financial Statements section of the most recent Annual or Semi-Annual report.
E Expense ratios reflect operating expenses of the class. Expenses before reductions do not reflect amounts reimbursed, waived, or reduced through arrangements with the investment adviser, brokerage services, or other offset arrangements, if applicable, and do not represent the amount paid by the class during periods when reimbursements, waivers or reductions occur.
F Amount does not include the portfolio activity of any underlying mutual funds or exchange-traded funds (ETFs).
See accompanying notes which are an integral part of the financial statements.
Notes to Financial Statements
For the period ended August 31, 2022
1. Organization.
Fidelity Total Bond K6 Fund (the Fund) is a fund of Fidelity Income Fund (the Trust) and is authorized to issue an unlimited number of shares. Share transactions on the Statement of Changes in Net Assets may contain exchanges between affiliated funds. The Trust is registered under the Investment Company Act of 1940, as amended (the 1940 Act), as an open-end management investment company organized as a Massachusetts business trust. Shares generally are available only to employer-sponsored retirement plans that are recordkept by Fidelity, or to certain employer-sponsored retirement plans that are not recordkept by Fidelity.
2. Investments in Fidelity Central Funds.
Funds may invest in Fidelity Central Funds, which are open-end investment companies generally available only to other investment companies and accounts managed by the investment adviser and its affiliates. The Schedule of Investments lists any Fidelity Central Funds held as an investment as of period end, but does not include the underlying holdings of each Fidelity Central Fund. An investing fund indirectly bears its proportionate share of the expenses of the underlying Fidelity Central Funds.
Based on its investment objective, each Fidelity Central Fund may invest or participate in various investment vehicles or strategies that are similar to those of the investing fund. These strategies are consistent with the investment objectives of the investing fund and may involve certain economic risks which may cause a decline in value of each of the Fidelity Central Funds and thus a decline in the value of the investing fund.
| Fidelity Central Fund | Investment Manager | Investment Objective | Investment Practices | Expense Ratio(a) |
| Fidelity Emerging Markets Debt Central Fund | Fidelity Management & Research Company LLC (FMR) | Seeks high total return by normally investing in debt securities of issuers in emerging markets and other debt investments that are tied economically to emerging markets. | Foreign Securities
Restricted Securities
| Less than .005% |
| Fidelity Floating Rate Central Fund | Fidelity Management & Research Company LLC (FMR) | Seeks a high level of income by normally investing in floating rate loans and other floating rate securities. | Foreign Securities
Loans & Direct Debt Instruments
Restricted Securities | Less than .005% |
| Fidelity Specialized High Income Central Fund | Fidelity Management & Research Company LLC (FMR) | Seeks a high level of current income by normally investing in income-producing debt securities, with an emphasis on lower-quality debt securities. | Loans & Direct Debt Instruments
Restricted Securities
| Less than .005% |
| Fidelity International Credit Central Fund | Fidelity Management & Research Company LLC (FMR) | Seeks a high level of current income by normally investing in debt securities of foreign issuers, including debt securities of issuers located in emerging markets. Foreign currency exposure is hedged utilizing foreign currency contracts. | Foreign Securities
Futures
Options
Restricted Securities
Swaps | Less than .005% |
| Fidelity Money Market Central Funds | Fidelity Management & Research Company LLC (FMR) | Each fund seeks to obtain a high level of current income consistent with the preservation of capital and liquidity. | Short-term Investments | Less than .005% |
(a) Expenses expressed as a percentage of average net assets and are as of each underlying Central Fund's most recent annual or semi-annual shareholder report.
An unaudited holdings listing for the investing fund, which presents direct holdings as well as the pro-rata share of any securities and other investments held indirectly through its investment in underlying non-money market Fidelity Central Funds, is available at fidelity.com and/or institutional.fidelity.com, as applicable. A complete unaudited list of holdings for each Fidelity Central Fund is available upon request or at the Securities and Exchange Commission website at www.sec.gov. In addition, the financial statements of the Fidelity Central Funds which contain the significant accounting policies (including investment valuation policies) of those funds, and are not covered by the Report of Independent Registered Public Accounting Firm, are available on the Securities and Exchange Commission website or upon request.
3. Significant Accounting Policies.
The Fund is an investment company and applies the accounting and reporting guidance of the Financial Accounting Standards Board (FASB) Accounting Standards Codification Topic 946 Financial Services - Investment Companies. The financial statements have been prepared in conformity with accounting principles generally accepted in the United States of America (GAAP), which require management to make certain estimates and assumptions at the date of the financial statements. Actual results could differ from those estimates. Subsequent events, if any, through the date that the financial statements were issued have been evaluated in the preparation of the financial statements. The Fund's Schedule of Investments lists any underlying mutual funds or exchange-traded funds (ETFs) but does not include the underlying holdings of these funds. The following summarizes the significant accounting policies of the Fund:
Investment Valuation. Investments are valued as of 4:00 p.m. Eastern time on the last calendar day of the period. The Board of Trustees (the Board) has delegated the day to day responsibility for the valuation of the Fund's investments to the Fair Value Committee (the Committee) established by the Fund's investment adviser. In accordance with valuation policies and procedures approved by the Board, the Fund attempts to obtain prices from one or more third party pricing vendors or brokers to value its investments. When current market prices, quotations or currency exchange rates are not readily available or reliable, investments will be fair valued in good faith by the Committee, in accordance with procedures adopted by the Board. Factors used in determining fair value vary by investment type and may include market or investment specific events, changes in interest rates and credit quality. The frequency with which these procedures are used cannot be predicted and they may be utilized to a significant extent. The Committee oversees the Fund's valuation policies and procedures and reports to the Board on the Committee's activities and fair value determinations. The Board monitors the appropriateness of the procedures used in valuing the Fund's investments and ratifies the fair value determinations of the Committee.
The Fund categorizes the inputs to valuation techniques used to value its investments into a disclosure hierarchy consisting of three levels as shown below:
- Level 1 – unadjusted quoted prices in active markets for identical investments
- Level 2 – other significant observable inputs (including quoted prices for similar investments, interest rates, prepayment speeds, etc.)
- Level 3 – unobservable inputs (including the Fund's own assumptions based on the best information available)
Valuation techniques used to value the Fund's investments by major category are as follows:
Debt securities, including restricted securities, are valued based on evaluated prices received from third party pricing vendors or from brokers who make markets in such securities. Corporate bonds, bank notes, foreign government and government agency obligations, municipal securities, preferred securities, supranational obligations and U.S. government and government agency obligations are valued by pricing vendors who utilize matrix pricing which considers yield or price of bonds of comparable quality, coupon, maturity and type or by broker-supplied prices. Asset backed securities, collateralized mortgage obligations, commercial mortgage securities and U.S. government agency mortgage securities are valued by pricing vendors who utilize matrix pricing which considers prepayment speed assumptions, attributes of the collateral, yield or price of bonds of comparable quality, coupon, maturity and type or by broker-supplied prices. Swaps are marked-to-market daily based on valuations from third party pricing vendors, registered derivatives clearing organizations (clearinghouses) or broker-supplied valuations. These pricing sources may utilize inputs such as interest rate curves, credit spread curves, default possibilities and recovery rates. When independent prices are unavailable or unreliable, debt securities and swaps may be valued utilizing pricing methodologies which consider similar factors that would be used by third party pricing vendors. Debt securities and swaps are generally categorized as Level 2 in the hierarchy but may be Level 3 depending on the circumstances.
Futures contracts are valued at the settlement price established each day by the board of trade or exchange on which they are traded and are categorized as Level 1 in the hierarchy. Investments in open-end mutual funds, including the Fidelity Central Funds, are valued at their closing net asset value (NAV) each business day and are categorized as Level 1 in the hierarchy.
Changes in valuation techniques may result in transfers in or out of an assigned level within the disclosure hierarchy. The aggregate value of investments by input level as of August 31, 2022 is included at the end of the Fund's Schedule of Investments.
Investment Transactions and Income. For financial reporting purposes, the Fund's investment holdings and NAV include trades executed through the end of the last business day of the period. The NAV per share for processing shareholder transactions is calculated as of the close of business of the New York Stock Exchange (NYSE), normally 4:00 p.m. Eastern time and includes trades executed through the end of the prior business day. Gains and losses on securities sold are determined on the basis of identified cost. Commissions paid to certain brokers with whom the investment adviser, or its affiliates, places trades on behalf of a fund include an amount in addition to trade execution, which may be rebated back to a fund. Any such rebates are included in net realized gain (loss) on investments in the Statement of Operations. Dividend income is recorded on the ex-dividend date. Income and capital gain distributions from Fidelity Central Funds, if any, are recorded on the ex-dividend date. Interest income is accrued as earned and includes coupon interest and amortization of premium and accretion of discount on debt securities as applicable. Debt obligations may be placed on non-accrual status and related interest income may be reduced by ceasing current accruals and writing off interest receivables when the collection of all or a portion of interest has become doubtful based on consistently applied procedures. A debt obligation is removed from non-accrual status when the issuer resumes interest payments or when collectability of interest is reasonably assured.
Expenses. Expenses directly attributable to a fund are charged to that fund. Expenses attributable to more than one fund are allocated among the respective funds on the basis of relative net assets or other appropriate methods. Expenses included in the accompanying financial statements reflect the expenses of that fund and do not include any expenses associated with any underlying mutual funds or exchange-traded funds. Although not included in a fund's expenses, a fund indirectly bears its proportionate share of these expenses through the net asset value of each underlying mutual fund or exchange-traded fund. Expense estimates are accrued in the period to which they relate and adjustments are made when actual amounts are known.
Income Tax Information and Distributions to Shareholders. Each year, the Fund intends to qualify as a regulated investment company under Subchapter M of the Internal Revenue Code, including distributing substantially all of its taxable income and realized gains. As a result, no provision for U.S. Federal income taxes is required. As of August 31, 2022, the Fund did not have any unrecognized tax benefits in the financial statements; nor is the Fund aware of any tax positions for which it is reasonably possible that the total amounts of unrecognized tax benefits will significantly change in the next twelve months. The Fund files a U.S. federal tax return, in addition to state and local tax returns as required. The Fund's federal income tax returns are subject to examination by the Internal Revenue Service (IRS) for a period of three fiscal years after they are filed. State and local tax returns may be subject to examination for an additional fiscal year depending on the jurisdiction.
Distributions are declared and recorded daily and paid monthly from net investment income. Distributions from realized gains, if any, are declared and recorded on the ex-dividend date. Income and capital gain distributions are determined in accordance with income tax regulations, which may differ from GAAP.
Capital accounts within the financial statements are adjusted for permanent book-tax differences. These adjustments have no impact on net assets or the results of operations. Capital accounts are not adjusted for temporary book-tax differences which will reverse in a subsequent period.
Book-tax differences are primarily due to the short-term gain distributions from the underlying mutual funds or exchange-traded funds (ETFs), futures contracts, swaps, market discount and losses deferred due to wash sales, futures contracts and excise tax regulations.
As of period end, the cost and unrealized appreciation (depreciation) in securities, and derivatives if applicable, for federal income tax purposes were as follows:
| Gross unrealized appreciation | $3,570,241 |
| Gross unrealized depreciation | (179,182,614) |
| Net unrealized appreciation (depreciation) | $(175,612,373) |
| Tax Cost | $2,164,709,690 |
The tax-based components of distributable earnings as of period end were as follows:
| Undistributed ordinary income | $1,254,987 |
| Net unrealized appreciation (depreciation) on securities and other investments | $(175,612,373) |
The Fund intends to elect to defer to its next fiscal year $27,432,004 of capital losses recognized during the period November 1, 2021 to August 31, 2022.
The tax character of distributions paid was as follows:
| | August 31, 2022 | August 31, 2021 |
| Ordinary Income | $48,594,184 | $ 69,020,151 |
| Long-term Capital Gains | 5,454,436 | 31,506,370 |
| Total | $54,048,620 | $ 100,526,521 |
Delayed Delivery Transactions and When-Issued Securities. During the period, certain Funds transacted in securities on a delayed delivery or when-issued basis. Payment and delivery may take place after the customary settlement period for that security. The price of the underlying securities and the date when the securities will be delivered and paid for are fixed at the time the transaction is negotiated. Securities purchased on a delayed delivery or when-issued basis are identified as such in the Schedule of Investments. Compensation for interest forgone in the purchase of a delayed delivery or when-issued debt security may be received. With respect to purchase commitments, each applicable Fund identifies securities as segregated in its records with a value at least equal to the amount of the commitment. Payables and receivables associated with the purchases and sales of delayed delivery securities having the same coupon, settlement date and broker are offset. Delayed delivery or when-issued securities that have been purchased from and sold to different brokers are reflected as both payables and receivables in the Statement of Assets and Liabilities under the caption "Delayed delivery", as applicable. Losses may arise due to changes in the value of the underlying securities or if the counterparty does not perform under the contract's terms, or if the issuer does not issue the securities due to political, economic, or other factors.
To-Be-Announced (TBA) Securities and Mortgage Dollar Rolls. TBA securities involve buying or selling mortgage-backed securities (MBS) on a forward commitment basis. A TBA transaction typically does not designate the actual security to be delivered and only includes an approximate principal amount; however delivered securities must meet specified terms defined by industry guidelines, including issuer, rate and current principal amount outstanding on underlying mortgage pools. Funds may enter into a TBA transaction with the intent to take possession of or deliver the underlying MBS, or a fund may elect to extend the settlement by entering into either a mortgage or reverse mortgage dollar roll. Mortgage dollar rolls are transactions where a fund sells TBA securities and simultaneously agrees to repurchase MBS on a later date at a lower price and with the same counterparty. Reverse mortgage dollar rolls involve the purchase and simultaneous agreement to sell TBA securities on a later date at a lower price. Transactions in mortgage dollar rolls and reverse mortgage dollar rolls are accounted for as purchases and sales and may result in an increase to a fund's portfolio turnover rate.
Purchases and sales of TBA securities involve risks similar to those discussed above for delayed delivery and when-issued securities. Also, if the counterparty in a mortgage dollar roll or a reverse mortgage dollar roll transaction files for bankruptcy or becomes insolvent, a fund's right to repurchase or sell securities may be limited. Additionally, when a fund sells TBA securities without already owning or having the right to obtain the deliverable securities (an uncovered forward commitment to sell), it incurs a risk of loss because it could have to purchase the securities at a price that is higher than the price at which it sold them. A fund may be unable to purchase the deliverable securities if the corresponding market is illiquid.
TBA securities subject to a forward commitment to sell at period end are included at the end of the Schedule of Investments under the caption "TBA Sale Commitments." The proceeds and value of these commitments are reflected in the Statement of Assets and Liabilities as "Receivable for TBA sale commitments" and "TBA sale commitments, at value," respectively.
Restricted Securities (including Private Placements). Funds may invest in securities that are subject to legal or contractual restrictions on resale. These securities generally may be resold in transactions exempt from registration or to the public if the securities are registered. Disposal of these securities may involve time-consuming negotiations and expense, and prompt sale at an acceptable price may be difficult. Information regarding restricted securities held at period end is included at the end of the Schedule of Investments, if applicable.
4. Derivative Instruments.
Risk Exposures and the Use of Derivative Instruments. Investment objectives allow a fund to enter into various types of derivative contracts, including futures contracts, swaps and options. Derivatives are investments whose value is primarily derived from underlying assets, indices or reference rates and may be transacted on an exchange or over-the-counter (OTC). Derivatives may involve a future commitment to buy or sell a specified asset based on specified terms, to exchange future cash flows at periodic intervals based on a notional principal amount, or for one party to make one or more payments upon the occurrence of specified events in exchange for periodic payments from the other party.
Derivatives were used to increase returns, to gain exposure to certain types of assets and to manage exposure to certain risks as defined below. The success of any strategy involving derivatives depends on analysis of numerous economic factors, and if the strategies for investment do not work as intended, the objectives may not be achieved.
Derivatives were used to increase or decrease exposure to the following risk(s):
| Credit Risk | Credit risk relates to the ability of the issuer of a financial instrument to make further principal or interest payments on an obligation or commitment that it has to a fund.
|
| Interest Rate Risk | Interest rate risk relates to the fluctuations in the value of interest-bearing securities due to changes in the prevailing levels of market interest rates. |
Funds are also exposed to additional risks from investing in derivatives, such as liquidity risk and counterparty credit risk. Liquidity risk is the risk that a fund will be unable to close out the derivative in the open market in a timely manner. Counterparty credit risk is the risk that the counterparty will not be able to fulfill its obligation to a fund. Derivative counterparty credit risk is managed through formal evaluation of the creditworthiness of all potential counterparties. On certain OTC derivatives such as options and bi-lateral swaps, a fund attempts to reduce its exposure to counterparty credit risk by entering into an International Swaps and Derivatives Association, Inc. (ISDA) Master Agreement with each of its counterparties. The ISDA Master Agreement gives a fund the right to terminate all transactions traded under such agreement upon the deterioration in the credit quality of the counterparty beyond specified levels. The ISDA Master Agreement gives each party the right, upon an event of default by the other party or a termination of the agreement, to close out all transactions traded under such agreement and to net amounts owed under each transaction to one net payable by one party to the other. To mitigate counterparty credit risk on bi-lateral OTC derivatives, a fund receives collateral in the form of cash or securities once net unrealized appreciation on outstanding derivative contracts under an ISDA Master Agreement exceeds certain applicable thresholds, subject to certain minimum transfer provisions. The collateral received is held in segregated accounts with the custodian bank in accordance with the collateral agreements entered into between a fund, the counterparty and the custodian bank. A fund could experience delays and costs in gaining access to the collateral even though it is held by the custodian bank. The maximum risk of loss to a fund from counterparty credit risk related to bi-lateral OTC derivatives is generally the aggregate unrealized appreciation and unpaid counterparty payments in excess of any collateral pledged by the counterparty to a fund. For OTC written options with upfront premiums received, a fund is obligated to perform and therefore does not have counterparty risk. For OTC written options with premiums to be received at a future date, the maximum risk of loss from counterparty credit risk is the amount of the premium in excess of any collateral pledged by the counterparty. A fund may be required to pledge collateral for the benefit of the counterparties on bi-lateral OTC derivatives in an amount not less than each counterparty's unrealized appreciation on outstanding derivative contracts, subject to certain minimum transfer provisions, and any such pledged collateral is identified in the Schedule of Investments. Exchange-traded contracts are not covered by the ISDA Master Agreement; however counterparty credit risk related to these contracts may be mitigated by the protection provided by the exchange on which they trade. Counterparty credit risk related to centrally cleared OTC swaps may be mitigated by the protection provided by the clearinghouse.
Investing in derivatives may involve greater risks than investing in the underlying assets directly and, to varying degrees, may involve risk of loss in excess of any initial investment and collateral received and amounts recognized in the Statement of Assets and Liabilities. In addition, there may be the risk that the change in value of the derivative contract does not correspond to the change in value of the underlying instrument.
Net Realized Gain (Loss) and Change in Net Unrealized Appreciation (Depreciation) on Derivatives. The table below, which reflects the impacts of derivatives on the financial performance, summarizes the net realized gain (loss) and change in net unrealized appreciation (depreciation) for derivatives during the period as presented in the Statement of Operations.
| Primary Risk Exposure / Derivative Type | Net Realized Gain (Loss) | Change in Net Unrealized Appreciation (Depreciation) |
| Fidelity Total Bond K6 Fund | | |
| Credit Risk | | |
| Swaps | $(22,836) | $79,299 |
| Total Credit Risk | (22,836) | 79,299 |
| Interest Rate Risk | | |
| Futures Contracts | 639,045 | 474,975 |
| Purchased Options | (6,052) | (605) |
| Written Options | 942 | (1,566) |
| Swaps | (266,411) | (69,484) |
| Total Interest Rate Risk | 367,524 | 403,320 |
| Totals | $344,688 | $482,619 |
If there are any open positions at period end, a summary of the value of derivatives by primary risk exposure is included at the end of the Schedule of Investments.
Futures Contracts. A futures contract is an agreement between two parties to buy or sell a specified underlying instrument for a fixed price at a specified future date. Futures contracts were used to manage exposure to the bond market and fluctuations in interest rates.
Upon entering into a futures contract, a fund is required to deposit either cash or securities (initial margin) with a clearing broker in an amount equal to a certain percentage of the face value of the contract. Futures contracts are marked-to-market daily and subsequent daily payments are made or received by a fund depending on the daily fluctuations in the value of the futures contracts and are recorded as unrealized appreciation or (depreciation). This receivable and/or payable, if any, is included in daily variation margin on futures contracts in the Statement of Assets and Liabilities. Realized gain or (loss) is recorded upon the expiration or closing of a futures contract. The net realized gain (loss) and change in net unrealized appreciation (depreciation) on futures contracts during the period is presented in the Statement of Operations.
Any open futures contracts at period end are presented in the Schedule of Investments under the caption "Futures Contracts". The notional amount at value reflects each contract's exposure to the underlying instrument or index at period end, and is representative of volume of activity during the period unless an average notional amount is presented. Any securities deposited to meet initial margin requirements are identified in the Schedule of Investments. Any cash deposited to meet initial margin requirements is presented as segregated cash with brokers for derivative instruments in the Statement of Assets and Liabilities.
Options. Options give the purchaser the right, but not the obligation, to buy (call) or sell (put) an underlying security or financial instrument at an agreed exercise or strike price between or on certain dates. Options obligate the seller (writer) to buy (put) or sell (call) an underlying instrument at the exercise or strike price or cash settle an underlying derivative instrument if the holder exercises the option on or before the expiration date. OTC options, such as swaptions, which are options where the underlying instrument is a swap, were used to manage exposure to fluctuations in interest rates.
Upon entering into an options contract, a fund will pay or receive a premium. Premiums paid on purchased options are reflected as cost of investments and premiums received on written options are reflected as a liability on the Statement of Assets and Liabilities. Certain options may be purchased or written with premiums to be paid or received on a future date. Options are valued daily and any unrealized appreciation (depreciation) is reflected on the Statement of Assets and Liabilities. When an option is exercised, the cost or proceeds of the underlying instrument purchased or sold is adjusted by the amount of the premium. When an option is closed, a gain or loss is realized depending on whether the proceeds or amount paid for the closing sale transaction is greater or less than the premium received or paid. When an option expires, gains and losses are realized to the extent of premiums received and paid, respectively. The net realized and unrealized gains (losses) on purchased options are included in the Statement of Operations in net realized gain (loss) and change in net unrealized appreciation (depreciation) on investment securities. The net realized gain (loss) and change in net unrealized appreciation (depreciation) on written options are presented in the Statement of Operations.
Any open options at period end are presented in the Schedule of Investments under the captions "Purchased Options," "Purchased Swaptions," "Written Options" and "Written Swaptions," as applicable, and are representative of volume of activity during the period unless an average notional amount is presented.
Writing puts and buying calls tend to increase exposure to the underlying instrument while buying puts and writing calls tend to decrease exposure to the underlying instrument. For purchased options, risk of loss is limited to the premium paid, and for written options, risk of loss is the change in value in excess of the premium received.
Swaps. A swap is a contract between two parties to exchange future cash flows at periodic intervals based on a notional principal amount. A bi-lateral OTC swap is a transaction between a fund and a dealer counterparty where cash flows are exchanged between the two parties for the life of the swap. A centrally cleared OTC swap is a transaction executed between a fund and a dealer counterparty, then cleared by a futures commission merchant (FCM) through a clearinghouse. Once cleared, the clearinghouse serves as a central counterparty, with whom a fund exchanges cash flows for the life of the transaction, similar to transactions in futures contracts.
Bi-lateral OTC swaps are marked-to-market daily and changes in value are reflected in the Statement of Assets and Liabilities in the bi-lateral OTC swaps at value line items. Any upfront premiums paid or received upon entering a bi-lateral OTC swap to compensate for differences between stated terms of the swap and prevailing market conditions (e.g. credit spreads, interest rates or other factors) are recorded in net unrealized appreciation (depreciation) in the Statement of Assets and Liabilities and amortized to realized gain or (loss) ratably over the term of the swap. Any unamortized upfront premiums are presented in the Schedule of Investments.
Centrally cleared OTC swaps require a fund to deposit either cash or securities (initial margin) with the FCM, at the instruction of and for the benefit of the clearinghouse. Any securities deposited to meet initial margin requirements are identified in the Schedule of Investments. Any cash deposited to meet initial margin requirements is presented in segregated cash with brokers for derivative instruments in the Statement of Assets and Liabilities. Centrally cleared OTC swaps are marked-to-market daily and subsequent payments (variation margin) are made or received depending on the daily fluctuations in the value of the swaps and are recorded as unrealized appreciation or (depreciation). These daily payments, if any, are included in receivable or payable for daily variation margin on centrally cleared OTC swaps in the Statement of Assets and Liabilities. Any premiums for centrally cleared OTC swaps are recorded periodically throughout the term of the swap to variation margin and included in unrealized appreciation (depreciation) in the Statement of Assets and Liabilities. Any premiums are recognized as realized gain (loss) upon termination or maturity of the swap.
For both bi-lateral and centrally cleared OTC swaps, payments are exchanged at specified intervals, accrued daily commencing with the effective date of the contract and recorded as realized gain or (loss). Some swaps may be terminated prior to the effective date and realize a gain or loss upon termination. The net realized gain (loss) and change in net unrealized appreciation (depreciation) on swaps during the period is presented in the Statement of Operations.
Any open swaps at period end are included in the Schedule of Investments under the caption "Swaps", and are representative of volume of activity during the period unless an average notional amount is presented.
Credit Default Swaps. Credit default swaps enable a fund to buy or sell protection against specified credit events on a single-name issuer or a traded credit index. Under the terms of a credit default swap the buyer of protection (buyer) receives credit protection in exchange for making periodic payments to the seller of protection (seller) based on a fixed percentage applied to a notional principal amount. In return for these payments, the seller will be required to make a payment upon the occurrence of one or more specified credit events. A fund enters into credit default swaps as a seller to gain credit exposure to an issuer and/or as a buyer to obtain a measure of protection against defaults of an issuer. Periodic payments are made over the life of the contract by the buyer provided that no credit event occurs.
For credit default swaps on most corporate and sovereign issuers, credit events include bankruptcy, failure to pay or repudiation/moratorium. For credit default swaps on corporate or sovereign issuers, the obligation that may be put to the seller is not limited to the specific reference obligation described in the Schedule of Investments. For credit default swaps on asset-backed securities, a credit event may be triggered by events such as failure to pay principal, maturity extension, rating downgrade or write-down. For credit default swaps on asset-backed securities, the reference obligation described represents the security that may be put to the seller. For credit default swaps on a traded credit index, a specified credit event may affect all or individual underlying securities included in the index.
As a seller, if an underlying credit event occurs, a fund will pay a net settlement amount of cash equal to the notional amount of the swap less the recovery value of the reference obligation or underlying securities comprising an index. Only in the event of the industry's inability to value the underlying asset will a fund be required to take delivery of the reference obligation or underlying securities comprising an index and pay an amount equal to the notional amount of the swap.
As a buyer, if an underlying credit event occurs, a fund will receive a net settlement amount of cash equal to the notional amount of the swap less the recovery value of the reference obligation or underlying securities comprising an index. Only in the event of the industry's inability to value the underlying asset will a fund be required to deliver the reference obligation or underlying securities comprising an index in exchange for payment of an amount equal to the notional amount of the swap.
Typically, the value of each credit default swap and credit rating disclosed for each reference obligation in the Schedule of Investments, where a fund is the seller, can be used as measures of the current payment/performance risk of the swap. As the value of the swap changes as a positive or negative percentage of the total notional amount, the payment/performance risk may decrease or increase, respectively. In addition to these measures, the investment adviser monitors a variety of factors including cash flow assumptions, market activity and market sentiment as part of its ongoing process of assessing payment/performance risk.
Interest Rate Swaps. Interest rate swaps are agreements between counterparties to exchange cash flows, one based on a fixed rate, and the other on a floating rate. A fund enters into interest rate swaps to manage its exposure to interest rate changes. Changes in interest rates can have an effect on both the value of bond holdings as well as the amount of interest income earned. In general, the value of bonds can fall when interest rates rise and can rise when interest rates fall.
5. Purchases and Sales of Investments.
Purchases and sales of securities, other than short-term securities, U.S. government securities and in-kind transactions, as applicable, are noted in the table below.
| | Purchases ($) | Sales ($) |
| Fidelity Total Bond K6 Fund | 1,176,568,667 | 1,073,561,537 |
6. Fees and Other Transactions with Affiliates.
Management Fee. Fidelity Management & Research Company LLC (the investment adviser) and its affiliates provide the Fund with investment management related services for which the Fund pays a monthly management fee that is based on an annual rate of .30% of average net assets. Under the management contract, the investment adviser or an affiliate pays all other expenses of the Fund, excluding fees and expenses of the independent Trustees, and certain miscellaneous expenses such as proxy and shareholder meeting expenses.
Interfund Trades. Funds may purchase from or sell securities to other Fidelity Funds under procedures adopted by the Board. The procedures have been designed to ensure these interfund trades are executed in accordance with Rule 17a-7 of the 1940 Act. Any interfund trades are included within the respective purchases and sales amounts shown in the Purchases and Sales of Investments note. During the period, there were no interfund trades.
Affiliated Exchanges In-Kind. During the period, the Fund redeemed 1,385,726 shares of Fidelity Mortgage Backed Securities Central Fund in exchange for investments, including accrued interest and cash, if any, with a value of $140,051,080. The net realized loss of $6,797,281 on the Fund's redemptions of Fidelity Mortgage Backed Securities Central Fund shares is included in "Net realized gain (loss) on Investment securities: Fidelity Central Funds" in the accompanying Statement of Operations. The Fund recognized a net loss on the exchanges for federal income tax purposes.
7. Committed Line of Credit.
Certain Funds participate with other funds managed by the investment adviser or an affiliate in a $4.25 billion credit facility (the "line of credit") to be utilized for temporary or emergency purposes to fund shareholder redemptions or for other short-term liquidity purposes. The commitment fees on the pro-rata portion of the line of credit are borne by the investment adviser. During the period, there were no borrowings on this line of credit.
8. Security Lending.
Funds lend portfolio securities from time to time in order to earn additional income. Lending agents are used, including National Financial Services (NFS), an affiliate of the investment adviser. Pursuant to a securities lending agreement, NFS will receive a fee, which is capped at 9.9% of a fund's daily lending revenue, for its services as lending agent. A fund may lend securities to certain qualified borrowers, including NFS. On the settlement date of the loan, a fund receives collateral (in the form of U.S. Treasury obligations, letters of credit and/or cash) against the loaned securities and maintains collateral in an amount not less than 100% of the market value of the loaned securities during the period of the loan. The market value of the loaned securities is determined at the close of business of a fund and any additional required collateral is delivered to a fund on the next business day. A fund or borrower may terminate the loan at any time, and if the borrower defaults on its obligation to return the securities loaned because of insolvency or other reasons, a fund may apply collateral received from the borrower against the obligation. A fund may experience delays and costs in recovering the securities loaned. Any cash collateral received is invested in the Fidelity Securities Lending Cash Central Fund. Any loaned securities are identified as such in the Schedule of Investments, and the value of loaned securities and cash collateral at period end, as applicable, are presented in the Statement of Assets and Liabilities. Security lending income represents the income earned on investing cash collateral, less rebates paid to borrowers and any lending agent fees associated with the loan, plus any premium payments received for lending certain types of securities. Security lending income is presented in the Statement of Operations as a component of income from Fidelity Central Funds. Affiliated security lending activity, if any, was as follows:
| | Total Security Lending Fees Paid to NFS | Security Lending Income From Securities Loaned to NFS | Value of Securities Loaned to NFS at Period End |
| Fidelity Total Bond K6 Fund | $5,874 | $– | $– |
9. Expense Reductions.
Through arrangements with the Fund's custodian, credits realized as a result of certain uninvested cash balances were used to reduce the Fund's expenses by $345.
10. Other.
A fund's organizational documents provide former and current trustees and officers with a limited indemnification against liabilities arising in connection with the performance of their duties to the fund. In the normal course of business, a fund may also enter into contracts that provide general indemnifications. A fund's maximum exposure under these arrangements is unknown as this would be dependent on future claims that may be made against a fund. The risk of material loss from such claims is considered remote.
11. Risk and Uncertainties.
Many factors affect a fund's performance. Developments that disrupt global economies and financial markets, such as pandemics, epidemics, outbreaks of infectious diseases, war, terrorism, and environmental disasters, may significantly affect a fund's investment performance. The effects of these developments to a fund will be impacted by the types of securities in which a fund invests, the financial condition, industry, economic sector, and geographic location of an issuer, and a fund's level of investment in the securities of that issuer.
Report of Independent Registered Public Accounting Firm
To the Board of Trustees of Fidelity Income Fund and the Shareholders of Fidelity Total Bond K6 Fund
Opinion on the Financial Statements and Financial Highlights
We have audited the accompanying statement of assets and liabilities of Fidelity Total Bond K6 Fund (the "Fund"), a fund of Fidelity Income Fund, including the schedule of investments, as of August 31, 2022, the related statement of operations for the year then ended, the statement of changes in net assets for each of the two years in the period then ended, the financial highlights for each of the five years in the period then ended, and the related notes. In our opinion, the financial statements and financial highlights present fairly, in all material respects, the financial position of the Fund as of August 31, 2022, and the results of its operations for the year then ended, the changes in its net assets for each of the two years in the period then ended, and the financial highlights for each of the five years in the period then ended in conformity with accounting principles generally accepted in the United States of America.
Basis for Opinion
These financial statements and financial highlights are the responsibility of the Fund's management. Our responsibility is to express an opinion on the Fund's financial statements and financial highlights based on our audits. We are a public accounting firm registered with the Public Company Accounting Oversight Board (United States) (PCAOB) and are required to be independent with respect to the Fund in accordance with the U.S. federal securities laws and the applicable rules and regulations of the Securities and Exchange Commission and the PCAOB.
We conducted our audits in accordance with the standards of the PCAOB. Those standards require that we plan and perform the audit to obtain reasonable assurance about whether the financial statements and financial highlights are free of material misstatement, whether due to error or fraud. The Fund is not required to have, nor were we engaged to perform, an audit of its internal control over financial reporting. As part of our audits we are required to obtain an understanding of internal control over financial reporting but not for the purpose of expressing an opinion on the effectiveness of the Fund’s internal control over financial reporting. Accordingly, we express no such opinion.
Our audits included performing procedures to assess the risks of material misstatement of the financial statements and financial highlights, whether due to error or fraud, and performing procedures that respond to those risks. Such procedures included examining, on a test basis, evidence regarding the amounts and disclosures in the financial statements and financial highlights. Our audits also included evaluating the accounting principles used and significant estimates made by management, as well as evaluating the overall presentation of the financial statements and financial highlights. Our procedures included confirmation of securities owned as of August 31, 2022, by correspondence with the custodian and brokers; when replies were not received from brokers, we performed other auditing procedures. We believe that our audits provide a reasonable basis for our opinion.
/s/ Deloitte & Touche LLP
Boston, Massachusetts
October 17, 2022
We have served as the auditor of one or more of the Fidelity investment companies since 1999.
Trustees and Officers
The Trustees, Members of the Advisory Board (if any), and officers of the trust and fund, as applicable, are listed below. The Board of Trustees governs the fund and is responsible for protecting the interests of shareholders. The Trustees are experienced executives who meet periodically throughout the year to oversee the fund's activities, review contractual arrangements with companies that provide services to the fund, oversee management of the risks associated with such activities and contractual arrangements, and review the fund's performance. Each of the Trustees oversees 297 funds.
The Trustees hold office without limit in time except that (a) any Trustee may resign; (b) any Trustee may be removed by written instrument, signed by at least two-thirds of the number of Trustees prior to such removal; (c) any Trustee who requests to be retired or who has become incapacitated by illness or injury may be retired by written instrument signed by a majority of the other Trustees; and (d) any Trustee may be removed at any special meeting of shareholders by a two-thirds vote of the outstanding voting securities of the trust. Each Trustee who is not an interested person (as defined in the 1940 Act) of the trust and the fund is referred to herein as an Independent Trustee. Each Independent Trustee shall retire not later than the last day of the calendar year in which his or her 75th birthday occurs. The Independent Trustees may waive this mandatory retirement age policy with respect to individual Trustees. Officers and Advisory Board Members hold office without limit in time, except that any officer or Advisory Board Member may resign or may be removed by a vote of a majority of the Trustees at any regular meeting or any special meeting of the Trustees. Except as indicated, each individual has held the office shown or other offices in the same company for the past five years.
The fund’s Statement of Additional Information (SAI) includes more information about the Trustees. To request a free copy, call Fidelity at 1-800-835-5092.
Experience, Skills, Attributes, and Qualifications of the Trustees. The Governance and Nominating Committee has adopted a statement of policy that describes the experience, qualifications, attributes, and skills that are necessary and desirable for potential Independent Trustee candidates (Statement of Policy). The Board believes that each Trustee satisfied at the time he or she was initially elected or appointed a Trustee, and continues to satisfy, the standards contemplated by the Statement of Policy. The Governance and Nominating Committee also engages professional search firms to help identify potential Independent Trustee candidates who have the experience, qualifications, attributes, and skills consistent with the Statement of Policy. From time to time, additional criteria based on the composition and skills of the current Independent Trustees, as well as experience or skills that may be appropriate in light of future changes to board composition, business conditions, and regulatory or other developments, have also been considered by the professional search firms and the Governance and Nominating Committee. In addition, the Board takes into account the Trustees' commitment and participation in Board and committee meetings, as well as their leadership of standing and ad hoc committees throughout their tenure.
In determining that a particular Trustee was and continues to be qualified to serve as a Trustee, the Board has considered a variety of criteria, none of which, in isolation, was controlling. The Board believes that, collectively, the Trustees have balanced and diverse experience, qualifications, attributes, and skills, which allow the Board to operate effectively in governing the fund and protecting the interests of shareholders. Information about the specific experience, skills, attributes, and qualifications of each Trustee, which in each case led to the Board's conclusion that the Trustee should serve (or continue to serve) as a trustee of the fund, is provided below.
Board Structure and Oversight Function. Abigail P. Johnson is an interested person and currently serves as Chairman. The Trustees have determined that an interested Chairman is appropriate and benefits shareholders because an interested Chairman has a personal and professional stake in the quality and continuity of services provided to the fund. Independent Trustees exercise their informed business judgment to appoint an individual of their choosing to serve as Chairman, regardless of whether the Trustee happens to be independent or a member of management. The Independent Trustees have determined that they can act independently and effectively without having an Independent Trustee serve as Chairman and that a key structural component for assuring that they are in a position to do so is for the Independent Trustees to constitute a substantial majority for the Board. The Independent Trustees also regularly meet in executive session. Michael E. Kenneally serves as Chairman of the Independent Trustees and as such (i) acts as a liaison between the Independent Trustees and management with respect to matters important to the Independent Trustees and (ii) with management prepares agendas for Board meetings.
Fidelity® funds are overseen by different Boards of Trustees. The fund's Board oversees Fidelity's investment-grade bond, money market, asset allocation and certain equity funds, and other Boards oversee Fidelity's high income and other equity funds. The asset allocation funds may invest in Fidelity® funds that are overseen by such other Boards. The use of separate Boards, each with its own committee structure, allows the Trustees of each group of Fidelity® funds to focus on the unique issues of the funds they oversee, including common research, investment, and operational issues. On occasion, the separate Boards establish joint committees to address issues of overlapping consequences for the Fidelity® funds overseen by each Board.
The Trustees operate using a system of committees to facilitate the timely and efficient consideration of all matters of importance to the Trustees, the fund, and fund shareholders and to facilitate compliance with legal and regulatory requirements and oversight of the fund's activities and associated risks. The Board, acting through its committees, has charged FMR and its affiliates with (i) identifying events or circumstances the occurrence of which could have demonstrably adverse effects on the fund's business and/or reputation; (ii) implementing processes and controls to lessen the possibility that such events or circumstances occur or to mitigate the effects of such events or circumstances if they do occur; and (iii) creating and maintaining a system designed to evaluate continuously business and market conditions in order to facilitate the identification and implementation processes described in (i) and (ii) above. Because the day-to-day operations and activities of the fund are carried out by or through FMR, its affiliates, and other service providers, the fund's exposure to risks is mitigated but not eliminated by the processes overseen by the Trustees. While each of the Board's committees has responsibility for overseeing different aspects of the fund's activities, oversight is exercised primarily through the Operations and Audit Committees. In addition, an ad hoc Board committee of Independent Trustees has worked with FMR to enhance the Board's oversight of investment and financial risks, legal and regulatory risks, technology risks, and operational risks, including the development of additional risk reporting to the Board. Appropriate personnel, including but not limited to the fund's Chief Compliance Officer (CCO), FMR's internal auditor, the independent accountants, the fund's Treasurer and portfolio management personnel, make periodic reports to the Board's committees, as appropriate, including an annual review of Fidelity's risk management program for the Fidelity® funds. The responsibilities of each standing committee, including their oversight responsibilities, are described further under "Standing Committees of the Trustees."
Interested Trustees*:
Correspondence intended for a Trustee who is an interested person may be sent to Fidelity Investments, 245 Summer Street, Boston, Massachusetts 02210.
Name, Year of Birth; Principal Occupations and Other Relevant Experience+
Abigail P. Johnson (1961)
Year of Election or Appointment: 2009
Trustee
Chairman of the Board of Trustees
Ms. Johnson also serves as Trustee of other Fidelity® funds. Ms. Johnson serves as Chairman (2016-present), Chief Executive Officer (2014-present), and Director (2007-present) of FMR LLC (diversified financial services company), President of Fidelity Financial Services (2012-present) and President of Personal, Workplace and Institutional Services (2005-present). Ms. Johnson is Chairman and Director of Fidelity Management & Research Company LLC (investment adviser firm, 2011-present). Previously, Ms. Johnson served as Chairman and Director of FMR Co., Inc. (investment adviser firm, 2011-2019), Vice Chairman (2007-2016) and President (2013-2016) of FMR LLC, President and a Director of Fidelity Management & Research Company (2001-2005), a Trustee of other investment companies advised by Fidelity Management & Research Company, Fidelity Investments Money Management, Inc. (investment adviser firm), and FMR Co., Inc. (2001-2005), Senior Vice President of the Fidelity® funds (2001-2005), and managed a number of Fidelity® funds. Ms. Abigail P. Johnson and Mr. Arthur E. Johnson are not related.
Jennifer Toolin McAuliffe (1959)
Year of Election or Appointment: 2016
Trustee
Ms. McAuliffe also serves as Trustee of other Fidelity® funds and as Trustee of Fidelity Charitable (2020-present). Previously, Ms. McAuliffe served as Co-Head of Fixed Income of Fidelity Investments Limited (now known as FIL Limited (FIL)) (diversified financial services company), Director of Research for FIL’s credit and quantitative teams in London, Hong Kong and Tokyo and Director of Research for taxable and municipal bonds at Fidelity Investments Money Management, Inc. Ms. McAuliffe previously served as a member of the Advisory Board of certain Fidelity® funds (2016). Ms. McAuliffe was previously a lawyer at Ropes & Gray LLP and currently serves as director or trustee of several not-for-profit entities.
* Determined to be an “Interested Trustee” by virtue of, among other things, his or her affiliation with the trust or various entities under common control with FMR.
+ The information includes the Trustee's principal occupation during the last five years and other information relating to the experience, attributes, and skills relevant to the Trustee's qualifications to serve as a Trustee, which led to the conclusion that the Trustee should serve as a Trustee for the fund.
Independent Trustees:
Correspondence intended for an Independent Trustee may be sent to Fidelity Investments, P.O. Box 55235, Boston, Massachusetts 02205-5235.
Name, Year of Birth; Principal Occupations and Other Relevant Experience+
Elizabeth S. Acton (1951)
Year of Election or Appointment: 2013
Trustee
Ms. Acton also serves as Trustee of other Fidelity® funds. Prior to her retirement, Ms. Acton served as Executive Vice President, Finance (2011-2012), Executive Vice President, Chief Financial Officer (2002-2011) and Treasurer (2004-2005) of Comerica Incorporated (financial services). Prior to joining Comerica, Ms. Acton held a variety of positions at Ford Motor Company (1983-2002), including Vice President and Treasurer (2000-2002) and Executive Vice President and Chief Financial Officer of Ford Motor Credit Company (1998-2000). Ms. Acton currently serves as a member of the Board and Audit and Finance Committees of Beazer Homes USA, Inc. (homebuilding, 2012-present). Ms. Acton previously served as a member of the Advisory Board of certain Fidelity® funds (2013-2016).
Ann E. Dunwoody (1953)
Year of Election or Appointment: 2018
Trustee
General Dunwoody also serves as Trustee of other Fidelity® funds. General Dunwoody (United States Army, Retired) was the first woman in U.S. military history to achieve the rank of four-star general and prior to her retirement in 2012 held a variety of positions within the U.S. Army, including Commanding General, U.S. Army Material Command (2008-2012). General Dunwoody currently serves as President of First to Four LLC (leadership and mentoring services, 2012-present), a member of the Board and Nomination and Corporate Governance Committees of Kforce Inc. (professional staffing services, 2016-present) and a member of the Board of Automattic Inc. (software engineering, 2018-present). Previously, General Dunwoody served as a member of the Advisory Board and Nominating and Corporate Governance Committee of L3 Technologies, Inc. (communication, electronic, sensor and aerospace systems, 2013-2019) and a member of the Board and Audit and Sustainability and Corporate Responsibility Committees of Republic Services, Inc. (waste collection, disposal and recycling, 2013-2016). Ms. Dunwoody also serves on several boards for non-profit organizations, including as a member of the Board, Chair of the Nomination and Governance Committee and a member of the Audit Committee of Logistics Management Institute (consulting non-profit, 2012-present), a member of the Council of Trustees for the Association of the United States Army (advocacy non-profit, 2013-present), a member of the Board of Florida Institute of Technology (2015-present) and a member of the Board of ThanksUSA (military family education non-profit, 2014-present). General Dunwoody previously served as a member of the Advisory Board of certain Fidelity® funds (2018).
John Engler (1948)
Year of Election or Appointment: 2014
Trustee
Mr. Engler also serves as Trustee of other Fidelity® funds. Previously, Mr. Engler served as Governor of Michigan (1991-2003), President of the Business Roundtable (2011-2017) and interim President of Michigan State University (2018-2019). Mr. Engler currently serves as a member of the Board of Stride, Inc. (formerly K12 Inc.) (technology-based education company, 2012-present). Previously, Mr. Engler served as a member of the Board of Universal Forest Products (manufacturer and distributor of wood and wood-alternative products, 2003-2019) and Trustee of The Munder Funds (2003-2014). Mr. Engler previously served as a member of the Advisory Board of certain Fidelity® funds (2014-2016).
Robert F. Gartland (1951)
Year of Election or Appointment: 2010
Trustee
Mr. Gartland also serves as Trustee of other Fidelity® funds. Prior to his retirement, Mr. Gartland held a variety of positions at Morgan Stanley (financial services, 1979-2007), including Managing Director (1987-2007) and Chase Manhattan Bank (1975-1978). Mr. Gartland previously served as Chairman and an investor in Gartland & Mellina Group Corp. (consulting, 2009-2019), as a member of the Board of National Securities Clearing Corporation (1993-1996) and as Chairman of TradeWeb (2003-2004).
Arthur E. Johnson (1947)
Year of Election or Appointment: 2008
Trustee
Mr. Johnson also serves as Trustee of other Fidelity® funds. Prior to his retirement, Mr. Johnson served as Senior Vice President of Corporate Strategic Development of Lockheed Martin Corporation (defense contractor, 1999-2009). Mr. Johnson currently serves as a member of the Board of Booz Allen Hamilton (management consulting, 2011-present). Mr. Johnson previously served as a member of the Board of Eaton Corporation plc (diversified power management, 2009-2019) and a member of the Board of AGL Resources, Inc. (holding company, 2002-2016). Mr. Johnson previously served as Chairman (2018-2021) and Vice Chairman (2015-2018) of the Independent Trustees of certain Fidelity® funds. Mr. Arthur E. Johnson is not related to Ms. Abigail P. Johnson.
Michael E. Kenneally (1954)
Year of Election or Appointment: 2009
Trustee
Chairman of the Independent Trustees
Mr. Kenneally also serves as Trustee of other Fidelity® funds and was Vice Chairman (2018-2021) of the Independent Trustees of certain Fidelity® funds. Prior to retirement in 2005, he was Chairman and Global Chief Executive Officer of Credit Suisse Asset Management, the worldwide fund management and institutional investment business of Credit Suisse Group. Previously, Mr. Kenneally was an Executive Vice President and the Chief Investment Officer for Bank of America. In this role, he was responsible for the investment management, strategy and products delivered to the bank’s institutional, high-net-worth and retail clients. Earlier, Mr. Kenneally directed the organization’s equity and quantitative research groups. He began his career as a research analyst and then spent more than a dozen years as a portfolio manager for endowments, pension plans and mutual funds. He earned the Chartered Financial Analyst (CFA) designation in 1991.
Marie L. Knowles (1946)
Year of Election or Appointment: 2001
Trustee
Ms. Knowles also serves as Trustee of other Fidelity® funds. Prior to her retirement, Ms. Knowles held several positions at Atlantic Richfield Company (diversified energy), including Executive Vice President and Chief Financial Officer (1996-2000), Senior Vice President (1993-1996) and President of ARCO Transportation Company (pipeline and tanker operations, 1993-1996). Ms. Knowles currently serves as a member of the Board of the Santa Catalina Island Company (real estate, 2009-present), a member of the Investment Company Institute Board of Governors and a member of the Governing Council of the Independent Directors Council (2014-present). Ms. Knowles also serves as a member of the Advisory Board for the School of Engineering of the University of Southern California. Ms. Knowles previously served as a member of the Board of McKesson Corporation (healthcare service, 2002-2021). In addition, Ms. Knowles previously served as Chairman (2015-2018) and Vice Chairman (2012-2015) of the Independent Trustees of certain Fidelity® funds.
Mark A. Murray (1954)
Year of Election or Appointment: 2016
Trustee
Mr. Murray also serves as Trustee of other Fidelity® funds. Previously, Mr. Murray served as Co-Chief Executive Officer (2013-2016), President (2006-2013) and Vice Chairman (2013-2020) of Meijer, Inc. Mr. Murray serves as a member of the Board (2009-present) and Public Policy and Responsibility Committee (2009-present) and Chair of the Nuclear Review Committee (2019-present) of DTE Energy Company (diversified energy company). Mr. Murray previously served as a member of the Board of Spectrum Health (not-for-profit health system, 2015-2019) and as a member of the Board and Audit Committee and Chairman of the Nominating and Corporate Governance Committee of Universal Forest Products, Inc. (manufacturer and distributor of wood and wood-alternative products, 2004-2016). Mr. Murray also serves as a member of the Board of many community and professional organizations. Mr. Murray previously served as a member of the Advisory Board of certain Fidelity® funds (2016).
+ The information includes the Trustee's principal occupation during the last five years and other information relating to the experience, attributes, and skills relevant to the Trustee's qualifications to serve as a Trustee, which led to the conclusion that the Trustee should serve as a Trustee for the fund.
Advisory Board Members and Officers:
Correspondence intended for an officer may be sent to Fidelity Investments, 245 Summer Street, Boston, Massachusetts 02210. Officers appear below in alphabetical order.
Name, Year of Birth; Principal Occupation
Laura M. Bishop (1961)
Year of Election or Appointment: 2022
Member of the Advisory Board
Ms. Bishop also serves as a Member of the Advisory Board of other funds. Prior to her retirement, Ms. Bishop held a variety of positions at United Services Automobile Association (2001-2020), including Executive Vice President and Chief Financial Officer (2014-2020) and Senior Vice President and Deputy Chief Financial Officer (2012-2014). Ms. Bishop currently serves as a member of the Audit Committee and Compensation and Personnel Committee (2021-present) of the Board of Directors of Korn Ferry (global organizational consulting).
Robert W. Helm (1957)
Year of Election or Appointment: 2021
Member of the Advisory Board
Mr. Helm also serves as a Member of the Advisory Board of other Fidelity® funds. Mr. Helm was formerly Deputy Chairman (2003-2020), partner (1991-2020) and an associate (1984-1991) of Dechert LLP (formerly Dechert Price & Rhoads). Mr. Helm currently serves on boards and committees of several not-for-profit organizations.
Craig S. Brown (1977)
Year of Election or Appointment: 2019
Assistant Treasurer
Mr. Brown also serves as an officer of other funds. Mr. Brown serves as Assistant Treasurer of FIMM, LLC (2021-present) and is an employee of Fidelity Investments (2013-present).
John J. Burke III (1964)
Year of Election or Appointment: 2018
Chief Financial Officer
Mr. Burke also serves as Chief Financial Officer of other funds. Mr. Burke serves as Head of Investment Operations for Fidelity Fund and Investment Operations (2018-present) and is an employee of Fidelity Investments (1998-present). Previously Mr. Burke served as head of Asset Management Investment Operations (2012-2018).
David J. Carter (1973)
Year of Election or Appointment: 2020
Assistant Secretary
Mr. Carter also serves as Assistant Secretary of other funds. Mr. Carter serves as Senior Vice President, Deputy General Counsel (2022-present) and is an employee of Fidelity Investments (2005-present).
Jonathan Davis (1968)
Year of Election or Appointment: 2010
Assistant Treasurer
Mr. Davis also serves as an officer of other funds. Mr. Davis serves as Assistant Treasurer of FIMM, LLC (2021-present), FMR Capital, Inc. (2017-present), FD Funds GP LLC (2021-present), FD Funds Holding LLC (2021-present), and FD Funds Management LLC (2021-present); and is an employee of Fidelity Investments. Previously, Mr. Davis served as Vice President and Associate General Counsel of FMR LLC (diversified financial services company, 2003-2010).
Laura M. Del Prato (1964)
Year of Election or Appointment: 2018
President and Treasurer
Ms. Del Prato also serves as an officer of other funds. Ms. Del Prato serves as Assistant Treasurer of FIMM, LLC (2021-present) and is an employee of Fidelity Investments (2017-present). Previously, Ms. Del Prato served as President and Treasurer of The North Carolina Capital Management Trust: Cash Portfolio and Term Portfolio (2018-2020). Prior to joining Fidelity Investments, Ms. Del Prato served as a Managing Director and Treasurer of the JPMorgan Mutual Funds (2014-2017). Prior to JPMorgan, Ms. Del Prato served as a partner at Cohen Fund Audit Services (accounting firm, 2012-2013) and KPMG LLP (accounting firm, 2004-2012).
Colm A. Hogan (1973)
Year of Election or Appointment: 2016
Assistant Treasurer
Mr. Hogan also serves as an officer of other funds. Mr. Hogan serves as Assistant Treasurer of FIMM, LLC (2021-present) and FMR Capital, Inc. (2017-present) and is an employee of Fidelity Investments (2005-present). Previously, Mr. Hogan served as Deputy Treasurer of certain Fidelity® funds (2016-2020) and Assistant Treasurer of certain Fidelity® funds (2016-2018).
Cynthia Lo Bessette (1969)
Year of Election or Appointment: 2019
Secretary and Chief Legal Officer (CLO)
Ms. Lo Bessette also serves as an officer of other funds. Ms. Lo Bessette serves as CLO, Secretary, and Senior Vice President of Fidelity Management & Research Company LLC (investment adviser firm, 2019-present); CLO of Fidelity Management & Research (Hong Kong) Limited, FMR Investment Management (UK) Limited, and Fidelity Management & Research (Japan) Limited (investment adviser firms, 2019-present); Secretary of FD Funds GP LLC (2021-present), FD Funds Holding LLC (2021-present), and FD Funds Management LLC (2021-present); and Assistant Secretary of FIMM, LLC (2019-present). She is a Senior Vice President and Deputy General Counsel of FMR LLC (diversified financial services company, 2019-present), and is an employee of Fidelity Investments. Previously, Ms. Lo Bessette served as CLO, Secretary, and Senior Vice President of FMR Co., Inc. (investment adviser firm, 2019); Secretary of Fidelity SelectCo, LLC and Fidelity Investments Money Management, Inc. (investment adviser firms, 2019). Prior to joining Fidelity Investments, Ms. Lo Bessette was Executive Vice President, General Counsel (2016-2019) and Senior Vice President, Deputy General Counsel (2015-2016) of OppenheimerFunds (investment management company) and Deputy Chief Legal Officer (2013-2015) of Jennison Associates LLC (investment adviser firm).
Chris Maher (1972)
Year of Election or Appointment: 2013
Assistant Treasurer
Mr. Maher also serves as an officer of other funds. Mr. Maher serves as Assistant Treasurer of FIMM, LLC (2021-present) and FMR Capital, Inc. (2017-present), and is an employee of Fidelity Investments (2008-present). Previously, Mr. Maher served as Assistant Treasurer of certain funds (2013-2020); Vice President of Asset Management Compliance (2013), Vice President of the Program Management Group of FMR (investment adviser firm, 2010-2013), and Vice President of Valuation Oversight (2008-2010).
Jamie Pagliocco (1964)
Year of Election or Appointment: 2020
Vice President
Mr. Pagliocco also serves as Vice President of other funds. Mr. Pagliocco serves as President of Fixed Income (2020-present), and is an employee of Fidelity Investments (2001-present). Previously, Mr. Pagliocco served as Co-Chief Investment Officer – Bond (2017-2020), Global Head of Bond Trading (2016-2019), and as a portfolio manager.
Kenneth B. Robins (1969)
Year of Election or Appointment: 2020
Chief Compliance Officer
Mr. Robins also serves as an officer of other funds. Mr. Robins serves as Compliance Officer of Fidelity Management & Research Company LLC (investment adviser firm, 2016-present) and is an employee of Fidelity Investments (2004-present). Previously, Mr. Robins served as Compliance Officer of FMR Co., Inc. (investment adviser firm, 2016-2019), as Executive Vice President of Fidelity Investments Money Management, Inc. (investment adviser firm, 2013-2016) and served in other fund officer roles.
Brett Segaloff (1972)
Year of Election or Appointment: 2021
Anti-Money Laundering (AML) Officer
Mr. Segaloff also serves as an AML Officer of other funds and other related entities. He is Director, Anti-Money Laundering (2007-present) of FMR LLC (diversified financial services company) and is an employee of Fidelity Investments (1996-present).
Stacie M. Smith (1974)
Year of Election or Appointment: 2013
Assistant Treasurer
Ms. Smith also serves as an officer of other funds. Ms. Smith serves as Assistant Treasurer of FIMM, LLC (2021-present) and FMR Capital, Inc. (2017-present), is an employee of Fidelity Investments (2009-present), and has served in other fund officer roles. Prior to joining Fidelity Investments, Ms. Smith served as Senior Audit Manager of Ernst & Young LLP (accounting firm, 1996-2009). Previously, Ms. Smith served as Assistant Treasurer (2013-2019) and Deputy Treasurer (2013-2016) of certain Fidelity® funds.
Jim Wegmann (1979)
Year of Election or Appointment: 2021
Deputy Treasurer
Mr. Wegmann also serves as an officer of other funds. Mr. Wegmann serves as Assistant Treasurer of FIMM, LLC (2021-present) and is an employee of Fidelity Investments (2011-present). Previously, Mr. Wegmann served as Assistant Treasurer of certain Fidelity® funds (2019-2021).
Shareholder Expense Example
As a shareholder, you incur two types of costs: (1) transaction costs, which may include sales charges (loads) on purchase payments or redemption proceeds, as applicable and (2) ongoing costs, which generally include management fees, distribution and/or service (12b-1) fees and other Fund expenses. This Example is intended to help you understand your ongoing costs (in dollars) of investing in a fund and to compare these costs with the ongoing costs of investing in other mutual funds.
The Example is based on an investment of $1,000 invested at the beginning of the period and held for the entire period (March 1, 2022 to August 31, 2022).
Actual Expenses
The first line of the accompanying table provides information about actual account values and actual expenses. You may use the information in this line, together with the amount you invested, to estimate the expenses that you paid over the period. Simply divide your account value by $1,000.00 (for example, an $8,600 account value divided by $1,000.00 = 8.6), then multiply the result by the number in the first line for a class/Fund under the heading entitled "Expenses Paid During Period" to estimate the expenses you paid on your account during this period. If any fund is a shareholder of any underlying mutual funds or exchange-traded funds (ETFs) (the Underlying Funds), such fund indirectly bears its proportional share of the expenses of the Underlying Funds in addition to the direct expenses incurred presented in the table. These fees and expenses are not included in the annualized expense ratio used to calculate the expense estimate in the table below.
Hypothetical Example for Comparison Purposes
The second line of the accompanying table provides information about hypothetical account values and hypothetical expenses based on the actual expense ratio and an assumed rate of return of 5% per year before expenses, which is not the actual return. The hypothetical account values and expenses may not be used to estimate the actual ending account balance or expenses you paid for the period. You may use this information to compare the ongoing costs of investing in the Fund and other funds. To do so, compare this 5% hypothetical example with the 5% hypothetical examples that appear in the shareholder reports of the other funds. If any fund is a shareholder of any Underlying Funds, such fund indirectly bears its proportional share of the expenses of the Underlying Funds in addition to the direct expenses as presented in the table. These fees and expenses are not included in the annualized expense ratio used to calculate the expense estimate in the table below.
Please note that the expenses shown in the table are meant to highlight your ongoing costs only and do not reflect any transaction costs. Therefore, the second line of the table is useful in comparing ongoing costs only, and will not help you determine the relative total costs of owning different funds. In addition, if these transactional costs were included, your costs would have been higher.
| | Annualized Expense Ratio-A | Beginning
Account Value
March 1, 2022 | Ending
Account Value
August 31, 2022 | Expenses Paid
During Period-B
March 1, 2022
to August 31, 2022 |
| Fidelity Total Bond K6 Fund | .30% | | | |
| Actual | | $1,000.00 | $922.90 | $1.45 |
| Hypothetical-C | | $1,000.00 | $1,023.69 | $1.53 |
A Annualized expense ratio reflects expenses net of applicable fee waivers.
B Expenses are equal to the annualized expense ratio, multiplied by the average account value over the period, multiplied by 184/ 365 (to reflect the one-half year period). The fees and expenses of any Underlying Funds are not included in each annualized expense ratio.
C 5% return per year before expenses
Distributions (Unaudited)
The dividend and capital gains distributions for the fund(s) are available on Fidelity.com or Institutional.Fidelity.com.
The fund hereby designates as a capital gain dividend with respect to the taxable year ended August 31, 2022, $5,221,452, or, if subsequently determined to be different, the net capital gain of such year.
A total of 19.10% of the dividends distributed during the fiscal year was derived from interest on U.S. Government securities which is generally exempt from state income tax.
The fund designates 89.58% of the short-term capital gain dividends distributed in December during the fiscal year as qualifying to be taxed as short-term capital gain dividends for nonresident alien shareholders.
The fund designates $41,835,553 of distributions paid in the calendar year 2021 as qualifying to be taxed as section 163(j) interest dividends.
The fund will notify shareholders in January 2023 of amounts for use in preparing 2022 income tax returns.
TBDK6-ANN-1022
1.9884015.105
Item 2.
Code of Ethics
As of the end of the period, August 31, 2022, Fidelity Income Fund (the trust) has adopted a code of ethics, as defined in Item 2 of Form N-CSR, that applies to its President and Treasurer and its Chief Financial Officer. A copy of the code of ethics is filed as an exhibit to this Form N-CSR.
Item 3.
Audit Committee Financial Expert
The Board of Trustees of the trust has determined that Elizabeth S. Acton is an audit committee financial expert, as defined in Item 3 of Form N-CSR. Ms. Acton is independent for purposes of Item 3 of Form N-CSR.
Item 4.
Principal Accountant Fees and Services
Fees and Services
The following table presents fees billed by PricewaterhouseCoopers LLP (“PwC”) in each of the last two fiscal years for services rendered to Fidelity Environmental Bond Fund, Fidelity Government Income Fund, Fidelity Intermediate Government Income Fund, Fidelity Series Government Bond Index Fund, and Fidelity Total Bond Fund (the “Funds”):
Services Billed by PwC
August 31, 2022 FeesA
| | | | |
| Audit Fees | Audit-Related Fees | Tax Fees | All Other Fees |
Fidelity Environmental Bond Fund | $73,000 | $5,700 | $7,600 | $2,500 |
Fidelity Government Income Fund | $68,100 | $5,800 | $9,300 | $2,500 |
Fidelity Intermediate Government Income Fund | $64,400 | $5,400 | $9,300 | $2,400 |
Fidelity Series Government Bond Index Fund | $58,600 | $5,000 | $9,300 | $2,200 |
Fidelity Total Bond Fund | $116,000 | $9,100 | $11,400 | $4,000 |
| | | | | |
| Audit Fees | Audit-Related Fees | Tax Fees | All Other Fees |
Fidelity Environmental Bond Fund | $41,700 | $700 | $7,400 | $300 |
Fidelity Government Income Fund | $71,700 | $6,100 | $9,000 | $2,900 |
Fidelity Intermediate Government Income Fund | $65,200 | $5,600 | $10,000 | $2,600 |
Fidelity Series Government Bond Index Fund | $57,000 | $5,300 | $9,600 | $2,500 |
Fidelity Total Bond Fund | $104,200 | $9,100 | $11,100 | $4,300 |
A Amounts may reflect rounding.
B Fidelity Environmental Bond Fund commenced operations on June 15, 2021.
The following table presents fees billed by Deloitte & Touche LLP, the member firms of Deloitte Touche Tohmatsu, and their respective affiliates (collectively, “Deloitte Entities”) in each of the last two fiscal years for services rendered to Fidelity Total Bond K6 Fund (the “Fund”):
Services Billed by Deloitte Entities
August 31, 2022 FeesA
| | | | |
| Audit Fees | Audit-Related Fees | Tax Fees | All Other Fees |
Fidelity Total Bond K6 Fund | $71,800 | $- | $10,900 | $1,600 |
| | | | |
| Audit Fees | Audit-Related Fees | Tax Fees | All Other Fees |
Fidelity Total Bond K6 Fund | $69,900 | $- | $10,000 | $1,700 |
A Amounts may reflect rounding.
The following table(s) present(s) fees billed by Deloitte Entities and PwC that were required to be approved by the Audit Committee for services that relate directly to the operations and financial reporting of the Fund(s) and that are rendered on behalf of Fidelity Management & Research Company LLC ("FMR") and entities controlling, controlled by, or under common control with FMR (not including any sub-adviser whose role is primarily portfolio management and is subcontracted with or overseen by another investment adviser) that provide ongoing services to the Fund(s) (“Fund Service Providers”):
Services Billed by PwC
| | | |
| August 31, 2022A | August 31, 2021A,B |
|
Audit-Related Fees | $7,914,600 | $8,959,700 |
|
Tax Fees | $353,200 | $11,200 |
|
All Other Fees | $- | $- |
|
A Amounts may reflect rounding.
B May include amounts billed prior to Fidelity Environmental Bond Fund’s
commencement of operations.
Services Billed by Deloitte Entities
| | | |
| August 31, 2022A | August 31, 2021A |
|
Audit-Related Fees | $- | $- |
|
Tax Fees | $- | $- |
|
All Other Fees | $- | $- |
|
A Amounts may reflect rounding.
“Audit-Related Fees” represent fees billed for assurance and related services that are reasonably related to the performance of the fund audit or the review of the fund's financial statements and that are not reported under Audit Fees.
“Tax Fees” represent fees billed for tax compliance, tax advice or tax planning that relate directly to the operations and financial reporting of the fund.
“All Other Fees” represent fees billed for services provided to the fund or Fund Service Provider, a significant portion of which are assurance related, that relate directly to the operations and financial reporting of the fund, excluding those services that are reported under Audit Fees, Audit-Related Fees or Tax Fees.
Assurance services must be performed by an independent public accountant.
* * *
The aggregate non-audit fees billed by Deloitte Entities and PwC for services rendered to the Fund(s), FMR (not including any sub-adviser whose role is primarily portfolio management and is subcontracted with or overseen by another investment adviser), and any Fund Service Provider for each of the last two fiscal years of the Fund(s) are as follows:
| | |
Billed By | August 31, 2022A | August 31, 2021A,B |
PwC | $13,347,700 | $14,379,600 |
Deloitte Entities | $470,100 | $533,300 |
A Amounts may reflect rounding.
B May include amounts billed prior to Fidelity Environmental Bond Fund’s
commencement of operations.
The trust's Audit Committee has considered non-audit services that were not pre-approved that were provided by Deloitte Entities and PwC to Fund Service Providers to be compatible with maintaining the independence of Deloitte Entities and PwC in its(their) audit of the Fund(s), taking into account representations from Deloitte Entities and PwC, in accordance with Public Company Accounting Oversight Board rules, regarding its independence from the Fund(s) and its(their) related entities and FMR’s review of the appropriateness and permissibility under applicable law of such non-audit services prior to their provision to the Fund(s) Service Providers.
Audit Committee Pre-Approval Policies and Procedures
The trust’s Audit Committee must pre-approve all audit and non-audit services provided by a fund’s independent registered public accounting firm relating to the operations or financial reporting of the fund. Prior to the commencement of any audit or non-audit services to a fund, the Audit Committee reviews the services to determine whether they are appropriate and permissible under applicable law.
The Audit Committee has adopted policies and procedures to, among other purposes, provide a framework for the Committee’s consideration of non-audit services by the audit firms that audit the Fidelity funds. The policies and procedures require that any non-audit service provided by a fund audit firm to a Fidelity fund and any non-audit service provided by a fund auditor to a Fund Service Provider that relates directly to the operations and financial reporting of a Fidelity fund (“Covered Service”) are subject to approval by the Audit Committee before such service is provided.
All Covered Services must be approved in advance of provision of the service either: (i) by formal resolution of the Audit Committee, or (ii) by oral or written approval of the service by the Chair of the Audit Committee (or if the Chair is unavailable, such other member of the Audit Committee as may be designated by the Chair to act in the Chair’s absence). The approval contemplated by (ii) above is permitted where the Treasurer determines that action on such an engagement is necessary before the next meeting of the Audit Committee.
Non-audit services provided by a fund audit firm to a Fund Service Provider that do not relate directly to the operations and financial reporting of a Fidelity fund are reported to the Audit Committee periodically.
Non-Audit Services Approved Pursuant to Rule 2-01(c)(7)(i)(C) and (ii) of Regulation S-X (“De Minimis Exception”)
There were no non-audit services approved or required to be approved by the Audit Committee pursuant to the De Minimis Exception during the Fund’s(s’) last two fiscal years relating to services provided to (i) the Fund(s) or (ii) any Fund Service Provider that relate directly to the operations and financial reporting of the Fund(s).
Item 5.
Audit Committee of Listed Registrants
Not applicable.
Item 6.
Investments
(a)
Not applicable.
(b)
Not applicable.
Item 7.
Disclosure of Proxy Voting Policies and Procedures for Closed-End Management Investment Companies
Not applicable.
Item 8.
Portfolio Managers of Closed-End Management Investment Companies
Not applicable.
Item 9.
Purchase of Equity Securities by Closed-End Management Investment Company and Affiliated Purchasers
Not applicable.
Item 10.
Submission of Matters to a Vote of Security Holders
There were no material changes to the procedures by which shareholders may recommend nominees to the trust’s Board of Trustees.
Item 11.
Controls and Procedures
(a)(i) The President and Treasurer and the Chief Financial Officer have concluded that the trust’s disclosure controls and procedures (as defined in Rule 30a-3(c) under the Investment Company Act) provide reasonable assurances that material information relating to the trust is made known to them by the appropriate persons, based on their evaluation of these controls and procedures as of a date within 90 days of the filing date of this report.
(a)(ii) There was no change in the trust’s internal control over financial reporting (as defined in Rule 30a-3(d) under the Investment Company Act) that occurred during the period covered by this report that has materially affected, or is reasonably likely to materially affect, the trust’s internal control over financial reporting.
Item 12.
Disclosure of Securities Lending Activities for Closed-End Management
Investment Companies
Not applicable.
Item 13.
Exhibits
SIGNATURES
Pursuant to the requirements of the Securities Exchange Act of 1934 and the Investment Company Act of 1940, the registrant has duly caused this report to be signed on its behalf by the undersigned, thereunto duly authorized.
Fidelity Income Fund
| |
By: | /s/Laura M. Del Prato |
| Laura M. Del Prato |
| President and Treasurer |
|
|
Date: | October 20, 2022 |
Pursuant to the requirements of the Securities Exchange Act of 1934 and the Investment Company Act of 1940, this report has been signed below by the following persons on behalf of the registrant and in the capacities and on the dates indicated.
| |
By: | /s/Laura M. Del Prato |
| Laura M. Del Prato |
| President and Treasurer |
|
|
Date: | October 20, 2022 |
| |
By: | /s/John J. Burke III |
| John J. Burke III |
| Chief Financial Officer |
|
|
Date: | October 20, 2022 |