UNITED STATES
SECURITIES AND EXCHANGE COMMISSION
Washington, D.C. 20549
FORM N-CSR
CERTIFIED SHAREHOLDER REPORT OF REGISTERED
MANAGEMENT INVESTMENT COMPANIES
Investment Company Act file number 811-04085
Fidelity Income Fund
(Exact name of registrant as specified in charter)
245 Summer St., Boston, Massachusetts 02210
(Address of principal executive offices) (Zip code)
Margaret Carey, Secretary
245 Summer St.
Boston, Massachusetts 02210
(Name and address of agent for service)
Registrant's telephone number, including area code:
617-563-7000
| |
Date of fiscal year end: | July 31 |
|
|
Date of reporting period: | July 31, 2023 |
Item 1.
Reports to Stockholders
Fidelity Managed Retirement Income Fund℠
Fidelity Managed Retirement 2010 Fund℠
Fidelity Managed Retirement 2015 Fund℠
Fidelity Managed Retirement 2020 Fund℠
Fidelity Managed Retirement 2025 Fund℠
Fidelity Managed Retirement 2030 Fund℠
Fidelity Managed Retirement 2035 Fund℠
Annual Report
July 31, 2023
Includes Fidelity and Fidelity Advisor share classes
Contents
To view a fund's proxy voting guidelines and proxy voting record for the 12-month period ended June 30, visit http://www.fidelity.com/proxyvotingresults or visit the Securities and Exchange Commission's (SEC) web site at http://www.sec.gov.
You may also call 1-800-544-8544 if you're an individual investing directly with Fidelity, call 1-800-835-5092 if you're a plan sponsor or participant with Fidelity as your recordkeeper or call 1-877-208-0098 on institutional accounts or if you're an advisor or invest through one to request a free copy of the proxy voting guidelines.
Standard & Poor's, S&P and S&P 500 are registered service marks of The McGraw-Hill Companies, Inc. and have been licensed for use by Fidelity Distributors Corporation.
Other third-party marks appearing herein are the property of their respective owners.
All other marks appearing herein are registered or unregistered trademarks or service marks of FMR LLC or an affiliated company. © 2023 FMR LLC. All rights reserved.
This report and the financial statements contained herein are submitted for the general information of the shareholders of the Funds. This report is not authorized for distribution to prospective investors in the Funds unless preceded or accompanied by an effective prospectus.
A fund files its complete schedule of portfolio holdings with the SEC for the first and third quarters of each fiscal year on Form N-PORT. Forms N-PORT are available on the SEC's web site at http://www.sec.gov. A fund's Forms N-PORT may be reviewed and copied at the SEC's Public Reference Room in Washington, DC. Information regarding the operation of the SEC's Public Reference Room may be obtained by calling 1-800-SEC-0330.
For a complete list of a fund's portfolio holdings, view the most recent holdings listing, semiannual report, or annual report on Fidelity's web site at http://www.fidelity.com, http://www.institutional.fidelity.com, or http://www.401k.com, as applicable.
NOT FDIC INSURED •MAY LOSE VALUE •NO BANK GUARANTEE
Neither the Funds nor Fidelity Distributors Corporation is a bank.
Fidelity Managed Retirement Income Fund℠
Average annual total return reflects the change in the value of an investment, assuming reinvestment of distributions from dividend income and capital gains (the profits earned upon the sale of securities that have grown in value, if any) and assuming a constant rate of performance each year. The hypothetical investment and the average annual total returns do not reflect the deduction of taxes that a shareholder would pay on fund distributions or the redemption of fund shares. During periods of reimbursement by Fidelity, a fund's total return will be greater than it would be had the reimbursement not occurred. How a fund did yesterday is no guarantee of how it will do tomorrow.
| Average Annual Total Returns |
| | | | |
Periods ended July 31, 2023 | Past 1 year | Past 5 years | Past 10 years |
Class A (incl. 5.75% sales charge) | -5.62% | 0.85% | 2.43% |
| Fidelity Managed Retirement Income Fund℠ | 0.37% | 2.30% | 3.30% |
| Class K | 0.47% | 2.39% | 3.34% |
| Class K6 | 0.57% | 2.47% | 3.38% |
| Class I | 0.37% | 2.31% | 3.30% |
| Class Z6 | 0.57% | 2.47% | 3.38% |
The initial offering of Class K, Class K6 and Class Z6 took place on August 1, 2019. Returns prior to August 1, 2019 are those of Fidelity Managed Retirement Income Fund, Fidelity Managed Retirement Income Fund and Class I, respectively, and have not been restated to reflect current expenses.
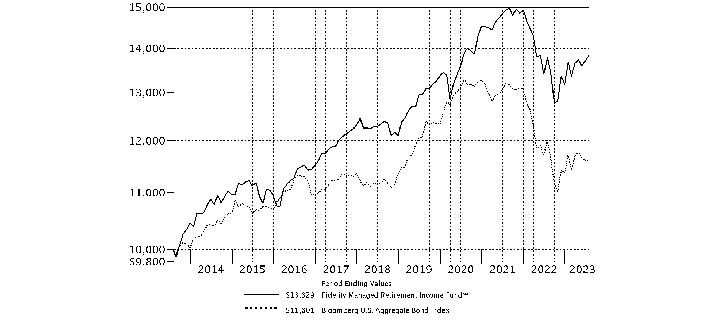
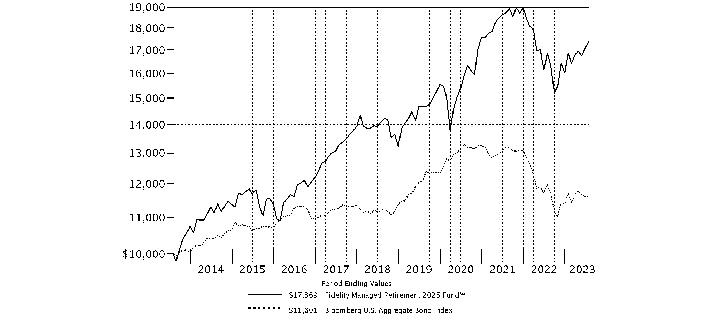
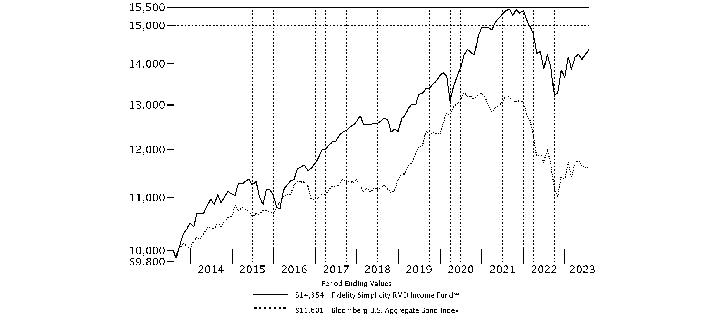
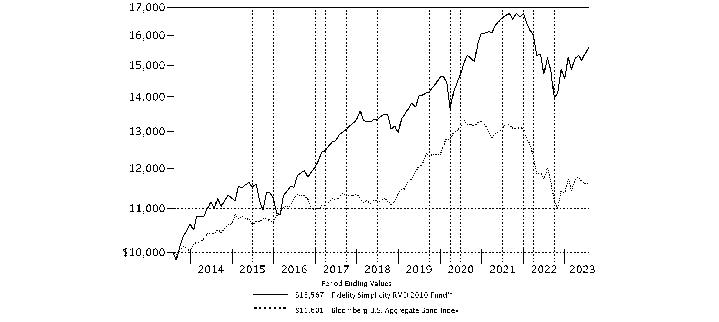
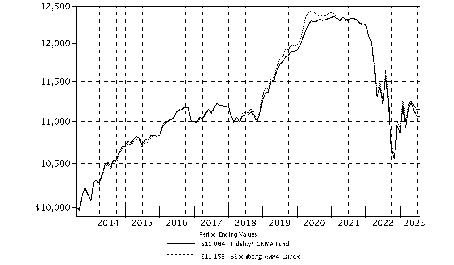
| $10,000 Over 10 Years |
| |
Let's say hypothetically that $10,000 was invested in Fidelity Managed Retirement Income Fund℠, a class of the fund, on July 31, 2013. The chart shows how the value of your investment would have changed, and also shows how the Bloomberg U.S. Aggregate Bond Index performed over the same period. |
|
|
Fidelity Managed Retirement 2010 Fund℠
Average annual total return reflects the change in the value of an investment, assuming reinvestment of distributions from dividend income and capital gains (the profits earned upon the sale of securities that have grown in value, if any) and assuming a constant rate of performance each year. The hypothetical investment and the average annual total returns do not reflect the deduction of taxes that a shareholder would pay on fund distributions or the redemption of fund shares. During periods of reimbursement by Fidelity, a fund's total return will be greater than it would be had the reimbursement not occurred. How a fund did yesterday is no guarantee of how it will do tomorrow.
| Average Annual Total Returns |
| | | | |
Periods ended July 31, 2023 | Past 1 year | Past 5 years | Past 10 years |
Class A (incl. 5.75% sales charge) | -5.33% | 1.25% | 3.41% |
| Fidelity Managed Retirement 2010 Fund℠ | 0.69% | 2.71% | 4.28% |
| Class K | 0.80% | 2.79% | 4.32% |
| Class K6 | 0.90% | 2.87% | 4.37% |
| Class I | 0.69% | 2.71% | 4.28% |
| Class Z6 | 0.88% | 2.87% | 4.37% |
The initial offering of Class K, Class K6 and Class Z6 took place on August 1, 2019. Returns prior to August 1, 2019 are those of Fidelity Managed Retirement 2010 Fund, Fidelity Managed Retirement 2010 Fund and Class I, respectively, and have not been restated to reflect current expenses.
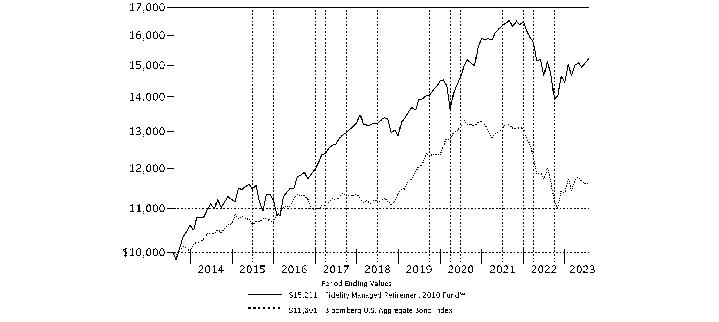
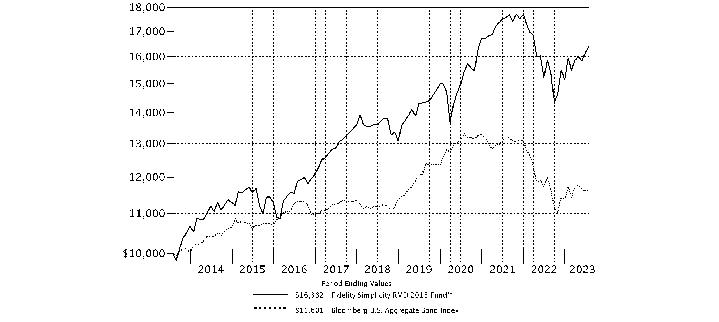
| $10,000 Over 10 Years |
| |
Let's say hypothetically that $10,000 was invested in Fidelity Managed Retirement 2010 Fund℠, a class of the fund, on July 31, 2013. The chart shows how the value of your investment would have changed, and also shows how the Bloomberg U.S. Aggregate Bond Index performed over the same period. |
|
|
Fidelity Managed Retirement 2015 Fund℠
Average annual total return reflects the change in the value of an investment, assuming reinvestment of distributions from dividend income and capital gains (the profits earned upon the sale of securities that have grown in value, if any) and assuming a constant rate of performance each year. The hypothetical investment and the average annual total returns do not reflect the deduction of taxes that a shareholder would pay on fund distributions or the redemption of fund shares. During periods of reimbursement by Fidelity, a fund's total return will be greater than it would be had the reimbursement not occurred. How a fund did yesterday is no guarantee of how it will do tomorrow.
| Average Annual Total Returns |
| | | | |
Periods ended July 31, 2023 | Past 1 year | Past 5 years | Past 10 years |
Class A (incl. 5.75% sales charge) | -4.57% | 1.81% | 3.93% |
| Fidelity Managed Retirement 2015 Fund℠ | 1.49% | 3.28% | 4.80% |
| Class K | 1.60% | 3.36% | 4.85% |
| Class K6 | 1.70% | 3.45% | 4.89% |
| Class I | 1.48% | 3.28% | 4.80% |
| Class Z6 | 1.69% | 3.44% | 4.89% |
The initial offering of Class K, Class K6 and Class Z6 took place on August 1, 2019. Returns prior to August 1, 2019 are those of Fidelity Managed Retirement 2015 Fund, Fidelity Managed Retirement 2015 Fund and Class I, respectively, and have not been restated to reflect current expenses.
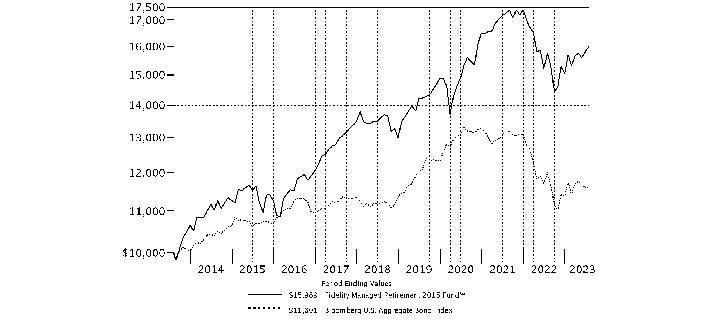
| $10,000 Over 10 Years |
| |
Let's say hypothetically that $10,000 was invested in Fidelity Managed Retirement 2015 Fund℠, a class of the fund, on July 31, 2013. The chart shows how the value of your investment would have changed, and also shows how the Bloomberg U.S. Aggregate Bond Index performed over the same period. |
|
|
Fidelity Managed Retirement 2020 Fund℠
Average annual total return reflects the change in the value of an investment, assuming reinvestment of distributions from dividend income and capital gains (the profits earned upon the sale of securities that have grown in value, if any) and assuming a constant rate of performance each year. The hypothetical investment and the average annual total returns do not reflect the deduction of taxes that a shareholder would pay on fund distributions or the redemption of fund shares. During periods of reimbursement by Fidelity, a fund's total return will be greater than it would be had the reimbursement not occurred. How a fund did yesterday is no guarantee of how it will do tomorrow.
| Average Annual Total Returns |
| | | | |
Periods ended July 31, 2023 | Past 1 year | Past 5 years | Past 10 years |
Class A (incl. 5.75% sales charge) | -3.83% | 2.33% | 4.39% |
| Fidelity Managed Retirement 2020 Fund℠ | 2.29% | 3.81% | 5.27% |
| Class K | 2.41% | 3.89% | 5.31% |
| Class K6 | 2.50% | 3.97% | 5.35% |
| Class I | 2.30% | 3.81% | 5.27% |
| Class Z6 | 2.48% | 3.97% | 5.35% |
The initial offering of Class K, Class K6 and Class Z6 took place on August 1, 2019. Returns prior to August 1, 2019 are those of Fidelity Managed Retirement 2020 Fund, Fidelity Managed Retirement 2020 Fund and Class I, respectively, and have not been restated to reflect current expenses.
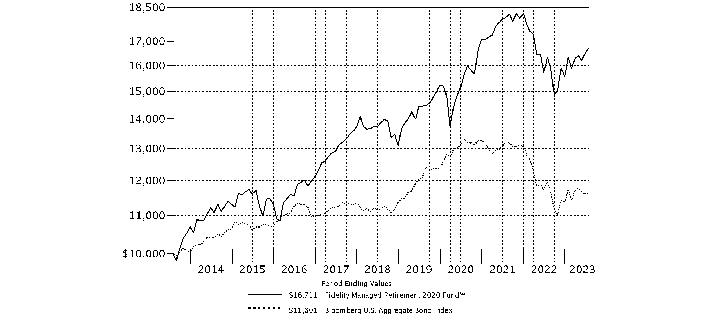
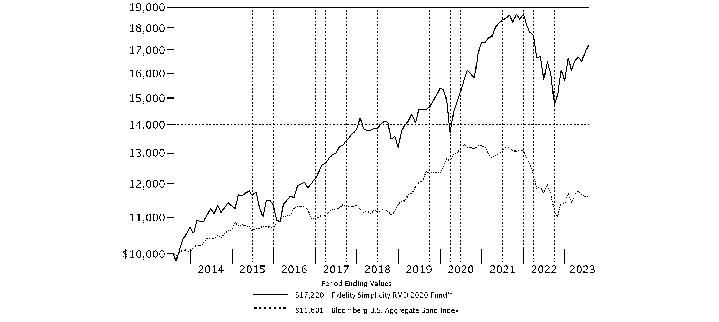
| $10,000 Over 10 Years |
| |
Let's say hypothetically that $10,000 was invested in Fidelity Managed Retirement 2020 Fund℠, a class of the fund, on July 31, 2013. The chart shows how the value of your investment would have changed, and also shows how the Bloomberg U.S. Aggregate Bond Index performed over the same period. |
|
|
Fidelity Managed Retirement 2025 Fund℠
Average annual total return reflects the change in the value of an investment, assuming reinvestment of distributions from dividend income and capital gains (the profits earned upon the sale of securities that have grown in value, if any) and assuming a constant rate of performance each year. The hypothetical investment and the average annual total returns do not reflect the deduction of taxes that a shareholder would pay on fund distributions or the redemption of fund shares. During periods of reimbursement by Fidelity, a fund's total return will be greater than it would be had the reimbursement not occurred. How a fund did yesterday is no guarantee of how it will do tomorrow.
| Average Annual Total Returns |
| | | | |
Periods ended July 31, 2023 | Past 1 year | Past 5 years | Past 10 years |
Class A (incl. 5.75% sales charge) | -3.07% | 2.78% | 4.79% |
| Fidelity Managed Retirement 2025 Fund℠ | 3.09% | 4.26% | 5.68% |
| Class K | 3.20% | 4.35% | 5.72% |
| Class K6 | 3.30% | 4.43% | 5.76% |
| Class I | 3.10% | 4.26% | 5.68% |
| Class Z6 | 3.30% | 4.43% | 5.76% |
The initial offering of Class K, Class K6 and Class Z6 took place on August 1, 2019. Returns prior to August 1, 2019 are those of Fidelity Managed Retirement 2025 Fund, Fidelity Managed Retirement 2025 Fund and Class I, respectively, and have not been restated to reflect current expenses.
| $10,000 Over 10 Years |
| |
Let's say hypothetically that $10,000 was invested in Fidelity Managed Retirement 2025 Fund℠, a class of the fund, on July 31, 2013. The chart shows how the value of your investment would have changed, and also shows how the Bloomberg U.S. Aggregate Bond Index performed over the same period. |
|
|
Fidelity Managed Retirement 2030 Fund℠
Average annual total return reflects the change in the value of an investment, assuming reinvestment of distributions from dividend income and capital gains (the profits earned upon the sale of securities that have grown in value, if any) and assuming a constant rate of performance each year. The hypothetical investment and the average annual total returns do not reflect the deduction of taxes that a shareholder would pay on fund distributions or the redemption of fund shares. During periods of reimbursement by Fidelity, a fund's total return will be greater than it would be had the reimbursement not occurred. How a fund did yesterday is no guarantee of how it will do tomorrow.
| Average Annual Total Returns |
| | | | |
Periods ended July 31, 2023 | Past 1 year | Life of Fund A |
Class A (incl. 5.75% sales charge) | -2.49% | 3.31% |
| Fidelity Managed Retirement 2030 Fund℠ | 3.71% | 5.12% |
| Class K | 3.82% | 5.23% |
| Class K6 | 3.93% | 5.33% |
| Class I | 3.71% | 5.11% |
| Class Z6 | 3.92% | 5.33% |
A From August 16, 2019
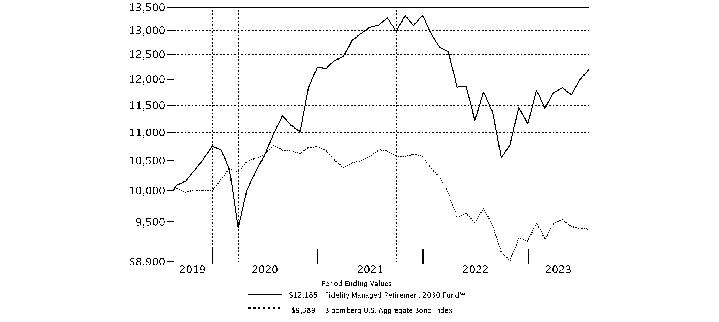
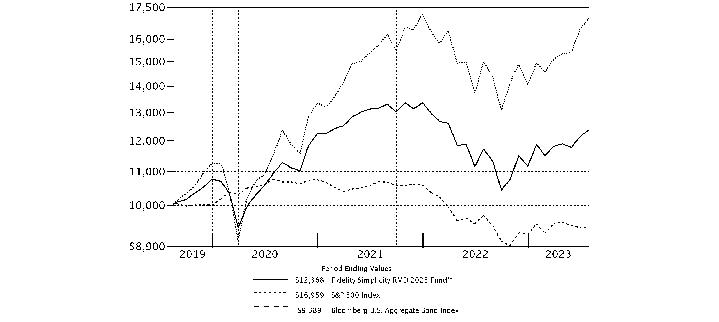
| $10,000 Over Life of Fund |
| |
Let's say hypothetically that $10,000 was invested in Fidelity Managed Retirement 2030 Fund℠, a class of the fund, on August 16, 2019, when the fund started. The chart shows how the value of your investment would have changed, and also shows how the Bloomberg U.S. Aggregate Bond Index performed over the same period. |
|
|
Fidelity Managed Retirement 2035 Fund℠
Average annual total return reflects the change in the value of an investment, assuming reinvestment of distributions from dividend income and capital gains (the profits earned upon the sale of securities that have grown in value, if any) and assuming a constant rate of performance each year. The hypothetical investment and the average annual total returns do not reflect the deduction of taxes that a shareholder would pay on fund distributions or the redemption of fund shares. During periods of reimbursement by Fidelity, a fund's total return will be greater than it would be had the reimbursement not occurred. How a fund did yesterday is no guarantee of how it will do tomorrow.
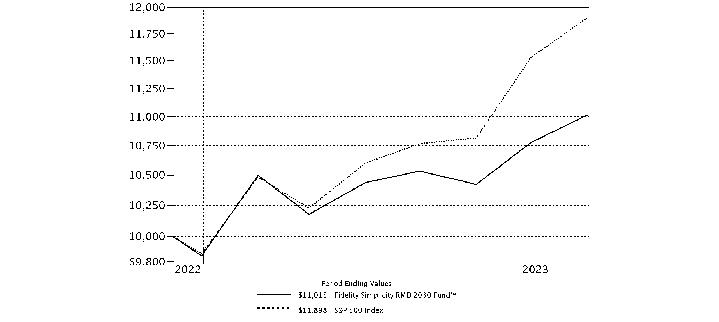
Average annual total returns for Fidelity Managed Retirement 2035 Fund℠ will be reported once the fund is a year old.
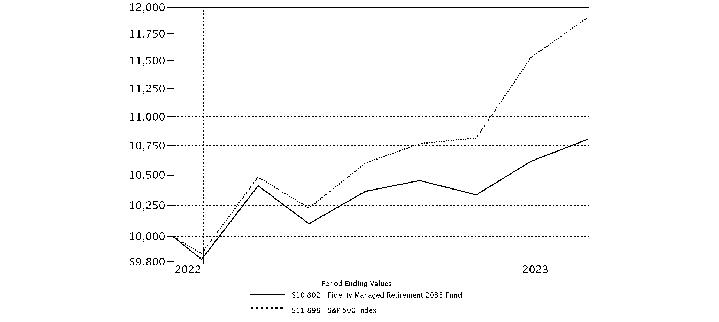
| $10,000 Over Life of Fund |
| |
Let's say hypothetically that $10,000 was invested in Fidelity Managed Retirement 2035 Fund℠, a class of the fund, on December 15, 2022, when the fund started. The chart shows how the value of your investment would have changed, and also shows how the S&P 500 Index performed over the same period. |
|
|
Market Recap:
For the 12 months ending July 31, 2023, continued global economic expansion, falling commodity prices and a slowing in the pace of inflation provided a favorable backdrop for risk assets. The U.S. Federal Reserve and other central banks aggressively tightened monetary policy throughout the period to combat persistently high inflation, leading to a broad retreat from riskier assets and declining prices for stocks and bonds through September 2022. Since then, markets experienced a sharp reversal amid optimism on moderating inflation and policy easing, allowing risk assets to rally through the first seven months of 2023, with U.S. large-cap stocks leading the way.
International equities rose 13.62% for the 12 months, according to the MSCI ACWI (All Country World Index) ex USA Index. All regions gained, with Europe ex U.K. (+23%) leading the way. Japan (+16%) also outperformed, whereas Canada (+6%) lagged by the widest margin. By sector, industrials (+20%) was the top performer, followed by information technology and consumer discretionary (+18% each). Financials (+17%) also topped the broader index. Conversely, real estate (-5%) fared worst by a wide margin.
U.S. stocks gained 12.62% for the 12 months, as measured by the Dow Jones U.S. Total Stock Market Index, as all but two sectors rose. Information technology (+27%), communication services (+19%) and industrials (+18%) led. Conversely, real estate (-9%) and utilities (-6%) lagged most. Growth stocks outpaced value, while larger-caps topped small-caps. Commodities returned -7.88%, according to the Bloomberg Commodity Index Total Return.
U.S. taxable investment-grade bonds returned -3.37% for the 12 months, per the Bloomberg U.S. Aggregate Bond Index, amid elevated inflation and rising interest rates. Since March 2022, the Fed has hiked its benchmark interest rate 11 times, by 5.25 percentage points, while allowing up to billions in bonds to mature each month without investing the proceeds. Short-term U.S. Treasuries (+3.98%) topped U.S. investment-grade corporate bonds (-1.29%), while commercial mortgage-backed securities (-3.26%) and agencies (-1.30%) also lost ground. Outside the index, leveraged loans (+10.06%), U.S. high-yield bonds (+4.16%) and emerging-markets debt (+5.20%) rose, whereas Treasury Inflation-Protected Securities (-5.39%) declined.
Comments from Co-Portfolio Managers Andrew Dierdorf and Brett Sumsion:
For the fiscal year, returns for the share classes of Fidelity® Managed Retirement Funds (excluding sales charges, if applicable) ranged from about 0% to 4%, with performance trending higher among the Funds for those investors with a longer retirement horizon. Funds for investors with a greater number years to invest in retirement - those that invest in a greater percentage of equities, and less fixed-income and short-term debt exposure - fared a bit better than those with more exposure to fixed-income and short-term securities, and a lower allocation to equities. The Fidelity® Managed Retirement Funds had mixed results versus their Composite indexes the past 12 months. The performance of the underlying investment funds notably contributed to the Funds' performance versus Composite indexes, especially among U.S. equities. In this asset class, an investment in Fidelity® Series Blue Chip Growth Fund (+26.84%) stood out, given its outperformance of the benchmark, the Russell 1000® Growth Index (+17.31%). Among non-U.S. equities, Fidelity® Series Emerging Markets Opportunities Fund (+12.85%) outpaced the 8.39% advance of the MSCI Emerging Markets Index. Among U.S. investment-grade bonds, Fidelity® Series Investment Grade Bond Fund returned -1.86%, topping the -3.37% result of its benchmark, the Bloomberg U.S. Aggregate Bond Index. In contrast, active asset allocation decisions detracted from the Funds' performance versus Composites. Specifically, underweighting U.S. equities hurt the Funds' relative results. An overweight position in long-term U.S. Treasury bonds also weighed on relative performance.
The views expressed above reflect those of the portfolio manager(s) only through the end of the period as stated on the cover of this report and do not necessarily represent the views of Fidelity or any other person in the Fidelity organization. Any such views are subject to change at any time based upon market or other conditions and Fidelity disclaims any responsibility to update such views. These views may not be relied on as investment advice and, because investment decisions for a Fidelity fund are based on numerous factors, may not be relied on as an indication of trading intent on behalf of any Fidelity fund.
The information in the following tables is based on the direct Investments of the Fund.
Top Holdings (% of Fund's net assets) |
| |
| Fidelity Series 0-5 Year Inflation-Protected Bond Index Fund | 20.0 | |
| Fidelity Series Investment Grade Bond Fund | 12.4 | |
| Fidelity Series Government Bond Index Fund | 12.1 | |
| Fidelity Series Investment Grade Securitized Fund | 8.4 | |
| Fidelity Series Corporate Bond Fund | 8.3 | |
| Fidelity Series Treasury Bill Index Fund | 6.6 | |
| Fidelity Series International Developed Markets Bond Index Fund | 3.9 | |
| Fidelity Series Emerging Markets Opportunities Fund | 3.9 | |
| Fidelity Series Long-Term Treasury Bond Index Fund | 3.8 | |
| Fidelity Series Government Money Market Fund 5.33% | 2.3 | |
| | 81.7 | |
| |
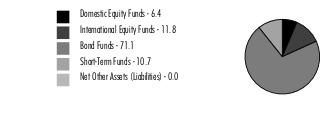
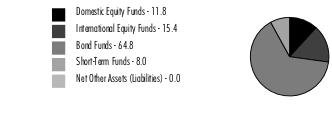
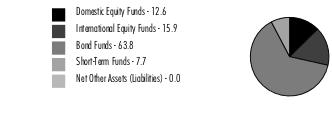
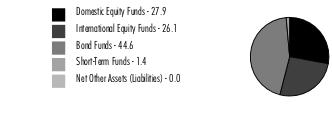
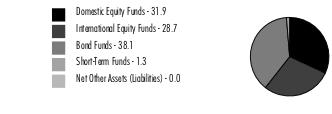
Asset Allocation (% of Fund's net assets) |
|
Percentages shown as 0.0% may reflect amounts less than 0.05%. |
|
Domestic Equity Funds category includes Fidelity Series Commodity Strategy Fund which invests in commodity-related investments.
Fidelity Managed Retirement Income Fund℠
Showing Percentage of Net Assets
| Domestic Equity Funds - 6.4% |
| | | Shares | Value ($) |
| Fidelity Series Blue Chip Growth Fund (a) | | 14,098 | 207,095 |
| Fidelity Series Commodity Strategy Fund (a) | | 1,199 | 123,398 |
| Fidelity Series Large Cap Growth Index Fund (a) | | 7,264 | 130,833 |
| Fidelity Series Large Cap Stock Fund (a) | | 7,335 | 145,083 |
| Fidelity Series Large Cap Value Index Fund (a) | | 17,992 | 269,527 |
| Fidelity Series Small Cap Core Fund (a) | | 66 | 715 |
| Fidelity Series Small Cap Opportunities Fund (a) | | 4,927 | 66,365 |
| Fidelity Series Value Discovery Fund (a) | | 6,484 | 99,468 |
| TOTAL DOMESTIC EQUITY FUNDS (Cost $880,346) | | | 1,042,484 |
| | | | |
| International Equity Funds - 11.8% |
| | | Shares | Value ($) |
| Fidelity Series Canada Fund (a) | | 7,523 | 110,291 |
| Fidelity Series Emerging Markets Fund (a) | | 18,280 | 159,950 |
| Fidelity Series Emerging Markets Opportunities Fund (a) | | 35,323 | 637,224 |
| Fidelity Series International Growth Fund (a) | | 16,743 | 278,109 |
| Fidelity Series International Index Fund (a) | | 8,921 | 105,177 |
| Fidelity Series International Small Cap Fund (a) | | 5,246 | 87,237 |
| Fidelity Series International Value Fund (a) | | 24,460 | 280,062 |
| Fidelity Series Overseas Fund (a) | | 21,905 | 278,417 |
| TOTAL INTERNATIONAL EQUITY FUNDS (Cost $1,729,593) | | | 1,936,467 |
| | | | |
| Bond Funds - 71.1% |
| | | Shares | Value ($) |
| Fidelity Series 0-5 Year Inflation-Protected Bond Index Fund (a) | | 344,981 | 3,270,413 |
| Fidelity Series 5+ Year Inflation-Protected Bond Index Fund (a) | | 12,673 | 99,867 |
| Fidelity Series Corporate Bond Fund (a) | | 150,486 | 1,364,912 |
| Fidelity Series Emerging Markets Debt Fund (a) | | 11,238 | 84,622 |
| Fidelity Series Emerging Markets Debt Local Currency Fund (a) | | 2,969 | 28,678 |
| Fidelity Series Floating Rate High Income Fund (a) | | 1,867 | 16,783 |
| Fidelity Series Government Bond Index Fund (a) | | 217,610 | 1,984,604 |
| Fidelity Series High Income Fund (a) | | 10,775 | 89,000 |
| Fidelity Series International Credit Fund (a) | | 969 | 7,460 |
| Fidelity Series International Developed Markets Bond Index Fund (a) | | 75,459 | 642,907 |
| Fidelity Series Investment Grade Bond Fund (a) | | 204,223 | 2,027,936 |
| Fidelity Series Investment Grade Securitized Fund (a) | | 155,201 | 1,376,634 |
| Fidelity Series Long-Term Treasury Bond Index Fund (a) | | 106,778 | 626,786 |
| Fidelity Series Real Estate Income Fund (a) | | 2,409 | 23,369 |
| TOTAL BOND FUNDS (Cost $12,989,271) | | | 11,643,971 |
| | | | |
| Short-Term Funds - 10.7% |
| | | Shares | Value ($) |
| Fidelity Series Government Money Market Fund 5.33% (a)(b) | | 373,590 | 373,590 |
| Fidelity Series Short-Term Credit Fund (a) | | 30,982 | 298,973 |
| Fidelity Series Treasury Bill Index Fund (a) | | 107,893 | 1,072,458 |
| TOTAL SHORT-TERM FUNDS (Cost $1,759,138) | | | 1,745,021 |
| | | | |
| TOTAL INVESTMENT IN SECURITIES - 100.0% (Cost $17,358,348) | 16,367,943 |
NET OTHER ASSETS (LIABILITIES) - 0.0% | (440) |
| NET ASSETS - 100.0% | 16,367,503 |
| | |
Legend
| (b) | The rate quoted is the annualized seven-day yield of the fund at period end. |
Affiliated Underlying Funds
Fiscal year to date information regarding the Fund's investments in affiliated Underlying Funds is presented below. Exchanges between classes of the same affiliated Underlying Funds may occur. If an Underlying Funds changes its name, the name presented below is the name in effect at period end.
| Affiliate | Value, beginning of period ($) | Purchases ($) | Sales Proceeds ($) | Dividend Income ($) | Realized Gain (loss) ($) | Change in Unrealized appreciation (depreciation) ($) | Value, end of period ($) |
| Fidelity Series 0-5 Year Inflation-Protected Bond Index Fund | 3,604,910 | 680,283 | 796,815 | 168,939 | (21,339) | (192,912) | 3,270,413 |
| Fidelity Series 5+ Year Inflation-Protected Bond Index Fund | 18,229 | 104,446 | 18,968 | 6,570 | (1,069) | (2,771) | 99,867 |
| Fidelity Series Blue Chip Growth Fund | 261,605 | 82,247 | 175,319 | 8,660 | (41,112) | 79,674 | 207,095 |
| Fidelity Series Canada Fund | 149,361 | 24,495 | 67,466 | 4,006 | (20) | 3,921 | 110,291 |
| Fidelity Series Commodity Strategy Fund | 272,004 | 188,208 | 170,560 | 146,920 | (75,909) | (90,345) | 123,398 |
| Fidelity Series Corporate Bond Fund | 1,389,346 | 305,925 | 262,254 | 52,627 | (17,637) | (50,468) | 1,364,912 |
| Fidelity Series Emerging Markets Debt Fund | 94,209 | 14,373 | 25,252 | 5,315 | (6,516) | 7,808 | 84,622 |
| Fidelity Series Emerging Markets Debt Local Currency Fund | 31,314 | 2,796 | 9,563 | - | (989) | 5,120 | 28,678 |
| Fidelity Series Emerging Markets Fund | 114,448 | 71,427 | 37,401 | 2,541 | (7,221) | 18,697 | 159,950 |
| Fidelity Series Emerging Markets Opportunities Fund | 1,035,222 | 95,728 | 560,559 | 21,274 | (116,166) | 182,999 | 637,224 |
| Fidelity Series Floating Rate High Income Fund | 17,773 | 5,836 | 7,077 | 1,398 | (287) | 538 | 16,783 |
| Fidelity Series Government Bond Index Fund | 2,040,519 | 465,345 | 391,276 | 46,814 | (19,995) | (109,989) | 1,984,604 |
| Fidelity Series Government Money Market Fund 5.33% | 334,931 | 173,852 | 135,193 | 15,576 | - | - | 373,590 |
| Fidelity Series High Income Fund | 97,582 | 15,482 | 21,346 | 5,911 | (1,435) | (1,283) | 89,000 |
| Fidelity Series International Credit Fund | 7,830 | 435 | - | 435 | - | (805) | 7,460 |
| Fidelity Series International Developed Markets Bond Index Fund | 721,484 | 103,376 | 133,397 | 14,966 | (9,170) | (39,386) | 642,907 |
| Fidelity Series International Growth Fund | 310,909 | 61,062 | 116,955 | 9,596 | (17,948) | 41,041 | 278,109 |
| Fidelity Series International Index Fund | 130,186 | 21,979 | 61,500 | 3,078 | (3,490) | 18,002 | 105,177 |
| Fidelity Series International Small Cap Fund | 95,915 | 17,057 | 27,139 | 5,284 | (5,811) | 7,215 | 87,237 |
| Fidelity Series International Value Fund | 308,251 | 61,463 | 133,913 | 9,396 | (4,252) | 48,513 | 280,062 |
| Fidelity Series Investment Grade Bond Fund | 2,109,226 | 442,793 | 404,922 | 77,454 | (21,368) | (97,793) | 2,027,936 |
| Fidelity Series Investment Grade Securitized Fund | 1,491,968 | 282,212 | 286,589 | 47,190 | (19,537) | (91,420) | 1,376,634 |
| Fidelity Series Large Cap Growth Index Fund | 165,518 | 41,171 | 93,351 | 1,256 | 6,536 | 10,959 | 130,833 |
| Fidelity Series Large Cap Stock Fund | 181,313 | 47,982 | 97,933 | 10,843 | 3,842 | 9,879 | 145,083 |
| Fidelity Series Large Cap Value Index Fund | 346,194 | 103,648 | 188,926 | 10,231 | 7,025 | 1,586 | 269,527 |
| Fidelity Series Long-Term Treasury Bond Index Fund | 795,851 | 219,027 | 283,475 | 20,973 | (61,555) | (43,062) | 626,786 |
| Fidelity Series Overseas Fund | 312,736 | 54,129 | 121,071 | 5,054 | (9,806) | 42,429 | 278,417 |
| Fidelity Series Real Estate Income Fund | 56,336 | 19,363 | 46,529 | 4,334 | (4,880) | (921) | 23,369 |
| Fidelity Series Short-Term Credit Fund | 334,147 | 33,484 | 67,300 | 7,447 | (1,516) | 158 | 298,973 |
| Fidelity Series Small Cap Core Fund | - | 1,691 | 1,044 | - | (13) | 81 | 715 |
| Fidelity Series Small Cap Opportunities Fund | 86,328 | 18,180 | 41,395 | 4,111 | (3,164) | 6,416 | 66,365 |
| Fidelity Series Treasury Bill Index Fund | 1,005,003 | 422,914 | 352,191 | 45,281 | (646) | (2,622) | 1,072,458 |
| Fidelity Series Value Discovery Fund | 127,676 | 36,887 | 65,468 | 5,457 | 1,732 | (1,359) | 99,468 |
| | 18,048,324 | 4,219,296 | 5,202,147 | 768,937 | (453,716) | (240,100) | 16,367,943 |
Amounts in the dividend income column in the above table include any capital gain distributions from underlying funds, which are presented in the corresponding line item in the Statement of Operations, if applicable.
Amounts included in the purchases and sales proceeds columns may include in-kind transactions, if applicable.
Investment Valuation
The following is a summary of the inputs used, as of July 31, 2023, involving the Fund's assets and liabilities carried at fair value. The inputs or methodology used for valuing securities may not be an indication of the risk associated with investing in those securities. For more information on valuation inputs, and their aggregation into the levels used below, please refer to the Investment Valuation section in the accompanying Notes to Financial Statements.
| Valuation Inputs at Reporting Date: |
| Description | Total ($) | Level 1 ($) | Level 2 ($) | Level 3 ($) |
Investments in Securities: | | | | |
|
| Domestic Equity Funds | 1,042,484 | 1,042,484 | - | - |
|
| International Equity Funds | 1,936,467 | 1,936,467 | - | - |
|
| Bond Funds | 11,643,971 | 11,643,971 | - | - |
|
| Short-Term Funds | 1,745,021 | 1,745,021 | - | - |
| Total Investments in Securities: | 16,367,943 | 16,367,943 | - | - |
Fidelity Managed Retirement Income Fund℠
| Statement of Assets and Liabilities |
| | | | July 31, 2023 |
| | | | | |
| Assets | | | | |
| Investment in securities, at value - See accompanying schedule: | | | | |
Affiliated issuers (cost $17,358,348) | $ | 16,367,943 | | |
| | | | | |
| | | | | |
| Total Investment in Securities (cost $17,358,348) | | | $ | 16,367,943 |
| Cash | | | | 14 |
| Receivable for investments sold | | | | 119,157 |
| Receivable for fund shares sold | | | | 311 |
Total assets | | | | 16,487,425 |
| Liabilities | | | | |
| Payable for investments purchased | $ | 100,378 | | |
| Payable for fund shares redeemed | | 13,369 | | |
| Accrued management fee | | 6,023 | | |
| Distribution and service plan fees payable | | 152 | | |
| Total Liabilities | | | | 119,922 |
| Net Assets | | | $ | 16,367,503 |
| Net Assets consist of: | | | | |
| Paid in capital | | | $ | 18,058,584 |
| Total accumulated earnings (loss) | | | | (1,691,081) |
| Net Assets | | | $ | 16,367,503 |
| | | | | |
| Net Asset Value and Maximum Offering Price | | | | |
| Class A : | | | | |
Net Asset Value and redemption price per share ($807,104 ÷ 14,931.09 shares)(a) | | | $ | 54.06 |
| Maximum offering price per share (100/94.25 of $54.06) | | | $ | 57.36 |
| Fidelity Managed Retirement Income : | | | | |
Net Asset Value, offering price and redemption price per share ($14,669,555 ÷ 271,437 shares) | | | $ | 54.04 |
| Class K : | | | | |
Net Asset Value, offering price and redemption price per share ($130,713 ÷ 2,418.29 shares) | | | $ | 54.05 |
| Class K6 : | | | | |
Net Asset Value, offering price and redemption price per share ($493,702 ÷ 9,132.61 shares) | | | $ | 54.06 |
| Class I : | | | | |
Net Asset Value, offering price and redemption price per share ($159,016 ÷ 2,938.95 shares) | | | $ | 54.11 |
| Class Z6 : | | | | |
Net Asset Value, offering price and redemption price per share ($107,413 ÷ 1,988.08 shares) | | | $ | 54.03 |
(a)Redemption price per share is equal to net asset value less any applicable contingent deferred sales charge. |
| Statement of Operations |
| | | | Year ended July 31, 2023 |
| Investment Income | | | | |
| Dividends: | | | | |
| Affiliated issuers | | | $ | 731,503 |
| Expenses | | | | |
| Management fee | $ | 75,062 | | |
| Distribution and service plan fees | | 1,680 | | |
| Independent trustees' fees and expenses | | 62 | | |
| Total expenses before reductions | | 76,804 | | |
| Expense reductions | | (36) | | |
| Total expenses after reductions | | | | 76,768 |
| Net Investment income (loss) | | | | 654,735 |
| Realized and Unrealized Gain (Loss) | | | | |
| Net realized gain (loss) on: | | | | |
| Investment Securities: | | | | |
| Affiliated issuers | | (453,716) | | |
| Capital gain distributions from underlying funds: | | | | |
| Affiliated issuers | | 37,434 | | |
| Total net realized gain (loss) | | | | (416,282) |
| Change in net unrealized appreciation (depreciation) on: | | | | |
| Investment Securities: | | | | |
| Affiliated issuers | | (240,100) | | |
| Total change in net unrealized appreciation (depreciation) | | | | (240,100) |
| Net gain (loss) | | | | (656,382) |
| Net increase (decrease) in net assets resulting from operations | | | $ | (1,647) |
| Statement of Changes in Net Assets |
| |
| | Year ended July 31, 2023 | | Year ended July 31, 2022 |
| Increase (Decrease) in Net Assets | | | | |
| Operations | | | | |
| Net investment income (loss) | $ | 654,735 | $ | 512,071 |
| Net realized gain (loss) | | (416,282) | | 154,259 |
| Change in net unrealized appreciation (depreciation) | | (240,100) | | (2,331,406) |
| Net increase (decrease) in net assets resulting from operations | | (1,647) | | (1,665,076) |
| Distributions to shareholders | | (850,429) | | (799,835) |
| | | | | |
| Share transactions - net increase (decrease) | | (828,342) | | (1,238,197) |
| Total increase (decrease) in net assets | | (1,680,418) | | (3,703,108) |
| | | | | |
| Net Assets | | | | |
| Beginning of period | | 18,047,921 | | 21,751,029 |
| End of period | $ | 16,367,503 | $ | 18,047,921 |
| | | | | |
| | | | | |
| Fidelity Advisor Managed Retirement Income Fund℠ Class A |
| |
| Years ended July 31, | | 2023 | | 2022 | | 2021 | | 2020 | | 2019 |
Selected Per-Share Data | | | | | | | | | | |
| Net asset value, beginning of period | $ | 56.57 | $ | 63.52 | $ | 60.44 | $ | 57.74 | $ | 57.55 |
| Income from Investment Operations | | | | | | | | | | |
Net investment income (loss) A,B | | 1.924 | | 1.317 | | .309 | | .684 | | 1.029 |
| Net realized and unrealized gain (loss) | | (1.950) | | (6.180) | | 4.009 | | 3.226 | | 1.594 |
| Total from investment operations | | (.026) | | (4.863) | | 4.318 | | 3.910 | | 2.623 |
| Distributions from net investment income | | (1.849) | | (1.252) | | (.329) | | (.776) | | (1.047) |
| Distributions from net realized gain | | (.635) | | (.835) | | (.909) | | (.434) | | (1.386) |
| Total distributions | | (2.484) | | (2.087) | | (1.238) | | (1.210) | | (2.433) |
| Net asset value, end of period | $ | 54.06 | $ | 56.57 | $ | 63.52 | $ | 60.44 | $ | 57.74 |
Total Return C,D | | .14% | | (7.90)% | | 7.21% | | 6.86% | | 4.78% |
Ratios to Average Net Assets B,E,F | | | | | | | | | | |
| Expenses before reductions | | .70% | | .70% | | .70% | | .70% | | .71% |
| Expenses net of fee waivers, if any | | .70% | | .70% | | .70% | | .70% | | .71% |
| Expenses net of all reductions | | .69% | | .70% | | .70% | | .70% | | .71% |
| Net investment income (loss) | | 3.60% | | 2.20% | | .50% | | 1.18% | | 1.83% |
| Supplemental Data | | | | | | | | | | |
| Net assets, end of period (000 omitted) | $ | 807 | $ | 717 | $ | 716 | $ | 453 | $ | 177 |
Portfolio turnover rate G | | 25% | | 64% | | 31% | | 62% H | | 68% |
ACalculated based on average shares outstanding during the period.
BNet investment income (loss) is affected by the timing of the declaration of dividends by any underlying mutual funds or exchange-traded funds (ETFs). Net investment income (loss) of any mutual funds or ETFs is not included in the Fund's net investment income (loss) ratio.
CTotal returns would have been lower if certain expenses had not been reduced during the applicable periods shown.
DTotal returns do not include the effect of the sales charges.
EFees and expenses of any underlying mutual funds or exchange-traded funds (ETFs) are not included in the Fund's expense ratio. The Fund indirectly bears its proportionate share of these expenses.
FExpense ratios reflect operating expenses of the class. Expenses before reductions do not reflect amounts reimbursed, waived, or reduced through arrangements with the investment adviser, brokerage services, or other offset arrangements, if applicable, and do not represent the amount paid by the class during periods when reimbursements, waivers or reductions occur.
GAmount does not include the portfolio activity of any underlying mutual funds or exchange-traded funds (ETFs).
HThe portfolio turnover rate does not include the assets acquired in the merger.
| Fidelity Managed Retirement Income Fund℠ |
| |
| Years ended July 31, | | 2023 | | 2022 | | 2021 | | 2020 | | 2019 |
Selected Per-Share Data | | | | | | | | | | |
| Net asset value, beginning of period | $ | 56.57 | $ | 63.52 | $ | 60.42 | $ | 57.73 | $ | 57.54 |
| Income from Investment Operations | | | | | | | | | | |
Net investment income (loss) A,B | | 2.055 | | 1.473 | | .464 | | .829 | | 1.170 |
| Net realized and unrealized gain (loss) | | (1.958) | | (6.189) | | 4.011 | | 3.220 | | 1.589 |
| Total from investment operations | | .097 | | (4.716) | | 4.475 | | 4.049 | | 2.759 |
| Distributions from net investment income | | (1.992) | | (1.399) | | (.466) | | (.925) | | (1.183) |
| Distributions from net realized gain | | (.635) | | (.835) | | (.909) | | (.434) | | (1.386) |
| Total distributions | | (2.627) | | (2.234) | | (1.375) | | (1.359) | | (2.569) |
| Net asset value, end of period | $ | 54.04 | $ | 56.57 | $ | 63.52 | $ | 60.42 | $ | 57.73 |
Total Return C | | .37% | | (7.68)% | | 7.48% | | 7.12% | | 5.04% |
Ratios to Average Net Assets B,D,E | | | | | | | | | | |
| Expenses before reductions | | .45% | | .45% | | .45% | | .45% | | .46% |
| Expenses net of fee waivers, if any | | .45% | | .45% | | .45% | | .45% | | .46% |
| Expenses net of all reductions | | .45% | | .45% | | .45% | | .45% | | .46% |
| Net investment income (loss) | | 3.84% | | 2.45% | | .75% | | 1.43% | | 2.08% |
| Supplemental Data | | | | | | | | | | |
| Net assets, end of period (000 omitted) | $ | 14,670 | $ | 16,230 | $ | 19,995 | $ | 13,965 | $ | 6,060 |
Portfolio turnover rate F | | 25% | | 64% | | 31% | | 62% G | | 68% |
ACalculated based on average shares outstanding during the period.
BNet investment income (loss) is affected by the timing of the declaration of dividends by any underlying mutual funds or exchange-traded funds (ETFs). Net investment income (loss) of any mutual funds or ETFs is not included in the Fund's net investment income (loss) ratio.
CTotal returns would have been lower if certain expenses had not been reduced during the applicable periods shown.
DFees and expenses of any underlying mutual funds or exchange-traded funds (ETFs) are not included in the Fund's expense ratio. The Fund indirectly bears its proportionate share of these expenses.
EExpense ratios reflect operating expenses of the class. Expenses before reductions do not reflect amounts reimbursed, waived, or reduced through arrangements with the investment adviser, brokerage services, or other offset arrangements, if applicable, and do not represent the amount paid by the class during periods when reimbursements, waivers or reductions occur.
FAmount does not include the portfolio activity of any underlying mutual funds or exchange-traded funds (ETFs).
GThe portfolio turnover rate does not include the assets acquired in the merger.
| Fidelity Managed Retirement Income Fund℠ Class K |
| |
| Years ended July 31, | | 2023 | | 2022 | | 2021 | | 2020 A |
Selected Per-Share Data | | | | | | | | |
| Net asset value, beginning of period | $ | 56.59 | $ | 63.54 | $ | 60.43 | $ | 57.81 |
| Income from Investment Operations | | | | | | | | |
Net investment income (loss) B,C | | 2.105 | | 1.529 | | .526 | | .889 |
| Net realized and unrealized gain (loss) | | (1.955) | | (6.186) | | 4.010 | | 3.146 |
| Total from investment operations | | .150 | | (4.657) | | 4.536 | | 4.035 |
| Distributions from net investment income | | (2.055) | | (1.458) | | (.517) | | (.981) |
| Distributions from net realized gain | | (.635) | | (.835) | | (.909) | | (.434) |
| Total distributions | | (2.690) | | (2.293) | | (1.426) | | (1.415) |
| Net asset value, end of period | $ | 54.05 | $ | 56.59 | $ | 63.54 | $ | 60.43 |
Total Return D | | .47% | | (7.58)% | | 7.59% | | 7.09% |
Ratios to Average Net Assets C,E,F | | | | | | | | |
| Expenses before reductions | | .35% | | .35% | | .35% | | .35% |
| Expenses net of fee waivers, if any | | .35% | | .35% | | .35% | | .35% |
| Expenses net of all reductions | | .35% | | .35% | | .35% | | .35% |
| Net investment income (loss) | | 3.94% | | 2.55% | | .85% | | 1.53% |
| Supplemental Data | | | | | | | | |
| Net assets, end of period (000 omitted) | $ | 131 | $ | 106 | $ | 115 | $ | 107 |
Portfolio turnover rate G | | 25% | | 64% | | 31% | | 62% H |
AFor the period August 1, 2019 (commencement of sale of shares) through July 31, 2020.
BCalculated based on average shares outstanding during the period.
CNet investment income (loss) is affected by the timing of the declaration of dividends by any underlying mutual funds or exchange-traded funds (ETFs). Net investment income (loss) of any mutual funds or ETFs is not included in the Fund's net investment income (loss) ratio.
DTotal returns for periods of less than one year are not annualized.
EFees and expenses of any underlying mutual funds or exchange-traded funds (ETFs) are not included in the Fund's expense ratio. The Fund indirectly bears its proportionate share of these expenses.
FExpense ratios reflect operating expenses of the class. Expenses before reductions do not reflect amounts reimbursed, waived, or reduced through arrangements with the investment adviser, brokerage services, or other offset arrangements, if applicable, and do not represent the amount paid by the class during periods when reimbursements, waivers or reductions occur.
GAmount does not include the portfolio activity of any underlying mutual funds or exchange-traded funds (ETFs).
HThe portfolio turnover rate does not include the assets acquired in the merger.
| Fidelity Managed Retirement Income Fund℠ Class K6 |
| |
| Years ended July 31, | | 2023 | | 2022 | | 2021 | | 2020 A |
Selected Per-Share Data | | | | | | | | |
| Net asset value, beginning of period | $ | 56.60 | $ | 63.55 | $ | 60.42 | $ | 57.81 |
| Income from Investment Operations | | | | | | | | |
Net investment income (loss) B,C | | 2.164 | | 1.583 | | .588 | | .941 |
| Net realized and unrealized gain (loss) | | (1.959) | | (6.174) | | 4.005 | | 3.151 |
| Total from investment operations | | .205 | | (4.591) | | 4.593 | | 4.092 |
| Distributions from net investment income | | (2.110) | | (1.524) | | (.554) | | (1.048) |
| Distributions from net realized gain | | (.635) | | (.835) | | (.909) | | (.434) |
| Total distributions | | (2.745) | | (2.359) | | (1.463) | | (1.482) |
| Net asset value, end of period | $ | 54.06 | $ | 56.60 | $ | 63.55 | $ | 60.42 |
Total Return D | | .57% | | (7.48)% | | 7.69% | | 7.20% |
Ratios to Average Net Assets C,E,F | | | | | | | | |
| Expenses before reductions | | .25% | | .25% | | .25% | | .25% |
| Expenses net of fee waivers, if any | | .25% | | .25% | | .25% | | .25% |
| Expenses net of all reductions | | .25% | | .25% | | .25% | | .25% |
| Net investment income (loss) | | 4.05% | | 2.65% | | .95% | | 1.62% |
| Supplemental Data | | | | | | | | |
| Net assets, end of period (000 omitted) | $ | 494 | $ | 711 | $ | 539 | $ | 434 |
Portfolio turnover rate G | | 25% | | 64% | | 31% | | 62% H |
AFor the period August 1, 2019 (commencement of sale of shares) through July 31, 2020.
BCalculated based on average shares outstanding during the period.
CNet investment income (loss) is affected by the timing of the declaration of dividends by any underlying mutual funds or exchange-traded funds (ETFs). Net investment income (loss) of any mutual funds or ETFs is not included in the Fund's net investment income (loss) ratio.
DTotal returns for periods of less than one year are not annualized.
EFees and expenses of any underlying mutual funds or exchange-traded funds (ETFs) are not included in the Fund's expense ratio. The Fund indirectly bears its proportionate share of these expenses.
FExpense ratios reflect operating expenses of the class. Expenses before reductions do not reflect amounts reimbursed, waived, or reduced through arrangements with the investment adviser, brokerage services, or other offset arrangements, if applicable, and do not represent the amount paid by the class during periods when reimbursements, waivers or reductions occur.
GAmount does not include the portfolio activity of any underlying mutual funds or exchange-traded funds (ETFs).
HThe portfolio turnover rate does not include the assets acquired in the merger.
| Fidelity Advisor Managed Retirement Income Fund℠ Class I |
| |
| Years ended July 31, | | 2023 | | 2022 | | 2021 | | 2020 | | 2019 |
Selected Per-Share Data | | | | | | | | | | |
| Net asset value, beginning of period | $ | 56.64 | $ | 63.58 | $ | 60.48 | $ | 57.71 | $ | 57.52 |
| Income from Investment Operations | | | | | | | | | | |
Net investment income (loss) A,B | | 2.059 | | 1.480 | | .464 | | .828 | | 1.167 |
| Net realized and unrealized gain (loss) | | (1.961) | | (6.193) | | 4.011 | | 3.233 | | 1.593 |
| Total from investment operations | | .098 | | (4.713) | | 4.475 | | 4.061 | | 2.760 |
| Distributions from net investment income | | (1.993) | | (1.392) | | (.466) | | (.857) | | (1.184) |
| Distributions from net realized gain | | (.635) | | (.835) | | (.909) | | (.434) | | (1.386) |
| Total distributions | | (2.628) | | (2.227) | | (1.375) | | (1.291) | | (2.570) |
| Net asset value, end of period | $ | 54.11 | $ | 56.64 | $ | 63.58 | $ | 60.48 | $ | 57.71 |
Total Return C | | .37% | | (7.66)% | | 7.48% | | 7.14% | | 5.04% |
Ratios to Average Net Assets B,D,E | | | | | | | | | | |
| Expenses before reductions | | .45% | | .45% | | .45% | | .45% | | .46% |
| Expenses net of fee waivers, if any | | .45% | | .45% | | .45% | | .45% | | .46% |
| Expenses net of all reductions | | .45% | | .45% | | .45% | | .45% | | .46% |
| Net investment income (loss) | | 3.85% | | 2.45% | | .75% | | 1.43% | | 2.08% |
| Supplemental Data | | | | | | | | | | |
| Net assets, end of period (000 omitted) | $ | 159 | $ | 176 | $ | 270 | $ | 300 | $ | 96 |
Portfolio turnover rate F | | 25% | | 64% | | 31% | | 62% G | | 68% |
ACalculated based on average shares outstanding during the period.
BNet investment income (loss) is affected by the timing of the declaration of dividends by any underlying mutual funds or exchange-traded funds (ETFs). Net investment income (loss) of any mutual funds or ETFs is not included in the Fund's net investment income (loss) ratio.
CTotal returns would have been lower if certain expenses had not been reduced during the applicable periods shown.
DFees and expenses of any underlying mutual funds or exchange-traded funds (ETFs) are not included in the Fund's expense ratio. The Fund indirectly bears its proportionate share of these expenses.
EExpense ratios reflect operating expenses of the class. Expenses before reductions do not reflect amounts reimbursed, waived, or reduced through arrangements with the investment adviser, brokerage services, or other offset arrangements, if applicable, and do not represent the amount paid by the class during periods when reimbursements, waivers or reductions occur.
FAmount does not include the portfolio activity of any underlying mutual funds or exchange-traded funds (ETFs).
GThe portfolio turnover rate does not include the assets acquired in the merger.
| Fidelity Advisor Managed Retirement Income Fund℠ Class Z6 |
| |
| Years ended July 31, | | 2023 | | 2022 | | 2021 | | 2020 A |
Selected Per-Share Data | | | | | | | | |
| Net asset value, beginning of period | $ | 56.57 | $ | 63.52 | $ | 60.41 | $ | 57.79 |
| Income from Investment Operations | | | | | | | | |
Net investment income (loss) B,C | | 2.161 | | 1.587 | | .588 | | .947 |
| Net realized and unrealized gain (loss) | | (1.956) | | (6.181) | | 4.008 | | 3.145 |
| Total from investment operations | | .205 | | (4.594) | | 4.596 | | 4.092 |
| Distributions from net investment income | | (2.110) | | (1.521) | | (.577) | | (1.038) |
| Distributions from net realized gain | | (.635) | | (.835) | | (.909) | | (.434) |
| Total distributions | | (2.745) | | (2.356) | | (1.486) | | (1.472) |
| Net asset value, end of period | $ | 54.03 | $ | 56.57 | $ | 63.52 | $ | 60.41 |
Total Return D | | .57% | | (7.49)% | | 7.69% | | 7.20% |
Ratios to Average Net Assets C,E,F | | | | | | | | |
| Expenses before reductions | | .25% | | .25% | | .25% | | .25% |
| Expenses net of fee waivers, if any | | .25% | | .25% | | .25% | | .25% |
| Expenses net of all reductions | | .25% | | .25% | | .25% | | .25% |
| Net investment income (loss) | | 4.04% | | 2.65% | | .95% | | 1.62% |
| Supplemental Data | | | | | | | | |
| Net assets, end of period (000 omitted) | $ | 107 | $ | 107 | $ | 115 | $ | 107 |
Portfolio turnover rate G | | 25% | | 64% | | 31% | | 62% H |
AFor the period August 1, 2019 (commencement of sale of shares) through July 31, 2020.
BCalculated based on average shares outstanding during the period.
CNet investment income (loss) is affected by the timing of the declaration of dividends by any underlying mutual funds or exchange-traded funds (ETFs). Net investment income (loss) of any mutual funds or ETFs is not included in the Fund's net investment income (loss) ratio.
DTotal returns for periods of less than one year are not annualized.
EFees and expenses of any underlying mutual funds or exchange-traded funds (ETFs) are not included in the Fund's expense ratio. The Fund indirectly bears its proportionate share of these expenses.
FExpense ratios reflect operating expenses of the class. Expenses before reductions do not reflect amounts reimbursed, waived, or reduced through arrangements with the investment adviser, brokerage services, or other offset arrangements, if applicable, and do not represent the amount paid by the class during periods when reimbursements, waivers or reductions occur.
GAmount does not include the portfolio activity of any underlying mutual funds or exchange-traded funds (ETFs).
HThe portfolio turnover rate does not include the assets acquired in the merger.
The information in the following tables is based on the direct Investments of the Fund.
Top Holdings (% of Fund's net assets) |
| |
| Fidelity Series 0-5 Year Inflation-Protected Bond Index Fund | 18.4 | |
| Fidelity Series Investment Grade Bond Fund | 12.1 | |
| Fidelity Series Government Bond Index Fund | 11.8 | |
| Fidelity Series Investment Grade Securitized Fund | 8.2 | |
| Fidelity Series Corporate Bond Fund | 8.1 | |
| Fidelity Series Treasury Bill Index Fund | 6.1 | |
| Fidelity Series Emerging Markets Opportunities Fund | 4.2 | |
| Fidelity Series Long-Term Treasury Bond Index Fund | 3.9 | |
| Fidelity Series International Developed Markets Bond Index Fund | 3.9 | |
| Fidelity Series Government Money Market Fund 5.33% | 2.2 | |
| | 78.9 | |
| |
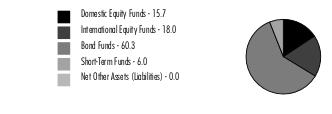
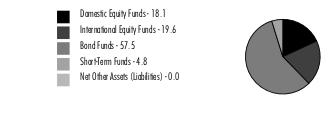
Asset Allocation (% of Fund's net assets) |
|
Percentages shown as 0.0% may reflect amounts less than 0.05%. |
|
Domestic Equity Funds category includes Fidelity Series Commodity Strategy Fund which invests in commodity-related investments.
Fidelity Managed Retirement 2010 Fund℠
Showing Percentage of Net Assets
| Domestic Equity Funds - 7.9% |
| | | Shares | Value ($) |
| Fidelity Series Blue Chip Growth Fund (a) | | 6,722 | 98,750 |
| Fidelity Series Commodity Strategy Fund (a) | | 451 | 46,405 |
| Fidelity Series Large Cap Growth Index Fund (a) | | 3,464 | 62,378 |
| Fidelity Series Large Cap Stock Fund (a) | | 3,497 | 69,175 |
| Fidelity Series Large Cap Value Index Fund (a) | | 8,580 | 128,523 |
| Fidelity Series Small Cap Core Fund (a) | | 33 | 352 |
| Fidelity Series Small Cap Opportunities Fund (a) | | 2,349 | 31,634 |
| Fidelity Series Value Discovery Fund (a) | | 3,091 | 47,420 |
| TOTAL DOMESTIC EQUITY FUNDS (Cost $387,828) | | | 484,637 |
| | | | |
| International Equity Funds - 12.8% |
| | | Shares | Value ($) |
| Fidelity Series Canada Fund (a) | | 3,116 | 45,687 |
| Fidelity Series Emerging Markets Fund (a) | | 6,580 | 57,577 |
| Fidelity Series Emerging Markets Opportunities Fund (a) | | 14,378 | 259,375 |
| Fidelity Series International Growth Fund (a) | | 6,947 | 115,383 |
| Fidelity Series International Index Fund (a) | | 3,695 | 43,565 |
| Fidelity Series International Small Cap Fund (a) | | 2,184 | 36,319 |
| Fidelity Series International Value Fund (a) | | 10,139 | 116,088 |
| Fidelity Series Overseas Fund (a) | | 9,088 | 115,511 |
| TOTAL INTERNATIONAL EQUITY FUNDS (Cost $686,522) | | | 789,505 |
| | | | |
| Bond Funds - 69.4% |
| | | Shares | Value ($) |
| Fidelity Series 0-5 Year Inflation-Protected Bond Index Fund (a) | | 119,639 | 1,134,177 |
| Fidelity Series 5+ Year Inflation-Protected Bond Index Fund (a) | | 10,430 | 82,192 |
| Fidelity Series Corporate Bond Fund (a) | | 55,247 | 501,092 |
| Fidelity Series Emerging Markets Debt Fund (a) | | 4,227 | 31,828 |
| Fidelity Series Emerging Markets Debt Local Currency Fund (a) | | 1,116 | 10,782 |
| Fidelity Series Floating Rate High Income Fund (a) | | 701 | 6,301 |
| Fidelity Series Government Bond Index Fund (a) | | 79,888 | 728,582 |
| Fidelity Series High Income Fund (a) | | 4,052 | 33,470 |
| Fidelity Series International Credit Fund (a) | | 667 | 5,135 |
| Fidelity Series International Developed Markets Bond Index Fund (a) | | 28,111 | 239,506 |
| Fidelity Series Investment Grade Bond Fund (a) | | 74,975 | 744,500 |
| Fidelity Series Investment Grade Securitized Fund (a) | | 56,978 | 505,391 |
| Fidelity Series Long-Term Treasury Bond Index Fund (a) | | 40,901 | 240,090 |
| Fidelity Series Real Estate Income Fund (a) | | 902 | 8,745 |
| TOTAL BOND FUNDS (Cost $4,718,240) | | | 4,271,791 |
| | | | |
| Short-Term Funds - 9.9% |
| | | Shares | Value ($) |
| Fidelity Series Government Money Market Fund 5.33% (a)(b) | | 133,727 | 133,727 |
| Fidelity Series Short-Term Credit Fund (a) | | 10,229 | 98,710 |
| Fidelity Series Treasury Bill Index Fund (a) | | 38,061 | 378,331 |
| TOTAL SHORT-TERM FUNDS (Cost $615,262) | | | 610,768 |
| | | | |
| TOTAL INVESTMENT IN SECURITIES - 100.0% (Cost $6,407,852) | 6,156,701 |
NET OTHER ASSETS (LIABILITIES) - 0.0% | (125) |
| NET ASSETS - 100.0% | 6,156,576 |
| | |
Legend
| (b) | The rate quoted is the annualized seven-day yield of the fund at period end. |
Affiliated Underlying Funds
Fiscal year to date information regarding the Fund's investments in affiliated Underlying Funds is presented below. Exchanges between classes of the same affiliated Underlying Funds may occur. If an Underlying Funds changes its name, the name presented below is the name in effect at period end.
| Affiliate | Value, beginning of period ($) | Purchases ($) | Sales Proceeds ($) | Dividend Income ($) | Realized Gain (loss) ($) | Change in Unrealized appreciation (depreciation) ($) | Value, end of period ($) |
| Fidelity Series 0-5 Year Inflation-Protected Bond Index Fund | 1,177,959 | 218,453 | 192,950 | 55,584 | (6,850) | (61,215) | 1,134,177 |
| Fidelity Series 5+ Year Inflation-Protected Bond Index Fund | 81,140 | 40,810 | 28,415 | 6,293 | (4,084) | (7,259) | 82,192 |
| Fidelity Series Blue Chip Growth Fund | 131,529 | 30,503 | 83,395 | 4,212 | (15,526) | 35,639 | 98,750 |
| Fidelity Series Canada Fund | 63,755 | 6,761 | 26,566 | 1,672 | 2,338 | (601) | 45,687 |
| Fidelity Series Commodity Strategy Fund | 100,692 | 64,519 | 59,130 | 52,719 | (28,237) | (31,439) | 46,405 |
| Fidelity Series Corporate Bond Fund | 495,223 | 95,264 | 66,004 | 19,069 | (299) | (23,092) | 501,092 |
| Fidelity Series Emerging Markets Debt Fund | 34,850 | 4,092 | 7,635 | 1,984 | (1,860) | 2,381 | 31,828 |
| Fidelity Series Emerging Markets Debt Local Currency Fund | 11,534 | 558 | 2,875 | - | (376) | 1,941 | 10,782 |
| Fidelity Series Emerging Markets Fund | 45,177 | 20,541 | 12,262 | 990 | (1,884) | 6,005 | 57,577 |
| Fidelity Series Emerging Markets Opportunities Fund | 409,947 | 25,955 | 204,430 | 8,289 | (26,973) | 54,876 | 259,375 |
| Fidelity Series Floating Rate High Income Fund | 6,700 | 840 | 1,342 | 529 | (48) | 151 | 6,301 |
| Fidelity Series Government Bond Index Fund | 727,371 | 152,573 | 105,851 | 17,019 | (2,006) | (43,505) | 728,582 |
| Fidelity Series Government Money Market Fund 5.33% | 109,031 | 68,050 | 43,354 | 5,397 | - | - | 133,727 |
| Fidelity Series High Income Fund | 36,176 | 4,507 | 6,261 | 2,205 | (493) | (459) | 33,470 |
| Fidelity Series International Credit Fund | 5,389 | 300 | - | 300 | - | (554) | 5,135 |
| Fidelity Series International Developed Markets Bond Index Fund | 267,488 | 25,213 | 35,604 | 5,674 | (3,852) | (13,739) | 239,506 |
| Fidelity Series International Growth Fund | 132,711 | 17,481 | 44,749 | 4,006 | (3,574) | 13,514 | 115,383 |
| Fidelity Series International Index Fund | 55,569 | 5,812 | 23,977 | 1,285 | 791 | 5,370 | 43,565 |
| Fidelity Series International Small Cap Fund | 40,933 | 4,789 | 10,078 | 2,206 | (545) | 1,220 | 36,319 |
| Fidelity Series International Value Fund | 131,571 | 17,802 | 51,949 | 3,923 | 181 | 18,483 | 116,088 |
| Fidelity Series Investment Grade Bond Fund | 751,853 | 139,115 | 105,069 | 28,008 | (1,248) | (40,151) | 744,500 |
| Fidelity Series Investment Grade Securitized Fund | 531,821 | 87,852 | 75,463 | 17,142 | (1,232) | (37,587) | 505,391 |
| Fidelity Series Large Cap Growth Index Fund | 83,223 | 14,284 | 44,301 | 627 | 4,529 | 4,643 | 62,378 |
| Fidelity Series Large Cap Stock Fund | 91,164 | 17,084 | 46,013 | 5,447 | 3,323 | 3,617 | 69,175 |
| Fidelity Series Large Cap Value Index Fund | 174,072 | 34,866 | 84,870 | 5,156 | 6,723 | (2,268) | 128,523 |
| Fidelity Series Long-Term Treasury Bond Index Fund | 301,592 | 70,944 | 93,801 | 7,985 | (19,139) | (19,506) | 240,090 |
| Fidelity Series Overseas Fund | 133,492 | 14,006 | 45,900 | 2,110 | (794) | 14,707 | 115,511 |
| Fidelity Series Real Estate Income Fund | 18,845 | 3,814 | 11,995 | 1,531 | (1,507) | (412) | 8,745 |
| Fidelity Series Short-Term Credit Fund | 108,776 | 6,506 | 16,214 | 2,468 | (351) | (7) | 98,710 |
| Fidelity Series Small Cap Core Fund | - | 872 | 553 | - | (7) | 40 | 352 |
| Fidelity Series Small Cap Opportunities Fund | 43,997 | 6,269 | 20,407 | 1,990 | 114 | 1,661 | 31,634 |
| Fidelity Series Treasury Bill Index Fund | 327,268 | 156,981 | 104,845 | 15,562 | (207) | (866) | 378,331 |
| Fidelity Series Value Discovery Fund | 64,198 | 11,969 | 28,941 | 2,742 | 1,696 | (1,502) | 47,420 |
| | 6,695,046 | 1,369,385 | 1,685,199 | 284,124 | (101,397) | (119,914) | 6,156,701 |
Amounts in the dividend income column in the above table include any capital gain distributions from underlying funds, which are presented in the corresponding line item in the Statement of Operations, if applicable.
Amounts included in the purchases and sales proceeds columns may include in-kind transactions, if applicable.
Investment Valuation
The following is a summary of the inputs used, as of July 31, 2023, involving the Fund's assets and liabilities carried at fair value. The inputs or methodology used for valuing securities may not be an indication of the risk associated with investing in those securities. For more information on valuation inputs, and their aggregation into the levels used below, please refer to the Investment Valuation section in the accompanying Notes to Financial Statements.
| Valuation Inputs at Reporting Date: |
| Description | Total ($) | Level 1 ($) | Level 2 ($) | Level 3 ($) |
Investments in Securities: | | | | |
|
| Domestic Equity Funds | 484,637 | 484,637 | - | - |
|
| International Equity Funds | 789,505 | 789,505 | - | - |
|
| Bond Funds | 4,271,791 | 4,271,791 | - | - |
|
| Short-Term Funds | 610,768 | 610,768 | - | - |
| Total Investments in Securities: | 6,156,701 | 6,156,701 | - | - |
Fidelity Managed Retirement 2010 Fund℠
| Statement of Assets and Liabilities |
| | | | July 31, 2023 |
| | | | | |
| Assets | | | | |
| Investment in securities, at value - See accompanying schedule: | | | | |
Affiliated issuers (cost $6,407,852) | $ | 6,156,701 | | |
| | | | | |
| | | | | |
| Total Investment in Securities (cost $6,407,852) | | | $ | 6,156,701 |
| Cash | | | | 56 |
| Receivable for investments sold | | | | 61,054 |
| Receivable for fund shares sold | | | | 216 |
Total assets | | | | 6,218,027 |
| Liabilities | | | | |
| Payable for investments purchased | $ | 46,888 | | |
| Payable for fund shares redeemed | | 12,184 | | |
| Accrued management fee | | 2,322 | | |
| Distribution and service plan fees payable | | 57 | | |
| Total Liabilities | | | | 61,451 |
| Net Assets | | | $ | 6,156,576 |
| Net Assets consist of: | | | | |
| Paid in capital | | | $ | 6,534,673 |
| Total accumulated earnings (loss) | | | | (378,097) |
| Net Assets | | | $ | 6,156,576 |
| | | | | |
| Net Asset Value and Maximum Offering Price | | | | |
| Class A : | | | | |
Net Asset Value and redemption price per share ($240,840 ÷ 4,667.79 shares)(a) | | | $ | 51.60 |
| Maximum offering price per share (100/94.25 of $51.60) | | | $ | 54.75 |
| Fidelity Managed Retirement 2010 : | | | | |
Net Asset Value, offering price and redemption price per share ($5,238,900 ÷ 101,451 shares) | | | $ | 51.64 |
| Class K : | | | | |
Net Asset Value, offering price and redemption price per share ($128,559 ÷ 2,490.65 shares) | | | $ | 51.62 |
| Class K6 : | | | | |
Net Asset Value, offering price and redemption price per share ($289,695 ÷ 5,612.44 shares) | | | $ | 51.62 |
| Class I : | | | | |
Net Asset Value, offering price and redemption price per share ($93,067 ÷ 1,802.63 shares) | | | $ | 51.63 |
| Class Z6 : | | | | |
Net Asset Value, offering price and redemption price per share ($165,515 ÷ 3,206.96 shares) | | | $ | 51.61 |
(a)Redemption price per share is equal to net asset value less any applicable contingent deferred sales charge. |
| Statement of Operations |
| | | | Year ended July 31, 2023 |
| Investment Income | | | | |
| Dividends: | | | | |
| Affiliated issuers | | | $ | 266,618 |
| Expenses | | | | |
| Management fee | $ | 28,214 | | |
| Distribution and service plan fees | | 728 | | |
| Independent trustees' fees and expenses | | 23 | | |
| Total expenses before reductions | | 28,965 | | |
| Expense reductions | | (2) | | |
| Total expenses after reductions | | | | 28,963 |
| Net Investment income (loss) | | | | 237,655 |
| Realized and Unrealized Gain (Loss) | | | | |
| Net realized gain (loss) on: | | | | |
| Investment Securities: | | | | |
| Affiliated issuers | | (101,397) | | |
| Capital gain distributions from underlying funds: | | | | |
| Affiliated issuers | | 17,506 | | |
| Total net realized gain (loss) | | | | (83,891) |
| Change in net unrealized appreciation (depreciation) on: | | | | |
| Investment Securities: | | | | |
| Affiliated issuers | | (119,914) | | |
| Total change in net unrealized appreciation (depreciation) | | | | (119,914) |
| Net gain (loss) | | | | (203,805) |
| Net increase (decrease) in net assets resulting from operations | | | $ | 33,850 |
| Statement of Changes in Net Assets |
| |
| | Year ended July 31, 2023 | | Year ended July 31, 2022 |
| Increase (Decrease) in Net Assets | | | | |
| Operations | | | | |
| Net investment income (loss) | $ | 237,655 | $ | 175,948 |
| Net realized gain (loss) | | (83,891) | | 200,489 |
| Change in net unrealized appreciation (depreciation) | | (119,914) | | (952,936) |
| Net increase (decrease) in net assets resulting from operations | | 33,850 | | (576,499) |
| Distributions to shareholders | | (339,967) | | (449,109) |
| | | | | |
| Share transactions - net increase (decrease) | | (232,213) | | 11,415 |
| Total increase (decrease) in net assets | | (538,330) | | (1,014,193) |
| | | | | |
| Net Assets | | | | |
| Beginning of period | | 6,694,906 | | 7,709,099 |
| End of period | $ | 6,156,576 | $ | 6,694,906 |
| | | | | |
| | | | | |
| Fidelity Advisor Managed Retirement 2010 Fund℠ Class A |
| |
| Years ended July 31, | | 2023 | | 2022 | | 2021 | | 2020 | | 2019 |
Selected Per-Share Data | | | | | | | | | | |
| Net asset value, beginning of period | $ | 54.07 | $ | 62.41 | $ | 58.79 | $ | 56.34 | $ | 56.78 |
| Income from Investment Operations | | | | | | | | | | |
Net investment income (loss) A,B | | 1.772 | | 1.275 | | .342 | | .777 | | .979 |
| Net realized and unrealized gain (loss) | | (1.646) | | (6.182) | | 5.126 | | 3.204 | | 1.401 |
| Total from investment operations | | .126 | | (4.907) | | 5.468 | | 3.981 | | 2.380 |
| Distributions from net investment income | | (1.726) | | (1.207) | | (.379) | | (.812) | | (1.001) |
| Distributions from net realized gain | | (.870) | | (2.226) | | (1.469) | | (.719) | | (1.819) |
| Total distributions | | (2.596) | | (3.433) | | (1.848) | | (1.531) | | (2.820) |
| Net asset value, end of period | $ | 51.60 | $ | 54.07 | $ | 62.41 | $ | 58.79 | $ | 56.34 |
Total Return C,D | | .45% | | (8.32)% | | 9.46% | | 7.19% | | 4.47% |
Ratios to Average Net Assets B,E,F | | | | | | | | | | |
| Expenses before reductions | | .71% | | .71% | | .71% | | .71% | | .75% |
| Expenses net of fee waivers, if any | | .71% | | .71% | | .71% | | .71% | | .75% |
| Expenses net of all reductions | | .71% | | .71% | | .71% | | .71% | | .75% |
| Net investment income (loss) | | 3.48% | | 2.21% | | .56% | | 1.37% | | 1.78% |
| Supplemental Data | | | | | | | | | | |
| Net assets, end of period (000 omitted) | $ | 241 | $ | 325 | $ | 394 | $ | 188 | $ | 202 |
Portfolio turnover rate G | | 22% | | 54% | | 41% | | 45% | | 62% |
ACalculated based on average shares outstanding during the period.
BNet investment income (loss) is affected by the timing of the declaration of dividends by any underlying mutual funds or exchange-traded funds (ETFs). Net investment income (loss) of any mutual funds or ETFs is not included in the Fund's net investment income (loss) ratio.
CTotal returns would have been lower if certain expenses had not been reduced during the applicable periods shown.
DTotal returns do not include the effect of the sales charges.
EFees and expenses of any underlying mutual funds or exchange-traded funds (ETFs) are not included in the Fund's expense ratio. The Fund indirectly bears its proportionate share of these expenses.
FExpense ratios reflect operating expenses of the class. Expenses before reductions do not reflect amounts reimbursed, waived, or reduced through arrangements with the investment adviser, brokerage services, or other offset arrangements, if applicable, and do not represent the amount paid by the class during periods when reimbursements, waivers or reductions occur.
GAmount does not include the portfolio activity of any underlying mutual funds or exchange-traded funds (ETFs).
| Fidelity Managed Retirement 2010 Fund℠ |
| |
| Years ended July 31, | | 2023 | | 2022 | | 2021 | | 2020 | | 2019 |
Selected Per-Share Data | | | | | | | | | | |
| Net asset value, beginning of period | $ | 54.12 | $ | 62.47 | $ | 58.82 | $ | 56.37 | $ | 56.80 |
| Income from Investment Operations | | | | | | | | | | |
Net investment income (loss) A,B | | 1.899 | | 1.421 | | .493 | | .920 | | 1.113 |
| Net realized and unrealized gain (loss) | | (1.652) | | (6.181) | | 5.129 | | 3.204 | | 1.402 |
| Total from investment operations | | .247 | | (4.760) | | 5.622 | | 4.124 | | 2.515 |
| Distributions from net investment income | | (1.857) | | (1.364) | | (.503) | | (.955) | | (1.126) |
| Distributions from net realized gain | | (.870) | | (2.226) | | (1.469) | | (.719) | | (1.819) |
| Total distributions | | (2.727) | | (3.590) | | (1.972) | | (1.674) | | (2.945) |
| Net asset value, end of period | $ | 51.64 | $ | 54.12 | $ | 62.47 | $ | 58.82 | $ | 56.37 |
Total Return C | | .69% | | (8.08)% | | 9.73% | | 7.46% | | 4.73% |
Ratios to Average Net Assets B,D,E | | | | | | | | | | |
| Expenses before reductions | | .46% | | .46% | | .46% | | .46% | | .50% |
| Expenses net of fee waivers, if any | | .46% | | .46% | | .46% | | .46% | | .50% |
| Expenses net of all reductions | | .46% | | .46% | | .46% | | .46% | | .50% |
| Net investment income (loss) | | 3.73% | | 2.46% | | .81% | | 1.62% | | 2.02% |
| Supplemental Data | | | | | | | | | | |
| Net assets, end of period (000 omitted) | $ | 5,239 | $ | 5,655 | $ | 6,728 | $ | 7,144 | $ | 9,091 |
Portfolio turnover rate F | | 22% | | 54% | | 41% | | 45% | | 62% |
ACalculated based on average shares outstanding during the period.
BNet investment income (loss) is affected by the timing of the declaration of dividends by any underlying mutual funds or exchange-traded funds (ETFs). Net investment income (loss) of any mutual funds or ETFs is not included in the Fund's net investment income (loss) ratio.
CTotal returns would have been lower if certain expenses had not been reduced during the applicable periods shown.
DFees and expenses of any underlying mutual funds or exchange-traded funds (ETFs) are not included in the Fund's expense ratio. The Fund indirectly bears its proportionate share of these expenses.
EExpense ratios reflect operating expenses of the class. Expenses before reductions do not reflect amounts reimbursed, waived, or reduced through arrangements with the investment adviser, brokerage services, or other offset arrangements, if applicable, and do not represent the amount paid by the class during periods when reimbursements, waivers or reductions occur.
FAmount does not include the portfolio activity of any underlying mutual funds or exchange-traded funds (ETFs).
| Fidelity Managed Retirement 2010 Fund℠ Class K |
| |
| Years ended July 31, | | 2023 | | 2022 | | 2021 | | 2020 A |
Selected Per-Share Data | | | | | | | | |
| Net asset value, beginning of period | $ | 54.10 | $ | 62.45 | $ | 58.81 | $ | 56.39 |
| Income from Investment Operations | | | | | | | | |
Net investment income (loss) B,C | | 1.947 | | 1.474 | | .554 | | .976 |
| Net realized and unrealized gain (loss) | | (1.646) | | (6.173) | | 5.122 | | 3.182 |
| Total from investment operations | | .301 | | (4.699) | | 5.676 | | 4.158 |
| Distributions from net investment income | | (1.911) | | (1.425) | | (.567) | | (1.019) |
| Distributions from net realized gain | | (.870) | | (2.226) | | (1.469) | | (.719) |
| Total distributions | | (2.781) | | (3.651) | | (2.036) | | (1.738) |
| Net asset value, end of period | $ | 51.62 | $ | 54.10 | $ | 62.45 | $ | 58.81 |
Total Return D,E | | .80% | | (7.99)% | | 9.83% | | 7.52% |
Ratios to Average Net Assets C,F,G | | | | | | | | |
| Expenses before reductions | | .36% | | .36% | | .36% | | .36% |
| Expenses net of fee waivers, if any | | .36% | | .36% | | .36% | | .36% |
| Expenses net of all reductions | | .36% | | .36% | | .36% | | .36% |
| Net investment income (loss) | | 3.83% | | 2.56% | | .91% | | 1.72% |
| Supplemental Data | | | | | | | | |
| Net assets, end of period (000 omitted) | $ | 129 | $ | 109 | $ | 118 | $ | 108 |
Portfolio turnover rate H | | 22% | | 54% | | 41% | | 45% |
AFor the period August 1, 2019 (commencement of sale of shares) through July 31, 2020.
BCalculated based on average shares outstanding during the period.
CNet investment income (loss) is affected by the timing of the declaration of dividends by any underlying mutual funds or exchange-traded funds (ETFs). Net investment income (loss) of any mutual funds or ETFs is not included in the Fund's net investment income (loss) ratio.
DTotal returns would have been lower if certain expenses had not been reduced during the applicable periods shown.
ETotal returns for periods of less than one year are not annualized.
FFees and expenses of any underlying mutual funds or exchange-traded funds (ETFs) are not included in the Fund's expense ratio. The Fund indirectly bears its proportionate share of these expenses.
GExpense ratios reflect operating expenses of the class. Expenses before reductions do not reflect amounts reimbursed, waived, or reduced through arrangements with the investment adviser, brokerage services, or other offset arrangements, if applicable, and do not represent the amount paid by the class during periods when reimbursements, waivers or reductions occur.
HAmount does not include the portfolio activity of any underlying mutual funds or exchange-traded funds (ETFs).
| Fidelity Managed Retirement 2010 Fund℠ Class K6 |
| |
| Years ended July 31, | | 2023 | | 2022 | | 2021 | | 2020 A |
Selected Per-Share Data | | | | | | | | |
| Net asset value, beginning of period | $ | 54.10 | $ | 62.46 | $ | 58.82 | $ | 56.39 |
| Income from Investment Operations | | | | | | | | |
Net investment income (loss) B,C | | 2.000 | | 1.503 | | .615 | | 1.029 |
| Net realized and unrealized gain (loss) | | (1.650) | | (6.145) | | 5.120 | | 3.191 |
| Total from investment operations | | .350 | | (4.642) | | 5.735 | | 4.220 |
| Distributions from net investment income | | (1.960) | | (1.492) | | (.626) | | (1.071) |
| Distributions from net realized gain | | (.870) | | (2.226) | | (1.469) | | (.719) |
| Total distributions | | (2.830) | | (3.718) | | (2.095) | | (1.790) |
| Net asset value, end of period | $ | 51.62 | $ | 54.10 | $ | 62.46 | $ | 58.82 |
Total Return D,E | | .90% | | (7.90)% | | 9.94% | | 7.64% |
Ratios to Average Net Assets C,F,G | | | | | | | | |
| Expenses before reductions | | .26% | | .26% | | .26% | | .26% |
| Expenses net of fee waivers, if any | | .26% | | .26% | | .26% | | .26% |
| Expenses net of all reductions | | .26% | | .26% | | .26% | | .26% |
| Net investment income (loss) | | 3.93% | | 2.65% | | 1.01% | | 1.82% |
| Supplemental Data | | | | | | | | |
| Net assets, end of period (000 omitted) | $ | 290 | $ | 337 | $ | 174 | $ | 160 |
Portfolio turnover rate H | | 22% | | 54% | | 41% | | 45% |
AFor the period August 1, 2019 (commencement of sale of shares) through July 31, 2020.
BCalculated based on average shares outstanding during the period.
CNet investment income (loss) is affected by the timing of the declaration of dividends by any underlying mutual funds or exchange-traded funds (ETFs). Net investment income (loss) of any mutual funds or ETFs is not included in the Fund's net investment income (loss) ratio.
DTotal returns would have been lower if certain expenses had not been reduced during the applicable periods shown.
ETotal returns for periods of less than one year are not annualized.
FFees and expenses of any underlying mutual funds or exchange-traded funds (ETFs) are not included in the Fund's expense ratio. The Fund indirectly bears its proportionate share of these expenses.
GExpense ratios reflect operating expenses of the class. Expenses before reductions do not reflect amounts reimbursed, waived, or reduced through arrangements with the investment adviser, brokerage services, or other offset arrangements, if applicable, and do not represent the amount paid by the class during periods when reimbursements, waivers or reductions occur.
HAmount does not include the portfolio activity of any underlying mutual funds or exchange-traded funds (ETFs).
| Fidelity Advisor Managed Retirement 2010 Fund℠ Class I |
| |
| Years ended July 31, | | 2023 | | 2022 | | 2021 | | 2020 | | 2019 |
Selected Per-Share Data | | | | | | | | | | |
| Net asset value, beginning of period | $ | 54.11 | $ | 62.46 | $ | 58.82 | $ | 56.36 | $ | 56.79 |
| Income from Investment Operations | | | | | | | | | | |
Net investment income (loss) A,B | | 1.898 | | 1.417 | | .493 | | .919 | | 1.105 |
| Net realized and unrealized gain (loss) | | (1.652) | | (6.176) | | 5.120 | | 3.213 | | 1.414 |
| Total from investment operations | | .246 | | (4.759) | | 5.613 | | 4.132 | | 2.519 |
| Distributions from net investment income | | (1.856) | | (1.365) | | (.504) | | (.953) | | (1.130) |
| Distributions from net realized gain | | (.870) | | (2.226) | | (1.469) | | (.719) | | (1.819) |
| Total distributions | | (2.726) | | (3.591) | | (1.973) | | (1.672) | | (2.949) |
| Net asset value, end of period | $ | 51.63 | $ | 54.11 | $ | 62.46 | $ | 58.82 | $ | 56.36 |
Total Return C | | .69% | | (8.08)% | | 9.72% | | 7.47% | | 4.74% |
Ratios to Average Net Assets B,D,E | | | | | | | | | | |
| Expenses before reductions | | .46% | | .46% | | .46% | | .46% | | .50% |
| Expenses net of fee waivers, if any | | .46% | | .46% | | .46% | | .46% | | .50% |
| Expenses net of all reductions | | .46% | | .46% | | .46% | | .46% | | .50% |
| Net investment income (loss) | | 3.73% | | 2.46% | | .81% | | 1.62% | | 2.03% |
| Supplemental Data | | | | | | | | | | |
| Net assets, end of period (000 omitted) | $ | 93 | $ | 103 | $ | 113 | $ | 113 | $ | 110 |
Portfolio turnover rate F | | 22% | | 54% | | 41% | | 45% | | 62% |
ACalculated based on average shares outstanding during the period.
BNet investment income (loss) is affected by the timing of the declaration of dividends by any underlying mutual funds or exchange-traded funds (ETFs). Net investment income (loss) of any mutual funds or ETFs is not included in the Fund's net investment income (loss) ratio.
CTotal returns would have been lower if certain expenses had not been reduced during the applicable periods shown.
DFees and expenses of any underlying mutual funds or exchange-traded funds (ETFs) are not included in the Fund's expense ratio. The Fund indirectly bears its proportionate share of these expenses.
EExpense ratios reflect operating expenses of the class. Expenses before reductions do not reflect amounts reimbursed, waived, or reduced through arrangements with the investment adviser, brokerage services, or other offset arrangements, if applicable, and do not represent the amount paid by the class during periods when reimbursements, waivers or reductions occur.
FAmount does not include the portfolio activity of any underlying mutual funds or exchange-traded funds (ETFs).
| Fidelity Advisor Managed Retirement 2010 Fund℠ Class Z6 |
| |
| Years ended July 31, | | 2023 | | 2022 | | 2021 | | 2020 A |
Selected Per-Share Data | | | | | | | | |
| Net asset value, beginning of period | $ | 54.10 | $ | 62.45 | $ | 58.81 | $ | 56.38 |
| Income from Investment Operations | | | | | | | | |
Net investment income (loss) B,C | | 1.999 | | 1.532 | | .614 | | 1.029 |
| Net realized and unrealized gain (loss) | | (1.658) | | (6.173) | | 5.122 | | 3.191 |
| Total from investment operations | | .341 | | (4.641) | | 5.736 | | 4.220 |
| Distributions from net investment income | | (1.961) | | (1.483) | | (.627) | | (1.071) |
| Distributions from net realized gain | | (.870) | | (2.226) | | (1.469) | | (.719) |
| Total distributions | | (2.831) | | (3.709) | | (2.096) | | (1.790) |
| Net asset value, end of period | $ | 51.61 | $ | 54.10 | $ | 62.45 | $ | 58.81 |
Total Return D,E | | .88% | | (7.90)% | | 9.94% | | 7.64% |
Ratios to Average Net Assets C,F,G | | | | | | | | |
| Expenses before reductions | | .26% | | .26% | | .26% | | .26% |
| Expenses net of fee waivers, if any | | .26% | | .26% | | .26% | | .26% |
| Expenses net of all reductions | | .26% | | .26% | | .26% | | .26% |
| Net investment income (loss) | | 3.93% | | 2.65% | | 1.01% | | 1.82% |
| Supplemental Data | | | | | | | | |
| Net assets, end of period (000 omitted) | $ | 166 | $ | 166 | $ | 183 | $ | 169 |
Portfolio turnover rate H | | 22% | | 54% | | 41% | | 45% |
AFor the period August 1, 2019 (commencement of sale of shares) through July 31, 2020.
BCalculated based on average shares outstanding during the period.
CNet investment income (loss) is affected by the timing of the declaration of dividends by any underlying mutual funds or exchange-traded funds (ETFs). Net investment income (loss) of any mutual funds or ETFs is not included in the Fund's net investment income (loss) ratio.
DTotal returns would have been lower if certain expenses had not been reduced during the applicable periods shown.
ETotal returns for periods of less than one year are not annualized.
FFees and expenses of any underlying mutual funds or exchange-traded funds (ETFs) are not included in the Fund's expense ratio. The Fund indirectly bears its proportionate share of these expenses.
GExpense ratios reflect operating expenses of the class. Expenses before reductions do not reflect amounts reimbursed, waived, or reduced through arrangements with the investment adviser, brokerage services, or other offset arrangements, if applicable, and do not represent the amount paid by the class during periods when reimbursements, waivers or reductions occur.
HAmount does not include the portfolio activity of any underlying mutual funds or exchange-traded funds (ETFs).
The information in the following tables is based on the direct Investments of the Fund.
Top Holdings (% of Fund's net assets) |
| |
| Fidelity Series 0-5 Year Inflation-Protected Bond Index Fund | 14.4 | |
| Fidelity Series Investment Grade Bond Fund | 11.3 | |
| Fidelity Series Government Bond Index Fund | 11.1 | |
| Fidelity Series Investment Grade Securitized Fund | 7.7 | |
| Fidelity Series Corporate Bond Fund | 7.6 | |
| Fidelity Series Treasury Bill Index Fund | 5.0 | |
| Fidelity Series Emerging Markets Opportunities Fund | 4.8 | |
| Fidelity Series Long-Term Treasury Bond Index Fund | 4.1 | |
| Fidelity Series International Developed Markets Bond Index Fund | 3.9 | |
| Fidelity Series Large Cap Value Index Fund | 3.2 | |
| | 73.1 | |
| |
Asset Allocation (% of Fund's net assets) |
|
Percentages shown as 0.0% may reflect amounts less than 0.05%. |
|
Domestic Equity Funds category includes Fidelity Series Commodity Strategy Fund which invests in commodity-related investments.
Fidelity Managed Retirement 2015 Fund℠
Showing Percentage of Net Assets
| Domestic Equity Funds - 11.8% |
| | | Shares | Value ($) |
| Fidelity Series Blue Chip Growth Fund (a) | | 10,760 | 158,062 |
| Fidelity Series Commodity Strategy Fund (a) | | 466 | 47,955 |
| Fidelity Series Large Cap Growth Index Fund (a) | | 5,544 | 99,840 |
| Fidelity Series Large Cap Stock Fund (a) | | 5,597 | 110,718 |
| Fidelity Series Large Cap Value Index Fund (a) | | 13,733 | 205,725 |
| Fidelity Series Small Cap Core Fund (a) | | 51 | 555 |
| Fidelity Series Small Cap Opportunities Fund (a) | | 3,758 | 50,622 |
| Fidelity Series Value Discovery Fund (a) | | 4,948 | 75,895 |
| TOTAL DOMESTIC EQUITY FUNDS (Cost $598,183) | | | 749,372 |
| | | | |
| International Equity Funds - 15.4% |
| | | Shares | Value ($) |
| Fidelity Series Canada Fund (a) | | 4,008 | 58,763 |
| Fidelity Series Emerging Markets Fund (a) | | 8,010 | 70,089 |
| Fidelity Series Emerging Markets Opportunities Fund (a) | | 16,815 | 303,349 |
| Fidelity Series International Growth Fund (a) | | 8,924 | 148,236 |
| Fidelity Series International Index Fund (a) | | 4,753 | 56,036 |
| Fidelity Series International Small Cap Fund (a) | | 2,796 | 46,495 |
| Fidelity Series International Value Fund (a) | | 13,035 | 149,252 |
| Fidelity Series Overseas Fund (a) | | 11,676 | 148,400 |
| TOTAL INTERNATIONAL EQUITY FUNDS (Cost $847,080) | | | 980,620 |
| | | | |
| Bond Funds - 64.8% |
| | | Shares | Value ($) |
| Fidelity Series 0-5 Year Inflation-Protected Bond Index Fund (a) | | 96,382 | 913,699 |
| Fidelity Series 5+ Year Inflation-Protected Bond Index Fund (a) | | 26,059 | 205,342 |
| Fidelity Series Corporate Bond Fund (a) | | 53,346 | 483,851 |
| Fidelity Series Emerging Markets Debt Fund (a) | | 4,367 | 32,880 |
| Fidelity Series Emerging Markets Debt Local Currency Fund (a) | | 1,155 | 11,156 |
| Fidelity Series Floating Rate High Income Fund (a) | | 717 | 6,448 |
| Fidelity Series Government Bond Index Fund (a) | | 77,140 | 703,521 |
| Fidelity Series High Income Fund (a) | | 4,185 | 34,568 |
| Fidelity Series International Credit Fund (a) | | 290 | 2,232 |
| Fidelity Series International Developed Markets Bond Index Fund (a) | | 29,379 | 250,310 |
| Fidelity Series Investment Grade Bond Fund (a) | | 72,396 | 718,888 |
| Fidelity Series Investment Grade Securitized Fund (a) | | 55,018 | 488,006 |
| Fidelity Series Long-Term Treasury Bond Index Fund (a) | | 44,069 | 258,683 |
| Fidelity Series Real Estate Income Fund (a) | | 922 | 8,943 |
| TOTAL BOND FUNDS (Cost $4,627,419) | | | 4,118,527 |
| | | | |
| Short-Term Funds - 8.0% |
| | | Shares | Value ($) |
| Fidelity Series Government Money Market Fund 5.33% (a)(b) | | 113,784 | 113,784 |
| Fidelity Series Short-Term Credit Fund (a) | | 7,915 | 76,378 |
| Fidelity Series Treasury Bill Index Fund (a) | | 31,873 | 316,813 |
| TOTAL SHORT-TERM FUNDS (Cost $510,298) | | | 506,975 |
| | | | |
| TOTAL INVESTMENT IN SECURITIES - 100.0% (Cost $6,582,980) | 6,355,494 |
NET OTHER ASSETS (LIABILITIES) - 0.0% | (342) |
| NET ASSETS - 100.0% | 6,355,152 |
| | |
Legend
| (b) | The rate quoted is the annualized seven-day yield of the fund at period end. |
Affiliated Underlying Funds
Fiscal year to date information regarding the Fund's investments in affiliated Underlying Funds is presented below. Exchanges between classes of the same affiliated Underlying Funds may occur. If an Underlying Funds changes its name, the name presented below is the name in effect at period end.
| Affiliate | Value, beginning of period ($) | Purchases ($) | Sales Proceeds ($) | Dividend Income ($) | Realized Gain (loss) ($) | Change in Unrealized appreciation (depreciation) ($) | Value, end of period ($) |
| Fidelity Series 0-5 Year Inflation-Protected Bond Index Fund | 994,376 | 204,819 | 229,396 | 44,226 | (4,046) | (51,082) | 913,699 |
| Fidelity Series 5+ Year Inflation-Protected Bond Index Fund | 229,067 | 65,823 | 59,002 | 14,156 | (7,553) | (22,993) | 205,342 |
| Fidelity Series Blue Chip Growth Fund | 209,150 | 43,462 | 127,385 | 6,450 | (24,475) | 57,310 | 158,062 |
| Fidelity Series Canada Fund | 85,646 | 9,148 | 38,252 | 2,128 | 6,751 | (4,530) | 58,763 |
| Fidelity Series Commodity Strategy Fund | 110,544 | 70,861 | 69,777 | 56,228 | (28,637) | (35,036) | 47,955 |
| Fidelity Series Corporate Bond Fund | 505,723 | 101,618 | 100,467 | 18,278 | (3,685) | (19,338) | 483,851 |
| Fidelity Series Emerging Markets Debt Fund | 38,274 | 4,345 | 10,265 | 2,041 | (2,761) | 3,287 | 32,880 |
| Fidelity Series Emerging Markets Debt Local Currency Fund | 12,707 | 572 | 3,719 | - | (550) | 2,146 | 11,156 |
| Fidelity Series Emerging Markets Fund | 55,240 | 27,196 | 17,664 | 1,140 | (1,919) | 7,236 | 70,089 |
| Fidelity Series Emerging Markets Opportunities Fund | 499,014 | 26,447 | 254,141 | 9,566 | (29,141) | 61,170 | 303,349 |
| Fidelity Series Floating Rate High Income Fund | 7,347 | 2,113 | 3,113 | 539 | (113) | 214 | 6,448 |
| Fidelity Series Government Bond Index Fund | 742,814 | 164,771 | 159,340 | 16,303 | (5,081) | (39,643) | 703,521 |
| Fidelity Series Government Money Market Fund 5.33% | 91,044 | 71,273 | 48,533 | 4,497 | - | - | 113,784 |
| Fidelity Series High Income Fund | 39,670 | 5,022 | 9,130 | 2,266 | (910) | (84) | 34,568 |
| Fidelity Series International Credit Fund | 2,343 | 130 | - | 130 | - | (241) | 2,232 |
| Fidelity Series International Developed Markets Bond Index Fund | 293,341 | 38,015 | 62,505 | 5,810 | (3,919) | (14,622) | 250,310 |
| Fidelity Series International Growth Fund | 178,276 | 22,168 | 64,573 | 5,096 | (2,447) | 14,812 | 148,236 |
| Fidelity Series International Index Fund | 74,651 | 7,473 | 33,834 | 1,634 | 2,753 | 4,993 | 56,036 |
| Fidelity Series International Small Cap Fund | 54,975 | 5,549 | 14,775 | 2,806 | (437) | 1,183 | 46,495 |
| Fidelity Series International Value Fund | 176,756 | 20,426 | 71,491 | 4,990 | 713 | 22,848 | 149,252 |
| Fidelity Series Investment Grade Bond Fund | 767,790 | 152,809 | 161,046 | 26,845 | (4,681) | (35,984) | 718,888 |
| Fidelity Series Investment Grade Securitized Fund | 543,101 | 95,105 | 112,038 | 16,422 | (5,140) | (33,022) | 488,006 |
| Fidelity Series Large Cap Growth Index Fund | 132,345 | 21,150 | 68,611 | 984 | 8,436 | 6,520 | 99,840 |
| Fidelity Series Large Cap Stock Fund | 144,986 | 25,095 | 70,730 | 8,317 | 5,479 | 5,888 | 110,718 |
| Fidelity Series Large Cap Value Index Fund | 276,852 | 45,178 | 123,959 | 8,105 | 10,659 | (3,005) | 205,725 |
| Fidelity Series Long-Term Treasury Bond Index Fund | 343,883 | 75,407 | 118,568 | 8,532 | (20,219) | (21,820) | 258,683 |
| Fidelity Series Overseas Fund | 179,321 | 17,683 | 65,911 | 2,684 | 4,333 | 12,974 | 148,400 |
| Fidelity Series Real Estate Income Fund | 22,362 | 3,281 | 14,592 | 1,639 | (1,599) | (509) | 8,943 |
| Fidelity Series Short-Term Credit Fund | 90,832 | 5,659 | 19,775 | 1,920 | (499) | 161 | 76,378 |
| Fidelity Series Small Cap Core Fund | - | 1,348 | 846 | - | (10) | 63 | 555 |
| Fidelity Series Small Cap Opportunities Fund | 70,833 | 9,326 | 32,578 | 3,061 | 410 | 2,631 | 50,622 |
| Fidelity Series Treasury Bill Index Fund | 273,248 | 157,718 | 113,280 | 12,787 | (241) | (632) | 316,813 |
| Fidelity Series Value Discovery Fund | 102,106 | 17,824 | 44,497 | 4,302 | 2,395 | (1,933) | 75,895 |
| | 7,348,617 | 1,518,814 | 2,323,793 | 293,882 | (106,134) | (81,038) | 6,355,494 |
Amounts in the dividend income column in the above table include any capital gain distributions from underlying funds, which are presented in the corresponding line item in the Statement of Operations, if applicable.
Amounts included in the purchases and sales proceeds columns may include in-kind transactions, if applicable.
Investment Valuation
The following is a summary of the inputs used, as of July 31, 2023, involving the Fund's assets and liabilities carried at fair value. The inputs or methodology used for valuing securities may not be an indication of the risk associated with investing in those securities. For more information on valuation inputs, and their aggregation into the levels used below, please refer to the Investment Valuation section in the accompanying Notes to Financial Statements.
| Valuation Inputs at Reporting Date: |
| Description | Total ($) | Level 1 ($) | Level 2 ($) | Level 3 ($) |
Investments in Securities: | | | | |
|
| Domestic Equity Funds | 749,372 | 749,372 | - | - |
|
| International Equity Funds | 980,620 | 980,620 | - | - |
|
| Bond Funds | 4,118,527 | 4,118,527 | - | - |
|
| Short-Term Funds | 506,975 | 506,975 | - | - |
| Total Investments in Securities: | 6,355,494 | 6,355,494 | - | - |
Fidelity Managed Retirement 2015 Fund℠
| Statement of Assets and Liabilities |
| | | | July 31, 2023 |
| | | | | |
| Assets | | | | |
| Investment in securities, at value - See accompanying schedule: | | | | |
Affiliated issuers (cost $6,582,980) | $ | 6,355,494 | | |
| | | | | |
| | | | | |
| Total Investment in Securities (cost $6,582,980) | | | $ | 6,355,494 |
| Cash | | | | 5 |
| Receivable for investments sold | | | | 68,311 |
| Receivable for fund shares sold | | | | 100 |
Total assets | | | | 6,423,910 |
| Liabilities | | | | |
| Payable for investments purchased | $ | 66,081 | | |
| Payable for fund shares redeemed | | 33 | | |
| Accrued management fee | | 2,408 | | |
| Distribution and service plan fees payable | | 236 | | |
| Total Liabilities | | | | 68,758 |
| Net Assets | | | $ | 6,355,152 |
| Net Assets consist of: | | | | |
| Paid in capital | | | $ | 6,763,395 |
| Total accumulated earnings (loss) | | | | (408,243) |
| Net Assets | | | $ | 6,355,152 |
| | | | | |
| Net Asset Value and Maximum Offering Price | | | | |
| Class A : | | | | |
Net Asset Value and redemption price per share ($1,042,878 ÷ 20,655.93 shares)(a) | | | $ | 50.49 |
| Maximum offering price per share (100/94.25 of $50.49) | | | $ | 53.57 |
| Fidelity Managed Retirement 2015 : | | | | |
Net Asset Value, offering price and redemption price per share ($4,612,323 ÷ 91,271.13 shares) | | | $ | 50.53 |
| Class K : | | | | |
Net Asset Value, offering price and redemption price per share ($171,249 ÷ 3,389.72 shares) | | | $ | 50.52 |
| Class K6 : | | | | |
Net Asset Value, offering price and redemption price per share ($162,262 ÷ 3,210.1 shares) | | | $ | 50.55 |
| Class I : | | | | |
Net Asset Value, offering price and redemption price per share ($253,025 ÷ 5,006.2 shares) | | | $ | 50.54 |
| Class Z6 : | | | | |
Net Asset Value, offering price and redemption price per share ($113,415 ÷ 2,243.5 shares) | | | $ | 50.55 |
(a)Redemption price per share is equal to net asset value less any applicable contingent deferred sales charge. |
| Statement of Operations |
| | | | Year ended July 31, 2023 |
| Investment Income | | | | |
| Dividends: | | | | |
| Affiliated issuers | | | $ | 268,301 |
| Expenses | | | | |
| Management fee | $ | 29,150 | | |
| Distribution and service plan fees | | 2,893 | | |
| Independent trustees' fees and expenses | | 24 | | |
| Total expenses before reductions | | 32,067 | | |
| Expense reductions | | (13) | | |
| Total expenses after reductions | | | | 32,054 |
| Net Investment income (loss) | | | | 236,247 |
| Realized and Unrealized Gain (Loss) | | | | |
| Net realized gain (loss) on: | | | | |
| Investment Securities: | | | | |
| Affiliated issuers | | (106,134) | | |
| Capital gain distributions from underlying funds: | | | | |
| Affiliated issuers | | 25,581 | | |
| Total net realized gain (loss) | | | | (80,553) |
| Change in net unrealized appreciation (depreciation) on: | | | | |
| Investment Securities: | | | | |
| Affiliated issuers | | (81,038) | | |
| Total change in net unrealized appreciation (depreciation) | | | | (81,038) |
| Net gain (loss) | | | | (161,591) |
| Net increase (decrease) in net assets resulting from operations | | | $ | 74,656 |
| Statement of Changes in Net Assets |
| |
| | Year ended July 31, 2023 | | Year ended July 31, 2022 |
| Increase (Decrease) in Net Assets | | | | |
| Operations | | | | |
| Net investment income (loss) | $ | 236,247 | $ | 200,628 |
| Net realized gain (loss) | | (80,553) | | 197,576 |
| Change in net unrealized appreciation (depreciation) | | (81,038) | | (1,146,423) |
| Net increase (decrease) in net assets resulting from operations | | 74,656 | | (748,219) |
| Distributions to shareholders | | (338,146) | | (451,806) |
| | | | | |
| Share transactions - net increase (decrease) | | (729,610) | | (374,012) |
| Total increase (decrease) in net assets | | (993,100) | | (1,574,037) |
| | | | | |
| Net Assets | | | | |
| Beginning of period | | 7,348,252 | | 8,922,289 |
| End of period | $ | 6,355,152 | $ | 7,348,252 |
| | | | | |
| | | | | |
| Fidelity Advisor Managed Retirement 2015 Fund℠ Class A |
| |
| Years ended July 31, | | 2023 | | 2022 | | 2021 | | 2020 | | 2019 |
Selected Per-Share Data | | | | | | | | | | |
| Net asset value, beginning of period | $ | 52.42 | $ | 60.51 | $ | 55.51 | $ | 53.13 | $ | 53.98 |
| Income from Investment Operations | | | | | | | | | | |
Net investment income (loss) A,B | | 1.675 | | 1.241 | | .335 | | .690 | | .887 |
| Net realized and unrealized gain (loss) | | (1.158) | | (6.395) | | 6.385 | | 3.244 | | 1.236 |
| Total from investment operations | | .517 | | (5.154) | | 6.720 | | 3.934 | | 2.123 |
| Distributions from net investment income | | (1.647) | | (1.207) | | (.369) | | (.769) | | (.884) |
| Distributions from net realized gain | | (.800) | | (1.729) | | (1.351) | | (.785) | | (2.089) |
| Total distributions | | (2.447) | | (2.936) | | (1.720) | | (1.554) | | (2.973) |
| Net asset value, end of period | $ | 50.49 | $ | 52.42 | $ | 60.51 | $ | 55.51 | $ | 53.13 |
Total Return C,D | | 1.25% | | (8.96)% | | 12.31% | | 7.54% | | 4.26% |
Ratios to Average Net Assets B,E,F | | | | | | | | | | |
| Expenses before reductions | | .71% | | .71% | | .72% | | .72% | | .78% |
| Expenses net of fee waivers, if any | | .71% | | .71% | | .72% | | .72% | | .78% |
| Expenses net of all reductions | | .71% | | .71% | | .72% | | .72% | | .78% |
| Net investment income (loss) | | 3.39% | | 2.20% | | .58% | | 1.30% | | 1.71% |
| Supplemental Data | | | | | | | | | | |
| Net assets, end of period (000 omitted) | $ | 1,043 | $ | 1,242 | $ | 1,461 | $ | 1,024 | $ | 244 |
Portfolio turnover rate G | | 23% | | 60% | | 32% | | 61% | | 67% |
ACalculated based on average shares outstanding during the period.
BNet investment income (loss) is affected by the timing of the declaration of dividends by any underlying mutual funds or exchange-traded funds (ETFs). Net investment income (loss) of any mutual funds or ETFs is not included in the Fund's net investment income (loss) ratio.
CTotal returns would have been lower if certain expenses had not been reduced during the applicable periods shown.
DTotal returns do not include the effect of the sales charges.
EFees and expenses of any underlying mutual funds or exchange-traded funds (ETFs) are not included in the Fund's expense ratio. The Fund indirectly bears its proportionate share of these expenses.
FExpense ratios reflect operating expenses of the class. Expenses before reductions do not reflect amounts reimbursed, waived, or reduced through arrangements with the investment adviser, brokerage services, or other offset arrangements, if applicable, and do not represent the amount paid by the class during periods when reimbursements, waivers or reductions occur.
GAmount does not include the portfolio activity of any underlying mutual funds or exchange-traded funds (ETFs).
| Fidelity Managed Retirement 2015 Fund℠ |
| |
| Years ended July 31, | | 2023 | | 2022 | | 2021 | | 2020 | | 2019 |
Selected Per-Share Data | | | | | | | | | | |
| Net asset value, beginning of period | $ | 52.47 | $ | 60.56 | $ | 55.53 | $ | 53.11 | $ | 53.97 |
| Income from Investment Operations | | | | | | | | | | |
Net investment income (loss) A,B | | 1.799 | | 1.389 | | .481 | | .825 | | 1.017 |
| Net realized and unrealized gain (loss) | | (1.166) | | (6.410) | | 6.395 | | 3.250 | | 1.226 |
| Total from investment operations | | .633 | | (5.021) | | 6.876 | | 4.075 | | 2.243 |
| Distributions from net investment income | | (1.773) | | (1.340) | | (.495) | | (.870) | | (1.014) |
| Distributions from net realized gain | | (.800) | | (1.729) | | (1.351) | | (.785) | | (2.089) |
| Total distributions | | (2.573) | | (3.069) | | (1.846) | | (1.655) | | (3.103) |
| Net asset value, end of period | $ | 50.53 | $ | 52.47 | $ | 60.56 | $ | 55.53 | $ | 53.11 |
Total Return C | | 1.49% | | (8.74)% | | 12.60% | | 7.83% | | 4.50% |
Ratios to Average Net Assets B,D,E | | | | | | | | | | |
| Expenses before reductions | | .46% | | .46% | | .47% | | .47% | | .53% |
| Expenses net of fee waivers, if any | | .46% | | .46% | | .47% | | .47% | | .53% |
| Expenses net of all reductions | | .46% | | .46% | | .47% | | .47% | | .53% |
| Net investment income (loss) | | 3.64% | | 2.45% | | .83% | | 1.55% | | 1.96% |
| Supplemental Data | | | | | | | | | | |
| Net assets, end of period (000 omitted) | $ | 4,612 | $ | 4,768 | $ | 6,736 | $ | 5,155 | $ | 4,087 |
Portfolio turnover rate F | | 23% | | 60% | | 32% | | 61% | | 67% |
ACalculated based on average shares outstanding during the period.
BNet investment income (loss) is affected by the timing of the declaration of dividends by any underlying mutual funds or exchange-traded funds (ETFs). Net investment income (loss) of any mutual funds or ETFs is not included in the Fund's net investment income (loss) ratio.
CTotal returns would have been lower if certain expenses had not been reduced during the applicable periods shown.
DFees and expenses of any underlying mutual funds or exchange-traded funds (ETFs) are not included in the Fund's expense ratio. The Fund indirectly bears its proportionate share of these expenses.
EExpense ratios reflect operating expenses of the class. Expenses before reductions do not reflect amounts reimbursed, waived, or reduced through arrangements with the investment adviser, brokerage services, or other offset arrangements, if applicable, and do not represent the amount paid by the class during periods when reimbursements, waivers or reductions occur.
FAmount does not include the portfolio activity of any underlying mutual funds or exchange-traded funds (ETFs).
| Fidelity Managed Retirement 2015 Fund℠ Class K |
| |
| Years ended July 31, | | 2023 | | 2022 | | 2021 | | 2020 A |
Selected Per-Share Data | | | | | | | | |
| Net asset value, beginning of period | $ | 52.46 | $ | 60.55 | $ | 55.52 | $ | 53.08 |
| Income from Investment Operations | | | | | | | | |
Net investment income (loss) B,C | | 1.845 | | 1.436 | | .539 | | .879 |
| Net realized and unrealized gain (loss) | | (1.158) | | (6.395) | | 6.392 | | 3.270 |
| Total from investment operations | | .687 | | (4.959) | | 6.931 | | 4.149 |
| Distributions from net investment income | | (1.827) | | (1.402) | | (.550) | | (.924) |
| Distributions from net realized gain | | (.800) | | (1.729) | | (1.351) | | (.785) |
| Total distributions | | (2.627) | | (3.131) | | (1.901) | | (1.709) |
| Net asset value, end of period | $ | 50.52 | $ | 52.46 | $ | 60.55 | $ | 55.52 |
Total Return D | | 1.60% | | (8.64)% | | 12.71% | | 7.98% |
Ratios to Average Net Assets C,E,F | | | | | | | | |
| Expenses before reductions | | .36% | | .36% | | .37% | | .37% |
| Expenses net of fee waivers, if any | | .36% | | .36% | | .37% | | .37% |
| Expenses net of all reductions | | .36% | | .36% | | .37% | | .37% |
| Net investment income (loss) | | 3.74% | | 2.55% | | .93% | | 1.65% |
| Supplemental Data | | | | | | | | |
| Net assets, end of period (000 omitted) | $ | 171 | $ | 111 | $ | 122 | $ | 108 |
Portfolio turnover rate G | | 23% | | 60% | | 32% | | 61% |
AFor the period August 1, 2019 (commencement of sale of shares) through July 31, 2020.
BCalculated based on average shares outstanding during the period.
CNet investment income (loss) is affected by the timing of the declaration of dividends by any underlying mutual funds or exchange-traded funds (ETFs). Net investment income (loss) of any mutual funds or ETFs is not included in the Fund's net investment income (loss) ratio.
DTotal returns for periods of less than one year are not annualized.
EFees and expenses of any underlying mutual funds or exchange-traded funds (ETFs) are not included in the Fund's expense ratio. The Fund indirectly bears its proportionate share of these expenses.
FExpense ratios reflect operating expenses of the class. Expenses before reductions do not reflect amounts reimbursed, waived, or reduced through arrangements with the investment adviser, brokerage services, or other offset arrangements, if applicable, and do not represent the amount paid by the class during periods when reimbursements, waivers or reductions occur.
GAmount does not include the portfolio activity of any underlying mutual funds or exchange-traded funds (ETFs).
| Fidelity Managed Retirement 2015 Fund℠ Class K6 |
| |
| Years ended July 31, | | 2023 | | 2022 | | 2021 | | 2020 A |
Selected Per-Share Data | | | | | | | | |
| Net asset value, beginning of period | $ | 52.46 | $ | 60.56 | $ | 55.53 | $ | 53.08 |
| Income from Investment Operations | | | | | | | | |
Net investment income (loss) B,C | | 1.920 | | 1.434 | | .597 | | .932 |
| Net realized and unrealized gain (loss) | | (1.181) | | (6.334) | | 6.391 | | 3.274 |
| Total from investment operations | | .739 | | (4.900) | | 6.988 | | 4.206 |
| Distributions from net investment income | | (1.849) | | (1.471) | | (.607) | | (.971) |
| Distributions from net realized gain | | (.800) | | (1.729) | | (1.351) | | (.785) |
| Total distributions | | (2.649) | | (3.200) | | (1.958) | | (1.756) |
| Net asset value, end of period | $ | 50.55 | $ | 52.46 | $ | 60.56 | $ | 55.53 |
Total Return D,E | | 1.70% | | (8.54)% | | 12.82% | | 8.09% |
Ratios to Average Net Assets C,F,G | | | | | | | | |
| Expenses before reductions | | .26% | | .26% | | .27% | | .27% |
| Expenses net of fee waivers, if any | | .26% | | .26% | | .27% | | .27% |
| Expenses net of all reductions | | .25% | | .26% | | .27% | | .27% |
| Net investment income (loss) | | 3.85% | | 2.65% | | 1.03% | | 1.75% |
| Supplemental Data | | | | | | | | |
| Net assets, end of period (000 omitted) | $ | 162 | $ | 837 | $ | 204 | $ | 112 |
Portfolio turnover rate H | | 23% | | 60% | | 32% | | 61% |
AFor the period August 1, 2019 (commencement of sale of shares) through July 31, 2020.
BCalculated based on average shares outstanding during the period.
CNet investment income (loss) is affected by the timing of the declaration of dividends by any underlying mutual funds or exchange-traded funds (ETFs). Net investment income (loss) of any mutual funds or ETFs is not included in the Fund's net investment income (loss) ratio.
DTotal returns would have been lower if certain expenses had not been reduced during the applicable periods shown.
ETotal returns for periods of less than one year are not annualized.
FFees and expenses of any underlying mutual funds or exchange-traded funds (ETFs) are not included in the Fund's expense ratio. The Fund indirectly bears its proportionate share of these expenses.
GExpense ratios reflect operating expenses of the class. Expenses before reductions do not reflect amounts reimbursed, waived, or reduced through arrangements with the investment adviser, brokerage services, or other offset arrangements, if applicable, and do not represent the amount paid by the class during periods when reimbursements, waivers or reductions occur.
HAmount does not include the portfolio activity of any underlying mutual funds or exchange-traded funds (ETFs).
| Fidelity Advisor Managed Retirement 2015 Fund℠ Class I |
| |
| Years ended July 31, | | 2023 | | 2022 | | 2021 | | 2020 | | 2019 |
Selected Per-Share Data | | | | | | | | | | |
| Net asset value, beginning of period | $ | 52.48 | $ | 60.57 | $ | 55.54 | $ | 53.12 | $ | 53.98 |
| Income from Investment Operations | | | | | | | | | | |
Net investment income (loss) A,B | | 1.799 | | 1.376 | | .481 | | .827 | | 1.015 |
| Net realized and unrealized gain (loss) | | (1.168) | | (6.387) | | 6.390 | | 3.242 | | 1.227 |
| Total from investment operations | | .631 | | (5.011) | | 6.871 | | 4.069 | | 2.242 |
| Distributions from net investment income | | (1.771) | | (1.350) | | (.490) | | (.864) | | (1.013) |
| Distributions from net realized gain | | (.800) | | (1.729) | | (1.351) | | (.785) | | (2.089) |
| Total distributions | | (2.571) | | (3.079) | | (1.841) | | (1.649) | | (3.102) |
| Net asset value, end of period | $ | 50.54 | $ | 52.48 | $ | 60.57 | $ | 55.54 | $ | 53.12 |
Total Return C | | 1.48% | | (8.72)% | | 12.59% | | 7.81% | | 4.50% |
Ratios to Average Net Assets B,D,E | | | | | | | | | | |
| Expenses before reductions | | .46% | | .46% | | .47% | | .47% | | .53% |
| Expenses net of fee waivers, if any | | .46% | | .46% | | .47% | | .47% | | .53% |
| Expenses net of all reductions | | .46% | | .46% | | .47% | | .47% | | .53% |
| Net investment income (loss) | | 3.64% | | 2.45% | | .83% | | 1.55% | | 1.97% |
| Supplemental Data | | | | | | | | | | |
| Net assets, end of period (000 omitted) | $ | 253 | $ | 279 | $ | 278 | $ | 274 | $ | 287 |
Portfolio turnover rate F | | 23% | | 60% | | 32% | | 61% | | 67% |
ACalculated based on average shares outstanding during the period.
BNet investment income (loss) is affected by the timing of the declaration of dividends by any underlying mutual funds or exchange-traded funds (ETFs). Net investment income (loss) of any mutual funds or ETFs is not included in the Fund's net investment income (loss) ratio.
CTotal returns would have been lower if certain expenses had not been reduced during the applicable periods shown.
DFees and expenses of any underlying mutual funds or exchange-traded funds (ETFs) are not included in the Fund's expense ratio. The Fund indirectly bears its proportionate share of these expenses.
EExpense ratios reflect operating expenses of the class. Expenses before reductions do not reflect amounts reimbursed, waived, or reduced through arrangements with the investment adviser, brokerage services, or other offset arrangements, if applicable, and do not represent the amount paid by the class during periods when reimbursements, waivers or reductions occur.
FAmount does not include the portfolio activity of any underlying mutual funds or exchange-traded funds (ETFs).
| Fidelity Advisor Managed Retirement 2015 Fund℠ Class Z6 |
| |
| Years ended July 31, | | 2023 | | 2022 | | 2021 | | 2020 A |
Selected Per-Share Data | | | | | | | | |
| Net asset value, beginning of period | $ | 52.49 | $ | 60.58 | $ | 55.55 | $ | 53.09 |
| Income from Investment Operations | | | | | | | | |
Net investment income (loss) B,C | | 1.898 | | 1.493 | | .597 | | .932 |
| Net realized and unrealized gain (loss) | | (1.165) | | (6.396) | | 6.390 | | 3.276 |
| Total from investment operations | | .733 | | (4.903) | | 6.987 | | 4.208 |
| Distributions from net investment income | | (1.873) | | (1.458) | | (.606) | | (.963) |
| Distributions from net realized gain | | (.800) | | (1.729) | | (1.351) | | (.785) |
| Total distributions | | (2.673) | | (3.187) | | (1.957) | | (1.748) |
| Net asset value, end of period | $ | 50.55 | $ | 52.49 | $ | 60.58 | $ | 55.55 |
Total Return D | | 1.69% | | (8.54)% | | 12.81% | | 8.09% |
Ratios to Average Net Assets C,E,F | | | | | | | | |
| Expenses before reductions | | .26% | | .26% | | .27% | | .27% |
| Expenses net of fee waivers, if any | | .26% | | .26% | | .27% | | .27% |
| Expenses net of all reductions | | .26% | | .26% | | .27% | | .27% |
| Net investment income (loss) | | 3.84% | | 2.65% | | 1.03% | | 1.75% |
| Supplemental Data | | | | | | | | |
| Net assets, end of period (000 omitted) | $ | 113 | $ | 112 | $ | 122 | $ | 108 |
Portfolio turnover rate G | | 23% | | 60% | | 32% | | 61% |
AFor the period August 1, 2019 (commencement of sale of shares) through July 31, 2020.
BCalculated based on average shares outstanding during the period.
CNet investment income (loss) is affected by the timing of the declaration of dividends by any underlying mutual funds or exchange-traded funds (ETFs). Net investment income (loss) of any mutual funds or ETFs is not included in the Fund's net investment income (loss) ratio.
DTotal returns for periods of less than one year are not annualized.
EFees and expenses of any underlying mutual funds or exchange-traded funds (ETFs) are not included in the Fund's expense ratio. The Fund indirectly bears its proportionate share of these expenses.
FExpense ratios reflect operating expenses of the class. Expenses before reductions do not reflect amounts reimbursed, waived, or reduced through arrangements with the investment adviser, brokerage services, or other offset arrangements, if applicable, and do not represent the amount paid by the class during periods when reimbursements, waivers or reductions occur.
GAmount does not include the portfolio activity of any underlying mutual funds or exchange-traded funds (ETFs).
The information in the following tables is based on the direct Investments of the Fund.
Top Holdings (% of Fund's net assets) |
| |
| Fidelity Series Investment Grade Bond Fund | 10.5 | |
| Fidelity Series 0-5 Year Inflation-Protected Bond Index Fund | 10.3 | |
| Fidelity Series Government Bond Index Fund | 10.3 | |
| Fidelity Series Investment Grade Securitized Fund | 7.2 | |
| Fidelity Series Corporate Bond Fund | 7.1 | |
| Fidelity Series Emerging Markets Opportunities Fund | 5.3 | |
| Fidelity Series 5+ Year Inflation-Protected Bond Index Fund | 5.1 | |
| Fidelity Series Large Cap Value Index Fund | 4.4 | |
| Fidelity Series Long-Term Treasury Bond Index Fund | 4.3 | |
| Fidelity Series International Developed Markets Bond Index Fund | 4.0 | |
| | 68.5 | |
| |
Asset Allocation (% of Fund's net assets) |
|
Percentages shown as 0.0% may reflect amounts less than 0.05%. |
|
Domestic Equity Funds category includes Fidelity Series Commodity Strategy Fund which invests in commodity-related investments.
Fidelity Managed Retirement 2020 Fund℠
Showing Percentage of Net Assets
| Domestic Equity Funds - 15.7% |
| | | Shares | Value ($) |
| Fidelity Series Blue Chip Growth Fund (a) | | 20,082 | 295,007 |
| Fidelity Series Commodity Strategy Fund (a) | | 642 | 66,092 |
| Fidelity Series Large Cap Growth Index Fund (a) | | 10,345 | 186,316 |
| Fidelity Series Large Cap Stock Fund (a) | | 10,446 | 206,623 |
| Fidelity Series Large Cap Value Index Fund (a) | | 25,634 | 383,990 |
| Fidelity Series Small Cap Core Fund (a) | | 125 | 1,355 |
| Fidelity Series Small Cap Opportunities Fund (a) | | 7,010 | 94,427 |
| Fidelity Series Value Discovery Fund (a) | | 9,231 | 141,611 |
| TOTAL DOMESTIC EQUITY FUNDS (Cost $1,123,482) | | | 1,375,421 |
| | | | |
| International Equity Funds - 18.0% |
| | | Shares | Value ($) |
| Fidelity Series Canada Fund (a) | | 6,595 | 96,684 |
| Fidelity Series Emerging Markets Fund (a) | | 13,280 | 116,200 |
| Fidelity Series Emerging Markets Opportunities Fund (a) | | 25,655 | 462,813 |
| Fidelity Series International Growth Fund (a) | | 14,687 | 243,958 |
| Fidelity Series International Index Fund (a) | | 7,820 | 92,199 |
| Fidelity Series International Small Cap Fund (a) | | 4,592 | 76,370 |
| Fidelity Series International Value Fund (a) | | 21,450 | 245,605 |
| Fidelity Series Overseas Fund (a) | | 19,215 | 244,227 |
| TOTAL INTERNATIONAL EQUITY FUNDS (Cost $1,393,308) | | | 1,578,056 |
| | | | |
| Bond Funds - 60.3% |
| | | Shares | Value ($) |
| Fidelity Series 0-5 Year Inflation-Protected Bond Index Fund (a) | | 95,319 | 903,622 |
| Fidelity Series 5+ Year Inflation-Protected Bond Index Fund (a) | | 56,906 | 448,419 |
| Fidelity Series Corporate Bond Fund (a) | | 68,471 | 621,030 |
| Fidelity Series Emerging Markets Debt Fund (a) | | 6,017 | 45,311 |
| Fidelity Series Emerging Markets Debt Local Currency Fund (a) | | 1,592 | 15,382 |
| Fidelity Series Floating Rate High Income Fund (a) | | 985 | 8,858 |
| Fidelity Series Government Bond Index Fund (a) | | 99,013 | 902,994 |
| Fidelity Series High Income Fund (a) | | 5,751 | 47,504 |
| Fidelity Series International Credit Fund (a) | | 232 | 1,789 |
| Fidelity Series International Developed Markets Bond Index Fund (a) | | 40,625 | 346,129 |
| Fidelity Series Investment Grade Bond Fund (a) | | 92,921 | 922,704 |
| Fidelity Series Investment Grade Securitized Fund (a) | | 70,616 | 626,368 |
| Fidelity Series Long-Term Treasury Bond Index Fund (a) | | 63,253 | 371,293 |
| Fidelity Series Real Estate Income Fund (a) | | 1,256 | 12,187 |
| TOTAL BOND FUNDS (Cost $5,988,252) | | | 5,273,590 |
| | | | |
| Short-Term Funds - 6.0% |
| | | Shares | Value ($) |
| Fidelity Series Government Money Market Fund 5.33% (a)(b) | | 123,748 | 123,748 |
| Fidelity Series Short-Term Credit Fund (a) | | 7,172 | 69,208 |
| Fidelity Series Treasury Bill Index Fund (a) | | 33,730 | 335,280 |
| TOTAL SHORT-TERM FUNDS (Cost $531,125) | | | 528,236 |
| | | | |
| TOTAL INVESTMENT IN SECURITIES - 100.0% (Cost $9,036,167) | 8,755,303 |
NET OTHER ASSETS (LIABILITIES) - 0.0% | (193) |
| NET ASSETS - 100.0% | 8,755,110 |
| | |
Legend
| (b) | The rate quoted is the annualized seven-day yield of the fund at period end. |
Affiliated Underlying Funds
Fiscal year to date information regarding the Fund's investments in affiliated Underlying Funds is presented below. Exchanges between classes of the same affiliated Underlying Funds may occur. If an Underlying Funds changes its name, the name presented below is the name in effect at period end.
| Affiliate | Value, beginning of period ($) | Purchases ($) | Sales Proceeds ($) | Dividend Income ($) | Realized Gain (loss) ($) | Change in Unrealized appreciation (depreciation) ($) | Value, end of period ($) |
| Fidelity Series 0-5 Year Inflation-Protected Bond Index Fund | 973,591 | 273,687 | 285,949 | 44,985 | (7,199) | (49,519) | 903,622 |
| Fidelity Series 5+ Year Inflation-Protected Bond Index Fund | 515,293 | 152,853 | 147,174 | 31,384 | (18,842) | (53,711) | 448,419 |
| Fidelity Series Blue Chip Growth Fund | 382,544 | 88,209 | 234,898 | 12,378 | (63,301) | 122,453 | 295,007 |
| Fidelity Series Canada Fund | 141,395 | 19,962 | 67,686 | 3,599 | 5,679 | (2,666) | 96,684 |
| Fidelity Series Commodity Strategy Fund | 154,277 | 109,287 | 103,909 | 82,702 | (48,786) | (44,777) | 66,092 |
| Fidelity Series Corporate Bond Fund | 653,761 | 171,098 | 170,965 | 24,046 | (14,537) | (18,327) | 621,030 |
| Fidelity Series Emerging Markets Debt Fund | 53,422 | 7,890 | 16,472 | 2,898 | (2,488) | 2,959 | 45,311 |
| Fidelity Series Emerging Markets Debt Local Currency Fund | 17,731 | 1,395 | 5,921 | - | (715) | 2,892 | 15,382 |
| Fidelity Series Emerging Markets Fund | 84,756 | 50,068 | 26,884 | 1,783 | (4,820) | 13,080 | 116,200 |
| Fidelity Series Emerging Markets Opportunities Fund | 765,590 | 62,368 | 409,479 | 15,024 | (76,374) | 120,708 | 462,813 |
| Fidelity Series Floating Rate High Income Fund | 10,170 | 3,655 | 5,096 | 761 | (175) | 304 | 8,858 |
| Fidelity Series Government Bond Index Fund | 960,216 | 269,203 | 265,589 | 21,408 | (14,177) | (46,659) | 902,994 |
| Fidelity Series Government Money Market Fund 5.33% | 87,618 | 90,505 | 54,375 | 4,808 | - | - | 123,748 |
| Fidelity Series High Income Fund | 55,379 | 9,619 | 15,846 | 3,221 | (1,436) | (212) | 47,504 |
| Fidelity Series International Credit Fund | 1,877 | 105 | - | 104 | - | (193) | 1,789 |
| Fidelity Series International Developed Markets Bond Index Fund | 409,032 | 78,654 | 113,942 | 8,209 | (9,033) | (18,582) | 346,129 |
| Fidelity Series International Growth Fund | 294,302 | 49,236 | 118,492 | 8,620 | (10,823) | 29,735 | 243,958 |
| Fidelity Series International Index Fund | 123,237 | 16,979 | 60,327 | 2,765 | (544) | 12,854 | 92,199 |
| Fidelity Series International Small Cap Fund | 90,920 | 12,024 | 27,200 | 4,746 | (3,656) | 4,282 | 76,370 |
| Fidelity Series International Value Fund | 291,606 | 43,256 | 127,328 | 8,441 | (1,663) | 39,734 | 245,605 |
| Fidelity Series Investment Grade Bond Fund | 992,561 | 254,766 | 268,087 | 35,313 | (18,292) | (38,244) | 922,704 |
| Fidelity Series Investment Grade Securitized Fund | 702,080 | 164,909 | 188,313 | 21,579 | (14,202) | (38,106) | 626,368 |
| Fidelity Series Large Cap Growth Index Fund | 242,075 | 45,554 | 128,104 | 1,858 | 15,459 | 11,332 | 186,316 |
| Fidelity Series Large Cap Stock Fund | 265,195 | 55,048 | 133,999 | 15,879 | 10,017 | 10,362 | 206,623 |
| Fidelity Series Large Cap Value Index Fund | 506,406 | 93,015 | 227,453 | 15,488 | 21,848 | (9,826) | 383,990 |
| Fidelity Series Long-Term Treasury Bond Index Fund | 496,350 | 126,738 | 186,885 | 12,570 | (36,046) | (28,864) | 371,293 |
| Fidelity Series Overseas Fund | 296,030 | 42,949 | 122,260 | 4,540 | (4,638) | 32,146 | 244,227 |
| Fidelity Series Real Estate Income Fund | 31,887 | 7,675 | 24,187 | 2,354 | (2,432) | (756) | 12,187 |
| Fidelity Series Short-Term Credit Fund | 87,414 | 9,547 | 27,329 | 1,843 | (810) | 386 | 69,208 |
| Fidelity Series Small Cap Core Fund | - | 2,554 | 1,333 | 1 | (19) | 153 | 1,355 |
| Fidelity Series Small Cap Opportunities Fund | 130,081 | 21,854 | 62,712 | 5,853 | (4,715) | 9,919 | 94,427 |
| Fidelity Series Treasury Bill Index Fund | 263,033 | 245,931 | 172,730 | 13,648 | (314) | (640) | 335,280 |
| Fidelity Series Value Discovery Fund | 186,766 | 40,573 | 85,925 | 8,207 | 4,553 | (4,356) | 141,611 |
| | 10,266,595 | 2,621,166 | 3,886,849 | 421,015 | (302,481) | 57,861 | 8,755,303 |
Amounts in the dividend income column in the above table include any capital gain distributions from underlying funds, which are presented in the corresponding line item in the Statement of Operations, if applicable.
Amounts included in the purchases and sales proceeds columns may include in-kind transactions, if applicable.
Investment Valuation
The following is a summary of the inputs used, as of July 31, 2023, involving the Fund's assets and liabilities carried at fair value. The inputs or methodology used for valuing securities may not be an indication of the risk associated with investing in those securities. For more information on valuation inputs, and their aggregation into the levels used below, please refer to the Investment Valuation section in the accompanying Notes to Financial Statements.
| Valuation Inputs at Reporting Date: |
| Description | Total ($) | Level 1 ($) | Level 2 ($) | Level 3 ($) |
Investments in Securities: | | | | |
|
| Domestic Equity Funds | 1,375,421 | 1,375,421 | - | - |
|
| International Equity Funds | 1,578,056 | 1,578,056 | - | - |
|
| Bond Funds | 5,273,590 | 5,273,590 | - | - |
|
| Short-Term Funds | 528,236 | 528,236 | - | - |
| Total Investments in Securities: | 8,755,303 | 8,755,303 | - | - |
Fidelity Managed Retirement 2020 Fund℠
| Statement of Assets and Liabilities |
| | | | July 31, 2023 |
| | | | | |
| Assets | | | | |
| Investment in securities, at value - See accompanying schedule: | | | | |
Affiliated issuers (cost $9,036,167) | $ | 8,755,303 | | |
| | | | | |
| | | | | |
| Total Investment in Securities (cost $9,036,167) | | | $ | 8,755,303 |
| Cash | | | | 40 |
| Receivable for investments sold | | | | 105,418 |
| Receivable for fund shares sold | | | | 200 |
Total assets | | | | 8,860,961 |
| Liabilities | | | | |
| Payable for investments purchased | $ | 102,443 | | |
| Payable for fund shares redeemed | | 33 | | |
| Accrued management fee | | 3,307 | | |
| Distribution and service plan fees payable | | 68 | | |
| Total Liabilities | | | | 105,851 |
| Net Assets | | | $ | 8,755,110 |
| Net Assets consist of: | | | | |
| Paid in capital | | | $ | 9,446,223 |
| Total accumulated earnings (loss) | | | | (691,113) |
| Net Assets | | | $ | 8,755,110 |
| | | | | |
| Net Asset Value and Maximum Offering Price | | | | |
| Class A : | | | | |
Net Asset Value and redemption price per share ($234,288 ÷ 4,600.38 shares)(a) | | | $ | 50.93 |
| Maximum offering price per share (100/94.25 of $50.93) | | | $ | 54.04 |
| Fidelity Managed Retirement 2020 : | | | | |
Net Asset Value, offering price and redemption price per share ($7,304,879 ÷ 143,227.51 shares) | | | $ | 51.00 |
| Class K : | | | | |
Net Asset Value, offering price and redemption price per share ($140,566 ÷ 2,755.7 shares) | | | $ | 51.01 |
| Class K6 : | | | | |
Net Asset Value, offering price and redemption price per share ($740,556 ÷ 14,517.07 shares) | | | $ | 51.01 |
| Class I : | | | | |
Net Asset Value, offering price and redemption price per share ($218,138 ÷ 4,275.11 shares) | | | $ | 51.03 |
| Class Z6 : | | | | |
Net Asset Value, offering price and redemption price per share ($116,683 ÷ 2,287.25 shares) | | | $ | 51.01 |
(a)Redemption price per share is equal to net asset value less any applicable contingent deferred sales charge. |
| Statement of Operations |
| | | | Year ended July 31, 2023 |
| Investment Income | | | | |
| Dividends: | | | | |
| Affiliated issuers | | | $ | 373,528 |
| Expenses | | | | |
| Management fee | $ | 41,520 | | |
| Distribution and service plan fees | | 1,300 | | |
| Independent trustees' fees and expenses | | 34 | | |
| Total expenses before reductions | | 42,854 | | |
| Expense reductions | | (1) | | |
| Total expenses after reductions | | | | 42,853 |
| Net Investment income (loss) | | | | 330,675 |
| Realized and Unrealized Gain (Loss) | | | | |
| Net realized gain (loss) on: | | | | |
| Investment Securities: | | | | |
| Affiliated issuers | | (302,481) | | |
| Capital gain distributions from underlying funds: | | | | |
| Affiliated issuers | | 47,487 | | |
| Total net realized gain (loss) | | | | (254,994) |
| Change in net unrealized appreciation (depreciation) on: | | | | |
| Investment Securities: | | | | |
| Affiliated issuers | | 57,861 | | |
| Total change in net unrealized appreciation (depreciation) | | | | 57,861 |
| Net gain (loss) | | | | (197,133) |
| Net increase (decrease) in net assets resulting from operations | | | $ | 133,542 |
| Statement of Changes in Net Assets |
| |
| | Year ended July 31, 2023 | | Year ended July 31, 2022 |
| Increase (Decrease) in Net Assets | | | | |
| Operations | | | | |
| Net investment income (loss) | $ | 330,675 | $ | 299,008 |
| Net realized gain (loss) | | (254,994) | | 175,685 |
| Change in net unrealized appreciation (depreciation) | | 57,861 | | (1,691,577) |
| Net increase (decrease) in net assets resulting from operations | | 133,542 | | (1,216,884) |
| Distributions to shareholders | | (360,184) | | (584,790) |
| | | | | |
| Share transactions - net increase (decrease) | | (1,284,586) | | (1,268,088) |
| Total increase (decrease) in net assets | | (1,511,228) | | (3,069,762) |
| | | | | |
| Net Assets | | | | |
| Beginning of period | | 10,266,338 | | 13,336,100 |
| End of period | $ | 8,755,110 | $ | 10,266,338 |
| | | | | |
| | | | | |
| Fidelity Advisor Managed Retirement 2020 Fund℠ Class A |
| |
| Years ended July 31, | | 2023 | | 2022 | | 2021 | | 2020 | | 2019 |
Selected Per-Share Data | | | | | | | | | | |
| Net asset value, beginning of period | $ | 51.75 | $ | 59.83 | $ | 53.77 | $ | 51.34 | $ | 52.52 |
| Income from Investment Operations | | | | | | | | | | |
Net investment income (loss) A,B | | 1.630 | | 1.245 | | .327 | | .639 | | .783 |
| Net realized and unrealized gain (loss) | | (.705) | | (6.741) | | 7.664 | | 3.282 | | 1.134 |
| Total from investment operations | | .925 | | (5.496) | | 7.991 | | 3.921 | | 1.917 |
| Distributions from net investment income | | (1.571) | | (1.232) | | (.409) | | (.754) | | (.822) |
| Distributions from net realized gain | | (.174) | | (1.352) | | (1.522) | | (.737) | | (2.275) |
| Total distributions | | (1.745) | | (2.584) | | (1.931) | | (1.491) | | (3.097) |
| Net asset value, end of period | $ | 50.93 | $ | 51.75 | $ | 59.83 | $ | 53.77 | $ | 51.34 |
Total Return C,D | | 2.03% | | (9.62)% | | 15.15% | | 7.76% | | 4.02% |
Ratios to Average Net Assets B,E,F | | | | | | | | | | |
| Expenses before reductions | | .72% | | .72% | | .72% | | .72% | | .81% G |
| Expenses net of fee waivers, if any | | .72% | | .72% | | .72% | | .72% | | .81% G |
| Expenses net of all reductions | | .72% | | .72% | | .72% | | .72% | | .81% G |
| Net investment income (loss) | | 3.30% | | 2.22% | | .57% | | 1.26% | | 1.57% |
| Supplemental Data | | | | | | | | | | |
| Net assets, end of period (000 omitted) | $ | 234 | $ | 509 | $ | 678 | $ | 155 | $ | 20 |
Portfolio turnover rate H | | 28% | | 67% | | 35% | | 69% | | 86% |
ACalculated based on average shares outstanding during the period.
BNet investment income (loss) is affected by the timing of the declaration of dividends by any underlying mutual funds or exchange-traded funds (ETFs). Net investment income (loss) of any mutual funds or ETFs is not included in the Fund's net investment income (loss) ratio.
CTotal returns would have been lower if certain expenses had not been reduced during the applicable periods shown.
DTotal returns do not include the effect of the sales charges.
EFees and expenses of any underlying mutual funds or exchange-traded funds (ETFs) are not included in the Fund's expense ratio. The Fund indirectly bears its proportionate share of these expenses.
FExpense ratios reflect operating expenses of the class. Expenses before reductions do not reflect amounts reimbursed, waived, or reduced through arrangements with the investment adviser, brokerage services, or other offset arrangements, if applicable, and do not represent the amount paid by the class during periods when reimbursements, waivers or reductions occur.
GOn certain classes, the size and fluctuation of net assets and expense amounts may cause ratios to differ from contractual rates.
HAmount does not include the portfolio activity of any underlying mutual funds or exchange-traded funds (ETFs).
| Fidelity Managed Retirement 2020 Fund℠ |
| |
| Years ended July 31, | | 2023 | | 2022 | | 2021 | | 2020 | | 2019 |
Selected Per-Share Data | | | | | | | | | | |
| Net asset value, beginning of period | $ | 51.84 | $ | 59.92 | $ | 53.81 | $ | 51.35 | $ | 52.53 |
| Income from Investment Operations | | | | | | | | | | |
Net investment income (loss) A,B | | 1.755 | | 1.389 | | .470 | | .777 | | .916 |
| Net realized and unrealized gain (loss) | | (.706) | | (6.758) | | 7.671 | | 3.281 | | 1.125 |
| Total from investment operations | | 1.049 | | (5.369) | | 8.141 | | 4.058 | | 2.041 |
| Distributions from net investment income | | (1.715) | | (1.359) | | (.509) | | (.861) | | (.946) |
| Distributions from net realized gain | | (.174) | | (1.352) | | (1.522) | | (.737) | | (2.275) |
| Total distributions | | (1.889) | | (2.711) | | (2.031) | | (1.598) | | (3.221) |
| Net asset value, end of period | $ | 51.00 | $ | 51.84 | $ | 59.92 | $ | 53.81 | $ | 51.35 |
Total Return C | | 2.29% | | (9.40)% | | 15.44% | | 8.04% | | 4.28% |
Ratios to Average Net Assets B,D,E | | | | | | | | | | |
| Expenses before reductions | | .47% | | .47% | | .47% | | .47% | | .55% |
| Expenses net of fee waivers, if any | | .47% | | .47% | | .47% | | .47% | | .55% |
| Expenses net of all reductions | | .47% | | .47% | | .47% | | .47% | | .55% |
| Net investment income (loss) | | 3.55% | | 2.47% | | .82% | | 1.51% | | 1.83% |
| Supplemental Data | | | | | | | | | | |
| Net assets, end of period (000 omitted) | $ | 7,305 | $ | 8,171 | $ | 11,460 | $ | 6,193 | $ | 4,303 |
Portfolio turnover rate F | | 28% | | 67% | | 35% | | 69% | | 86% |
ACalculated based on average shares outstanding during the period.
BNet investment income (loss) is affected by the timing of the declaration of dividends by any underlying mutual funds or exchange-traded funds (ETFs). Net investment income (loss) of any mutual funds or ETFs is not included in the Fund's net investment income (loss) ratio.
CTotal returns would have been lower if certain expenses had not been reduced during the applicable periods shown.
DFees and expenses of any underlying mutual funds or exchange-traded funds (ETFs) are not included in the Fund's expense ratio. The Fund indirectly bears its proportionate share of these expenses.
EExpense ratios reflect operating expenses of the class. Expenses before reductions do not reflect amounts reimbursed, waived, or reduced through arrangements with the investment adviser, brokerage services, or other offset arrangements, if applicable, and do not represent the amount paid by the class during periods when reimbursements, waivers or reductions occur.
FAmount does not include the portfolio activity of any underlying mutual funds or exchange-traded funds (ETFs).
| Fidelity Managed Retirement 2020 Fund℠ Class K |
| |
| Years ended July 31, | | 2023 | | 2022 | | 2021 | | 2020 A |
Selected Per-Share Data | | | | | | | | |
| Net asset value, beginning of period | $ | 51.85 | $ | 59.93 | $ | 53.82 | $ | 51.28 |
| Income from Investment Operations | | | | | | | | |
Net investment income (loss) B,C | | 1.804 | | 1.439 | | .526 | | .829 |
| Net realized and unrealized gain (loss) | | (.698) | | (6.752) | | 7.661 | | 3.357 |
| Total from investment operations | | 1.106 | | (5.313) | | 8.187 | | 4.186 |
| Distributions from net investment income | | (1.772) | | (1.415) | | (.555) | | (.909) |
| Distributions from net realized gain | | (.174) | | (1.352) | | (1.522) | | (.737) |
| Total distributions | | (1.946) | | (2.767) | | (2.077) | | (1.646) |
| Net asset value, end of period | $ | 51.01 | $ | 51.85 | $ | 59.93 | $ | 53.82 |
Total Return D,E | | 2.41% | | (9.31)% | | 15.53% | | 8.31% |
Ratios to Average Net Assets C,F,G | | | | | | | | |
| Expenses before reductions | | .37% | | .37% | | .37% | | .37% |
| Expenses net of fee waivers, if any | | .37% | | .37% | | .37% | | .37% |
| Expenses net of all reductions | | .37% | | .37% | | .37% | | .37% |
| Net investment income (loss) | | 3.65% | | 2.57% | | .92% | | 1.61% |
| Supplemental Data | | | | | | | | |
| Net assets, end of period (000 omitted) | $ | 141 | $ | 113 | $ | 125 | $ | 108 |
Portfolio turnover rate H | | 28% | | 67% | | 35% | | 69% |
AFor the period August 1, 2019 (commencement of sale of shares) through July 31, 2020.
BCalculated based on average shares outstanding during the period.
CNet investment income (loss) is affected by the timing of the declaration of dividends by any underlying mutual funds or exchange-traded funds (ETFs). Net investment income (loss) of any mutual funds or ETFs is not included in the Fund's net investment income (loss) ratio.
DTotal returns for periods of less than one year are not annualized.
ETotal returns would have been lower if certain expenses had not been reduced during the applicable periods shown.
FFees and expenses of any underlying mutual funds or exchange-traded funds (ETFs) are not included in the Fund's expense ratio. The Fund indirectly bears its proportionate share of these expenses.
GExpense ratios reflect operating expenses of the class. Expenses before reductions do not reflect amounts reimbursed, waived, or reduced through arrangements with the investment adviser, brokerage services, or other offset arrangements, if applicable, and do not represent the amount paid by the class during periods when reimbursements, waivers or reductions occur.
HAmount does not include the portfolio activity of any underlying mutual funds or exchange-traded funds (ETFs).
| Fidelity Managed Retirement 2020 Fund℠ Class K6 |
| |
| Years ended July 31, | | 2023 | | 2022 | | 2021 | | 2020 A |
Selected Per-Share Data | | | | | | | | |
| Net asset value, beginning of period | $ | 51.85 | $ | 59.93 | $ | 53.82 | $ | 51.28 |
| Income from Investment Operations | | | | | | | | |
Net investment income (loss) B,C | | 1.856 | | 1.458 | | .584 | | .869 |
| Net realized and unrealized gain (loss) | | (.707) | | (6.709) | | 7.661 | | 3.369 |
| Total from investment operations | | 1.149 | | (5.251) | | 8.245 | | 4.238 |
| Distributions from net investment income | | (1.815) | | (1.477) | | (.613) | | (.961) |
| Distributions from net realized gain | | (.174) | | (1.352) | | (1.522) | | (.737) |
| Total distributions | | (1.989) | | (2.829) | | (2.135) | | (1.698) |
| Net asset value, end of period | $ | 51.01 | $ | 51.85 | $ | 59.93 | $ | 53.82 |
Total Return D,E | | 2.50% | | (9.21)% | | 15.65% | | 8.42% |
Ratios to Average Net Assets C,F,G | | | | | | | | |
| Expenses before reductions | | .27% | | .27% | | .27% | | .27% |
| Expenses net of fee waivers, if any | | .27% | | .27% | | .27% | | .27% |
| Expenses net of all reductions | | .27% | | .27% | | .27% | | .27% |
| Net investment income (loss) | | 3.75% | | 2.67% | | 1.02% | | 1.71% |
| Supplemental Data | | | | | | | | |
| Net assets, end of period (000 omitted) | $ | 741 | $ | 1,110 | $ | 628 | $ | 406 |
Portfolio turnover rate H | | 28% | | 67% | | 35% | | 69% |
AFor the period August 1, 2019 (commencement of sale of shares) through July 31, 2020.
BCalculated based on average shares outstanding during the period.
CNet investment income (loss) is affected by the timing of the declaration of dividends by any underlying mutual funds or exchange-traded funds (ETFs). Net investment income (loss) of any mutual funds or ETFs is not included in the Fund's net investment income (loss) ratio.
DTotal returns for periods of less than one year are not annualized.
ETotal returns would have been lower if certain expenses had not been reduced during the applicable periods shown.
FFees and expenses of any underlying mutual funds or exchange-traded funds (ETFs) are not included in the Fund's expense ratio. The Fund indirectly bears its proportionate share of these expenses.
GExpense ratios reflect operating expenses of the class. Expenses before reductions do not reflect amounts reimbursed, waived, or reduced through arrangements with the investment adviser, brokerage services, or other offset arrangements, if applicable, and do not represent the amount paid by the class during periods when reimbursements, waivers or reductions occur.
HAmount does not include the portfolio activity of any underlying mutual funds or exchange-traded funds (ETFs).
| Fidelity Advisor Managed Retirement 2020 Fund℠ Class I |
| |
| Years ended July 31, | | 2023 | | 2022 | | 2021 | | 2020 | | 2019 |
Selected Per-Share Data | | | | | | | | | | |
| Net asset value, beginning of period | $ | 51.87 | $ | 59.95 | $ | 53.83 | $ | 51.35 | $ | 52.53 |
| Income from Investment Operations | | | | | | | | | | |
Net investment income (loss) A,B | | 1.757 | | 1.389 | | .470 | | .779 | | .890 |
| Net realized and unrealized gain (loss) | | (.704) | | (6.761) | | 7.673 | | 3.282 | | 1.148 |
| Total from investment operations | | 1.053 | | (5.372) | | 8.143 | | 4.061 | | 2.038 |
| Distributions from net investment income | | (1.719) | | (1.356) | | (.501) | | (.844) | | (.943) |
| Distributions from net realized gain | | (.174) | | (1.352) | | (1.522) | | (.737) | | (2.275) |
| Total distributions | | (1.893) | | (2.708) | | (2.023) | | (1.581) | | (3.218) |
| Net asset value, end of period | $ | 51.03 | $ | 51.87 | $ | 59.95 | $ | 53.83 | $ | 51.35 |
Total Return C | | 2.30% | | (9.40)% | | 15.44% | | 8.05% | | 4.27% |
Ratios to Average Net Assets B,D,E | | | | | | | | | | |
| Expenses before reductions | | .47% | | .47% | | .47% | | .47% | | .55% |
| Expenses net of fee waivers, if any | | .47% | | .47% | | .47% | | .47% | | .55% |
| Expenses net of all reductions | | .47% | | .47% | | .47% | | .47% | | .55% |
| Net investment income (loss) | | 3.55% | | 2.47% | | .82% | | 1.51% | | 1.83% |
| Supplemental Data | | | | | | | | | | |
| Net assets, end of period (000 omitted) | $ | 218 | $ | 249 | $ | 320 | $ | 212 | $ | 291 |
Portfolio turnover rate F | | 28% | | 67% | | 35% | | 69% | | 86% |
ACalculated based on average shares outstanding during the period.
BNet investment income (loss) is affected by the timing of the declaration of dividends by any underlying mutual funds or exchange-traded funds (ETFs). Net investment income (loss) of any mutual funds or ETFs is not included in the Fund's net investment income (loss) ratio.
CTotal returns would have been lower if certain expenses had not been reduced during the applicable periods shown.
DFees and expenses of any underlying mutual funds or exchange-traded funds (ETFs) are not included in the Fund's expense ratio. The Fund indirectly bears its proportionate share of these expenses.
EExpense ratios reflect operating expenses of the class. Expenses before reductions do not reflect amounts reimbursed, waived, or reduced through arrangements with the investment adviser, brokerage services, or other offset arrangements, if applicable, and do not represent the amount paid by the class during periods when reimbursements, waivers or reductions occur.
FAmount does not include the portfolio activity of any underlying mutual funds or exchange-traded funds (ETFs).
| Fidelity Advisor Managed Retirement 2020 Fund℠ Class Z6 |
| |
| Years ended July 31, | | 2023 | | 2022 | | 2021 | | 2020 A |
Selected Per-Share Data | | | | | | | | |
| Net asset value, beginning of period | $ | 51.86 | $ | 59.94 | $ | 53.82 | $ | 51.28 |
| Income from Investment Operations | | | | | | | | |
Net investment income (loss) B,C | | 1.854 | | 1.494 | | .583 | | .881 |
| Net realized and unrealized gain (loss) | | (.711) | | (6.747) | | 7.669 | | 3.352 |
| Total from investment operations | | 1.143 | | (5.253) | | 8.252 | | 4.233 |
| Distributions from net investment income | | (1.819) | | (1.475) | | (.610) | | (.956) |
| Distributions from net realized gain | | (.174) | | (1.352) | | (1.522) | | (.737) |
| Total distributions | | (1.993) | | (2.827) | | (2.132) | | (1.693) |
| Net asset value, end of period | $ | 51.01 | $ | 51.86 | $ | 59.94 | $ | 53.82 |
Total Return D,E | | 2.48% | | (9.21)% | | 15.66% | | 8.41% |
Ratios to Average Net Assets B,F,G | | | | | | | | |
| Expenses before reductions | | .27% | | .27% | | .27% | | .27% |
| Expenses net of fee waivers, if any | | .27% | | .27% | | .27% | | .27% |
| Expenses net of all reductions | | .27% | | .27% | | .27% | | .27% |
| Net investment income (loss) | | 3.75% | | 2.67% | | 1.02% | | 1.71% |
| Supplemental Data | | | | | | | | |
| Net assets, end of period (000 omitted) | $ | 117 | $ | 114 | $ | 125 | $ | 108 |
Portfolio turnover rate H | | 28% | | 67% | | 35% | | 69% |
AFor the period August 1, 2019 (commencement of sale of shares) through July 31, 2020.
BNet investment income (loss) is affected by the timing of the declaration of dividends by any underlying mutual funds or exchange-traded funds (ETFs). Net investment income (loss) of any mutual funds or ETFs is not included in the Fund's net investment income (loss) ratio.
CCalculated based on average shares outstanding during the period.
DTotal returns for periods of less than one year are not annualized.
ETotal returns would have been lower if certain expenses had not been reduced during the applicable periods shown.
FExpense ratios reflect operating expenses of the class. Expenses before reductions do not reflect amounts reimbursed, waived, or reduced through arrangements with the investment adviser, brokerage services, or other offset arrangements, if applicable, and do not represent the amount paid by the class during periods when reimbursements, waivers or reductions occur.
GFees and expenses of any underlying mutual funds or exchange-traded funds (ETFs) are not included in the Fund's expense ratio. The Fund indirectly bears its proportionate share of these expenses.
HAmount does not include the portfolio activity of any underlying mutual funds or exchange-traded funds (ETFs).
The information in the following tables is based on the direct Investments of the Fund.
Top Holdings (% of Fund's net assets) |
| |
| Fidelity Series Investment Grade Bond Fund | 9.8 | |
| Fidelity Series Government Bond Index Fund | 9.6 | |
| Fidelity Series 5+ Year Inflation-Protected Bond Index Fund | 7.0 | |
| Fidelity Series Investment Grade Securitized Fund | 6.6 | |
| Fidelity Series Corporate Bond Fund | 6.6 | |
| Fidelity Series 0-5 Year Inflation-Protected Bond Index Fund | 6.3 | |
| Fidelity Series Emerging Markets Opportunities Fund | 5.9 | |
| Fidelity Series Large Cap Value Index Fund | 5.5 | |
| Fidelity Series Long-Term Treasury Bond Index Fund | 4.4 | |
| Fidelity Series Blue Chip Growth Fund | 4.2 | |
| | 65.9 | |
| |
Asset Allocation (% of Fund's net assets) |
|
Percentages shown as 0.0% may reflect amounts less than 0.05%. |
|
Domestic Equity Funds category includes Fidelity Series Commodity Strategy Fund which invests in commodity-related investments.
Fidelity Managed Retirement 2025 Fund℠
Showing Percentage of Net Assets
| Domestic Equity Funds - 19.6% |
| | | Shares | Value ($) |
| Fidelity Series Blue Chip Growth Fund (a) | | 153,487 | 2,254,724 |
| Fidelity Series Commodity Strategy Fund (a) | | 3,889 | 400,289 |
| Fidelity Series Large Cap Growth Index Fund (a) | | 79,072 | 1,424,079 |
| Fidelity Series Large Cap Stock Fund (a) | | 79,841 | 1,579,262 |
| Fidelity Series Large Cap Value Index Fund (a) | | 195,930 | 2,935,027 |
| Fidelity Series Small Cap Core Fund (a) | | 986 | 10,664 |
| Fidelity Series Small Cap Opportunities Fund (a) | | 53,576 | 721,670 |
| Fidelity Series Value Discovery Fund (a) | | 70,557 | 1,082,346 |
| TOTAL DOMESTIC EQUITY FUNDS (Cost $8,548,033) | | | 10,408,061 |
| | | | |
| International Equity Funds - 20.6% |
| | | Shares | Value ($) |
| Fidelity Series Canada Fund (a) | | 46,513 | 681,876 |
| Fidelity Series Emerging Markets Fund (a) | | 89,162 | 780,166 |
| Fidelity Series Emerging Markets Opportunities Fund (a) | | 172,506 | 3,112,006 |
| Fidelity Series International Growth Fund (a) | | 103,614 | 1,721,030 |
| Fidelity Series International Index Fund (a) | | 55,155 | 650,276 |
| Fidelity Series International Small Cap Fund (a) | | 32,259 | 536,459 |
| Fidelity Series International Value Fund (a) | | 151,306 | 1,732,458 |
| Fidelity Series Overseas Fund (a) | | 135,557 | 1,722,930 |
| TOTAL INTERNATIONAL EQUITY FUNDS (Cost $10,023,421) | | | 10,937,201 |
| | | | |
| Bond Funds - 55.7% |
| | | Shares | Value ($) |
| Fidelity Series 0-5 Year Inflation-Protected Bond Index Fund (a) | | 350,406 | 3,321,853 |
| Fidelity Series 5+ Year Inflation-Protected Bond Index Fund (a) | | 471,881 | 3,718,420 |
| Fidelity Series Corporate Bond Fund (a) | | 384,164 | 3,484,368 |
| Fidelity Series Emerging Markets Debt Fund (a) | | 36,445 | 274,433 |
| Fidelity Series Emerging Markets Debt Local Currency Fund (a) | | 9,643 | 93,155 |
| Fidelity Series Floating Rate High Income Fund (a) | | 5,932 | 53,328 |
| Fidelity Series Government Bond Index Fund (a) | | 555,532 | 5,066,451 |
| Fidelity Series High Income Fund (a) | | 34,731 | 286,874 |
| Fidelity Series International Credit Fund (a) | | 1,550 | 11,931 |
| Fidelity Series International Developed Markets Bond Index Fund (a) | | 245,929 | 2,095,312 |
| Fidelity Series Investment Grade Bond Fund (a) | | 521,349 | 5,176,995 |
| Fidelity Series Investment Grade Securitized Fund (a) | | 396,205 | 3,514,342 |
| Fidelity Series Long-Term Treasury Bond Index Fund (a) | | 398,484 | 2,339,099 |
| Fidelity Series Real Estate Income Fund (a) | | 7,648 | 74,187 |
| TOTAL BOND FUNDS (Cost $33,672,745) | | | 29,510,748 |
| | | | |
| Short-Term Funds - 4.1% |
| | | Shares | Value ($) |
| Fidelity Series Government Money Market Fund 5.33% (a)(b) | | 528,417 | 528,417 |
| Fidelity Series Short-Term Credit Fund (a) | | 25,204 | 243,220 |
| Fidelity Series Treasury Bill Index Fund (a) | | 140,512 | 1,396,693 |
| TOTAL SHORT-TERM FUNDS (Cost $2,179,081) | | | 2,168,330 |
| | | | |
| TOTAL INVESTMENT IN SECURITIES - 100.0% (Cost $54,423,280) | 53,024,340 |
NET OTHER ASSETS (LIABILITIES) - 0.0% | (979) |
| NET ASSETS - 100.0% | 53,023,361 |
| | |
Legend
| (b) | The rate quoted is the annualized seven-day yield of the fund at period end. |
Affiliated Underlying Funds
Fiscal year to date information regarding the Fund's investments in affiliated Underlying Funds is presented below. Exchanges between classes of the same affiliated Underlying Funds may occur. If an Underlying Funds changes its name, the name presented below is the name in effect at period end.
| Affiliate | Value, beginning of period ($) | Purchases ($) | Sales Proceeds ($) | Dividend Income ($) | Realized Gain (loss) ($) | Change in Unrealized appreciation (depreciation) ($) | Value, end of period ($) |
| Fidelity Series 0-5 Year Inflation-Protected Bond Index Fund | 3,131,574 | 1,098,305 | 721,398 | 146,926 | (15,209) | (168,191) | 3,321,853 |
| Fidelity Series 5+ Year Inflation-Protected Bond Index Fund | 3,848,965 | 1,251,245 | 836,401 | 235,442 | (67,053) | (478,336) | 3,718,420 |
| Fidelity Series Blue Chip Growth Fund | 2,580,615 | 668,538 | 1,451,321 | 84,725 | (338,800) | 795,692 | 2,254,724 |
| Fidelity Series Canada Fund | 892,508 | 165,376 | 403,254 | 23,412 | 11,597 | 15,649 | 681,876 |
| Fidelity Series Commodity Strategy Fund | 847,095 | 619,367 | 548,818 | 459,003 | (274,311) | (243,044) | 400,289 |
| Fidelity Series Corporate Bond Fund | 3,302,280 | 1,032,223 | 690,127 | 126,146 | (40,658) | (119,350) | 3,484,368 |
| Fidelity Series Emerging Markets Debt Fund | 293,431 | 51,405 | 74,831 | 16,435 | (11,993) | 16,421 | 274,433 |
| Fidelity Series Emerging Markets Debt Local Currency Fund | 97,612 | 10,609 | 27,873 | - | (3,013) | 15,820 | 93,155 |
| Fidelity Series Emerging Markets Fund | 505,875 | 417,865 | 208,457 | 10,933 | (40,255) | 105,138 | 780,166 |
| Fidelity Series Emerging Markets Opportunities Fund | 4,566,346 | 446,365 | 2,218,168 | 92,274 | (564,640) | 882,103 | 3,112,006 |
| Fidelity Series Floating Rate High Income Fund | 56,275 | 23,912 | 27,655 | 4,327 | (878) | 1,674 | 53,328 |
| Fidelity Series Government Bond Index Fund | 4,850,584 | 1,596,170 | 1,067,894 | 112,587 | (56,549) | (255,860) | 5,066,451 |
| Fidelity Series Government Money Market Fund 5.33% | 280,213 | 477,490 | 229,286 | 18,813 | - | - | 528,417 |
| Fidelity Series High Income Fund | 303,848 | 62,607 | 71,478 | 18,255 | (5,476) | (2,627) | 286,874 |
| Fidelity Series International Credit Fund | 12,522 | 696 | - | 696 | - | (1,287) | 11,931 |
| Fidelity Series International Developed Markets Bond Index Fund | 2,236,726 | 524,018 | 515,963 | 46,456 | (25,483) | (123,986) | 2,095,312 |
| Fidelity Series International Growth Fund | 1,858,103 | 397,792 | 678,486 | 56,081 | (68,189) | 211,810 | 1,721,030 |
| Fidelity Series International Index Fund | 777,904 | 128,684 | 343,960 | 17,989 | (10,724) | 98,372 | 650,276 |
| Fidelity Series International Small Cap Fund | 574,478 | 90,055 | 137,333 | 30,882 | (22,015) | 31,274 | 536,459 |
| Fidelity Series International Value Fund | 1,842,603 | 319,326 | 696,747 | 54,916 | (5,630) | 272,906 | 1,732,458 |
| Fidelity Series Investment Grade Bond Fund | 5,013,601 | 1,525,451 | 1,078,461 | 185,258 | (62,924) | (220,672) | 5,176,995 |
| Fidelity Series Investment Grade Securitized Fund | 3,546,325 | 1,003,213 | 770,678 | 113,331 | (49,622) | (214,896) | 3,514,342 |
| Fidelity Series Large Cap Growth Index Fund | 1,633,061 | 342,040 | 760,369 | 13,320 | 32,880 | 176,467 | 1,424,079 |
| Fidelity Series Large Cap Stock Fund | 1,789,350 | 400,646 | 775,488 | 108,074 | 39,915 | 124,839 | 1,579,262 |
| Fidelity Series Large Cap Value Index Fund | 3,416,886 | 690,713 | 1,289,567 | 109,071 | 65,838 | 51,157 | 2,935,027 |
| Fidelity Series Long-Term Treasury Bond Index Fund | 2,825,179 | 818,474 | 935,136 | 73,923 | (197,453) | (171,965) | 2,339,099 |
| Fidelity Series Overseas Fund | 1,868,698 | 355,996 | 700,113 | 29,538 | (50,409) | 248,758 | 1,722,930 |
| Fidelity Series Real Estate Income Fund | 176,042 | 41,421 | 126,017 | 13,254 | (13,679) | (3,580) | 74,187 |
| Fidelity Series Short-Term Credit Fund | 279,557 | 44,907 | 79,962 | 6,069 | (1,546) | 264 | 243,220 |
| Fidelity Series Small Cap Core Fund | - | 18,066 | 8,478 | 6 | (127) | 1,203 | 10,664 |
| Fidelity Series Small Cap Opportunities Fund | 873,574 | 163,970 | 362,303 | 40,116 | (32,905) | 79,334 | 721,670 |
| Fidelity Series Treasury Bill Index Fund | 841,140 | 1,294,453 | 735,430 | 52,306 | (1,858) | (1,612) | 1,396,693 |
| Fidelity Series Value Discovery Fund | 1,260,235 | 312,408 | 501,146 | 57,767 | 20,594 | (9,745) | 1,082,346 |
| | 56,383,205 | 16,393,806 | 19,072,598 | 2,358,331 | (1,790,575) | 1,113,730 | 53,024,340 |
Amounts in the dividend income column in the above table include any capital gain distributions from underlying funds, which are presented in the corresponding line item in the Statement of Operations, if applicable.
Amounts included in the purchases and sales proceeds columns may include in-kind transactions, if applicable.
Investment Valuation
The following is a summary of the inputs used, as of July 31, 2023, involving the Fund's assets and liabilities carried at fair value. The inputs or methodology used for valuing securities may not be an indication of the risk associated with investing in those securities. For more information on valuation inputs, and their aggregation into the levels used below, please refer to the Investment Valuation section in the accompanying Notes to Financial Statements.
| Valuation Inputs at Reporting Date: |
| Description | Total ($) | Level 1 ($) | Level 2 ($) | Level 3 ($) |
Investments in Securities: | | | | |
|
| Domestic Equity Funds | 10,408,061 | 10,408,061 | - | - |
|
| International Equity Funds | 10,937,201 | 10,937,201 | - | - |
|
| Bond Funds | 29,510,748 | 29,510,748 | - | - |
|
| Short-Term Funds | 2,168,330 | 2,168,330 | - | - |
| Total Investments in Securities: | 53,024,340 | 53,024,340 | - | - |
Fidelity Managed Retirement 2025 Fund℠
| Statement of Assets and Liabilities |
| | | | July 31, 2023 |
| | | | | |
| Assets | | | | |
| Investment in securities, at value - See accompanying schedule: | | | | |
Affiliated issuers (cost $54,423,280) | $ | 53,024,340 | | |
| | | | | |
| | | | | |
| Total Investment in Securities (cost $54,423,280) | | | $ | 53,024,340 |
| Cash | | | | 411 |
| Receivable for investments sold | | | | 652,598 |
| Receivable for fund shares sold | | | | 2,030 |
Total assets | | | | 53,679,379 |
| Liabilities | | | | |
| Payable for investments purchased | $ | 629,358 | | |
| Payable for fund shares redeemed | | 5,635 | | |
| Accrued management fee | | 20,678 | | |
| Distribution and service plan fees payable | | 347 | | |
| Total Liabilities | | | | 656,018 |
| Net Assets | | | $ | 53,023,361 |
| Net Assets consist of: | | | | |
| Paid in capital | | | $ | 56,692,328 |
| Total accumulated earnings (loss) | | | | (3,668,967) |
| Net Assets | | | $ | 53,023,361 |
| | | | | |
| Net Asset Value and Maximum Offering Price | | | | |
| Class A : | | | | |
Net Asset Value and redemption price per share ($1,583,394 ÷ 30,138.65 shares)(a) | | | $ | 52.54 |
| Maximum offering price per share (100/94.25 of $52.54) | | | $ | 55.75 |
| Fidelity Managed Retirement 2025 : | | | | |
Net Asset Value, offering price and redemption price per share ($47,433,305 ÷ 900,705.33 shares) | | | $ | 52.66 |
| Class K : | | | | |
Net Asset Value, offering price and redemption price per share ($363,774 ÷ 6,906.59 shares) | | | $ | 52.67 |
| Class K6 : | | | | |
Net Asset Value, offering price and redemption price per share ($3,349,597 ÷ 63,602.92 shares) | | | $ | 52.66 |
| Class I : | | | | |
Net Asset Value, offering price and redemption price per share ($173,778 ÷ 3,288.37 shares) | | | $ | 52.85 |
| Class Z6 : | | | | |
Net Asset Value, offering price and redemption price per share ($119,513 ÷ 2,264.66 shares) | | | $ | 52.77 |
(a)Redemption price per share is equal to net asset value less any applicable contingent deferred sales charge. |
| Statement of Operations |
| | | | Year ended July 31, 2023 |
| Investment Income | | | | |
| Dividends: | | | | |
| Affiliated issuers | | | $ | 2,036,450 |
| Expenses | | | | |
| Management fee | $ | 247,169 | | |
| Distribution and service plan fees | | 4,080 | | |
| Independent trustees' fees and expenses | | 191 | | |
| Total expenses before reductions | | 251,440 | | |
| Expense reductions | | (13) | | |
| Total expenses after reductions | | | | 251,427 |
| Net Investment income (loss) | | | | 1,785,023 |
| Realized and Unrealized Gain (Loss) | | | | |
| Net realized gain (loss) on: | | | | |
| Investment Securities: | | | | |
| Affiliated issuers | | (1,790,575) | | |
| Capital gain distributions from underlying funds: | | | | |
| Affiliated issuers | | 321,881 | | |
| Total net realized gain (loss) | | | | (1,468,694) |
| Change in net unrealized appreciation (depreciation) on: | | | | |
| Investment Securities: | | | | |
| Affiliated issuers | | 1,113,730 | | |
| Total change in net unrealized appreciation (depreciation) | | | | 1,113,730 |
| Net gain (loss) | | | | (354,964) |
| Net increase (decrease) in net assets resulting from operations | | | $ | 1,430,059 |
| Statement of Changes in Net Assets |
| |
| | Year ended July 31, 2023 | | Year ended July 31, 2022 |
| Increase (Decrease) in Net Assets | | | | |
| Operations | | | | |
| Net investment income (loss) | $ | 1,785,023 | $ | 1,462,092 |
| Net realized gain (loss) | | (1,468,694) | | 1,579,222 |
| Change in net unrealized appreciation (depreciation) | | 1,113,730 | | (9,408,802) |
| Net increase (decrease) in net assets resulting from operations | | 1,430,059 | | (6,367,488) |
| Distributions to shareholders | | (2,607,842) | | (3,176,472) |
| | | | | |
| Share transactions - net increase (decrease) | | (2,181,059) | | 6,559,519 |
| Total increase (decrease) in net assets | | (3,358,842) | | (2,984,441) |
| | | | | |
| Net Assets | | | | |
| Beginning of period | | 56,382,203 | | 59,366,644 |
| End of period | $ | 53,023,361 | $ | 56,382,203 |
| | | | | |
| | | | | |
| Fidelity Advisor Managed Retirement 2025 Fund℠ Class A |
| |
| Years ended July 31, | | 2023 | | 2022 | | 2021 | | 2020 | | 2019 |
Selected Per-Share Data | | | | | | | | | | |
| Net asset value, beginning of period | $ | 53.57 | $ | 62.69 | $ | 55.13 | $ | 52.89 | $ | 54.27 |
| Income from Investment Operations | | | | | | | | | | |
Net investment income (loss) A,B | | 1.586 | | 1.274 | | .377 | | .692 | | .818 |
| Net realized and unrealized gain (loss) | | (.249) | | (7.367) | | 9.095 | | 3.455 | | 1.072 |
| Total from investment operations | | 1.337 | | (6.093) | | 9.472 | | 4.147 | | 1.890 |
| Distributions from net investment income | | (1.562) | | (1.297) | | (.446) | | (.756) | | (.820) |
| Distributions from net realized gain | | (.805) | | (1.730) | | (1.466) | | (1.151) | | (2.450) |
| Total distributions | | (2.367) | | (3.027) | | (1.912) | | (1.907) | | (3.270) |
| Net asset value, end of period | $ | 52.54 | $ | 53.57 | $ | 62.69 | $ | 55.13 | $ | 52.89 |
Total Return C,D | | 2.84% | | (10.25)% | | 17.50% | | 8.01% | | 3.87% |
Ratios to Average Net Assets B,E,F | | | | | | | | | | |
| Expenses before reductions | | .73% | | .73% | | .73% | | .73% | | .84% |
| Expenses net of fee waivers, if any | | .73% | | .73% | | .73% | | .73% | | .84% |
| Expenses net of all reductions | | .73% | | .73% | | .73% | | .73% | | .84% |
| Net investment income (loss) | | 3.13% | | 2.19% | | .63% | | 1.32% | | 1.59% |
| Supplemental Data | | | | | | | | | | |
| Net assets, end of period (000 omitted) | $ | 1,583 | $ | 1,689 | $ | 1,867 | $ | 993 | $ | 556 |
Portfolio turnover rate G | | 31% | | 53% | | 27% | | 67% | | 48% |
ACalculated based on average shares outstanding during the period.
BNet investment income (loss) is affected by the timing of the declaration of dividends by any underlying mutual funds or exchange-traded funds (ETFs). Net investment income (loss) of any mutual funds or ETFs is not included in the Fund's net investment income (loss) ratio.
CTotal returns would have been lower if certain expenses had not been reduced during the applicable periods shown.
DTotal returns do not include the effect of the sales charges.
EFees and expenses of any underlying mutual funds or exchange-traded funds (ETFs) are not included in the Fund's expense ratio. The Fund indirectly bears its proportionate share of these expenses.
FExpense ratios reflect operating expenses of the class. Expenses before reductions do not reflect amounts reimbursed, waived, or reduced through arrangements with the investment adviser, brokerage services, or other offset arrangements, if applicable, and do not represent the amount paid by the class during periods when reimbursements, waivers or reductions occur.
GAmount does not include the portfolio activity of any underlying mutual funds or exchange-traded funds (ETFs).
| Fidelity Managed Retirement 2025 Fund℠ |
| |
| Years ended July 31, | | 2023 | | 2022 | | 2021 | | 2020 | | 2019 |
Selected Per-Share Data | | | | | | | | | | |
| Net asset value, beginning of period | $ | 53.69 | $ | 62.80 | $ | 55.19 | $ | 52.92 | $ | 54.31 |
| Income from Investment Operations | | | | | | | | | | |
Net investment income (loss) A,B | | 1.716 | | 1.421 | | .525 | | .825 | | .950 |
| Net realized and unrealized gain (loss) | | (.253) | | (7.388) | | 9.109 | | 3.466 | | 1.062 |
| Total from investment operations | | 1.463 | | (5.967) | | 9.634 | | 4.291 | | 2.012 |
| Distributions from net investment income | | (1.688) | | (1.413) | | (.558) | | (.870) | | (.952) |
| Distributions from net realized gain | | (.805) | | (1.730) | | (1.466) | | (1.151) | | (2.450) |
| Total distributions | | (2.493) | | (3.143) | | (2.024) | | (2.021) | | (3.402) |
| Net asset value, end of period | $ | 52.66 | $ | 53.69 | $ | 62.80 | $ | 55.19 | $ | 52.92 |
Total Return C | | 3.09% | | (10.03)% | | 17.79% | | 8.30% | | 4.11% |
Ratios to Average Net Assets B,D,E | | | | | | | | | | |
| Expenses before reductions | | .48% | | .48% | | .48% | | .48% | | .59% |
| Expenses net of fee waivers, if any | | .48% | | .48% | | .48% | | .48% | | .59% |
| Expenses net of all reductions | | .48% | | .48% | | .48% | | .48% | | .59% |
| Net investment income (loss) | | 3.38% | | 2.44% | | .88% | | 1.57% | | 1.84% |
| Supplemental Data | | | | | | | | | | |
| Net assets, end of period (000 omitted) | $ | 47,433 | $ | 51,468 | $ | 55,127 | $ | 30,093 | $ | 20,130 |
Portfolio turnover rate F | | 31% | | 53% | | 27% | | 67% | | 48% |
ACalculated based on average shares outstanding during the period.
BNet investment income (loss) is affected by the timing of the declaration of dividends by any underlying mutual funds or exchange-traded funds (ETFs). Net investment income (loss) of any mutual funds or ETFs is not included in the Fund's net investment income (loss) ratio.
CTotal returns would have been lower if certain expenses had not been reduced during the applicable periods shown.
DFees and expenses of any underlying mutual funds or exchange-traded funds (ETFs) are not included in the Fund's expense ratio. The Fund indirectly bears its proportionate share of these expenses.
EExpense ratios reflect operating expenses of the class. Expenses before reductions do not reflect amounts reimbursed, waived, or reduced through arrangements with the investment adviser, brokerage services, or other offset arrangements, if applicable, and do not represent the amount paid by the class during periods when reimbursements, waivers or reductions occur.
FAmount does not include the portfolio activity of any underlying mutual funds or exchange-traded funds (ETFs).
| Fidelity Managed Retirement 2025 Fund℠ Class K |
| |
| Years ended July 31, | | 2023 | | 2022 | | 2021 | | 2020 A |
Selected Per-Share Data | | | | | | | | |
| Net asset value, beginning of period | $ | 53.71 | $ | 62.82 | $ | 55.20 | $ | 52.82 |
| Income from Investment Operations | | | | | | | | |
Net investment income (loss) B,C | | 1.766 | | 1.480 | | .582 | | .879 |
| Net realized and unrealized gain (loss) | | (.250) | | (7.390) | | 9.109 | | 3.572 |
| Total from investment operations | | 1.516 | | (5.910) | | 9.691 | | 4.451 |
| Distributions from net investment income | | (1.751) | | (1.470) | | (.605) | | (.920) |
| Distributions from net realized gain | | (.805) | | (1.730) | | (1.466) | | (1.151) |
| Total distributions | | (2.556) | | (3.200) | | (2.071) | | (2.071) |
| Net asset value, end of period | $ | 52.67 | $ | 53.71 | $ | 62.82 | $ | 55.20 |
Total Return D,E | | 3.20% | | (9.94)% | | 17.90% | | 8.63% |
Ratios to Average Net Assets C,F,G | | | | | | | | |
| Expenses before reductions | | .38% | | .38% | | .38% | | .38% |
| Expenses net of fee waivers, if any | | .38% | | .38% | | .38% | | .38% |
| Expenses net of all reductions | | .38% | | .38% | | .38% | | .38% |
| Net investment income (loss) | | 3.48% | | 2.54% | | .98% | | 1.67% |
| Supplemental Data | | | | | | | | |
| Net assets, end of period (000 omitted) | $ | 364 | $ | 115 | $ | 128 | $ | 109 |
Portfolio turnover rate H | | 31% | | 53% | | 27% | | 67% |
AFor the period August 1, 2019 (commencement of sale of shares) through July 31, 2020.
BCalculated based on average shares outstanding during the period.
CNet investment income (loss) is affected by the timing of the declaration of dividends by any underlying mutual funds or exchange-traded funds (ETFs). Net investment income (loss) of any mutual funds or ETFs is not included in the Fund's net investment income (loss) ratio.
DTotal returns for periods of less than one year are not annualized.
ETotal returns would have been lower if certain expenses had not been reduced during the applicable periods shown.
FFees and expenses of any underlying mutual funds or exchange-traded funds (ETFs) are not included in the Fund's expense ratio. The Fund indirectly bears its proportionate share of these expenses.
GExpense ratios reflect operating expenses of the class. Expenses before reductions do not reflect amounts reimbursed, waived, or reduced through arrangements with the investment adviser, brokerage services, or other offset arrangements, if applicable, and do not represent the amount paid by the class during periods when reimbursements, waivers or reductions occur.
HAmount does not include the portfolio activity of any underlying mutual funds or exchange-traded funds (ETFs).
| Fidelity Managed Retirement 2025 Fund℠ Class K6 |
| |
| Years ended July 31, | | 2023 | | 2022 | | 2021 | | 2020 A |
Selected Per-Share Data | | | | | | | | |
| Net asset value, beginning of period | $ | 53.70 | $ | 62.81 | $ | 55.20 | $ | 52.82 |
| Income from Investment Operations | | | | | | | | |
Net investment income (loss) B,C | | 1.817 | | 1.527 | | .648 | | .932 |
| Net realized and unrealized gain (loss) | | (.254) | | (7.379) | | 9.105 | | 3.567 |
| Total from investment operations | | 1.563 | | (5.852) | | 9.753 | | 4.499 |
| Distributions from net investment income | | (1.798) | | (1.528) | | (.677) | | (.968) |
| Distributions from net realized gain | | (.805) | | (1.730) | | (1.466) | | (1.151) |
| Total distributions | | (2.603) | | (3.258) | | (2.143) | | (2.119) |
| Net asset value, end of period | $ | 52.66 | $ | 53.70 | $ | 62.81 | $ | 55.20 |
Total Return D,E | | 3.30% | | (9.85)% | | 18.03% | | 8.73% |
Ratios to Average Net Assets C,F,G | | | | | | | | |
| Expenses before reductions | | .28% | | .28% | | .28% | | .28% |
| Expenses net of fee waivers, if any | | .28% | | .28% | | .28% | | .28% |
| Expenses net of all reductions | | .28% | | .28% | | .28% | | .28% |
| Net investment income (loss) | | 3.58% | | 2.64% | | 1.08% | | 1.77% |
| Supplemental Data | | | | | | | | |
| Net assets, end of period (000 omitted) | $ | 3,350 | $ | 2,437 | $ | 1,351 | $ | 412 |
Portfolio turnover rate H | | 31% | | 53% | | 27% | | 67% |
AFor the period August 1, 2019 (commencement of sale of shares) through July 31, 2020.
BCalculated based on average shares outstanding during the period.
CNet investment income (loss) is affected by the timing of the declaration of dividends by any underlying mutual funds or exchange-traded funds (ETFs). Net investment income (loss) of any mutual funds or ETFs is not included in the Fund's net investment income (loss) ratio.
DTotal returns for periods of less than one year are not annualized.
ETotal returns would have been lower if certain expenses had not been reduced during the applicable periods shown.
FFees and expenses of any underlying mutual funds or exchange-traded funds (ETFs) are not included in the Fund's expense ratio. The Fund indirectly bears its proportionate share of these expenses.
GExpense ratios reflect operating expenses of the class. Expenses before reductions do not reflect amounts reimbursed, waived, or reduced through arrangements with the investment adviser, brokerage services, or other offset arrangements, if applicable, and do not represent the amount paid by the class during periods when reimbursements, waivers or reductions occur.
HAmount does not include the portfolio activity of any underlying mutual funds or exchange-traded funds (ETFs).
| Fidelity Advisor Managed Retirement 2025 Fund℠ Class I |
| |
| Years ended July 31, | | 2023 | | 2022 | | 2021 | | 2020 | | 2019 |
Selected Per-Share Data | | | | | | | | | | |
| Net asset value, beginning of period | $ | 53.82 | $ | 62.93 | $ | 55.30 | $ | 53.00 | $ | 54.38 |
| Income from Investment Operations | | | | | | | | | | |
Net investment income (loss) A,B | | 1.723 | | 1.427 | | .525 | | .831 | | .906 |
| Net realized and unrealized gain (loss) | | (.249) | | (7.400) | | 9.122 | | 3.463 | | 1.114 |
| Total from investment operations | | 1.474 | | (5.973) | | 9.647 | | 4.294 | | 2.020 |
| Distributions from net investment income | | (1.639) | | (1.407) | | (.551) | | (.843) | | (.950) |
| Distributions from net realized gain | | (.805) | | (1.730) | | (1.466) | | (1.151) | | (2.450) |
| Total distributions | | (2.444) | | (3.137) | | (2.017) | | (1.994) | | (3.400) |
| Net asset value, end of period | $ | 52.85 | $ | 53.82 | $ | 62.93 | $ | 55.30 | $ | 53.00 |
Total Return C | | 3.10% | | (10.02)% | | 17.78% | | 8.29% | | 4.12% |
Ratios to Average Net Assets B,D,E | | | | | | | | | | |
| Expenses before reductions | | .48% | | .48% | | .48% | | .48% | | .57% F |
| Expenses net of fee waivers, if any | | .48% | | .48% | | .48% | | .48% | | .57% F |
| Expenses net of all reductions | | .48% | | .48% | | .48% | | .48% | | .57% F |
| Net investment income (loss) | | 3.39% | | 2.44% | | .88% | | 1.57% | | 1.87% |
| Supplemental Data | | | | | | | | | | |
| Net assets, end of period (000 omitted) | $ | 174 | $ | 556 | $ | 765 | $ | 498 | $ | 678 |
Portfolio turnover rate G | | 31% | | 53% | | 27% | | 67% | | 48% |
ACalculated based on average shares outstanding during the period.
BNet investment income (loss) is affected by the timing of the declaration of dividends by any underlying mutual funds or exchange-traded funds (ETFs). Net investment income (loss) of any mutual funds or ETFs is not included in the Fund's net investment income (loss) ratio.
CTotal returns would have been lower if certain expenses had not been reduced during the applicable periods shown.
DFees and expenses of any underlying mutual funds or exchange-traded funds (ETFs) are not included in the Fund's expense ratio. The Fund indirectly bears its proportionate share of these expenses.
EExpense ratios reflect operating expenses of the class. Expenses before reductions do not reflect amounts reimbursed, waived, or reduced through arrangements with the investment adviser, brokerage services, or other offset arrangements, if applicable, and do not represent the amount paid by the class during periods when reimbursements, waivers or reductions occur.
FOn certain classes, the size and fluctuation of net assets and expense amounts may cause ratios to differ from contractual rates.
GAmount does not include the portfolio activity of any underlying mutual funds or exchange-traded funds (ETFs).
| Fidelity Advisor Managed Retirement 2025 Fund℠ Class Z6 |
| |
| Years ended July 31, | | 2023 | | 2022 | | 2021 | | 2020 A |
Selected Per-Share Data | | | | | | | | |
| Net asset value, beginning of period | $ | 53.80 | $ | 62.91 | $ | 55.28 | $ | 52.89 |
| Income from Investment Operations | | | | | | | | |
Net investment income (loss) B,C | | 1.821 | | 1.541 | | .643 | | .933 |
| Net realized and unrealized gain (loss) | | (.255) | | (7.395) | | 9.116 | | 3.577 |
| Total from investment operations | | 1.566 | | (5.854) | | 9.759 | | 4.510 |
| Distributions from net investment income | | (1.791) | | (1.526) | | (.663) | | (.969) |
| Distributions from net realized gain | | (.805) | | (1.730) | | (1.466) | | (1.151) |
| Total distributions | | (2.596) | | (3.256) | | (2.129) | | (2.120) |
| Net asset value, end of period | $ | 52.77 | $ | 53.80 | $ | 62.91 | $ | 55.28 |
Total Return D,E | | 3.30% | | (9.84)% | | 18.01% | | 8.74% |
Ratios to Average Net Assets C,F,G | | | | | | | | |
| Expenses before reductions | | .28% | | .28% | | .28% | | .28% |
| Expenses net of fee waivers, if any | | .28% | | .28% | | .28% | | .28% |
| Expenses net of all reductions | | .28% | | .28% | | .28% | | .28% |
| Net investment income (loss) | | 3.58% | | 2.64% | | 1.08% | | 1.77% |
| Supplemental Data | | | | | | | | |
| Net assets, end of period (000 omitted) | $ | 120 | $ | 116 | $ | 128 | $ | 109 |
Portfolio turnover rate H | | 31% | | 53% | | 27% | | 67% |
AFor the period August 1, 2019 (commencement of sale of shares) through July 31, 2020.
BCalculated based on average shares outstanding during the period.
CNet investment income (loss) is affected by the timing of the declaration of dividends by any underlying mutual funds or exchange-traded funds (ETFs). Net investment income (loss) of any mutual funds or ETFs is not included in the Fund's net investment income (loss) ratio.
DTotal returns for periods of less than one year are not annualized.
ETotal returns would have been lower if certain expenses had not been reduced during the applicable periods shown.
FFees and expenses of any underlying mutual funds or exchange-traded funds (ETFs) are not included in the Fund's expense ratio. The Fund indirectly bears its proportionate share of these expenses.
GExpense ratios reflect operating expenses of the class. Expenses before reductions do not reflect amounts reimbursed, waived, or reduced through arrangements with the investment adviser, brokerage services, or other offset arrangements, if applicable, and do not represent the amount paid by the class during periods when reimbursements, waivers or reductions occur.
HAmount does not include the portfolio activity of any underlying mutual funds or exchange-traded funds (ETFs).
The information in the following tables is based on the direct Investments of the Fund.
Top Holdings (% of Fund's net assets) |
| |
| Fidelity Series Investment Grade Bond Fund | 9.0 | |
| Fidelity Series Government Bond Index Fund | 8.9 | |
| Fidelity Series 5+ Year Inflation-Protected Bond Index Fund | 7.9 | |
| Fidelity Series Large Cap Value Index Fund | 6.3 | |
| Fidelity Series Emerging Markets Opportunities Fund | 6.3 | |
| Fidelity Series Investment Grade Securitized Fund | 6.1 | |
| Fidelity Series Corporate Bond Fund | 6.1 | |
| Fidelity Series Blue Chip Growth Fund | 4.9 | |
| Fidelity Series Long-Term Treasury Bond Index Fund | 4.7 | |
| Fidelity Series International Developed Markets Bond Index Fund | 4.0 | |
| | 64.2 | |
| |
Asset Allocation (% of Fund's net assets) |
|
Percentages shown as 0.0% may reflect amounts less than 0.05%. |
|
Domestic Equity Funds category includes Fidelity Series Commodity Strategy Fund which invests in commodity-related investments.
Fidelity Managed Retirement 2030 Fund℠
Showing Percentage of Net Assets
| Domestic Equity Funds - 22.4% |
| | | Shares | Value ($) |
| Fidelity Series Blue Chip Growth Fund (a) | | 129,601 | 1,903,833 |
| Fidelity Series Commodity Strategy Fund (a) | | 2,869 | 295,326 |
| Fidelity Series Large Cap Growth Index Fund (a) | | 66,769 | 1,202,514 |
| Fidelity Series Large Cap Stock Fund (a) | | 67,418 | 1,333,523 |
| Fidelity Series Large Cap Value Index Fund (a) | | 165,436 | 2,478,236 |
| Fidelity Series Small Cap Core Fund (a) | | 729 | 7,877 |
| Fidelity Series Small Cap Opportunities Fund (a) | | 45,243 | 609,424 |
| Fidelity Series Value Discovery Fund (a) | | 59,581 | 913,972 |
| TOTAL DOMESTIC EQUITY FUNDS (Cost $7,775,364) | | | 8,744,705 |
| | | | |
| International Equity Funds - 22.4% |
| | | Shares | Value ($) |
| Fidelity Series Canada Fund (a) | | 37,669 | 552,234 |
| Fidelity Series Emerging Markets Fund (a) | | 70,324 | 615,335 |
| Fidelity Series Emerging Markets Opportunities Fund (a) | | 136,073 | 2,454,749 |
| Fidelity Series International Growth Fund (a) | | 83,909 | 1,393,727 |
| Fidelity Series International Index Fund (a) | | 44,670 | 526,663 |
| Fidelity Series International Small Cap Fund (a) | | 26,040 | 433,046 |
| Fidelity Series International Value Fund (a) | | 122,534 | 1,403,017 |
| Fidelity Series Overseas Fund (a) | | 109,777 | 1,395,261 |
| TOTAL INTERNATIONAL EQUITY FUNDS (Cost $8,834,075) | | | 8,774,032 |
| | | | |
| Bond Funds - 51.6% |
| | | Shares | Value ($) |
| Fidelity Series 0-5 Year Inflation-Protected Bond Index Fund (a) | | 144,940 | 1,374,036 |
| Fidelity Series 5+ Year Inflation-Protected Bond Index Fund (a) | | 389,334 | 3,067,951 |
| Fidelity Series Corporate Bond Fund (a) | | 261,852 | 2,375,000 |
| Fidelity Series Emerging Markets Debt Fund (a) | | 26,908 | 202,617 |
| Fidelity Series Emerging Markets Debt Local Currency Fund (a) | | 7,102 | 68,607 |
| Fidelity Series Floating Rate High Income Fund (a) | | 4,360 | 39,199 |
| Fidelity Series Government Bond Index Fund (a) | | 378,668 | 3,453,454 |
| Fidelity Series High Income Fund (a) | | 25,537 | 210,936 |
| Fidelity Series International Credit Fund (a) | | 609 | 4,688 |
| Fidelity Series International Developed Markets Bond Index Fund (a) | | 181,676 | 1,547,881 |
| Fidelity Series Investment Grade Bond Fund (a) | | 355,363 | 3,528,751 |
| Fidelity Series Investment Grade Securitized Fund (a) | | 270,063 | 2,395,457 |
| Fidelity Series Long-Term Treasury Bond Index Fund (a) | | 310,280 | 1,821,345 |
| Fidelity Series Real Estate Income Fund (a) | | 5,626 | 54,571 |
| TOTAL BOND FUNDS (Cost $23,010,173) | | | 20,144,493 |
| | | | |
| Short-Term Funds - 3.6% |
| | | Shares | Value ($) |
| Fidelity Series Government Money Market Fund 5.33% (a)(b) | | 335,223 | 335,223 |
| Fidelity Series Short-Term Credit Fund (a) | | 17,616 | 169,992 |
| Fidelity Series Treasury Bill Index Fund (a) | | 90,195 | 896,539 |
| TOTAL SHORT-TERM FUNDS (Cost $1,410,398) | | | 1,401,754 |
| | | | |
| TOTAL INVESTMENT IN SECURITIES - 100.0% (Cost $41,030,010) | 39,064,984 |
NET OTHER ASSETS (LIABILITIES) - 0.0% | (671) |
| NET ASSETS - 100.0% | 39,064,313 |
| | |
Legend
| (b) | The rate quoted is the annualized seven-day yield of the fund at period end. |
Affiliated Underlying Funds
Fiscal year to date information regarding the Fund's investments in affiliated Underlying Funds is presented below. Exchanges between classes of the same affiliated Underlying Funds may occur. If an Underlying Funds changes its name, the name presented below is the name in effect at period end.
| Affiliate | Value, beginning of period ($) | Purchases ($) | Sales Proceeds ($) | Dividend Income ($) | Realized Gain (loss) ($) | Change in Unrealized appreciation (depreciation) ($) | Value, end of period ($) |
| Fidelity Series 0-5 Year Inflation-Protected Bond Index Fund | 1,028,674 | 605,897 | 194,973 | 55,469 | (3,343) | (61,000) | 1,374,036 |
| Fidelity Series 5+ Year Inflation-Protected Bond Index Fund | 2,594,598 | 1,316,972 | 447,900 | 176,033 | (15,364) | (380,355) | 3,067,951 |
| Fidelity Series Blue Chip Growth Fund | 1,780,353 | 708,628 | 997,911 | 61,207 | (232,205) | 644,968 | 1,903,833 |
| Fidelity Series Canada Fund | 594,353 | 199,597 | 265,444 | 17,529 | 936 | 22,792 | 552,234 |
| Fidelity Series Commodity Strategy Fund | 517,746 | 470,216 | 356,597 | 297,669 | (181,079) | (154,960) | 295,326 |
| Fidelity Series Corporate Bond Fund | 1,853,100 | 949,680 | 335,185 | 80,336 | (21,429) | (71,166) | 2,375,000 |
| Fidelity Series Emerging Markets Debt Fund | 179,402 | 60,367 | 40,303 | 11,296 | (1,844) | 4,995 | 202,617 |
| Fidelity Series Emerging Markets Debt Local Currency Fund | 59,742 | 15,061 | 15,249 | - | (1,043) | 10,096 | 68,607 |
| Fidelity Series Emerging Markets Fund | 326,417 | 358,633 | 119,709 | 7,925 | (22,701) | 72,695 | 615,335 |
| Fidelity Series Emerging Markets Opportunities Fund | 2,945,650 | 617,126 | 1,356,506 | 66,940 | (413,401) | 661,880 | 2,454,749 |
| Fidelity Series Floating Rate High Income Fund | 34,387 | 21,292 | 17,026 | 2,983 | (508) | 1,054 | 39,199 |
| Fidelity Series Government Bond Index Fund | 2,721,885 | 1,444,822 | 525,965 | 72,177 | (18,216) | (169,072) | 3,453,454 |
| Fidelity Series Government Money Market Fund 5.33% | 149,333 | 331,691 | 145,801 | 11,861 | - | - | 335,223 |
| Fidelity Series High Income Fund | 185,661 | 68,237 | 37,801 | 12,555 | (1,498) | (3,663) | 210,936 |
| Fidelity Series International Credit Fund | 4,920 | 274 | - | 273 | - | (506) | 4,688 |
| Fidelity Series International Developed Markets Bond Index Fund | 1,367,641 | 559,939 | 282,646 | 33,263 | (11,820) | (85,233) | 1,547,881 |
| Fidelity Series International Growth Fund | 1,237,274 | 444,901 | 407,237 | 41,960 | (24,774) | 143,563 | 1,393,727 |
| Fidelity Series International Index Fund | 518,019 | 161,301 | 221,645 | 13,455 | (8,059) | 77,047 | 526,663 |
| Fidelity Series International Small Cap Fund | 382,451 | 115,177 | 74,602 | 23,102 | (4,510) | 14,530 | 433,046 |
| Fidelity Series International Value Fund | 1,226,921 | 394,434 | 422,158 | 41,087 | (9,065) | 212,885 | 1,403,017 |
| Fidelity Series Investment Grade Bond Fund | 2,813,392 | 1,416,111 | 533,305 | 118,090 | (24,001) | (143,446) | 3,528,751 |
| Fidelity Series Investment Grade Securitized Fund | 1,990,052 | 936,822 | 374,731 | 72,564 | (16,882) | (139,804) | 2,395,457 |
| Fidelity Series Large Cap Growth Index Fund | 1,126,641 | 388,409 | 502,353 | 10,537 | (8,225) | 198,042 | 1,202,514 |
| Fidelity Series Large Cap Stock Fund | 1,234,468 | 426,413 | 475,658 | 75,670 | (11,686) | 159,986 | 1,333,523 |
| Fidelity Series Large Cap Value Index Fund | 2,357,303 | 846,029 | 824,896 | 85,309 | (23,438) | 123,238 | 2,478,236 |
| Fidelity Series Long-Term Treasury Bond Index Fund | 1,818,918 | 805,739 | 547,709 | 53,663 | (106,006) | (149,597) | 1,821,345 |
| Fidelity Series Overseas Fund | 1,244,340 | 420,874 | 430,802 | 22,096 | (21,013) | 181,862 | 1,395,261 |
| Fidelity Series Real Estate Income Fund | 107,776 | 42,283 | 84,469 | 8,803 | (6,338) | (4,681) | 54,571 |
| Fidelity Series Short-Term Credit Fund | 148,987 | 53,025 | 31,628 | 3,877 | (221) | (171) | 169,992 |
| Fidelity Series Small Cap Core Fund | - | 15,144 | 8,052 | 4 | (104) | 889 | 7,877 |
| Fidelity Series Small Cap Opportunities Fund | 601,276 | 195,595 | 229,790 | 29,051 | (30,761) | 73,104 | 609,424 |
| Fidelity Series Treasury Bill Index Fund | 448,198 | 916,236 | 465,778 | 33,002 | (1,601) | (516) | 896,539 |
| Fidelity Series Value Discovery Fund | 869,437 | 354,346 | 318,270 | 45,146 | (9,498) | 17,957 | 913,972 |
| | 34,469,315 | 15,661,271 | 11,092,099 | 1,584,932 | (1,229,697) | 1,257,413 | 39,064,984 |
Amounts in the dividend income column in the above table include any capital gain distributions from underlying funds, which are presented in the corresponding line item in the Statement of Operations, if applicable.
Amounts included in the purchases and sales proceeds columns may include in-kind transactions, if applicable.
Investment Valuation
The following is a summary of the inputs used, as of July 31, 2023, involving the Fund's assets and liabilities carried at fair value. The inputs or methodology used for valuing securities may not be an indication of the risk associated with investing in those securities. For more information on valuation inputs, and their aggregation into the levels used below, please refer to the Investment Valuation section in the accompanying Notes to Financial Statements.
| Valuation Inputs at Reporting Date: |
| Description | Total ($) | Level 1 ($) | Level 2 ($) | Level 3 ($) |
Investments in Securities: | | | | |
|
| Domestic Equity Funds | 8,744,705 | 8,744,705 | - | - |
|
| International Equity Funds | 8,774,032 | 8,774,032 | - | - |
|
| Bond Funds | 20,144,493 | 20,144,493 | - | - |
|
| Short-Term Funds | 1,401,754 | 1,401,754 | - | - |
| Total Investments in Securities: | 39,064,984 | 39,064,984 | - | - |
Fidelity Managed Retirement 2030 Fund℠
| Statement of Assets and Liabilities |
| | | | July 31, 2023 |
| | | | | |
| Assets | | | | |
| Investment in securities, at value - See accompanying schedule: | | | | |
Affiliated issuers (cost $41,030,010) | $ | 39,064,984 | | |
| | | | | |
| | | | | |
| Total Investment in Securities (cost $41,030,010) | | | $ | 39,064,984 |
| Cash | | | | 178 |
| Receivable for investments sold | | | | 492,244 |
| Receivable for fund shares sold | | | | 10,196 |
Total assets | | | | 39,567,602 |
| Liabilities | | | | |
| Payable for investments purchased | $ | 488,093 | | |
| Payable for fund shares redeemed | | 34 | | |
| Accrued management fee | | 15,064 | | |
| Distribution and service plan fees payable | | 98 | | |
| Total Liabilities | | | | 503,289 |
| Net Assets | | | $ | 39,064,313 |
| Net Assets consist of: | | | | |
| Paid in capital | | | $ | 42,649,874 |
| Total accumulated earnings (loss) | | | | (3,585,561) |
| Net Assets | | | $ | 39,064,313 |
| | | | | |
| Net Asset Value and Maximum Offering Price | | | | |
| Class A : | | | | |
Net Asset Value and redemption price per share ($546,138 ÷ 51,493.98 shares)(a) | | | $ | 10.61 |
| Maximum offering price per share (100/94.25 of $10.61) | | | $ | 11.26 |
| Fidelity Managed Retirement 2030 Fund : | | | | |
Net Asset Value, offering price and redemption price per share ($35,369,083 ÷ 3,330,887.87 shares) | | | $ | 10.62 |
| Class K : | | | | |
Net Asset Value, offering price and redemption price per share ($346,623 ÷ 32,586.21 shares) | | | $ | 10.64 |
| Class K6 : | | | | |
Net Asset Value, offering price and redemption price per share ($2,105,316 ÷ 197,952.32 shares) | | | $ | 10.64 |
| Class I : | | | | |
Net Asset Value, offering price and redemption price per share ($350,576 ÷ 32,973.04 shares) | | | $ | 10.63 |
| Class Z6 : | | | | |
Net Asset Value, offering price and redemption price per share ($346,577 ÷ 32,576.35 shares) | | | $ | 10.64 |
(a)Redemption price per share is equal to net asset value less any applicable contingent deferred sales charge. |
| Statement of Operations |
| | | | Year ended July 31, 2023 |
| Investment Income | | | | |
| Dividends: | | | | |
| Affiliated issuers | | | $ | 1,349,715 |
| Expenses | | | | |
| Management fee | $ | 171,251 | | |
| Distribution and service plan fees | | 1,007 | | |
| Independent trustees' fees and expenses | | 128 | | |
| Total expenses before reductions | | 172,386 | | |
| Expense reductions | | (21) | | |
| Total expenses after reductions | | | | 172,365 |
| Net Investment income (loss) | | | | 1,177,350 |
| Realized and Unrealized Gain (Loss) | | | | |
| Net realized gain (loss) on: | | | | |
| Investment Securities: | | | | |
| Affiliated issuers | | (1,229,697) | | |
| Capital gain distributions from underlying funds: | | | | |
| Affiliated issuers | | 235,217 | | |
| Total net realized gain (loss) | | | | (994,480) |
| Change in net unrealized appreciation (depreciation) on: | | | | |
| Investment Securities: | | | | |
| Affiliated issuers | | 1,257,413 | | |
| Total change in net unrealized appreciation (depreciation) | | | | 1,257,413 |
| Net gain (loss) | | | | 262,933 |
| Net increase (decrease) in net assets resulting from operations | | | $ | 1,440,283 |
| Statement of Changes in Net Assets |
| |
| | Year ended July 31, 2023 | | Year ended July 31, 2022 |
| Increase (Decrease) in Net Assets | | | | |
| Operations | | | | |
| Net investment income (loss) | $ | 1,177,350 | $ | 855,222 |
| Net realized gain (loss) | | (994,480) | | 669,719 |
| Change in net unrealized appreciation (depreciation) | | 1,257,413 | | (5,791,383) |
| Net increase (decrease) in net assets resulting from operations | | 1,440,283 | | (4,266,442) |
| Distributions to shareholders | | (1,494,111) | | (1,764,249) |
| | | | | |
| Share transactions - net increase (decrease) | | 4,649,194 | | 8,627,785 |
| Total increase (decrease) in net assets | | 4,595,366 | | 2,597,094 |
| | | | | |
| Net Assets | | | | |
| Beginning of period | | 34,468,947 | | 31,871,853 |
| End of period | $ | 39,064,313 | $ | 34,468,947 |
| | | | | |
| | | | | |
| Fidelity Advisor Managed Retirement 2030 Fund℠ Class A |
| |
| Years ended July 31, | | 2023 | | 2022 | | 2021 | | 2020 A |
Selected Per-Share Data | | | | | | | | |
| Net asset value, beginning of period | $ | 10.68 | $ | 12.51 | $ | 10.78 | $ | 10.00 |
| Income from Investment Operations | | | | | | | | |
Net investment income (loss) B,C | | .304 | | .248 | | .056 | | .104 |
| Net realized and unrealized gain (loss) | | .029 | | (1.517) | | 1.993 | | .837 |
| Total from investment operations | | .333 | | (1.269) | | 2.049 | | .941 |
| Distributions from net investment income | | (.303) | | (.257) | | (.089) | | (.121) |
| Distributions from net realized gain | | (.100) | | (.304) | | (.230) | | (.040) |
| Total distributions | | (.403) | | (.561) | | (.319) | | (.161) |
| Net asset value, end of period | $ | 10.61 | $ | 10.68 | $ | 12.51 | $ | 10.78 |
Total Return D,E,F | | 3.46% | | (10.66)% | | 19.28% | | 9.46% |
Ratios to Average Net Assets C,G,H | | | | | | | | |
| Expenses before reductions | | .73% | | .73% | | .73% | | .73% I |
| Expenses net of fee waivers, if any | | .73% | | .73% | | .73% | | .73% I |
| Expenses net of all reductions | | .73% | | .73% | | .73% | | .73% I |
| Net investment income (loss) | | 2.99% | | 2.13% | | .47% | | 1.06% I |
| Supplemental Data | | | | | | | | |
| Net assets, end of period (000 omitted) | $ | 546 | $ | 455 | $ | 595 | $ | 300 |
Portfolio turnover rate J | | 31% | | 54% | | 46% | | 117% I |
AFor the period August 16, 2019 (commencement of operations) through July 31, 2020.
BCalculated based on average shares outstanding during the period.
CNet investment income (loss) is affected by the timing of the declaration of dividends by any underlying mutual funds or exchange-traded funds (ETFs). Net investment income (loss) of any mutual funds or ETFs is not included in the Fund's net investment income (loss) ratio.
DTotal returns for periods of less than one year are not annualized.
ETotal returns would have been lower if certain expenses had not been reduced during the applicable periods shown.
FTotal returns do not include the effect of the sales charges.
GFees and expenses of any underlying mutual funds or exchange-traded funds (ETFs) are not included in the Fund's expense ratio. The Fund indirectly bears its proportionate share of these expenses.
HExpense ratios reflect operating expenses of the class. Expenses before reductions do not reflect amounts reimbursed, waived, or reduced through arrangements with the investment adviser, brokerage services, or other offset arrangements, if applicable, and do not represent the amount paid by the class during periods when reimbursements, waivers or reductions occur.
IAnnualized.
JAmount does not include the portfolio activity of any underlying mutual funds or exchange-traded funds (ETFs).
| Fidelity Managed Retirement 2030 Fund℠ |
| |
| Years ended July 31, | | 2023 | | 2022 | | 2021 | | 2020 A |
Selected Per-Share Data | | | | | | | | |
| Net asset value, beginning of period | $ | 10.69 | $ | 12.51 | $ | 10.77 | $ | 10.00 |
| Income from Investment Operations | | | | | | | | |
Net investment income (loss) B,C | | .330 | | .275 | | .086 | | .127 |
| Net realized and unrealized gain (loss) | | .028 | | (1.510) | | 1.990 | | .832 |
| Total from investment operations | | .358 | | (1.235) | | 2.076 | | .959 |
| Distributions from net investment income | | (.328) | | (.281) | | (.106) | | (.149) |
| Distributions from net realized gain | | (.100) | | (.304) | | (.230) | | (.040) |
| Total distributions | | (.428) | | (.585) | | (.336) | | (.189) |
| Net asset value, end of period | $ | 10.62 | $ | 10.69 | $ | 12.51 | $ | 10.77 |
Total Return D,E | | 3.71% | | (10.39)% | | 19.57% | | 9.66% |
Ratios to Average Net Assets C,F,G | | | | | | | | |
| Expenses before reductions | | .48% | | .48% | | .48% | | .48% H |
| Expenses net of fee waivers, if any | | .48% | | .48% | | .48% | | .48% H |
| Expenses net of all reductions | | .48% | | .48% | | .48% | | .48% H |
| Net investment income (loss) | | 3.24% | | 2.38% | | .73% | | 1.31% H |
| Supplemental Data | | | | | | | | |
| Net assets, end of period (000 omitted) | $ | 35,369 | $ | 32,369 | $ | 28,958 | $ | 4,986 |
Portfolio turnover rate I | | 31% | | 54% | | 46% | | 117% H |
AFor the period August 16, 2019 (commencement of operations) through July 31, 2020.
BCalculated based on average shares outstanding during the period.
CNet investment income (loss) is affected by the timing of the declaration of dividends by any underlying mutual funds or exchange-traded funds (ETFs). Net investment income (loss) of any mutual funds or ETFs is not included in the Fund's net investment income (loss) ratio.
DTotal returns for periods of less than one year are not annualized.
ETotal returns would have been lower if certain expenses had not been reduced during the applicable periods shown.
FFees and expenses of any underlying mutual funds or exchange-traded funds (ETFs) are not included in the Fund's expense ratio. The Fund indirectly bears its proportionate share of these expenses.
GExpense ratios reflect operating expenses of the class. Expenses before reductions do not reflect amounts reimbursed, waived, or reduced through arrangements with the investment adviser, brokerage services, or other offset arrangements, if applicable, and do not represent the amount paid by the class during periods when reimbursements, waivers or reductions occur.
HAnnualized.
IAmount does not include the portfolio activity of any underlying mutual funds or exchange-traded funds (ETFs).
| Fidelity Managed Retirement 2030 Fund℠ Class K |
| |
| Years ended July 31, | | 2023 | | 2022 | | 2021 | | 2020 A |
Selected Per-Share Data | | | | | | | | |
| Net asset value, beginning of period | $ | 10.71 | $ | 12.53 | $ | 10.78 | $ | 10.00 |
| Income from Investment Operations | | | | | | | | |
Net investment income (loss) B,C | | .341 | | .289 | | .097 | | .138 |
| Net realized and unrealized gain (loss) | | .028 | | (1.514) | | 1.994 | | .832 |
| Total from investment operations | | .369 | | (1.225) | | 2.091 | | .970 |
| Distributions from net investment income | | (.339) | | (.291) | | (.111) | | (.150) |
| Distributions from net realized gain | | (.100) | | (.304) | | (.230) | | (.040) |
| Total distributions | | (.439) | | (.595) | | (.341) | | (.190) |
| Net asset value, end of period | $ | 10.64 | $ | 10.71 | $ | 12.53 | $ | 10.78 |
Total Return D,E | | 3.82% | | (10.30)% | | 19.69% | | 9.77% |
Ratios to Average Net Assets C,F,G | | | | | | | | |
| Expenses before reductions | | .38% | | .38% | | .38% | | .38% H |
| Expenses net of fee waivers, if any | | .38% | | .38% | | .38% | | .38% H |
| Expenses net of all reductions | | .38% | | .38% | | .38% | | .38% H |
| Net investment income (loss) | | 3.34% | | 2.48% | | .83% | | 1.41% H |
| Supplemental Data | | | | | | | | |
| Net assets, end of period (000 omitted) | $ | 347 | $ | 196 | $ | 219 | $ | 183 |
Portfolio turnover rate I | | 31% | | 54% | | 46% | | 117% H |
AFor the period August 16, 2019 (commencement of operations) through July 31, 2020.
BCalculated based on average shares outstanding during the period.
CNet investment income (loss) is affected by the timing of the declaration of dividends by any underlying mutual funds or exchange-traded funds (ETFs). Net investment income (loss) of any mutual funds or ETFs is not included in the Fund's net investment income (loss) ratio.
DTotal returns for periods of less than one year are not annualized.
ETotal returns would have been lower if certain expenses had not been reduced during the applicable periods shown.
FFees and expenses of any underlying mutual funds or exchange-traded funds (ETFs) are not included in the Fund's expense ratio. The Fund indirectly bears its proportionate share of these expenses.
GExpense ratios reflect operating expenses of the class. Expenses before reductions do not reflect amounts reimbursed, waived, or reduced through arrangements with the investment adviser, brokerage services, or other offset arrangements, if applicable, and do not represent the amount paid by the class during periods when reimbursements, waivers or reductions occur.
HAnnualized.
IAmount does not include the portfolio activity of any underlying mutual funds or exchange-traded funds (ETFs).
| Fidelity Managed Retirement 2030 Fund℠ Class K6 |
| |
| Years ended July 31, | | 2023 | | 2022 | | 2021 | | 2020 A |
Selected Per-Share Data | | | | | | | | |
| Net asset value, beginning of period | $ | 10.71 | $ | 12.53 | $ | 10.79 | $ | 10.00 |
| Income from Investment Operations | | | | | | | | |
Net investment income (loss) B,C | | .352 | | .303 | | .111 | | .148 |
| Net realized and unrealized gain (loss) | | .028 | | (1.517) | | 1.985 | | .840 |
| Total from investment operations | | .380 | | (1.214) | | 2.096 | | .988 |
| Distributions from net investment income | | (.350) | | (.302) | | (.126) | | (.158) |
| Distributions from net realized gain | | (.100) | | (.304) | | (.230) | | (.040) |
| Total distributions | | (.450) | | (.606) | | (.356) | | (.198) |
| Net asset value, end of period | $ | 10.64 | $ | 10.71 | $ | 12.53 | $ | 10.79 |
Total Return D,E | | 3.93% | | (10.21)% | | 19.73% | | 9.95% |
Ratios to Average Net Assets C,F,G | | | | | | | | |
| Expenses before reductions | | .28% | | .28% | | .28% | | .28% H |
| Expenses net of fee waivers, if any | | .28% | | .28% | | .28% | | .28% H |
| Expenses net of all reductions | | .28% | | .28% | | .28% | | .28% H |
| Net investment income (loss) | | 3.44% | | 2.58% | | .93% | | 1.51% H |
| Supplemental Data | | | | | | | | |
| Net assets, end of period (000 omitted) | $ | 2,105 | $ | 892 | $ | 1,459 | $ | 183 |
Portfolio turnover rate I | | 31% | | 54% | | 46% | | 117% H |
AFor the period August 16, 2019 (commencement of operations) through July 31, 2020.
BCalculated based on average shares outstanding during the period.
CNet investment income (loss) is affected by the timing of the declaration of dividends by any underlying mutual funds or exchange-traded funds (ETFs). Net investment income (loss) of any mutual funds or ETFs is not included in the Fund's net investment income (loss) ratio.
DTotal returns for periods of less than one year are not annualized.
ETotal returns would have been lower if certain expenses had not been reduced during the applicable periods shown.
FFees and expenses of any underlying mutual funds or exchange-traded funds (ETFs) are not included in the Fund's expense ratio. The Fund indirectly bears its proportionate share of these expenses.
GExpense ratios reflect operating expenses of the class. Expenses before reductions do not reflect amounts reimbursed, waived, or reduced through arrangements with the investment adviser, brokerage services, or other offset arrangements, if applicable, and do not represent the amount paid by the class during periods when reimbursements, waivers or reductions occur.
HAnnualized.
IAmount does not include the portfolio activity of any underlying mutual funds or exchange-traded funds (ETFs).
| Fidelity Advisor Managed Retirement 2030 Fund℠ Class I |
| |
| Years ended July 31, | | 2023 | | 2022 | | 2021 | | 2020 A |
Selected Per-Share Data | | | | | | | | |
| Net asset value, beginning of period | $ | 10.70 | $ | 12.53 | $ | 10.78 | $ | 10.00 |
| Income from Investment Operations | | | | | | | | |
Net investment income (loss) B,C | | .331 | | .277 | | .086 | | .128 |
| Net realized and unrealized gain (loss) | | .027 | | (1.523) | | 1.998 | | .833 |
| Total from investment operations | | .358 | | (1.246) | | 2.084 | | .961 |
| Distributions from net investment income | | (.328) | | (.280) | | (.104) | | (.141) |
| Distributions from net realized gain | | (.100) | | (.304) | | (.230) | | (.040) |
| Total distributions | | (.428) | | (.584) | | (.334) | | (.181) |
| Net asset value, end of period | $ | 10.63 | $ | 10.70 | $ | 12.53 | $ | 10.78 |
Total Return D,E | | 3.71% | | (10.46)% | | 19.62% | | 9.67% |
Ratios to Average Net Assets C,F,G | | | | | | | | |
| Expenses before reductions | | .48% | | .48% | | .48% | | .48% H |
| Expenses net of fee waivers, if any | | .48% | | .48% | | .48% | | .48% H |
| Expenses net of all reductions | | .48% | | .48% | | .48% | | .48% H |
| Net investment income (loss) | | 3.25% | | 2.38% | | .73% | | 1.31% H |
| Supplemental Data | | | | | | | | |
| Net assets, end of period (000 omitted) | $ | 351 | $ | 359 | $ | 421 | $ | 254 |
Portfolio turnover rate I | | 31% | | 54% | | 46% | | 117% H |
AFor the period August 16, 2019 (commencement of operations) through July 31, 2020.
BCalculated based on average shares outstanding during the period.
CNet investment income (loss) is affected by the timing of the declaration of dividends by any underlying mutual funds or exchange-traded funds (ETFs). Net investment income (loss) of any mutual funds or ETFs is not included in the Fund's net investment income (loss) ratio.
DTotal returns for periods of less than one year are not annualized.
ETotal returns would have been lower if certain expenses had not been reduced during the applicable periods shown.
FFees and expenses of any underlying mutual funds or exchange-traded funds (ETFs) are not included in the Fund's expense ratio. The Fund indirectly bears its proportionate share of these expenses.
GExpense ratios reflect operating expenses of the class. Expenses before reductions do not reflect amounts reimbursed, waived, or reduced through arrangements with the investment adviser, brokerage services, or other offset arrangements, if applicable, and do not represent the amount paid by the class during periods when reimbursements, waivers or reductions occur.
HAnnualized.
IAmount does not include the portfolio activity of any underlying mutual funds or exchange-traded funds (ETFs).
| Fidelity Advisor Managed Retirement 2030 Fund℠ Class Z6 |
| |
| Years ended July 31, | | 2023 | | 2022 | | 2021 | | 2020 A |
Selected Per-Share Data | | | | | | | | |
| Net asset value, beginning of period | $ | 10.71 | $ | 12.54 | $ | 10.79 | $ | 10.00 |
| Income from Investment Operations | | | | | | | | |
Net investment income (loss) B,C | | .351 | | .300 | | .109 | | .148 |
| Net realized and unrealized gain (loss) | | .028 | | (1.523) | | 1.994 | | .840 |
| Total from investment operations | | .379 | | (1.223) | | 2.103 | | .988 |
| Distributions from net investment income | | (.349) | | (.303) | | (.123) | | (.158) |
| Distributions from net realized gain | | (.100) | | (.304) | | (.230) | | (.040) |
| Total distributions | | (.449) | | (.607) | | (.353) | | (.198) |
| Net asset value, end of period | $ | 10.64 | $ | 10.71 | $ | 12.54 | $ | 10.79 |
Total Return D,E | | 3.92% | | (10.28)% | | 19.80% | | 9.95% |
Ratios to Average Net Assets C,F,G | | | | | | | | |
| Expenses before reductions | | .28% | | .28% | | .28% | | .28% H |
| Expenses net of fee waivers, if any | | .28% | | .28% | | .28% | | .28% H |
| Expenses net of all reductions | | .28% | | .28% | | .28% | | .28% H |
| Net investment income (loss) | | 3.44% | �� | 2.58% | | .93% | | 1.51% H |
| Supplemental Data | | | | | | | | |
| Net assets, end of period (000 omitted) | $ | 347 | $ | 198 | $ | 220 | $ | 183 |
Portfolio turnover rate I | | 31% | | 54% | | 46% | | 117% H |
AFor the period August 16, 2019 (commencement of operations) through July 31, 2020.
BCalculated based on average shares outstanding during the period.
CNet investment income (loss) is affected by the timing of the declaration of dividends by any underlying mutual funds or exchange-traded funds (ETFs). Net investment income (loss) of any mutual funds or ETFs is not included in the Fund's net investment income (loss) ratio.
DTotal returns for periods of less than one year are not annualized.
ETotal returns would have been lower if certain expenses had not been reduced during the applicable periods shown.
FFees and expenses of any underlying mutual funds or exchange-traded funds (ETFs) are not included in the Fund's expense ratio. The Fund indirectly bears its proportionate share of these expenses.
GExpense ratios reflect operating expenses of the class. Expenses before reductions do not reflect amounts reimbursed, waived, or reduced through arrangements with the investment adviser, brokerage services, or other offset arrangements, if applicable, and do not represent the amount paid by the class during periods when reimbursements, waivers or reductions occur.
HAnnualized.
IAmount does not include the portfolio activity of any underlying mutual funds or exchange-traded funds (ETFs).
The information in the following tables is based on the direct Investments of the Fund.
Top Holdings (% of Fund's net assets) |
| |
| Fidelity Series 5+ Year Inflation-Protected Bond Index Fund | 8.6 | |
| Fidelity Series Investment Grade Bond Fund | 8.3 | |
| Fidelity Series Government Bond Index Fund | 8.1 | |
| Fidelity Series Large Cap Value Index Fund | 7.2 | |
| Fidelity Series Emerging Markets Opportunities Fund | 6.7 | |
| Fidelity Series Investment Grade Securitized Fund | 5.6 | |
| Fidelity Series Corporate Bond Fund | 5.6 | |
| Fidelity Series Blue Chip Growth Fund | 5.5 | |
| Fidelity Series Long-Term Treasury Bond Index Fund | 4.9 | |
| Fidelity Series International Developed Markets Bond Index Fund | 4.0 | |
| | 64.5 | |
| |
Asset Allocation (% of Fund's net assets) |
|
Percentages shown as 0.0% may reflect amounts less than 0.05%. |
|
Domestic Equity Funds category includes Fidelity Series Commodity Strategy Fund which invests in commodity-related investments.
Fidelity Managed Retirement 2035 Fund℠
Showing Percentage of Net Assets
| Domestic Equity Funds - 25.2% |
| | | Shares | Value ($) |
| Fidelity Series Blue Chip Growth Fund (a) | | 4,943 | 72,617 |
| Fidelity Series Commodity Strategy Fund (a) | | 97 | 9,966 |
| Fidelity Series Large Cap Growth Index Fund (a) | | 2,546 | 45,860 |
| Fidelity Series Large Cap Stock Fund (a) | | 2,572 | 50,866 |
| Fidelity Series Large Cap Value Index Fund (a) | | 6,310 | 94,527 |
| Fidelity Series Small Cap Core Fund (a) | | 31 | 330 |
| Fidelity Series Small Cap Opportunities Fund (a) | | 1,726 | 23,253 |
| Fidelity Series Value Discovery Fund (a) | | 2,272 | 34,860 |
| TOTAL DOMESTIC EQUITY FUNDS (Cost $283,889) | | | 332,279 |
| | | | |
| International Equity Funds - 24.3% |
| | | Shares | Value ($) |
| Fidelity Series Canada Fund (a) | | 1,389 | 20,362 |
| Fidelity Series Emerging Markets Fund (a) | | 2,527 | 22,112 |
| Fidelity Series Emerging Markets Opportunities Fund (a) | | 4,889 | 88,198 |
| Fidelity Series International Growth Fund (a) | | 3,091 | 51,347 |
| Fidelity Series International Index Fund (a) | | 1,646 | 19,408 |
| Fidelity Series International Small Cap Fund (a) | | 958 | 15,933 |
| Fidelity Series International Value Fund (a) | | 4,516 | 51,713 |
| Fidelity Series Overseas Fund (a) | | 4,045 | 51,408 |
| TOTAL INTERNATIONAL EQUITY FUNDS (Cost $285,875) | | | 320,481 |
| | | | |
| Bond Funds - 47.5% |
| | | Shares | Value ($) |
| Fidelity Series 0-5 Year Inflation-Protected Bond Index Fund (a) | | 1,305 | 12,374 |
| Fidelity Series 5+ Year Inflation-Protected Bond Index Fund (a) | | 14,300 | 112,682 |
| Fidelity Series Corporate Bond Fund (a) | | 8,118 | 73,633 |
| Fidelity Series Emerging Markets Debt Fund (a) | | 909 | 6,842 |
| Fidelity Series Emerging Markets Debt Local Currency Fund (a) | | 239 | 2,310 |
| Fidelity Series Floating Rate High Income Fund (a) | | 147 | 1,323 |
| Fidelity Series Government Bond Index Fund (a) | | 11,739 | 107,063 |
| Fidelity Series High Income Fund (a) | | 860 | 7,103 |
| Fidelity Series International Developed Markets Bond Index Fund (a) | | 6,143 | 52,338 |
| Fidelity Series Investment Grade Bond Fund (a) | | 11,019 | 109,414 |
| Fidelity Series Investment Grade Securitized Fund (a) | | 8,373 | 74,265 |
| Fidelity Series Long-Term Treasury Bond Index Fund (a) | | 11,075 | 65,009 |
| Fidelity Series Real Estate Income Fund (a) | | 185 | 1,798 |
| TOTAL BOND FUNDS (Cost $631,049) | | | 626,154 |
| | | | |
| Short-Term Funds - 3.0% |
| | | Shares | Value ($) |
| Fidelity Series Government Money Market Fund 5.33% (a)(b) | | 9,317 | 9,317 |
| Fidelity Series Short-Term Credit Fund (a) | | 472 | 4,556 |
| Fidelity Series Treasury Bill Index Fund (a) | | 2,497 | 24,817 |
| TOTAL SHORT-TERM FUNDS (Cost $38,662) | | | 38,690 |
| | | | |
| TOTAL INVESTMENT IN SECURITIES - 100.0% (Cost $1,239,475) | 1,317,604 |
NET OTHER ASSETS (LIABILITIES) - 0.0% | 22 |
| NET ASSETS - 100.0% | 1,317,626 |
| | |
Legend
| (b) | The rate quoted is the annualized seven-day yield of the fund at period end. |
Affiliated Central Funds
Fiscal year to date information regarding the Fund's investments in Fidelity Central Funds, including the ownership percentage, is presented below.
| Affiliate | Value, beginning of period ($) | Purchases ($) | Sales Proceeds ($) | Dividend Income ($) | Realized Gain (loss) ($) | Change in Unrealized appreciation (depreciation) ($) | Value, end of period ($) | % ownership, end of period |
| Fidelity Cash Central Fund 5.32% | - | 600,000 | 600,000 | 72 | - | - | - | 0.0% |
| Total | - | 600,000 | 600,000 | 72 | - | - | - | |
| | | | | | | | | |
Amounts in the dividend income column in the above table include any capital gain distributions from underlying funds, which are presented in the corresponding line item in the Statement of Operations, if applicable.
Amounts included in the purchases and sales proceeds columns may include in-kind transactions, if applicable.
Affiliated Underlying Funds
Fiscal year to date information regarding the Fund's investments in affiliated Underlying Funds is presented below. Exchanges between classes of the same affiliated Underlying Funds may occur. If an Underlying Funds changes its name, the name presented below is the name in effect at period end.
| Affiliate | Value, beginning of period ($) | Purchases ($) | Sales Proceeds ($) | Dividend Income ($) | Realized Gain (loss) ($) | Change in Unrealized appreciation (depreciation) ($) | Value, end of period ($) |
| Fidelity Series 0-5 Year Inflation-Protected Bond Index Fund | - | 14,043 | 1,847 | - | 5 | 173 | 12,374 |
| Fidelity Series 5+ Year Inflation-Protected Bond Index Fund | - | 139,912 | 27,679 | 31 | (113) | 562 | 112,682 |
| Fidelity Series Blue Chip Growth Fund | - | 87,715 | 38,434 | - | 3,107 | 20,229 | 72,617 |
| Fidelity Series Canada Fund | - | 28,150 | 9,586 | - | 8 | 1,790 | 20,362 |
| Fidelity Series Commodity Strategy Fund | - | 14,353 | 4,452 | - | (75) | 140 | 9,966 |
| Fidelity Series Corporate Bond Fund | - | 90,845 | 16,709 | 1,556 | (270) | (233) | 73,633 |
| Fidelity Series Emerging Markets Debt Fund | - | 8,494 | 1,743 | 223 | (21) | 112 | 6,842 |
| Fidelity Series Emerging Markets Debt Local Currency Fund | - | 2,676 | 602 | - | 9 | 227 | 2,310 |
| Fidelity Series Emerging Markets Fund | - | 25,510 | 5,668 | - | 99 | 2,171 | 22,112 |
| Fidelity Series Emerging Markets Opportunities Fund | - | 120,658 | 44,008 | - | 575 | 10,973 | 88,198 |
| Fidelity Series Floating Rate High Income Fund | - | 1,631 | 327 | 63 | (1) | 20 | 1,323 |
| Fidelity Series Government Bond Index Fund | - | 133,663 | 25,028 | 1,498 | (221) | (1,351) | 107,063 |
| Fidelity Series Government Money Market Fund 5.33% | - | 13,272 | 3,955 | 218 | - | - | 9,317 |
| Fidelity Series High Income Fund | - | 8,881 | 1,816 | 233 | (21) | 59 | 7,103 |
| Fidelity Series International Developed Markets Bond Index Fund | - | 65,982 | 13,268 | 973 | (103) | (273) | 52,338 |
| Fidelity Series International Growth Fund | - | 62,812 | 16,837 | - | 59 | 5,313 | 51,347 |
| Fidelity Series International Index Fund | - | 26,238 | 9,073 | - | 181 | 2,062 | 19,408 |
| Fidelity Series International Small Cap Fund | - | 19,258 | 4,542 | - | (11) | 1,228 | 15,933 |
| Fidelity Series International Value Fund | - | 64,371 | 18,219 | - | 41 | 5,520 | 51,713 |
| Fidelity Series Investment Grade Bond Fund | - | 136,128 | 25,519 | 2,282 | (269) | (926) | 109,414 |
| Fidelity Series Investment Grade Securitized Fund | - | 93,223 | 17,661 | 1,475 | (257) | (1,040) | 74,265 |
| Fidelity Series Large Cap Growth Index Fund | - | 55,573 | 20,729 | 120 | 1,250 | 9,766 | 45,860 |
| Fidelity Series Large Cap Stock Fund | - | 61,555 | 18,339 | - | 352 | 7,298 | 50,866 |
| Fidelity Series Large Cap Value Index Fund | - | 119,028 | 30,899 | 239 | (434) | 6,832 | 94,527 |
| Fidelity Series Long-Term Treasury Bond Index Fund | - | 92,104 | 24,239 | 1,110 | (632) | (2,224) | 65,009 |
| Fidelity Series Overseas Fund | - | 62,298 | 16,466 | - | 28 | 5,548 | 51,408 |
| Fidelity Series Real Estate Income Fund | - | 3,661 | 1,855 | 59 | (7) | (1) | 1,798 |
| Fidelity Series Short-Term Credit Fund | - | 8,423 | 3,918 | 79 | 11 | 40 | 4,556 |
| Fidelity Series Small Cap Core Fund | - | 574 | 271 | - | (10) | 37 | 330 |
| Fidelity Series Small Cap Opportunities Fund | - | 29,294 | 8,427 | - | (94) | 2,480 | 23,253 |
| Fidelity Series Treasury Bill Index Fund | - | 37,240 | 12,409 | 609 | (2) | (12) | 24,817 |
| Fidelity Series Value Discovery Fund | - | 44,599 | 11,162 | 105 | (186) | 1,609 | 34,860 |
| | - | 1,672,164 | 435,687 | 10,873 | 2,998 | 78,129 | 1,317,604 |
Amounts in the dividend income column in the above table include any capital gain distributions from underlying funds, which are presented in the corresponding line item in the Statement of Operations, if applicable.
Amounts included in the purchases and sales proceeds columns may include in-kind transactions, if applicable.
Investment Valuation
The following is a summary of the inputs used, as of July 31, 2023, involving the Fund's assets and liabilities carried at fair value. The inputs or methodology used for valuing securities may not be an indication of the risk associated with investing in those securities. For more information on valuation inputs, and their aggregation into the levels used below, please refer to the Investment Valuation section in the accompanying Notes to Financial Statements.
| Valuation Inputs at Reporting Date: |
| Description | Total ($) | Level 1 ($) | Level 2 ($) | Level 3 ($) |
Investments in Securities: | | | | |
|
| Domestic Equity Funds | 332,279 | 332,279 | - | - |
|
| International Equity Funds | 320,481 | 320,481 | - | - |
|
| Bond Funds | 626,154 | 626,154 | - | - |
|
| Short-Term Funds | 38,690 | 38,690 | - | - |
| Total Investments in Securities: | 1,317,604 | 1,317,604 | - | - |
Fidelity Managed Retirement 2035 Fund℠
| Statement of Assets and Liabilities |
| | | | July 31, 2023 |
| | | | | |
| Assets | | | | |
| Investment in securities, at value - See accompanying schedule: | | | | |
Affiliated issuers (cost $1,239,475) | $ | 1,317,604 | | |
| | | | | |
| | | | | |
| Total Investment in Securities (cost $1,239,475) | | | $ | 1,317,604 |
| Cash | | | | 72 |
| Receivable for investments sold | | | | 104,968 |
Total assets | | | | 1,422,644 |
| Liabilities | | | | |
| Payable for fund shares redeemed | $ | 104,470 | | |
| Accrued management fee | | 525 | | |
| Distribution and service plan fees payable | | 23 | | |
| Total Liabilities | | | | 105,018 |
| Net Assets | | | $ | 1,317,626 |
| Net Assets consist of: | | | | |
| Paid in capital | | | $ | 1,234,547 |
| Total accumulated earnings (loss) | | | | 83,079 |
| Net Assets | | | $ | 1,317,626 |
| | | | | |
| Net Asset Value and Maximum Offering Price | | | | |
| Class A : | | | | |
Net Asset Value and redemption price per share ($115,085 ÷ 10,700.88 shares)(a) | | | $ | 10.75 |
| Maximum offering price per share (100/94.25 of $10.75) | | | $ | 11.41 |
| Fidelity Managed Retirement 2035 Fund : | | | | |
Net Asset Value, offering price and redemption price per share ($764,532 ÷ 71,086.38 shares) | | | $ | 10.75 |
| Class K : | | | | |
Net Asset Value, offering price and redemption price per share ($108,142 ÷ 10,048.65 shares) | | | $ | 10.76 |
| Class K6 : | | | | |
Net Asset Value, offering price and redemption price per share ($108,344 ÷ 10,066.92 shares) | | | $ | 10.76 |
| Class I : | | | | |
Net Asset Value, offering price and redemption price per share ($113,314 ÷ 10,530.88 shares) | | | $ | 10.76 |
| Class Z6 : | | | | |
Net Asset Value, offering price and redemption price per share ($108,209 ÷ 10,054.45 shares) | | | $ | 10.76 |
(a)Redemption price per share is equal to net asset value less any applicable contingent deferred sales charge. |
| Statement of Operations |
| | | | For the period December 15, 2022 (commencement of operations) through July 31, 2023 |
| Investment Income | | | | |
| Dividends: | | | | |
| Affiliated issuers | | | $ | 10,666 |
| Income from Fidelity Central Funds | | | | 72 |
| Total Income | | | | 10,738 |
| Expenses | | | | |
| Management fee | $ | 3,151 | | |
| Distribution and service plan fees | | 163 | | |
| Independent trustees' fees and expenses | | 2 | | |
| Total expenses before reductions | | 3,316 | | |
| Expense reductions | | (1) | | |
| Total expenses after reductions | | | | 3,315 |
| Net Investment income (loss) | | | | 7,423 |
| Realized and Unrealized Gain (Loss) | | | | |
| Net realized gain (loss) on: | | | | |
| Investment Securities: | | | | |
| Affiliated issuers | | 2,998 | | |
| Capital gain distributions from underlying funds: | | | | |
| Affiliated issuers | | 207 | | |
| Total net realized gain (loss) | | | | 3,205 |
| Change in net unrealized appreciation (depreciation) on: | | | | |
| Investment Securities: | | | | |
| Affiliated issuers | | 78,129 | | |
| Total change in net unrealized appreciation (depreciation) | | | | 78,129 |
| Net gain (loss) | | | | 81,334 |
| Net increase (decrease) in net assets resulting from operations | | | $ | 88,757 |
| Statement of Changes in Net Assets |
| |
| | For the period December 15, 2022 (commencement of operations) through July 31, 2023 |
| Increase (Decrease) in Net Assets | | |
| Operations | | |
| Net investment income (loss) | $ | 7,423 |
| Net realized gain (loss) | | 3,205 |
| Change in net unrealized appreciation (depreciation) | | 78,129 |
| Net increase (decrease) in net assets resulting from operations | | 88,757 |
| Distributions to shareholders | | (5,680) |
| | | |
| Share transactions - net increase (decrease) | | 1,234,549 |
| Total increase (decrease) in net assets | | 1,317,626 |
| | | |
| Net Assets | | |
| Beginning of period | | - |
| End of period | $ | 1,317,626 |
| | | |
| | | |
| Fidelity Advisor Managed Retirement 2035 Fund℠ Class A |
| |
| Years ended July 31, | | 2023 A |
Selected Per-Share Data | | |
| Net asset value, beginning of period | $ | 10.00 |
| Income from Investment Operations | | |
Net investment income (loss) B,C | | .048 |
| Net realized and unrealized gain (loss) | | .736 |
| Total from investment operations | | .784 |
| Distributions from net investment income | | (.034) |
| Total distributions | | (.034) |
| Net asset value, end of period | $ | 10.75 |
Total Return D,E,F | | 7.86% |
Ratios to Average Net Assets C,G,H | | |
| Expenses before reductions | | .73% I |
| Expenses net of fee waivers, if any | | .73% I |
| Expenses net of all reductions | | .73% I |
| Net investment income (loss) | | .75% I |
| Supplemental Data | | |
| Net assets, end of period (000 omitted) | $ | 115 |
Portfolio turnover rate J | | 59% I |
AFor the period December 15, 2022 (commencement of operations) through July 31, 2023.
BCalculated based on average shares outstanding during the period.
CNet investment income (loss) is affected by the timing of the declaration of dividends by any underlying mutual funds or exchange-traded funds (ETFs). Net investment income (loss) of any mutual funds or ETFs is not included in the Fund's net investment income (loss) ratio.
DTotal returns for periods of less than one year are not annualized.
ETotal returns would have been lower if certain expenses had not been reduced during the applicable periods shown.
FTotal returns do not include the effect of the sales charges.
GFees and expenses of any underlying mutual funds or exchange-traded funds (ETFs) are not included in the Fund's expense ratio. The Fund indirectly bears its proportionate share of these expenses. For additional expense information related to investments in Fidelity Central Funds, please refer to the "Investments in Fidelity Central Funds" note found in the Notes to Financial Statements section of the most recent Annual or Semi-Annual report.
HExpense ratios reflect operating expenses of the class. Expenses before reductions do not reflect amounts reimbursed, waived, or reduced through arrangements with the investment adviser, brokerage services, or other offset arrangements, if applicable, and do not represent the amount paid by the class during periods when reimbursements, waivers or reductions occur.
IAnnualized.
JAmount does not include the portfolio activity of any underlying mutual funds or exchange-traded funds (ETFs).
| Fidelity Managed Retirement 2035 Fund℠ |
| |
| Years ended July 31, | | 2023 A |
Selected Per-Share Data | | |
| Net asset value, beginning of period | $ | 10.00 |
| Income from Investment Operations | | |
Net investment income (loss) B,C | | .065 |
| Net realized and unrealized gain (loss) | | .735 |
| Total from investment operations | | .800 |
| Distributions from net investment income | | (.050) |
| Total distributions | | (.050) |
| Net asset value, end of period | $ | 10.75 |
Total Return D,E | | 8.02% |
Ratios to Average Net Assets C,F,G | | |
| Expenses before reductions | | .48% H |
| Expenses net of fee waivers, if any | | .48% H |
| Expenses net of all reductions | | .48% H |
| Net investment income (loss) | | 1.00% H |
| Supplemental Data | | |
| Net assets, end of period (000 omitted) | $ | 765 |
Portfolio turnover rate I | | 59% H |
AFor the period December 15, 2022 (commencement of operations) through July 31, 2023.
BCalculated based on average shares outstanding during the period.
CNet investment income (loss) is affected by the timing of the declaration of dividends by any underlying mutual funds or exchange-traded funds (ETFs). Net investment income (loss) of any mutual funds or ETFs is not included in the Fund's net investment income (loss) ratio.
DTotal returns for periods of less than one year are not annualized.
ETotal returns would have been lower if certain expenses had not been reduced during the applicable periods shown.
FFees and expenses of any underlying mutual funds or exchange-traded funds (ETFs) are not included in the Fund's expense ratio. The Fund indirectly bears its proportionate share of these expenses. For additional expense information related to investments in Fidelity Central Funds, please refer to the "Investments in Fidelity Central Funds" note found in the Notes to Financial Statements section of the most recent Annual or Semi-Annual report.
GExpense ratios reflect operating expenses of the class. Expenses before reductions do not reflect amounts reimbursed, waived, or reduced through arrangements with the investment adviser, brokerage services, or other offset arrangements, if applicable, and do not represent the amount paid by the class during periods when reimbursements, waivers or reductions occur.
HAnnualized.
IAmount does not include the portfolio activity of any underlying mutual funds or exchange-traded funds (ETFs).
| Fidelity Managed Retirement 2035 Fund℠ Class K |
| |
| Years ended July 31, | | 2023 A |
Selected Per-Share Data | | |
| Net asset value, beginning of period | $ | 10.00 |
| Income from Investment Operations | | |
Net investment income (loss) B,C | | .071 |
| Net realized and unrealized gain (loss) | | .739 |
| Total from investment operations | | .810 |
| Distributions from net investment income | | (.050) |
| Total distributions | | (.050) |
| Net asset value, end of period | $ | 10.76 |
Total Return D,E | | 8.12% |
Ratios to Average Net Assets C,F,G | | |
| Expenses before reductions | | .38% H |
| Expenses net of fee waivers, if any | | .38% H |
| Expenses net of all reductions | | .38% H |
| Net investment income (loss) | | 1.10% H |
| Supplemental Data | | |
| Net assets, end of period (000 omitted) | $ | 108 |
Portfolio turnover rate I | | 59% H |
AFor the period December 15, 2022 (commencement of operations) through July 31, 2023.
BCalculated based on average shares outstanding during the period.
CNet investment income (loss) is affected by the timing of the declaration of dividends by any underlying mutual funds or exchange-traded funds (ETFs). Net investment income (loss) of any mutual funds or ETFs is not included in the Fund's net investment income (loss) ratio.
DTotal returns for periods of less than one year are not annualized.
ETotal returns would have been lower if certain expenses had not been reduced during the applicable periods shown.
FFees and expenses of any underlying mutual funds or exchange-traded funds (ETFs) are not included in the Fund's expense ratio. The Fund indirectly bears its proportionate share of these expenses. For additional expense information related to investments in Fidelity Central Funds, please refer to the "Investments in Fidelity Central Funds" note found in the Notes to Financial Statements section of the most recent Annual or Semi-Annual report.
GExpense ratios reflect operating expenses of the class. Expenses before reductions do not reflect amounts reimbursed, waived, or reduced through arrangements with the investment adviser, brokerage services, or other offset arrangements, if applicable, and do not represent the amount paid by the class during periods when reimbursements, waivers or reductions occur.
HAnnualized.
IAmount does not include the portfolio activity of any underlying mutual funds or exchange-traded funds (ETFs).
| Fidelity Managed Retirement 2035 Fund℠ Class K6 |
| |
| Years ended July 31, | | 2023 A |
Selected Per-Share Data | | |
| Net asset value, beginning of period | $ | 10.00 |
| Income from Investment Operations | | |
Net investment income (loss) B,C | | .077 |
| Net realized and unrealized gain (loss) | | .739 |
| Total from investment operations | | .816 |
| Distributions from net investment income | | (.056) |
| Total distributions | | (.056) |
| Net asset value, end of period | $ | 10.76 |
Total Return D,E | | 8.19% |
Ratios to Average Net Assets C,F,G | | |
| Expenses before reductions | | .28% H |
| Expenses net of fee waivers, if any | | .28% H |
| Expenses net of all reductions | | .28% H |
| Net investment income (loss) | | 1.20% H |
| Supplemental Data | | |
| Net assets, end of period (000 omitted) | $ | 108 |
Portfolio turnover rate I | | 59% H |
AFor the period December 15, 2022 (commencement of operations) through July 31, 2023.
BCalculated based on average shares outstanding during the period.
CNet investment income (loss) is affected by the timing of the declaration of dividends by any underlying mutual funds or exchange-traded funds (ETFs). Net investment income (loss) of any mutual funds or ETFs is not included in the Fund's net investment income (loss) ratio.
DTotal returns for periods of less than one year are not annualized.
ETotal returns would have been lower if certain expenses had not been reduced during the applicable periods shown.
FFees and expenses of any underlying mutual funds or exchange-traded funds (ETFs) are not included in the Fund's expense ratio. The Fund indirectly bears its proportionate share of these expenses. For additional expense information related to investments in Fidelity Central Funds, please refer to the "Investments in Fidelity Central Funds" note found in the Notes to Financial Statements section of the most recent Annual or Semi-Annual report.
GExpense ratios reflect operating expenses of the class. Expenses before reductions do not reflect amounts reimbursed, waived, or reduced through arrangements with the investment adviser, brokerage services, or other offset arrangements, if applicable, and do not represent the amount paid by the class during periods when reimbursements, waivers or reductions occur.
HAnnualized.
IAmount does not include the portfolio activity of any underlying mutual funds or exchange-traded funds (ETFs).
| Fidelity Advisor Managed Retirement 2035 Fund℠ Class I |
| |
| Years ended July 31, | | 2023 A |
Selected Per-Share Data | | |
| Net asset value, beginning of period | $ | 10.00 |
| Income from Investment Operations | | |
Net investment income (loss) B,C | | .064 |
| Net realized and unrealized gain (loss) | | .741 |
| Total from investment operations | | .805 |
| Distributions from net investment income | | (.045) |
| Total distributions | | (.045) |
| Net asset value, end of period | $ | 10.76 |
Total Return D,E | | 8.07% |
Ratios to Average Net Assets C,F,G | | |
| Expenses before reductions | | .48% H |
| Expenses net of fee waivers, if any | | .48% H |
| Expenses net of all reductions | | .48% H |
| Net investment income (loss) | | 1.00% H |
| Supplemental Data | | |
| Net assets, end of period (000 omitted) | $ | 113 |
Portfolio turnover rate I | | 59% H |
AFor the period December 15, 2022 (commencement of operations) through July 31, 2023.
BCalculated based on average shares outstanding during the period.
CNet investment income (loss) is affected by the timing of the declaration of dividends by any underlying mutual funds or exchange-traded funds (ETFs). Net investment income (loss) of any mutual funds or ETFs is not included in the Fund's net investment income (loss) ratio.
DTotal returns for periods of less than one year are not annualized.
ETotal returns would have been lower if certain expenses had not been reduced during the applicable periods shown.
FFees and expenses of any underlying mutual funds or exchange-traded funds (ETFs) are not included in the Fund's expense ratio. The Fund indirectly bears its proportionate share of these expenses. For additional expense information related to investments in Fidelity Central Funds, please refer to the "Investments in Fidelity Central Funds" note found in the Notes to Financial Statements section of the most recent Annual or Semi-Annual report.
GExpense ratios reflect operating expenses of the class. Expenses before reductions do not reflect amounts reimbursed, waived, or reduced through arrangements with the investment adviser, brokerage services, or other offset arrangements, if applicable, and do not represent the amount paid by the class during periods when reimbursements, waivers or reductions occur.
HAnnualized.
IAmount does not include the portfolio activity of any underlying mutual funds or exchange-traded funds (ETFs).
| Fidelity Advisor Managed Retirement 2035 Fund℠ Class Z6 |
| |
| Years ended July 31, | | 2023 A |
Selected Per-Share Data | | |
| Net asset value, beginning of period | $ | 10.00 |
| Income from Investment Operations | | |
Net investment income (loss) B,C | | .077 |
| Net realized and unrealized gain (loss) | | .739 |
| Total from investment operations | | .816 |
| Distributions from net investment income | | (.056) |
| Total distributions | | (.056) |
| Net asset value, end of period | $ | 10.76 |
Total Return D,E | | 8.19% |
Ratios to Average Net Assets B,F,G | | |
| Expenses before reductions | | .28% H |
| Expenses net of fee waivers, if any | | .28% H |
| Expenses net of all reductions | | .28% H |
| Net investment income (loss) | | 1.20% H |
| Supplemental Data | | |
| Net assets, end of period (000 omitted) | $ | 108 |
Portfolio turnover rate I | | 59% H |
AFor the period December 15, 2022 (commencement of operations) through July 31, 2023.
BNet investment income (loss) is affected by the timing of the declaration of dividends by any underlying mutual funds or exchange-traded funds (ETFs). Net investment income (loss) of any mutual funds or ETFs is not included in the Fund's net investment income (loss) ratio.
CCalculated based on average shares outstanding during the period.
DTotal returns for periods of less than one year are not annualized.
ETotal returns would have been lower if certain expenses had not been reduced during the applicable periods shown.
FFees and expenses of any underlying mutual funds or exchange-traded funds (ETFs) are not included in the Fund's expense ratio. The Fund indirectly bears its proportionate share of these expenses. For additional expense information related to investments in Fidelity Central Funds, please refer to the "Investments in Fidelity Central Funds" note found in the Notes to Financial Statements section of the most recent Annual or Semi-Annual report.
GExpense ratios reflect operating expenses of the class. Expenses before reductions do not reflect amounts reimbursed, waived, or reduced through arrangements with the investment adviser, brokerage services, or other offset arrangements, if applicable, and do not represent the amount paid by the class during periods when reimbursements, waivers or reductions occur.
HAnnualized.
IAmount does not include the portfolio activity of any underlying mutual funds or exchange-traded funds (ETFs).
For the period ended July 31, 2023
1. Organization.
Fidelity Managed Retirement Income Fund, Fidelity Managed Retirement 2010 Fund, Fidelity Managed Retirement 2015 Fund, Fidelity Managed Retirement 2020 Fund, Fidelity Managed Retirement 2025 Fund, Fidelity Managed Retirement 2030 Fund and Fidelity Managed Retirement 2035 Fund (the Funds) are funds of Fidelity Income Fund (the Trust). The Trust is registered under the Investment Company Act of 1940, as amended (the 1940 Act), as an open-end management investment company organized as a Massachusetts business trust. Each Fund is authorized to issue an unlimited number of shares.
Each Fund offers the following classes of shares: Class A, Fidelity Managed Retirement shares, Class K, Class K6, Class I and Class Z6. Class A, Class I and Class Z6 are Fidelity Advisor classes. Each class has equal rights as to assets and voting privileges, except for matters affecting a single class.
2. Investments in Fidelity Central Funds.
Funds may invest in Fidelity Central Funds, which are open-end investment companies generally available only to other investment companies and accounts managed by the investment adviser and its affiliates. The Schedule of Investments lists any Fidelity Central Funds held as an investment as of period end, but does not include the underlying holdings of each Fidelity Central Fund. An investing fund indirectly bears its proportionate share of the expenses of the underlying Fidelity Central Funds.
Based on its investment objective, each Fidelity Central Fund may invest or participate in various investment vehicles or strategies that are similar to those of the investing fund. These strategies are consistent with the investment objectives of the investing fund and may involve certain economic risks which may cause a decline in value of each of the Fidelity Central Funds and thus a decline in the value of the investing fund.
| Fidelity Central Fund | Investment Manager | Investment Objective | Investment Practices | Expense RatioA |
| Fidelity Money Market Central Funds | Fidelity Management & Research Company LLC (FMR) | Each fund seeks to obtain a high level of current income consistent with the preservation of capital and liquidity. | Short-term Investments | Less than .005% |
A Expenses expressed as a percentage of average net assets and are as of each underlying Central Fund's most recent annual or semi-annual shareholder report.
A complete unaudited list of holdings for each Fidelity Central Fund is available upon request or at the Securities and Exchange Commission website at www.sec.gov. In addition, the financial statements of the Fidelity Central Funds which contain the significant accounting policies (including investment valuation policies) of those funds, and are not covered by the Report of Independent Registered Public Accounting Firm, are available on the Securities and Exchange Commission website or upon request.
3. Significant Accounting Policies.
Each Fund is an investment company and applies the accounting and reporting guidance of the Financial Accounting Standards Board (FASB) Accounting Standards Codification Topic 946 Financial Services - Investment Companies. The financial statements have been prepared in conformity with accounting principles generally accepted in the United States of America (GAAP), which require management to make certain estimates and assumptions at the date of the financial statements. Actual results could differ from those estimates. Subsequent events, if any, through the date that the financial statements were issued have been evaluated in the preparation of the financial statements. Each Fund's Schedule of Investments lists any underlying mutual funds or exchange-traded funds (ETFs) but does not include the underlying holdings of these funds. The following summarizes the significant accounting policies of each Fund:
Investment Valuation. Investments are valued as of 4:00 p.m. Eastern time on the last calendar day of the period. Each Fund categorizes the inputs to valuation techniques used to value its investments into a disclosure hierarchy consisting of three levels as shown below:
Level 1 - unadjusted quoted prices in active markets for identical investments
Level 2 - other significant observable inputs (including quoted prices for similar investments, interest rates, prepayment speeds, etc.)
Level 3 - unobservable inputs (including the Fund's own assumptions based on the best information available)
Valuation techniques used to value each Fund's investments by major category are as follows. Investments in open-end mutual funds are valued at their closing net asset value (NAV) each business day and are categorized as Level 1 in the hierarchy. The aggregate value of investments by input level as of July 31, 2023 is included at the end of each Fund's Schedule of Investments.
Investment Transactions and Income. For financial reporting purposes, the Funds' investment holdings and NAV include trades executed through the end of the last business day of the period. The NAV per share for processing shareholder transactions is calculated as of the close of business of the New York Stock Exchange (NYSE), normally 4:00 p.m. Eastern time and includes trades executed through the end of the prior business day. Gains and losses on securities sold are determined on the basis of identified cost. Income and capital gain distributions from any underlying mutual funds or exchange-traded funds (ETFs) are recorded on the ex-dividend date. Distributions from any underlying mutual funds or exchange-traded funds (ETFs) that are deemed to be return of capital are recorded as a reduction of cost of investments.
Class Allocations and Expenses. Investment income, realized and unrealized capital gains and losses, common expenses of a fund, and certain fund-level expense reductions, if any, are allocated daily on a pro-rata basis to each class based on the relative net assets of each class to the total net assets of a fund. Each class differs with respect to transfer agent and distribution and service plan fees incurred, as applicable. Certain expense reductions may also differ by class, if applicable. For the reporting period, the allocated portion of income and expenses to each class as a percent of its average net assets may vary due to the timing of recording these transactions in relation to fluctuating net assets of the classes. Expenses directly attributable to a fund are charged to that fund. Expenses attributable to more than one fund are allocated among the respective funds on the basis of relative net assets or other appropriate methods. Expenses included in the accompanying financial statements reflect the expenses of that fund and do not include any expenses associated with any underlying mutual funds or exchange-traded funds (ETFs). Although not included in a fund's expenses, a fund indirectly bears its proportionate share of these expenses through the net asset value of each underlying mutual fund or exchange-traded fund (ETF). Expense estimates are accrued in the period to which they relate and adjustments are made when actual amounts are known.
Income Tax Information and Distributions to Shareholders. Each year, each Fund intends to qualify as a regulated investment company under Subchapter M of the Internal Revenue Code, including distributing substantially all of its taxable income and realized gains. As a result, no provision for U.S. Federal income taxes is required. As of July 31, 2023, each Fund did not have any unrecognized tax benefits in the financial statements; nor is each Fund aware of any tax positions for which it is reasonably possible that the total amounts of unrecognized tax benefits will significantly change in the next twelve months. Each Fund files a U.S. federal tax return, in addition to state and local tax returns as required. Each Fund's federal income tax returns are subject to examination by the Internal Revenue Service (IRS) for a period of three fiscal years after they are filed. State and local tax returns may be subject to examination for an additional fiscal year depending on the jurisdiction.
Distributions are declared and recorded on the ex-dividend date. Income and capital gain distributions are declared separately for each class. Income and capital gain distributions are determined in accordance with income tax regulations, which may differ from GAAP.
Capital accounts within the financial statements are adjusted for permanent book-tax differences. These adjustments have no impact on net assets or the results of operations. Capital accounts are not adjusted for temporary book-tax differences which will reverse in a subsequent period.
Book-tax differences are primarily due to capital loss carryforwards and losses deferred due to wash sales and excise tax regulations.
As of period end, the cost and unrealized appreciation (depreciation) in securities, and derivatives if applicable, for federal income tax purposes were as follows for each Fund:
| | Tax cost | Gross unrealized appreciation | Gross unrealized depreciation | Net unrealized appreciation (depreciation) |
Fidelity Managed Retirement Income Fund | $17,564,360 | $407,862 | $(1,604,279) | $(1,196,417) |
| Fidelity Managed Retirement 2010 Fund | 6,460,345 | 206,444 | (510,088) | (303,644) |
| Fidelity Managed Retirement 2015 Fund | 6,669,869 | 281,496 | (595,871) | (314,375) |
| Fidelity Managed Retirement 2020 Fund | 9,172,942 | 454,388 | (872,027) | (417,639) |
| Fidelity Managed Retirement 2025 Fund | 55,261,672 | 3,016,062 | (5,253,394) | (2,237,332) |
| Fidelity Managed Retirement 2030 Fund | 41,802,538 | 1,620,709 | (4,358,263) | (2,737,554) |
| Fidelity Managed Retirement 2035 Fund | 1,242,656 | 82,934 | (7,986) | 74,948 |
The tax-based components of distributable earnings as of period end were as follows for each Fund:
| | Undistributed ordinary income | Undistributed long-term capital gain | Capital loss carryforward | Net unrealized appreciation (depreciation) on securities and other investments |
Fidelity Managed Retirement Income Fund | $32,797 | $ - | $ (527,464) | $ (1,196,417) |
| Fidelity Managed Retirement 2010 Fund | 12,175 | - | (86,627) | (303,644) |
| Fidelity Managed Retirement 2015 Fund | 11,209 | - | (105,078) | (314,375) |
| Fidelity Managed Retirement 2020 Fund | 13,781 | - | (287,256) | (417,639) |
| Fidelity Managed Retirement 2025 Fund | 73,604 | - | - | (2,237,332) |
| Fidelity Managed Retirement 2030 Fund | 50,381 | - | - | (2,737,554) |
| Fidelity Managed Retirement 2035 Fund | 7,951 | 179 | - | 74,948 |
Capital loss carryforwards are only available to offset future capital gains of the Funds to the extent provided by regulations and may be limited. The capital loss carryforward information presented below, including any applicable limitation, is estimated as of fiscal period end and is subject to adjustment.
| | Short-term | Long-term | Total capital loss carryforward |
Fidelity Managed Retirement Income Fund | $ (162,795) | $ (364,669) | $ (527,464) |
| Fidelity Managed Retirement 2010 Fund | (30,489) | (56,138) | (86,627) |
| Fidelity Managed Retirement 2015 Fund | (42,190) | (62,888) | (105,078) |
| Fidelity Managed Retirement 2020 Fund | (90,319) | (196,937) | (287,256) |
In addition, certain of the Funds intend to elect to defer to the next fiscal year capital losses recognized during the period November 1, 2022 to July 31, 2023. Loss deferrals were as follows:
| | Capital losses |
| Fidelity Managed Retirement 2025 Fund | (1,505,240) |
| Fidelity Managed Retirement 2030 Fund | (898,385) |
Due to large subscriptions in a prior period, Fidelity Managed Retirement 2030 Fund is subject to an annual limit on its use of some of its unrealized capital losses to offset capital gains in future periods. If those capital losses are realized and the limitation prevents the Fund from using any of those capital losses in a future period, those capital losses will be available to offset capital gains in subsequent periods.
The tax character of distributions paid was as follows:
| July 31, 2023 | | | |
| | Ordinary Income | Long-term Capital Gains | Total |
| Fidelity Managed Retirement Income Fund | $641,673 | $208,756 | $850,429 |
| Fidelity Managed Retirement 2010 Fund | 232,387 | 107,580 | 339,967 |
| Fidelity Managed Retirement 2015 Fund | 230,915 | 107,231 | 338,146 |
| Fidelity Managed Retirement 2020 Fund | 325,626 | 34,558 | 360,184 |
| Fidelity Managed Retirement 2025 Fund | 1,752,862 | 854,980 | 2,607,842 |
| Fidelity Managed Retirement 2030 Fund | 1,151,131 | 342,980 | 1,494,111 |
Fidelity Managed Retirement 2035 Fund A | 5,680 | - | 5,680 |
| July 31, 2022 | | | |
| | Ordinary Income | Long-term Capital Gains | Total |
| Fidelity Managed Retirement Income Fund | $570,265 | $229,570 | $799,835 |
| Fidelity Managed Retirement 2010 Fund | 205,143 | 243,966 | 449,109 |
| Fidelity Managed Retirement 2015 Fund | 244,092 | 207,714 | 451,806 |
| Fidelity Managed Retirement 2020 Fund | 362,701 | 222,089 | 584,790 |
| Fidelity Managed Retirement 2025 Fund | 1,892,237 | 1,284,235 | 3,176,472 |
| Fidelity Managed Retirement 2030 Fund | 1,142,383 | 621,866 | 1,764,249 |
A For the period December 15, 2022 (commencement of operations) through July 31, 2023.
4. Purchases and Sales of Investments.
Purchases and sales of securities, other than short-term securities and in-kind transactions, as applicable, are noted in the table below.
| | Purchases ($) | Sales ($) |
| Fidelity Managed Retirement Income Fund | 4,219,296 | 5,202,147 |
| Fidelity Managed Retirement 2010 Fund | 1,369,385 | 1,685,199 |
| Fidelity Managed Retirement 2015 Fund | 1,518,814 | 2,323,793 |
| Fidelity Managed Retirement 2020 Fund | 2,621,166 | 3,886,849 |
| Fidelity Managed Retirement 2025 Fund | 16,393,806 | 19,072,598 |
| Fidelity Managed Retirement 2030 Fund | 15,661,271 | 11,092,099 |
| Fidelity Managed Retirement 2035 Fund | 1,672,164 | 435,687 |
5. Fees and Other Transactions with Affiliates.
Management Fee. Fidelity Management & Research Company LLC (the investment adviser) and its affiliates provide the Funds with investment management related services. Under the management contract, each Class of each Fund pays a monthly management fee that is set at an annual rate by referring to each Fund's horizon date indicated by its name, such that the management fee rate applicable to each Class of each Fund is reduced as the fund approaches, and then passes, its horizon date. In addition, the investment adviser pays all ordinary operating expenses of each Fund, except distribution and service plan fees, fees and expenses of the independent Trustees, and certain miscellaneous expenses such as proxy and shareholder meeting expenses.
For the reporting period, the total annual management fee rate for each Fund was as follows:
| | Annual % of Class-Level Average Net Assets (Classes A, Retail and I) | Annual % of Class-Level Average Net Assets (Classes K, K6 and Z6) |
| Fidelity Managed Retirement Income Fund | .45% | .35% |
| Fidelity Managed Retirement 2010 Fund | .46% | .36% |
| Fidelity Managed Retirement 2015 Fund | .46% | .36% |
| Fidelity Managed Retirement 2020 Fund | .47% | .37% |
| Fidelity Managed Retirement 2025 Fund | .48% | .38% |
| Fidelity Managed Retirement 2030 Fund | .48% | .38% |
| Fidelity Managed Retirement 2035 Fund | .48% | .38% |
Under the expense contract, the investment adviser pays class-level expenses for Classes K6 and Z6 of each Fund as necessary so that Classes K6 and Z6 total expenses do not exceed certain amounts of Classes K6 and Z6 average net assets on an annual basis with certain exceptions, as noted in the following table:
| | Annual % of Class-Level Average Net Assets (Classes K6 and Z6) |
| Fidelity Managed Retirement Income Fund | .25% |
| Fidelity Managed Retirement 2010 Fund | .26% |
| Fidelity Managed Retirement 2015 Fund | .26% |
| Fidelity Managed Retirement 2020 Fund | .27% |
| Fidelity Managed Retirement 2025 Fund | .28% |
| Fidelity Managed Retirement 2030 Fund | .28% |
| Fidelity Managed Retirement 2035 Fund | .28% |
Distribution and Service Plan Fees. In accordance with Rule 12b-1 of the 1940 Act, each Fund has adopted separate Distribution and Service Plans for each class of shares. Certain classes pay Fidelity Distributors Company LLC (FDC), an affiliate of the investment adviser, separate Distribution and Service Fees, each of which is based on an annual percentage of each class' average net assets. In addition, FDC may pay financial intermediaries for selling shares of each Fund and providing shareholder support services. For the period, the Distribution and Service Fee rates, total fees and amounts retained by FDC were as follows:
| | Distribution Fee | Service Fee | Total Fees | Retained by FDC |
| Fidelity Managed Retirement Income Fund | | | | |
| Class A | - % | .25% | $1,680 | $19 |
| | | | $1,680 | $19 |
| Fidelity Managed Retirement 2010 Fund | | | | |
| Class A | - % | .25% | $728 | $3 |
| | | | $728 | $3 |
| Fidelity Managed Retirement 2015 Fund | | | | |
| Class A | - % | .25% | $2,893 | $10 |
| | | | $2,893 | $10 |
| Fidelity Managed Retirement 2020 Fund | | | | |
| Class A | - % | .25% | $1,300 | $8 |
| | | | $1,300 | $8 |
| Fidelity Managed Retirement 2025 Fund | | | | |
| Class A | - % | .25% | $4,080 | $11 |
| | | | $4,080 | $11 |
| Fidelity Managed Retirement 2030 Fund | | | | |
| Class A | - % | .25% | $1,007 | $129 |
| | | | $1,007 | $129 |
| Fidelity Managed Retirement 2035 Fund | | | | |
| Class A | - % | .25% | $163 | $162 |
| | | | $163 | $162 |
Sales Load. FDC may receive a front-end sales charge of up to 5.75% for selling each Fund's Class A shares, some of which is paid to financial intermediaries for selling shares of the Fund. Depending on the holding period, FDC may receive contingent deferred sales charges levied on Class A redemptions. The deferred sales charge is 1.00% for certain purchases of each Fund's Class A shares.
For the period, sales charge amounts retained by FDC were as follows:
| | Retained by FDC |
| Fidelity Managed Retirement Income Fund | |
| Class A | $1,514 |
| Fidelity Managed Retirement 2010 Fund | |
| Class A | $- |
| Fidelity Managed Retirement 2015 Fund | |
| Class A | $- |
| Fidelity Managed Retirement 2020 Fund | |
| Class A | $- |
| Fidelity Managed Retirement 2025 Fund | |
| Class A | $236 |
| Fidelity Managed Retirement 2030 Fund | |
| Class A | $1,716 |
| Fidelity Managed Retirement 2035 Fund | |
| Class A | $- |
Interfund Trades. Funds may purchase from or sell securities to other Fidelity Funds under procedures adopted by the Board. The procedures have been designed to ensure these interfund trades are executed in accordance with Rule 17a-7 of the 1940 Act. Any interfund trades are included within the respective purchases and sales amounts shown in the Purchases and Sales of Investments note. During the period, there were no interfund trades.
Prior Year Reallocation of Underlying Fund Investments. During the prior period, the investment adviser reallocated investments of the Funds. This involved taxable redemptions of the Funds' interest in Fidelity Series Inflation-Protected Bond Index Fund, ("Underlying Fund") for investments and cash and non-taxable exchanges of those investments and cash for shares of Fidelity Series 0-5 Year Inflation-Protected Bond Index Fund and Fidelity Series 5+ Year Inflation-Protected Bond Index Fund which are affiliated investment companies managed by FMR. Net realized gain (loss) on the redemptions of the Underlying Fund in connection with the reallocation is included in the accompanying Statements of Changes in Net Assets as "Net realized gain (loss)."
Details of these transactions with the net related gain (loss) for the Funds are presented in the accompanying table:
| | Value of Investments and Cash reallocated ($) | Net realized Gain (Loss) on redemptions of Underlying Fund ($) |
| Fidelity Managed Retirement Income Fund | 1,944,779 | 89,719 |
| Fidelity Managed Retirement 2010 Fund | 603,205 | 48,796 |
| Fidelity Managed Retirement 2015 Fund | 604,324 | 33,280 |
| Fidelity Managed Retirement 2020 Fund | 771,991 | 27,286 |
| Fidelity Managed Retirement 2025 Fund | 3,340,942 | 112,223 |
| Fidelity Managed Retirement 2030 Fund | 1,816,824 | (6,325) |
6. Expense Reductions.
Through arrangements with each applicable Fund's custodian and each class' transfer agent, credits realized as a result of certain uninvested cash balances were used to reduce each applicable Fund's or class' expenses. All of the applicable expense reductions are noted in the table below.
| | Custodian credits | Transfer Agent credits |
| Fidelity Managed Retirement Income Fund | | |
| Class A | | $36 |
| Fidelity Managed Retirement 2010 Fund | | |
| Fidelity Managed Retirement 2010 | $2 | |
| Fidelity Managed Retirement 2015 Fund | | |
| Class K6 | | $13 |
| Fidelity Managed Retirement 2020 Fund | | |
| Fidelity Managed Retirement 2020 | $1 | |
| Fidelity Managed Retirement 2025 Fund | | |
| Fidelity Managed Retirement 2025 | $13 | |
| Fidelity Managed Retirement 2030 Fund | | |
| Fidelity Managed Retirement 2030 | $6 | |
| Class K6 | | $1 |
| Class I | | $14 |
Fidelity Managed Retirement 2035 Fund | | |
| Fidelity Managed Retirement 2035 | $1 | |
7. Distributions to Shareholders.
Distributions to shareholders of each class were as follows:
| | Year ended July 31, 2023A | Year ended July 31, 2022 |
| Fidelity Managed Retirement Income Fund | | |
| Distributions to shareholders | | |
| Class A | $30,825 | $23,201 |
| Fidelity Managed Retirement Income | 765,103 | 730,653 |
| Class K | 5,595 | 4,211 |
| Class K6 | 36,074 | 28,418 |
| Class I | 7,544 | 9,013 |
| Class Z6 | 5,288 | 4,339 |
Total | $850,429 | $799,835 |
| Fidelity Managed Retirement 2010 Fund | | |
| Distributions to shareholders | | |
| Class A | $15,168 | $21,558 |
| Fidelity Managed Retirement 2010 | 287,106 | 391,662 |
| Class K | 5,856 | 7,043 |
| Class K6 | 17,663 | 11,163 |
| Class I | 5,302 | 6,595 |
| Class Z6 | 8,872 | 11,088 |
Total | $339,967 | $449,109 |
| Fidelity Managed Retirement 2015 Fund | | |
| Distributions to shareholders | | |
| Class A | $57,506 | $70,787 |
| Fidelity Managed Retirement 2015 | 236,084 | 340,286 |
| Class K | 5,945 | 6,403 |
| Class K6 | 19,064 | 12,656 |
| Class I | 13,748 | 15,144 |
| Class Z6 | 5,799 | 6,530 |
Total | $338,146 | $451,806 |
| Fidelity Managed Retirement 2020 Fund | | |
| Distributions to shareholders | | |
| Class A | $19,273 | $27,651 |
| Fidelity Managed Retirement 2020 | 286,009 | 502,416 |
| Class K | 4,448 | 5,860 |
| Class K6 | 37,690 | 28,546 |
| Class I | 8,321 | 14,316 |
| Class Z6 | 4,443 | 6,001 |
Total | $360,184 | $584,790 |
| Fidelity Managed Retirement 2025 Fund | | |
| Distributions to shareholders | | |
| Class A | $75,727 | $93,730 |
| Fidelity Managed Retirement 2025 | 2,377,382 | 2,917,914 |
| Class K | 6,792 | 6,623 |
| Class K6 | 122,627 | 115,837 |
| Class I | 19,622 | 35,623 |
| Class Z6 | 5,692 | 6,745 |
Total | $2,607,842 | $3,176,472 |
| Fidelity Managed Retirement 2030 Fund | | |
| Distributions to shareholders | | |
| Class A | $15,906 | $22,711 |
| Fidelity Managed Retirement 2030 Fund | 1,412,691 | 1,630,623 |
| Class K | 9,749 | 10,537 |
| Class K6 | 34,156 | 70,002 |
| Class I | 12,934 | 19,563 |
| Class Z6 | 8,675 | 10,813 |
Total | $1,494,111 | $1,764,249 |
| Fidelity Managed Retirement 2035 Fund | | |
| Distributions to shareholders | | |
| Class A | $340 | $- |
| Fidelity Managed Retirement 2035 Fund | 3,249 | - |
| Class K | 501 | - |
| Class K6 | 561 | - |
| Class I | 468 | - |
| Class Z6 | 561 | - |
Total | $5,680 | $- |
A Distributions for Fidelity Managed Retirement 2035 Fund are for the period December 15, 2022 (commencement of sale of shares) through July 31, 2023.
8. Share Transactions.
Share transactions for each class were as follows and may contain in-kind transactions, automatic conversions between classes or exchanges between affiliated funds:
| | Shares | Shares | Dollars | Dollars |
| | Year ended July 31, 2023A | Year ended July 31, 2022 | Year ended July 31, 2023A | Year ended July 31, 2022 |
| Fidelity Managed Retirement Income Fund | | | | |
| Class A | | | | |
| Shares sold | 3,627 | 4,335 | $195,073 | $258,005 |
| Reinvestment of distributions | 565 | 361 | 29,856 | 22,335 |
| Shares redeemed | (1,940) | (3,295) | (104,167) | (201,987) |
| Net increase (decrease) | 2,252 | 1,401 | $120,762 | $78,353 |
| Fidelity Managed Retirement Income | | | | |
| Shares sold | 27,223 | 79,943 | $1,477,101 | $4,847,918 |
| Reinvestment of distributions | 12,187 | 10,359 | 644,354 | 639,506 |
| Shares redeemed | (54,848) | (118,209) | (2,924,303) | (7,007,849) |
| Net increase (decrease) | (15,438) | (27,907) | $(802,848) | $(1,520,425) |
| Class K | | | | |
| Shares sold | 727 | - | $38,462 | $ - |
| Reinvestment of distributions | 106 | 69 | 5,595 | 4,211 |
| Shares redeemed | (297) | - | (15,918) | - |
| Net increase (decrease) | 536 | 69 | $28,139 | $4,211 |
| Class K6 | | | | |
| Shares sold | 3,785 | 9,760 | $206,587 | $601,002 |
| Reinvestment of distributions | 683 | 462 | 36,074 | 28,418 |
| Shares redeemed | (7,900) | (6,134) | (413,843) | (367,494) |
| Net increase (decrease) | (3,432) | 4,088 | $(171,182) | $261,926 |
| Class I | | | | |
| Shares sold | 586 | - | $31,608 | $ - |
| Reinvestment of distributions | 135 | 134 | 7,118 | 8,270 |
| Shares redeemed | (895) | (1,268) | (47,227) | (74,871) |
| Net increase (decrease) | (174) | (1,134) | $(8,501) | $(66,601) |
| Class Z6 | | | | |
| Reinvestment of distributions | 100 | 70 | $5,288 | $4,339 |
| Net increase (decrease) | 100 | 70 | $5,288 | $4,339 |
| Fidelity Managed Retirement 2010 Fund | | | | |
| Class A | | | | |
| Shares sold | - | 47 | $- | $2,509 |
| Reinvestment of distributions | 301 | 359 | 15,168 | 21,558 |
| Shares redeemed | (1,638) | (718) | (83,733) | (41,005) |
| Net increase (decrease) | (1,337) | (312) | $(68,565) | $(16,938) |
| Fidelity Managed Retirement 2010 | | | | |
| Shares sold | 3,923 | 14,547 | $200,194 | $829,091 |
| Reinvestment of distributions | 4,718 | 5,806 | 238,071 | 348,856 |
| Shares redeemed | (11,670) | (23,561) | (596,306) | (1,363,916) |
| Net increase (decrease) | (3,029) | (3,208) | $(158,041) | $(185,969) |
| Class K | | | | |
| Shares sold | 366 | - | $18,719 | $ - |
| Reinvestment of distributions | 116 | 118 | 5,856 | 7,043 |
| Net increase (decrease) | 482 | 118 | $24,575 | $7,043 |
| Class K6 | | | | |
| Shares sold | 379 | 3,756 | $19,151 | $209,788 |
| Reinvestment of distributions | 351 | 187 | 17,663 | 11,163 |
| Shares redeemed | (1,351) | (489) | (68,089) | (28,840) |
| Net increase (decrease) | (621) | 3,454 | $(31,275) | $192,111 |
| Class I | | | | |
| Reinvestment of distributions | 105 | 110 | $5,302 | $6,595 |
| Shares redeemed | (214) | - | (10,928) | - |
| Net increase (decrease) | (109) | 110 | $(5,626) | $6,595 |
| Class Z6 | | | | |
| Reinvestment of distributions | 176 | 185 | $8,872 | $11,088 |
| Shares redeemed | (43) | (43) | (2,153) | (2,515) |
| Net increase (decrease) | 133 | 142 | $6,719 | $8,573 |
| Fidelity Managed Retirement 2015 Fund | | | | |
| Class A | | | | |
| Shares sold | - | 112 | $ - | $6,591 |
| Reinvestment of distributions | 1,181 | 1,208 | 57,506 | 70,787 |
| Shares redeemed | (4,218) | (1,770) | (210,819) | (99,383) |
| Net increase (decrease) | (3,037) | (450) | $(153,313) | $(22,005) |
| Fidelity Managed Retirement 2015 | | | | |
| Shares sold | 6,953 | 12,644 | $340,470 | $702,163 |
| Reinvestment of distributions | 4,392 | 5,542 | 214,460 | 324,754 |
| Shares redeemed | (10,936) | (38,552) | (540,007) | (2,118,332) |
| Net increase (decrease) | 409 | (20,366) | $14,923 | $(1,091,415) |
| Class K | | | | |
| Shares sold | 1,148 | - | $57,268 | $ - |
| Reinvestment of distributions | 122 | 109 | 5,945 | 6,403 |
| Net increase (decrease) | 1,270 | 109 | $63,213 | $6,403 |
| Class K6 | | | | |
| Shares sold | 178 | 17,000 | $8,810 | $908,785 |
| Reinvestment of distributions | 389 | 219 | 19,064 | 12,656 |
| Shares redeemed | (13,320) | (4,625) | (673,024) | (237,763) |
| Net increase (decrease) | (12,753) | 12,594 | $(645,150) | $683,678 |
| Class I | | | | |
| Shares sold | 17 | 504 | $863 | $30,000 |
| Reinvestment of distributions | 281 | 259 | 13,711 | 15,144 |
| Shares redeemed | (601) | (40) | (29,656) | (2,347) |
| Net increase (decrease) | (303) | 723 | $(15,082) | $42,797 |
| Class Z6 | | | | |
| Reinvestment of distributions | 119 | 112 | $5,799 | $6,530 |
| Net increase (decrease) | 119 | 112 | $5,799 | $6,530 |
| Fidelity Managed Retirement 2020 Fund | | | | |
| Class A | | | | |
| Shares sold | 2,463 | 2,597 | $121,452 | $151,458 |
| Reinvestment of distributions | 401 | 474 | 19,273 | 27,651 |
| Shares redeemed | (8,092) | (4,580) | (404,954) | (262,598) |
| Net increase (decrease) | (5,228) | (1,509) | $(264,229) | $(83,489) |
| Fidelity Managed Retirement 2020 | | | | |
| Shares sold | 12,552 | 35,834 | $628,868 | $2,017,295 |
| Reinvestment of distributions | 5,374 | 7,500 | 259,182 | 436,751 |
| Shares redeemed | (32,324) | (76,962) | (1,575,144) | (4,256,265) |
| Net increase (decrease) | (14,398) | (33,628) | $(687,094) | $(1,802,219) |
| Class K | | | | |
| Shares sold | 475 | - | $23,783 | $ - |
| Reinvestment of distributions | 92 | 101 | 4,448 | 5,860 |
| Net increase (decrease) | 567 | 101 | $28,231 | $5,860 |
| Class K6 | | | | |
| Shares sold | 1,248 | 34,851 | $62,179 | $1,904,684 |
| Reinvestment of distributions | 781 | 495 | 37,690 | 28,546 |
| Shares redeemed | (8,929) | (24,400) | (438,956) | (1,299,460) |
| Net increase (decrease) | (6,900) | 10,946 | $(339,087) | $633,770 |
| Class I | | | | |
| Shares sold | 13 | 71 | $618 | $3,559 |
| Reinvestment of distributions | 172 | 244 | 8,288 | 14,198 |
| Shares redeemed | (711) | (852) | (35,756) | (45,768) |
| Net increase (decrease) | (526) | (537) | $(26,850) | $(28,011) |
| Class Z6 | | | | |
| Reinvestment of distributions | 92 | 103 | $4,443 | $6,001 |
| Net increase (decrease) | 92 | 103 | $4,443 | $6,001 |
| Fidelity Managed Retirement 2025 Fund | | | | |
| Class A | | | | |
| Shares sold | 1,080 | 1,857 | $55,268 | $112,295 |
| Reinvestment of distributions | 1,528 | 1,538 | 75,727 | 93,730 |
| Shares redeemed | (4,001) | (1,639) | (205,772) | (92,245) |
| Net increase (decrease) | (1,393) | 1,756 | $(74,777) | $113,780 |
| Fidelity Managed Retirement 2025 | | | | |
| Shares sold | 97,735 | 296,505 | $5,028,821 | $17,455,286 |
| Reinvestment of distributions | 40,549 | 43,173 | 2,018,409 | 2,631,538 |
| Shares redeemed | (196,184) | (258,937) | (9,971,080) | (14,955,162) |
| Net increase (decrease) | (57,900) | 80,741 | $(2,923,850) | $5,131,662 |
| Class K | | | | |
| Shares sold | 4,979 | - | $256,058 | $ - |
| Reinvestment of distributions | 129 | 109 | 6,433 | 6,623 |
| Shares redeemed | (349) | - | (17,869) | - |
| Net increase (decrease) | 4,759 | 109 | $244,622 | $6,623 |
| Class K6 | | | | |
| Shares sold | 32,944 | 64,022 | $1,672,600 | $3,799,515 |
| Reinvestment of distributions | 2,463 | 1,905 | 122,627 | 115,837 |
| Shares redeemed | (17,193) | (42,047) | (871,481) | (2,507,197) |
| Net increase (decrease) | 18,214 | 23,880 | $923,746 | $1,408,155 |
| Class I | | | | |
| Shares sold | 1,828 | 987 | $92,326 | $52,884 |
| Reinvestment of distributions | 394 | 583 | 19,622 | 35,623 |
| Shares redeemed | (9,270) | (3,393) | (468,440) | (195,953) |
| Net increase (decrease) | (7,048) | (1,823) | $(356,492) | $(107,446) |
| Class Z6 | | | | |
| Reinvestment of distributions | 114 | 109 | $5,692 | $6,745 |
| Net increase (decrease) | 114 | 109 | $5,692 | $6,745 |
| Fidelity Managed Retirement 2030 Fund | | | | |
| Class A | | | | |
| Shares sold | 18,613 | 10,183 | $194,871 | $117,544 |
| Reinvestment of distributions | 1,611 | 1,860 | 15,906 | 22,711 |
| Shares redeemed | (11,369) | (17,015) | (114,724) | (207,301) |
| Net increase (decrease) | 8,855 | (4,972) | $96,053 | $(67,046) |
| Fidelity Managed Retirement 2030 Fund | | | | |
| Shares sold | 723,736 | 1,410,617 | $7,415,873 | $17,095,755 |
| Reinvestment of distributions | 121,301 | 119,058 | 1,200,188 | 1,449,121 |
| Shares redeemed | (542,920) | (814,796) | (5,507,199) | (9,513,672) |
| Net increase (decrease) | 302,117 | 714,879 | $3,108,862 | $9,031,204 |
| Class K | | | | |
| Shares sold | 13,268 | - | $134,681 | $ - |
| Reinvestment of distributions | 981 | 865 | 9,749 | 10,537 |
| Shares redeemed | (2) | - | (21) | - |
| Net increase (decrease) | 14,247 | 865 | $144,409 | $10,537 |
| Class K6 | | | | |
| Shares sold | 146,146 | 172,801 | $1,498,389 | $1,982,234 |
| Reinvestment of distributions | 3,423 | 5,738 | 34,156 | 70,002 |
| Shares redeemed | (34,929) | (211,644) | (372,535) | (2,410,238) |
| Net increase (decrease) | 114,640 | (33,105) | $1,160,010 | $(358,002) |
| Class I | | | | |
| Shares sold | 3,910 | 3,559 | $39,746 | $41,327 |
| Reinvestment of distributions | 1,305 | 1,604 | 12,934 | 19,563 |
| Shares redeemed | (5,815) | (5,199) | (58,499) | (61,062) |
| Net increase (decrease) | (600) | (36) | $(5,819) | $(172) |
| Class Z6 | | | | |
| Shares sold | 14,761 | 36 | $152,590 | $451 |
| Reinvestment of distributions | 859 | 888 | 8,523 | 10,813 |
| Shares redeemed | (1,499) | - | (15,434) | - |
| Net increase (decrease) | 14,121 | 924 | $145,679 | $11,264 |
| Fidelity Managed Retirement 2035 Fund | | | | |
| Class A | | | | |
| Shares sold | 10,668 | - | $107,138 | $ - |
| Reinvestment of distributions | 33 | - | 340 | - |
| Net increase (decrease) | 10,701 | - | $107,478 | $ - |
| Fidelity Managed Retirement 2035 Fund | | | | |
| Shares sold | 103,506 | - | $1,054,826 | $ - |
| Reinvestment of distributions | 120 | - | 1,244 | - |
| Shares redeemed | (32,540) | - | (336,222) | - |
| Net increase (decrease) | 71,086 | - | $719,848 | $ - |
| Class K | | | | |
| Shares sold | 10,000 | - | $100,000 | $ - |
| Reinvestment of distributions | 49 | - | 501 | - |
| Net increase (decrease) | 10,049 | - | $100,501 | $ - |
| Class K6 | | | | |
| Shares sold | 10,013 | - | $100,135 | $ - |
| Reinvestment of distributions | 54 | - | 561 | - |
| Shares redeemed | - | - | (3) | - |
| Net increase (decrease) | 10,067 | - | $100,693 | $ - |
| Class I | | | | |
| Shares sold | 10,485 | - | $105,000 | $ - |
| Reinvestment of distributions | 45 | - | 468 | - |
| Net increase (decrease) | 10,530 | - | $105,468 | $ - |
| Class Z6 | | | | |
| Shares sold | 10,000 | - | $100,000 | $ - |
| Reinvestment of distributions | 54 | - | 561 | - |
| Net increase (decrease) | 10,054 | - | $100,561 | $ - |
A Share transactions for Fidelity Managed Retirement 2035 Fund are for the period December 15, 2022 (commencement of sale of shares) through July 31, 2023.
9. Other.
A fund's organizational documents provide former and current trustees and officers with a limited indemnification against liabilities arising in connection with the performance of their duties to the fund. In the normal course of business, a fund may also enter into contracts that provide general indemnifications. A fund's maximum exposure under these arrangements is unknown as this would be dependent on future claims that may be made against a fund. The risk of material loss from such claims is considered remote.
At the end of the period, the investment adviser or its affiliates were owners of record of more than 10% of the outstanding shares as follows:
| Fund | Affiliated % |
| Fidelity Managed Retirement 2035 Fund | 30% |
10. Risk and Uncertainties.
Many factors affect a fund's performance. Developments that disrupt global economies and financial markets, such as pandemics, epidemics, outbreaks of infectious diseases, war, terrorism, and environmental disasters, may significantly affect a fund's investment performance. The effects of these developments to a fund will be impacted by the types of securities in which a fund invests, the financial condition, industry, economic sector, and geographic location of an issuer, and a fund's level of investment in the securities of that issuer. Significant concentrations in security types, issuers, industries, sectors, and geographic locations may magnify the factors that affect a fund's performance.
To the Board of Trustees of Fidelity Income Fund and the Shareholders of Fidelity Managed Retirement Income Fund, Fidelity Managed Retirement 2010 Fund, Fidelity Managed Retirement 2015 Fund, Fidelity Managed Retirement 2020 Fund, Fidelity Managed Retirement 2025 Fund, Fidelity Managed Retirement 2030 Fund and Fidelity Managed Retirement 2035 Fund:
Opinion on the Financial Statements and Financial Highlights
We have audited the accompanying statements of assets and liabilities of Fidelity Managed Retirement Income Fund, Fidelity Managed Retirement 2010 Fund, Fidelity Managed Retirement 2015 Fund, Fidelity Managed Retirement 2020 Fund, Fidelity Managed Retirement 2025 Fund, Fidelity Managed Retirement 2030 Fund and Fidelity Managed Retirement 2035 Fund (the "Funds"), each a fund of Fidelity Income Fund, including the schedules of investments, as of July 31, 2023, the related statements of operations for the year then ended, the statements of changes in net assets for each of the two years in the period then ended, the financial highlights for each of the five years in the period then ended, except for the financial highlights for the Fidelity Managed Retirement 2030 Fund, which are for each of the three years in the period then ended, and for the period from August 16, 2019 (commencement of operations) through July 31, 2020, and the statement of changes in net assets and the financial highlights for the Fidelity Managed Retirement 2035 Fund which are for the period from December 15, 2022 (commencement of operations) through July 31, 2023, and the related notes. In our opinion, the financial statements and financial highlights present fairly, in all material respects, the financial position of each of the Funds as of July 31, 2023, and the results of their operations for the year then ended, the changes in their net assets for each of the two years in the period then ended (or for the period mentioned above), and the financial highlights for each of the five years in the period then ended (or for the periods mentioned above), in conformity with accounting principles generally accepted in the United States of America.
Basis for Opinion
These financial statements and financial highlights are the responsibility of the Funds' management. Our responsibility is to express an opinion on the Funds' financial statements and financial highlights based on our audits. We are a public accounting firm registered with the Public Company Accounting Oversight Board (United States) (PCAOB) and are required to be independent with respect to the Funds in accordance with the U.S. federal securities laws and the applicable rules and regulations of the Securities and Exchange Commission and the PCAOB.
We conducted our audits in accordance with the standards of the PCAOB. Those standards require that we plan and perform the audit to obtain reasonable assurance about whether the financial statements and financial highlights are free of material misstatement, whether due to error or fraud. The Funds are not required to have, nor were we engaged to perform, an audit of their internal control over financial reporting. As part of our audits we are required to obtain an understanding of internal control over financial reporting but not for the purpose of expressing an opinion on the effectiveness of the Funds' internal control over financial reporting. Accordingly, we express no such opinion.
Our audits included performing procedures to assess the risks of material misstatement of the financial statements and financial highlights, whether due to error or fraud, and performing procedures that respond to those risks. Such procedures included examining, on a test basis, evidence regarding the amounts and disclosures in the financial statements and financial highlights. Our audits also included evaluating the accounting principles used and significant estimates made by management, as well as evaluating the overall presentation of the financial statements and financial highlights. Our procedures included confirmation of securities owned as of July 31, 2023, by correspondence with the custodian and brokers; when replies were not received from brokers, we performed other auditing procedures. We believe that our audits provide a reasonable basis for our opinion.
/s/ Deloitte & Touche LLP
Boston, Massachusetts
September 14, 2023
We have served as the auditor of one or more of the Fidelity investment companies since 1999.
The Trustees, Members of the Advisory Board (if any), and officers of the trust and funds, as applicable, are listed below. The Board of Trustees governs each fund and is responsible for protecting the interests of shareholders. The Trustees are experienced executives who meet periodically throughout the year to oversee each fund's activities, review contractual arrangements with companies that provide services to each fund, oversee management of the risks associated with such activities and contractual arrangements, and review each fund's performance. If the interests of a fund and an underlying Fidelity® fund were to diverge, a conflict of interest could arise and affect how the Trustees and Members of the Advisory Board fulfill their fiduciary duties to the affected funds. FMR has structured the funds to avoid these potential conflicts, although there may be situations where a conflict of interest is unavoidable. In such instances, FMR, the Trustees, and Members of the Advisory Board would take reasonable steps to minimize and, if possible, eliminate the conflict. Each of the Trustees oversees 313 funds.
The Trustees hold office without limit in time except that (a) any Trustee may resign; (b) any Trustee may be removed by written instrument, signed by at least two-thirds of the number of Trustees prior to such removal; (c) any Trustee who requests to be retired or who has become incapacitated by illness or injury may be retired by written instrument signed by a majority of the other Trustees; and (d) any Trustee may be removed at any special meeting of shareholders by a two-thirds vote of the outstanding voting securities of the trust. Each Trustee who is not an interested person (as defined in the 1940 Act) of the trust and the funds is referred to herein as an Independent Trustee. Each Independent Trustee shall retire not later than the last day of the calendar year in which his or her 75th birthday occurs. The Independent Trustees may waive this mandatory retirement age policy with respect to individual Trustees. Officers and Advisory Board Members hold office without limit in time, except that any officer or Advisory Board Member may resign or may be removed by a vote of a majority of the Trustees at any regular meeting or any special meeting of the Trustees. Except as indicated, each individual has held the office shown or other offices in the same company for the past five years.
The funds' Statement of Additional Information (SAI) includes more information about the Trustees. To request a free copy, call Fidelity at 1-800-544-8544 if you're an individual investing directly with Fidelity, call 1-800-835-5092 if you're a plan sponsor or participant with Fidelity as your recordkeeper or call 1-877-208-0098 on institutional accounts or if you're an advisor or invest through one.
Experience, Skills, Attributes, and Qualifications of the Trustees. The Governance and Nominating Committee has adopted a statement of policy that describes the experience, qualifications, attributes, and skills that are necessary and desirable for potential Independent Trustee candidates (Statement of Policy). The Board believes that each Trustee satisfied at the time he or she was initially elected or appointed a Trustee, and continues to satisfy, the standards contemplated by the Statement of Policy. The Governance and Nominating Committee also engages professional search firms to help identify potential Independent Trustee candidates who have the experience, qualifications, attributes, and skills consistent with the Statement of Policy. From time to time, additional criteria based on the composition and skills of the current Independent Trustees, as well as experience or skills that may be appropriate in light of future changes to board composition, business conditions, and regulatory or other developments, have also been considered by the professional search firms and the Governance and Nominating Committee. In addition, the Board takes into account the Trustees' commitment and participation in Board and committee meetings, as well as their leadership of standing and ad hoc committees throughout their tenure.
In determining that a particular Trustee was and continues to be qualified to serve as a Trustee, the Board has considered a variety of criteria, none of which, in isolation, was controlling. The Board believes that, collectively, the Trustees have balanced and diverse experience, qualifications, attributes, and skills, which allow the Board to operate effectively in governing each fund and protecting the interests of shareholders. Information about the specific experience, skills, attributes, and qualifications of each Trustee, which in each case led to the Board's conclusion that the Trustee should serve (or continue to serve) as a trustee of the funds, is provided below.
Board Structure and Oversight Function. Abigail P. Johnson is an interested person and currently serves as Chairman. The Trustees have determined that an interested Chairman is appropriate and benefits shareholders because an interested Chairman has a personal and professional stake in the quality and continuity of services provided to the funds. Independent Trustees exercise their informed business judgment to appoint an individual of their choosing to serve as Chairman, regardless of whether the Trustee happens to be independent or a member of management. The Independent Trustees have determined that they can act independently and effectively without having an Independent Trustee serve as Chairman and that a key structural component for assuring that they are in a position to do so is for the Independent Trustees to constitute a substantial majority for the Board. The Independent Trustees also regularly meet in executive session. Michael E. Kenneally serves as Chairman of the Independent Trustees and as such (i) acts as a liaison between the Independent Trustees and management with respect to matters important to the Independent Trustees and (ii) with management prepares agendas for Board meetings.
Fidelity® funds are overseen by different Boards of Trustees. The funds' Board oversees Fidelity's investment-grade bond, money market, asset allocation and certain equity funds, and other Boards oversee Fidelity's alternative investment, high income and other equity funds. The asset allocation funds may invest in Fidelity® funds that are overseen by such other Boards. The use of separate Boards, each with its own committee structure, allows the Trustees of each group of Fidelity® funds to focus on the unique issues of the funds they oversee, including common research, investment, and operational issues. On occasion, the separate Boards establish joint committees to address issues of overlapping consequences for the Fidelity® funds overseen by each Board.
The Trustees operate using a system of committees to facilitate the timely and efficient consideration of all matters of importance to the Trustees, each fund, and fund shareholders and to facilitate compliance with legal and regulatory requirements and oversight of the funds' activities and associated risks. The Board, acting through its committees, has charged FMR and its affiliates with (i) identifying events or circumstances the occurrence of which could have demonstrably adverse effects on the funds' business and/or reputation; (ii) implementing processes and controls to lessen the possibility that such events or circumstances occur or to mitigate the effects of such events or circumstances if they do occur; and (iii) creating and maintaining a system designed to evaluate continuously business and market conditions in order to facilitate the identification and implementation processes described in (i) and (ii) above. Because the day-to-day operations and activities of the funds are carried out by or through FMR, its affiliates, and other service providers, the funds' exposure to risks is mitigated but not eliminated by the processes overseen by the Trustees. While each of the Board's committees has responsibility for overseeing different aspects of the funds' activities, oversight is exercised primarily through the Operations and Audit Committees. In addition, an ad hoc Board committee of Independent Trustees has worked with FMR to enhance the Board's oversight of investment and financial risks, legal and regulatory risks, technology risks, and operational risks, including the development of additional risk reporting to the Board. Appropriate personnel, including but not limited to the funds' Chief Compliance Officer (CCO), FMR's internal auditor, the independent accountants, the funds' Treasurer and portfolio management personnel, make periodic reports to the Board's committees, as appropriate, including an annual review of Fidelity's risk management program for the Fidelity® funds. The responsibilities of each standing committee, including their oversight responsibilities, are described further under "Standing Committees of the Trustees."
Interested Trustees*:
Correspondence intended for a Trustee who is an interested person may be sent to Fidelity Investments, 245 Summer Street, Boston, Massachusetts 02210.
Name, Year of Birth; Principal Occupations and Other Relevant Experience+
Abigail P. Johnson (1961)
Year of Election or Appointment: 2009
Trustee
Chairman of the Board of Trustees
Ms. Johnson also serves as Trustee of other Fidelity® funds. Ms. Johnson serves as Chairman (2016-present), Chief Executive Officer (2014-present), and Director (2007-present) of FMR LLC (diversified financial services company), President of Fidelity Financial Services (2012-present) and President of Personal, Workplace and Institutional Services (2005-present). Ms. Johnson is Chairman and Director of Fidelity Management & Research Company LLC (investment adviser firm, 2011-present). Previously, Ms. Johnson served as Chairman and Director of FMR Co., Inc. (investment adviser firm, 2011-2019), Vice Chairman (2007-2016) and President (2013-2016) of FMR LLC, President and a Director of Fidelity Management & Research Company (2001-2005), a Trustee of other investment companies advised by Fidelity Management & Research Company, Fidelity Investments Money Management, Inc. (investment adviser firm), and FMR Co., Inc. (2001-2005), Senior Vice President of the Fidelity® funds (2001-2005), and managed a number of Fidelity® funds. Ms. Abigail P. Johnson and Mr. Arthur E. Johnson are not related.
Jennifer Toolin McAuliffe (1959)
Year of Election or Appointment: 2016
Trustee
Ms. McAuliffe also serves as Trustee of other Fidelity® funds and as Trustee of Fidelity Charitable (2020-present). Previously, Ms. McAuliffe served as Co-Head of Fixed Income of Fidelity Investments Limited (now known as FIL Limited (FIL)) (diversified financial services company), Director of Research for FIL's credit and quantitative teams in London, Hong Kong and Tokyo and Director of Research for taxable and municipal bonds at Fidelity Investments Money Management, Inc. Ms. McAuliffe previously served as a member of the Advisory Board of certain Fidelity® funds (2016). Ms. McAuliffe was previously a lawyer at Ropes & Gray LLP and an international banker at Chemical Bank NA (now JPMorgan Chase & Co.). Ms. McAuliffe also currently serves as director or trustee of several not-for-profit entities.
* Determined to be an "Interested Trustee" by virtue of, among other things, his or her affiliation with the trust or various entities under common control with FMR.
+ The information includes the Trustee's principal occupation during the last five years and other information relating to the experience, attributes, and skills relevant to the Trustee's qualifications to serve as a Trustee, which led to the conclusion that the Trustee should serve as a Trustee for each fund.
Independent Trustees:
Correspondence intended for an Independent Trustee may be sent to Fidelity Investments, P.O. Box 55235, Boston, Massachusetts 02205-5235.
Name, Year of Birth; Principal Occupations and Other Relevant Experience+
Elizabeth S. Acton (1951)
Year of Election or Appointment: 2013
Trustee
Ms. Acton also serves as Trustee of other Fidelity® funds. Prior to her retirement, Ms. Acton served as Executive Vice President, Finance (2011-2012), Executive Vice President, Chief Financial Officer (2002-2011) and Treasurer (2004-2005) of Comerica Incorporated (financial services). Prior to joining Comerica, Ms. Acton held a variety of positions at Ford Motor Company (1983-2002), including Vice President and Treasurer (2000-2002) and Executive Vice President and Chief Financial Officer of Ford Motor Credit Company (1998-2000). Ms. Acton currently serves as a member of the Board and Audit and Finance Committees of Beazer Homes USA, Inc. (homebuilding, 2012-present). Ms. Acton previously served as a member of the Advisory Board of certain Fidelity® funds (2013-2016).
Ann E. Dunwoody (1953)
Year of Election or Appointment: 2018
Trustee
General Dunwoody also serves as Trustee of other Fidelity® funds. General Dunwoody (United States Army, Retired) was the first woman in U.S. military history to achieve the rank of four-star general and prior to her retirement in 2012 held a variety of positions within the U.S. Army, including Commanding General, U.S. Army Material Command (2008-2012). General Dunwoody currently serves as a member of the Board, Chair of Nomination Committee and a member of the Corporate Governance Committee of Kforce Inc. (professional staffing services, 2016-present) and a member of the Board of Automattic Inc. (software engineering, 2018-present). Previously, General Dunwoody served as President of First to Four LLC (leadership and mentoring services, 2012-2022), a member of the Advisory Board and Nominating and Corporate Governance Committee of L3 Technologies, Inc. (communication, electronic, sensor and aerospace systems, 2013-2019) and a member of the Board and Audit and Sustainability and Corporate Responsibility Committees of Republic Services, Inc. (waste collection, disposal and recycling, 2013-2016). General Dunwoody also serves on several boards for non-profit organizations, including as a member of the Board, Chair of the Nomination and Governance Committee and a member of the Audit Committee of the Noble Reach Foundation (formerly Logistics Management Institute) (consulting non-profit, 2012-present) and a member of the Board of ThanksUSA (military family education non-profit, 2014-present). Previously, General Dunwoody served as a member of the Board of Florida Institute of Technology (2015-2022) and a member of the Council of Trustees for the Association of the United States Army (advocacy non-profit, 2013-2021). General Dunwoody previously served as a member of the Advisory Board of certain Fidelity® funds (2018).
John Engler (1948)
Year of Election or Appointment: 2014
Trustee
Mr. Engler also serves as Trustee of other Fidelity® funds. Previously, Mr. Engler served as Governor of Michigan (1991-2003), President of the Business Roundtable (2011-2017) and interim President of Michigan State University (2018-2019). Previously, Mr. Engler served as a member of the Board of Stride, Inc. (formerly K12 Inc.) (technology-based education company, 2012-2022), a member of the Board of Universal Forest Products (manufacturer and distributor of wood and wood-alternative products, 2003-2019) and Trustee of The Munder Funds (2003-2014). Mr. Engler previously served as a member of the Advisory Board of certain Fidelity® funds (2014-2016).
Robert F. Gartland (1951)
Year of Election or Appointment: 2010
Trustee
Mr. Gartland also serves as Trustee of other Fidelity® funds. Prior to his retirement, Mr. Gartland held a variety of positions at Morgan Stanley (financial services, 1979-2007), including Managing Director (1987-2007) and Chase Manhattan Bank (1975-1978). Mr. Gartland previously served as Chairman and an investor in Gartland & Mellina Group Corp. (consulting, 2009-2019), as a member of the Board of National Securities Clearing Corporation (1993-1996) and as Chairman of TradeWeb (2003-2004).
Arthur E. Johnson (1947)
Year of Election or Appointment: 2008
Trustee
Mr. Johnson also serves as Trustee of other Fidelity® funds. Prior to his retirement, Mr. Johnson served as Senior Vice President of Corporate Strategic Development of Lockheed Martin Corporation (defense contractor, 1999-2009). Mr. Johnson currently serves as a member of the Board of Booz Allen Hamilton (management consulting, 2011-present). Mr. Johnson previously served as a member of the Board of Eaton Corporation plc (diversified power management, 2009-2019) and a member of the Board of AGL Resources, Inc. (holding company, 2002-2016). Mr. Johnson previously served as Chairman (2018-2021) and Vice Chairman (2015-2018) of the Independent Trustees of certain Fidelity® funds. Mr. Arthur E. Johnson is not related to Ms. Abigail P. Johnson.
Michael E. Kenneally (1954)
Year of Election or Appointment: 2009
Trustee
Chairman of the Independent Trustees
Mr. Kenneally also serves as Trustee of other Fidelity® funds and was Vice Chairman (2018-2021) of the Independent Trustees of certain Fidelity® funds. Prior to retirement in 2005, he was Chairman and Global Chief Executive Officer of Credit Suisse Asset Management, the worldwide fund management and institutional investment business of Credit Suisse Group. Previously, Mr. Kenneally was an Executive Vice President and the Chief Investment Officer for Bank of America. In this role, he was responsible for the investment management, strategy and products delivered to the bank's institutional, high-net-worth and retail clients. Earlier, Mr. Kenneally directed the organization's equity and quantitative research groups. He began his career as a research analyst and then spent more than a dozen years as a portfolio manager for endowments, pension plans and mutual funds. He earned the Chartered Financial Analyst (CFA) designation in 1991.
Mark A. Murray (1954)
Year of Election or Appointment: 2016
Trustee
Mr. Murray also serves as Trustee of other Fidelity® funds. Previously, Mr. Murray served as Co-Chief Executive Officer (2013-2016), President (2006-2013) and Vice Chairman (2013-2020) of Meijer, Inc. Mr. Murray serves as a member of the Board (2009-present) and Public Policy and Responsibility Committee (2009-present) and Chair of the Nuclear Review Committee (2019-present) of DTE Energy Company (diversified energy company). Mr. Murray previously served as a member of the Board of Spectrum Health (not-for-profit health system, 2015-2019) and as a member of the Board and Audit Committee and Chairman of the Nominating and Corporate Governance Committee of Universal Forest Products, Inc. (manufacturer and distributor of wood and wood-alternative products, 2004-2016). Mr. Murray also serves as a member of the Board of many community and professional organizations. Mr. Murray previously served as a member of the Advisory Board of certain Fidelity® funds (2016).
+ The information includes the Trustee's principal occupation during the last five years and other information relating to the experience, attributes, and skills relevant to the Trustee's qualifications to serve as a Trustee, which led to the conclusion that the Trustee should serve as a Trustee for each fund.
Advisory Board Members and Officers:
Correspondence intended for a Member of the Advisory Board (if any) may be sent to Fidelity Investments, P.O. Box 55235, Boston, Massachusetts 02205-5235. Correspondence intended for an officer may be sent to Fidelity Investments, 245 Summer Street, Boston, Massachusetts 02210. Officers appear below in alphabetical order.
Name, Year of Birth; Principal Occupation
Laura M. Bishop (1961)
Year of Election or Appointment: 2022
Member of the Advisory Board
Ms. Bishop also serves as a Member of the Advisory Board of other funds. Prior to her retirement, Ms. Bishop held a variety of positions at United Services Automobile Association (2001-2020), including Executive Vice President and Chief Financial Officer (2014-2020) and Senior Vice President and Deputy Chief Financial Officer (2012-2014). Ms. Bishop currently serves as a member of the Audit Committee and Compensation and Personnel Committee (2021-present) of the Board of Directors of Korn Ferry (global organizational consulting).
Robert W. Helm (1957)
Year of Election or Appointment: 2021
Member of the Advisory Board
Mr. Helm also serves as a Member of the Advisory Board of other Fidelity® funds. Mr. Helm was formerly Deputy Chairman (2003-2020), partner (1991-2020) and an associate (1984-1991) of Dechert LLP (formerly Dechert Price & Rhoads). Mr. Helm currently serves on boards and committees of several not-for-profit organizations, including as a Trustee and member of the Executive Committee of the Baltimore Council on Foreign Affairs, a member of the Board of Directors of the St. Vincent de Paul Society of Baltimore and a member of the Life Guard Society of Mt. Vernon.
Carol J. Zierhoffer (1960)
Year of Election or Appointment: 2023
Member of the Advisory Board
Ms. Zierhoffer also serves as a Member of the Advisory Board of other funds. Prior to her retirement, Ms. Zierhoffer held a variety of positions at Bechtel Corporation (engineering company, 2013-2019), including Principal Vice President and Chief Information Officer (2013-2016) and Senior Vice President and Chief Information Officer (2016-2019). Ms. Zierhoffer currently serves as a member of the Board of Directors, Audit Committee and Compensation Committee of Allscripts Healthcare Solutions, Inc. (healthcare technology, 2020-present) and as a member of the Board of Directors, Audit and Finance Committee and Nominating and Governance Committee of Atlas Air Worldwide Holdings, Inc. (aviation operating services, 2021-present). Previously, Ms. Zierhoffer served as a member of the Board of Directors and Audit Committee and as the founding Chair of the Information Technology Committee of MedAssets, Inc. (healthcare technology, 2013-2016).
Heather Bonner (1977)
Year of Election or Appointment: 2023
Assistant Treasurer
Ms. Bonner also serves as an officer of other funds. Ms. Bonner serves as Senior Vice President (2022-present), and is an employee of Fidelity Investments. Ms. Bonner serves as Assistant Treasurer of Fidelity CRET Trustee LLC (2022-present). Prior to joining Fidelity, Ms. Bonner served as Managing Director at AQR Capital Management (2013-2022) and was the Treasurer and Principal Financial Officer of the AQR Funds (2013-2022).
Craig S. Brown (1977)
Year of Election or Appointment: 2019
Assistant Treasurer
Mr. Brown also serves as an officer of other funds. Mr. Brown serves as Assistant Treasurer of FIMM, LLC (2021-present) and is an employee of Fidelity Investments (2013-present). Previously, Mr. Brown served as Assistant Treasurer of certain Fidelity® funds (2019-2022).
John J. Burke III (1964)
Year of Election or Appointment: 2018
Chief Financial Officer
Mr. Burke also serves as Chief Financial Officer of other funds. Mr. Burke serves as Head of Investment Operations for Fidelity Fund and Investment Operations (2018-present) and is an employee of Fidelity Investments (1998-present). Previously Mr. Burke served as head of Asset Management Investment Operations (2012-2018).
Margaret Carey (1973)
Year of Election or Appointment: 2023
Secretary and Chief Legal Officer (CLO)
Ms. Carey also serves as an officer of other funds and as CLO of certain other Fidelity entities. She is a Senior Vice President and Deputy General Counsel of FMR LLC (diversified financial services company, 2019-present), and is an employee of Fidelity Investments.
David J. Carter (1973)
Year of Election or Appointment: 2020
Assistant Secretary
Mr. Carter also serves as Assistant Secretary of other funds. Mr. Carter serves as Senior Vice President, Deputy General Counsel (2022-present) and is an employee of Fidelity Investments (2005-present).
Jonathan Davis (1968)
Year of Election or Appointment: 2010
Assistant Treasurer
Mr. Davis also serves as an officer of other funds. Mr. Davis serves as Vice President Assistant Treasurer and is an employee of Fidelity Investments. Mr. Davis serves as Assistant Treasurer of certain Fidelity entities.
Laura M. Del Prato (1964)
Year of Election or Appointment: 2018
President and Treasurer
Ms. Del Prato also serves as an officer of other funds. Ms. Del Prato serves as Assistant Treasurer of FIMM, LLC (2021-present) and is an employee of Fidelity Investments (2017-present). Previously, Ms. Del Prato served as President and Treasurer of The North Carolina Capital Management Trust: Cash Portfolio and Term Portfolio (2018-2020). Prior to joining Fidelity Investments, Ms. Del Prato served as a Managing Director and Treasurer of the JPMorgan Mutual Funds (2014-2017). Prior to JPMorgan, Ms. Del Prato served as a partner at Cohen Fund Audit Services (accounting firm, 2012-2013) and KPMG LLP (accounting firm, 2004-2012).
Christopher M. Gouveia (1973)
Year of Election or Appointment: 2023
Chief Compliance Officer
Mr. Gouveia also serves as Chief Compliance Officer of other funds. Mr. Gouveia serves as Senior Vice President of Asset Management Compliance for Fidelity Investments and is an employee of Fidelity Investments. Previously, Mr. Gouveia served as Chief Compliance Officer of the North Carolina Capital Management Trust (2016-2019).
Colm A. Hogan (1973)
Year of Election or Appointment: 2016
Assistant Treasurer
Mr. Hogan also serves as an officer of other funds. Mr. Hogan serves as Assistant Treasurer of FIMM, LLC (2021-present) and FMR Capital, Inc. (2017-present) and is an employee of Fidelity Investments (2005-present). Previously, Mr. Hogan served as Deputy Treasurer of certain Fidelity® funds (2016-2020) and Assistant Treasurer of certain Fidelity® funds (2016-2018).
William Irving (1964)
Year of Election or Appointment: 2023
Vice President
Mr. Irving also serves as Vice President of other funds. Mr. Irving serves as Head of Fidelity Asset Management Solutions (2022-present) and is an employee of Fidelity Investments. Mr. Irving serves as President and Director of Fidelity Diversifying Solutions LLC (investment adviser firm, 2023-present) and President, Director, or Vice President of certain other Fidelity entities. Previously, Mr. Irving served as Chief Investment Officer (CIO) in the Global Asset Allocation division (2020-2022). Prior to that, he was Managing Director of Research in the Global Asset Allocation division (2018-2020) and portfolio manager of certain Fidelity® funds (2004-2018).
Chris Maher (1972)
Year of Election or Appointment: 2013
Assistant Treasurer
Mr. Maher also serves as an officer of other funds. Mr. Maher serves as Assistant Treasurer of FIMM, LLC (2021-present) and FMR Capital, Inc. (2017-present), and is an employee of Fidelity Investments (2008-present). Previously, Mr. Maher served as Assistant Treasurer of certain funds (2013-2020); Vice President of Asset Management Compliance (2013), Vice President of the Program Management Group of FMR (investment adviser firm, 2010-2013), and Vice President of Valuation Oversight (2008-2010).
Brett Segaloff (1972)
Year of Election or Appointment: 2021
Anti-Money Laundering (AML) Officer
Mr. Segaloff also serves as an AML Officer of other funds and other related entities. He is Director, Anti-Money Laundering (2007-present) of FMR LLC (diversified financial services company) and is an employee of Fidelity Investments (1996-present).
Stacie M. Smith (1974)
Year of Election or Appointment: 2013
Assistant Treasurer
Ms. Smith also serves as an officer of other funds. Ms. Smith serves as Assistant Treasurer of FIMM, LLC (2021-present) and FMR Capital, Inc. (2017-present), is an employee of Fidelity Investments (2009-present), and has served in other fund officer roles. Prior to joining Fidelity Investments, Ms. Smith served as Senior Audit Manager of Ernst & Young LLP (accounting firm, 1996-2009). Previously, Ms. Smith served as Assistant Treasurer (2013-2019) and Deputy Treasurer (2013-2016) of certain Fidelity® funds.
Jim Wegmann (1979)
Year of Election or Appointment: 2021
Deputy Treasurer
Mr. Wegmann also serves as an officer of other funds. Mr. Wegmann serves as Assistant Treasurer of FIMM, LLC (2021-present) and is an employee of Fidelity Investments (2011-present). Previously, Mr. Wegmann served as Assistant Treasurer of certain Fidelity® funds (2019-2021).
As a shareholder, you incur two types of costs: (1) transaction costs, which may include sales charges (loads) on purchase payments or redemption proceeds, as applicable and (2) ongoing costs, which generally include management fees, distribution and/or service (12b-1) fees and other Fund expenses. This Example is intended to help you understand your ongoing costs (in dollars) of investing in a fund and to compare these costs with the ongoing costs of investing in other mutual funds.
| The Example is based on an investment of $1,000 invested at the beginning of the period and held for the entire period (February 1, 2023 to July 31, 2023). |
Actual Expenses
The first line of the accompanying table provides information about actual account values and actual expenses. You may use the information in this line, together with the amount you invested, to estimate the expenses that you paid over the period. Simply divide your account value by $1,000.00 (for example, an $8,600 account value divided by $1,000.00 = 8.6), then multiply the result by the number in the first line for a class/Fund under the heading entitled "Expenses Paid During Period" to estimate the expenses you paid on your account during this period. If any fund is a shareholder of any underlying mutual funds or exchange-traded funds (ETFs) (the Underlying Funds), such fund indirectly bears its proportional share of the expenses of the Underlying Funds in addition to the direct expenses incurred presented in the table. These fees and expenses are not included in the annualized expense ratio used to calculate the expense estimate in the table below.
Hypothetical Example for Comparison Purposes
The second line of the accompanying table provides information about hypothetical account values and hypothetical expenses based on the actual expense ratio and an assumed rate of return of 5% per year before expenses, which is not the actual return. The hypothetical account values and expenses may not be used to estimate the actual ending account balance or expenses you paid for the period. You may use this information to compare the ongoing costs of investing in the Fund and other funds. To do so, compare this 5% hypothetical example with the 5% hypothetical examples that appear in the shareholder reports of the other funds. If any fund is a shareholder of any Underlying Funds, such fund indirectly bears its proportional share of the expenses of the Underlying Funds in addition to the direct expenses as presented in the table. These fees and expenses are not included in the annualized expense ratio used to calculate the expense estimate in the table below.
Please note that the expenses shown in the table are meant to highlight your ongoing costs only and do not reflect any transaction costs. Therefore, the second line of the table is useful in comparing ongoing costs only, and will not help you determine the relative total costs of owning different funds. In addition, if these transactional costs were included, your costs would have been higher.
| | | | | Annualized Expense Ratio- A | | Beginning Account Value February 1, 2023 | | Ending Account Value July 31, 2023 | | Expenses Paid During Period- C February 1, 2023 to July 31, 2023 |
| Fidelity Managed Retirement Income Fund℠ | | | | | | | | | | |
| Class A | | | | .70% | | | | | | |
| Actual | | | | | | $ 1,000 | | $ 1,010.60 | | $ 3.49 |
Hypothetical-B | | | | | | $ 1,000 | | $ 1,021.32 | | $ 3.51 |
| Fidelity Managed Retirement Income Fund℠ | | | | .45% | | | | | | |
| Actual | | | | | | $ 1,000 | | $ 1,011.50 | | $ 2.24 |
Hypothetical-B | | | | | | $ 1,000 | | $ 1,022.56 | | $ 2.26 |
| Class K | | | | .35% | | | | | | |
| Actual | | | | | | $ 1,000 | | $ 1,012.30 | | $ 1.75 |
Hypothetical-B | | | | | | $ 1,000 | | $ 1,023.06 | | $ 1.76 |
| Class K6 | | | | .25% | | | | | | |
| Actual | | | | | | $ 1,000 | | $ 1,012.70 | | $ 1.25 |
Hypothetical-B | | | | | | $ 1,000 | | $ 1,023.55 | | $ 1.25 |
| Class I | | | | .45% | | | | | | |
| Actual | | | | | | $ 1,000 | | $ 1,011.80 | | $ 2.24 |
Hypothetical-B | | | | | | $ 1,000 | | $ 1,022.56 | | $ 2.26 |
| Class Z6 | | | | .25% | | | | | | |
| Actual | | | | | | $ 1,000 | | $ 1,012.70 | | $ 1.25 |
Hypothetical-B | | | | | | $ 1,000 | | $ 1,023.55 | | $ 1.25 |
| Fidelity Managed Retirement 2010 Fund℠ | | | | | | | | | | |
| Class A | | | | .71% | | | | | | |
| Actual | | | | | | $ 1,000 | | $ 1,012.70 | | $ 3.54 |
Hypothetical-B | | | | | | $ 1,000 | | $ 1,021.27 | | $ 3.56 |
| Fidelity Managed Retirement 2010 Fund℠ | | | | .46% | | | | | | |
| Actual | | | | | | $ 1,000 | | $ 1,013.90 | | $ 2.30 |
Hypothetical-B | | | | | | $ 1,000 | | $ 1,022.51 | | $ 2.31 |
| Class K | | | | .36% | | | | | | |
| Actual | | | | | | $ 1,000 | | $ 1,014.40 | | $ 1.80 |
Hypothetical-B | | | | | | $ 1,000 | | $ 1,023.01 | | $ 1.81 |
| Class K6 | | | | .26% | | | | | | |
| Actual | | | | | | $ 1,000 | | $ 1,014.80 | | $ 1.30 |
Hypothetical-B | | | | | | $ 1,000 | | $ 1,023.51 | | $ 1.30 |
| Class I | | | | .46% | | | | | | |
| Actual | | | | | | $ 1,000 | | $ 1,013.80 | | $ 2.30 |
Hypothetical-B | | | | | | $ 1,000 | | $ 1,022.51 | | $ 2.31 |
| Class Z6 | | | | .26% | | | | | | |
| Actual | | | | | | $ 1,000 | | $ 1,014.80 | | $ 1.30 |
Hypothetical-B | | | | | | $ 1,000 | | $ 1,023.51 | | $ 1.30 |
| Fidelity Managed Retirement 2015 Fund℠ | | | | | | | | | | |
| Class A | | | | .71% | | | | | | |
| Actual | | | | | | $ 1,000 | | $ 1,018.00 | | $ 3.55 |
Hypothetical-B | | | | | | $ 1,000 | | $ 1,021.27 | | $ 3.56 |
| Fidelity Managed Retirement 2015 Fund℠ | | | | .46% | | | | | | |
| Actual | | | | | | $ 1,000 | | $ 1,019.10 | | $ 2.30 |
Hypothetical-B | | | | | | $ 1,000 | | $ 1,022.51 | | $ 2.31 |
| Class K | | | | .36% | | | | | | |
| Actual | | | | | | $ 1,000 | | $ 1,019.70 | | $ 1.80 |
Hypothetical-B | | | | | | $ 1,000 | | $ 1,023.01 | | $ 1.81 |
| Class K6 | | | | .26% | | | | | | |
| Actual | | | | | | $ 1,000 | | $ 1,020.20 | | $ 1.30 |
Hypothetical-B | | | | | | $ 1,000 | | $ 1,023.51 | | $ 1.30 |
| Class I | | | | .46% | | | | | | |
| Actual | | | | | | $ 1,000 | | $ 1,019.10 | | $ 2.30 |
Hypothetical-B | | | | | | $ 1,000 | | $ 1,022.51 | | $ 2.31 |
| Class Z6 | | | | .26% | | | | | | |
| Actual | | | | | | $ 1,000 | | $ 1,020.10 | | $ 1.30 |
Hypothetical-B | | | | | | $ 1,000 | | $ 1,023.51 | | $ 1.30 |
| Fidelity Managed Retirement 2020 Fund℠ | | | | | | | | | | |
| Class A | | | | .72% | | | | | | |
| Actual | | | | | | $ 1,000 | | $ 1,023.40 | | $ 3.61 |
Hypothetical-B | | | | | | $ 1,000 | | $ 1,021.22 | | $ 3.61 |
| Fidelity Managed Retirement 2020 Fund℠ | | | | .47% | | | | | | |
| Actual | | | | | | $ 1,000 | | $ 1,024.60 | | $ 2.36 |
Hypothetical-B | | | | | | $ 1,000 | | $ 1,022.46 | | $ 2.36 |
| Class K | | | | .37% | | | | | | |
| Actual | | | | | | $ 1,000 | | $ 1,025.20 | | $ 1.86 |
Hypothetical-B | | | | | | $ 1,000 | | $ 1,022.96 | | $ 1.86 |
| Class K6 | | | | .27% | | | | | | |
| Actual | | | | | | $ 1,000 | | $ 1,025.60 | | $ 1.36 |
Hypothetical-B | | | | | | $ 1,000 | | $ 1,023.46 | | $ 1.35 |
| Class I | | | | .47% | | | | | | |
| Actual | | | | | | $ 1,000 | | $ 1,024.60 | | $ 2.36 |
Hypothetical-B | | | | | | $ 1,000 | | $ 1,022.46 | | $ 2.36 |
| Class Z6 | | | | .27% | | | | | | |
| Actual | | | | | | $ 1,000 | | $ 1,025.60 | | $ 1.36 |
Hypothetical-B | | | | | | $ 1,000 | | $ 1,023.46 | | $ 1.35 |
| Fidelity Managed Retirement 2025 Fund℠ | | | | | | | | | | |
| Class A | | | | .73% | | | | | | |
| Actual | | | | | | $ 1,000 | | $ 1,028.70 | | $ 3.67 |
Hypothetical-B | | | | | | $ 1,000 | | $ 1,021.17 | | $ 3.66 |
| Fidelity Managed Retirement 2025 Fund℠ | | | | .48% | | | | | | |
| Actual | | | | | | $ 1,000 | | $ 1,030.00 | | $ 2.42 |
Hypothetical-B | | | | | | $ 1,000 | | $ 1,022.41 | | $ 2.41 |
| Class K | | | | .38% | | | | | | |
| Actual | | | | | | $ 1,000 | | $ 1,030.50 | | $ 1.91 |
Hypothetical-B | | | | | | $ 1,000 | | $ 1,022.91 | | $ 1.91 |
| Class K6 | | | | .28% | | | | | | |
| Actual | | | | | | $ 1,000 | | $ 1,030.90 | | $ 1.41 |
Hypothetical-B | | | | | | $ 1,000 | | $ 1,023.41 | | $ 1.40 |
| Class I | | | | .48% | | | | | | |
| Actual | | | | | | $ 1,000 | | $ 1,030.10 | | $ 2.42 |
Hypothetical-B | | | | | | $ 1,000 | | $ 1,022.41 | | $ 2.41 |
| Class Z6 | | | | .28% | | | | | | |
| Actual | | | | | | $ 1,000 | | $ 1,030.90 | | $ 1.41 |
Hypothetical-B | | | | | | $ 1,000 | | $ 1,023.41 | | $ 1.40 |
| Fidelity Managed Retirement 2030 Fund℠ | | | | | | | | | | |
| Class A | | | | .73% | | | | | | |
| Actual | | | | | | $ 1,000 | | $ 1,033.00 | | $ 3.68 |
Hypothetical-B | | | | | | $ 1,000 | | $ 1,021.17 | | $ 3.66 |
| Fidelity Managed Retirement 2030 Fund℠ | | | | .48% | | | | | | |
| Actual | | | | | | $ 1,000 | | $ 1,034.10 | | $ 2.42 |
Hypothetical-B | | | | | | $ 1,000 | | $ 1,022.41 | | $ 2.41 |
| Class K | | | | .38% | | | | | | |
| Actual | | | | | | $ 1,000 | | $ 1,034.50 | | $ 1.92 |
Hypothetical-B | | | | | | $ 1,000 | | $ 1,022.91 | | $ 1.91 |
| Class K6 | | | | .28% | | | | | | |
| Actual | | | | | | $ 1,000 | | $ 1,035.20 | | $ 1.41 |
Hypothetical-B | | | | | | $ 1,000 | | $ 1,023.41 | | $ 1.40 |
| Class I | | | | .48% | | | | | | |
| Actual | | | | | | $ 1,000 | | $ 1,034.00 | | $ 2.42 |
Hypothetical-B | | | | | | $ 1,000 | | $ 1,022.41 | | $ 2.41 |
| Class Z6 | | | | .28% | | | | | | |
| Actual | | | | | | $ 1,000 | | $ 1,035.00 | | $ 1.41 |
Hypothetical-B | | | | | | $ 1,000 | | $ 1,023.41 | | $ 1.40 |
| Fidelity Managed Retirement 2035 Fund℠ | | | | | | | | | | |
| Class A | | | | .73% | | | | | | |
| Actual | | | | | | $ 1,000 | | $ 1,036.20 | | $ 3.69 |
Hypothetical-B | | | | | | $ 1,000 | | $ 1,021.17 | | $ 3.66 |
| Fidelity Managed Retirement 2035 Fund℠ | | | | .48% | | | | | | |
| Actual | | | | | | $ 1,000 | | $ 1,037.70 | | $ 2.43 |
Hypothetical-B | | | | | | $ 1,000 | | $ 1,022.41 | | $ 2.41 |
| Class K | | | | .38% | | | | | | |
| Actual | | | | | | $ 1,000 | | $ 1,038.70 | | $ 1.92 |
Hypothetical-B | | | | | | $ 1,000 | | $ 1,022.91 | | $ 1.91 |
| Class K6 | | | | .28% | | | | | | |
| Actual | | | | | | $ 1,000 | | $ 1,039.30 | | $ 1.42 |
Hypothetical-B | | | | | | $ 1,000 | | $ 1,023.41 | | $ 1.40 |
| Class I | | | | .48% | | | | | | |
| Actual | | | | | | $ 1,000 | | $ 1,038.20 | | $ 2.43 |
Hypothetical-B | | | | | | $ 1,000 | | $ 1,022.41 | | $ 2.41 |
| Class Z6 | | | | .28% | | | | | | |
| Actual | | | | | | $ 1,000 | | $ 1,039.30 | | $ 1.42 |
Hypothetical-B | | | | | | $ 1,000 | | $ 1,023.41 | | $ 1.40 |
| |
A Annualized expense ratio reflects expenses net of applicable fee waivers.
B 5% return per year before expenses
C Expenses are equal to the annualized expense ratio, multiplied by the average account value over the period, multiplied by 181/ 365 (to reflect the one-half year period). The fees and expenses of any Underlying Funds are not included in each annualized expense ratio.
The dividend and capital gains distributions for the fund(s) are available on Fidelity.com or Institutional.Fidelity.com.
The funds hereby designate as capital gain dividend the amounts noted below for the taxable year ended July 31, 2023, or, if subsequently determined to be different, the net capital gain of such year.
| Fidelity Managed Retirement 2025 Fund | $20,606 |
| Fidelity Managed Retirement 2030 Fund | $62,862 |
| Fidelity Managed Retirement 2035 Fund | $179 |
A percentage of the dividends distributed during the fiscal year for the following funds were derived from interest on U.S. Government securities which is generally exempt from state income tax.
| Fidelity Managed Retirement Income Fund | 40.86% |
| Fidelity Managed Retirement 2010 Fund | 39.30% |
| Fidelity Managed Retirement 2015 Fund | 35.62% |
| Fidelity Managed Retirement 2020 Fund | 32.10% |
| Fidelity Managed Retirement 2025 Fund | 28.74% |
| Fidelity Managed Retirement 2030 Fund | 26.90% |
| Fidelity Managed Retirement 2035 Fund | 35.86% |
A percentage of the dividends distributed during the fiscal year for the following funds may be taken into account as a dividend for purposes of the maximum rate under section 1(h)(11) of the Internal Revenue Code.
| | Class A | Retail Class | Class K | Class K6 | Class I | Class Z6 |
| Fidelity Managed Retirement Income Fund | | | | | | |
| August 2022 | 0.00% | 0.00% | 0.00% | 0.00% | 0.00% | 0.00% |
| September 02,2022 | 12.80% | 6.69% | 5.66% | 4.75% | 6.85% | 4.91% |
| September 09,2022 | - | - | - | - | - | - |
| October 2022 | 10.43% | 10.16% | 10.06% | 9.94% | 10.16% | 9.96% |
| November 2022 | 12.57% | 10.16% | 9.60% | 8.95% | 10.16% | 8.95% |
| December 2022 | 10.44% | 10.16% | 10.02% | 9.96% | 10.18% | 9.93% |
| February 2023 | 0.61% | 0.52% | 0.47% | 0.46% | 0.52% | 0.45% |
| March 2023 | 0.68% | 0.52% | 0.46% | 0.43% | 0.52% | 0.43% |
| April 2023 | 0.63% | 0.52% | 0.48% | 0.45% | 0.52% | 0.45% |
| May 2023 | 0.57% | 0.52% | 0.50% | 0.48% | 0.50% | 0.49% |
| June 2023 | 0.59% | 0.52% | 0.49% | 0.46% | 0.51% | 0.46% |
| July 2023 | 0.60% | 0.52% | 0.49% | 0.46% | 0.52% | 0.46% |
| Fidelity Managed Retirement 2010 Fund | | | | | | |
| August 2022 | 0.00% | 0.00% | 0.00% | 0.00% | 0.00% | 0.00% |
| September 02,2022 | 10.54% | 8.03% | 7.34% | 6.75% | 8.03% | 6.75% |
| September 09,2022 | - | - | - | - | - | - |
| October 2022 | 12.37% | 12.06% | 11.96% | 11.81% | 12.06% | 11.81% |
| November 2022 | 14.75% | 12.07% | 12.07% | 10.71% | 12.07% | 10.54% |
| December 2022 | 12.40% | 12.06% | 11.87% | 11.79% | 12.05% | 11.79% |
| February 2023 | 0.45% | 0.37% | 0.33% | 0.32% | 0.37% | 0.32% |
| March 2023 | 0.48% | 0.36% | 0.34% | 0.31% | 0.36% | 0.31% |
| April 2023 | 0.44% | 0.37% | 0.34% | 0.32% | 0.37% | 0.32% |
| May 2023 | 0.41% | 0.36% | 0.35% | 0.33% | 0.36% | 0.33% |
| June 2023 | 0.44% | 0.36% | 0.34% | 0.32% | 0.37% | 0.32% |
| July 2023 | 0.42% | 0.36% | 0.34% | 0.33% | 0.37% | 0.33% |
| Fidelity Managed Retirement 2015 Fund | | | | | | |
| August 2022 | 0.00% | 0.00% | 0.00% | 0.00% | 0.00% | 0.00% |
| September 02,2022 | 15.63% | 11.82% | 10.77% | 10.31% | 11.82% | 9.89% |
| September 09,2022 | - | - | - | - | - | - |
| October 2022 | 15.79% | 15.42% | 15.29% | 15.19% | 15.42% | 15.13% |
| November 2022 | 19.23% | 15.11% | 14.76% | 12.44% | 15.11% | 12.69% |
| December 2022 | 15.74% | 15.41% | 15.22% | 15.34% | 15.40% | 15.15% |
| February 2023 | 1.26% | 0.80% | 0.66% | 0.64% | 0.82% | 0.63% |
| March 2023 | 1.19% | 0.80% | 0.72% | 0.65% | 0.80% | 0.65% |
| April 2023 | 0.99% | 0.82% | 0.77% | 0.73% | 0.82% | 0.73% |
| May 2023 | 0.95% | 0.82% | 0.77% | 0.75% | 0.85% | 0.75% |
| June 2023 | 1.00% | 0.82% | 0.76% | 0.79% | 0.82% | 0.71% |
| July 2023 | 0.97% | 0.82% | 0.78% | 0.74% | 0.82% | 0.73% |
| Fidelity Managed Retirement 2020 Fund | | | | | | |
| August 2022 | 0.00% | 0.00% | 0.00% | 0.00% | 0.00% | 0.00% |
| September 02,2022 | 18.18% | 13.85% | 12.65% | 11.64% | 14.19% | 11.64% |
| September 09,2022 | - | - | - | - | - | - |
| October 2022 | 19.09% | 18.64% | 18.52% | 18.32% | 18.64% | 18.28% |
| November 2022 | 24.89% | 18.84% | 17.87% | 15.49% | 18.34% | 16.60% |
| December 2022 | 18.94% | 18.66% | 18.38% | 18.23% | 18.64% | 18.19% |
| February 2023 | 1.13% | 0.98% | 0.81% | 0.79% | 0.98% | 0.79% |
| March 2023 | 1.37% | 0.98% | 0.86% | 0.78% | 0.95% | 0.78% |
| April 2023 | 1.18% | 0.98% | 0.90% | 0.85% | 0.98% | 0.85% |
| May 2023 | 1.12% | 0.97% | 0.91% | 0.89% | 0.97% | 0.88% |
| June 2023 | 2.94% | 0.96% | 0.89% | 0.83% | 0.96% | 0.83% |
| July 2023 | 1.43% | 0.97% | 0.90% | 0.85% | 0.96% | 0.84% |
| Fidelity Managed Retirement 2025 Fund | | | | | | |
| August 2022 | 0.00% | 0.00% | 0.00% | 0.00% | 0.00% | 0.00% |
| September 03,2022 | 22.90% | 17.32% | 15.78% | 14.49% | 17.75% | 14.49% |
| September 09,2022 | - | - | - | - | - | - |
| October 2022 | 22.91% | 22.33% | 22.09% | 21.86% | 22.33% | 21.90% |
| November 2022 | 32.42% | 22.44% | 19.45% | 17.16% | 22.44% | 17.68% |
| December 2022 | 22.94% | 22.32% | 22.05% | 21.83% | 23.40% | 21.81% |
| February 2023 | 0.73% | 0.53% | 0.40% | 0.41% | 0.60% | 0.42% |
| March 2023 | 0.86% | 0.53% | 0.40% | 0.38% | 0.51% | 0.40% |
| April 2023 | 0.66% | 0.53% | 0.46% | 0.43% | 0.45% | 0.44% |
| May 2023 | 0.63% | 0.52% | 0.50% | 0.47% | 0.52% | 0.47% |
| June 2023 | 0.70% | 0.53% | 0.41% | 0.43% | 0.64% | 0.44% |
| July 2023 | 0.66% | 0.53% | 0.56% | 0.45% | 0.55% | 0.45% |
| Fidelity Managed Retirement 2030 Fund | | | | | | |
| August 2022 | 0.00% | 0.00% | 0.00% | 0.00% | 0.00% | 0.00% |
| September 02,2022 | 29.49% | 19.66% | 16.85% | 16.85% | 19.66% | 14.75% |
| September 09,2022 | - | - | - | - | - | - |
| October 2022 | 26.02% | 25.46% | 25.19% | 24.93% | 25.46% | 24.93% |
| November 2022 | 34.07% | 25.55% | 22.71% | 20.44% | 25.55% | 20.44% |
| December 2022 | 26.39% | 25.46% | 25.16% | 25.02% | 25.46% | 25.02% |
| February 2023 | 0.00% | 0.00% | 0.00% | 0.00% | 0.00% | 0.00% |
| March 2023 | 0.00% | 0.00% | 0.00% | 0.00% | 0.00% | 0.00% |
| April 2023 | 0.00% | 0.00% | 0.00% | 0.00% | 0.00% | 0.00% |
| May 2023 | 0.00% | 0.00% | 0.00% | 0.00% | 0.00% | 0.00% |
| June 2023 | 0.00% | 0.00% | 0.00% | 0.00% | 0.00% | 0.00% |
| July 2023 | 0.00% | 0.00% | 0.00% | 0.00% | 0.00% | 0.00% |
| Fidelity Managed Retirement 2035 Fund | | | | | | |
| December 2022 | 0.00% | 0.00% | 0.00% | 0.00% | 0.00% | 0.00% |
| February 2023 | - | 3.55% | 3.55% | 2.37% | 7.10% | 2.37% |
| March 2023 | - | 2.86% | 8.57% | 4.28% | - | 4.28% |
| April 2023 | 4.82% | 3.21% | 3.21% | 2.89% | 3.21% | 2.89% |
| May 2023 | 4.27% | 3.20% | 3.20% | 2.95% | 3.49% | 2.95% |
| June 2023 | 4.69% | 3.35% | 2.93% | 2.60% | 3.35% | 2.60% |
| July 2023 | 4.44% | 3.33% | 2.96% | 2.67% | 3.33% | 2.67% |
A percentage of the dividends distributed during the fiscal year for the following funds qualify as a section 199A dividend:
| | Class A | Retail Class | Class K | Class K6 | Class I | Class Z6 |
| Fidelity Managed Retirement Income Fund | | | | | | |
| August 2022 | 0.00% | 0.00% | 0.00% | 0.00% | 0.00% | 0.00% |
| September 02,2022 | 0.26% | 0.14% | 0.12% | 0.10% | 0.14% | 0.10% |
| September 09,2022 | - | - | - | - | - | - |
| October 2022 | 0.21% | 0.20% | 0.20% | 0.20% | 0.20% | 0.20% |
| November 2022 | 0.25% | 0.20% | 0.19% | 0.18% | 0.20% | 0.18% |
| December 2022 | 0.21% | 0.20% | 0.20% | 0.20% | 0.21% | 0.20% |
| February 2023 | 0.44% | 0.37% | 0.34% | 0.33% | 0.37% | 0.32% |
| March 2023 | 0.49% | 0.37% | 0.33% | 0.30% | 0.37% | 0.30% |
| April 2023 | 0.45% | 0.37% | 0.34% | 0.32% | 0.37% | 0.32% |
| May 2023 | 0.41% | 0.37% | 0.36% | 0.35% | 0.36% | 0.35% |
| June 2023 | 0.43% | 0.37% | 0.35% | 0.33% | 0.37% | 0.33% |
| July 2023 | 0.43% | 0.37% | 0.35% | 0.33% | 0.37% | 0.33% |
| Fidelity Managed Retirement 2010 Fund | | | | | | |
| August 2022 | 0.00% | 0.00% | 0.00% | 0.00% | 0.00% | 0.00% |
| September 02,2022 | 0.00% | 0.00% | 0.00% | 0.00% | 0.00% | 0.00% |
| September 09,2022 | - | - | - | - | - | - |
| October 2022 | 0.00% | 0.00% | 0.00% | 0.00% | 0.00% | 0.00% |
| November 2022 | 0.00% | 0.00% | 0.00% | 0.00% | 0.00% | 0.00% |
| December 2022 | 0.00% | 0.00% | 0.00% | 0.00% | 0.00% | 0.00% |
| February 2023 | 1.44% | 1.17% | 1.04% | 1.02% | 1.17% | 1.02% |
| March 2023 | 1.53% | 1.16% | 1.07% | 0.99% | 1.16% | 0.99% |
| April 2023 | 1.40% | 1.16% | 1.08% | 1.02% | 1.16% | 1.02% |
| May 2023 | 1.31% | 1.16% | 1.11% | 1.07% | 1.16% | 1.07% |
| June 2023 | 1.41% | 1.16% | 1.09% | 1.03% | 1.18% | 1.03% |
| July 2023 | 1.35% | 1.16% | 1.10% | 1.05% | 1.18% | 1.05% |
| Fidelity Managed Retirement 2015 Fund | | | | | | |
| August 2022 | 0.00% | 0.00% | 0.00% | 0.00% | 0.00% | 0.00% |
| September 02,2022 | 0.00% | 0.00% | 0.00% | 0.00% | 0.00% | 0.00% |
| September 09,2022 | - | - | - | - | - | - |
| October 2022 | 0.00% | 0.00% | 0.00% | 0.00% | 0.00% | 0.00% |
| November 2022 | 0.00% | 0.00% | 0.00% | 0.00% | 0.00% | 0.00% |
| December 2022 | 0.00% | 0.00% | 0.00% | 0.00% | 0.00% | 0.00% |
| February 2023 | 2.50% | 1.59% | 1.31% | 1.28% | 1.64% | 1.25% |
| March 2023 | 2.36% | 1.60% | 1.43% | 1.30% | 1.60% | 1.30% |
| April 2023 | 1.97% | 1.63% | 1.54% | 1.45% | 1.63% | 1.45% |
| May 2023 | 1.90% | 1.64% | 1.53% | 1.49% | 1.68% | 1.49% |
| June 2023 | 1.99% | 1.62% | 1.51% | 1.57% | 1.62% | 1.41% |
| July 2023 | 1.93% | 1.63% | 1.55% | 1.47% | 1.63% | 1.45% |
| Fidelity Managed Retirement 2020 Fund | | | | | | |
| August 2022 | 0.00% | 0.00% | 0.00% | 0.00% | 0.00% | 0.00% |
| September 02,2022 | 0.00% | 0.00% | 0.00% | 0.00% | 0.00% | 0.00% |
| September 09,2022 | - | - | - | - | - | - |
| October 2022 | 0.00% | 0.00% | 0.00% | 0.00% | 0.00% | 0.00% |
| November 2022 | 0.00% | 0.00% | 0.00% | 0.00% | 0.00% | 0.00% |
| December 2022 | 0.00% | 0.00% | 0.00% | 0.00% | 0.00% | 0.00% |
| February 2023 | 3.00% | 2.25% | 1.86% | 1.80% | 2.25% | 1.80% |
| March 2023 | 3.14% | 2.25% | 1.96% | 1.79% | 2.18% | 1.79% |
| April 2023 | 2.69% | 2.23% | 2.06% | 1.94% | 2.23% | 1.94% |
| May 2023 | 2.56% | 2.22% | 2.08% | 2.03% | 2.22% | 2.01% |
| June 2023 | 6.74% | 2.20% | 2.03% | 1.89% | 2.20% | 1.89% |
| July 2023 | 3.26% | 2.23% | 2.06% | 1.95% | 2.19% | 1.92% |
| Fidelity Managed Retirement 2025 Fund | | | | | | |
| August 2022 | 0.00% | 0.00% | 0.00% | 0.00% | 0.00% | 0.00% |
| September 02,2022 | 0.00% | 0.00% | 0.00% | 0.00% | 0.00% | 0.00% |
| September 09,2022 | - | - | - | - | - | - |
| October 2022 | 0.00% | 0.00% | 0.00% | 0.00% | 0.00% | 0.00% |
| November 2022 | 0.00% | 0.00% | 0.00% | 0.00% | 0.00% | 0.00% |
| December 2022 | 0.00% | 0.00% | 0.00% | 0.00% | 0.00% | 0.00% |
| February 2023 | 4.09% | 2.95% | 2.23% | 2.30% | 3.35% | 2.38% |
| March 2023 | 4.81% | 2.96% | 2.26% | 2.14% | 2.85% | 2.26% |
| April 2023 | 3.68% | 2.95% | 2.60% | 2.43% | 2.51% | 2.47% |
| May 2023 | 3.50% | 2.94% | 2.81% | 2.63% | 2.94% | 2.63% |
| June 2023 | 3.94% | 2.96% | 2.27% | 2.41% | 3.58% | 2.46% |
| July 2023 | 3.68% | 2.94% | 3.11% | 2.53% | 3.05% | 2.53% |
| Fidelity Managed Retirement 2030 Fund | | | | | | |
| August 2022 | 0.00% | 0.00% | 0.00% | 0.00% | 0.00% | 0.00% |
| September 02,2022 | 0.00% | 0.00% | 0.00% | 0.00% | 0.00% | 0.00% |
| September 09,2022 | - | - | - | - | - | - |
| October 2022 | 0.00% | 0.00% | 0.00% | 0.00% | 0.00% | 0.00% |
| November 2022 | 0.00% | 0.00% | 0.00% | 0.00% | 0.00% | 0.00% |
| December 2022 | 0.00% | 0.00% | 0.00% | 0.00% | 0.00% | 0.00% |
| February 2023 | 4.02% | 3.21% | 2.68% | 2.30% | 3.21% | 2.68% |
| March 2023 | 5.35% | 3.21% | 2.68% | 2.29% | 3.21% | 2.29% |
| April 2023 | 4.00% | 3.20% | 2.91% | 2.66% | 3.20% | 2.91% |
| May 2023 | 3.80% | 3.21% | 2.98% | 2.61% | 3.21% | 2.79% |
| June 2023 | 4.47% | 3.20% | 3.20% | 2.80% | 3.20% | 2.80% |
| July 2023 | 4.02% | 3.22% | 2.92% | 2.68% | 3.22% | 2.47% |
| Fidelity Managed Retirement 2035 Fund | | | | | | |
| December 2022 | 0.00% | 0.00% | 0.00% | 0.00% | 0.00% | 0.00% |
| February 2023 | - | 0.52% | 0.52% | 0.35% | 1.04% | 0.35% |
| March 2023 | - | 0.42% | 1.27% | 0.63% | - | 0.63% |
| April 2023 | 0.71% | 0.48% | 0.48% | 0.43% | 0.48% | 0.43% |
| May 2023 | 0.63% | 0.47% | 0.47% | 0.44% | 0.52% | 0.44% |
| June 2023 | 0.69% | 0.50% | 0.43% | 0.39% | 0.50% | 0.39% |
| July 2023 | 0.66% | 0.49% | 0.44% | 0.39% | 0.49% | 0.39% |
The amounts per share which represent income derived from sources within, and taxes paid to, foreign countries or possessions of the United States are as follows:
| | Pay Date | Income | Taxes |
| Fidelity Managed Retirement Income Fund | | | |
| Class A | 12/30/2022 | $0.1690 | $0.0199 |
| Fidelity Managed Retirement Income | 12/30/2022 | $0.1736 | $0.0199 |
| Class K | 12/30/2022 | $0.1760 | $0.0199 |
| Class K6 | 12/30/2022 | $0.1771 | $0.0199 |
| Class I | 12/30/2022 | $0.1733 | $0.0199 |
| Class Z6 | 12/30/2022 | $0.1777 | $0.0199 |
| Fidelity Managed Retirement 2010 Fund | | | |
| Class A | 12/30/2022 | $0.1760 | $0.0206 |
| Fidelity Managed Retirement 2010 | 12/30/2022 | $0.1810 | $0.0206 |
| Class K | 12/30/2022 | $0.1838 | $0.0206 |
| Class K6 | 12/30/2022 | $0.1851 | $0.0206 |
| Class I | 12/30/2022 | $0.1812 | $0.0206 |
| Class Z6 | 12/30/2022 | $0.1851 | $0.0206 |
| Fidelity Managed Retirement 2015 Fund | | | |
| Class A | 12/30/2022 | $0.2073 | $0.0237 |
| Fidelity Managed Retirement 2015 | 12/30/2022 | $0.2116 | $0.0237 |
| Class K | 12/30/2022 | $0.2143 | $0.0237 |
| Class K6 | 12/30/2022 | $0.2126 | $0.0237 |
| Class I | 12/30/2022 | $0.2119 | $0.0237 |
| Class Z6 | 12/30/2022 | $0.2153 | $0.0237 |
| Fidelity Managed Retirement 2020 Fund | | | |
| Class A | 12/30/2022 | $0.2358 | $0.0267 |
| Fidelity Managed Retirement 2020 | 12/30/2022 | $0.2395 | $0.0267 |
| Class K | 12/30/2022 | $0.2431 | $0.0267 |
| Class K6 | 12/30/2022 | $0.2450 | $0.0267 |
| Class I | 12/30/2022 | $0.2397 | $0.0267 |
| Class Z6 | 12/30/2022 | $0.2456 | $0.0267 |
| Fidelity Managed Retirement 2025 Fund | | | |
| Class A | 12/30/2022 | $0.2724 | $0.0309 |
| Fidelity Managed Retirement 2025 | 12/30/2022 | $0.2799 | $0.0309 |
| Class K | 12/30/2022 | $0.2834 | $0.0309 |
| Class K6 | 12/30/2022 | $0.2862 | $0.0309 |
| Class I | 12/30/2022 | $0.2670 | $0.0309 |
| Class Z6 | 12/30/2022 | $0.2865 | $0.0309 |
| Fidelity Managed Retirement 2030 Fund | | | |
| Class A | 12/30/2022 | $0.0575 | $0.0066 |
| Fidelity Managed Retirement 2030 | 12/30/2022 | $0.0596 | $0.0066 |
| Class K | 12/30/2022 | $0.0603 | $0.0066 |
| Class K6 | 12/30/2022 | $0.0607 | $0.0066 |
| Class I | 12/30/2022 | $0.0596 | $0.0066 |
| Class Z6 | 12/30/2022 | $0.0607 | $0.0066 |
| Fidelity Managed Retirement 2035 Fund | | | |
| Class A | 12/30/2022 | $0.0000 | $0.0000 |
| Fidelity Managed Retirement 2035 | 12/30/2022 | $0.0000 | $0.0000 |
| Class K | 12/30/2022 | $0.0000 | $0.0000 |
| Class K6 | 12/30/2022 | $0.0000 | $0.0000 |
| Class I | 12/30/2022 | $0.0000 | $0.0000 |
| Class Z6 | 12/30/2022 | $0.0000 | $0.0000 |
The funds will notify shareholders in January 2024 of amounts for use in preparing 2023 income tax returns.
1.9881729.106
MRI-ANN-0923
Fidelity Simplicity RMD Income Fund℠
Fidelity Simplicity RMD 2010 Fund℠
Fidelity Simplicity RMD 2015 Fund℠
Fidelity Simplicity RMD 2020 Fund℠
Fidelity Simplicity RMD 2025 Fund℠
Fidelity Simplicity RMD 2030 Fund℠
Annual Report
July 31, 2023
Contents
To view a fund's proxy voting guidelines and proxy voting record for the 12-month period ended June 30, visit http://www.fidelity.com/proxyvotingresults or visit the Securities and Exchange Commission's (SEC) web site at http://www.sec.gov.
You may also call 1-800-544-8544 to request a free copy of the proxy voting guidelines.
Standard & Poor's, S&P and S&P 500 are registered service marks of The McGraw-Hill Companies, Inc. and have been licensed for use by Fidelity Distributors Corporation.
Other third-party marks appearing herein are the property of their respective owners.
All other marks appearing herein are registered or unregistered trademarks or service marks of FMR LLC or an affiliated company. © 2023 FMR LLC. All rights reserved.
This report and the financial statements contained herein are submitted for the general information of the shareholders of the Funds. This report is not authorized for distribution to prospective investors in the Funds unless preceded or accompanied by an effective prospectus.
A fund files its complete schedule of portfolio holdings with the SEC for the first and third quarters of each fiscal year on Form N-PORT. Forms N-PORT are available on the SEC's web site at http://www.sec.gov. A fund's Forms N-PORT may be reviewed and copied at the SEC's Public Reference Room in Washington, DC. Information regarding the operation of the SEC's Public Reference Room may be obtained by calling 1-800-SEC-0330.
For a complete list of a fund's portfolio holdings, view the most recent holdings listing, semiannual report, or annual report on Fidelity's web site at http://www.fidelity.com, http://www.institutional.fidelity.com, or http://www.401k.com, as applicable.
NOT FDIC INSURED •MAY LOSE VALUE •NO BANK GUARANTEE
Neither the Funds nor Fidelity Distributors Corporation is a bank.
Fidelity Simplicity RMD Income Fund℠
Average annual total return reflects the change in the value of an investment, assuming reinvestment of distributions from dividend income and capital gains (the profits earned upon the sale of securities that have grown in value, if any) and assuming a constant rate of performance each year. The hypothetical investment and the average annual total returns do not reflect the deduction of taxes that a shareholder would pay on fund distributions or the redemption of fund shares. During periods of reimbursement by Fidelity, a fund's total return will be greater than it would be had the reimbursement not occurred. How a fund did yesterday is no guarantee of how it will do tomorrow.
| Average Annual Total Returns |
| | | | |
Periods ended July 31, 2023 | Past 1 year | Past 5 years | Past 10 years |
| Fidelity Simplicity RMD Income Fund℠ | 0.84% | 2.59% | 3.68% |
| $10,000 Over 10 Years |
| |
Let's say hypothetically that $10,000 was invested in Fidelity Simplicity RMD Income Fund℠ on July 31, 2013. The chart shows how the value of your investment would have changed, and also shows how the Bloomberg U.S. Aggregate Bond Index performed over the same period. |
|
|
Fidelity Simplicity RMD 2010 Fund℠
Average annual total return reflects the change in the value of an investment, assuming reinvestment of distributions from dividend income and capital gains (the profits earned upon the sale of securities that have grown in value, if any) and assuming a constant rate of performance each year. The hypothetical investment and the average annual total returns do not reflect the deduction of taxes that a shareholder would pay on fund distributions or the redemption of fund shares. During periods of reimbursement by Fidelity, a fund's total return will be greater than it would be had the reimbursement not occurred. How a fund did yesterday is no guarantee of how it will do tomorrow.
| Average Annual Total Returns |
| | | | |
Periods ended July 31, 2023 | Past 1 year | Past 5 years | Past 10 years |
| Fidelity Simplicity RMD 2010 Fund℠ | 2.17% | 3.02% | 4.52% |
| $10,000 Over 10 Years |
| |
Let's say hypothetically that $10,000 was invested in Fidelity Simplicity RMD 2010 Fund℠ on July 31, 2013. The chart shows how the value of your investment would have changed, and also shows how the Bloomberg U.S. Aggregate Bond Index performed over the same period. |
|
|
Fidelity Simplicity RMD 2015 Fund℠
Average annual total return reflects the change in the value of an investment, assuming reinvestment of distributions from dividend income and capital gains (the profits earned upon the sale of securities that have grown in value, if any) and assuming a constant rate of performance each year. The hypothetical investment and the average annual total returns do not reflect the deduction of taxes that a shareholder would pay on fund distributions or the redemption of fund shares. During periods of reimbursement by Fidelity, a fund's total return will be greater than it would be had the reimbursement not occurred. How a fund did yesterday is no guarantee of how it will do tomorrow.
| Average Annual Total Returns |
| | | | |
Periods ended July 31, 2023 | Past 1 year | Past 5 years | Past 10 years |
| Fidelity Simplicity RMD 2015 Fund℠ | 3.32% | 3.62% | 5.06% |
| $10,000 Over 10 Years |
| |
Let's say hypothetically that $10,000 was invested in Fidelity Simplicity RMD 2015 Fund℠ on July 31, 2013. The chart shows how the value of your investment would have changed, and also shows how the Bloomberg U.S. Aggregate Bond Index performed over the same period. |
|
|
Fidelity Simplicity RMD 2020 Fund℠
Average annual total return reflects the change in the value of an investment, assuming reinvestment of distributions from dividend income and capital gains (the profits earned upon the sale of securities that have grown in value, if any) and assuming a constant rate of performance each year. The hypothetical investment and the average annual total returns do not reflect the deduction of taxes that a shareholder would pay on fund distributions or the redemption of fund shares. During periods of reimbursement by Fidelity, a fund's total return will be greater than it would be had the reimbursement not occurred. How a fund did yesterday is no guarantee of how it will do tomorrow.
| Average Annual Total Returns |
| | | | |
Periods ended July 31, 2023 | Past 1 year | Past 5 years | Past 10 years |
| Fidelity Simplicity RMD 2020 Fund℠ | 4.45% | 4.21% | 5.59% |
| $10,000 Over 10 Years |
| |
Let's say hypothetically that $10,000 was invested in Fidelity Simplicity RMD 2020 Fund℠ on July 31, 2013. The chart shows how the value of your investment would have changed, and also shows how the Bloomberg U.S. Aggregate Bond Index performed over the same period. |
|
|
Fidelity Simplicity RMD 2025 Fund℠
Average annual total return reflects the change in the value of an investment, assuming reinvestment of distributions from dividend income and capital gains (the profits earned upon the sale of securities that have grown in value, if any) and assuming a constant rate of performance each year. The hypothetical investment and the average annual total returns do not reflect the deduction of taxes that a shareholder would pay on fund distributions or the redemption of fund shares. During periods of reimbursement by Fidelity, a fund's total return will be greater than it would be had the reimbursement not occurred. How a fund did yesterday is no guarantee of how it will do tomorrow.
| Average Annual Total Returns |
| | | | |
Periods ended July 31, 2023 | Past 1 year | Life of Fund A |
| Fidelity Simplicity RMD 2025 Fund℠ | 5.63% | 5.51% |
A From August 16, 2019
| $10,000 Over Life of Fund |
| |
Let's say hypothetically that $10,000 was invested in Fidelity Simplicity RMD 2025 Fund℠ on August 16, 2019, when the fund started. The chart shows how the value of your investment would have changed, and also shows how the S&P 500® Index and Bloomberg U.S. Aggregate Bond Index performed over the same period. |
|
|
Fidelity Simplicity RMD 2030 Fund℠
Average annual total return reflects the change in the value of an investment, assuming reinvestment of distributions from dividend income and capital gains (the profits earned upon the sale of securities that have grown in value, if any) and assuming a constant rate of performance each year. The hypothetical investment and the average annual total returns do not reflect the deduction of taxes that a shareholder would pay on fund distributions or the redemption of fund shares. During periods of reimbursement by Fidelity, a fund's total return will be greater than it would be had the reimbursement not occurred. How a fund did yesterday is no guarantee of how it will do tomorrow.
Average annual total returns for Fidelity Simplicity RMD 2030 Fund℠ will be reported once the fund is a year old.
| $10,000 Over Life of Fund |
| |
Let's say hypothetically that $10,000 was invested in Fidelity Simplicity RMD 2030 Fund℠, on December 15, 2022, when the fund started. The chart shows how the value of your investment would have changed, and also shows how the S&P 500® Index performed over the same period. |
|
|
Market Recap:
For the 12 months ending July 31, 2023, continued global economic expansion, falling commodity prices and a slowing in the pace of inflation provided a favorable backdrop for risk assets. The U.S. Federal Reserve and other central banks aggressively tightened monetary policy throughout the period to combat persistently high inflation, contributing to a broad retreat from riskier assets and declining prices for stocks and bonds through September 2022. Since then, markets experienced a sharp reversal amid optimism on moderating inflation and policy easing, allowing risk assets to rally through the first seven months of 2023, with U.S. large-cap stocks leading the way.
International equities rose 13.62% for the 12 months, according to the MSCI ACWI (All Country World Index) ex USA Index. All regions gained, with Europe ex U.K. (+23%) leading the way. Japan (+16%) also outperformed, whereas Canada (+6%) lagged by the widest margin. By sector, industrials (+20%) was the top performer, followed by information technology and consumer discretionary (+18% each). Financials (+17%) also topped the broader index. Conversely, real estate (-5%) fared worst by a wide margin.
U.S. stocks gained 12.62% for the 12 months, as measured by the Dow Jones U.S. Total Stock Market Index, as all but two sectors rose. Information technology (+27%), communication services (+19%) and industrials (+18%) led. Conversely, real estate (-9%) and utilities (-6%) lagged most. Growth stocks outpaced value, while larger-caps topped small-caps. Commodities returned -7.88%, according to the Bloomberg Commodity Index Total Return.
U.S. taxable investment-grade bonds returned -3.37% for the 12 months, per the Bloomberg U.S. Aggregate Bond Index, amid elevated inflation and rising interest rates. Since March 2022, the Fed has hiked its benchmark interest rate 11 times, by 5.25 percentage points, while allowing up to billions in bonds to mature each month without investing the proceeds. Short-term U.S. Treasuries (+3.98%) topped U.S. investment-grade corporate bonds (-1.29%), while commercial mortgage-backed securities (-3.26%) and agencies (-1.30%) also lost ground. Outside the index, leveraged loans (+10.06%), U.S. high-yield bonds (+4.16%) and emerging-markets debt (+5.20%) rose, whereas Treasury Inflation-Protected Securities (-5.39%) declined.
Comments from Portfolio Managers Andrew Dierdorf and Brett Sumsion:
For the fiscal year ending July 31, 2023, returns for Fidelity Simplicity RMD FundsSM ranged from about 1% to 6%, with performance trending higher among the Funds for investors with a longer retirement horizon. Funds with more exposure to equities, and less fixed-income and short-term debt exposure, fared better than those that invest in a greater percentage of fixed-income and short-term securities and have lower allocations to equities. Each Fidelity Simplicity RMD Fund outpaced its Composite index the past 12 months due to outperformance among the underlying investment portfolios. Specifically, investments in U.S. equities notably contributed to the Funds' relative results, especially Fidelity® Series Growth Company Fund, which gained 24.95%, topping the 16.97% result of its benchmark, the Russell 3000® Growth Index. Within U.S. investment-grade bonds, Fidelity® Series Investment Grade Bond Fund returned -1.86%, finishing ahead of its benchmark, the Bloomberg U.S. Aggregate Bond Index (-3.37%). Within non-U.S. equities, an investment in Fidelity® Series Emerging Markets Opportunities Fund (+12.85%) also contributed, as the fund outperformed the 8.39% result of the MSCI Emerging Markets Index. Conversely, an investment in Fidelity® Series Overseas Fund (+14.15%) detracted from relative performance. The fund trailed the 17.05% gain of its benchmark, the MSCI EAFE Index. Overall, active asset allocation decisions held back the Funds' relative performance versus Composites this period. For example, underweighting U.S. equities − one of the better-performing asset classes − detracted value for the Funds relative to their Composite indexes.
The views expressed above reflect those of the portfolio manager(s) only through the end of the period as stated on the cover of this report and do not necessarily represent the views of Fidelity or any other person in the Fidelity organization. Any such views are subject to change at any time based upon market or other conditions and Fidelity disclaims any responsibility to update such views. These views may not be relied on as investment advice and, because investment decisions for a Fidelity fund are based on numerous factors, may not be relied on as an indication of trading intent on behalf of any Fidelity fund.
The information in the following tables is based on the direct Investments of the Fund.
Top Holdings (% of Fund's net assets) |
| |
| Fidelity Series Investment Grade Bond Fund | 41.3 | |
| Fidelity Series 0-5 Year Inflation-Protected Bond Index Fund | 20.0 | |
| Fidelity Series Government Money Market Fund 5.33% | 8.8 | |
| Fidelity Series Emerging Markets Opportunities Fund | 4.0 | |
| Fidelity Series International Developed Markets Bond Index Fund | 3.9 | |
| Fidelity Series Long-Term Treasury Bond Index Fund | 3.8 | |
| Fidelity Series International Value Fund | 1.9 | |
| Fidelity Series Overseas Fund | 1.9 | |
| Fidelity Series International Growth Fund | 1.9 | |
| Fidelity Series Short-Term Credit Fund | 1.8 | |
| | 89.3 | |
| |
Asset Allocation (% of Fund's net assets) |
|
Percentages shown as 0.0% may reflect amounts less than 0.05%. |
|
Domestic Equity Funds category includes Fidelity Series Commodity Strategy Fund which invests in commodity-related investments.
Fidelity Simplicity RMD Income Fund℠
Showing Percentage of Net Assets
| Domestic Equity Funds - 6.4% |
| | | Shares | Value ($) |
| Fidelity Series All-Sector Equity Fund (a) | | 6,668 | 71,283 |
| Fidelity Series Blue Chip Growth Fund (a) | | 13,409 | 196,979 |
| Fidelity Series Commodity Strategy Fund (a) | | 2,573 | 264,781 |
| Fidelity Series Growth Company Fund (a) | | 19,282 | 366,740 |
| Fidelity Series Intrinsic Opportunities Fund (a) | | 5,668 | 73,289 |
| Fidelity Series Large Cap Stock Fund (a) | | 17,429 | 344,741 |
| Fidelity Series Large Cap Value Index Fund (a) | | 7,202 | 107,891 |
| Fidelity Series Opportunistic Insights Fund (a) | | 12,273 | 218,577 |
| Fidelity Series Small Cap Core Fund (a) | | 61 | 658 |
| Fidelity Series Small Cap Discovery Fund (a) | | 2,742 | 31,556 |
| Fidelity Series Small Cap Opportunities Fund (a) | | 7,801 | 105,079 |
| Fidelity Series Stock Selector Large Cap Value Fund (a) | | 18,363 | 240,009 |
| Fidelity Series Value Discovery Fund (a) | | 14,023 | 215,117 |
| TOTAL DOMESTIC EQUITY FUNDS (Cost $1,922,672) | | | 2,236,700 |
| | | | |
| International Equity Funds - 11.8% |
| | | Shares | Value ($) |
| Fidelity Series Canada Fund (a) | | 16,135 | 236,535 |
| Fidelity Series Emerging Markets Fund (a) | | 36,018 | 315,154 |
| Fidelity Series Emerging Markets Opportunities Fund (a) | | 77,350 | 1,395,401 |
| Fidelity Series International Growth Fund (a) | | 40,462 | 672,075 |
| Fidelity Series International Small Cap Fund (a) | | 11,268 | 187,392 |
| Fidelity Series International Value Fund (a) | | 59,058 | 676,210 |
| Fidelity Series Overseas Fund (a) | | 52,955 | 673,053 |
| TOTAL INTERNATIONAL EQUITY FUNDS (Cost $3,684,968) | | | 4,155,820 |
| | | | |
| Bond Funds - 71.2% |
| | | Shares | Value ($) |
| Fidelity Series 0-5 Year Inflation-Protected Bond Index Fund (a) | | 740,315 | 7,018,186 |
| Fidelity Series 5+ Year Inflation-Protected Bond Index Fund (a) | | 27,197 | 214,310 |
| Fidelity Series Emerging Markets Debt Fund (a) | | 24,114 | 181,579 |
| Fidelity Series Emerging Markets Debt Local Currency Fund (a) | | 6,370 | 61,532 |
| Fidelity Series Floating Rate High Income Fund (a) | | 4,001 | 35,970 |
| Fidelity Series High Income Fund (a) | | 23,119 | 190,964 |
| Fidelity Series International Credit Fund (a) | | 1,974 | 15,198 |
| Fidelity Series International Developed Markets Bond Index Fund (a) | | 162,026 | 1,380,465 |
| Fidelity Series Investment Grade Bond Fund (a) | | 1,460,832 | 14,506,058 |
| Fidelity Series Long-Term Treasury Bond Index Fund (a) | | 229,139 | 1,345,046 |
| Fidelity Series Real Estate Income Fund (a) | | 5,173 | 50,182 |
| TOTAL BOND FUNDS (Cost $27,834,739) | | | 24,999,490 |
| | | | |
| Short-Term Funds - 10.6% |
| | | Shares | Value ($) |
| Fidelity Series Government Money Market Fund 5.33% (a)(b) | | 3,101,330 | 3,101,330 |
| Fidelity Series Short-Term Credit Fund (a) | | 66,482 | 641,551 |
| TOTAL SHORT-TERM FUNDS (Cost $3,759,347) | | | 3,742,881 |
| | | | |
| TOTAL INVESTMENT IN SECURITIES - 100.0% (Cost $37,201,726) | 35,134,891 |
NET OTHER ASSETS (LIABILITIES) - 0.0% | (464) |
| NET ASSETS - 100.0% | 35,134,427 |
| | |
Legend
| (b) | The rate quoted is the annualized seven-day yield of the fund at period end. |
Affiliated Underlying Funds
Fiscal year to date information regarding the Fund's investments in affiliated Underlying Funds is presented below. Exchanges between classes of the same affiliated Underlying Funds may occur. If an Underlying Funds changes its name, the name presented below is the name in effect at period end.
| Affiliate | Value, beginning of period ($) | Purchases ($) | Sales Proceeds ($) | Dividend Income ($) | Realized Gain (loss) ($) | Change in Unrealized appreciation (depreciation) ($) | Value, end of period ($) |
| Fidelity Series 0-5 Year Inflation-Protected Bond Index Fund | 8,094,778 | 1,178,855 | 1,785,118 | 360,711 | (63,035) | (399,367) | 7,018,186 |
| Fidelity Series 5+ Year Inflation-Protected Bond Index Fund | 40,949 | 222,262 | 40,762 | 14,024 | (2,443) | (5,696) | 214,310 |
| Fidelity Series All-Sector Equity Fund | 96,163 | 15,278 | 46,226 | 4,250 | 1,642 | 4,426 | 71,283 |
| Fidelity Series Blue Chip Growth Fund | 221,277 | 83,638 | 147,800 | 7,456 | (13,693) | 53,557 | 196,979 |
| Fidelity Series Canada Fund | 335,477 | 41,050 | 148,082 | 8,543 | 3,242 | 4,848 | 236,535 |
| Fidelity Series Commodity Strategy Fund | 609,160 | 388,949 | 373,448 | 318,108 | (170,485) | (189,395) | 264,781 |
| Fidelity Series Emerging Markets Debt Fund | 210,696 | 21,850 | 53,620 | 11,413 | (11,780) | 14,433 | 181,579 |
| Fidelity Series Emerging Markets Debt Local Currency Fund | 69,444 | 3,162 | 19,938 | - | (2,515) | 11,379 | 61,532 |
| Fidelity Series Emerging Markets Fund | 255,837 | 119,809 | 83,037 | 5,419 | (16,931) | 39,476 | 315,154 |
| Fidelity Series Emerging Markets Opportunities Fund | 2,325,027 | 130,448 | 1,200,073 | 45,370 | (208,009) | 348,008 | 1,395,401 |
| Fidelity Series Floating Rate High Income Fund | 40,337 | 5,240 | 10,172 | 3,031 | (443) | 1,008 | 35,970 |
| Fidelity Series Government Money Market Fund 5.33% | 3,008,644 | 1,149,730 | 1,057,044 | 129,356 | - | - | 3,101,330 |
| Fidelity Series Growth Company Fund | 447,520 | 120,341 | 277,712 | 2,011 | (22,497) | 99,088 | 366,740 |
| Fidelity Series High Income Fund | 219,158 | 24,780 | 47,082 | 12,691 | (5,202) | (690) | 190,964 |
| Fidelity Series International Credit Fund | 15,950 | 887 | - | 887 | - | (1,639) | 15,198 |
| Fidelity Series International Developed Markets Bond Index Fund | 1,620,441 | 162,084 | 296,553 | 31,990 | (35,853) | (69,654) | 1,380,465 |
| Fidelity Series International Growth Fund | 796,229 | 120,538 | 299,462 | 23,331 | (34,233) | 89,003 | 672,075 |
| Fidelity Series International Small Cap Fund | 215,731 | 26,406 | 57,196 | 11,283 | (11,328) | 13,779 | 187,392 |
| Fidelity Series International Value Fund | 789,401 | 119,743 | 339,350 | 22,846 | (14,332) | 120,748 | 676,210 |
| Fidelity Series Intrinsic Opportunities Fund | 298,066 | 106,683 | 258,159 | 78,690 | (8,732) | (64,569) | 73,289 |
| Fidelity Series Investment Grade Bond Fund | 15,788,656 | 2,576,010 | 2,992,603 | 552,489 | (221,978) | (644,027) | 14,506,058 |
| Fidelity Series Large Cap Stock Fund | 424,363 | 138,951 | 251,507 | 25,694 | 6,110 | 26,824 | 344,741 |
| Fidelity Series Large Cap Value Index Fund | 142,919 | 28,703 | 67,440 | 4,058 | 3,074 | 635 | 107,891 |
| Fidelity Series Long-Term Treasury Bond Index Fund | 1,787,427 | 409,463 | 625,219 | 45,015 | (156,626) | (69,999) | 1,345,046 |
| Fidelity Series Opportunistic Insights Fund | 250,821 | 83,572 | 140,234 | 9,891 | (7,279) | 31,697 | 218,577 |
| Fidelity Series Overseas Fund | 800,917 | 99,272 | 304,733 | 12,289 | (25,872) | 103,469 | 673,053 |
| Fidelity Series Real Estate Income Fund | 124,842 | 34,784 | 96,867 | 9,324 | (9,339) | (3,238) | 50,182 |
| Fidelity Series Short-Term Credit Fund | 749,457 | 41,714 | 146,406 | 15,949 | (4,377) | 1,163 | 641,551 |
| Fidelity Series Small Cap Core Fund | - | 1,023 | 416 | - | (10) | 61 | 658 |
| Fidelity Series Small Cap Discovery Fund | 45,776 | 5,094 | 20,325 | 1,892 | 869 | 142 | 31,556 |
| Fidelity Series Small Cap Opportunities Fund | 149,091 | 23,397 | 72,348 | 6,756 | (2,291) | 7,230 | 105,079 |
| Fidelity Series Stock Selector Large Cap Value Fund | 316,212 | 86,659 | 169,381 | 17,505 | 3,589 | 2,930 | 240,009 |
| Fidelity Series Value Discovery Fund | 243,747 | 97,431 | 127,967 | 10,614 | 2,651 | (745) | 215,117 |
| | 40,534,513 | 7,667,806 | 11,556,280 | 1,802,886 | (1,028,106) | (475,115) | 35,134,891 |
Amounts in the dividend income column in the above table include any capital gain distributions from underlying funds, which are presented in the corresponding line item in the Statement of Operations, if applicable.
Amounts included in the purchases and sales proceeds columns may include in-kind transactions, if applicable.
Investment Valuation
The following is a summary of the inputs used, as of July 31, 2023, involving the Fund's assets and liabilities carried at fair value. The inputs or methodology used for valuing securities may not be an indication of the risk associated with investing in those securities. For more information on valuation inputs, and their aggregation into the levels used below, please refer to the Investment Valuation section in the accompanying Notes to Financial Statements.
| Valuation Inputs at Reporting Date: |
| Description | Total ($) | Level 1 ($) | Level 2 ($) | Level 3 ($) |
Investments in Securities: | | | | |
|
| Domestic Equity Funds | 2,236,700 | 2,236,700 | - | - |
|
| International Equity Funds | 4,155,820 | 4,155,820 | - | - |
|
| Bond Funds | 24,999,490 | 24,999,490 | - | - |
|
| Short-Term Funds | 3,742,881 | 3,742,881 | - | - |
| Total Investments in Securities: | 35,134,891 | 35,134,891 | - | - |
Fidelity Simplicity RMD Income Fund℠
| Statement of Assets and Liabilities |
| | | | July 31, 2023 |
| | | | | |
| Assets | | | | |
| Investment in securities, at value - See accompanying schedule: | | | | |
Affiliated issuers (cost $37,201,726) | $ | 35,134,891 | | |
| | | | | |
| | | | | |
| Total Investment in Securities (cost $37,201,726) | | | $ | 35,134,891 |
| Cash | | | | 209 |
| Receivable for investments sold | | | | 248,991 |
Total assets | | | | 35,384,091 |
| Liabilities | | | | |
| Payable for investments purchased | $ | 235,070 | | |
| Payable for fund shares redeemed | | 1,173 | | |
| Accrued management fee | | 13,421 | | |
| Total Liabilities | | | | 249,664 |
| Net Assets | | | $ | 35,134,427 |
| Net Assets consist of: | | | | |
| Paid in capital | | | $ | 38,347,777 |
| Total accumulated earnings (loss) | | | | (3,213,350) |
| Net Assets | | | $ | 35,134,427 |
Net Asset Value, offering price and redemption price per share ($35,134,427 ÷ 647,581 shares) | | | $ | 54.25 |
| Statement of Operations |
| | | | Year ended July 31, 2023 |
| Investment Income | | | | |
| Dividends: | | | | |
| Affiliated issuers | | | $ | 1,638,255 |
| Expenses | | | | |
| Management fee | $ | 168,145 | | |
| Independent trustees' fees and expenses | | 134 | | |
| Total expenses before reductions | | 168,279 | | |
| Expense reductions | | (7) | | |
| Total expenses after reductions | | | | 168,272 |
| Net Investment income (loss) | | | | 1,469,983 |
| Realized and Unrealized Gain (Loss) | | | | |
| Net realized gain (loss) on: | | | | |
| Investment Securities: | | | | |
| Affiliated issuers | | (1,028,106) | | |
| Capital gain distributions from underlying funds: | | | | |
| Affiliated issuers | | 164,631 | | |
| Total net realized gain (loss) | | | | (863,475) |
| Change in net unrealized appreciation (depreciation) on: | | | | |
| Investment Securities: | | | | |
| Affiliated issuers | | (475,115) | | |
| Total change in net unrealized appreciation (depreciation) | | | | (475,115) |
| Net gain (loss) | | | | (1,338,590) |
| Net increase (decrease) in net assets resulting from operations | | | $ | 131,393 |
| Statement of Changes in Net Assets |
| |
| | Year ended July 31, 2023 | | Year ended July 31, 2022 |
| Increase (Decrease) in Net Assets | | | | |
| Operations | | | | |
| Net investment income (loss) | $ | 1,469,983 | $ | 1,129,170 |
| Net realized gain (loss) | | (863,475) | | 933,383 |
| Change in net unrealized appreciation (depreciation) | | (475,115) | | (5,536,828) |
| Net increase (decrease) in net assets resulting from operations | | 131,393 | | (3,474,275) |
| Distributions to shareholders | | (2,081,134) | | (2,059,213) |
| | | | | |
| Share transactions | | | | |
| Proceeds from sales of shares | | 1,555,588 | | 7,800,124 |
| Reinvestment of distributions | | 1,826,862 | | 1,830,077 |
| Cost of shares redeemed | | (6,832,236) | | (9,786,111) |
| | | | | |
Net increase (decrease) in net assets resulting from share transactions | | (3,449,786) | | (155,910) |
| Total increase (decrease) in net assets | | (5,399,527) | | (5,689,398) |
| | | | | |
| Net Assets | | | | |
| Beginning of period | | 40,533,954 | | 46,223,352 |
| End of period | $ | 35,134,427 | $ | 40,533,954 |
| | | | | |
| Other Information | | | | |
| Shares | | | | |
| Sold | | 28,765 | | 126,863 |
| Issued in reinvestment of distributions | | 34,369 | | 29,375 |
| Redeemed | | (127,752) | | (161,848) |
| Net increase (decrease) | | (64,618) | | (5,610) |
| | | | | |
| Fidelity Simplicity RMD Income Fund℠ |
| |
| Years ended July 31, | | 2023 | | 2022 | | 2021 | | 2020 | | 2019 |
Selected Per-Share Data | | | | | | | | | | |
| Net asset value, beginning of period | $ | 56.91 | $ | 64.40 | $ | 61.11 | $ | 58.52 | $ | 57.61 |
| Income from Investment Operations | | | | | | | | | | |
Net investment income (loss) A,B | | 2.156 | | 1.542 | | .572 | | .950 | | 1.164 |
| Net realized and unrealized gain (loss) | | (1.812) | | (6.196) | | 4.418 | | 3.181 | | 1.632 |
| Total from investment operations | | .344 | | (4.654) | | 4.990 | | 4.131 | | 2.796 |
| Distributions from net investment income | | (2.108) | | (1.516) | | (.562) | | (1.020) | | (1.163) |
| Distributions from net realized gain | | (.896) | | (1.320) | | (1.138) | | (.521) | | (.723) |
| Total distributions | | (3.004) | | (2.836) | | (1.700) | | (1.541) | | (1.886) |
| Net asset value, end of period | $ | 54.25 | $ | 56.91 | $ | 64.40 | $ | 61.11 | $ | 58.52 |
Total Return C | | .84% | | (7.54)% | | 8.26% | | 7.19% | | 5.03% |
Ratios to Average Net Assets B,D,E | | | | | | | | | | |
| Expenses before reductions | | .46% | | .46% | | .46% | | .46% | | .46% |
| Expenses net of fee waivers, if any | | .46% | | .46% | | .46% | | .46% | | .46% |
| Expenses net of all reductions | | .46% | | .46% | | .46% | | .46% | | .46% |
| Net investment income (loss) | | 4.02% | | 2.56% | | .91% | | 1.62% | | 2.04% |
| Supplemental Data | | | | | | | | | | |
| Net assets, end of period (000 omitted) | $ | 35,134 | $ | 40,534 | $ | 46,223 | $ | 39,908 | $ | 21,145 |
Portfolio turnover rate F | | 21% | | 59% | | 37% | | 42% G | | 38% |
ACalculated based on average shares outstanding during the period.
BNet investment income (loss) is affected by the timing of the declaration of dividends by any underlying mutual funds or exchange-traded funds (ETFs). Net investment income (loss) of any mutual funds or ETFs is not included in the Fund's net investment income (loss) ratio.
CTotal returns would have been lower if certain expenses had not been reduced during the applicable periods shown.
DFees and expenses of any underlying mutual funds or exchange-traded funds (ETFs) are not included in the Fund's expense ratio. The Fund indirectly bears its proportionate share of these expenses.
EExpense ratios reflect operating expenses of the class. Expenses before reductions do not reflect amounts reimbursed, waived, or reduced through arrangements with the investment adviser, brokerage services, or other offset arrangements, if applicable, and do not represent the amount paid by the class during periods when reimbursements, waivers or reductions occur.
FAmount does not include the portfolio activity of any underlying mutual funds or exchange-traded funds (ETFs).
GThe portfolio turnover rate does not include the assets acquired in the merger.
The information in the following tables is based on the direct Investments of the Fund.
Top Holdings (% of Fund's net assets) |
| |
| Fidelity Series Investment Grade Bond Fund | 37.1 | |
| Fidelity Series 0-5 Year Inflation-Protected Bond Index Fund | 13.5 | |
| Fidelity Series Government Money Market Fund 5.33% | 6.5 | |
| Fidelity Series Emerging Markets Opportunities Fund | 4.9 | |
| Fidelity Series Long-Term Treasury Bond Index Fund | 4.1 | |
| Fidelity Series International Developed Markets Bond Index Fund | 3.9 | |
| Fidelity Series 5+ Year Inflation-Protected Bond Index Fund | 3.7 | |
| Fidelity Series International Value Fund | 2.7 | |
| Fidelity Series Overseas Fund | 2.7 | |
| Fidelity Series International Growth Fund | 2.7 | |
| | 81.8 | |
| |
Asset Allocation (% of Fund's net assets) |
|
Percentages shown as 0.0% may reflect amounts less than 0.05%. |
|
Domestic Equity Funds category includes Fidelity Series Commodity Strategy Fund which invests in commodity-related investments.
Fidelity Simplicity RMD 2010 Fund℠
Showing Percentage of Net Assets
| Domestic Equity Funds - 12.6% |
| | | Shares | Value ($) |
| Fidelity Series All-Sector Equity Fund (a) | | 4,070 | 43,510 |
| Fidelity Series Blue Chip Growth Fund (a) | | 8,190 | 120,315 |
| Fidelity Series Commodity Strategy Fund (a) | | 747 | 76,903 |
| Fidelity Series Growth Company Fund (a) | | 11,779 | 224,043 |
| Fidelity Series Intrinsic Opportunities Fund (a) | | 3,460 | 44,738 |
| Fidelity Series Large Cap Stock Fund (a) | | 10,647 | 210,602 |
| Fidelity Series Large Cap Value Index Fund (a) | | 4,398 | 65,882 |
| Fidelity Series Opportunistic Insights Fund (a) | | 7,496 | 133,510 |
| Fidelity Series Small Cap Core Fund (a) | | 38 | 413 |
| Fidelity Series Small Cap Discovery Fund (a) | | 1,671 | 19,238 |
| Fidelity Series Small Cap Opportunities Fund (a) | | 4,764 | 64,164 |
| Fidelity Series Stock Selector Large Cap Value Fund (a) | | 11,217 | 146,606 |
| Fidelity Series Value Discovery Fund (a) | | 8,566 | 131,397 |
| TOTAL DOMESTIC EQUITY FUNDS (Cost $1,104,993) | | | 1,281,321 |
| | | | |
| International Equity Funds - 15.9% |
| | | Shares | Value ($) |
| Fidelity Series Canada Fund (a) | | 6,672 | 97,819 |
| Fidelity Series Emerging Markets Fund (a) | | 13,389 | 117,156 |
| Fidelity Series Emerging Markets Opportunities Fund (a) | | 27,549 | 496,992 |
| Fidelity Series International Growth Fund (a) | | 16,737 | 277,999 |
| Fidelity Series International Small Cap Fund (a) | | 4,667 | 77,606 |
| Fidelity Series International Value Fund (a) | | 24,429 | 279,712 |
| Fidelity Series Overseas Fund (a) | | 21,904 | 278,404 |
| TOTAL INTERNATIONAL EQUITY FUNDS (Cost $1,459,417) | | | 1,625,688 |
| | | | |
| Bond Funds - 63.8% |
| | | Shares | Value ($) |
| Fidelity Series 0-5 Year Inflation-Protected Bond Index Fund (a) | | 144,594 | 1,370,749 |
| Fidelity Series 5+ Year Inflation-Protected Bond Index Fund (a) | | 47,359 | 373,188 |
| Fidelity Series Emerging Markets Debt Fund (a) | | 7,002 | 52,727 |
| Fidelity Series Emerging Markets Debt Local Currency Fund (a) | | 1,852 | 17,887 |
| Fidelity Series Floating Rate High Income Fund (a) | | 1,151 | 10,343 |
| Fidelity Series High Income Fund (a) | | 6,717 | 55,481 |
| Fidelity Series International Credit Fund (a) | | 427 | 3,288 |
| Fidelity Series International Developed Markets Bond Index Fund (a) | | 47,155 | 401,763 |
| Fidelity Series Investment Grade Bond Fund (a) | | 381,258 | 3,785,894 |
| Fidelity Series Long-Term Treasury Bond Index Fund (a) | | 71,200 | 417,947 |
| Fidelity Series Real Estate Income Fund (a) | | 1,481 | 14,361 |
| TOTAL BOND FUNDS (Cost $7,251,506) | | | 6,503,628 |
| | | | |
| Short-Term Funds - 7.7% |
| | | Shares | Value ($) |
| Fidelity Series Government Money Market Fund 5.33% (a)(b) | | 662,457 | 662,457 |
| Fidelity Series Short-Term Credit Fund (a) | | 12,708 | 122,634 |
| TOTAL SHORT-TERM FUNDS (Cost $788,189) | | | 785,091 |
| | | | |
| TOTAL INVESTMENT IN SECURITIES - 100.0% (Cost $10,604,105) | 10,195,728 |
NET OTHER ASSETS (LIABILITIES) - 0.0% | (177) |
| NET ASSETS - 100.0% | 10,195,551 |
| | |
Legend
| (b) | The rate quoted is the annualized seven-day yield of the fund at period end. |
Affiliated Underlying Funds
Fiscal year to date information regarding the Fund's investments in affiliated Underlying Funds is presented below. Exchanges between classes of the same affiliated Underlying Funds may occur. If an Underlying Funds changes its name, the name presented below is the name in effect at period end.
| Affiliate | Value, beginning of period ($) | Purchases ($) | Sales Proceeds ($) | Dividend Income ($) | Realized Gain (loss) ($) | Change in Unrealized appreciation (depreciation) ($) | Value, end of period ($) |
| Fidelity Series 0-5 Year Inflation-Protected Bond Index Fund | 1,403,450 | 326,506 | 278,422 | 63,713 | (6,781) | (72,602) | 1,370,749 |
| Fidelity Series 5+ Year Inflation-Protected Bond Index Fund | 422,238 | 107,958 | 99,875 | 25,591 | (16,601) | (40,532) | 373,188 |
| Fidelity Series All-Sector Equity Fund | 59,213 | 6,604 | 26,118 | 2,675 | (3,669) | 7,480 | 43,510 |
| Fidelity Series Blue Chip Growth Fund | 132,935 | 42,261 | 81,418 | 4,380 | (5,713) | 32,250 | 120,315 |
| Fidelity Series Canada Fund | 139,778 | 14,533 | 60,082 | 3,494 | 725 | 2,865 | 97,819 |
| Fidelity Series Commodity Strategy Fund | 171,741 | 111,656 | 106,060 | 88,773 | (49,021) | (51,413) | 76,903 |
| Fidelity Series Emerging Markets Debt Fund | 59,494 | 6,758 | 14,359 | 3,217 | (3,106) | 3,940 | 52,727 |
| Fidelity Series Emerging Markets Debt Local Currency Fund | 19,815 | 1,045 | 5,489 | - | (814) | 3,330 | 17,887 |
| Fidelity Series Emerging Markets Fund | 88,289 | 46,737 | 26,199 | 1,828 | (4,262) | 12,591 | 117,156 |
| Fidelity Series Emerging Markets Opportunities Fund | 796,754 | 38,966 | 390,320 | 15,366 | (58,379) | 109,971 | 496,992 |
| Fidelity Series Floating Rate High Income Fund | 11,402 | 1,457 | 2,685 | 857 | (95) | 264 | 10,343 |
| Fidelity Series Government Money Market Fund 5.33% | 523,665 | 350,044 | 211,252 | 25,756 | - | - | 662,457 |
| Fidelity Series Growth Company Fund | 269,035 | 45,734 | 140,754 | 1,273 | (15,766) | 65,794 | 224,043 |
| Fidelity Series High Income Fund | 61,566 | 7,838 | 12,347 | 3,568 | (1,053) | (523) | 55,481 |
| Fidelity Series International Credit Fund | 3,451 | 192 | - | 192 | - | (355) | 3,288 |
| Fidelity Series International Developed Markets Bond Index Fund | 455,236 | 61,852 | 86,269 | 9,031 | (5,622) | (23,434) | 401,763 |
| Fidelity Series International Growth Fund | 331,753 | 39,711 | 116,314 | 9,541 | (16,197) | 39,046 | 277,999 |
| Fidelity Series International Small Cap Fund | 89,837 | 8,737 | 22,100 | 4,616 | (5,309) | 6,441 | 77,606 |
| Fidelity Series International Value Fund | 328,927 | 33,206 | 126,159 | 9,343 | (7,688) | 51,426 | 279,712 |
| Fidelity Series Intrinsic Opportunities Fund | 172,684 | 60,204 | 147,285 | 46,615 | (11,563) | (29,302) | 44,738 |
| Fidelity Series Investment Grade Bond Fund | 3,882,104 | 814,592 | 700,872 | 138,205 | (52,448) | (157,482) | 3,785,894 |
| Fidelity Series Large Cap Stock Fund | 255,107 | 61,862 | 128,584 | 15,478 | 1,039 | 21,178 | 210,602 |
| Fidelity Series Large Cap Value Index Fund | 85,932 | 10,904 | 33,354 | 2,565 | 591 | 1,809 | 65,882 |
| Fidelity Series Long-Term Treasury Bond Index Fund | 539,551 | 117,650 | 171,653 | 13,575 | (33,704) | (33,897) | 417,947 |
| Fidelity Series Opportunistic Insights Fund | 150,723 | 36,654 | 69,530 | 6,272 | (4,581) | 20,244 | 133,510 |
| Fidelity Series Overseas Fund | 333,700 | 32,819 | 120,158 | 5,025 | (13,726) | 45,769 | 278,404 |
| Fidelity Series Real Estate Income Fund | 32,013 | 5,801 | 20,344 | 2,490 | (1,957) | (1,152) | 14,361 |
| Fidelity Series Short-Term Credit Fund | 130,581 | 17,258 | 24,689 | 2,884 | (534) | 18 | 122,634 |
| Fidelity Series Small Cap Core Fund | - | 491 | 114 | - | (3) | 39 | 413 |
| Fidelity Series Small Cap Discovery Fund | 27,522 | 2,655 | 11,703 | 1,185 | (1,379) | 2,143 | 19,238 |
| Fidelity Series Small Cap Opportunities Fund | 91,352 | 10,585 | 41,551 | 3,960 | (3,419) | 7,197 | 64,164 |
| Fidelity Series Stock Selector Large Cap Value Fund | 190,122 | 35,948 | 84,189 | 11,089 | (3,539) | 8,264 | 146,606 |
| Fidelity Series Value Discovery Fund | 146,563 | 47,787 | 64,091 | 6,724 | (899) | 2,037 | 131,397 |
| | 11,406,533 | 2,507,005 | 3,424,339 | 529,281 | (325,473) | 33,404 | 10,195,728 |
Amounts in the dividend income column in the above table include any capital gain distributions from underlying funds, which are presented in the corresponding line item in the Statement of Operations, if applicable.
Amounts included in the purchases and sales proceeds columns may include in-kind transactions, if applicable.
Investment Valuation
The following is a summary of the inputs used, as of July 31, 2023, involving the Fund's assets and liabilities carried at fair value. The inputs or methodology used for valuing securities may not be an indication of the risk associated with investing in those securities. For more information on valuation inputs, and their aggregation into the levels used below, please refer to the Investment Valuation section in the accompanying Notes to Financial Statements.
| Valuation Inputs at Reporting Date: |
| Description | Total ($) | Level 1 ($) | Level 2 ($) | Level 3 ($) |
Investments in Securities: | | | | |
|
| Domestic Equity Funds | 1,281,321 | 1,281,321 | - | - |
|
| International Equity Funds | 1,625,688 | 1,625,688 | - | - |
|
| Bond Funds | 6,503,628 | 6,503,628 | - | - |
|
| Short-Term Funds | 785,091 | 785,091 | - | - |
| Total Investments in Securities: | 10,195,728 | 10,195,728 | - | - |
Fidelity Simplicity RMD 2010 Fund℠
| Statement of Assets and Liabilities |
| | | | July 31, 2023 |
| | | | | |
| Assets | | | | |
| Investment in securities, at value - See accompanying schedule: | | | | |
Affiliated issuers (cost $10,604,105) | $ | 10,195,728 | | |
| | | | | |
| | | | | |
| Total Investment in Securities (cost $10,604,105) | | | $ | 10,195,728 |
| Cash | | | | 31 |
| Receivable for investments sold | | | | 120,507 |
| Receivable for fund shares sold | | | | 155 |
Total assets | | | | 10,316,421 |
| Liabilities | | | | |
| Payable for investments purchased | $ | 112,611 | | |
| Payable for fund shares redeemed | | 4,113 | | |
| Accrued management fee | | 4,146 | | |
| Total Liabilities | | | | 120,870 |
| Net Assets | | | $ | 10,195,551 |
| Net Assets consist of: | | | | |
| Paid in capital | | | $ | 11,003,052 |
| Total accumulated earnings (loss) | | | | (807,501) |
| Net Assets | | | $ | 10,195,551 |
Net Asset Value, offering price and redemption price per share ($10,195,551 ÷ 202,354 shares) | | | $ | 50.38 |
| Statement of Operations |
| | | | Year ended July 31, 2023 |
| Investment Income | | | | |
| Dividends: | | | | |
| Affiliated issuers | | | $ | 435,868 |
| Expenses | | | | |
| Management fee | $ | 50,505 | | |
| Independent trustees' fees and expenses | | 38 | | |
| Total expenses before reductions | | 50,543 | | |
| Expense reductions | | (1) | | |
| Total expenses after reductions | | | | 50,542 |
| Net Investment income (loss) | | | | 385,326 |
| Realized and Unrealized Gain (Loss) | | | | |
| Net realized gain (loss) on: | | | | |
| Investment Securities: | | | | |
| Affiliated issuers | | (325,473) | | |
| Capital gain distributions from underlying funds: | | | | |
| Affiliated issuers | | 93,413 | | |
| Total net realized gain (loss) | | | | (232,060) |
| Change in net unrealized appreciation (depreciation) on: | | | | |
| Investment Securities: | | | | |
| Affiliated issuers | | 33,404 | | |
| Total change in net unrealized appreciation (depreciation) | | | | 33,404 |
| Net gain (loss) | | | | (198,656) |
| Net increase (decrease) in net assets resulting from operations | | | $ | 186,670 |
| Statement of Changes in Net Assets |
| |
| | Year ended July 31, 2023 | | Year ended July 31, 2022 |
| Increase (Decrease) in Net Assets | | | | |
| Operations | | | | |
| Net investment income (loss) | $ | 385,326 | $ | 345,511 |
| Net realized gain (loss) | | (232,060) | | 262,718 |
| Change in net unrealized appreciation (depreciation) | | 33,404 | | (1,841,306) |
| Net increase (decrease) in net assets resulting from operations | | 186,670 | | (1,233,077) |
| Distributions to shareholders | | (562,742) | | (663,449) |
| | | | | |
| Share transactions | | | | |
| Proceeds from sales of shares | | 411,764 | | 2,025,768 |
| Reinvestment of distributions | | 495,959 | | 591,517 |
| Cost of shares redeemed | | (1,742,440) | | (4,140,067) |
| | | | | |
Net increase (decrease) in net assets resulting from share transactions | | (834,717) | | (1,522,782) |
| Total increase (decrease) in net assets | | (1,210,789) | | (3,419,308) |
| | | | | |
| Net Assets | | | | |
| Beginning of period | | 11,406,340 | | 14,825,648 |
| End of period | $ | 10,195,551 | $ | 11,406,340 |
| | | | | |
| Other Information | | | | |
| Shares | | | | |
| Sold | | 8,330 | | 35,677 |
| Issued in reinvestment of distributions | | 10,221 | | 10,199 |
| Redeemed | | (35,173) | | (74,473) |
| Net increase (decrease) | | (16,622) | | (28,597) |
| | | | | |
| Fidelity Simplicity RMD 2010 Fund℠ |
| |
| Years ended July 31, | | 2023 | | 2022 | | 2021 | | 2020 | | 2019 |
Selected Per-Share Data | | | | | | | | | | |
| Net asset value, beginning of period | $ | 52.09 | $ | 59.88 | $ | 55.75 | $ | 53.53 | $ | 53.40 |
| Income from Investment Operations | | | | | | | | | | |
Net investment income (loss) A,B | | 1.837 | | 1.444 | | .508 | | .888 | | 1.026 |
| Net realized and unrealized gain (loss) | | (.873) | | (6.454) | | 5.365 | | 3.009 | | 1.329 |
| Total from investment operations | | .964 | | (5.010) | | 5.873 | | 3.897 | | 2.355 |
| Distributions from net investment income | | (1.808) | | (1.433) | | (.533) | | (.908) | | (1.028) |
| Distributions from net realized gain | | (.866) | | (1.347) | | (1.210) | | (.769) | | (1.197) |
| Total distributions | | (2.674) | | (2.780) | | (1.743) | | (1.677) | | (2.225) |
| Net asset value, end of period | $ | 50.38 | $ | 52.09 | $ | 59.88 | $ | 55.75 | $ | 53.53 |
Total Return C | | 2.17% | | (8.77)% | | 10.69% | | 7.44% | | 4.66% |
Ratios to Average Net Assets B,D,E | | | | | | | | | | |
| Expenses before reductions | | .49% | | .49% | | .50% | | .51% | | .52% |
| Expenses net of fee waivers, if any | | .49% | | .49% | | .50% | | .51% | | .52% |
| Expenses net of all reductions | | .49% | | .49% | | .50% | | .51% | | .52% |
| Net investment income (loss) | | 3.74% | | 2.58% | | .88% | | 1.66% | | 1.97% |
| Supplemental Data | | | | | | | | | | |
| Net assets, end of period (000 omitted) | $ | 10,196 | $ | 11,406 | $ | 14,826 | $ | 11,105 | $ | 10,548 |
Portfolio turnover rate F | | 24% | | 58% | | 32% | | 51% | | 32% |
ACalculated based on average shares outstanding during the period.
BNet investment income (loss) is affected by the timing of the declaration of dividends by any underlying mutual funds or exchange-traded funds (ETFs). Net investment income (loss) of any mutual funds or ETFs is not included in the Fund's net investment income (loss) ratio.
CTotal returns would have been lower if certain expenses had not been reduced during the applicable periods shown.
DFees and expenses of any underlying mutual funds or exchange-traded funds (ETFs) are not included in the Fund's expense ratio. The Fund indirectly bears its proportionate share of these expenses.
EExpense ratios reflect operating expenses of the class. Expenses before reductions do not reflect amounts reimbursed, waived, or reduced through arrangements with the investment adviser, brokerage services, or other offset arrangements, if applicable, and do not represent the amount paid by the class during periods when reimbursements, waivers or reductions occur.
FAmount does not include the portfolio activity of any underlying mutual funds or exchange-traded funds (ETFs).
The information in the following tables is based on the direct Investments of the Fund.
Top Holdings (% of Fund's net assets) |
| |
| Fidelity Series Investment Grade Bond Fund | 33.6 | |
| Fidelity Series 0-5 Year Inflation-Protected Bond Index Fund | 7.9 | |
| Fidelity Series 5+ Year Inflation-Protected Bond Index Fund | 6.3 | |
| Fidelity Series Emerging Markets Opportunities Fund | 5.7 | |
| Fidelity Series Long-Term Treasury Bond Index Fund | 4.3 | |
| Fidelity Series Government Money Market Fund 5.33% | 4.2 | |
| Fidelity Series International Developed Markets Bond Index Fund | 4.0 | |
| Fidelity Series International Value Fund | 3.5 | |
| Fidelity Series Overseas Fund | 3.5 | |
| Fidelity Series International Growth Fund | 3.4 | |
| | 76.4 | |
| |
Asset Allocation (% of Fund's net assets) |
|
Percentages shown as 0.0% may reflect amounts less than 0.05%. |
|
Domestic Equity Funds category includes Fidelity Series Commodity Strategy Fund which invests in commodity-related investments.
Fidelity Simplicity RMD 2015 Fund℠
Showing Percentage of Net Assets
| Domestic Equity Funds - 18.1% |
| | | Shares | Value ($) |
| Fidelity Series All-Sector Equity Fund (a) | | 13,103 | 140,072 |
| Fidelity Series Blue Chip Growth Fund (a) | | 26,370 | 387,380 |
| Fidelity Series Commodity Strategy Fund (a) | | 1,644 | 169,211 |
| Fidelity Series Growth Company Fund (a) | | 37,929 | 721,414 |
| Fidelity Series Intrinsic Opportunities Fund (a) | | 11,139 | 144,024 |
| Fidelity Series Large Cap Stock Fund (a) | | 34,284 | 678,138 |
| Fidelity Series Large Cap Value Index Fund (a) | | 14,159 | 212,109 |
| Fidelity Series Opportunistic Insights Fund (a) | | 24,138 | 429,898 |
| Fidelity Series Small Cap Core Fund (a) | | 158 | 1,712 |
| Fidelity Series Small Cap Discovery Fund (a) | | 5,378 | 61,904 |
| Fidelity Series Small Cap Opportunities Fund (a) | | 15,336 | 206,570 |
| Fidelity Series Stock Selector Large Cap Value Fund (a) | | 36,119 | 472,070 |
| Fidelity Series Value Discovery Fund (a) | | 27,580 | 423,083 |
| TOTAL DOMESTIC EQUITY FUNDS (Cost $3,474,400) | | | 4,047,585 |
| | | | |
| International Equity Funds - 19.6% |
| | | Shares | Value ($) |
| Fidelity Series Canada Fund (a) | | 18,538 | 271,760 |
| Fidelity Series Emerging Markets Fund (a) | | 33,661 | 294,538 |
| Fidelity Series Emerging Markets Opportunities Fund (a) | | 71,119 | 1,282,993 |
| Fidelity Series International Growth Fund (a) | | 46,497 | 772,323 |
| Fidelity Series International Small Cap Fund (a) | | 12,898 | 214,488 |
| Fidelity Series International Value Fund (a) | | 67,866 | 777,066 |
| Fidelity Series Overseas Fund (a) | | 60,853 | 773,447 |
| TOTAL INTERNATIONAL EQUITY FUNDS (Cost $3,905,002) | | | 4,386,615 |
| | | | |
| Bond Funds - 57.5% |
| | | Shares | Value ($) |
| Fidelity Series 0-5 Year Inflation-Protected Bond Index Fund (a) | | 185,073 | 1,754,493 |
| Fidelity Series 5+ Year Inflation-Protected Bond Index Fund (a) | | 178,054 | 1,403,066 |
| Fidelity Series Emerging Markets Debt Fund (a) | | 15,397 | 115,939 |
| Fidelity Series Emerging Markets Debt Local Currency Fund (a) | | 4,086 | 39,471 |
| Fidelity Series Floating Rate High Income Fund (a) | | 2,506 | 22,527 |
| Fidelity Series High Income Fund (a) | | 14,663 | 121,117 |
| Fidelity Series International Credit Fund (a) | | 566 | 4,356 |
| Fidelity Series International Developed Markets Bond Index Fund (a) | | 103,826 | 884,599 |
| Fidelity Series Investment Grade Bond Fund (a) | | 756,121 | 7,508,282 |
| Fidelity Series Long-Term Treasury Bond Index Fund (a) | | 165,426 | 971,051 |
| Fidelity Series Real Estate Income Fund (a) | | 3,138 | 30,434 |
| TOTAL BOND FUNDS (Cost $14,479,899) | | | 12,855,335 |
| | | | |
| Short-Term Funds - 4.8% |
| | | Shares | Value ($) |
| Fidelity Series Government Money Market Fund 5.33% (a)(b) | | 948,979 | 948,979 |
| Fidelity Series Short-Term Credit Fund (a) | | 14,044 | 135,521 |
| TOTAL SHORT-TERM FUNDS (Cost $1,086,788) | | | 1,084,500 |
| | | | |
| TOTAL INVESTMENT IN SECURITIES - 100.0% (Cost $22,946,089) | 22,374,035 |
NET OTHER ASSETS (LIABILITIES) - 0.0% | (484) |
| NET ASSETS - 100.0% | 22,373,551 |
| | |
Legend
| (b) | The rate quoted is the annualized seven-day yield of the fund at period end. |
Affiliated Underlying Funds
Fiscal year to date information regarding the Fund's investments in affiliated Underlying Funds is presented below. Exchanges between classes of the same affiliated Underlying Funds may occur. If an Underlying Funds changes its name, the name presented below is the name in effect at period end.
| Affiliate | Value, beginning of period ($) | Purchases ($) | Sales Proceeds ($) | Dividend Income ($) | Realized Gain (loss) ($) | Change in Unrealized appreciation (depreciation) ($) | Value, end of period ($) |
| Fidelity Series 0-5 Year Inflation-Protected Bond Index Fund | 1,803,857 | 544,902 | 489,499 | 82,769 | (15,691) | (87,258) | 1,754,493 |
| Fidelity Series 5+ Year Inflation-Protected Bond Index Fund | 1,702,834 | 404,909 | 471,884 | 98,083 | (79,712) | (153,081) | 1,403,066 |
| Fidelity Series All-Sector Equity Fund | 195,613 | 21,848 | 89,843 | 9,007 | (12,175) | 24,629 | 140,072 |
| Fidelity Series Blue Chip Growth Fund | 438,965 | 145,348 | 285,947 | 14,756 | (24,588) | 113,602 | 387,380 |
| Fidelity Series Canada Fund | 410,640 | 49,168 | 197,202 | 10,194 | 6,503 | 2,651 | 271,760 |
| Fidelity Series Commodity Strategy Fund | 404,602 | 282,327 | 273,643 | 215,515 | (127,610) | (116,465) | 169,211 |
| Fidelity Series Emerging Markets Debt Fund | 140,166 | 16,009 | 41,603 | 7,490 | (7,524) | 8,891 | 115,939 |
| Fidelity Series Emerging Markets Debt Local Currency Fund | 46,646 | 2,609 | 15,473 | - | (1,917) | 7,606 | 39,471 |
| Fidelity Series Emerging Markets Fund | 236,052 | 111,687 | 73,478 | 4,854 | (16,690) | 36,967 | 294,538 |
| Fidelity Series Emerging Markets Opportunities Fund | 2,130,574 | 180,518 | 1,161,591 | 40,929 | (260,131) | 393,623 | 1,282,993 |
| Fidelity Series Floating Rate High Income Fund | 26,876 | 8,303 | 12,999 | 1,972 | (587) | 934 | 22,527 |
| Fidelity Series Government Money Market Fund 5.33% | 626,134 | 781,468 | 458,623 | 37,151 | - | - | 948,979 |
| Fidelity Series Growth Company Fund | 888,543 | 154,840 | 489,998 | 4,278 | (78,722) | 246,751 | 721,414 |
| Fidelity Series High Income Fund | 145,113 | 21,494 | 41,504 | 8,318 | (4,318) | 332 | 121,117 |
| Fidelity Series International Credit Fund | 4,572 | 254 | - | 254 | - | (470) | 4,356 |
| Fidelity Series International Developed Markets Bond Index Fund | 1,070,824 | 174,640 | 290,998 | 21,323 | (30,042) | (39,825) | 884,599 |
| Fidelity Series International Growth Fund | 974,490 | 141,708 | 409,223 | 27,835 | (59,241) | 124,589 | 772,323 |
| Fidelity Series International Small Cap Fund | 264,486 | 26,721 | 79,154 | 13,465 | (20,217) | 22,652 | 214,488 |
| Fidelity Series International Value Fund | 965,986 | 100,014 | 414,016 | 27,258 | (17,929) | 143,011 | 777,066 |
| Fidelity Series Intrinsic Opportunities Fund | 562,926 | 182,548 | 462,782 | 156,486 | (48,814) | (89,854) | 144,024 |
| Fidelity Series Investment Grade Bond Fund | 8,195,651 | 1,970,840 | 2,204,722 | 289,012 | (221,499) | (231,988) | 7,508,282 |
| Fidelity Series Large Cap Stock Fund | 842,555 | 202,907 | 440,158 | 51,132 | 6,425 | 66,409 | 678,138 |
| Fidelity Series Large Cap Value Index Fund | 283,842 | 40,955 | 119,644 | 8,631 | 2,145 | 4,811 | 212,109 |
| Fidelity Series Long-Term Treasury Bond Index Fund | 1,333,213 | 304,390 | 498,083 | 33,280 | (99,292) | (69,177) | 971,051 |
| Fidelity Series Opportunistic Insights Fund | 497,805 | 122,503 | 241,830 | 21,094 | (22,641) | 74,061 | 429,898 |
| Fidelity Series Overseas Fund | 979,758 | 124,348 | 423,220 | 14,660 | (42,426) | 134,987 | 773,447 |
| Fidelity Series Real Estate Income Fund | 81,973 | 12,526 | 55,864 | 6,132 | (5,806) | (2,395) | 30,434 |
| Fidelity Series Short-Term Credit Fund | 155,926 | 34,899 | 54,538 | 3,423 | (1,150) | 384 | 135,521 |
| Fidelity Series Small Cap Core Fund | - | 1,552 | - | 1 | - | 160 | 1,712 |
| Fidelity Series Small Cap Discovery Fund | 90,903 | 11,196 | 42,405 | 3,970 | (4,970) | 7,180 | 61,904 |
| Fidelity Series Small Cap Opportunities Fund | 305,067 | 43,074 | 153,265 | 13,354 | (13,248) | 24,942 | 206,570 |
| Fidelity Series Stock Selector Large Cap Value Fund | 627,995 | 111,296 | 280,273 | 37,343 | (14,223) | 27,275 | 472,070 |
| Fidelity Series Value Discovery Fund | 484,128 | 168,465 | 231,393 | 22,643 | (3,709) | 5,592 | 423,083 |
| | 26,918,715 | 6,500,266 | 10,504,855 | 1,286,612 | (1,219,799) | 681,526 | 22,374,035 |
Amounts in the dividend income column in the above table include any capital gain distributions from underlying funds, which are presented in the corresponding line item in the Statement of Operations, if applicable.
Amounts included in the purchases and sales proceeds columns may include in-kind transactions, if applicable.
Investment Valuation
The following is a summary of the inputs used, as of July 31, 2023, involving the Fund's assets and liabilities carried at fair value. The inputs or methodology used for valuing securities may not be an indication of the risk associated with investing in those securities. For more information on valuation inputs, and their aggregation into the levels used below, please refer to the Investment Valuation section in the accompanying Notes to Financial Statements.
| Valuation Inputs at Reporting Date: |
| Description | Total ($) | Level 1 ($) | Level 2 ($) | Level 3 ($) |
Investments in Securities: | | | | |
|
| Domestic Equity Funds | 4,047,585 | 4,047,585 | - | - |
|
| International Equity Funds | 4,386,615 | 4,386,615 | - | - |
|
| Bond Funds | 12,855,335 | 12,855,335 | - | - |
|
| Short-Term Funds | 1,084,500 | 1,084,500 | - | - |
| Total Investments in Securities: | 22,374,035 | 22,374,035 | - | - |
Fidelity Simplicity RMD 2015 Fund℠
| Statement of Assets and Liabilities |
| | | | July 31, 2023 |
| | | | | |
| Assets | | | | |
| Investment in securities, at value - See accompanying schedule: | | | | |
Affiliated issuers (cost $22,946,089) | $ | 22,374,035 | | |
| | | | | |
| | | | | |
| Total Investment in Securities (cost $22,946,089) | | | $ | 22,374,035 |
| Cash | | | | 2 |
| Receivable for investments sold | | | | 290,984 |
Total assets | | | | 22,665,021 |
| Liabilities | | | | |
| Payable for investments purchased | $ | 279,043 | | |
| Payable for fund shares redeemed | | 2,636 | | |
| Accrued management fee | | 9,791 | | |
| Total Liabilities | | | | 291,470 |
| Net Assets | | | $ | 22,373,551 |
| Net Assets consist of: | | | | |
| Paid in capital | | | $ | 24,215,272 |
| Total accumulated earnings (loss) | | | | (1,841,721) |
| Net Assets | | | $ | 22,373,551 |
Net Asset Value, offering price and redemption price per share ($22,373,551 ÷ 392,961 shares) | | | $ | 56.94 |
| Statement of Operations |
| | | | Year ended July 31, 2023 |
| Investment Income | | | | |
| Dividends: | | | | |
| Affiliated issuers | | | $ | 978,292 |
| Expenses | | | | |
| Management fee | $ | 127,269 | | |
| Independent trustees' fees and expenses | | 88 | | |
| Total Expenses | | | | 127,357 |
| Net Investment income (loss) | | | | 850,935 |
| Realized and Unrealized Gain (Loss) | | | | |
| Net realized gain (loss) on: | | | | |
| Investment Securities: | | | | |
| Affiliated issuers | | (1,219,799) | | |
| Capital gain distributions from underlying funds: | | | | |
| Affiliated issuers | | 308,320 | | |
| Total net realized gain (loss) | | | | (911,479) |
| Change in net unrealized appreciation (depreciation) on: | | | | |
| Investment Securities: | | | | |
| Affiliated issuers | | 681,526 | | |
| Total change in net unrealized appreciation (depreciation) | | | | 681,526 |
| Net gain (loss) | | | | (229,953) |
| Net increase (decrease) in net assets resulting from operations | | | $ | 620,982 |
| Statement of Changes in Net Assets |
| |
| | Year ended July 31, 2023 | | Year ended July 31, 2022 |
| Increase (Decrease) in Net Assets | | | | |
| Operations | | | | |
| Net investment income (loss) | $ | 850,935 | $ | 785,008 |
| Net realized gain (loss) | | (911,479) | | 883,754 |
| Change in net unrealized appreciation (depreciation) | | 681,526 | | (4,769,552) |
| Net increase (decrease) in net assets resulting from operations | | 620,982 | | (3,100,790) |
| Distributions to shareholders | | (1,400,178) | | (1,738,925) |
| | | | | |
| Share transactions | | | | |
| Proceeds from sales of shares | | 1,485,316 | | 6,526,136 |
| Reinvestment of distributions | | 1,225,964 | | 1,595,979 |
| Cost of shares redeemed | | (6,476,135) | | (7,740,580) |
| | | | | |
Net increase (decrease) in net assets resulting from share transactions | | (3,764,855) | | 381,535 |
| Total increase (decrease) in net assets | | (4,544,051) | | (4,458,180) |
| | | | | |
| Net Assets | | | | |
| Beginning of period | | 26,917,602 | | 31,375,782 |
| End of period | $ | 22,373,551 | $ | 26,917,602 |
| | | | | |
| Other Information | | | | |
| Shares | | | | |
| Sold | | 26,943 | | 99,713 |
| Issued in reinvestment of distributions | | 22,653 | | 24,193 |
| Redeemed | | (117,741) | | (122,767) |
| Net increase (decrease) | | (68,145) | | 1,139 |
| | | | | |
| Fidelity Simplicity RMD 2015 Fund℠ |
| |
| Years ended July 31, | | 2023 | | 2022 | | 2021 | | 2020 | | 2019 |
Selected Per-Share Data | | | | | | | | | | |
| Net asset value, beginning of period | $ | 58.38 | $ | 68.21 | $ | 61.80 | $ | 59.41 | $ | 59.14 |
| Income from Investment Operations | | | | | | | | | | |
Net investment income (loss) A,B | | 1.947 | | 1.629 | | .565 | | .947 | | 1.093 |
| Net realized and unrealized gain (loss) | | (.246) | | (7.886) | | 7.894 | | 3.526 | | 1.336 |
| Total from investment operations | | 1.701 | | (6.257) | | 8.459 | | 4.473 | | 2.429 |
| Distributions from net investment income | | (1.901) | | (1.569) | | (.598) | | (.987) | | (1.092) |
| Distributions from net realized gain | | (1.240) | | (2.004) | | (1.451) | | (1.096) | | (1.067) |
| Total distributions | | (3.141) | | (3.573) | | (2.049) | | (2.083) | | (2.159) |
| Net asset value, end of period | $ | 56.94 | $ | 58.38 | $ | 68.21 | $ | 61.80 | $ | 59.41 |
Total Return C | | 3.32% | | (9.69)% | | 13.92% | | 7.71% | | 4.36% |
Ratios to Average Net Assets B,D,E | | | | | | | | | | |
| Expenses before reductions | | .53% | | .54% | | .55% | | .55% | | .57% |
| Expenses net of fee waivers, if any | | .53% | | .54% | | .55% | | .55% | | .57% |
| Expenses net of all reductions | | .53% | | .54% | | .55% | | .55% | | .57% |
| Net investment income (loss) | | 3.54% | | 2.58% | | .86% | | 1.60% | | 1.89% |
| Supplemental Data | | | | | | | | | | |
| Net assets, end of period (000 omitted) | $ | 22,374 | $ | 26,918 | $ | 31,376 | $ | 21,546 | $ | 20,922 |
Portfolio turnover rate F | | 27% | | 58% | | 30% | | 48% | | 28% |
ACalculated based on average shares outstanding during the period.
BNet investment income (loss) is affected by the timing of the declaration of dividends by any underlying mutual funds or exchange-traded funds (ETFs). Net investment income (loss) of any mutual funds or ETFs is not included in the Fund's net investment income (loss) ratio.
CTotal returns would have been lower if certain expenses had not been reduced during the applicable periods shown.
DFees and expenses of any underlying mutual funds or exchange-traded funds (ETFs) are not included in the Fund's expense ratio. The Fund indirectly bears its proportionate share of these expenses.
EExpense ratios reflect operating expenses of the class. Expenses before reductions do not reflect amounts reimbursed, waived, or reduced through arrangements with the investment adviser, brokerage services, or other offset arrangements, if applicable, and do not represent the amount paid by the class during periods when reimbursements, waivers or reductions occur.
FAmount does not include the portfolio activity of any underlying mutual funds or exchange-traded funds (ETFs).
The information in the following tables is based on the direct Investments of the Fund.
Top Holdings (% of Fund's net assets) |
| |
| Fidelity Series Investment Grade Bond Fund | 28.9 | |
| Fidelity Series 5+ Year Inflation-Protected Bond Index Fund | 8.9 | |
| Fidelity Series Emerging Markets Opportunities Fund | 6.5 | |
| Fidelity Series Long-Term Treasury Bond Index Fund | 5.0 | |
| Fidelity Series Growth Company Fund | 4.3 | |
| Fidelity Series International Value Fund | 4.2 | |
| Fidelity Series Overseas Fund | 4.2 | |
| Fidelity Series International Growth Fund | 4.2 | |
| Fidelity Series Large Cap Stock Fund | 4.0 | |
| Fidelity Series International Developed Markets Bond Index Fund | 4.0 | |
| | 74.2 | |
| |
Asset Allocation (% of Fund's net assets) |
|
Percentages shown as 0.0% may reflect amounts less than 0.05%. |
|
Domestic Equity Funds category includes Fidelity Series Commodity Strategy Fund which invests in commodity-related investments.
Fidelity Simplicity RMD 2020 Fund℠
Showing Percentage of Net Assets
| Domestic Equity Funds - 23.6% |
| | | Shares | Value ($) |
| Fidelity Series All-Sector Equity Fund (a) | | 40,622 | 434,244 |
| Fidelity Series Blue Chip Growth Fund (a) | | 81,757 | 1,201,012 |
| Fidelity Series Commodity Strategy Fund (a) | | 3,861 | 397,323 |
| Fidelity Series Growth Company Fund (a) | | 117,597 | 2,236,693 |
| Fidelity Series Intrinsic Opportunities Fund (a) | | 34,531 | 446,486 |
| Fidelity Series Large Cap Stock Fund (a) | | 106,295 | 2,102,506 |
| Fidelity Series Large Cap Value Index Fund (a) | | 43,898 | 657,597 |
| Fidelity Series Opportunistic Insights Fund (a) | | 74,837 | 1,332,855 |
| Fidelity Series Small Cap Core Fund (a) | | 424 | 4,588 |
| Fidelity Series Small Cap Discovery Fund (a) | | 16,671 | 191,883 |
| Fidelity Series Small Cap Opportunities Fund (a) | | 47,542 | 640,394 |
| Fidelity Series Stock Selector Large Cap Value Fund (a) | | 111,983 | 1,463,612 |
| Fidelity Series Value Discovery Fund (a) | | 85,510 | 1,311,726 |
| TOTAL DOMESTIC EQUITY FUNDS (Cost $10,930,494) | | | 12,420,919 |
| | | | |
| International Equity Funds - 23.3% |
| | | Shares | Value ($) |
| Fidelity Series Canada Fund (a) | | 52,735 | 773,096 |
| Fidelity Series Emerging Markets Fund (a) | | 93,276 | 816,164 |
| Fidelity Series Emerging Markets Opportunities Fund (a) | | 190,276 | 3,432,574 |
| Fidelity Series International Growth Fund (a) | | 132,304 | 2,197,576 |
| Fidelity Series International Small Cap Fund (a) | | 36,534 | 607,567 |
| Fidelity Series International Value Fund (a) | | 193,104 | 2,211,035 |
| Fidelity Series Overseas Fund (a) | | 173,153 | 2,200,770 |
| TOTAL INTERNATIONAL EQUITY FUNDS (Cost $11,094,450) | | | 12,238,782 |
| | | | |
| Bond Funds - 50.4% |
| | | Shares | Value ($) |
| Fidelity Series 0-5 Year Inflation-Protected Bond Index Fund (a) | | 122,912 | 1,165,201 |
| Fidelity Series 5+ Year Inflation-Protected Bond Index Fund (a) | | 590,889 | 4,656,207 |
| Fidelity Series Emerging Markets Debt Fund (a) | | 36,228 | 272,798 |
| Fidelity Series Emerging Markets Debt Local Currency Fund (a) | | 9,536 | 92,119 |
| Fidelity Series Floating Rate High Income Fund (a) | | 5,863 | 52,711 |
| Fidelity Series High Income Fund (a) | | 34,300 | 283,321 |
| Fidelity Series International Credit Fund (a) | | 1,308 | 10,068 |
| Fidelity Series International Developed Markets Bond Index Fund (a) | | 243,857 | 2,077,665 |
| Fidelity Series Investment Grade Bond Fund (a) | | 1,528,114 | 15,174,171 |
| Fidelity Series Long-Term Treasury Bond Index Fund (a) | | 446,819 | 2,622,826 |
| Fidelity Series Real Estate Income Fund (a) | | 7,588 | 73,607 |
| TOTAL BOND FUNDS (Cost $30,085,090) | | | 26,480,694 |
| | | | |
| Short-Term Funds - 2.7% |
| | | Shares | Value ($) |
| Fidelity Series Government Money Market Fund 5.33% (a)(b) | | 1,333,176 | 1,333,176 |
| Fidelity Series Short-Term Credit Fund (a) | | 6,929 | 66,864 |
| TOTAL SHORT-TERM FUNDS (Cost $1,401,244) | | | 1,400,040 |
| | | | |
| TOTAL INVESTMENT IN SECURITIES - 100.0% (Cost $53,511,278) | 52,540,435 |
NET OTHER ASSETS (LIABILITIES) - 0.0% | (1,051) |
| NET ASSETS - 100.0% | 52,539,384 |
| | |
Legend
| (b) | The rate quoted is the annualized seven-day yield of the fund at period end. |
Affiliated Underlying Funds
Fiscal year to date information regarding the Fund's investments in affiliated Underlying Funds is presented below. Exchanges between classes of the same affiliated Underlying Funds may occur. If an Underlying Funds changes its name, the name presented below is the name in effect at period end.
| Affiliate | Value, beginning of period ($) | Purchases ($) | Sales Proceeds ($) | Dividend Income ($) | Realized Gain (loss) ($) | Change in Unrealized appreciation (depreciation) ($) | Value, end of period ($) |
| Fidelity Series 0-5 Year Inflation-Protected Bond Index Fund | 627,050 | 736,836 | 158,988 | 36,854 | (2,878) | (36,010) | 1,165,201 |
| Fidelity Series 5+ Year Inflation-Protected Bond Index Fund | 5,202,740 | 1,287,449 | 1,119,166 | 294,797 | (179,213) | (535,603) | 4,656,207 |
| Fidelity Series All-Sector Equity Fund | 546,976 | 63,793 | 213,557 | 25,531 | (46,392) | 83,424 | 434,244 |
| Fidelity Series Blue Chip Growth Fund | 1,227,195 | 425,076 | 708,466 | 41,262 | (87,919) | 345,126 | 1,201,012 |
| Fidelity Series Canada Fund | 1,066,585 | 149,799 | 470,286 | 26,673 | 10,286 | 16,712 | 773,096 |
| Fidelity Series Commodity Strategy Fund | 877,329 | 611,567 | 565,635 | 465,832 | (271,845) | (254,093) | 397,323 |
| Fidelity Series Emerging Markets Debt Fund | 303,956 | 38,976 | 73,523 | 16,231 | (12,544) | 15,933 | 272,798 |
| Fidelity Series Emerging Markets Debt Local Currency Fund | 101,211 | 7,479 | 28,902 | - | (4,259) | 16,590 | 92,119 |
| Fidelity Series Emerging Markets Fund | 573,728 | 368,158 | 186,264 | 11,836 | (41,474) | 102,016 | 816,164 |
| Fidelity Series Emerging Markets Opportunities Fund | 5,177,815 | 355,009 | 2,433,913 | 100,071 | (621,457) | 955,120 | 3,432,574 |
| Fidelity Series Floating Rate High Income Fund | 58,277 | 27,864 | 34,198 | 4,234 | (1,834) | 2,602 | 52,711 |
| Fidelity Series Government Money Market Fund 5.33% | 362,121 | 1,620,866 | 649,811 | 44,417 | - | - | 1,333,176 |
| Fidelity Series Growth Company Fund | 2,484,256 | 471,773 | 1,201,141 | 12,150 | (217,293) | 699,098 | 2,236,693 |
| Fidelity Series High Income Fund | 314,647 | 54,425 | 77,051 | 18,027 | (7,363) | (1,337) | 283,321 |
| Fidelity Series International Credit Fund | 10,567 | 587 | - | 587 | - | (1,086) | 10,068 |
| Fidelity Series International Developed Markets Bond Index Fund | 2,316,678 | 462,210 | 549,066 | 45,552 | (47,246) | (104,911) | 2,077,665 |
| Fidelity Series International Growth Fund | 2,531,624 | 391,395 | 894,428 | 72,828 | (155,031) | 324,016 | 2,197,576 |
| Fidelity Series International Small Cap Fund | 687,059 | 73,646 | 158,729 | 35,225 | (51,894) | 57,485 | 607,567 |
| Fidelity Series International Value Fund | 2,510,416 | 294,954 | 925,014 | 71,315 | (52,818) | 383,497 | 2,211,035 |
| Fidelity Series Intrinsic Opportunities Fund | 1,567,418 | 482,846 | 1,216,038 | 438,855 | (132,261) | (255,479) | 446,486 |
| Fidelity Series Investment Grade Bond Fund | 15,049,798 | 4,374,271 | 3,410,720 | 534,731 | (297,168) | (542,010) | 15,174,171 |
| Fidelity Series Large Cap Stock Fund | 2,355,875 | 578,237 | 1,048,244 | 143,638 | (6,284) | 222,922 | 2,102,506 |
| Fidelity Series Large Cap Value Index Fund | 793,629 | 115,156 | 274,670 | 24,519 | (613) | 24,095 | 657,597 |
| Fidelity Series Long-Term Treasury Bond Index Fund | 3,262,420 | 806,930 | 1,025,530 | 81,897 | (240,411) | (180,583) | 2,622,826 |
| Fidelity Series Opportunistic Insights Fund | 1,391,594 | 362,350 | 570,979 | 60,067 | (60,924) | 210,814 | 1,332,855 |
| Fidelity Series Overseas Fund | 2,546,099 | 358,210 | 945,469 | 38,355 | (130,860) | 372,790 | 2,200,770 |
| Fidelity Series Real Estate Income Fund | 182,145 | 24,856 | 116,193 | 13,278 | (12,128) | (5,073) | 73,607 |
| Fidelity Series Short-Term Credit Fund | 90,087 | 18,908 | 41,604 | 1,806 | (714) | 187 | 66,864 |
| Fidelity Series Small Cap Core Fund | - | 4,159 | - | 3 | - | 429 | 4,588 |
| Fidelity Series Small Cap Discovery Fund | 254,178 | 33,741 | 104,185 | 11,289 | (14,343) | 22,492 | 191,883 |
| Fidelity Series Small Cap Opportunities Fund | 853,502 | 118,659 | 369,764 | 37,308 | (34,004) | 72,001 | 640,394 |
| Fidelity Series Stock Selector Large Cap Value Fund | 1,755,837 | 319,025 | 655,892 | 106,160 | (36,984) | 81,626 | 1,463,612 |
| Fidelity Series Value Discovery Fund | 1,353,615 | 502,520 | 553,508 | 64,367 | (5,622) | 14,721 | 1,311,726 |
| | 58,436,427 | 15,541,730 | 20,780,934 | 2,879,695 | (2,763,490) | 2,107,511 | 52,540,435 |
Amounts in the dividend income column in the above table include any capital gain distributions from underlying funds, which are presented in the corresponding line item in the Statement of Operations, if applicable.
Amounts included in the purchases and sales proceeds columns may include in-kind transactions, if applicable.
Investment Valuation
The following is a summary of the inputs used, as of July 31, 2023, involving the Fund's assets and liabilities carried at fair value. The inputs or methodology used for valuing securities may not be an indication of the risk associated with investing in those securities. For more information on valuation inputs, and their aggregation into the levels used below, please refer to the Investment Valuation section in the accompanying Notes to Financial Statements.
| Valuation Inputs at Reporting Date: |
| Description | Total ($) | Level 1 ($) | Level 2 ($) | Level 3 ($) |
Investments in Securities: | | | | |
|
| Domestic Equity Funds | 12,420,919 | 12,420,919 | - | - |
|
| International Equity Funds | 12,238,782 | 12,238,782 | - | - |
|
| Bond Funds | 26,480,694 | 26,480,694 | - | - |
|
| Short-Term Funds | 1,400,040 | 1,400,040 | - | - |
| Total Investments in Securities: | 52,540,435 | 52,540,435 | - | - |
Fidelity Simplicity RMD 2020 Fund℠
| Statement of Assets and Liabilities |
| | | | July 31, 2023 |
| | | | | |
| Assets | | | | |
| Investment in securities, at value - See accompanying schedule: | | | | |
Affiliated issuers (cost $53,511,278) | $ | 52,540,435 | | |
| | | | | |
| | | | | |
| Total Investment in Securities (cost $53,511,278) | | | $ | 52,540,435 |
| Cash | | | | 187 |
| Receivable for investments sold | | | | 688,397 |
| Receivable for fund shares sold | | | | 103 |
Total assets | | | | 53,229,122 |
| Liabilities | | | | |
| Payable for investments purchased | $ | 660,207 | | |
| Payable for fund shares redeemed | | 4,764 | | |
| Accrued management fee | | 24,767 | | |
| Total Liabilities | | | | 689,738 |
| Net Assets | | | $ | 52,539,384 |
| Net Assets consist of: | | | | |
| Paid in capital | | | $ | 56,401,149 |
| Total accumulated earnings (loss) | | | | (3,861,765) |
| Net Assets | | | $ | 52,539,384 |
Net Asset Value, offering price and redemption price per share ($52,539,384 ÷ 896,423 shares) | | | $ | 58.61 |
| Statement of Operations |
| | | | Year ended July 31, 2023 |
| Investment Income | | | | |
| Dividends: | | | | |
| Affiliated issuers | | | $ | 2,019,461 |
| Expenses | | | | |
| Management fee | $ | 296,648 | | |
| Independent trustees' fees and expenses | | 190 | | |
| Total expenses before reductions | | 296,838 | | |
| Expense reductions | | (6) | | |
| Total expenses after reductions | | | | 296,832 |
| Net Investment income (loss) | | | | 1,722,629 |
| Realized and Unrealized Gain (Loss) | | | | |
| Net realized gain (loss) on: | | | | |
| Investment Securities: | | | | |
| Affiliated issuers | | (2,763,490) | | |
| Capital gain distributions from underlying funds: | | | | |
| Affiliated issuers | | 860,234 | | |
| Total net realized gain (loss) | | | | (1,903,256) |
| Change in net unrealized appreciation (depreciation) on: | | | | |
| Investment Securities: | | | | |
| Affiliated issuers | | 2,107,511 | | |
| Total change in net unrealized appreciation (depreciation) | | | | 2,107,511 |
| Net gain (loss) | | | | 204,255 |
| Net increase (decrease) in net assets resulting from operations | | | $ | 1,926,884 |
| Statement of Changes in Net Assets |
| |
| | Year ended July 31, 2023 | | Year ended July 31, 2022 |
| Increase (Decrease) in Net Assets | | | | |
| Operations | | | | |
| Net investment income (loss) | $ | 1,722,629 | $ | 1,681,186 |
| Net realized gain (loss) | | (1,903,256) | | 2,511,654 |
| Change in net unrealized appreciation (depreciation) | | 2,107,511 | | (11,882,740) |
| Net increase (decrease) in net assets resulting from operations | | 1,926,884 | | (7,689,900) |
| Distributions to shareholders | | (3,243,749) | | (4,086,853) |
| | | | | |
| Share transactions | | | | |
| Proceeds from sales of shares | | 3,392,453 | | 16,359,796 |
| Reinvestment of distributions | | 3,036,491 | | 3,771,778 |
| Cost of shares redeemed | | (11,007,930) | | (17,530,600) |
| | | | | |
Net increase (decrease) in net assets resulting from share transactions | | (4,578,986) | | 2,600,974 |
| Total increase (decrease) in net assets | | (5,895,851) | | (9,175,779) |
| | | | | |
| Net Assets | | | | |
| Beginning of period | | 58,435,235 | | 67,611,014 |
| End of period | $ | 52,539,384 | $ | 58,435,235 |
| | | | | |
| Other Information | | | | |
| Shares | | | | |
| Sold | | 60,470 | | 241,238 |
| Issued in reinvestment of distributions | | 55,248 | | 55,153 |
| Redeemed | | (198,222) | | (272,603) |
| Net increase (decrease) | | (82,504) | | 23,788 |
| | | | | |
| Fidelity Simplicity RMD 2020 Fund℠ |
| |
| Years ended July 31, | | 2023 | | 2022 | | 2021 | | 2020 | | 2019 |
Selected Per-Share Data | | | | | | | | | | |
| Net asset value, beginning of period | $ | 59.69 | $ | 70.79 | $ | 62.18 | $ | 59.88 | $ | 59.80 |
| Income from Investment Operations | | | | | | | | | | |
Net investment income (loss) A,B | | 1.853 | | 1.637 | | .586 | | .930 | | 1.031 |
| Net realized and unrealized gain (loss) | | .496 | | (8.714) | | 9.999 | | 3.672 | | 1.221 |
| Total from investment operations | | 2.349 | | (7.077) | | 10.585 | | 4.602 | | 2.252 |
| Distributions from net investment income | | (1.819) | | (1.614) | | (.617) | | (.966) | | (1.061) |
| Distributions from net realized gain | | (1.610) | | (2.409) | | (1.358) | | (1.336) | | (1.111) |
| Total distributions | | (3.429) | | (4.023) | | (1.975) | | (2.302) | | (2.172) |
| Net asset value, end of period | $ | 58.61 | $ | 59.69 | $ | 70.79 | $ | 62.18 | $ | 59.88 |
Total Return C | | 4.45% | | (10.63)% | | 17.29% | | 7.88% | | 4.04% |
Ratios to Average Net Assets B,D,E | | | | | | | | | | |
| Expenses before reductions | | .57% | | .58% | | .59% | | .60% | | .61% |
| Expenses net of fee waivers, if any | | .57% | | .58% | | .59% | | .60% | | .61% |
| Expenses net of all reductions | | .57% | | .58% | | .59% | | .60% | | .61% |
| Net investment income (loss) | | 3.31% | | 2.51% | | .87% | | 1.57% | | 1.78% |
| Supplemental Data | | | | | | | | | | |
| Net assets, end of period (000 omitted) | $ | 52,539 | $ | 58,435 | $ | 67,611 | $ | 49,365 | $ | 43,005 |
Portfolio turnover rate F | | 30% | | 62% | | 34% | | 48% | | 29% |
ACalculated based on average shares outstanding during the period.
BNet investment income (loss) is affected by the timing of the declaration of dividends by any underlying mutual funds or exchange-traded funds (ETFs). Net investment income (loss) of any mutual funds or ETFs is not included in the Fund's net investment income (loss) ratio.
CTotal returns would have been lower if certain expenses had not been reduced during the applicable periods shown.
DFees and expenses of any underlying mutual funds or exchange-traded funds (ETFs) are not included in the Fund's expense ratio. The Fund indirectly bears its proportionate share of these expenses.
EExpense ratios reflect operating expenses of the class. Expenses before reductions do not reflect amounts reimbursed, waived, or reduced through arrangements with the investment adviser, brokerage services, or other offset arrangements, if applicable, and do not represent the amount paid by the class during periods when reimbursements, waivers or reductions occur.
FAmount does not include the portfolio activity of any underlying mutual funds or exchange-traded funds (ETFs).
The information in the following tables is based on the direct Investments of the Fund.
Top Holdings (% of Fund's net assets) |
| |
| Fidelity Series Investment Grade Bond Fund | 25.3 | |
| Fidelity Series 5+ Year Inflation-Protected Bond Index Fund | 8.5 | |
| Fidelity Series Emerging Markets Opportunities Fund | 7.2 | |
| Fidelity Series Long-Term Treasury Bond Index Fund | 5.5 | |
| Fidelity Series Growth Company Fund | 5.1 | |
| Fidelity Series International Value Fund | 4.8 | |
| Fidelity Series Large Cap Stock Fund | 4.7 | |
| Fidelity Series Overseas Fund | 4.7 | |
| Fidelity Series International Growth Fund | 4.7 | |
| Fidelity Series International Developed Markets Bond Index Fund | 3.9 | |
| | 74.4 | |
| |
Asset Allocation (% of Fund's net assets) |
|
Percentages shown as 0.0% may reflect amounts less than 0.05%. |
|
Domestic Equity Funds category includes Fidelity Series Commodity Strategy Fund which invests in commodity-related investments.
Fidelity Simplicity RMD 2025 Fund℠
Showing Percentage of Net Assets
| Domestic Equity Funds - 27.9% |
| | | Shares | Value ($) |
| Fidelity Series All-Sector Equity Fund (a) | | 10,238 | 109,440 |
| Fidelity Series Blue Chip Growth Fund (a) | | 20,605 | 302,681 |
| Fidelity Series Commodity Strategy Fund (a) | | 821 | 84,462 |
| Fidelity Series Growth Company Fund (a) | | 29,637 | 563,700 |
| Fidelity Series Intrinsic Opportunities Fund (a) | | 8,703 | 112,526 |
| Fidelity Series Large Cap Stock Fund (a) | | 26,789 | 529,879 |
| Fidelity Series Large Cap Value Index Fund (a) | | 11,064 | 165,731 |
| Fidelity Series Opportunistic Insights Fund (a) | | 18,861 | 335,916 |
| Fidelity Series Small Cap Core Fund (a) | | 98 | 1,060 |
| Fidelity Series Small Cap Discovery Fund (a) | | 4,201 | 48,357 |
| Fidelity Series Small Cap Opportunities Fund (a) | | 11,981 | 161,389 |
| Fidelity Series Stock Selector Large Cap Value Fund (a) | | 28,223 | 368,872 |
| Fidelity Series Value Discovery Fund (a) | | 21,551 | 330,588 |
| TOTAL DOMESTIC EQUITY FUNDS (Cost $2,867,258) | | | 3,114,601 |
| | | | |
| International Equity Funds - 26.1% |
| | | Shares | Value ($) |
| Fidelity Series Canada Fund (a) | | 12,688 | 186,008 |
| Fidelity Series Emerging Markets Fund (a) | | 21,600 | 188,998 |
| Fidelity Series Emerging Markets Opportunities Fund (a) | | 44,478 | 802,391 |
| Fidelity Series International Growth Fund (a) | | 31,836 | 528,793 |
| Fidelity Series International Small Cap Fund (a) | | 8,747 | 145,466 |
| Fidelity Series International Value Fund (a) | | 46,464 | 532,013 |
| Fidelity Series Overseas Fund (a) | | 41,665 | 529,558 |
| TOTAL INTERNATIONAL EQUITY FUNDS (Cost $2,776,735) | | | 2,913,227 |
| | | | |
| Bond Funds - 44.6% |
| | | Shares | Value ($) |
| Fidelity Series 5+ Year Inflation-Protected Bond Index Fund (a) | | 119,842 | 944,353 |
| Fidelity Series Emerging Markets Debt Fund (a) | | 7,711 | 58,061 |
| Fidelity Series Emerging Markets Debt Local Currency Fund (a) | | 2,013 | 19,445 |
| Fidelity Series Floating Rate High Income Fund (a) | | 1,245 | 11,196 |
| Fidelity Series High Income Fund (a) | | 7,282 | 60,152 |
| Fidelity Series International Credit Fund (a) | | 353 | 2,720 |
| Fidelity Series International Developed Markets Bond Index Fund (a) | | 50,690 | 431,880 |
| Fidelity Series Investment Grade Bond Fund (a) | | 284,825 | 2,828,311 |
| Fidelity Series Long-Term Treasury Bond Index Fund (a) | | 103,865 | 609,688 |
| Fidelity Series Real Estate Income Fund (a) | | 1,611 | 15,623 |
| TOTAL BOND FUNDS (Cost $5,717,633) | | | 4,981,429 |
| | | | |
| Short-Term Funds - 1.4% |
| | | Shares | Value ($) |
| Fidelity Series Government Money Market Fund 5.33% (a)(b) | | 145,790 | 145,790 |
| Fidelity Series Short-Term Credit Fund (a) | | 418 | 4,034 |
| TOTAL SHORT-TERM FUNDS (Cost $149,774) | | | 149,824 |
| | | | |
| TOTAL INVESTMENT IN SECURITIES - 100.0% (Cost $11,511,400) | 11,159,081 |
NET OTHER ASSETS (LIABILITIES) - 0.0% | (281) |
| NET ASSETS - 100.0% | 11,158,800 |
| | |
Legend
| (b) | The rate quoted is the annualized seven-day yield of the fund at period end. |
Affiliated Underlying Funds
Fiscal year to date information regarding the Fund's investments in affiliated Underlying Funds is presented below. Exchanges between classes of the same affiliated Underlying Funds may occur. If an Underlying Funds changes its name, the name presented below is the name in effect at period end.
| Affiliate | Value, beginning of period ($) | Purchases ($) | Sales Proceeds ($) | Dividend Income ($) | Realized Gain (loss) ($) | Change in Unrealized appreciation (depreciation) ($) | Value, end of period ($) |
| Fidelity Series 5+ Year Inflation-Protected Bond Index Fund | 779,438 | 420,237 | 143,543 | 51,068 | (11,302) | (100,477) | 944,353 |
| Fidelity Series All-Sector Equity Fund | 118,129 | 27,696 | 46,793 | 6,054 | (6,470) | 16,878 | 109,440 |
| Fidelity Series Blue Chip Growth Fund | 264,971 | 132,777 | 164,656 | 9,063 | (15,824) | 85,413 | 302,681 |
| Fidelity Series Canada Fund | 222,220 | 58,275 | 102,989 | 6,027 | (709) | 9,211 | 186,008 |
| Fidelity Series Commodity Strategy Fund | 163,734 | 128,400 | 108,583 | 87,576 | (50,766) | (48,323) | 84,462 |
| Fidelity Series Emerging Markets Debt Fund | 56,737 | 15,511 | 15,097 | 3,273 | (1,982) | 2,892 | 58,061 |
| Fidelity Series Emerging Markets Debt Local Currency Fund | 18,918 | 3,931 | 6,004 | - | (434) | 3,034 | 19,445 |
| Fidelity Series Emerging Markets Fund | 115,194 | 98,511 | 38,808 | 2,573 | (3,990) | 18,091 | 188,998 |
| Fidelity Series Emerging Markets Opportunities Fund | 1,039,199 | 189,595 | 513,169 | 21,759 | (101,710) | 188,476 | 802,391 |
| Fidelity Series Floating Rate High Income Fund | 10,870 | 7,204 | 7,038 | 853 | (220) | 380 | 11,196 |
| Fidelity Series Government Money Market Fund 5.33% | - | 269,340 | 123,550 | 4,980 | - | - | 145,790 |
| Fidelity Series Growth Company Fund | 536,464 | 174,771 | 273,376 | 2,870 | (25,167) | 151,008 | 563,700 |
| Fidelity Series High Income Fund | 58,689 | 18,828 | 15,845 | 3,642 | (850) | (670) | 60,152 |
| Fidelity Series International Credit Fund | 2,855 | 158 | - | 159 | - | (293) | 2,720 |
| Fidelity Series International Developed Markets Bond Index Fund | 422,550 | 131,879 | 94,633 | 9,196 | (6,034) | (21,882) | 431,880 |
| Fidelity Series International Growth Fund | 527,448 | 152,142 | 196,634 | 16,505 | (21,101) | 66,938 | 528,793 |
| Fidelity Series International Small Cap Fund | 143,102 | 31,964 | 32,538 | 7,955 | (6,298) | 9,236 | 145,466 |
| Fidelity Series International Value Fund | 523,044 | 130,780 | 201,320 | 16,110 | (8,280) | 87,789 | 532,013 |
| Fidelity Series Intrinsic Opportunities Fund | 337,872 | 120,258 | 260,902 | 98,438 | (22,819) | (61,883) | 112,526 |
| Fidelity Series Investment Grade Bond Fund | 2,444,056 | 1,079,349 | 561,646 | 94,719 | (23,427) | (110,021) | 2,828,311 |
| Fidelity Series Large Cap Stock Fund | 508,741 | 195,942 | 234,655 | 31,333 | (4,043) | 63,894 | 529,879 |
| Fidelity Series Large Cap Value Index Fund | 171,391 | 48,176 | 60,593 | 5,799 | (2,367) | 9,124 | 165,731 |
| Fidelity Series Long-Term Treasury Bond Index Fund | 663,856 | 261,058 | 229,246 | 18,039 | (26,915) | (59,065) | 609,688 |
| Fidelity Series Opportunistic Insights Fund | 300,481 | 124,953 | 129,730 | 14,170 | (4,246) | 44,458 | 335,916 |
| Fidelity Series Overseas Fund | 530,449 | 141,707 | 204,635 | 8,664 | (12,723) | 74,760 | 529,558 |
| Fidelity Series Real Estate Income Fund | 33,185 | 10,987 | 25,298 | 2,583 | (1,987) | (1,264) | 15,623 |
| Fidelity Series Short-Term Credit Fund | - | 3,983 | - | 66 | - | 51 | 4,034 |
| Fidelity Series Small Cap Core Fund | - | 962 | 1 | 1 | - | 99 | 1,060 |
| Fidelity Series Small Cap Discovery Fund | 54,890 | 14,510 | 23,734 | 2,665 | (3,690) | 6,381 | 48,357 |
| Fidelity Series Small Cap Opportunities Fund | 184,410 | 51,078 | 85,475 | 8,218 | (5,480) | 16,856 | 161,389 |
| Fidelity Series Stock Selector Large Cap Value Fund | 379,199 | 121,649 | 145,389 | 25,098 | (7,261) | 20,674 | 368,872 |
| Fidelity Series Value Discovery Fund | 292,341 | 151,096 | 116,306 | 15,220 | (3,388) | 6,845 | 330,588 |
| | 10,904,433 | 4,317,707 | 4,162,186 | 574,676 | (379,483) | 478,610 | 11,159,081 |
Amounts in the dividend income column in the above table include any capital gain distributions from underlying funds, which are presented in the corresponding line item in the Statement of Operations, if applicable.
Amounts included in the purchases and sales proceeds columns may include in-kind transactions, if applicable.
Investment Valuation
The following is a summary of the inputs used, as of July 31, 2023, involving the Fund's assets and liabilities carried at fair value. The inputs or methodology used for valuing securities may not be an indication of the risk associated with investing in those securities. For more information on valuation inputs, and their aggregation into the levels used below, please refer to the Investment Valuation section in the accompanying Notes to Financial Statements.
| Valuation Inputs at Reporting Date: |
| Description | Total ($) | Level 1 ($) | Level 2 ($) | Level 3 ($) |
Investments in Securities: | | | | |
|
| Domestic Equity Funds | 3,114,601 | 3,114,601 | - | - |
|
| International Equity Funds | 2,913,227 | 2,913,227 | - | - |
|
| Bond Funds | 4,981,429 | 4,981,429 | - | - |
|
| Short-Term Funds | 149,824 | 149,824 | - | - |
| Total Investments in Securities: | 11,159,081 | 11,159,081 | - | - |
Fidelity Simplicity RMD 2025 Fund℠
| Statement of Assets and Liabilities |
| | | | July 31, 2023 |
| | | | | |
| Assets | | | | |
| Investment in securities, at value - See accompanying schedule: | | | | |
Affiliated issuers (cost $11,511,400) | $ | 11,159,081 | | |
| | | | | |
| | | | | |
| Total Investment in Securities (cost $11,511,400) | | | $ | 11,159,081 |
| Receivable for investments sold | | | | 127,713 |
| Receivable for fund shares sold | | | | 15,000 |
Total assets | | | | 11,301,794 |
| Liabilities | | | | |
| Payable for investments purchased | $ | 137,415 | | |
| Accrued management fee | | 5,579 | | |
| Total Liabilities | | | | 142,994 |
| Net Assets | | | $ | 11,158,800 |
| Net Assets consist of: | | | | |
| Paid in capital | | | $ | 12,088,955 |
| Total accumulated earnings (loss) | | | | (930,155) |
| Net Assets | | | $ | 11,158,800 |
Net Asset Value, offering price and redemption price per share ($11,158,800 ÷ 1,063,154 shares) | | | $ | 10.50 |
| Statement of Operations |
| | | | Year ended July 31, 2023 |
| Investment Income | | | | |
| Dividends: | | | | |
| Affiliated issuers | | | $ | 380,667 |
| Expenses | | | | |
| Management fee | $ | 64,182 | | |
| Independent trustees' fees and expenses | | 38 | | |
| Total Expenses | | | | 64,220 |
| Net Investment income (loss) | | | | 316,447 |
| Realized and Unrealized Gain (Loss) | | | | |
| Net realized gain (loss) on: | | | | |
| Investment Securities: | | | | |
| Affiliated issuers | | (379,483) | | |
| Capital gain distributions from underlying funds: | | | | |
| Affiliated issuers | | 194,009 | | |
| Total net realized gain (loss) | | | | (185,474) |
| Change in net unrealized appreciation (depreciation) on: | | | | |
| Investment Securities: | | | | |
| Affiliated issuers | | 478,610 | | |
| Total change in net unrealized appreciation (depreciation) | | | | 478,610 |
| Net gain (loss) | | | | 293,136 |
| Net increase (decrease) in net assets resulting from operations | | | $ | 609,583 |
| Statement of Changes in Net Assets |
| |
| | Year ended July 31, 2023 | | Year ended July 31, 2022 |
| Increase (Decrease) in Net Assets | | | | |
| Operations | | | | |
| Net investment income (loss) | $ | 316,447 | $ | 274,958 |
| Net realized gain (loss) | | (185,474) | | 242,545 |
| Change in net unrealized appreciation (depreciation) | | 478,610 | | (2,094,819) |
| Net increase (decrease) in net assets resulting from operations | | 609,583 | | (1,577,316) |
| Distributions to shareholders | | (551,378) | | (733,824) |
| | | | | |
| Share transactions | | | | |
| Proceeds from sales of shares | | 2,145,106 | | 6,604,735 |
| Reinvestment of distributions | | 530,200 | | 719,705 |
| Cost of shares redeemed | | (2,478,871) | | (5,508,059) |
| | | | | |
Net increase (decrease) in net assets resulting from share transactions | | 196,435 | | 1,816,381 |
| Total increase (decrease) in net assets | | 254,640 | | (494,759) |
| | | | | |
| Net Assets | | | | |
| Beginning of period | | 10,904,160 | | 11,398,919 |
| End of period | $ | 11,158,800 | $ | 10,904,160 |
| | | | | |
| Other Information | | | | |
| Shares | | | | |
| Sold | | 222,343 | | 554,677 |
| Issued in reinvestment of distributions | | 54,701 | | 59,330 |
| Redeemed | | (252,694) | | (482,095) |
| Net increase (decrease) | | 24,350 | | 131,912 |
| | | | | |
| Fidelity Simplicity RMD 2025 Fund℠ |
| |
| Years ended July 31, | | 2023 | | 2022 | | 2021 | | 2020 A |
Selected Per-Share Data | | | | | | | | |
| Net asset value, beginning of period | $ | 10.50 | $ | 12.57 | $ | 10.77 | $ | 10.00 |
| Income from Investment Operations | | | | | | | | |
Net investment income (loss) B,C | | .299 | | .269 | | .088 | | .118 |
| Net realized and unrealized gain (loss) | | .236 | | (1.561) | | 2.054 | | .822 |
| Total from investment operations | | .535 | | (1.292) | | 2.142 | | .940 |
| Distributions from net investment income | | (.301) | | (.283) | | (.106) | | (.134) |
| Distributions from net realized gain | | (.234) | | (.495) | | (.236) | | (.036) |
| Total distributions | | (.535) | | (.778) | | (.342) | | (.170) |
| Net asset value, end of period | $ | 10.50 | $ | 10.50 | $ | 12.57 | $ | 10.77 |
Total Return D | | 5.63% | | (11.01)% | | 20.21% | | 9.45% |
Ratios to Average Net Assets C,E,F | | | | | | | | |
| Expenses before reductions | | .61% | | .62% | | .63% | | .64% G |
| Expenses net of fee waivers, if any | | .61% | | .62% | | .63% | | .64% G |
| Expenses net of all reductions | | .61% | | .62% | | .63% | | .64% G |
| Net investment income (loss) | | 3.01% | | 2.35% | | .74% | | 1.21% G |
| Supplemental Data | | | | | | | | |
| Net assets, end of period (000 omitted) | $ | 11,159 | $ | 10,904 | $ | 11,399 | $ | 5,676 |
Portfolio turnover rate H | | 40% | | 79% | | 66% | | 54% G |
AFor the period August 16, 2019 (commencement of operations) through July 31, 2020.
BCalculated based on average shares outstanding during the period.
CNet investment income (loss) is affected by the timing of the declaration of dividends by any underlying mutual funds or exchange-traded funds (ETFs). Net investment income (loss) of any mutual funds or ETFs is not included in the Fund's net investment income (loss) ratio.
DTotal returns for periods of less than one year are not annualized.
EFees and expenses of any underlying mutual funds or exchange-traded funds (ETFs) are not included in the Fund's expense ratio. The Fund indirectly bears its proportionate share of these expenses.
FExpense ratios reflect operating expenses of the class. Expenses before reductions do not reflect amounts reimbursed, waived, or reduced through arrangements with the investment adviser, brokerage services, or other offset arrangements, if applicable, and do not represent the amount paid by the class during periods when reimbursements, waivers or reductions occur.
GAnnualized.
HAmount does not include the portfolio activity of any underlying mutual funds or exchange-traded funds (ETFs).
The information in the following tables is based on the direct Investments of the Fund.
Top Holdings (% of Fund's net assets) |
| |
| Fidelity Series Investment Grade Bond Fund | 22.6 | |
| Fidelity Series Emerging Markets Opportunities Fund | 7.7 | |
| Fidelity Series Long-Term Treasury Bond Index Fund | 5.9 | |
| Fidelity Series Growth Company Fund | 5.8 | |
| Fidelity Series Large Cap Stock Fund | 5.4 | |
| Fidelity Series International Value Fund | 5.3 | |
| Fidelity Series Overseas Fund | 5.3 | |
| Fidelity Series International Growth Fund | 5.3 | |
| Fidelity Series 5+ Year Inflation-Protected Bond Index Fund | 4.3 | |
| Fidelity Series International Developed Markets Bond Index Fund | 3.9 | |
| | 71.5 | |
| |
Asset Allocation (% of Fund's net assets) |
|
Percentages shown as 0.0% may reflect amounts less than 0.05%. |
|
Domestic Equity Funds category includes Fidelity Series Commodity Strategy Fund which invests in commodity-related investments.
Fidelity Simplicity RMD 2030 Fund℠
Showing Percentage of Net Assets
| Domestic Equity Funds - 31.9% |
| | | Shares | Value ($) |
| Fidelity Series All-Sector Equity Fund (a) | | 686 | 7,332 |
| Fidelity Series Blue Chip Growth Fund (a) | | 1,380 | 20,277 |
| Fidelity Series Commodity Strategy Fund (a) | | 48 | 4,959 |
| Fidelity Series Growth Company Fund (a) | | 1,985 | 37,763 |
| Fidelity Series Intrinsic Opportunities Fund (a) | | 583 | 7,538 |
| Fidelity Series Large Cap Stock Fund (a) | | 1,795 | 35,497 |
| Fidelity Series Large Cap Value Index Fund (a) | | 741 | 11,103 |
| Fidelity Series Opportunistic Insights Fund (a) | | 1,264 | 22,503 |
| Fidelity Series Small Cap Core Fund (a) | | 7 | 77 |
| Fidelity Series Small Cap Discovery Fund (a) | | 281 | 3,240 |
| Fidelity Series Small Cap Opportunities Fund (a) | | 803 | 10,812 |
| Fidelity Series Stock Selector Large Cap Value Fund (a) | | 1,891 | 24,711 |
| Fidelity Series Value Discovery Fund (a) | | 1,444 | 22,146 |
| TOTAL DOMESTIC EQUITY FUNDS (Cost $183,515) | | | 207,958 |
| | | | |
| International Equity Funds - 28.7% |
| | | Shares | Value ($) |
| Fidelity Series Canada Fund (a) | | 824 | 12,082 |
| Fidelity Series Emerging Markets Fund (a) | | 1,439 | 12,590 |
| Fidelity Series Emerging Markets Opportunities Fund (a) | | 2,785 | 50,240 |
| Fidelity Series International Growth Fund (a) | | 2,067 | 34,327 |
| Fidelity Series International Small Cap Fund (a) | | 565 | 9,389 |
| Fidelity Series International Value Fund (a) | | 3,017 | 34,547 |
| Fidelity Series Overseas Fund (a) | | 2,706 | 34,388 |
| TOTAL INTERNATIONAL EQUITY FUNDS (Cost $173,654) | | | 187,563 |
| | | | |
| Bond Funds - 38.1% |
| | | Shares | Value ($) |
| Fidelity Series 5+ Year Inflation-Protected Bond Index Fund (a) | | 3,555 | 28,016 |
| Fidelity Series Emerging Markets Debt Fund (a) | | 449 | 3,380 |
| Fidelity Series Emerging Markets Debt Local Currency Fund (a) | | 117 | 1,132 |
| Fidelity Series Floating Rate High Income Fund (a) | | 73 | 655 |
| Fidelity Series High Income Fund (a) | | 426 | 3,519 |
| Fidelity Series International Developed Markets Bond Index Fund (a) | | 2,969 | 25,297 |
| Fidelity Series Investment Grade Bond Fund (a) | | 14,832 | 147,280 |
| Fidelity Series Long-Term Treasury Bond Index Fund (a) | | 6,534 | 38,354 |
| Fidelity Series Real Estate Income Fund (a) | | 92 | 897 |
| TOTAL BOND FUNDS (Cost $252,040) | | | 248,530 |
| | | | |
| Short-Term Funds - 1.3% |
| | | Shares | Value ($) |
| Fidelity Series Government Money Market Fund 5.33% (a)(b) | | 8,111 | 8,111 |
| Fidelity Series Short-Term Credit Fund (a) | | 68 | 654 |
| TOTAL SHORT-TERM FUNDS (Cost $8,761) | | | 8,765 |
| | | | |
| TOTAL INVESTMENT IN SECURITIES - 100.0% (Cost $617,970) | 652,816 |
NET OTHER ASSETS (LIABILITIES) - 0.0% | (6) |
| NET ASSETS - 100.0% | 652,810 |
| | |
Legend
| (b) | The rate quoted is the annualized seven-day yield of the fund at period end. |
Affiliated Central Funds
Fiscal year to date information regarding the Fund's investments in Fidelity Central Funds, including the ownership percentage, is presented below.
| Affiliate | Value, beginning of period ($) | Purchases ($) | Sales Proceeds ($) | Dividend Income ($) | Realized Gain (loss) ($) | Change in Unrealized appreciation (depreciation) ($) | Value, end of period ($) | % ownership, end of period |
| Fidelity Cash Central Fund 5.32% | - | 100,000 | 100,000 | 12 | - | - | - | 0.0% |
| Total | - | 100,000 | 100,000 | 12 | - | - | - | |
| | | | | | | | | |
Amounts in the dividend income column in the above table include any capital gain distributions from underlying funds, which are presented in the corresponding line item in the Statement of Operations, if applicable.
Amounts included in the purchases and sales proceeds columns may include in-kind transactions, if applicable.
Affiliated Underlying Funds
Fiscal year to date information regarding the Fund's investments in affiliated Underlying Funds is presented below. Exchanges between classes of the same affiliated Underlying Funds may occur. If an Underlying Funds changes its name, the name presented below is the name in effect at period end.
| Affiliate | Value, beginning of period ($) | Purchases ($) | Sales Proceeds ($) | Dividend Income ($) | Realized Gain (loss) ($) | Change in Unrealized appreciation (depreciation) ($) | Value, end of period ($) |
| Fidelity Series 5+ Year Inflation-Protected Bond Index Fund | - | 28,943 | 837 | 7 | (23) | (67) | 28,016 |
| Fidelity Series All-Sector Equity Fund | - | 7,309 | 915 | 44 | 29 | 909 | 7,332 |
| Fidelity Series Blue Chip Growth Fund | - | 19,850 | 4,793 | - | 471 | 4,749 | 20,277 |
| Fidelity Series Canada Fund | - | 13,818 | 2,382 | - | 2 | 644 | 12,082 |
| Fidelity Series Commodity Strategy Fund | - | 5,461 | 562 | - | (12) | 72 | 4,959 |
| Fidelity Series Emerging Markets Debt Fund | - | 3,504 | 167 | 91 | (5) | 48 | 3,380 |
| Fidelity Series Emerging Markets Debt Local Currency Fund | - | 1,094 | 52 | - | - | 90 | 1,132 |
| Fidelity Series Emerging Markets Fund | - | 13,013 | 1,375 | - | (5) | 957 | 12,590 |
| Fidelity Series Emerging Markets Opportunities Fund | - | 54,771 | 8,670 | - | 72 | 4,067 | 50,240 |
| Fidelity Series Floating Rate High Income Fund | - | 681 | 32 | 26 | - | 6 | 655 |
| Fidelity Series Government Money Market Fund 5.33% | - | 12,581 | 4,470 | 165 | - | - | 8,111 |
| Fidelity Series Growth Company Fund | - | 36,929 | 7,403 | - | 594 | 7,643 | 37,763 |
| Fidelity Series High Income Fund | - | 3,668 | 169 | 95 | (3) | 23 | 3,519 |
| Fidelity Series International Developed Markets Bond Index Fund | - | 27,145 | 1,658 | 386 | (19) | (171) | 25,297 |
| Fidelity Series International Growth Fund | - | 35,286 | 3,458 | - | 19 | 2,480 | 34,327 |
| Fidelity Series International Small Cap Fund | - | 9,433 | 523 | - | (2) | 481 | 9,389 |
| Fidelity Series International Value Fund | - | 35,390 | 3,435 | - | (2) | 2,594 | 34,547 |
| Fidelity Series Intrinsic Opportunities Fund | - | 9,576 | 2,476 | - | (19) | 457 | 7,538 |
| Fidelity Series Investment Grade Bond Fund | - | 155,862 | 6,604 | 2,531 | (124) | (1,854) | 147,280 |
| Fidelity Series Large Cap Stock Fund | - | 35,994 | 4,386 | - | 93 | 3,796 | 35,497 |
| Fidelity Series Large Cap Value Index Fund | - | 11,507 | 933 | 21 | (8) | 537 | 11,103 |
| Fidelity Series Long-Term Treasury Bond Index Fund | - | 45,394 | 5,330 | 532 | (140) | (1,570) | 38,354 |
| Fidelity Series Opportunistic Insights Fund | - | 22,143 | 3,027 | - | 120 | 3,267 | 22,503 |
| Fidelity Series Overseas Fund | - | 35,112 | 3,415 | - | 6 | 2,685 | 34,388 |
| Fidelity Series Real Estate Income Fund | - | 1,330 | 415 | 25 | (6) | (12) | 897 |
| Fidelity Series Short-Term Credit Fund | - | 1,621 | 971 | 11 | 1 | 3 | 654 |
| Fidelity Series Small Cap Core Fund | - | 70 | - | - | - | 7 | 77 |
| Fidelity Series Small Cap Discovery Fund | - | 3,476 | 448 | 7 | (8) | 220 | 3,240 |
| Fidelity Series Small Cap Opportunities Fund | - | 11,453 | 1,403 | - | (4) | 766 | 10,812 |
| Fidelity Series Stock Selector Large Cap Value Fund | - | 25,863 | 2,487 | 76 | (12) | 1,347 | 24,711 |
| Fidelity Series Value Discovery Fund | - | 23,580 | 2,083 | 49 | (23) | 672 | 22,146 |
| | - | 691,857 | 74,879 | 4,066 | 992 | 34,846 | 652,816 |
Amounts in the dividend income column in the above table include any capital gain distributions from underlying funds, which are presented in the corresponding line item in the Statement of Operations, if applicable.
Amounts included in the purchases and sales proceeds columns may include in-kind transactions, if applicable.
Investment Valuation
The following is a summary of the inputs used, as of July 31, 2023, involving the Fund's assets and liabilities carried at fair value. The inputs or methodology used for valuing securities may not be an indication of the risk associated with investing in those securities. For more information on valuation inputs, and their aggregation into the levels used below, please refer to the Investment Valuation section in the accompanying Notes to Financial Statements.
| Valuation Inputs at Reporting Date: |
| Description | Total ($) | Level 1 ($) | Level 2 ($) | Level 3 ($) |
Investments in Securities: | | | | |
|
| Domestic Equity Funds | 207,958 | 207,958 | - | - |
|
| International Equity Funds | 187,563 | 187,563 | - | - |
|
| Bond Funds | 248,530 | 248,530 | - | - |
|
| Short-Term Funds | 8,765 | 8,765 | - | - |
| Total Investments in Securities: | 652,816 | 652,816 | - | - |
Fidelity Simplicity RMD 2030 Fund℠
| Statement of Assets and Liabilities |
| | | | July 31, 2023 |
| | | | | |
| Assets | | | | |
| Investment in securities, at value - See accompanying schedule: | | | | |
Affiliated issuers (cost $617,970) | $ | 652,816 | | |
| | | | | |
| | | | | |
| Total Investment in Securities (cost $617,970) | | | $ | 652,816 |
| Cash | | | | 12 |
| Receivable for investments sold | | | | 7,876 |
Total assets | | | | 660,704 |
| Liabilities | | | | |
| Payable for investments purchased | $ | 7,540 | | |
| Accrued management fee | | 354 | | |
| Total Liabilities | | | | 7,894 |
| Net Assets | | | $ | 652,810 |
| Net Assets consist of: | | | | |
| Paid in capital | | | $ | 616,324 |
| Total accumulated earnings (loss) | | | | 36,486 |
| Net Assets | | | $ | 652,810 |
Net Asset Value, offering price and redemption price per share ($652,810 ÷ 59,449 shares) | | | $ | 10.98 |
| Statement of Operations |
| | | | For the period December 15, 2022 (commencement of operations) through July 31, 2023 |
| Investment Income | | | | |
| Dividends: | | | | |
| Affiliated issuers | | | $ | 3,917 |
| Income from Fidelity Central Funds | | | | 12 |
| Total Income | | | | 3,929 |
| Expenses | | | | |
| Management fee | $ | 1,943 | | |
| Independent trustees' fees and expenses | | 1 | | |
| Total Expenses | | | | 1,944 |
| Net Investment income (loss) | | | | 1,985 |
| Realized and Unrealized Gain (Loss) | | | | |
| Net realized gain (loss) on: | | | | |
| Investment Securities: | | | | |
| Affiliated issuers | | 992 | | |
| Capital gain distributions from underlying funds: | | | | |
| Affiliated issuers | | 149 | | |
| Total net realized gain (loss) | | | | 1,141 |
| Change in net unrealized appreciation (depreciation) on: | | | | |
| Investment Securities: | | | | |
| Affiliated issuers | | 34,846 | | |
| Total change in net unrealized appreciation (depreciation) | | | | 34,846 |
| Net gain (loss) | | | | 35,987 |
| Net increase (decrease) in net assets resulting from operations | | | $ | 37,972 |
| Statement of Changes in Net Assets |
| |
| | For the period December 15, 2022 (commencement of operations) through July 31, 2023 |
| Increase (Decrease) in Net Assets | | |
| Operations | | |
| Net investment income (loss) | $ | 1,985 |
| Net realized gain (loss) | | 1,141 |
| Change in net unrealized appreciation (depreciation) | | 34,846 |
| Net increase (decrease) in net assets resulting from operations | | 37,972 |
| Distributions to shareholders | | (1,486) |
| | | |
| Share transactions | | |
| Proceeds from sales of shares | | 636,085 |
| Reinvestment of distributions | | 1,379 |
| Cost of shares redeemed | | (21,140) |
| | | |
Net increase (decrease) in net assets resulting from share transactions | | 616,324 |
| Total increase (decrease) in net assets | | 652,810 |
| | | |
| Net Assets | | |
| Beginning of period | | - |
| End of period | $ | 652,810 |
| | | |
| Other Information | | |
| Shares | | |
| Sold | | 61,367 |
| Issued in reinvestment of distributions | | 132 |
| Redeemed | | (2,050) |
| Net increase (decrease) | | 59,449 |
| | | |
| Fidelity Simplicity RMD 2030 Fund℠ |
| |
| Years ended July 31, | | 2023 A |
Selected Per-Share Data | | |
| Net asset value, beginning of period | $ | 10.00 |
| Income from Investment Operations | | |
Net investment income (loss) B,C | | .044 |
| Net realized and unrealized gain (loss) | | .967 |
| Total from investment operations | | 1.011 |
| Distributions from net investment income | | (.031) |
| Total distributions | | (.031) |
| Net asset value, end of period | $ | 10.98 |
Total Return D | | 10.13% |
Ratios to Average Net Assets C,E,F | | |
| Expenses before reductions | | .66% G |
| Expenses net of fee waivers, if any | | .66% G |
| Expenses net of all reductions | | .66% G |
| Net investment income (loss) | | .67% G |
| Supplemental Data | | |
| Net assets, end of period (000 omitted) | $ | 653 |
Portfolio turnover rate H | | 25% G |
AFor the period December 15, 2022 (commencement of operations) through July 31, 2023.
BCalculated based on average shares outstanding during the period.
CNet investment income (loss) is affected by the timing of the declaration of dividends by any underlying mutual funds or exchange-traded funds (ETFs). Net investment income (loss) of any mutual funds or ETFs is not included in the Fund's net investment income (loss) ratio.
DTotal returns for periods of less than one year are not annualized.
EFees and expenses of any underlying mutual funds or exchange-traded funds (ETFs) are not included in the Fund's expense ratio. The Fund indirectly bears its proportionate share of these expenses. For additional expense information related to investments in Fidelity Central Funds, please refer to the "Investments in Fidelity Central Funds" note found in the Notes to Financial Statements section of the most recent Annual or Semi-Annual report.
FExpense ratios reflect operating expenses of the class. Expenses before reductions do not reflect amounts reimbursed, waived, or reduced through arrangements with the investment adviser, brokerage services, or other offset arrangements, if applicable, and do not represent the amount paid by the class during periods when reimbursements, waivers or reductions occur.
GAnnualized.
HAmount does not include the portfolio activity of any underlying mutual funds or exchange-traded funds (ETFs).
For the period ended July 31, 2023
1. Organization.
Fidelity Simplicity RMD Income Fund, Fidelity Simplicity RMD 2010 Fund, Fidelity Simplicity RMD 2015 Fund, Fidelity Simplicity RMD 2020 Fund, Fidelity Simplicity RMD 2025 Fund and Fidelity Simplicity RMD 2030 Fund (the Funds) are funds of Fidelity Income Fund (the Trust). The Trust is registered under the Investment Company Act of 1940, as amended (the 1940 Act), as an open-end management investment company organized as a Massachusetts business trust. Each Fund is authorized to issue an unlimited number of shares.
2. Investments in Fidelity Central Funds.
Funds may invest in Fidelity Central Funds, which are open-end investment companies generally available only to other investment companies and accounts managed by the investment adviser and its affiliates. The Schedule of Investments lists any Fidelity Central Funds held as an investment as of period end, but does not include the underlying holdings of each Fidelity Central Fund. An investing fund indirectly bears its proportionate share of the expenses of the underlying Fidelity Central Funds.
Based on its investment objective, each Fidelity Central Fund may invest or participate in various investment vehicles or strategies that are similar to those of the investing fund. These strategies are consistent with the investment objectives of the investing fund and may involve certain economic risks which may cause a decline in value of each of the Fidelity Central Funds and thus a decline in the value of the investing fund.
| Fidelity Central Fund | Investment Manager | Investment Objective | Investment Practices | Expense RatioA |
| Fidelity Money Market Central Funds | Fidelity Management & Research Company LLC (FMR) | Each fund seeks to obtain a high level of current income consistent with the preservation of capital and liquidity. | Short-term Investments | Less than .005% |
A Expenses expressed as a percentage of average net assets and are as of each underlying Central Fund's most recent annual or semi-annual shareholder report.
A complete unaudited list of holdings for each Fidelity Central Fund is available upon request or at the Securities and Exchange Commission website at www.sec.gov. In addition, the financial statements of the Fidelity Central Funds which contain the significant accounting policies (including investment valuation policies) of those funds, and are not covered by the Report of Independent Registered Public Accounting Firm, are available on the Securities and Exchange Commission website or upon request.
3. Significant Accounting Policies.
Each Fund is an investment company and applies the accounting and reporting guidance of the Financial Accounting Standards Board (FASB) Accounting Standards Codification Topic 946 Financial Services - Investment Companies. The financial statements have been prepared in conformity with accounting principles generally accepted in the United States of America (GAAP), which require management to make certain estimates and assumptions at the date of the financial statements. Actual results could differ from those estimates. Subsequent events, if any, through the date that the financial statements were issued have been evaluated in the preparation of the financial statements. Each Fund's Schedule of Investments lists any underlying mutual funds or exchange-traded funds (ETFs) but does not include the underlying holdings of these funds. The following summarizes the significant accounting policies of each Fund:
Investment Valuation. Investments are valued as of 4:00 p.m. Eastern time on the last calendar day of the period. Each Fund categorizes the inputs to valuation techniques used to value its investments into a disclosure hierarchy consisting of three levels as shown below:
Level 1 - unadjusted quoted prices in active markets for identical investments
Level 2 - other significant observable inputs (including quoted prices for similar investments, interest rates, prepayment speeds, etc.)
Level 3 - unobservable inputs (including the Fund's own assumptions based on the best information available)
Valuation techniques used to value each Fund's investments by major category are as follows. Investments in open-end mutual funds are valued at their closing net asset value (NAV) each business day and are categorized as Level 1 in the hierarchy. The aggregate value of investments by input level as of July 31, 2023 is included at the end of each Fund's Schedule of Investments.
Investment Transactions and Income. For financial reporting purposes, the Funds' investment holdings and NAV include trades executed through the end of the last business day of the period. The NAV per share for processing shareholder transactions is calculated as of the close of business of the New York Stock Exchange (NYSE), normally 4:00 p.m. Eastern time and includes trades executed through the end of the prior business day. Gains and losses on securities sold are determined on the basis of identified cost. Income and capital gain distributions from any underlying mutual funds or exchange-traded funds (ETFs) are recorded on the ex-dividend date. Distributions from any underlying mutual funds or exchange-traded funds (ETFs) that are deemed to be return of capital are recorded as a reduction of cost of investments.
Expenses. Expenses directly attributable to a fund are charged to that fund. Expenses attributable to more than one fund are allocated among the respective funds on the basis of relative net assets or other appropriate methods. Expenses included in the accompanying financial statements reflect the expenses of that fund and do not include any expenses associated with any underlying mutual funds or exchange-traded funds. Although not included in a fund's expenses, a fund indirectly bears its proportionate share of these expenses through the net asset value of each underlying mutual fund or exchange-traded fund. Expense estimates are accrued in the period to which they relate and adjustments are made when actual amounts are known.
Income Tax Information and Distributions to Shareholders. Each year, each Fund intends to qualify as a regulated investment company under Subchapter M of the Internal Revenue Code, including distributing substantially all of its taxable income and realized gains. As a result, no provision for U.S. Federal income taxes is required. As of July 31, 2023, each Fund did not have any unrecognized tax benefits in the financial statements; nor is each Fund aware of any tax positions for which it is reasonably possible that the total amounts of unrecognized tax benefits will significantly change in the next twelve months. Each Fund files a U.S. federal tax return, in addition to state and local tax returns as required. Each Fund's federal income tax returns are subject to examination by the Internal Revenue Service (IRS) for a period of three fiscal years after they are filed. State and local tax returns may be subject to examination for an additional fiscal year depending on the jurisdiction.
Distributions are declared and recorded on the ex-dividend date. Income and capital gain distributions are determined in accordance with income tax regulations, which may differ from GAAP.
Capital accounts within the financial statements are adjusted for permanent book-tax differences. These adjustments have no impact on net assets or the results of operations. Capital accounts are not adjusted for temporary book-tax differences which will reverse in a subsequent period.
Book-tax differences are primarily due to capital loss carryforwards and losses deferred due to wash sales and excise tax regulations.
As of period end, the cost and unrealized appreciation (depreciation) in securities, and derivatives if applicable, for federal income tax purposes were as follows for each Fund:
| | Tax cost | Gross unrealized appreciation | Gross unrealized depreciation | Net unrealized appreciation (depreciation) |
| Fidelity Simplicity RMD Income Fund | $37,541,479 | $849,242 | $(3,255,830) | $(2,406,588) |
| Fidelity Simplicity RMD 2010 Fund | 10,750,445 | 349,899 | (904,616) | (554,717) |
| Fidelity Simplicity RMD 2015 Fund | 23,268,269 | 1,083,493 | (1,977,727) | (894,234) |
| Fidelity Simplicity RMD 2020 Fund | 54,357,460 | 2,849,369 | (4,666,394) | (1,817,025) |
| Fidelity Simplicity RMD 2025 Fund | 11,697,115 | 515,428 | (1,053,462) | (538,034) |
| Fidelity Simplicity RMD 2030 Fund | 618,459 | 38,429 | (4,072) | 34,357 |
The tax-based components of distributable earnings as of period end were as follows for each Fund:
| | Undistributed ordinary income | Undistributed long-term capital gain | Capital loss carryforward | Net unrealized appreciation (depreciation) on securities and other investments |
| Fidelity Simplicity RMD Income Fund | $74,720 | $- | $(881,481) | $(2,406,588) |
| Fidelity Simplicity RMD 2010 Fund | 18,052 | - | (270,835) | (554,717) |
| Fidelity Simplicity RMD 2015 Fund | 32,217 | - | (979,704) | (894,234) |
| Fidelity Simplicity RMD 2020 Fund | 57,624 | - | (2,102,363) | (1,817,025) |
| Fidelity Simplicity RMD 2025 Fund | 8,058 | - | (400,178) | (538,034) |
| Fidelity Simplicity RMD 2030 Fund | 1,991 | 139 | - | 34,357 |
Capital loss carryforwards are only available to offset future capital gains of the Funds to the extent provided by regulations and may be limited. The capital loss carryforward information presented below, including any applicable limitation, is estimated as of fiscal period end and is subject to adjustment.
| | Short-term | Long-term | Total capital loss carryforward |
| Fidelity Simplicity RMD Income Fund | $(359,130) | $(522,351) | $(881,481) |
| Fidelity Simplicity RMD 2010 Fund | (144,032) | (126,803) | (270,835) |
| Fidelity Simplicity RMD 2015 Fund | (320,123) | (659,581) | (979,704) |
| Fidelity Simplicity RMD 2020 Fund | (1,121,171) | (981,192) | (2,102,363) |
| Fidelity Simplicity RMD 2025 Fund | (221,938) | (178,240) | (400,178) |
Due to large subscriptions in a prior period, Fidelity Simplicity RMD 2025 Fund is subject to an annual limit on its use of some of its unrealized capital losses to offset capital gains in future periods. If those capital losses are realized and the limitation prevents the Fund from using any of those capital losses in a future period, those capital losses will be available to offset capital gains in subsequent periods.
The tax character of distributions paid was as follows:
| July 31, 2023 | | | |
| | Ordinary Income | Long-term Capital Gains | Total |
| Fidelity Simplicity RMD Income Fund | $1,447,229 | $633,905 | $2,081,134 |
| Fidelity Simplicity RMD 2010 Fund | 378,848 | 183,894 | 562,742 |
| Fidelity Simplicity RMD 2015 Fund | 837,648 | 562,530 | 1,400,178 |
| Fidelity Simplicity RMD 2020 Fund | 1,697,467 | 1,546,282 | 3,243,749 |
| Fidelity Simplicity RMD 2025 Fund | 311,135 | 240,243 | 551,378 |
Fidelity Simplicity RMD 2030 Fund A | 1,486 | - | 1,486 |
A For the period December 15, 2022 (commencement of operations) through July 31, 2023.
| July 31, 2022 | | | |
| | Ordinary Income | Long-term Capital Gains | Total |
| Fidelity Simplicity RMD Income Fund | $1,247,173 | $812,040 | $2,059,213 |
| Fidelity Simplicity RMD 2010 Fund | 412,118 | 251,331 | 663,449 |
| Fidelity Simplicity RMD 2015 Fund | 997,466 | 741,459 | 1,738,925 |
| Fidelity Simplicity RMD 2020 Fund | 2,210,868 | 1,875,985 | 4,086,853 |
| Fidelity Simplicity RMD 2025 Fund | 430,159 | 303,665 | 733,824 |
4. Purchases and Sales of Investments.
Purchases and sales of securities, other than short-term securities and in-kind transactions, as applicable, are noted in the table below.
| | Purchases ($) | Sales ($) |
| Fidelity Simplicity RMD Income Fund | 7,667,806 | 11,556,280 |
| Fidelity Simplicity RMD 2010 Fund | 2,507,005 | 3,424,339 |
| Fidelity Simplicity RMD 2015 Fund | 6,500,266 | 10,504,855 |
| Fidelity Simplicity RMD 2020 Fund | 15,541,730 | 20,780,934 |
| Fidelity Simplicity RMD 2025 Fund | 4,317,707 | 4,162,186 |
| Fidelity Simplicity RMD 2030 Fund | 691,857 | 74,879 |
5. Fees and Other Transactions with Affiliates.
Management Fee. Fidelity Management & Research Company LLC (the investment adviser) and its affiliates provide the Funds with investment management related services. Under the management contract, each Fund pays a monthly management fee that is set at an annual rate by referring to each Fund's horizon date indicated by its name, such that the management fee rate applicable to each Fund is reduced as the fund approaches, and then passes, its horizon date. In addition, the investment adviser pays all ordinary operating expenses of each Fund, except fees and expenses of the independent Trustees, and certain miscellaneous expenses such as proxy and shareholder meeting expenses.
For the reporting period, the total annual management fee rate for each Fund was as follows:
| Fidelity Simplicity RMD Income Fund | .46% |
| Fidelity Simplicity RMD 2010 Fund | .49% |
| Fidelity Simplicity RMD 2015 Fund | .53% |
| Fidelity Simplicity RMD 2020 Fund | .57% |
| Fidelity Simplicity RMD 2025 Fund | .61% |
| Fidelity Simplicity RMD 2030 Fund | .66% |
Interfund Trades. Funds may purchase from or sell securities to other Fidelity Funds under procedures adopted by the Board. The procedures have been designed to ensure these interfund trades are executed in accordance with Rule 17a-7 of the 1940 Act. Any interfund trades are included within the respective purchases and sales amounts shown in the Purchases and Sales of Investments note. During the period, there were no interfund trades.
Prior Year Reallocation of Underlying Fund Investments. During the prior period, the investment adviser reallocated investments of the Funds. This involved taxable redemptions of the Funds' interest in Fidelity Series Inflation-Protected Bond Index Fund, ("Underlying Fund") for investments and cash and non-taxable exchanges of those investments and cash for shares of Fidelity Series 0-5 Year Inflation-Protected Bond Index Fund and Fidelity Series 5+ Year Inflation-Protected Bond Index Fund which are affiliated investment companies managed by FMR. Net realized gain (loss) on the redemptions of the Underlying Fund in connection with the reallocation is included in the accompanying Statements of Changes in Net Assets as "Net realized gain (loss)."
Details of these transactions with the net related gain (loss) for the Funds are presented in the accompanying table:
| | Value of Investments and Cash reallocated ($) | Net realized Gain (Loss) on redemptions of Underlying Fund ($) |
| Fidelity Simplicity RMD Income Fund | 4,050,355 | 286,682 |
| Fidelity Simplicity RMD 2010 Fund | 1,122,865 | 65,739 |
| Fidelity Simplicity RMD 2015 Fund | 2,210,765 | 101,629 |
| Fidelity Simplicity RMD 2020 Fund | 4,135,488 | 188,898 |
| Fidelity Simplicity RMD 2025 Fund | 580,441 | 8,469 |
6. Expense Reductions.
Through arrangements with each applicable Fund's custodian, credits realized as a result of certain uninvested cash balances were used to reduce each applicable Fund's expenses. All of the applicable expense reductions are noted in the table below.
| | Custodian credits |
| Fidelity Simplicity RMD Income Fund | $7 |
| Fidelity Simplicity RMD 2010 Fund | 1 |
| Fidelity Simplicity RMD 2020 Fund | 6 |
7. Other.
A fund's organizational documents provide former and current trustees and officers with a limited indemnification against liabilities arising in connection with the performance of their duties to the fund. In the normal course of business, a fund may also enter into contracts that provide general indemnifications. A fund's maximum exposure under these arrangements is unknown as this would be dependent on future claims that may be made against a fund. The risk of material loss from such claims is considered remote.
At the end of the period, the investment adviser or its affiliates were owners of record of more than 10% and certain otherwise unaffiliated shareholders were owners of record of more than 50% of the outstanding shares as follows:
| Fund | Affiliated % | Number of Unaffiliated Shareholders | Unaffiliated Shareholders % |
| Fidelity Simplicity RMD 2030 Fund | 17% | 1 | 64% |
8. Risk and Uncertainties.
Many factors affect a fund's performance. Developments that disrupt global economies and financial markets, such as pandemics, epidemics, outbreaks of infectious diseases, war, terrorism, and environmental disasters, may significantly affect a fund's investment performance. The effects of these developments to a fund will be impacted by the types of securities in which a fund invests, the financial condition, industry, economic sector, and geographic location of an issuer, and a fund's level of investment in the securities of that issuer. Significant concentrations in security types, issuers, industries, sectors, and geographic locations may magnify the factors that affect a fund's performance.
To the Board of Trustees of Fidelity Income Fund and the Shareholders of Fidelity Simplicity RMD Income Fund, Fidelity Simplicity RMD 2010 Fund, Fidelity Simplicity RMD 2015 Fund, Fidelity Simplicity RMD 2020 Fund, Fidelity Simplicity RMD 2025 Fund and Fidelity Simplicity RMD 2030 Fund:
Opinion on the Financial Statements and Financial Highlights
We have audited the accompanying statements of assets and liabilities of Fidelity Simplicity RMD Income Fund, Fidelity Simplicity RMD 2010 Fund, Fidelity Simplicity RMD 2015 Fund, Fidelity Simplicity RMD 2020 Fund, Fidelity Simplicity RMD 2025 Fund and Fidelity Simplicity RMD 2030 Fund (the "Funds"), each a fund of Fidelity Income Fund, including the schedules of investments, as of July 31, 2023, the related statements of operations for the year then ended, the statements of changes in net assets for each of the two years in the period then ended, the financial highlights for each of the five years in the period then ended, except for the financial highlights for the Fidelity Simplicity RMD 2025 Fund, which are for each of the three years in the period then ended and for the period from August 16, 2019 (commencement of operations) through July 31, 2020, and the statement of changes in net assets and the financial highlights for the Fidelity Simplicity RMD 2030 Fund which are for the period from December 15, 2022 (commencement of operations) through July 31, 2023, and the related notes. In our opinion, the financial statements and financial highlights present fairly, in all material respects, the financial position of each of the Funds as of July 31, 2023, and the results of their operations for the year then ended, the changes in their net assets for each of the two years in the period then ended (or for the period mentioned above), and the financial highlights for each of the five years in the period then ended (or for the periods mentioned above), in conformity with accounting principles generally accepted in the United States of America.
Basis for Opinion
These financial statements and financial highlights are the responsibility of the Funds' management. Our responsibility is to express an opinion on the Funds' financial statements and financial highlights based on our audits. We are a public accounting firm registered with the Public Company Accounting Oversight Board (United States) (PCAOB) and are required to be independent with respect to the Funds in accordance with the U.S. federal securities laws and the applicable rules and regulations of the Securities and Exchange Commission and the PCAOB.
We conducted our audits in accordance with the standards of the PCAOB. Those standards require that we plan and perform the audit to obtain reasonable assurance about whether the financial statements and financial highlights are free of material misstatement, whether due to error or fraud. The Funds are not required to have, nor were we engaged to perform, an audit of its internal control over financial reporting. As part of our audits we are required to obtain an understanding of internal control over financial reporting but not for the purpose of expressing an opinion on the effectiveness of the Funds' internal control over financial reporting. Accordingly, we express no such opinion.
Our audits included performing procedures to assess the risks of material misstatement of the financial statements and financial highlights, whether due to error or fraud, and performing procedures that respond to those risks. Such procedures included examining, on a test basis, evidence regarding the amounts and disclosures in the financial statements and financial highlights. Our audits also included evaluating the accounting principles used and significant estimates made by management, as well as evaluating the overall presentation of the financial statements and financial highlights. Our procedures included confirmation of securities owned as of July 31, 2023, by correspondence with the custodian and brokers; when replies were not received from brokers, we performed other auditing procedures. We believe that our audits provide a reasonable basis for our opinion.
/s/ Deloitte & Touche LLP
Boston, Massachusetts
September 12, 2023
We have served as the auditor of one or more of the Fidelity investment companies since 1999.
The Trustees, Members of the Advisory Board (if any), and officers of the trust and funds, as applicable, are listed below. The Board of Trustees governs each fund and is responsible for protecting the interests of shareholders. The Trustees are experienced executives who meet periodically throughout the year to oversee each fund's activities, review contractual arrangements with companies that provide services to each fund, oversee management of the risks associated with such activities and contractual arrangements, and review each fund's performance. If the interests of a fund and an underlying Fidelity® fund were to diverge, a conflict of interest could arise and affect how the Trustees and Members of the Advisory Board fulfill their fiduciary duties to the affected funds. FMR has structured the funds to avoid these potential conflicts, although there may be situations where a conflict of interest is unavoidable. In such instances, FMR, the Trustees, and Members of the Advisory Board would take reasonable steps to minimize and, if possible, eliminate the conflict. Each of the Trustees oversees 313 funds.
The Trustees hold office without limit in time except that (a) any Trustee may resign; (b) any Trustee may be removed by written instrument, signed by at least two-thirds of the number of Trustees prior to such removal; (c) any Trustee who requests to be retired or who has become incapacitated by illness or injury may be retired by written instrument signed by a majority of the other Trustees; and (d) any Trustee may be removed at any special meeting of shareholders by a two-thirds vote of the outstanding voting securities of the trust. Each Trustee who is not an interested person (as defined in the 1940 Act) of the trust and the funds is referred to herein as an Independent Trustee. Each Independent Trustee shall retire not later than the last day of the calendar year in which his or her 75th birthday occurs. The Independent Trustees may waive this mandatory retirement age policy with respect to individual Trustees. Officers and Advisory Board Members hold office without limit in time, except that any officer or Advisory Board Member may resign or may be removed by a vote of a majority of the Trustees at any regular meeting or any special meeting of the Trustees. Except as indicated, each individual has held the office shown or other offices in the same company for the past five years.
The funds' Statement of Additional Information (SAI) includes more information about the Trustees. To request a free copy, call Fidelity at 1-800-544-8544.
Experience, Skills, Attributes, and Qualifications of the Trustees. The Governance and Nominating Committee has adopted a statement of policy that describes the experience, qualifications, attributes, and skills that are necessary and desirable for potential Independent Trustee candidates (Statement of Policy). The Board believes that each Trustee satisfied at the time he or she was initially elected or appointed a Trustee, and continues to satisfy, the standards contemplated by the Statement of Policy. The Governance and Nominating Committee also engages professional search firms to help identify potential Independent Trustee candidates who have the experience, qualifications, attributes, and skills consistent with the Statement of Policy. From time to time, additional criteria based on the composition and skills of the current Independent Trustees, as well as experience or skills that may be appropriate in light of future changes to board composition, business conditions, and regulatory or other developments, have also been considered by the professional search firms and the Governance and Nominating Committee. In addition, the Board takes into account the Trustees' commitment and participation in Board and committee meetings, as well as their leadership of standing and ad hoc committees throughout their tenure.
In determining that a particular Trustee was and continues to be qualified to serve as a Trustee, the Board has considered a variety of criteria, none of which, in isolation, was controlling. The Board believes that, collectively, the Trustees have balanced and diverse experience, qualifications, attributes, and skills, which allow the Board to operate effectively in governing each fund and protecting the interests of shareholders. Information about the specific experience, skills, attributes, and qualifications of each Trustee, which in each case led to the Board's conclusion that the Trustee should serve (or continue to serve) as a trustee of the funds, is provided below.
Board Structure and Oversight Function. Abigail P. Johnson is an interested person and currently serves as Chairman. The Trustees have determined that an interested Chairman is appropriate and benefits shareholders because an interested Chairman has a personal and professional stake in the quality and continuity of services provided to the funds. Independent Trustees exercise their informed business judgment to appoint an individual of their choosing to serve as Chairman, regardless of whether the Trustee happens to be independent or a member of management. The Independent Trustees have determined that they can act independently and effectively without having an Independent Trustee serve as Chairman and that a key structural component for assuring that they are in a position to do so is for the Independent Trustees to constitute a substantial majority for the Board. The Independent Trustees also regularly meet in executive session. Michael E. Kenneally serves as Chairman of the Independent Trustees and as such (i) acts as a liaison between the Independent Trustees and management with respect to matters important to the Independent Trustees and (ii) with management prepares agendas for Board meetings.
Fidelity® funds are overseen by different Boards of Trustees. The funds' Board oversees Fidelity's investment-grade bond, money market, asset allocation and certain equity funds, and other Boards oversee Fidelity's alternative investment, high income and other equity funds. The asset allocation funds may invest in Fidelity® funds that are overseen by such other Boards. The use of separate Boards, each with its own committee structure, allows the Trustees of each group of Fidelity® funds to focus on the unique issues of the funds they oversee, including common research, investment, and operational issues. On occasion, the separate Boards establish joint committees to address issues of overlapping consequences for the Fidelity® funds overseen by each Board.
The Trustees operate using a system of committees to facilitate the timely and efficient consideration of all matters of importance to the Trustees, each fund, and fund shareholders and to facilitate compliance with legal and regulatory requirements and oversight of the funds' activities and associated risks. The Board, acting through its committees, has charged FMR and its affiliates with (i) identifying events or circumstances the occurrence of which could have demonstrably adverse effects on the funds' business and/or reputation; (ii) implementing processes and controls to lessen the possibility that such events or circumstances occur or to mitigate the effects of such events or circumstances if they do occur; and (iii) creating and maintaining a system designed to evaluate continuously business and market conditions in order to facilitate the identification and implementation processes described in (i) and (ii) above. Because the day-to-day operations and activities of the funds are carried out by or through FMR, its affiliates, and other service providers, the funds' exposure to risks is mitigated but not eliminated by the processes overseen by the Trustees. While each of the Board's committees has responsibility for overseeing different aspects of the funds' activities, oversight is exercised primarily through the Operations and Audit Committees. In addition, an ad hoc Board committee of Independent Trustees has worked with FMR to enhance the Board's oversight of investment and financial risks, legal and regulatory risks, technology risks, and operational risks, including the development of additional risk reporting to the Board. Appropriate personnel, including but not limited to the funds' Chief Compliance Officer (CCO), FMR's internal auditor, the independent accountants, the funds' Treasurer and portfolio management personnel, make periodic reports to the Board's committees, as appropriate, including an annual review of Fidelity's risk management program for the Fidelity® funds. The responsibilities of each standing committee, including their oversight responsibilities, are described further under "Standing Committees of the Trustees."
Interested Trustees*:
Correspondence intended for a Trustee who is an interested person may be sent to Fidelity Investments, 245 Summer Street, Boston, Massachusetts 02210.
Name, Year of Birth; Principal Occupations and Other Relevant Experience+
Abigail P. Johnson (1961)
Year of Election or Appointment: 2009
Trustee
Chairman of the Board of Trustees
Ms. Johnson also serves as Trustee of other Fidelity® funds. Ms. Johnson serves as Chairman (2016-present), Chief Executive Officer (2014-present), and Director (2007-present) of FMR LLC (diversified financial services company), President of Fidelity Financial Services (2012-present) and President of Personal, Workplace and Institutional Services (2005-present). Ms. Johnson is Chairman and Director of Fidelity Management & Research Company LLC (investment adviser firm, 2011-present). Previously, Ms. Johnson served as Chairman and Director of FMR Co., Inc. (investment adviser firm, 2011-2019), Vice Chairman (2007-2016) and President (2013-2016) of FMR LLC, President and a Director of Fidelity Management & Research Company (2001-2005), a Trustee of other investment companies advised by Fidelity Management & Research Company, Fidelity Investments Money Management, Inc. (investment adviser firm), and FMR Co., Inc. (2001-2005), Senior Vice President of the Fidelity® funds (2001-2005), and managed a number of Fidelity® funds. Ms. Abigail P. Johnson and Mr. Arthur E. Johnson are not related.
Jennifer Toolin McAuliffe (1959)
Year of Election or Appointment: 2016
Trustee
Ms. McAuliffe also serves as Trustee of other Fidelity® funds and as Trustee of Fidelity Charitable (2020-present). Previously, Ms. McAuliffe served as Co-Head of Fixed Income of Fidelity Investments Limited (now known as FIL Limited (FIL)) (diversified financial services company), Director of Research for FIL's credit and quantitative teams in London, Hong Kong and Tokyo and Director of Research for taxable and municipal bonds at Fidelity Investments Money Management, Inc. Ms. McAuliffe previously served as a member of the Advisory Board of certain Fidelity® funds (2016). Ms. McAuliffe was previously a lawyer at Ropes & Gray LLP and an international banker at Chemical Bank NA (now JPMorgan Chase & Co.). Ms. McAuliffe also currently serves as director or trustee of several not-for-profit entities.
* Determined to be an "Interested Trustee" by virtue of, among other things, his or her affiliation with the trust or various entities under common control with FMR.
+ The information includes the Trustee's principal occupation during the last five years and other information relating to the experience, attributes, and skills relevant to the Trustee's qualifications to serve as a Trustee, which led to the conclusion that the Trustee should serve as a Trustee for each fund.
Independent Trustees:
Correspondence intended for an Independent Trustee may be sent to Fidelity Investments, P.O. Box 55235, Boston, Massachusetts 02205-5235.
Name, Year of Birth; Principal Occupations and Other Relevant Experience+
Elizabeth S. Acton (1951)
Year of Election or Appointment: 2013
Trustee
Ms. Acton also serves as Trustee of other Fidelity® funds. Prior to her retirement, Ms. Acton served as Executive Vice President, Finance (2011-2012), Executive Vice President, Chief Financial Officer (2002-2011) and Treasurer (2004-2005) of Comerica Incorporated (financial services). Prior to joining Comerica, Ms. Acton held a variety of positions at Ford Motor Company (1983-2002), including Vice President and Treasurer (2000-2002) and Executive Vice President and Chief Financial Officer of Ford Motor Credit Company (1998-2000). Ms. Acton currently serves as a member of the Board and Audit and Finance Committees of Beazer Homes USA, Inc. (homebuilding, 2012-present). Ms. Acton previously served as a member of the Advisory Board of certain Fidelity® funds (2013-2016).
Ann E. Dunwoody (1953)
Year of Election or Appointment: 2018
Trustee
General Dunwoody also serves as Trustee of other Fidelity® funds. General Dunwoody (United States Army, Retired) was the first woman in U.S. military history to achieve the rank of four-star general and prior to her retirement in 2012 held a variety of positions within the U.S. Army, including Commanding General, U.S. Army Material Command (2008-2012). General Dunwoody currently serves as a member of the Board, Chair of Nomination Committee and a member of the Corporate Governance Committee of Kforce Inc. (professional staffing services, 2016-present) and a member of the Board of Automattic Inc. (software engineering, 2018-present). Previously, General Dunwoody served as President of First to Four LLC (leadership and mentoring services, 2012-2022), a member of the Advisory Board and Nominating and Corporate Governance Committee of L3 Technologies, Inc. (communication, electronic, sensor and aerospace systems, 2013-2019) and a member of the Board and Audit and Sustainability and Corporate Responsibility Committees of Republic Services, Inc. (waste collection, disposal and recycling, 2013-2016). General Dunwoody also serves on several boards for non-profit organizations, including as a member of the Board, Chair of the Nomination and Governance Committee and a member of the Audit Committee of the Noble Reach Foundation (formerly Logistics Management Institute) (consulting non-profit, 2012-present) and a member of the Board of ThanksUSA (military family education non-profit, 2014-present). Previously, General Dunwoody served as a member of the Board of Florida Institute of Technology (2015-2022) and a member of the Council of Trustees for the Association of the United States Army (advocacy non-profit, 2013-2021). General Dunwoody previously served as a member of the Advisory Board of certain Fidelity® funds (2018).
John Engler (1948)
Year of Election or Appointment: 2014
Trustee
Mr. Engler also serves as Trustee of other Fidelity® funds. Previously, Mr. Engler served as Governor of Michigan (1991-2003), President of the Business Roundtable (2011-2017) and interim President of Michigan State University (2018-2019). Previously, Mr. Engler served as a member of the Board of Stride, Inc. (formerly K12 Inc.) (technology-based education company, 2012-2022), a member of the Board of Universal Forest Products (manufacturer and distributor of wood and wood-alternative products, 2003-2019) and Trustee of The Munder Funds (2003-2014). Mr. Engler previously served as a member of the Advisory Board of certain Fidelity® funds (2014-2016).
Robert F. Gartland (1951)
Year of Election or Appointment: 2010
Trustee
Mr. Gartland also serves as Trustee of other Fidelity® funds. Prior to his retirement, Mr. Gartland held a variety of positions at Morgan Stanley (financial services, 1979-2007), including Managing Director (1987-2007) and Chase Manhattan Bank (1975-1978). Mr. Gartland previously served as Chairman and an investor in Gartland & Mellina Group Corp. (consulting, 2009-2019), as a member of the Board of National Securities Clearing Corporation (1993-1996) and as Chairman of TradeWeb (2003-2004).
Arthur E. Johnson (1947)
Year of Election or Appointment: 2008
Trustee
Mr. Johnson also serves as Trustee of other Fidelity® funds. Prior to his retirement, Mr. Johnson served as Senior Vice President of Corporate Strategic Development of Lockheed Martin Corporation (defense contractor, 1999-2009). Mr. Johnson currently serves as a member of the Board of Booz Allen Hamilton (management consulting, 2011-present). Mr. Johnson previously served as a member of the Board of Eaton Corporation plc (diversified power management, 2009-2019) and a member of the Board of AGL Resources, Inc. (holding company, 2002-2016). Mr. Johnson previously served as Chairman (2018-2021) and Vice Chairman (2015-2018) of the Independent Trustees of certain Fidelity® funds. Mr. Arthur E. Johnson is not related to Ms. Abigail P. Johnson.
Michael E. Kenneally (1954)
Year of Election or Appointment: 2009
Trustee
Chairman of the Independent Trustees
Mr. Kenneally also serves as Trustee of other Fidelity® funds and was Vice Chairman (2018-2021) of the Independent Trustees of certain Fidelity® funds. Prior to retirement in 2005, he was Chairman and Global Chief Executive Officer of Credit Suisse Asset Management, the worldwide fund management and institutional investment business of Credit Suisse Group. Previously, Mr. Kenneally was an Executive Vice President and the Chief Investment Officer for Bank of America. In this role, he was responsible for the investment management, strategy and products delivered to the bank's institutional, high-net-worth and retail clients. Earlier, Mr. Kenneally directed the organization's equity and quantitative research groups. He began his career as a research analyst and then spent more than a dozen years as a portfolio manager for endowments, pension plans and mutual funds. He earned the Chartered Financial Analyst (CFA) designation in 1991.
Mark A. Murray (1954)
Year of Election or Appointment: 2016
Trustee
Mr. Murray also serves as Trustee of other Fidelity® funds. Previously, Mr. Murray served as Co-Chief Executive Officer (2013-2016), President (2006-2013) and Vice Chairman (2013-2020) of Meijer, Inc. Mr. Murray serves as a member of the Board (2009-present) and Public Policy and Responsibility Committee (2009-present) and Chair of the Nuclear Review Committee (2019-present) of DTE Energy Company (diversified energy company). Mr. Murray previously served as a member of the Board of Spectrum Health (not-for-profit health system, 2015-2019) and as a member of the Board and Audit Committee and Chairman of the Nominating and Corporate Governance Committee of Universal Forest Products, Inc. (manufacturer and distributor of wood and wood-alternative products, 2004-2016). Mr. Murray also serves as a member of the Board of many community and professional organizations. Mr. Murray previously served as a member of the Advisory Board of certain Fidelity® funds (2016).
+ The information includes the Trustee's principal occupation during the last five years and other information relating to the experience, attributes, and skills relevant to the Trustee's qualifications to serve as a Trustee, which led to the conclusion that the Trustee should serve as a Trustee for each fund.
Advisory Board Members and Officers:
Correspondence intended for a Member of the Advisory Board (if any) may be sent to Fidelity Investments, P.O. Box 55235, Boston, Massachusetts 02205-5235. Correspondence intended for an officer may be sent to Fidelity Investments, 245 Summer Street, Boston, Massachusetts 02210. Officers appear below in alphabetical order.
Name, Year of Birth; Principal Occupation
Laura M. Bishop (1961)
Year of Election or Appointment: 2022
Member of the Advisory Board
Ms. Bishop also serves as a Member of the Advisory Board of other funds. Prior to her retirement, Ms. Bishop held a variety of positions at United Services Automobile Association (2001-2020), including Executive Vice President and Chief Financial Officer (2014-2020) and Senior Vice President and Deputy Chief Financial Officer (2012-2014). Ms. Bishop currently serves as a member of the Audit Committee and Compensation and Personnel Committee (2021-present) of the Board of Directors of Korn Ferry (global organizational consulting).
Robert W. Helm (1957)
Year of Election or Appointment: 2021
Member of the Advisory Board
Mr. Helm also serves as a Member of the Advisory Board of other Fidelity® funds. Mr. Helm was formerly Deputy Chairman (2003-2020), partner (1991-2020) and an associate (1984-1991) of Dechert LLP (formerly Dechert Price & Rhoads). Mr. Helm currently serves on boards and committees of several not-for-profit organizations, including as a Trustee and member of the Executive Committee of the Baltimore Council on Foreign Affairs, a member of the Board of Directors of the St. Vincent de Paul Society of Baltimore and a member of the Life Guard Society of Mt. Vernon.
Carol J. Zierhoffer (1960)
Year of Election or Appointment: 2023
Member of the Advisory Board
Ms. Zierhoffer also serves as a Member of the Advisory Board of other funds. Prior to her retirement, Ms. Zierhoffer held a variety of positions at Bechtel Corporation (engineering company, 2013-2019), including Principal Vice President and Chief Information Officer (2013-2016) and Senior Vice President and Chief Information Officer (2016-2019). Ms. Zierhoffer currently serves as a member of the Board of Directors, Audit Committee and Compensation Committee of Allscripts Healthcare Solutions, Inc. (healthcare technology, 2020-present) and as a member of the Board of Directors, Audit and Finance Committee and Nominating and Governance Committee of Atlas Air Worldwide Holdings, Inc. (aviation operating services, 2021-present). Previously, Ms. Zierhoffer served as a member of the Board of Directors and Audit Committee and as the founding Chair of the Information Technology Committee of MedAssets, Inc. (healthcare technology, 2013-2016).
Heather Bonner (1977)
Year of Election or Appointment: 2023
Assistant Treasurer
Ms. Bonner also serves as an officer of other funds. Ms. Bonner serves as Senior Vice President (2022-present), and is an employee of Fidelity Investments. Ms. Bonner serves as Assistant Treasurer of Fidelity CRET Trustee LLC (2022-present). Prior to joining Fidelity, Ms. Bonner served as Managing Director at AQR Capital Management (2013-2022) and was the Treasurer and Principal Financial Officer of the AQR Funds (2013-2022).
Craig S. Brown (1977)
Year of Election or Appointment: 2019
Assistant Treasurer
Mr. Brown also serves as an officer of other funds. Mr. Brown serves as Assistant Treasurer of FIMM, LLC (2021-present) and is an employee of Fidelity Investments (2013-present). Previously, Mr. Brown served as Assistant Treasurer of certain Fidelity® funds (2019-2022).
John J. Burke III (1964)
Year of Election or Appointment: 2018
Chief Financial Officer
Mr. Burke also serves as Chief Financial Officer of other funds. Mr. Burke serves as Head of Investment Operations for Fidelity Fund and Investment Operations (2018-present) and is an employee of Fidelity Investments (1998-present). Previously Mr. Burke served as head of Asset Management Investment Operations (2012-2018).
Margaret Carey (1973)
Year of Election or Appointment: 2023
Secretary and Chief Legal Officer (CLO)
Ms. Carey also serves as an officer of other funds and as CLO of certain other Fidelity entities. She is a Senior Vice President and Deputy General Counsel of FMR LLC (diversified financial services company, 2019-present), and is an employee of Fidelity Investments.
David J. Carter (1973)
Year of Election or Appointment: 2020
Assistant Secretary
Mr. Carter also serves as Assistant Secretary of other funds. Mr. Carter serves as Senior Vice President, Deputy General Counsel (2022-present) and is an employee of Fidelity Investments (2005-present).
Jonathan Davis (1968)
Year of Election or Appointment: 2010
Assistant Treasurer
Mr. Davis also serves as an officer of other funds. Mr. Davis serves as Vice President Assistant Treasurer and is an employee of Fidelity Investments. Mr. Davis serves as Assistant Treasurer of certain Fidelity entities.
Laura M. Del Prato (1964)
Year of Election or Appointment: 2018
President and Treasurer
Ms. Del Prato also serves as an officer of other funds. Ms. Del Prato serves as Assistant Treasurer of FIMM, LLC (2021-present) and is an employee of Fidelity Investments (2017-present). Previously, Ms. Del Prato served as President and Treasurer of The North Carolina Capital Management Trust: Cash Portfolio and Term Portfolio (2018-2020). Prior to joining Fidelity Investments, Ms. Del Prato served as a Managing Director and Treasurer of the JPMorgan Mutual Funds (2014-2017). Prior to JPMorgan, Ms. Del Prato served as a partner at Cohen Fund Audit Services (accounting firm, 2012-2013) and KPMG LLP (accounting firm, 2004-2012).
Christopher M. Gouveia (1973)
Year of Election or Appointment: 2023
Chief Compliance Officer
Mr. Gouveia also serves as Chief Compliance Officer of other funds. Mr. Gouveia serves as Senior Vice President of Asset Management Compliance for Fidelity Investments and is an employee of Fidelity Investments. Previously, Mr. Gouveia served as Chief Compliance Officer of the North Carolina Capital Management Trust (2016-2019).
Colm A. Hogan (1973)
Year of Election or Appointment: 2016
Assistant Treasurer
Mr. Hogan also serves as an officer of other funds. Mr. Hogan serves as Assistant Treasurer of FIMM, LLC (2021-present) and FMR Capital, Inc. (2017-present) and is an employee of Fidelity Investments (2005-present). Previously, Mr. Hogan served as Deputy Treasurer of certain Fidelity® funds (2016-2020) and Assistant Treasurer of certain Fidelity® funds (2016-2018).
William Irving (1964)
Year of Election or Appointment: 2023
Vice President
Mr. Irving also serves as Vice President of other funds. Mr. Irving serves as Head of Fidelity Asset Management Solutions (2022-present) and is an employee of Fidelity Investments. Mr. Irving serves as President and Director of Fidelity Diversifying Solutions LLC (investment adviser firm, 2023-present) and President, Director, or Vice President of certain other Fidelity entities. Previously, Mr. Irving served as Chief Investment Officer (CIO) in the Global Asset Allocation division (2020-2022). Prior to that, he was Managing Director of Research in the Global Asset Allocation division (2018-2020) and portfolio manager of certain Fidelity® funds (2004-2018).
Chris Maher (1972)
Year of Election or Appointment: 2013
Assistant Treasurer
Mr. Maher also serves as an officer of other funds. Mr. Maher serves as Assistant Treasurer of FIMM, LLC (2021-present) and FMR Capital, Inc. (2017-present), and is an employee of Fidelity Investments (2008-present). Previously, Mr. Maher served as Assistant Treasurer of certain funds (2013-2020); Vice President of Asset Management Compliance (2013), Vice President of the Program Management Group of FMR (investment adviser firm, 2010-2013), and Vice President of Valuation Oversight (2008-2010).
Brett Segaloff (1972)
Year of Election or Appointment: 2021
Anti-Money Laundering (AML) Officer
Mr. Segaloff also serves as an AML Officer of other funds and other related entities. He is Director, Anti-Money Laundering (2007-present) of FMR LLC (diversified financial services company) and is an employee of Fidelity Investments (1996-present).
Stacie M. Smith (1974)
Year of Election or Appointment: 2013
Assistant Treasurer
Ms. Smith also serves as an officer of other funds. Ms. Smith serves as Assistant Treasurer of FIMM, LLC (2021-present) and FMR Capital, Inc. (2017-present), is an employee of Fidelity Investments (2009-present), and has served in other fund officer roles. Prior to joining Fidelity Investments, Ms. Smith served as Senior Audit Manager of Ernst & Young LLP (accounting firm, 1996-2009). Previously, Ms. Smith served as Assistant Treasurer (2013-2019) and Deputy Treasurer (2013-2016) of certain Fidelity® funds.
Jim Wegmann (1979)
Year of Election or Appointment: 2021
Deputy Treasurer
Mr. Wegmann also serves as an officer of other funds. Mr. Wegmann serves as Assistant Treasurer of FIMM, LLC (2021-present) and is an employee of Fidelity Investments (2011-present). Previously, Mr. Wegmann served as Assistant Treasurer of certain Fidelity® funds (2019-2021).
As a shareholder, you incur two types of costs: (1) transaction costs, which may include sales charges (loads) on purchase payments or redemption proceeds, as applicable and (2) ongoing costs, which generally include management fees, distribution and/or service (12b-1) fees and other Fund expenses. This Example is intended to help you understand your ongoing costs (in dollars) of investing in a fund and to compare these costs with the ongoing costs of investing in other mutual funds.
| The Example is based on an investment of $1,000 invested at the beginning of the period and held for the entire period (February 1, 2023 to July 31, 2023). |
Actual Expenses
The first line of the accompanying table provides information about actual account values and actual expenses. You may use the information in this line, together with the amount you invested, to estimate the expenses that you paid over the period. Simply divide your account value by $1,000.00 (for example, an $8,600 account value divided by $1,000.00 = 8.6), then multiply the result by the number in the first line for a class/Fund under the heading entitled "Expenses Paid During Period" to estimate the expenses you paid on your account during this period. If any fund is a shareholder of any underlying mutual funds or exchange-traded funds (ETFs) (the Underlying Funds), such fund indirectly bears its proportional share of the expenses of the Underlying Funds in addition to the direct expenses incurred presented in the table. These fees and expenses are not included in the annualized expense ratio used to calculate the expense estimate in the table below.
Hypothetical Example for Comparison Purposes
The second line of the accompanying table provides information about hypothetical account values and hypothetical expenses based on the actual expense ratio and an assumed rate of return of 5% per year before expenses, which is not the actual return. The hypothetical account values and expenses may not be used to estimate the actual ending account balance or expenses you paid for the period. You may use this information to compare the ongoing costs of investing in the Fund and other funds. To do so, compare this 5% hypothetical example with the 5% hypothetical examples that appear in the shareholder reports of the other funds. If any fund is a shareholder of any Underlying Funds, such fund indirectly bears its proportional share of the expenses of the Underlying Funds in addition to the direct expenses as presented in the table. These fees and expenses are not included in the annualized expense ratio used to calculate the expense estimate in the table below.
Please note that the expenses shown in the table are meant to highlight your ongoing costs only and do not reflect any transaction costs. Therefore, the second line of the table is useful in comparing ongoing costs only, and will not help you determine the relative total costs of owning different funds. In addition, if these transactional costs were included, your costs would have been higher.
| | | | | Annualized Expense Ratio- A | | Beginning Account Value February 1, 2023 | | Ending Account Value July 31, 2023 | | Expenses Paid During Period- C February 1, 2023 to July 31, 2023 |
| | | | | | | | | | |
| Fidelity Simplicity RMD Income Fund℠ | | | | .46% | | | | | | |
| Actual | | | | | | $ 1,000 | | $ 1,012.90 | | $ 2.30 |
Hypothetical-B | | | | | | $ 1,000 | | $ 1,022.51 | | $ 2.31 |
| | | | | | | | | | |
| Fidelity Simplicity RMD 2010 Fund℠ | | | | .49% | | | | | | |
| Actual | | | | | | $ 1,000 | | $ 1,021.50 | | $ 2.46 |
Hypothetical-B | | | | | | $ 1,000 | | $ 1,022.36 | | $ 2.46 |
| | | | | | | | | | |
| Fidelity Simplicity RMD 2015 Fund℠ | | | | .53% | | | | | | |
| Actual | | | | | | $ 1,000 | | $ 1,029.00 | | $ 2.67 |
Hypothetical-B | | | | | | $ 1,000 | | $ 1,022.17 | | $ 2.66 |
| | | | | | | | | | |
| Fidelity Simplicity RMD 2020 Fund℠ | | | | .57% | | | | | | |
| Actual | | | | | | $ 1,000 | | $ 1,036.30 | | $ 2.88 |
Hypothetical-B | | | | | | $ 1,000 | | $ 1,021.97 | | $ 2.86 |
| | | | | | | | | | |
| Fidelity Simplicity RMD 2025 Fund℠ | | | | .61% | | | | | | |
| Actual | | | | | | $ 1,000 | | $ 1,042.40 | | $ 3.09 |
Hypothetical-B | | | | | | $ 1,000 | | $ 1,021.77 | | $ 3.06 |
| | | | | | | | | | |
| Fidelity Simplicity RMD 2030 Fund℠ | | | | .66% | | | | | | |
| Actual | | | | | | $ 1,000 | | $ 1,049.10 | | $ 3.35 |
Hypothetical-B | | | | | | $ 1,000 | | $ 1,021.52 | | $ 3.31 |
| |
A Annualized expense ratio reflects expenses net of applicable fee waivers.
B 5% return per year before expenses
C Expenses are equal to the annualized expense ratio, multiplied by the average account value over the period, multiplied by 181/ 365 (to reflect the one-half year period). The fees and expenses of any Underlying Funds are not included in each annualized expense ratio.
The dividend and capital gains distributions for the fund(s) are available on Fidelity.com or Institutional.Fidelity.com.
The funds hereby designate as capital gain dividend the amounts noted below for the taxable year ended July 31, 2023, or, if subsequently determined to be different, the net capital gain of such year.
| Fidelity Simplicity RMD 2030 Fund | $139 |
A percentage of the dividends distributed during the fiscal year for the following funds were derived from interest on U.S. Government securities which is generally exempt from state income tax:
| Fidelity Simplicity RMD Income Fund | 32.19% |
| Fidelity Simplicity RMD 2010 Fund | 26.67% |
| Fidelity Simplicity RMD 2015 Fund | 22.47% |
| Fidelity Simplicity RMD 2020 Fund | 18.92% |
| Fidelity Simplicity RMD 2025 Fund | 15.92% |
| Fidelity Simplicity RMD 2030 Fund | 27.94% |
A percentage of the dividends distributed during the fiscal year for the following funds may be taken into account as a dividend for purposes of the maximum rate under section 1(h)(11) of the Internal Revenue Code.
| Fidelity Simplicity RMD Income Fund | |
| September 2022 | 6.53% |
| October 2022 | 9.70% |
| November 2022 | 9.70% |
| December 2022 | 9.70% |
| February 2023 | .05% |
| March 2023 | .05% |
| April 2023 | .05% |
| May 2023 | .05% |
| June 2023 | .05% |
| July 2023 | .05% |
| Fidelity Simplicity RMD 2010 Fund | |
| September 2022 | 12.16% |
| October 2022 | 15.72% |
| November 2022 | 15.72% |
| December 2022 | 15.72% |
| February 2023 | .40% |
| March 2023 | .40% |
| April 2023 | .40% |
| May 2023 | .40% |
| June 2023 | .40% |
| July 2023 | .40% |
| Fidelity Simplicity RMD 2015 Fund | |
| September 2022 | 16.53% |
| October 2022 | 20.46% |
| November 2022 | 20.46% |
| December 2022 | 20.46% |
| February 2023 | .28% |
| March 2023 | .28% |
| April 2023 | .28% |
| May 2023 | .28% |
| June 2023 | .28% |
| July 2023 | .28% |
| Fidelity Simplicity RMD 2020 Fund | |
| September 2022 | 20.00% |
| October 2022 | 25.75% |
| November 2022 | 25.75% |
| December 2022 | 25.75% |
| February 2023 | 1.03% |
| March 2023 | 1.03% |
| April 2023 | 1.03% |
| May 2023 | 1.03% |
| June 2023 | 1.03% |
| July 2023 | 1.03% |
| Fidelity Simplicity RMD 2025 Fund | |
| September 2022 | 15.41% |
| October 2022 | 30.92% |
| November 2022 | 30.92% |
| December 2022 | 30.92% |
| February 2023 | 1.48% |
| March 2023 | 1.48% |
| April 2023 | 1.48% |
| May 2023 | 1.48% |
| June 2023 | 1.48% |
| July 2023 | 1.48% |
| Fidelity Simplicity RMD 2030 Fund | |
| April 2023 | 3.33% |
| May 2023 | 3.33% |
| June 2023 | 3.33% |
| July 2023 | 3.33% |
| | |
A percentage of the dividends distributed during the fiscal year for the following funds qualify as a section 199A dividend:
| Fidelity Simplicity RMD Income Fund | |
| February 2023 | .77% |
| March 2023 | .77% |
| April 2023 | .77% |
| May 2023 | .77% |
| June 2023 | .77% |
| July 2023 | .77% |
| Fidelity Simplicity RMD 2010 Fund | |
| February 2023 | 1.24% |
| March 2023 | 1.24% |
| April 2023 | 1.24% |
| May 2023 | 1.24% |
| June 2023 | 1.24% |
| July 2023 | 1.24% |
| Fidelity Simplicity RMD 2015 Fund | |
| February 2023 | 1.81% |
| March 2023 | 1.81% |
| April 2023 | 1.81% |
| May 2023 | 1.81% |
| June 2023 | 1.81% |
| July 2023 | 1.81% |
| Fidelity Simplicity RMD 2020 Fund | |
| February 2023 | 2.74% |
| March 2023 | 2.74% |
| April 2023 | 2.74% |
| May 2023 | 2.74% |
| June 2023 | 2.74% |
| July 2023 | 2.74% |
| Fidelity Simplicity RMD 2025 Fund | |
| February 2023 | 3.56% |
| March 2023 | 3.56% |
| April 2023 | 3.56% |
| May 2023 | 3.56% |
| June 2023 | 3.56% |
| July 2023 | 3.56% |
| Fidelity Simplicity RMD 2030 Fund | |
| April 2023 | .66% |
| May 2023 | .66% |
| June 2023 | .66% |
| July 2023 | .66% |
The amounts per share which represent income derived from sources within, and taxes paid to, foreign countries or possessions of the United States are as follows:
| | Pay Date | Income | Taxes |
| Fidelity Simplicity RMD Income Fund | 12/30/22 | $0.1731 | $0.0199 |
| Fidelity Simplicity RMD 2010 Fund | 12/30/22 | $0.2117 | $0.0238 |
| Fidelity Simplicity RMD 2015 Fund | 12/30/22 | $0.2830 | $0.0314 |
| Fidelity Simplicity RMD 2020 Fund | 12/30/22 | $0.3371 | $0.0371 |
| Fidelity Simplicity RMD 2025 Fund | 12/30/22 | $0.0668 | $0.0073 |
| Fidelity Simplicity RMD 2030 Fund | 12/30/22 | $0.0000 | $0.0000 |
The funds will notify shareholders in January 2024 of amounts for use in preparing 2023 income tax returns.
1.9881721.106
SRD-ANN-0923
Fidelity® GNMA Fund
Annual Report
July 31, 2023
Contents
To view a fund's proxy voting guidelines and proxy voting record for the 12-month period ended June 30, visit http://www.fidelity.com/proxyvotingresults or visit the Securities and Exchange Commission's (SEC) web site at http://www.sec.gov.
You may also call 1-800-544-8544 to request a free copy of the proxy voting guidelines.
Standard & Poor's, S&P and S&P 500 are registered service marks of The McGraw-Hill Companies, Inc. and have been licensed for use by Fidelity Distributors Corporation.
Other third-party marks appearing herein are the property of their respective owners.
All other marks appearing herein are registered or unregistered trademarks or service marks of FMR LLC or an affiliated company. © 2023 FMR LLC. All rights reserved.
This report and the financial statements contained herein are submitted for the general information of the shareholders of the Fund. This report is not authorized for distribution to prospective investors in the Fund unless preceded or accompanied by an effective prospectus.
A fund files its complete schedule of portfolio holdings with the SEC for the first and third quarters of each fiscal year on Form N-PORT. Forms N-PORT are available on the SEC's web site at http://www.sec.gov. A fund's Forms N-PORT may be reviewed and copied at the SEC's Public Reference Room in Washington, DC. Information regarding the operation of the SEC's Public Reference Room may be obtained by calling 1-800-SEC-0330.
For a complete list of a fund's portfolio holdings, view the most recent holdings listing, semiannual report, or annual report on Fidelity's web site at http://www.fidelity.com, http://www.institutional.fidelity.com, or http://www.401k.com, as applicable.
NOT FDIC INSURED •MAY LOSE VALUE •NO BANK GUARANTEE
Neither the Fund nor Fidelity Distributors Corporation is a bank.
Average annual total return reflects the change in the value of an investment, assuming reinvestment of distributions from dividend income and capital gains (the profits earned upon the sale of securities that have grown in value, if any) and assuming a constant rate of performance each year. The hypothetical investment and the average annual total returns do not reflect the deduction of taxes that a shareholder would pay on fund distributions or the redemption of fund shares. During periods of reimbursement by Fidelity, a fund's total return will be greater than it would be had the reimbursement not occurred. How a fund did yesterday is no guarantee of how it will do tomorrow.
| Average Annual Total Returns |
| | | | |
Periods ended July 31, 2023 | Past 1 year | Past 5 years | Past 10 years |
| Fidelity® GNMA Fund | -4.39% | -0.03% | 1.02% |
| $10,000 Over 10 Years |
| |
Let's say hypothetically that $10,000 was invested in Fidelity® GNMA Fund on July 31, 2013. The chart shows how the value of your investment would have changed, and also shows how the Bloomberg GNMA Index performed over the same period. |
|
|
Market Recap:
U.S. taxable investment-grade bonds returned -3.37% for the 12 months ending July 31, 2023, according to the Bloomberg U.S. Aggregate Bond Index. The first months of the period saw a continuation of the historic bond market downturn that began in early 2022, when the U.S. Federal Reserve began an aggressive series of interest rate hikes to combat persistent inflation. The actions helped push nominal and real U.S. bond yields to their highest level in more than a decade. Bond prices, which move inversely to yields, fell sharply through October, and credit spreads widened, as investors demanded more yield for buying credit-sensitive assets. In November, the bond market staged a broad rally (+3.68%) when comments by Fed Chair Powell pointed to a slowdown in the size of future rate hikes. To date, the central bank has raised its benchmark rate 11 times, by a total of 5.25 percentage points. With the market anticipating the end of the hiking cycle by mid-year, the Aggregate index advanced 3.59% in the first four months of 2023, only to fall back in May (-1.09%) and June (-0.36%), and to tread water in July (-0.07%), as cooling but still-high inflation and a strong labor market suggested the Fed may need to keep raising rates for longer than anticipated. For the 12 months, short-term bonds outperformed long-term issues, while lower-quality bonds bettered higher-quality debt, and risk assets like corporate bonds and asset-backed securities outpaced U.S. Treasuries. Meanwhile, U.S. mortgage-backed securities lagged.
Comments from Co-Managers Sean Corcoran and Franco Castagliuolo:
For the fiscal year ending July 31, 2023, the fund returned -4.39%, versus -4.18% for the benchmark Bloomberg GNMA Index. In managing the fund, we remained focused on seeking competitive risk-adjusted performance commensurate with investors' expectations of a GNMA fund. We sought to exploit market inefficiencies based on our top-down research on the global economy, government policy, and supply and demand in the market. We also tried to find mispriced securities by relying on proprietary models to forecast the timing of cash flows. Versus the benchmark, modest overweights in mid-coupon (3% to 4%) securities backed by non-conventional loans, such as FHA loans, VA loans and USDA loans, detracted from the fund's relative result. Conversely, the fund's overweight in securities backed by 15-year mortgages added value, as these securities outperformed. An overweight in government agency commercial mortgage-backed securities also boosted the relative result, as did larger-than-benchmark exposure to low-coupon (2%) GNMA securities and high-coupon (5.5%) Fannie Mae securities.
The views expressed above reflect those of the portfolio manager(s) only through the end of the period as stated on the cover of this report and do not necessarily represent the views of Fidelity or any other person in the Fidelity organization. Any such views are subject to change at any time based upon market or other conditions and Fidelity disclaims any responsibility to update such views. These views may not be relied on as investment advice and, because investment decisions for a Fidelity fund are based on numerous factors, may not be relied on as an indication of trading intent on behalf of any Fidelity fund.
| Coupon Distribution (% of Fund's Investments) |
| |
| Zero coupon bonds | 0.5 | |
| 0.01 - 0.99% | 0.3 | |
| 1 - 1.99% | 1.1 | |
| 2 - 2.99% | 34.6 | |
| 3 - 3.99% | 25.8 | |
| 4 - 4.99% | 10.5 | |
| 5 - 5.99% | 9.2 | |
| 6 - 6.99% | 1.0 | |
| 7 - 7.99% | 0.1 | |
| 8 - 8.99% | 0.0 | |
| Coupon distribution shows the range of stated interest rates on the fund's investments, excluding short-term investments. |
Percentages shown as 0.0% may reflect amounts less than 0.05%.
Asset Allocation (% of Fund's net assets) |
|
Short-Term Investments and Net Other Assets (Liabilities) - (19.8)% |
Futures and Swaps - 10.3% |
GNMA Securities - 98.8% |
Percentages in the above tables are adjusted for the effect of TBA Sale Commitments. |
|
Showing Percentage of Net Assets
| U.S. Government and Government Agency Obligations - 6.4% |
| | | Principal Amount (a) (000s) | Value ($) (000s) |
| U.S. Treasury Obligations - 6.4% | | | |
| U.S. Treasury Bonds: | | | |
| 3.625% 2/15/53 | | 15,277 | 14,248 |
| 3.625% 5/15/53 | | 5,680 | 5,306 |
| U.S. Treasury Notes: | | | |
| 3.625% 5/15/26 | | 9,520 | 9,283 |
| 3.625% 5/31/28 | | 13,390 | 13,070 |
| 3.875% 3/31/25 | | 32,870 | 32,238 |
| 3.875% 1/15/26 | | 10,640 | 10,438 |
| 4% 2/15/26 | | 19,800 | 19,489 |
| 4.625% 2/28/25 | | 13,300 | 13,200 |
| 4.625% 3/15/26 | | 30,280 | 30,284 |
| | | | |
| TOTAL U.S. GOVERNMENT AND GOVERNMENT AGENCY OBLIGATIONS (Cost $150,230) | | | 147,556 |
| | | | |
| U.S. Government Agency - Mortgage Securities - 111.9% |
| | | Principal Amount (a) (000s) | Value ($) (000s) |
| Fannie Mae - 4.2% | | | |
| 12 month U.S. LIBOR + 1.460% 3.847% 1/1/35 (b)(c) | | 33 | 33 |
| 12 month U.S. LIBOR + 1.480% 5.73% 7/1/34 (b)(c) | | 4 | 4 |
| 12 month U.S. LIBOR + 1.530% 3.94% 3/1/36 (b)(c) | | 37 | 37 |
| 12 month U.S. LIBOR + 1.620% 3.963% 5/1/35 (b)(c) | | 77 | 78 |
| 12 month U.S. LIBOR + 1.620% 4.293% 3/1/33 (b)(c) | | 31 | 31 |
| 12 month U.S. LIBOR + 1.630% 4.575% 11/1/36 (b)(c) | | 41 | 41 |
| 12 month U.S. LIBOR + 1.640% 3.895% 6/1/47 (b)(c) | | 53 | 54 |
| 12 month U.S. LIBOR + 1.710% 3.857% 8/1/35 (b)(c) | | 83 | 84 |
| 12 month U.S. LIBOR + 1.890% 5.057% 8/1/35 (b)(c) | | 64 | 65 |
| 6 month U.S. LIBOR + 1.510% 6.193% 2/1/33 (b)(c) | | 8 | 8 |
| 6 month U.S. LIBOR + 1.530% 3.785% 12/1/34 (b)(c) | | 9 | 9 |
| 6 month U.S. LIBOR + 1.530% 3.844% 3/1/35 (b)(c) | | 18 | 18 |
| 6 month U.S. LIBOR + 1.550% 5.954% 9/1/33 (b)(c) | | 124 | 126 |
| 6 month U.S. LIBOR + 1.550% 5.984% 10/1/33 (b)(c) | | 6 | 6 |
| 6 month U.S. LIBOR + 1.560% 6.127% 7/1/35 (b)(c) | | 6 | 6 |
| U.S. TREASURY 1 YEAR INDEX + 2.180% 4.487% 7/1/36 (b)(c) | | 34 | 34 |
| U.S. TREASURY 1 YEAR INDEX + 2.280% 4.405% 10/1/33 (b)(c) | | 14 | 14 |
| U.S. TREASURY 1 YEAR INDEX + 2.460% 4.585% 9/1/34 (b)(c) | | 23 | 23 |
| U.S. TREASURY 1 YEAR INDEX + 2.460% 5.324% 7/1/34 (b)(c) | | 147 | 149 |
| 1.5% 1/1/51 to 8/1/51 | | 11,303 | 8,687 |
| 2% 2/1/28 to 2/1/37 | | 14,020 | 12,505 |
| 2.5% 1/1/28 to 11/1/41 | | 13,124 | 11,884 |
| 3% 2/1/33 to 3/1/52 | | 3,510 | 3,207 |
| 3.5% 1/1/52 to 4/1/52 | | 14,980 | 13,594 |
| 4.5% 9/1/52 to 11/1/52 | | 4,456 | 4,269 |
| 5% 10/1/52 to 12/1/52 | | 7,192 | 7,099 |
| 5.5% 11/1/52 to 7/1/53 | | 23,642 | 23,594 |
| 6% 11/1/52 to 6/1/53 | | 10,849 | 11,042 |
| 8.5% 12/1/27 | | 8 | 8 |
TOTAL FANNIE MAE | | | 96,709 |
| Freddie Mac - 4.4% | | | |
| 12 month U.S. LIBOR + 1.860% 4.11% 8/1/34 (b)(c) | | 45 | 46 |
| 12 month U.S. LIBOR + 1.860% 5.239% 4/1/36 (b)(c) | | 49 | 50 |
| 12 month U.S. LIBOR + 1.960% 5.711% 6/1/33 (b)(c) | | 80 | 80 |
| 12 month U.S. LIBOR + 2.030% 4.158% 3/1/33 (b)(c) | | 1 | 1 |
| 6 month U.S. LIBOR + 1.880% 4.488% 10/1/36 (b)(c) | | 116 | 116 |
| 6 month U.S. LIBOR + 1.990% 4.664% 10/1/35 (b)(c) | | 63 | 63 |
| U.S. TREASURY 1 YEAR INDEX + 2.030% 4.858% 6/1/33 (b)(c) | | 89 | 89 |
| U.S. TREASURY 1 YEAR INDEX + 2.230% 4.342% 12/1/35 (b)(c) | | 380 | 384 |
| U.S. TREASURY 1 YEAR INDEX + 2.260% 5.195% 6/1/33 (b)(c) | | 156 | 156 |
| U.S. TREASURY 1 YEAR INDEX + 2.430% 4.962% 3/1/35 (b)(c) | | 306 | 310 |
| 1.5% 1/1/51 to 4/1/51 | | 22,846 | 17,550 |
| 2% 3/1/36 to 1/1/37 | | 3,383 | 2,999 |
| 2.5% 1/1/28 to 4/1/42 | | 6,758 | 6,015 |
| 3% 2/1/34 to 3/1/52 | | 5,109 | 4,797 |
| 3.5% 9/1/51 to 3/1/52 | | 15,491 | 14,103 |
| 4.5% 9/1/52 (d)(e)(f) | | 20,635 | 19,766 |
| 5% 10/1/52 to 12/1/52 | | 19,870 | 19,489 |
| 5.5% 12/1/52 to 8/1/53 | | 14,509 | 14,511 |
| 6.5% 1/1/53 | | 563 | 575 |
TOTAL FREDDIE MAC | | | 101,100 |
| Ginnie Mae - 98.8% | | | |
| 3% 5/15/27 to 12/20/50 | | 179,536 | 161,899 |
| 3.5% 9/15/26 to 5/20/50 (d)(e) | | 245,431 | 228,775 |
| 3.7% 10/15/42 | | 3,990 | 3,722 |
| 4% 5/15/44 | | 865 | 828 |
| 4.5% 7/15/33 to 11/20/52 | | 95,485 | 92,607 |
| 4.75% 7/15/40 | | 346 | 339 |
| 4.875% 9/15/39 to 12/15/39 | | 3,050 | 3,006 |
| 5.09% 4/15/36 to 11/15/36 | | 2,544 | 2,517 |
| 5.15% 2/15/36 | | 96 | 95 |
| 5.2% 7/15/36 | | 48 | 48 |
| 5.25% 4/15/36 to 4/15/37 | | 166 | 165 |
| 5.39% 5/15/36 | | 45 | 45 |
| 5.45% 2/15/37 | | 415 | 416 |
| 5.5% 7/20/24 to 2/20/42 | | 3,826 | 3,868 |
| 5.6% 11/15/36 | | 134 | 136 |
| 5.85% 1/15/37 | | 31 | 31 |
| 6.45% 1/15/32 to 8/15/32 | | 88 | 89 |
| 6.5% 9/15/23 to 1/15/39 | | 2,636 | 2,723 |
| 7% to 7% 9/15/23 to 9/20/34 | | 5,721 | 5,871 |
| 7.25% 9/15/27 | | 19 | 19 |
| 7.5% to 7.5% 8/15/23 to 8/20/32 | | 1,909 | 1,966 |
| 8% 12/15/23 to 9/15/31 | | 479 | 493 |
| 8.5% 9/15/30 to 2/15/31 | | 102 | 108 |
| 9% 9/15/23 to 5/15/30 | | 1 | 1 |
| 2% 9/20/50 to 4/20/51 | | 389,250 | 326,451 |
| 2% 8/1/53 (g) | | 43,950 | 36,738 |
| 2% 8/1/53 (g) | | 21,950 | 18,348 |
| 2% 8/1/53 (g) | | 8,750 | 7,314 |
| 2% 8/1/53 (g) | | 44,650 | 37,323 |
| 2% 8/1/53 (g) | | 29,300 | 24,492 |
| 2% 8/1/53 (g) | | 63,450 | 53,038 |
| 2% 8/1/53 (g) | | 20,875 | 17,450 |
| 2% 8/1/53 (g) | | 17,425 | 14,566 |
| 2% 9/1/53 (g) | | 65,400 | 54,735 |
| 2% 9/1/53 (g) | | 86,600 | 72,477 |
| 2% 9/1/53 (g) | | 14,950 | 12,512 |
| 2.25% 5/20/50 | | 1,893 | 1,586 |
| 2.375% 5/20/50 | | 1,371 | 1,158 |
| 2.5% 3/15/28 to 10/20/52 | | 372,147 | 322,826 |
| 2.5% 8/1/53 (g) | | 49,750 | 42,915 |
| 2.5% 8/1/53 (g) | | 99,450 | 85,786 |
| 2.5% 8/1/53 (g) | | 33,750 | 29,113 |
| 2.5% 8/1/53 (g) | | 19,300 | 16,648 |
| 2.5% 8/1/53 (g) | | 16,550 | 14,276 |
| 2.5% 9/1/53 (g) | | 49,850 | 43,044 |
| 2.5% 9/1/53 (g) | | 49,800 | 43,001 |
| 2.625% 5/20/50 | | 3,770 | 3,245 |
| 2.75% 5/20/50 | | 1,636 | 1,420 |
| 3% 8/1/53 (g) | | 97,750 | 87,007 |
| 3% 8/1/53 (g) | | 52,400 | 46,641 |
| 3% 8/1/53 (g) | | 65,150 | 57,990 |
| 3% 8/1/53 (g) | | 19,450 | 17,312 |
| 3% 8/1/53 (g) | | 25,950 | 23,098 |
| 3.25% 2/20/41 to 7/20/46 | | 867 | 759 |
| 3.375% 5/20/50 | | 452 | 411 |
| 3.5% 8/1/53 (g) | | 17,800 | 16,365 |
| 3.5% 8/1/53 (g) | | 3,300 | 3,034 |
| 3.5% 8/1/53 (g) | | 3,550 | 3,264 |
| 3.5% 8/1/53 (g) | | 2,700 | 2,482 |
| 3.5% 8/1/53 (g) | | 2,250 | 2,069 |
| 3.5% 8/1/53 (g) | | 4,000 | 3,678 |
| 3.5% 9/1/53 (g) | | 7,250 | 6,667 |
| 3.74% 7/20/42 to 8/20/42 | | 323 | 302 |
| 3.75% 10/20/41 to 7/20/47 | | 16,670 | 15,693 |
| 4% 2/20/33 to 1/20/50 | | 140,074 | 133,832 |
| 4% 8/1/53 (g) | | 8,050 | 7,584 |
| 4.25% 1/20/46 | | 295 | 285 |
| 5% 6/20/29 to 7/20/48 | | 42,116 | 41,887 |
| 5.35% 4/20/29 to 12/20/30 | | 3,595 | 3,566 |
| 5.5% 8/1/53 (g) | | 3,575 | 3,554 |
| 5.5% 8/1/53 (g) | | 4,125 | 4,101 |
| 5.75% 9/20/39 to 9/20/40 | | 5,876 | 6,008 |
| 6% to 6% 12/20/23 to 3/15/39 | | 5,532 | 5,621 |
| 7.395% 7/20/25 to 2/20/27 | | 98 | 99 |
TOTAL GINNIE MAE | | | 2,283,538 |
| Uniform Mortgage Backed Securities - 4.5% | | | |
| 2.5% 8/1/53 (g) | | 1,150 | 970 |
| 2.5% 8/1/53 (g) | | 775 | 653 |
| 2.5% 8/1/53 (g) | | 600 | 506 |
| 5% 8/1/38 (g) | | 2,300 | 2,285 |
| 5% 8/1/38 (g) | | 11,600 | 11,524 |
| 5% 8/1/38 (g) | | 6,625 | 6,582 |
| 5% 8/1/38 (g) | | 3,500 | 3,477 |
| 5% 8/1/38 (g) | | 3,475 | 3,452 |
| 5% 9/1/38 (g) | | 8,150 | 8,100 |
| 5.5% 8/1/53 (g) | | 17,750 | 17,632 |
| 5.5% 8/1/53 (g) | | 10,650 | 10,579 |
| 5.5% 8/1/53 (g) | | 8,750 | 8,692 |
| 5.5% 8/1/53 (g) | | 5,700 | 5,662 |
| 5.5% 9/1/53 (g) | | 17,600 | 17,485 |
| 5.5% 9/1/53 (g) | | 7,750 | 7,699 |
TOTAL UNIFORM MORTGAGE BACKED SECURITIES | | | 105,298 |
| TOTAL U.S. GOVERNMENT AGENCY - MORTGAGE SECURITIES (Cost $2,704,926) | | | 2,586,645 |
| | | | |
| Collateralized Mortgage Obligations - 13.4% |
| | | Principal Amount (a) (000s) | Value ($) (000s) |
| U.S. Government Agency - 13.4% | | | |
| Fannie Mae: | | | |
| planned amortization class Series G93-32 Class PJ, 6.75% 9/25/23 | | 5 | 5 |
| sequential payer: | | | |
Series 2020-101 Class BA, 1.5% 9/25/45 | | 2,096 | 1,756 |
Series 2020-49 Class JA, 2% 8/25/44 | | 912 | 810 |
Series 2021-68 Class A, 2% 7/25/49 | | 1,793 | 1,438 |
Series 2021-85 Class L, 2.5% 8/25/48 | | 977 | 849 |
Series 2021-96 Class HA, 2.5% 2/25/50 | | 1,622 | 1,416 |
Series 2022-3 Class N, 2% 10/25/47 | | 11,196 | 9,389 |
Series 2022-4 Class B, 2.5% 5/25/49 | | 1,179 | 1,027 |
| Series 2016-3 Class IP, 4% 2/25/46 (h) | | 16,076 | 2,962 |
| Series 2016-78 Class IO, 3.5% 11/25/46 (h) | | 4,125 | 656 |
| Series 2017-74 Class SH, 6.080% - U.S. 30-Day Avg. Secured Overnight Fin. Rate (SOFR) Index 1.0165% 10/25/47 (b)(h)(i) | | 12,978 | 1,379 |
| Series 2021-59 Class H, 2% 6/25/48 | | 1,012 | 831 |
| Series 2021-66: | | | |
Class DA, 2% 1/25/48 | | 1,093 | 901 |
Class DM, 2% 1/25/48 | | 1,162 | 957 |
| Fannie Mae Stripped Mortgage-Backed Securities: | | | |
| Series 331 Class 12, 6.5% 2/25/33 (b)(h) | | 90 | 15 |
| Series 339 Class 5, 5.5% 7/25/33 (h) | | 114 | 18 |
| Series 343 Class 16, 5.5% 5/25/34 (h) | | 107 | 17 |
| Freddie Mac: | | | |
| planned amortization class: | | | |
Series 2220 Class PD, 8% 3/15/30 | | 198 | 205 |
Series 40 Class K, 6.5% 8/17/24 | | 3 | 3 |
| sequential payer: | | | |
Series 2021-5175 Class CB, 2.5% 4/25/50 | | 5,768 | 4,970 |
Series 2021-5180 Class KA, 2.5% 10/25/47 | | 1,167 | 1,027 |
Series 2022-5191 Class CA, 2.5% 4/25/50 | | 1,379 | 1,190 |
Series 2022-5198 Class BA, 2.5% 11/25/47 | | 3,867 | 3,393 |
Series 2204 Class N, 7.5% 12/20/29 | | 442 | 453 |
| Series 2018-4763 Class SC, 6.080% - U.S. 30-Day Avg. Secured Overnight Fin. Rate (SOFR) Index 1.0176% 8/15/47 (b)(h)(i) | | 5,851 | 612 |
| Series 2021-5083 Class VA, 1% 8/15/38 | | 5,111 | 4,716 |
| Series 2021-5176 Class AG, 2% 1/25/47 | | 4,369 | 3,743 |
| Series 2021-5182 Class A, 2.5% 10/25/48 | | 7,540 | 6,510 |
| Freddie Mac Multi-family Structured pass-thru certificates sequential payer Series 2021-5159 Class GC, 2% 11/25/47 | | 937 | 803 |
| Ginnie Mae Series 2011-93 Class SA, 6.540% - CME Term SOFR 1 Month Index 1.291% 7/20/41 (b)(h)(i) | | 6,889 | 805 |
| Ginnie Mae guaranteed REMIC pass-thru certificates: | | | |
| floater: | | | |
Series 2007-37 Class TS, 6.570% - CME Term SOFR 1 Month Index 1.3539% 6/16/37 (b)(h)(i) | | 597 | 56 |
Series 2008-51 Class FE, CME Term SOFR 1 Month Index + 0.860% 6.0861% 6/16/38 (b)(c) | | 156 | 155 |
Series 2008-57 Class AF, CME Term SOFR 1 Month Index + 0.690% 5.9491% 7/20/38 (b)(c) | | 400 | 396 |
Series 2010-130 Class KF, CME Term SOFR 1 Month Index + 0.760% 5.9861% 10/16/40 (b)(c) | | 744 | 738 |
Series 2010-H03 Class FA, 1 month U.S. LIBOR + 0.550% 5.6984% 3/20/60 (b)(c)(j) | | 6,068 | 6,042 |
Series 2010-H17 Class FA, 1 month U.S. LIBOR + 0.330% 5.4784% 7/20/60 (b)(c)(j) | | 6,112 | 6,063 |
Series 2010-H18 Class AF, 1 month U.S. LIBOR + 0.300% 5.463% 9/20/60 (b)(c)(j) | | 6,586 | 6,533 |
Series 2010-H19 Class FG, 1 month U.S. LIBOR + 0.300% 5.463% 8/20/60 (b)(c)(j) | | 5,237 | 5,194 |
Series 2010-H27 Class FA, 1 month U.S. LIBOR + 0.380% 5.543% 12/20/60 (b)(c)(j) | | 2,447 | 2,431 |
Series 2011-H05 Class FA, 1 month U.S. LIBOR + 0.500% 5.663% 12/20/60 (b)(c)(j) | | 2,166 | 2,156 |
Series 2011-H07 Class FA, 1 month U.S. LIBOR + 0.500% 5.663% 2/20/61 (b)(c)(j) | | 454 | 452 |
Series 2011-H12 Class FA, 1 month U.S. LIBOR + 0.490% 5.653% 2/20/61 (b)(c)(j) | | 2,883 | 2,868 |
Series 2011-H13 Class FA, 1 month U.S. LIBOR + 0.500% 5.663% 4/20/61 (b)(c)(j) | | 1,995 | 1,985 |
Series 2011-H14: | | | |
Class FB, 1 month U.S. LIBOR + 0.500% 5.663% 5/20/61 (b)(c)(j) | | 3,145 | 3,132 |
Class FC, 1 month U.S. LIBOR + 0.500% 5.663% 5/20/61 (b)(c)(j) | | 2,350 | 2,338 |
Series 2011-H17 Class FA, 1 month U.S. LIBOR + 0.530% 5.693% 6/20/61 (b)(c)(j) | | 2,673 | 2,661 |
Series 2011-H21 Class FA, 1 month U.S. LIBOR + 0.600% 5.763% 10/20/61 (b)(c)(j) | | 3,064 | 3,053 |
Series 2012-48 Class FA, CME Term SOFR 1 Month Index + 0.460% 5.6861% 4/16/42 (b)(c) | | 290 | 283 |
Series 2012-76 Class GF CME Term SOFR 1 Month Index + 0.410% 5.6361% 6/16/42 (b)(c) | | 333 | 327 |
Series 2012-H01 Class FA, 1 month U.S. LIBOR + 0.700% 5.863% 11/20/61 (b)(c)(j) | | 3,033 | 3,024 |
Series 2012-H03 Class FA, 1 month U.S. LIBOR + 0.700% 5.863% 1/20/62 (b)(c)(j) | | 1,658 | 1,654 |
Series 2012-H06 Class FA, 1 month U.S. LIBOR + 0.630% 5.793% 1/20/62 (b)(c)(j) | | 3,010 | 2,999 |
Series 2012-H07 Class FA, 1 month U.S. LIBOR + 0.630% 5.793% 3/20/62 (b)(c)(j) | | 1,381 | 1,375 |
Series 2012-H21 Class DF, 1 month U.S. LIBOR + 0.650% 4.8713% 5/20/61 (b)(c)(j) | | 23 | 22 |
Series 2015-H13 Class FL, 1 month U.S. LIBOR + 0.280% 4.9087% 5/20/63 (b)(c)(j) | | 26 | 26 |
Series 2015-H19 Class FA, 1 month U.S. LIBOR + 0.200% 4.9297% 4/20/63 (b)(c)(j) | | 41 | 40 |
Series 2016-12 Class FA, CME Term SOFR 1 Month Index + 0.460% 5.7191% 1/20/46 (b)(c) | | 762 | 736 |
Series 2019-42 Class FK, CME Term SOFR 1 Month Index + 0.560% 5.8191% 4/20/49 (b)(c) | | 5,413 | 5,269 |
| planned amortization class: | | | |
Series 2003-74 Class PZ, 5.5% 8/20/33 | | 2,551 | 2,562 |
Series 2004-19 Class DP, 5.5% 3/20/34 | | 1 | 1 |
Series 2005-24 Class TC, 5.5% 3/20/35 | | 1,777 | 1,782 |
Series 2005-57 Class PB, 5.5% 7/20/35 | | 2,595 | 2,641 |
Series 2006-50 Class JC, 5% 6/20/36 | | 455 | 450 |
Series 2010-158 Class MS, 9.770% - CME Term SOFR 1 Month Index 0% 12/20/40 (b)(i) | | 2,189 | 1,737 |
Series 2011-136 Class WI, 4.5% 5/20/40 (h) | | 176 | 11 |
Series 2015-24 Class PI, 3.5% 2/20/45 (h) | | 8,467 | 1,284 |
Series 2016-69 Class WA, 3% 2/20/46 | | 1,020 | 929 |
Series 2017-134 Class BA, 2.5% 11/20/46 | | 435 | 386 |
Series 2017-139 Class K, 3% 8/20/47 | | 14,137 | 12,797 |
Series 2017-153 Class GA, 3% 9/20/47 | | 2,808 | 2,518 |
Series 2017-182 Class KA, 3% 10/20/47 | | 2,199 | 1,974 |
Series 2018-13 Class Q, 3% 4/20/47 | | 2,790 | 2,542 |
| sequential payer: | | | |
Series 2003-75 Class ZA, 5.5% 9/20/33 | | 779 | 770 |
Series 2004-24 Class ZM, 5% 4/20/34 | | 1,624 | 1,584 |
Series 2004-46 Class BZ, 6% 6/20/34 | | 986 | 989 |
Series 2004-86 Class G, 6% 10/20/34 | | 6,273 | 6,427 |
Series 2005-26 Class ZA, 5.5% 1/20/35 | | 7,374 | 7,475 |
Series 2005-47 Class ZY, 6% 6/20/35 | | 5,319 | 5,431 |
Series 2005-6 Class EX, 5.5% 11/20/34 | | 1,001 | 1,017 |
Series 2005-82 Class JV, 5% 6/20/35 | | 1,412 | 1,412 |
Series 2006-2 Class Z, 5.5% 1/20/36 | | 3,218 | 3,266 |
Series 2010-160 Class DY, 4% 12/20/40 | | 14,474 | 13,880 |
Series 2010-168 Class BG, 4% 4/20/40 | | 5,970 | 5,734 |
Series 2010-170 Class B, 4% 12/20/40 | | 2,282 | 2,189 |
Series 2011-21 Class SB, 9.270% - CME Term SOFR 1 Month Index 0% 2/16/41 (b)(i) | | 5,042 | 4,196 |
Series 2011-72 Class SE, 7.250% - CME Term SOFR 1 Month Index 0.1986% 5/16/41 (b)(i) | | 9,501 | 7,968 |
Series 2017-139 Class BA, 3% 9/20/47 | | 4,804 | 4,308 |
Series 2018-H12 Class HA, 3.25% 8/20/68 (j) | | 11,519 | 10,974 |
| Series 2004-32: | | | |
Class GS, 6.380% - CME Term SOFR 1 Month Index 1.1639% 5/16/34 (b)(h)(i) | | 191 | 12 |
Class SG, 6.380% - CME Term SOFR 1 Month Index 1.131% 3/20/33 (b)(h)(i) | | 2,344 | 110 |
| Series 2004-59 Class SC, 7.080% - CME Term SOFR 1 Month Index 1.8639% 8/16/34 (b)(h)(i) | | 1,108 | 87 |
| Series 2004-73 Class AL, 7.080% - CME Term SOFR 1 Month Index 1.8639% 8/17/34 (b)(h)(i) | | 338 | 34 |
| Series 2005-13 Class SA, 6.680% - CME Term SOFR 1 Month Index 1.431% 2/20/35 (b)(h)(i) | | 1,880 | 138 |
| Series 2005-6 Class EY, 5.5% 11/20/33 | | 1,016 | 1,006 |
| Series 2005-82 Class NS, 6.180% - CME Term SOFR 1 Month Index 0.931% 7/20/34 (b)(h)(i) | | 1,912 | 158 |
| Series 2006-13 Class DS, 10.920% x CME Term SOFR 1 Month Index 3.0464% 3/20/36 (b)(c)(i) | | 2,001 | 1,968 |
| Series 2007-35 Class SC, 39.510% x CME Term SOFR 1 Month Index 8.1833% 6/16/37 (b)(c)(i) | | 424 | 469 |
| Series 2009-13 Class E, 4.5% 3/16/39 | | 1,728 | 1,677 |
| Series 2009-42 Class AY, 5% 6/16/37 | | 1,139 | 1,130 |
| Series 2010-14 Class SN, 5.830% - CME Term SOFR 1 Month Index 0.6139% 2/16/40 (b)(h)(i) | | 1,317 | 66 |
| Series 2010-H10 Class FA, 1 month U.S. LIBOR + 0.330% 5.4784% 5/20/60 (b)(c)(j) | | 3,778 | 3,750 |
| Series 2011-52 Class HI, 7% 4/16/41 (h) | | 261 | 39 |
| Series 2011-54 Class SA, 5.880% - CME Term SOFR 1 Month Index 0.631% 4/20/41 (b)(h)(i) | | 3,220 | 285 |
| Series 2012-103 Class IL, 3% 8/20/27 (h) | | 6,341 | 233 |
| Series 2012-75 Class SA, 5.930% - CME Term SOFR 1 Month Index 0.681% 6/20/42 (b)(h)(i) | | 6,334 | 619 |
| Series 2012-76 Class GS, 6.580% - CME Term SOFR 1 Month Index 1.3639% 6/16/42 (b)(h)(i) | | 1,010 | 86 |
| Series 2013-149 Class MA, 2.5% 5/20/40 | | 9,691 | 9,205 |
| Series 2013-182 Class IQ, 4.5% 12/16/43 (h) | | 2,822 | 476 |
| Series 2013-39 Class GS, 9.270% - CME Term SOFR 1 Month Index 0% 3/20/41 (b)(i) | | 12,748 | 10,618 |
| Series 2014-133 Class IB, 5% 9/20/44 (h) | | 2,711 | 523 |
| Series 2014-146 Class EI, 5% 10/20/44 (h) | | 5,166 | 1,041 |
| Series 2014-154 Class IO, 5% 10/20/44 (h) | | 1,047 | 208 |
| Series 2014-158 Class ID, 5% 10/20/44 (h) | | 4,534 | 911 |
| Series 2014-178 Class IO, 5% 11/20/44 (h) | | 6,480 | 1,277 |
| Series 2014-2 Class BA, 3% 1/20/44 | | 3,481 | 3,136 |
| Series 2014-21 Class HA, 3% 2/20/44 | | 1,285 | 1,161 |
| Series 2014-25 Class HC, 3% 2/20/44 | | 2,189 | 1,968 |
| Series 2014-5 Class A, 3% 1/20/44 | | 1,857 | 1,675 |
| Series 2015-117 Class KI, 5% 8/20/45 (h) | | 6,194 | 1,203 |
| Series 2015-14 Class IO, 5% 10/20/44 (h) | | 7,017 | 1,371 |
| Series 2015-79 Class IC, 5% 5/20/45 (h) | | 3,376 | 657 |
| Series 2015-H21: | | | |
Class HZ, 4.281% 6/20/63 (b)(j) | | 449 | 436 |
Class JZ, 4.5941% 6/20/65 (b)(j) | | 174 | 170 |
| Series 2016-146 Class AL, 5.6986% 5/20/40 (b) | | 2,108 | 2,119 |
| Series 2016-17 Class A, 3% 2/16/46 | | 13,907 | 12,648 |
| Series 2016-171 Class BI, 5% 10/20/44 (h) | | 6,301 | 1,247 |
| Series 2017-186 Class HK, 3% 11/16/45 | | 6,565 | 5,911 |
| Series 2017-75 Class PT, 5.7321% 4/20/47 (b) | | 7,752 | 7,769 |
| Series 2017-H06 Class FA, U.S. TREASURY 1 YEAR INDEX + 0.350% 5.5% 8/20/66 (b)(c)(j) | | 7,546 | 7,510 |
| | | | |
| TOTAL COLLATERALIZED MORTGAGE OBLIGATIONS (Cost $342,076) | | | 309,205 |
| | | | |
| Commercial Mortgage Securities - 1.2% |
| | | Principal Amount (a) (000s) | Value ($) (000s) |
| Freddie Mac: | | | |
| sequential payer: | | | |
Series 2015-K049 Class A2, 3.01% 7/25/25 | | 213 | 204 |
Series 2015-K051 Class A2, 3.308% 9/25/25 | | 337 | 324 |
Series 2021-K126 Class A2, 2.074% 1/25/31 | | 2,700 | 2,261 |
Series 2021-K127 Class A2, 2.108% 1/25/31 | | 4,000 | 3,354 |
Series 2022-150 Class A2, 3.71% 9/25/32 | | 1,800 | 1,674 |
Series 2022-K140 Class A2, 2.25% 1/25/32 | | 3,629 | 3,020 |
Series 2022-K750 Class A2, 3% 9/25/29 | | 5,736 | 5,240 |
| Series 2017-K727 Class A2, 2.946% 7/25/24 | | 3,986 | 3,893 |
| Series 2022 K748 Class A2, 2.26% 1/25/29 | | 5,200 | 4,597 |
| Series K063 Class A2, 3.43% 1/25/27 | | 3,300 | 3,145 |
| Ginnie Mae guaranteed Multi-family REMIC pass-thru securities sequential payer Series 2001-58 Class X, 0.4902% 9/16/41 (b)(h) | | 264 | 0 |
| Ginnie Mae guaranteed REMIC pass-thru certificates: | | | |
| sequential payer Series 2002-81 Class IO, 0.9708% 9/16/42 (b)(h) | | 1,345 | 23 |
| Series 2002-62 Class IO, 1.1703% 8/16/42 (b)(h) | | 596 | 7 |
| TOTAL COMMERCIAL MORTGAGE SECURITIES (Cost $34,956) | | | 27,742 |
| | | | |
| Money Market Funds - 11.3% |
| | | Shares | Value ($) (000s) |
Fidelity Cash Central Fund 5.32% (k) (Cost $260,948) | | 260,895,764 | 260,948 |
| | | | |
| TOTAL INVESTMENT IN SECURITIES - 144.2% (Cost $3,493,136) | 3,332,096 |
NET OTHER ASSETS (LIABILITIES) - (44.2)% | (1,021,237) |
| NET ASSETS - 100.0% | 2,310,859 |
| | |
| TBA Sale Commitments |
| | Principal Amount (a) (000s) | Value ($) (000s) |
| Ginnie Mae | | |
| 2% 8/1/53 | (65,400) | (54,668) |
| 2% 8/1/53 | (86,600) | (72,389) |
| 2% 8/1/53 | (14,950) | (12,497) |
| 2.5% 8/1/53 | (49,850) | (43,000) |
| 2.5% 8/1/53 | (49,800) | (42,957) |
| 3.5% 8/1/53 | (5,200) | (4,781) |
| 3.5% 8/1/53 | (7,250) | (6,666) |
| | | |
| TOTAL GINNIE MAE | | (236,958) |
| | | |
| Uniform Mortgage Backed Securities | | |
| 2.5% 8/1/53 | (2,525) | (2,129) |
| 3.5% 8/1/53 | (9,425) | (8,544) |
| 4.5% 8/1/53 | (4,000) | (3,831) |
| 5% 8/1/38 | (5,700) | (5,663) |
| 5% 8/1/38 | (8,150) | (8,097) |
| 5% 8/1/53 | (4,750) | (4,642) |
| 5.5% 8/1/53 | (17,600) | (17,483) |
| 5.5% 8/1/53 | (7,750) | (7,699) |
| 5.5% 8/1/53 | (800) | (795) |
| 5.5% 8/1/53 | (3,000) | (2,980) |
| 5.5% 8/1/53 | (750) | (745) |
| 5.5% 8/1/53 | (3,200) | (3,179) |
| | | |
| TOTAL UNIFORM MORTGAGE BACKED SECURITIES | | (65,787) |
| | | |
TOTAL TBA SALE COMMITMENTS (Proceeds $303,625) | | (302,745) |
| Futures Contracts |
| | Number of contracts | Expiration Date | Notional Amount ($) (000s) | Value ($) (000s) | Unrealized Appreciation/ (Depreciation) ($) (000s) |
| Purchased | | | | | |
| | | | | | |
| Treasury Contracts | | | | | |
| CBOT 2-Year U.S. Treasury Note Contracts (United States) | 260 | Sep 2023 | 52,788 | (506) | (506) |
| CBOT Ultra Long Term U.S. Treasury Bond Contracts (United States) | 5 | Sep 2023 | 661 | (12) | (12) |
| | | | | | |
| TOTAL PURCHASED | | | | | (518) |
| | | | | | |
| Sold | | | | | |
| | | | | | |
| Treasury Contracts | | | | | |
| CBOT 10-Year U.S. Treasury Note Contracts (United States) | 2,007 | Sep 2023 | 223,592 | 5,553 | 5,553 |
| CBOT 5-Year U.S. Treasury Note Contracts (United States) | 25 | Sep 2023 | 2,671 | 9 | 9 |
| CBOT Long Term U.S. Treasury Bond Contracts (United States) | 456 | Sep 2023 | 56,744 | 1,301 | 1,301 |
| | | | | | |
| TOTAL SOLD | | | | | 6,863 |
| | | | | | |
| TOTAL FUTURES CONTRACTS | | | | | 6,345 |
| The notional amount of futures purchased as a percentage of Net Assets is 2.3% |
| The notional amount of futures sold as a percentage of Net Assets is 12.3% |
For the period, the average monthly notional amount at value for futures contracts in the aggregate was $376,671,000.
| Interest Rate Swaps |
| Payment Received | Payment Frequency | Payment Paid | Payment Frequency | Clearinghouse / Counterparty(1) | Maturity Date | Notional Amount (000s)(2) | Value ($) (000s) | Upfront Premium Received/ (Paid) ($) (000s)(3) | Unrealized Appreciation/ (Depreciation) ($) (000s) |
| 3.75% | Annual | U.S. Secured Overnight Fin. Rate (SOFR) Index(4) | Annual | LCH | Sep 2028 | | 3,512 | (51) | 0 | (51) |
| 3.5% | Annual | U.S. Secured Overnight Fin. Rate (SOFR) Index(4) | Annual | LCH | Sep 2033 | | 1,338 | (25) | 0 | (25) |
| 3.25% | Annual | U.S. Secured Overnight Fin. Rate (SOFR) Index(4) | Annual | LCH | Sep 2053 | | 3,709 | (101) | 0 | (101) |
| TOTAL INTEREST RATE SWAPS | | | | | | | | (177) | 0 | (177) |
(1)Swaps with LCH Clearnet Group (LCH) are centrally cleared over-the-counter (OTC) swaps.
(2)Notional amount is stated in U.S. Dollars unless otherwise noted.
(3)Any premiums for centrally cleared over-the-counter (OTC) swaps are recorded periodically throughout the term of the swap to variation margin and included in unrealized appreciation (depreciation).
(4)Represents floating rate.
Any values shown as $0 in the Schedule of Investments may reflect amounts less than $500.
Legend
| (a) | Amount is stated in United States dollars unless otherwise noted. |
| (b) | Coupon rates for floating and adjustable rate securities reflect the rates in effect at period end. |
| (c) | Coupon is indexed to a floating interest rate which may be multiplied by a specified factor and/or subject to caps or floors. |
| (d) | Security or a portion of the security was pledged to cover margin requirements for futures contracts. At period end, the value of securities pledged amounted to $6,082,000. |
| (e) | Security or a portion of the security was pledged to cover margin requirements for centrally cleared OTC swaps. At period end, the value of securities pledged amounted to $553,000. |
| (f) | Security or a portion of the security has been segregated as collateral for mortgage-backed or asset-backed securities purchased on a delayed delivery or when-issued basis. At period end, the value of securities pledged amounted to $2,167,000. |
| (g) | Security or a portion of the security purchased on a delayed delivery or when-issued basis. |
| (h) | Interest Only (IO) security represents the right to receive only monthly interest payments on an underlying pool of mortgages or assets. Principal shown is the outstanding par amount of the pool as of the end of the period. |
| (i) | Coupon is inversely indexed to a floating interest rate multiplied by a specified factor. The price may be considerably more volatile than the price of a comparable fixed rate security. |
| (j) | Represents an investment in an underlying pool of reverse mortgages which typically do not require regular principal and interest payments as repayment is deferred until a maturity event. |
| (k) | Affiliated fund that is generally available only to investment companies and other accounts managed by Fidelity Investments. The rate quoted is the annualized seven-day yield of the fund at period end. A complete unaudited listing of the fund's holdings as of its most recent quarter end is available upon request. In addition, each Fidelity Central Fund's financial statements, which are not covered by the Fund's Report of Independent Registered Public Accounting Firm, are available on the SEC's website or upon request. |
Affiliated Central Funds
Fiscal year to date information regarding the Fund's investments in Fidelity Central Funds, including the ownership percentage, is presented below.
| Affiliate (Amounts in thousands) | Value, beginning of period ($) | Purchases ($) | Sales Proceeds ($) | Dividend Income ($) | Realized Gain (loss) ($) | Change in Unrealized appreciation (depreciation) ($) | Value, end of period ($) | % ownership, end of period |
| Fidelity Cash Central Fund 5.32% | 877,434 | 767,588 | 1,384,074 | 21,726 | - | - | 260,948 | 0.6% |
| Fidelity Securities Lending Cash Central Fund 5.32% | - | 147,880 | 147,880 | 10 | - | - | - | 0.0% |
| Total | 877,434 | 915,468 | 1,531,954 | 21,736 | - | - | 260,948 | |
| | | | | | | | | |
Amounts in the dividend income column in the above table include any capital gain distributions from underlying funds, which are presented in the corresponding line item in the Statement of Operations, if applicable.
Amounts in the dividend income column for Fidelity Securities Lending Cash Central Fund represents the income earned on investing cash collateral, less rebates paid to borrowers and any lending agent fees associated with the loan, plus any premium payments received for lending certain types of securities.
Amounts included in the purchases and sales proceeds columns may include in-kind transactions, if applicable.
Investment Valuation
The following is a summary of the inputs used, as of July 31, 2023, involving the Fund's assets and liabilities carried at fair value. The inputs or methodology used for valuing securities may not be an indication of the risk associated with investing in those securities. For more information on valuation inputs, and their aggregation into the levels used below, please refer to the Investment Valuation section in the accompanying Notes to Financial Statements.
| Valuation Inputs at Reporting Date: |
Description (Amounts in thousands) | Total ($) | Level 1 ($) | Level 2 ($) | Level 3 ($) |
Investments in Securities: | | | | |
|
| U.S. Government and Government Agency Obligations | 147,556 | - | 147,556 | - |
|
| U.S. Government Agency - Mortgage Securities | 2,586,645 | - | 2,586,645 | - |
|
| Collateralized Mortgage Obligations | 309,205 | - | 309,205 | - |
|
| Commercial Mortgage Securities | 27,742 | - | 27,742 | - |
|
| Money Market Funds | 260,948 | 260,948 | - | - |
| Total Investments in Securities: | 3,332,096 | 260,948 | 3,071,148 | - |
Derivative Instruments: | | | | |
|
| Assets | | | | |
Futures Contracts | 6,863 | 6,863 | - | - |
| Total Assets | 6,863 | 6,863 | - | - |
|
| Liabilities | | | | |
Futures Contracts | (518) | (518) | - | - |
Swaps | (177) | - | (177) | - |
| Total Liabilities | (695) | (518) | (177) | - |
| Total Derivative Instruments: | 6,168 | 6,345 | (177) | - |
Other Financial Instruments: | | | | |
|
| TBA Sale Commitments | (302,745) | - | (302,745) | - |
| Total Other Financial Instruments: | (302,745) | - | (302,745) | - |
Value of Derivative Instruments
The following table is a summary of the Fund's value of derivative instruments by primary risk exposure as of July 31, 2023. For additional information on derivative instruments, please refer to the Derivative Instruments section in the accompanying Notes to Financial Statements.
Primary Risk Exposure / Derivative Type | Value |
| (Amounts in thousands) | Asset ($) | Liability ($) |
| Interest Rate Risk | | |
Futures Contracts (a) | 6,863 | (518) |
| Total Interest Rate Risk | 6,863 | (518) |
| Other Risk | | |
Swaps (b) | 0 | (177) |
| Total Other Risk | 0 | (177) |
| Total Value of Derivatives | 6,863 | (695) |
(a)Reflects gross cumulative appreciation (depreciation) on futures contracts as presented in the Schedule of Investments. In the Statement of Assets and Liabilities, the period end daily variation margin is included in receivable or payable for daily variation margin on futures contracts, and the net cumulative appreciation (depreciation) is included in Total accumulated earnings (loss).
(b)For centrally cleared over-the-counter (OTC) swaps, reflects gross cumulative appreciation (depreciation) as presented in the Schedule of Investments. In the Statement of Assets and Liabilities, the period end daily variation margin for centrally cleared OTC swaps is included in receivable or payable for daily variation margin on centrally cleared OTC swaps, and the net cumulative appreciation (depreciation) for centrally cleared OTC swaps is included in Total accumulated earnings (loss).
| Statement of Assets and Liabilities |
| Amounts in thousands (except per-share amount) | | | | July 31, 2023 |
| | | | | |
| Assets | | | | |
| Investment in securities, at value - See accompanying schedule: | | | | |
Unaffiliated issuers (cost $3,232,188) | $ | 3,071,148 | | |
Fidelity Central Funds (cost $260,948) | | 260,948 | | |
| | | | | |
| | | | | |
| Total Investment in Securities (cost $3,493,136) | | | $ | 3,332,096 |
| Receivable for investments sold | | | | 73 |
| Receivable for TBA sale commitments | | | | 303,625 |
| Receivable for fund shares sold | | | | 592 |
| Interest receivable | | | | 7,671 |
| Distributions receivable from Fidelity Central Funds | | | | 1,183 |
| Receivable for daily variation margin on centrally cleared OTC swaps | | | | 19 |
| Other receivables | | | | 6 |
Total assets | | | | 3,645,265 |
| Liabilities | | | | |
| Payable for investments purchased | | | | |
Regular delivery | $ | 11,491 | | |
Delayed delivery | | 1,015,893 | | |
| TBA sale commitments, at value | | 302,745 | | |
| Payable for fund shares redeemed | | 2,408 | | |
| Distributions payable | | 799 | | |
| Accrued management fee | | 573 | | |
| Payable for daily variation margin on futures contracts | | 193 | | |
| Other affiliated payables | | 297 | | |
| Other payables and accrued expenses | | 7 | | |
| Total Liabilities | | | | 1,334,406 |
| Net Assets | | | $ | 2,310,859 |
| Net Assets consist of: | | | | |
| Paid in capital | | | $ | 2,721,493 |
| Total accumulated earnings (loss) | | | | (410,634) |
| Net Assets | | | $ | 2,310,859 |
Net Asset Value, offering price and redemption price per share ($2,310,859 ÷ 229,678 shares) | | | $ | 10.06 |
| Statement of Operations |
| Amounts in thousands | | | | Year ended July 31, 2023 |
| Investment Income | | | | |
| Interest | | | $ | 70,376 |
| Income from Fidelity Central Funds (including $10 from security lending) | | | | 21,736 |
| Total Income | | | | 92,112 |
| Expenses | | | | |
| Management fee | $ | 7,515 | | |
| Transfer agent fees | | 2,525 | | |
| Fund wide operations fee | | 1,314 | | |
| Independent trustees' fees and expenses | | 10 | | |
| Total expenses before reductions | | 11,364 | | |
| Expense reductions | | (5) | | |
| Total expenses after reductions | | | | 11,359 |
| Net Investment income (loss) | | | | 80,753 |
| Realized and Unrealized Gain (Loss) | | | | |
| Net realized gain (loss) on: | | | | |
| Investment Securities: | | | | |
| Unaffiliated issuers | | (95,271) | | |
| Futures contracts | | 14,717 | | |
| Swaps | | (252) | | |
| Total net realized gain (loss) | | | | (80,806) |
| Change in net unrealized appreciation (depreciation) on: | | | | |
| Investment Securities: | | | | |
| Unaffiliated issuers | | (146,471) | | |
| Futures contracts | | 10,436 | | |
| Swaps | | (1,981) | | |
| TBA Sale commitments | | 7,969 | | |
| Total change in net unrealized appreciation (depreciation) | | | | (130,047) |
| Net gain (loss) | | | | (210,853) |
| Net increase (decrease) in net assets resulting from operations | | | $ | (130,100) |
| Statement of Changes in Net Assets |
| |
| Amount in thousands | | Year ended July 31, 2023 | | Year ended July 31, 2022 |
| Increase (Decrease) in Net Assets | | | | |
| Operations | | | | |
| Net investment income (loss) | $ | 80,753 | $ | 34,502 |
| Net realized gain (loss) | | (80,806) | | (156,978) |
| Change in net unrealized appreciation (depreciation) | | (130,047) | | (98,381) |
| Net increase (decrease) in net assets resulting from operations | | (130,100) | | (220,857) |
| Distributions to shareholders | | (79,236) | | (43,898) |
| | | | | |
| Share transactions | | | | |
| Proceeds from sales of shares | | 189,947 | | 252,722 |
| Reinvestment of distributions | | 70,547 | | 39,254 |
| Cost of shares redeemed | | (633,058) | | (1,092,057) |
| | | | | |
Net increase (decrease) in net assets resulting from share transactions | | (372,564) | | (800,081) |
| Total increase (decrease) in net assets | | (581,900) | | (1,064,836) |
| | | | | |
| Net Assets | | | | |
| Beginning of period | | 2,892,759 | | 3,957,595 |
| End of period | $ | 2,310,859 | $ | 2,892,759 |
| | | | | |
| Other Information | | | | |
| Shares | | | | |
| Sold | | 18,607 | | 22,670 |
| Issued in reinvestment of distributions | | 6,944 | | 3,488 |
| Redeemed | | (62,311) | | (97,015) |
| Net increase (decrease) | | (36,760) | | (70,857) |
| | | | | |
| Years ended July 31, | | 2023 | | 2022 | | 2021 | | 2020 | | 2019 |
Selected Per-Share Data | | | | | | | | | | |
| Net asset value, beginning of period | $ | 10.86 | $ | 11.73 | $ | 11.80 | $ | 11.51 | $ | 11.12 |
| Income from Investment Operations | | | | | | | | | | |
Net investment income (loss) A,B | | .326 | | .116 | | .097 | | .229 | | .292 |
| Net realized and unrealized gain (loss) | | (.823) | | (.838) | | (.065) | | .307 | | .371 |
| Total from investment operations | | (.497) | | (.722) | | .032 | | .536 | | .663 |
| Distributions from net investment income | | (.303) | | (.121) | | (.093) C | | (.246) | | (.273) |
| Distributions from net realized gain | | - | | (.027) | | (.009) C | | - | | - |
| Total distributions | | (.303) | | (.148) | | (.102) | | (.246) | | (.273) |
| Net asset value, end of period | $ | 10.06 | $ | 10.86 | $ | 11.73 | $ | 11.80 | $ | 11.51 |
Total Return D | | (4.39)% | | (6.19)% | | .27% | | 4.71% | | 6.04% |
Ratios to Average Net Assets B,E,F | | | | | | | | | | |
| Expenses before reductions | | .45% | | .45% | | .45% | | .45% | | .45% |
| Expenses net of fee waivers, if any | | .45% | | .45% | | .45% | | .45% | | .45% |
| Expenses net of all reductions | | .45% | | .45% | | .45% | | .45% | | .45% |
| Net investment income (loss) | | 3.20% | | 1.03% | | .83% | | 1.96% | | 2.60% |
| Supplemental Data | | | | | | | | | | |
| Net assets, end of period (in millions) | $ | 2,311 | $ | 2,893 | $ | 3,958 | $ | 4,303 | $ | 4,172 |
Portfolio turnover rate G | | 776% | | 863% | | 593% | | 561% | | 420% |
ACalculated based on average shares outstanding during the period.
BNet investment income (loss) is affected by the timing of the declaration of dividends by any underlying mutual funds or exchange-traded funds (ETFs). Net investment income (loss) of any mutual funds or ETFs is not included in the Fund's net investment income (loss) ratio.
CThe amount shown reflects reclassifications related to book to tax differences that were made in the year shown.
DTotal returns would have been lower if certain expenses had not been reduced during the applicable periods shown.
EFees and expenses of any underlying mutual funds or exchange-traded funds (ETFs) are not included in the Fund's expense ratio. The Fund indirectly bears its proportionate share of these expenses. For additional expense information related to investments in Fidelity Central Funds, please refer to the "Investments in Fidelity Central Funds" note found in the Notes to Financial Statements section of the most recent Annual or Semi-Annual report.
FExpense ratios reflect operating expenses of the class. Expenses before reductions do not reflect amounts reimbursed, waived, or reduced through arrangements with the investment adviser, brokerage services, or other offset arrangements, if applicable, and do not represent the amount paid by the class during periods when reimbursements, waivers or reductions occur.
GAmount does not include the portfolio activity of any underlying mutual funds or exchange-traded funds (ETFs).
For the period ended July 31, 2023
(Amounts in thousands except percentages)
1. Organization.
Fidelity GNMA Fund (the Fund) is a fund of Fidelity Income Fund (the Trust) and is authorized to issue an unlimited number of shares. Share transactions on the Statement of Changes in Net Assets may contain exchanges between affiliated funds. The Trust is registered under the Investment Company Act of 1940, as amended (the 1940 Act), as an open-end management investment company organized as a Massachusetts business trust.
2. Investments in Fidelity Central Funds.
Funds may invest in Fidelity Central Funds, which are open-end investment companies generally available only to other investment companies and accounts managed by the investment adviser and its affiliates. The Schedule of Investments lists any Fidelity Central Funds held as an investment as of period end, but does not include the underlying holdings of each Fidelity Central Fund. An investing fund indirectly bears its proportionate share of the expenses of the underlying Fidelity Central Funds.
Based on its investment objective, each Fidelity Central Fund may invest or participate in various investment vehicles or strategies that are similar to those of the investing fund. These strategies are consistent with the investment objectives of the investing fund and may involve certain economic risks which may cause a decline in value of each of the Fidelity Central Funds and thus a decline in the value of the investing fund.
| Fidelity Central Fund | Investment Manager | Investment Objective | Investment Practices | Expense RatioA |
| Fidelity Money Market Central Funds | Fidelity Management & Research Company LLC (FMR) | Each fund seeks to obtain a high level of current income consistent with the preservation of capital and liquidity. | Short-term Investments | Less than .005% |
A Expenses expressed as a percentage of average net assets and are as of each underlying Central Fund's most recent annual or semi-annual shareholder report.
A complete unaudited list of holdings for each Fidelity Central Fund is available upon request or at the Securities and Exchange Commission website at www.sec.gov. In addition, the financial statements of the Fidelity Central Funds which contain the significant accounting policies (including investment valuation policies) of those funds, and are not covered by the Report of Independent Registered Public Accounting Firm, are available on the Securities and Exchange Commission website or upon request.
3. Significant Accounting Policies.
The Fund is an investment company and applies the accounting and reporting guidance of the Financial Accounting Standards Board (FASB) Accounting Standards Codification Topic 946 Financial Services - Investment Companies. The financial statements have been prepared in conformity with accounting principles generally accepted in the United States of America (GAAP), which require management to make certain estimates and assumptions at the date of the financial statements. Actual results could differ from those estimates. Subsequent events, if any, through the date that the financial statements were issued have been evaluated in the preparation of the financial statements. The Fund's Schedule of Investments lists any underlying mutual funds or exchange-traded funds (ETFs) but does not include the underlying holdings of these funds. The following summarizes the significant accounting policies of the Fund:
Investment Valuation. Investments are valued as of 4:00 p.m. Eastern time on the last calendar day of the period. The Board of Trustees (the Board) has designated the Fund's investment adviser as the valuation designee responsible for the fair valuation function and performing fair value determinations as needed. The investment adviser has established a Fair Value Committee (the Committee) to carry out the day-to-day fair valuation responsibilities and has adopted policies and procedures to govern the fair valuation process and the activities of the Committee. In accordance with these fair valuation policies and procedures, which have been approved by the Board, the Fund attempts to obtain prices from one or more third party pricing services or brokers to value its investments. When current market prices, quotations or currency exchange rates are not readily available or reliable, investments will be fair valued in good faith by the Committee, in accordance with the policies and procedures. Factors used in determining fair value vary by investment type and may include market or investment specific events, transaction data, estimated cash flows, and market observations of comparable investments. The frequency that the fair valuation procedures are used cannot be predicted and they may be utilized to a significant extent. The Committee manages the Fund's fair valuation practices and maintains the fair valuation policies and procedures. The Fund's investment adviser reports to the Board information regarding the fair valuation process and related material matters.
The Fund categorizes the inputs to valuation techniques used to value its investments into a disclosure hierarchy consisting of three levels as shown below:
Level 1 - unadjusted quoted prices in active markets for identical investments
Level 2 - other significant observable inputs (including quoted prices for similar investments, interest rates, prepayment speeds, etc.)
Level 3 - unobservable inputs (including the Fund's own assumptions based on the best information available)
Valuation techniques used to value the Fund's investments by major category are as follows:
Debt securities, including restricted securities, are valued based on evaluated prices received from third party pricing services or from brokers who make markets in such securities. U.S. government and government agency obligations are valued by pricing services who utilize matrix pricing which considers yield or price of bonds of comparable quality, coupon, maturity and type or by broker-supplied prices. Collateralized mortgage obligations, commercial mortgage securities and U.S. government agency mortgage securities are valued by pricing services who utilize matrix pricing which considers prepayment speed assumptions, attributes of the collateral, yield or price of bonds of comparable quality, coupon, maturity and type or by broker-supplied prices. Swaps are marked-to-market daily based on valuations from third party pricing services, registered derivatives clearing organizations (clearinghouses) or broker-supplied valuations. These pricing sources may utilize inputs such as interest rate curves, credit spread curves, default possibilities and recovery rates. When independent prices are unavailable or unreliable, debt securities and swaps may be valued utilizing pricing methodologies which consider similar factors that would be used by third party pricing services. Debt securities and swaps are generally categorized as Level 2 in the hierarchy but may be Level 3 depending on the circumstances.
Futures contracts are valued at the settlement price established each day by the board of trade or exchange on which they are traded and are categorized as Level 1 in the hierarchy. Investments in open-end mutual funds, including the Fidelity Central Funds, are valued at their closing net asset value (NAV) each business day and are categorized as Level 1 in the hierarchy.
Changes in valuation techniques may result in transfers in or out of an assigned level within the disclosure hierarchy. The aggregate value of investments by input level as of July 31, 2023 is included at the end of the Fund's Schedule of Investments.
Investment Transactions and Income. For financial reporting purposes, the Fund's investment holdings and NAV include trades executed through the end of the last business day of the period. The NAV per share for processing shareholder transactions is calculated as of the close of business of the New York Stock Exchange (NYSE), normally 4:00 p.m. Eastern time and includes trades executed through the end of the prior business day. Gains and losses on securities sold are determined on the basis of identified cost. Income and capital gain distributions from Fidelity Central Funds, if any, are recorded on the ex-dividend date. Interest income is accrued as earned and includes coupon interest and amortization of premium and accretion of discount on debt securities as applicable.
Expenses. Expenses directly attributable to a fund are charged to that fund. Expenses attributable to more than one fund are allocated among the respective funds on the basis of relative net assets or other appropriate methods. Expenses included in the accompanying financial statements reflect the expenses of that fund and do not include any expenses associated with any underlying mutual funds or exchange-traded funds. Although not included in a fund's expenses, a fund indirectly bears its proportionate share of these expenses through the net asset value of each underlying mutual fund or exchange-traded fund. Expense estimates are accrued in the period to which they relate and adjustments are made when actual amounts are known.
Deferred Trustee Compensation. Under a Deferred Compensation Plan (the Plan) for certain Funds, certain independent Trustees have elected to defer receipt of a portion of their annual compensation. Deferred amounts are invested in affiliated mutual funds, are marked-to-market and remain in a fund until distributed in accordance with the Plan. The investment of deferred amounts and the offsetting payable to the Trustees presented below are included in the accompanying Statement of Assets and Liabilities in other receivables and other payables and accrued expenses, as applicable.
Income Tax Information and Distributions to Shareholders. Each year, the Fund intends to qualify as a regulated investment company under Subchapter M of the Internal Revenue Code, including distributing substantially all of its taxable income and realized gains. As a result, no provision for U.S. Federal income taxes is required. As of July 31, 2023, the Fund did not have any unrecognized tax benefits in the financial statements; nor is the Fund aware of any tax positions for which it is reasonably possible that the total amounts of unrecognized tax benefits will significantly change in the next twelve months. The Fund files a U.S. federal tax return, in addition to state and local tax returns as required. The Fund's federal income tax returns are subject to examination by the Internal Revenue Service (IRS) for a period of three fiscal years after they are filed. State and local tax returns may be subject to examination for an additional fiscal year depending on the jurisdiction.
Distributions are declared and recorded daily and paid monthly from net investment income. Distributions from realized gains, if any, are declared and recorded on the ex-dividend date. Income and capital gain distributions are determined in accordance with income tax regulations, which may differ from GAAP.
Capital accounts within the financial statements are adjusted for permanent book-tax differences. These adjustments have no impact on net assets or the results of operations. Capital accounts are not adjusted for temporary book-tax differences which will reverse in a subsequent period.
Book-tax differences are primarily due to futures contracts, swaps, deferred Trustees compensation, capital loss carryforwards and losses deferred due to wash sales and excise tax regulations.
As of period end, the cost and unrealized appreciation (depreciation) in securities, and derivatives if applicable, for federal income tax purposes were as follows:
| Gross unrealized appreciation | $4,752 |
| Gross unrealized depreciation | (177,383) |
| Net unrealized appreciation (depreciation) | $(172,631) |
| Tax Cost | $3,505,449 |
The tax-based components of distributable earnings as of period end were as follows:
| Capital loss carryforward | $(237,320) |
| Net unrealized appreciation (depreciation) on securities and other investments | $(172,631) |
Capital loss carryforwards are only available to offset future capital gains of the Fund to the extent provided by regulations and may be limited. The capital loss carryforward information presented below, including any applicable limitation, is estimated as of fiscal period end and is subject to adjustment.
| Short-term | $(237,320) |
| Total capital loss carryforward | $(237,320) |
The tax character of distributions paid was as follows:
| | July 31, 2023 | July 31, 2022 |
| Ordinary Income | $79,236 | $40,216 |
| Long-term Capital Gains | - | 3,682 |
| Total | $79,236 | $43,898 |
Delayed Delivery Transactions and When-Issued Securities. During the period, certain Funds transacted in securities on a delayed delivery or when-issued basis. Payment and delivery may take place after the customary settlement period for that security. The price of the underlying securities and the date when the securities will be delivered and paid for are fixed at the time the transaction is negotiated. Securities purchased on a delayed delivery or when-issued basis are identified as such in the Schedule of Investments. Compensation for interest forgone in the purchase of a delayed delivery or when-issued debt security may be received. With respect to purchase commitments, each applicable Fund identifies securities as segregated in its records with a value at least equal to the amount of the commitment. Payables and receivables associated with the purchases and sales of delayed delivery securities having the same coupon, settlement date and broker are offset. Delayed delivery or when-issued securities that have been purchased from and sold to different brokers are reflected as both payables and receivables in the Statement of Assets and Liabilities under the caption "Delayed delivery", as applicable. Losses may arise due to changes in the value of the underlying securities or if the counterparty does not perform under the contract's terms, or if the issuer does not issue the securities due to political, economic, or other factors.
To-Be-Announced (TBA) Securities and Mortgage Dollar Rolls. TBA securities involve buying or selling mortgage-backed securities (MBS) on a forward commitment basis. A TBA transaction typically does not designate the actual security to be delivered and only includes an approximate principal amount; however delivered securities must meet specified terms defined by industry guidelines, including issuer, rate and current principal amount outstanding on underlying mortgage pools. Funds may enter into a TBA transaction with the intent to take possession of or deliver the underlying MBS, or a fund may elect to extend the settlement by entering into either a mortgage or reverse mortgage dollar roll. Mortgage dollar rolls are transactions where a fund sells TBA securities and simultaneously agrees to repurchase MBS on a later date at a lower price and with the same counterparty. Reverse mortgage dollar rolls involve the purchase and simultaneous agreement to sell TBA securities on a later date at a lower price. Transactions in mortgage dollar rolls and reverse mortgage dollar rolls are accounted for as purchases and sales and may result in an increase to a fund's portfolio turnover rate.
Purchases and sales of TBA securities involve risks similar to those discussed above for delayed delivery and when-issued securities. Also, if the counterparty in a mortgage dollar roll or a reverse mortgage dollar roll transaction files for bankruptcy or becomes insolvent, a fund's right to repurchase or sell securities may be limited. Additionally, when a fund sells TBA securities without already owning or having the right to obtain the deliverable securities (an uncovered forward commitment to sell), it incurs a risk of loss because it could have to purchase the securities at a price that is higher than the price at which it sold them. A fund may be unable to purchase the deliverable securities if the corresponding market is illiquid.
TBA securities subject to a forward commitment to sell at period end are included at the end of the Schedule of Investments under the caption "TBA Sale Commitments." The proceeds and value of these commitments are reflected in the Statement of Assets and Liabilities as "Receivable for TBA sale commitments" and "TBA sale commitments, at value," respectively.
4. Derivative Instruments.
Risk Exposures and the Use of Derivative Instruments. The Fund's investment objectives allow for various types of derivative instruments, including futures contracts and swaps. Derivatives are investments whose value is primarily derived from underlying assets, indices or reference rates and may be transacted on an exchange or over-the-counter (OTC). Derivatives may involve a future commitment to buy or sell a specified asset based on specified terms, to exchange future cash flows at periodic intervals based on a notional principal amount, or for one party to make one or more payments upon the occurrence of specified events in exchange for periodic payments from the other party.
Derivatives were used to increase returns, to gain exposure to certain types of assets and to manage exposure to certain risks as defined below. The success of any strategy involving derivatives depends on analysis of numerous economic factors, and if the strategies for investment do not work as intended, the objectives may not be achieved.
Derivatives were used to increase or decrease exposure to the following risk(s):
| | |
| Interest Rate Risk | Interest rate risk relates to the fluctuations in the value of interest-bearing securities due to changes in the prevailing levels of market interest rates. |
Funds are also exposed to additional risks from investing in derivatives, such as liquidity risk and counterparty credit risk. Liquidity risk is the risk that a fund will be unable to close out the derivative in the open market in a timely manner. Counterparty credit risk is the risk that the counterparty will not be able to fulfill its obligation to a fund. Exchange-traded contracts are not covered by the ISDA Master Agreement; however counterparty credit risk related to these contracts may be mitigated by the protection provided by the exchange on which they trade. Counterparty credit risk related to centrally cleared OTC swaps may be mitigated by the protection provided by the clearinghouse.
Investing in derivatives may involve greater risks than investing in the underlying assets directly and, to varying degrees, may involve risk of loss in excess of any initial investment and collateral received and amounts recognized in the Statement of Assets and Liabilities. In addition, there may be the risk that the change in value of the derivative contract does not correspond to the change in value of the underlying instrument.
Net Realized Gain (Loss) and Change in Net Unrealized Appreciation (Depreciation) on Derivatives. The table below, which reflects the impacts of derivatives on the financial performance, summarizes the net realized gain (loss) and change in net unrealized appreciation (depreciation) for derivatives during the period as presented in the Statement of Operations.
| Primary Risk Exposure / Derivative Type | Net Realized Gain (Loss)($) | Change in Net Unrealized Appreciation (Depreciation)($) |
| Fidelity GNMA Fund | | |
| Interest Rate Risk | | |
| Futures Contracts | $14,717 | $10,436 |
| Swaps | (252) | (1,981) |
| Total Interest Rate Risk | 14,465 | 8,455 |
| Totals | $14,465 | $8,455 |
If there are any open positions at period end, a summary of the value of derivatives by primary risk exposure is included at the end of the Schedule of Investments.
Futures Contracts. A futures contract is an agreement between two parties to buy or sell a specified underlying instrument for a fixed price at a specified future date. Futures contracts were used to manage exposure to the bond market and fluctuations in interest rates.
Upon entering into a futures contract, a fund is required to deposit either cash or securities (initial margin) with a clearing broker in an amount equal to a certain percentage of the face value of the contract. Futures contracts are marked-to-market daily and subsequent daily payments are made or received by a fund depending on the daily fluctuations in the value of the futures contracts and are recorded as unrealized appreciation or (depreciation). This receivable and/or payable, if any, is included in daily variation margin on futures contracts in the Statement of Assets and Liabilities. Realized gain or (loss) is recorded upon the expiration or closing of a futures contract. The net realized gain (loss) and change in net unrealized appreciation (depreciation) on futures contracts during the period is presented in the Statement of Operations.
Any open futures contracts at period end are presented in the Schedule of Investments under the caption "Futures Contracts". The notional amount at value reflects each contract's exposure to the underlying instrument or index at period end, and is representative of volume of activity during the period unless an average notional amount is presented. Any securities deposited to meet initial margin requirements are identified in the Schedule of Investments. Any cash deposited to meet initial margin requirements is presented as segregated cash with brokers for derivative instruments in the Statement of Assets and Liabilities.
Swaps. A swap is a contract between two parties to exchange future cash flows at periodic intervals based on a notional principal amount. A centrally cleared OTC swap is a transaction executed between a fund and a dealer counterparty, then cleared by a futures commission merchant (FCM) through a clearinghouse. Once cleared, the clearinghouse serves as a central counterparty, with whom a fund exchanges cash flows for the life of the transaction, similar to transactions in futures contracts.
Centrally cleared OTC swaps require a fund to deposit either cash or securities (initial margin) with the FCM, at the instruction of and for the benefit of the clearinghouse. Any securities deposited to meet initial margin requirements are identified in the Schedule of Investments. Any cash deposited to meet initial margin requirements is presented in segregated cash with brokers for derivative instruments in the Statement of Assets and Liabilities. Centrally cleared OTC swaps are marked-to-market daily and subsequent payments (variation margin) are made or received depending on the daily fluctuations in the value of the swaps and are recorded as unrealized appreciation or (depreciation). These daily payments, if any, are included in receivable or payable for daily variation margin on centrally cleared OTC swaps in the Statement of Assets and Liabilities. Any premiums for centrally cleared OTC swaps are recorded periodically throughout the term of the swap to variation margin and included in total accumulated earnings (loss) in the Statement of Assets and Liabilities. Any premiums are recognized as realized gain (loss) upon termination or maturity of the swap.
Payments are exchanged at specified intervals, accrued daily commencing with the effective date of the contract and recorded as realized gain or (loss). Some swaps may be terminated prior to the effective date and realize a gain or loss upon termination. The net realized gain (loss) and change in net unrealized appreciation (depreciation) on swaps during the period is presented in the Statement of Operations.
Any open swaps at period end are included in the Schedule of Investments under the caption "Swaps", and are representative of volume of activity during the period unless an average notional amount is presented.
Interest Rate Swaps. Interest rate swaps are agreements between counterparties to exchange cash flows, one based on a fixed rate, and the other on a floating rate. A fund enters into interest rate swaps to manage its exposure to interest rate changes. Changes in interest rates can have an effect on both the value of bond holdings as well as the amount of interest income earned. In general, the value of bonds can fall when interest rates rise and can rise when interest rates fall.
5. Purchases and Sales of Investments.
Purchases and sales of securities, other than short-term securities, U.S. government securities and in-kind transactions, as applicable, are noted in the table below.
| | Purchases ($) | Sales ($) |
| Fidelity GNMA Fund | 3,976,808 | 4,008,585 |
6. Fees and Other Transactions with Affiliates.
Management Fee. Fidelity Management & Research Company LLC (the investment adviser) and its affiliates provide the Fund with investment management related services for which the Fund pays a monthly management fee. The management fee is the sum of an individual fund fee rate that is based on an annual rate of .20% of the Fund's average net assets and an annualized group fee rate that averaged .10% during the period. The group fee rate is based upon the monthly average net assets of a group of registered investment companies with which the investment adviser has management contracts. The group fee rate decreases as assets under management increase and increases as assets under management decrease. For the reporting period, the total annual management fee rate was .30% of the Fund's average net assets.
Transfer Agent Fees. Fidelity Investments Institutional Operations Company LLC (FIIOC), an affiliate of the investment adviser, is the Fund's transfer, dividend disbursing and shareholder servicing agent. FIIOC receives an asset-based fee of .10% of the Fund's average net assets. FIIOC pays for typesetting, printing and mailing of shareholder reports, except proxy statements.
Fund Wide Operations Fee. Pursuant to the Fund Wide Operations and Expense Agreement (FWOE), the investment adviser has agreed to provide for fund-level expenses (which may not include transfer agent, the compensation of the independent Trustees, interest, taxes or extraordinary expenses, as applicable) in return for a FWOE fee equal to .35% of fund-level average net assets less the total amount of the management fee. The FWOE paid by a fund is reduced by an amount equal to the fees and expenses paid to the independent Trustees. For the period, the FWOE fees were equivalent to the following annual rate expressed as a percentage of average net assets:
Interfund Trades. Funds may purchase from or sell securities to other Fidelity Funds under procedures adopted by the Board. The procedures have been designed to ensure these interfund trades are executed in accordance with Rule 17a-7 of the 1940 Act. Any interfund trades are included within the respective purchases and sales amounts shown in the Purchases and Sales of Investments note. During the period, there were no interfund trades.
7. Committed Line of Credit.
Certain Funds participate with other funds managed by the investment adviser or an affiliate in a $4.25 billion credit facility (the "line of credit") to be utilized for temporary or emergency purposes to fund shareholder redemptions or for other short-term liquidity purposes. The commitment fees on the pro-rata portion of the line of credit are borne by the investment adviser. During the period, there were no borrowings on this line of credit.
8. Security Lending.
Funds lend portfolio securities from time to time in order to earn additional income. Lending agents are used, including National Financial Services (NFS), an affiliate of the investment adviser. Pursuant to a securities lending agreement, NFS will receive a fee, which is capped at 9.9% of a fund's daily lending revenue, for its services as lending agent. A fund may lend securities to certain qualified borrowers, including NFS. On the settlement date of the loan, a fund receives collateral (in the form of U.S. Treasury obligations, letters of credit and/or cash) against the loaned securities and maintains collateral in an amount not less than 100% of the market value of the loaned securities during the period of the loan. The market value of the loaned securities is determined at the close of business of a fund and any additional required collateral is delivered to a fund on the next business day. A fund or borrower may terminate the loan at any time, and if the borrower defaults on its obligation to return the securities loaned because of insolvency or other reasons, a fund may apply collateral received from the borrower against the obligation. A fund may experience delays and costs in recovering the securities loaned. Any cash collateral received is invested in the Fidelity Securities Lending Cash Central Fund. Any loaned securities are identified as such in the Schedule of Investments, and the value of loaned securities and cash collateral at period end, as applicable, are presented in the Statement of Assets and Liabilities. Security lending income represents the income earned on investing cash collateral, less rebates paid to borrowers and any lending agent fees associated with the loan, plus any premium payments received for lending certain types of securities. Security lending income is presented in the Statement of Operations as a component of income from Fidelity Central Funds. Affiliated security lending activity, if any, was as follows:
| | Total Security Lending Fees Paid to NFS | Security Lending Income From Securities Loaned to NFS | Value of Securities Loaned to NFS at Period End |
| Fidelity GNMA Fund | $1 | $ - | $- |
9. Expense Reductions.
Through arrangements with the Fund's custodian, credits realized as a result of certain uninvested cash balances were used to reduce the Fund's expenses by $5.
10. Other.
A fund's organizational documents provide former and current trustees and officers with a limited indemnification against liabilities arising in connection with the performance of their duties to the fund. In the normal course of business, a fund may also enter into contracts that provide general indemnifications. A fund's maximum exposure under these arrangements is unknown as this would be dependent on future claims that may be made against a fund. The risk of material loss from such claims is considered remote.
11. Risk and Uncertainties.
Many factors affect a fund's performance. Developments that disrupt global economies and financial markets, such as pandemics, epidemics, outbreaks of infectious diseases, war, terrorism, and environmental disasters, may significantly affect a fund's investment performance. The effects of these developments to a fund will be impacted by the types of securities in which a fund invests, the financial condition, industry, economic sector, and geographic location of an issuer, and a fund's level of investment in the securities of that issuer. Significant concentrations in security types, issuers, industries, sectors, and geographic locations may magnify the factors that affect a fund's performance.
To the Board of Trustees of Fidelity Income Fund and Shareholders of Fidelity GNMA Fund
Opinion on the Financial Statements
We have audited the accompanying statement of assets and liabilities, including the schedule of investments, of Fidelity GNMA Fund (one of the funds constituting Fidelity Income Fund, referred to hereafter as the "Fund") as of July 31, 2023, the related statement of operations for the year ended July 31, 2023, the statement of changes in net assets for each of the two years in the period ended July 31, 2023, including the related notes, and the financial highlights for each of the five years in the period ended July 31, 2023 (collectively referred to as the "financial statements"). In our opinion, the financial statements present fairly, in all material respects, the financial position of the Fund as of July 31, 2023, the results of its operations for the year then ended, the changes in its net assets for each of the two years in the period ended July 31, 2023 and the financial highlights for each of the five years in the period ended July 31, 2023 in conformity with accounting principles generally accepted in the United States of America.
Basis for Opinion
These financial statements are the responsibility of the Fund's management. Our responsibility is to express an opinion on the Fund's financial statements based on our audits. We are a public accounting firm registered with the Public Company Accounting Oversight Board (United States) (PCAOB) and are required to be independent with respect to the Fund in accordance with the U.S. federal securities laws and the applicable rules and regulations of the Securities and Exchange Commission and the PCAOB.
We conducted our audits of these financial statements in accordance with the standards of the PCAOB. Those standards require that we plan and perform the audit to obtain reasonable assurance about whether the financial statements are free of material misstatement, whether due to error or fraud.
Our audits included performing procedures to assess the risks of material misstatement of the financial statements, whether due to error or fraud, and performing procedures that respond to those risks. Such procedures included examining, on a test basis, evidence regarding the amounts and disclosures in the financial statements. Our audits also included evaluating the accounting principles used and significant estimates made by management, as well as evaluating the overall presentation of the financial statements. Our procedures included confirmation of securities owned as of July 31, 2023 by correspondence with the custodian and brokers; when replies were not received from brokers, we performed other auditing procedures. We believe that our audits provide a reasonable basis for our opinion.
/s/ PricewaterhouseCoopers LLP
Boston, Massachusetts
September 13, 2023
We have served as the auditor of one or more investment companies in the Fidelity group of funds since 1932.
The Trustees, Members of the Advisory Board (if any), and officers of the trust and fund, as applicable, are listed below. The Board of Trustees governs the fund and is responsible for protecting the interests of shareholders. The Trustees are experienced executives who meet periodically throughout the year to oversee the fund's activities, review contractual arrangements with companies that provide services to the fund, oversee management of the risks associated with such activities and contractual arrangements, and review the fund's performance. Each of the Trustees oversees 313 funds.
The Trustees hold office without limit in time except that (a) any Trustee may resign; (b) any Trustee may be removed by written instrument, signed by at least two-thirds of the number of Trustees prior to such removal; (c) any Trustee who requests to be retired or who has become incapacitated by illness or injury may be retired by written instrument signed by a majority of the other Trustees; and (d) any Trustee may be removed at any special meeting of shareholders by a two-thirds vote of the outstanding voting securities of the trust. Each Trustee who is not an interested person (as defined in the 1940 Act) of the trust and the fund is referred to herein as an Independent Trustee. Each Independent Trustee shall retire not later than the last day of the calendar year in which his or her 75th birthday occurs. The Independent Trustees may waive this mandatory retirement age policy with respect to individual Trustees. Officers and Advisory Board Members hold office without limit in time, except that any officer or Advisory Board Member may resign or may be removed by a vote of a majority of the Trustees at any regular meeting or any special meeting of the Trustees. Except as indicated, each individual has held the office shown or other offices in the same company for the past five years.
The fund's Statement of Additional Information (SAI) includes more information about the Trustees. To request a free copy, call Fidelity at 1-800-544-8544.
Experience, Skills, Attributes, and Qualifications of the Trustees. The Governance and Nominating Committee has adopted a statement of policy that describes the experience, qualifications, attributes, and skills that are necessary and desirable for potential Independent Trustee candidates (Statement of Policy). The Board believes that each Trustee satisfied at the time he or she was initially elected or appointed a Trustee, and continues to satisfy, the standards contemplated by the Statement of Policy. The Governance and Nominating Committee also engages professional search firms to help identify potential Independent Trustee candidates who have the experience, qualifications, attributes, and skills consistent with the Statement of Policy. From time to time, additional criteria based on the composition and skills of the current Independent Trustees, as well as experience or skills that may be appropriate in light of future changes to board composition, business conditions, and regulatory or other developments, have also been considered by the professional search firms and the Governance and Nominating Committee. In addition, the Board takes into account the Trustees' commitment and participation in Board and committee meetings, as well as their leadership of standing and ad hoc committees throughout their tenure.
In determining that a particular Trustee was and continues to be qualified to serve as a Trustee, the Board has considered a variety of criteria, none of which, in isolation, was controlling. The Board believes that, collectively, the Trustees have balanced and diverse experience, qualifications, attributes, and skills, which allow the Board to operate effectively in governing the fund and protecting the interests of shareholders. Information about the specific experience, skills, attributes, and qualifications of each Trustee, which in each case led to the Board's conclusion that the Trustee should serve (or continue to serve) as a trustee of the fund, is provided below.
Board Structure and Oversight Function. Abigail P. Johnson is an interested person and currently serves as Chairman. The Trustees have determined that an interested Chairman is appropriate and benefits shareholders because an interested Chairman has a personal and professional stake in the quality and continuity of services provided to the fund. Independent Trustees exercise their informed business judgment to appoint an individual of their choosing to serve as Chairman, regardless of whether the Trustee happens to be independent or a member of management. The Independent Trustees have determined that they can act independently and effectively without having an Independent Trustee serve as Chairman and that a key structural component for assuring that they are in a position to do so is for the Independent Trustees to constitute a substantial majority for the Board. The Independent Trustees also regularly meet in executive session. Michael E. Kenneally serves as Chairman of the Independent Trustees and as such (i) acts as a liaison between the Independent Trustees and management with respect to matters important to the Independent Trustees and (ii) with management prepares agendas for Board meetings.
Fidelity® funds are overseen by different Boards of Trustees. The fund's Board oversees Fidelity's investment-grade bond, money market, asset allocation and certain equity funds, and other Boards oversee Fidelity's alternative investment, high income and other equity funds. The asset allocation funds may invest in Fidelity® funds that are overseen by such other Boards. The use of separate Boards, each with its own committee structure, allows the Trustees of each group of Fidelity® funds to focus on the unique issues of the funds they oversee, including common research, investment, and operational issues. On occasion, the separate Boards establish joint committees to address issues of overlapping consequences for the Fidelity® funds overseen by each Board.
The Trustees operate using a system of committees to facilitate the timely and efficient consideration of all matters of importance to the Trustees, the fund, and fund shareholders and to facilitate compliance with legal and regulatory requirements and oversight of the fund's activities and associated risks. The Board, acting through its committees, has charged FMR and its affiliates with (i) identifying events or circumstances the occurrence of which could have demonstrably adverse effects on the fund's business and/or reputation; (ii) implementing processes and controls to lessen the possibility that such events or circumstances occur or to mitigate the effects of such events or circumstances if they do occur; and (iii) creating and maintaining a system designed to evaluate continuously business and market conditions in order to facilitate the identification and implementation processes described in (i) and (ii) above. Because the day-to-day operations and activities of the fund are carried out by or through FMR, its affiliates, and other service providers, the fund's exposure to risks is mitigated but not eliminated by the processes overseen by the Trustees. While each of the Board's committees has responsibility for overseeing different aspects of the fund's activities, oversight is exercised primarily through the Operations and Audit Committees. In addition, an ad hoc Board committee of Independent Trustees has worked with FMR to enhance the Board's oversight of investment and financial risks, legal and regulatory risks, technology risks, and operational risks, including the development of additional risk reporting to the Board. Appropriate personnel, including but not limited to the fund's Chief Compliance Officer (CCO), FMR's internal auditor, the independent accountants, the fund's Treasurer and portfolio management personnel, make periodic reports to the Board's committees, as appropriate, including an annual review of Fidelity's risk management program for the Fidelity® funds. The responsibilities of each standing committee, including their oversight responsibilities, are described further under "Standing Committees of the Trustees."
Interested Trustees*:
Correspondence intended for a Trustee who is an interested person may be sent to Fidelity Investments, 245 Summer Street, Boston, Massachusetts 02210.
Name, Year of Birth; Principal Occupations and Other Relevant Experience+
Abigail P. Johnson (1961)
Year of Election or Appointment: 2009
Trustee
Chairman of the Board of Trustees
Ms. Johnson also serves as Trustee of other Fidelity® funds. Ms. Johnson serves as Chairman (2016-present), Chief Executive Officer (2014-present), and Director (2007-present) of FMR LLC (diversified financial services company), President of Fidelity Financial Services (2012-present) and President of Personal, Workplace and Institutional Services (2005-present). Ms. Johnson is Chairman and Director of Fidelity Management & Research Company LLC (investment adviser firm, 2011-present). Previously, Ms. Johnson served as Chairman and Director of FMR Co., Inc. (investment adviser firm, 2011-2019), Vice Chairman (2007-2016) and President (2013-2016) of FMR LLC, President and a Director of Fidelity Management & Research Company (2001-2005), a Trustee of other investment companies advised by Fidelity Management & Research Company, Fidelity Investments Money Management, Inc. (investment adviser firm), and FMR Co., Inc. (2001-2005), Senior Vice President of the Fidelity® funds (2001-2005), and managed a number of Fidelity® funds. Ms. Abigail P. Johnson and Mr. Arthur E. Johnson are not related.
Jennifer Toolin McAuliffe (1959)
Year of Election or Appointment: 2016
Trustee
Ms. McAuliffe also serves as Trustee of other Fidelity® funds and as Trustee of Fidelity Charitable (2020-present). Previously, Ms. McAuliffe served as Co-Head of Fixed Income of Fidelity Investments Limited (now known as FIL Limited (FIL)) (diversified financial services company), Director of Research for FIL's credit and quantitative teams in London, Hong Kong and Tokyo and Director of Research for taxable and municipal bonds at Fidelity Investments Money Management, Inc. Ms. McAuliffe previously served as a member of the Advisory Board of certain Fidelity® funds (2016). Ms. McAuliffe was previously a lawyer at Ropes & Gray LLP and an international banker at Chemical Bank NA (now JPMorgan Chase & Co.). Ms. McAuliffe also currently serves as director or trustee of several not-for-profit entities.
* Determined to be an "Interested Trustee" by virtue of, among other things, his or her affiliation with the trust or various entities under common control with FMR.
+ The information includes the Trustee's principal occupation during the last five years and other information relating to the experience, attributes, and skills relevant to the Trustee's qualifications to serve as a Trustee, which led to the conclusion that the Trustee should serve as a Trustee for the fund.
Independent Trustees:
Correspondence intended for an Independent Trustee may be sent to Fidelity Investments, P.O. Box 55235, Boston, Massachusetts 02205-5235.
Name, Year of Birth; Principal Occupations and Other Relevant Experience+
Elizabeth S. Acton (1951)
Year of Election or Appointment: 2013
Trustee
Ms. Acton also serves as Trustee of other Fidelity® funds. Prior to her retirement, Ms. Acton served as Executive Vice President, Finance (2011-2012), Executive Vice President, Chief Financial Officer (2002-2011) and Treasurer (2004-2005) of Comerica Incorporated (financial services). Prior to joining Comerica, Ms. Acton held a variety of positions at Ford Motor Company (1983-2002), including Vice President and Treasurer (2000-2002) and Executive Vice President and Chief Financial Officer of Ford Motor Credit Company (1998-2000). Ms. Acton currently serves as a member of the Board and Audit and Finance Committees of Beazer Homes USA, Inc. (homebuilding, 2012-present). Ms. Acton previously served as a member of the Advisory Board of certain Fidelity® funds (2013-2016).
Ann E. Dunwoody (1953)
Year of Election or Appointment: 2018
Trustee
General Dunwoody also serves as Trustee of other Fidelity® funds. General Dunwoody (United States Army, Retired) was the first woman in U.S. military history to achieve the rank of four-star general and prior to her retirement in 2012 held a variety of positions within the U.S. Army, including Commanding General, U.S. Army Material Command (2008-2012). General Dunwoody currently serves as a member of the Board, Chair of Nomination Committee and a member of the Corporate Governance Committee of Kforce Inc. (professional staffing services, 2016-present) and a member of the Board of Automattic Inc. (software engineering, 2018-present). Previously, General Dunwoody served as President of First to Four LLC (leadership and mentoring services, 2012-2022), a member of the Advisory Board and Nominating and Corporate Governance Committee of L3 Technologies, Inc. (communication, electronic, sensor and aerospace systems, 2013-2019) and a member of the Board and Audit and Sustainability and Corporate Responsibility Committees of Republic Services, Inc. (waste collection, disposal and recycling, 2013-2016). General Dunwoody also serves on several boards for non-profit organizations, including as a member of the Board, Chair of the Nomination and Governance Committee and a member of the Audit Committee of the Noble Reach Foundation (formerly Logistics Management Institute) (consulting non-profit, 2012-present) and a member of the Board of ThanksUSA (military family education non-profit, 2014-present). Previously, General Dunwoody served as a member of the Board of Florida Institute of Technology (2015-2022) and a member of the Council of Trustees for the Association of the United States Army (advocacy non-profit, 2013-2021). General Dunwoody previously served as a member of the Advisory Board of certain Fidelity® funds (2018).
John Engler (1948)
Year of Election or Appointment: 2014
Trustee
Mr. Engler also serves as Trustee of other Fidelity® funds. Previously, Mr. Engler served as Governor of Michigan (1991-2003), President of the Business Roundtable (2011-2017) and interim President of Michigan State University (2018-2019). Previously, Mr. Engler served as a member of the Board of Stride, Inc. (formerly K12 Inc.) (technology-based education company, 2012-2022), a member of the Board of Universal Forest Products (manufacturer and distributor of wood and wood-alternative products, 2003-2019) and Trustee of The Munder Funds (2003-2014). Mr. Engler previously served as a member of the Advisory Board of certain Fidelity® funds (2014-2016).
Robert F. Gartland (1951)
Year of Election or Appointment: 2010
Trustee
Mr. Gartland also serves as Trustee of other Fidelity® funds. Prior to his retirement, Mr. Gartland held a variety of positions at Morgan Stanley (financial services, 1979-2007), including Managing Director (1987-2007) and Chase Manhattan Bank (1975-1978). Mr. Gartland previously served as Chairman and an investor in Gartland & Mellina Group Corp. (consulting, 2009-2019), as a member of the Board of National Securities Clearing Corporation (1993-1996) and as Chairman of TradeWeb (2003-2004).
Arthur E. Johnson (1947)
Year of Election or Appointment: 2008
Trustee
Mr. Johnson also serves as Trustee of other Fidelity® funds. Prior to his retirement, Mr. Johnson served as Senior Vice President of Corporate Strategic Development of Lockheed Martin Corporation (defense contractor, 1999-2009). Mr. Johnson currently serves as a member of the Board of Booz Allen Hamilton (management consulting, 2011-present). Mr. Johnson previously served as a member of the Board of Eaton Corporation plc (diversified power management, 2009-2019) and a member of the Board of AGL Resources, Inc. (holding company, 2002-2016). Mr. Johnson previously served as Chairman (2018-2021) and Vice Chairman (2015-2018) of the Independent Trustees of certain Fidelity® funds. Mr. Arthur E. Johnson is not related to Ms. Abigail P. Johnson.
Michael E. Kenneally (1954)
Year of Election or Appointment: 2009
Trustee
Chairman of the Independent Trustees
Mr. Kenneally also serves as Trustee of other Fidelity® funds and was Vice Chairman (2018-2021) of the Independent Trustees of certain Fidelity® funds. Prior to retirement in 2005, he was Chairman and Global Chief Executive Officer of Credit Suisse Asset Management, the worldwide fund management and institutional investment business of Credit Suisse Group. Previously, Mr. Kenneally was an Executive Vice President and the Chief Investment Officer for Bank of America. In this role, he was responsible for the investment management, strategy and products delivered to the bank's institutional, high-net-worth and retail clients. Earlier, Mr. Kenneally directed the organization's equity and quantitative research groups. He began his career as a research analyst and then spent more than a dozen years as a portfolio manager for endowments, pension plans and mutual funds. He earned the Chartered Financial Analyst (CFA) designation in 1991.
Mark A. Murray (1954)
Year of Election or Appointment: 2016
Trustee
Mr. Murray also serves as Trustee of other Fidelity® funds. Previously, Mr. Murray served as Co-Chief Executive Officer (2013-2016), President (2006-2013) and Vice Chairman (2013-2020) of Meijer, Inc. Mr. Murray serves as a member of the Board (2009-present) and Public Policy and Responsibility Committee (2009-present) and Chair of the Nuclear Review Committee (2019-present) of DTE Energy Company (diversified energy company). Mr. Murray previously served as a member of the Board of Spectrum Health (not-for-profit health system, 2015-2019) and as a member of the Board and Audit Committee and Chairman of the Nominating and Corporate Governance Committee of Universal Forest Products, Inc. (manufacturer and distributor of wood and wood-alternative products, 2004-2016). Mr. Murray also serves as a member of the Board of many community and professional organizations. Mr. Murray previously served as a member of the Advisory Board of certain Fidelity® funds (2016).
+ The information includes the Trustee's principal occupation during the last five years and other information relating to the experience, attributes, and skills relevant to the Trustee's qualifications to serve as a Trustee, which led to the conclusion that the Trustee should serve as a Trustee for the fund.
Advisory Board Members and Officers:
Correspondence intended for a Member of the Advisory Board (if any) may be sent to Fidelity Investments, P.O. Box 55235, Boston, Massachusetts 02205-5235. Correspondence intended for an officer may be sent to Fidelity Investments, 245 Summer Street, Boston, Massachusetts 02210. Officers appear below in alphabetical order.
Name, Year of Birth; Principal Occupation
Laura M. Bishop (1961)
Year of Election or Appointment: 2022
Member of the Advisory Board
Ms. Bishop also serves as a Member of the Advisory Board of other funds. Prior to her retirement, Ms. Bishop held a variety of positions at United Services Automobile Association (2001-2020), including Executive Vice President and Chief Financial Officer (2014-2020) and Senior Vice President and Deputy Chief Financial Officer (2012-2014). Ms. Bishop currently serves as a member of the Audit Committee and Compensation and Personnel Committee (2021-present) of the Board of Directors of Korn Ferry (global organizational consulting).
Robert W. Helm (1957)
Year of Election or Appointment: 2021
Member of the Advisory Board
Mr. Helm also serves as a Member of the Advisory Board of other Fidelity® funds. Mr. Helm was formerly Deputy Chairman (2003-2020), partner (1991-2020) and an associate (1984-1991) of Dechert LLP (formerly Dechert Price & Rhoads). Mr. Helm currently serves on boards and committees of several not-for-profit organizations, including as a Trustee and member of the Executive Committee of the Baltimore Council on Foreign Affairs, a member of the Board of Directors of the St. Vincent de Paul Society of Baltimore and a member of the Life Guard Society of Mt. Vernon.
Carol J. Zierhoffer (1960)
Year of Election or Appointment: 2023
Member of the Advisory Board
Ms. Zierhoffer also serves as a Member of the Advisory Board of other funds. Prior to her retirement, Ms. Zierhoffer held a variety of positions at Bechtel Corporation (engineering company, 2013-2019), including Principal Vice President and Chief Information Officer (2013-2016) and Senior Vice President and Chief Information Officer (2016-2019). Ms. Zierhoffer currently serves as a member of the Board of Directors, Audit Committee and Compensation Committee of Allscripts Healthcare Solutions, Inc. (healthcare technology, 2020-present) and as a member of the Board of Directors, Audit and Finance Committee and Nominating and Governance Committee of Atlas Air Worldwide Holdings, Inc. (aviation operating services, 2021-present). Previously, Ms. Zierhoffer served as a member of the Board of Directors and Audit Committee and as the founding Chair of the Information Technology Committee of MedAssets, Inc. (healthcare technology, 2013-2016).
Heather Bonner (1977)
Year of Election or Appointment: 2023
Assistant Treasurer
Ms. Bonner also serves as an officer of other funds. Ms. Bonner serves as Senior Vice President (2022-present), and is an employee of Fidelity Investments. Ms. Bonner serves as Assistant Treasurer of Fidelity CRET Trustee LLC (2022-present). Prior to joining Fidelity, Ms. Bonner served as Managing Director at AQR Capital Management (2013-2022) and was the Treasurer and Principal Financial Officer of the AQR Funds (2013-2022).
Craig S. Brown (1977)
Year of Election or Appointment: 2019
Assistant Treasurer
Mr. Brown also serves as an officer of other funds. Mr. Brown serves as Assistant Treasurer of FIMM, LLC (2021-present) and is an employee of Fidelity Investments (2013-present). Previously, Mr. Brown served as Assistant Treasurer of certain Fidelity® funds (2019-2022).
John J. Burke III (1964)
Year of Election or Appointment: 2018
Chief Financial Officer
Mr. Burke also serves as Chief Financial Officer of other funds. Mr. Burke serves as Head of Investment Operations for Fidelity Fund and Investment Operations (2018-present) and is an employee of Fidelity Investments (1998-present). Previously Mr. Burke served as head of Asset Management Investment Operations (2012-2018).
Margaret Carey (1973)
Year of Election or Appointment: 2023
Secretary and Chief Legal Officer (CLO)
Ms. Carey also serves as an officer of other funds and as CLO of certain other Fidelity entities. She is a Senior Vice President and Deputy General Counsel of FMR LLC (diversified financial services company, 2019-present), and is an employee of Fidelity Investments.
David J. Carter (1973)
Year of Election or Appointment: 2020
Assistant Secretary
Mr. Carter also serves as Assistant Secretary of other funds. Mr. Carter serves as Senior Vice President, Deputy General Counsel (2022-present) and is an employee of Fidelity Investments (2005-present).
Jonathan Davis (1968)
Year of Election or Appointment: 2010
Assistant Treasurer
Mr. Davis also serves as an officer of other funds. Mr. Davis serves as Vice President Assistant Treasurer and is an employee of Fidelity Investments. Mr. Davis serves as Assistant Treasurer of certain Fidelity entities.
Laura M. Del Prato (1964)
Year of Election or Appointment: 2018
President and Treasurer
Ms. Del Prato also serves as an officer of other funds. Ms. Del Prato serves as Assistant Treasurer of FIMM, LLC (2021-present) and is an employee of Fidelity Investments (2017-present). Previously, Ms. Del Prato served as President and Treasurer of The North Carolina Capital Management Trust: Cash Portfolio and Term Portfolio (2018-2020). Prior to joining Fidelity Investments, Ms. Del Prato served as a Managing Director and Treasurer of the JPMorgan Mutual Funds (2014-2017). Prior to JPMorgan, Ms. Del Prato served as a partner at Cohen Fund Audit Services (accounting firm, 2012-2013) and KPMG LLP (accounting firm, 2004-2012).
Robin Foley (1964)
Year of Election or Appointment: 2023
Vice President
Ms. Foley also serves as Vice President of other funds. Ms. Foley serves as Head of Fidelity's Fixed Income division (2023-present) and is an employee of Fidelity Investments. Previously, Ms. Foley served as Chief Investment Officer of Bonds (2017-2023).
Christopher M. Gouveia (1973)
Year of Election or Appointment: 2023
Chief Compliance Officer
Mr. Gouveia also serves as Chief Compliance Officer of other funds. Mr. Gouveia serves as Senior Vice President of Asset Management Compliance for Fidelity Investments and is an employee of Fidelity Investments. Previously, Mr. Gouveia served as Chief Compliance Officer of the North Carolina Capital Management Trust (2016-2019).
Colm A. Hogan (1973)
Year of Election or Appointment: 2016
Assistant Treasurer
Mr. Hogan also serves as an officer of other funds. Mr. Hogan serves as Assistant Treasurer of FIMM, LLC (2021-present) and FMR Capital, Inc. (2017-present) and is an employee of Fidelity Investments (2005-present). Previously, Mr. Hogan served as Deputy Treasurer of certain Fidelity® funds (2016-2020) and Assistant Treasurer of certain Fidelity® funds (2016-2018).
Chris Maher (1972)
Year of Election or Appointment: 2013
Assistant Treasurer
Mr. Maher also serves as an officer of other funds. Mr. Maher serves as Assistant Treasurer of FIMM, LLC (2021-present) and FMR Capital, Inc. (2017-present), and is an employee of Fidelity Investments (2008-present). Previously, Mr. Maher served as Assistant Treasurer of certain funds (2013-2020); Vice President of Asset Management Compliance (2013), Vice President of the Program Management Group of FMR (investment adviser firm, 2010-2013), and Vice President of Valuation Oversight (2008-2010).
Brett Segaloff (1972)
Year of Election or Appointment: 2021
Anti-Money Laundering (AML) Officer
Mr. Segaloff also serves as an AML Officer of other funds and other related entities. He is Director, Anti-Money Laundering (2007-present) of FMR LLC (diversified financial services company) and is an employee of Fidelity Investments (1996-present).
Stacie M. Smith (1974)
Year of Election or Appointment: 2013
Assistant Treasurer
Ms. Smith also serves as an officer of other funds. Ms. Smith serves as Assistant Treasurer of FIMM, LLC (2021-present) and FMR Capital, Inc. (2017-present), is an employee of Fidelity Investments (2009-present), and has served in other fund officer roles. Prior to joining Fidelity Investments, Ms. Smith served as Senior Audit Manager of Ernst & Young LLP (accounting firm, 1996-2009). Previously, Ms. Smith served as Assistant Treasurer (2013-2019) and Deputy Treasurer (2013-2016) of certain Fidelity® funds.
Jim Wegmann (1979)
Year of Election or Appointment: 2021
Deputy Treasurer
Mr. Wegmann also serves as an officer of other funds. Mr. Wegmann serves as Assistant Treasurer of FIMM, LLC (2021-present) and is an employee of Fidelity Investments (2011-present). Previously, Mr. Wegmann served as Assistant Treasurer of certain Fidelity® funds (2019-2021).
As a shareholder, you incur two types of costs: (1) transaction costs, which may include sales charges (loads) on purchase payments or redemption proceeds, as applicable and (2) ongoing costs, which generally include management fees, distribution and/or service (12b-1) fees and other Fund expenses. This Example is intended to help you understand your ongoing costs (in dollars) of investing in a fund and to compare these costs with the ongoing costs of investing in other mutual funds.
| The Example is based on an investment of $1,000 invested at the beginning of the period and held for the entire period (February 1, 2023 to July 31, 2023). |
Actual Expenses
The first line of the accompanying table provides information about actual account values and actual expenses. You may use the information in this line, together with the amount you invested, to estimate the expenses that you paid over the period. Simply divide your account value by $1,000.00 (for example, an $8,600 account value divided by $1,000.00 = 8.6), then multiply the result by the number in the first line for a class/Fund under the heading entitled "Expenses Paid During Period" to estimate the expenses you paid on your account during this period. If any fund is a shareholder of any underlying mutual funds or exchange-traded funds (ETFs) (the Underlying Funds), such fund indirectly bears its proportional share of the expenses of the Underlying Funds in addition to the direct expenses incurred presented in the table. These fees and expenses are not included in the annualized expense ratio used to calculate the expense estimate in the table below.
Hypothetical Example for Comparison Purposes
The second line of the accompanying table provides information about hypothetical account values and hypothetical expenses based on the actual expense ratio and an assumed rate of return of 5% per year before expenses, which is not the actual return. The hypothetical account values and expenses may not be used to estimate the actual ending account balance or expenses you paid for the period. You may use this information to compare the ongoing costs of investing in the Fund and other funds. To do so, compare this 5% hypothetical example with the 5% hypothetical examples that appear in the shareholder reports of the other funds. If any fund is a shareholder of any Underlying Funds, such fund indirectly bears its proportional share of the expenses of the Underlying Funds in addition to the direct expenses as presented in the table. These fees and expenses are not included in the annualized expense ratio used to calculate the expense estimate in the table below.
Please note that the expenses shown in the table are meant to highlight your ongoing costs only and do not reflect any transaction costs. Therefore, the second line of the table is useful in comparing ongoing costs only, and will not help you determine the relative total costs of owning different funds. In addition, if these transactional costs were included, your costs would have been higher.
| | | | | Annualized Expense Ratio- A | | Beginning Account Value February 1, 2023 | | Ending Account Value July 31, 2023 | | Expenses Paid During Period- C February 1, 2023 to July 31, 2023 |
| | | | | | | | | | |
| Fidelity® GNMA Fund | | | | .45% | | | | | | |
| Actual | | | | | | $ 1,000 | | $ 987.30 | | $ 2.22 |
Hypothetical-B | | | | | | $ 1,000 | | $ 1,022.56 | | $ 2.26 |
| |
A Annualized expense ratio reflects expenses net of applicable fee waivers.
B 5% return per year before expenses
C Expenses are equal to the annualized expense ratio, multiplied by the average account value over the period, multiplied by 181/ 365 (to reflect the one-half year period). The fees and expenses of any Underlying Funds are not included in each annualized expense ratio.
The dividend and capital gains distributions for the fund(s) are available on Fidelity.com or Institutional.Fidelity.com.
A total of 2.71% of the dividends distributed during the fiscal year was derived from interest on U.S. Government securities which is generally exempt from state income tax.
The fund designates $54,065,906 of distributions paid in the calendar year 2022 as qualifying to be taxed as interest-related dividends for nonresident alien shareholders.
The fund designates $79,235,698 of distributions paid during the fiscal year ended 2023 as qualifying to be taxed as section 163(j) interest dividends.
The fund will notify shareholders in January 2024 of amounts for use in preparing 2023 income tax returns.
1.930526.112
MOG-ANN-0923
Item 2.
Code of Ethics
As of the end of the period, July 31, 2023, Fidelity Income Fund (the trust) has adopted a code of ethics, as defined in Item 2 of Form N-CSR, that applies to its President and Treasurer and its Chief Financial Officer. A copy of the code of ethics is filed as an exhibit to this Form N-CSR.
Item 3.
Audit Committee Financial Expert
The Board of Trustees of the trust has determined that Elizabeth S. Acton is an audit committee financial expert, as defined in Item 3 of Form N-CSR. Ms. Acton is independent for purposes of Item 3 of Form N-CSR.
Item 4.
Principal Accountant Fees and Services
Fees and Services
The following table presents fees billed by Deloitte & Touche LLP, the member firms of Deloitte Touche Tohmatsu, and their respective affiliates (collectively, “Deloitte Entities”) in each of the last two fiscal years for services rendered to Fidelity Managed Retirement 2010 Fund, Fidelity Managed Retirement 2015 Fund, Fidelity Managed Retirement 2020 Fund, Fidelity Managed Retirement 2025 Fund, Fidelity Managed Retirement 2030 Fund, Fidelity Managed Retirement 2035 Fund, Fidelity Managed Retirement Income Fund, Fidelity Simplicity RMD 2010 Fund, Fidelity Simplicity RMD 2015 Fund, Fidelity Simplicity RMD 2020 Fund, Fidelity Simplicity RMD 2025 Fund, Fidelity Simplicity RMD 2030 Fund, and Fidelity Simplicity RMD Income Fund (the “Funds”):
Services Billed by Deloitte Entities
July 31, 2023 FeesA,B
| | | | |
| Audit Fees | Audit-Related Fees | Tax Fees | All Other Fees |
| | | | |
Fidelity Managed Retirement 2010 Fund | $22,600 | $- | $7,500 | $600 |
Fidelity Managed Retirement 2015 Fund | $22,600 | $- | $7,500 | $600 |
Fidelity Managed Retirement 2020 Fund | $22,600 | $- | $7,500 | $600 |
Fidelity Managed Retirement 2025 Fund | $22,600 | $- | $7,500 | $600 |
Fidelity Managed Retirement 2030 Fund | $21,400 | $- | $8,000 | $600 |
Fidelity Managed Retirement 2035 Fund | $16,900 | $- | $7,500 | $300 |
Fidelity Managed Retirement Income Fund | $22,600 | $- | $7,500 | $600 |
Fidelity Simplicity RMD 2010 Fund | $16,400 | $- | $7,500 | $500 |
Fidelity Simplicity RMD 2015 Fund | $16,400 | $- | $7,500 | $500 |
Fidelity Simplicity RMD 2020 Fund | $16,400 | $- | $7,500 | $500 |
Fidelity Simplicity RMD 2025 Fund | $18,100 | $- | $7,500 | $500 |
Fidelity Simplicity RMD 2030 Fund | $13,800 | $- | $7,800 | $300 |
Fidelity Simplicity RMD Income Fund | $16,400 | $- | $7,500 | $500 |
| | | | |
| Audit Fees | Audit-Related Fees | Tax Fees | All Other Fees |
| | | | |
Fidelity Managed Retirement 2010 Fund | $20,900 | $- | $7,100 | $500 |
Fidelity Managed Retirement 2015 Fund | $20,900 | $- | $7,100 | $500 |
Fidelity Managed Retirement 2020 Fund | $20,900 | $- | $7,100 | $500 |
Fidelity Managed Retirement 2025 Fund | $20,900 | $- | $7,100 | $500 |
Fidelity Managed Retirement 2030 Fund | $19,700 | $- | $7,100 | $500 |
Fidelity Managed Retirement 2035 Fund | $- | $- | $- | $- |
Fidelity Managed Retirement Income Fund | $20,900 | $- | $7,100 | $500 |
Fidelity Simplicity RMD 2010 Fund | $14,800 | $- | $7,100 | $400 |
Fidelity Simplicity RMD 2015 Fund | $14,800 | $- | $7,100 | $400 |
Fidelity Simplicity RMD 2020 Fund | $14,800 | $- | $7,100 | $400 |
Fidelity Simplicity RMD 2025 Fund | $16,300 | $- | $7,300 | $500 |
Fidelity Simplicity RMD 2030 Fund | $- | $- | $- | $- |
Fidelity Simplicity RMD Income Fund | $14,800 | $- | $7,100 | $400 |
A Amounts may reflect rounding.
B Fidelity Managed Retirement 2035 Fund and Fidelity Simplicity RMD 2030 Fund commenced operations on December 15, 2022.
The following table presents fees billed by PricewaterhouseCoopers LLP (“PwC”) in each of the last two fiscal years for services rendered to Fidelity GNMA Fund (the “Fund”):
Services Billed by PwC
July 31, 2023 FeesA
| | | | |
| Audit Fees | Audit-Related Fees | Tax Fees | All Other Fees |
Fidelity GNMA Fund | $96,500 | $8,000 | $14,100 | $3,400 |
| | | | |
| Audit Fees | Audit-Related Fees | Tax Fees | All Other Fees |
Fidelity GNMA Fund | $91,900 | $7,800 | $13,500 | $3,400 |
A Amounts may reflect rounding.
The following table(s) present(s) fees billed by Deloitte Entities and PwC that were required to be approved by the Audit Committee for services that relate directly to the operations and financial reporting of the Fund(s) and that are rendered on behalf of Fidelity Management & Research Company LLC ("FMR") and entities controlling, controlled by, or under common control with FMR (not including any sub-adviser whose role is primarily portfolio management and is subcontracted with or overseen by another investment adviser) that provide ongoing services to the Fund(s) (“Fund Service Providers”):
Services Billed by Deloitte Entities
| | |
| July 31, 2023A,B | July 31, 2022A,B |
Audit-Related Fees | $- | $- |
Tax Fees | $- | $- |
All Other Fees | $- | $- |
A Amounts may reflect rounding.
B May include amounts billed prior to the Fidelity Managed Retirement 2035 Fund and Fidelity Simplicity RMD 2030 Fund’s commencement of operations.
Services Billed by PwC
| | |
| July 31, 2023A | July 31, 2022A |
Audit-Related Fees | $8,284,200 | $7,914,600 |
Tax Fees | $1,000 | $353,200 |
All Other Fees | $- | $- |
A Amounts may reflect rounding
“Audit-Related Fees” represent fees billed for assurance and related services that are reasonably related to the performance of the fund audit or the review of the fund's financial statements and that are not reported under Audit Fees.
“Tax Fees” represent fees billed for tax compliance, tax advice or tax planning that relate directly to the operations and financial reporting of the fund.
“All Other Fees” represent fees billed for services provided to the fund or Fund Service Provider, a significant portion of which are assurance related, that relate directly to the operations and financial reporting of the fund, excluding those services that are reported under Audit Fees, Audit-Related Fees or Tax Fees.
Assurance services must be performed by an independent public accountant.
* * *
The aggregate non-audit fees billed by Deloitte Entities and PwC for services rendered to the Fund(s), FMR (not including any sub-adviser whose role is primarily portfolio management and is subcontracted with or overseen by another investment adviser), and any Fund Service Provider for each of the last two fiscal years of the Fund(s) are as follows:
| | |
Billed By | July 31, 2023A,B | July 31, 2022A,B |
Deloitte Entities | $347,600 | $541,000 |
PwC | $13,613,300 | $13,259,900 |
| | |
A Amounts may reflect rounding.
B May include amounts billed prior to the Fidelity Managed Retirement 2035 Fund and Fidelity Simplicity RMD 2030 Fund’s commencement of operations.
The trust's Audit Committee has considered non-audit services that were not pre-approved that were provided by Deloitte Entities and PwC to Fund Service Providers to be compatible with maintaining the independence of Deloitte Entities and PwC in its(their) audit of the Fund(s), taking into account representations from Deloitte Entities and PwC, in accordance with Public Company Accounting Oversight Board rules, regarding its independence from the Fund(s) and its(their) related entities and FMR’s review of the appropriateness and permissibility under applicable law of such non-audit services prior to their provision to the Fund(s) Service Providers.
Audit Committee Pre-Approval Policies and Procedures
The trust’s Audit Committee must pre-approve all audit and non-audit services provided by a fund’s independent registered public accounting firm relating to the operations or financial reporting of the fund. Prior to the commencement of any audit or non-audit services to a fund, the Audit Committee reviews the services to determine whether they are appropriate and permissible under applicable law.
The Audit Committee has adopted policies and procedures to, among other purposes, provide a framework for the Committee’s consideration of non-audit services by the audit firms that audit the Fidelity funds. The policies and procedures require that any non-audit service provided by a fund audit firm to a Fidelity fund and any non-audit service provided by a fund auditor to a Fund Service Provider that relates directly to the operations and financial reporting of a Fidelity fund (“Covered Service”) are subject to approval by the Audit Committee before such service is provided.
All Covered Services must be approved in advance of provision of the service either: (i) by formal resolution of the Audit Committee, or (ii) by oral or written approval of the service by the Chair of the Audit Committee (or if the Chair is unavailable, such other member of the Audit Committee as may be designated by the Chair to act in the Chair’s absence). The approval contemplated by (ii) above is permitted where the Treasurer determines that action on such an engagement is necessary before the next meeting of the Audit Committee.
Non-audit services provided by a fund audit firm to a Fund Service Provider that do not relate directly to the operations and financial reporting of a Fidelity fund are reported to the Audit Committee periodically.
Non-Audit Services Approved Pursuant to Rule 2-01(c)(7)(i)(C) and (ii) of Regulation S-X (“De Minimis Exception”)
There were no non-audit services approved or required to be approved by the Audit Committee pursuant to the De Minimis Exception during the Fund’s(s’) last two fiscal years relating to services provided to (i) the Fund(s) or (ii) any Fund Service Provider that relate directly to the operations and financial reporting of the Fund(s).
The Registrant has not retained, for the preparation of the audit report on the financial statements included in the Form N-CSR, a registered public accounting firm that has a branch or office that is located in a foreign jurisdiction and that the Public Company Accounting Oversight Board (the “PCAOB”) has determined that the PCAOB is unable to inspect or investigate completely because of a position taken by an authority in the foreign jurisdiction.
The Registrant is not a “foreign issuer,” as defined in 17 CFR 240.3b-4.
Item 5.
Audit Committee of Listed Registrants
Not applicable.
Item 6.
Investments
(a)
Not applicable.
(b)
Not applicable.
Item 7.
Disclosure of Proxy Voting Policies and Procedures for Closed-End Management Investment Companies
Not applicable.
Item 8.
Portfolio Managers of Closed-End Management Investment Companies
Not applicable.
Item 9.
Purchase of Equity Securities by Closed-End Management Investment Company and Affiliated Purchasers
Not applicable.
Item 10.
Submission of Matters to a Vote of Security Holders
There were no material changes to the procedures by which shareholders may recommend nominees to the trust’s Board of Trustees.
Item 11.
Controls and Procedures
(a)(i) The President and Treasurer and the Chief Financial Officer have concluded that the trust’s disclosure controls and procedures (as defined in Rule 30a-3(c) under the Investment Company Act) provide reasonable assurances that material information relating to the trust is made known to them by the appropriate persons, based on their evaluation of these controls and procedures as of a date within 90 days of the filing date of this report.
(a)(ii) There was no change in the trust’s internal control over financial reporting (as defined in Rule 30a-3(d) under the Investment Company Act) that occurred during the period covered by this report that has materially affected, or is reasonably likely to materially affect, the trust’s internal control over financial reporting.
Item 12.
Disclosure of Securities Lending Activities for Closed-End Management
Investment Companies
Not applicable.
Item 13.
Exhibits
SIGNATURES
Pursuant to the requirements of the Securities Exchange Act of 1934 and the Investment Company Act of 1940, the registrant has duly caused this report to be signed on its behalf by the undersigned, thereunto duly authorized.
Fidelity Income Fund
| |
By: | /s/Laura M. Del Prato |
| Laura M. Del Prato |
| President and Treasurer |
| |
Date: | September 21, 2023 |
Pursuant to the requirements of the Securities Exchange Act of 1934 and the Investment Company Act of 1940, this report has been signed below by the following persons on behalf of the registrant and in the capacities and on the dates indicated.
| |
By: | /s/Laura M. Del Prato |
| Laura M. Del Prato |
| President and Treasurer |
| |
Date: | September 21, 2023 |
| |
By: | /s/John J. Burke III |
| John J. Burke III |
| Chief Financial Officer |
| |
Date: | September 21, 2023 |