| | |
OMB APPROVAL |
OMB Number: | | 3235-0570 |
| |
Expires: | | September 30, 2007 |
|
Estimated average burden |
hours per response: | | 19.4 |
UNITED STATES
SECURITIES AND EXCHANGE COMMISSION
Washington, D.C. 20549
FORM N-CSR
CERTIFIED SHAREHOLDER REPORT OF REGISTERED
MANAGEMENT INVESTMENT COMPANIES
Investment Company Act file number 811-04088
Excelsior Funds, Inc.
(Exact name of registrant as specified in charter)
United States Trust Company of New York
114 West 47th Street
New York, New York 10036
(Address of principal executive offices) (Zip code)
BISYS Fund Services
3435 Stelzer Road
Columbus, Ohio 43219
(Name and address of agent for service)
Registrant’s telephone number, including area code: 1-212-852-1000
Date of fiscal year end: March 31, 2005
Date of reporting period: March 31, 2005
| Item 1. | Reports to Stockholders. |

EQUITY FUNDS
ANNUAL REPORT
March 31, 2005
TABLE OF CONTENTS
For shareholder account information, current price and yield quotations, or to make an initial purchase or obtain a prospectus, call 1-800-446-1012, from overseas, call 617-483-7297.
Internet Address: http://www.excelsiorfunds.com
This report must be preceded or accompanied by a current prospectus.
A description of the policies and procedures that Excelsior Funds use to determine how to vote proxies relating to portfolio securities, as well as information relating to how a Fund voted proxies relating to portfolio securities during the most recent 12-month period ended June 30, is available (i) without charge, upon request, by calling 1-800-446-1012, or (ii) by accessing the Excelsior Funds’ internet address and (iii) on the Commission’s website at http://www.sec.gov.
Excelsior Funds file their June 30 and December 31 schedule of portfolio holdings with the Securities and Exchange Commission, on Form N-Q, within sixty days after the applicable reporting period. Excelsior Funds Form N-Q is available on the Commission’s website at http://www.sec.gov, and may be reviewed and copied at the Commission’s Public Reference Room in Washington, DC. Information on the operation of the Public Reference Room may be obtained by calling 1-800-SEC-0330.
You should consider the Fund’s investment objectives, risks and expenses carefully before you invest. Information about these and other important subjects is in the Fund’s prospectus, which you should read carefully before investing.
Excelsior Funds, Inc. and Excelsior Funds Trust are distributed by BISYS Fund Services Limited Partnership.
You may write to Excelsior Funds, Inc. and Excelsior Funds Trust at the following address:
Excelsior Funds
P.O. Box 8529
Boston, MA 02266-8529
SHARES IN THE FUNDS ARE NOT DEPOSITS OR OBLIGATIONS OF, OR GUARANTEED OR ENDORSED BY, UNITED STATES TRUST COMPANY OF NEW YORK, U.S. TRUST COMPANY, N.A. THEIR PARENT OR AFFILIATES AND SHARES ARE NOT INSURED BY THE FEDERAL DEPOSIT INSURANCE CORPORATION, THE FEDERAL RESERVE BOARD, OR ANY OTHER AGENCY. INVESTMENTS IN THE FUNDS INVOLVE INVESTMENT RISKS, INCLUDING POSSIBLE LOSS OF PRINCIPAL. FUND SHARES ARE NOT INSURED OR GUARANTEED BY THE U.S. GOVERNMENT.
LETTER TO SHAREHOLDERS
March 31, 2005
Dear Fellow Shareholder:
The fiscal year ended March 31, 2005 was marked by a continuing uptrend in broad based market indices. Financial markets spent much of 2004 waiting to see who would win the U.S. Presidential election. Stocks rose in the post-election period, posting gains from the first week of November to year end. The markets held their ground despite higher than anticipated energy prices. On December 14th, the Standard & Poor’s 500 Index closed above 1200 for the first time since August of 2001, and stocks retained most of their year-end 2004 gains during the first quarter of 2005. Also, the Federal Reserve monetary policy took hold, with its seventh increase in the Federal Funds rate to 2.75% as of the end of the first quarter of 2005.
Going forward, our overall investment theme reflects a preference for goods versus services, real versus financial assets, and “old economy” sectors and industries stocks versus the so-called “new economy”. Creating the cities and the infrastructure that are springing up in giant global emerging economies has raised overall levels of demand for commodities that are in relatively short supply, particularly after a decade or more of capital under investment in tangible producing sectors. We expect to focus on opportunities for above-market returns, and our portfolio managers will aim to capitalize on these prospects as they take shape.
As always, we value your confidence in selecting Excelsior to fulfill your investment needs. We strongly believe that Excelsior’s array of funds will help meet the full range of your financial objectives.
Sincerely,

Mary Martinez
President
1
| | DOMESTIC EQUITY MARKET REVIEW |
After a strong performance across sectors, styles, and capitalization ranges during the previous reporting period ended March 31, 2004, the domestic equity markets turned challenging and finished the current reporting period only slightly higher. For the twelve months ended March 31, 2005, the Dow Jones Industrial Average (DJIA) rose 1.4%, the NASDAQ Composite Index (COMP) ticked up 0.25%, while the Standard & Poor’s 500 Index (S&P 500) gained 4.8%.
Throughout the reporting period, good news—including positive macroeconomic trends and attractive corporate fundamentals—was overshadowed by the triple threat of rising market interest rates, surging oil prices, and ongoing violence in the Middle East. The closely fought presidential election added further uncertainty to the markets, which rallied late in 2004 following President Bush’s reelection. However, a falling dollar, repeated interest rate hikes by the Federal Reserve, and a resurgence of oil prices depressed the domestic equity markets in the first calendar quarter of 2005.
During the first fiscal quarter ended June 30, 2004, stocks found solid support behind a bulwark of positive economic news and good company fundamentals. Although a major advance was checked, stocks were able to shake off the so-called “triple threat” to continue their rally.
The second fiscal quarter proved more challenging as stocks declined after the Democratic Convention gave candidate John Kerry a lift in the polls. Prices recovered in September after President Bush took the lead in the polls following the Republican Convention and the markets began to believe he would win reelection. Oil prices exceeded $50 per barrel during the quarter and investors began to fret about declining inventories. This, in turn, fueled worries over inflation and the effect of high energy prices on domestic economic growth.
The markets received a boost in the fiscal third quarter as growth in gross domestic product (GDP) was revised upwards to 3.9% from an initial reading of 3.7%. The reelection of President Bush by a solid majority was also well received by the markets in anticipation of favorable tax developments in the future. In December, new unemployment claims fell to a one-year low, and there was hope that the pace of job creation had stepped up. Retail sales data reported in mid-December surprised on the upside, suggesting that consumers were maintaining spending in the face of increased costs for gasoline and heating oil. Even the persistently high oil prices eased, adding to the good news, while inflation remained in check.
In the final fiscal quarter ended March 31, 2005, the combined headwinds of rising oil prices (which reversed course to exceed $50 per barrel once again), rising market interest rates, and a falling dollar proved too strong for stocks to overcome. Despite these overhangs, consumer confidence remained strong and the labor market remained stable. However, two key measures of business activity in the U.S. decelerated during the quarter. The rally of late 2004 stalled in January 2005, regained momentum in February, only to stall again in March. As a result, domestic equities generally declined in the quarter.
2
INTERNATIONAL EQUITY MARKET REVIEW
After an especially strong year for International equities for the previous fiscal year ended March 31, 2004, the non-U.S. stock markets generally produced another year of solid returns during the twelve-month period ended March 31, 2005. Gains were largely driven by two factors: the continuing global economic recovery and the slumping U.S. dollar, which boosted International equity gains further in U.S. currency terms.
For the first fiscal quarter ended June 30, 2004, MSCI Europe led the way, posting a gain of 2.1% (in U.S. dollars) versus MSCI Asia, which declined 5.3% in USD. Currencies had a negative bias throughout the world but were the worst in Australia and Japan. Key macroeconomic drivers continued to be terrorism and its effects on oil prices, as well as a general bias towards interest-rate tightening globally. The Bank of England raised rates twice for a total hike of 50 basis points (one-half of one percent) while the European Central Bank (ECB) and China stood pat. European stock exchanges were generally in positive territory but Asia was a far different story, as overall weakness in non-Japan Asia resulted from a slowdown being orchestrated in China and an overwhelmingly negative sentiment towards technology that hurt Taiwan and Korea.
In the second fiscal quarter, European stocks rose slightly while Japanese stocks sold off fairly dramatically. Outside of Japan, however, Asian equities delivered a strong rebound in the quarter. The positive fallout from the declining interest rates in the U.S. was strongly felt throughout emerging markets as risk premiums declined. Indeed, the Hong Kong property market, in an environment of negative real interest rates, was up sharply. With the U.S. raising interest rates, the ECB stayed on hold at 2% while the Bank of England raised rates by 25 basis points to 4.75%.
The third fiscal quarter saw international markets once again outperforming the U.S. market, and the performance differential was quite impressive. A continuing contributor to the absolute performance of the international market was the decline of the U.S. dollar, which established new all-time lows against the euro during the fourth calendar quarter.
In general, non-U.S. stocks finished the final fiscal quarter on a positive note. Developed markets were supported by solid economic growth worldwide, while emerging markets continued to benefit from substantial improvements in the quality of management and the transparency of balance sheets. However, the previously all-too-familiar weakness of the U.S. dollar ceased to be a contributor to the absolute performance of International equities during this period as lingering concerns regarding both current account and federal budget deficits were overcome by the realization that the U.S. enjoyed one of the fastest-growing economies in the developed world.
3
EXCELSIOR FUNDS, INC. | BLENDED EQUITY FUND |
The reporting period began on a promising note following a strong showing for the equity markets in 2003 and the first calendar quarter of 2004. Economic growth was accelerating, interest rates remained low, consumer and business confidence continued to improve, and corporate profits grew at a brisk pace. As a result, we emphasized companies in the capital markets, energy, and consumer goods sectors as well as larger and higher-quality companies. Strength in selected consumer stocks, as well as an overweight position in the energy sector, helped performance relative to the benchmark in the second fiscal quarter. Poor performance in technology and selected pharmaceutical stocks detracted from relative performance. In the third fiscal quarter, consumer-related and energy stocks continued to drive relative performance, while technology stocks (primarily large-cap and semiconductors) as well as pharmaceutical stocks detracted from relative returns. In the final fiscal quarter, a lackluster and trading range market environment, the two best performing sectors within the portfolio were utilities and energy. The latter sector (which also turned in the strongest performance in 2004) was supported by consistently high oil prices and the resultant surge in profits. The portfolio’s healthcare stocks outperformed, helped in part by its emphasis away from the large pharmaceutical companies. The financial stocks showed weakness with concerns over rising interest rates; however, the portfolio’s financial stocks performed well on a relative basis. The same was true with respect to the portfolio’s relative performance in the weak technology sector.
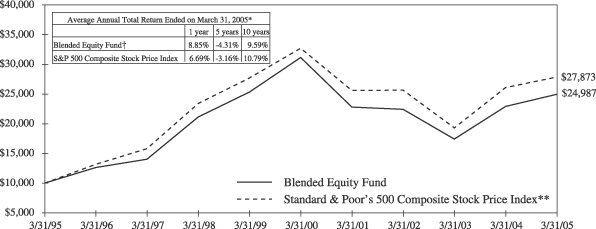
Past performance is not predictive of future performance. Investment returns and principal values will vary and shares may be worth more or less at redemption than their original cost.
The above illustration compares a $10,000 investment made in the Fund and a broad-based index over the past ten fiscal years. The chart assumes all dividends and capital gain distributions are reinvested. The Fund’s performance takes into account fees and expenses. The index does not take into account charges, fees and other expenses. Further information relating to Fund performance is contained in the Financial Highlights section of the Prospectus and elsewhere in this report.
| * | | Total return represents the change during the period in a hypothetical account with dividends reinvested. |
| ** | | Source: Standard & Poor’s Corporation—Reflects the reinvestment of income dividends and, where applicable, capital gain distributions. The Standard & Poor’s 500 Composite Stock Price Index is a widely accepted unmanaged index of U.S. stock market performance. |
| † | | Currently certain fees are waived. Had certain fees not been waived, returns would have been lower. Returns do not reflect the deduction of taxes that a shareholder would pay on Fund distributions or the redemption of shares. |
4
EXCELSIOR FUNDS, INC. | LARGE CAP GROWTH FUND |
Throughout the reporting period, investors focused more on interest-rate-sensitive and low-multiple stocks than would be typical at this stage of the business cycle. We had expected a shift toward companies with sustainable growth stories, and the diversity of the portfolio’s best performers during the reporting period reflected that expectation, with selected consumer goods, telecommunications, and healthcare companies leading the way. In the first fiscal quarter, top performers included a leading pet-supply retailer and the largest futures exchange in the U.S. Also driving performance was a holding from the healthcare sector. On the negative side, an adult education provider and major investment banker hampered returns. Most major equity indices were down in the second fiscal quarter as investors sought shelter in large-cap value stocks. The Russell 1000 Value Index gained 1.5% and stood out as the only large-cap domestic equity benchmark in the black. The S&P 500 and NASDAQ Composite Indices declined 2% and 7%, respectively. Normally, growth stocks would have outperformed value stocks at this stage of the business cycle. However, equity investors took their cues from the bond market and preferred to hold on to interest-rate-sensitive and low-multiple stocks until clear signs of a sustained rebound emerged. In the third fiscal quarter, the bulk of our positive outperformance was generated by holdings in the healthcare, financials, and consumer discretionary stocks, while lack of exposure to the energy, utility, and materials sectors modestly hindered returns. In the reporting period’s final quarter, the Fund underperformed both the market in general and its benchmark. Above-market returns were generated in health care, financial and telecom services, while underperformance was caused primarily by Internet, healthcare and consumer discretionary stocks.
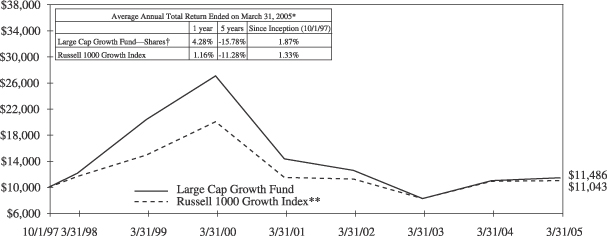
Past performance is not predictive of future performance. Investment returns and principal values will vary and shares may be worth more or less at redemption than their original cost.
The above illustration compares a $10,000 investment made in the Fund and a broad-based index since 10/1/97 (inception date). The chart assumes all dividends and capital gain distributions are reinvested. The Fund’s performance takes into account fees and expenses. The index does not take into account charges, fees and other expenses. Further information relating to Fund performance is contained in the Financial Highlights section of the Prospectus and elsewhere in this report.
| * | | Total return represents the change during the period in a hypothetical account with dividends reinvested. |
| ** | | Source: Frank Russell Company—The Russell 1000 Growth Index is an unmanaged index composed of those Russell 1000 Index companies with higher price-to-book ratios and higher forecasted growth values. The Russell 1000 Index is composed of the 1000 largest companies in The Russell 3000 Index which is composed of 3,000 of the largest U.S. companies by market capitalization. The Index includes dividends reinvested. |
| † | | Currently certain fees are waived. Had certain fees not been waived, returns would have been lower. Returns do not reflect the deduction of taxes that a shareholder would pay on Fund distributions or the redemption of shares. |
5
EXCELSIOR FUNDS, INC. | SMALL CAP FUND |
Compared to its benchmark, the Fund’s holdings during the period generally comprised larger-capitalization stocks with a significantly higher median return on equity and lower debt. It is our belief that higher growth, generated with less debt and greater profitability, and acquired at a lower price, is the hallmark of good value. Throughout the reporting period, an otherwise attractive environment for small-cap stocks—including positive macroeconomic trends and solid-to-strong corporate fundamentals—was overshadowed by the triple threat of rising market interest rates, surging oil prices, and ongoing violence in the Middle East. Despite these headwinds, the small-cap asset class powered ahead in calendar year 2004, completing five years of outperformance compared to its larger-cap brethren. The Fund’s outperformance in the first fiscal quarter was driven by holdings in healthcare, technology, and industrial stocks, which outperformed relative to the benchmark. In the second fiscal quarter, the energy, industrials, and technology sectors aided relative returns by overweight holdings and healthcare stocks detracted from relative returns. The reporting period ended on a challenging note as small-cap stocks generally suffered steeper declines than their larger-cap peers. Companies with pricing power, such as energy and materials (especially steel) outperformed those without pricing power, particularly technology. An underweight in financials, which were pressured by rising interest rates, proved beneficial to relative returns.
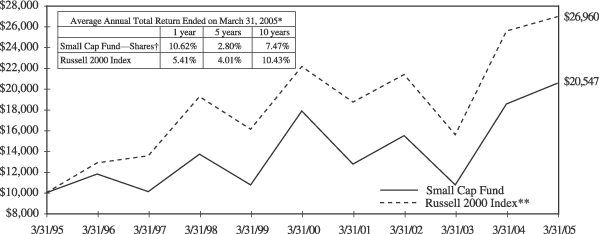
Past performance is not predictive of future performance. Investment returns and principal values will vary and shares may be worth more or less at redemption than their original cost. There is greater volatility associated with an investment in the Small Cap Market.
The above illustration compares a $10,000 investment made in the Fund and a broad-based index over the past ten fiscal years. The chart assumes all dividends and capital gain distributions are reinvested. The Fund’s performance takes into account fees and expenses. The index does not take into account charges, fees and other expenses. Further information relating to Fund performance is contained in the Financial Highlights section of the Prospectus and elsewhere in this report.
| * | | Total return represents the change during the period in a hypothetical account with dividends reinvested. |
| ** | | Source: Frank Russell Company—The Russell 2000 Index is an unmanaged index and is composed of the 2,000 smallest companies in the Russell 3000 Index. The Russell 3000 Index is composed of 3,000 of the largest U.S. companies by market capitalization. The index includes dividends reinvested. |
| † | | Currently certain fees are waived. Had certain fees not been waived, returns would have been lower. Returns do not reflect the deduction of taxes that a shareholder would pay on Fund distributions or the redemption of shares. |
6
EXCELSIOR FUNDS, INC. | VALUE AND RESTRUCTURING FUND |
Throughout the reporting period, holdings in the energy sector benefited Fund performance as energy prices—particularly oil, but also natural gas—rose significantly. Positions in cyclical stocks also boosted returns. In the first fiscal quarter, underweight exposure to technology, pharmaceutical, and healthcare stocks aided relative returns, as did overweight positions in energy and industrials. Meanwhile, holdings in financial firms detracted from performance. In the second fiscal quarter, energy and cyclical stocks performed solidly, while our underweight positions in technology and healthcare once again benefited relative performance as neither sector fared particularly well. During the third fiscal quarter, an important trend emerged: an increasing number of, as well as higher, dividend payouts. Flush with cash, corporate managers began using dividends to enhance shareholder value. This allowed the Fund’s yield to remain steady and rewarding, despite a gain in asset value throughout the period. Dividends are an important component of total return, and the trend towards higher payouts is, we believe, an important feature of the market environment going forward. Once again, energy and natural resource-related stocks powered Fund returns. In the final fiscal quarter of the reporting period, the equity markets essentially went sideways, with energy holdings (particularly overseas-based companies), as well as an underweight exposure to technology and healthcare once again boosting relative performance.
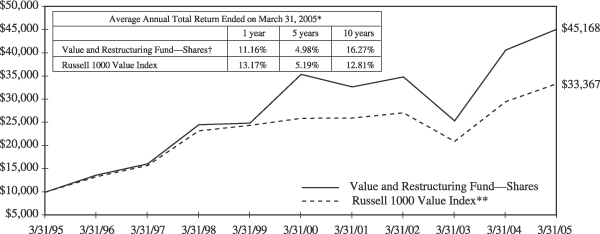
Past performance is not predictive of future performance. Investment returns and principal values will vary and shares may be worth more or less at redemption than their original cost.
The above illustration compares a $10,000 investment made in the Fund and a broad-based index over the past ten fiscal years. The chart assumes all dividends and capital gain distributions are reinvested. The Fund’s performance takes into account fees and expenses. The index does not take into account charges, fees and other expenses. Further information relating to Fund performance is contained in the Financial Highlights section of the Prospectus and elsewhere in this report.
| * | | Total return represents the change during the period in a hypothetical account with dividends reinvested. |
| ** | | Source: Frank Russell Company—The Russell 1000 Value Index is an unmanaged index composed of those Russell 1000 Index companies with lower price-to-book ratios and lower forecasted growth values. The Russell 1000 Index is composed of the 1000 largest companies in The Russell 3000 Index which is composed of 3,000 of the largest U.S. companies by market capitalization. The Index includes dividends reinvested. |
| † | | Currently certain fees are waived. Had certain fees not been waived, returns would have been lower. Returns do not reflect the deduction of taxes that a shareholder would pay on Fund distributions or the redemption of shares. |
7
EXCELSIOR FUNDS TRUST | MID CAP VALUE FUND |
Throughout the reporting period, an attractive environment for mid-cap stocks—including positive macroeconomic trends and solid-to-strong corporate fundamentals—was overshadowed by the triple threat of rising market interest rates, surging oil prices, and ongoing violence in the Middle East. In the first fiscal quarter, appreciation in equities essentially paused while volatility increased. The Fund’s top-performing stocks included two energy-related firms, while holdings in the technology and home-building sectors lagged. In the second fiscal quarter, the Fund maintained its bias toward companies positioned to benefit from continued economic expansion, a posture we believed remained appropriate. The third fiscal quarter was strong for stocks and the Fund participated in the rally, led by holdings in consumer products and land development companies. Late in the reporting period, the emerging “triple threat” depressed investor sentiment toward the domestic equity markets and ushered in a challenging period for stocks in general, with the majority of equity market indices losing ground. Specific to the portfolio, the Fund’s exposure to healthcare, technology, and energy stocks (particularly power producers) hampered relative returns. Despite the less-than-stellar environment, the Fund maintained its longer-range view of investment opportunities and made new investments in sectors believed to be overlooked during the recent rise in commodity prices and that generally lagged in the quarter, including technology stocks and select financials.
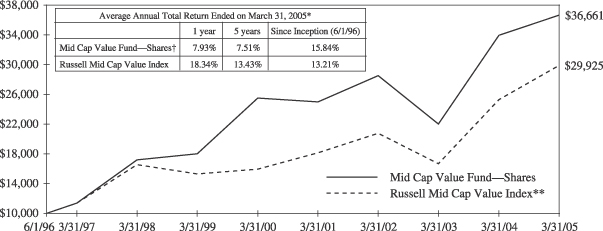
Past performance is not predictive of future performance. Investment returns and principal values will vary and shares may be worth more or less at redemption than their original cost.
The above illustration compares a $10,000 investment made in the Fund and a broad-based index since 6/1/96 (inception date). The chart assumes all dividends and capital gain distributions are reinvested. The Fund’s performance takes into account fees and expenses. The index does not take into account charges, fees and other expenses. Further information relating to Fund performance is contained in the Financial Highlights section of the Prospectus and elsewhere in this report.
| * | | Total return represents the change during the period in a hypothetical account with dividends reinvested. |
| ** | | Source: Frank Russell Company—The Russell Mid Cap Value Index measures the performance of medium-sized value-oriented securities. |
| † | | Currently certain fees are waived. Had certain fees not been waived, returns would have been lower. Returns do not reflect the deduction of taxes that a shareholder would pay on Fund distributions or the redemption of shares. |
8
EXCELSIOR FUNDS, INC. | ENERGY AND NATURAL RESOURCES FUND |
The dramatic rise in oil and natural gas prices may have hindered non-energy stocks, but certainly supported gains in the energy sector. Tight supplies resulting from production problems in Iraq, Indonesia and Venezuela, coupled with rising demand—driven by a synchronized global recovery and China’s accelerating growth—combined to propel energy prices to or near record highs. Crude oil prices above $25 a barrel typically generate significant free cash flow for producers, resulting in value-enhancing dividend increases, debt reduction, share repurchase and merger activity. Prices remained above this key threshold for the entire duration of this reporting period. As a result, many of our holdings saw significant gains in share prices. In the first fiscal quarter, the Fund benefited from two holdings experiencing takeovers. Higher pricing began to accrue to service providers, so we raised our weighting in the oilfield service sector from 18% to 25%. This weighting began to pay off in the third fiscal quarter as capacity utilization for oilfield services began to reach a tipping point and higher service pricing accrued to the sector. In the final fiscal quarter, the Fund’s top performers were a mid-capitalization refiner, which benefited from rising refining margins; a major domestic oil producer that became a takeover target, a small capitalization independent oil producer, and a mid-capitalization independent gas producer. Laggards included a seismic company, which experienced a tepid launch of its new seismic product, and an engineering and construction firm forced to restate its financials.
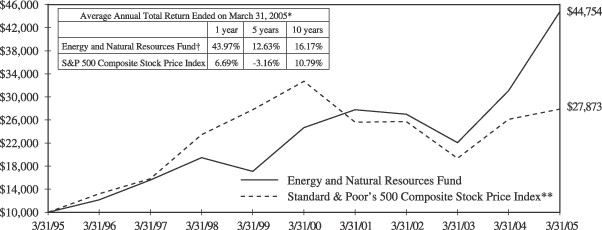
Past performance is not predictive of future performance. Investment returns and principal values will vary and shares may be worth more or less at redemption than their original cost. Concentration in one economic sector may subject an investor to greater volatility.
The above illustration compares a $10,000 investment made in the Fund and a broad-based index over the past ten fiscal years. The chart assumes all dividends and capital gain distributions are reinvested. The Fund’s performance takes into account fees and expenses. The index does not take into account charges, fees and other expenses. Further information relating to Fund performance is contained in the Financial Highlights section of the Prospectus and elsewhere in this report.
| * | | Total return represents the change during the period in a hypothetical account with dividends reinvested. |
| ** | | Source: Standard & Poor’s Corporation—Reflects the reinvestment of income dividends and, where applicable, capital gain distributions. The Standard & Poor’s 500 Composite Stock Price Index is a widely accepted unmanaged index of U.S. stock market performance. |
| † | | Currently certain fees are waived. Had certain fees not been waived, returns would have been lower. Returns do not reflect the deduction of taxes that a shareholder would pay on Fund distributions or the redemption of shares. |
9
EXCELSIOR FUNDS, INC. | REAL ESTATE FUND |
During the reporting period, interest-rate hikes by the Federal Reserve were largely overshadowed by the brisk pace of growth in the U.S. economy. As the 12-month period began, the group as a whole declined as interest rates began to rise and cash flows into real estate mutual funds turned modestly negative. The best performers in the first fiscal quarter were multifamily stocks, while the mall and healthcare categories were the poorest performers. Following a significant sell-off in the first quarter of the reporting period, however, REITs recovered strongly in the period’s second quarter, with the Morgan Stanley REIT Index climbing 8.4%. The retail sector performed particularly well during this time, while the manufactured housing group lagged. For the second fiscal quarter, the retail sector continued to perform well while the manufactured housing group lagged. The third fiscal quarter saw a recovery from the dramatic sell-off in the first fiscal quarter, as investors began to adapt to an environment of rising interest rates and inflows into REIT securities continued. Investors were also attracted by the announcement of sizable acquisitions in the retail and multifamily subsectors. In the reporting period’s final quarter, returns on REIT securities reversed course once again as repeated interest rates hikes and mounting inflationary pressures weighed on investor sentiment. The office subsector was the top performer in this quarter, while industrial REITs were the worst performer, declining on average by more than 10%. Smaller companies generally outperformed large-cap companies. During the quarter, we reduced our positions in small-cap REITs and geographically in Florida, while adding to a position in the storage sector, where fundamentals appear attractive.
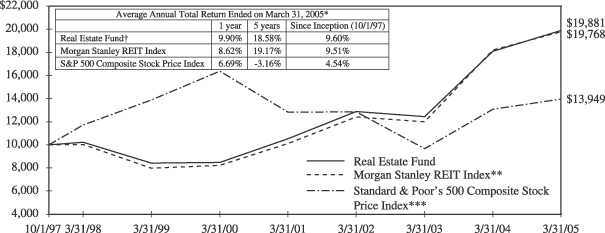
Past performance is not predictive of future performance. Investment returns and principal values will vary and shares may be worth more or less at redemption than their original cost. Concentration in one economic sector may subject an investor to greater volatility.
The above illustration compares a $10,000 investment made in the Fund and broad-based indices since 10/1/97 (inception date). The chart assumes all dividends and capital gain distributions are reinvested. The Fund’s performance takes into account fees and expenses. The indices do not take into account charges, fees and other expenses. Further information relating to Fund performance is contained in the Financial Highlights section of the Prospectus and elsewhere in this report.
| * | | Total return represents the change during the period in a hypothetical account with dividends reinvested. |
| ** | | Source: Morgan Stanley & Co., Incorporated—Reflects the reinvestment of income dividends and, where applicable, capital gain distributions. The Morgan Stanley REIT Index is an unmanaged capitalization-weighted index composed of the largest and most actively traded REITs designed to provide a broad measure of real estate equity performance. |
| *** | | Source: Standard & Poor’s Corporation—Reflects the reinvestment of income dividends and, where applicable, capital gain distributions. The Standard & Poor’s 500 Composite Stock Price Index is a widely accepted unmanaged index of U.S. stock market performance. |
| † | | Currently certain fees are waived. Had certain fees not been waived, returns would have been lower. Returns do not reflect the deduction of taxes that a shareholder would pay on Fund distributions or the redemption of shares. |
10
EXCELSIOR FUNDS TRUST | EQUITY INCOME FUND |
In the first fiscal quarter, the largest share of the Fund’s return was generated by selected holdings, including in a global maker of metal components for furniture; a major supermarket chain; a manufacturer of automotive components; and the leading provider of computer software. Two energy-related firms detracted from performance. During the second fiscal quarter, we initiated positions in two telecommunications companies that pay solid dividend yields. We continued to see key factors supporting the Fund’s investment strategy, including a historically low dividend payout ratio (implying room for future dividend growth), increasingly healthy corporate balance sheets, a shortage of quality reinvestment opportunities for corporations, and favorable changes in tax law treatment of dividends. The third quarter saw a trend toward a number of portfolio holdings raising their annual dividends by significant amounts, generally by double-digit figures. At quarter’s end, the portfolio’s current dividend yield was approximately 2.9%, compared to approximately 1.8% for the S&P 500 Index. In the reporting period’s final quarter, the portfolio benefited from merger activities in department stores and telecommunications, when two of our holdings were acquired. Other significant contributors in the quarter were in energy, specifically among the oil majors. We also did well in the food sector. The worst performing stocks in the portfolio during the quarter were in telecom, and data services. However, we are maintaining our investment in the specific companies where our analysis still suggests positive investment potential.
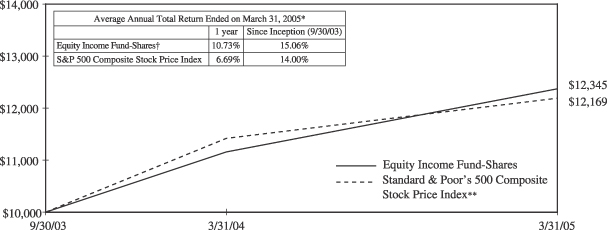
Past performance is not predictive of future performance. Investment returns and principal values will vary and shares may be worth more or less at redemption than their original cost.
The above illustration compares a $10,000 investment made in the Fund and a broad-based index since 9/30/03 (inception date). The chart assumes all dividends and capital gain distributions are reinvested. The Fund’s performance takes into account fees and expenses. The index does not take into account charges, fees and other expenses. Further information relating to Fund performance is contained in the Financial Highlights section of the Prospectus and elsewhere in this report.
| * | | Total return represents the change during the period in a hypothetical account with dividends reinvested. |
| ** | | Source: Standard & Poor’s Corporation—Reflects the reinvestment of income dividends and, where applicable, capital gain distributions. The Standard & Poor’s 500 Composite Stock Price Index is a widely accepted unmanaged index of U.S. stock market performance. |
| † | | Currently certain fees are waived. Had such fees not been waived, returns would have been lower. Returns do not reflect the deduction of taxes that a shareholder would pay on Fund distributions or the redemption of shares. |
11
EXCELSIOR FUNDS TRUST | EQUITY CORE FUND |
At the end of the first fiscal quarter, the portfolio emphasized the consumer discretionary, materials, and utilities sectors and underweighted information technology, financial and telecommunications stocks. The underweight of financial stocks resulted from concerns about rising interest rates. In terms of performance, holdings in department stores, pharmaceuticals, and energy were positive while an auto parts retailer, a cable provider, and an Internet networking and storage firm suffered the largest absolute declines. During the second fiscal quarter, the Fund prospered by owning a number of restructuring companies, including a large maker of digital imaging equipment and film, as well as three energy-related companies. On the other hand, holdings in auto parts retailers and networking and storage solutions firms hampered performance. The Fund advanced in the third fiscal quarter as investors became convinced of the viability and strength of the U.S. economic recovery, and the presidential election was resolved in favor of the Bush administration. The same restructuring companies that helped power returns in the previous quarter continued to perform well, and our pro-growth holdings structure allowed us to capitalize on the market’s forceful gains in the quarter. The Fund also continued to benefit from our holding of Florida’s single biggest land company, which beat earnings guidance in the third calendar quarter and reaffirmed guidance for 2004. On the negative side, we suffered from the big-pharmaceutical backlash triggered by drug recalls. In the reporting period’s final fiscal quarter, a lackluster and trading range market environment, the two best performing sectors within the portfolio were utilities and energy. The latter sector (which also turned in the strongest performance in 2004) was supported by consistently high oil prices and the resultant surge in profits. The consumer stocks in the portfolio held up well in a generally weak group. The portfolio’s healthcare stocks outperformed, helped in part by its emphasis away from the large pharmaceutical companies. The financial stocks showed weakness with concerns over rising interest rates; however, the portfolio’s financial stocks performed well on a relative basis, helped by our underweighting of commercial banks. Our underweighting in technology also aided performance.
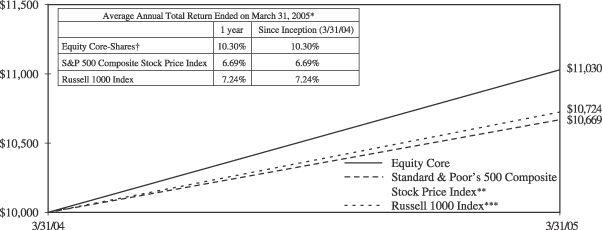
Past performance is not predictive of future performance. Investment returns and principal values will vary and shares may be worth more or less at redemption than their original cost.
The above illustration compares a $10,000 investment made in the Fund and a broad-based index since 3/31/04 (inception date). The chart assumes all dividends and capital gain distributions are reinvested. The Fund’s performance takes into account fees and expenses. The index does not take into account charges, fees and other expenses. Further information relating to Fund performance is contained in the Financial Highlights section of the Prospectus and elsewhere in this report.
| * | | Total return represents the change during the period in a hypothetical account with dividends reinvested. |
| ** | | Source: Standard & Poor’s Corporation—Reflects the reinvestment of income dividends and, where applicable, capital gain distributions. The Standard & Poor’s 500 Composite Stock Price Index is a widely accepted unmanaged index of U.S. stock market performance. |
| *** | | Source: Frank Russell Company—The Russell 1000 Index measures the performance of the 1,000 largest companies in the Russell 3000 Index, which represents approximately 92% of the total market capitalization of the Russell 3000 Index. The Index includes dividends reinvested. |
| † | | Currently certain fees are waived. Had such fees not been waived, returns would have been lower. Returns do not reflect the deduction of taxes that a shareholder would pay on Fund distributions or the redemption of shares. |
12
EXCELSIOR FUNDS, INC. | INTERNATIONAL FUND |
During the first fiscal quarter, we maintained weightings in Japan roughly in-line with the benchmark, while underweighting the United Kingdom on a negative outlook for the financial sector and overweighting the Asian emerging markets due to accelerating growth. Holdings in consumer staples, healthcare, and energy boosted relative returns while information technology, telecommunications, and materials stocks were a drag on performance. In the second fiscal quarter, we reduced exposure to technology and, within the energy sector, diversified out of exploration and production into oil service companies we believe held greater appreciation potential. The third fiscal quarter saw the Fund outperform its benchmark due to successful stock selection across sectors. During the quarter, we initiated new positions in the Taiwanese technology and European media sectors. In the reporting period’s final quarter, the Fund continued to benefit from successful stock selection, especially in the energy, materials, and industrials sectors, and an overweight position in Emerging Markets stocks. By country, Norway, Denmark, and Canada were performance leaders while holdings in Ireland, Hong Kong, and New Zealand were laggards. By period’s end, we had eliminated selected positions in Asia, moving away from consumer sectors, while adding positions in robotics and pharmaceuticals. In Europe, we added in consumer sectors and autos.
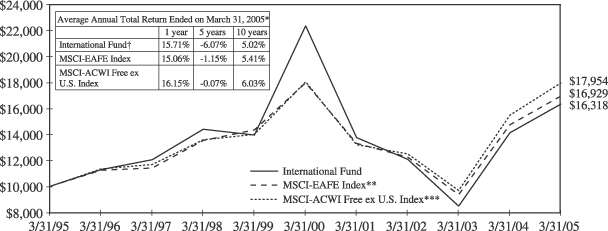
Past performance is not predictive of future performance. Investment returns and principal values will vary and shares may be worth more or less at redemption than their original cost. International investing is subject to special risks such as currency fluctuations and differences in accounting and taxation standards.
The above illustration compares a $10,000 investment made in the Fund and broad-based indices over the past ten fiscal years. The chart assumes all dividends and capital gain distributions are reinvested. The Fund’s performance takes into account fees and expenses. The indices do not take into account charges, fees and other expenses. Further information relating to Fund performance is contained in the Financial Highlights section of the Prospectus and elsewhere in this report.
| * | | Total return represents the change during the period in a hypothetical account with dividends reinvested. |
| ** | | Source: Morgan Stanley & Co., Incorporated—Morgan Stanley Capital International EAFE (Europe, Australia, Asia, Far East) Index is a widely accepted, unmanaged index composed of a sample of companies from 21 countries representing the developed stock markets outside North America. |
| *** | | Source: Morgan Stanley & Co., Incorporated—Morgan Stanley Capital International All Country World Index Free ex U.S. is a widely accepted, unmanaged index of global stock market performance comprising 47 countries with developed and emerging markets excluding the United States. |
| † | | Currently certain fees are waived. Had such fees not been waived returns would have been lower. Returns do not reflect the deduction of taxes that a shareholder would pay on Fund distributions or the redemption of shares. Returns do not reflect the 2% fee imposed on shares redeemed 30 days or less after their date of purchase. |
13
EXCELSIOR FUNDS, INC. | PACIFIC/ASIA FUND |
During the quarter preceding the reporting period, we increased exposure to Japan and that strategy paid off in the first fiscal quarter. We also remained overweight in a number of key markets including India, Hong Kong, China, and Korea. Negatively influencing returns were holdings in healthcare, consumer discretionary, materials, financials, and telecommunications. In the second quarter, we bought back shares in a Chinese power company as the share price had fallen enough to become attractive and the outlook for power generation in China is strong. In addition, we increased exposure to Australia, especially in the media sector. Performance in the third fiscal quarter was led by a resurgence in India, Indonesia, and South Korea, whose equity markets were all up nearly or more than 20%. Outperformers were quite geographically diverse and reflected successful bottom-up stock selection, while limited exposure to Australian stocks hampered returns. Meanwhile, we raised exposure to larger-capitalization Japanese equities as they became more attractively valued on a global basis. The reporting period’s final quarter saw lackluster performance in absolute terms but strong performance relative to the Fund’s benchmark, driven by overweight exposure to equities in Thailand, Indonesia, and Korea. By period’s end, we had increased emphasis on technology and pharmaceuticals as well as firms poised to benefit from rising textile quotas.
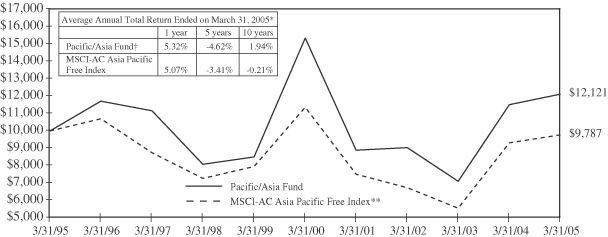
Past performance is not predictive of future performance. Investment returns and principal values will vary and shares may be worth more or less at redemption than their original cost. International investing is subject to special risks such as currency fluctuations and differences in accounting and taxation standards.
The above illustration compares a $10,000 investment made in the Fund and a broad-based index over the past ten fiscal years. The chart assumes all dividends and capital gain distributions are reinvested. The Fund’s performance takes into account fees and expenses. The index does not take into account charges, fees and other expenses. Further information relating to Fund performance is contained in the Financial Highlights section of the Prospectus and elsewhere in this report.
| * | | Total return represents the change during the period in a hypothetical account with dividends reinvested. |
| ** | | Source: Morgan Stanley & Co., Incorporated—The Morgan Stanley Capital International All Country Asia Pacific Free Index is a widely-accepted, unmanaged index composed of a sample of companies representative of the market structure of 10 developed and emerging market countries: China Free, Hong Kong, Japan, Indonesia, Korea, Malaysia, Philippines, Singapore, Taiwan and Thailand. The Index aims to capture 85% of the free float adjusted market capitalization in each industry group, in each country, for those securities not subject to foreign ownership restrictions. The Index includes dividends reinvested. |
| † | | Currently certain fees are waived. Had such fees not been waived, returns would have been lower. Returns do not reflect the deduction of taxes that a shareholder would pay on Fund distributions or the redemption of shares. Returns do not reflect the 2% fee imposed on shares redeemed 30 days or less after their date of purchase. |
14
EXCELSIOR FUNDS, INC. | EMERGING MARKETS FUND |
After five quarters of positive dollar returns, emerging markets equities stumbled in the period’s first fiscal quarter on fears of a “hard landing” in China, the Russian government’s multibillion-dollar tax levy against Yukos Oil, and political uncertainty in India. Overweight exposure to telecommunications stocks helped relative performance during the period. We reduced exposure to the banking sector by selling Taiwanese banks, whose outlook dimmed on a potential economic slowdown in China. In the second fiscal quarter, emerging markets continued to stumble, only to come on strong in September as fears of economic weakness in China eased. The portfolio benefited by overweight exposure to Mexican equities, and telecommunications remained the Fund’s largest overweight. The fiscal third quarter saw strong performance by emerging markets stocks. Banks were a solid contributor to absolute returns, with South African, Brazilian and Indian institutions leading the way. In the reporting period’s final quarter, the Fund underperformed its benchmark due largely to underweight exposure to cyclical sectors such as industrials, metals, and technology. Disappointing performance by holdings in China, most notably food and Internet-related stocks, also hampered relative returns. At period’s end we remained optimistic about appreciation opportunities in emerging markets equities.
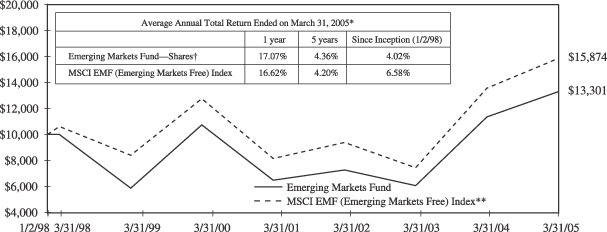
Past performance is not predictive of future performance. Investment returns and principal values will vary and shares may be worth more or less at redemption than their original cost. International investing is subject to special risks such as currency fluctuations and differences in accounting and taxation standards.
The above illustration compares a $10,000 investment made in the Fund and a broad-based index since 1/2/98 (inception date). For comparative purposes, the value of the index on 12/31/97 is used as the beginning value on 1/2/98. The chart assumes all dividends and capital gain distributions are reinvested. The Fund’s performance takes into account fees and expenses. The index does not take into account charges, fees and other expenses. Further information relating to Fund performance is contained in the Financial Highlights section of the Prospectus and elsewhere in this report.
| * | | Total return represents the change during the period in a hypothetical account with dividends reinvested. |
| ** | | Source: Morgan Stanley & Co., Incorporated—Morgan Stanley Capital International EMF (Emerging Markets Free) Index is a widely-accepted, unmanaged index composed of a sample of companies representative of the market structure of 26 global emerging market countries. The Index includes dividends reinvested. |
| † | | Currently certain fees are waived. Had such fees not been waived, returns would have been lower. Returns do not reflect the deduction of taxes that a shareholder would pay on Fund distributions or the redemption of shares. Returns do not reflect the 2% fee imposed on shares redeemed 30 days or less after their date of purchase. |
15
Excelsior Funds, Inc.
Portfolio of Investments — March 31, 2005
Blended Equity Fund
| | | | | |
| | | | | |
Shares
| | | | Value
|
| COMMON STOCKS — 99.19% | | |
| | | CONSUMER DISCRETIONARY — 14.09% |
| 29,200 | | Autozone, Inc.(a) | | $ | 2,502,440 |
| 179,243 | | Coach, Inc.(a) | | | 10,150,530 |
| 166,480 | | Eastman Kodak Co. | | | 5,418,924 |
| 98,800 | | eBay(a) | | | 3,681,288 |
| 305,810 | | Fossil, Inc.(a) | | | 7,928,124 |
| 284,002 | | John Wiley & Sons, Class A | | | 10,011,071 |
| 73,325 | | Mohawk Industries, Inc.(a) | | | 6,181,298 |
| 30,900 | | Omnicom Group | | | 2,735,268 |
| 19,451 | | Sears Holding Corp.(a) | | | 2,590,290 |
| 176,400 | | Target Corp. | | | 8,823,528 |
| 81,515 | | Timberland Co., Class A(a) | | | 5,781,859 |
| | | | |
|
|
| | | | | | 65,804,620 |
| | | | |
|
|
| | | CONSUMER STAPLES — 6.84% |
| 88,200 | | Altria Group, Inc. | | | 5,767,398 |
| 51,200 | | Kellogg Co. | | | 2,215,424 |
| 204,836 | | Sysco Corp. | | | 7,333,129 |
| 156,100 | | Wal-Mart Stores, Inc. | | | 7,822,171 |
| 81,800 | | Walgreen Co. | | | 3,633,556 |
| 78,437 | | Wm. Wrigley Jr. Co. | | | 5,143,114 |
| | | | |
|
|
| | | | | | 31,914,792 |
| | | | |
|
|
| | | ENERGY — 9.31% |
| 129,044 | | Apache Corp. | | | 7,901,364 |
| 37,100 | | ChevronTexaco Corp. | | | 2,163,301 |
| 314,564 | | Exxon Mobil Corp. | | | 18,748,014 |
| 103,929 | | Nabors Industries Ltd.(a) | | | 6,146,361 |
| 37,200 | | Royal Dutch Petroleum Co.(NY Shares) | | | 2,233,488 |
| 155,608 | | Suncor Energy, Inc. | | | 6,256,998 |
| | | | |
|
|
| | | | | | 43,449,526 |
| | | | |
|
|
| | | FINANCIAL — 20.52% |
| 169,864 | | Allstate Corp. | | | 9,182,848 |
| 92,600 | | American Express Co. | | | 4,756,862 |
| 160,591 | | American International Group, Inc. | | | 8,898,347 |
| 168,520 | | Bank of America Corp. | | | 7,431,732 |
| 200,762 | | Citigroup, Inc. | | | 9,022,244 |
| 95,666 | | Goldman Sachs Group, Inc. | | | 10,522,304 |
| 23,350 | | HSBC Holdings plc ADR | | | 1,853,990 |
| 76,000 | | JP Morgan Chase & Co. | | | 2,629,600 |
| 29,700 | | MBIA, Inc. | | | 1,552,716 |
| 49,088 | | Mellon Financial Corp. | | | 1,400,972 |
| 55,600 | | Merrill Lynch & Co., Inc. | | | 3,146,960 |
| | | | | |
| | | | | |
| | | | | |
Shares
| | | | Value
|
| COMMON STOCKS — (continued) | | |
| | | FINANCIAL — (continued) |
| 105,457 | | RenaissanceRe Holdings Ltd. | | $ | 4,924,842 |
| 213,100 | | State Street Corp. | | | 9,316,732 |
| 160,618 | | U.S. BanCorp. | | | 4,629,011 |
| 177,300 | | Washington Mutual, Inc. | | | 7,003,350 |
| 160,460 | | Wells Fargo & Co. | | | 9,595,508 |
| | | | |
|
|
| | | | | | 95,868,018 |
| | | | |
|
|
| | | HEALTH CARE — 12.65% |
| 180,800 | | Abbott Laboratories | | | 8,428,896 |
| 55,245 | | Barr Laboratories, Inc.(a) | | | 2,697,613 |
| 22,100 | | Genzyme Corp. — General Division(a) | | | 1,265,004 |
| 35,900 | | HCA, Inc. | | | 1,923,163 |
| 18,100 | | Hospira, Inc.(a) | | | 584,087 |
| 235,270 | | Johnson & Johnson | | | 15,800,733 |
| 98,044 | | Medtronic, Inc. | | | 4,995,342 |
| 105,297 | | Novo-Nordisk A/S ADR | | | 5,877,679 |
| 301,300 | | Pfizer, Inc. | | | 7,915,151 |
| 97,100 | | Schering Plough Corp. | | | 1,762,365 |
| 62,246 | | Wellpoint Health Networks(a) | | | 7,802,536 |
| | | | |
|
|
| | | | | | 59,052,569 |
| | | | |
|
|
| | | INDUSTRIALS — 11.55% |
| 170,070 | | Danaher Corp. | | | 9,083,439 |
| 52,100 | | Dover Corp. | | | 1,968,859 |
| 631,184 | | General Electric Co. | | | 22,760,495 |
| 79,400 | | Herman Miller, Inc. | | | 2,391,528 |
| 137,100 | | Illinois Tool Works, Inc. | | | 12,274,563 |
| 75,000 | | Tyco International Ltd. | | | 2,535,000 |
| 101,500 | | Waste Management, Inc. | | | 2,928,275 |
| | | | |
|
|
| | | | | | 53,942,159 |
| | | | |
|
|
| | | INFORMATION TECHNOLOGY — 12.98% |
| 231,925 | | Accenture Ltd., Class A(a) | | | 5,600,989 |
| 152,352 | | Analog Devices, Inc. | | | 5,506,001 |
| 432,065 | | Cisco Systems, Inc.(a) | | | 7,729,643 |
| 40 | | Computer Associates International, Inc. | | | 1,084 |
| 70,600 | | Dell, Inc.(a) | | | 2,712,452 |
| 149,070 | | Intel Corp. | | | 3,462,896 |
| 87,349 | | International Business Machines Corp. | | | 7,981,952 |
| 10,200 | | Maxim Integrated Products, Inc. | | | 416,874 |
| 316,700 | | Microsoft Corp. | | | 7,654,639 |
| 210,799 | | Molex, Inc., Class A | | | 4,974,856 |
See Notes to Financial Statements.
16
Excelsior Funds, Inc.
Portfolio of Investments — March 31, 2005
Blended Equity Fund — (continued)
| | | | | |
| | | | | |
| | | | | |
Shares
| | | | Value
|
| COMMON STOCKS — (continued) | | |
| | | INFORMATION TECHNOLOGY — (continued) |
| 207,563 | | National Instruments Corp. | | $ | 5,614,579 |
| 141,200 | | NCR Corp.(a) | | | 4,764,088 |
| 103,888 | | SAP AG ADR | | | 4,163,831 |
| | | | |
|
|
| | | | | | 60,583,884 |
| | | | |
|
|
| | | RAW/INTERMEDIATE MATERIALS — 4.03% |
| 26,500 | | Air Products & Chemicals, Inc. | | | 1,677,185 |
| 295,633 | | Aracruz Cellulose S.A. ADR | | | 10,583,662 |
| 55,918 | | E.I. Du Pont de Nemours & Co. | | | 2,865,238 |
| 25,600 | | International Paper Co. | | | 941,824 |
| 48,215 | | Vulcan Materials Company | | | 2,740,058 |
| | | | |
|
|
| | | | | | 18,807,967 |
| | | | |
|
|
| | | REAL ESTATE — 2.52% |
| 175,018 | | St. Joe Co. | | | 11,778,711 |
| | | | |
|
|
| | | UTILITIES — 4.70% |
| 384,715 | | AES Corp.(a) | | | 6,301,632 |
| 482,621 | | Centerpoint Energy, Inc. | | | 5,805,931 |
| 123,500 | | TXU Corp. | | | 9,834,304 |
| | | | |
|
|
| | | | | | 21,941,867 |
| | | | |
|
|
| | | TOTAL COMMON STOCKS
(Cost $267,407,781) | | | 463,144,113 |
| | | | |
|
|
| | | | | |
| | | | | |
| | | | | |
Principal
Amount
| | | | Value
|
| REPURCHASE AGREEMENT — 0.59% | | |
| $2,737,000 | | JP Morgan Chase Securities, Inc., 2.30%, dated 3/31/05, to be repurchased 4/01/05,
repurchase price $2,737,175 (collateralized by Federal National Mortgage Association MTN, par value $2,734,000, 4.63%, maturing 10/15/14; total market value $2,795,314) | | $ | 2,737,000 |
| | | | |
|
|
| | | TOTAL REPURCHASE AGREEMENT
(Cost $2,737,000) | | | 2,737,000 |
| | | | |
|
|
| | | | | | |
| | | | | | |
| | | | | | |
TOTAL INVESTMENTS
(Cost $270,144,781)(b) | | 99.78 | % | | $ | 465,881,113 |
OTHER ASSETS IN EXCESS OF LIABILITIES | | 0.22 | | | | 1,022,029 |
| | |
|
| |
|
|
NET ASSETS | | 100.00 | % | | $ | 466,903,142 |
| | |
|
| |
|
|
| (a) | Non-income producing security. |
| (b) | Unrealized appreciation (depreciation) of securities: |
| | | | |
Unrealized
Appreciation
| | Unrealized
(Depreciation)
| | Net Unrealized
Appreciation/
(Depreciation)
|
| $197,668,910 | | $(1,932,578) | | $195,736,332 |
ADR—American Depository Receipt
Ltd.—Limited
MTN—Medium Term Note
plc—public limited company
See Notes to Financial Statements.
17
Excelsior Funds, Inc.
Portfolio of Investments — March 31, 2005
Blended Equity Fund — (continued)
The summary of the Fund’s investments as of March 31, 2005 is as follows: (Unaudited)
| | | | | | |
Sector Diversification
| | % of
Net
Assets
| | | Market Value
|
Financial | | 20.52 | % | | $ | 95,868,018 |
Consumer Discretionary | | 14.09 | | | | 65,804,620 |
Information Technology | | 12.98 | | | | 60,583,884 |
Health Care | | 12.65 | | | | 59,052,569 |
Industrials | | 11.55 | | | | 53,942,159 |
Energy | | 9.31 | | | | 43,449,526 |
Consumer Staples | | 6.84 | | | | 31,914,792 |
Utilities | | 4.70 | | | | 21,941,867 |
Raw/Intermediate Materials | | 4.03 | | | | 18,807,967 |
Real Estate | | 2.52 | | | | 11,778,711 |
Repurchase Agreements | | 0.59 | | | | 2,737,000 |
| | |
|
| |
|
|
Total Investment | | 99.78 | % | | $ | 465,881,113 |
Other Assets and Liabilities (Net) | | 0.22 | | | | 1,022,029 |
| | |
|
| |
|
|
Net Assets | | 100.00 | % | | $ | 466,903,142 |
| | |
|
| |
|
|
See Notes to Financial Statements.
18
Excelsior Funds, Inc.
Portfolio of Investments — March 31, 2005
Large Cap Growth Fund
| | | | | |
| | | | | |
Shares
| | | | Value
|
| COMMON STOCKS — 96.14% | | |
| | | CONSUMER DISCRETIONARY — 21.53% |
| 161,500 | | Carnival Corp., Class A | | $ | 8,367,315 |
| 110,600 | | eBay(a) | | | 4,120,956 |
| 60,900 | | Kohls Corp.(a) | | | 3,144,267 |
| 96,300 | | Lowes Companies, Inc. | | | 5,497,767 |
| 492,900 | | News Corp., Class A | | | 8,339,868 |
| 162,500 | | Petsmart, Inc. | | | 4,671,875 |
| 87,600 | | Starbucks Corp.(a) | | | 4,525,416 |
| 237,100 | | Univision Communications, Inc.(a) | | | 6,565,299 |
| | | | |
|
|
| | | | | | 45,232,763 |
| | | | |
|
|
| | | FINANCIAL — 7.90% |
| 32,300 | | Chicago Mercantile Exchange | | | 6,267,169 |
| 42,700 | | Lehman Brothers Holding, Inc. | | | 4,020,632 |
| 126,526 | | SLM Corp. | | | 6,306,056 |
| | | | |
|
|
| | | | | | 16,593,857 |
| | | | |
|
|
| | | HEALTH CARE — 29.16% |
| 97,900 | | Alcon, Inc. | | | 8,741,491 |
| 78,400 | | Amgen, Inc.(a) | | | 4,563,664 |
| 124,400 | | Boston Scientific Corp.(a) | | | 3,643,676 |
| 204,700 | | Caremark Rx, Inc.(a) | | | 8,142,966 |
| 73,600 | | Eli Lilly & Co. | | | 3,834,560 |
| 257,100 | | Gilead Sciences, Inc.(a) | | | 9,204,180 |
| 75,700 | | Medtronic, Inc. | | | 3,856,915 |
| 88,900 | | Patterson Cos., Inc.(a) | | | 4,440,555 |
| 222,800 | | Teva Pharmaceutical | | | 6,906,800 |
| 101,700 | | Zimmer Holdings, Inc.(a) | | | 7,913,277 |
| | | | |
|
|
| | | | | | 61,248,084 |
| | | | |
|
|
| | | INDUSTRIALS — 5.50% |
| 57,900 | | Apollo Group, Inc., Class A(a) | | | 4,288,074 |
| 104,900 | | Career Education Corp.(a) | | | 3,593,874 |
| 68,600 | | Expeditors International of Washington, Inc. | | | 3,673,530 |
| | | | |
|
|
| | | | | | 11,555,478 |
| | | | |
|
|
| | | INFORMATION TECHNOLOGY — 28.01% |
| 183,700 | | Apple Computer, Inc.(a) | | | 7,654,779 |
| 169,800 | | Broadcom Corp., Class A(a) | | | 5,080,416 |
| 163,200 | | Dell, Inc.(a) | | | 6,270,144 |
| 118,300 | | Electronic Arts, Inc.(a) | | | 6,125,574 |
| 71,400 | | Infosys Technologies, Ltd. ADR | | | 5,264,322 |
| 231,984 | | Qualcomm, Inc. | | | 8,502,213 |
| 92,918 | | Research In Motion, Ltd.(a) | | | 7,100,794 |
| | | | | |
| | | | | |
Shares
| | | | Value
|
| COMMON STOCKS — (continued) | | |
| | | INFORMATION TECHNOLOGY — (continued) |
| 201,800 | | SAP AG ADR | | $ | 8,088,144 |
| 126,000 | | Symantec Corp.(a) | | | 2,687,580 |
| 89,300 | | Veritas Software Corp.(a) | | | 2,073,546 |
| | | | |
|
|
| | | | | | 58,847,512 |
| | | | |
|
|
| | | TELECOMMUNICATION — 4.04% |
| 164,300 | | America Movil S.A. de C.V., Series L ADR | | | 8,477,880 |
| | | | |
|
|
| | | Total COMMON STOCKS
(Cost $175,170,826) | | | 201,955,574 |
| | | | |
|
|
| | |
Principal
Amount
| | | | |
| REPURCHASE AGREEMENT — 8.25% | | |
| $17,324,000 | | JP Morgan Chase Securities, Inc., 2.30%, dated 03/31/05, to be repurchased on 04/01/05, repurchase price $17,325,107 (collateralized by Federal National Mortgage Association MTN, par value $17,302,000, 4.63%, maturing on 10/15/14; total market value $17,692,963) | | | 17,324,000 |
| | | | |
|
|
| | | TOTAL REPURCHASE AGREEMENT
(Cost $17,324,000) | | | 17,324,000 |
| | | | |
|
|
| | | | | | | |
| | | | | | | |
TOTAL INVESTMENTS
(Cost $192,494,826)(b) | | 104.39 | % | | $ | 219,279,574 | |
LIABILITIES IN EXCESS OF
OTHER ASSETS | | (4.39 | ) | | | (9,218,684 | ) |
| | |
|
| |
|
|
|
NET ASSETS | | 100.00 | % | | $ | 210,060,890 | |
| | |
|
| |
|
|
|
| (a) | Non-income producing security |
| (b) | Unrealized appreciation (depreciation) of securities: |
| | | | |
Unrealized
Appreciation
| | Unrealized
(Depreciation)
| | Net Unrealized
Appreciation/
(Depreciation)
|
| $34,414,355 | | $(7,629,607) | | $26,784,748 |
ADR—American Depository Receipt
Ltd.—Limited
MTN—Medium Term Note
See Notes to Financial Statements.
19
Excelsior Funds, Inc.
Portfolio of Investments — March 31, 2005
Large Cap Growth Fund — (continued)
The summary of the Fund’s investments as of March 31, 2005 is as follows: (Unaudited)
| | | | | | | |
Sector Diversification
| | % of
Net
Assets
| | | Market Value
| |
Health Care | | 29.16 | % | | $ | 61,248,084 | |
Information Technology | | 28.01 | | | | 58,847,512 | |
Consumer Discretionary | | 21.53 | | | | 45,232,763 | |
Repurchase Agreements | | 8.25 | | | | 17,324,000 | |
Financial | | 7.90 | | | | 16,593,857 | |
Industrials | | 5.50 | | | | 11,555,478 | |
Telecommunication | | 4.04 | | | | 8,477,880 | |
| | |
|
| |
|
|
|
Total Investment | | 104.39 | % | | $ | 219,279,574 | |
Other Assets and Liabilities (Net) | | (4.39 | ) | | | (9,218,684 | ) |
| | |
|
| |
|
|
|
Net Assets | | 100.00 | % | | $ | 210,060,890 | |
| | |
|
| |
|
|
|
See Notes to Financial Statements.
20
Excelsior Funds, Inc.
Portfolio of Investments — March 31, 2005
Small Cap Fund
| | | | | |
| | | | | |
Shares
| | | | Value
|
| COMMON STOCKS — 99.57% | | |
| | | CONSUMER DISCRETIONARY — 16.50% |
| 440,000 | | BJ’s Wholesale Club, Inc.(a) | | $ | 13,666,400 |
| 800,000 | | Corinthian Colleges, Inc.(a) | | | 12,576,000 |
| 1,000,000 | | Oakley, Inc. | | | 12,820,000 |
| 200,000 | | Panera Bread Co., Class A(a) | | | 11,306,000 |
| 1,000,000 | | Sotheby’s Holdings, Inc., Class A(a) | | | 16,960,000 |
| 250,000 | | Thor Industries, Inc. | | | 7,477,500 |
| 120,000 | | Urban Outfitters, Inc.(a) | | | 5,756,400 |
| | | | |
|
|
| | | | | | 80,562,300 |
| | | | |
|
|
| | | CONSUMER STAPLES — 1.68% |
| 300,000 | | American Italian Pasta Co. | | | 8,220,000 |
| | | | |
|
|
| | | ENERGY — 5.63% |
| 330,000 | | Cal Dive International, Inc.(a) | | | 14,949,000 |
| 240,000 | | Helmerich & Payne, Inc. | | | 9,525,600 |
| 80,000 | | Oceaneering International, Inc.(a) | | | 3,000,000 |
| | | | |
|
|
| | | | | | 27,474,600 |
| | | | |
|
|
| | | FINANCIAL — 13.79% |
| 320,000 | | Jefferies Group, Inc. | | | 12,057,600 |
| 1,500,000 | | Knight Trading Group, Inc.(a) | | | 14,460,000 |
| 1,600,000 | | LaBranche & Co., Inc.(a) | | | 14,880,000 |
| 65,000 | | Park National Corp. | | | 7,312,500 |
| 240,000 | | Philadelphia Consolidated Holdings Corp.(a) | | | 18,607,200 |
| | | | |
|
|
| | | | | | 67,317,300 |
| | | | |
|
|
| | | HEALTH CARE — 9.90% |
| 300,000 | | Arrow International, Inc. | | | 10,305,000 |
| 430,000 | | Kensey Nash Corp.(a) | | | 11,644,400 |
| 370,000 | | LifePoint Hospitals, Inc.(a) | | | 16,220,800 |
| 1,500,000 | | Orthovita, Inc.(a) | | | 5,100,000 |
| 224,930 | | Zoll Medical Group(a) | | | 5,067,673 |
| | | | |
|
|
| | | | | | 48,337,873 |
| | | | |
|
|
| | | INDUSTRIALS — 10.08% |
| 1,800,000 | | Quanta Services, Inc.(a) | | | 13,734,000 |
| 400,000 | | Simpson Manufacturing Co., Inc. | | | 12,360,000 |
| 450,000 | | Thomas & Betts Corp.(a) | | | 14,535,000 |
| 220,000 | | Triumph Group, Inc.(a) | | | 8,566,800 |
| | | | |
|
|
| | | | | | 49,195,800 |
| | | | |
|
|
| | | | | |
| | | | | |
Shares
| | | | Value
|
| COMMON STOCKS — (continued) | | |
| | | INFORMATION TECHNOLOGY — 21.82% |
| 170,000 | | Anteon International Corp.(a) | | $ | 6,618,100 |
| 250,000 | | Cabot Microelectronics Corp.(a) | | | 7,845,000 |
| 340,000 | | CACI International, Inc., Class A(a) | | | 18,778,200 |
| 480,000 | | Dendrite International, Inc.(a) | | | 6,739,200 |
| 600,000 | | Forrester Research, Inc.(a) | | | 8,448,000 |
| 1,000,000 | | Keane, Inc.(a) | | | 13,030,000 |
| 240,000 | | Manhattan Associates, Inc.(a) | | | 4,888,800 |
| 300,000 | | MAXIMUS, Inc. | | | 10,047,000 |
| 120,000 | | Palmone, Inc.(a) | | | 3,045,600 |
| 280,000 | | Quanex Corp. | | | 14,929,600 |
| 770,000 | | RSA Security, Inc.(a) | | | 12,204,500 |
| | | | |
|
|
| | | | | | 106,574,000 |
| | | | |
|
|
| | | RAW/INTERMEDIATE MATERIALS — 8.71% |
| 400,000 | | Cambrex Corp. | | | 8,520,000 |
| 360,000 | | Oregon Steel Mills, Inc.(a) | | | 8,280,000 |
| 260,000 | | Steel Dynamics, Inc. | | | 8,957,000 |
| 380,000 | | Stillwater Mining Co.(a) | | | 3,743,000 |
| 800,000 | | USEC, Inc. | | | 13,024,000 |
| | | | |
|
|
| | | | | | 42,524,000 |
| | | | |
|
|
| | | TECHNOLOGY — 6.17% |
| 660,000 | | CommScope, Inc.(a) | | | 9,873,600 |
| 1,000,000 | | Kulicke & Soffa Industries, Inc.(a) | | | 6,290,000 |
| 240,000 | | Power Integrations(a) | | | 5,013,600 |
| 600,000 | | Technitrol, Inc.(a) | | | 8,952,000 |
| | | | |
|
|
| | | | | | 30,129,200 |
| | | | |
|
|
| | | TRANSPORTATION — 3.79% |
| 960,000 | | Kansas City Southern(a) | | | 18,489,600 |
| | | | |
|
|
| | | UTILITIES — 1.50% |
| 300,000 | | Aqua America, Inc. | | | 7,308,000 |
| | | | |
|
|
| | | TOTAL COMMON STOCKS
(Cost $391,639,078) | | | 486,132,673 |
| | | | |
|
|
See Notes to Financial Statements.
21
Excelsior Funds, Inc.
Portfolio of Investments — March 31, 2005
Small Cap Fund — (continued)
| | | | | |
| | | | | |
Principal
Amount
| | | | Value
|
| REPURCHASE AGREEMENT — 0.69% | | |
| $3,353,000 | | JP Morgan Chase Securities, Inc., 2.30%, dated 03/31/05, to be repurchased on 04/01/05, repurchase price $3,353,214 (collateralized by Federal National Mortgage Association MTN, par value $3,349,000, 4.63%, maturing on 10/15/14; total market value $3,424,407) | | $ | 3,353,000 |
| | | | |
|
|
| | | TOTAL REPURCHASE AGREEMENT
(Cost $3,353,000) | | | 3,353,000 |
| | | | |
|
|
| | | | | | | |
| | | | | | | |
TOTAL INVESTMENTS
(Cost $394,992,078)(b) | | 100.26 | % | | $ | 489,485,673 | |
LIABILITIES IN EXCESS OF OTHER ASSETS | | (0.26 | ) | | | (1,263,151 | ) |
| | |
|
| |
|
|
|
NET ASSETS | | 100.00 | % | | $ | 488,222,522 | |
| | |
|
| |
|
|
|
| (a) | Non-income producing security |
| (b) | Unrealized appreciation (depreciation) of securities: |
| | | | |
Unrealized
Appreciation
| | Unrealized
(Depreciation)
| | Net Unrealized
Appreciation/
(Depreciation)
|
| $113,033,494 | | $(18,539,899) | | $94,493,595 |
MTN—Medium Term Note
The summary of the Fund’s investments as of March 31, 2005 is as follows: (Unaudited)
| | | | | | | |
Sector Diversification
| | % of
Net
Assets
| | | Market Value
| |
Information Technology | | 21.82 | % | | $ | 106,574,000 | |
Consumer Discretionary | | 16.50 | | | | 80,562,300 | |
Financial | | 13.79 | | | | 67,317,300 | |
Industrials | | 10.08 | | | | 49,195,800 | |
Health Care | | 9.90 | | | | 48,337,873 | |
Raw/Intermediate Materials | | 8.71 | | | | 42,524,000 | |
Technology | | 6.17 | | | | 30,129,200 | |
Energy | | 5.63 | | | | 27,474,600 | |
Transportation | | 3.79 | | | | 18,489,600 | |
Consumer Staples | | 1.68 | | | | 8,220,000 | |
Utilities | | 1.50 | | | | 7,308,000 | |
Repurchase Agreements | | 0.69 | | | | 3,353,000 | |
| | |
|
| |
|
|
|
Total Investment | | 100.26 | % | | $ | 489,485,673 | |
Other Assets and Liabilities (Net) | | (0.26 | ) | | | (1,263,151 | ) |
| | |
|
| |
|
|
|
Net Assets | | 100.00 | % | | $ | 488,222,522 | |
| | |
|
| |
|
|
|
See Notes to Financial Statements.
22
Excelsior Funds, Inc.
Portfolio of Investments — March 31, 2005
Value and Restructuring Fund
| | | | | |
| | | | | |
Shares
| | | | Value
|
| COMMON STOCKS — 95.06% | | |
| | | CONSUMER DISCRETIONARY — 20.83% |
| 1,750,000 | | Avon Products, Inc. | | $ | 75,145,000 |
| 1,800,000 | | Black & Decker Corp. | | | 142,182,000 |
| 2,450,000 | | Centex Corp. | | | 140,311,500 |
| 1,011,388 | | Harman International | | | 89,467,382 |
| 3,650,000 | | Interpublic Group of Companies, Inc.(a) | | | 44,822,000 |
| 1,700,000 | | Journal Communications, Inc., Class A | | | 28,135,000 |
| 3,700,000 | | Liberty Media Corp., Class A(a) | | | 38,369,000 |
| 2,000,000 | | Loews Corp. — Carolina Group | | | 66,200,000 |
| 2,250,000 | | Newell Rubbermaid, Inc. | | | 49,365,000 |
| 2,100,000 | | TJX Cos., Inc. | | | 51,723,000 |
| 5,600,000 | | XM Satellite Radio Holdings, Inc., Class A(a) | | | 176,400,001 |
| 2,075,000 | | Zale Corp.(a) | | | 61,669,000 |
| | | | |
|
|
| | | | | | 963,788,883 |
| | | | |
|
|
| | | CONSUMER STAPLES — 4.32% |
| 1,850,000 | | ConAgra Foods, Inc. | | | 49,987,000 |
| 2,425,000 | | Dean Foods Co.(a) | | | 83,177,500 |
| 1,575,000 | | Kraft Foods, Inc., Class A | | | 52,053,750 |
| 1,500,000 | | Vintage Wine Trust, Inc.(a)(b) | | | 15,000,000 |
| | | | |
|
|
| | | | | | 200,218,250 |
| | | | |
|
|
| | | ENERGY — 12.97% |
| 200,000 | | Alpha Natural Resources, Inc.(a) | | | 5,734,000 |
| 2,100,000 | | Burlington Resources, Inc.(c) | | | 105,147,000 |
| 625,000 | | ConocoPhillips | | | 67,400,000 |
| 2,050,000 | | Consol Energy, Inc. | | | 96,391,000 |
| 2,225,000 | | Devon Energy Corp.(c) | | | 106,243,750 |
| 1,200,000 | | Mariner Energy, Inc.(a)(b) | | | 16,800,000 |
| 950,000 | | Noble Energy, Inc. | | | 64,619,000 |
| 1,650,000 | | Petrobras ADR | | | 72,897,000 |
| 1,650,000 | | Todco, Class A(a) | | | 42,636,000 |
| 1,100,000 | | W&T Offshore, Inc.(a) | | | 22,836,000 |
| | | | |
|
|
| | | | | | 600,703,750 |
| | | | |
|
|
| | | FINANCIAL — 16.84% |
| 1,450,000 | | Ace Ltd. | | | 59,841,500 |
| 2,486,200 | | Amvescap plc ADR | | | 31,525,016 |
| 1,650,000 | | Apollo Investment Corp.(d) | | | 27,687,000 |
| | | | | |
| | | | | |
Shares
| | | | Value
|
| COMMON STOCKS — (continued) | | |
| | | FINANCIAL — (continued) |
| 725,000 | | CIT Group, Inc. | | $ | 27,550,000 |
| 1,625,000 | | Citigroup, Inc. | | | 73,027,500 |
| 1,000,000 | | Freddie Mac | | | 63,200,000 |
| 1,825,000 | | JP Morgan Chase & Co. | | | 63,145,000 |
| 675,000 | | Lehman Brothers Holding, Inc. | | | 63,558,000 |
| 700,000 | | Loews Corp. | | | 51,478,000 |
| 2,400,000 | | MCG Capital Corp. | | | 36,924,000 |
| 1,300,000 | | Metlife, Inc. | | | 50,830,000 |
| 1,500,000 | | MoneyGram International, Inc. | | | 28,335,000 |
| 1,325,000 | | Morgan Stanley | | | 75,856,250 |
| 800,000 | | PNC Financial Services Group, Inc. | | | 41,184,000 |
| 2,100,000 | | Primus Guaranty Ltd.(a) | | | 27,363,000 |
| 650,000 | | Washington Mutual, Inc. | | | 25,675,000 |
| 450,000 | | XL Capital Ltd., Class A | | | 32,566,500 |
| | | | |
|
|
| | | | | | 779,745,766 |
| | | | |
|
|
| | | HEALTH CARE — 3.85% |
| 860,000 | | AmerisourceBergen Corp. | | | 49,269,400 |
| 525,000 | | Baxter International, Inc. | | | 17,839,500 |
| 900,000 | | Bristol-Myers Squibb Co. | | | 22,914,000 |
| 1,175,000 | | HCA, Inc. | | | 62,944,750 |
| 600,000 | | Wyeth | | | 25,308,000 |
| | | | |
|
|
| | | | | | 178,275,650 |
| | | | |
|
|
| | | INDUSTRIALS — 12.89% |
| 1,850,000 | | AGCO Corp.(a) | | | 33,762,500 |
| 700,000 | | Arlington Tankers | | | 16,450,000 |
| 2,875,000 | | Cendant Corp. | | | 59,052,500 |
| 1,350,000 | | Deluxe Corp. | | | 53,811,000 |
| 120,200 | | Dolby Laboratories, Inc., Class A(a) | | | 2,824,700 |
| 1,775,000 | | Empresa Brasileira de Aeronautica S.A. ADR | | | 55,557,500 |
| 1,150,000 | | Gol Linhas Aereas Inteligentes S.A. ADR(a) | | | 28,899,500 |
| 1,425,000 | | Overnite Corp. | | | 45,585,750 |
| 1,100,000 | | Ryder Systems, Inc. | | | 45,870,000 |
| 1,650,000 | | Tyco International Ltd. | | | 55,770,000 |
| 1,100,000 | | Union Pacific Corp. | | | 76,670,000 |
| 3,300,000 | | United Rentals, Inc.(a) | | | 66,693,000 |
| 550,000 | | United Technologies Corp. | | | 55,913,000 |
| | | | |
|
|
| | | | | | 596,859,450 |
| | | | |
|
|
See Notes to Financial Statements.
23
Excelsior Funds, Inc.
Portfolio of Investments — March 31, 2005
Value and Restructuring Fund — (continued)
| | | | | |
| | | | | |
Shares
| | | | Value
|
| COMMON STOCKS — (continued) | | |
| | | INFORMATION TECHNOLOGY — 5.61% |
| 1,970 | | Computer Associates International, Inc. | | $ | 53,387 |
| 3,400,000 | | Harris Corp. | | | 111,010,000 |
| 2,575,000 | | Nokia Oyj ADR | | | 39,732,250 |
| 1,300,000 | | Plantronics, Inc. | | | 49,504,000 |
| 1,200,000 | | Texas Instruments, Inc.(c) | | | 30,588,000 |
| 2,325,000 | | Vishay Intertechnology, Inc.(a) | | | 28,899,750 |
| | | | |
|
|
| | | | | | 259,787,387 |
| | | | |
|
|
| | | RAW/INTERMEDIATE MATERIALS — 7.00% |
| 550,000 | | Cambrex Corp. | | | 11,715,000 |
| 2,450,000 | | Celanese Corp., Class A(a) | | | 44,075,500 |
| 400,000 | | Eagle Materials, Inc., Class B | | | 31,520,000 |
| 1,300,000 | | Foundation Coal Holdings, Inc. | | | 30,563,000 |
| 1,775,000 | | Georgia-Pacific Corp. | | | 62,994,750 |
| 1,200,000 | | Lafarge Corp. | | | 70,140,000 |
| 1,025,000 | | PPG Industries, Inc. | | | 73,308,000 |
| | | | |
|
|
| | | | | | 324,316,250 |
| | | | |
|
|
| | | REAL ESTATE — 4.19% |
| 1,150,000 | | Capital Lease Funding, Inc. | | | 12,707,500 |
| 1,920,000 | | Diamondrock Hospitality Co.(a)(b) | | | 20,448,000 |
| 1,875,000 | | Fieldstone Investment Corp.(b) | | | 27,225,000 |
| 2,275,000 | | Friedman Billings Ramsey Group, Inc., Class A | | | 36,104,250 |
| 1,450,000 | | Host Marriott Corp. | | | 24,012,000 |
| 1,300,000 | | Luminent Mortgage Capital, Inc. | | | 14,274,000 |
| 1,000,000 | | Peoples Choice Financial Corp.(a)(b) | | | 10,000,000 |
| 135,000 | | PHH Corp.(a) | | | 2,952,450 |
| 1,600,000 | | Provident Senior Living Trust(b) | | | 25,840,000 |
| 1,200,000 | | Saxon Capital, Inc. | | | 20,640,000 |
| | | | |
|
|
| | | | | | 194,203,200 |
| | | | |
|
|
| | | TELECOMMUNICATION — 4.33% |
| 1,625,000 | | America Movil S.A. de C.V., Series L ADR | | | 83,850,000 |
| 1,325,000 | | EchoStar Communications, Inc., Class A | | | 38,756,250 |
| 788,300 | | Iowa Telecommunications Services, Inc. | | | 15,371,850 |
| | | | | |
| | | | | |
Shares
| | | | Value
|
| COMMON STOCKS — (continued) | | |
| | | TELECOMMUNICATION — (continued) |
| 1,900,000 | | Nextel Communications, Inc., Class A(a) | | $ | 53,998,000 |
| 575,400 | | Valor Communications, Inc. | | | 8,326,038 |
| | | | |
|
|
| | | | | | 200,302,138 |
| | | | |
|
|
| | | UTILITIES — 2.23% |
| 8,000,000 | | Calpine Corp.(a) | | | 22,400,000 |
| 1,350,000 | | Centerpoint Energy, Inc. | | | 16,240,500 |
| 1,050,000 | | Duke Energy Corp. | | | 29,410,500 |
| 649,275 | | Public Service Enterprise Group, Inc. | | | 35,314,067 |
| | | | |
|
|
| | | | | | 103,365,067 |
| | | | |
|
|
| | | TOTAL COMMON STOCKS
(Cost $3,195,937,037) | | | 4,401,565,791 |
| | | | |
|
|
| FOREIGN COMMON STOCKS — 1.39% | | |
| | | ITALY — 0.94% |
| 4,570,000 | | Enel S.p.A | | | 43,724,120 |
| | | | |
|
|
| | | UNITED KINGDOM — 0.45% |
| 1,200,000 | | Severn Trent plc | | | 20,744,379 |
| | | | |
|
|
| | | TOTAL FOREIGN
COMMON STOCKS
(Cost $45,124,797) | | | 64,468,499 |
| | | | |
|
|
| CONVERTIBLE PREFERRED STOCKS — 2.43% |
| | | CONSUMER DISCRETIONARY — 1.03% |
| 931,400 | | Adelphia Communications, Preferred Exchange, 7.50%, In Default | | | 186,280 |
| 1,050,000 | | Ford Motor Co. Capital Trust II, Preferred Exchange, 6.50% | | | 47,607,000 |
| | | | |
|
|
| | | | | | 47,793,280 |
| | | | |
|
|
| | | FINANCIAL — 0.21% |
| 300,000 | | Genworth Financial, Inc., Preferred Exchange, 6.00% | | | 9,630,000 |
| | | | |
|
|
| | | HEALTH CARE — 1.10% |
| 942,400 | | Baxter International, Inc., Preferred Exchange, 7.00% | | | 50,748,240 |
| | | | |
|
|
| | | RAW/INTERMEDIATE MATERIALS — 0.09% |
| 150,000 | | Celanese Corp., Preferred Exchange, 4.25% | | | 4,162,500 |
| | | | |
|
|
| | | TOTAL CONVERTIBLE PREFERRED STOCKS
(Cost $120,528,219) | | | 112,334,020 |
| | | | |
|
|
See Notes to Financial Statements.
24
Excelsior Funds, Inc.
Portfolio of Investments — March 31, 2005
Value and Restructuring Fund — (continued)
| | | | | |
| | | | | |
Principal
Amount
| | | | Value
|
| REPURCHASE AGREEMENT — 1.06% | | |
| $49,122,000 | | JP Morgan Chase Securities, Inc., 2.30%, dated 3/31/05, to be repurchased 4/01/05, repurchase price $49,125,138 (collateralized by Federal National Mortgage Association MTN, par value $49,061,000, 4.63%, maturing 10/15/14; total market value $50,168,130) | | $ | 49,122,000 |
| | | | |
|
|
| | | TOTAL REPURCHASE AGREEMENT
(Cost $49,122,000) | | | 49,122,000 |
| | | | |
|
|
| | | | | | |
| | | | | | |
TOTAL INVESTMENTS
(Cost $3,410,712,053)(e) | | 99.94 | % | | $ | 4,627,490,310 |
OTHER ASSETS IN EXCESS OF LIABILITIES | | 0.06 | | | | 2,601,616 |
| | |
|
| |
|
|
NET ASSETS | | 100.00 | % | | $ | 4,630,091,926 |
| | |
|
| |
|
|
| (a) | Non-income producing security. |
| (b) | Security, or part of security, exempt from registration under Rule 144A of the Securities Act of 1933. This security may be resold in transactions exempt from registration, normally to qualified institutional buyers. At March 31, 2005, these securities amounted to $107,471,000 or 2.32% of net assets. |
| (c) | All or part of the security is held as collateral. |
| (d) | Registered Investment Company |
| (e) | Unrealized appreciation (depreciation) of securities: |
| | | | |
Unrealized Appreciation
| | Unrealized
(Depreciation)
| | Net Unrealized
Appreciation/
(Depreciation)
|
| $1,399,947,607 | | $(183,169,350) | | $1,216,778,257 |
ADR—American Depository Receipt
In Default—Security in default on income payments.
MTN—Medium Term Note
plc—public limited company
| | | | |
Contracts
| | | | Value
|
| CALL OPTIONS WRITTEN: (0.04)% |
| (12,000) | | Texas Instruments, Expires 7/19/05, strike price 30 | | $ (360,000) |
| (3,828) | | Devon Energy, Expires 7/19/05, strike price 50 | | (918,720) |
| (672) | | Devon Energy, Expires 7/19/05, strike price 55 | | (67,200) |
| (3,500) | | Burlington Resources, Expires 8/23/05, strike price 55 | | (647,500) |
| | | | |
|
| | | TOTAL CALL OPTIONS WRITTEN
(Premiums received $2,633,972) | | $ (1,993,420) |
| | | | |
|
See Notes to Financial Statements.
25
Excelsior Funds, Inc.
Portfolio of Investments — March 31, 2005
Value and Restructuring Fund — (continued)
The summary of the Fund’s investments as of March 31, 2005 is as follows: (Unaudited)
| | | | | | | |
Sector Diversification
| | % of
Net
Assets
| | | Market Value
| |
Consumer Discretionary | | 21.86 | % | | $ | 1,011,582,163 | |
Financial | | 17.05 | | | | 789,375,766 | |
Energy | | 12.97 | | | | 600,703,750 | |
Industrials | | 12.89 | | | | 596,859,450 | |
Raw/Intermediate Materials | | 7.09 | | | | 328,478,750 | |
Information Technology | | 5.61 | | | | 259,787,387 | |
Health Care | | 4.95 | | | | 229,023,890 | |
Telecommunication | | 4.33 | | | | 200,302,138 | |
Consumer Staples | | 4.32 | | | | 200,218,250 | |
Real Estate | | 4.19 | | | | 194,203,200 | |
Utilities | | 3.62 | | | | 167,833,566 | |
Repurchase Agreements | | 1.06 | | | | 49,122,000 | |
| | |
|
| |
|
|
|
Total Investment | | 99.94 | % | | $ | 4,627,490,310 | |
Call Options Written | | (0.04 | ) | | | (1,993,420 | ) |
Other Assets and Liabilities (Net) | | 0.10 | | | | 4,595,036 | |
| | |
|
| |
|
|
|
Net Assets | | 100.00 | % | | $ | 4,630,091,926 | |
| | |
|
| |
|
|
|
See Notes to Financial Statements.
26
Excelsior Funds Trust
Portfolio of Investments — March 31, 2005
Mid Cap Value Fund
| | | | | |
| | | | | |
Shares
| | | | Value
|
| COMMON STOCKS — 97.99% | | |
| | | CONSUMER DISCRETIONARY — 28.51% |
| 85,900 | | Autozone, Inc.(a) | | $ | 7,361,630 |
| 90,400 | | Best Buy Co., Inc. | | | 4,882,504 |
| 126,600 | | Black & Decker Corp. | | | 10,000,133 |
| 562,200 | | Blockbuster, Inc., Class A | | | 4,964,226 |
| 217,000 | | Brink’s Co. | | | 7,508,200 |
| 452,000 | | Callaway Golf Co. | | | 5,785,600 |
| 85,000 | | Centex Corp. | | | 4,867,950 |
| 375,000 | | Interpublic Group of Companies, Inc.(a) | | | 4,605,000 |
| 270,000 | | Limited Brands | | | 6,561,000 |
| 264,300 | | Newell Rubbermaid, Inc. | | | 5,798,742 |
| 149,200 | | Officemax, Inc. | | | 4,998,200 |
| 135,600 | | Sherwin-Williams Co. | | | 5,965,044 |
| 203,400 | | TJX Cos., Inc. | | | 5,009,742 |
| 208,000 | | Zale Corp.(a) | | | 6,181,760 |
| | | | |
|
|
| | | | | | 84,489,731 |
| | | | |
|
|
| | | CONSUMER STAPLES — 2.37% | | | |
| 205,000 | | Dean Foods Co.(a) | | | 7,031,500 |
| | | | |
|
|
| | | ENERGY — 9.23% | | | |
| 217,000 | | Devon Energy Corp. | | | 10,361,750 |
| 153,700 | | Noble Corp. | | | 8,639,477 |
| 117,600 | | Occidental Petroleum Corp. | | | 8,369,592 |
| | | | |
|
|
| | | | | | 27,370,819 |
| | | | |
|
|
| | | FINANCIAL — 13.02% | | | |
| 167,300 | | Ace Ltd. | | | 6,904,471 |
| 189,900 | | CIT Group, Inc. | | | 7,216,200 |
| 904,000 | | Instinet Group, Inc.(a) | | | 5,315,520 |
| 72,400 | | Lehman Brothers Holding, Inc. | | | 6,817,184 |
| 122,100 | | RenaissanceRe Holdings Ltd. | | | 5,702,070 |
| 298,400 | | Sovereign Bancorp, Inc. | | | 6,612,544 |
| | | | |
|
|
| | | | | | 38,567,989 |
| | | | |
|
|
| | | HEALTH CARE — 5.09% | | | |
| 316,400 | | Health Management Associates, Inc., Class A | | | 8,283,352 |
| 198,900 | | Shire Pharmaceuticals plc ADR | | | 6,818,292 |
| | | | |
|
|
| | | | | | 15,101,644 |
| | | | |
|
|
| | | INDUSTRIALS — 13.00% | | | |
| 227,000 | | Empresa Brasileira de Aeronautica S.A. ADR | | | 7,105,100 |
| 153,700 | | Lincoln Electric Holdings, Inc. | | | 4,623,296 |
| | | | | |
| | | | | |
Shares
| | | | Value
|
| COMMON STOCKS — (continued) | | |
| | | INDUSTRIALS — (continued) | | | |
| 194,400 | | Mueller Industries, Inc. | | $ | 5,472,360 |
| 379,700 | | Onex Corp. | | | 6,199,742 |
| 406,800 | | United Rentals, Inc.(a) | | | 8,221,428 |
| 176,300 | | York International Corp. | | | 6,907,434 |
| | | | |
|
|
| | | | | | 38,529,360 |
| | | | |
|
|
| | | INFORMATION TECHNOLOGY — 11.39% |
| 280,000 | | Avaya, Inc.(a) | | | 3,270,400 |
| 200,000 | | Cabot Microelectronics Corp.(a) | | | 6,276,000 |
| 245,000 | | Electronic Data Systems Corp. | | | 5,064,150 |
| 280,400 | | Harris Corp. | | | 9,155,060 |
| 365,000 | | Symbol Technologies, Inc. | | | 5,288,850 |
| 379,700 | | Vishay Intertechnology, Inc.(a) | | | 4,719,671 |
| | | | |
|
|
| | | | | | 33,774,131 |
| | | | |
|
|
| | | RAW/INTERMEDIATE MATERIALS — 5.04% |
| 228,800 | | Aracruz Cellulose S.A. ADR | | | 8,191,040 |
| 189,900 | | Georgia-Pacific Corp. | | | 6,739,551 |
| | | | |
|
|
| | | | | | 14,930,591 |
| | | | |
|
|
| | | REAL ESTATE — 4.62% |
| 325,500 | | Friedman Billings Ramsey Group, Inc., Class A | | | 5,165,685 |
| 126,600 | | St. Joe Co. | | | 8,520,180 |
| | | | |
|
|
| | | | | | 13,685,865 |
| | | | |
|
|
| | | UTILITIES — 5.72% |
| 1,988,800 | | Calpine Corp.(a) | | | 5,568,640 |
| 200,000 | | Centerpoint Energy, Inc. | | | 2,406,000 |
| 406,800 | | EL Paso Corp. | | | 4,303,944 |
| 248,600 | | Williams Cos., Inc. | | | 4,676,166 |
| | | | |
|
|
| | | | | | 16,954,750 |
| | | | |
|
|
| | | TOTAL COMMON STOCKS
(Cost $218,138,324) | | | 290,436,380 |
| | | | |
|
|
| FOREIGN COMMON STOCKS — 1.69% | | |
| | | NETHERLANDS — 1.69% |
| 99,500 | | Hunter Douglas NV | | | 5,015,311 |
| | | | |
|
|
| | | TOTAL FOREIGN COMMON STOCKS
(Cost $3,662,399) | | | 5,015,311 |
| | | | |
|
|
See Notes to Financial Statements.
27
Excelsior Funds Trust
Portfolio of Investments — March 31, 2005
Mid Cap Value Fund — (continued)
| | | | | |
| | | | | |
Principal
Amount
| | | | Value
|
| REPURCHASE AGREEMENT — (0.19%) | | |
| $573,000 | | JP Morgan Chase Securities, Inc., 2.30%, dated 3/31/05, to be repurchased 4/01/05, repurchase price $573,037 (collateralized by Federal National Mortgage Association MTN, par value $572,000, 4.63%, maturing 10/15/14; total market value $585,200) | | $ | 573,000 |
| | | | |
|
|
| | | TOTAL REPURCHASE AGREEMENT
(Cost $573,000) | | | 573,000 |
| | | | |
|
|
| | | | | | |
| | | | | | |
| | | | | |
Value
|
TOTAL INVESTMENTS
(Cost $222,373,723)(b) | | 99.87 | % | | $ | 296,024,691 |
OTHER ASSETS IN EXCESS
OF LIABILITIES | | 0.13 | | | | 390,997 |
| | |
|
| |
|
|
NET ASSETS | | 100.00 | % | | $ | 296,415,688 |
| | |
|
| |
|
|
| (a) | Non-income producing security. |
| (b) | Unrealized appreciation (depreciation) of securities: |
| | | | |
Unrealized Appreciation
| | Unrealized
(Depreciation)
| | Net Unrealized
Appreciation/
(Depreciation)
|
| $82,748,653 | | $(9,097,685) | | $73,650,968 |
ADR—American Depository Receipt
MTN—Medium Term Note
plc—public limited company
The summary of the Fund’s investments as of March 31, 2005 is as follows: (Unaudited)
| | | | | | |
Sector Diversification
| | % of
Net
Assets
| | | Market Value
|
Consumer Discretionary | | 30.20 | % | | $ | 89,505,042 |
Financial | | 13.02 | | | | 38,567,989 |
Industrials | | 13.00 | | | | 38,529,360 |
Information Technology | | 11.39 | | | | 33,774,131 |
Energy | | 9.23 | | | | 27,370,819 |
Utilities | | 5.72 | | | | 16,954,750 |
Health Care | | 5.09 | | | | 15,101,644 |
Raw/Intermediate Materials | | 5.04 | | | | 14,930,591 |
Real Estate | | 4.62 | | | | 13,685,865 |
Consumer Staples | | 2.37 | | | | 7,031,500 |
Repurchase Agreements | | 0.19 | | | | 573,000 |
| | |
|
| |
|
|
Total Investment | | 99.87 | % | | $ | 296,024,691 |
Other Assets and Liabilities (Net) | | 0.13 | | | | 390,997 |
| | |
|
| |
|
|
Net Assets | | 100.00 | % | | $ | 296,415,688 |
| | |
|
| |
|
|
See Notes to Financial Statements.
28
Excelsior Funds, Inc.
Portfolio of Investments — March 31, 2005
Energy & Natural Resources Fund
| | | | | |
| | | | | |
Shares
| | | | Value
|
| COMMON STOCKS — 95.96% | | |
| | | ENERGY — 76.50% | | | |
| 98,000 | | Alpha Natural Resources, Inc.(a) | | $ | 2,809,660 |
| 100,000 | | American Power Conversion Corp. | | | 2,611,000 |
| 98,000 | | Apache Corp. | | | 6,000,540 |
| 71,600 | | Bill Barrett Corp. | | | 2,072,104 |
| 147,800 | | BJ Services Co. | | | 7,667,864 |
| 82,740 | | BP plc ADR | | | 5,162,976 |
| 132,500 | | Burlington Resources, Inc. | | | 6,634,275 |
| 289,500 | | Chesapeake Energy Corp. | | | 6,351,630 |
| 151,900 | | Cimarex Energy Co.(a) | | | 5,924,100 |
| 126,388 | | Devon Energy Corp. | | | 6,035,027 |
| 118,000 | | Diamond Offshore Drilling | | | 5,888,200 |
| 588,000 | | Endeavor International Corp.(a) | | | 2,052,120 |
| 147,000 | | ENSCO International, Inc. | | | 5,536,020 |
| 108,000 | | Exxon Mobil Corp. | | | 6,436,800 |
| 100,000 | | GlobalSantaFe Corp. | | | 3,704,000 |
| 150,000 | | Grant Prideco, Inc. | | | 3,621,000 |
| 173,000 | | Halliburton Co. | | | 7,482,250 |
| 98,000 | | Hornbeck Offshore Services, Inc.(a) | | | 2,455,880 |
| 98,000 | | Infinity, Inc.(a) | | | 980,000 |
| 145,000 | | Input/Output, Inc.(a) | | | 935,250 |
| 69,600 | | Kerr-McGee Corp. | | | 5,451,768 |
| 294,000 | | McMoRan Exploration Co.(a) | | | 5,909,400 |
| 58,800 | | Murphy Oil Corp. | | | 5,805,324 |
| 134,300 | | Nabors Industries Ltd.(a) | | | 7,942,502 |
| 49,000 | | National-Oilwell, Inc.(a) | | | 2,288,300 |
| 83,300 | | Newfield Exploration Co.(a) | | | 6,185,858 |
| 107,800 | | Noble Corp. | | | 6,059,438 |
| 39,400 | | Occidental Petroleum Corp. | | | 2,804,098 |
| 73,500 | | Oceaneering International, Inc.(a) | | | 2,756,250 |
| 122,500 | | Patterson-UTI Energy, Inc. | | | 3,064,950 |
| 148,000 | | Peabody Energy Corp. | | | 6,861,280 |
| 390,000 | | Petroquest Energy, Inc.(a) | | | 2,589,600 |
| 201,400 | | Plains Exploration & Production Co.(a) | | | 7,028,860 |
| 68,900 | | Premcor, Inc. | | | 4,111,952 |
| 98,000 | | Range Resources Corp. | | | 2,289,280 |
| 73,500 | | Schlumberger Ltd. | | | 5,180,280 |
| 78,400 | | Smith International, Inc. | | | 4,918,032 |
| 79,400 | | Southwestern Energy Co.(a) | | | 4,506,744 |
| 107,800 | | Suncor Energy, Inc. | | | 4,334,638 |
| 245,800 | | TETRA Technologies, Inc.(a) | | | 6,990,552 |
| | | | | |
| | | | | |
Shares
| | | | Value
|
| COMMON STOCKS — (continued) | | |
| | | ENERGY — (continued) | | | |
| 174,000 | | Tidewater, Inc. | | $ | 6,761,640 |
| 127,400 | | Transocean Sedco Forex, Inc.(a) | | | 6,556,004 |
| 99,200 | | Ultra Petroleum Corp.(a) | | | 5,039,360 |
| 73,500 | | Valero Energy | | | 5,385,345 |
| 344,500 | | Willbros Group, Inc.(a) | | | 6,958,900 |
| 166,667 | | XTO Energy, Inc. | | | 5,473,332 |
| | | | |
|
|
| | | | | | 223,614,383 |
| | | | |
|
|
| | | INDUSTRIALS — 1.23% | | | |
| 55,200 | | Arlington Tankers | | | 1,297,200 |
| 125,000 | | Excel Maritime Carriers(a) | | | 2,306,250 |
| | | | |
|
|
| | | | | | 3,603,450 |
| | | | |
|
|
| | | RAW/INTERMEDIATE MATERIALS — 11.42% |
| 122,500 | | Aracruz Cellulose S.A. ADR | | | 4,385,500 |
| 90,000 | | Ashland, Inc. | | | 6,072,300 |
| 400 | | Cemex S.A. de C.V. ADR | | | 14,500 |
| 117,700 | | Dow Chemical Co. | | | 5,867,345 |
| 142,100 | | Freeport-McMoRan Copper & Gold, Inc., Class B | | | 5,628,581 |
| 210,500 | | Lyondell Chemical Co. | | | 5,877,160 |
| 54,400 | | Phelps Dodge Corp. | | | 5,534,112 |
| | | | |
|
|
| | | | | | 33,379,498 |
| | | | |
|
|
| | | REAL ESTATE — 1.34% |
| 58,200 | | St. Joe Co. | | | 3,916,860 |
| | | | |
|
|
| | | UTILITIES — 5.47% |
| 75,000 | | Allete, Inc. | | | 3,138,750 |
| 492,000 | | EL Paso Corp. | | | 5,205,360 |
| 407,000 | | Williams Cos., Inc. | | | 7,655,670 |
| | | | |
|
|
| | | | | | 15,999,780 |
| | | | |
|
|
| | | TOTAL COMMON STOCKS
(Cost $221,251,455) | | | 280,513,971 |
| | | | |
|
|
See Notes to Financial Statements.
29
Excelsior Funds, Inc.
Portfolio of Investments — March 31, 2005
Energy & Natural Resources Fund — (continued)
| | | | | |
| | | | | |
Principal
Amount
| | | | Value
|
| REPURCHASE AGREEMENT — 9.16% | | |
| $26,785,000 | | JP Morgan Chase Securities, Inc., 2.30%, dated 3/31/05, to be repurchased 4/01/05, repurchase price $26,786,711 (collateralized by Federal National Mortgage Association MTN, par value $26,752,000, 4.63%, maturing 10/15/14; total market value $27,355,429) | | $ | 26,785,000 |
| | | | |
|
|
| | | TOTAL REPURCHASE
AGREEMENT
(Cost $26,785,000) | | | 26,785,000 |
| | | | |
|
|
| | | | | | | |
| | | | | | | |
| | | | | |
Value
| |
TOTAL INVESTMENTS
(Cost $248,036,455)(b) | | 105.12 | % | | $ | 307,298,971 | |
LIABILITIES IN EXCESS OF
OTHER ASSETS | | (5.12 | ) | | | (14,966,266 | ) |
| | |
|
| |
|
|
|
NET ASSETS | | 100.00 | % | | $ | 292,332,705 | |
| | |
|
| |
|
|
|
| (a) | Non-income producing security. |
| (b) | Unrealized appreciation (depreciation) of securities: |
| | | | |
Unrealized
Appreciation
| | Unrealized
(Depreciation)
| | Net Unrealized
Appreciation/
(Depreciation)
|
| $62,301,816 | | $(3,039,300) | | $59,262,516 |
ADR—American Depository Receipt
Ltd.—Limited
MTN—Medium Term Note
plc—public limited company
The summary of the Fund’s investments as of March 31, 2005 is as follows: (Unaudited)
| | | | | | | |
Sector Diversification
| | % of
Net
Assets
| | | Market Value
| |
Energy | | 76.50 | % | | $ | 223,614,383 | |
Raw/Intermediate Materials | | 11.42 | | | | 33,379,498 | |
Repurchase Agreements | | 9.16 | | | | 26,785,000 | |
Utilities | | 5.47 | | | | 15,999,780 | |
Real Estate | | 1.34 | | | | 3,916,860 | |
Industrials | | 1.23 | | | | 3,603,450 | |
| | |
|
| |
|
|
|
Total Investment | | 105.12 | % | | $ | 307,298,971 | |
Other Assets and Liabilities (Net) | | (5.12 | ) | | | (14,966,266 | ) |
| | |
|
| |
|
|
|
Net Assets | | 100.00 | % | | $ | 292,332,705 | |
| | |
|
| |
|
|
|
See Notes to Financial Statements.
30
Excelsior Funds, Inc.
Portfolio of Investments — March 31, 2005
Real Estate Fund
| | | | | |
| | | | | |
Shares
| | | | Value
|
| COMMON STOCKS — 97.76% | | |
| | | CONSUMER DISCRETIONARY — 3.19% |
| 59,900 | | Starwood Hotels & Resorts Worldwide, Inc. | | $ | 3,595,797 |
| | | | |
|
|
| | | REAL ESTATE — 92.72% |
| 78,400 | | AMB Property Corp. | | | 2,963,520 |
| 127,500 | | Amerivest Properties, Inc. | | | 660,450 |
| 64,500 | | Apartment Investment & Management Co., Class A | | | 2,399,400 |
| 46,784 | | AvalonBay Communities, Inc. | | | 3,129,382 |
| 69,600 | | Boston Properties, Inc. | | | 4,192,008 |
| 68,800 | | Camden Property Trust | | | 3,235,664 |
| 93,076 | | Catellus Development Corp. | | | 2,480,475 |
| 175,100 | | Cedar Shopping Centers, Inc. | | | 2,493,424 |
| 27,700 | | Centerpoint Properties Trust | | | 1,135,700 |
| 101,800 | | Cousins Properties, Inc. | | | 2,633,566 |
| 110,600 | | Duke Realty Corp. | | | 3,301,410 |
| 156,320 | | Equity Office Properties Trust | | | 4,709,922 |
| 116,820 | | Equity Residential | | | 3,762,772 |
| 66,400 | | Federal Realty Investment Trust | | | 3,210,440 |
| 44,300 | | Forest City Enterprises, Inc., Class A | | | 2,826,340 |
| 116,600 | | General Growth Properties, Inc. | | | 3,976,060 |
| 83,000 | | GMH Communities Trust | | | 971,930 |
| 92,200 | | Healthcare Realty Trust, Inc. | | | 3,359,768 |
| 80,700 | | Heritage Property Investment Trust | | | 2,395,176 |
| 55,300 | | Home Properties of New York, Inc. | | | 2,145,640 |
| 123,300 | | Host Marriott Corp. | | | 2,041,848 |
| 62,200 | | Kimco Realty Corp. | | | 3,352,580 |
| 83,000 | | Liberty Property Trust | | | 3,241,150 |
| 50,700 | | Macerich Co. | | | 2,701,296 |
| 50,700 | | Pan Pacific Retail Properties, Inc. | | | 2,877,225 |
| 69,200 | | Parkway Properties, Inc. | | | 3,231,640 |
| 69,200 | | Post Properties, Inc. | | | 2,147,968 |
| 96,800 | | Prentiss Properties Trust | | | 3,306,688 |
| 87,600 | | Prologis | | | 3,249,960 |
| 65,600 | | Public Storage, Inc. | | | 3,735,264 |
| 96,800 | | Simon Property Group, Inc. | | | 5,864,144 |
| 27,300 | | St. Joe Co. | | | 1,837,290 |
| 4,186 | | Trizec Canada, Inc. | | | 70,388 |
| 129,513 | �� | Trizec Properties, Inc. | | | 2,460,747 |
| | | | | |
| | | | | |
Shares
| | | | Value
|
| COMMON STOCKS — (continued) | | |
| | | REAL ESTATE — (continued) |
| 55,300 | | U-Store-It Trust | | $ | 962,220 |
| 64,500 | | Vornado Realty Trust | | | 4,467,915 |
| 91,175 | | Weingarten Realty Investors | | | 3,146,449 |
| | | | |
|
|
| | | | | | 104,677,819 |
| | | | |
|
|
| | | TRANSPORTATION — 1.85% |
| 50,700 | | Alexander & Baldwin, Inc. | | | 2,088,840 |
| | | | |
|
|
| | | TOTAL COMMON STOCKS
(Cost $83,139,558) | | | 110,362,456 |
| | | | |
|
|
| | |
Principal
Amount
| | | | |
| REPURCHASE AGREEMENT — 2.07% | | | |
| $2,333,000 | | JP Morgan Chase Securities, Inc., 2.30%, dated 3/31/05, to be repurchased 4/01/05, repurchase price $2,333,149 (collateralized by Federal National Mortgage Association MTN, par value $2,330,000, 4.63%, maturing 10/15/14; total market value $2,382,696) | | | 2,333,000 |
| | | | |
|
|
| | | TOTAL REPURCHASE AGREEMENT
(Cost $2,333,000) | | | 2,333,000 |
| | | | |
|
|
| | | | | | |
TOTAL INVESTMENTS
(Cost $85,472,558)(a) | | 99.83 | % | | $ | 112,695,456 |
OTHER ASSETS IN EXCESS OF LIABILITIES | | 0.17 | | | | 193,912 |
| | |
|
| |
|
|
NET ASSETS | | 100.00 | % | | $ | 112,889,368 |
| | |
|
| |
|
|
| (a) | Unrealized appreciation (depreciation) of securities: |
| | | | |
Unrealized
Appreciation
| | Unrealized
(Depreciation)
| | Net Unrealized
Appreciation/
(Depreciation)
|
| $28,168,119 | | $(945,221) | | $27,222,898 |
MTN—Medium Term Note
See Notes to Financial Statements.
31
Excelsior Funds, Inc.
Portfolio of Investments — March 31, 2005
Real Estate Fund — (continued)
The summary of the Fund’s investments as of March 31, 2005 is as follows: (Unaudited)
| | | | | | |
Sector Diversification
| | % of
Net
Assets
| | | Market Value
|
Real Estate | | 92.72 | % | | $ | 104,677,819 |
Consumer Discretionary | | 3.19 | | | | 3,595,797 |
Repurchase Agreements | | 2.07 | | | | 2,333,000 |
Transportation | | 1.85 | | | | 2,088,840 |
| | |
|
| |
|
|
Total Investment | | 99.83 | % | | $ | 112,695,456 |
Other Assets and Liabilities (Net) | | 0.17 | | | | 193,912 |
| | |
|
| |
|
|
Net Assets | | 100.00 | % | | $ | 112,889,368 |
| | |
|
| |
|
|
See Notes to Financial Statements.
32
Excelsior Funds, Inc.
Portfolio of Investments — March 31, 2005
Equity Income Fund
| | | | | |
| | | | | |
Shares
| | | | Value
|
| COMMON STOCKS — 87.20% | | |
| | | CONSUMER DISCRETIONARY — 12.86% |
| 208,300 | | Circuit City Stores, Inc. | | $ | 3,343,215 |
| 165,200 | | Leggett & Platt, Inc. | | | 4,770,976 |
| 198,000 | | Newell Rubbermaid, Inc. | | | 4,344,120 |
| 131,000 | | Officemax, Inc. | | | 4,388,500 |
| 135,000 | | Snap-On, Inc. | | | 4,291,650 |
| 229,400 | | Time Warner, Inc.(a) | | | 4,025,970 |
| | | | |
|
|
| | | | | | 25,164,431 |
| | | | |
|
|
| | | CONSUMER STAPLES — 9.23% |
| 220,100 | | Albertson’s, Inc. | | | 4,545,065 |
| 68,700 | | Altria Group, Inc. | | | 4,492,293 |
| 218,000 | | American Italian Pasta Co. | | | 5,973,200 |
| 137,400 | | Sara Lee Corp. | | | 3,044,784 |
| | | | |
|
|
| | | | | | 18,055,342 |
| | | | |
|
|
| | | ENERGY — 5.50% |
| 85,300 | | BP plc ADR | | | 5,322,720 |
| 93,300 | | ChevronTexaco Corp. | | | 5,440,323 |
| | | | |
|
|
| | | | | | 10,763,043 |
| | | | |
|
|
| | | FINANCIAL — 14.26% |
| 86,616 | | Bank of America Corp. | | | 3,819,766 |
| 88,250 | | Citigroup, Inc. | | | 3,965,955 |
| 65,000 | | Comerica, Inc. | | | 3,580,200 |
| 82,100 | | Montpelier RE Holdings, Ltd. | | | 2,885,815 |
| 64,960 | | Morgan Stanley | | | 3,718,960 |
| 144,000 | | U.S. BanCorp. | | | 4,150,080 |
| 343,000 | | Van der Moolen Holding NV ADR(a) | | | 2,449,020 |
| 147,500 | | W. P. Stewart & Co., Ltd. | | | 3,342,350 |
| | | | |
|
|
| | | | | | 27,912,146 |
| | | | |
|
|
| | | HEALTH CARE — 6.66% |
| 54,800 | | Eli Lilly & Co. | | | 2,855,080 |
| 84,300 | | Medtronic, Inc. | | | 4,295,085 |
| 81,400 | | Merck & Co., Inc. | | | 2,634,918 |
| 45,000 | | Pharmaceutical Holders Trust Index Fund(b) | | | 3,237,300 |
| | | | |
|
|
| | | | | | 13,022,383 |
| | | | |
|
|
| | | INDUSTRIALS — 10.77% |
| 89,845 | | Deluxe Corp. | | | 3,581,222 |
| 135,200 | | General Electric Co. | | | 4,875,311 |
| 113,900 | | Honeywell International, Inc. | | | 4,238,219 |
| 70,475 | | Hubbell, Inc., Class B | | | 3,601,273 |
| | | | | |
| | | | | |
Shares
| | | | Value
|
| COMMON STOCKS — (continued) | | |
| | | INDUSTRIALS — (continued) |
| 151,100 | | RR Donnelley & Sons Co. | | $ | 4,777,782 |
| | | | |
|
|
| | | | | | 21,073,807 |
| | | | |
|
|
| | | INFORMATION TECHNOLOGY — 8.48% |
| 305,000 | | AVX Corp. | | | 3,736,250 |
| 216,500 | | Electronic Data Systems Corp. | | | 4,475,055 |
| 174,000 | | Microsoft Corp. | | | 4,205,580 |
| 270,000 | | Nokia Oyj ADR | | | 4,166,100 |
| | | | |
|
|
| | | | | | 16,582,985 |
| | | | |
|
|
| | | RAW/INTERMEDIATE MATERIALS — 9.22% |
| 82,500 | | Eastman Chemical Co. | | | 4,867,500 |
| 145,000 | | Packaging Corp. of America | | | 3,522,050 |
| 10,000 | | Pope Resources, Ltd. | | | 365,900 |
| 48,000 | | Rayonier, Inc. | | | 2,377,440 |
| 195,500 | | RPM, Inc. | | | 3,573,740 |
| 115,500 | | Sonoco Products Co. | | | 3,332,175 |
| | | | |
|
|
| | | | | | 18,038,805 |
| | | | |
|
|
| | | REAL ESTATE — 0.72% |
| 38,000 | | Apartment Investment & Management Co., Class A | | | 1,413,600 |
| | | | |
|
|
| | | TELECOMMUNICATION — 4.34% |
| 220,300 | | AT&T Corp. | | | 4,130,625 |
| 123,000 | | Verizon Communications, Inc. | | | 4,366,500 |
| | | | |
|
|
| | | | | | 8,497,125 |
| | | | |
|
|
| | | UTILITIES — 5.16% |
| 274,000 | | Centerpoint Energy, Inc. | | | 3,296,220 |
| 178,200 | | Cleco Corp. | | | 3,795,660 |
| 112,750 | | Vectren Corp. | | | 3,003,660 |
| | | | |
|
|
| | | | | | 10,095,540 |
| | | | |
|
|
| | | TOTAL COMMON STOCKS (Cost $156,658,412) | | | 170,619,207 |
| | | | |
|
|
| FOREIGN COMMON STOCKS — 2.63% | | |
| | | NETHERLANDS — 0.37% |
| 100,000 | | Van der Moolen Holding NV(a) | | | 716,925 |
| | | | |
|
|
| | | UNITED KINGDOM — 2.26% |
| 363,400 | | Pearson plc | | | 4,428,358 |
| | | | |
|
|
| | | TOTAL FOREIGN COMMON STOCKS
(Cost $4,876,699) | | | 5,145,283 |
| | | | |
|
|
See Notes to Financial Statements.
33
Excelsior Funds, Inc.
Portfolio of Investments — March 31, 2005
Equity Income Fund — (continued)
| | | | | |
| | | | | |
Shares
| | | | Value
|
| PREFERRED STOCK — 1.17% | | |
| | | ENERGY — 1.17% |
| 45,400 | | EL Paso Tennessee Pipeline Co., Preferred Exchange, 8.25% | | $ | 2,294,121 |
| | | | |
|
|
| | | TOTAL PREFERRED STOCK
(Cost $2,107,870) | | | 2,294,121 |
| | | | |
|
|
| CONVERTIBLE PREFERRED STOCKS — 4.31% |
| | | CONSUMER DISCRETIONARY — 2.48% |
| 56,000 | | Ford Motor Co. Capital Trust II, Preferred Exchange, 6.50% | | | 2,539,040 |
| 124,000 | | General Motors, Series B, Preferred Exchange, 5.25% | | | 2,316,320 |
| | | | |
|
|
| | | | | | 4,855,360 |
| | | | |
|
|
| | | ENERGY — 1.83% |
| 99,000 | | EL Paso Energy Capital Trust I, Preferred Exchange, 4.75% | | | 3,583,800 |
| | | | |
|
|
| | | TOTAL CONVERTIBLE PREFERRED STOCKS
(Cost $8,371,207) | | | 8,439,160 |
| | | | |
|
|
| | |
Contracts
| | | | |
| PUT OPTION PURCHASED — 0.01% |
| 350 | | Centerpoint Energy, Inc. Expires 4/16/05 strike price 12.5 | | | 19,250 |
| | | | |
|
|
| | | TOTAL PUT OPTION PURCHASED
(Cost $36,050) | | | 19,250 |
| | | | |
|
|
| | |
Principal
Amount
| | | | |
| REPURCHASE AGREEMENT — 4.96% |
| $9,709,000 | | JP Morgan Chase Securities, Inc., 2.30%, dated 03/31/05, to be repurchased on 04/01/05, repurchase price $9,709,620 (collateralized by Federal National Mortgage Association MTN, par value $9,697,000, 4.63%, maturing on 10/15/14; total market value $9,915,826) | | | 9,709,000 |
| | | | |
|
|
| | | TOTAL REPURCHASE AGREEMENT
(Cost $9,709,000) | | | 9,709,000 |
| | | | |
|
|
| | | | | | | |
| | | | | | | |
| | | | | | Value
| |
TOTAL INVESTMENTS
(Cost $181,759,238)(c) | | 100.28 | % | | $ | 196,226,021 | |
LIABILITIES IN EXCESS OF
OTHER ASSETS | | (0.28 | ) | | | (556,473 | ) |
| | |
|
| |
|
|
|
NET ASSETS | | 100.00 | % | | $ | 195,669,548 | |
| | |
|
| |
|
|
|
| (a) | Non-income producing security |
| (b) | Registered Investment Company |
| (c) | Unrealized appreciation (depreciation) of securities: |
| | | | |
Unrealized
Appreciation
| | Unrealized
(Depreciation)
| | Net Unrealized
Appreciation/
(Depreciation)
|
| $18,733,669 | | $(4,266,886) | | $14,466,783 |
ADR—American Depository Receipt
Ltd.—Limited
MTN—Medium Term Note
plc—Public limited company
See Notes to Financial Statements.
34
Excelsior Funds, Inc.
Portfolio of Investments — March 31, 2005
Equity Income Fund — (continued)
The summary of the Fund’s investments as of March 31, 2005 is as follows: (Unaudited)
| | | | | | | |
Sector Diversification
| | % of
Net
Assets
| | | Market Value
| |
Consumer Discretionary | | 15.34 | % | | $ | 30,019,791 | |
Financial | | 14.63 | | | | 28,629,071 | |
Industrials | | 10.77 | | | | 21,073,807 | |
Information Technology | | 10.74 | | | | 21,011,343 | |
Consumer Staples | | 9.23 | | | | 18,055,342 | |
Raw/Intermediate Materials | | 9.22 | | | | 18,038,805 | |
Energy | | 8.51 | | | | 16,640,964 | |
Health Care | | 6.66 | | | | 13,022,383 | |
Utilities | | 5.16 | | | | 10,114,790 | |
Repurchase Agreements | | 4.96 | | | | 9,709,000 | |
Telecommunication | | 4.34 | | | | 8,497,125 | |
Real Estate | | 0.72 | | | | 1,413,600 | |
| | |
|
| |
|
|
|
Total Investment | | 100.28 | % | | $ | 196,226,021 | |
Other Assets and Liabilities (Net) | | (0.28 | ) | | | (556,473 | ) |
| | |
|
| |
|
|
|
Net Assets | | 100.00 | % | | $ | 195,669,548 | |
| | |
|
| |
|
|
|
See Notes to Financial Statements.
35
Excelsior Funds Trust
Portfolio of Investments — March 31, 2005
Equity Core Fund
| | | | | |
| | | | | |
Shares
| | | | Value
|
| COMMON STOCKS — 92.86% | | |
| | | CONSUMER DISCRETIONARY — 16.21% |
| 28,422 | | Autozone, Inc.(a) | | $ | 2,435,764 |
| 82,193 | | Dillards, Inc., Class A | | | 2,210,992 |
| 72,378 | | Eastman Kodak Co. | | | 2,355,904 |
| 107,406 | | Furniture Brands International, Inc. | | | 2,342,525 |
| 66,505 | | John Wiley & Sons, Class A | | | 2,344,301 |
| 68,517 | | Leggett & Platt, Inc. | | | 1,978,771 |
| 29,733 | | Timberland Co., Class A(a) | | | 2,108,962 |
| | | | |
|
|
| | | | | | 15,777,219 |
| | | | |
|
|
| | | CONSUMER STAPLES — 7.51% |
| 52,157 | | Anheuser Busch Cos., Inc. | | | 2,471,720 |
| 69,643 | | Sysco Corp. | | | 2,493,220 |
| 35,839 | | Wm. Wrigley Jr. Co. | | | 2,349,963 |
| | | | |
|
|
| | | | | | 7,314,903 |
| | | | |
|
|
| | | ENERGY — 5.06% |
| 43,660 | | Exxon Mobil Corp. | | | 2,602,136 |
| 57,932 | | Suncor Energy, Inc. | | | 2,329,446 |
| | | | |
|
|
| | | | | | 4,931,582 |
| | | | |
|
|
| | | FINANCIAL — 13.89% |
| 75,338 | | American Capital Strategies Ltd. | | | 2,366,367 |
| 41,348 | | American International Group, Inc. | | | 2,291,093 |
| 28 | | Berkshire Hathaway, Inc., Class A(a) | | | 2,435,999 |
| 21,535 | | Lehman Brothers Holding, Inc. | | | 2,027,736 |
| 73,578 | | North Fork Bancorporation, Inc. | | | 2,041,054 |
| 50,672 | | RenaissanceRe Holdings Ltd. | | | 2,366,382 |
| | | | |
|
|
| | | | | | 13,528,631 |
| | | | |
|
|
| | | HEALTH CARE — 10.38% |
| 38,533 | | Johnson & Johnson | | | 2,587,876 |
| 48,163 | | Medtronic, Inc. | | | 2,453,905 |
| 45,223 | | Novo-Nordisk A/S ADR | | | 2,524,348 |
| 47,311 | | Roche Holdings Ltd., Sponsored ADR | | | 2,544,371 |
| | | | |
|
|
| | | | | | 10,110,500 |
| | | | |
|
|
| | | INDUSTRIALS — 7.97% |
| 1,164,791 | | Bombardier, Inc., Class B | | | 2,598,649 |
| 70,752 | | General Electric Co. | | | 2,551,317 |
| 342,999 | | Quanta Services, Inc.(a) | | | 2,617,082 |
| | | | |
|
|
| | | | | | 7,767,048 |
| | | | |
|
|
| | | | | |
| | | | | |
Shares
| | | | Value
|
| COMMON STOCKS — (continued) | | |
| | | INFORMATION TECHNOLOGY — 12.00% |
| 563,849 | | 3com Corp.(a) | | $ | 2,007,302 |
| 67,785 | | Analog Devices, Inc. | | | 2,449,750 |
| 98,847 | | Molex, Inc., Class A | | | 2,332,789 |
| 88,343 | | National Instruments Corp. | | | 2,389,678 |
| 55,607 | | Pitney Bowes, Inc. | | | 2,508,989 |
| | | | |
|
|
| | | | | | 11,688,508 |
| | | | |
|
|
| | | RAW/INTERMEDIATE MATERIALS — 10.12% |
| 67,485 | | Aracruz Cellulose S.A. ADR | | | 2,415,963 |
| 48,717 | | E.I. Du Pont de Nemours & Co. | | | 2,496,259 |
| 36,733 | | Monsanto Co/New | | | 2,369,279 |
| 45,244 | | Vulcan Materials Company | | | 2,571,216 |
| | | | |
|
|
| | | | | | 9,852,717 |
| | | | |
|
|
| | | REAL ESTATE — 2.14% | | | |
| 31,000 | | St. Joe Co. | | | 2,086,300 |
| | | | |
|
|
| | | UTILITIES — 7.58% | | | |
| 163,116 | | AES Corp.(a) | | | 2,671,840 |
| 180,250 | | Centerpoint Energy, Inc. | | | 2,168,408 |
| 240,812 | | EL Paso Corp. | | | 2,547,791 |
| | | | |
|
|
| | | | | | 7,388,039 |
| | | | |
|
|
| | | TOTAL COMMON STOCKS
(Cost $89,999,131) | | | 90,445,447 |
| | | | |
|
|
| FOREIGN COMMON STOCKS — 2.60% | | |
| | | GERMANY — 2.60% | | | |
| 55,897 | | Bayerische Motoren Werke AG | | | 2,535,601 |
| | | | |
|
|
| | | TOTAL FOREIGN
COMMON STOCKS
(Cost $2,486,080) | | | 2,535,601 |
| | | | |
|
|
See Notes to Financial Statements.
36
Excelsior Funds Trust
Portfolio of Investments — March 31, 2005
Equity Core Fund — (continued)
| | | | | |
| | | | | |
Principal
Amount
| | | | Value
|
| REPURCHASE AGREEMENT — 4.98% | | |
| $4,851,000 | | JP Morgan Chase Securities, Inc., 2.30%, dated 3/31/05, to be repurchased 4/01/05, repurchase price $4,851,310 (collateralized by Federal National Mortgage Association MTN, par value $4,845,000, 4.63%, maturing 10/15/14; total market value $4,954,334) | | $ | 4,851,000 |
| | | | |
|
|
| | | TOTAL REPURCHASE AGREEMENT
(Cost $4,851,000) | | | 4,851,000 |
| | | | |
|
|
| | | | | | | |
TOTAL INVESTMENTS
(Cost $97,336,211)(b) | | 100.44 | % | | $ | 97,832,048 | |
LIABILITIES IN EXCESS OF
OTHER ASSETS | | (0.44 | ) | | | (426,415 | ) |
| | |
|
| |
|
|
|
NET ASSETS | | 100.00 | % | | $ | 97,405,633 | |
| | |
|
| |
|
|
|
| (a) | Non-income producing security. |
| (b) | Unrealized appreciation (depreciation) of securities: |
| | | | |
Unrealized
Appreciation
| | Unrealized
(Depreciation)
| | Net
Unrealized
Appreciation/
(Depreciation)
|
| $3,409,171 | | $(2,913,334) | | $495,837 |
ADR—American Depository Receipt
MTN—Medium Term Note
The summary of the Fund’s investments as of March 31, 2005 is as follows: (Unaudited)
| | | | | | | |
Sector Diversification
| | % of
Net
Assets
| | | Market Value
| |
Consumer Discretionary | | 18.81 | % | | $ | 18,312,820 | |
Financial | | 13.89 | | | | 13,528,631 | |
Information Technology | | 12.00 | | | | 11,688,508 | |
Health Care | | 10.38 | | | | 10,110,500 | |
Raw/Intermediate Materials | | 10.12 | | | | 9,852,717 | |
Industrials | | 7.97 | | | | 7,767,048 | |
Utilities | | 7.58 | | | | 7,388,039 | |
Consumer Staples | | 7.51 | | | | 7,314,903 | |
Energy | | 5.06 | | | | 4,931,582 | |
Repurchase Agreements | | 4.98 | | | | 4,851,000 | |
Real Estate | | 2.14 | | | | 2,086,300 | |
| | |
|
| |
|
|
|
Total Investment | | 100.44 | % | | $ | 97,832,048 | |
Other Assets and Liabilities (Net) | | (0.44 | ) | | | (426,415 | ) |
| | |
|
| |
|
|
|
Net Assets | | 100.00 | % | | $ | 97,405,633 | |
| | |
|
| |
|
|
|
See Notes to Financial Statements.
37
Excelsior Funds, Inc.
Portfolio of Investments — March 31, 2005
International Fund
| | | | | |
| | | | | |
Shares
| | | | Value
|
| COMMON STOCKS — 92.73% | | |
| | | AUSTRALIA — 0.88% | | | |
| 60,647 | | Rio Tinto, Ltd. | | $ | 2,116,351 |
| | | | |
|
|
| | | BELGIUM — 3.40% | | | |
| 101,700 | | Dexia | | | 2,419,388 |
| 102,400 | | Fortis S.A. | | | 2,917,939 |
| 27,800 | | Umicore | | | 2,821,987 |
| | | | |
|
|
| | | | | | 8,159,314 |
| | | | |
|
|
| | | CANADA — 1.08% | | | |
| 64,568 | | Suncor Energy, Inc. | | | 2,599,900 |
| | | | |
|
|
| | | CHINA — 3.06% | | | |
| 2,093,800 | | Cafe de Coral Holdings, Ltd.
(Hong Kong) | | | 2,389,294 |
| 5,658,000 | | Far East Consortium Int’L, Ltd. (Hong Kong)(a) | | | 2,412,120 |
| 282,000 | | Sun Hung Kai Properties, Ltd. (Hong Kong) | | | 2,558,114 |
| | | | |
|
|
| | | | | | 7,359,528 |
| | | | |
|
|
| | | FINLAND — 0.91% | | | |
| 112,900 | | Fortum Oyj | | | 2,198,429 |
| | | | |
|
|
| | | FRANCE — 8.40% | | | |
| 89,828 | | AXA S.A. | | | 2,393,162 |
| 47,400 | | BNP Paribas S.A. | | | 3,358,281 |
| 68,256 | | Carrefour S.A. | | | 3,622,740 |
| 41,800 | | Compagnie Generale de Geophysique S.A. (CGG)(a) | | | 3,657,872 |
| 42,026 | | Sanofi-Aventis S.A. | | | 3,544,165 |
| 15,389 | | TotalFinaElf S.A. | | | 3,601,108 |
| | | | |
|
|
| | | | | | 20,177,328 |
| | | | |
|
|
| | | GERMANY — 5.82% | | | |
| 14,100 | | Adidas-Salomon AG | | | 2,240,353 |
| 78,100 | | Bayerische Motoren Werke AG | | | 3,542,774 |
| 43,310 | | Fielmann AG | | | 2,919,711 |
| 54,600 | | MAN AG | | | 2,435,004 |
| 224,300 | | SGL Carbon AG(a) | | | 2,849,731 |
| | | | |
|
|
| | | | | | 13,987,573 |
| | | | |
|
|
| | | GREECE — 0.92% | | | |
| 125,200 | | Hellenic Telecommunication S.A. | | | 2,210,701 |
| | | | |
|
|
| | | INDIA — 1.18% | | | |
| 72,800 | | State Bank of India GDR(b) | | | 2,835,560 |
| | | | |
|
|
| | | | | |
| | | | | |
Shares
| | | | Value
|
| COMMON STOCKS — (continued) | | |
| | | INDONESIA — 0.97% | | | |
| 4,923,500 | | PT Telekomunikasi Indonesia Tbk | | $ | 2,326,329 |
| | | | |
|
|
| | | IRELAND — 2.75% | | | |
| 139,063 | | Anglo Irish Bank plc | | | 3,483,110 |
| 198,200 | | Depfa Bank plc(a) | | | 3,134,816 |
| | | | |
|
|
| | | | | | 6,617,926 |
| | | | |
|
|
| | | ITALY — 3.68% | | | |
| 947,300 | | Cassa di Risparmio di Firenze S.p.A. (Carifirenze) | | | 2,440,248 |
| 169,290 | | ENI S.p.A. | | | 4,396,031 |
| 118,450 | | Permasteelisa S.p.A. | | | 2,011,661 |
| | | | |
|
|
| | | | | | 8,847,940 |
| | | | |
|
|
| | | JAPAN — 18.97% | | | |
| 72,600 | | Canon, Inc. | | | 3,893,943 |
| 442,963 | | Chiyoda Corp. | | | 4,615,361 |
| 40,300 | | Don Quijote Co., Ltd. | | | 2,364,507 |
| 3,520 | | eAccess, Ltd. | | | 2,987,920 |
| 120,200 | | FamilyMart Co., Ltd. | | | 3,543,044 |
| 46,300 | | FANUC Co., Ltd. | | | 2,897,934 |
| 33,300 | | Hoya Corp. | | | 3,665,314 |
| 15,400 | | Keyence Corp. | | | 3,568,266 |
| 243 | | Millea Holdings, Inc. | | | 3,536,029 |
| 157,000 | | Mimasu Semiconducotor Industry Co., Ltd. | | | 2,370,999 |
| 356 | | Mitsubishi Tokyo Financial Group, Inc. | | | 3,088,289 |
| 498,900 | | Mitsui Osk Lines, Ltd. | | | 3,206,400 |
| 214,200 | | Nissan Motors Co., Ltd. | | | 2,195,847 |
| 76,500 | | Takeda Chemical Co., Ltd. | | | 3,646,425 |
| | | | |
|
|
| | | | | | 45,580,278 |
| | | | |
|
|
| | | MALAYSIA — 0.83% | | | |
| 979,400 | | Public Bank Berhad | | | 1,997,461 |
| | | | |
|
|
| | | MEXICO — 1.96% | | | |
| 73,900 | | Cemex S.A. de C.V. ADR | | | 2,678,875 |
| 59,000 | | Telefonos de Mexico S.A. de C.V., Series L ADR | | | 2,037,270 |
| | | | |
|
|
| | | | | | 4,716,145 |
| | | | |
|
|
| | | NETHERLANDS — 1.42% | | | |
| 288,700 | | Qiagen NV(a) | | | 3,405,938 |
| | | | |
|
|
See Notes to Financial Statements.
38
Excelsior Funds, Inc.
Portfolio of Investments — March 31, 2005
International Fund — (continued)
| | | | | |
| | | | | |
Shares
| | | | Value
|
| COMMON STOCKS — (continued) | | |
| | | NORWAY — 2.75% | | | |
| 352,600 | | Telenor ASA | | $ | 3,171,164 |
| 227,000 | | Yara International ASA(a) | | | 3,447,371 |
| | | | |
|
|
| | | | | | 6,618,535 |
| | | | |
|
|
| | | SOUTH KOREA — 1.50% | | | |
| 7,300 | | Samsung Electronic Co., Ltd. | | | 3,604,513 |
| | | | |
|
|
| | | SPAIN — 3.32% | | | |
| 30,150 | | Fomento de Construcciones y Contratas S.A. (FCC) | | | 1,541,213 |
| 129,600 | | Repsol YPF S.A. | | | 3,430,909 |
| 173,222 | | Telefonica S.A. | | | 3,018,220 |
| | | | |
|
|
| | | | | | 7,990,342 |
| | | | |
|
|
| | | SWEDEN — 1.25% | | | |
| 77,200 | | Modern Times Group (MTG) AB, Class B(a) | | | 2,336,284 |
| 161,000 | | Ortivus AB(a) | | | 660,265 |
| | | | |
|
|
| | | | | | 2,996,549 |
| | | | |
|
|
| | | SWITZERLAND — 4.01% | | | |
| 105 | | Lindt & Spruengli AG | | | 1,592,904 |
| 41,380 | | Novartis AG | | | 1,929,960 |
| 27,310 | | Roche Holdings AG | | | 2,926,398 |
| 37,800 | | UBS AG, Registered Shares | | | 3,191,072 |
| | | | |
|
|
| | | | | | 9,640,334 |
| | | | |
|
|
| | | TAIWAN — 2.21% | | | |
| 676,000 | | Hon Hai Precision, Inc. | | | 3,002,062 |
| 272,100 | | Taiwan Semiconductor Manufacturing Co, Ltd. ADR | | | 2,307,408 |
| | | | |
|
|
| | | | | | 5,309,470 |
| | | | |
|
|
| | | THAILAND — 0.90% | | | |
| 322,100 | | Siam Cement Public Co., Ltd. (Foreign Shares) | | | 2,170,075 |
| | | | |
|
|
| | | UNITED KINGDOM — 20.56% | | | |
| 178,446 | | Alliance Unichem plc | | | 2,607,746 |
| 429,416 | | BAE Systems plc | | | 2,105,299 |
| 344,800 | | BG Group | | | 2,678,991 |
| 361,900 | | Cadbury Schweppes plc | | | 3,627,205 |
| 329,000 | | Davis Service Group plc | | | 2,716,286 |
| 145,117 | | GlaxoSmithKline plc | | | 3,325,655 |
| 256,600 | | Lloyds TSB Group | | | 2,317,302 |
| 292,000 | | Paragon Group plc | | | 2,206,688 |
| 81,473 | | Reckitt Benckiser plc | | | 2,589,034 |
| | | | | |
| | | | | |
Shares
| | | | Value
|
| COMMON STOCKS — (continued) | | |
| | | UNITED KINGDOM — (continued) |
| 109,121 | | Royal Bank of Scotland Group plc | | $ | 3,471,751 |
| 916,100 | | Sage Group plc (The) | | | 3,483,188 |
| 836,392 | | Serco Group plc | | | 3,859,601 |
| 312,900 | | Shire Pharmaceuticals Group plc | | | 3,573,551 |
| 354,034 | | Stolt Offshore S.A.(a) | | | 2,731,589 |
| 95,500 | | SurfControl plc(a) | | | 1,132,179 |
| 1,345,246 | | Vodafone Group plc | | | 3,570,887 |
| 913,176 | | William Morrison Supermarkets plc | | | 3,381,494 |
| | | | |
|
|
| | | | | | 49,378,446 |
| | | | |
|
|
| | | TOTAL COMMON STOCKS
(Cost $187,998,118) | | | 222,844,965 |
| | | | |
|
|
| PREFERRED STOCKS — 2.20% |
| | | GERMANY — 1.18% | | | |
| 45,900 | | Rhoen-Klinikum AG | | | 2,832,488 |
| | | | |
|
|
| | | SOUTH KOREA — 1.02% | | | |
| 70,335 | | Hyundai Motor Co., Ltd. | | | 2,462,870 |
| | | | |
|
|
| | | TOTAL PREFERRED STOCKS (Cost $3,875,354) | | | 5,295,358 |
| | | | |
|
|
| | |
Principal
Amount
| | | | |
| FOREIGN BOND — 0.00% |
| | | BRAZIL — 0.00% | | | |
| $25,200 | | Companhia Vale do Rio Doce(c) | | | — |
| | | | |
|
|
| | | TOTAL FOREIGN BOND
(Cost $0) | | | — |
| | | | |
|
|
| REPURCHASE AGREEMENT — 4.15% | | |
| 9,977,000 | | JP Morgan Chase Securities, Inc., 2.30%, dated 3/31/05, to be repurchased 4/01/05, repurchase price $9,977,637 (collateralized by Federal National Mortgage Association MTN, par value $9,965,000, 4.63%, maturing 10/15/14; total market value $10,189,475) | | | 9,977,000 |
| | | | |
|
|
| | | TOTAL REPURCHASE AGREEMENT
(Cost $9,977,000) | | | 9,977,000 |
| | | | |
|
|
See Notes to Financial Statements.
39
Excelsior Funds, Inc.
Portfolio of Investments — March 31, 2005
International Fund — (continued)
| | | | | | |
| | | | | | |
| | | | | | Value
|
TOTAL INVESTMENTS
(Cost $201,850,472)(d) | | 99.08 | % | | $ | 238,117,323 |
OTHER ASSETS IN EXCESS
OF LIABILITIES | | 0.92 | | | | 2,204,443 |
| | |
|
| |
|
|
NET ASSETS | | 100.00 | % | | $ | 240,321,766 |
| | |
|
| |
|
|
| (a) | Non-income producing security. |
| (b) | Security exempt from registration under Rule 144A of the Securities Act of 1933. This security may be resold in transactions exempt from registration, normally to qualified institutional buyers. At March 31, 2005, these securities amounted to $2,835,560 or 1.18% of net assets. |
| (c) | Perpetual debt security with coupon rate linked to mining activities revenue which is fair valued at zero. Such security is valued in accordance with procedures adopted by the Board of Directors. |
| (d) | Unrealized appreciation (depreciation) of securities: |
| | | | |
Unrealized
Appreciation
| | Unrealized
(Depreciation)
| | Net Unrealized
Appreciation/
(Depreciation)
|
| $40,375,010 | | $(4,108,159) | | $36,266,851 |
ADR—American Depository Receipt
GDR—Global Depository Receipt
Ltd.—Limited
MTN—Medium Term Note
plc—Public limited company
The summary of the Fund’s investments as of March 31, 2005 is as follows: (Unaudited)
| | | | | | |
Sector Diversification
| | % of
Net
Assets
| | | Market Value
|
Financial | | 17.81 | % | | $ | 42,791,096 |
Industrials | | 14.08 | | | | 33,836,661 |
Consumer Discretionary | | 11.51 | | | | 27,660,000 |
Health Care | | 10.32 | | | | 24,806,165 |
Energy | | 9.61 | | | | 23,096,400 |
Consumer Staples | | 8.90 | | | | 21,389,265 |
Telecommunication | | 6.80 | | | | 16,334,570 |
Technology | | 5.08 | | | | 12,218,774 |
Raw/Intermediate Materials | | 4.68 | | | | 11,235,441 |
Repurchase Agreement | | 4.15 | | | | 9,977,000 |
Information Technology | | 3.16 | | | | 7,603,287 |
Real Estate | | 2.07 | | | | 4,970,235 |
Utilities | | 0.91 | | | | 2,198,429 |
| | |
|
| |
|
|
Total Investment | | 99.08 | % | | $ | 238,117,323 |
Other Assets and Liabilities (Net) | | 0.92 | | | | 2,204,443 |
| | |
|
| |
|
|
Net Assets | | 100.00 | % | | $ | 240,321,766 |
| | |
|
| |
|
|
See Notes to Financial Statements.
40
Excelsior Funds, Inc.
Portfolio of Investments — March 31, 2005
Pacific/Asia Fund
| | | | | |
| | | | | |
Shares
| | | | Value
|
| COMMON STOCKS — 94.87% | | |
| | | AUSTRALIA — 1.43% | | | |
| 54,986 | | Rio Tinto, Ltd. | | $ | 1,918,803 |
| | | | |
|
|
| | | CHINA — 19.12% | | | |
| 2,558,800 | | Cafe de Coral Holdings, Ltd. (Hong Kong) | | | 2,919,918 |
| 6,262,000 | | China Oilfield Services, Ltd., Class H (Hong Kong) | | | 2,167,810 |
| 24,300 | | CNOOC, Ltd. ADR
(Hong Kong) | | | 1,329,453 |
| 5,627,900 | | Convenience Retail Asia, Ltd. (Hong Kong) | | | 1,948,294 |
| 5,674,000 | | Far East Consortium Int’L, Ltd. (Hong Kong)(a) | | | 2,418,941 |
| 3,359,000 | | FU JI Food & Catering Services, Ltd. (Hong Kong)(a) | | | 2,713,282 |
| 1,097,200 | | Hongkong Land Holdings, Ltd. | | | 2,951,468 |
| 2,618,000 | | Huaneng Power International, Inc., Class H (Hong Kong) | | | 1,913,326 |
| 1,988,400 | | People’s Food Holdings, Ltd. | | | 1,457,542 |
| 338,000 | | Sun Hung Kai Properties, Ltd. (Hong Kong) | | | 3,066,109 |
| 6,987,000 | | Symphony Holdings, Ltd.
(Hong Kong) | | | 1,558,778 |
| 1,533,000 | | Texwinca Holdings, Ltd.
(Hong Kong) | | | 1,287,442 |
| | | | |
|
|
| | | | | | 25,732,363 |
| | | | |
|
|
| | | INDIA — 6.31% | | | |
| 269,454 | | Gujarat Ambuja Cements, Ltd. GDR | | | 2,478,249 |
| 64,000 | | India Fund, Inc.(b) | | | 1,738,880 |
| 1,074,500 | | National Thermal Power Corp. | | | 2,106,622 |
| 55,787 | | State Bank of India GDR(c) | | | 2,172,904 |
| | | | |
|
|
| | | | | | 8,496,655 |
| | | | |
|
|
| | | INDONESIA — 5.80% | | | |
| 16,800,500 | | Berlain Laju Tanker Tbk | | | 1,525,544 |
| 60,900 | | Freeport-McMoRan Copper & Gold, Inc., Class B | | | 2,412,249 |
| 106,573,600 | | PT Bank Internasional Indonesia Tbk(a) | | | 2,250,525 |
| 3,424,300 | | PT Telekomunikasi Indonesia Tbk | | | 1,617,965 |
| | | | |
|
|
| | | | | | 7,806,283 |
| | | | |
|
|
| | | | | |
| | | | | |
Shares
| | | | Value
|
| COMMON STOCKS — (continued) | | |
| | | JAPAN — 45.79% | | | |
| 43,900 | | Canon, Inc. | | $ | 2,354,601 |
| 380,745 | | Chiyoda Corp. | | | 3,967,094 |
| 49,000 | | Don Quijote Co., Ltd. | | | 2,874,959 |
| 4,180 | | eAccess, Ltd. | | | 3,548,155 |
| 92,000 | | FamilyMart Co., Ltd. | | | 2,711,814 |
| 44,400 | | FANUC Co., Ltd. | | | 2,779,012 |
| 68,000 | | Hisamitsu Pharmaceutical | | | 1,506,460 |
| 96,800 | | Honda Motor Co., Ltd. ADR | | | 2,423,872 |
| 24,300 | | Hoya Corp. | | | 2,674,689 |
| 277 | | INPEX Corp. | | | 1,483,121 |
| 16,000 | | Keyence Corp. | | | 3,707,290 |
| 178,000 | | Koyo Seiko Co., Ltd | | | 2,409,197 |
| 180 | | Millea Holdings, Inc. | | | 2,619,281 |
| 197,650 | | Mimasu Semiconductor Industry Co., Ltd. | | | 2,984,892 |
| 338 | | Mitsubishi Tokyo Financial Group, Inc. | | | 2,932,139 |
| 522,200 | | Mitsui Osk Lines, Ltd. | | | 3,356,148 |
| 22,000 | | Nidec Corp. | | | 2,739,611 |
| 399 | | Ninety-Nine Plus, Inc.(a) | | | 2,597,845 |
| 240,000 | | Nissan Motors Co., Ltd. | | | 2,460,333 |
| 1,247,000 | | Resona Holdings, Inc.(a) | | | 2,500,863 |
| 139,500 | | Sato Corp. | | | 3,513,362 |
| 73,000 | | Takeda Chemical Co., Ltd. | | | 3,479,595 |
| | | | |
|
|
| | | | | | 61,624,333 |
| | | | |
|
|
| | | MALAYSIA — 1.22% | | | |
| 806,900 | | Public Bank Berhad | | | 1,645,651 |
| | | | |
|
|
| | | SOUTH KOREA — 5.21% | | | |
| 67,000 | | Hyundai Heavy Industries Co., Ltd. | | | 3,354,382 |
| 7,398 | | Samsung Electronic Co., Ltd. | | | 3,652,903 |
| | | | |
|
|
| | | | | | 7,007,285 |
| | | | |
|
|
| | | TAIWAN — 3.67% | | | |
| 683,000 | | Hon Hai Precision, Inc. | | | 3,033,148 |
| 225,000 | | Taiwan Semiconductor Manufacturing Co, Ltd. ADR | | | 1,908,000 |
| | | | |
|
|
| | | | | | 4,941,148 |
| | | | |
|
|
| | | THAILAND — 6.32% | | | |
| 12,638,600 | | Home Product Center Public Co., Ltd. (Foreign Shares) | | | 1,773,952 |
| 8,125,800 | | IT City Public Co., Ltd.
(Foreign Shares) | | | 908,281 |
See Notes to Financial Statements.
41
Excelsior Funds, Inc.
Portfolio of Investments — March 31, 2005
Pacific/Asia Fund — (continued)
| | | | | |
| | | | | |
Shares
| | | | Value
|
| COMMON STOCKS — (continued) | | |
| | | THAILAND — (continued) | | | |
| 406,700 | | Siam Cement Public Co., Ltd. (Foreign Shares) | | $ | 2,740,048 |
| 4,201,700 | | Thai Union Frozen Products Public Co., Ltd.
(Foreign Shares) | | | 3,082,784 |
| | | | |
|
|
| | | | | | 8,505,065 |
| | | | |
|
|
| | | TOTAL COMMON STOCKS
(Cost $114,239,529) | | | 127,677,586 |
| | | | |
|
|
| PREFERRED STOCKS — 3.13% | | |
| | | SOUTH KOREA — 3.13% | | | |
| 120,300 | | Hyundai Motor Co., Ltd. | | | 4,212,458 |
| | | | |
|
|
| | | TOTAL PREFERRED STOCKS (Cost $2,461,711) | | | 4,212,458 |
| | | | |
|
|
| WARRANT — 0.04% | | |
| | | HONG KONG — 0.04% | | | |
| 2,048,852 | | Champion Technology
Holding | | | 58,844 |
| | | | |
|
|
| | | TOTAL WARRANT
(Cost $0) | | | 58,844 |
| | | | |
|
|
| | |
Principal
Amount
| | | | |
| REPURCHASE AGREEMENT — 1.81% | | |
| $2,431,000 | | JP Morgan Chase Securities, Inc., 2.30%, dated 03/31/05, to be repurchased on 04/01/05, repurchase price $2,431,155 (collateralized by Federal National Mortgage Association MTN, par value $2,428,000, 4.63%, maturing on 10/15/14; total market value $2,482,791) | | | 2,431,000 |
| | | | |
|
|
| | | TOTAL REPURCHASE AGREEMENT
(Cost $2,431,000) | | | 2,431,000 |
| | | | |
|
|
| | | | | | |
TOTAL INVESTMENTS
(Cost $119,132,240)(d) | | 99.85 | % | | $ | 134,379,888 |
OTHER ASSETS IN EXCESS OF LIABILITIES | | 0.15 | | | | 198,891 |
| | |
|
| |
|
|
NET ASSETS | | 100.00 | % | | $ | 134,578,779 |
| | |
|
| |
|
|
| (a) | Non-income producing security |
| (b) | Registered Investment Company |
| (c) | Security exempt from registration under Rule 144A of the Securities Act of 1933. This security may be resold in transactions exempt from registration, normally to qualified institutional buyers. At March 31, 2005, this security amounted to $2,172,904 or 1.61% of net assets. |
| (d) | Unrealized appreciation (depreciation) of securities: |
| | | | |
Unrealized
Appreciation
| | Unrealized
(Depreciation)
| | Net Unrealized
Appreciation/
(Depreciation)
|
| $17,737,183 | | $(2,489,535) | | $15,247,648 |
ADR—American Depository Receipt
GDR—Global Depository Receipt
Ltd.—Limited
MTN—Medium Term Note
See Notes to Financial Statements.
42
Excelsior Funds, Inc.
Portfolio of Investments — March 31, 2005
Pacific/Asia Fund — (continued)
The summary of the Fund’s investments as of March 31, 2005 is as follows: (Unaudited)
| | | | | | |
Sector Diversification
| | % of
Net
Assets
| | | Market Value
|
Industrials | | 25.34 | % | | $ | 34,107,179 |
Consumer Discretionary | | 24.34 | | | | 32,761,834 |
Technology | | 11.12 | | | | 14,973,160 |
Financial | | 10.49 | | | | 14,121,363 |
Real Estate | | 6.27 | | | | 8,436,518 |
Consumer Staples | | 5.39 | | | | 7,253,607 |
Energy | | 3.70 | | | | 4,980,384 |
Raw/Intermediate Materials | | 3.22 | | | | 4,331,052 |
Utilities | | 2.99 | | | | 4,019,947 |
Information Technology | | 2.64 | | | | 3,548,155 |
Repurchase Agreement | | 1.81 | | | | 2,431,000 |
Investment Companies | | 1.29 | | | | 1,738,880 |
Telecommunication | | 1.25 | | | | 1,676,809 |
| | |
|
| |
|
|
Total Investment | | 99.85 | % | | $ | 134,379,888 |
Other Assets and Liabilities (Net) | | 0.15 | | | | 198,891 |
| | |
|
| |
|
|
Net Assets | | 100.00 | % | | $ | 134,578,779 |
| | |
|
| |
|
|
See Notes to Financial Statements.
43
Excelsior Funds, Inc.
Portfolio of Investments — March 31, 2005
Emerging Markets Fund
| | | | | |
| | | | | |
Shares
| | | | Value
|
| COMMON STOCKS — 87.00% | | |
| | | ARGENTINA — 0.42% | | | |
| 146,000 | | IRSA Inversiones y Representaciones S.A. GDR(a) | | $ | 1,832,300 |
| | | | |
|
|
| | | BRAZIL — 4.15% | | | |
| 187,100 | | Companhia Vale do Rio Doce S.A. | | | 5,969,498 |
| 37,000 | | Diagnosticos da America S.A.(a) | | | 377,849 |
| 167,400 | | Gol Linhas Aereas Inteligentes S.A. ADR(a) | | | 4,206,762 |
| 215,400 | | Uniao de Bancos Brasileiros S.A. | | | 7,405,452 |
| | | | �� |
|
|
| | | | | | 17,959,561 |
| | | | |
|
|
| | | CHILE — 1.59% | | | |
| 382,939 | | Compania de Telecomunicaciones de Chile S.A. ADR | | | 4,265,941 |
| 34,692 | | Vina Concha y Toro S.A. ADR | | | 2,634,510 |
| | | | |
|
|
| | | | | | 6,900,451 |
| | | | |
|
|
| | | CHINA — 9.08% | | | |
| 18,925,300 | | Chaoda Mordern Agriculture Holdings, Ltd. (Hong Kong) | | | 7,461,605 |
| 464,897 | | China Mobile, Ltd. ADR
(Hong Kong) | | | 7,628,960 |
| 14,372,000 | | China Petroleum & Chemical Corp., Class H (Hong Kong) | | | 5,804,598 |
| 13,803,000 | | Far East Consortium Int’L, Ltd. (Hong Kong)(a) | | | 5,884,499 |
| 9,018,400 | | People’s Food Holdings, Ltd. | | | 6,610,689 |
| 7,029,000 | | Texwinca Holdings, Ltd.
(Hong Kong) | | | 5,903,087 |
| | | | |
|
|
| | | | | | 39,293,438 |
| | | | |
|
|
| | | COLUMBIA — 0.89% | | | |
| 288,800 | | Bancolombia S.A. ADR | | | 3,858,368 |
| | | | |
|
|
| | | CZECH REPUBLIC — 1.73% | | | |
| 401,100 | | Cesky Telecom A.S. | | | 7,506,664 |
| | | | |
|
|
| | | HUNGARY — 2.82% | | | |
| 473,200 | | BorsodChem Rt. | | | 6,445,285 |
| 169,000 | | OTP Bank Rt. | | | 5,776,869 |
| | | | |
|
|
| | | | | | 12,222,154 |
| | | | |
|
|
| | | | | |
| | | | | |
Shares
| | | | Value
|
| COMMON STOCKS — (continued) | | |
| | | INDIA — 3.84% | | | |
| 190,317 | | Gujarat Ambuja Cements, Ltd. GDR | | $ | 1,750,403 |
| 249,150 | | ICICI Bank, Ltd. ADR | | | 5,162,388 |
| 213,700 | | India Fund, Inc.(b) | | | 5,806,229 |
| 100,200 | | State Bank of India GDR(c) | | | 3,902,790 |
| | | | |
|
|
| | | | | | 16,621,810 |
| | | | |
|
|
| | | INDONESIA — 2.71% | | | |
| 18,673,700 | | PT Indocement Tunggal Prakarsa Tbk(a) | | | 5,520,680 |
| 13,181,200 | | PT Telekomunikasi Indonesia Tbk | | | 6,228,051 |
| | | | |
|
|
| | | | | | 11,748,731 |
| | | | |
|
|
| | | MALAYSIA — 4.14% | | | |
| 1,221,000 | | Genting Berhad | | | 5,558,763 |
| 3,181,950 | | Public Bank Berhad | | | 6,489,504 |
| 2,293,900 | | Telekom Malaysia Berhad | | | 5,885,664 |
| | | | |
|
|
| | | | | | 17,933,931 |
| | | | |
|
|
| | | MEXICO — 8.48% | | | |
| 105,100 | | America Movil S.A. de C.V.,
Series L ADR | | | 5,423,160 |
| 165,720 | | Cemex S.A. de C.V. ADR | | | 6,007,350 |
| 129,600 | | Grupo Aeroportuario del Sureste S.A. de C.V. ADR | | | 3,635,280 |
| 512,955 | | Grupo Elektra S.A. | | | 4,110,714 |
| 1,895,400 | | Grupo Televisa S.A. | | | 5,580,796 |
| 181,690 | | Telefonos de Mexico S.A. de C.V., Series L ADR | | | 6,273,756 |
| 1,618,715 | | Wal-Mart de Mexico S.A. de C.V. | | | 5,682,245 |
| | | | |
|
|
| | | | | | 36,713,301 |
| | | | |
|
|
| | | POLAND — 2.84% | | | |
| 497,000 | | KGHM Polska Miedz S.A.(a) | | | 4,848,627 |
| 848,600 | | Powszechna Kasa Oszczednoski Polski Bank S.A.(a) | | | 7,472,389 |
| | | | |
|
|
| | | | | | 12,321,016 |
| | | | |
|
|
| | | RUSSIA — 6.00% | | | |
| 52,550 | | Lukoil Co. ADR | | | 7,115,270 |
| 103,200 | | MMC Norilsk Nickel ADR | | | 6,021,720 |
| 183,900 | | OAO Gazprom ADR | | | 6,197,430 |
| 530,100 | | Rostelecom ADR | | | 6,647,454 |
| | | | |
|
|
| | | | | | 25,981,874 |
| | | | |
|
|
See Notes to Financial Statements.
44
Excelsior Funds, Inc.
Portfolio of Investments — March 31, 2005
Emerging Markets Fund — (continued)
| | | | | |
| | | | | |
Shares
| | | | Value
|
| COMMON STOCKS — (continued) | | |
| | | SOUTH AFRICA — 6.88% | | | |
| 2,136,600 | | African Bank Investments, Ltd. | | $ | 5,714,756 |
| 436,200 | | Gold Fields, Ltd. ADR | | | 5,011,938 |
| 1,029,000 | | MTN Group, Ltd. | | | 7,251,469 |
| 455,355 | | Nedcor, Ltd. | | | 5,484,360 |
| 369,400 | | Telekom South Africa, Ltd. | | | 6,357,133 |
| | | | |
|
|
| | | | | | 29,819,656 |
| | | | |
|
|
| | | SOUTH KOREA — 17.62% | | | |
| 258,900 | | Hana Bank | | | 7,130,337 |
| 336,138 | | KT Corp. ADR | | | 7,163,101 |
| 271,800 | | LG Cable, Ltd. | | | 6,603,382 |
| 73,933 | | LG Home Shopping, Inc. | | | 5,730,395 |
| 7,660 | | Lotte Chilsung Beverage Co., Ltd. | | | 7,579,608 |
| 100,700 | | NCSoft Corp.(a) | | | 7,725,811 |
| 57,170 | | Samsung Electronic Co., Ltd. | | | 28,228,765 |
| 310,785 | | SK Telecom Co., Ltd. ADR | | | 6,128,680 |
| | | | |
|
|
| | | | | | 76,290,079 |
| | | | |
|
|
| | | TAIWAN — 7.89% | | | |
| 91,770 | | AU Optronics Corp. ADR | | | 1,345,348 |
| 1,271,628 | | Hon Hai Precision, Inc. | | | 5,647,198 |
| 891,700 | | iShares MSCI Taiwan Index Fund(b) | | | 10,325,886 |
| 3,080,453 | | President Chain Store Corp.(a) | | | 5,247,274 |
| 3,193,858 | | Synnex Technology International Corp. | | | 4,883,234 |
| 216,096 | | Taiwan Semiconductor Manufacturing Co, Ltd. | | | 353,020 |
| 753,400 | | Taiwan Semiconductor Manufacturing Co, Ltd. ADR | | | 6,388,832 |
| | | | |
|
|
| | | | | | 34,190,792 |
| | | | |
|
|
| | | THAILAND — 3.07% | | | |
| 6,285,700 | | BEC World Public Co., Ltd. (Foreign Shares) | | | 2,358,040 |
| 3,708,400 | | Kasikornbank Public Co., Ltd. (Foreign Shares) | | | 5,536,338 |
| 802,600 | | Siam Cement Public Co., Ltd. (Foreign Shares) | | | 5,407,334 |
| | | | |
|
|
| | | | | | 13,301,712 |
| | | | |
|
|
| | | TURKEY — 1.33% | | | |
| 594,700 | | Akbank T.A.S. ADR(c) | | | 5,768,649 |
| | | | |
|
|
| | | | | |
| | | | | |
Shares
| | | | Value
|
| COMMON STOCKS — (continued) | | |
| | | UNITED KINGDOM — 0.86% |
| 126,268 | | Old Mutual plc | | $ | 320,859 |
| 1,349,200 | | Old Mutual plc (South Africa shares) | | | 3,401,253 |
| | | | |
|
|
| | | | | | 3,722,112 |
| | | | |
|
|
| | | VENEZUELA — 0.66% | | | |
| 151,599 | | Compania Anonima Nacional Telefonos de Venezuela ADR | | | 2,868,253 |
| | | | |
|
|
| | | TOTAL COMMON STOCKS
(Cost $321,103,384) | | | 376,854,852 |
| | | | |
|
|
| PREFERRED STOCKS — 7.09% | | |
| | | BRAZIL — 5.40% | | | |
| 269,630 | | Banco Bradesco S.A. | | | 7,804,946 |
| 111,406,300 | | Companhia Siderurgica de Tubarao S.A. | | | 6,836,628 |
| 226,700 | | Petroleo Brasileiro S.A. | | | 8,778,614 |
| | | | |
|
|
| | | | | | 23,420,188 |
| | | | |
|
|
| | | SOUTH KOREA — 1.69% | | | |
| 208,800 | | Hyundai Motor Co., Ltd. | | | 7,311,399 |
| | | | |
|
|
| | | TOTAL PREFERRED STOCKS
(Cost $19,458,636) | | | 30,731,587 |
| | | | |
|
|
| | |
Principal
Amount
| | | | |
| FOREIGN BOND — 0.00% | | |
| | | BRAZIL — 0.00% | | | |
| $45,600 | | Companhia Vale do Rio Doce(d) | | | — |
| | | | |
|
|
| | | TOTAL FOREIGN BOND
(Cost $0) | | | — |
| | | | |
|
|
| REPURCHASE AGREEMENT — 5.42% | | |
| 23,457,000 | | JP Morgan Chase Securities, Inc., 2.30%, dated 03/31/05, to be repurchased on 04/01/05, repurchase price $23,458,499 (collateralized by Federal National Mortgage Association MTN, par value $23,428,000, 4.63%, maturing on 10/15/14; total market value $23,956,685) | | | 23,457,000 |
| | | | |
|
|
| | | TOTAL REPURCHASE AGREEMENT
(Cost $23,457,000) | | | 23,457,000 |
| | | | |
|
|
See Notes to Financial Statements.
45
Excelsior Funds, Inc.
Portfolio of Investments — March 31, 2005
Emerging Markets Fund — (continued)
| | | | | | |
| | | | | | |
| | | | | | Value
|
TOTAL INVESTMENTS
(Cost $364,019,020)(e) | | 99.51 | % | | $ | 431,043,439 |
OTHER ASSETS IN EXCESS OF LIABILITIES | | 0.49 | | | | 2,124,827 |
| | |
|
| |
|
|
NET ASSETS | | 100.00 | % | | $ | 433,168,266 |
| | |
|
| |
|
|
| (a) | Non-income producing security |
| (b) | Registered Investment Company |
| (c) | Security exempt from registration under Rule 144A of the Securities Act of 1933. This security may be resold in transactions exempt from registration, normally to qualified institutional buyers. At March 31, 2005, these securities amounted to $9,671,439 or 2.23% of net assets. |
| (d) | Perpetual debt security with coupon rate linked to mining activities revenue which is fair valued at zero. Such security is valued in accordance with procedures adopted by the Board of Directors. |
| (e) | Unrealized appreciation (depreciation) of securities: |
| | | | |
Unrealized
Appreciation
| | Unrealized
(Depreciation)
| | Net Unrealized
Appreciation/
(Depreciation)
|
| $77,610,025 | | $(10,585,606) | | $67,024,419 |
ADR—American Depository Receipt
GDR—Global Depository Receipt
Ltd.—Limited
MTN—Medium Term Note
plc—Public limited company
The summary of the Fund’s investments as of March 31, 2005 is as follows: (Unaudited)
| | | | | | |
Sector Diversification
| | % of
Net
Assets
| | | Market Value
|
Financial | | 18.75 | % | | $ | 81,229,258 |
Telecommunication | | 18.38 | | | | 79,628,285 |
Industrials | | 15.52 | | | | 67,228,387 |
Consumer Discretionary | | 10.96 | | | | 47,482,713 |
Raw/Intermediate Materials | | 10.93 | | | | 47,338,476 |
Consumer Staples | | 5.61 | | | | 24,286,412 |
Repurchase Agreement | | 5.42 | | | | 23,457,000 |
Energy | | 5.01 | | | | 21,698,482 |
Investment Companies | | 3.72 | | | | 16,132,115 |
Information Technology | | 1.78 | | | | 7,725,811 |
Real Estate | | 1.78 | | | | 7,716,799 |
Technology | | 1.56 | | | | 6,741,852 |
Health Care | | 0.09 | | | | 377,849 |
| | |
|
| |
|
|
Total Investment | | 99.51 | % | | $ | 431,043,439 |
Other Assets and Liabilities (Net) | | 0.49 | | | | 2,124,827 |
| | |
|
| |
|
|
Net Assets | | 100.00 | % | | $ | 433,168,266 |
| | |
|
| |
|
|
See Notes to Financial Statements.
46
[THIS PAGE INTENTIONALLY LEFT BLANK]
Excelsior Funds
Statements of Assets and Liabilities
March 31, 2005
| | | | | | | |
| | |
| | | Blended
Equity
Fund
| | Large Cap
Growth
Fund
| |
ASSETS: | | | | | | | |
Investments, at cost — see accompanying portfolios | | $ | 270,144,781 | | $ | 192,494,826 | |
| | |
|
| |
|
|
|
Investments, at value (including Repurchase Agreements) (Note 1) | | $ | 465,881,113 | | $ | 219,279,574 | |
Cash | | | 21,570 | | | 32 | |
Dividends and interest receivable | | | 654,214 | | | 29,777 | |
Receivable for investments sold | | | — | | | — | |
Receivable for fund shares sold | | | 1,022,580 | | | 261,544 | |
Reclaims receivable | | | 11,497 | | | — | |
| | |
|
| |
|
|
|
Total Assets | | | 467,590,974 | | | 219,570,927 | |
| | |
|
| |
|
|
|
LIABILITIES: | | | | | | | |
Payable for investments purchased | | | — | | | 9,160,635 | |
Cash overdraft | | | — | | | — | |
Options written, at value (Premiums received: Value and Restructuring
Fund — $2,633,972) | | | — | | | — | |
Payable for fund shares redeemed | | | 103,372 | | | 126,410 | |
Investment advisory fees payable (Note 2) | | | 231,379 | | | 98,799 | |
Administration fees payable (Note 2) | | | 61,455 | | | 27,058 | |
Shareholder servicing fees payable (Note 2) | | | 135,991 | | | 22,566 | |
Directors’/Trustees’ fees and expenses payable (Note 2) | | | 94 | | | — | |
Accrued expenses and other payables | | | 155,541 | | | 74,569 | |
| | |
|
| |
|
|
|
Total Liabilities | | | 687,832 | | | 9,510,037 | |
| | |
|
| |
|
|
|
NET ASSETS | | $ | 466,903,142 | | $ | 210,060,890 | |
| | |
|
| |
|
|
|
NET ASSETS consist of: | | | | | | | |
Undistributed net investment income | | $ | 762,218 | | $ | — | |
Accumulated net realized gain (loss) on investments, foreign currency transactions and written options | | | 24,603,801 | | | (138,913,076 | ) |
Unrealized appreciation of investments, foreign currency translations and written options | | | 195,736,332 | | | 26,784,748 | |
Par value (Note 5) | | | 12,926 | | | 26,138 | |
Paid in capital in excess of par value | | | 245,787,865 | | | 322,163,080 | |
| | |
|
| |
|
|
|
Net Assets | | $ | 466,903,142 | | $ | 210,060,890 | |
| | |
|
| |
|
|
|
Net Assets: | | | | | | | |
Shares | | $ | 466,903,142 | | $ | 210,059,749 | |
Institutional Shares | | | — | | | — | |
Retirement Shares | | | — | | | 1,141 | |
Shares outstanding (Note 5): | | | | | | | |
Shares | | | 12,925,520 | | | 26,137,790 | |
Institutional Shares | | | — | | | — | |
Retirement Shares | | | — | | | 142 | |
NET ASSET VALUE PER SHARE (net assets ÷ shares outstanding): | | | | | | | |
Shares | | | $36.12 | | | $8.04 | |
| | |
|
| |
|
|
|
Institutional Shares | | | — | | | — | |
| | |
|
| |
|
|
|
Retirement Shares | | | — | | | $8.02 | |
| | |
|
| |
|
|
|
See Notes to Financial Statements.
48
| | | | | | | | | | | | |
| | | |
Small
Cap
Fund
| | Value and
Restructuring
Fund
| | | Mid Cap
Value
Fund
| | | Energy and
Natural Resources
Fund
|
| | | | | | | | | | | | | |
| $ | 394,992,078 | | $ | 3,410,712,053 | | | $ | 222,373,723 | | | $ | 248,036,455 |
|
| |
|
|
| |
|
|
| |
|
|
| $ | 489,485,673 | | $ | 4,627,490,310 | | | $ | 296,024,691 | | | $ | 307,298,971 |
| | 505 | | | 225,238 | | | | 25,086 | | | | 85 |
| | 33,714 | | | 6,369,844 | | | | 357,646 | | | | 176,185 |
| | — | | | 939,466 | | | | — | | | | 4,546,071 |
| | 485,249 | | | 13,216,442 | | | | 459,092 | | | | 2,143,541 |
| | — | | | — | | | | — | | | | — |
|
| |
|
|
| |
|
|
| |
|
|
| | 490,005,141 | | | 4,648,241,300 | | | | 296,866,515 | | | | 314,164,853 |
|
| |
|
|
| |
|
|
| |
|
|
| | | | | | | | | | | | | |
| | — | | | 7,476,843 | | | | — | | | | 21,071,549 |
| | — | | | — | | | | — | | | | — |
|
— | | | 1,993,420 | | | | — | | | | — |
| | 1,284,309 | | | 3,182,790 | | | | 112,965 | | | | 498,335 |
| | 245,965 | | | 2,377,259 | | | | 146,134 | | | | 135,900 |
| | 64,517 | | | 594,778 | | | | 40,142 | | | | 36,721 |
| | 69,153 | | | 1,364,406 | | | | 117,275 | | | | — |
| | — | | | — | | | | 32 | | | | 109 |
| | 118,675 | | | 1,159,878 | | | | 34,279 | | | | 89,534 |
|
| |
|
|
| |
|
|
| |
|
|
| | 1,782,619 | | | 18,149,374 | | | | 450,827 | | | | 21,832,148 |
|
| |
|
|
| |
|
|
| |
|
|
| $ | 488,222,522 | | $ | 4,630,091,926 | | | $ | 296,415,688 | | | $ | 292,332,705 |
|
| |
|
|
| |
|
|
| |
|
|
| | | | | | | | | | | | | |
| $ | — | | $ | 8,690,692 | | | $ | 388,063 | | | $ | — |
|
19,621,519 | | | (165,739,268 | ) | | | (146,340 | ) | | | 25,356,342 |
|
94,493,595 | | | 1,217,406,843 | | | | 73,650,968 | | | | 59,262,516 |
| | 30,247 | | | 111,826 | | | | 177 | | | | 13,084 |
| | 374,077,161 | | | 3,569,621,833 | | | | 222,522,820 | | | | 207,700,763 |
|
| |
|
|
| |
|
|
| |
|
|
| $ | 488,222,522 | | $ | 4,630,091,926 | | | $ | 296,415,688 | | | $ | 292,332,705 |
|
| |
|
|
| |
|
|
| |
|
|
| | | | | | | | | | | | | |
| $ | 488,221,400 | | $ | 4,469,074,789 | | | $ | 214,844,139 | | | $ | 292,332,705 |
| | — | | | 161,015,995 | | | | 81,570,415 | | | | — |
| | 1,122 | | | 1,142 | | | | 1,134 | | | | — |
| | | | | | | | | | | | | |
| | 30,246,709 | | | 107,937,578 | | | | 12,808,139 | | | | 13,083,766 |
| | — | | | 3,888,844 | | | | 4,852,989 | | | | — |
| | 70 | | | 28 | | | | 68 | | | | — |
| | | | | | | | | | | | | |
| | $16.14 | | | $41.40 | | | | $16.77 | | | | $22.34 |
|
| |
|
|
| |
|
|
| |
|
|
| | — | | | $41.40 | | | | $16.81 | | | | — |
|
| |
|
|
| |
|
|
| |
|
|
| | $16.12 | | | $41.49 | | | | $16.78 | | | | — |
|
| |
|
|
| |
|
|
| |
|
|
See Notes to Financial Statements.
49
Excelsior Funds
Statements of Assets and Liabilities
March 31, 2005
| | | | | | | | |
| | |
| | | Real
Estate
Fund
| | | Equity
Income
Fund
| |
ASSETS: | | | | | | | | |
Investments, at cost — see accompanying portfolios | | $ | 85,472,558 | | | $ | 181,759,238 | |
| | |
|
|
| |
|
|
|
Investments, at value (including Repurchase Agreements) (Note 1) | | $ | 112,695,456 | | | $ | 196,226,021 | |
Cash | | | 261 | | | | — | |
Foreign currency (cost $0, $0, $0, $507,887, $914,240, $286,714 respectively) | | | — | | | | — | |
Dividends receivable | | | 513,995 | | | | 485,575 | |
Receivable for fund shares sold | | | 57,351 | | | | 404,033 | |
Receivable for forward foreign currency contracts | | | — | | | | — | |
Reclaims receivable | | | — | | | | — | |
| | |
|
|
| |
|
|
|
Total Assets | | | 113,267,063 | | | | 197,115,629 | |
| | |
|
|
| |
|
|
|
LIABILITIES: | | | | | | | | |
Payable for investments purchased | | | — | | | | 1,071,256 | |
Cash overdraft | | | — | | | | 35,367 | |
Payable for fund shares redeemed | | | 232,224 | | | | 139,987 | |
Investment advisory fees payable (Note 2) | | | 63,128 | | | | 94,850 | |
Administration fees payable (Note 2) | | | 15,223 | | | | 24,812 | |
Shareholder servicing fees payable (Note 2) | | | 11,379 | | | | 38,068 | |
Accrued expenses and other payables | | | 55,741 | | | | 41,741 | |
| | |
|
|
| |
|
|
|
Total Liabilities | | | 377,695 | | | | 1,446,081 | |
| | |
|
|
| |
|
|
|
NET ASSETS | | $ | 112,889,368 | | | $ | 195,669,548 | |
| | |
|
|
| |
|
|
|
NET ASSETS consist of: | | | | | | | | |
Undistributed (distributions in excess of) net investment income | | $ | (761,948 | ) | | $ | 844,970 | |
Accumulated net realized gain (loss) on investments and foreign currency transactions | | | 7,210,343 | | | | (46,670 | ) |
Unrealized appreciation of investments and foreign currency translations | | | 27,222,898 | | | | 14,466,783 | |
Par value (Note 5) | | | 12,135 | | | | 233 | |
Paid in capital in excess of par value | | | 79,205,940 | | | | 180,404,232 | |
| | |
|
|
| |
|
|
|
Net Assets | | $ | 112,889,368 | | | $ | 195,669,548 | |
| | |
|
|
| |
|
|
|
Net Assets: | | | | | | | | |
Shares | | $ | 112,889,368 | | | $ | 195,668,405 | |
Institutional Shares | | | — | | | | — | |
Retirement Shares | | | — | | | | 1,143 | |
Shares outstanding (Note 5): | | | | | | | | |
Shares | | | 12,134,851 | | | | 23,334,740 | |
Institutional Shares | | | — | | | | — | |
Retirement Shares | | | — | | | | 136 | |
NET ASSET VALUE PER SHARE (net assets ÷ shares outstanding): | | | | | | | | |
Shares | | | $9.30 | | | | $8.39 | |
| | |
|
|
| |
|
|
|
Institutional Shares | | | — | | | | — | |
| | |
|
|
| |
|
|
|
Retirement Shares | | | — | | | | $8.43 | |
| | |
|
|
| |
|
|
|
See Notes to Financial Statements.
50
| | | | | | | | | | | | | |
| | | |
Equity
Core
Fund
| | International
Fund
| | | Pacific/Asia
Fund
| | | Emerging
Markets
Fund
| |
| | | | | | | | | | | | | | |
| $ | 97,336,211 | | $ | 201,850,472 | | | $ | 119,132,240 | | | $ | 364,019,020 | |
|
| |
|
|
| |
|
|
| |
|
|
|
| $ | 97,832,048 | | $ | 238,117,323 | | | $ | 134,379,888 | | | $ | 431,043,439 | |
| | 214,386 | | | — | | | | 572 | | | | 32 | |
| | — | | | 505,071 | | | | 910,394 | | | | 285,532 | |
| | 70,477 | | | 617,404 | | | | 492,000 | | | | 1,397,302 | |
| | 419,000 | | | 1,698,316 | | | | 306,349 | | | | 2,186,124 | |
| | — | | | 355 | | | | — | | | | — | |
| | 6,212 | | | 208,160 | | | | — | | | | 3,121 | |
|
| |
|
|
| |
|
|
| |
|
|
|
| | 98,542,123 | | | 241,146,629 | | | | 136,089,203 | | | | 434,915,550 | |
|
| |
|
|
| |
|
|
| |
|
|
|
| | | | | | | | | | | | | | |
| | 958,864 | | | 238,789 | | | | 1,291,749 | | | | — | |
| | — | | | 39,455 | | | | — | | | | — | |
| | 123,453 | | | 195,387 | | | | 17,393 | | | | 1,092,697 | |
| | 28,797 | | | 192,840 | | | | 102,557 | | | | 341,934 | |
| | 10,652 | | | 41,233 | | | | 23,204 | | | | 74,774 | |
| | 7,225 | | | 10,198 | | | | 12,779 | | | | 35,322 | |
| | 7,499 | | | 106,961 | | | | 62,742 | | | | 202,557 | |
|
| |
|
|
| |
|
|
| |
|
|
|
| | 1,136,490 | | | 824,863 | | | | 1,510,424 | | | | 1,747,284 | |
|
| |
|
|
| |
|
|
| |
|
|
|
| $ | 97,405,633 | | $ | 240,321,766 | | | $ | 134,578,779 | | | $ | 433,168,266 | |
|
| |
|
|
| |
|
|
| |
|
|
|
| | | | | | | | | | | | | | |
| $ | 96,881 | | $ | 886,210 | | | $ | 416,681 | | | $ | 596,420 | |
|
8,255 | | | (100,256,612 | ) | | | (19,855,425 | ) | | | (3,127,534 | ) |
| | 495,790 | | | 36,293,148 | | | | 15,244,513 | | | | 67,027,746 | |
| | 89 | | | 18,411 | | | | 15,150 | | | | 49,631 | |
| | 96,804,618 | | | 303,380,609 | | | | 138,757,860 | | | | 368,622,003 | |
|
| |
|
|
| |
|
|
| |
|
|
|
| $ | 97,405,633 | | $ | 240,321,766 | | | $ | 134,578,779 | | | $ | 433,168,266 | |
|
| |
|
|
| |
|
|
| |
|
|
|
| | | | | | | | | | | | | | |
| $ | 43,579,167 | | $ | 240,321,766 | | | $ | 134,578,779 | | | $ | 433,167,766 | |
| | 53,826,466 | | | — | | | | — | | | | 500 | |
| | — | | | — | | | | — | | | | — | |
| | | | | | | | | | | | | | |
| | 3,969,574 | | | 18,411,250 | | | | 15,150,050 | | | | 49,630,774 | |
| | 4,900,329 | | | — | | | | — | | | | 57 | |
| | — | | | — | | | | — | | | | — | |
| | | | | | | | | | | | | | |
| | $10.98 | | | $13.05 | | | | $8.88 | | | | $8.73 | |
|
| |
|
|
| |
|
|
| |
|
|
|
| | $10.98 | | | — | | | | — | | | | $8.73 | |
|
| |
|
|
| |
|
|
| |
|
|
|
| | — | | | — | | | | — | | | | — | |
|
| |
|
|
| |
|
|
| |
|
|
|
See Notes to Financial Statements.
51
Excelsior Funds
Statements of Operations
For the Year Ended March 31, 2005
| | | | | | | | |
| | |
| | | Blended
Equity
Fund
| | | Large Cap
Growth
Fund
| |
INVESTMENT INCOME: | | | | | | | | |
Dividend income | | $ | 10,330,255 | | | $ | 590,262 | |
Interest income | | | 70,111 | | | | 174,156 | |
Less: Foreign taxes withheld | | | (69,496 | ) | | | (7,944 | ) |
| | |
|
|
| |
|
|
|
Total Income | | | 10,330,870 | | | | 756,474 | |
| | |
|
|
| |
|
|
|
EXPENSES: | | | | | | | | |
Investment advisory fees (Note 2) | | | 4,044,987 | | | | 1,219,255 | |
Shareholder servicing fees — Shares (Note 2) | | | 1,348,329 | | | | 390,189 | |
Shareholder servicing fees — Institutional Shares (Note 2) | | | — | | | | — | |
Administration fees (Note 2) | | | 816,805 | | | | 246,253 | |
Transfer agent fees | | | 173,889 | | | | 117,084 | |
Legal and audit fees | | | 123,835 | | | | 49,192 | |
Re-audit expenses (Note 2) | | | 45,293 | | | | 16,450 | |
Custodian fees | | | 22,499 | | | | 7,370 | |
Registration and filing fees | | | 22,895 | | | | 16,232 | |
Shareholder reports | | | 36,442 | | | | 12,458 | |
Directors’/Trustees’ fees and expenses (Note 2) | | | 14,884 | | | | 4,114 | |
Miscellaneous expenses | | | 30,237 | | | | 10,199 | |
| | |
|
|
| |
|
|
|
Total Expenses | | | 6,680,095 | | | | 2,088,796 | |
| | |
|
|
| |
|
|
|
Fees waived and reimbursed by: | | | | | | | | |
Investment Adviser (Note 2) | | | (867,936 | ) | | | (339,084 | ) |
Administrator (Note 2) | | | (92,015 | ) | | | (23,079 | ) |
Re-audit expenses paid by Investment Adviser (Note 2) | | | (45,293 | ) | | | (16,450 | ) |
| | |
|
|
| |
|
|
|
Net Expenses | | | 5,674,851 | | | | 1,710,183 | |
| | |
|
|
| |
|
|
|
NET INVESTMENT INCOME (LOSS) | | | 4,656,019 | | | | (953,709 | ) |
| | |
|
|
| |
|
|
|
REALIZED AND UNREALIZED GAIN (LOSS) ON INVESTMENTS (Note 1): | | | | | | | | |
Net realized gain (loss) on: | | | | | | | | |
Security transactions | | | 61,371,061 | | | | (480,165 | ) |
Foreign currency transactions | | | — | | | | — | |
Written Options | | | — | | | | — | |
| | |
|
|
| |
|
|
|
Total net realized gain (loss) | | | 61,371,061 | | | | (480,165 | ) |
Change in unrealized appreciation (depreciation) of investments, foreign currency translations and written options during the year | | | (19,164,776 | ) | | | 7,803,728 | |
| | |
|
|
| |
|
|
|
Net realized and unrealized gain on investments, foreign currency transactions and written options | | | 42,206,285 | | | | 7,323,563 | |
| | |
|
|
| |
|
|
|
Net increase in net assets resulting from operations | | $ | 46,862,304 | | | $ | 6,369,854 | |
| | |
|
|
| |
|
|
|
See Notes to Financial Statements.
52
| | | | | | | | | | | | | | |
| | | |
Small
Cap
Fund
| | | Value and
Restructuring
Fund
| | | Mid Cap
Value
Fund
| | | Energy and
Natural Resources
Fund
| |
| | | | | | | | | | | | | | | |
| $ | 1,684,223 | | | $ | 74,083,694 | | | $ | 7,606,258 | | | $ | 2,252,880 | |
| | 109,944 | | | | 844,797 | | | | 52,134 | | | | 114,928 | |
| | — | | | | (844,437 | ) | | | (66,107 | ) | | | (36,609 | ) |
|
|
| |
|
|
| |
|
|
| |
|
|
|
| | 1,794,167 | | | | 74,084,054 | | | | 7,592,285 | | | | 2,331,199 | |
|
|
| |
|
|
| |
|
|
| |
|
|
|
| | | | | | | | | | | | | | | |
| | 2,664,033 | | | | 22,824,694 | | | | 1,982,815 | | | | 1,149,750 | |
| | 1,066,294 | | | | 9,095,957 | | | | 501,132 | | | | 402,275 | |
| | — | | | | — | | | | 78,304 | | | | — | |
| | 672,219 | | | | 5,757,405 | | | | 462,079 | | | | 290,241 | |
| | 130,165 | | | | 1,733,417 | | | | 114,517 | | | | 205,095 | |
| | 109,864 | | | | 801,738 | | | | 85,678 | | | | 56,141 | |
| | 35,165 | | | | 267,371 | | | | 27,416 | | | | 21,312 | |
| | 13,800 | | | | 172,635 | | | | 14,936 | | | | 11,101 | |
| | 27,446 | | | | 100,852 | | | | 38,415 | | | | 21,950 | |
| | 34,698 | | | | 373,999 | | | | 30,099 | | | | 25,651 | |
| | 11,950 | | | | 98,402 | | | | 12,616 | | | | 4,951 | |
| | 26,649 | | | | 212,159 | | | | 18,999 | | | | 12,053 | |
|
|
| |
|
|
| |
|
|
| |
|
|
|
| | 4,792,283 | | | | 41,438,629 | | | | 3,367,006 | | | | 2,200,520 | |
|
|
| |
|
|
| |
|
|
| |
|
|
|
| | | | | | | | | | | | | | | |
| | (56,545 | ) | | | — | | | | (222,455 | ) | | | (50,164 | ) |
| | (63,801 | ) | | | (557,110 | ) | | | (47,237 | ) | | | (26,487 | ) |
| | (35,165 | ) | | | (267,371 | ) | | | (27,416 | ) | | | (21,312 | ) |
|
|
| |
|
|
| |
|
|
| |
|
|
|
| | 4,636,772 | | | | 40,614,148 | | | | 3,069,898 | | | | 2,102,557 | |
|
|
| |
|
|
| |
|
|
| |
|
|
|
| | (2,842,605 | ) | | | 33,469,906 | | | | 4,522,387 | | | | 228,642 | |
|
|
| |
|
|
| |
|
|
| |
|
|
|
| | | | | | | | | | | | | | | |
| | | | | | | | | | | | | | | |
| | 31,179,377 | | | | 25,789,853 | | | | 12,483,472 | | | | 43,589,108 | |
| | — | | | | 101 | | | | 2,133 | | | | — | |
| | — | | | | 2,015,708 | | | | — | | | | — | |
|
|
| |
|
|
| |
|
|
| |
|
|
|
| | 31,179,377 | | | | 27,805,662 | | | | 12,485,605 | | | | 43,589,108 | |
|
15,666,672 |
| | | 348,650,183 | | | | 10,433,850 | | | | 27,931,944 | |
|
|
| |
|
|
| |
|
|
| |
|
|
|
| | | |
| | 46,846,049 | | | | 376,455,845 | | | | 22,919,455 | | | | 71,521,052 | |
|
|
| |
|
|
| |
|
|
| |
|
|
|
| $ | 44,003,444 | | | $ | 409,925,751 | | | $ | 27,441,842 | | | $ | 71,749,694 | |
|
|
| |
|
|
| |
|
|
| |
|
|
|
See Notes to Financial Statements.
53
Excelsior Funds
Statements of Operations
For the Year Ended March 31, 2005
| | | | | | | | |
| | |
| | | Real
Estate
Fund
| | | Equity
Income
Fund
| |
INVESTMENT INCOME: | | | | | | | | |
Dividend income | | $ | 3,560,552 | | | $ | 4,843,173 | |
Interest income | | | 48,701 | | | | 96,677 | |
Less: Foreign taxes withheld | | | (538 | ) | | | (4,740 | ) |
| | |
|
|
| |
|
|
|
Total Income | | | 3,608,715 | | | | 4,935,110 | |
| | |
|
|
| |
|
|
|
EXPENSES: | | | | | | | | |
Investment advisory fees (Note 2) | | | 1,166,576 | | | | 1,085,612 | |
Shareholder servicing fees — Shares (Note 2) | | | 279,978 | | | | 361,876 | |
Administration fees (Note 2) | | | 176,766 | | | | 219,261 | |
Transfer agent fees | | | 79,112 | | | | 22,399 | |
Legal and audit fees | | | 51,852 | | | | 44,160 | |
Re-audit expenses (Note 2) | | | 14,804 | | | | 13,030 | |
Custodian fees | | | 5,647 | | | | 11,217 | |
Registration and filing fees | | | 18,038 | | | | 21,792 | |
Shareholder reports | | | 13,502 | | | | 7,838 | |
Directors’/Trustees’ fees and expenses (Note 2) | | | 3,235 | | | | 5,788 | |
Amortization of offering costs | | | — | | | | 34,348 | |
Miscellaneous expenses | | | 8,138 | | | | 9,664 | |
| | |
|
|
| |
|
|
|
Total Expenses | | | 1,817,648 | | | | 1,836,985 | |
| | |
|
|
| |
|
|
|
Fees waived and reimbursed by: | | | | | | | | |
Investment Adviser (Note 2) | | | (382,293 | ) | | | (281,616 | ) |
Administrator (Note 2) | | | (17,826 | ) | | | (19,651 | ) |
Re-audit expenses paid by Investment Adviser (Note 2) | | | (14,804 | ) | | | (13,030 | ) |
| | |
|
|
| |
|
|
|
Net Expenses | | | 1,402,725 | | | | 1,522,688 | |
| | |
|
|
| |
|
|
|
NET INVESTMENT INCOME | | | 2,205,990 | | | | 3,412,422 | |
| | |
|
|
| |
|
|
|
REALIZED AND UNREALIZED GAIN (LOSS) ON INVESTMENTS (Note 1): | | | | | | | | |
Net realized gain (loss) on: | | | | | | | | |
Security transactions | | | 11,012,821 | | | | (45,295 | ) |
Foreign currency transactions | | | — | | | | 914 | |
| | |
|
|
| |
|
|
|
Total net realized gain (loss) | | | 11,012,821 | | | | (44,381 | ) |
Change in unrealized appreciation (depreciation) of investments and foreign currency translations during the year | | | (2,363,716 | ) | | | 11,960,531 | |
| | |
|
|
| |
|
|
|
Net realized and unrealized gain (loss) on investments and foreign currency transactions | | | 8,649,105 | | | | 11,916,150 | |
| | |
|
|
| |
|
|
|
Net increase (decrease) in net assets resulting from operations | | $ | 10,855,095 | | | $ | 15,328,572 | |
| | |
|
|
| |
|
|
|
See Notes to Financial Statements.
54
| | | | | | | | | | | | | | |
| | | |
Equity
Core
Fund
| | | International
Fund
| | | Pacific/Asia
Fund
| | | Emerging
Markets
Fund
| |
| | | | | | | | | | | | | | | |
| $ | 326,946 | | | $ | 3,984,047 | | | $ | 2,322,429 | | | $ | 8,674,950 | |
| | 40,473 | | | | 78,222 | | | | 44,571 | | | | 260,121 | |
| | (8,499 | ) | | | (421,390 | ) | | | (161,648 | ) | | | (905,665 | ) |
|
|
| |
|
|
| |
|
|
| |
|
|
|
| | 358,920 | | | | 3,640,879 | | | | 2,205,352 | | | | 8,029,406 | |
|
|
| |
|
|
| |
|
|
| |
|
|
|
| | | | | | | | | | | | | | | |
| | 150,883 | | | | 1,794,657 | | | | 1,182,559 | | | | 3,184,179 | |
| | 7,876 | | | | 412,774 | | | | 283,814 | | | | 498,102 | |
| | 30,439 | | | | 358,933 | | | | 236,513 | | | | 509,471 | |
| | 11,690 | | | | 88,880 | | | | 47,956 | | | | 166,337 | |
| | 12,695 | | | | 54,127 | | | | 39,915 | | | | 70,543 | |
| | 3,293 | | | | 14,282 | | | | 12,878 | | | | 19,703 | |
| | 5,256 | | | | 121,579 | | | | 95,335 | | | | 339,238 | |
| | 3,438 | | | | 23,700 | | | | 18,656 | | | | 30,458 | |
| | 4,217 | | | | 17,595 | | | | 9,566 | | | | 18,026 | |
| | 397 | | | | 4,592 | | | | 2,991 | | | | 5,677 | |
| | 74,592 | | | | — | | | | — | | | | — | |
| | 2,552 | | | | 18,547 | | | | 11,471 | | | | 18,987 | |
|
|
| |
|
|
| |
|
|
| |
|
|
|
| | 307,328 | | | | 2,909,666 | | | | 1,941,654 | | | | 4,860,721 | |
|
|
| |
|
|
| |
|
|
| |
|
|
|
| | | | | | | | | | | | | | | |
| | (100,187 | ) | | | (172,930 | ) | | | (132,880 | ) | | | (472,863 | ) |
| | (1,008 | ) | | | (25,422 | ) | | | (18,554 | ) | | | (30,644 | ) |
| | (3,293 | ) | | | (14,282 | ) | | | (12,878 | ) | | | (19,703 | ) |
|
|
| |
|
|
| |
|
|
| |
|
|
|
| | 202,840 | | | | 2,697,032 | | | | 1,777,342 | | | | 4,337,511 | |
|
|
| |
|
|
| |
|
|
| |
|
|
|
| | 156,080 | | | | 943,847 | | | | 428,010 | | | | 3,691,895 | |
|
|
| |
|
|
| |
|
|
| |
|
|
|
| | | | | | | | | | | | | | | |
| | | | | | | | | | | | | | | |
| | 20,575 | | | | 21,637,973 | | | | 9,817,779 | | | | 8,135,660 | |
| | (2,893 | ) | | | (54,499 | ) | | | (4,656 | ) | | | (5,147 | ) |
|
|
| |
|
|
| |
|
|
| |
|
|
|
| | 17,682 | | | | 21,583,474 | | | | 9,813,123 | | | | 8,130,513 | |
|
495,790 |
| | | 7,900,777 | | | | (3,876,768 | ) | | | 23,888,849 | |
|
|
| |
|
|
| |
|
|
| |
|
|
|
|
513,472 |
| | | 29,484,251 | | | | 5,936,355 | | | | 32,019,362 | |
|
|
| |
|
|
| |
|
|
| |
|
|
|
| $ | 669,552 | | | $ | 30,428,098 | | | $ | 6,364,365 | | | $ | 35,711,257 | |
|
|
| |
|
|
| |
|
|
| |
|
|
|
See Notes to Financial Statements.
55
Excelsior Funds
Statements of Changes in Net Assets
| | | | | | | | | | | | | | | | |
| | |
| | |
Blended Equity Fund
| | |
Large Cap Growth Fund
| |
| | | Year Ended March 31,
| | | Year Ended March 31,
| |
| | | 2005
| | | 2004
| | | 2005
| | | 2004
| |
Net investment income (loss) | | $ | 4,656,019 | | | $ | 2,526,256 | | | $ | (953,709 | ) | | $ | (733,372 | ) |
Net realized gain (loss) on investments and foreign currency transactions | | | 61,371,061 | | | | 10,797,205 | | | | (480,165 | ) | | | (1,591,302 | ) |
Net realized gain (loss) on written options | | | — | | | | — | | | | — | | | | — | |
Change in unrealized appreciation (depreciation) of investments, foreign currency translations and written options during the year | | | (19,164,776 | ) | | | 135,044,927 | | | | 7,803,728 | | | | 28,354,319 | |
| | |
|
|
| |
|
|
| |
|
|
| |
|
|
|
Net increase in net assets resulting from operations | | | 46,862,304 | | | | 148,368,388 | | | | 6,369,854 | | | | 26,029,645 | |
| | |
|
|
| |
|
|
| |
|
|
| |
|
|
|
Distributions to shareholders: | | | | | | | | | | | | | | | | |
From net investment income | | | | | | | | | | | | | | | | |
Shares | | | (4,368,038 | ) | | | (2,883,929 | ) | | | — | | | | — | |
Institutional Shares | | | — | | | | — | | | | — | | | | — | |
From net realized gain on investments | | | | | | | | | | | | | | | | |
Shares | | | (3,153,196 | ) | | | — | | | | — | | | | — | |
| | |
|
|
| |
|
|
| |
|
|
| |
|
|
|
Total distributions | | | (7,521,234 | ) | | | (2,883,929 | ) | | | — | | | | — | |
| | |
|
|
| |
|
|
| |
|
|
| |
|
|
|
Increase (decrease) in net assets from fund share transactions (Note 5) | | | | | | | | | | | | | | | | |
Shares | | | (145,679,465 | ) | | | (41,255,598 | ) | | | 76,459,149 | | | | 27,306,627 | |
Institutional Shares | | | — | | | | — | | | | — | | | | — | |
Retirement Shares | | | — | | | | — | | | | 1,150 | | | | — | |
| | |
|
|
| |
|
|
| |
|
|
| |
|
|
|
Total from fund share transactions | | | (145,679,465 | ) | | | (41,255,598 | ) | | | 76,460,299 | | | | 27,306,627 | |
| | |
|
|
| |
|
|
| |
|
|
| |
|
|
|
Net increase (decrease) in net assets | | | (106,338,395 | ) | | | 104,228,861 | | | | 82,830,153 | | | | 53,336,272 | |
| | |
|
|
| |
|
|
| |
|
|
| |
|
|
|
NET ASSETS: | | | | | | | | | | | | | | | | |
Beginning of year | | | 573,241,537 | | | | 469,012,676 | | | | 127,230,737 | | | | 73,894,465 | |
| | |
|
|
| |
|
|
| |
|
|
| |
|
|
|
End of year(1) | | $ | 466,903,142 | | | $ | 573,241,537 | | | $ | 210,060,890 | | | $ | 127,230,737 | |
| | |
|
|
| |
|
|
| |
|
|
| |
|
|
|
(1) Including undistributed net investment income | | $ | 762,218 | | | $ | 474,237 | | | $ | — | | | $ | — | |
| | |
|
|
| |
|
|
| |
|
|
| |
|
|
|
See Notes to Financial Statements.
56
| | | | | | | | | | | | | | | | | | | | | | | | | | | | | | |
| | | |
Small Cap Fund
| | | Value and Restructuring Fund
| | | Mid Cap Value Fund
| | | Energy and Natural
Resources Fund
| |
Year Ended March 31,
| | | Year Ended March 31,
| | | Year Ended March 31,
| | | Year Ended March 31,
| |
2005
| | | 2004
| | | 2005
| | | 2004
| | | 2005
| | | 2004
| | | 2005
| | | 2004
| |
| $ | (2,842,605 | ) | | $ | (541,330 | ) | | $ | 33,469,906 | | | $ | 18,590,937 | | | $ | 4,522,387 | | | $ | 637,981 | | | $ | 228,642 | | | $ | 523,355 | |
|
31,179,377 |
| | | 31,762,314 | | | | 25,789,954 | | | | 26,130,547 | | | | 12,485,605 | | | | 3,623,320 | | | | 43,589,108 | | | | 8,036,767 | |
| | — | | | | — | | | | 2,015,708 | | | | (1,694,222 | ) | | | — | | | | — | | | | — | | | | — | |
|
15,666,672 |
| | | 99,769,816 | | | | 348,650,183 | | | | 978,738,539 | | | | 10,433,850 | | | | 74,173,832 | | | | 27,931,944 | | | | 30,299,792 | |
|
|
| |
|
|
| |
|
|
| |
|
|
| |
|
|
| |
|
|
| |
|
|
| |
|
|
|
| | 44,003,444 | | | | 130,990,800 | | | | 409,925,751 | | | | 1,021,765,801 | | | | 27,441,842 | | | | 78,435,133 | | | | 71,749,694 | | | | 38,859,914 | |
|
|
| |
|
|
| |
|
|
| |
|
|
| |
|
|
| |
|
|
| |
|
|
| |
|
|
|
| | | | | | | | | | | | | | | | | | | | | | | | | | | | | | | |
| | | | | | | | | | | | | | | | | | | | | | | | | | | | | | | |
| | — | | | | — | | | | (31,399,379 | ) | | | (16,015,057 | ) | | | (2,985,864 | ) | | | (306,909 | ) | | | (465,778 | ) | | | (355,796 | ) |
| | — | | | | — | | | | (542,162 | ) | | | (230,193 | ) | | | (1,745,081 | ) | | | (226,937 | ) | | | — | | | | — | |
| | | | | | | | | | | | | | | | | | | | | | | | | | | | | | | |
| | — | | | | — | | | | — | | | | — | | | | — | | | | — | | | | (10,741,372 | ) | | | — | |
|
|
| |
|
|
| |
|
|
| |
|
|
| |
|
|
| |
|
|
| |
|
|
| |
|
|
|
| | — | | | | — | | | | (31,941,541 | ) | | | (16,245,250 | ) | | | (4,730,945 | ) | | | (533,846 | ) | | | (11,207,150 | ) | | | (355,796 | ) |
|
|
| |
|
|
| |
|
|
| |
|
|
| |
|
|
| |
|
|
| |
|
|
| |
|
|
|
| | | | | | | | | | | | | | | | | | | | | | | | | | | | | | | |
| | 91,761,412 | | | | 65,141,731 | | | | 850,392,716 | | | | 691,737,456 | | | | 14,044,442 | | | | 51,526,480 | | | | 81,754,770 | | | | 19,090,869 | |
| | — | | | | — | | | | 118,620,109 | | | | 27,115,289 | | | | (27,789,884 | ) | | | 31,858,348 | | | | — | | | | — | |
| | 1,150 | | | | — | | | | 1,089 | | | | — | | | | 1,151 | | | | — | | | | — | | | | — | |
|
|
| |
|
|
| |
|
|
| |
|
|
| |
|
|
| |
|
|
| |
|
|
| |
|
|
|
| | 91,762,562 | | | | 65,141,731 | | | | 969,013,914 | | | | 718,852,745 | | | | (13,744,291 | ) | | | 83,384,828 | | | | 81,754,770 | | | | 19,090,869 | |
|
|
| |
|
|
| |
|
|
| |
|
|
| |
|
|
| |
|
|
| |
|
|
| |
|
|
|
| | 135,766,006 | | | | 196,132,531 | | | | 1,346,998,124 | | | | 1,724,373,296 | | | | 8,966,606 | | | | 161,286,115 | | | | 142,297,314 | | | | 57,594,987 | |
|
|
| |
|
|
| |
|
|
| |
|
|
| |
|
|
| |
|
|
| |
|
|
| |
|
|
|
| | | | | | | | | | | | | | | | | | | | | | | | | | | | | | | |
| | 352,456,516 | | | | 156,323,985 | | | | 3,283,093,802 | | | | 1,558,720,506 | | | | 287,449,082 | | | | 126,162,967 | | | | 150,035,391 | | | | 92,440,404 | |
|
|
| |
|
|
| |
|
|
| |
|
|
| |
|
|
| |
|
|
| |
|
|
| |
|
|
|
| | $488,222,522 | | | $ | 352,456,516 | | | $ | 4,630,091,926 | | | $ | 3,283,093,802 | | | $ | 296,415,688 | | | $ | 287,449,082 | | | $ | 292,332,705 | | | $ | 150,035,391 | |
|
|
| |
|
|
| |
|
|
| |
|
|
| |
|
|
| |
|
|
| |
|
|
| |
|
|
|
| $ | — | | | $ | — | | | $ | 8,690,692 | | | $ | 6,850,019 | | | $ | 388,063 | | | $ | 232,080 | | | $ | — | | | $ | 206,066 | |
|
|
| |
|
|
| |
|
|
| |
|
|
| |
|
|
| |
|
|
| |
|
|
| |
|
|
|
See Notes to Financial Statements.
57
Excelsior Funds
Statements of Changes in Net Assets
| | | | | | | | | | | | | | | | |
| | |
| | | Real Estate Fund
| | | Equity Income Fund
| |
| | | Year Ended March 31,
| | | Year Ended
March 31,
| | | Period Ended
March 31,
| |
| | | 2005
| | | 2004
| | | 2005
| | | 2004*
| |
Net investment income | | $ | 2,205,990 | | | $ | 3,597,428 | | | $ | 3,412,422 | | | $ | 624,670 | |
Net realized gain (loss) on investments and foreign currency transactions | | | 11,012,821 | | | | 6,155,479 | | | | (44,381 | ) | | | 356,963 | |
Change in unrealized appreciation (depreciation) of investments and foreign currency translations during the year | | | (2,363,716 | ) | | | 27,077,288 | | | | 11,960,531 | | | | 2,506,252 | |
| | |
|
|
| |
|
|
| |
|
|
| |
|
|
|
Net increase (decrease) in net assets resulting from operations | | | 10,855,095 | | | | 36,830,195 | | | | 15,328,572 | | | | 3,487,885 | |
| | |
|
|
| |
|
|
| |
|
|
| |
|
|
|
Distributions to shareholders: | | | | | | | | | | | | | | | | |
From net investment income | | | | | | | | | | | | | | | | |
Shares | | | (2,975,084 | ) | | | (3,935,500 | ) | | | (3,002,218 | ) | | | (219,601 | ) |
From net realized gain on investments | | | | | | | | | | | | | | | | |
Shares | | | (6,547,304 | ) | | | (734,269 | ) | | | (358,338 | ) | | | — | |
| | |
|
|
| |
|
|
| |
|
|
| |
|
|
|
Total distributions | | | (9,522,388 | ) | | | (4,669,769 | ) | | | (3,360,556 | ) | | | (219,601 | ) |
| | |
|
|
| |
|
|
| |
|
|
| |
|
|
|
Increase (decrease) in net assets from fund share transactions (Note 5): | | | | | | | | | | | | | | | | |
Shares | | | (11,317,823 | ) | | | 11,339,921 | | | | 83,676,030 | | | | 96,756,067 | |
Institutional Shares | | | — | | | | — | | | | — | | | | — | |
Retirement Shares | | | — | | | | — | | | | 1,151 | | | | — | |
| | |
|
|
| |
|
|
| |
|
|
| |
|
|
|
Total from fund share transactions | | | (11,317,823 | ) | | | 11,339,921 | | | | 83,677,181 | | | | 96,756,067 | |
| | |
|
|
| |
|
|
| |
|
|
| |
|
|
|
Net increase (decrease) in net assets | | | (9,985,116 | ) | | | 43,500,347 | | | | 95,645,197 | | | | 100,024,351 | |
| | |
|
|
| |
|
|
| |
|
|
| |
|
|
|
NET ASSETS: | | | | | | | | | | | | | | | | |
Beginning of year | | | 122,874,484 | | | | 79,374,137 | | | | 100,024,351 | | | | — | |
| | |
|
|
| |
|
|
| |
|
|
| |
|
|
|
End of year(1) | | $ | 112,889,368 | | | $ | 122,874,484 | | | $ | 195,669,548 | | | $ | 100,024,351 | |
| | |
|
|
| |
|
|
| |
|
|
| |
|
|
|
(1) Including undistributed (distributions in excess of) net investment income | | $ | (761,948 | ) | | $ | 622,225 | | | $ | 844,970 | | | $ | 433,852 | |
| | |
|
|
| |
|
|
| |
|
|
| |
|
|
|
| * | | Equity Income Fund commenced operations on September 30, 2003. |
| ** | | Equity Core Fund commenced operations on March 31, 2004. |
See Notes to Financial Statements.
58
| | | | | | | | | | | | | | | | | | | | | | | | | | | | |
| | | |
Equity Core Fund
| | International Fund
| | | Pacific/Asia Fund
| | Emerging Markets Fund
| |
Year Ended
March 31,
| | | Period Ended
March 31,
| | Year Ended March 31,
| | | Year Ended March 31,
| | Year Ended March 31,
| |
2005
| | | 2004**
| | 2005
| | | 2004
| | | 2005
| | | 2004
| | 2005
| | | 2004
| |
| $ | 156,080 | | | $ | — | | $ | 943,847 | | | $ | 988,225 | | | $ | 428,010 | | | $ | 121,228 | | $ | 3,691,895 | | | $ | 776,071 | |
|
17,682 |
| | | — | | | 21,583,474 | | | | (2,852,794 | ) | | | 9,813,123 | | | | 3,252,695 | | | 8,130,513 | | | | 1,657,874 | |
|
495,790 |
| | | — | | | 7,900,777 | | | | 54,917,465 | | | | (3,876,768 | ) | | | 22,866,250 | | | 23,888,849 | | | | 47,032,218 | |
|
|
| |
|
| |
|
|
| |
|
|
| |
|
|
| |
|
| |
|
|
| |
|
|
|
|
669,552 |
| | | — | | | 30,428,098 | | | | 53,052,896 | | | | 6,364,365 | | | | 26,240,173 | | | 35,711,257 | | | | 49,466,163 | |
|
|
| |
|
| |
|
|
| |
|
|
| |
|
|
| |
|
| |
|
|
| |
|
|
|
| | | | | | | | | | | | | | | | | | | | | | | | | | | | | |
| | | | | | | | | | | | | | | | | | | | | | | | | | | | | |
| | (56,745 | ) | | | — | | | (29,357 | ) | | | (926,946 | ) | | | (112,049 | ) | | | — | | | (3,087,200 | ) | | | (925,467 | ) |
| | | | | | | | | | | | | | | | | | | | | | | | | | | | | |
| | (12,320 | ) | | | — | | | — | | | | — | | | | — | | | | — | | | (5,580,183 | ) | | | — | |
|
|
| |
|
| |
|
|
| |
|
|
| |
|
|
| |
|
| |
|
|
| |
|
|
|
| | (69,065 | ) | | | — | | | (29,357 | ) | | | (926,946 | ) | | | (112,049 | ) | | | — | | | (8,667,383 | ) | | | (925,467 | ) |
|
|
| |
|
| |
|
|
| |
|
|
| |
|
|
| |
|
| |
|
|
| |
|
|
|
| | | | | | | | | | | | | | | | | | | | | | | | | | | | | |
| | 41,347,713 | | | | 100 | | | 79,780,442 | | | | (11,662,599 | ) | | | 13,496,301 | | | | 61,259,593 | | | 196,962,705 | | | | 130,571,102 | |
| | 55,457,333 | | | | — | | | — | | | | — | | | | — | | | | — | | | 500 | | | | — | |
| | — | | | | — | | | — | | | | — | | | | — | | | | — | | | — | | | | — | |
|
|
| |
|
| |
|
|
| |
|
|
| |
|
|
| |
|
| |
|
|
| |
|
|
|
| | 96,805,046 | | | | 100 | | | 79,780,442 | | | | (11,662,599 | ) | | | 13,496,301 | | | | 61,259,593 | | | 196,963,205 | | | | 130,571,102 | |
|
|
| |
|
| |
|
|
| |
|
|
| |
|
|
| |
|
| |
|
|
| |
|
|
|
| | 97,405,533 | | | | 100 | | | 110,179,183 | | | | 40,463,351 | | | | 19,748,617 | | | | 87,499,766 | | | 224,007,079 | | | | 179,111,798 | |
|
|
| |
|
| |
|
|
| |
|
|
| |
|
|
| |
|
| |
|
|
| |
|
|
|
| | | | | | | | | | | | | | | | | | | | | | | | | | | | | |
| | 100 | | | | — | | | 130,142,583 | | | | 89,679,232 | | | | 114,830,162 | | | | 27,330,396 | | | 209,161,187 | | | | 30,049,389 | |
|
|
| |
|
| |
|
|
| |
|
|
| |
|
|
| |
|
| |
|
|
| |
|
|
|
| | $97,405,633 | | | $ | 100 | | $ | 240,321,766 | | | $ | 130,142,583 | | | $ | 134,578,779 | | | $ | 114,830,162 | | $ | 433,168,266 | | | $ | 209,161,187 | |
|
|
| |
|
| |
|
|
| |
|
|
| |
|
|
| |
|
| |
|
|
| |
|
|
|
| | | | | | | | | | | | | | | | | | | | | | | | | | | | | |
| $ | 96,881 | | | $ | 100 | | $ | 886,210 | | | $ | 27,632 | | | $ | 416,681 | | | $ | 105,379 | | $ | 596,420 | | | $ | — | |
|
|
| |
|
| |
|
|
| |
|
|
| |
|
|
| |
|
| |
|
|
| |
|
|
|
See Notes to Financial Statements.
59
Excelsior Funds
Financial Highlights — Selected Per Share Data and Ratios
| | | | | | | | | | | | | | | | | | | | | | | |
| | | | | | |
| | | Net Asset Value,
Beginning of
Year
| | Net
Investment
Income (Loss)
| | | Net Realized and
Unrealized Gain (Loss)
of Investments and
Options
| | | Total From
Investment
Operations
| | | Dividends
From Net
Investment
Income
| | | Distributions From
Net Realized Gain
on Investments
and Options
| |
BLENDED EQUITY FUND | | | | | | | | | | | | | | | | | | | | | | | |
Shares — (04/25/85*) | | | | | | | | | | | | | | | | | | | | | | | |
Year Ended March 31, | | | | | | | | | | | | | | | | | | | | | | | |
2005 | | $ | 33.64 | | $ | 0.30 | (2) | | $ | 2.66 | (2) | | $ | 2.96 | | | $ | (0.28 | ) | | $ | (0.20 | ) |
2004 | | | 25.67 | | | 0.14 | | | | 7.99 | | | | 8.13 | | | | (0.16 | ) | | | — | |
2003 | | | 35.17 | | | 0.17 | | | | (7.97 | ) | | | (7.80 | ) | | | (0.15 | ) | | | (1.55 | ) |
2002 | | | 35.99 | | | 0.10 | | | | (0.67 | ) | | | (0.57 | ) | | | (0.08 | ) | | | (0.17 | ) |
2001 | | | 50.63 | | | 0.01 | | | | (13.31 | ) | | | (13.30 | ) | | | (0.01 | ) | | | (1.33 | ) |
LARGE CAP GROWTH FUND | | | | | | | | | | | | | | | | | | | | |
Shares — (10/01/97*) | | | | | | | | | | | | | | | | | | | | | | | |
Year Ended March 31, | | | | | | | | | | | | | | | | | | | | | | | |
2005 | | $ | 7.71 | | $ | (0.05 | )(2) | | $ | 0.38 | (2) | | $ | 0.33 | | | | — | | | | — | |
2004 | | | 5.79 | | | (0.05 | )(2) | | | 1.97 | (2) | | | 1.92 | | | | — | | | | — | |
2003 | | | 8.83 | | | (0.01 | )(2) | | | (3.03 | )(2) | | | (3.04 | ) | | | — | | | | — | |
2002 | | | 10.06 | | | (0.06 | ) | | | (1.17 | ) | | | (1.23 | ) | | | — | | | | — | |
2001 | | | 18.98 | | | (0.08 | ) | | | (8.84 | ) | | | (8.92 | ) | | | — | | | | — | |
SMALL CAP FUND | | | | | | | | | | | | | | | | | | | | | | | |
Shares — (12/31/92*) | | | | | | | | | | | | | | | | | | | | | | | |
Year Ended March 31, | | | | | | | | | | | | | | | | | | | | | | | |
2005 | | $ | 14.59 | | $ | (0.10 | )(2) | | $ | 1.65 | (2) | | $ | 1.55 | | | | — | | | | — | |
2004 | | | 8.47 | | | (0.02 | )(2) | | | 6.14 | (2) | | | 6.12 | | | | — | | | | — | |
2003 | | | 12.19 | | | (0.03 | )(2) | | | (3.69 | )(2) | | | (3.72 | ) | | | — | | | | — | |
2002 | | | 10.06 | | | 0.03 | | | | 2.14 | | | | 2.17 | | | $ | (0.04 | )(3) | | | — | |
2001 | | | 15.39 | | | 0.07 | | | | (4.41 | ) | | | (4.34 | ) | | | (0.07 | ) | | $ | (0.92 | ) |
VALUE AND RESTRUCTURING FUND | | | | | | | | | | | | | | | | | | | | |
Shares — (12/31/92*) | | | | | | | | | | | | | | | | | | | | | | | |
Year Ended March 31, | | | | | | | | | | | | | | | | | | | | | | | |
2005 | | $ | 37.57 | | $ | 0.34 | (2) | | $ | 3.83 | (2) | | $ | 4.17 | | | $ | (0.34 | ) | | | — | |
2004 | | | 23.66 | | | 0.24 | | | | 13.90 | | | | 14.14 | | | | (0.23 | ) | | | — | |
2003 | | | 32.63 | | | 0.17 | | | | (9.01 | ) | | | (8.84 | ) | | | (0.13 | ) | | | — | |
2002 | | | 30.69 | | | 0.08 | | | | 1.94 | | | | 2.02 | | | | (0.08 | ) | | | — | |
2001 | | | 33.89 | | | 0.60 | | | | (3.21 | ) | | | (2.61 | ) | | | (0.59 | ) | | | — | |
MID CAP VALUE FUND | | | | | | | | | | | | | | | | | | | | | | | |
Shares — (06/01/96*) | | | | | | | | | | | | | | | | | | | | | | | |
Year Ended March 31, | | | | | | | | | | | | | | | | | | | | | | | |
2005 | | $ | 15.75 | | $ | 0.23 | (2) | | $ | 1.02 | (2) | | $ | 1.25 | | | $ | (0.23 | ) | | | — | |
2004 | | | 10.24 | | | 0.03 | (2) | | | 5.51 | (2) | | | 5.54 | | | | (0.03 | ) | | | — | |
2003 | | | 13.29 | | | 0.02 | (2) | | | (3.05 | )(2) | | | (3.03 | ) | | | (0.02 | ) | | | — | |
2002 | | | 11.99 | | | 0.27 | (2) | | | 1.41 | (2) | | | 1.68 | | | | (0.02 | ) | | $ | (0.36 | ) |
2001 | | | 21.34 | | | 0.37 | | | | (1.27 | ) | | | (0.90 | ) | | | (0.37 | ) | | | (8.08 | ) |
* Commencement of Operations.
| (1) | Expense ratios before waiver of fees and reimbursement of expenses (if any) by advisor and administrator. |
| (2) | For comparative purposes per share amounts are based on average shares outstanding. |
| (3) | Includes a tax return of capital of $(0.01). |
See Notes to Financial Statements.
60
| | | | | | | | | | | | | | | | | | | | | | | | | | | |
| | | | | | | | |
Total
Distributions
| | | Net Asset Value,
End of Year
| | Total
Return
| | | Net Assets, End
of Year (000’s)
| | Ratio of Net
Operating Expenses
to Average
Net Assets
| | | Ratio of Gross
Operating Expenses
to Average
Net Assets (1)
| | | Ratio of Net
Investment
Income (Loss) to
Average Net Assets
| | | Portfolio
Turnover
Rate
| | | Fee
Waivers
(Note 2)
| |
| | | | | | | | | | | | | | | | | | | | | | | | | | | | |
| | | | | | | | | | | | | | | | | | | | | | | | | | | | |
| | | | | | | | | | | | | | | | | | | | | | | | | | | | |
| $ | (0.48 | ) | | $ | 36.12 | | 8.85 | % | | $ | 466,903 | | 1.05 | % | | 1.24 | % | | 0.86 | % | | 19 | % | | $ | 0.06 | (2) |
| | (0.16 | ) | | | 33.64 | | 31.75 | % | | | 573,242 | | 0.99 | % | | 1.10 | % | | 0.45 | % | | 24 | % | | | 0.03 | |
| | (1.70 | ) | | | 25.67 | | (22.45 | )% | | | 469,013 | | 0.96 | % | | 1.11 | % | | 0.59 | % | | 36 | % | | | 0.04 | |
| | (0.25 | ) | | | 35.17 | | (1.58 | )% | | | 683,100 | | 0.97 | % | | 1.08 | % | | 0.59 | % | | 43 | % | | | 0.04 | |
| | (1.34 | ) | | | 35.99 | | (26.72 | )% | | | 724,180 | | 0.99 | % | | 1.06 | % | | 0.03 | % | | 36 | % | | | 0.03 | |
| | | | | | | | | | | | | | | | | | | | | | | | | | | | |
| | | | | | | | | | | | | | | | | | | | | | | | | | | | |
| | | | | | | | | | | | | | | | | | | | | | | | | | | | |
| | — | | | $ | 8.04 | | 4.28 | % | | $ | 210,060 | | 1.05 | % | | 1.28 | % | | (0.59 | )% | | 25 | % | | $ | 0.02 | (2) |
| | — | | | | 7.71 | | 33.16 | % | | | 127,231 | | 1.05 | % | | 1.18 | % | | (0.74 | )% | | 79 | % | | | 0.01 | |
| | — | | | | 5.79 | | (34.43 | )% | | | 73,894 | | 1.04 | % | | 1.21 | % | | (0.21 | )% | | 56 | % | | | 0.01 | |
| | — | | | | 8.83 | | (12.23 | )% | | | 189,247 | | 1.00 | % | | 1.10 | % | | (0.50 | )% | | 10 | % | | | 0.01 | |
| | — | | | | 10.06 | | (47.00 | )% | | | 277,504 | | 1.01 | % | | 1.08 | % | | (0.50 | )% | | 20 | % | | | 0.01 | |
| | | | | | | | | | | | | | | | | | | | | | | | | | | | |
| | | | | | | | | | | | | | | | | | | | | | | | | | | | |
| | | | | | | | | | | | | | | | | | | | | | | | | | | | |
| | — | | | $ | 16.14 | | 10.62 | % | | $ | 488,221 | | 1.05 | % | | 1.08 | % | | (0.64 | )% | | 61 | % | | $ | 0.01 | (2) |
| | — | | | | 14.59 | | 72.26 | % | | | 352,457 | | 0.83 | % | | 0.98 | % | | (0.20 | )% | | 82 | % | | | 0.02 | |
| | — | | | | 8.47 | | (30.52 | )% | | | 156,324 | | 0.83 | % | | 1.05 | % | | (0.31 | )% | | 105 | % | | | 0.02 | |
| $ | (0.04 | ) | | | 12.19 | | 21.61 | % | | | 171,601 | | 0.84 | % | | 0.98 | % | | 0.19 | % | | 144 | % | | | 0.01 | |
| | (0.99 | ) | | | 10.06 | | (28.69 | )% | | | 87,180 | | 0.89 | % | | 1.04 | % | | 0.57 | % | | 132 | % | | | 0.02 | |
| | | | | | | | | | | | | | | | | | | | | | | | | | | | |
| | | | | | | | | | | | | | | | | | | | | | | | | | | | |
| | | | | | | | | | | | | | | | | | | | | | | | | | | | |
| $ | (0.34 | ) | | $ | 41.40 | | 11.16 | % | | $ | 4,469,075 | | 1.07 | % | | 1.09 | % | | 0.87 | % | | 8 | % | | $ | 0.01 | (2) |
| | (0.23 | ) | | | 37.57 | | 60.06 | % | | | 3,244,851 | | 0.99 | % | | 1.14 | % | | 0.78 | % | | 4 | % | | | 0.05 | |
| | (0.13 | ) | | | 23.66 | | (27.13 | )% | | | 1,558,721 | | 0.99 | % | | 1.12 | % | | 0.65 | % | | 16 | % | | | 0.03 | |
| | (0.08 | ) | | | 32.63 | | 6.60 | % | | | 2,408,053 | | 0.94 | % | | 1.02 | % | | 0.27 | % | | 8 | % | | | 0.02 | |
| | (0.59 | ) | | | 30.69 | | (7.74 | )% | | | 1,822,710 | | 0.95 | % | | 1.02 | % | | 1.66 | % | | 15 | % | | | 0.03 | |
| | | | | | | | | | | | | | | | | | | | | | | | | | | | |
| | | | | | | | | | | | | | | | | | | | | | | | | | | | |
| | | | | | | | | | | | | | | | | | | | | | | | | | | | |
| $ | (0.23 | ) | | $ | 16.77 | | 7.93 | % | | $ | 214,844 | | 1.06 | % | | 1.16 | % | | 1.42 | % | | 28 | % | | $ | 0.01 | (2) |
| | (0.03 | ) | | | 15.75 | | 54.21 | % | | | 186,720 | | 0.99 | % | | 1.23 | % | | 0.24 | % | | 13 | % | | | 0.03 | |
| | (0.02 | ) | | | 10.24 | | (22.81 | )% | | | 81,146 | | 1.01 | % | | 1.15 | % | | 0.20 | % | | 28 | % | | | 0.02 | |
| | (0.38 | ) | | | 13.29 | | 14.23 | % | | | 50,477 | | 1.05 | % | | 1.16 | % | | 0.59 | % | | 24 | % | | | 0.01 | |
| | (8.45 | ) | | | 11.99 | | (0.84 | )% | | | 2,371 | | 1.03 | % | | 1.26 | % | | 0.97 | % | | 95 | % | | | 0.09 | |
See Notes to Financial Statements.
61
Excelsior Funds
Financial Highlights — Selected Per Share Data and Ratios
| | | | | | | | | | | | | | | | | | | | | | | |
| | | | | | |
| | | Net Asset Value,
Beginning of
Year
| | Net
Investment
Income (Loss)
| | | Net Realized and
Unrealized Gain (Loss)
of Investments
| | | Total From
Investment
Operations
| | | Dividends
From Net
Investment
Income
| | | Distributions From
Net Realized Gain
on Investments
| |
ENERGY AND NATURAL RESOURCES FUND | | | | | | | | | | | | | | | | | |
Shares — (12/31/92*) | | | | | | | | | | | | | | | | | | | | | | | |
Year Ended March 31, | | | | | | | | | | | | | | | | | | | | | | | |
2005 | | $ | 16.45 | | $ | 0.02 | (2) | | $ | 6.99 | (2) | | $ | 7.01 | | | $ | (0.05 | ) | | $ | (1.07 | ) |
2004 | | | 11.72 | | | 0.06 | | | | 4.71 | | | | 4.77 | | | | (0.04 | ) | | | — | |
2003 | | | 14.40 | | | 0.04 | | | | (2.67 | ) | | | (2.63 | ) | | | (0.05 | ) | | | — | |
2002 | | | 15.41 | | | 0.10 | | | | (0.58 | ) | | | (0.48 | ) | | | (0.10 | ) | | | (0.43 | ) |
2001 | | | 15.21 | | | 0.07 | | | | 1.60 | | | | 1.67 | | | | (0.07 | ) | | | (1.40 | ) |
REAL ESTATE FUND | | | | | | | | | | | | | | | | | | | | | | | |
Shares — (10/01/97*) | | | | | | | | | | | | | | | | | | | | | | | |
Year Ended March 31, | | | | | | | | | | | | | | | | | | | | | | | |
2005 | | $ | 9.17 | | $ | 0.17 | (2) | | $ | 0.68 | (2) | | $ | 0.85 | | | $ | (0.22 | ) | | $ | (0.50 | ) |
2004 | | | 6.61 | | | 0.29 | (2) | | | 2.64 | (2) | | | 2.93 | | | | (0.31 | ) | | | (0.06 | ) |
2003 | | | 7.10 | | | 0.28 | (2) | | | (0.52 | )(2) | | | (0.24 | ) | | | (0.25 | ) | | | — | |
2002 | | | 6.09 | | | 0.31 | | | | 1.01 | | | | 1.32 | | | | (0.31 | )(3) | | | — | |
2001 | | | 5.21 | | | 0.33 | | | | 0.89 | | | | 1.22 | | | | (0.34 | )(3) | | | — | |
EQUITY INCOME FUND | | | | | | | | | | | | | | | | | | | | | | | |
Shares — (09/30/03*) | | | | | | | | | | | | | | | | | | | | | | | |
Year Ended March 31, | | | | | | | | | | | | | | | | | | | | | | | |
2005 | | $ | 7.76 | | $ | 0.19 | (2) | | $ | 0.63 | (2) | | $ | 0.82 | | | $ | (0.17 | ) | | $ | (0.02 | ) |
Period Ended March 31, 2004 | | | 7.00 | | | 0.07 | | | | 0.73 | | | | 0.80 | | | | (0.04 | ) | | | — | |
EQUITY CORE FUND | | | | | | | | | | | | | | | | | | | | | | | |
Shares — (03/31/04*) | | | | | | | | | | | | | | | | | | | | | | | |
Year Ended March 31, | | | | | | | | | | | | | | | | | | | | | | | |
2005 | | $ | 10.00 | | $ | 0.08 | (2) | | $ | 0.95 | (2) | | $ | 1.03 | | | $ | (0.04 | ) | | $ | (0.01 | ) |
INTERNATIONAL FUND | | | | | | | | | | | | | | | | | | | | | | | |
Shares — (07/21/87*) | | | | | | | | | | | | | | | | | | | | | | | |
Year Ended March 31, | | | | | | | | | | | | | | | | | | | | | | | |
2005 | | $ | 11.28 | | $ | 0.06 | (2) | | $ | 1.71 | (2) | | $ | 1.77 | | | | — | (4) | | | — | |
2004 | | | 6.83 | | | 0.09 | | | | 4.44 | | | | 4.53 | | | $ | (0.08 | ) | | | — | |
2003 | | | 9.75 | | | 0.10 | | | | (2.99 | ) | | | (2.89 | ) | | | (0.03 | ) | | | — | |
2002 | | | 11.75 | | | 0.03 | | | | (1.43 | ) | | | (1.40 | ) | | | (0.08 | ) | | $ | (0.52 | ) |
2001 | | | 20.02 | | | (0.05 | ) | | | (7.49 | ) | | | (7.54 | ) | | | (0.13 | ) | | | (0.60 | ) |
PACIFIC/ASIA FUND | | | | | | | | | | | | | | | | | | | | | | | |
Shares — (12/31/92*) | | | | | | | | | | | | | | | | | | | | | | | |
Year Ended March 31, | | | | | | | | | | | | | | | | | | | | | | | |
2005 | | $ | 8.44 | | $ | 0.03 | (2) | | $ | 0.42 | (2) | | $ | 0.45 | | | $ | (0.01 | ) | | | — | |
2004 | | | 5.21 | | | 0.01 | | | | 3.22 | | | | 3.23 | | | | — | | | | — | |
2003 | | | 6.68 | | | 0.01 | | | | (1.43 | ) | | | (1.42 | ) | | | (0.05 | ) | | | — | |
2002 | | | 6.59 | | | 0.02 | | | | 0.09 | | | | 0.11 | | | | (0.02 | ) | | | — | |
2001 | | | 11.89 | | | (0.06 | ) | | | (4.88 | ) | | | (4.94 | ) | | | (0.36 | ) | | | — | |
EMERGING MARKETS FUND | | | | | | | | | | | | | | | | | | | | | | | |
Shares — (01/02/98*) | | | | | | | | | | | | | | | | | | | | | | | |
Year Ended March 31, | | | | | | | | | | | | | | | | | | | | | | | |
2005 | | $ | 7.67 | | $ | 0.12 | (2) | | $ | 1.18 | (2) | | $ | 1.30 | | | $ | (0.08 | ) | | $ | (0.16 | ) |
2004 | | | 4.12 | | | 0.05 | | | | 3.55 | | | | 3.60 | | | | (0.05 | ) | | | — | |
2003 | | | 4.95 | | | 0.02 | | | | (0.84 | ) | | | (0.82 | ) | | | (0.01 | ) | | | — | |
2002 | | | 4.43 | | | 0.01 | | | | 0.53 | | | | 0.54 | | | | (0.02 | ) | | | — | |
2001 | | | 7.35 | | | (0.01 | ) | | | (2.91 | ) | | | (2.92 | ) | | | — | | | | — | |
* Commencement of Operations.
| (1) | Expense ratios before waiver of fees and reimbursement of expenses (if any) by advisor and administrator. |
| (2) | For comparative purposes per share amounts are based on average shares outstanding. |
| (3) | Includes a tax return of capital of $(0.08) and $(0.02) for the years ended March 31, 2001 and March 31, 2002, respectively. |
| (4) | Amount represents less than $0.01 per share. |
See Notes to Financial Statements.
62
| | | | | | | | | | | | | | | | | | | | | | | | | | | |
| | | | | | | | |
Total
Distributions
| | | Net Asset Value,
End of Year
| | Total
Return
| | | Net Assets, End
of Year (000’s)
| | Ratio of Net
Operating Expenses
to Average
Net Assets
| | | Ratio of Gross
Operating Expenses
to Average
Net Assets (1)
| | | Ratio of Net
Investment
Income (Loss) to
Average Net Assets
| | | Portfolio
Turnover
Rate
| | | Fee
Waivers
(Note 2)
| |
| | | | | | | | | | | | | | | | | | | | | | | | | | | | |
| | | | | | | | | | | | | | | | | | | | | | | | | | | | |
| | | | | | | | | | | | | | | | | | | | | | | | | | | | |
| $ | (1.12 | ) | | $ | 22.34 | | 43.97 | % | | $ | 292,333 | | 1.10 | % | | 1.15 | % | | 0.12 | % | | 111 | % | | $ | 0.01 | (2) |
| | (0.04 | ) | | | 16.45 | | 40.84 | % | | | 150,035 | | 0.99 | % | | 1.13 | % | | 0.45 | % | | 91 | % | | | 0.02 | |
| | (0.05 | ) | | | 11.72 | | (18.30 | )% | | | 92,440 | | 1.01 | % | | 1.19 | % | | 0.35 | % | | 78 | % | | | 0.02 | |
| | (0.53 | ) | | | 14.40 | | (2.82 | )% | | | 129,169 | | 0.98 | % | | 1.12 | % | | 0.77 | % | | 73 | % | | | 0.02 | |
| | (1.47 | ) | | | 15.41 | | 11.98 | % | | | 102,850 | | 0.99 | % | | 1.05 | % | | 0.46 | % | | 59 | % | | | 0.01 | |
| | | | | | | | | | | | | | | | | | | | | | | | | | | | |
| | | | | | | | | | | | | | | | | | | | | | | | | | | | |
| | | | | | | | | | | | | | | | | | | | | | | | | | | | |
| $ | (0.72 | ) | | $ | 9.30 | | 9.90 | % | | $ | 112,889 | | 1.20 | % | | 1.56 | % | | 1.89 | % | | 17 | % | | $ | 0.03 | (2) |
| | (0.37 | ) | | | 9.17 | | 45.65 | % | | | 122,874 | | 1.20 | % | | 1.35 | % | | 3.67 | % | | 38 | % | | | 0.01 | |
| | (0.25 | ) | | | 6.61 | | (3.49 | )% | | | 79,374 | | 1.17 | % | | 1.23 | % | | 4.09 | % | | 23 | % | | | — | (4) |
| | (0.31 | ) | | | 7.10 | | 22.37 | % | | | 91,308 | | 1.20 | % | | 1.33 | % | | 4.53 | % | | 25 | % | | | 0.01 | |
| | (0.34 | ) | | | 6.09 | | 24.03 | % | | | 44,237 | | 1.20 | % | | 1.36 | % | | 5.52 | % | | 29 | % | | | 0.01 | |
| | | | | | | | | | | | | | | | | | | | | | | | | | | | |
| | | | | | | | | | | | | | | | | | | | | | | | | | | | |
| | | | | | | | | | | | | | | | | | | | | | | | | | | | |
| $ | (0.19 | ) | | $ | 8.39 | | 10.73 | % | | $ | 195,668 | | 1.05 | % | | 1.26 | % | | 2.35 | % | | 19 | % | | $ | 0.02 | (2) |
| | (0.04 | ) | | | 7.76 | | 11.48 | %(5) | | | 100,024 | | 1.05 | %(6) | | 1.17 | %(6) | | 2.44 | % | | 6 | % | | | — | (4) |
| | | | | | | | | | | | | | | | | | | | | | | | | | | | |
| | | | | | | | | | | | | | | | | | | | | | | | | | | | |
| | | | | | | | | | | | | | | | | | | | | | | | | | | | |
| $ | (0.05 | ) | | $ | 10.98 | | 10.30 | % | | $ | 43,579 | | 1.05 | % | | 1.59 | % | | 0.74 | % | | 13 | % | | $ | 0.06 | (2) |
| | | | | | | | | | | | | | | | | | | | | | | | | | | | |
| | | | | | | | | | | | | | | | | | | | | | | | | | | | |
| | | | | | | | | | | | | | | | | | | | | | | | | | | | |
| | — | | | $ | 13.05 | | 15.71 | % | | $ | 240,322 | | 1.50 | % | | 1.61 | % | | 0.52 | % | | 66 | % | | $ | 0.01 | (2) |
| $ | (0.08 | ) | | | 11.28 | | 66.51 | % | | | 130,143 | | 1.38 | % | | 1.49 | % | | 0.92 | % | | 58 | % | | | 0.01 | |
| | (0.03 | ) | | | 6.83 | | (29.72 | )% | | | 89,679 | | 1.40 | % | | 1.57 | % | | 0.55 | % | | 73 | % | | | 0.01 | |
| | (0.60 | ) | | | 9.75 | | (12.25 | )% | | | 167,280 | | 1.23 | % | | 1.53 | % | | 0.44 | % | | 50 | % | | | 0.03 | |
| | (0.73 | ) | | | 11.75 | | (38.41 | )% | | | 302,067 | | 1.41 | % | | 1.53 | % | | (0.29 | )% | | 55 | % | | | 0.02 | |
| | | | | | | | | | | | | | | | | | | | | | | | | | | | |
| | | | | | | | | | | | | | | | | | | | | | | | | | | | |
| | | | | | | | | | | | | | | | | | | | | | | | | | | | |
| $ | (0.01 | ) | | $ | 8.88 | | 5.32 | % | | $ | 134,579 | | 1.50 | % | | 1.64 | % | | 0.35 | % | | 90 | % | | $ | 0.01 | (2) |
| | — | | | | 8.44 | | 62.00 | % | | | 114,830 | | 1.45 | % | | 1.58 | % | | 0.20 | % | | 58 | % | | | 0.01 | |
| | (0.05 | ) | | | 5.21 | | (21.44 | )% | | | 27,330 | | 1.51 | % | | 1.66 | % | | 0.15 | % | | 73 | % | | | 0.01 | |
| | (0.02 | ) | | | 6.68 | | 1.62 | % | | | 23,541 | | 1.43 | % | | 1.74 | % | | 0.35 | % | | 94 | % | | | 0.02 | |
| | (0.36 | ) | | | 6.59 | | (41.79 | )% | | | 31,995 | | 1.50 | % | | 1.68 | % | | (0.63 | )% | | 75 | % | | | 0.02 | |
| | | | | | | | | | | | | | | | | | | | | | | | | | | | |
| | | | | | | | | | | | | | | | | | | | | | | | | | | | |
| | | | | | | | | | | | | | | | | | | | | | | | | | | | |
| $ | (0.24 | ) | | $ | 8.73 | | 17.07 | % | | $ | 433,168 | | 1.70 | % | | 1.90 | % | | 1.44 | % | | 21 | % | | $ | 0.02 | (2) |
| | (0.05 | ) | | | 7.67 | | 87.57 | % | | | 209,161 | | 1.65 | % | | 1.92 | % | | 0.81 | % | | 14 | % | | | 0.02 | |
| | (0.01 | ) | | | 4.12 | | (16.62 | )% | | | 30,049 | | 1.61 | % | | 1.84 | % | | 0.51 | % | | 43 | % | | | 0.01 | |
| | (0.02 | ) | | | 4.95 | | 12.16 | % | | | 22,847 | | 1.59 | % | | 1.93 | % | | 0.78 | % | | 31 | % | | | 0.01 | |
| | — | | | | 4.43 | | (39.73 | )% | | | 12,258 | | 1.65 | % | | 2.09 | % | | (0.16 | )% | | 30 | % | | | 0.02 | |
See Notes to Financial Statements.
63
EXCELSIOR FUNDS
NOTES TO FINANCIAL STATEMENTS
1. Significant Accounting Policies:
Excelsior Funds, Inc. (“Excelsior Fund”) was incorporated under the laws of the State of Maryland on August 2, 1984. Excelsior Funds Trust (the “Trust”) is a statutory trust organized under the laws of the State of Delaware on April 27, 1994. Excelsior Fund and the Trust are registered under the Investment Company Act of 1940 (the “1940 Act”), as amended, as open-ended diversified management investment companies with the exception of Energy and Natural Resources Fund and Real Estate Fund, each of which are non-diversified.
Excelsior Fund and the Trust currently offer shares in fifteen and seven managed investment portfolios, respectively, each having its own investment objectives and policies. The following is a summary of significant accounting policies for Blended Equity Fund, Large Cap Growth Fund, Small Cap Fund, Value and Restructuring Fund, Energy and Natural Resources Fund, Real Estate Fund, International Fund, Pacific/Asia Fund and Emerging Markets Fund, portfolios of Excelsior Fund, and Mid Cap Value Fund, Equity Income Fund and Equity Core Fund, portfolios of the Trust. Such policies are in conformity with accounting principles generally accepted in the United States of America and are consistently followed by Excelsior Fund and the Trust (collectively the “Funds”) in the preparation of their financial statements. The preparation of financial statements requires management to make estimates and assumptions that affect the reported amounts and disclosures in the financial statements. Actual results could differ from these estimates.
The Emerging Markets Fund and Equity Core Fund offer two classes of shares: Shares and Institutional Shares. The Large Cap Growth Fund, Equity Income Fund and Small Cap Fund offer two classes of shares: Shares and Retirement Shares. The Mid Cap Value Fund and the Value and Restructuring Fund offer three classes of shares: Shares, Institutional Shares and Retirement Shares. The Financial Highlights of the Institutional Shares and Retirement Shares as well as the financial statements for the remaining portfolios of Excelsior Fund and the Trust are presented separately.
(a) Portfolio valuation:
Investments in securities that are traded on recognized domestic and foreign stock exchanges are valued at the last sale price on the exchange on which such securities are primarily traded or at the last quoted sale price on a national securities market. Securities traded over-the-counter are valued each business day on the basis of closing over-the-counter sale prices. Equity securities that are traded on the NASDAQ National Market System for which quotations are readily available are valued at the official closing price. Securities for which there were no transactions are valued at the last quoted sales price for the most recent day such prices were available. Securities for which market quotations are not readily available are valued in good faith at fair value pursuant to procedures adopted by the Board of Directors with regard to Excelsior Fund and the Board of Trustees with regard to the Trust.
Short-term debt instruments that mature in 60 days or less are valued at amortized cost, which approximates market value. The amortized cost method values a security at its cost at the time of purchase (or at its market value 61 days before maturity) and thereafter assumes a constant
64
amortization to maturity of any bond premium or discount. Investments in securities that are primarily traded on foreign securities exchanges are generally valued at the preceding closing values of such securities on their respective exchanges, except that when a significant event has occurred subsequent to the close of such foreign exchange and prior to the time at which the Fund’s net asset value is determined, then such securities are valued in good faith at fair value in accordance with procedures adopted by the Board of Directors with regard to Excelsior Fund and the Board of Trustees with regard to the Trust.
Investment valuations, other assets and liabilities initially expressed in foreign currencies are converted each business day into U.S. dollars based upon current exchange rates. Purchases and sales of foreign investments and income and expenses are converted into U.S. dollars based upon currency exchange rates prevailing on the respective dates of such transactions. The Funds do not isolate the portion of gains and losses on investment securities that is due to changes in foreign exchange rates from that which is due to changes in market prices of such securities. The Funds report gains and losses on foreign currency related transactions as realized and unrealized gains or losses for financial reporting purposes, whereas such components are treated as ordinary income or loss for federal income tax purposes.
(b) Forward foreign currency exchange contracts:
The Funds’ participation in forward currency exchange contracts will be limited to hedging involving either specific transactions or portfolio positions. Transaction hedging involves the purchase or sale of foreign currency with respect to specific receivables or payables of a Fund generally arising in connection with the purchase or sale of its portfolio securities. Risk may arise upon entering into these contracts from the potential inability of counterparties to meet the terms of their contracts and is generally limited to the amount of unrealized gain on the contracts, if any, at the date of default. Risk may also arise from unanticipated movements in the value of foreign currency relative to the U.S. dollar. Contracts are marked to market daily and the change in market value is recorded as unrealized appreciation or depreciation. Realized gains or losses arising from such transactions are included in net realized gains or losses from foreign currency transactions.
The International Fund had the following forward foreign currency contracts outstanding as of March 31, 2005:
| | | | | | | | |
Settlement Dates
| | Currency to
Receive
| | In
Exchange
For
| | Unrealized
Appreciation
|
Foreign Currency Purchases: | | | | | | | | |
04/01/05 | | CAD 288,982 | | $ | 238,434 | | $ | 355 |
(c) Covered call options written:
Certain Funds may engage in writing covered call options. By writing a covered call option, a Fund forgoes the opportunity to profit from an increase in the market price of the underlying security above the exercise price, except insofar as the premium represents such a profit.
65
When a Fund writes an option, an amount equal to the net premium (the premium less the commission) received by that Fund is included in the liability section of that Fund’s statement of assets and liabilities as a deferred credit. The amount of the deferred credit will be subsequently marked to market to reflect the current value of the option written. The current value of the traded option is the last sale price or, in the absence of a sale, the last quoted sale price for the most recent day such price was available. If an option expires on the stipulated expiration date, or if the Fund involved enters into a closing purchase transaction, the Fund will realize a gain (or loss if the cost of a closing purchase transaction exceeds the net premium received when the option is sold), and the deferred credit related to such option will be eliminated. If an option is exercised, the Fund involved may deliver the underlying security from its portfolio or purchase the underlying security in the open market. In either event, the proceeds of the sale will be increased by the net premium originally received, and the Fund involved will realize a gain or loss. Premiums from expired call options written by the Fund and net gains from closing purchase transactions are treated as short-term capital gains for Federal income tax purposes, and losses on closing purchase transactions are short-term capital losses.
There is no assurance that a liquid secondary market on an exchange will exist for any particular option. A covered option writer, unable to effect a closing purchase transaction, will not be able to sell the underlying security until the option expires or is delivered upon exercise. As a result, the writer in such circumstances will be subject to the risk of market decline in the underlying security during such period and to the risk that market values increase beyond the option exercise price, in each case to the extent not offset by the net premium. A Fund will write an option on a particular security only if the Adviser believes that a liquid secondary market will exist on an exchange for options of the same series, which will permit the Fund to make a closing purchase transaction in order to close out its position.
During the year ended March 31, 2005, the Value and Restructuring Fund had the following written option transactions:
| | | | | | | |
| Written Option Transactions | | Number of
Contracts
| | | Premiums
| |
Outstanding, beginning of period | | (15,385 | ) | | $ | (2,153,485 | ) |
Options written | | (33,294 | ) | | | (5,171,714 | ) |
Options expired | | 20,604 | | | | 2,596,637 | |
Options exercised | | 4,175 | | | | 1,312,069 | |
Options terminated in closing purchase transactions | | 3,900 | | | | 782,521 | |
| | |
|
| |
|
|
|
Outstanding, end of year | | (20,000 | ) | | $ | (2,633,972 | ) |
| | |
|
| |
|
|
|
(d) Concentration of risks:
The International Fund, Pacific/Asia Fund and Emerging Markets Fund invest primarily in securities of companies that are located in or conduct a substantial amount of their business in foreign countries, including emerging market countries. Prices of securities in foreign markets generally, and emerging markets in particular, have historically been more volatile than prices in U.S. markets. Some countries in which the Funds may invest require government approval for the
66
repatriation of investment income, capital or the proceeds of sales of securities by foreign investors. In addition, if there is deterioration in a country’s balance of payments or for other reasons, a country may impose temporary restrictions on foreign capital remittances abroad.
(e) Security transactions and investment income:
Security transactions are recorded on a trade date basis. Realized gains and losses on investments sold are recorded on the basis of identified cost. Interest income, adjusted for amortization of premiums and, when appropriate, discounts on investments, is earned from settlement date and is recorded on the accrual basis. Dividend income is recorded on the ex-dividend date, except for certain dividends from foreign securities, which are recorded as soon as the Fund is informed of the dividend.
(f) Repurchase agreements:
The Funds may purchase portfolio securities from financial institutions deemed to be creditworthy by the investment adviser subject to the seller’s agreement to repurchase and the Funds’ agreement to resell such securities at mutually agreed upon prices. Securities purchased subject to such repurchase agreements are deposited with the Funds’ custodian or sub-custodian or are maintained in the Federal Reserve/Treasury book-entry system and must have, at all times, an aggregate market value not less than the repurchase price (including accrued interest).
Default or bankruptcy of the seller may, however, expose the applicable Fund to possible delay in connection with the disposition of the securities or loss to the extent that proceeds from a sale of the underlying securities were less than the repurchase price under the agreement.
(g) Distributions to shareholders:
Dividends equal to all or substantially all of each Fund’s net investment income will be declared and paid as follows: for the Blended Equity Fund, Large Cap Growth Fund, Small Cap Fund, Value and Restructuring Fund, Mid Cap Value Fund, Energy and Natural Resources Fund, Real Estate Fund, Equity Income Fund and Equity Core Fund, dividends will be declared and paid at least quarterly; and for the International Fund, Pacific/Asia Fund and Emerging Markets Fund, dividends will be declared and paid semiannually. Net realized capital gains, unless offset by any available capital loss carryforward, are distributed at least annually. Dividends and distributions are recorded on the ex-dividend date.
(h) Expense allocation:
Expenses directly attributable to a Fund are charged to that Fund. Other expenses are allocated to the respective Fund based on average daily net assets. Expenses attributable to a specific class of shares, such as shareholder servicing fees, are charged directly to that class.
(i) Organization and offering costs:
Organization costs of the Equity Income Fund, which commenced operations on September 30, 2003, and the Equity Core Fund, which commenced operations on March 31, 2004, have been
67
expensed as incurred. Offering costs, including costs of printing initial prospectuses and registration fees, were amortized to expense over twelve months.
2. Investment Advisory Fee, Administration Fee, Shareholder Servicing Fees and Related Party
Transactions:
United States Trust Company of New York (“U.S. Trust NY”) and U.S. Trust Company, N.A. (together, the “Adviser” or “U.S. Trust”), acting through their respective registered investment advisory divisions, U.S. Trust New York Asset Management Division and U.S. Trust Company, N.A. Asset Management Division, serve as the investment adviser to the Funds. For the services provided pursuant to the Investment Advisory Agreements, the Adviser receives a fee, computed daily and paid monthly, as follows:
| | | |
Blended Equity Fund | | 0.75 | % |
Large Cap Growth Fund | | 0.75 | % |
Small Cap Fund | | 0.60 | % |
Value and Restructuring Fund | | 0.60 | % |
Mid Cap Value Fund | | 0.65 | % |
Energy and Natural Resources Fund | | 0.60 | % |
Real Estate Fund | | 1.00 | % |
Equity Income Fund | | 0.75 | % |
Equity Core Fund | | 0.75 | % |
International Fund | | 1.00 | % |
Pacific/Asia Fund | | 1.00 | % |
Emerging Markets Fund | | 1.25 | % |
U.S. Trust NY is a state-chartered bank and trust company and a member bank of the Federal Reserve System. U.S. Trust Company, N.A. is a national bank organized under the laws of the United States. Each is a wholly-owned subsidiary of U.S. Trust Corporation, a registered bank holding company. U.S. Trust Corporation is a wholly-owned subsidiary of The Charles Schwab Corporation (“Schwab”).
68
U.S. Trust Company, N.A., and BISYS Fund Services, Ohio, Inc. (collectively, the “Administrators”) provide administrative services to the Funds. For the services provided to the Funds, the Administrators are entitled jointly to annual fees, computed daily and paid monthly, based on the combined aggregate average daily net assets of Excelsior Fund, Excelsior Tax-Exempt Funds, Inc. (“Excelsior Tax-Exempt Fund”) and the Trust (excluding the international equity portfolios of Excelsior Fund and the Trust), all of which are affiliated investment companies, as follows: 0.200% of the first $200 million, 0.175% of the next $200 million and 0.150% over $400 million. The Administrators are entitled jointly to annual fees, computed daily and paid monthly, at the annual rate of 0.20% of the average daily net assets of the International Equity Fund, International Fund, Pacific/Asia Fund and Emerging Markets Fund. Administration fees payable by each Fund of the three investment companies are determined in proportion to the relative average daily net assets of the respective Fund for the period paid. For the five month period ended August 31, 2004, U.S. Trust Company, N.A. voluntarily agreed to waive a portion of its administration fee in an amount equal to an annual rate of 0.04% of the average daily net assets of each Fund. For the year ended March 31, 2005, administration fees charged by U.S. Trust Company, N.A. were as follows:
| | | | | | | | | | |
| | | Administration
Fees
| | Waiver
Administration
Fees
| | | Net
Administration
Fees
|
Blended Equity Fund | | $ | 816,805 | | $ | (92,015 | ) | | $ | 724,790 |
Large Cap Growth Fund | | | 246,253 | | | (23,079 | ) | | | 223,174 |
Small Cap Fund | | | 672,219 | | | (63,801 | ) | | | 608,418 |
Value and Restructuring Fund | | | 5,757,405 | | | (557,110 | ) | | | 5,200,295 |
Mid Cap Value Fund | | | 462,079 | | | (47,237 | ) | | | 414,842 |
Energy and Natural Resources Fund | | | 290,241 | | | (26,487 | ) | | | 263,754 |
Real Estate Fund | | | 176,766 | | | (17,826 | ) | | | 158,940 |
Equity Income Fund | | | 219,261 | | | (19,651 | ) | | | 199,610 |
Equity Core Fund | | | 30,439 | | | (1,008 | ) | | | 29,431 |
International Fund | | | 358,933 | | | (25,422 | ) | | | 333,511 |
Pacific/Asia Fund | | | 236,513 | | | (18,554 | ) | | | 217,959 |
Emerging Markets Fund | | | 509,471 | | | (30,644 | ) | | | 478,827 |
69
From time to time, in its sole discretion, U.S. Trust may undertake to waive a portion or all of the fees payable to it and may also reimburse the Funds for a portion of other expenses. For the year ended March 31, 2005, U.S. Trust has contractually agreed to waive investment advisory fees and to reimburse other ordinary operating expenses to the extent necessary to keep total operating expenses from exceeding the following annual percentages of each Fund’s average daily net assets:
| | | |
Blended Equity Fund — Shares | | 1.05 | % |
Large Cap Growth Fund — Shares | | 1.05 | % |
Small Cap Fund — Shares | | 1.05 | % |
Value and Restructuring Fund — Shares | | 1.14 | % |
Mid Cap Value Fund — Shares | | 1.14 | % |
Energy and Natural Resources Fund — Shares | | 1.25 | % |
Real Estate Fund — Shares | | 1.20 | % |
Equity Income Fund — Shares | | 1.05 | % |
Equity Core Fund — Shares | | 1.05 | % |
International Fund — Shares | | 1.50 | % |
Pacific/Asia Fund — Shares | | 1.50 | % |
Emerging Markets Fund — Shares | | 1.70 | % |
Value and Restructuring Fund — Institutional Shares | | 0.89 | % |
Mid Cap Value Fund — Institutional Shares | | 0.89 | % |
Equity Core Fund — Institutional Shares | | 0.80 | % |
Emerging Markets — Institutional Shares | | 1.45 | % |
Large Cap Growth Fund — Retirement Shares | | 1.55 | % |
Small Cap Fund — Retirement Shares | | 1.55 | % |
Value and Restructuring Fund — Retirement Shares | | 1.64 | % |
Mid Cap Value Fund — Retirement Shares | | 1.64 | % |
Equity Income Fund — Retirement Shares | | 1.55 | % |
For the year ended March 31, 2005, pursuant to the above, investment advisory fees waived by U.S. Trust were as follows:
| | | | |
Blended Equity Fund | | $ | (867,936 | ) |
Large Cap Growth Fund | | | (339,084 | ) |
Small Cap Fund | | | (56,545 | ) |
Value and Restructuring Fund | | | — | |
Mid Cap Value Fund | | | (222,455 | ) |
Energy and Natural Resources Fund | | | (50,164 | ) |
Real Estate Fund | | | (382,293 | ) |
Equity Income Fund | | | (281,616 | ) |
Equity Core Fund | | | (100,187 | ) |
International Fund | | | (172,930 | ) |
Pacific/Asia Fund | | | (132,880 | ) |
Emerging Markets Fund | | | (472,863 | ) |
The Funds have entered into shareholder servicing agreements with various service organizations, which may include Charles Schwab & Co. Inc. (“CS & Co.”) and U.S. Trust. Services included in the
70
servicing agreements are assisting in processing purchase, exchange and redemption requests; transmitting and receiving funds in connection with customer orders to purchase, exchange or redeem shares; and providing periodic statements. Shareholder servicing fees are incurred on a Fund or class level (where applicable). In consideration for these services, each service organization receives a fee, computed daily and paid monthly, at an annual rate up to 0.25% of the average daily net assets of the Fund’s shares held by each service organizations’ customers. The Adviser, out of its own resources, may additionally compensate certain organizations for providing these services.
For the year ended March 31, 2005, shareholder servicing fees paid to CS & Co. and U.S. Trust were as follows:
| | |
Blended Equity Fund | | $1,275,589 |
Large Cap Growth Fund | | 378,816 |
Small Cap Fund | | 1,028,717 |
Value and Restructuring Fund | | 4,751,166 |
Mid Cap Value Fund | | 520,007 |
Energy and Natural Resources Fund | | 299,870 |
Real Estate Fund | | 248,917 |
Equity Income Fund | | 357,870 |
Equity Core Fund | | 45 |
International Fund | | 406,940 |
Pacific/Asia Fund | | 270,497 |
Emerging Markets Fund | | 323,588 |
Effective January 1, 2005, BISYS Fund Services Limited Partnership became the Distributor for the Funds. Prior to January 1, 2005, Edgewood Services, Inc. (a wholly-owned subsidiary of Federated Investors, Inc.) served as the Distributor of the Funds. Shares of each Fund are sold without a sales charge on a continuous basis by the Distributor.
Certain Funds have adopted a Distribution Plan pursuant to Rule 12b-1 under the 1940 Act, under which they may compensate the Distributor monthly for its services that are intended to result in the sale of Fund Shares (in the case of Mid Cap Value Fund) or Retirement Shares (in the case of Large Cap Growth Fund, Small Cap Fund, Value and Restructuring Fund, Mid Cap Value Fund and Equity Income Fund), in an amount not to exceed the annual rate of 0.25% or 0.50%, respectively, of the average daily net asset value of such Fund’s Shares or Retirement Shares. There were no fees charged for the year ended March 31, 2005.
Effective July 31, 2004, each Independent Director/Trustee of the Funds receives a total annual fee of $100,000 paid by the Funds and other affiliated investment companies managed by U.S. Trust. The Chairman of the Board receives an additional $30,000, the Chairman of the Audit Committee receives an additional $15,000, and the Chairman of the Nominating Committee receives an additional $5,000 for serving in those capacities. Prior to July 31, 2004, each Independent Director of Excelsior Fund received an annual fee of $15,000, plus a meeting fee of $2,500 for each meeting attended. The Chairman received an additional annual fee of $7,500. Independent Trustees of the Trust received an annual fee of $6,000, plus a meeting fee of $1,000 for each meeting attended. The Chairman of the Board received an additional annual fee of $5,000. Each member of the Nominating Committee for Excelsior Fund, the Trust and Excelsior Tax-Exempt Fund received an annual fee of $3,000 for each meeting attended. In addition, Directors and Trustees are reimbursed by Excelsior Fund and the Trust, respectively, for reasonable expenses incurred when acting in their capacity as Directors and Trustees.
71
The Funds’ Board of Directors/Trustees selected Deloitte & Touche LLP in November of 2004 to be their registered public accounting firm and to re-audit the Funds’ March 31, 2004 financial statements. All expenses in connection with the re-audit, including costs of audit, legal services, and printing and mailing of the financial statements, were paid by the Adviser. Such expenses are reflected in the Statements of Operations as “re-audit expenses” and the corresponding expense waiver “re-audit expenses paid by Investment Adviser.”
3. Purchases, Sales and Maturities of Securities:
For the year ended March 31, 2005, purchases, sales and maturities of securities, excluding short-term investments, for the Funds aggregated:
| | | | | | |
| | | Purchases
| | Sales and
Maturities
|
Blended Equity Fund | | $ | 103,722,089 | | $ | 248,277,650 |
Large Cap Growth Fund | | | 111,700,899 | | | 38,674,489 |
Small Cap Fund | | | 365,410,661 | | | 268,128,237 |
Value and Restructuring Fund | | | 1,249,651,610 | | | 304,807,240 |
Mid Cap Value Fund | | | 83,791,436 | | | 90,195,837 |
Energy and Natural Resources Fund | | | 279,877,312 | | | 210,286,926 |
Real Estate Fund | | | 19,834,621 | | | 34,020,135 |
Equity Income Fund | | | 107,412,418 | | | 26,679,008 |
Equity Core Fund | | | 95,222,823 | | | 2,758,187 |
International Fund | | | 185,474,623 | | | 114,133,280 |
Pacific/Asia Fund | | | 122,644,102 | | | 103,471,971 |
Emerging Markets Fund | | | 237,877,887 | | | 51,150,876 |
4. Federal Taxes:
It is the policy of Excelsior Fund and the Trust that each Fund qualify or continue to qualify as a regulated investment company, by complying with the requirements of the Internal Revenue Code applicable to regulated investment companies, and by distributing substantially all of its taxable earnings to its shareholders.
In order to avoid a federal excise tax, each Fund is required to distribute certain minimum amounts of net realized capital gain and net investment income for the respective twelve-month periods ending October 31 and December 31 each calendar year.
Net realized gains of the Funds derived in certain countries are subject to certain foreign taxation.
Dividends and distributions are determined in accordance with federal income tax regulations and may differ from accounting principles generally accepted in the United States of America. These differences are primarily due to differing treatments for net operating losses, foreign currency transactions, passive foreign investment companies, partnership income, deferral of losses on wash sales, dividends received from real estate investment trusts, and net capital losses and net currency losses incurred after October 31 through the end of the fiscal year (“Post-October losses”). To the extent
72
these differences are permanent, adjustments are made to the appropriate equity accounts in the period that these differences arise. Accordingly, the following reclassifications, as of March 31, 2005, were made to/from the following accounts:
| | | | | | | | | | | | |
| | | Undistributed
Net Investment
Income
| | | Accumulated
Net Realized
Gain (Loss)
| | | Paid-In-Capital
| |
Blended Equity Fund | | | — | | | $ | (31,939,888 | ) | | $ | 31,939,888 | |
Large Cap Growth Fund | | $ | 953,709 | | | | 3 | | | | (953,712 | ) |
Small Cap Fund | | | 2,842,605 | | | | (4,708,605 | ) | | | 1,866,000 | |
Value and Restructuring Fund | | | 312,308 | | | | (312,308 | ) | | | — | |
Mid Cap Value Fund | | | 364,541 | | | | (9,893,533 | ) | | | 9,528,992 | |
Energy and Natural Resources Fund | | | 31,070 | | | | (1,876,837 | ) | | | 1,845,767 | |
Real Estate Fund* | | | (615,082 | ) | | | 837,421 | | | | (222,339 | ) |
Equity Income Fund | | | 914 | | | | (914 | ) | | | — | |
Equity Core Fund | | | (2,454 | ) | | | 2,893 | | | | (439 | ) |
International Fund | | | (54,495 | ) | | | 25,827,275 | | | | (25,772,780 | ) |
Pacific/Asia Fund | | | (4,659 | ) | | | 4,654 | | | | 5 | |
Emerging Markets Fund | | | (8,275 | ) | | | 8,278 | | | | (3 | ) |
| * | The Real Estate Fund has a tax year end of June 30. |
The tax character of dividends and distributions declared during the years ended March 31, 2005 and March 31, 2004 were as follows:
| | | | | | | | | | | |
| | | Ordinary
Income
| | Long-Term
Capital Gain
| | Return
of Capital
| | Total
|
Blended Equity Fund | | | | | | | | | | | |
2005 | | $ | 4,368,038 | | $ | 3,153,196 | | — | | $ | 7,521,234 |
2004 | | | 2,883,929 | | | — | | — | | | 2,883,929 |
Value and Restructuring Fund | | | | | | | | | | | |
2005 | | | 31,941,541 | | | — | | — | | | 31,941,541 |
2004 | | | 16,245,250 | | | — | | — | | | 16,245,250 |
Mid Cap Value Fund | | | | | | | | | | | |
2005 | | | 4,730,945 | | | — | | — | | | 4,730,945 |
2004 | | | 533,846 | | | — | | — | | | 533,846 |
Energy and Natural Resources Fund | | | | | | | | | | | |
2005 | | | 465,778 | | | 10,741,372 | | — | | | 11,207,150 |
2004 | | | 355,796 | | | — | | — | | | 355,796 |
Real Estate Fund | | | | | | | | | | | |
2005 | | | 3,121,363 | | | 6,178,686 | | 222,339 | | | 9,522,388 |
2004 | | | 3,725,211 | | | 944,558 | | — | | | 4,669,769 |
Equity Income Fund | | | | | | | | | | | |
2005 | | | 3,360,556 | | | — | | — | | | 3,360,556 |
2004 | | | 219,601 | | | — | | — | | | 219,601 |
73
| | | | | | | | | | | |
| | | Ordinary
Income
| | Long-Term
Capital Gain
| | Return
of Capital
| | Total
|
Equity Core Fund | | | | | | | | | | | |
2005 | | $ | 69,065 | | | — | | — | | $ | 69,065 |
2004* | | | — | | | — | | — | | | — |
International Fund | | | | | | | | | | | |
2005 | | | 29,357 | | | — | | — | | | 29,357 |
2004 | | | 926,946 | | | — | | — | | | 926,946 |
Pacific/Asia Fund | | | | | | | | | | | |
2005 | | | 112,049 | | | — | | — | | | 112,049 |
2004 | | | — | | | — | | — | | | — |
Emerging Markets Fund | | | | | | | | | | | |
2005 | | | 3,090,328 | | $ | 5,577,055 | | — | | | 8,667,383 |
2004 | | | 925,467 | | | — | | — | | | 925,467 |
| * | Equity Core Fund commenced operations on March 31, 2004. |
As of March 31, 2005 (except for Real Estate Fund which is as of June 30, 2004), the components of distributable earnings (accumulated losses) on a tax basis were as follows:
| | | | | | | | | | | | | | | | | | | | | |
| | | Undistributed
Ordinary
Income
| | Undistributed
Long-Term
Capital Gain
| | Accumulated
Capital and
Other Losses
| | | Post-October
Losses
| | | Unrealized
Appreciation
(Depreciation)
| | Total
Accumulated
Earnings/
(Deficit)
| |
Blended Equity Fund | | $ | 4,216,727 | | $ | 21,336,026 | | | — | | | | — | | | $ | 195,549,598 | | $ | 221,102,351 | |
Large Cap Growth Fund | | | — | | | — | | $ | (138,913,076 | ) | | | — | | | | 26,784,748 | | | (112,128,328 | ) |
Small Cap Fund | | | — | | | 21,177,386 | | | — | | | | — | | | | 92,937,728 | | | 114,115,114 | |
Value and Restructuring Fund | | | 10,697,424 | | | — | | | (165,302,979 | ) | | | — | | | | 1,214,963,822 | | | 1,060,358,267 | |
Mid Cap Value Fund | | | 388,063 | | | — | | | (121,536 | ) | | | — | | | | 73,626,164 | | | 73,892,691 | |
Energy and Natural Resources Fund | | | 11,075,862 | | | 14,282,755 | | | — | | | | — | | | | 59,260,241 | | | 84,618,858 | |
Real Estate Fund (1) | | | — | | | 6,448,395 | | | — | | | | — | | | | 27,204,670 | | | 33,653,065 | |
Equity Income Fund | | | 1,416,452 | | | — | | | — | | | $ | (539,313 | ) | | | 14,387,944 | | | 15,265,083 | |
Equity Core Fund | | | 167,351 | | | — | | | (59,322 | ) | | | (2,893 | ) | | | 495,790 | | | 600,926 | |
International Fund | | | 923,854 | | | — | | | (99,757,337 | ) | | | (38,655 | ) | | | 35,794,884 | | | (63,077,254 | ) |
Pacific/Asia Fund | | | 1,350,650 | | | — | | | (19,704,802 | ) | | | — | | | | 14,159,921 | | | (4,194,231 | ) |
Emerging Markets Fund | | | 596,420 | | | — | | | (1,892,527 | ) | | | (1,209,853 | ) | | | 67,002,592 | | | 64,496,632 | |
| (1) | The components of distributable earnings for the Real Estate Fund are estimated at March 31, 2005. The actual amounts to be distributed will not be determined until June 30, 2005 when the portfolio completes its tax year end. |
Post-October losses are deemed to arise on the first business day of a Fund’s next taxable year.
For federal income tax purposes, capital loss carryforwards may be carried forward and applied against future capital gains. To the extent that such carryforwards are utilized, capital gains distributions
74
will be reduced. At March 31, 2005, the following Funds had capital loss carryforwards available to offset future net capital gains through the indicated expiration dates:
| | | | | | | | | | | | | | | | | | | | | |
| | | Expires
| | |
| | | 2008
| | 2009
| | 2010
| | 2011
| | 2012
| | 2013
| | Total
|
Large Cap Growth Fund | | $ | 8,373,927 | | | — | | $ | 24,653,640 | | $ | 83,374,895 | | $ | 22,030,449 | | $ | 480,165 | | $ | 138,913,076 |
Value and Restructuring Fund | | | — | | | — | | | 7,063,026 | | | 130,876,419 | | | 27,363,534 | | | — | | | 165,302,979 |
Mid Cap Value Fund | | | — | | | — | | | — | | | 121,536 | | | — | | | — | | | 121,536 |
International Fund | | | — | | | — | | | 15,154,055 | | | 69,463,465 | | | 15,141,183 | | | — | | | 99,758,703 |
Pacific/Asia Fund | | | — | | $ | 3,035,139 | | | 13,687,497 | | | 2,982,166 | | | — | | | — | | | 19,704,802 |
Emerging Markets Fund | | | — | | | — | | | — | | | — | | | 1,892,527 | | | — | | | 1,892,527 |
The International Fund acquired $32,286,998 of capital loss carryforwards from its merger with the Pan European Fund. However, future utilization of the capital loss carryforwards is limited to a maximum of $6,514,230 for the International Fund, included in the above totals, pursuant to Sections 382-383 of the Internal Revenue Code, as amended.
At March 31, 2005, aggregate gross unrealized appreciation for all securities and call options written for which there was an excess of value over estimated tax cost and aggregate gross unrealized depreciation for all securities for which there was an excess of estimated tax cost over value is as follows:
| | | | | | | | | | | | | |
| | | Federal Tax
Cost
| | Tax Basis
Unrealized
Appreciation
| | Tax Basis
Unrealized
(Depreciation)
| | | Net Unrealized
Appreciation
|
Blended Equity Fund | | $ | 270,331,515 | | $ | 197,482,176 | | $ | (1,932,578 | ) | | $ | 195,549,598 |
Large Cap Growth Fund | | | 192,494,826 | | | 34,414,355 | | | (7,629,607 | ) | | | 26,784,748 |
Small Cap Fund | | | 396,547,945 | | | 111,477,627 | | | (18,539,899 | ) | | | 92,937,728 |
Value and Restructuring Fund | | | 3,413,155,075 | | | 1,398,133,172 | | | (183,169,350 | ) | | | 1,214,963,822 |
Mid Cap Value Fund | | | 222,398,527 | | | 82,723,849 | | | (9,097,685 | ) | | | 73,626,164 |
Energy and Natural Resources Fund | | | 248,038,730 | | | 62,299,541 | | | (3,039,300 | ) | | | 59,260,241 |
Real Estate Fund | | | 85,490,785 | | | 28,149,891 | | | (945,221 | ) | | | 27,204,670 |
Equity Income Fund | | | 181,838,077 | | | 18,654,830 | | | (4,266,886 | ) | | | 14,387,944 |
Equity Core Fund | | | 97,336,211 | | | 3,409,171 | | | (2,913,381 | ) | | | 495,790 |
International Fund | | | 202,348,381 | | | 39,903,043 | | | (4,108,159 | ) | | | 35,794,884 |
Pacific/Asia Fund | | | 120,216,832 | | | 16,649,456 | | | (2,489,535 | ) | | | 14,159,921 |
Emerging Markets Fund | | | 364,044,174 | | | 77,588,198 | | | (10,585,606 | ) | | | 67,002,592 |
75
5. Capital Transactions:
Excelsior Fund has authorized capital of 35 billion shares of Common Stock, 29.3756 billion of which is currently classified to represent interests in certain classes of shares. Authorized capital currently offered for each Fund is as follows: 2.25 billion shares of the Blended Equity Fund; 1.5 billion shares of the Value and Restructuring Fund; 1 billion shares each of the Large Cap Growth Fund, Small Cap Fund, Energy and Natural Resources Fund and Pacific/Asia Fund; 875 million shares of the International Fund; and 500 million shares each of Real Estate Fund and Emerging Markets Fund. Each share has a par value of $0.001 and represents an equal proportionate interest in the particular Fund with other shares of the same Fund, and is entitled to such dividends and distributions of taxable earnings on the assets belonging to such Fund as are declared at the discretion of Excelsior Fund’s Board of Directors.
The Trust has authorized an unlimited number of shares of beneficial interest of each class of each Fund. Each share has a par value of $0.00001 and represents an equal proportionate interest in the particular Fund with other shares of the same Fund, and is entitled to such dividends and distributions of taxable earnings on the assets belonging to such Fund as are declared at the discretion of the Trust’s Board of Trustees.
A redemption fee of 2% of the value of the shares redeemed or exchanged is imposed on shares of the International Fund, Pacific/Asia Fund and Emerging Markets Fund redeemed or exchanged 30 days or less after their date of purchase. The redemption fee is intended to limit short-term trading in the Fund.
Capital Share Transactions
| | | | | | | | | | | | | | |
| | | Blended Equity Fund
| |
| | | Year Ended
03/31/05
| | | Year Ended
03/31/04
| |
| | | Shares
| | | Amounts
| | | Shares
| | | Amounts
| |
Sold | | | | | | | | | | | | | | |
Shares | | 1,453,644 | | | $ | 50,182,768 | | | 2,516,258 | | | $ | 76,921,408 | |
Issued as reinvestment of dividends | | | | | | | | | | | | | | |
Shares | | 54,781 | | | | 1,919,788 | | | 24,290 | | | | 719,595 | |
Redeemed | | | | | | | | | | | | | | |
Shares | | (3,867,630 | ) | | | (133,154,580 | ) | | (3,775,754 | ) | | | (118,896,601 | ) |
Redemption in-kind | | (1,753,322 | ) | | | (64,627,441 | ) | | — | | | | — | |
| | |
|
| |
|
|
| |
|
| |
|
|
|
Net Increase (Decrease) | | (4,112,527 | ) | | $ | (145,679,465 | ) | | (1,235,206 | ) | | $ | (41,255,598 | ) |
| | |
|
| |
|
|
| |
|
| |
|
|
|
| |
| | | Large Cap Growth Fund
| |
| | | Year Ended
03/31/05
| | | Year Ended
03/31/04
| |
| | | Shares
| | | Amounts
| | | Shares
| | | Amounts
| |
Sold | | | | | | | | | | | | | | |
Shares | | 14,085,811 | | | $ | 111,219,637 | | | 8,064,149 | | | $ | 57,523,780 | |
Retirement Shares | | 142 | | | | 1,150 | | | — | | | | — | |
Redeemed | | | | | | | | | | | | | | |
Shares | | (4,443,816 | ) | | | (34,760,488 | ) | | (4,333,821 | ) | | | (30,217,153 | ) |
Retirement Shares | | — | | | | — | | | — | | | | — | |
| | |
|
| |
|
|
| |
|
| |
|
|
|
Net Increase (Decrease) | | 9,642,137 | | | $ | 76,460,299 | | | 3,730,328 | | | $ | 27,306,627 | |
| | |
|
| |
|
|
| |
|
| |
|
|
|
76
| | | | | | | | | | | | | | |
| | | Small Cap Fund
| |
| | | Year Ended
03/31/05
| | | Year Ended
03/31/04
| |
| | | Shares
| | | Amounts
| | | Shares
| | | Amounts
| |
Sold | | | | | | | | | | | | | | |
Shares | | 15,104,853 | | | $ | 235,106,641 | | | 21,479,092 | | | $ | 245,816,096 | |
Retirement Shares | | 70 | | | | 1,150 | | | — | | | | — | |
Redeemed | | | | | | | | | | | | | | |
Shares | | (7,918,805 | ) | | | (124,749,437 | ) | | (15,766,201 | ) | | | (180,674,365 | ) |
Redemption in-kind | | (1,099,692 | ) | | | (18,595,792 | ) | | — | | | | — | |
| | |
|
| |
|
|
| |
|
| |
|
|
|
Net Increase (Decrease) | | 6,086,426 | | | $ | 91,762,562 | | | 5,712,891 | | | $ | 65,141,731 | |
| | |
|
| |
|
|
| |
|
| |
|
|
|
| |
| | | Value and Restructuring Fund
| |
| | | Year Ended
03/31/05
| | | Year Ended
03/31/04
| |
| | | Shares
| | | Amounts
| | | Shares
| | | Amounts
| |
Sold | | | | | | | | | | | | | | |
Shares | | 39,449,835 | | | $ | 1,550,480,361 | | | 38,649,596 | | | $ | 1,265,514,960 | |
Institutional Shares | | 3,740,751 | | | | 154,963,204 | | | 1,036,754 | | | | 27,794,739 | |
Retirement Shares | | 103 | | | | 4,238 | | | — | | | | — | |
Issued as reinvestment of dividends | | | | | | | | | | | | | | |
Shares | | 647,698 | | | | 24,887,348 | | | 408,200 | | | | 11,870,494 | |
Institutional Shares | | 3,356 | | | | 131,791 | | | 1,230 | | | | 36,028 | |
Redeemed | | | | | | | | | | | | | | |
Shares | | (18,527,714 | ) | | | (724,974,993 | ) | | (18,583,380 | ) | | | (585,647,998 | ) |
Institutional Shares | | (873,380 | ) | | | (36,474,886 | ) | | (19,867 | ) | | | (715,478 | ) |
Retirement Shares | | (75 | ) | | | (3,149 | ) | | — | | | | — | |
| | |
|
| |
|
|
| |
|
| |
|
|
|
Net Increase (Decrease) | | 24,440,574 | | | $ | 969,013,914 | | | 21,492,533 | | | $ | 718,852,745 | |
| | |
|
| |
|
|
| |
|
| |
|
|
|
| |
| | | Mid Cap Value Fund
| |
| | | Year Ended
03/31/05
| | | Year Ended
03/31/04
| |
| | | Shares
| | | Amounts
| | | Shares
| | | Amounts
| |
Sold | | | | | | | | | | | | | | |
Shares | | 4,506,275 | | | $ | 71,247,527 | | | 9,417,352 | | | $ | 127,160,451 | |
Institutional Shares | | 1,440,444 | | | | 23,328,088 | | | 3,131,670 | | | | 45,488,248 | |
Retirement Shares | | 68 | | | | 1,150 | | | — | | | | — | |
Issued as reinvestment of dividends | | | | | | | | | | | | | | |
Shares | | 65,005 | | | | 1,086,350 | | | 7,386 | | | | 94,100 | |
Institutional Shares | | 40,959 | | | | 681,342 | | | 179 | | | | 2,276 | |
Redeemed | | | | | | | | | | | | | | |
Shares | | (3,620,972 | ) | | | (58,289,434 | ) | | (5,489,526 | ) | | | (75,728,071 | ) |
Institutional Shares | | (1,119,376 | ) | | | (18,369,260 | ) | | (1,138,246 | ) | | | (13,632,176 | ) |
Redemption in-kind | | (1,892,982 | ) | | | (33,430,054 | ) | | — | | | | — | |
| | |
|
| |
|
|
| |
|
| |
|
|
|
Net Increase (Decrease) | | (580,579 | ) | | $ | (13,744,291 | ) | | 5,928,815 | | | $ | 83,384,828 | |
| | |
|
| |
|
|
| |
|
| |
|
|
|
77
| | | | | | | | | | | | | | |
| | | Energy and Natural Resources Fund
| |
| | | Year Ended
03/31/05
| | | Year Ended
03/31/04
| |
| | | Shares
| | | Amounts
| | | Shares
| | | Amounts
| |
Sold | | | | | | | | | | | | | | |
Shares | | 6,720,085 | | | $ | 134,647,171 | | | 4,504,249 | | | $ | 64,768,581 | |
Issued as reinvestment of dividends | | | | | | | | | | | | | | |
Shares | | 370,420 | | | | 6,947,444 | | | 15,674 | | | | 206,503 | |
Redeemed | | | | | | | | | | | | | | |
Shares | | (2,879,496 | ) | | | (54,059,904 | ) | | (3,287,604 | ) | | | (45,884,215 | ) |
Redemption in-kind | | (249,566 | ) | | | (5,779,941 | ) | | — | | | | — | |
| | |
|
| |
|
|
| |
|
| |
|
|
|
Net Increase (Decrease) | | 3,961,443 | | | $ | 81,754,770 | | | 1,232,319 | | | $ | 19,090,869 | |
| | |
|
| |
|
|
| |
|
| |
|
|
|
| |
| | | Real Estate Fund
| |
| | | Year Ended
03/31/05
| | | Year Ended
03/31/04
| |
| | | Shares
| | | Amounts
| | | Shares
| | | Amounts
| |
Sold | | | | | | | | | | | | | | |
Shares | | 4,646,651 | | | $ | 42,090,605 | | | 8,266,532 | | | $ | 63,671,391 | |
Issued as reinvestment of dividends | | | | | | | | | | | | | | |
Shares | | 327,236 | | | | 2,958,693 | | | 71,903 | | | | 551,312 | |
Redeemed | | | | | | | | | | | | | | |
Shares | | (5,186,990 | ) | | | (46,102,897 | ) | | (6,950,905 | ) | | | (52,882,782 | ) |
Redemption in-kind | | (1,048,440 | ) | | | (10,264,224 | ) | | — | | | | — | |
| | |
|
| |
|
|
| |
|
| |
|
|
|
Net Increase (Decrease) | | (1,261,543 | ) | | $ | (11,317,823 | ) | | 1,387,530 | | | $ | 11,339,921 | |
| | |
|
| |
|
|
| |
|
| |
|
|
|
| |
| | | Equity Income Fund
| |
| | | Year Ended
03/31/05
| | | Period Ended
03/31/04*
| |
| | | Shares
| | | Amounts
| | | Shares
| | | Amounts
| |
Sold | | | | | | | | | | | | | | |
Shares | | 12,455,777 | | | $ | 99,825,944 | | | 13,207,804 | | | $ | 99,187,559 | |
Retirement Shares | | 136 | | | | 1,150 | | | — | | | | — | |
Issued as reinvestment of dividends | | | | | | | | | | | | | | |
Shares | | 77,738 | | | | 622,458 | | | 5,633 | | | | 41,579 | |
Redeemed | | | | | | | | | | | | | | |
Shares | | (2,085,368 | ) | | | (16,772,371 | ) | | (326,844 | ) | | | (2,473,071 | ) |
| | |
|
| |
|
|
| |
|
| |
|
|
|
Net Increase (Decrease) | | 10,448,283 | | | $ | 83,677,181 | | | 12,886,593 | | | $ | 96,756,067 | |
| | |
|
| |
|
|
| |
|
| |
|
|
|
78
| | | | | | | | | | | | | | |
| | | Equity Core Fund
| |
| | | Year Ended
03/31/05
| | | Period Ended
03/31/04**
| |
| | | Shares
| | | Amounts
| | | Shares
| | | Amounts
| |
Sold | | | | | | | | | | | | | | |
Shares | | 4,146,420 | | | $ | 43,209,200 | | | 10 | | | $ | 100 | |
Institutional Shares | | 4,994,257 | | | | 56,502,175 | | | — | | | | — | |
Issued as reinvestment of dividends | | | | | | | | | | | | | | |
Shares | | 2,246 | | | | 23,331 | | | — | | | | — | |
Redeemed | | | | | | | | | | | | | | |
Shares | | (179,102 | ) | | | (1,884,818 | ) | | — | | | | — | |
Institutional Shares | | (93,928 | ) | | | (1,044,842 | ) | | — | | | | — | |
| | |
|
| |
|
|
| |
|
| |
|
|
|
Net Increase (Decrease) | | 8,869,893 | | | $ | 96,805,046 | | | 10 | | | $ | 100 | |
| | |
|
| |
|
|
| |
|
| |
|
|
|
| |
| | | International Fund
| |
| | | Year Ended
03/31/05
| | | Year Ended
03/31/04
| |
| | | Shares
| | | Amounts
| | | Shares
| | | Amounts
| |
Sold | | | | | | | | | | | | | | |
Shares | | 11,128,396 | | | $ | 135,738,549 | | | 2,860,938 | | | $ | 27,374,650 | |
Issued as reinvestment of dividends | | | | | | | | | | | | | | |
Shares | | 540 | | | | 5,983 | | | 12,649 | | | | 129,149 | |
Issued in connection with merger | | 2,194,980 | | | | 22,740,352 | | | — | | | | — | |
Redeemed | | | | | | | | | | | | | | |
Shares | | (6,452,142 | ) | | | (78,715,450 | ) | | (4,454,816 | ) | | | (39,226,864 | ) |
Redemption fee | | — | | | | 11,008 | | | — | | | | 60,466 | |
| | |
|
| |
|
|
| |
|
| |
|
|
|
Net Increase (Decrease) | | 6,871,774 | | | $ | 79,780,442 | | | (1,581,229 | ) | | $ | (11,662,599 | ) |
| | |
|
| |
|
|
| |
|
| |
|
|
|
| |
| | | Pacific/Asia Fund
| |
| | �� | Year Ended
03/31/05
| | | Year Ended
03/31/04
| |
| | | Shares
| | | Amounts
| | | Shares
| | | Amounts
| |
Sold | | | | | | | | | | | | | | |
Shares | | 6,880,415 | | | $ | 57,331,130 | | | 11,858,691 | | | $ | 85,179,338 | |
Issued as reinvestment of dividends | | | | | | | | | | | | | | |
Shares | | 3,310 | | | | 26,777 | | | — | | | | — | |
Redeemed | | | | | | | | | | | | | | |
Shares | | (5,346,261 | ) | | | (43,870,251 | ) | | (3,493,012 | ) | | | (23,959,144 | ) |
Redemption fee | | — | | | | 8,645 | | | — | | | | 39,399 | |
| | |
|
| |
|
|
| |
|
| |
|
|
|
Net Increase (Decrease) | | 1,537,464 | | | $ | 13,496,301 | | | 8,365,679 | | | $ | 61,259,593 | |
| | |
|
| |
|
|
| |
|
| |
|
|
|
79
| | | | | | | | | | | | | | |
| | | Emerging Markets Fund
| |
| | | Year Ended
03/31/05
| | | Year Ended
03/31/04
| |
| | | Shares
| | | Amounts
| | | Shares
| | | Amounts
| |
Sold | | | | | | | | | | | | | | |
Shares | | 37,020,633 | | | $ | 308,671,668 | | | 25,421,706 | | | $ | 167,022,946 | |
Institutional Shares | | 57 | | | | 500 | | | — | | | | — | |
Issued as reinvestment of dividends | | | | | | | | | | | | | | |
Shares | | 627,999 | | | | 5,340,759 | | | 55,746 | | | | 372,970 | |
Redeemed | | | | | | | | | | | | | | |
Shares | | (15,283,468 | ) | | | (117,126,423 | ) | | (5,499,805 | ) | | | (36,825,422 | ) |
Redemption fee | | — | | | | 76,701 | | | — | | | | 608 | |
| | |
|
| |
|
|
| |
|
| |
|
|
|
Net Increase (Decrease) | | 22,365,221 | | | $ | 196,963,205 | | | 19,977,647 | | | $ | 130,571,102 | |
| | |
|
| |
|
|
| |
|
| |
|
|
|
| * | Equity Income Fund commenced operations on September 30, 2003. |
| ** | Equity Core Fund commenced operations on March 31, 2004. |
6. Line of Credit:
During the year ended March 31, 2005, the Funds and other affiliated funds participated in a $50 million unsecured line of credit provided by a syndication of banks under a line of credit agreement. A commitment fee, equal to an annual rate of 0.15% of the average daily unused portion of the line of credit, is allocated among the participating Funds at the end of each quarter, and is included in miscellaneous expenses on the statements of operations. For the year ended March 31, 2005, the Funds had no borrowings under the agreement. Effective March 9, 2005, the unsecured line of credit was terminated.
7. Guarantees:
In the normal course of business, the Funds enter into contracts that provide general indemnifications. The Funds’ maximum exposure under these arrangements is dependent on future claims that may be made against the Funds, and, therefore, cannot be established; however, based on experience, the risk of loss from such claims is considered remote.
8. Legal Proceedings:
The Adviser and Excelsior Funds, Inc., Excelsior Tax-Exempt Funds, Inc., and Excelsior Funds Trust (the “Companies”) were contacted in September, 2003 by the Office of the New York State Attorney General (the “NYAG”), and the Adviser was contacted by the Securities and Exchange Commission (the “SEC”) in connection with their investigations of practices in the mutual fund industry identified as “market timing” and “late trading” of mutual fund shares (the “Investigations”). The Adviser and the Companies have cooperated with respect to these Investigations. As disclosed previously by the Adviser and its affiliates, with respect to the Adviser, these investigations have focused on circumstances in which a small number of parties were permitted to engage in short-term trading of certain Excelsior Funds. The short-term trading activities permitted under these arrangements have been terminated and the Adviser has strengthened its policies and procedures to deter frequent trading in the Companies.
80
Five class actions filed against the Companies and two derivative actions purportedly brought on behalf of each of the Companies and each of the funds have been transferred to the United District Court for the District of Maryland for coordinated or consolidated pre-trial proceedings in a matter styled In Re Mutual Funds Investment Litigation, MDL Docket No. 1586. Lead plaintiffs were appointed and additional defendants were added (generally consisting of current and former directors and officers of the Companies). The five class actions were then consolidated and a single amended complaint was filed on or about September 29, 2004. Plaintiffs in the consolidated class action are seeking unspecified monetary damages from claimed injuries arising from allegedly illegal and improper mutual fund trading practices, as well as disgorgement of investment advisory fees, rescission and restitution of unspecified funds. The two derivative actions were also consolidated into a new amended complaint, also filed on or about September 29, 2004. Plaintiffs in the consolidated derivative action are seeking, on behalf of the Companies, unspecified monetary damages for similar claimed injuries, as well as removal of Excelsior Fund directors, removal of U.S. Trust as advisor to the Excelsior Funds, rescission of its investment advisory contracts and disgorgement of management fees and compensation relating to the Excelsior Funds.
The defendants in the consolidated actions have moved to dismiss such actions, and the Maryland court is scheduled to hear oral argument on the motions to dismiss on June 16-17, 2005. The defendants will not be required to answer the complaints until such motions have been decided, and discovery in the actions is currently stayed.
While the ultimate outcome of these matters cannot be predicted with any certainty at this time, based on currently available information, the Adviser believes that the likelihood is remote that the pending private lawsuits and Investigations will have a material adverse financial impact on the Companies, and further believes that the pending Investigations and private lawsuits are not likely to materially affect the Adviser’s ability to provide investment management services to the Companies.
9. Merger:
On November 14, 2003, the Board of Directors of Excelsior Fund approved a proposed Plan of Reorganization (the “Plan”) of the Pan European Fund into the International Fund. Pan European Fund’s shareholders approved the proposed Plan at a special meeting held on April 7, 2004, and reconvened on April 21, 2004 and May 12, 2004.
At the close of business on May 14, 2004, in accordance with the Plan, all of the assets and liabilities of the Pan European Fund were transferred to the International Fund and all shares of the Pan European Fund were reclassified as shares of International Fund, and each holder of shares of Pan European Fund was issued full and fractional shares of the International Fund with the same aggregate dollar value as the shareholder had in the Pan European Fund immediately before the transaction. In accordance with the Plan, 2,721,234 shares of the Pan European Fund were exchanged for 2,194,980 shares of the International Fund in a tax-free exchange.
The value of the Pan European Fund on May 14, 2004 was $22,740,352, which included $952,224 in unrealized gains, $(1,417) of accumulated net investment losses, and $(32,409,541) of accumulated net realized losses on investments. Upon the business combination of the Pan European Fund and International Fund on May 14, 2004, the value of the International Fund combined with the Pan European Fund was $153,058,555.
81
10. Other Federal Tax Information (Unaudited):
For corporate shareholders, the following percentage of the total ordinary income distributions paid during the fiscal year ended March 31, 2005, qualify for the corporate dividends received deduction for the following Funds:
| | | |
Fund
| | Percentage
| |
Blended Equity Fund | | 100.00 | % |
Value and Restructuring Fund | | 99.85 | % |
Mid Cap Value Fund | | 93.48 | % |
Energy and Natural Resources Fund | | 54.89 | % |
Equity Income Fund | | 95.04 | % |
82
REPORT OF INDEPENDENT REGISTERED PUBLIC ACCOUNTING FIRM
To the Board of Directors/Trustees and Shareholders of
Excelsior Funds, Inc. and Excelsior Funds Trust
We have audited the accompanying statements of assets and liabilities, including the portfolios of investments, of the Blended Equity Fund, Large Cap Growth Fund, Small Cap Fund, Value and Restructuring Fund, Mid Cap Value Fund, Energy and Natural Resources Fund, Real Estate Fund, Equity Income Fund, Equity Core Fund, International Fund, Pacific/Asia Fund, and Emerging Markets Fund (nine of the portfolios constituting the Excelsior Funds, Inc. and three of the portfolios constituting the Excelsior Funds Trust) (collectively, the “Funds”) as of March 31, 2005, and the related statements of operations for the year then ended, the statements of changes in net assets and the financial highlights (Shares) for each of the two years in the period then ended. These financial statements and financial highlights are the responsibility of the Funds’ management. Our responsibility is to express an opinion on these financial statements and financial highlights based on our audits. The financial highlights for each of the years in the three year period ended March 31, 2003 were audited by other auditors whose reports dated May 16, 2003, expressed an unqualified opinion on those financial highlights.
We conducted our audits in accordance with the standards of the Public Company Accounting Oversight Board (United States). Those standards require that we plan and perform the audit to obtain reasonable assurance about whether the financial statements and financial highlights are free of material misstatement. The Funds are not required to have, nor were we engaged to perform, an audit of their internal control over financial reporting. Our audit included consideration of internal control over financial reporting as a basis for designing audit procedures that are appropriate in the circumstances, but not for the purpose of expressing an opinion on the effectiveness of the Funds’ internal control over financial reporting. Accordingly, we express no such opinion. An audit also includes examining, on a test basis, evidence supporting the amounts and disclosures in the financial statements, assessing the accounting principles used and significant estimates made by management, as well as evaluating the overall financial statement presentation. Our procedures included confirmation of securities owned as of March 31, 2005, by correspondence with the custodian and brokers; where replies were not received from brokers, we performed other auditing procedures. We believe that our audits provide a reasonable basis for our opinion.
In our opinion, the financial statements and financial highlights referred to above present fairly, in all material respects, the financial position of Blended Equity Fund, Large Cap Growth Fund, Small Cap Fund, Value and Restructuring Fund, Mid Cap Value Fund, Energy and Natural Resources Fund, Real Estate Fund, Equity Income Fund, Equity Core Fund, International Fund, Pacific/Asia Fund, and Emerging Markets Fund as of March 31, 2005, the results of their operations for the year then ended, and the changes in their net assets and the financial highlights for each of the two years in the period then ended, in conformity with accounting principles generally accepted in the United States of America.
DELOITTE & TOUCHE LLP
New York, New York
May 27, 2005
83
Directors/Trustees and Officers of the Excelsior Funds Complex (Unaudited)
Information pertaining to the Directors/Trustees and Officers of Excelsior Fund, Excelsior Tax-Exempt Fund and Excelsior Funds Trust (each a “Company” and collectively, the “Excelsior Funds Complex”) is set forth below. Directors/Trustees who are not deemed to be “interested persons” of the Excelsior Funds Complex as defined in the 1940 Act are referred to as “Independent Board Members.” Directors/Trustees who are deemed to be “interested persons” of the Excelsior Funds Complex are referred to as “Interested Board Members”. The following information is as of May 20, 2005.
| | | | | | |
Name and Address(1) Age Time Served with the Excelsior Funds Complex
| | Principal Occupation
During the Past Five Years
| | Number of
Portfolios in Fund Complex Overseen by Director/Trustee(3)
| | Other Directorships Held by Director/Trustee(4)
|
DIRECTORS/TRUSTEES(2) INDEPENDENT BOARD MEMBERS | | | | |
Frederick S. Wonham
Age: 74
Since 1997 | | Retired. Chairman of the Boards and Director (since 1997) and President and Treasurer (from 1995 to February 2002) of Excelsior Funds, Inc. and Excelsior Tax-Exempt Funds, Inc.; Chairman of the Board and Trustee (since 1997) and President and Treasurer (from 1995 to February 2002) of Excelsior Funds Trust. | | 29 | | None. |
| | | |
Rodman L. Drake
Age: 62
Since 1994 | | Director of Excelsior Funds, Inc. and Excelsior Tax-Exempt Funds, Inc. (since 1996); Trustee of Excelsior Funds Trust (since 1994); Director, Crystal River Capital Inc. (a private REIT) (since March 2005); Director, Parson Brinkerhoff, Inc. (engineering firm) (since 1995); Co-Founder of Baringo Capital LLC (since 2002); President, Continuation Investments Group, Inc. (from 1997 to 2001). | | 29 | | Director and Chairman, Hyperion Total Return Fund, Inc., Hyperion Strategic Mortgage Fund Inc., and Hyperion 2005 Term Trust Inc. (since 1991); Director, Jackson Hewitt Inc. (since June 2004). |
| | | |
Morrill Melton ("Mel") Hall, Jr.
Age: 60
Since 2000 | | Director of Excelsior Funds, Inc. and Excelsior Tax-Exempt Funds, Inc. (since 2000); Trustee of Excelsior Funds Trust (since 2000); Chairman and Chief Executive Officer, Comprehensive Health Services, Inc. (health care management and administration) (since 1991). | | 29 | | None. |
| | | |
Roger M. Lynch
Age: 64
Since 2001 | | Retired. Director of Excelsior Funds, Inc. and Excelsior Tax- Exempt Funds, Inc. and Trustee of Excelsior Funds Trust (since 2001); Director, SLD Commodities, Inc. (importer of nuts) (since 1991); President, Corporate Asset Funding Co., Inc. (asset securitization) (from 1987 to 1999); Limited Partner (from 1986 to 1999), Goldman Sachs & Co. | | 29 | | None. |
84
| | | | | | |
Name and Address(1) Age Time Served with the Excelsior Funds Complex
| | Principal Occupation
During the Past Five Years
| | Number of
Portfolios in Fund Complex Overseen by Director/Trustee(3)
| | Other Directorships Held by Director/Trustee(4)
|
Jonathan Piel
Age: 66
Since 1994 | | Retired. Director, Excelsior Funds, Inc. and Excelsior Tax-Exempt Funds, Inc. (since 1996); Trustee, Excelsior Funds Trust (since 1994). | | 29 | | None. |
| | | |
John. D. Collins
Age: 66
Since 2005 | | Retired. Director, Excelsior Funds, Inc. and Excelsior Tax-Exempt Funds, Inc. (since 2005); Trustee, Excelsior Funds Trust (since 2005). Consultant, KPMG, LLP (from July 1999 to June 2000); Partner, KPMG, LLP (from March 1962 to June 1999). | | 29 | | Director, CCC Information Services Inc. (software to automate process of settling automobile claims) (since September 2004); Director, Mrs. Fields’ Companies, Inc. (consumer products) (since December 2004). |
| INTERESTED BOARD MEMBER(5) | | | | |
James L. Bailey
114 West 47th Street
New York, NY 10036
Age: 59
Since 2004 | | Chief Operating Officer of U.S. Trust Corporation (since December 2004) and Executive Vice President of U.S. Trust Corporation and United States Trust Company of New York (since 2003); President, Excelsior Funds, Inc., Excelsior Tax-Exempt Funds, Inc. and Excelsior Funds Trust (from 2003 to July 2004); Consultant in the financial services industry (from August 2000 to January 2003); Executive Vice President of Citicorp (from 1992 to August 2000). | | 29 | | None. |
| OFFICERS | | | | | | |
Mary Martinez
114 West 47th Street
New York, NY 10036
Age: 45
President
Since July 2004 | | Managing Director of United States Trust Company of New York (since 2003) and Chief Executive Officer of National Private Banking (since October 2004); Managing Director and Director of Relationship Management Service, Marketing, Information and Technology at Bessemer Trust (from 1998 to 2003). | | N/A | | N/A |
| | | |
Joseph Trainor, CFA
114 West 47th Street
New York, NY 10036
Age: 44
Vice President
Since February 2004 | | Managing Director of United States Trust Company of New York and President, U.S. Trust Institutional (since 2003); President of MFS Institutional Advisors (from 1998 to 2002). | | N/A | | N/A |
85
| | | | | | |
Name and Address(1) Age Time Served with the Excelsior Funds Complex
| | Principal Occupation
During the Past Five Years
| | Number of
Portfolios in Fund Complex Overseen by Director/Trustee(3)
| | Other Directorships Held by Director/Trustee(4)
|
Agnes Mullady
225 High Ridge Road
Stamford, CT 06905
Age: 46
Treasurer/Chief Financial and
Chief Accounting Officer
Since February 2004 | | Senior Vice President, U.S. Trust Company, N.A. (since 2004); Chief Financial Officer, AMIC Distribution Partners (from 2002 to 2004); Controller Reserve Management Corporation, Reserve Management Company, Inc. and Reserve Partners, Inc. (from 2000 to 2002); Vice President and Treasurer, Northstar Funds; Senior Vice President and Chief Financial Officer, Northstar Investment Management Corp.; President and Treasurer, Northstar Administrators Corp.; and Vice President and Treasurer, Northstar Distributors, Inc. (from 1993 to 2000). | | N/A | | N/A |
| | | |
Scott Rhodes
225 High Ridge Road
Stamford, CT 06905
Age: 46
Vice President and
Assistant Treasurer
Since November 2004 | | Vice President, U.S. Trust Company, N.A. (since August 2004); Vice President, BlackRock Financial Management, Inc. (2004); Controller, Mutual Funds, American Skandia Investment Services, Inc. and Assistant Treasurer, American Skandia Trust and American Skandia Advisor Funds, Inc. (from 1996 to 2003). | | N/A | | N/A |
| | | |
Alexandra Poe
114 West 47th Street
New York, NY 10036
Age: 44
Secretary and
Chief Legal Officer
Since May 2004 | | Senior Vice President and Assistant General Counsel, United States Trust Company of New York (since May 2004); Chief Legal Officer for Managed Accounts and Alternative Investment Strategies, Prudential Investments (from 2001 to 2004); Senior Vice President and General Counsel, US Investment Management and Global Hedge Funds and President of the Schroder Mutual Funds, Schroders (from 1996 to 2001). | | N/A | | N/A |
| | | |
Sharon M. Davison
114 West 47th Street
New York, NY 10036
Age: 50
Chief Compliance Officer
Since September 2004 | | Senior Vice President of U.S. Trust Company of New York (since 2001); Director of Securities and Corporate Compliance (since 2001); Director of Special Investigations-New York Stock Exchange Division of Market Surveillance (from 2000 to 2001); Senior Counsel-New York Stock Exchange Division of Market Surveillance (from 1997 to 2000). | | N/A | | N/A |
86
| | | | | | |
Name and Address(1) Age Time Served with the Excelsior Funds Complex
| | Principal Occupation
During the Past Five Years
| | Number of
Portfolios in Fund Complex Overseen by Director/Trustee(3)
| | Other Directorships Held by Director/Trustee(4)
|
Wyndham Clark
225 High Ridge Road
Stamford, CT 06905
Age: 47
Anti-Money Laundering Officer
Since May 2004 | | Vice President and AML Officer, U.S. Trust Company, N.A. (since 2003); Vice President and Deputy Director Risk Management, IBJ Whitehall (banking) (from 2001 to 2002); and Vice President and Chief Risk Officer, EMAC, LLC (commercial lender, asset backed security issuer) (from 1999 to 2001). | | N/A | | N/A |
| | | |
Ralph Pastore
225 High Ridge Road
Stamford, CT 06905
Age: 35
Vice President
Since May 2005 | | Vice President, U.S. Trust Company, N.A. (since 2001); Director, Mutual Fund Operations, American Skandia Investment Services, Inc. (from 1998 to 2001) | | N/A | | N/A |
| (1) | Each independent director/trustee may be contacted by writing to Excelsior Funds, 225 High Ridge Road, Stamford, CT 06905. |
| (2) | Each director/trustee shall hold office until the election and qualification of his or her successor, or until he or she sooner dies, resigns or is removed. The officers of each Company shall hold office for a one year term and until their respective successors are chosen and qualified, or in each case until he or she sooner dies, resigns, is removed, or becomes disqualified in accordance with each Company’s by-laws. |
| (3) | The Excelsior Funds Complex consists of all registered investment companies (Excelsior Funds Inc., Excelsior Tax-Exempt Funds, Inc. and Excelsior Funds Trust) for which U.S. Trust serves as investment adviser. As of May 20, 2005, the Excelsior Funds Complex consisted of 29 Funds. |
| (4) | Directorships of companies required to report to the Securities and Exchange Commission under the Securities Exchange Act of 1934 (i.e., “public companies”) or other investment companies registered under the 1940 Act. |
| (5) | “Interested person” of the Company is defined in the 1940 Act. Mr. Bailey is considered an “interested person” because of his affiliation with the Adviser. |
For more information regarding the Directors/Trustees and Officers, please refer to the Statement of Additional Information, which is available upon request by calling 1-800-446-1012.
87
DISCLOSURE OF FUND EXPENSES (Unaudited)
We believe it is important for you to understand the impact of fees regarding your investment. As a shareholder of the fund, you incur ongoing, or operating costs, which include costs for portfolio management, administrative services, and shareholder reports (like this one), among others. Operating expenses, which are deducted from a fund’s gross income, directly reduce the investment return of the fund. A fund’s expenses are expressed as a percentage of its average net assets. This figure is known as the expense ratio. The following examples are intended to help you understand the ongoing costs (in dollars) of investing in your fund and to compare these costs with those of other mutual funds. The examples are based on an investment of $1,000 made at the beginning of the period shown and held for the entire period.
The table on the following page illustrates your fund’s costs in two ways.
| | · | Actual expenses. This section provides information about actual account values and actual expenses based on the Funds’ actual return for the period. This section is designed to help you to estimate the actual expenses after fee waivers that you paid over the period. The “Ending Account Value” shown is derived from the fund’s actual return, and the fourth column shows the dollar amount that would have been paid by an investor who started with $1,000 in the fund. You may use the information here, together with the amount you invested, to estimate the expenses that you paid over the period. |
To do so, simply divide your account value by $1,000 (for example, an $8,600 account value divided by $1,000 = $8.6), then multiply the result by the number given for your fund under the heading “Expenses Paid During Period”.
| | · | Hypothetical expenses. This section provides information about hypothetical account values and hypothetical expenses that would have been incurred by an investor in the Fund based on an assumed rate of return of 5% per year before expenses. This section is designed to help you compare your fund’s costs with those of other mutual funds. It assumes that the fund had a return of 5% before expenses during the year, but that the expense ratio is unchanged. In this case, because the return used is not the fund’s actual return, the results cannot be used to estimate the actual ending account balance or expenses you paid for the period. You may use this information to compare the ongoing costs of investing in your Fund and other funds. To do so, compare this 5% hypothetical example with the 5% hypothetical examples that appear in shareholder reports of other funds. |
88
DISCLOSURE OF FUND EXPENSES (Unaudited) (Continued)
Please note that the expenses shown in the table are meant to highlight and help you compare ongoing costs only, which are described in the Prospectus. Therefore, the hypothetical example is useful in comparing ongoing costs only, and will not help you determine the relative total costs of owning different funds.
| | | | | | | | | | | | |
| | | Beginning
Account
Value
9/30/2004
| | Ending
Account
Value
3/31/2005
| | Annualized
Expense
Ratios**
| | | Expenses Paid
During Period*
|
Actual Fund Return | | | | | | | | | | | | |
Blended Equity Fund — Shares | | $ | 1,000.00 | | $ | 1,097.80 | | 1.05 | % | | $ | 5.49 |
Large Cap Growth Fund — Shares | | | 1,000.00 | | | 1,074.80 | | 1.05 | % | | | 5.43 |
Small Cap Fund — Shares | | | 1,000.00 | | | 1,050.70 | | 1.05 | % | | | 5.37 |
Value and Restructuring Fund — Shares | | | 1,000.00 | | | 1,093.80 | | 1.07 | % | | | 5.59 |
Mid Cap Value Fund — Shares | | | 1,000.00 | | | 1,106.90 | | 1.06 | % | | | 5.57 |
Energy and Natural Resources Fund — Shares | | | 1,000.00 | | | 1,234.40 | | 1.10 | % | | | 6.13 |
Real Estate Fund — Shares | | | 1,000.00 | | | 1,076.30 | | 1.20 | % | | | 6.21 |
Equity Income Fund — Shares | | | 1,000.00 | | | 1,092.90 | | 1.05 | % | | | 5.48 |
Equity Core Fund — Shares | | | 1,000.00 | | | 1,097.90 | | 1.05 | % | | | 5.49 |
International Fund — Shares | | | 1,000.00 | | | 1,163.00 | | 1.50 | % | | | 8.09 |
Pacific/Asia Fund — Shares | | | 1,000.00 | | | 1,135.50 | | 1.50 | % | | | 7.99 |
Emerging Markets Fund — Shares | | | 1,000.00 | | | 1,172.20 | | 1.70 | % | | | 9.21 |
| | | | |
Hypothetical 5% Return | | | | | | | | | | | | |
Blended Equity Fund — Shares | | | 1,000.00 | | | 1,019.70 | | 1.05 | % | | | 5.29 |
Large Cap Growth Fund — Shares | | | 1,000.00 | | | 1,019.70 | | 1.05 | % | | | 5.29 |
Small Cap Fund — Shares | | | 1,000.00 | | | 1,019.70 | | 1.05 | % | | | 5.29 |
Value and Restructuring Fund — Shares | | | 1,000.00 | | | 1,019.60 | | 1.07 | % | | | 5.39 |
Mid Cap Value Fund — Shares | | | 1,000.00 | | | 1,019.65 | | 1.06 | % | | | 5.34 |
Energy and Natural Resources Fund — Shares | | | 1,000.00 | | | 1,019.45 | | 1.10 | % | | | 5.54 |
Real Estate Fund — Shares | | | 1,000.00 | | | 1,018.95 | | 1.20 | % | | | 6.04 |
Equity Income Fund — Shares | | | 1,000.00 | | | 1,019.70 | | 1.05 | % | | | 5.29 |
Equity Core Fund — Shares | | | 1,000.00 | | | 1,019.70 | | 1.05 | % | | | 5.29 |
International Fund — Shares | | | 1,000.00 | | | 1,017.45 | | 1.50 | % | | | 7.54 |
Pacific/Asia Fund — Shares | | | 1,000.00 | | | 1,017.45 | | 1.50 | % | | | 7.54 |
Emerging Markets Fund — Shares | | | 1,000.00 | | | 1,016.45 | | 1.70 | % | | | 8.55 |
| * | Expenses are equal to the Fund’s annualized expense ratio multiplied by the average account value over the period, multiplied by the number of days in the most recent fiscal half-year (182) then divided by 365. |
| ** | Annualized expense ratios of certain Funds are after fee waivers and expense reimbursements by the investment adviser. Absent such waivers and reimbursements, expenses paid during the period would have been greater. |
89
AR-EQUITIES-0305/43796

MONEY MARKET
FUNDS
ANNUAL REPORT
March 31, 2005
TABLE OF CONTENTS
For shareholder account information, current price and yield quotations, or to make an initial purchase or obtain a prospectus, call 1-800-446-1012, from overseas, call 617-483-7297.
| Internet | Address: http://www.excelsiorfunds.com |
This report must be preceded or accompanied by a current prospectus.
A description of the policies and procedures that Excelsior Funds use to determine how to vote proxies relating to portfolio securities, as well as information relating to how a Fund voted proxies relating to portfolio securities during the most recent 12-month period ended June 30, is available (i) without charge, upon request, by calling 1-800-446-1012, or (ii) by accessing the Excelsior Funds’ internet address and (iii) on the Commission’s website at http://www.sec.gov.
Excelsior Funds file their June 30 and December 31 schedule of portfolio holdings with the Securities and Exchange Commission, on Form N-Q, within sixty days after the applicable reporting period. Excelsior Funds Form N-Q is available on the Commission’s website at http://www.sec.gov, and may be reviewed and copied at the Commission’s Public Reference Room in Washington, DC. Information on the operation of the Public Reference Room may be obtained by calling 1-800-SEC-0330.
You should consider the Fund’s investment objectives, risks and expenses carefully before you invest. Information about these and other important subjects is in the Fund’s prospectus, which you should read carefully before investing.
Excelsior Funds, Inc. and Excelsior Tax-Exempt Funds, Inc. are distributed by BISYS Fund Services Limited Partnership.
You may write to Excelsior Funds, Inc. and Excelsior Tax-Exempt Funds, Inc. at the following address:
Excelsior Funds
P.O. Box 8529
Boston, MA 02266-8529
SHARES IN THE FUNDS ARE NOT DEPOSITS OR OBLIGATIONS OF, OR GUARANTEED OR ENDORSED BY, UNITED STATES TRUST COMPANY OF NEW YORK, U.S. TRUST COMPANY, N.A., THEIR PARENT AND AFFILIATES AND SHARES ARE NOT INSURED BY THE FEDERAL DEPOSIT INSURANCE CORPORATION, THE FEDERAL RESERVE BOARD, OR ANY OTHER AGENCY. FUND SHARES ARE NOT INSURED OR GUARANTEED BY THE U.S. GOVERNMENT. ALTHOUGH THE FUNDS SEEK TO PRESERVE THE VALUE OF YOUR INVESTMENT AT $1.00 PER SHARE, IT IS POSSIBLE TO LOSE MONEY BY INVESTING IN THE FUNDS.
LETTER TO SHAREHOLDERS
March 31, 2005
Dear Fellow Shareholder:
The fiscal year ended March 31, 2005 was marked by a continuing uptrend in broad based market indices. Financial markets spent much of 2004 waiting to see who would win the U.S. Presidential election. Stocks rose in the post-election period, posting gains from the first week of November to year end. The markets held their ground despite higher than anticipated energy prices. On December 14th, the Standard & Poor’s 500 Index closed above 1200 for the first time since August of 2001, and stocks retained most of their year-end 2004 gains during the first quarter of 2005. Also, the Federal Reserve monetary policy took hold, with its seventh increase in the Federal Funds rate to 2.75% as of the end of the first quarter of 2005.
Going forward, our overall investment theme reflects a preference for goods versus services, real versus financial assets, and “old economy” sectors and industries stocks versus the so-called “new economy”. Creating the cities and the infrastructure that are springing up in giant global emerging economies has raised overall levels of demand for commodities that are in relatively short supply, particularly after a decade or more of capital under investment in tangible producing sectors. We expect to focus on opportunities for above-market returns, and our portfolio managers will aim to capitalize on these prospects as they take shape.
As always, we value your confidence in selecting Excelsior to fulfill your investment needs. We strongly believe that Excelsior’s array of funds will help meet the full range of your financial objectives.
Sincerely,

Mary Martinez
President
1
Excelsior Funds, Inc.
Portfolio of Investments — March 31, 2005
Money Fund
| | | | | |
Principal
| | Security Description
| | Value
|
| | | | | | |
| BANK NOTES — 4.05% | | | |
| $ 70,000,000 | | Bank of America,
2.75%, 05/17/05 | | $ | 70,000,000 |
| | | | |
|
|
| | | TOTAL BANK NOTES
(Cost $70,000,000) | | | 70,000,000 |
| | | | |
|
|
| CERTIFICATES OF DEPOSIT — 23.12% | | | |
| 50,000,000 | | Barclay Bank,
3.02%, 06/30/05 | | | 50,000,000 |
| 75,000,000 | | BNP Paribas,
2.78%, 04/06/05 | | | 75,000,000 |
| 75,000,000 | | First Tennessee Bank,
2.80%, 05/03/05 | | | 74,999,899 |
| 50,000,000 | | HSBC, 2.71%, 05/09/05 | | | 50,001,048 |
| 75,000,000 | | Washington Mutual Corp.,
2.81%, 05/03/05 | | | 75,000,000 |
| 75,000,000 | | Wells Fargo Co.,
2.80%, 05/06/05 | | | 75,000,000 |
| | | | |
|
|
| | | TOTAL CERTIFICATES OF DEPOSIT
(Cost $400,000,947) | | | 400,000,947 |
| | | | |
|
|
| COMMERCIAL PAPER — 34.06% | | | |
| 50,000,000 | | Allied Irish Bank, Discount Note,
2.70%, 05/05/05 | | | 49,872,500 |
| 75,000,000 | | American Express Credit Corp., Discount Note,
2.58%, 04/01/05 | | | 75,000,000 |
| 15,000,000 | | Dupont, Discount Note,
2.83%, 04/01/05 | | | 15,000,000 |
| 75,000,000 | | General Electric Capital Corp., Discount Note,
2.75%, 04/01/05 | | | 75,000,000 |
| 50,000,000 | | HBOS Treasury Services plc, Discount Note,
2.69%, 05/09/05 | | | 49,858,028 |
| 50,000,000 | | International Lease Finance, Discount Note,
2.81%, 05/09/05 | | | 49,851,694 |
| 75,000,000 | | New Center Asset Trust, Discount Note, 2.85%, 05/04/05 | | | 74,804,063 |
| 75,000,000 | | Prudential Funding, Discount Note, 2.82%, 04/01/05 | | | 75,000,000 |
| 75,000,000 | | SLM Corp., Discount Note,
2.76%, 04/06/05(a) | | | 74,971,250 |
| | | | | |
Principal/
Shares
| | Security Description
| | Value
|
| | | | | | |
| COMMERCIAL PAPER — (continued) | | | |
| $ 50,000,000 | | UBS Finance Corp., Discount Note, 2.58%, 04/01/05 | | $ | 50,000,000 |
| | | | |
|
|
| | | TOTAL COMMERCIAL PAPER
(Cost $589,357,535) | | | 589,357,535 |
| | | | |
|
|
| U.S. GOVERNMENT & AGENCY OBLIGATIONS — 26.87% |
| 265,000,000 | | Federal Home Loan Bank, Discount Note,
2.58%, 04/01/05 | | | 265,000,000 |
| 200,000,000 | | Federal National Mortgage Association, Discount Note,
2.50%, 04/01/05 | | | 200,000,000 |
| | | | |
|
|
| | | TOTAL U.S. GOVERNMENT & AGENCY OBLIGATIONS
(Cost $465,000,000) | | | 465,000,000 |
| | | | |
|
|
| REGISTERED INVESTMENT COMPANY — 0.00% |
| 36,433 | | Dreyfus Government Cash Management Fund | | | 36,433 |
| | | | |
|
|
| | | TOTAL REGISTERED INVESTMENT COMPANY
(Cost $36,433) | | | 36,433 |
| | | | |
|
|
| REPURCHASE AGREEMENT — 4.17% | | | |
| 72,200,000 | | Morgan Stanley Dean Witter 2.82%, dated 3/31/05, due 4/1/05, to be repurchased at $72,205,656 (collateralized by U.S. Government obligations ranging in par value $75,000-$31,290,000, 0.00%-6.88%, 4/21/05-9/15/10; total market value $73,920,184) | | | 72,200,000 |
| | | | |
|
|
| | | TOTAL REPURCHASE AGREEMENT
(Cost $72,200,000) | | | 72,200,000 |
| | | | |
|
|
| | | | | | |
TOTAL INVESTMENTS
(Cost $1,596,594,915) | | 92.27 | % | | $ | 1,596,594,915 |
OTHER ASSETS IN EXCESS OF LIABILITIES | | 7.73 | | | | 133,745,500 |
| | |
|
| |
|
|
NET ASSETS | | 100.00 | % | | $ | 1,730,340,415 |
| | |
|
| |
|
|
See Notes to Financial Statements.
2
Excelsior Funds, Inc.
Portfolio of Investments — March 31, 2005
Money Fund — (continued)
| (a) | Security exempt from registration under Rule 144A of the Securities Act of 1933. This security may be resold in transactions exempt from registration, normally to qualified institutional buyers. At March 31, 2005, these securities amounted to $74,971,250 or 4.33% of net assets. |
Discount Note—The rate reported is the discount rate at the time of purchase.
plc—public liability company
The summary of the Fund’s investments as of March 31, 2005 is as follows: (Unaudited)
| | | | | | |
Portfolio Diversification
| | % of
Net
Assets
| | | Value
|
Commercial Paper | | 34.06 | % | | $ | 589,357,535 |
U.S. Government Agency Mortgage Obligations | | 26.87 | | | | 465,000,000 |
Certificates of Deposit | | 23.12 | | | | 400,000,947 |
Repurchase Agreement | | 4.17 | | | | 72,200,000 |
Bank Notes | | 4.05 | | | | 70,000,000 |
Registered Investment Company | | 0.00 | | | | 36,433 |
| | |
|
| |
|
|
Total Investments | | 92.27 | % | | $ | 1,596,594,915 |
Other Assets and Liabilities (Net) | | 7.73 | | | | 133,745,500 |
| | |
|
| |
|
|
Net Assets | | 100.00 | % | | $ | 1,730,340,415 |
| | |
|
| |
|
|
See Notes to Financial Statements.
3
Excelsior Funds, Inc.
Portfolio of Investments — March 31, 2005
Government Money Fund
| | | | | |
Principal/
Shares
| | Security Description
| | Value
|
| U.S. GOVERNMENT & AGENCY OBLIGATIONS — 65.34% |
| $ 70,000,000 | | Federal Farm Credit Bank, Discount Note, 2.56%, 04/04/05 | | $ | 69,985,067 |
| 54,100,000 | | Federal Home Loan Bank, Discount Note, 2.58%, 04/01/05 | | | 54,100,000 |
| 200,000,000 | | Federal National Mortgage Association, Discount Note, 2.50%, 04/01/05 | | | 199,999,999 |
| | | | |
|
|
| | | TOTAL U.S. GOVERNMENT & AGENCY OBLIGATIONS
(Cost $324,085,066) | | | 324,085,066 |
| | | | |
|
|
| REGISTERED INVESTMENT COMPANY — 0.01% |
| 66,578 | | Dreyfus Treasury Prime Cash Management Fund | | | 66,578 |
| | | | |
|
|
| | | TOTAL REGISTERED INVESTMENT COMPANY
(Cost $66,578) | | | 66,578 |
| | | | |
|
|
| | | | | |
Principal
| | Security Description
| | Value
|
| REPURCHASE AGREEMENT — 4.11% |
| $ 20,400,000 | | Morgan Stanley Dean Witter 2.82%, dated 03/31/05, due 04/01/05, to be repurchased at $20,401,598 (collateralized by U.S. Treasury Obligation, total market value $20,855,310) | | $ | 20,400,000 |
| | | | |
|
|
| | | TOTAL REPURCHASE AGREEMENT
(Cost $20,400,000) | | | 20,400,000 |
| | | | |
|
|
| | | | | | |
TOTAL INVESTMENTS
(Cost $344,551,644) | | 69.46 | % | | $ | 344,551,644 |
OTHER ASSETS IN EXCESS OF LIABILITIES | | 30.54 | | | | 151,474,884 |
| | |
|
| |
|
|
NET ASSETS | | 100.00 | % | | $ | 496,026,528 |
| | |
|
| |
|
|
Discount Note—The rate reported is the discount rate at the time of purchase.
The summary of the Fund’s investments as of March 31, 2005 is as follows: (Unaudited)
| | | | | | |
Portfolio Diversification
| | % of
Net
Assets
| | | Value
|
U.S. Government & Agency Obligations | | 65.34 | % | | $ | 324,085,066 |
Repurchase Agreement | | 4.11 | | | | 20,400,000 |
Registered Investment Company | | 0.01 | | | | 66,578 |
| | |
|
| |
|
|
Total Investments | | 69.46 | % | | $ | 344,551,644 |
Other Assets and Liabilities (Net) | | 30.54 | | | | 151,474,884 |
| | |
|
| |
|
|
Net Assets | | 100.00 | % | | $ | 496,026,528 |
| | |
|
| |
|
|
See Notes to Financial Statements.
4
Excelsior Funds, Inc.
Portfolio of Investments — March 31, 2005
Treasury Money Fund
| | | | | |
Principal
| | Security
Description
| | Value
|
| U.S. GOVERNMENT & AGENCY OBLIGATIONS — 13.90% |
| $ 25,000,000 | | Federal Farm Credit Bank, Discount Note,
2.56%, 04/04/05 | | $ | 24,994,667 |
| 34,500,000 | | Federal Home Loan Bank, Discount Note,
2.52%, 04/01/05 | | | 34,500,000 |
| | | | |
|
|
| | | TOTAL U.S. GOVERNMENT & AGENCY OBLIGATIONS
(Cost $59,494,667) | | | 59,494,667 |
| | | | |
|
|
| U.S. TREASURY OBLIGATIONS — 72.29% |
| 10,000,000 | | 2.65%, 04/15/05(a) | | | 9,989,694 |
| 300,000,000 | | 2.65%, 04/28/05(a) | | | 299,406,000 |
| | | | |
|
|
| | | TOTAL U.S. TREASURY OBLIGATIONS
(Cost $309,395,694) | | | 309,395,694 |
| | | | |
|
|
| | | | | |
Shares
| | Security
Description
| | Value
|
| REGISTERED INVESTMENT COMPANY — 0.01% |
| 57,568 | | Dreyfus Treasury Prime Cash Management Fund | | $ | 57,568 |
| | | | |
|
|
| | | TOTAL REGISTERED
INVESTMENT COMPANY
(Cost $57,568) | | | 57,568 |
| | | | |
|
|
| | | | | | |
TOTAL INVESTMENTS
(Cost $368,947,929) | | 86.20 | % | | $ | 368,947,929 |
OTHER ASSETS IN EXCESS OF LIABILITIES | | 13.80 | | | | 59,060,233 |
| | |
|
| |
|
|
NET ASSETS | | 100.00 | % | | $ | 428,008,162 |
| | |
|
| |
|
|
| (a) | The rate shown is the effective yield at the time of purchase. |
Discount Note—The rate reported is the discount rate at the time of purchase.
The summary of the Fund’s investments as of March 31, 2005 is as follows: (Unaudited)
| | | | | | |
Portfolio Diversification
| | % of
Net
Assets
| | | Value
|
U.S. Treasury Obligations | | 72.29 | % | | $ | 309,395,694 |
U.S. Government & Agency Obligations | | 13.90 | | | | 59,494,667 |
Registered Investment Company | | 0.01 | | | | 57,568 |
| | |
|
| |
|
|
Total Investments | | 86.20 | % | | $ | 368,947,929 |
Other Assets and Liabilities (Net) | | 13.80 | | | | 59,060,233 |
| | |
|
| |
|
|
Net Assets | | 100.00 | % | | $ | 428,008,162 |
| | |
|
| |
|
|
See Notes to Financial Statements.
5
Excelsior Tax-Exempt Funds, Inc.
Portfolio of Investments — March 31, 2005
Tax-Exempt Money Fund
| | | | | |
Principal
| | Security
Description
| | Value
|
| TAX-EXEMPT CASH EQUIVALENT SECURITIES — 88.47% |
| $12,775,000 | | Alaska State, Housing Finance Authority, State Capital Project, Revenue Bonds, Series C, (MBIA), 2.25%, 07/01/22(a) | | $ | 12,775,000 |
| 56,765,000 | | Austin, Texas, Water & Wastewater System, Revenue Bonds, (FSA), 2.30%, 05/15/24(a) | | | 56,765,000 |
| 15,640,000 | | Bastrop, Texas, Independent School District, Munitops Certificates Trust, General Obligation Bonds,
Series 2003-23, 2.03%, 02/15/11(a)(b) | | | 15,640,000 |
| 16,500,000 | | Brownsville, Texas, Utilities System, Revenue Bonds, Series B, (MBIA), 2.05%, 09/01/25(a) | | | 16,500,000 |
| 40,500,000 | | Burke County, Georgia, Olgethorpe Power Authority, Commercial Paper, (AMBAC), 1.88%, 04/04/05 | | | 40,500,000 |
| 24,000,000 | | Burke County, Georgia, Olgethorpe Power Authority, Commercial Paper, (AMBAC), 1.97%, 04/06/05 | | | 24,000,000 |
| 10,000,000 | | Burke County, Georgia, Olgethorpe Power Authority, Commercial Paper, (AMBAC), 1.95%, 04/07/05 | | | 10,000,000 |
| 20,000,000 | | Burke County, Georgia, Olgethorpe Power Authority, Commercial Paper, (AMBAC), 1.98%, 04/08/05 | | | 20,000,000 |
| 44,430,000 | | Charlotte, North Carolina, Water & Sewer System, Revenue Bonds, Series B, 2.30%, 07/01/27(a) | | | 44,430,000 |
| | | | | |
Principal
| | Security
Description
| | Value
|
TAX-EXEMPT CASH EQUIVALENT
SECURITIES — (continued) |
| $12,200,000 | | Chicago, Illinois, Board of Education, General Obligation Bonds, Series D, (FSA),2.30%, 03/01/32(a) | | $ | 12,200,000 |
| 16,500,000 | | Chicago, Illinois, General Obligation Bonds, Series B, (FGIC),2.29%, 01/01/37(a) | | | 16,500,000 |
| 11,900,000 | | Chicago, Illinois, General Obligation Bonds, TOCS, Series A, (FSA), 2.31%, 03/19/12(a)(b) | | | 11,900,000 |
| 55,575,000 | | Chicago, Illinois, Metropolitan Water Reclamation District Project, Capital Improvement, General Obligation Bonds, Series A, 2.29%, 12/01/31(a) | | | 55,575,000 |
| 46,730,000 | | Chicago, Illinois, Metropolitan Water Reclamation District Project, Capital Improvement, General Obligation Bonds, Series E, 2.27%, 12/01/22(a) | | | 46,730,000 |
| 28,565,000 | | Chicago, Illinois, Sales Tax, Revenue Bonds, (FGIC), 2.30%, 01/01/34(a) | | | 28,565,000 |
| 15,000,000 | | Cleveland, Ohio, Waterworks, Revenue Bonds, Series L, (FGIC), 2.30%, 01/01/33(a) | | | 15,000,000 |
| 20,000,000 | | Colorado Springs, Colorado, School District No. 11 Facilities Corp., Certificate Participation, (FSA), 2.30%, 12/01/17(a) | | | 20,000,000 |
| 16,000,000 | | Colorado Springs, Colorado, Utilities, Revenue Bonds, Series A, 2.22%, 11/01/29(a) | | | 16,000,000 |
| 11,100,000 | | Colorado Springs, Colorado, Utilities, Revenue Bonds, TOCS, Series E, 2.32%, 11/09/12(a)(b) | | | 11,100,000 |
See Notes to Financial Statements.
6
Excelsior Tax-Exempt Funds, Inc.
Portfolio of Investments — March 31, 2005
Tax-Exempt Money Fund — (continued)
| | | | | |
Principal
| | Security
Description
| | Value
|
TAX-EXEMPT CASH EQUIVALENT
SECURITIES — (continued) |
| $ 9,000,000 | | Colorado, Department of Transportation, Revenue Bonds, PUTTER, Series 249Z, (AMBAC), 2.32%, 06/15/14(a)(b) | | $ | 9,000,000 |
| 8,160,000 | | Curators of the University Missouri, Systems Facility, Revenue Bonds, Series A, 2.30%, 11/01/32(a) | | | 8,160,000 |
| 25,995,000 | | Cypress Fairbanks, Texas, Independent School District, Munitops Certificates Trust, General Obligation Bonds, Series 2003-22, 2.03%, 02/15/11(a)(b) | | | 25,995,000 |
| 7,510,000 | | Dallas, Texas, Floating Rate Trust Certificates, General Obligation Bonds, Series 93, 2.32%, 02/15/15(a)(b) | | | 7,510,000 |
| 29,630,000 | | Dallas, Texas, Independent School District, Munitops Certificates Trust, General Obligation Bonds, Series 2005-1, 2.33%, 08/15/12(a)(b) | | | 29,630,000 |
| 16,685,000 | | Dallas, Texas, Munitops Certificates Trust, General Obligation Bonds, Series 2004-6, 2.33%, 02/15/12(a)(b) | | | 16,685,000 |
| 12,935,000 | | Denton, Texas, Munitops Certificates Trust, General Obligation Bonds, Series 2004-21, 2.33%, 08/15/12(a)(b) | | | 12,935,000 |
| 10,735,000 | | Detroit, Michigan, City School District, Munitops Certificates Trust, General Obligation Bonds, Series 2004-39, (FGIC), 2.32%, 05/01/11(a)(b) | | | 10,735,000 |
| | | | | |
Principal
| | Security
Description
| | Value
|
TAX-EXEMPT CASH EQUIVALENT
SECURITIES — (continued) |
| $41,620,000 | | Detroit, Michigan, Sewage Disposal, Revenue Bonds, Series C-1, (FSA), 2.25%, 07/01/27(a) | | $ | 41,620,000 |
| 51,780,000 | | Detroit, Michigan, Sewage Disposal, Revenue Bonds, Series C-2, (FGIC), 2.25%, 07/01/29(a) | | | 51,780,000 |
| 23,000,000 | | District of Columbia, General Obligation Bonds, Series B, (FSA), 2.27%, 06/01/30(a) | | | 23,000,000 |
| 23,740,000 | | District of Columbia, General Obligation Bonds, Series D, (FGIC), 2.25%, 06/01/29(a) | | | 23,740,000 |
| 5,985,000 | | Fairfax County, Virginia, General Obligation Bonds, PUTTER, Series 461, 2.30%, 04/01/12(a)(b) | | | 5,985,000 |
| 13,665,000 | | Florida State, Board of Education, Capital Outlay, General Obligation Bonds, Series 374, 2.32%, 06/01/22(a)(b) | | | 13,665,000 |
| 3,500,000 | | Fort Bend, Texas, Independent School District, Munitops Certificates Trust, General Obligation Bonds, Series 1999-6, 2.33%, 03/07/07(a)(b) | | | 3,500,000 |
| 9,265,000 | | Frisco, Texas, Munitops Certificates Trust, General Obligation Bonds, 2.33%, 08/15/11(a)(b) | | | 9,265,000 |
| 8,385,000 | | Grand Rapids, Michigan, Sanitation & Sewer Systems, Revenue Bonds, TOCS, Series G, (FGIC), 2.31%, 07/23/12(a)(b) | | | 8,385,000 |
| 8,131,000 | | Harvard University, Commercial Paper, Series E, 2.00%, 05/12/05 | | | 8,131,000 |
See Notes to Financial Statements.
7
Excelsior Tax-Exempt Funds, Inc.
Portfolio of Investments — March 31, 2005
Tax-Exempt Money Fund — (continued)
| | | | | |
Principal
| | Security
Description
| | Value
|
TAX-EXEMPT CASH EQUIVALENT
SECURITIES — (continued) |
| $10,420,000 | | Hawaii State, Munitops Certificates Trust, General Obligation Bonds (FSA), 2.32%, 07/01/10(a)(b) | | $ | 10,420,000 |
| 10,000,000 | | Hockley County, Texas, Industrial Development Corporation, Pollution Control, Amoco Project — Standard Oil Company, Revenue Bonds, 2.10%, 03/01/14(a) | | | 10,000,000 |
| 10,300,000 | | Hockley County, Texas, Industrial Development Corporation, Pollution Control, Amoco Project, Revenue Bonds, 1.80%, 11/01/19(a) | | | 10,300,000 |
| 12,600,000 | | Houston, Texas, Utility System, Revenue Bonds, TOCS, Series A, (FSA), 2.33%, 05/15/12(a)(b) | | | 12,600,000 |
| 25,000,000 | | Intermountain Power Agency, Utah, Commercial Paper, Series B, 1.90%, 04/07/05 | | | 25,000,000 |
| 13,000,000 | | Ipa, Utah, Commercial Paper, Series 98-B5, 2.03%, 05/11/05 | | | 13,000,000 |
| 28,000,000 | | Jacksonville, Florida, Commercial Paper, 1.97%, 04/06/05 | | | 28,000,000 |
| 8,505,000 | | Jacksonville, Florida, Electric Authority, Floating Rate Trust Certificates, Revenue Bonds, Series N-8, 2.36%, 10/01/23(a)(b) | | | 8,505,000 |
| 21,900,000 | | Jacksonville, Florida, Electric Authority, Sub Electric Systems, Revenue Bonds, Series B, 2.30%, 10/01/30(a) | | | 21,900,000 |
| 7,825,000 | | Jefferson County, Alabama, Sewer Revenue, Revenue Bonds, Series A, (FGIC), 2.30%, 02/01/42(a) | | | 7,825,000 |
| | | | | |
Principal
| | Security
Description
| | Value
|
TAX-EXEMPT CASH EQUIVALENT
SECURITIES — (continued) |
| $13,288,000 | | Johns Hopkins University, Commercial Paper,
1.90%, 04/08/05 | | $ | 13,288,000 |
| 8,955,000 | | Judson, Texas, Munitops Certificates Trust, General Obligation Bonds, Series 2003-36, 2.33%, 02/01/11(a)(b) | | | 8,955,000 |
| 22,500,000 | | Massachusetts State, General Obligations, Series A, 2.24%, 09/01/16(a) | | | 22,500,000 |
| 23,600,000 | | Mecklenburg County, North Carolina, General Obligation Bonds, Series 1996C,
2.29%, 03/01/14(a) | | | 23,600,000 |
| 15,500,000 | | Metropolitan Government Nashville & Davidson County, Tennessee, Commercial Paper,
1.90%, 04/14/05 | | | 15,500,000 |
| 10,000,000 | | Metropolitan Government Nashville & Davidson County, Tennessee, Commercial Paper,
1.92%, 05/09/05 | | | 10,000,000 |
| 5,000,000 | | Metropolitan Government Nashville & Davidson County, Tennessee, Commercial Paper,
2.20%, 07/15/05 | | | 5,000,000 |
| 5,000,000 | | Metropolitan Government Nashville & Davidson County, Tennessee, Commercial Paper,
2.25%, 08/15/05 | | | 5,000,000 |
| 9,495,000 | | Michigan State, Municipal Bond Authority, Revenue Bonds, PUTTER, Series 419,
2.30%, 04/01/12(a)(b) | | | 9,495,000 |
| 5,230,000 | | Michigan State, Municipal Bond Authority, Revenue Bonds, PUTTER, Series 453,
2.32%, 05/01/12(a)(b) | | | 5,230,000 |
See Notes to Financial Statements.
8
Excelsior Tax-Exempt Funds, Inc.
Portfolio of Investments — March 31, 2005
Tax-Exempt Money Fund — (continued)
| | | | | |
Principal
| | Security
Description
| | Value
|
TAX-EXEMPT CASH EQUIVALENT
SECURITIES — (continued) |
| $18,297,000 | | Michigan State, Municipal Bond Authority, Revenue Bonds, Series 718, 2.32%, 10/01/20(a)(b) | | $ | 18,297,000 |
| 15,800,000 | | Michigan State, School Loan, Commercial Paper,
2.20%, 10/05/05 | | | 15,800,000 |
| 25,000,000 | | New Hampshire State, Anticipation Notes, 2.20%, 06/01/05(b) | | | 25,004,087 |
| 16,995,000 | | New York City, New York, Municipal Water Finance Authority, Water & Sewer Systems, Floating Rate Trust Certificates, Revenue Bonds, Series 726X, (MBIA),
2.30%, 06/15/27(a)(b) | | | 16,995,000 |
| 8,795,000 | | New York City, New York, Transitional Finance Authority, Revenue Bonds, PUTTER, Series 468, (MBIA),
2.30%, 02/01/11(a)(b) | | | 8,795,000 |
| 12,255,000 | | North Carolina State, General Obligation Bonds, PUTTER, Series 465, 2.30%, 05/01/11(a)(b) | | | 12,255,000 |
| 10,305,000 | | North Carolina State, General Obligation Bonds, PUTTER, Series 466, 2.30%, 03/01/12(a)(b) | | | 10,305,000 |
| 37,600,000 | | Ohio State University, Commercial Paper, Series F,
2.05%, 05/16/05 | | | 37,600,000 |
| 50,585,000 | | Ohio State, Infrastructure Improvement, General Obligations Bonds, Series D,
2.25%, 02/01/19(a) | | | 50,585,000 |
| 16,000,000 | | Oklahoma State Water Resource Board, Loan Program, Revenue Bonds, 2.20%, 09/01/32(a) | | | 16,000,000 |
| | | | | |
Principal
| | Security
Description
| | Value
|
TAX-EXEMPT CASH EQUIVALENT
SECURITIES — (continued) |
| $25,700,000 | | Omaha, Nebraska, Commercial Paper, 1.98%, 04/13/05 | | $ | 25,700,000 |
| 63,800,000 | | Orlando, Florida, Utilities Commission Water & Electric, Revenue Bonds, Series A,
2.23%, 10/01/17(a) | | | 63,800,000 |
| 22,000,000 | | Pennsylvania State University, Revenue Bonds, Series A,
2.26%, 04/01/31(a) | | | 22,000,000 |
| 36,000,000 | | Pennsylvania State, Turnpike Commission, Revenue Bonds, Series A-2, 2.30%, 12/01/30(a) | | | 36,000,000 |
| 3,905,000 | | Phoenix, Arizona, Civic Improvement Corp., Excise Tax, Revenue Bonds, EAGLE, Class A, 2.32%, 07/01/17(a)(b) | | | 3,905,000 |
| 3,100,000 | | Port Authority of New York & New Jersey, Special Obligation, Versatile Structure Obligation, Revenue Bonds, Series 3,
2.30%, 06/01/20(a) | | | 3,100,000 |
| 3,875,000 | | Round Rock, Texas, Independent School District, General Obligation Bonds, Series 578, 2.32%, 08/01/20(a)(b) | | | 3,875,000 |
| 20,800,000 | | Salt River, Arizona, Commercial Paper, Series B, 1.90%, 04/01/05 | | | 20,800,000 |
| 16,560,000 | | Snohomish County, Washington, Public Utilities Authority, District No. 1 Generation System, Revenue Bonds, (MBIA), 2.28%, 01/01/25(a) | | | 16,560,000 |
See Notes to Financial Statements.
9
Excelsior Tax-Exempt Funds, Inc.
Portfolio of Investments — March 31, 2005
Tax-Exempt Money Fund — (continued)
| | | | | |
Principal
| | Security
Description
| | Value
|
TAX-EXEMPT CASH EQUIVALENT
SECURITIES — (continued) |
| $27,600,000 | | Snohomish County, Washington, Public Utilities Authority, District No. 1 Generation System, Revenue Bonds, Series A-1, (FSA),
2.29%, 12/01/19(a) | | $ | 27,600,000 |
| 39,000,000 | | St. James Parish, Louisiana, Pollution Control, Texaco Project, Commercial Paper, Series B, 2.10%, 05/12/05 | | | 39,000,000 |
| 17,700,000 | | Suffolk County, New York, Water Authority, Bond Anticipation Notes, 2.22%, 01/01/08(a) | | | 17,700,000 |
| 14,425,000 | | Tennessee State, School Board Authority, Higher Education, Commercial Paper,
1.81%, 04/01/05 | | | 14,425,000 |
| 8,000,000 | | Tennessee State, School Board Authority, Higher Education, Commercial Paper, Series A, 1.97%, 04/04/05 | | | 8,000,000 |
| 8,000,000 | | Texas State, Public Finance Authority, Commercial Paper, Series 2003, 1.85%, 04/06/05 | | | 8,000,000 |
| 42,000,000 | | Triborough Bridge & Tunnel Authority, New York, General Purpose, Revenue Bonds, Series C, (AMBAC),
2.27%, 01/01/32(a) | | | 42,000,000 |
| 17,000,000 | | University of Arizona, Certificates of Participation, Series B, (AMBAC), 2.28%, 06/01/31(a) | | | 17,000,000 |
| 18,020,000 | | University of Minnesota, Board of Regents, Revenue Bonds, Series A, 2.30%, 01/01/34(a) | | | 18,020,000 |
| | | | | |
Principal
| | Security
Description
| | Value
|
TAX-EXEMPT CASH EQUIVALENT
SECURITIES — (continued) |
| $12,500,000 | | University of Pittsburgh, Commonwealth of Higher Education, University Capital Project, Revenue Bonds, Series A, 2.25%, 09/15/29(a) | | $ | 12,500,000 |
| 14,125,000 | | University of Texas, Permanent University Fund, Floating Rate Trust Certificates, Revenue Bonds, Series 1023,
2.32%, 07/01/30(a)(b) | | | 14,125,000 |
| 9,330,000 | | University of Texas, Revenue Bonds, PUTTER, Series 592,
2.32%, 08/15/12(a)(b) | | | 9,330,000 |
| 3,300,000 | | University of Virginia, Revenue Bonds, EAGLE, Series A,
2.32%, 06/01/33(a)(b) | | | 3,300,000 |
| 54,730,000 | | Valdez, Alaska, Marine Terminal, BP Pipelines Project, Revenue Bonds, Series B, 2.30%, 07/01/37(a) | | | 54,730,000 |
| 13,300,000 | | Virginia College Building Authority, Educational Facilities, University of Richmond Project, Revenue Bonds, 2.29%, 08/01/34(a) | | | 13,300,000 |
| 13,800,000 | | Wilmington, North Carolina, General Obligation Bonds, 2.30%, 06/01/15(a) | | | 13,800,000 |
| 32,720,000 | | Wisconsin State, Transportation Revenue, Commercial Paper, Series 97A, 1.98%, 04/22/05 | | | 32,720,000 |
| | | | |
|
|
| | | TOTAL TAX-EXEMPT CASH EQUIVALENT SECURITIES (Cost $1,802,945,087) | | | 1,802,945,087 |
| | | | |
|
|
See Notes to Financial Statements.
10
Excelsior Tax-Exempt Funds, Inc.
Portfolio of Investments — March 31, 2005
Tax-Exempt Money Fund — (continued)
| | | | | |
Principal
| | Security
Description
| | Value
|
TAX-EXEMPT CASH EQUIVALENT
SECURITIES — BACKED BY LETTERS OF
CREDIT — 12.16% |
| $29,900,000 | | Baltimore, Maryland, Port Facilities Authority, Revenue Bonds, (BNP PARIBAS),
1.98%, 10/14/11(a) | | $ | 29,900,000 |
| 18,300,000 | | Brownsville, Texas, Commercial Paper, (STATE STREET BANK & TRUST), 1.88%, 04/07/05 | | | 18,300,000 |
| 15,000,000 | | Chicago, Illinois, Tender Notes, General Obligation Bonds, (STATE STREET BANK & TRUST), 2.20%, 01/27/06 | | | 15,000,000 |
| 22,000,000 | | Des Moines, Iowa, Hospital Facilities Authority, Methodist Medical Center Project, Revenue Bonds, (BANK OF AMERICA N.A.), 2.25%, 08/01/15(a) | | | 22,000,000 |
| 15,000,000 | | District of Columbia, Phillips College Issue, Revenue Bond, (BANK OF AMERICA N.A.), 2.30%, 08/01/33(a) | | | 15,000,000 |
| 19,500,000 | | Illinois State Development Finance Authority, Chicago Symphony Orchestra, Revenue Bonds, (NORTHERN TRUST COMPANY),
2.25%, 12/01/28(a) | | | 19,500,000 |
| 7,000,000 | | Kenton County, Kentucky, Industrial Building Authority, Redken Labs, Inc. Project, Revenue Bonds, (JP MORGAN CHASE BANK),
1.90%, 12/01/14(a) | | | 7,000,000 |
| 17,600,000 | | King County, Washington, Sewer Authority, Revenue Bonds, Series A, (LANDESBANK HESSEN), 2.25%, 01/01/32(a) | | | 17,600,000 |
| | | | | |
Principal
| | Security
Description
| | Value
|
TAX-EXEMPT CASH EQUIVALENT
SECURITIES — BACKED BY LETTERS OF
CREDIT — (continued) |
| $13,034,000 | | Long Island Power Authority, New York, Electrical Systems, Revenue Bonds, Series 1A, (BAYERISCHE LANDESBANK-80%/LANDESBANK BADEN-WUERTTEMBERG-20%),
2.28%, 05/01/33(a) | | $ | 13,034,000 |
| 30,800,000 | | Michigan State, Building Authority, Commercial Paper, Series 4, (BANK OF NEW YORK-70%/STATE STREET BANK & TRUST-30%),
1.95%, 04/27/05 | | | 30,800,000 |
| 13,550,000 | | New York City, New York, General Obligation Bonds, Series F-3, (JP MORGAN CHASE BANK), 2.23%, 02/15/13(a) | | | 13,550,000 |
| 10,800,000 | | New York City, New York, General Obligation Bonds, Sub-Series H-3, (BANK OF NEW YORK),
2.21%, 03/01/34(a) | | | 10,800,000 |
| 16,200,000 | | Virginia State, Capital Region Airport Community Authority, Revenue Bonds, Series B, (FIRST UNION NATIONAL BANK), 2.30%, 06/01/29(a) | | | 16,200,000 |
| 19,030,000 | | Washington State, Public Power Supply System, Nuclear Project No. 1, Revenue Bonds, Series 1A-2, (BANK OF AMERICA N.A.), 2.29%, 07/01/17(a) | | | 19,030,000 |
| | | | |
|
|
| | | TOTAL TAX-EXEMPT
CASH EQUIVALENT SECURITIES — BACKED BY LETTERS OF CREDIT
(Cost $247,714,000) | | | 247,714,000 |
| | | | |
|
|
See Notes to Financial Statements.
11
Excelsior Tax-Exempt Funds, Inc.
Portfolio of Investments — March 31, 2005
Tax-Exempt Money Fund — (continued)
| | | | | |
Shares
| | Security
Description
| | Value
|
| REGISTERED INVESTMENT COMPANIES — 0.00% |
| 1 | | BlackRock Muni Fund | | $ | 1 |
| 1 | | Dreyfus Tax Exempt Cash Fund | | | 1 |
| | | | |
|
|
| | | TOTAL REGISTERED INVESTMENT COMPANIES
(Cost $2) | | | 2 |
| | | | |
|
|
| | | | | | | |
TOTAL INVESTMENTS
(Cost $2,050,659,089) | | 100.63 | % | | $ | 2,050,659,089 | |
LIABILITIES IN EXCESS OF OTHER ASSETS | | (0.63 | ) | | | (12,856,596 | ) |
| | |
|
| |
|
|
|
NET ASSETS | | 100.00 | % | | $ | 2,037,802,493 | |
| | |
|
| |
|
|
|
| (a) | Variable Rate Security—The rate disclosed is as of March 31, 2005. |
| (b) | Security exempt from registration under Rule 144A of the Securities Act of 1933. This security may be resold in transactions exempt from registration, normally to qualified institutional buyers. At March 31, 2005, these securities amounted to $373,321,087 or 18.32% of net assets. |
AMBAC—American Municipal Bond Assurance Corp.
FGIC—Financial Guaranty Insurance Corp.
FSA—Financial Security Assurance
MBIA—Municipal Bond Insurance Association
Notes (The following notes have not been audited by Deloitte & Touche LLP):
These municipal securities meet the three highest ratings assigned by Moody’s Investors Services, Inc. or Standard and Poor’s Corporation or, where not rated, are determined by the Advisor, under the supervision of the Board of Directors, to be of comparable quality at the time of purchase to rated instruments that may be acquired by the Fund.
At March 31, 2005, approximately 12% of the net assets are invested in municipal securities that have letter of credit enhancement features or escrows in U.S. Government securities backing them, on which the Fund relies. Without such features, the securities may or may not meet the quality standards of securities purchased by the Fund.
See Notes to Financial Statements.
12
Excelsior Tax-Exempt Funds, Inc.
Portfolio of Investments — March 31, 2005
Tax-Exempt Money Fund — (continued)
The summary of the Fund’s investments as of March 31, 2005 is as follows: (Unaudited)
| | | | | | | |
State Diversification
| | % of
Net
Assets
| | | Market Value
| |
Texas | | 12.65 | % | | $ | 257,810,000 | |
Illinois | | 10.28 | | | | 209,470,000 | |
Michigan | | 9.43 | | | | 192,142,000 | |
Florida | | 6.67 | | | | 135,870,000 | |
New York | | 6.18 | | | | 125,974,000 | |
Georgia | | 5.54 | | | | 112,800,000 | |
North Carolina | | 5.12 | | | | 104,390,000 | |
Ohio | | 5.06 | | | | 103,185,000 | |
Washington | | 3.97 | | | | 80,790,000 | |
Pennsylvania | | 3.46 | | | | 70,500,000 | |
Tennessee | | 3.35 | | | | 68,225,000 | |
Alaska | | 3.31 | | | | 67,505,000 | |
District of Columbia | | 3.03 | | | | 61,740,000 | |
Colorado | | 2.75 | | | | 56,100,000 | |
Maryland | | 2.12 | | | | 43,188,000 | |
Arizona | | 2.05 | | | | 41,705,000 | |
Louisiana | | 1.91 | | | | 39,000,000 | |
Virginia | | 1.90 | | | | 38,785,000 | |
Utah | | 1.87 | | | | 38,000,000 | |
Wisconsin | | 1.61 | | | | 32,720,000 | |
Massachusetts | | 1.50 | | | | 30,631,000 | |
Nebraska | | 1.26 | | | | 25,700,000 | |
New Hampshire | | 1.23 | | | | 25,004,087 | |
Iowa | | 1.08 | | | | 22,000,000 | |
Minnesota | | 0.88 | | | | 18,020,000 | |
Oklahoma | | 0.79 | | | | 16,000,000 | |
Hawaii | | 0.51 | | | | 10,420,000 | |
Missouri | | 0.40 | | | | 8,160,000 | |
Alabama | | 0.38 | | | | 7,825,000 | |
Kentucky | | 0.34 | | | | 7,000,000 | |
Registered Investment Company | | 0.00 | | | | 2 | |
| | |
|
| |
|
|
|
Total Investments | | 100.63 | % | | $ | 2,050,659,089 | |
Other Assets and Liabilities (Net) | | (0.63 | ) | | | (12,856,596 | ) |
| | |
|
| |
|
|
|
Net Assets | | 100.00 | % | | $ | 2,037,802,493 | |
| | |
|
| |
|
|
|
See Notes to Financial Statements.
13
Excelsior Tax-Exempt Funds, Inc.
Portfolio of Investments — March 31, 2005
New York Tax-Exempt Money Fund
| | | | | |
Principal
| | Security
Description
| | Value
|
| TAX-EXEMPT CASH EQUIVALENT SECURITIES — 67.93% |
| $ 5,500,000 | | Albany, New York, City School District, Tax Anticipation Notes, 2.75%, 10/28/05 | | $ | 5,513,351 |
| 10,000,000 | | Broome County, New York, Bond Anticipation Notes,
2.00%, 04/21/05 | | | 10,000,874 |
| 15,400,000 | | Metropolitan Transition Authority, New York, Transition Revenue, BANS, Commercial Paper, Series A, CP-1,
1.95%, 04/06/05 | | | 15,400,000 |
| 8,485,000 | | New York City, New York, Municipal Water Finance Authority, Eagle Project 20040027, Revenue Bonds, Class A,
2.30%, 06/15/34(a)(b) | | | 8,485,000 |
| 5,000,000 | | New York City, New York, Municipal Water Finance Authority, Extendable Commercial Paper,
2.05%, 04/11/05 | | | 5,000,000 |
| 10,000,000 | | New York City, New York, Municipal Water Finance Authority, Revenue Bonds, PUTTER, Series 622, (AMBAC), 2.30%, 06/15/12(a)(b) | | | 10,000,000 |
| 7,300,000 | | New York City, New York, Municipal Water Finance Authority, Revenue Bonds, Series A, (FGIC),
2.25%, 06/15/25(a) | | | 7,300,000 |
| 2,100,000 | | New York City, New York, Municipal Water Finance Authority, Revenue Bonds, Series C, (FGIC),
2.24%, 06/15/23(a) | | | 2,100,000 |
| 10,870,000 | | New York City, New York, Transitional Finance Authority, Eagle Project 20030036, Revenue Bonds, Class A,
2.30%, 02/01/31(a)(b) | | | 10,870,000 |
| | | | | |
Principal
| | Security
Description
| | Value
|
TAX-EXEMPT CASH EQUIVALENT
SECURITIES — (continued) |
| $ 4,995,000 | | New York City, New York, Transitional Finance Authority, Revenue Bonds, PUTTER,
Series 307, (AMBAC),
2.30%, 08/01/19(a)(b) | | $ | 4,995,000 |
| 5,515,000 | | New York City, New York, Transitional Finance Authority, Revenue Bonds, PUTTER,
Series 471, (FGIC),
2.30%, 02/01/11(a)(b) | | | 5,515,000 |
| 9,000,000 | | New York City, New York, Transitional Finance Authority, Revenue Bonds, Series 283,
2.30%, 11/15/18(a)(b) | | | 9,000,000 |
| 12,685,000 | | New York City, New York, Transitional Finance Authority, Revenue Bonds, Series 536, (MBIA),
2.30%, 05/01/15(a)(b) | | | 12,685,000 |
| 4,000,000 | | New York State Thruway, Tax Exempt, Commercial Paper, 1.95%, 04/07/05 | | | 4,000,000 |
| 11,000,000 | | New York State, Dormitory Authority, Columbia University, Series 1997, Commercial Paper, 1.95%, 04/11/05 | | | 11,000,000 |
| 1,600,000 | | New York State, Dormitory Authority, Cornell University, Commercial Paper,
1.90%, 04/08/05 | | | 1,600,000 |
| 10,000,000 | | New York State, Dormitory Authority, Cornell University, Revenue Bonds, Series B,
2.24%, 07/01/30(a) | | | 10,000,000 |
| 5,000,000 | | New York State, Dormitory Authority, Mental Health Facilities, Revenue Bonds, (FSA), 2.28%, 02/15/21(a) | | | 5,000,000 |
| 15,350,000 | | New York State, Dormitory Authority, Public Library Project, Revenue Bonds,
Series A, (MBIA),
2.23%, 07/01/28(a) | | | 15,350,000 |
See Notes to Financial Statements.
14
Excelsior Tax-Exempt Funds, Inc.
Portfolio of Investments — March 31, 2005
New York Tax-Exempt Money Fund — (continued)
| | | | | |
Principal
| | Security
Description
| | Value
|
TAX-EXEMPT CASH EQUIVALENT
SECURITIES — (continued) |
| $ 1,500,000 | | New York State, Dormitory Authority, Rockefeller University, Revenue Bonds, Series A2,
2.24%, 07/01/32(a) | | $ | 1,500,000 |
| 11,417,500 | | New York State, Environmental Facilities Authority, Revenue Bonds, Series 731,
2.30%, 06/15/22(a)(b) | | | 11,417,500 |
| 5,695,000 | | New York State, Metropolitan Transportation Authority, Floating Rate Trust Certificate, Revenue Bonds, Series 9, (FGIC),
2.31%, 07/01/26(a)(b) | | | 5,695,000 |
| 13,165,000 | | New York State, Metropolitan Transportation Authority, Revenue Bonds, Series B, (FSA), 2.25%, 11/01/22(a) | | | 13,165,000 |
| 5,000,000 | | New York State, Power Authority, Revenue Bonds, Sub-Series 5, 2.23%, 11/15/11(a) | | | 5,000,000 |
| 8,200,000 | | New York State, Sales Tax Asset Receivable Corp., Revenue Bonds, PUTTER, Series 564, (MBIA),
2.30%, 10/15/12(a)(b) | | | 8,200,000 |
| 10,000,000 | | New York State, Triborough Bridge & Tunnel Authority, Revenue Bonds, Series C, (AMBAC),
2.23%, 01/01/33(a) | | | 10,000,000 |
| 9,100,000 | | Niagara Falls, New York, Bridge Community Toll Authority, Revenue Bonds, Series A, (FGIC), 2.26%, 10/01/19(a) | | | 9,100,000 |
| 7,430,000 | | North Hempstead, New York, Bond Anticipation Notes,
2.00%, 04/28/05 | | | 7,431,379 |
| | | | | |
Principal
| | Security
Description
| | Value
|
TAX-EXEMPT CASH EQUIVALENT
SECURITIES — (continued) |
| $ 6,325,000 | | Port Authority of New York & New Jersey, Special Obligation, Revenue Bonds, Versatile Structure Obligation, Series 5, 2.30%, 08/01/24(a) | | $ | 6,325,000 |
| 13,910,000 | | Sales Tax Asset Receivable Corporation, New York, Floating Rate Trust Certificate, Revenue Bonds, Series 984, (AMBAC), 2.30%, 10/15/32(a)(b) | | | 13,910,000 |
| 12,500,000 | | Suffolk County, New York, Tax Anticipation Notes, Series I, 3.25%, 08/16/05 | | | 12,561,498 |
| 6,900,000 | | Suffolk County, New York, Water Authority, Bond Anticipation Notes, 2.22%, 06/01/06(a) | | | 6,900,000 |
| 5,000,000 | | Suffolk County, New York, Water Authority, Bond Anticipation Notes, 2.22%, 01/01/08(a) | | | 5,000,000 |
| 8,000,000 | | Suffolk County, New York, Water Authority, Bond Anticipation Notes, 2.22%, 12/01/09(a) | | | 8,000,000 |
| | | | |
|
|
| | | TOTAL TAX-EXEMPT CASH EQUIVALENT SECURITIES (Cost $278,019,602) | | | 278,019,602 |
| | | | |
|
|
TAX-EXEMPT CASH EQUIVALENT SECURITIES —
BACKED BY LETTERS OF CREDIT — 31.93% |
| 7,000,000 | | Long Island Power Authority, New York, Commercial Paper, Series 1, (JP MORGAN CHASE BANK), 2.05%, 04/06/05 | | | 7,000,000 |
| 1,050,000 | | Long Island Power Authority, New York, Revenue Bonds, Sub-Series 1B, (STATE STREET BANK & TRUST),
2.28%, 05/01/33(a) | | | 1,050,000 |
| 4,350,000 | | Long Island Power Authority, New York, Revenue Bonds, Sub-Series 2A, (WESTDEUTSCHE LANDESBANK),
2.23%, 05/01/33(a) | | | 4,350,000 |
See Notes to Financial Statements.
15
Excelsior Tax-Exempt Funds, Inc.
Portfolio of Investments — March 31, 2005
New York Tax-Exempt Money Fund — (continued)
| | | | | |
Principal
| | Security
Description
| | Value
|
TAX-EXEMPT CASH EQUIVALENT SECURITIES —
BACKED BY LETTERS OF CREDIT — (continued) |
| $ 8,000,000 | | Long Island Power Authority, New York, Revenue Bonds, Sub-Series 3B, (WESTDEUTSCHE LANDESBANK),
2.25%, 05/01/33 | | $ | 8,000,000 |
| 17,255,000 | | Nassau County, New York, Interim Finance Authority, Sales Tax, Revenue Bonds, Series B, (BNP PARIBAS),
2.21%, 11/15/22(a) | | | 17,255,000 |
| 5,000,000 | | New York City, New York, General Obligation Bonds, Sub-Series A2, (BANK OF AMERICA N.A.), 2.23%, 08/01/31(a) | | | 5,000,000 |
| 9,630,000 | | New York City, New York, General Obligation Bonds, Sub-Series B8, (BAYERISCHE LANDESBANK),
2.23%, 08/15/24(a) | | | 9,630,000 |
| 1,300,000 | | New York City, New York, General Obligation Bonds, Sub-Series C5, (BANK OF NEW YORK),
2.28%, 08/01/20(a) | | | 1,300,000 |
| 1,300,000 | | New York City, New York, General Obligation Bonds, Sub-Series E5, (JP MORGAN CHASE BANK), 2.25%, 08/01/16(a) | | | 1,300,000 |
| 2,900,000 | | New York City, New York, General Obligation Bonds, Sub-Series G3, (WESTDEUTSCHE LANDESBANK),
2.21%, 08/01/14(a) | | | 2,900,000 |
| 6,850,000 | | New York City, New York, General Obligation Bonds, Sub-Series H6, (FLEET NATIONAL BANK), 2.24%, 03/01/34(a) | | | 6,850,000 |
| | | | | |
Principal
| | Security
Description
| | Value
|
TAX-EXEMPT CASH EQUIVALENT SECURITIES —
BACKED BY LETTERS OF CREDIT — (continued) |
| $ 8,800,000 | | New York City, New York, Industrial Development Agency, Civic Facility Revenue Bonds, Jewish Community Center Project, (MANUFACTURERS & TRADERS),
2.38%, 03/01/30(a) | | $ | 8,800,000 |
| 10,000,000 | | New York City, New York, Industrial Development Agency, Revenue Bonds, New York Stock Exchange Project, Series B, (BANK OF AMERICA N.A.),
2.30%, 05/01/33(a) | | | 10,000,000 |
| 6,300,000 | | New York City, New York, Mass Transportation Authority, Commercial Paper, Series A-1, (ABN AMRO),
1.92%, 04/06/05 | | | 6,300,000 |
| 5,400,000 | | New York City, New York, Mass Transportation Authority, Commercial Paper, Series A-1, (ABN AMRO),
1.93%, 04/07/05 | | | 5,400,000 |
| 13,500,000 | | New York State, Housing Finance Agency Services, Revenue Bonds, Series I, (LANDESBANK HESSEN),
2.28%, 03/15/31(a) | | | 13,500,000 |
| 11,000,000 | | New York State, Local Government Assistance, Revenue Bonds, Series E, (LANDESBANK HESSEN), 2.18%, 04/01/25(a) | | | 11,000,000 |
| 6,800,000 | | New York State, Local Government Assistance, Revenue Bonds, Series F, (SOCIETE GENERALE),
2.21%, 04/01/25(a) | | | 6,800,000 |
See Notes to Financial Statements.
16
Excelsior Tax-Exempt Funds, Inc.
Portfolio of Investments — March 31, 2005
New York Tax-Exempt Money Fund — (continued)
| | | | | |
Principal/
Shares
| | Security
Description
| | Value
|
TAX-EXEMPT CASH EQUIVALENT SECURITIES —
BACKED BY LETTERS OF CREDIT — (continued) |
| $ 4,238,000 | | Yonkers, New York, Industrial Development Agency, Civic Facility Revenue Bonds, Consumers Union Facility, (BANK OF NEW YORK),
2.30%, 07/01/19(a) | | $ | 4,238,000 |
| | | | |
|
|
| | | TOTAL TAX-EXEMPT CASH EQUIVALENT SECURITIES — BACKED BY LETTERS OF CREDIT
(Cost $130,673,000) | | | 130,673,000 |
| | | | |
|
|
| REGISTERED INVESTMENT COMPANIES — 0.24% |
| 972,255 | | BlackRock Institutional New York Money Market Fund | | | 972,255 |
| 1 | | Dreyfus New York Tax Exempt Fund | | | 1 |
| | | | |
|
|
| | | TOTAL REGISTERED INVESTMENT COMPANIES
(Cost $972,256) | | | 972,256 |
| | | | |
|
|
| | | | | | | |
TOTAL INVESTMENTS
(Cost $409,664,858) | | 100.10 | % | | $ | 409,664,858 | |
LIABILITIES IN EXCESS
OF OTHER ASSETS | | (0.10 | ) | | | (412,856 | ) |
| | |
|
| |
|
|
|
NET ASSETS | | 100.00 | % | | $ | 409,252,002 | |
| | |
|
| |
|
|
|
| (a) | Variable Rate Security—The rate disclosed is as of March 31, 2005. |
| (b) | Security exempt from registration under Rule 144A of the Securities Act of 1933. This security may be resold in transactions exempt from registration, normally to qualified institutional buyers. At March 31, 2005, these securities amounted to $100,772,500 or 24.62% net assets. |
AMBAC—American Municipal Bond Assurance Corp.
FGIC—Financial Guaranty Insurance Corp.
FGIC-SPI—Financial Guaranty Insurance Corp. Securities Purchase, Inc.
FSA—Financial Security Assurance
MBIA—Municipal Bond Insurance Association
Notes (The following notes have not been audited by Deloitte & Touche LLP):
These municipal securities meet the three highest ratings assigned by Moody’s Investors Services, Inc. or Standard and Poor’s Corporation or, where not rated, are determined by the Advisor, under the supervision of the Board of Directors, to be of comparable quality at the time of purchase to rated instruments that may be acquired by the Fund.
At March 31, 2005, approximately 32% of the net assets are invested in municipal securities that have letter of credit enhancement features or escrows in U.S. Government securities backing them, on which the Fund relies. Without such features, the securities may or may not meet the quality standards of securities purchased by the Fund.
At March 31, 2005, approximately 99% of the net assets are invested in New York municipal securities. Economic changes affecting the state and certain of its public bodies and municipalities may affect the ability of the issuers to pay the required principal and interest payments of the municipal securities.
The summary of the Fund’s investments as of March 31, 2005 is as follows: (Unaudited)
| | | | | | | |
Portfolio Diversification
| | % of
Net
Assets
| | | Value
| |
Revenue Bonds | | 66.12 | % | | $ | 270,605,500 | |
Commercial Paper | | 13.61 | | | | 55,700,000 | |
Anticipation Notes | | 13.54 | | | | 55,407,102 | |
General Obligation Bonds | | 6.59 | | | | 26,980,000 | |
Registered Investment Company | | 0.24 | | | | 972,256 | |
| | |
|
| |
|
|
|
Total Investments | | 100.10 | % | | $ | 409,664,858 | |
Other Assets and Liabilities (Net) | | (0.10 | ) | | | (412,856 | ) |
| | |
|
| |
|
|
|
Net Assets | | 100.00 | % | | $ | 409,252,002 | |
| | |
|
| |
|
|
|
See Notes to Financial Statements.
17
Excelsior Funds
Statements of Assets and Liabilities
March 31, 2005
| | | | | | | | | | | | | | | | | |
| | | | | |
| | | Money
Fund
| | | Government
Money
Fund
| | | Treasury
Money
Fund
| | Tax-Exempt
Money
Fund
| | New York
Tax-Exempt
Money
Fund
|
ASSETS: | | | | | | | | | | | | | | | | | |
Investments, at cost — see accompanying portfolios | | $ | 1,596,594,915 | | | $ | 344,551,644 | | | $ | 368,947,929 | | $ | 2,050,659,089 | | $ | 409,664,858 |
| | |
|
|
| |
|
|
| |
|
| |
|
| |
|
|
Investments, at value (including repurchase agreements) (Note 1) | | $ | 1,596,594,915 | | | $ | 344,551,644 | | | $ | 368,947,929 | | $ | 2,050,659,089 | | $ | 409,664,858 |
Cash | | | — | | | | — | | | | — | | | — | | | 71,657 |
Interest receivable | | | 584,798 | | | | 3,146 | | | | 5,882 | | | 5,483,434 | | | 1,512,371 |
Receivable for investments sold | | | 149,704,688 | | | | 149,704,688 | | | | 39,983,667 | | | — | | | 3,500,000 |
Receivable for fund shares sold | | | 26,723,967 | | | | 22,451,522 | | | | 35,581,274 | | | 35,803,920 | | | 5,075,543 |
| | |
|
|
| |
|
|
| |
|
| |
|
| |
|
|
Total Assets | | | 1,773,608,368 | | | | 516,711,000 | | | | 444,518,752 | | | 2,091,946,443 | | | 419,824,429 |
| | |
|
|
| |
|
|
| |
|
| |
|
| |
|
|
LIABILITIES: | | | | | | | | | | | | | | | | | |
Payable for dividends declared | | | 2,587,123 | | | | 846,662 | | | | 487,546 | | | 2,593,234 | | | 400,596 |
Payable for investments purchased | | | — | | | | — | | | | 9,989,695 | | | — | | | — |
Payable for fund shares redeemed | | | 39,937,498 | | | | 19,570,559 | | | | 5,787,969 | | | 48,891,504 | | | 9,942,627 |
Investment advisory fees payable
(Note 2) | | | 35,632 | | | | 6,038 | | | | 40,500 | | | 59,518 | | | 32,716 |
Administration fees payable (Note 2) | | | 205,957 | | | | 64,070 | | | | 50,743 | | | 272,907 | | | 51,823 |
Shareholder servicing fees payable
(Note 2) | | | 240,885 | | | | 103,004 | | | | 93,006 | | | 420,492 | | | 71,765 |
Directors’/Trustees’ fees and expense payable (Note 2) | | | — | | | | 349 | | | | 47 | | | — | | | — |
Cash overdraft | | | — | | | | — | | | | — | | | 1,634,162 | | | — |
Accrued expenses and other payables | | | 260,858 | | | | 93,790 | | | | 61,084 | | | 272,133 | | | 72,900 |
| | |
|
|
| |
|
|
| |
|
| |
|
| |
|
|
Total Liabilities | | | 43,267,953 | | | | 20,684,472 | | | | 16,510,590 | | | 54,143,950 | | | 10,572,427 |
| | |
|
|
| |
|
|
| |
|
| |
|
| |
|
|
NET ASSETS | | $ | 1,730,340,415 | | | $ | 496,026,528 | | | $ | 428,008,162 | | $ | 2,037,802,493 | | $ | 409,252,002 |
| | |
|
|
| |
|
|
| |
|
| |
|
| |
|
|
NET ASSETS consist of: | | | | | | | | | | | | | | | | | |
Undistributed net investment income | | $ | — | | | $ | — | | | $ | 2,400 | | $ | 26,400 | | $ | 986 |
Accumulated net realized gain (loss) on investments | | | (35,637 | ) | | | (32,448 | ) | | | — | | | — | | | — |
Par value (Note 4) | | | 1,730,581 | | | | 496,126 | | | | 428,016 | | | 2,038,026 | | | 409,252 |
Paid-in capital in excess of par value | | | 1,728,645,471 | | | | 495,562,850 | | | | 427,577,746 | | | 2,035,738,067 | | | 408,841,764 |
| | |
|
|
| |
|
|
| |
|
| |
|
| |
|
|
Net Assets | | $ | 1,730,340,415 | | | $ | 496,026,528 | | | $ | 428,008,162 | | $ | 2,037,802,493 | | $ | 409,252,002 |
| | |
|
|
| |
|
|
| |
|
| |
|
| |
|
|
Net Assets: | | | | | | | | | | | | | | | | | |
Shares | | $ | 1,105,053,164 | | | $ | 496,026,528 | | | $ | 428,008,162 | | $ | 2,037,802,493 | | $ | 409,252,002 |
Institutional Shares | | | 625,287,251 | | | | — | | | | — | | | — | | | — |
Shares of Common Stock Outstanding (Note 4): | | | | | | | | | | | | | | | | | |
Shares | | | 1,105,292,365 | | | | 496,126,021 | | | | 428,015,889 | | | 2,038,025,945 | | | 409,251,926 |
Institutional Shares | | | 625,288,256 | | | | — | | | | — | | | — | | | — |
NET ASSET VALUE PER SHARE
(net assets ÷ shares outstanding): | | | | | | | | | | | | | | | | | |
Shares | | | $1.00 | | | | $1.00 | | | | $1.00 | | | $1.00 | | | $1.00 |
| | |
|
|
| |
|
|
| |
|
| |
|
| |
|
|
Institutional Shares | | | $1.00 | | | | — | | | | — | | | — | | | — |
| | |
|
|
| |
|
|
| |
|
| |
|
| |
|
|
See Notes to Financial Statements.
18
Excelsior Funds
Statements of Operations
Year Ended March 31, 2005
| | | | | | | | | | | | | | | | | | | | |
| | | | | |
| | | Money
Fund
| | | Government
Money
Fund
| | | Treasury
Money
Fund
| | | Tax-Exempt
Money
Fund
| | | New York
Tax-Exempt
Money
Fund
| |
INVESTMENT INCOME: | | | | | | | | | | | | | | | | | | | | |
Interest income | | $ | 27,818,905 | | | $ | 8,814,263 | | | $ | 6,599,273 | | | $ | 29,840,070 | | | $ | 5,931,020 | |
| | |
|
|
| |
|
|
| |
|
|
| |
|
|
| |
|
|
|
EXPENSES: | | | | | | | | | | | | | | | | | | | | |
Investment advisory fees (Note 2) | | | 4,004,089 | | | | 1,286,537 | | | | 1,284,515 | | | | 5,222,568 | | | | 2,156,839 | |
Administration fees (Note 2) | | | 2,424,662 | | | | 779,389 | | | | 648,495 | | | | 3,162,252 | | | | 653,423 | |
Shareholder servicing fees — Shares (Note 2) | | | 2,860,544 | | | | 1,286,283 | | | | 1,070,408 | | | | 5,195,400 | | | | 1,072,136 | |
Legal and audit fees | | | 315,004 | | | | 118,125 | | | | 98,475 | | | | 412,711 | | | | 97,205 | |
Re-audit expenses (Note 2) | | | 118,853 | | | | 42,607 | | | | 39,434 | | | | 146,285 | | | | 41,921 | |
Custodian fees | | | 66,509 | | | | 25,883 | | | | — | | | | 101,085 | | | | 34,851 | |
Registration and filing fees | | | 49,104 | | | | 23,553 | | | | 17,888 | | | | 25,689 | | | | 18,302 | |
Shareholder reports | | | 72,274 | | | | 11,373 | | | | 8,387 | | | | 46,801 | | | | 9,545 | |
Transfer agent fees | | | 127,811 | | | | 26,245 | | | | 24,071 | | | | 33,088 | | | | 24,616 | |
Directors’/Trustees fees and expenses (Note 2) | | | 45,115 | | | | 14,216 | | | | 11,862 | | | | 78,693 | | | | 16,155 | |
Miscellaneous expenses | | | 82,346 | | | | 28,689 | | | | 22,312 | | | | 112,881 | | | | 30,711 | |
| | |
|
|
| |
|
|
| |
|
|
| |
|
|
| |
|
|
|
Total Expenses | | | 10,166,311 | | | | 3,642,900 | | | | 3,225,847 | | | | 14,537,453 | | | | 4,155,704 | |
Fees waived and reimbursed by: | | | | | | | | | | | | | | | | | | | | |
Investment Adviser (Note 2) | | | (3,555,089 | ) | | | (1,146,409 | ) | | | (750,805 | ) | | | (4,432,905 | ) | | | (1,657,746 | ) |
Administrator (Note 2) | | | (273,411 | ) | | | (86,874 | ) | | | (75,758 | ) | | | (348,319 | ) | | | (78,650 | ) |
Re-audit expenses paid by Investment Adviser (Note 2) | | | (118,853 | ) | | | (42,607 | ) | | | (39,434 | ) | | | (146,285 | ) | | | (41,921 | ) |
| | |
|
|
| |
|
|
| |
|
|
| |
|
|
| |
|
|
|
Net Expenses | | | 6,218,958 | | | | 2,367,010 | | | | 2,359,850 | | | | 9,609,944 | | | | 2,377,387 | |
| | |
|
|
| |
|
|
| |
|
|
| |
|
|
| |
|
|
|
NET INVESTMENT INCOME | | | 21,599,947 | | | | 6,447,253 | | | | 4,239,423 | | | | 20,230,126 | | | | 3,553,633 | |
| | |
|
|
| |
|
|
| |
|
|
| |
|
|
| |
|
|
|
REALIZED GAIN ON INVESTMENTS (Note 1): | | | | | | | | | | | | | | | | | | | | |
Net realized gain on security transactions | | | 6,919 | | | | 2,167 | | | | 6,094 | | | | 38,044 | | | | 1,894 | |
| | |
|
|
| |
|
|
| |
|
|
| |
|
|
| |
|
|
|
Net increase in net assets resulting from operations | | $ | 21,606,866 | | | $ | 6,449,420 | | | $ | 4,245,517 | | | $ | 20,268,170 | | | $ | 3,555,527 | |
| | |
|
|
| |
|
|
| |
|
|
| |
|
|
| |
|
|
|
See Notes to Financial Statements.
19
Excelsior Funds
Statements of Changes in Net Assets
| | | | | | | | | | | | | | | | |
| | |
| | |
Money Fund
| | | Government Money Fund
| |
| | | Year Ended March 31,
| | | Year Ended March 31,
| |
| | | 2005
| | | 2004
| | | 2005
| | | 2004
| |
Net investment income | | $ | 21,599,947 | | | $ | 14,865,550 | | | $ | 6,447,253 | | | $ | 3,926,682 | |
Net realized gain (loss) on security transactions | | | 6,919 | | | | (23,975 | ) | | | 2,167 | | | | (6,483 | ) |
| | |
|
|
| |
|
|
| |
|
|
| |
|
|
|
Net increase in net assets resulting from operations | | | 21,606,866 | | | | 14,841,575 | | | | 6,449,420 | | | | 3,920,199 | |
| | |
|
|
| |
|
|
| |
|
|
| |
|
|
|
Distributions to shareholders: | | | | | | | | | | | | | | | | |
From net investment income | | | | | | | | | | | | | | | | |
Shares | | | (14,621,112 | ) | | | (9,962,795 | ) | | | (6,447,253 | ) | | | (3,926,682 | ) |
Institutional Shares | | | (6,978,835 | ) | | | (4,902,755 | ) | | | — | | | | — | |
From net realized gain on investment | | | — | | | | — | | | | — | | | | — | |
| | |
|
|
| |
|
|
| |
|
|
| |
|
|
|
Total distributions | | | (21,599,947 | ) | | | (14,865,550 | ) | | | (6,447,253 | ) | | | (3,926,682 | ) |
| | |
|
|
| |
|
|
| |
|
|
| |
|
|
|
Change in net assets from fund shares transactions (Note 4): | | | | | | | | | | | | | | | | |
Shares | | | (36,514,934 | ) | | | (646,272,448 | ) | | | (48,696,954 | ) | | | (49,768,352 | ) |
Institutional Shares | | | 155,097,235 | | | | (77,930,018 | ) | | | — | | | | — | |
| | |
|
|
| |
|
|
| |
|
|
| |
|
|
|
Total from fund share transactions | | | 118,582,301 | | | | (724,202,466 | ) | | | (48,696,954 | ) | | | (49,768,352 | ) |
| | |
|
|
| |
|
|
| |
|
|
| |
|
|
|
Net change in net assets | | | 118,589,220 | | | | (724,226,441 | ) | | | (48,694,787 | ) | | | (49,774,835 | ) |
| | |
|
|
| |
|
|
| |
|
|
| |
|
|
|
NET ASSETS: | | | | | | | | | | | | | | | | |
Beginning of period | | | 1,611,751,195 | | | | 2,335,977,636 | | | | 544,721,315 | | | | 594,496,150 | |
| | |
|
|
| |
|
|
| |
|
|
| |
|
|
|
End of period(1) | | $ | 1,730,340,415 | | | $ | 1,611,751,195 | | | $ | 496,026,528 | | | $ | 544,721,315 | |
| | |
|
|
| |
|
|
| |
|
|
| |
|
|
|
(1) Including undistributed net investment income | | $ | — | | | $ | — | | | $ | — | | | $ | — | |
| | |
|
|
| |
|
|
| |
|
|
| |
|
|
|
See Notes to Financial Statements.
20
| | | | | | | | | | | | | | | | | | | | | | |
| | |
Treasury Money Fund
| | | Tax-Exempt Money Fund
| | | New York Tax-Exempt
Money Fund
| |
Year Ended March 31,
| | | Year Ended March 31,
| | | Year Ended March 31,
| |
2005
| | | 2004
| | | 2005
| | | 2004
| | | 2005
| | | 2004
| |
| $ | 4,239,423 | | | $ | 2,592,575 | | | $ | 20,230,126 | | | $ | 11,865,428 | | | $ | 3,553,633 | | | $ | 2,456,690 | |
| | 6,094 | | | | 4,011 | | | | 38,044 | | | | (780 | ) | | | 1,894 | | | | 18,555 | |
|
|
| |
|
|
| |
|
|
| |
|
|
| |
|
|
| |
|
|
|
| | 4,245,517 | | | | 2,596,586 | | | | 20,268,170 | | | | 11,864,648 | | | | 3,555,527 | | | | 2,475,245 | |
|
|
| |
|
|
| |
|
|
| |
|
|
| |
|
|
| |
|
|
|
| | | | | | | | | | | | | | | | | | | | | | | |
| | | | | | | | | | | | | | | | | | | | | | | |
| | (4,245,864 | ) | | | (2,592,576 | ) | | | (20,240,002 | ) | | | (11,865,425 | ) | | | (3,553,633 | ) | | | (2,456,690 | ) |
| | — | | | | — | | | | — | | | | — | | | | — | | | | — | |
| | — | | | | (4,586 | ) | | | — | | | | (311,916 | ) | | | — | | | | (31,105 | ) |
|
|
| |
|
|
| |
|
|
| |
|
|
| |
|
|
| |
|
|
|
| | (4,245,864 | ) | | | (2,597,162 | ) | | | (20,240,002 | ) | | | (12,177,341 | ) | | | (3,553,633 | ) | | | (2,487,795 | ) |
|
|
| |
|
|
| |
|
|
| |
|
|
| |
|
|
| |
|
|
|
| | | | | | | | | | | | | | | | | | | | | | | |
| | | | | | | | | | | | | | | | | | | | | | | |
| | (91,713,040 | ) | | | (52,275,911 | ) | | | (6,902,094 | ) | | | (236,273,538 | ) | | | (80,848,665 | ) | | | (58,462,779 | ) |
| | — | | | | — | | | | — | | | | — | | | | — | | | | — | |
|
|
| |
|
|
| |
|
|
| |
|
|
| |
|
|
| |
|
|
|
| | (91,713,040 | ) | | | (52,275,911 | ) | | | (6,902,094 | ) | | | (236,273,538 | ) | | | (80,848,665 | ) | | | (58,462,779 | ) |
|
|
| |
|
|
| |
|
|
| |
|
|
| |
|
|
| |
|
|
|
| | (91,713,387 | ) | | | (52,276,487 | ) | | | (6,873,926 | ) | | | (236,586,231 | ) | | | (80,846,771 | ) | | | (58,475,329 | ) |
|
|
| |
|
|
| |
|
|
| |
|
|
| |
|
|
| |
|
|
|
| | | | | | | | | | | | | | | | | | | | | | | |
| | 519,721,549 | | | | 571,998,036 | | | | 2,044,676,419 | | | | 2,281,262,650 | | | | 490,098,773 | | | | 548,574,102 | |
|
|
| |
|
|
| |
|
|
| |
|
|
| |
|
|
| |
|
|
|
| $ | 428,008,162 | | | $ | 519,721,549 | | | $ | 2,037,802,493 | | | $ | 2,044,676,419 | | | $ | 409,252,002 | | | $ | 490,098,773 | |
|
|
| |
|
|
| |
|
|
| |
|
|
| |
|
|
| |
|
|
|
| $ | 2,400 | | | $ | 2,747 | | | $ | 26,400 | | | $ | 56 | | | $ | 986 | | | $ | — | |
|
|
| |
|
|
| |
|
|
| |
|
|
| |
|
|
| |
|
|
|
See Notes to Financial Statements.
21
Excelsior Funds
Financial Highlights — Selected Per Share Data and Ratios
| | | | | | | | | | | | | | | | | | | | | | |
| | | | | | |
| | | Net Asset Value,
Beginning of
Period
| | Net
Investment
Income
| | | Net Realized
Gain (Loss)
on Investments
| | | Total From
Investment
Operations
| | Dividends
From Net
Investment
Income
| | | Distributions From
Net Realized Gain
on Investments
| |
MONEY FUND | | | | | | | | | | | | | | | | | | | | | | |
Shares — (5/3/85*) | | | | | | | | | | | | | | | | | | | |
Year Ended March 31, | | | | | | | | | | | | | | | | | | | |
2005 | | $ | 1.00 | | $ | 0.01275 | (2) | | $ | 0.00010 | | | $ | 0.01285 | | $ | (0.01285 | ) | | | — | |
2004 | | | 1.00 | | | 0.00662 | | | | — | | | | 0.00662 | | | (0.00662 | ) | | | — | |
2003 | | | 1.00 | | | 0.01255 | | | | (0.00010 | ) | | | 0.01245 | | | (0.01245 | ) | | | — | |
2002 | | | 1.00 | | | 0.02741 | | | | 0.00010 | | | | 0.02751 | | | (0.02751 | ) | | | — | |
2001 | | | 1.00 | | | 0.05804 | | | | — | | | | 0.05804 | | | (0.05804 | ) | | | — | |
GOVERNMENT MONEY FUND | | | | | | | | | | | | |
Shares — (5/8/85*) | | | | | | | | | | | | | | | | | | | |
Year Ended March 31, | | | | | | | | | | | | | | | | | | | |
2005 | | $ | 1.00 | | $ | 0.01250 | (2) | | $ | 0.00003 | | | $ | 0.01253 | | $ | (0.01253 | ) | | | — | |
2004 | | | 1.00 | | | 0.00625 | | | | — | | | | 0.00625 | | | (0.00625 | ) | | | — | |
2003 | | | 1.00 | | | 0.01199 | | | | (0.00039 | ) | | | 0.01160 | | | (0.01160 | ) | | | — | |
2002 | | | 1.00 | | | 0.02585 | | | | 0.00038 | | | | 0.02623 | | | (0.02623 | ) | | | — | |
2001 | | | 1.00 | | | 0.05752 | | | | — | | | | 0.05752 | | | (0.05752 | ) | | | — | |
TREASURY MONEY FUND | | | | | | | | | | | | |
Shares — (2/13/91*) | | | | | | | | | | | | | | | | | | | |
Year Ended March 31, | | | | | | | | | | | | | | | | | | | |
2005 | | $ | 1.00 | | $ | 0.00988 | (2) | | $ | 0.00031 | | | $ | 0.01019 | | $ | (0.01019 | ) | | | — | |
2004 | | | 1.00 | | | 0.00484 | | | | 0.00002 | | | | 0.00486 | | | (0.00485 | ) | | $ | (0.00001 | ) |
2003 | | | 1.00 | | | 0.01085 | | | | 0.00004 | | | | 0.01089 | | | (0.01089 | ) | | | — | |
2002 | | | 1.00 | | | 0.02451 | | | | (0.00002 | ) | | | 0.02449 | | | (0.02449 | ) | | | — | |
2001 | | | 1.00 | | | 0.05339 | | | | — | | | | 0.05339 | | | (0.05339 | ) | | | — | |
TAX-EXEMPT MONEY FUND | | | | | | | | | | | | |
Shares — (5/24/85*) | | | | | | | | | | | | | | | | | | | |
Year Ended March 31, | | | | | | | | | | | | | | | | | | | |
2005 | | $ | 1.00 | | $ | 0.00966 | (2) | | | — | | | $ | 0.00966 | | $ | (0.00966 | ) | | | — | |
2004 | | | 1.00 | | | 0.00546 | | | $ | 0.00029 | | | | 0.00575 | | | (0.00560 | ) | | $ | (0.00015 | ) |
2003 | | | 1.00 | | | 0.00967 | | | | (0.00002 | ) | | | 0.00965 | | | (0.00964 | ) | | | (0.00001 | ) |
2002 | | | 1.00 | | | 0.01862 | | | | 0.00013 | | | | 0.01875 | | | (0.01865 | ) | | | (0.00010 | ) |
2001 | | | 1.00 | | | 0.03580 | | | | — | | | | 0.03580 | | | (0.03580 | ) | | | — | |
NEW YORK TAX-EXEMPT MONEY FUND | | | | | | | | |
Shares — (8/3/98*) | | | | | | | | | | | | | | | | | | | |
Year Ended March 31, | | | | | | | | | | | | | | | | | | | |
2005 | | $ | 1.00 | | $ | 0.00822 | (2) | | $ | 0.00023 | | | $ | 0.00845 | | $ | (0.00845 | ) | | | — | |
2004 | | | 1.00 | | | 0.00491 | | | | 0.00006 | | | | 0.00497 | | | (0.00490 | ) | | $ | (0.00007 | ) |
2003 | | | 1.00 | | | 0.00884 | | | | (0.00007 | ) | | | 0.00877 | | | (0.00873 | ) | | | (0.00004 | ) |
2002 | | | 1.00 | | | 0.01758 | | | | 0.00011 | | | | 0.01769 | | | (0.01769 | ) | | | — | |
2001 | | | 1.00 | | | 0.03431 | | | | — | | | | 0.03431 | | | (0.03431 | ) | | | — | |
| * | Commencement of Operations |
| (1) | Expense ratios before waiver of fees and reimbursement of expenses by adviser and administrator. |
| (2) | For comparative purposes, per share amounts are based on average shares outstanding. |
See Notes to Financial Statements.
22
| | | | | | | | | | | | | | | | | | | | | | | | |
| | | | | | | |
Total
Distributions
| | | Net Asst Value,
End of Period
| | Total
Return
| | | Net Assets, End
of Period (000's)
| | Ratio of Net
Operating Expenses
to Average
Net Assets
| | | Ratio of Gross
Operating Expenses
to Average Net
Assets(1)
| | | Ratio of Net
Investment
Income to
Average Net Assets
| | | Fee
Wavier
(Note 2)
| |
| | | | | | | | | | | | | | | | | | | | | | | | | |
| | | | | | | | | | | | | | | | | | | | | | | | | |
| | | | | | | | | | | | | | | | | | | | | | | | | |
| $ | (0.01285 | ) | | $ | 1.00 | | 1.29 | % | | $ | 1,105,053 | | 0.46 | % | | 0.70 | % | | 1.28 | % | | $ | 0.00249 | (2) |
| | (0.00662 | ) | | | 1.00 | | 0.66 | % | | | 1,141,562 | | 0.45 | % | | 0.73 | % | | 0.67 | % | | | 0.00279 | |
| | (0.01245 | ) | | | 1.00 | | 1.25 | % | | | 1,787,852 | | 0.39 | % | | 0.43 | % | | 1.25 | % | | | 0.00033 | |
| | (0.02751 | ) | | | 1.00 | | 2.79 | % | | | 1,802,136 | | 0.44 | % | | 0.74 | % | | 2.76 | % | | | 0.00295 | |
| | (0.05804 | ) | | | 1.00 | | 5.96 | % | | | 1,891,042 | | 0.47 | % | | 0.71 | % | | 5.84 | % | | | 0.00238 | |
| | | | | | | | | | | | | | | | | | | | | | | | | |
| | | | | | | | | | | | | | | | | | | | | | | | | |
| | | | | | | | | | | | | | | | | | | | | | | | | |
| $ | (0.01253 | ) | | $ | 1.00 | | 1.26 | % | | $ | 496,027 | | 0.46 | % | | 0.71 | % | | 1.25 | % | | $ | 0.00247 | (2) |
| | (0.00625 | ) | | | 1.00 | | 0.63 | % | | | 544,721 | | 0.45 | % | | 0.54 | % | | 0.62 | % | | | 0.00089 | |
| | (0.01160 | ) | | | 1.00 | | 1.17 | % | | | 594,496 | | 0.39 | % | | 0.47 | % | | 1.21 | % | | | 0.00082 | |
| | (0.02623 | ) | | | 1.00 | | 2.65 | % | | | 795,287 | | 0.43 | % | | 0.49 | % | | 2.72 | % | | | 0.00063 | |
| | (0.05752 | ) | | | 1.00 | | 5.91 | % | | | 1,427,560 | | 0.46 | % | | 0.48 | % | | 5.76 | % | | | 0.00029 | |
| | | | | | | | | | | | | | | | | | | | | | | | | |
| | | | | | | | | | | | | | | | | | | | | | | | | |
| | | | | | | | | | | | | | | | | | | | | | | | | |
| $ | (0.01019 | ) | | $ | 1.00 | | 1.02 | % | | $ | 428,008 | | 0.55 | % | | 0.75 | % | | 0.99 | % | | $ | 0.00202 | (2) |
| | (0.00486 | ) | | | 1.00 | | 0.49 | % | | | 519,722 | | 0.50 | % | | 0.57 | % | | 0.49 | % | | | 0.00075 | |
| | (0.01089 | ) | | | 1.00 | | 1.09 | % | | | 571,998 | | 0.45 | % | | 0.53 | % | | 1.08 | % | | | 0.00075 | |
| | (0.02449 | ) | | | 1.00 | | 2.48 | % | | | 604,281 | | 0.48 | % | | 0.54 | % | | 2.42 | % | | | 0.00062 | |
| | (0.05339 | ) | | | 1.00 | | 5.47 | % | | | 615,926 | | 0.50 | % | | 0.55 | % | | 5.35 | % | | | 0.00046 | |
| | | | | | | | | | | | | | | | | | | | | | | | | |
| | | | | | | | | | | | | | | | | | | | | | | | | |
| | | | | | | | | | | | | | | | | | | | | | | | | |
| $ | (0.00966 | ) | | $ | 1.00 | | 0.97 | % | | $ | 2,037,802 | | 0.46 | % | | 0.69 | % | | 0.97 | % | | $ | 0.00235 | (2) |
| | (0.00575 | ) | | | 1.00 | | 0.58 | % | | | 2,044,676 | | 0.44 | % | | 0.58 | % | | 0.56 | % | | | 0.00132 | |
| | (0.00965 | ) | | | 1.00 | | 0.97 | % | | | 2,281,263 | | 0.39 | % | | 0.54 | % | | 0.97 | % | | | 0.00158 | |
| | (0.01875 | ) | | | 1.00 | | 1.89 | % | | | 2,522,455 | | 0.44 | % | | 0.58 | % | | 1.85 | % | | | 0.00136 | |
| | (0.03580 | ) | | | 1.00 | | 3.64 | % | | | 2,617,329 | | 0.45 | % | | 0.53 | % | | 3.59 | % | | | 0.00075 | |
| | | | | | | | | | | | | | | | | | | | | | | | | |
| | | | | | | | | | | | | | | | | | | | | | | | | |
| | | | | | | | | | | | | | | | | | | | | | | | | |
| $ | (0.00845 | ) | | $ | 1.00 | | 0.85 | % | | $ | 409,252 | | 0.55 | % | | 0.97 | % | | 0.82 | % | | $ | 0.00411 | (2) |
| | (0.00497 | ) | | | 1.00 | | 0.50 | % | | | 490,099 | | 0.50 | % | | 0.75 | % | | 0.49 | % | | | 0.00253 | |
| | (0.00877 | ) | | | 1.00 | | 0.88 | % | | | 548,574 | | 0.44 | % | | 0.49 | % | | 0.89 | % | | | 0.00043 | |
| | (0.01769 | ) | | | 1.00 | | 1.78 | % | | | 696,093 | | 0.48 | % | | 0.71 | % | | 1.76 | % | | | 0.00228 | |
| | (0.03431 | ) | | | 1.00 | | 3.49 | % | | | 682,445 | | 0.51 | % | | 0.72 | % | | 3.43 | % | | | 0.00214 | |
See Notes to Financial Statements.
23
EXCELSIOR FUNDS
NOTES TO FINANCIAL STATEMENTS
1. Significant Accounting Policies:
Excelsior Funds, Inc. (“Excelsior Fund”) and Excelsior Tax-Exempt Funds, Inc. (“Excelsior Tax-Exempt Fund”) were incorporated under the laws of the State of Maryland on August 2, 1984 and August 8, 1984, respectively, and are registered under the Investment Company Act of 1940 (the “1940 Act”), as amended, as open-ended diversified management investment companies with the exception of Energy and Natural Resources Fund, Real Estate Fund, New York Intermediate-Term Tax-Exempt Fund, California Tax-Exempt Income Fund and New York Tax-Exempt Money Fund, each of which are non-diversified.
Excelsior Fund and Excelsior Tax-Exempt Fund currently offer shares in fifteen and seven managed investment portfolios, respectively, each having its own investment objectives and policies. The following is a summary of significant accounting policies for Money Fund, Government Money Fund and Treasury Money Fund, portfolios of Excelsior Fund, and for Tax-Exempt Money Fund and New York Tax-Exempt Money Fund, portfolios of Excelsior Tax-Exempt Fund (collectively, the “Funds”). Such policies are in conformity with accounting principles generally accepted in the United States of America and are consistently followed by the Funds in the preparation of their financial statements. The preparation of financial statements requires management to make estimates and assumptions that affect the reported amounts and disclosures in the financial statements. Actual results could differ from these estimates.
The Money Fund offers two classes of shares: Institutional Shares and Shares. The Financial Highlights of the Institutional Shares as well as the financial statements for the remaining portfolios of Excelsior Fund and Excelsior Tax-Exempt Fund are presented separately.
It is each Fund’s policy, to the extent possible, to maintain a continuous net asset value per share of $1.00. Each Fund has adopted certain investment portfolio valuation and dividend distribution policies to enable it to do so. However, there can be no assurance that the net asset value per share of the Fund will not vary.
(a) Portfolio valuation:
Securities are valued at amortized cost, which has been determined by each Fund’s Board of Directors to represent the fair value of the Funds’ investments. Amortized cost valuation involves valuing an instrument at its cost initially and, thereafter, assuming a constant amortization to maturity of any discount or premium.
(b) Security transactions and investment income:
Security transactions are recorded on a trade date basis. Realized gains and losses on investments sold are recorded on the basis of identified cost. Interest income, adjusted for amortization of premiums and, when appropriate, discounts on investments, is earned from settlement date and is recorded on the accrual basis.
24
(c) Repurchase agreements:
The Funds may purchase portfolio securities from financial institutions deemed to be creditworthy by the investment adviser subject to the seller’s agreement to repurchase and the Funds’ agreement to resell such securities at mutually agreed upon prices. Securities purchased subject to such repurchase agreements are deposited with the Funds’ custodian or sub-custodian or are maintained in the Federal Reserve/Treasury book-entry system and must have, at all times, an aggregate market value not less than the repurchase price (including accrued interest).
Default or bankruptcy of the seller may, however, expose the applicable Fund to possible delay in connection with the disposition of the underlying securities or loss to the extent that proceeds from a sale of the underlying securities were less than the repurchase price under the agreement.
(d) Distributions to shareholders:
Dividends from net investment income are declared daily and paid monthly. Net realized capital gains, unless offset by any available capital loss carryforward, are distributed to shareholders annually or more frequently to maintain a net asset value of $1.00 per share.
(e) Expense allocation:
Expenses directly attributable to a Fund are charged to that Fund. Other expenses are allocated to the respective Funds based on average daily net assets. Expenses attributable to a specific class of shares, such as shareholder servicing fees, are charged directly to that class.
2. Investment Advisory Fee, Administration Fee, Shareholder Servicing Fees and Related Party Transactions:
United States Trust Company of New York (“U.S. Trust NY”) and U.S. Trust Company, N.A. (together, the “Adviser” or “U.S. Trust”), acting through their respective registered investment advisory divisions, U.S. Trust New York Asset Management Division and U.S. Trust Company, N.A. Asset Management Division, serve as the investment adviser to the Funds. For the services provided pursuant to the Investment Advisory Agreements, the Adviser receives a fee, computed daily and paid monthly as follows:
| | | |
Money Fund | | 0.25 | % |
Government Money Fund | | 0.25 | % |
Treasury Money Fund | | 0.30 | % |
Tax-Exempt Money Fund | | 0.25 | % |
New York Tax-Exempt Money Fund | | 0.50 | % |
U.S. Trust NY is a state-chartered bank and trust company and a member bank of the Federal Reserve System. U.S. Trust Company, N.A. is a national bank organized under the laws of the United States. Each is a wholly-owned subsidiary of U.S. Trust Corporation, a registered bank holding company. U.S. Trust Corporation is a wholly-owned subsidiary of The Charles Schwab Corporation (“Schwab”).
U.S. Trust Company, N.A., and BISYS Fund Services Ohio, Inc. (collectively, the “Administrators”) provide administrative services to the Funds. For the services provided to the Funds, the Administrators
25
are entitled jointly to annual fees, computed daily and paid monthly, based on the combined aggregate average daily net assets of Excelsior Fund, Excelsior Tax-Exempt Fund and Excelsior Funds Trust (excluding the international equity portfolios of Excelsior Fund and Excelsior Funds Trust), all of which are affiliated investment companies, as follows: 0.200% of the first $200 million, 0.175% of the next $200 million and 0.150% over $400 million. The Administrators are entitled jointly to annual fees, computed daily and paid monthly, at the annual rate of 0.20% of the average daily net assets of the International Equity Fund, International Fund, Pacific/Asia Fund and Emerging Markets Fund. Administration fees payable by each Fund of the three investment companies are determined in proportion to the relative average daily net assets of the respective Funds for the period paid. For the five month period ended August 31, 2004, U.S. Trust Company, N.A. voluntarily agreed to waive a portion of its administration fee in an amount equal to an annual rate of 0.04% of the average daily net assets of each Fund. For the year ended March 31, 2005, administration fees charged to the Funds by U.S. Trust Company, N.A. were as follows:
| | | | | | | | | | |
| | | Administration
Fees
| | Waiver
Administration
Fees
| | | Net
Administration
Fees
|
Money Fund | | $ | 2,424,662 | | $ | (273,411 | ) | | $ | 2,151,251 |
Government Money Fund | | | 779,389 | | | (86,874 | ) | | | 692,515 |
Treasury Money Fund | | | 648,495 | | | (75,758 | ) | | | 572,737 |
Tax-Exempt Money Fund | | | 3,162,252 | | | (348,319 | ) | | | 2,813,933 |
New York Tax-Exempt Money Fund | | | 653,423 | | | (78,650 | ) | | | 574,773 |
From time to time, in its sole discretion, U.S. Trust may undertake to waive a portion or all of the fees payable to it and may also reimburse the Funds for a portion of other expenses. For the year ended March 31, 2005, U.S. Trust has contractually agreed to waive investment advisory fees and to reimburse other ordinary operating expenses to the extent necessary to keep total operating expenses from exceeding the following annual percentages of each Fund’s average daily net assets:
| | | |
Money Fund | | 0.50 | % |
Government Money Fund | | 0.50 | % |
Treasury Money Fund | | 0.55 | % |
Tax-Exempt Money Fund | | 0.50 | % |
New York Tax-Exempt Money Fund | | 0.60 | % |
With regard to the Institutional Shares of Money Fund, for the period ended March 31, 2005, and until further notice, U.S. Trust contractually agreed to waive fees and reimburse expenses to the extent necessary to maintain an annual expense ratio of not more than 0.25%.
For the year ended March 31, 2005, pursuant to the above, investment advisory fees waived by U.S. Trust were as follows:
| | | | |
Money Fund | | $ | (3,555,089 | ) |
Government Money Fund | | | (1,146,409 | ) |
Treasury Money Fund | | | (750,805 | ) |
Tax-Exempt Money Fund | | | (4,432,905 | ) |
New York Tax-Exempt Money Fund | | | (1,657,746 | ) |
26
The Funds have entered into shareholder servicing agreements with various service organizations, which may include Charles Schwab & Co. Inc. (“CS & Co.”) and U.S. Trust. Services included in the servicing agreements are assisting in processing purchase, exchange and redemption requests; transmitting and receiving funds in connection with customer orders to purchase, exchange or redeem shares; and providing periodic statements. Shareholder servicing fees are incurred on a Fund or class level (where applicable). In consideration for these services, each service organization receives a fee, computed daily and paid monthly, at an annual rate up to 0.25% of the average daily net assets of the Funds’ shares held by each service organizations’ customers, with the exception of the Institutional Shares of the Money Fund, which pays a fee of up to 0.15% of the average daily net assets of its shares. The Adviser, out of its own resources, may additionally compensate certain organizations for providing these services.
For the year ended March 31, 2005, shareholder servicing fees paid to CS & Co. and U.S. Trust were as follows:
| | | |
Money Fund | | $ | 2,833,215 |
Government Money Fund | | | 1,284,129 |
Treasury Money Fund | | | 1,055,676 |
Tax-Exempt Money Fund | | | 5,223,666 |
New York Tax-Exempt Fund | | | 1,082,177 |
Effective January 1, 2005, BISYS Fund Services Limited Partnership became the Distributor for the Funds. Prior to January 1, 2005, Edgewood Services, Inc. (a wholly-owned subsidiary of Federated Investors, Inc.), served as the Distributor of the Funds. Shares of each Fund are sold without a sales charge on a continuous basis by the Distributor.
Effective July 31, 2004, each Independent Director/Trustee of the Funds receives a total annual fee of $100,000 paid by the Funds and other affiliated investment companies managed by U.S. Trust. The Chairman of the Board receives an additional $30,000, the Chairman of the Audit Committee receives an additional $15,000, and the Chairman of the Nominating Committee receives an additional $5,000 for serving in those capacities. Prior to July 31, 2004, each Independent Director of Excelsior Fund received an annual fee of $15,000, plus a meeting fee of $2,500 for each meeting attended. The Chairman received an additional annual fee of $7,500. Each Independent Director of the Excelsior Tax-Exempt Fund received an annual fee of $15,000, plus a meeting fee of $2,500 for each meeting attended. The Chairman receives an additional annual fee of $7,500. Each member of the Nominating Committee for Excelsior Fund, Excelsior Tax-Exempt Fund and Excelsior Funds Trust receives a fee of $3,000 for each meeting attended. The Chairman of the Nominating Committee received an additional annual fee of $5,000. In addition, Directors and Trustees are reimbursed by the Excelsior Fund and Excelsior Tax-Exempt Fund for reasonable expenses incurred when acting in their capacity as Directors and Trustees.
The Funds’ Board of Directors/Trustees selected Deloitte & Touche LLP in November of 2004 to be their registered public accounting firm and to re-audit the Funds’ March 31, 2004 financial statements. All expenses in connection with the re-audit, including costs of audit, legal services, and printing and mailing of the financial statements, were paid by the Adviser. Such expenses are reflected in the Statements of Operations as “re-audit expenses” and the corresponding expense waiver “re-audit expenses paid by Investment Adviser.”
27
3. Federal Taxes:
It is the policy of the Excelsior Fund and Excelsior Tax-Exempt Fund that each Fund qualify or continue to qualify as a regulated investment company, by complying with the requirements of the Internal Revenue Code applicable to regulated investment companies and by distributing substantially all of its taxable earnings to its shareholders.
In order to avoid a federal excise tax, each Fund is required to distribute certain minimum amounts of net realized capital gain and net investment income for the respective twelve-month periods ending October 31 and December 31 in each calendar year.
Dividends and distributions are determined in accordance with federal income tax regulations and may differ from accounting principles generally accepted in the United States of America. These differences are primarily due to differing treatments for deferral of losses on wash sales and net capital losses incurred after October 31 and within the taxable year (“Post-October losses”). To the extent these differences are permanent, adjustments are made to the appropriate equity accounts in the period that these differences arise. Accordingly, the following reclassifications have been made to/from the following accounts:
| | | | | | | | | | |
| | | Undistributed
Net Investment
Income
| | Accumulated
Net Realized
Gain (Loss)
| | | Paid-In
Capital
| |
Money Fund | | — | | $ | 5,131 | | | $ | (5,131 | ) |
Treasury Money Fund | | 6,094 | | | (6,094 | ) | | | — | |
Tax-Exempt Money Fund | | 36,220 | | | (36,217 | ) | | | (3 | ) |
New York Tax-Exempt Money Fund | | 986 | | | (986 | ) | | | — | |
The tax character of dividends and distributions declared during the years ended March 31, 2005 and March 31, 2004 were as follows:
| | | | | | | | | | | | |
| | | Ordinary
Income
| | Tax-Exempt
Income
| | Long-Term
Capital
Gain
| | Total
|
Money Fund | | | | | | | | | | | | |
2005 | | $ | 19,959,001 | | | — | | | — | | $ | 19,959,001 |
2004 | | | 14,865,550 | | | — | | | — | | | 14,865,550 |
Government Money Fund | | | | | | | | | | | | |
2005 | | | 5,884,680 | | | — | | | — | | | 5,884,680 |
2004 | | | 3,926,682 | | | — | | | — | | | 3,926,682 |
Treasury Money Fund | | | | | | | | | | | | |
2005 | | | 3,943,362 | | | — | | | — | | | 3,943,362 |
2004 | | | 2,597,162 | | | — | | | — | | | 2,597,162 |
Tax-Exempt Money Fund | | | | | | | | | | | | |
2005 | | | 28,575 | | $ | 18,660,028 | | $ | 7,646 | | | 18,696,249 |
2004 | | | 38,469 | | | 11,865,305 | | | 273,567 | | | 12,177,341 |
New York Tax-Exempt Money Fund | | | | | | | | | | | | |
2005 | | | 988 | | | 3,352,703 | | | — | | | 3,353,691 |
2004 | | | 31,529 | | | 2,456,266 | | | — | | | 2,487,795 |
28
As of March 31, 2005, the components of distributable earnings (accumulated losses) on a tax basis were as follows:
| | | | | | | | | | | | | | | | | | | | | |
| | | Undistributed
Ordinary
Income
| | Undistributed
Tax-Exempt
Income
| | Accumulated
Earnings
| | Distributions
Payable
| | | Accumulated
Capital and
Other Losses
| | | Total
Accumulated
Earnings
| |
Money Fund | | $ | 2,587,123 | | | — | | $ | 2,587,123 | | $ | (2,587,123 | ) | | $ | (35,637 | ) | | $ | (35,637 | ) |
Government Money Fund | | | 846,662 | | | — | | | 846,662 | | | (846,662 | ) | | | (32,448 | ) | | | (32,448 | ) |
Treasury Money Fund | | | 489,946 | | | — | | | 489,946 | | | (487,546 | ) | | | — | | | | 2,400 | |
Tax-Exempt Money Fund | | | — | | $ | 2,619,634 | | | 2,619,634 | | | (2,593,234 | ) | | | — | | | | 26,400 | |
New York Tax-Exempt Money Fund | | | — | | | 401,582 | | | 401,582 | | | (400,596 | ) | | | — | | | | 986 | |
Post-October losses are deemed to arise on the first business day of a Fund’s next taxable year.
For federal income tax purposes, capital loss carryforwards may be carried forward and applied against future capital gains. To the extent that such carryforwards are utilized, capital gain distributions will be reduced. At March 31, 2005, the following Funds had capital loss carryforwards available to offset future net capital gains through the indicated expiration dates:
| | | | | | | | | | | | | | | | | | |
| | | Expires
| |
|
| | | 2006
| | 2007
| | 2008
| | 2011
| | 2012
| | Total
|
Money Fund | | | — | | | — | | | — | | $ | 11,662 | | $ | 23,975 | | $ | 35,637 |
Government Money Fund | | $ | 4,692 | | $ | 3,297 | | $ | 18,903 | | | — | | | 5,556 | | | 32,448 |
4. Capital Transactions:
Excelsior Fund has authorized capital of 35 billion shares of Common Stock, 29.3756 billion of which is currently classified to represent interests in certain classes of shares. Excelsior Tax-Exempt Fund has authorized capital of 24 billion shares of Common Stock, 15 billion of which is currently classified to represent interests in certain classes of shares. Authorized capital currently classified for each Fund is as follows: 4 billion shares each of the Money Fund and Government Money Fund, 2.5 billion shares of Treasury Money Fund, 2 billion shares of New York Tax-Exempt Money Fund and 5.5 billion shares for Tax-Exempt Money Fund.
Each share has a par value of $0.001 and represents an equal proportionate interest in the particular Fund with other shares of the same Fund, and is entitled to such dividends and distributions of taxable earnings on the assets belonging to such Fund as are declared at the discretion of each Fund’s Board of Directors. Since the Funds have sold, reinvested and redeemed shares only at a constant net asset value of $1.00 per share, the number of shares represented by such sales, reinvestments and redemptions is the same as the amounts shown below for such transactions.
29
| | | | | | | | | | | |
| | | Money Fund
| |
| | | Year Ended March 31,
| |
| | | 2005
| | | 2004
| |
| | | Shares
| | | Amount
| | | Amount
| |
Sold: | | | | | | | | | | | |
Shares | | 3,782,584,603 | | | $ | 3,782,584,603 | | | $ | 4,664,084,234 | |
Institutional Shares | | 4,191,107,467 | | | | 4,191,107,467 | | | | 2,751,605,010 | |
Issued as reinvestment of dividends: | | | | | | | | | | | |
Shares | | 1,188,525 | | | | 1,188,499 | | | | 784,932 | |
Institutional Shares | | 2,099,572 | | | | 2,099,573 | | | | 2,186,353 | |
Redeemed: | | | | | | | | | | | |
Shares | | (3,820,288,035 | ) | | | (3,820,288,036 | ) | | | (5,311,141,614 | ) |
Institutional Shares | | (4,038,109,800 | ) | | | (4,038,109,805 | ) | | | (2,831,721,381 | ) |
| | |
|
| |
|
|
| |
|
|
|
Change in net assets | | 118,582,332 | | | $ | 118,582,301 | | | $ | (724,202,466 | ) |
| | |
|
| |
|
|
| |
|
|
|
| | | | | | | | |
| |
| | | Government Money Fund
| |
| | | Year Ended March 31,
| |
| | | 2005
| | | 2004
| |
Sold | | $ | 2,736,097,238 | | | $ | 3,164,391,955 | |
Issued as reinvestment of dividends | | | 377,287 | | | | 271,873 | |
Redeemed | | | (2,785,171,479 | ) | | | (3,214,432,180 | ) |
| | |
|
|
| |
|
|
|
Change in net assets | | $ | (48,696,954 | ) | | $ | (49,768,352 | ) |
| | |
|
|
| |
|
|
|
| |
| | | Treasury Money Fund
| |
| | | Year Ended March 31,
| |
| | | 2005
| | | 2004
| |
Sold | | $ | 3,255,632,599 | | | $ | 2,924,119,256 | |
Issued as reinvestment of dividends | | | 968,644 | | | | 641,186 | |
Redeemed | | | (3,348,314,283 | ) | | | (2,977,036,353 | ) |
| | |
|
|
| |
|
|
|
Change in net assets | | $ | (91,713,040 | ) | | $ | (52,275,911 | ) |
| | |
|
|
| |
|
|
|
| |
| | | Tax-Exempt Money Fund
| |
| | | Year Ended March 31,
| |
| | | 2005
| | | 2004
| |
Sold | | $ | 8,993,982,009 | | | $ | 7,348,246,145 | |
Issued as reinvestment of dividends | | | 573,372 | | | | 360,212 | |
Redeemed | | | (9,001,457,475 | ) | | | (7,584,879,895 | ) |
| | |
|
|
| |
|
|
|
Change in net assets | | $ | (6,902,094 | ) | | $ | (236,273,538 | ) |
| | |
|
|
| |
|
|
|
| |
| | | New York Tax-Exempt Money Fund
| |
| | | Year Ended March 31,
| |
| | | 2005
| | | 2004
| |
Sold | | $ | 1,870,092,958 | | | $ | 1,700,208,458 | |
Issued as reinvestment of dividends | | | 460,208 | | | | 422,511 | |
Redeemed | | | (1,951,401,831 | ) | | | (1,759,093,748 | ) |
| | |
|
|
| |
|
|
|
Change in net assets | | $ | (80,848,665 | ) | | $ | (58,462,779 | ) |
| | |
|
|
| |
|
|
|
30
5. Line of Credit:
During the year ended March 31, 2005, the Funds and other affiliated funds participated in a $50 million unsecured line of credit provided by a syndication of banks under a line of credit agreement. A commitment fee, equal to an annual rate of 0.15% of the average daily unused portion of the line of credit, is allocated among the participating Funds at the end of each quarter, and is included in miscellaneous expenses on the statements of operations. For the year ended March 31, 2005, the Funds had no borrowings under the agreement. Effective March 9, 2005, the unsecured line of credit was terminated.
6. Guarantees:
In the normal course of business, the Funds enter into contracts that provide general indemnifications. The Funds’ maximum exposure under these arrangements is dependent on future claims that may be made against the Funds, and therefore, cannot be established; however, based on experience, the risk of loss from such claims is considered remote.
7. Legal Proceedings:
The Adviser and Excelsior Funds, Inc., Excelsior Tax-Exempt Funds, Inc., and Excelsior Funds Trust (the “Companies”) were contacted in September, 2003 by the Office of the New York State Attorney General (the “NYAG”), and the Adviser was contacted by the Securities and Exchange Commission (the “SEC”) in connection with their investigations of practices in the mutual fund industry identified as “market timing” and “late trading” of mutual fund shares (the “Investigations”). The Adviser and the Companies have cooperated with respect to these Investigations. As disclosed previously by the Adviser and its affiliates, with respect to the Adviser, these investigations have focused on circumstances in which a small number of parties were permitted to engage in short-term trading of certain Excelsior Funds. The short-term trading activities permitted under these arrangements have been terminated and the Adviser has strengthened its policies and procedures to deter frequent trading in the Companies.
Five class actions filed against the Companies and two derivative actions purportedly brought on behalf of each of the Companies and each of the funds have been transferred to the United District Court for the District of Maryland for coordinated or consolidated pre-trial proceedings in a matter styled In Re Mutual Funds Investment Litigation, MDL Docket No. 1586. Lead plaintiffs were appointed and additional defendants were added (generally consisting of current and former directors and officers of the Companies). The five class actions were then consolidated and a single amended complaint was filed on or about September 29, 2004. Plaintiffs in the consolidated class action are seeking unspecified monetary damages from claimed injuries arising from allegedly illegal and improper mutual fund trading practices, as well as disgorgement of investment advisory fees, rescission and restitution of unspecified funds. The two derivative actions were also consolidated into a new amended complaint, also filed on or about September 29, 2004. Plaintiffs in the consolidated derivative action are seeking, on behalf of the Companies, unspecified monetary damages for similar claimed injuries, as well as removal of Excelsior Fund directors, removal of U.S. Trust as advisor to the Excelsior Funds, rescission of its investment advisory contracts and disgorgement of management fees and compensation relating to the Excelsior Funds.
31
The defendants in the consolidated actions have moved to dismiss such actions, and the Maryland court is scheduled to hear oral argument on the motions to dismiss on June 16-17, 2005. The defendants will not be required to answer the complaints until such motions have been decided, and discovery in the actions is currently stayed.
While the ultimate outcome of these matters cannot be predicted with any certainty at this time, based on currently available information, the Adviser believes that the likelihood is remote that the pending private lawsuits and Investigations will have a material adverse financial impact on the Companies, and further believes that the pending Investigations and private lawsuits are not likely to materially affect the Adviser’s ability to provide investment management services to the Companies.
32
REPORT OF INDEPENDENT REGISTERED PUBLIC ACCOUNTING FIRM
To the Board of Directors and Shareholders of
Excelsior Funds, Inc. and Excelsior Tax-Exempt Funds, Inc.
We have audited the accompanying statements of assets and liabilities, including the portfolios of investments, of the Money Fund, Government Money Fund, Treasury Money Fund, Tax-Exempt Money Fund, and New York Tax-Exempt Money Fund (three of the portfolios constituting the Excelsior Funds, Inc. and two of the portfolios constituting the Excelsior Tax-Exempt Funds, Inc.) (collectively, the “Funds”) as of March 31, 2005, and the related statements of operations for the year then ended, the statements of changes in net assets and the financial highlights (Shares) for each of the two years in the period then ended. These financial statements and financial highlights are the responsibility of the Funds’ management. Our responsibility is to express an opinion on these financial statements and financial highlights based on our audits. The financial highlights for each of the years in the three year period ended March 31, 2003 were audited by other auditors whose reports dated May 16, 2003, expressed an unqualified opinion on those financial highlights.
We conducted our audits in accordance with the standards of the Public Company Accounting Oversight Board (United States). Those standards require that we plan and perform the audit to obtain reasonable assurance about whether the financial statements and financial highlights are free of material misstatement. The Funds are not required to have, nor were we engaged to perform, an audit of their internal control over financial reporting. Our audit included consideration of internal control over financial reporting as a basis for designing audit procedures that are appropriate in the circumstances, but not for the purpose of expressing an opinion on the effectiveness of the Funds’ internal control over financial reporting. Accordingly, we express no such opinion. An audit also includes examining, on a test basis, evidence supporting the amounts and disclosures in the financial statements, assessing the accounting principles used and significant estimates made by management, as well as evaluating the overall financial statement presentation. Our procedures included confirmation of securities owned as of March 31, 2005, by correspondence with the custodian and brokers; where replies were not received from brokers, we performed other auditing procedures. We believe that our audits provide a reasonable basis for our opinion.
In our opinion, the financial statements and financial highlights referred to above present fairly, in all material respects, the financial position of Money Fund, Government Money Fund, Treasury Money Fund, Tax-Exempt Money Fund, and New York Tax-Exempt Money Fund as of March 31, 2005, the results of their operations for the year then ended, and the changes in their net assets and the financial highlights for each of the two years in the period then ended, in conformity with accounting principles generally accepted in the United States of America.
DELOITTE & TOUCHE LLP
New York, New York
May 27, 2005
33
Directors/Trustees and Officers of the Excelsior Funds Complex (Unaudited)
Information pertaining to the Directors/Trustees and Officers of Excelsior Fund, Excelsior Tax-Exempt Fund and Excelsior Funds Trust (each a “Company” and collectively, the “Excelsior Funds Complex”) is set forth below. Directors/Trustees who are not deemed to be “interested persons” of the Excelsior Funds Complex as defined in the 1940 Act are referred to as “Independent Board Members.” Directors/Trustees who are deemed to be “interested persons” of the Excelsior Funds Complex are referred to as “Interested Board Members”. The following information is as of May 20, 2005.
| | | | | | |
Name and Address(1) Age Time Served with the Excelsior Funds Complex
| | Principal Occupation During the Past Five Years
| | Number of Portfolios in Fund Complex Overseen by Director/ Trustee(3)
| | Other Directorships Held by Director/Trustee(4)
|
DIRECTORS/TRUSTEES(2) INDEPENDENT BOARD MEMBERS | | | | |
Frederick S. Wonham
Age: 74
Since 1997 | | Retired. Chairman of the Boards and Director (since 1997) and President and Treasurer (from 1995 to February 2002) of Excelsior Funds, Inc. and Excelsior Tax-Exempt Funds, Inc.; Chairman of the Board and Trustee (since 1997) and President and Treasurer (from 1995 to February 2002) of Excelsior Funds Trust. | | 29 | | None. |
| | | |
Rodman L. Drake
Age: 62
Since 1994 | | Director of Excelsior Funds, Inc. and Excelsior Tax-Exempt Funds, Inc. (since 1996); Trustee of Excelsior Funds Trust (since 1994); Director, Crystal River Capital Inc. (a private REIT) (since March 2005); Director, Parson Brinkerhoff, Inc. (engineering firm) (since 1995); Co-Founder of Baringo Capital LLC (since 2002); President, Continuation Investments Group, Inc. (from 1997 to 2001). | | 29 | | Director and Chairman, Hyperion Total Return Fund, Inc., Hyperion Strategic Mortgage Fund Inc., and Hyperion 2005 Term Trust Inc. (since 1991); Director, Jackson Hewitt Inc. (since June 2004). |
| | | |
Morrill Melton (“Mel”) Hall, Jr.
Age: 60
Since 2000 | | Director of Excelsior Funds, Inc. and Excelsior Tax-Exempt Funds, Inc. (since 2000); Trustee of Excelsior Funds Trust (since 2000); Chairman and Chief Executive Officer, Comprehensive Health Services, Inc. (health care management and administration) (since 1991). | | 29 | | None. |
| | | |
Roger M. Lynch
Age: 64
Since 2001 | | Retired. Director of Excelsior Funds, Inc. and Excelsior Tax- Exempt Funds, Inc. and Trustee of Excelsior Funds Trust (since 2001); Director, SLD Commodities, Inc. (importer of nuts) (since 1991); President, Corporate Asset Funding Co., Inc. (asset securitization) (from 1987 to 1999); Limited Partner (from 1986 to 1999), Goldman Sachs & Co. | | 29 | | None. |
| | | |
Jonathan Piel
Age: 66
Since 1994 | | Retired. Director, Excelsior Funds, Inc. and Excelsior Tax-Exempt Funds, Inc. (since 1996); Trustee, Excelsior Funds Trust (since 1994). | | 29 | | None. |
34
| | | | | | |
Name and Address(1) Age Time Served with the Excelsior Funds Complex
| | Principal Occupation During the Past Five Years
| | Number of Portfolios in Fund Complex Overseen by Director/ Trustee(3)
| | Other Directorships Held by Director/Trustee(4)
|
John. D. Collins
Age: 66
Since 2005 | | Retired. Director, Excelsior Funds, Inc. and Excelsior Tax-Exempt Funds, Inc. (since 2005); Trustee, Excelsior Funds Trust (since 2005). Consultant, KPMG, LLP (from July 1999 to June 2000); Partner, KPMG, LLP (from March 1962 to June 1999). | | 29 | | Director, CCC Information Services Inc. (software to automate process of settling automobile claims) (since September 2004); Director, Mrs. Fields’ Companies, Inc. (consumer products) (since December 2004). |
| | |
| INTERESTED BOARD MEMBER(5) | | | | |
James L. Bailey
114 West 47th Street
New York, NY 10036
Age: 59
Since 2004 | | Chief Operating Officer of U.S. Trust Corporation (since December 2004) and Executive Vice President of U.S. Trust Corporation and United States Trust Company of New York (since 2003); President, Excelsior Funds, Inc., Excelsior Tax-Exempt Funds, Inc. and Excelsior Funds Trust (from 2003 to July 2004); Consultant in the financial services industry (from August 2000 to January 2003); Executive Vice President of Citicorp (from 1992 to August 2000). | | 29 | | None. |
| | | |
| OFFICERS | | | | | | |
Mary Martinez
114 West 47th Street
New York, NY 10036
Age: 45
President
Since July 2004 | | Managing Director of United States Trust Company of New York (since 2003) and Chief Executive Officer of National Private Banking (since October 2004); Managing Director and Director of Relationship Management Service, Marketing, Information and Technology at Bessemer Trust (from 1998 to 2003). | | N/A | | N/A |
| | | |
Joseph Trainor, CFA
114 West 47th Street
New York, NY 10036
Age: 44
Vice President
Since February 2004 | | Managing Director of United States Trust Company of New York and President, U.S. Trust Institutional (since 2003); President of MFS Institutional Advisors (from 1998 to 2002). | | N/A | | N/A |
| | | |
Agnes Mullady
225 High Ridge Road
Stamford, CT 06905
Age: 46
Treasurer/Chief Financial
and Chief Accounting Officer
Since February 2004 | | Senior Vice President, U.S. Trust Company, N.A. (since 2004); Chief Financial Officer, AMIC Distribution Partners (from 2002 to 2004); Controller Reserve Management Corporation, Reserve Management Company, Inc. and Reserve Partners, Inc. (from 2000 to 2002); Vice President and Treasurer, Northstar Funds; Senior Vice President and Chief Financial Officer, Northstar Investment Management Corp.; President and Treasurer, Northstar Administrators Corp.; and Vice President and Treasurer, Northstar Distributors, Inc. (from 1993 to 2000). | | N/A | | N/A |
35
| | | | | | |
Name and Address(1) Age Time Served with the Excelsior Funds Complex
| | Principal Occupation During the Past Five Years
| | Number of Portfolios in Fund Complex Overseen by Director/ Trustee(3)
| | Other Directorships Held by Director/Trustee(4)
|
Scott Rhodes
225 High Ridge Road
Stamford, CT 06905
Age: 46
Vice President and Assistant Treasurer
Since November 2004 | | Vice President, U.S. Trust Company, N.A. (since August 2004); Vice President, BlackRock Financial Management, Inc. (2004); Controller, Mutual Funds, American Skandia Investment Services, Inc. and Assistant Treasurer, American Skandia Trust and American Skandia Advisor Funds, Inc. (from 1996 to 2003). | | N/A | | N/A |
| | | |
Alexandra Poe
114 West 47th Street
New York, NY 10036
Age: 44
Secretary and
Chief Legal Officer
Since May 2004 | | Senior Vice President and Assistant General Counsel, United States Trust Company of New York (since May 2004); Chief Legal Officer for Managed Accounts and Alternative Investment Strategies, Prudential Investments (from 2001 to 2004); Senior Vice President and General Counsel, US Investment Management and Global Hedge Funds and President of the Schroder Mutual Funds, Schroders (from 1996 to 2001). | | N/A | | N/A |
| | | |
Sharon M. Davison
114 West 47th Street
New York, NY 10036
Age: 50
Chief Compliance Officer Since September 2004 | | Senior Vice President of U.S. Trust Company of New York (since 2001); Director of Securities and Corporate Compliance (since 2001); Director of Special Investigations-New York Stock Exchange Division of Market Surveillance (from 2000 to 2001); Senior Counsel-New York Stock Exchange Division of Market Surveillance (from 1997 to 2000). | | N/A | | N/A |
| | | |
Wyndham Clark
225 High Ridge Road
Stamford, CT 06905
Age: 47
Anti-Money Laundering Officer
Since May 2004 | | Vice President and AML Officer, U.S. Trust Company, N.A. (since 2003); Vice President and Deputy Director Risk Management, IBJ Whitehall (banking) (from 2001 to 2002); and Vice President and Chief Risk Officer, EMAC, LLC (commercial lender, asset backed security issuer) (from 1999 to 2001). | | N/A | | N/A |
| | | |
Ralph Pastore
225 High Ridge Road
Stamford, CT 06905
Age: 35
Vice President
Since May 2005 | | Vice President, U.S. Trust Company, N.A. (since 2001); Director, Mutual Fund Operations, American Skandia Investment Services, Inc. (from 1998 to 2001) | | N/A | | N/A |
36
| (1) | Each independent director/trustee may be contacted by writing to Excelsior Funds, 225 High Ridge Road, Stamford, CT 06905. |
| (2) | Each director/trustee shall hold office until the election and qualification of his or her successor, or until he or she sooner dies, resigns or is removed. The officers of each Company shall hold office for a one year term and until their respective successors are chosen and qualified, or in each case until he or she sooner dies, resigns, is removed, or becomes disqualified in accordance with each Company’s by-laws. |
| (3) | The Excelsior Funds Complex consists of all registered investment companies (Excelsior Funds Inc., Excelsior Tax-Exempt Funds, Inc. and Excelsior Funds Trust) for which U.S. Trust serves as investment adviser. As of May 20, 2005, the Excelsior Funds Complex consisted of 29 Funds. |
| (4) | Directorships of companies required to report to the Securities and Exchange Commission under the Securities Exchange Act of 1934 (i.e., “public companies”) or other investment companies registered under the 1940 Act. |
| (5) | “Interested person” of the Company is defined in the 1940 Act. Mr. Bailey is considered an “interested person” because of his affiliation with the Adviser. |
For more information regarding the Directors/Trustees and Officers, please refer to the Statement of Additional Information, which is available upon request by calling 1-800-446-1012.
37
DISCLOSURE OF FUND EXPENSES (Unaudited)
We believe it is important for you to understand the impact of fees regarding your investment. As a shareholder of the fund, you incur ongoing, or operating costs, which include costs for portfolio management, administrative services, and shareholder reports (like this one), among others. Operating expenses, which are deducted from a fund’s gross income, directly reduce the investment return of the fund. A fund’s expenses are expressed as a percentage of its average net assets. This figure is known as the expense ratio. The following examples are intended to help you understand the ongoing costs (in dollars) of investing in your fund and to compare these costs with those of other mutual funds. The examples are based on an investment of $1,000 made at the beginning of the period shown and held for the entire period.
The table on the following page illustrates your fund’s costs in two ways.
| | • | | Actual expenses. This section provides information about actual account values and actual expenses based on the Funds’ actual return for the period. This section is designed to help you to estimate the actual expenses after fee waivers that you paid over the period. The “Ending Account Value” shown is derived from the fund’s actual return, and the fourth column shows the dollar amount that would have been paid by an investor who started with $1,000 in the fund. You may use the information here, together with the amount you invested, to estimate the expenses that you paid over the period. |
To do so, simply divide your account value by $1,000 (for example, an $8,600 account value divided by $1,000=$8.6), then multiply the result by the number given for your fund under the heading “Expenses Paid During Period”.
| | • | | Hypothetical expenses. This section provides information about hypothetical account values and hypothetical expenses that would have been incurred by an investor in the Fund based on an assumed rate of return of 5% per year before expenses. This section is designed to help you compare your fund’s costs with those of other mutual funds. It assumes that the fund had a return of 5% before expenses during the year, but that the expense ratio is unchanged. In this case, because the return used is not the fund’s actual return, the results cannot be used to estimate the actual ending account balance or expenses you paid for the period. You may use this information to compare the ongoing costs of investing in your Fund and other funds. To do so, compare this 5% hypothetical example with the 5% hypothetical examples that appear in shareholder reports of other funds. |
38
DISCLOSURE OF FUND EXPENSES (Unaudited) (Continued)
Please note that the expenses shown in the table are meant to highlight and help you compare ongoing costs only, which are described in the Prospectus. Therefore, the hypothetical example is useful in comparing ongoing costs only, and will not help you determine the relative total costs of owning different funds.
| | | | | | | | | | | | |
| | | Beginning
Account
Value
9/30/2004
| | Ending
Account
Value
3/31/2005
| | Annualized
Expense
Ratios*
| | | Expenses
Paid
During
Period**
|
Actual Fund Return | | | | | | | | | | | | |
Money Fund — Shares | | $ | 1,000.00 | | $ | 1,008.90 | | 0.46 | % | | $ | 2.31 |
Government Money Fund — Shares | | | 1,000.00 | | | 1,008.70 | | 0.46 | | | | 2.31 |
Treasury Money Fund — Shares | | | 1,000.00 | | | 1,007.30 | | 0.55 | | | | 2.76 |
Tax-Exempt Money Fund — Shares | | | 1,000.00 | | | 1,006.40 | | 0.46 | | | | 2.31 |
New York Tax-Exempt Money Fund — Shares | | | 1,000.00 | | | 1,005.80 | | 0.55 | | | | 2.76 |
| | | | |
Hypothetical 5% Return | | | | | | | | | | | | |
Money Fund — Shares | | | 1,000.00 | | | 1,022.68 | | 0.46 | | | | 2.32 |
Government Money Fund — Shares | | | 1,000.00 | | | 1,022.68 | | 0.46 | | | | 2.32 |
Treasury Money Fund — Shares | | | 1,000.00 | | | 1,022.22 | | 0.55 | | | | 2.78 |
Tax-Exempt Money Fund — Shares | | | 1,000.00 | | | 1,022.68 | | 0.46 | | | | 2.32 |
New York Tax-Exempt Money Fund — Shares | | | 1,000.00 | | | 1,022.22 | | 0.55 | | | | 2.78 |
| * | | Annualized expense ratios of certain funds are after fee waivers and expense reimbursements by the investment adviser. Absent such waivers and reimbursements, expenses paid during the period would have been greater. |
| **Expenses | | are equal to the Fund’s annualized expense ratio multiplied by the average account value over the period, multiplied by the number of days in the most recent fiscal half-year (182) then divided by 365. |
39
AR-MM-0305/43798

Retirement Shares
EQUITY INCOME FUND
LARGE CAP GROWTH FUND
MANAGED INCOME FUND
MID CAP VALUE FUND
SMALL CAP FUND
VALUEAND RESTRUCTURING FUND
ANNUAL REPORT
March 31, 2005
TABLE OF CONTENTS
This report must be preceded or accompanied by a current prospectus.
A description of the policies and procedures that Excelsior Funds use to determine how to vote proxies relating to portfolio securities, as well as information relating to how a Fund voted proxies relating to portfolio securities during the most recent 12-month period ended June 30, is available (i) without charge, upon request, by calling (800) 881-9358, and (ii) on the Commission’s website at http://www.sec.gov.
Excelsior Funds file their June 30 and December 31 schedule of portfolio holdings with the Securities and Exchange Commission, on Form N-Q, within sixty days after the applicable reporting period. Excelsior Funds Form N-Q is available on the Commission’s website at http://www.sec.gov, and may be reviewed and copied at the Commission’s Public Reference Room in Washington, DC. Information on the operation of the Public Reference Room may be obtained by calling 1-800-SEC-0330.
You should consider the Fund’s investment objectives, risks and expenses carefully before you invest. Information about these and other important subjects is in the Fund’s prospectus, which you should read carefully before investing.
Excelsior Funds Trust and Excelsior Funds, Inc. are distributed by BISYS Fund Services Limited Partnership.
SHARES OF THE FUNDS ARE NOT DEPOSITS OR OBLIGATIONS OF, OR GUARANTEED OR ENDORSED BY, ANY BANK, AND THE SHARES ARE NOT FEDERALLY INSURED BY THE FEDERAL DEPOSIT INSURANCE CORPORATION, BANK INSURANCE FUND, FEDERAL RESERVE BOARD, OR ANY OTHER GOVERNMENTAL AGENCY. AN INVESTMENT IN A FUND IS SUBJECT TO RISK OF PRINCIPAL.
LETTER TO SHAREHOLDERS
March 31, 2005
Dear Fellow Shareholder:
The fiscal year ended March 31, 2005 was marked by a continuing uptrend in broad based market indices. Financial markets spent much of 2004 waiting to see who would win the U.S. Presidential election. Stocks rose in the post-election period, posting gains from the first week of November to year end. The markets held their ground despite higher than anticipated energy prices. On December 14th, the Standard & Poor’s 500 Index closed above 1200 for the first time since August of 2001, and stocks retained most of their year-end 2004 gains during the first quarter of 2005. Also, the Federal Reserve monetary policy took hold, with its seventh increase in the Federal Funds rate to 2.75% as of the end of the first quarter of 2005.
Going forward, our overall investment theme reflects a preference for goods versus services, real versus financial assets, and “old economy” sectors and industries stocks versus the so-called “new economy”. Creating the cities and the infrastructure that are springing up in giant global emerging economies has raised overall levels of demand for commodities that are in relatively short supply, particularly after a decade or more of capital under investment in tangible producing sectors. We expect to focus on opportunities for above-market returns, and our portfolio managers will aim to capitalize on these prospects as they take shape.
As always, we value your confidence in selecting Excelsior to fulfill your investment needs. We strongly believe that Excelsior’s array of funds will help meet the full range of your financial objectives.
Sincerely,

Mary Martinez
President
1
Excelsior Funds, Inc.
Portfolio of Investments — March 31, 2005
Equity Income Fund
| | | | | |
| | | | | |
Shares
| | | | Value
|
| COMMON STOCKS — 87.20% | | | |
| | | CONSUMER DISCRETIONARY — 12.86% |
| 208,300 | | Circuit City Stores, Inc. | | $ | 3,343,215 |
| 165,200 | | Leggett & Platt, Inc. | | | 4,770,976 |
| 198,000 | | Newell Rubbermaid, Inc. | | | 4,344,120 |
| 131,000 | | Officemax, Inc. | | | 4,388,500 |
| 135,000 | | Snap-On, Inc. | | | 4,291,650 |
| 229,400 | | Time Warner, Inc.(a) | | | 4,025,970 |
| | | | |
|
|
| | | | | | 25,164,431 |
| | | | |
|
|
| | | CONSUMER STAPLES — 9.23% |
| 220,100 | | Albertson’s, Inc. | | | 4,545,065 |
| 68,700 | | Altria Group, Inc. | | | 4,492,293 |
| 218,000 | | American Italian Pasta Co. | | | 5,973,200 |
| 137,400 | | Sara Lee Corp. | | | 3,044,784 |
| | | | |
|
|
| | | | | | 18,055,342 |
| | | | |
|
|
| | | ENERGY — 5.50% |
| 85,300 | | BP plc ADR | | | 5,322,720 |
| 93,300 | | ChevronTexaco Corp. | | | 5,440,323 |
| | | | |
|
|
| | | | | | 10,763,043 |
| | | | |
|
|
| | | FINANCIAL — 14.26% |
| 86,616 | | Bank of America Corp. | | | 3,819,766 |
| 88,250 | | Citigroup, Inc. | | | 3,965,955 |
| 65,000 | | Comerica, Inc. | | | 3,580,200 |
| 82,100 | | Montpelier RE Holdings, Ltd. | | | 2,885,815 |
| 64,960 | | Morgan Stanley | | | 3,718,960 |
| 144,000 | | U.S. BanCorp. | | | 4,150,080 |
| 343,000 | | Van der Moolen Holding NV ADR(a) | | | 2,449,020 |
| 147,500 | | W. P. Stewart & Co., Ltd. | | | 3,342,350 |
| | | | |
|
|
| | | | | | 27,912,146 |
| | | | |
|
|
| | | HEALTH CARE — 6.66% |
| 54,800 | | Eli Lilly & Co. | | | 2,855,080 |
| 84,300 | | Medtronic, Inc. | | | 4,295,085 |
| 81,400 | | Merck & Co., Inc. | | | 2,634,918 |
| 45,000 | | Pharmaceutical Holders Trust Index Fund(b) | | | 3,237,300 |
| | | | |
|
|
| | | | | | 13,022,383 |
| | | | |
|
|
| | | INDUSTRIALS — 10.77% |
| 89,845 | | Deluxe Corp. | | | 3,581,222 |
| 135,200 | | General Electric Co. | | | 4,875,311 |
| 113,900 | | Honeywell International, Inc. | | | 4,238,219 |
| 70,475 | | Hubbell, Inc., Class B | | | 3,601,273 |
| | | | | |
| | | | | |
Shares
| | | | Value
|
| COMMON STOCKS — (continued) | | |
| | | INDUSTRIALS — (continued) |
| 151,100 | | RR Donnelley & Sons Co. | | $ | 4,777,782 |
| | | | |
|
|
| | | | | | 21,073,807 |
| | | | |
|
|
| | | INFORMATION TECHNOLOGY — 8.48% |
| 305,000 | | AVX Corp. | | | 3,736,250 |
| 216,500 | | Electronic Data Systems Corp. | | | 4,475,055 |
| 174,000 | | Microsoft Corp. | | | 4,205,580 |
| 270,000 | | Nokia Oyj ADR | | | 4,166,100 |
| | | | |
|
|
| | | | | | 16,582,985 |
| | | | |
|
|
| | | RAW/INTERMEDIATE MATERIALS — 9.22% |
| 82,500 | | Eastman Chemical Co. | | | 4,867,500 |
| 145,000 | | Packaging Corp. of America | | | 3,522,050 |
| 10,000 | | Pope Resources, Ltd. | | | 365,900 |
| 48,000 | | Rayonier, Inc. | | | 2,377,440 |
| 195,500 | | RPM, Inc. | | | 3,573,740 |
| 115,500 | | Sonoco Products Co. | | | 3,332,175 |
| | | | |
|
|
| | | | | | 18,038,805 |
| | | | |
|
|
| | | REAL ESTATE — 0.72% |
| 38,000 | | Apartment Investment & Management Co., Class A | | | 1,413,600 |
| | | | |
|
|
| | | TELECOMMUNICATION — 4.34% |
| 220,300 | | AT&T Corp. | | | 4,130,625 |
| 123,000 | | Verizon Communications, Inc. | | | 4,366,500 |
| | | | |
|
|
| | | | | | 8,497,125 |
| | | | |
|
|
| | | UTILITIES — 5.16% |
| 274,000 | | Centerpoint Energy, Inc. | | | 3,296,220 |
| 178,200 | | Cleco Corp. | | | 3,795,660 |
| 112,750 | | Vectren Corp. | | | 3,003,660 |
| | | | |
|
|
| | | | | | 10,095,540 |
| | | | |
|
|
| | | TOTAL COMMON STOCKS (Cost $156,658,412) | | | 170,619,207 |
| | | | |
|
|
| FOREIGN COMMON STOCKS — 2.63% | | |
| | | NETHERLANDS — 0.37% |
| 100,000 | | Van der Moolen Holding NV(a) | | | 716,925 |
| | | | |
|
|
| | | UNITED KINGDOM — 2.26% |
| 363,400 | | Pearson plc | | | 4,428,358 |
| | | | |
|
|
| | | TOTAL FOREIGN COMMON STOCKS
(Cost $4,876,699) | | | 5,145,283 |
| | | | |
|
|
See Notes to Financial Statements.
2
Excelsior Funds, Inc.
Portfolio of Investments — March 31, 2005
Equity Income Fund — (continued)
| | | | | |
| | | | | |
Shares
| | | | Value
|
| PREFERRED STOCK — 1.17% | | |
| | | ENERGY — 1.17% |
| 45,400 | | EL Paso Tennessee Pipeline Co., Preferred Exchange, 8.25% | | $ | 2,294,121 |
| | | | |
|
|
| | | TOTAL PREFERRED STOCK
(Cost $2,107,870) | | | 2,294,121 |
| | | | |
|
|
| CONVERTIBLE PREFERRED STOCKS — 4.31% |
| | | CONSUMER DISCRETIONARY — 2.48% |
| 56,000 | | Ford Motor Co. Capital Trust II, Preferred Exchange, 6.50% | | | 2,539,040 |
| 124,000 | | General Motors, Series B, Preferred Exchange, 5.25% | | | 2,316,320 |
| | | | |
|
|
| | | | | | 4,855,360 |
| | | | |
|
|
| | | ENERGY — 1.83% |
| 99,000 | | EL Paso Energy Capital Trust I, Preferred Exchange, 4.75% | | | 3,583,800 |
| | | | |
|
|
| | | TOTAL CONVERTIBLE PREFERRED STOCKS
(Cost $8,371,207) | | | 8,439,160 |
| | | | |
|
|
| | |
Contracts
| | | | |
| PUT OPTION PURCHASED — 0.01% |
| 350 | | Centerpoint Energy, Inc. Expires 4/16/05 strike price 12.5 | | | 19,250 |
| | | | |
|
|
| | | TOTAL PUT OPTION PURCHASED
(Cost $36,050) | | | 19,250 |
| | | | |
|
|
| | |
Principal
Amount
| | | | |
| REPURCHASE AGREEMENT — 4.96% |
| $9,709,000 | | JP Morgan Chase Securities, Inc., 2.30%, dated 03/31/05, to be repurchased on 04/01/05, repurchase price $9,709,620 (collateralized by Federal National Mortgage Association MTN, par value $9,697,000, 4.63%, maturing on 10/15/14; total market value $9,915,826) | | | 9,709,000 |
| | | | |
|
|
| | | TOTAL REPURCHASE AGREEMENT
(Cost $9,709,000) | | | 9,709,000 |
| | | | |
|
|
| | | | | | | |
| | | | | | | |
| | | | | | Value
| |
TOTAL INVESTMENTS
(Cost $181,759,238)(c) | | 100.28 | % | | $ | 196,226,021 | |
LIABILITIES IN EXCESS OF
OTHER ASSETS | | (0.28 | ) | | | (556,473 | ) |
| | |
|
| |
|
|
|
NET ASSETS | | 100.00 | % | | $ | 195,669,548 | |
| | |
|
| |
|
|
|
| (a) | Non-income producing security |
| (b) | Registered Investment Company |
| (c) | Unrealized appreciation (depreciation) of securities: |
| | | | |
Unrealized
Appreciation
| | Unrealized
(Depreciation)
| | Net Unrealized
Appreciation/
(Depreciation)
|
| $18,733,669 | | $(4,266,886) | | $14,466,783 |
ADR—American Depository Receipt
Ltd.—Limited
MTN—Medium Term Note
plc—Public limited company
See Notes to Financial Statements.
3
Excelsior Funds, Inc.
Portfolio of Investments — March 31, 2005
Equity Income Fund — (continued)
The summary of the Fund’s investments as of March 31, 2005 is as follows: (Unaudited)
| | | | | | | |
Sector Diversification
| | % of
Net
Assets
| | | Market Value
| |
Consumer Discretionary | | 15.34 | % | | $ | 30,019,791 | |
Financial | | 14.63 | | | | 28,629,071 | |
Industrials | | 10.77 | | | | 21,073,807 | |
Information Technology | | 10.74 | | | | 21,011,343 | |
Consumer Staples | | 9.23 | | | | 18,055,342 | |
Raw/Intermediate Materials | | 9.22 | | | | 18,038,805 | |
Energy | | 8.51 | | | | 16,640,964 | |
Health Care | | 6.66 | | | | 13,022,383 | |
Utilities | | 5.16 | | | | 10,114,790 | |
Repurchase Agreements | | 4.96 | | | | 9,709,000 | |
Telecommunication | | 4.34 | | | | 8,497,125 | |
Real Estate | | 0.72 | | | | 1,413,600 | |
| | |
|
| |
|
|
|
Total Investment | | 100.28 | % | | $ | 196,226,021 | |
Other Assets and Liabilities (Net) | | (0.28 | ) | | | (556,473 | ) |
| | |
|
| |
|
|
|
Net Assets | | 100.00 | % | | $ | 195,669,548 | |
| | |
|
| |
|
|
|
See Notes to Financial Statements.
4
Excelsior Funds, Inc.
Portfolio of Investments — March 31, 2005
Large Cap Growth Fund
| | | | | |
| | | | | |
Shares
| | | | Value
|
| COMMON STOCKS — 96.14% | | | |
| | | CONSUMER DISCRETIONARY — 21.53% |
| 161,500 | | Carnival Corp., Class A | | $ | 8,367,315 |
| 110,600 | | eBay(a) | | | 4,120,956 |
| 60,900 | | Kohls Corp.(a) | | | 3,144,267 |
| 96,300 | | Lowes Companies, Inc. | | | 5,497,767 |
| 492,900 | | News Corp., Class A | | | 8,339,868 |
| 162,500 | | Petsmart, Inc. | | | 4,671,875 |
| 87,600 | | Starbucks Corp.(a) | | | 4,525,416 |
| 237,100 | | Univision Communications, Inc.(a) | | | 6,565,299 |
| | | | |
|
|
| | | | | | 45,232,763 |
| | | | |
|
|
| | | FINANCIAL — 7.90% |
| 32,300 | | Chicago Mercantile Exchange | | | 6,267,169 |
| 42,700 | | Lehman Brothers Holding, Inc. | | | 4,020,632 |
| 126,526 | | SLM Corp. | | | 6,306,056 |
| | | | |
|
|
| | | | | | 16,593,857 |
| | | | |
|
|
| | | HEALTH CARE — 29.16% |
| 97,900 | | Alcon, Inc. | | | 8,741,491 |
| 78,400 | | Amgen, Inc.(a) | | | 4,563,664 |
| 124,400 | | Boston Scientific Corp.(a) | | | 3,643,676 |
| 204,700 | | Caremark Rx, Inc.(a) | | | 8,142,966 |
| 73,600 | | Eli Lilly & Co. | | | 3,834,560 |
| 257,100 | | Gilead Sciences, Inc.(a) | | | 9,204,180 |
| 75,700 | | Medtronic, Inc. | | | 3,856,915 |
| 88,900 | | Patterson Cos., Inc.(a) | | | 4,440,555 |
| 222,800 | | Teva Pharmaceutical | | | 6,906,800 |
| 101,700 | | Zimmer Holdings, Inc.(a) | | | 7,913,277 |
| | | | |
|
|
| | | | | | 61,248,084 |
| | | | |
|
|
| | | INDUSTRIALS — 5.50% |
| 57,900 | | Apollo Group, Inc., Class A(a) | | | 4,288,074 |
| 104,900 | | Career Education Corp.(a) | | | 3,593,874 |
| 68,600 | | Expeditors International of Washington, Inc. | | | 3,673,530 |
| | | | |
|
|
| | | | | | 11,555,478 |
| | | | |
|
|
| | | INFORMATION TECHNOLOGY — 28.01% |
| 183,700 | | Apple Computer, Inc.(a) | | | 7,654,779 |
| 169,800 | | Broadcom Corp., Class A(a) | | | 5,080,416 |
| 163,200 | | Dell, Inc.(a) | | | 6,270,144 |
| 118,300 | | Electronic Arts, Inc.(a) | | | 6,125,574 |
| 71,400 | | Infosys Technologies, Ltd. ADR | | | 5,264,322 |
| 231,984 | | Qualcomm, Inc. | | | 8,502,213 |
| 92,918 | | Research In Motion, Ltd.(a) | | | 7,100,794 |
| | | | | |
| | | | | |
Shares
| | | | Value
|
| COMMON STOCKS — (continued) | | |
| | | INFORMATION TECHNOLOGY — (continued) |
| 201,800 | | SAP AG ADR | | $ | 8,088,144 |
| 126,000 | | Symantec Corp.(a) | | | 2,687,580 |
| 89,300 | | Veritas Software Corp.(a) | | | 2,073,546 |
| | | | |
|
|
| | | | | | 58,847,512 |
| | | | |
|
|
| | | TELECOMMUNICATION — 4.04% |
| 164,300 | | America Movil S.A. de C.V., Series L ADR | | | 8,477,880 |
| | | | |
|
|
| | | Total COMMON STOCKS
(Cost $175,170,826) | | | 201,955,574 |
| | | | |
|
|
| | |
Principal
Amount
| | | | |
| REPURCHASE AGREEMENT — 8.25% | | |
| $17,324,000 | | JP Morgan Chase Securities, Inc., 2.30%, dated 03/31/05, to be repurchased on 04/01/05, repurchase price $17,325,107 (collateralized by Federal National Mortgage Association MTN, par value $17,302,000, 4.63%, maturing on 10/15/14; total market value $17,692,963) | | | 17,324,000 |
| | | | |
|
|
| | | TOTAL REPURCHASE AGREEMENT
(Cost $17,324,000) | | | 17,324,000 |
| | | | |
|
|
| | | | | | | |
| | | | | | | |
TOTAL INVESTMENTS
(Cost $192,494,826)(b) | | 104.39 | % | | $ | 219,279,574 | |
LIABILITIES IN EXCESS OF
OTHER ASSETS | | (4.39 | ) | | | (9,218,684 | ) |
| | |
|
| |
|
|
|
NET ASSETS | | 100.00 | % | | $ | 210,060,890 | |
| | |
|
| |
|
|
|
| (a) | Non-income producing security |
| (b) | Unrealized appreciation (depreciation) of securities: |
| | | | |
Unrealized
Appreciation
| | Unrealized
(Depreciation)
| | Net Unrealized
Appreciation/
(Depreciation)
|
| $34,414,355 | | $(7,629,607) | | $26,784,748 |
ADR—American Depository Receipt
Ltd.—Limited
MTN—Medium Term Note
See Notes to Financial Statements.
5
Excelsior Funds, Inc.
Portfolio of Investments — March 31, 2005
Large Cap Growth Fund — (continued)
The summary of the Fund’s investments as of March 31, 2005 is as follows: (Unaudited)
| | | | | | | |
Sector Diversification
| | % of
Net
Assets
| | | Market Value
| |
Health Care | | 29.16 | % | | $ | 61,248,084 | |
Information Technology | | 28.01 | | | | 58,847,512 | |
Consumer Discretionary | | 21.53 | | | | 45,232,763 | |
Repurchase Agreements | | 8.25 | | | | 17,324,000 | |
Financial | | 7.90 | | | | 16,593,857 | |
Industrials | | 5.50 | | | | 11,555,478 | |
Telecommunication | | 4.04 | | | | 8,477,880 | |
| | |
|
| |
|
|
|
Total Investment | | 104.39 | % | | $ | 219,279,574 | |
Other Assets and Liabilities (Net) | | (4.39 | ) | | | (9,218,684 | ) |
| | |
|
| |
|
|
|
Net Assets | | 100.00 | % | | $ | 210,060,890 | |
| | |
|
| |
|
|
|
See Notes to Financial Statements.
6
Excelsior Funds, Inc.
Portfolio of Investments — March 31, 2005
Managed Income Fund
| | | | | | | | | | | |
| | | | | | | | | | | | |
Principal
| | | | Rate
| | | Maturity
Date
| | Value
|
| | ASSET BACKED SECURITIES — 2.04% |
| $ | 2,156,712 | | CIT RV Trust,
1999-A A4 | | 6.16 | % | | 06/15/13 | | $ | 2,177,136 |
| | 2,161,000 | | Residential Asset Mortgage Products, Inc.,
2003-FZ4 A2(a) | | 2.81 | | | 07/25/27 | | | 2,144,814 |
| | | | | | | | | | |
|
|
| | | | TOTAL ASSET BACKED SECURITIES
(Cost $4,273,185) | | | 4,321,950 |
| | | | | | | | | | |
|
|
| | COLLATERALIZED MORTGAGE OBLIGATIONS — 13.76% |
| | 2,701,071 | | Citigroup Mortgage Loan Trust,
2004-HYB4 WA(a) | | 4.49 | | | 12/25/34 | | | 2,687,565 |
| | 3,062,141 | | Countrywide Alternative Loan Trust,
2004-16CB 1A2 | | 5.50 | | | 07/25/34 | | | 3,077,796 |
| | 2,034,936 | | Countrywide Alternative Loan Trust,
2004-22CB 1A1 | | 6.00 | | | 10/25/34 | | | 2,076,568 |
| | 3,265,044 | | Wells Fargo Mortgage Backed Securities Trust, 2004-EE 3A1 | | 3.99 | | | 01/25/35 | | | 3,204,434 |
| | | | | | | | | | |
|
|
| | | | | 11,046,363 |
| | | | | | | | | | |
|
|
| | | | FEDERAL HOME LOAN MORTGAGE
CORPORATION — 7.07% |
| | 9,568,125 | | 1602 PH | | 6.00 | | | 04/15/23 | | | 9,738,026 |
| | 5,033,552 | | 2333 UZ | | 6.50 | | | 07/15/31 | | | 5,248,183 |
| | | | | | | | | | |
|
|
| | | | | | | | | | | | 14,986,209 |
| | | | | | | | | | |
|
|
| | | | GOVERNMENT NATIONAL MORTGAGE ASSOCIATION — 1.48% |
| | 3,000,000 | | 2005-25 B | | 6.21 | | | 03/16/21 | | | 3,127,349 |
| | | | | | | | | | |
|
|
| | | | TOTAL COLLATERALIZED MORTGAGE OBLIGATIONS
(Cost $29,294,034) | | | 29,159,921 |
| | | | | | | | | | |
|
|
| | COMMERCIAL MORTGAGE-BACKED SECURITIES — 16.33% |
| | 1,477,000 | | Bank of America Commercial Mortgage, Inc.,
2004-1 A4 | | 4.76 | | | 11/10/39 | | | 1,445,378 |
| | 3,705,581 | | Chase Commercial Mortgage Securities Corp., 1997-2 D
| | 6.60 | | | 12/19/29 | | | 3,899,755 |
| | 1,689,000 | | Greenwich Capital Commercial Funding Corp.,
2004-GG1 A1 | | 5.32 | | | 06/10/36 | | | 1,718,354 |
| | 2,000,000 | | Morgan Stanley Capital I, 1997-C1F(b) | | 6.85 | | | 02/15/20 | | | 2,100,107 |
| | 3,601,000 | | Morgan Stanley Capital I, 1999-WF1 B | | 6.32 | | | 11/15/31 | | | 3,798,947 |
| | 3,150,000 | | Morgan Stanley Dean Witter Capital I,
2000-LIF2 C | | 7.50 | | | 10/15/33 | | | 3,524,429 |
| | 4,000,000 | | Mortgage Capital Funding, Inc.,
1996-MC1 G | | 7.15 | | | 06/15/06 | | | 4,125,009 |
| | | | | | | | | | | |
| | | | | | | | | | | | |
Principal
| | | | Rate
| | | Maturity
Date
| | Value
|
| | COMMERCIAL MORTGAGE-BACKED SECURITIES — (continued) |
| $ | 1,009,000 | | Mortgage Capital Funding, Inc.,
1996-MC2 D | | 7.26 | % | | 10/20/06 | | $ | 1,052,172 |
| | 836,000 | | Mortgage Capital Funding, Inc.,
1997-MC2 C(a) | | 6.88 | | | 11/20/27 | | | 881,797 |
| | 3,061,000 | | Mortgage Capital Funding, Inc.,
1998-MC1 C | | 6.95 | | | 03/18/30 | | | 3,252,450 |
| | 2,521,000 | | Nomura Asset Securities Corp.,
1998-D6 A4(a) | | 7.61 | | | 03/15/30 | | | 2,892,223 |
| | 3,601,000 | | Wachovia Bank Commercial Mortgage Trust,
2003-C9 A3 | | 4.61 | | | 12/15/35 | | | 3,560,007 |
| | 2,305,000 | | Wachovia Bank Commercial Mortgage Trust,
2004-C12 A3 | | 5.23 | | | 07/15/41 | | | 2,353,477 |
| | | | | | | | | | |
|
|
| | | | TOTAL COMMERCIAL MORTGAGE-BACKED SECURITIES
(Cost $33,891,204) | | | 34,604,105 |
| | | | | | | | | | |
|
|
| | CORPORATE BONDS — 14.11% |
| | 505,000 | | AK Steel Corp. | | 7.75 | | | 06/15/12 | | | 486,063 |
| | 1,117,000 | | America Movil S.A. | | 4.13 | | | 03/01/09 | | | 1,074,240 |
| | 3,421,000 | | Bank One Texas N.A. | | 6.25 | | | 02/15/08 | | | 3,587,344 |
| | 700,000 | | British Telecommunications plc | | 8.88 | | | 12/15/30 | | | 932,742 |
| | 1,081,000 | | CIT Group, Inc. | | 5.88 | | | 10/15/08 | | | 1,122,056 |
| | 961,000 | | CMS Energy Corp. | | 9.88 | | | 10/15/07 | | | 1,042,685 |
| | 1,441,000 | | Comcast Cable Communications | | 6.88 | | | 06/15/09 | | | 1,546,122 |
| | 1,441,000 | | DaimlerChrysler N.A. Holding Corp. | | 7.20 | | | 09/01/09 | | | 1,550,876 |
| | 1,081,000 | | Deutsche Telekom International Finance | | 8.75 | | | 06/15/30 | | | 1,413,408 |
| | 181,000 | | Hercules, Inc. | | 11.13 | | | 11/15/07 | | | 207,245 |
| | 2,773,000 | | Household Finance Corp. | | 8.00 | | | 07/15/10 | | | 3,172,220 |
| | 649,000 | | IMC Global, Inc.,
Series B | | 10.88 | | | 06/01/08 | | | 743,105 |
| | 1,437,000 | | International Lease Finance Corp. | | 4.50 | | | 05/01/08 | | | 1,427,721 |
| | 2,881,000 | | Merrill Lynch & Co. MTN | | 5.00 | | | 02/03/14 | | | 2,822,461 |
| | 1,441,000 | | Prudential Financial, Inc. | | 5.10 | | | 09/20/14 | | | 1,426,740 |
| | 627,000 | | PSEG Energy Holdings, Inc. | | 8.63 | | | 02/15/08 | | | 661,485 |
| | 800,000 | | Qwest Services Corp.(b) | | 14.00 | | | 12/15/10 | | | 926,000 |
| | 1,596,000 | | Sprint Capital Corp. | | 8.38 | | | 03/15/12 | | | 1,865,242 |
| | 1,153,000 | | Time Warner Cos., Inc. | | 7.25 | | | 10/15/17 | | | 1,307,450 |
See Notes to Financial Statements.
7
Excelsior Funds, Inc.
Portfolio of Investments — March 31, 2005
Managed Income Fund — (continued)
| | | | | | | | | | | |
| | | | | | | | | | | | |
Principal
| | | | Rate
| | | Maturity
Date
| | Value
|
| | CORPORATE BONDS — (continued) |
| $ | 1,441,000 | | Wal-Mart Stores | | 4.13 | % | | 02/15/11 | | $ | 1,395,861 |
| | 1,081,000 | | Weyerhaeuser Co. | | 6.88 | | | 12/15/33 | | | 1,200,497 |
| | | | | | | | | | |
|
|
| | | | TOTAL CORPORATE BONDS
(Cost $28,568,554) | | | 29,911,563 |
| | | | | | | | | | |
|
|
| | TAX-EXEMPT SECURITIES — 4.22% |
| | 3,169,000 | | New York State Dormitory Authority, Personal Income Tax Revenue Bonds, Series B,
(AMBAC) | | 5.50 | | | 03/15/28 | | | 3,624,544 |
| | 1,441,000 | | New York State Dormitory Authority, Personal Income Tax Revenue Bonds, Series B,
(AMBAC) | | 5.50 | | | 03/15/30 | | | 1,648,144 |
| | 3,601,000 | | University of Texas Revenue Bonds, Series B | | 5.00 | | | 08/15/33 | | | 3,677,521 |
| | | | | | | | | | |
|
|
| | | | TOTAL TAX-EXEMPT SECURITIES
(Cost $9,257,739) | | | 8,950,209 |
| | | | | | | | | | |
|
|
| | FOREIGN GOVERNMENT OBLIGATION — 1.06% |
| | 2,161,000 | | United Mexican States | | 6.38 | | | 01/16/13 | | | 2,242,038 |
| | | | | | | | | | |
|
|
| | | | TOTAL FOREIGN GOVERNMENT OBLIGATION
(Cost $2,198,956) | | | 2,242,038 |
| | | | | | | | | | |
|
|
| | U.S. GOVERNMENT AGENCY BONDS & NOTES — 10.64% |
| | | | FANNIE MAE — 10.64% | | | |
| | 2,000,000 | | | | 6.25 | | | 02/01/11 | | | 2,137,068 |
| | 18,000,000 | | Discount Note(c) | | 2.73 | | | 05/04/05 | | | 17,954,955 |
| | 5,329,000 | | Discount Note | | 6.25 | | | 10/09/19 | | | 2,455,710 |
| | | | | | | | | | |
|
|
| | | | | | | | | | | | 22,547,733 |
| | | | | | | | | | |
|
|
| | | | TOTAL U.S. GOVERNMENT AGENCY BONDS & NOTES
(Cost $22,250,923) | | | 22,547,733 |
| | | | | | | | | | |
|
|
| U.S. GOVERNMENT AGENCY MORTGAGE PASS THROUGH
SECURITIES — 26.19% |
| | | | FEDERAL HOME LOAN MORTGAGE
CORPORATION — 3.18% |
| | 3,355,322 | | Pool # A20105 | | 5.00 | | | 04/01/34 | | | 3,285,094 |
| | 3,397,249 | | Pool # C01811 | | 5.00 | | | 04/01/34 | | | 3,326,143 |
| | 136,304 | | Pool # C71221 | | 5.00 | | | 09/01/32 | | | 133,860 |
| | | | | | | | | | |
|
|
| | | | | | | | | | | | 6,745,097 |
| | | | | | | | | | |
|
|
| | | | FEDERAL NATIONAL MORTGAGE
ASSOCIATION — 18.92% |
| | 23,988,889 | | Pool # 11996,
May TBA | | 5.00 | | | 05/01/35 | | | 23,381,682 |
| | 1,282,401 | | Pool # 387203 | | 4.80 | | | 01/01/12 | | | 1,286,394 |
| | 1,095,029 | | Pool # 387204 | | 4.80 | | | 01/01/12 | | | 1,098,439 |
| | 5,182,934 | | Pool # 618322 | | 6.00 | | | 12/01/31 | | | 5,304,508 |
| | | | | | | | | | | |
| | | | | | | | | | | | |
Principal/
Shares
| | | | Rate
| | | Maturity
Date
| | Value
|
| U.S. GOVERNMENT AGENCY MORTGAGE PASS THROUGH
SECURITIES — (continued) |
| | | | FEDERAL NATIONAL MORTGAGE
ASSOCIATION ��� (continued) |
| $ | 2,724,099 | | Pool # 728826 ARM(a) | | 4.10 | % | | 07/01/33 | | $ | 2,705,560 |
| | 6,299,361 | | Pool # 805386 ARM(a) | | 4.94 | | | 01/01/35 | | | 6,307,357 |
| | | | | | | | | | |
|
|
| | | | | | | | | | | | 40,083,940 |
| | | | | | | | | | |
|
|
| | | | GOVERNMENT NATIONAL MORTGAGE
ASSOCIATION — 4.09% |
| | 548,861 | | Pool # 2562 | | 6.00 | | | 03/20/28 | | | 564,684 |
| | 771,468 | | Pool # 267812 | | 8.50 | | | 06/15/17 | | | 841,436 |
| | 2,571,829 | | Pool # 3413 | | 4.50 | | | 07/20/33 | | | 2,457,698 |
| | 2,414,218 | | Pool # 3442 | | 5.00 | | | 09/20/33 | | | 2,381,738 |
| | 36,755 | | Pool # 532751 | | 9.00 | | | 08/15/30 | | | 40,672 |
| | 136,374 | | Pool # 568670 | | 6.50 | | | 04/15/32 | | | 142,611 |
| | 398,889 | | Pool # 780548 | | 8.50 | | | 12/15/17 | | | 433,731 |
| | 391,833 | | Pool # 780865 | | 9.50 | | | 11/15/17 | | | 432,724 |
| | 717,221 | | Pool # 781084 | | 9.00 | | | 12/15/17 | | | 781,102 |
| | 578,818 | | Pool # 80311
ARM(a) | | 3.50 | | | 08/20/29 | | | 586,391 |
| | | | | | | | | | |
|
|
| | | | | | | | | | | | 8,662,787 |
| | | | | | | | | | |
|
|
| | | | TOTAL U.S. GOVERNMENT AGENCY MORTGAGE PASS THROUGH SECURITIES
(Cost $55,007,487) | | | 55,491,824 |
| | | | | | | | | | |
|
|
| | U.S. GOVERNMENT SECURITIES — 11.17% |
| | | | U.S. TREASURY PRINCIPAL ONLY STRIPS — 4.44% |
| | 4,836,000 | | | | 0.00 | | | 05/15/17 | | | 2,714,785 |
| | 4,545,000 | | | | 0.00 | | | 05/15/17 | | | 2,539,382 |
| | 8,642,000 | | | | 0.00 | | | 02/15/20 | | | 4,164,182 |
| | | | | | | | | | |
|
|
| | | | | | | | | | | | 9,418,349 |
| | | | | | | | | | |
|
|
| | | | U.S. TREASURY INFLATION PROTECTED
BONDS — 2.70% |
| | 1,675,595 | | | | 3.88 | | | 01/15/09 | | | 1,847,846 |
| | 3,000,000 | | | | 4.25 | | | 01/15/10 | | | 3,870,789 |
| | | | | | | | | | |
|
|
| | | | | | | | | | | | 5,718,635 |
| | | | | | | | | | |
|
|
| | | | U.S. TREASURY NOTES — 4.03% |
| | 7,000,000 | | (c) | | 3.63 | | | 01/15/10 | | | 6,833,750 |
| | 1,285,000 | | | | 7.63 | | | 11/15/22 | | | 1,701,970 |
| | | | | | | | | | |
|
|
| | | | | | | | | | | | 8,535,720 |
| | | | | | | | | | |
|
|
| | | | TOTAL U.S. GOVERNMENT SECURITIES
(Cost $23,517,454) | | | 23,672,704 |
| | | | | | | | | | |
|
|
| | REGISTERED INVESTMENT COMPANIES — 0.72% |
| | 764,706 | | Dreyfus Government Cash Management Fund | | | 764,706 |
| | 764,706 | | Fidelity U.S. Treasury II Fund | | | 764,705 |
| | | | | | | | | | |
|
|
| | | | TOTAL REGISTERED INVESTMENT COMPANIES
(Cost $1,529,411) | | | 1,529,411 |
| | | | | | | | | | |
|
|
See Notes to Financial Statements.
8
Excelsior Funds, Inc.
Portfolio of Investments — March 31, 2005
Managed Income Fund — (continued)
| | | | | | | |
| | | | | | Value
| |
TOTAL INVESTMENTS
(Cost $209,787,935)(d) | | 100.24 | % | | $ | 212,431,458 | |
| | | | | | | | |
LIABILITIES IN EXCESS OF OTHER ASSETS | | 0.24 | | | | (498,472 | ) |
| | |
|
| |
|
|
|
NET ASSETS | | 100.00 | % | | $ | 211,932,986 | |
| | |
|
| |
|
|
|
| (a) | Variable Rate Security—The rate disclosed is as of March 31, 2005. |
| (b) | Security exempt from registration under Rule 144A of the Securities Act of 1933. This security may be resold in transactions exempt from registration, normally to qualified institutional buyers. At March 31, 2005, these securities amounted to $3,026,107 or 1.43% of net assets. |
| (c) | All or part of the security is segregated by the fund’s custodian to cover future purchase commitments. |
| (d) | Unrealized appreciation (depreciation) of securities: |
| | | | |
Unrealized
Appreciation
| | Unrealized
(Depreciation)
| | Net Unrealized
Appreciation/
(Depreciation)
|
| $3,669,100 | | $(1,025,577) | | $2,643,523 |
AMBAC—American Municipal Bond Assurance Corp.
ARM—Adjustable Rate Mortgage
Discount Note—The rate reported is the discount rate at the time of purchase.
MTN—Medium Term Note
plc—public limited company
STRIPS—Separately Traded Registered Interest and Principal Securities
TBA—To Be Announced
The summary of the Fund’s investments as of March 31, 2005 is as follows: (Unaudited)
| | | | | | | |
Portfolio Diversification
| | % of
Net
Assets
| | | Value
| |
U.S. Government & Agency Securities | | 48.00 | % | | $ | 101,712,261 | |
Commercial Mortgage-Backed Securities | | 16.33 | | | | 34,604,105 | |
Corporate Bonds | | 14.11 | | | | 29,911,563 | |
Collateralized Mortgage Obligations | | 13.76 | | | | 29,159,921 | |
Tax-Exempt Securities | | 4.22 | | | | 8,950,209 | |
Asset Backed Securities | | 2.04 | | | | 4,321,950 | |
Foreign Government Obligation | | 1.06 | | | | 2,242,038 | |
Registered Investment Company | | 0.72 | | | | 1,529,411 | |
| | |
|
| |
|
|
|
Total Investments | | 100.24 | % | | $ | 212,431,458 | |
Other Assets and Liabilities (Net) | | (0.24 | ) | | | (498,472 | ) |
| | |
|
| |
|
|
|
Net Assets | | 100.00 | % | | $ | 211,932,986 | |
| | |
|
| |
|
|
|
See Notes to Financial Statements.
9
Excelsior Funds Trust
Portfolio of Investments — March 31, 2005
Mid Cap Value Fund
| | | | | |
| | | | | |
Shares
| | | | Value
|
| COMMON STOCKS — 97.99% | | | |
| | | CONSUMER DISCRETIONARY — 28.51% |
| 85,900 | | Autozone, Inc.(a) | | $ | 7,361,630 |
| 90,400 | | Best Buy Co., Inc. | | | 4,882,504 |
| 126,600 | | Black & Decker Corp. | | | 10,000,133 |
| 562,200 | | Blockbuster, Inc., Class A | | | 4,964,226 |
| 217,000 | | Brink’s Co. | | | 7,508,200 |
| 452,000 | | Callaway Golf Co. | | | 5,785,600 |
| 85,000 | | Centex Corp. | | | 4,867,950 |
| 375,000 | | Interpublic Group of Companies, Inc.(a) | | | 4,605,000 |
| 270,000 | | Limited Brands | | | 6,561,000 |
| 264,300 | | Newell Rubbermaid, Inc. | | | 5,798,742 |
| 149,200 | | Officemax, Inc. | | | 4,998,200 |
| 135,600 | | Sherwin-Williams Co. | | | 5,965,044 |
| 203,400 | | TJX Cos., Inc. | | | 5,009,742 |
| 208,000 | | Zale Corp.(a) | | | 6,181,760 |
| | | | |
|
|
| | | | | | 84,489,731 |
| | | | |
|
|
| | | CONSUMER STAPLES — 2.37% | | | |
| 205,000 | | Dean Foods Co.(a) | | | 7,031,500 |
| | | | |
|
|
| | | ENERGY — 9.23% | | | |
| 217,000 | | Devon Energy Corp. | | | 10,361,750 |
| 153,700 | | Noble Corp. | | | 8,639,477 |
| 117,600 | | Occidental Petroleum Corp. | | | 8,369,592 |
| | | | |
|
|
| | | | | | 27,370,819 |
| | | | |
|
|
| | | FINANCIAL — 13.02% | | | |
| 167,300 | | Ace Ltd. | | | 6,904,471 |
| 189,900 | | CIT Group, Inc. | | | 7,216,200 |
| 904,000 | | Instinet Group, Inc.(a) | | | 5,315,520 |
| 72,400 | | Lehman Brothers Holding, Inc. | | | 6,817,184 |
| 122,100 | | RenaissanceRe Holdings Ltd. | | | 5,702,070 |
| 298,400 | | Sovereign Bancorp, Inc. | | | 6,612,544 |
| | | | |
|
|
| | | | | | 38,567,989 |
| | | | |
|
|
| | | HEALTH CARE — 5.09% | | | |
| 316,400 | | Health Management Associates, Inc., Class A | | | 8,283,352 |
| 198,900 | | Shire Pharmaceuticals plc ADR | | | 6,818,292 |
| | | | |
|
|
| | | | | | 15,101,644 |
| | | | |
|
|
| | | INDUSTRIALS — 13.00% | | | |
| 227,000 | | Empresa Brasileira de Aeronautica S.A. ADR | | | 7,105,100 |
| 153,700 | | Lincoln Electric Holdings, Inc. | | | 4,623,296 |
| | | | | |
| | | | | |
Shares
| | | | Value
|
| COMMON STOCKS — (continued) | | |
| | | INDUSTRIALS — (continued) | | | |
| 194,400 | | Mueller Industries, Inc. | | $ | 5,472,360 |
| 379,700 | | Onex Corp. | | | 6,199,742 |
| 406,800 | | United Rentals, Inc.(a) | | | 8,221,428 |
| 176,300 | | York International Corp. | | | 6,907,434 |
| | | | |
|
|
| | | | | | 38,529,360 |
| | | | |
|
|
| | | INFORMATION TECHNOLOGY — 11.39% |
| 280,000 | | Avaya, Inc.(a) | | | 3,270,400 |
| 200,000 | | Cabot Microelectronics Corp.(a) | | | 6,276,000 |
| 245,000 | | Electronic Data Systems Corp. | | | 5,064,150 |
| 280,400 | | Harris Corp. | | | 9,155,060 |
| 365,000 | | Symbol Technologies, Inc. | | | 5,288,850 |
| 379,700 | | Vishay Intertechnology, Inc.(a) | | | 4,719,671 |
| | | | |
|
|
| | | | | | 33,774,131 |
| | | | |
|
|
| | | RAW/INTERMEDIATE MATERIALS — 5.04% |
| 228,800 | | Aracruz Cellulose S.A. ADR | | | 8,191,040 |
| 189,900 | | Georgia-Pacific Corp. | | | 6,739,551 |
| | | | |
|
|
| | | | | | 14,930,591 |
| | | | |
|
|
| | | REAL ESTATE — 4.62% |
| 325,500 | | Friedman Billings Ramsey Group, Inc., Class A | | | 5,165,685 |
| 126,600 | | St. Joe Co. | | | 8,520,180 |
| | | | |
|
|
| | | | | | 13,685,865 |
| | | | |
|
|
| | | UTILITIES — 5.72% |
| 1,988,800 | | Calpine Corp.(a) | | | 5,568,640 |
| 200,000 | | Centerpoint Energy, Inc. | | | 2,406,000 |
| 406,800 | | EL Paso Corp. | | | 4,303,944 |
| 248,600 | | Williams Cos., Inc. | | | 4,676,166 |
| | | | |
|
|
| | | | | | 16,954,750 |
| | | | |
|
|
| | | TOTAL COMMON STOCKS
(Cost $218,138,324) | | | 290,436,380 |
| | | | |
|
|
| FOREIGN COMMON STOCKS — 1.69% | | | |
| | | NETHERLANDS — 1.69% |
| 99,500 | | Hunter Douglas NV | | | 5,015,311 |
| | | | |
|
|
| | | TOTAL FOREIGN COMMON STOCKS
(Cost $3,662,399) | | | 5,015,311 |
| | | | |
|
|
See Notes to Financial Statements.
10
Excelsior Funds Trust
Portfolio of Investments — March 31, 2005
Mid Cap Value Fund — (continued)
| | | | | |
| | | | | |
Principal
Amount
| | | | Value
|
| REPURCHASE AGREEMENT — 0.19% | | | |
| $573,000 | | JP Morgan Chase Securities, Inc., 2.30%, dated 3/31/05, to be repurchased 4/01/05, repurchase price $573,037 (collateralized by Federal National Mortgage Association MTN, par value $572,000, 4.63%, maturing 10/15/14; total market value $585,200) | | $ | 573,000 |
| | | | |
|
|
| | | TOTAL REPURCHASE AGREEMENT
(Cost $573,000) | | | 573,000 |
| | | | |
|
|
| | | | | | |
| | | | | | |
| | | | | |
Value
|
TOTAL INVESTMENTS
(Cost $222,373,723)(b) | | 99.87 | % | | $ | 296,024,691 |
OTHER ASSETS IN EXCESS
OF LIABILITIES | | 0.13 | | | | 390,997 |
| | |
|
| |
|
|
NET ASSETS | | 100.00 | % | | $ | 296,415,688 |
| | |
|
| |
|
|
| (a) | Non-income producing security. |
| (b) | Unrealized appreciation (depreciation) of securities: |
| | | | |
Unrealized Appreciation
| | Unrealized
(Depreciation)
| | Net Unrealized
Appreciation/
(Depreciation)
|
| $82,748,653 | | $(9,097,685) | | $73,650,968 |
ADR—American Depository Receipt
MTN—Medium Term Note
plc—public limited company
The summary of the Fund’s investments as of March 31, 2005 is as follows: (Unaudited)
| | | | | | |
Sector Diversification
| | % of
Net
Assets
| | | Market Value
|
Consumer Discretionary | | 30.20 | % | | $ | 89,505,042 |
Financial | | 13.02 | | | | 38,567,989 |
Industrials | | 13.00 | | | | 38,529,360 |
Information Technology | | 11.39 | | | | 33,774,131 |
Energy | | 9.23 | | | | 27,370,819 |
Utilities | | 5.72 | | | | 16,954,750 |
Health Care | | 5.09 | | | | 15,101,644 |
Raw/Intermediate Materials | | 5.04 | | | | 14,930,591 |
Real Estate | | 4.62 | | | | 13,685,865 |
Consumer Staples | | 2.37 | | | | 7,031,500 |
Repurchase Agreements | | 0.19 | | | | 573,000 |
| | |
|
| |
|
|
Total Investment | | 99.87 | % | | $ | 296,024,691 |
Other Assets and Liabilities (Net) | | 0.13 | | | | 390,997 |
| | |
|
| |
|
|
Net Assets | | 100.00 | % | | $ | 296,415,688 |
| | |
|
| |
|
|
See Notes to Financial Statements.
11
Excelsior Funds, Inc.
Portfolio of Investments — March 31, 2005
Small Cap Fund
| | | | | |
| | | | | |
Shares
| | | | Value
|
| COMMON STOCKS — 99.57% | | |
| | | CONSUMER DISCRETIONARY — 16.50% |
| 440,000 | | BJ’s Wholesale Club, Inc.(a) | | $ | 13,666,400 |
| 800,000 | | Corinthian Colleges, Inc.(a) | | | 12,576,000 |
| 1,000,000 | | Oakley, Inc. | | | 12,820,000 |
| 200,000 | | Panera Bread Co., Class A(a) | | | 11,306,000 |
| 1,000,000 | | Sotheby’s Holdings, Inc., Class A(a) | | | 16,960,000 |
| 250,000 | | Thor Industries, Inc. | | | 7,477,500 |
| 120,000 | | Urban Outfitters, Inc.(a) | | | 5,756,400 |
| | | | |
|
|
| | | | | | 80,562,300 |
| | | | |
|
|
| | | CONSUMER STAPLES — 1.68% |
| 300,000 | | American Italian Pasta Co. | | | 8,220,000 |
| | | | |
|
|
| | | ENERGY — 5.63% |
| 330,000 | | Cal Dive International, Inc.(a) | | | 14,949,000 |
| 240,000 | | Helmerich & Payne, Inc. | | | 9,525,600 |
| 80,000 | | Oceaneering International, Inc.(a) | | | 3,000,000 |
| | | | |
|
|
| | | | | | 27,474,600 |
| | | | |
|
|
| | | FINANCIAL — 13.79% |
| 320,000 | | Jefferies Group, Inc. | | | 12,057,600 |
| 1,500,000 | | Knight Trading Group, Inc.(a) | | | 14,460,000 |
| 1,600,000 | | LaBranche & Co., Inc.(a) | | | 14,880,000 |
| 65,000 | | Park National Corp. | | | 7,312,500 |
| 240,000 | | Philadelphia Consolidated Holdings Corp.(a) | | | 18,607,200 |
| | | | |
|
|
| | | | | | 67,317,300 |
| | | | |
|
|
| | | HEALTH CARE — 9.90% |
| 300,000 | | Arrow International, Inc. | | | 10,305,000 |
| 430,000 | | Kensey Nash Corp.(a) | | | 11,644,400 |
| 370,000 | | LifePoint Hospitals, Inc.(a) | | | 16,220,800 |
| 1,500,000 | | Orthovita, Inc.(a) | | | 5,100,000 |
| 224,930 | | Zoll Medical Group(a) | | | 5,067,673 |
| | | | |
|
|
| | | | | | 48,337,873 |
| | | | |
|
|
| | | INDUSTRIALS — 10.08% |
| 1,800,000 | | Quanta Services, Inc.(a) | | | 13,734,000 |
| 400,000 | | Simpson Manufacturing Co., Inc. | | | 12,360,000 |
| 450,000 | | Thomas & Betts Corp.(a) | | | 14,535,000 |
| 220,000 | | Triumph Group, Inc.(a) | | | 8,566,800 |
| | | | |
|
|
| | | | | | 49,195,800 |
| | | | |
|
|
| | | | | |
| | | | | |
Shares
| | | | Value
|
| COMMON STOCKS — (continued) | | |
| | | INFORMATION TECHNOLOGY — 21.82% |
| 170,000 | | Anteon International Corp.(a) | | $ | 6,618,100 |
| 250,000 | | Cabot Microelectronics Corp.(a) | | | 7,845,000 |
| 340,000 | | CACI International, Inc., Class A(a) | | | 18,778,200 |
| 480,000 | | Dendrite International, Inc.(a) | | | 6,739,200 |
| 600,000 | | Forrester Research, Inc.(a) | | | 8,448,000 |
| 1,000,000 | | Keane, Inc.(a) | | | 13,030,000 |
| 240,000 | | Manhattan Associates, Inc.(a) | | | 4,888,800 |
| 300,000 | | MAXIMUS, Inc. | | | 10,047,000 |
| 120,000 | | Palmone, Inc.(a) | | | 3,045,600 |
| 280,000 | | Quanex Corp. | | | 14,929,600 |
| 770,000 | | RSA Security, Inc.(a) | | | 12,204,500 |
| | | | |
|
|
| | | | | | 106,574,000 |
| | | | |
|
|
| | | RAW/INTERMEDIATE MATERIALS — 8.71% |
| 400,000 | | Cambrex Corp. | | | 8,520,000 |
| 360,000 | | Oregon Steel Mills, Inc.(a) | | | 8,280,000 |
| 260,000 | | Steel Dynamics, Inc. | | | 8,957,000 |
| 380,000 | | Stillwater Mining Co.(a) | | | 3,743,000 |
| 800,000 | | USEC, Inc. | | | 13,024,000 |
| | | | |
|
|
| | | | | | 42,524,000 |
| | | | |
|
|
| | | TECHNOLOGY — 6.17% |
| 660,000 | | CommScope, Inc.(a) | | | 9,873,600 |
| 1,000,000 | | Kulicke & Soffa Industries, Inc.(a) | | | 6,290,000 |
| 240,000 | | Power Integrations(a) | | | 5,013,600 |
| 600,000 | | Technitrol, Inc.(a) | | | 8,952,000 |
| | | | |
|
|
| | | | | | 30,129,200 |
| | | | |
|
|
| | | TRANSPORTATION — 3.79% |
| 960,000 | | Kansas City Southern(a) | | | 18,489,600 |
| | | | |
|
|
| | | UTILITIES — 1.50% |
| 300,000 | | Aqua America, Inc. | | | 7,308,000 |
| | | | |
|
|
| | | TOTAL COMMON STOCKS
(Cost $391,639,078) | | | 486,132,673 |
| | | | |
|
|
See Notes to Financial Statements.
12
Excelsior Funds, Inc.
Portfolio of Investments — March 31, 2005
Small Cap Fund — (continued)
| | | | | |
| | | | | |
Principal
Amount
| | | | Value
|
| REPURCHASE AGREEMENT — 0.69% | | |
| $3,353,000 | | JP Morgan Chase Securities, Inc., 2.30%, dated 03/31/05, to be repurchased on 04/01/05, repurchase price $3,353,214 (collateralized by Federal National Mortgage Association MTN, par value $3,349,000, 4.63%, maturing on 10/15/14; total market value $3,424,407) | | $ | 3,353,000 |
| | | | |
|
|
| | | TOTAL REPURCHASE AGREEMENT
(Cost $3,353,000) | | | 3,353,000 |
| | | | |
|
|
| | | | | | | |
| | | | | | | |
TOTAL INVESTMENTS
(Cost $394,992,078)(b) | | 100.26 | % | | $ | 489,485,673 | |
LIABILITIES IN EXCESS OF OTHER ASSETS | | (0.26 | ) | | | (1,263,151 | ) |
| | |
|
| |
|
|
|
NET ASSETS | | 100.00 | % | | $ | 488,222,522 | |
| | |
|
| |
|
|
|
| (a) | Non-income producing security |
| (b) | Unrealized appreciation (depreciation) of securities: |
| | | | |
Unrealized
Appreciation
| | Unrealized
(Depreciation)
| | Net Unrealized
Appreciation/
(Depreciation)
|
| $113,033,494 | | $(18,539,899) | | $94,493,595 |
MTN—Medium Term Note
The summary of the Fund’s investments as of March 31, 2005 is as follows: (Unaudited)
| | | | | | | |
Sector Diversification
| | % of
Net
Assets
| | | Market Value
| |
Information Technology | | 21.82 | % | | $ | 106,574,000 | |
Consumer Discretionary | | 16.50 | | | | 80,562,300 | |
Financial | | 13.79 | | | | 67,317,300 | |
Industrials | | 10.08 | | | | 49,195,800 | |
Health Care | | 9.90 | | | | 48,337,873 | |
Raw/Intermediate Materials | | 8.71 | | | | 42,524,000 | |
Technology | | 6.17 | | | | 30,129,200 | |
Energy | | 5.63 | | | | 27,474,600 | |
Transportation | | 3.79 | | | | 18,489,600 | |
Consumer Staples | | 1.68 | | | | 8,220,000 | |
Utilities | | 1.50 | | | | 7,308,000 | |
Repurchase Agreements | | 0.69 | | | | 3,353,000 | |
| | |
|
| |
|
|
|
Total Investment | | 100.26 | % | | $ | 489,485,673 | |
Other Assets and Liabilities (Net) | | (0.26 | ) | | | (1,263,151 | ) |
| | |
|
| |
|
|
|
Net Assets | | 100.00 | % | | $ | 488,222,522 | |
| | |
|
| |
|
|
|
See Notes to Financial Statements.
13
Excelsior Funds, Inc.
Portfolio of Investments — March 31, 2005
Value and Restructuring Fund
| | | | | |
| | | | | |
Shares
| | | | Value
|
| COMMON STOCKS — 95.06% | | | |
| | | CONSUMER DISCRETIONARY — 20.83% |
| 1,750,000 | | Avon Products, Inc. | | $ | 75,145,000 |
| 1,800,000 | | Black & Decker Corp. | | | 142,182,000 |
| 2,450,000 | | Centex Corp. | | | 140,311,500 |
| 1,011,388 | | Harman International | | | 89,467,382 |
| 3,650,000 | | Interpublic Group of Companies, Inc.(a) | | | 44,822,000 |
| 1,700,000 | | Journal Communications, Inc., Class A | | | 28,135,000 |
| 3,700,000 | | Liberty Media Corp., Class A(a) | | | 38,369,000 |
| 2,000,000 | | Loews Corp. — Carolina Group | | | 66,200,000 |
| 2,250,000 | | Newell Rubbermaid, Inc. | | | 49,365,000 |
| 2,100,000 | | TJX Cos., Inc. | | | 51,723,000 |
| 5,600,000 | | XM Satellite Radio Holdings, Inc., Class A(a) | | | 176,400,001 |
| 2,075,000 | | Zale Corp.(a) | | | 61,669,000 |
| | | | |
|
|
| | | | | | 963,788,883 |
| | | | |
|
|
| | | CONSUMER STAPLES — 4.32% |
| 1,850,000 | | ConAgra Foods, Inc. | | | 49,987,000 |
| 2,425,000 | | Dean Foods Co.(a) | | | 83,177,500 |
| 1,575,000 | | Kraft Foods, Inc., Class A | | | 52,053,750 |
| 1,500,000 | | Vintage Wine Trust, Inc.(a)(b) | | | 15,000,000 |
| | | | |
|
|
| | | | | | 200,218,250 |
| | | | |
|
|
| | | ENERGY — 12.97% |
| 200,000 | | Alpha Natural Resources, Inc.(a) | | | 5,734,000 |
| 2,100,000 | | Burlington Resources, Inc.(c) | | | 105,147,000 |
| 625,000 | | ConocoPhillips | | | 67,400,000 |
| 2,050,000 | | Consol Energy, Inc. | | | 96,391,000 |
| 2,225,000 | | Devon Energy Corp.(c) | | | 106,243,750 |
| 1,200,000 | | Mariner Energy, Inc.(a)(b) | | | 16,800,000 |
| 950,000 | | Noble Energy, Inc. | | | 64,619,000 |
| 1,650,000 | | Petrobras ADR | | | 72,897,000 |
| 1,650,000 | | Todco, Class A(a) | | | 42,636,000 |
| 1,100,000 | | W&T Offshore, Inc.(a) | | | 22,836,000 |
| | | | |
|
|
| | | | | | 600,703,750 |
| | | | |
|
|
| | | FINANCIAL — 16.84% |
| 1,450,000 | | Ace Ltd. | | | 59,841,500 |
| 2,486,200 | | Amvescap plc ADR | | | 31,525,016 |
| 1,650,000 | | Apollo Investment Corp.(d) | | | 27,687,000 |
| | | | | |
| | | | | |
Shares
| | | | Value
|
| COMMON STOCKS — (continued) | | |
| | | FINANCIAL — (continued) |
| 725,000 | | CIT Group, Inc. | | $ | 27,550,000 |
| 1,625,000 | | Citigroup, Inc. | | | 73,027,500 |
| 1,000,000 | | Freddie Mac | | | 63,200,000 |
| 1,825,000 | | JP Morgan Chase & Co. | | | 63,145,000 |
| 675,000 | | Lehman Brothers Holding, Inc. | | | 63,558,000 |
| 700,000 | | Loews Corp. | | | 51,478,000 |
| 2,400,000 | | MCG Capital Corp. | | | 36,924,000 |
| 1,300,000 | | Metlife, Inc. | | | 50,830,000 |
| 1,500,000 | | MoneyGram International, Inc. | | | 28,335,000 |
| 1,325,000 | | Morgan Stanley | | | 75,856,250 |
| 800,000 | | PNC Financial Services Group, Inc. | | | 41,184,000 |
| 2,100,000 | | Primus Guaranty Ltd.(a) | | | 27,363,000 |
| 650,000 | | Washington Mutual, Inc. | | | 25,675,000 |
| 450,000 | | XL Capital Ltd., Class A | | | 32,566,500 |
| | | | |
|
|
| | | | | | 779,745,766 |
| | | | |
|
|
| | | HEALTH CARE — 3.85% |
| 860,000 | | AmerisourceBergen Corp. | | | 49,269,400 |
| 525,000 | | Baxter International, Inc. | | | 17,839,500 |
| 900,000 | | Bristol-Myers Squibb Co. | | | 22,914,000 |
| 1,175,000 | | HCA, Inc. | | | 62,944,750 |
| 600,000 | | Wyeth | | | 25,308,000 |
| | | | |
|
|
| | | | | | 178,275,650 |
| | | | |
|
|
| | | INDUSTRIALS — 12.89% |
| 1,850,000 | | AGCO Corp.(a) | | | 33,762,500 |
| 700,000 | | Arlington Tankers | | | 16,450,000 |
| 2,875,000 | | Cendant Corp. | | | 59,052,500 |
| 1,350,000 | | Deluxe Corp. | | | 53,811,000 |
| 120,200 | | Dolby Laboratories, Inc., Class A(a) | | | 2,824,700 |
| 1,775,000 | | Empresa Brasileira de Aeronautica S.A. ADR | | | 55,557,500 |
| 1,150,000 | | Gol Linhas Aereas Inteligentes S.A. ADR(a) | | | 28,899,500 |
| 1,425,000 | | Overnite Corp. | | | 45,585,750 |
| 1,100,000 | | Ryder Systems, Inc. | | | 45,870,000 |
| 1,650,000 | | Tyco International Ltd. | | | 55,770,000 |
| 1,100,000 | | Union Pacific Corp. | | | 76,670,000 |
| 3,300,000 | | United Rentals, Inc.(a) | | | 66,693,000 |
| 550,000 | | United Technologies Corp. | | | 55,913,000 |
| | | | |
|
|
| | | | | | 596,859,450 |
| | | | |
|
|
See Notes to Financial Statements.
14
Excelsior Funds, Inc.
Portfolio of Investments — March 31, 2005
Value and Restructuring Fund — (continued)
| | | | | |
| | | | | |
Shares
| | | | Value
|
| COMMON STOCKS — (continued) | | |
| | | INFORMATION TECHNOLOGY — 5.61% |
| 1,970 | | Computer Associates International, Inc. | | $ | 53,387 |
| 3,400,000 | | Harris Corp. | | | 111,010,000 |
| 2,575,000 | | Nokia Oyj ADR | | | 39,732,250 |
| 1,300,000 | | Plantronics, Inc. | | | 49,504,000 |
| 1,200,000 | | Texas Instruments, Inc.(c) | | | 30,588,000 |
| 2,325,000 | | Vishay Intertechnology, Inc.(a) | | | 28,899,750 |
| | | | |
|
|
| | | | | | 259,787,387 |
| | | | |
|
|
| | | RAW/INTERMEDIATE MATERIALS — 7.00% |
| 550,000 | | Cambrex Corp. | | | 11,715,000 |
| 2,450,000 | | Celanese Corp., Class A(a) | | | 44,075,500 |
| 400,000 | | Eagle Materials, Inc., Class B | | | 31,520,000 |
| 1,300,000 | | Foundation Coal Holdings, Inc. | | | 30,563,000 |
| 1,775,000 | | Georgia-Pacific Corp. | | | 62,994,750 |
| 1,200,000 | | Lafarge Corp. | | | 70,140,000 |
| 1,025,000 | | PPG Industries, Inc. | | | 73,308,000 |
| | | | |
|
|
| | | | | | 324,316,250 |
| | | | |
|
|
| | | REAL ESTATE — 4.19% |
| 1,150,000 | | Capital Lease Funding, Inc. | | | 12,707,500 |
| 1,920,000 | | Diamondrock Hospitality Co.(a)(b) | | | 20,448,000 |
| 1,875,000 | | Fieldstone Investment Corp.(b) | | | 27,225,000 |
| 2,275,000 | | Friedman Billings Ramsey Group, Inc., Class A | | | 36,104,250 |
| 1,450,000 | | Host Marriott Corp. | | | 24,012,000 |
| 1,300,000 | | Luminent Mortgage Capital, Inc. | | | 14,274,000 |
| 1,000,000 | | Peoples Choice Financial Corp.(a)(b) | | | 10,000,000 |
| 135,000 | | PHH Corp.(a) | | | 2,952,450 |
| 1,600,000 | | Provident Senior Living Trust(b) | | | 25,840,000 |
| 1,200,000 | | Saxon Capital, Inc. | | | 20,640,000 |
| | | | |
|
|
| | | | | | 194,203,200 |
| | | | |
|
|
| | | TELECOMMUNICATION — 4.33% |
| 1,625,000 | | America Movil S.A. de C.V., Series L ADR | | | 83,850,000 |
| 1,325,000 | | EchoStar Communications, Inc., Class A | | | 38,756,250 |
| 788,300 | | Iowa Telecommunications Services, Inc. | | | 15,371,850 |
| | | | | |
| | | | | |
Shares
| | | | Value
|
| COMMON STOCKS — (continued) | | |
| | | TELECOMMUNICATION — (continued) |
| 1,900,000 | | Nextel Communications, Inc., Class A(a) | | $ | 53,998,000 |
| 575,400 | | Valor Communications, Inc. | | | 8,326,038 |
| | | | |
|
|
| | | | | | 200,302,138 |
| | | | |
|
|
| | | UTILITIES — 2.23% |
| 8,000,000 | | Calpine Corp.(a) | | | 22,400,000 |
| 1,350,000 | | Centerpoint Energy, Inc. | | | 16,240,500 |
| 1,050,000 | | Duke Energy Corp. | | | 29,410,500 |
| 649,275 | | Public Service Enterprise Group, Inc. | | | 35,314,067 |
| | | | |
|
|
| | | | | | 103,365,067 |
| | | | |
|
|
| | | TOTAL COMMON STOCKS
(Cost $3,195,937,037) | | | 4,401,565,791 |
| | | | |
|
|
| FOREIGN COMMON STOCKS — 1.39% | | |
| | | ITALY — 0.94% |
| 4,570,000 | | Enel S.p.A | | | 43,724,120 |
| | | | |
|
|
| | | UNITED KINGDOM — 0.45% |
| 1,200,000 | | Severn Trent plc | | | 20,744,379 |
| | | | |
|
|
| | | TOTAL FOREIGN
COMMON STOCKS
(Cost $45,124,797) | | | 64,468,499 |
| | | | |
|
|
| CONVERTIBLE PREFERRED STOCKS — 2.43% |
| | | CONSUMER DISCRETIONARY — 1.03% |
| 931,400 | | Adelphia Communications, Preferred Exchange, 7.50%, In Default | | | 186,280 |
| 1,050,000 | | Ford Motor Co. Capital Trust II, Preferred Exchange, 6.50% | | | 47,607,000 |
| | | | |
|
|
| | | | | | 47,793,280 |
| | | | |
|
|
| | | FINANCIAL — 0.21% |
| 300,000 | | Genworth Financial, Inc., Preferred Exchange, 6.00% | | | 9,630,000 |
| | | | |
|
|
| | | HEALTH CARE — 1.10% |
| 942,400 | | Baxter International, Inc., Preferred Exchange, 7.00% | | | 50,748,240 |
| | | | |
|
|
| | | RAW/INTERMEDIATE MATERIALS — 0.09% |
| 150,000 | | Celanese Corp., Preferred Exchange, 4.25% | | | 4,162,500 |
| | | | |
|
|
| | | TOTAL CONVERTIBLE PREFERRED STOCKS
(Cost $120,528,219) | | | 112,334,020 |
| | | | |
|
|
See Notes to Financial Statements.
15
Excelsior Funds, Inc.
Portfolio of Investments — March 31, 2005
Value and Restructuring Fund — (continued)
| | | | | |
| | | | | |
Principal
Amount
| | | | Value
|
| REPURCHASE AGREEMENT — 1.06% | | |
| $49,122,000 | | JP Morgan Chase Securities, Inc., 2.30%, dated 3/31/05, to be repurchased 4/01/05, repurchase price $49,125,138 (collateralized by Federal National Mortgage Association MTN, par value $49,061,000, 4.63%, maturing 10/15/14; total market value $50,168,130) | | $ | 49,122,000 |
| | | | |
|
|
| | | TOTAL REPURCHASE AGREEMENT
(Cost $49,122,000) | | | 49,122,000 |
| | | | |
|
|
| | | | | | |
| | | | | | |
TOTAL INVESTMENTS
(Cost $3,410,712,053)(e) | | 99.94 | % | | $ | 4,627,490,310 |
OTHER ASSETS IN EXCESS OF LIABILITIES | | 0.06 | | | | 2,601,616 |
| | |
|
| |
|
|
NET ASSETS | | 100.00 | % | | $ | 4,630,091,926 |
| | |
|
| |
|
|
| (a) | Non-income producing security. |
| (b) | Security, or part of security, exempt from registration under Rule 144A of the Securities Act of 1933. This security may be resold in transactions exempt from registration, normally to qualified institutional buyers. At March 31, 2005, these securities amounted to $107,471,000 or 2.32% of net assets. |
| (c) | All or part of the security is held as collateral. |
| (d) | Registered Investment Company |
| (e) | Unrealized appreciation (depreciation) of securities: |
| | | | |
Unrealized Appreciation
| | Unrealized
(Depreciation)
| | Net Unrealized
Appreciation/
(Depreciation)
|
| $1,399,947,607 | | $(183,169,350) | | $1,216,778,257 |
ADR—American Depository Receipt
In Default—Security in default on income payments.
MTN—Medium Term Note
plc—public limited company
| | | | |
Contracts
| | | | Value
|
| CALL OPTIONS WRITTEN: (0.04)% |
| (12,000) | | Texas Instruments, Expires 7/19/05, strike price 30 | | $ (360,000) |
| (3,828) | | Devon Energy, Expires 7/19/05, strike price 50 | | (918,720) |
| (672) | | Devon Energy, Expires 7/19/05, strike price 55 | | (67,200) |
| (3,500) | | Burlington Resources, Expires 8/23/05, strike price 55 | | (647,500) |
| | | | |
|
| | | TOTAL CALL OPTIONS WRITTEN
(Premiums received $2,633,972) | | $ (1,993,420) |
| | | | |
|
See Notes to Financial Statements.
16
Excelsior Funds, Inc.
Portfolio of Investments — March 31, 2005
Value and Restructuring Fund — (continued)
The summary of the Fund’s investments as of March 31, 2005 is as follows: (Unaudited)
| | | | | | | |
Sector Diversification
| | % of
Net
Assets
| | | Market Value
| |
Consumer Discretionary | | 21.86 | % | | $ | 1,011,582,163 | |
Financial | | 17.05 | | | | 789,375,766 | |
Energy | | 12.97 | | | | 600,703,750 | |
Industrials | | 12.89 | | | | 596,859,450 | |
Raw/Intermediate Materials | | 7.09 | | | | 328,478,750 | |
Information Technology | | 5.61 | | | | 259,787,387 | |
Health Care | | 4.95 | | | | 229,023,890 | |
Telecommunication | | 4.33 | | | | 200,302,138 | |
Consumer Staples | | 4.32 | | | | 200,218,250 | |
Real Estate | | 4.19 | | | | 194,203,200 | |
Utilities | | 3.62 | | | | 167,833,566 | |
Repurchase Agreements | | 1.06 | | | | 49,122,000 | |
| | |
|
| |
|
|
|
Total Investment | | 99.94 | % | | $ | 4,627,490,310 | |
Call Options Written | | (0.04 | ) | | | (1,993,420 | ) |
Other Assets and Liabilities (Net) | | 0.10 | | | | 4,595,036 | |
| | |
|
| |
|
|
|
Net Assets | | 100.00 | % | | $ | 4,630,091,926 | |
| | |
|
| |
|
|
|
See Notes to Financial Statements.
17
Excelsior Funds
Statements of Assets and Liabilities
March 31, 2005
| | | | | | | | |
| | | Equity
Income
Fund
| | | Large Cap
Growth Fund
| |
ASSETS: | | | | | | | | |
Investments, at cost—see accompanying portfolios | | $ | 181,759,238 | | | $ | 192,494,826 | |
| | |
|
|
| |
|
|
|
Investments, at value (including Repurchase Agreements) (Note 1) | | $ | 196,226,021 | | | $ | 219,279,574 | |
Cash | | | — | | | | 32 | |
Dividends and interest receivable | | | 485,575 | | | | 29,777 | |
Receivable for investments sold | | | — | | | | — | |
Receivable for fund shares sold | | | 404,033 | | | | 261,544 | |
| | |
|
|
| |
|
|
|
Total Assets | | | 197,115,629 | | | | 219,570,927 | |
| | |
|
|
| |
|
|
|
LIABILITIES: | | | | | | | | |
Payable for dividends declared | | | — | | | | — | |
Payable for investments purchased | | | 1,071,256 | | | | 9,160,635 | |
Cash overdraft | | | 35,367 | | | | — | |
Options written, at value (Premiums received: Value and Restructuring
Fund—$2,633,972) | | | — | | | | — | |
Payable for fund shares redeemed | | | 139,987 | | | | 126,410 | |
Investment advisory fees payable (Note 2) | | | 94,850 | | | | 98,799 | |
Administration fees payable (Note 2) | | | 24,812 | | | | 27,058 | |
Shareholder servicing fees payable (Note 2) | | | 38,068 | | | | 22,566 | |
Directors'/Trustees' fees and expenses payable (Note 2) | | | — | | | | — | |
Accrued expenses and other payables | | | 41,741 | | | | 74,569 | |
| | |
|
|
| |
|
|
|
Total Liabilities | | | 1,446,081 | | | | 9,510,037 | |
| | |
|
|
| |
|
|
|
NET ASSETS | | $ | 195,669,548 | | | $ | 210,060,890 | |
| | |
|
|
| |
|
|
|
NET ASSETS consist of: | | | | | | | | |
Undistributed net investment income | | $ | 844,970 | | | $ | — | |
Accumulated net realized gain (loss) on investments, foreign currency transactions and written options | | | (46,670 | ) | | | (138,913,076 | ) |
Unrealized appreciation of investments, foreign currency translations and written options | | | 14,466,783 | | | | 26,784,748 | |
Par value (Note 5) | | | 233 | | | | 26,138 | |
Paid in capital in excess of par value | | | 180,404,232 | | | | 322,163,080 | |
| | |
|
|
| |
|
|
|
Net Assets | | $ | 195,669,548 | | | $ | 210,060,890 | |
| | |
|
|
| |
|
|
|
Net Assets: | | | | | | | | |
Shares | | $ | 195,668,405 | | | $ | 210,059,749 | |
Institutional Shares | | | — | | | | — | |
Retirement Shares | | | 1,143 | | | | 1,141 | |
Shares outstanding (Note 5): | | | | | | | | |
Shares | | | 23,334,740 | | | | 26,137,790 | |
Institutional Shares | | | — | | | | — | |
Retirement Shares | | | 136 | | | | 142 | |
NET ASSET VALUE PER SHARE (net assets ÷ shares outstanding): | | | | | | | | |
Shares | | | $8.39 | | | | $8.04 | |
| | |
|
|
| |
|
|
|
Institutional Shares | | | — | | | | — | |
| | |
|
|
| |
|
|
|
Retirement Shares | | | $8.43 | | | | $8.02 | |
| | |
|
|
| |
|
|
|
See Notes to Financial Statements.
18
| | | | | | | | | | | | |
Managed
Income
Fund
| | Mid Cap
Value
Fund
| | | Small
Cap
Fund
| | Value and
Restructuring
Fund
| |
| | | | | | | | | | | | | |
| $ | 209,787,935 | | $ | 222,373,723 | | | $ | 394,992,078 | | $ | 3,410,712,053 | |
|
| |
|
|
| |
|
| |
|
|
|
| $ | 212,431,458 | | $ | 296,024,691 | | | $ | 489,485,673 | | $ | 4,627,490,310 | |
| | 12,563 | | | 25,086 | | | | 505 | | | 225,238 | |
| | 1,235,057 | | | 357,646 | | | | 33,714 | | | 6,369,844 | |
| | 25,557,790 | | | — | | | | — | | | 939,466 | |
| | 244,407 | | | 459,092 | | | | 485,249 | | | 13,216,442 | |
|
| |
|
|
| |
|
| |
|
|
|
| | 239,481,275 | | | 296,866,515 | | | | 490,005,141 | | | 4,648,241,300 | |
|
| |
|
|
| |
|
| |
|
|
|
| | | | | | | | | | | | | |
| | 428,319 | | | — | | | | — | | | — | |
| | 26,389,789 | | | — | | | | — | | | 7,476,843 | |
| | — | | | — | | | | — | | | — | |
|
— | | | — | | | | — | | | 1,993,420 | |
| | 507,723 | | | 112,965 | | | | 1,284,309 | | | 3,182,790 | |
| | 65,342 | | | 146,134 | | | | 245,965 | | | 2,377,259 | |
| | 27,375 | | | 40,142 | | | | 64,517 | | | 594,778 | |
| | 28,830 | | | 117,275 | | | | 69,153 | | | 1,364,406 | |
| | 9 | | | 32 | | | | — | | | — | |
| | 100,902 | | | 34,279 | | | | 118,675 | | | 1,159,878 | |
|
| |
|
|
| |
|
| |
|
|
|
| | 27,548,289 | | | 450,827 | | | | 1,782,619 | | | 18,149,374 | |
|
| |
|
|
| �� |
|
| |
|
|
|
| $ | 211,932,986 | | $ | 296,415,688 | | | $ | 488,222,522 | | $ | 4,630,091,926 | |
|
| |
|
|
| |
|
| |
|
|
|
| | | | | | | | | | | | | |
| $ | 9,744 | | $ | 388,063 | | | $ | — | | $ | 8,690,692 | |
|
1,913,595 | | | (146,340 | ) | | | 19,621,519 | | | (165,739,268 | ) |
|
2,643,523 | | | 73,650,968 | | | | 94,493,595 | | | 1,217,406,843 | |
| | 23,151 | | | 177 | | | | 30,247 | | | 111,826 | |
| | 207,342,973 | | | 222,522,820 | | | | 374,077,161 | | | 3,569,621,833 | |
|
| |
|
|
| |
|
| |
|
|
|
| $ | 211,932,986 | | $ | 296,415,688 | | | $ | 488,222,522 | | $ | 4,630,091,926 | |
|
| |
|
|
| |
|
| |
|
|
|
| | | | | | | | | | | | | |
| $ | 211,931,836 | | $ | 214,844,139 | | | $ | 488,221,400 | | $ | 4,469,074,789 | |
| | — | | | 81,570,415 | | | | — | | | 161,015,995 | |
| | 1,150 | | | 1,134 | | | | 1,122 | | | 1,142 | |
| | | | | | | | | | | | | |
| | 23,150,973 | | | 12,808,139 | | | | 30,246,709 | | | 107,937,578 | |
| | — | | | 4,852,989 | | | | — | | | 3,888,844 | |
| | 126 | | | 68 | | | | 70 | | | 28 | |
| | | | | | | | | | | | | |
| | $9.15 | | | $16.77 | | | | $16.14 | | | $41.40 | |
|
| |
|
|
| |
|
| |
|
|
|
| | — | | | $16.81 | | | | — | | | $41.40 | |
|
| |
|
|
| |
|
| |
|
|
|
| | $9.16 | | | $16.78 | | | | $16.12 | | | $41.49 | |
|
| |
|
|
| |
|
| |
|
|
|
See Notes to Financial Statements.
19
Excelsior Funds
Statements of Operations
For the Year Ended March 31, 2005
| | | | | | | | |
| | | Equity
Income
Fund
| | | Large Cap
Growth
Fund
| |
INVESTMENT INCOME: | | | | | | | | |
Dividend income | | $ | 4,843,173 | | | $ | 590,262 | |
Interest income | | | 96,677 | | | | 174,156 | |
Less: Foreign taxes withheld | | | (4,740 | ) | | | (7,944 | ) |
| | |
|
|
| |
|
|
|
Total Income | | | 4,935,110 | | | | 756,474 | |
| | |
|
|
| |
|
|
|
EXPENSES: | | | | | | | | |
Investment advisory fees (Note 2) | | | 1,085,612 | | | | 1,219,255 | |
Shareholder servicing fees — Shares (Note 2) | | | 361,876 | | | | 390,189 | |
Shareholder servicing fees — Institutional Shares (Note 2) | | | — | | | | — | |
Administration fees (Note 2) | | | 219,261 | | | | 246,253 | |
Transfer agent fees | | | 22,399 | | | | 117,084 | |
Legal and audit fees | | | 44,160 | | | | 49,192 | |
Re-audit expenses (Note 2) | | | 13,030 | | | | 16,450 | |
Custodian fees | | | 11,217 | | | | 7,370 | |
Registration and filing fees | | | 21,792 | | | | 16,232 | |
Shareholder reports | | | 7,838 | | | | 12,458 | |
Directors'/Trustees' fees and expenses (Note 2) | | | 5,788 | | | | 4,114 | |
Amortization of offering costs | | | 34,348 | | | | — | |
Miscellaneous expenses | | | 9,664 | | | | 10,199 | |
| | |
|
|
| |
|
|
|
Total Expenses | | | 1,836,985 | | | | 2,088,796 | |
| | |
|
|
| |
|
|
|
Fees waived and reimbursed by: | | | | | | | | |
Investment Adviser (Note 2) | | | (281,616 | ) | | | (339,084 | ) |
Administrator (Note 2) | | | (19,651 | ) | | | (23,079 | ) |
Re-audit expenses paid by Investment Adviser (Note 2) | | | (13,030 | ) | | | (16,450 | ) |
| | |
|
|
| |
|
|
|
Net Expenses | | | 1,522,688 | | | | 1,710,183 | |
| | |
|
|
| |
|
|
|
NET INVESTMENT INCOME (LOSS) | | | 3,412,422 | | | | (953,709 | ) |
| | |
|
|
| |
|
|
|
REALIZED AND UNREALIZED GAIN (LOSS) ON INVESTMENTS (NOTE 1): | | | | | | | | |
Net realized gain (loss) on: | | | | | | | | |
Security transactions | | | (45,295 | ) | | | (480,165 | ) |
Foreign currency transactions | | | 914 | | | | — | |
Written options | | | — | | | | — | |
| | |
|
|
| |
|
|
|
Total net realized gain (loss) | | | (44,381 | ) | | | (480,165 | ) |
Change in unrealized appreciation (depreciation) of investments, foreign currency translations and written options during the year | | | 11,960,531 | | | | 7,803,728 | |
| | |
|
|
| |
|
|
|
Net realized and unrealized gain (loss) on investments, foreign currency transactions and written options | | | 11,916,150 | | | | 7,323,563 | |
| | |
|
|
| |
|
|
|
Net increase in net assets resulting from operations | | $ | 15,328,572 | | | $ | 6,369,854 | |
| | |
|
|
| |
|
|
|
See Notes to Financial Statements.
20
| | | | | | | | | | | | | | |
Managed Income Fund
| | | Mid Cap
Value
Fund
| | | Small
Cap
Fund
| | | Value and
Restructuring
Fund
| |
| | | | | | | | | | | | | | | |
| $ | 82,331 | | | $ | 7,606,258 | | | $ | 1,684,223 | | | $ | 74,083,694 | |
| | 12,833,462 | | | | 52,134 | | | | 109,944 | | | | 844,797 | |
| | — | | | | (66,107 | ) | | | — | | | | (844,437 | ) |
|
|
| |
|
|
| |
|
|
| |
|
|
|
| | 12,915,793 | | | | 7,592,285 | | | | 1,794,167 | | | | 74,084,054 | |
|
|
| |
|
|
| |
|
|
| |
|
|
|
| | | | | | | | | | | | | | | |
| | 1,976,828 | | | | 1,982,815 | | | | 2,664,033 | | | | 22,824,694 | |
| | 637,856 | | | | 501,132 | | | | 1,066,294 | | | | 9,095,957 | |
| | — | | | | 78,304 | | | | — | | | | — | |
| | 399,281 | | | | 462,079 | | | | 672,219 | | | | 5,757,405 | |
| | 153,507 | | | | 114,517 | | | | 130,165 | | | | 1,733,417 | |
| | 70,024 | | | | 85,678 | | | | 109,864 | | | | 801,738 | |
| | 26,987 | | | | 27,416 | | | | 35,165 | | | | 267,371 | |
| | 12,964 | | | | 14,936 | | | | 13,800 | | | | 172,635 | |
| | 29,013 | | | | 38,415 | | | | 27,446 | | | | 100,852 | |
| | 20,156 | | | | 30,099 | | | | 34,698 | | | | 373,999 | |
| | 7,269 | | | | 12,616 | | | | 11,950 | | | | 98,402 | |
| | — | | | | — | | | | — | | | | — | |
| | 25,976 | | | | 18,999 | | | | 26,649 | | | | 212,159 | |
|
|
| |
|
|
| |
|
|
| |
|
|
|
| | 3,359,861 | | | | 3,367,006 | | | | 4,792,283 | | | | 41,438,629 | |
|
|
| |
|
|
| |
|
|
| |
|
|
|
| | | | | | | | | | | | | | | |
| | (912,503 | ) | | | (222,455 | ) | | | (56,545 | ) | | | — | |
| | (43,265 | ) | | | (47,237 | ) | | | (63,801 | ) | | | (557,110 | ) |
| | (26,987 | ) | | | (27,416 | ) | | | (35,165 | ) | | | (267,371 | ) |
|
|
| |
|
|
| |
|
|
| |
|
|
|
| | 2,377,106 | | | | 3,069,898 | | | | 4,636,772 | | | | 40,614,148 | |
|
|
| |
|
|
| |
|
|
| |
|
|
|
| | 10,538,687 | | | | 4,522,387 | | | | (2,842,605 | ) | | | 33,469,906 | |
|
|
| |
|
|
| |
|
|
| |
|
|
|
| | | | | | | | | | | | | | | |
| | | | | | | | | | | | | | | |
| | 3,809,789 | | | | 12,483,472 | | | | 31,179,377 | | | | 25,789,853 | |
| | — | | | | 2,133 | | | | — | | | | 101 | |
| | — | | | | — | | | | — | | | | 2,015,708 | |
|
|
| |
|
|
| |
|
|
| |
|
|
|
| | 3,809,789 | | | | 12,485,605 | | | | 31,179,377 | | | | 27,805,662 | |
| | | |
| | (9,984,664 | ) | | | 10,433,850 | | | | 15,666,672 | | | | 348,650,183 | |
|
|
| |
|
|
| |
|
|
| |
|
|
|
| | | |
| | (6,174,875 | ) | | | 22,919,455 | | | | 46,846,049 | | | | 376,455,845 | |
|
|
| |
|
|
| |
|
|
| |
|
|
|
| $ | 4,363,812 | | | $ | 27,441,842 | | | $ | 44,003,444 | | | $ | 409,925,751 | |
|
|
| |
|
|
| |
|
|
| |
|
|
|
See Notes to Financial Statements.
21
Excelsior Funds
Statements of Changes in Net Assets
| | | | | | | | | | | | | | | | |
| | | Equity Income Fund
| | | Large Cap Growth Fund
| |
| | | Year Ended
March 31,
| | | Period Ended
March 31,
| | | Year Ended March 31,
| |
| | | 2005
| | | 2004*
| | | 2005
| | | 2004
| |
Net investment income (loss) | | $ | 3,412,422 | | | $ | 624,670 | | | $ | (953,709 | ) | | $ | (733,372 | ) |
Net realized gain (loss) on investments and foreign currency transactions | | | (44,381 | ) | | | 356,963 | | | | (480,165 | ) | | | (1,591,302 | ) |
Net realized gain (loss) on written options | | | — | | | | — | | | | — | | | | — | |
Change in unrealized appreciation (depreciation) of investments, foreign currency translations and written options during the year | | | 11,960,531 | | | | 2,506,252 | | | | 7,803,728 | | | | 28,354,319 | |
| | |
|
|
| |
|
|
| |
|
|
| |
|
|
|
Net increase in net assets resulting from operations | | | 15,328,572 | | | | 3,487,885 | | | | 6,369,854 | | | | 26,029,645 | |
| | |
|
|
| |
|
|
| |
|
|
| |
|
|
|
Distributions to shareholders: | | | | | | | | | | | | | | | | |
From net investment income | | | | | | | | | | | | | | | | |
Shares | | | (3,002,218 | ) | | | (219,601 | ) | | | — | | | | — | |
Institutional Shares | | | — | | | | — | | | | — | | | | — | |
Retirement Shares | | | — | | | | — | | | | — | | | | — | |
From net realized gain on investments | | | | | | | | | | | | | | | | |
Shares | | | (358,338 | ) | | | — | | | | — | | | | — | |
| | |
|
|
| |
|
|
| |
|
|
| |
|
|
|
Total distributions | | | (3,360,556 | ) | | | (219,601 | ) | | | — | | | | — | |
| | |
|
|
| |
|
|
| |
|
|
| |
|
|
|
Increase (decrease) in net assets from fund share transactions (Note 5) | | | | | | | | | | | | | | | | |
Shares | | | 83,676,030 | | | | 96,756,067 | | | | 76,459,149 | | | | 27,306,627 | |
Institutional Shares | | | — | | | | — | | | | — | | | | — | |
Retirement Shares | | | 1,151 | | | | — | | | | 1,150 | | | | — | |
| | |
|
|
| |
|
|
| |
|
|
| |
|
|
|
Total from fund share transactions | | | 83,677,181 | | | | 96,756,067 | | | | 76,460,299 | | | | 27,306,627 | |
| | |
|
|
| |
|
|
| |
|
|
| |
|
|
|
Net increase (decrease) in net assets | | | 95,645,197 | | | | 100,024,351 | | | | 82,830,153 | | | | 53,336,272 | |
| | |
|
|
| |
|
|
| |
|
|
| |
|
|
|
NET ASSETS: | | | | | | | | | | | | | | | | |
Beginning of year | | | 100,024,351 | | | | — | | | | 127,230,737 | | | | 73,894,465 | |
| | |
|
|
| |
|
|
| |
|
|
| |
|
|
|
End of year (1) | | $ | 195,669,548 | | | $ | 100,024,351 | | | $ | 210,060,890 | | | $ | 127,230,737 | |
| | |
|
|
| |
|
|
| |
|
|
| |
|
|
|
(1) Including undistributed net investment income | | $ | 844,970 | | | $ | 433,852 | | | $ | — | | | $ | — | |
| | |
|
|
| |
|
|
| |
|
|
| |
|
|
|
* Equity Income Fund commenced operations on September 30, 2003.
See Notes to Financial Statements.
22
| | | | | | | | | | | | | | | | | | | | | | | | | | | | | | |
Managed Income Fund
| | | Mid Cap Value Fund
| | | Small Cap Fund
| | | Value and Restructuring Fund
| |
| | | |
Year Ended March 31,
| | | Year Ended March 31,
| | | Year Ended March 31,
| | | Year Ended March 31,
| |
2005
| | | 2004
| | | 2005
| | | 2004
| | | 2005
| | | 2004
| | | 2005
| | | 2004
| |
| $ | 10,538,687 | | | $ | 11,400,699 | | | $ | 4,522,387 | | | $ | 637,981 | | | $ | (2,842,605 | ) | | $ | (541,330 | ) | | $ | 33,469,906 | | | $ | 18,590,937 | |
| | | | | | | |
| | 3,809,789 | | | | 2,230,517 | | | | 12,485,605 | | | | 3,623,320 | | | | 31,179,377 | | | | 31,762,314 | | | | 25,789,954 | | | | 26,130,547 | |
| | — | | | | — | | | | — | | | | — | | | | — | | | | — | | | | 2,015,708 | | | | (1,694,222 | ) |
| | | | | | | |
| | (9,984,664 | ) | | | 1,241,354 | | | | 10,433,850 | | | | 74,173,832 | | | | 15,666,672 | | | | 99,769,816 | | | | 348,650,183 | | | | 978,738,539 | |
|
|
| |
|
|
| |
|
|
| |
|
|
| |
|
|
| |
|
|
| |
|
|
| |
|
|
|
| | 4,363,812 | | | | 14,872,570 | | | | 27,441,842 | | | | 78,435,133 | | | | 44,003,444 | | | | 130,990,800 | | | | 409,925,751 | | | | 1,021,765,801 | |
|
|
| |
|
|
| |
|
|
| |
|
|
| |
|
|
| |
|
|
| |
|
|
| |
|
|
|
| | | | | | | |
| | (10,706,658 | ) | | | (11,408,944 | ) | | | (2,985,864 | ) | | | (306,909 | ) | | | — | | | | — | | | | (31,399,379 | ) | | | (16,015,057 | ) |
| | — | | | | — | | | | (1,745,081 | ) | | | (226,937 | ) | | | — | | | | — | | | | (542,162 | ) | | | (230,193 | ) |
| | (4 | ) | | | — | | | | — | | | | — | | | | — | | | | — | | | | — | | | | — | |
| | | | | | | |
| | (1,392,832 | ) | | | (4,038,025 | ) | | | — | | | | — | | | | — | | | | — | | | | — | | | | — | |
|
|
| |
|
|
| |
|
|
| |
|
|
| |
|
|
| |
|
|
| |
|
|
| |
|
|
|
| | (12,099,494 | ) | | | (15,446,969 | ) | | | (4,730,945 | ) | | | (533,846 | ) | | | — | | | | — | | | | (31,941,541 | ) | | | (16,245,250 | ) |
|
|
| |
|
|
| |
|
|
| |
|
|
| |
|
|
| |
|
|
| |
|
|
| |
|
|
|
| | | | | | | |
| | | | | | | | | | | | | | | | | | | | | | | | | | | | | | | |
| | (49,359,232 | ) | | | (23,580,863 | ) | | | 14,044,442 | | | | 51,526,480 | | | | 91,761,412 | | | | 65,141,731 | | | | 850,392,716 | | | | 691,737,456 | |
| | — | | | | — | | | | (27,789,884 | ) | | | 31,858,348 | | | | — | | | | — | | | | 118,620,109 | | | | 27,115,289 | |
| | 1,054 | | | | — | | | | 1,151 | | | | — | | | | 1,150 | | | | — | | | | 1,089 | | | | — | |
|
|
| |
|
|
| |
|
|
| |
|
|
| |
|
|
| |
|
|
| |
|
|
| |
|
|
|
| | (49,358,178 | ) | | | (23,580,863 | ) | | | (13,744,291 | ) | | | 83,384,828 | | | | 91,762,562 | | | | 65,141,731 | | | | 969,013,914 | | | | 718,852,745 | |
|
|
| |
|
|
| |
|
|
| |
|
|
| |
|
|
| |
|
|
| |
|
|
| |
|
|
|
| | (57,093,860 | ) | | | (24,155,262 | ) | | | 8,966,606 | | | | 161,286,115 | | | | 135,766,006 | | | | 196,132,531 | | | | 1,346,998,124 | | | | 1,724,373,296 | |
|
|
| |
|
|
| |
|
|
| |
|
|
| |
|
|
| |
|
|
| |
|
|
| |
|
|
|
| | | | | | | |
| | 269,026,846 | | | | 293,182,108 | | | | 287,449,082 | | | | 126,162,967 | | | | 352,456,516 | | | | 156,323,985 | | | | 3,283,093,802 | | | | 1,558,720,506 | |
|
|
| |
|
|
| |
|
|
| |
|
|
| |
|
|
| |
|
|
| |
|
|
| |
|
|
|
| $ | 211,932,986 | | | $ | 269,026,846 | | | $ | 296,415,688 | | | $ | 287,449,082 | | | $ | 488,222,522 | | | $ | 352,456,516 | | | $ | 4,630,091,926 | | | $ | 3,283,093,802 | |
|
|
| |
|
|
| |
|
|
| |
|
|
| |
|
|
| |
|
|
| |
|
|
| |
|
|
|
| $ | 9,744 | | | $ | — | | | $ | 388,063 | | | $ | 232,080 | | | $ | — | | | $ | — | | | $ | 8,690,692 | | | $ | 6,850,019 | |
|
|
| |
|
|
| |
|
|
| |
|
|
| |
|
|
| |
|
|
| |
|
|
| |
|
|
|
See Notes to Financial Statements.
23
Excelsior Funds
Financial Highlights — Selected Per Share Data and Ratios
| | | | | | | | | | | | | | | | | | | | | | |
| | | Net Asset Value,
Beginning of
Period
| | Net
Investment
Income (Loss)
| | | Net Realized and
Unrealized Gain (Loss)
of Investments and
Options
| | | Total From
Investment
Operations
| | | Dividends
From Net
Investment
Income
| | | Distributions From
Net Realized Gain
on Investments
and Options
|
EQUITY INCOME FUND | | | | | | | | | | | | | | | | | | | | | | |
Retirement Shares — (12/31/04*) | | | | | | | | | | | | | | | | | | | | | | |
Period Ended March 31, | | | | | | | | | | | | | | | | | | | | | | |
2005 | | $ | 8.50 | | $ | — | (2)(3) | | $ | (0.07 | )(2) | | $ | (0.07 | ) | | $ | — | | | $ | — |
LARGE CAP GROWTH FUND | | | | | | | | | | | | | | | | | | | | | | |
Retirement Shares — (12/31/04*) | | | | | | | | | | | | | | | | | | | | | | |
Period Ended March 31, | | | | | | | | | | | | | | | | | | | | | | |
2005 | | $ | 8.49 | | $ | (0.03 | )(2) | | $ | (0.44 | )(2) | | $ | (0.47 | ) | | $ | — | | | $ | — |
MANAGED INCOME FUND | | | | | | | | | | | | | | | | | | | | | | |
Retirement Shares — (12/31/04*) | | | | | | | | | | | | | | | | | | | | | | |
Period Ended March 31, | | | | | | | | | | | | | | | | | | | | | | |
2005 | | $ | 9.27 | | $ | 0.07 | (2) | | $ | (0.06 | )(2) | | $ | 0.01 | | | $ | (0.12 | ) | | $ | — |
MID CAP VALUE FUND | | | | | | | | | | | | | | | | | | | | | | |
Retirement Shares — (12/31/04*) | | | | | | | | | | | | | | | | | | | | | | |
Period Ended March 31, | | | | | | | | | | | | | | | | | | | | | | |
2005 | | $ | 17.26 | | $ | (0.01 | )(2) | | $ | (0.47 | )(2) | | $ | (0.48 | ) | | $ | — | | | $ | — |
SMALL CAP FUND | | | | | | | | | | | | | | | | | | | | | | |
Retirement Shares — (12/31/04*) | | | | | | | | | | | | | | | | | | | | | | |
Period Ended March 31, | | | | | | | | | | | | | | | | | | | | | | |
2005 | | $ | 17.00 | | $ | (0.04 | )(2) | | $ | (0.84 | )(2) | | $ | (0.88 | ) | | $ | — | | | $ | — |
VALUE AND RESTRUCTURING FUND | | | | | | | | | | | | | | | | | | | | | | |
Retirement Shares — (12/31/04*) | | | | | | | | | | | | | | | | | | | | | | |
Period Ended March 31, | | | | | | | | | | | | | | | | | | | | | | |
2005 | | $ | 42.43 | | $ | (0.04 | )(2) | | $ | (0.90 | )(2) | | $ | (0.94 | ) | | $ | — | | | $ | — |
* Commencement of Operations.
| (1) | Expense ratios before waiver of fees and reimbursement of expenses (if any) by advisor and administrator. |
| (2) | For comparative purposes per share amounts are based on average shares outstanding. |
| (3) | Amount represents less than $0.01 per share. |
See Notes to Financial Statements.
24
| | | | | | | | | | | | | | | | | | | | | |
Total
Distributions
| | Net Asset Value,
End of Period
| | Total
Return
| | | Net Assets, End
of Period
(000's)
| | Ratio of Net
Operating Expenses
to Average Net Assets
| | | Ratio of Gross
Operating Expenses
to Average Net Assets (1)
| | | Ratio of Net
Investment
Income (Loss) to
Average Net Assets
| | | Portfolio
Turnover
Rate
| |
| | | | | | | | | | | | | | | | | | | | | | |
| | | | | | | | | | | | | | | | | | | | | | |
| | | | | | | | | | | | | | | | | | | | | | |
| $ — | | $ | 8.43 | | (1.52 | %)(4) | | $ | 1 | | 1.55 | %(5) | | 1.76 | %(5) | | 0.02 | %(5) | | 19 | % |
| | | | | | | | | | | | | | | | | | | | | | |
| | | | | | | | | | | | | | | | | | | | | | |
| | | | | | | | | | | | | | | | | | | | | | |
| $ — | | $ | 8.02 | | (5.54 | %)(4) | | $ | 1 | | 1.55 | %(5) | | 1.78 | %(5) | | (1.45 | )%(5) | | 25 | % |
| | | | | | | | | | | | | | | | | | | | | | |
| | | | | | | | | | | | | | | | | | | | | | |
| | | | | | | | | | | | | | | | | | | | | | |
| $(0.12) | | $ | 9.16 | | 0.10 | %(4) | | $ | 1 | | 1.40 | %(5) | | 1.77 | %(5) | | 3.60 | %(5) | | 90 | % |
| | | | | | | | | | | | | | | | | | | | | | |
| | | | | | | | | | | | | | | | | | | | | | |
| | | | | | | | | | | | | | | | | | | | | | |
| $ — | | $ | 16.78 | | (3.01 | %)(4) | | $ | 1 | | 1.56 | %(5) | | 1.66 | %(5) | | (0.13 | )%(5) | | 28 | % |
| | | | | | | | | | | | | | | | | | | | | | |
| | | | | | | | | | | | | | | | | | | | | | |
| | | | | | | | | | | | | | | | | | | | | | |
| $ — | | $ | 16.12 | | (5.23 | %)(4) | | $ | 1 | | 1.55 | %(5) | | 1.58 | %(5) | | (1.28 | )%(5) | | 61 | % |
| | | | | | | | | | | | | | | | | | | | | | |
| | | | | | | | | | | | | | | | | | | | | | |
| | | | | | | | | | | | | | | | | | | | | | |
| $ — | | $ | 41.49 | | (2.58 | %)(4) | | $ | 1 | | 1.57 | %(5) | | 1.59 | %(5) | | (0.35 | )%(5) | | 8 | % |
See Notes to Financial Statements.
25
EXCELSIOR FUNDS
NOTES TO FINANCIAL STATEMENTS
1. Significant Accounting Policies:
Excelsior Funds, Inc. (“Excelsior Fund”) was incorporated under the laws of the State of Maryland on August 2, 1984. Excelsior Funds Trust (the “Trust”) is a statutory trust organized under the laws of the State of Delaware on April 27, 1994. Excelsior Fund and the Trust are registered under the Investment Company Act of 1940 (the “1940 Act”), as amended as open-ended diversified management investment companies.
Excelsior Fund and the Trust currently offer shares in fifteen and seven managed investment portfolios, respectively, each having its own investment objectives and policies. The following is a summary of significant accounting policies Large Cap Growth Fund, Managed Income Fund, Small Cap Fund and Value and Restructuring Fund, portfolios of Excelsior Fund, Equity Income Fund and Mid Cap Value Fund, portfolios of the Trust (the “Funds”). Such policies are in conformity with accounting principles generally accepted in the United States of America and are consistently followed by Excelsior Fund and the Trust in the preparation of their financial statements. The preparation of financial statements requires management to make estimates and assumptions that affect the reported amounts and disclosures in the financial statements. Actual results could differ from these estimates.
The Equity Income Fund, Managed Income Fund, Small Cap Fund and Large Cap Growth Fund offer two classes of shares: Retirement Shares and Shares. The Mid Cap Value Fund and Value and Restructuring Fund offer three classes of shares: Institutional Shares, Shares and Retirement Shares. The Financial Highlights of the Shares and Institutional Shares as well as the financial statements for the remaining portfolios of Excelsior Fund and the Trust are presented separately.
(a) Portfolio valuation:
Investments in securities that are traded on recognized domestic and foreign stock exchanges are valued at the last sale price on the exchange on which such securities are primarily traded or at the last quoted sale price on a national securities market. Securities traded over-the-counter are valued each business day on the basis of closing over-the-counter sale prices. Equity securities that are traded on the NASDAQ National Market System for which quotations are readily available are valued at the official closing price. Securities for which there were no transactions are valued at the last quoted sales price for the most recent day such prices were available. Securities for which market quotations are not readily available are valued in good faith at fair value pursuant to procedures adopted by the Board of Directors with regard to Excelsior Fund and the Board of Trustees with regard to the Trust.
Short-term debt instruments that mature in 60 days or less are valued at amortized cost, which approximates market value. The amortized cost method values a security at its cost at the time of purchase (or at its market value 61 days before maturity) and thereafter assumes a constant amortization to maturity of any bond premium or discount. Investments in securities that are primarily traded on foreign securities exchanges are generally valued at the preceding closing values of such securities on their respective exchanges, except that when a significant event has
26
occurred subsequent to the close of such foreign exchange and prior to the time at which the Fund’s net asset value is determined, then such securities are valued in good faith at fair value in accordance with procedures adopted by the Board of Directors with regard to Excelsior Fund and the Board of Trustees with regard to the Trust.
Investment valuations, other assets and liabilities initially expressed in foreign currencies are converted each business day into U.S. dollars based upon current exchange rates. Purchases and sales of foreign investments and income and expenses are converted into U.S. dollars based upon currency exchange rates prevailing on the respective dates of such transactions. The Funds do not isolate the portion of gains and losses on investment securities that is due to changes in foreign exchange rates from that which is due to changes in market prices of such securities. The Funds report gains and losses on foreign currency related transactions as realized and unrealized gains or losses for financial reporting purposes, whereas such components are treated as ordinary income or loss for federal income tax purposes.
(b) Forward foreign currency exchange contracts:
The Funds’ participation in forward currency exchange contracts will be limited to hedging involving either specific transactions or portfolio positions. Transaction hedging involves the purchase or sale of foreign currency with respect to specific receivables or payables of a Fund generally arising in connection with the purchase or sale of its portfolio securities. Risk may arise upon entering into these contracts from the potential inability of counterparties to meet the terms of their contracts and is generally limited to the amount of unrealized gain on the contracts, if any, at the date of default. Risk may also arise from unanticipated movements in the value of foreign currency relative to the U.S. dollar. Contracts are marked to market daily and the change in market value is recorded as unrealized appreciation or depreciation. Realized gains or losses arising from such transactions are included in net realized gains or losses from foreign currency transactions.
The Funds had no forward foreign currency exchange contracts outstanding as of March 31, 2005.
(c) Covered call options written:
Certain Funds may engage in writing covered call options. By writing a covered call option, a Fund forgoes the opportunity to profit from an increase in the market price of the underlying security above the exercise price, except insofar as the premium represents such a profit.
When a Fund writes an option, an amount equal to the net premium (the premium less the commission) received by that Fund is included in the liability section of that Fund’s statement of assets and liabilities as a deferred credit. The amount of the deferred credit will be subsequently marked to market to reflect the current value of the option written. The current value of the traded option is the last sale price or, in the absence of a sale, the last quoted sale price for the most recent day such price was available. If an option expires on the stipulated expiration date, or if the Fund involved enters into a closing purchase transaction, the Fund will realize a gain (or loss if the cost of a closing purchase transaction exceeds the net premium received when the option is sold), and the deferred credit related to such option will be eliminated. If an option is exercised, the Fund involved may deliver the underlying security from its portfolio or purchase the underlying security
27
in the open market. In either event, the proceeds of the sale will be increased by the net premium originally received, and the Fund involved will realize a gain or loss. Premiums from expired call options written by the Fund and net gains from closing purchase transactions are treated as short-term capital gains for Federal income tax purposes, and losses on closing purchase transactions are short-term capital losses.
There is no assurance that a liquid secondary market on an exchange will exist for any particular option. A covered option writer, unable to effect a closing purchase transaction, will not be able to sell the underlying security until the option expires or is delivered upon exercise. As a result, the writer in such circumstances will be subject to the risk of market decline in the underlying security during such period and to the risk that market values increase beyond the option exercise price, in each case to the extent not offset by the net premium. A Fund will write an option on a particular security only if the Adviser believes that a liquid secondary market will exist on an exchange for options of the same series, which will permit the Fund to make a closing purchase transaction in order to close out its position.
During the year ended March 31, 2005, the Value and Restructuring Fund had the following written option transactions:
| | | | | | | |
| Written Option Transactions | | Number of
Contracts
| | | Premiums
| |
Outstanding, beginning of period | | (15,385 | ) | | $ | (2,153,485 | ) |
Options written | | (33,294 | ) | | | (5,171,714 | ) |
Options expired | | 20,604 | | | | 2,596,637 | |
Options exercised | | 4,175 | | | | 1,312,069 | |
Options terminated in closing purchase transactions | | 3,900 | | | | 782,521 | |
| | |
|
| |
|
|
|
Outstanding, end of year | | (20,000 | ) | | $ | (2,633,972 | ) |
| | |
|
| |
|
|
|
(d) Security transactions and investment income:
Security transactions are recorded on a trade date basis. Realized gains and losses on investments sold are recorded on the basis of identified cost. Interest income, adjusted for amortization of premiums and, when appropriate, discounts on investments, is earned from settlement date and is recorded on the accrual basis. Dividend income is recorded on the ex-dividend date, except for certain dividends from foreign securities, which are recorded as soon as the Funds are informed of the dividend.
(e) Repurchase agreements:
The Funds may purchase portfolio securities from financial institutions deemed to be creditworthy by the investment adviser subject to the seller’s agreement to repurchase and the Funds’ agreement to resell such securities at mutually agreed upon prices. Securities purchased subject to such repurchase agreements are deposited with the Funds’ custodian or sub-custodian or are maintained in the Federal Reserve/Treasury book-entry system and must have, at all times, an aggregate market value not less than the repurchase price (including accrued interest).
28
Default or bankruptcy of the seller may, however, expose the applicable Fund to possible delay in connection with the disposition of the securities or loss to the extent that proceeds from a sale of the underlying securities were less than the repurchase price under the agreement.
(e) TBA purchase commitments:
The Managed Income Fund may enter into “TBA” (To Be Announced) purchase commitments to purchase securities for a fixed price at a future date, typically not exceeding 45 days. TBA purchase commitments may be considered securities in themselves, and involve risk of loss if the value of the security to be purchased declines prior to settlement date. The Fund must maintain liquid securities having a value not less than the purchase price (including accrued interest) for such purchase commitments. Unsettled TBA purchase commitments are valued at the current market value of the underlying securities, according to the procedures described under “Portfolio Valuation” above.
(f) Mortgage dollar rolls:
The Managed Income Fund may enter into mortgage dollar rolls (principally in securities referred to as TBA, (see note 1(e)) in which the Fund will sell mortgage securities for delivery in the current month and simultaneously contract to repurchase similar, but not identical, securities at an agreed upon price on a fixed date. The Fund will account for such dollar rolls as repurchases and sales and receive compensation in consideration for entering into the commitment to repurchase. The Fund must maintain liquid securities having a value not less that the repurchase price (including accrued interest) for such dollar rolls. The market value of the securities that the Fund is required to repurchase may decline below the agreed upon repurchase price of those securities.
(g) Distributions to shareholders:
Dividends equal to all or substantially all of each Fund’s net investment income will be declared and paid as follows: for Equity Income Fund, Large Cap Growth Fund, Mid Cap Value Fund, Small Cap Fund and Value and Restructuring Fund, dividends will be declared and paid at least quarterly; for the Managed Income Fund, dividends from net investment income are declared daily and paid monthly. Net realized capital gains, unless offset by any available capital loss carryforward, are distributed at least annually. Dividends and distributions are recorded on the ex-dividend date.
(h) Expense allocation:
Expenses directly attributable to a Fund are charged to that Fund. Other expenses are allocated to the respective Fund based on average daily net assets. Expenses attributable to a specific class of shares, such as shareholder servicing fees, are charged directly to that class.
(i) Organization and offering costs:
Organization costs of the Equity Income Fund, which commenced operations on September 30, 2003, have been expensed as incurred. Offering costs, including costs of printing initial prospectuses and registration fees, were amortized to expense over twelve months.
29
2. Investment Advisory Fee, Administration Fee, Shareholder Servicing Fees and Related Party
Transactions:
United States Trust Company of New York (“U.S. Trust NY”) and U.S. Trust Company, N.A. (together the “Adviser” or “U.S. Trust”), acting through their respective registered investment advisory divisions, U.S. Trust New York Asset Management Division and U.S. Trust Company, N.A. Asset Management Division, serve as the investment adviser to the Funds. For the services provided pursuant to the Investment Advisory Agreements, the Adviser receives a fee, computed daily and paid monthly, as follows:
| | | |
Equity Income Fund | | 0.75 | % |
Large Cap Growth Fund | | 0.75 | % |
Managed Income Fund | | 0.75 | % |
Mid Cap Value Fund | | 0.65 | % |
Small Cap Fund | | 0.60 | % |
Value and Restructuring Fund | | 0.60 | % |
U.S. Trust NY is a state-chartered bank and trust company and a member bank of the Federal Reserve System. U.S. Trust Company, N.A. is a national bank organized under the laws of the United States. Each is a wholly-owned subsidiary of U.S. Trust Corporation, a registered bank holding company. U.S. Trust Corporation is a wholly-owned subsidiary of The Charles Schwab Corporation (“Schwab”).
U.S. Trust Company, N.A., and BISYS Fund Services Ohio, Inc. (collectively, the “Administrators”) provide administrative services to the Funds. For the services provided to the Funds, the Administrators are entitled jointly to annual fees, computed daily and paid monthly, based on the combined aggregate average daily net assets of Excelsior Fund, Excelsior Tax-Exempt Funds, Inc. (“Excelsior Tax-Exempt Fund”) and the Trust (excluding the international equity portfolios of Excelsior Fund and the Trust), all of which are affiliated investment companies, as follows: 0.200% of the first $200 million, 0.175% of the next $200 million and 0.150% over $400 million. Administration fees payable by each Fund of the three investment companies are determined in proportion to the relative average daily net assets of the respective Fund for the period paid. For the five month period ended August 31, 2004, U.S. Trust Company, N.A. voluntarily agreed to waive a portion of its administration fee in an amount equal to an annual rate of 0.04% of the average daily net assets of each Fund. For the year ended March 31, 2005, administration fees charged by U.S. Trust Company, N.A. were as follows:
| | | | | | | | | | |
| | | Administration
Fees
| | Waiver
Administration
Fees
| | | Net
Administration
Fees
|
Equity Income Fund | | $ | 219,261 | | $ | (19,651 | ) | | $ | 199,610 |
Large Cap Growth Fund | | | 246,253 | | | (23,079 | ) | | | 223,174 |
Managed Income Fund | | | 399,281 | | | (43,265 | ) | | | 356,016 |
Mid Cap Value Fund | | | 462,079 | | | (47,237 | ) | | | 414,842 |
Small Cap Fund | | | 672,219 | | | (63,801 | ) | | | 608,418 |
Value and Restructuring Fund | | | 5,757,405 | | | (557,110 | ) | | | 5,200,295 |
From time to time, in its sole discretion, U.S. Trust may undertake to waive a portion or all of the fees payable to it and may also reimburse the Funds for a portion of other expenses. For the year ended
30
March 31, 2005, U.S. Trust has contractually agreed to waive investment advisory fees and to reimburse other ordinary operating expenses to the extent necessary to keep total operating expenses from exceeding the following annual percentages of each Fund’s average daily net assets:
| | | |
Equity Income Fund — Retirement Shares | | 1.55 | % |
Large Cap Growth Fund — Retirement Shares | | 1.55 | % |
Managed Income Fund — Retirement Shares | | 1.40 | % |
Mid Cap Value Fund — Retirement Shares | | 1.64 | % |
Small Cap Fund — Retirement Shares | | 1.55 | % |
Value and Restructuring Fund — Retirement Shares | | 1.64 | % |
For the year ended March 31, 2005, total investment advisory fees waived by U.S. Trust for all Classes were as follows:
| | | | |
Equity Income Fund | | $ | (281,616 | ) |
Large Cap Growth Fund | | | (339,084 | ) |
Managed Income Fund | | | (912,503 | ) |
Mid Cap Value Fund | | | (222,455 | ) |
Small Cap Fund | | | (56,545 | ) |
Value and Restructuring Fund | | | — | |
The Funds have entered into shareholder servicing agreements with various service organizations, which may include Charles Schwab & Co. Inc. (“CS & Co.”) and U.S. Trust. Services included in the servicing agreements are assisting in processing purchase, exchange and redemption requests; transmitting and receiving funds in connection with customer orders to purchase, exchange or redeem shares; and providing periodic statements. Shareholder servicing fees are incurred on a Fund or class level (where applicable). In consideration for these services, each service organization receives a fee, computed daily and paid monthly, at an annual rate up to 0.25% of the average daily net assets of the Fund’s shares held by each service organizations’ customers. The Adviser, out of its own resources, may additionally compensate certain organizations for providing these services.
For the year ended March 31, 2005, shareholder servicing fees paid to CS & Co. and U.S. Trust were as follows:
| | | |
Equity Income Fund | | $ | 357,870 |
Large Cap Growth Fund | | | 378,816 |
Managed Income Fund | | | 565,074 |
Mid Cap Value Fund | | | 520,007 |
Small Cap Fund | | | 1,028,717 |
Value and Restructuring Fund | | | 4,751,166 |
Effective January 1, 2005, BISYS Fund Services Limited Partnership became the Distributor for the Funds. Prior to January 1, 2005, Edgewood Services, Inc. (a wholly-owned subsidiary of Federated Investors, Inc.) served as the Distributor of the Funds. Shares of each Fund are sold without a sales charge on a continuous basis by the Distributor.
31
Certain funds have adopted a Distribution Plan pursuant to Rule 12b-1 under the 1940 Act, under which the Equity Income Fund, Large Cap Growth Fund, Managed Income Fund, Mid Cap Value Fund, Small Cap Fund and Value and Restructuring Fund may compensate the Distributor monthly for its services which are intended to result in the sale of Retirement Shares, in an amount not to exceed the annual rate of 0.50%, of the average daily net asset value of such Fund’s Retirement Shares. There were no fees charged for the year ended March 31, 2005.
Effective July 31, 2004, each Independent Director/Trustee of the Funds receives a total annual fee of $100,000 paid by the Funds and other affiliated investment companies managed by the Adviser. The Chairman of the Board receives an additional $30,000, the Chairman of the Audit Committee receives an additional $15,000, and the Chairman of the Nominating Committee receives an additional $5,000 for serving in those capacities. Prior to July 31, 2004, each Independent Director of Excelsior Fund received an annual fee of $15,000, plus a meeting fee of $2,500 for each meeting attended. The Chairman received an additional annual fee of $7,500. Independent Trustees of the Trust received an annual fee of $6,000, plus a meeting fee of $1,000 for each meeting attended. The Chairman of the Board received an additional annual fee of $5,000. Each member of the Nominating Committee received a meeting fee of $3,000 for each meeting attended. In addition, Directors and Trustees are reimbursed by Excelsior Fund, Excelsior Tax-Exempt Fund and the Trust, respectively, for reasonable expenses incurred when acting in their capacity as Directors and Trustees.
The Funds’ Board of Directors/Trustees selected Deloitte & Touche LLP in November of 2004 to be their registered public accounting firm and to re-audit the Funds’ March 31, 2004 financial statements. All expenses in connection with the re-audit, including costs of audit, legal services, and printing and mailing of the financial statements, were paid by the Adviser. Such expenses are reflected in the Statements of Operations as “re-audit expenses” and the corresponding expense waiver “re-audit expenses paid by Investment Adviser.”
3. Purchases, Sales and Maturities of Securities:
For the year ended March 31, 2005, purchases, sales and maturities of securities, excluding short-term investments and U.S. Government Agency obligations, for the Funds aggregated:
| | | | | | |
| | | Purchases
| | Sales and
Maturities
|
Equity Income Fund | | $ | 107,412,418 | | $ | 26,679,008 |
Large Cap Growth Fund | | | 111,700,899 | | | 38,674,489 |
Managed Income Fund | | | | | | |
U.S. Government | | | 123,990,498 | | | 142,161,091 |
Other | | | 80,751,542 | | | 98,954,519 |
Mid Cap Value Fund | | | 83,791,436 | | | 90,195,837 |
Small Cap Fund | | | 365,410,661 | | | 268,128,237 |
Value and Restructuring Fund | | | 1,249,651,610 | | | 304,807,240 |
32
4. Federal Taxes:
It is the policy of Excelsior Fund and the Trust that each Fund qualify or continue to qualify as a regulated investment company, by complying with the requirements of the Internal Revenue Code applicable to regulated investment companies, and by distributing substantially all of its taxable earnings to its shareholders.
In order to avoid a federal excise tax, each Fund is required to distribute certain minimum amounts of net realized capital gain and net investment income for the respective twelve-month periods ending October 31 and December 31 each calendar year.
Net realized gains of the Funds derived in certain countries are subject to certain foreign taxation.
Dividends and distributions are determined in accordance with federal income tax regulations and may differ from accounting principles generally accepted in the United States of America. These differences are primarily due to differing treatments for net operating losses, foreign currency transactions, passive foreign investment companies, partnership income, deferral of losses on wash sales and net capital losses and net currency losses incurred after October 31 through the end of the fiscal year (“Post-October losses”). To the extent these differences are permanent, adjustments are made to the appropriate equity accounts in the period that these differences arise. Accordingly, the following reclassifications as of March 31, 2005, were made to/from the following accounts:
| | | | | | | | | | | |
| | | Undistributed
Net Investment
Income
| | Accumulated
Net Realized
Gain (Loss)
| | | Paid-In-Capital
| |
Equity Income Fund | | $ | 914 | | $ | (914 | ) | | | — | |
Large Cap Growth Fund | | | 953,709 | | | 3 | | | $ | (953,712 | ) |
Managed Income Fund | | | 177,719 | | | (1,724,997 | ) | | | 1,547,278 | |
Mid Cap Value Fund | | | 364,541 | | | (9,893,533 | ) | | | 9,528,992 | |
Small Cap Fund | | | 2,842,605 | | | (4,708,605 | ) | | | 1,866,000 | |
Value and Restructuring Fund | | | 312,308 | | | (312,308 | ) | | | — | |
The tax character of dividends and distributions declared during the years ended March 31, 2005 and March 31, 2004 were as follows:
| | | | | | | | | |
| | | Ordinary
Income
| | Long-Term
Capital Gain
| | Total
|
Equity Income Fund | | | | | | | | | |
2005 | | $ | 3,360,556 | | | — | | $ | 3,360,556 |
2004 | | | 219,601 | | | — | | | 219,601 |
Managed Income Fund | | | | | | | | | |
2005 | | | 11,633,310 | | $ | 1,031,057 | | | 12,664,367 |
2004 | | | 12,669,037 | | | 2,777,932 | | | 15,446,969 |
Mid Cap Value Fund | | | | | | | | | |
2005 | | | 4,730,945 | | | — | | | 4,730,945 |
2004 | | | 533,846 | | | — | | | 533,846 |
Value and Restructuring Fund | | | | | | | | | |
2005 | | | 31,941,541 | | | — | | | 31,941,541 |
2004 | | | 16,245,250 | | | — | | | 16,245,250 |
33
As of March 31, 2005, the components of distributable earnings (accumulated losses) on a tax basis were as follows:
| | | | | | | | | | | | | | | | | | | | | | | | | |
| | | Undistributed
Ordinary
Income
| | Undistributed
Long-Term
Capital Gain
| | Distributions
Payable
| | | Accumulated
Capital and
Other Losses
| | | Post-
October
Losses
| | | Unrealized
Appreciation
(Depreciation)
| | Total
Accumulated
Earnings /
(Deficit)
| |
Equity Income Fund | | $ | 1,416,452 | | | — | | | — | | | | — | | | $ | (539,313 | ) | | $ | 14,387,944 | | $ | 15,265,083 | |
Large Cap Growth Fund | | | — | | | — | | | — | | | $ | (138,913,076 | ) | | | — | | | | 26,784,748 | | | (112,128,328 | ) |
Managed Income Fund | | | 1,159,172 | | $ | 1,192,486 | | $ | (428,319 | ) | | | — | | | | — | | | | 2,643,523 | | | 4,566,862 | |
Mid Cap Value Fund | | | 388,063 | | | — | | | — | | | | (121,536 | ) | | | — | | | | 73,626,164 | | | 73,892,691 | |
Small Cap Fund | | | — | | | 21,177,386 | | | — | | | | — | | | | — | | | | 92,937,728 | | | 114,115,114 | |
Value and Restructuring Fund | | | 10,697,424 | | | — | | | — | | | | (165,302,979 | ) | | | — | | | | 1,214,963,822 | | | 1,060,358,267 | |
Post-October losses are deemed to arise on the first business day of a Fund’s next taxable year.
For federal income tax purposes, capital loss carryforwards may be carried forward and applied against future capital gains. To the extent that such carryforwards are utilized, capital gains distributions will be reduced. At March 31, 2005, the following Funds had capital loss carryforwards available to offset future net capital gains through the indicated expiration dates:
| | | | | | | | | | | | | | | | | | | | |
| | | Expires
| |
|
| | | 2008
| | 2009
| | 2010
| | 2011
| | 2012
| | 2013
| | Total
|
Large Cap Growth Fund | | $ | 8,373,927 | | — | | $ | 24,653,640 | | $ | 83,374,895 | | $ | 22,030,449 | | $ | 480,165 | | $ | 138,913,076 |
Mid Cap Value Fund | | | — | | — | | | — | | | 121,536 | | | — | | | — | | | 121,536 |
Value and Restructuring Fund | | | — | | — | | | 7,063,026 | | | 130,876,419 | | | 27,363,534 | | | — | | | 165,302,979 |
At March 31, 2005, aggregate gross unrealized appreciation for all securities and call options written for which there was an excess of value over estimated tax cost and aggregate gross unrealized depreciation for all securities for which there was an excess of estimated tax cost over value is as follows:
| | | | | | | | | | | | | |
| | | Federal Tax Cost
| | Tax Basis
Unrealized
Appreciation
| | Tax Basis
Unrealized
(Depreciation)
| | | Net Unrealized
Appreciation
|
Equity Income Fund | | $ | 181,838,077 | | $ | 18,654,830 | | $ | (4,266,886 | ) | | $ | 14,387,944 |
Large Cap Growth Fund | | | 192,494,826 | | | 34,414,355 | | | (7,629,607 | ) | | | 26,784,748 |
Managed Income Fund | | | 209,787,935 | | | 3,669,100 | | | (1,025,577 | ) | | | 2,643,523 |
Mid Cap Value Fund | | | 222,398,527 | | | 82,723,849 | | | (9,097,685 | ) | | | 73,626,164 |
Small Cap Fund | | | 396,547,945 | | | 111,477,627 | | | (18,539,899 | ) | | | 92,937,728 |
Value and Restructuring Fund | | | 3,413,155,075 | | | 1,398,133,172 | | | (183,169,350 | ) | | | 1,214,963,822 |
5. Capital Transactions:
Excelsior Fund has authorized capital of 35 billion shares of Common Stock, 29.3756 billion of which is currently classified to represent interests in certain classes of shares. Authorized capital currently offered for each Fund is as follows: 1.5 billion shares of the Value and Restructuring Fund; 1 billion shares each of the Large Cap Growth Fund, Small Cap Fund; and 750 million shares of the
34
Managed Income Fund. Each share has a par value of $0.001 and represents an equal proportionate interest in the particular Fund with other shares of the same Fund and is entitled to such dividends and distributions of taxable earnings on the assets belonging to such Fund as are declared at the discretion of Excelsior Fund’s Board of Directors.
The Trust has authorized an unlimited number of shares of beneficial interest of each class of each Fund. Each share has a par value of $0.00001 and represents an equal proportionate interest in the particular Fund with other shares of the same Fund, and is entitled to such dividends and distributions of taxable earnings on the assets belonging to such Fund as are declared at the discretion of the Trust’s Board of Trustees.
Capital Share Transactions
| | | | | | | | | | | | | | |
| | | Equity Income Fund
| |
| | | Year Ended
03/31/05
| | | Period Ended
03/31/04*
| |
| | | Shares
| | | Amounts
| | | Shares
| | | Amounts
| |
Sold: | | | | | | | | | | | | | | |
Shares | | 12,455,777 | | | $ | 99,825,944 | | | 13,207,804 | | | $ | 99,187,559 | |
Retirement Shares | | 136 | | | | 1,151 | | | — | | | | — | |
Issued as reinvestment of dividends: | | | | | | | | | | | | | | |
Shares | | 77,738 | | | | 622,457 | | | 5,633 | | | | 41,579 | |
Redeemed: | | | | | | | | | | | | | | |
Shares | | (2,085,368 | ) | | | (16,772,371 | ) | | (326,844 | ) | | | (2,473,071 | ) |
| | |
|
| |
|
|
| |
|
| |
|
|
|
Net Increase (Decrease) | | 10,448,283 | | | $ | 83,677,181 | | | 12,886,593 | | | $ | 96,756,067 | |
| | |
|
| |
|
|
| |
|
| |
|
|
|
| |
| | | Large Cap Growth Fund
| |
| | | Year Ended
03/31/05
| | | Year Ended
03/31/04
| |
| | | Shares
| | | Amounts
| | | Shares
| | | Amounts
| |
Sold: | | | | | | | | | | | | | | |
Shares | | 14,085,811 | | | $ | 111,219,637 | | | 8,064,149 | | | $ | 57,523,780 | |
Retirement Shares | | 142 | | | | 1,150 | | | — | | | | — | |
Redeemed: | | | | | | | | | | | | | | |
Shares | | (4,443,816 | ) | | | (34,760,488 | ) | | (4,333,821 | ) | | | (30,217,153 | ) |
Retirement Shares | | — | | | | — | | | — | | | | — | |
| | |
|
| |
|
|
| |
|
| |
|
|
|
Net Increase (Decrease) | | 9,642,137 | | | $ | 76,460,299 | | | 3,730,328 | | | $ | 27,306,627 | |
| | |
|
| |
|
|
| |
|
| |
|
|
|
35
| | | | | | | | | | | | | | |
| | | Managed Income Fund
| |
| | | Year Ended
03/31/05
| | | Year Ended
03/31/04
| |
| | | Shares
| | | Amounts
| | | Shares
| | | Amounts
| |
Sold: | | | | | | | | | | | | | | |
Shares | | 7,544,152 | | | $ | 69,875,602 | | | 6,431,529 | | | $ | 60,736,685 | |
Retirement Shares | | 126 | | | | 1,050 | | | — | | | | — | |
Issued as reinvestment of dividends: | | | | | | | | | | | | | | |
Shares | | 331,579 | | | | 3,062,096 | | | 447,581 | | | | 4,191,949 | |
Retirement Shares | | — | | | | 4 | | | — | | | | — | |
Redeemed: | | | | | | | | | | | | | | |
Shares | | (4,431,412 | ) | | | (40,768,322 | ) | | (9,433,164 | ) | | | (88,509,497 | ) |
Redemption in-kind | | (8,833,002 | ) | | | (81,528,608 | ) | | — | | | | — | |
| | |
|
| |
|
|
| |
|
| |
|
|
|
Net Increase (Decrease) | | (5,388,557 | ) | | $ | (49,358,178 | ) | | (2,554,054 | ) | | $ | (23,580,863 | ) |
| | |
|
| |
|
|
| |
|
| |
|
|
|
| |
| | | Mid Cap Value Fund
| |
| | | Year Ended
03/31/05
| | | Year Ended
03/31/04
| |
| | | Shares
| | | Amounts
| | | Shares
| | | Amounts
| |
Sold: | | | | | | | | | | | | | | |
Shares | | 4,506,275 | | | $ | 71,247,527 | | | 9,417,352 | | | $ | 127,160,451 | |
Institutional Shares | | 1,440,444 | | | | 23,328,088 | | | 3,131,670 | | | | 45,488,248 | |
Retirement Shares | | 68 | | | | 1,151 | | | — | | | | — | |
Issued as reinvestment of dividends: | | | | | | | | | | | | | | |
Shares | | 65,005 | | | | 1,086,349 | | | 7,386 | | | | 94,100 | |
Institutional Shares | | 40,959 | | | | 681,342 | | | 179 | | | | 2,276 | |
Redeemed: | | | | | | | | | | | | | | |
Shares | | (3,620,972 | ) | | | (58,289,434 | ) | | (5,489,526 | ) | | | (75,728,071 | ) |
Institutional Shares | | (1,119,376 | ) | | | (18,369,260 | ) | | (1,138,246 | ) | | | (13,632,176 | ) |
Redemption in-kind | | (1,892,982 | ) | | | (33,430,054 | ) | | — | | | | — | |
| | |
|
| |
|
|
| |
|
| |
|
|
|
Net Increase (Decrease) | | (580,579 | ) | | $ | (13,744,291 | ) | | 5,928,815 | | | $ | 83,384,828 | |
| | |
|
| |
|
|
| |
|
| |
|
|
|
| |
| | | Small Cap Fund
| |
| | | Year Ended
03/31/05
| | | Year Ended
03/31/04
| |
| | | Shares
| | | Amounts
| | | Shares
| | | Amounts
| |
Sold: | | | | | | | | | | | | | | |
Shares | | 15,104,853 | | | $ | 235,106,641 | | | 21,479,092 | | | $ | 245,816,096 | |
Retirement Shares | | 70 | | | | 1,150 | | | — | | | | — | |
Redeemed: | | | | | | | | | | | | | | |
Shares | | (7,918,805 | ) | | | (124,749,437 | ) | | (15,766,201 | ) | | | (180,674,365 | ) |
Redemption in-kind | | (1,099,692 | ) | | | (18,595,792 | ) | | — | | | | — | |
| | |
|
| |
|
|
| |
|
| |
|
|
|
Net Increase (Decrease) | | 6,086,426 | | | $ | 91,762,562 | | | 5,712,891 | | | $ | 65,141,731 | |
| | |
|
| |
|
|
| |
|
| |
|
|
|
36
| | | | | | | | | | | | | | |
| | | Value and Restructuring Fund
| |
| | | Year Ended
03/31/05
| | | Year Ended
03/31/04
| |
| | | Shares
| | | Amounts
| | | Shares
| | | Amounts
| |
Sold: | | | | | | | | | | | | | | |
Shares | | 39,449,835 | | | $ | 1,550,480,361 | | | 38,649,596 | | | $ | 1,265,514,960 | |
Institutional Shares | | 3,740,751 | | | | 154,963,204 | | | 1,036,754 | | | | 27,794,739 | |
Retirement Shares | | 103 | | | | 4,238 | | | — | | | | — | |
Issued as reinvestment of dividends: | | | | | | | | | | | | | | |
Shares | | 647,698 | | | | 24,887,348 | | | 408,200 | | | | 11,870,494 | |
Institutional Shares | | 3,356 | | | | 131,791 | | | 1,230 | | | | 36,028 | |
Redeemed: | | | | | | | | | | | | | | |
Shares | | (18,527,714 | ) | | | (724,974,993 | ) | | (18,583,380 | ) | | | (585,647,998 | ) |
Institutional Shares | | (873,380 | ) | | | (36,474,886 | ) | | (19,867 | ) | | | (715,478 | ) |
Retirement Shares | | (75 | ) | | | (3,149 | ) | | — | | | | — | |
| | |
|
| |
|
|
| |
|
| |
|
|
|
Net Increase (Decrease) | | 24,440,574 | | | $ | 969,013,914 | | | 21,492,533 | | | $ | 718,852,745 | |
| | |
|
| |
|
|
| |
|
| |
|
|
|
| * | Equity Income Fund commenced operations on September 30, 2003. |
6. Line of Credit:
During the year ended March 31, 2005, the Funds and other affiliated funds participated in a $50 million unsecured line of credit provided by a syndication of banks under a line of credit agreement. A commitment fee, equal to an annual rate of 0.15% of the average daily unused portion of the line of credit, is allocated among the participating Funds at the end of each quarter, and is included in miscellaneous expenses on the statements of operations. For the year ended March 31, 2005, the Funds had no borrowings under the agreement. Effective March 9, 2005, the unsecured line of credit was terminated.
7. Guarantees:
In the normal course of business, the Funds enter into contracts that provide general indemnifications. The Funds’ maximum exposure under these arrangements is dependent on future claims that may be made against the Funds, and therefore, cannot be established; however, based on experience, the risk of loss from such claims is considered remote.
8. Legal Proceedings:
The Adviser and Excelsior Funds, Inc., Excelsior Tax-Exempt Funds, Inc., and Excelsior Funds Trust (the “Companies”) were contacted in September, 2003 by the Office of the New York State Attorney General (the “NYAG”), and the Adviser was contacted by the Securities and Exchange Commission (the “SEC”) in connection with their investigations of practices in the mutual fund industry identified as “market timing” and “late trading” of mutual fund shares (the “Investigations”). The Adviser and the Companies have cooperated with respect to these Investigations. As disclosed previously by the Adviser and its affiliates, with respect to the Adviser, these investigations have focused on circumstances in which a small number of parties were permitted to engage in short-term trading of certain Excelsior Funds. The short-term trading activities permitted under these arrangements have been terminated and the Adviser has strengthened its policies and procedures to deter frequent trading in the Companies.
37
Five class actions filed against the Companies and two derivative actions purportedly brought on behalf of each of the Companies and each of the funds have been transferred to the United District Court for the District of Maryland for coordinated or consolidated pre-trial proceedings in a matter styled In Re Mutual Funds Investment Litigation, MDL Docket No. 1586. Lead plaintiffs were appointed and additional defendants were added (generally consisting of current and former directors and officers of the Companies). The five class actions were then consolidated and a single amended complaint was filed on or about September 29, 2004. Plaintiffs in the consolidated class action are seeking unspecified monetary damages from claimed injuries arising from allegedly illegal and improper mutual fund trading practices, as well as disgorgement of investment advisory fees, rescission and restitution of unspecified funds. The two derivative actions were also consolidated into a new amended complaint, also filed on or about September 29, 2004. Plaintiffs in the consolidated derivative action are seeking, on behalf of the Companies, unspecified monetary damages for similar claimed injuries, as well as removal of Excelsior Fund directors, removal of U.S. Trust as advisor to the Excelsior Funds, rescission of its investment advisory contracts and disgorgement of management fees and compensation relating to the Excelsior Funds.
The defendants in the consolidated actions have moved to dismiss such actions, and the Maryland court is scheduled to hear oral argument on the motions to dismiss on June 16-17, 2005. The defendants will not be required to answer the complaints until such motions have been decided, and discovery in the actions is currently stayed.
While the ultimate outcome of these matters cannot be predicted with any certainty at this time, based on currently available information, the Adviser believes that the likelihood is remote that the pending private lawsuits and Investigations will have a material adverse financial impact on the Companies, and further believes that the pending Investigations and private lawsuits are not likely to materially affect the Adviser’s ability to provide investment management services to the Companies.
38
REPORT OF INDEPENDENT REGISTERED PUBLIC ACCOUNTING FIRM
To the Board of Trustees/Directors and Shareholders of
Excelsior Funds Trust and Excelsior Funds, Inc.
We have audited the accompanying statements of assets and liabilities, including the portfolios of investments, of the Equity Income Fund, Large Cap Growth Fund, Managed Income Fund, Mid Cap Value Fund, Small Cap Fund, and Value and Restructuring Fund (four of the portfolios constituting the Excelsior Funds, Inc. and two of the portfolios constituting the Excelsior Funds Trust) (collectively, the “Funds”) as of March 31, 2005, and the related statements of operations for the year then ended, the statements of changes in net assets for each of the two years in the period then ended and the Retirement Shares financial highlights for the period December 31, 2004 (commencement of Retirement Shares operations) through March 31, 2005. These financial statements and financial highlights are the responsibility of the Funds’ management. Our responsibility is to express an opinion on these financial statements and financial highlights based on our audits.
We conducted our audits in accordance with the standards of the Public Company Accounting Oversight Board (United States). Those standards require that we plan and perform the audit to obtain reasonable assurance about whether the financial statements and financial highlights are free of material misstatement. The Funds are not required to have, nor were we engaged to perform, an audit of their internal control over financial reporting. Our audit included consideration of internal control over financial reporting as a basis for designing audit procedures that are appropriate in the circumstances, but not for the purpose of expressing an opinion on the effectiveness of the Funds’ internal control over financial reporting. Accordingly, we express no such opinion. An audit also includes examining, on a test basis, evidence supporting the amounts and disclosures in the financial statements, assessing the accounting principles used and significant estimates made by management, as well as evaluating the overall financial statement presentation. Our procedures included confirmation of securities owned as of March 31, 2005, by correspondence with the custodian and brokers; where replies were not received from brokers, we performed other auditing procedures. We believe that our audits provide a reasonable basis for our opinion.
In our opinion, the financial statements and financial highlights referred to above present fairly, in all material respects, the financial position of Equity Income Fund, Large Cap Growth Fund, Managed Income Fund, Mid Cap Value Fund, Small Cap Fund, and Value and Restructuring Fund as of March 31, 2005, the results of their operations for the year then ended, and the changes in their net assets for each of the two years in the period then ended and the Retirement Shares financial highlights for the period December 31, 2004 (commencement of Retirement Shares operations) through March 31, 2005, in conformity with accounting principles generally accepted in the United States of America.
DELOITTE & TOUCHE LLP
New York, New York
May 27, 2005
39
Directors/Trustees and Officers of the Excelsior Funds Complex (Unaudited)
Information pertaining to the Directors/Trustees and Officers of Excelsior Fund, Excelsior Tax-Exempt Fund and Excelsior Funds Trust (each a “Company” and collectively, the “Excelsior Funds Complex”) is set forth below. Directors/Trustees who are not deemed to be “interested persons” of the Excelsior Funds Complex as defined in the 1940 Act are referred to as “Independent Board Members.” Directors/Trustees who are deemed to be “interested persons” of the Excelsior Funds Complex are referred to as “Interested Board Members”. The following information is as of May 20, 2005.
| | | | | | |
Name and Address(1) Age Time Served with the Excelsior Funds Complex
| | Principal Occupation
During the Past Five Years
| | Number of
Portfolios in Fund Complex Overseen by Director/Trustee(3)
| | Other Directorships Held by Director/Trustee(4)
|
DIRECTORS/TRUSTEES(2) INDEPENDENT BOARD MEMBERS | | | | |
Frederick S. Wonham
Age: 74
Since 1997 | | Retired. Chairman of the Boards and Director (since 1997) and President and Treasurer (from 1995 to February 2002) of Excelsior Funds, Inc. and Excelsior Tax-Exempt Funds, Inc.; Chairman of the Board and Trustee (since 1997) and President and Treasurer (from 1995 to February 2002) of Excelsior Funds Trust. | | 29 | | None. |
| | | |
Rodman L. Drake
Age: 62
Since 1994 | | Director of Excelsior Funds, Inc. and Excelsior Tax-Exempt Funds, Inc. (since 1996); Trustee of Excelsior Funds Trust (since 1994); Director, Crystal River Capital Inc. (a private REIT) (since March 2005); Director, Parson Brinkerhoff, Inc. (engineering firm) (since 1995); Co-Founder of Baringo Capital LLC (since 2002); President, Continuation Investments Group, Inc. (from 1997 to 2001). | | 29 | | Director and Chairman, Hyperion Total Return Fund, Inc., Hyperion Strategic Mortgage Fund Inc., and Hyperion 2005 Term Trust Inc. (since 1991); Director, Jackson Hewitt Inc. (since June 2004). |
| | | |
Morrill Melton ("Mel") Hall, Jr.
Age: 60
Since 2000 | | Director of Excelsior Funds, Inc. and Excelsior Tax-Exempt Funds, Inc. (since 2000); Trustee of Excelsior Funds Trust (since 2000); Chairman and Chief Executive Officer, Comprehensive Health Services, Inc. (health care management and administration) (since 1991). | | 29 | | None. |
| | | |
Roger M. Lynch
Age: 64
Since 2001 | | Retired. Director of Excelsior Funds, Inc. and Excelsior Tax- Exempt Funds, Inc. and Trustee of Excelsior Funds Trust (since 2001); Director, SLD Commodities, Inc. (importer of nuts) (since 1991); President, Corporate Asset Funding Co., Inc. (asset securitization) (from 1987 to 1999); Limited Partner (from 1986 to 1999), Goldman Sachs & Co. | | 29 | | None. |
40
| | | | | | |
Name and Address(1) Age Time Served with the Excelsior Funds Complex
| | Principal Occupation
During the Past Five Years
| | Number of
Portfolios in Fund Complex Overseen by Director/Trustee(3)
| | Other Directorships Held by Director/Trustee(4)
|
Jonathan Piel
Age: 66
Since 1994 | | Retired. Director, Excelsior Funds, Inc. and Excelsior Tax-Exempt Funds, Inc. (since 1996); Trustee, Excelsior Funds Trust (since 1994). | | 29 | | None. |
| | | |
John. D. Collins
Age: 66
Since 2005 | | Retired. Director, Excelsior Funds, Inc. and Excelsior Tax-Exempt Funds, Inc. (since 2005); Trustee, Excelsior Funds Trust (since 2005). Consultant, KPMG, LLP (from July 1999 to June 2000); Partner, KPMG, LLP (from March 1962 to June 1999). | | 29 | | Director, CCC Information Services Inc. (software to automate process of settling automobile claims) (since September 2004); Director, Mrs. Fields’ Companies, Inc. (consumer products) (since December 2004). |
| INTERESTED BOARD MEMBER(5) | | | | |
James L. Bailey
114 West 47th Street
New York, NY 10036
Age: 59
Since 2004 | | Chief Operating Officer of U.S. Trust Corporation (since December 2004) and Executive Vice President of U.S. Trust Corporation and United States Trust Company of New York (since 2003); President, Excelsior Funds, Inc., Excelsior Tax-Exempt Funds, Inc. and Excelsior Funds Trust (from 2003 to July 2004); Consultant in the financial services industry (from August 2000 to January 2003); Executive Vice President of Citicorp (from 1992 to August 2000). | | 29 | | None. |
| OFFICERS | | | | | | |
Mary Martinez
114 West 47th Street
New York, NY 10036
Age: 45
President
Since July 2004 | | Managing Director of United States Trust Company of New York (since 2003) and Chief Executive Officer of National Private Banking (since October 2004); Managing Director and Director of Relationship Management Service, Marketing, Information and Technology at Bessemer Trust (from 1998 to 2003). | | N/A | | N/A |
| | | |
Joseph Trainor, CFA
114 West 47th Street
New York, NY 10036
Age: 44
Vice President
Since February 2004 | | Managing Director of United States Trust Company of New York and President, U.S. Trust Institutional (since 2003); President of MFS Institutional Advisors (from 1998 to 2002). | | N/A | | N/A |
41
| | | | | | |
Name and Address(1) Age Time Served with the Excelsior Funds Complex
| | Principal Occupation
During the Past Five Years
| | Number of
Portfolios in Fund Complex Overseen by Director/Trustee(3)
| | Other Directorships Held by Director/Trustee(4)
|
Agnes Mullady
225 High Ridge Road
Stamford, CT 06905
Age: 46
Treasurer/Chief Financial and
Chief Accounting Officer
Since February 2004 | | Senior Vice President, U.S. Trust Company, N.A. (since 2004); Chief Financial Officer, AMIC Distribution Partners (from 2002 to 2004); Controller Reserve Management Corporation, Reserve Management Company, Inc. and Reserve Partners, Inc. (from 2000 to 2002); Vice President and Treasurer, Northstar Funds; Senior Vice President and Chief Financial Officer, Northstar Investment Management Corp.; President and Treasurer, Northstar Administrators Corp.; and Vice President and Treasurer, Northstar Distributors, Inc. (from 1993 to 2000). | | N/A | | N/A |
| | | |
Scott Rhodes
225 High Ridge Road
Stamford, CT 06905
Age: 46
Vice President and
Assistant Treasurer
Since November 2004 | | Vice President, U.S. Trust Company, N.A. (since August 2004); Vice President, BlackRock Financial Management, Inc. (2004); Controller, Mutual Funds, American Skandia Investment Services, Inc. and Assistant Treasurer, American Skandia Trust and American Skandia Advisor Funds, Inc. (from 1996 to 2003). | | N/A | | N/A |
| | | |
Alexandra Poe
114 West 47th Street
New York, NY 10036
Age: 44
Secretary and
Chief Legal Officer
Since May 2004 | | Senior Vice President and Assistant General Counsel, United States Trust Company of New York (since May 2004); Chief Legal Officer for Managed Accounts and Alternative Investment Strategies, Prudential Investments (from 2001 to 2004); Senior Vice President and General Counsel, US Investment Management and Global Hedge Funds and President of the Schroder Mutual Funds, Schroders (from 1996 to 2001). | | N/A | | N/A |
| | | |
Sharon M. Davison
114 West 47th Street
New York, NY 10036
Age: 50
Chief Compliance Officer
Since September 2004 | | Senior Vice President of U.S. Trust Company of New York (since 2001); Director of Securities and Corporate Compliance (since 2001); Director of Special Investigations-New York Stock Exchange Division of Market Surveillance (from 2000 to 2001); Senior Counsel-New York Stock Exchange Division of Market Surveillance (from 1997 to 2000). | | N/A | | N/A |
42
| | | | | | |
Name and Address(1) Age Time Served with the Excelsior Funds Complex
| | Principal Occupation
During the Past Five Years
| | Number of
Portfolios in Fund Complex Overseen by Director/Trustee(3)
| | Other Directorships Held by Director/Trustee(4)
|
Wyndham Clark
225 High Ridge Road
Stamford, CT 06905
Age: 47
Anti-Money Laundering Officer
Since May 2004 | | Vice President and AML Officer, U.S. Trust Company, N.A. (since 2003); Vice President and Deputy Director Risk Management, IBJ Whitehall (banking) (from 2001 to 2002); and Vice President and Chief Risk Officer, EMAC, LLC (commercial lender, asset backed security issuer) (from 1999 to 2001). | | N/A | | N/A |
| | | |
Ralph Pastore
225 High Ridge Road
Stamford, CT 06905
Age: 35
Vice President
Since May 2005 | | Vice President, U.S. Trust Company, N.A. (since 2001); Director, Mutual Fund Operations, American Skandia Investment Services, Inc. (from 1998 to 2001) | | N/A | | N/A |
| (1) | Each independent director/trustee may be contacted by writing to Excelsior Funds, 225 High Ridge Road, Stamford, CT 06905. |
| (2) | Each director/trustee shall hold office until the election and qualification of his or her successor, or until he or she sooner dies, resigns or is removed. The officers of each Company shall hold office for a one year term and until their respective successors are chosen and qualified, or in each case until he or she sooner dies, resigns, is removed, or becomes disqualified in accordance with each Company’s by-laws. |
| (3) | The Excelsior Funds Complex consists of all registered investment companies (Excelsior Funds Inc., Excelsior Tax-Exempt Funds, Inc. and Excelsior Funds Trust) for which U.S. Trust serves as investment adviser. As of May 20, 2005, the Excelsior Funds Complex consisted of 29 Funds. |
| (4) | Directorships of companies required to report to the Securities and Exchange Commission under the Securities Exchange Act of 1934 (i.e., “public companies”) or other investment companies registered under the 1940 Act. |
| (5) | “Interested person” of the Company is defined in the 1940 Act. Mr. Bailey is considered an “interested person” because of his affiliation with the Adviser. |
For more information regarding the Directors/Trustees and Officers, please refer to the Statement of Additional Information, which is available upon request by calling 1-800-446-1012.
43
DISCLOSURE OF FUND EXPENSES (Unaudited)
We believe it is important for you to understand the impact of fees regarding your investment. As a shareholder of the fund, you incur ongoing, or operating costs, which include costs for portfolio management, administrative services, and shareholder reports (like this one), among others. Operating expenses, which are deducted from a fund’s gross income, directly reduce the investment return of the fund. A fund’s expenses are expressed as a percentage of its average net assets. This figure is known as the expense ratio. The following examples are intended to help you understand the ongoing costs (in dollars) of investing in your fund and to compare these costs with those of other mutual funds. The examples are based on an investment of $1,000 made at the beginning of the period shown and held for the entire period.
The table on the following page illustrates your fund’s costs in two ways.
| | · | Actual expenses. This section provides information about actual account values and actual expenses based on the Funds’ actual return for the period. This section is designed to help you to estimate the actual expenses after fee waivers that you paid over the period. The “Ending Account Value” shown is derived from the fund’s actual return, and the fourth column shows the dollar amount that would have been paid by an investor who started with $1,000 in the fund. You may use the information here, together with the amount you invested, to estimate the expenses that you paid over the period. |
To do so, simply divide your account value by $1,000 (for example, an $8,600 account value divided by $1,000 = $8.6), then multiply the result by the number given for your fund under the heading “Expenses Paid During Period”.
| | · | Hypothetical expenses. This section provides information about hypothetical account values and hypothetical expenses that would have been incurred by an investor in the Fund based on an assumed rate of return of 5% per year before expenses. This section is designed to help you compare your fund’s costs with those of other mutual funds. It assumes that the fund had a return of 5% before expenses during the year, but that the expense ratio is unchanged. In this case, because the return used is not the fund’s actual return, the results cannot be used to estimate the actual ending account balance or expenses you paid for the period. You may use this information to compare the ongoing costs of investing in your Fund and other funds. To do so, compare this 5% hypothetical example with the 5% hypothetical examples that appear in shareholder reports of other funds. |
44
DISCLOSURE OF FUND EXPENSES (Unaudited) (Continued)
Please note that the expenses shown in the table are meant to highlight and help you compare ongoing costs only, which are described in the Prospectus. Therefore, the hypothetical example is useful in comparing ongoing costs only, and will not help you determine the relative total costs of owning different funds.
| | | | | | | | | | | | |
| | | Beginning
Account
Value
9/30/2004
| | Ending
Account
Value
3/31/2005
| | Annualized
Expense
Ratios**
| | | Expenses
Paid
During
Period*
|
Actual Fund Return*** | | | | | | | | | | | | |
Equity Income Fund — Retirement Shares | | $ | 1,000.00 | | $ | 984.80 | | 1.55 | % | | $ | 3.74 |
Large Cap Growth Fund — Retirement Shares | | | 1,000.00 | | | 944.60 | | 1.55 | | | | 3.67 |
Managed Income Fund — Retirement Shares | | | 1,000.00 | | | 1,001.00 | | 1.40 | | | | 3.38 |
Mid Cap Value Fund — Retirement Shares | | | 1,000.00 | | | 969.90 | | 1.64 | | | | 3.69 |
Small Cap Fund — Retirement Shares | | | 1,000.00 | | | 947.70 | | 1.55 | | | | 2.57 |
Value and Restructuring Fund — Retirement Shares | | | 1,000.00 | | | 974.20 | | 1.64 | | | | 3.68 |
| | | | |
Hypothetical 5% Return**** | | | | | | | | | | | | |
Equity Income Fund — Retirement Shares | | | 1,000.00 | | | 1,017.30 | | 1.55 | | | | 7.70 |
Large Cap Growth Fund — Retirement Shares | | | 1,000.00 | | | 1,017.30 | | 1.55 | | | | 7.70 |
Managed Income Fund — Retirement Shares | | | 1,000.00 | | | 1,018.10 | | 1.40 | | | | 6.89 |
Mid Cap Value Fund — Retirement Shares | | | 1,000.00 | | | 1,017.35 | | 1.64 | | | | 7.64 |
Small Cap Fund — Retirement Shares | | | 1,000.00 | | | 1,019.60 | | 1.55 | | | | 5.39 |
Value and Restructuring Fund — Retirement Shares | | | 1,000.00 | | | 1,017.40 | | 1.64 | | | | 7.59 |
| * | Expenses are equal to the Fund's annualized expense ratio multiplied by the average account value over the period, multiplied by the number of days in the most recent fiscal half-year (182) then divided by 365. |
| ** | Annualized expense ratios of certain Funds are after fee waivers and expense reimbursements by the investment adviser. Absent such waivers and reimbursements, expenses paid during the period would have been greater. |
| *** | Information shown reflects values for the period from December 31, 2004 (date of commencement of operations) to March 31, 2005 and has been calculated using expense ratios and rates of return for the same time period. |
| **** | Information shown reflects values using the expense ratios for the period from December 31, 2004 (date of commencement of operations) to March 31, 2005 and has been annualized to reflect values for the period from September 30, 2004 to March 31, 2005. |
45
AR-RETIRE-0305

Institutional Shares
MONEY FUND
VALUEAND RESTRUCTURING FUND
MID CAP VALUE FUND
INTERNATIONAL EQUITY FUND
TOTAL RETURN BOND FUND
INCOME FUND
HIGH YIELD FUND
EQUITY CORE FUND
ANNUAL REPORT
March 31, 2005
TABLE OF CONTENTS
This report must be preceded or accompanied by a current prospectus.
A description of the policies and procedures that Excelsior Funds use to determine how to vote proxies relating to portfolio securities, as well as information relating to how a Fund voted proxies relating to portfolio securities during the most recent 12-month period ended June 30, is available (i) without charge, upon request, by calling (800) 881-9358, and (ii) on the Commission’s website at http://www.sec.gov.
Excelsior Funds file their June 30 and December 31 schedule of portfolio holdings with the Securities and Exchange Commission, on Form N-Q, within sixty days after the applicable reporting period. Excelsior Funds Form N-Q is available on the Commission’s website at http://www.sec.gov, and may be reviewed and copied at the Commission’s Public Reference Room in Washington, DC. Information on the operation of the Public Reference Room may be obtained by calling 1-800-SEC-0330.
You should consider the Fund’s investment objectives, risks and expenses carefully before you invest. Information about these and other important subjects is in the Fund’s prospectus, which you should read carefully before investing.
Excelsior Funds Trust and Excelsior Funds, Inc. are distributed by BISYS Fund Services Limited Partnership.
SHARES OF THE FUNDS ARE NOT DEPOSITS OR OBLIGATIONS OF, OR GUARANTEED OR ENDORSED BY, ANY BANK, AND THE SHARES ARE NOT FEDERALLY INSURED BY THE FEDERAL DEPOSIT INSURANCE CORPORATION, BANK INSURANCE FUND, FEDERAL RESERVE BOARD, OR ANY OTHER GOVERNMENTAL AGENCY. AN INVESTMENT IN A FUND IS SUBJECT TO RISK OF PRINCIPAL.
LETTER TO SHAREHOLDERS
March 31, 2005
Dear Fellow Shareholder:
The fiscal year ended March 31, 2005 was marked by a continuing uptrend in broad based market indices. Financial markets spent much of 2004 waiting to see who would win the U.S. Presidential election. Stocks rose in the post-election period, posting gains from the first week of November to year end. The markets held their ground despite higher than anticipated energy prices. On December 14th, the Standard & Poor’s 500 Index closed above 1200 for the first time since August of 2001, and stocks retained most of their year-end 2004 gains during the first quarter of 2005. Also, the Federal Reserve monetary policy took hold, with its seventh increase in the Federal Funds rate to 2.75% as of the end of the first quarter of 2005.
Going forward, our overall investment theme reflects a preference for goods versus services, real versus financial assets, and “old economy” sectors and industries stocks versus the so-called “new economy”. Creating the cities and the infrastructure that are springing up in giant global emerging economies has raised overall levels of demand for commodities that are in relatively short supply, particularly after a decade or more of capital under investment in tangible producing sectors. We expect to focus on opportunities for above-market returns, and our portfolio managers will aim to capitalize on these prospects as they take shape.
As always, we value your confidence in selecting Excelsior to fulfill your investment needs. We strongly believe that Excelsior’s array of funds will help meet the full range of your financial objectives.
Sincerely,

Mary Martinez
President
1
| | DOMESTIC EQUITY MARKET REVIEW |
After a strong performance across sectors, styles, and capitalization ranges during the previous reporting period ended March 31, 2004, the domestic equity markets turned challenging and finished the current reporting period only slightly higher. For the twelve months ended March 31, 2005, the Dow Jones Industrial Average (DJIA) rose 1.4%, the NASDAQ Composite Index (COMP) ticked up 0.25%, while the Standard & Poor’s 500 Index (S&P 500) gained 4.8%.
Throughout the reporting period, good news—including positive macroeconomic trends and attractive corporate fundamentals—was overshadowed by the triple threat of rising market interest rates, surging oil prices, and ongoing violence in the Middle East. The closely fought presidential election added further uncertainty to the markets, which rallied late in 2004 following President Bush’s reelection. However, a falling dollar, repeated interest rate hikes by the Federal Reserve, and a resurgence of oil prices depressed the domestic equity markets in the first calendar quarter of 2005.
During the first fiscal quarter ended June 30, 2004, stocks found solid support behind a bulwark of positive economic news and good company fundamentals. Although a major advance was checked, stocks were able to shake off the so-called “triple threat” to continue their rally.
The second fiscal quarter proved more challenging as stocks declined after the Democratic Convention gave candidate John Kerry a lift in the polls. Prices recovered in September after President Bush took the lead in the polls following the Republican Convention and the markets began to believe he would win re-election. Oil prices exceeded $50 per barrel during the quarter and investors began to fret about declining inventories. This, in turn, fueled worries over inflation and the effect of high energy prices on domestic economic growth.
The markets received a boost in the fiscal third quarter as growth in gross domestic product (GDP) was revised upwards to 3.9% from an initial reading of 3.7%. The re-election of President Bush by a solid majority was also well received by the markets in anticipation of favorable tax developments in the future. In December, new unemployment claims fell to a one-year low, and there was hope that the pace of job creation had stepped up. Retail sales data reported in mid-December surprised on the upside, suggesting that consumers were maintaining spending in the face of increased costs for gasoline and heating oil. Even the persistently high oil prices eased, adding to the good news, while inflation remained in check.
In the final fiscal quarter ended March 31, 2005, the combined headwinds of rising oil prices (which reversed course to exceed $50 per barrel once again), rising market interest rates, and a falling dollar proved too strong for stocks to overcome. Despite these overhangs, consumer confidence remained strong and the labor market remained stable. However, two key measures of business activity in the U.S. decelerated during the quarter. The rally of late 2004 stalled in January 2005, regained momentum in February, only to stall again in March. As a result, domestic equities generally declined in the quarter.
2
| | INTERNATIONAL EQUITY MARKET REVIEW |
After an especially strong year for International equities for the previous fiscal year ended March 31, 2004, the non-U.S. stock markets generally produced another year of solid returns during the twelve-month period ended March 31, 2005. Gains were largely driven by two factors: the continuing global economic recovery and the slumping U.S. dollar, which boosted International equity gains further in U.S. currency terms.
For the first fiscal quarter ended June 30, 2004, MSCI Europe led the way, posting a gain of 2.1% (in U.S. dollars) versus MSCI Asia, which declined 5.3% in USD. Currencies had a negative bias throughout the world but were the worst in Australia and Japan. Key macroeconomic drivers continued to be terrorism and its effects on oil prices, as well as a general bias towards interest-rate tightening globally. The Bank of England raised rates twice for a total hike of 50 basis points (one-half of one percent) while the European Central Bank (ECB) and China stood pat. European stock exchanges were generally in positive territory but Asia was a far different story, as overall weakness in non-Japan Asia resulted from a slowdown being orchestrated in China and an overwhelmingly negative sentiment towards technology that hurt Taiwan and Korea.
In the second fiscal quarter, European stocks rose slightly while Japanese stocks sold off fairly dramatically. Outside of Japan, however, Asian equities delivered a strong rebound in the quarter. The positive fallout from the declining interest rates in the U.S. was strongly felt throughout emerging markets as risk premiums declined. Indeed, the Hong Kong property market, in an environment of negative real interest rates, was up sharply. With the U.S. raising interest rates, the ECB stayed on hold at 2% while the Bank of England raised rates by 25 basis points to 4.75%.
The third fiscal quarter saw international markets once again outperforming the U.S. market, and the performance differential was quite impressive. A continuing contributor to the absolute performance of the international market was the decline of the U.S. dollar, which established new all-time lows against the euro during the fourth calendar quarter.
In general, non-U.S. stocks finished the final fiscal quarter on a positive note. Developed markets were supported by solid economic growth worldwide, while emerging markets continued to benefit from substantial improvements in the quality of management and the transparency of balance sheets. However, the previously all-too-familiar weakness of the U.S. dollar ceased to be a contributor to the absolute performance of International equities during this period as lingering concerns regarding both current account and federal budget deficits were overcome by the realization that the U.S. enjoyed one of the fastest-growing economies in the developed world.
3
| | FIXED INCOME MARKET REVIEW |
Despite the strong crosscurrents of rising market interest rates and growing inflationary pressures, the fixed-income marketplace held up relatively well for the twelve-month period ended March 31, 2005. Whether corporate or municipal, long or short-term, high quality or high yield, the fixed-income market indices generally trended upwards during the reporting period.
During the first fiscal quarter, U.S. Treasuries declined in price, suffering one of the worst three-month periods in a decade as the economy and the jobs market heated up. The Federal Reserve raised its federal funds target by 25 basis points, or one-quarter of one percent, to 1.25%, the first increase since May 2000.
After performing strongly earlier in 2004, asset-backed and commercial-mortgage-backed securities (CMBS) posted weaker returns relative to Treasuries. The underperformance was primarily due to the rise in interest rate swap spreads since these sectors are tightly correlated to swap spread movements. In addition, a surge in CMBS issuance in June also negatively impacted spreads. Meanwhile, residential mortgage-backed securities posted stronger relative results.
Prices for U.S. Treasury securities rebounded in the second fiscal quarter, pushing bond yields lower. This decrease in yields occurred even as the Federal Reserve continued to raise its target short-term interest rate. The Fed’s rate-setting committee increased its target short-term federal funds rate twice during the quarter, to 1.75%. Although short Treasury rates moderately declined in the quarter, the intermediate to long end of the Treasury curve experienced a decline in yields and the yield curve continued to flatten.
The third fiscal quarter saw further interest rate hikes on the part of the Federal Reserve, with two additional increases of 25 basis points bringing the target federal funds rate to 2.25%. These moves brought short-term rates to their highest levels in more than three years, although the yield curve flattened even further as the intermediate and long end of the Treasury curve experienced a less dramatic rise in yields.
Meanwhile, the municipal market took the Federal Reserve’s actions in stride with surprisingly little movement in residential mortgage rates. After jumping last spring when the Fed signaled its intention to raise short-term interest rates, longer-term municipal yields actually came back down when the Fed’s tightening began in earnest in June.
The reporting period’s final quarter proved challenging for the fixed-income markets. The Fed raised rates twice more, bringing the federal funds rate to 2.75%. A market sell-off in bonds was precipitated by Federal Reserve Chairman Alan Greenspan’s pronouncement mid-way through the quarter that low long-term yields, combined with rising short-term yields, posed a “conundrum” in the market. Then in March, the Fed indicated for the first time in this tightening cycle that it is concerned about inflationary pressures. The fixed-income market’s sentiment worsened further after General Motors announced that its earnings and cash flow for 2005 would be much lower than anticipated. As a result, the majority of fixed-income indices came under pressure during the quarter.
4
EXCELSIOR FUNDS, INC. | VALUE & RESTRUCTURING FUND |
Throughout the reporting period, holdings in the energy sector benefited Fund performance as energy prices—particularly oil, but also natural gas—rose significantly. Positions in cyclical stocks also boosted returns. In the first fiscal quarter, underweight exposure to technology, pharmaceutical, and healthcare stocks aided relative returns, as did overweight positions in energy and industrials. Meanwhile, holdings in financial firms detracted from performance. In the second fiscal quarter, energy and cyclical stocks performed solidly, while our underweight positions in technology and healthcare once again benefited relative performance as neither sector fared particularly well. During the third fiscal quarter, an important trend emerged: an increasing number of, as well as higher, dividend payouts. Flush with cash, corporate managers began using dividends to enhance shareholder value. This allowed the Fund’s yield to remain steady and rewarding, despite a gain in asset value throughout the period. Dividends are an important component of total return, and the trend towards higher payouts is, we believe, an important feature of the market environment going forward. Once again, energy and natural resource-related stocks powered Fund returns. In the final fiscal quarter of the reporting period, the equity markets essentially went sideways, with energy holdings (particularly overseas-based companies), as well as an underweight exposure to technology and healthcare once again boosting relative performance.
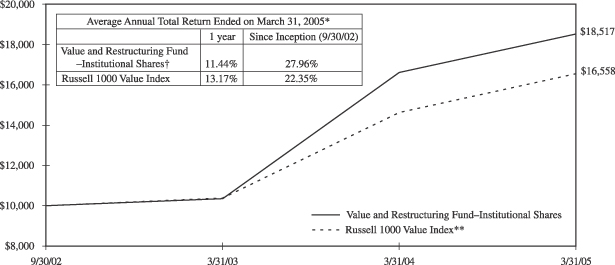
Past performance is not predictive of future performance. Investment returns and principal values will vary and shares may be worth more or less at redemption than their original cost.
The above illustration compares a $10,000 investment made in the Fund and a broad-based index since 9/30/02 (inception date). The chart assumes all dividends and capital gain distributions are reinvested. The Fund’s performance takes into account fees and expenses. The index does do not take into account charges, fees and other expenses. Further information relating to Fund performance is contained in the Financial Highlights section of the Prospectus and elsewhere in this report.
| * | | Total return represents the change during the period in a hypothetical account with dividends reinvested. |
| ** | | Source: Frank Russell Company—The Russell 1000 Value Index is an unmanaged index composed of those Russell 1000 Index companies with lower price-to-book ratios and lower forecasted growth values. The Russell 1000 Index is composed of the 1000 largest companies in The Russell 3000 Index which is composed of 3,000 of the largest U.S. companies by market capitalization. The Index includes dividends reinvested. |
| † | | Currently certain fees are waived. Had such fees not been waived, returns would have been lower. Returns do not reflect the deduction of taxes that a shareholder would pay on fund distributions or the redemption of shares. |
5
EXCELSIOR FUNDS TRUST | MID CAP VALUE FUND |
Throughout the reporting period, an attractive environment for mid-cap stocks—including positive macroeconomic trends and solid-to-strong corporate fundamentals—was overshadowed by the triple threat of rising market interest rates, surging oil prices, and ongoing violence in the Middle East. In the first fiscal quarter, appreciation in equities essentially paused while volatility increased. The Fund’s top-performing stocks included two energy-related firms, while holdings in the technology and home-building sectors lagged. In the second fiscal quarter, the Fund maintained its bias toward companies positioned to benefit from continued economic expansion, a posture we believed remained appropriate. The third fiscal quarter was strong for stocks and the Fund participated in the rally, led by holdings in consumer products and land development companies. Late in the reporting period, the emerging “triple threat” depressed investor sentiment toward the domestic equity markets and ushered in a challenging period for stocks in general, with the majority of equity market indices losing ground. Specific to the portfolio, the Fund’s exposure to healthcare, technology, and energy stocks (particularly power producers) hampered relative returns. Despite the less-than-stellar environment, the Fund maintained its longer-range view of investment opportunities and made new investments in sectors believed to be overlooked during the recent rise in commodity prices and that generally lagged in the quarter, including technology stocks and select financials.
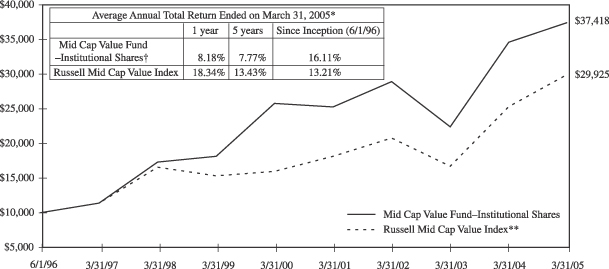
Past performance is not predictive of future performance. Investment returns and principal values will vary and shares may be worth more or less at redemption than their original cost.
The above illustration compares a $10,000 investment made in the Fund and a broad-based index since 6/1/96 (inception date). The chart assumes all dividends and capital gain distributions are reinvested. The Fund’s performance takes into account fees and expenses. The index does not take into account charges, fees and other expenses. Further information relating to Fund performance is contained in the Financial Highlights section of the Prospectus and elsewhere in this report.
| * | | Total return represents the change during the period in a hypothetical account with dividends reinvested. |
| ** | | Source: Frank Russell Company—The Russell Mid Cap Value Index measures the performance of medium-sized value-oriented securities. |
| † | | Currently certain fees are waived. Had such fees not been waived, returns would have been lower. Returns do not reflect the deduction of taxes that a shareholder would pay on Fund distributions or the redemption of shares. |
6
EXCELSIOR FUNDS TRUST | INTERNATIONAL EQUITY FUND |
During the first fiscal quarter, we maintained weightings in Japan roughly in-line with the benchmark, while underweighting the United Kingdom on a negative outlook for the financial sector and overweighting the Asian emerging markets due to accelerating growth. Holdings in consumer staples, healthcare, and energy boosted relative returns while information technology, telecommunications, and materials stocks were a drag on performance. In the second fiscal quarter, we reduced exposure to technology and, within the energy sector, diversified out of exploration and production into oil service companies we believe held greater appreciation potential. The third fiscal quarter saw the Fund outperform its benchmark due to successful stock selection across sectors. During the quarter, we initiated new positions in the Taiwanese technology and European media sectors. In the reporting period’s final quarter, the Fund continued to benefit from successful stock selection, especially in the energy, materials, and industrials sectors, and an overweight position in Emerging Markets stocks. By country, Norway, Denmark, and Canada were performance leaders while holdings in Ireland, Hong Kong, and New Zealand were laggards. By period’s end, we had eliminated selected positions in Asia, moving away from consumer sectors, while adding positions in robotics and pharmaceuticals. In Europe, we added in consumer sectors and autos.
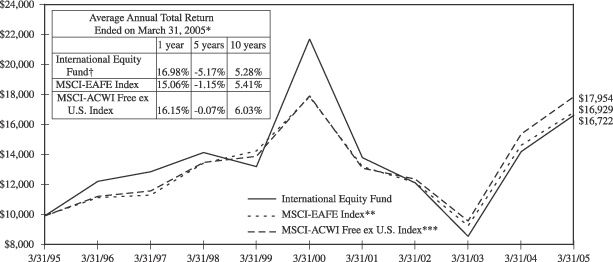
Past performance is not predictive of future performance. Investment returns and principal values will vary and shares may be worth more or less at redemption than their original cost. International investing is subject to special risks such as currency fluctuations, political risks, and differences in accounting and taxation standards.
The above illustration compares a $10,000 investment made in the Fund and broad-based indices over the past ten fiscal years. The chart assumes all dividends and capital gain distributions are reinvested. The Fund’s performance takes into account fees and expenses. The indices do not take into account charges, fees and other expenses. Further information relating to Fund performance is contained in the Financial Highlights section of the Prospectus and elsewhere in this report.
| * | | Total return represents the change during the period in a hypothetical account with dividends reinvested. |
| ** | | Source: Morgan Stanley & Co., Incorporated—The Morgan Stanley Capital International EAFE (Europe, Australia, Asia, Far East) Index is a widely accepted, unmanaged index composed of a sample of companies from 21 countries representing the developed stock markets outside North America. |
| *** | | Source: Morgan Stanley & Co., Incorporated—The Morgan Stanley Capital International All Country World Index Free ex U.S. Index is a widely accepted, unmanaged index of global stock market performance comprising 47 countries with developed and emerging markets excluding the United States. |
| † | | Currently certain fees are waived. Had such fees not been waived, returns would have been lower. Returns do not reflect the deduction of taxes that a shareholder would pay on Fund distributions or the redemption of shares. Returns do not reflect the 2% fee imposed on shares redeemed 30 days or less after their date of purchase. |
7
EXCELSIOR FUNDS TRUST | TOTAL RETURN BOND FUND |
The Total Return Bond Fund’s performance in the first fiscal quarter was in line with the benchmark’s (Lehman Government/Credit Index) return. The portfolio’s barbell position and shorter duration benefited as yields rose and the Treasury yield curve flattened. The portfolio’s residential mortgage-backed and municipal holdings were also positive contributors to relative performance. These positive effects were offset by the negative impact from widening swap spreads on the portfolio’s asset-backed and commercial mortgage backed holdings. The portfolio’s overweight in the finance sector and underweight in the industrial sector also had a negative effect.
In the second fiscal quarter, the portfolio’s barbell position benefited from the flattening in the Treasury yield curve. Another positive contributor, as interest rates declined, was the portfolio’s higher weighted coupon in the mortgage sector. These positive effects were offset by the moderate underweight allocation in corporate bonds, a sector of the market that outperformed over the quarter.
The fund has maintained its defensive positioning to rising interest rates over the third fiscal quarter and the bias to a continued flattening of the yield curve. This strategy was a positive contributor to returns along with the portfolio’s off-index allocation to residential mortgages and commercial mortgage backed securities. These contributors were offset by the moderate underweight allocation in corporate bonds, a sector of the market that outperformed over the quarter. At year end, the duration of the fund was 4.9 years and the average quality rating of the portfolio remains at AAA.
Over the fourth fiscal quarter, ending March 31, 2005, the Fed’s rate-setting committee increased its target short-term federal funds rate twice during the last quarter, to 2.75%. These moves brought short-term rates to their highest levels in over three years. U.S. Treasury rates rose during the first quarter of the year as the Federal Reserve continued to raise its target short-term interest rate. A market sell-off in bonds was precipitated by Fed Reserve Chairman Alan Greenspan’s pronouncement mid-way through the quarter that low long-term yields combined with rising short-term yields pose a “conundrum” in the market. Then, in March, the Fed indicated for the first time in this tightening cycle that it is concerned about inflationary pressures. The Fund’s defensive posture to rising rates and positioning for a flattening yield curve were contributors to out-performance for the quarter. The allocation to residential and commercial mortgage backed securities also added value over the quarter as these sectors posted positive excess returns. Our underweight allocation versus the benchmark in corporate bonds helped as the investment grade corporate market lost ground over the period.
8
EXCELSIOR FUNDS TRUST | TOTAL RETURN BOND FUND |
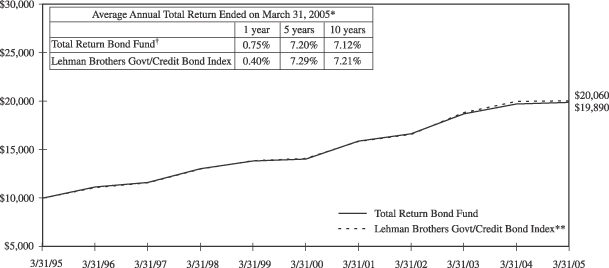
Past performance is not predictive of future performance. Investment returns and principal values will vary and shares may be worth more or less at redemption than their original cost.
The above illustration compares a $10,000 investment made in the Fund and a broad-based index over the past ten fiscal years. The chart assumes all dividends and capital gain distributions are reinvested. The Fund’s performance takes into account fees and expenses. The index does not take into account charges, fees and other expenses. Further information relating to Fund performance is contained in the Financial Highlights section of the Prospectus and elsewhere in this report.
| * | | Total return represents the change during the period in a hypothetical account with dividends reinvested. |
| ** | | Source: Lehman Brothers—The Lehman Brothers Govt/Credit Bond Index is an unmanaged total return performance benchmark comprised of U.S. Government agencies and U.S. Treasury securities and investment grade corporate debt, selected as representative of the market. |
| † | | Currently certain fees are waived. Had such fees not been waived, returns would have been lower. Returns do not reflect the deduction of taxes that a shareholder would pay on fund distributions or the redemption of shares. |
9
EXCELSIOR FUNDS TRUST | INCOME FUND |
In the first fiscal quarter, the Income Fund’s performance was in line with the benchmark’s (Lehman Aggregate Index) return. The portfolio’s barbell position benefited from the flattening in the Treasury yield curve. Another positive contributor, as interest rates rose, was the portfolio’s higher weighted coupon in the mortgage sector. These positive effects were offset by the negative impact from widening swap spreads on the portfolio’s asset-backed and commercial mortgage backed holdings. The portfolio’s overweight in the finance sector and underweight in the industrial sector also had a negative effect.
The portfolio’s barbell position benefited from the flattening in the Treasury yield curve in the second fiscal quarter. Another positive contributor, as interest rates declined, was the portfolio’s higher weighted coupon in the mortgage sector. These positive effects were offset by the moderate underweight allocation in corporate bonds, a sector of the market that outperformed over the quarter. Although the Treasury yield curve, represented by the 2-year/30-year Treasury spread, narrowed in the third quarter, it remained steep at 228 basis points. In this environment, we maintained the barbell positioning of our portfolios.
In the third fiscal quarter, the Income Fund maintained its defensive positioning to rising interest rates and the bias to a continued flattening of the yield curve. This strategy was a positive contributor to returns along with the Fund’s allocation to residential mortgages and commercial mortgage backed securities. Corporate bonds again led all sectors in terms of spread compression by generating 86 basis points of excess returns against duration-equivalent Treasuries and an absolute return of 1.3% as represented by the Lehman U.S. Credit Index. In securitized sectors, the asset-backed securities sector continued its run of out-performance driven by tighter spread to interest rate swap levels and by strong investor demand for yield. Strong investor demand led to solid performance in the commercial mortgage backed securities sector, posting 49 basis points of excess returns. Residential mortgages posted 84 basis points of excess returns versus curve-adjusted Treasuries in the quarter.
Over the fourth fiscal quarter, ending March 31, 2005, U.S. Treasury rates rose as the Federal Reserve continued to raise its target short-term interest rate. A market sell-off in bonds was precipitated by Fed Reserve Chairman Alan Greenspan’s pronouncement mid-way through the quarter that low long-term yields combined with rising short-term yields pose a “conundrum” in the market. The Fed’s rate-setting committee increased its target short-term federal funds rate twice during the last quarter, to 2.75%. These moves brought short-term rates to their highest levels in over three years. In March, the Fed indicated for the first time in this tightening cycle that it is concerned about inflationary pressures. The Fund’s defensive posture to rising rates and positioning for a flattening yield curve were the largest contributors to out-performance for the quarter. Our moderate underweight allocation in corporate bonds helped returns this quarter as the investment grade corporate market lost ground over the period.
10
EXCELSIOR FUNDS TRUST | INCOME FUND |
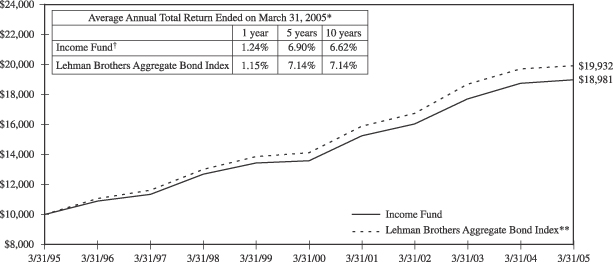
Past performance is not predictive of future performance. Investment returns and principal values will vary and shares may be worth more or less at redemption than their original cost.
The above illustration compares a $10,000 investment made in the Fund and a broad-based index over the past ten fiscal years. The chart assumes all dividends and capital gain distributions are reinvested. The Fund’s performance takes into account fees and expenses. The index does not take into account charges, fees and other expenses. Further information relating to Fund performance is contained in the Financial Highlights section of the Prospectus and elsewhere in this report.
| * | | Total return represents the change during the period in a hypothetical account with dividends reinvested. |
| ** | | Source: Lehman Brothers—The Lehman Brothers Aggregate Bond Index is an unmanaged, fixed income, market value- weighted index that includes treasury issues, agency issues, corporate bond issues and mortgage-backed securities. |
| † | | Currently certain fees are waived. Had such fees not been waived, returns would have been lower. Returns do not reflect the deduction of taxes that a shareholder would pay on fund distributions or the redemption of shares. |
11
EXCELSIOR FUNDS TRUST | HIGH YIELD FUND |
The key drivers of high yield market performance in the first fiscal quarter were the ongoing improvement in default rates and the nearly 100-basis-point increase in U.S. interest rates. Relative to the Merrill High Yield Index, we had overweight positions in paper/packaging, chemicals, and metals/mining to benefit from strong economic growth and in gaming to reduce portfolio volatility. In the second fiscal quarter, we positioned the portfolio for moderate volatility in an environment of solid economic growth and stable or moderately rising interest rates, holding issues with high coupons trading near their call prices. As a result, the Fund did not fully participate in the strong performance of the high yield sector during the quarter as interest rates fell. The Fund’s relative underperformance in the third fiscal quarter was almost entirely due to underweight exposure to high-volatility, lower-tier securities. However, it is important to note that our underweighting of lower-tier credits reflected concerns surrounding possible principal risk from rising interest rates and uncertainty surrounding national and international political events. In the reporting period’s final quarter, the Fund’s performance was notably mixed with January and particularly March suffering negative returns. During the quarter, our positions in chemicals and metals, along with certain telecom holdings, helped the Fund outperform the Index. However, our underweight in energy as well as holdings in automotive suppliers modestly impaired performance. Finally, the Fund’s shorter duration relative to the Index was somewhat beneficial to performance, as Treasury yields continued to rise throughout the quarter.
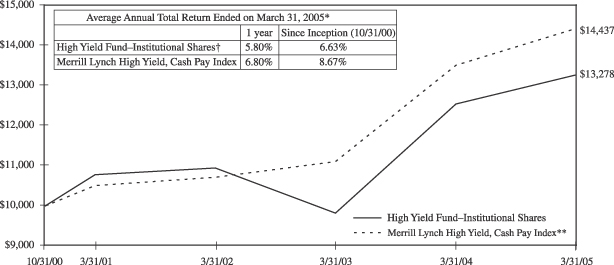
Past performance is not predictive of future performance. Investment returns and principal values will vary and shares may be worth more or less at redemption than their original cost. Securities rated below investment grade generally entail greater market, credit, and liquidity risks than investment grade securities.
The above illustration compares a $10,000 investment made in the Fund and a broad-based index since 10/31/00 (inception date). The chart assumes all dividends and capital gain distributions are reinvested. The Fund’s performance takes into account fees and expenses. The index does not take into account charges, fees and other expenses. Further information relating to Fund performance is contained in the Financial Highlights section of the Prospectus and elsewhere in this report.
| * | | Total return represents the change during the period in a hypothetical account with dividends reinvested. |
| ** | | Source: Merrill Lynch—The Merrill Lynch High Yield, Cash Pay Index is an unmanaged index comprised of publicly placed, non-convertible, coupon bearing domestic debt. Issues in the index are less than investment grade as rated by Standard & Poor’s Ratings Group or Moody’s Investors Service, Inc., and must not be in default. Issues have a term to maturity of at least one year. |
| † | | Currently certain fees are waived. Had such fees not been waived, returns would have been lower. Returns do not reflect the deduction of taxes that a shareholder would pay on Fund distributions or the redemption of shares. |
12
EXCELSIOR FUNDS TRUST | EQUITY CORE FUND |
At the end of the first fiscal quarter, the portfolio emphasized the consumer discretionary, materials, and utilities sectors and underweighted information technology, financial and telecommunications stocks. The underweight of financial stocks resulted from concerns about rising interest rates. In terms of performance, holdings in department stores, pharmaceuticals, and energy were positive while an auto parts retailer, a cable provider, and an Internet networking and storage firm suffered the largest absolute declines. During the second fiscal quarter, the Fund prospered by owning a number of restructuring companies, including a large maker of digital imaging equipment and film, as well as three energy-related companies. On the other hand, holdings in auto parts retailers and networking and storage solutions firms hampered performance. The Fund advanced in the third fiscal quarter as investors became convinced of the viability and strength of the U.S. economic recovery, and the presidential election was resolved in favor of the Bush administration. The same restructuring companies that helped power returns in the previous quarter continued to perform well, and our pro-growth holdings structure allowed us to capitalize on the market’s forceful gains in the quarter. The Fund also continued to benefit from our holding of Florida’s single biggest land company, which beat earnings guidance in the third calendar quarter and reaffirmed guidance for 2004. On the negative side, we suffered from the big-pharmaceutical backlash triggered by drug recalls. In the reporting period’s final fiscal quarter, a lackluster and trading range market environment, the two best performing sectors within the portfolio were utilities and energy. The latter sector (which also turned in the strongest performance in 2004) was supported by consistently high oil prices and the resultant surge in profits. The consumer stocks in the portfolio held up well in a generally weak group. The portfolio’s healthcare stocks outperformed, helped in part by its emphasis away from the large pharmaceutical companies. The financial stocks showed weakness with concerns over rising interest rates; however, the portfolio’s financial stocks performed well on a relative basis, helped by our underweighting of commercial banks. Our underweighting in technology also aided performance.
13
Excelsior Funds, Inc.
Portfolio of Investments — March 31, 2005
Money Fund
| | | | | | | | |
Principal
| | | | Rate
| | | Value
|
| | | | | | | | | |
BANK NOTES — 4.05% | | | | | | |
| $70,000,000 | | Bank of America, 05/17/05 | | 2.75 | % | | $ | 70,000,000 |
| | | | | | | |
|
|
| | | TOTAL BANK NOTES
(Cost $70,000,000) | | | | 70,000,000 |
| | | | | | | |
|
|
CERTIFICATES OF DEPOSIT — 23.12% | | | | | | |
| 50,000,000 | | Barclay Bank, 06/30/05 | | 3.02 | | | | 50,000,000 |
| 75,000,000 | | BNP Paribas, 04/06/05 | | 2.78 | | | | 75,000,000 |
| 75,000,000 | | First Tennessee Bank, 05/03/05 | | 2.80 | | | | 74,999,899 |
| 50,000,000 | | HSBC, 05/09/05 | | 2.71 | | | | 50,001,048 |
| 75,000,000 | | Washington Mutual Corp., 05/03/05 | | 2.81 | | | | 75,000,000 |
| 75,000,000 | | Wells Fargo Co., 05/06/05 | | 2.80 | | | | 75,000,000 |
| | | | | | | |
|
|
| | | TOTAL CERTIFICATES OF DEPOSIT
(Cost $400,000,947) | | | | 400,000,947 |
| | | | | | | |
|
|
COMMERCIAL PAPER — 34.06% | | | | | | |
| 50,000,000 | | Allied Irish Bank, Discount Note, 05/05/05 | | 2.70 | | | | 49,872,500 |
| 75,000,000 | | American Express Credit Corp., Discount Note, 04/01/05 | | 2.58 | | | | 75,000,000 |
| 15,000,000 | | Dupont, Discount Note, 04/01/05 | | 2.83 | | | | 15,000,000 |
| 75,000,000 | | General Electric Capital Corp., Discount Note, 04/01/05 | | 2.75 | | | | 75,000,000 |
| 50,000,000 | | HBOS Treasury Services plc, Discount Note, 05/09/05 | | 2.69 | | | | 49,858,028 |
| 50,000,000 | | International Lease Finance, Discount Note, 05/09/05 | | 2.81 | | | | 49,851,694 |
| 75,000,000 | | New Center Asset Trust, Discount Note, 05/04/05 | | 2.85 | | | | 74,804,063 |
| 75,000,000 | | Prudential Funding, Discount Note, 04/01/05 | | 2.82 | | | | 75,000,000 |
| 75,000,000 | | SLM Corp., Discount Note, 04/06/05(a) | | 2.76 | | | | 74,971,250 |
| 50,000,000 | | UBS Finance Corp., Discount Note, 04/01/05 | | 2.58 | | | | 50,000,000 |
| | | | | | | |
|
|
| | | TOTAL COMMERCIAL PAPER
(Cost $589,357,535) | | | | 589,357,535 |
| | | | | | | |
|
|
| | | | | | | | |
Principal
| | | | Rate
| | | Value
|
| | | | | | | | | |
U.S. GOVERNMENT & AGENCY OBLIGATIONS — 26.87% |
| $265,000,000 | | Federal Home Loan Bank, Discount Note, 04/01/05 | | 2.58 | % | | $ | 265,000,000 |
| 200,000,000 | | Federal National Mortgage Association, Discount Note, 04/01/05 | | 2.50 | | | | 200,000,000 |
| | | | | | | |
|
|
| | | TOTAL U.S. GOVERNMENT & AGENCY OBLIGATIONS
(Cost $465,000,000) | | | | 465,000,000 |
| | | | | | | |
|
|
| | | |
Shares
| | | | | | | |
REGISTERED INVESTMENT COMPANY — 0.00% |
| 36,433 | | Dreyfus Government Cash Management Fund | | | | | | 36,433 |
| | | | | | | |
|
|
| | | TOTAL REGISTERED INVESTMENT COMPANY
(Cost $36,433) | | | | 36,433 |
| | | | | | | |
|
|
| | | |
Principal
| | | | | | | |
REPURCHASE AGREEMENT — 4.17% | | | | | | |
| $72,200,000 | | Morgan Stanley Dean Witter
2.82%, dated 3/31/05, due 4/1/05, to be repurchased at $72,205,656 (collateralized by U.S. Government obligations ranging in par value $75,000-$31,290,000, 0.00%-6.88%, 4/21/05-9/15/10; total market value $73,920.184) | | | | 72,200,000 |
| | | | | | | |
|
|
| | | TOTAL REPURCHASE AGREEMENT
(Cost $72,200,000) | | | | 72,200,000 |
| | | | | | | |
|
|
| | | | | | |
TOTAL INVESTMENTS
(Cost $1,596,594,915) | | 92.27 | % | | $ | 1,596,594,915 |
OTHER ASSETS IN EXCESS OF LIABILITIES | | 7.73 | | | | 133,745,500 |
| | |
|
| |
|
|
NET ASSETS | | 100.00 | % | | $ | 1,730,340,415 |
| | |
|
| |
|
|
| (a) | Security exempt from registration under Rule 144A of the Securities Act of 1933. This security may be resold in transactions exempt from registration, normally to qualified institutional buyers. At March 31, 2005, these securities amounted to $74,971,250 or 4.33% of net assets. |
Discount Note—The rate reported is the discount rate at the time of purchase.
plc—public liability company
See Notes to Financial Statements.
14
Excelsior Funds, Inc.
Portfolio of Investments — March 31, 2005
Money Fund — (continued)
The summary of the Fund’s investments as of March 31, 2005 is as follows: (Unaudited)
| | | | | | |
Portfolio Diversification
| | % of
Net
Assets
| | | Value
|
Commercial Paper | | 34.06 | % | | $ | 589,357,535 |
U.S. Government Agency and Mortgage Obligations | | 26.87 | | | | 465,000,000 |
Certificates of Deposit | | 23.12 | | | | 400,000,947 |
Repurchase Agreement | | 4.17 | | | | 72,200,000 |
Bank Notes | | 4.05 | | | | 70,000,000 |
Registered Investment Company | | — | | | | 36,433 |
| | |
|
| |
|
|
Total Investments | | 92.27 | % | | $ | 1,596,594,915 |
Other Assets and Liabilities (Net) | | 7.73 | | | | 133,745,500 |
| | |
|
| |
|
|
Net Assets | | 100.00 | % | | $ | 1,730,340,415 |
| | |
|
| |
|
|
See Notes to Financial Statements.
15
Excelsior Funds, Inc.
Portfolio of Investments — March 31, 2005
Value and Restructuring Fund
| | | | | |
Shares
| | | | Value
|
| | | | | | |
| COMMON STOCKS — 95.06% | | |
| | | CONSUMER DISCRETIONARY — 20.83% |
| 1,750,000 | | Avon Products, Inc. | | $ | 75,145,000 |
| 1,800,000 | | Black & Decker Corp. | | | 142,182,000 |
| 2,450,000 | | Centex Corp. | | | 140,311,500 |
| 1,011,388 | | Harman International | | | 89,467,382 |
| 3,650,000 | | Interpublic Group of Companies, Inc.(a) | | | 44,822,000 |
| 1,700,000 | | Journal Communications, Inc., Class A | | | 28,135,000 |
| 3,700,000 | | Liberty Media Corp., Class A(a) | | | 38,369,000 |
| 2,000,000 | | Loews Corp. — Carolina Group | | | 66,200,000 |
| 2,250,000 | | Newell Rubbermaid, Inc. | | | 49,365,000 |
| 2,100,000 | | TJX Cos., Inc. | | | 51,723,000 |
| 5,600,000 | | XM Satellite Radio Holdings, Inc., Class A(a) | | | 176,400,001 |
| 2,075,000 | | Zale Corp.(a) | | | 61,669,000 |
| | | | |
|
|
| | | | | | 963,788,883 |
| | | | |
|
|
| | | CONSUMER STAPLES — 4.32% |
| 1,850,000 | | ConAgra Foods, Inc. | | | 49,987,000 |
| 2,425,000 | | Dean Foods Co.(a) | | | 83,177,500 |
| 1,575,000 | | Kraft Foods, Inc., Class A | | | 52,053,750 |
| 1,500,000 | | Vintage Wine Trust, Inc.(a)(b) | | | 15,000,000 |
| | | | |
|
|
| | | | | | 200,218,250 |
| | | | |
|
|
| | | ENERGY — 12.97% | | | |
| 200,000 | | Alpha Natural Resources, Inc.(a) | | | 5,734,000 |
| 2,100,000 | | Burlington Resources, Inc.(c) | | | 105,147,000 |
| 625,000 | | ConocoPhillips | | | 67,400,000 |
| 2,050,000 | | Consol Energy, Inc. | | | 96,391,000 |
| 2,225,000 | | Devon Energy Corp.(c) | | | 106,243,750 |
| 1,200,000 | | Mariner Energy, Inc.(a)(b) | | | 16,800,000 |
| 950,000 | | Noble Energy, Inc. | | | 64,619,000 |
| 1,650,000 | | Petrobras ADR | | | 72,897,000 |
| 1,650,000 | | Todco, Class A(a) | | | 42,636,000 |
| 1,100,000 | | W&T Offshore, Inc.(a) | | | 22,836,000 |
| | | | |
|
|
| | | | | | 600,703,750 |
| | | | |
|
|
| | | FINANCIAL — 16.84% | | | |
| 1,450,000 | | Ace Ltd. | | | 59,841,500 |
| 2,486,200 | | Amvescap plc ADR | | | 31,525,016 |
| 1,650,000 | | Apollo Investment Corp.(d) | | | 27,687,000 |
| 725,000 | | CIT Group, Inc. | | | 27,550,000 |
| 1,625,000 | | Citigroup, Inc. | | | 73,027,500 |
| 1,000,000 | | Freddie Mac | | | 63,200,000 |
| 1,825,000 | | JP Morgan Chase & Co. | | | 63,145,000 |
| | | | | |
Shares
| | | | Value
|
| | | | | | |
| COMMON STOCKS — (continued) | | |
| | | FINANCIAL — (continued) | | | |
| 675,000 | | Lehman Brothers Holding, Inc. | | $ | 63,558,000 |
| 700,000 | | Loews Corp. | | | 51,478,000 |
| 2,400,000 | | MCG Capital Corp. | | | 36,924,000 |
| 1,300,000 | | Metlife, Inc. | | | 50,830,000 |
| 1,500,000 | | MoneyGram International, Inc. | | | 28,335,000 |
| 1,325,000 | | Morgan Stanley | | | 75,856,250 |
| 800,000 | | PNC Financial Services Group, Inc. | | | 41,184,000 |
| 2,100,000 | | Primus Guaranty Ltd.(a) | | | 27,363,000 |
| 650,000 | | Washington Mutual, Inc. | | | 25,675,000 |
| 450,000 | | XL Capital Ltd., Class A | | | 32,566,500 |
| | | | |
|
|
| | | | | | 779,745,766 |
| | | | |
|
|
| | | HEALTH CARE — 3.85% | | | |
| 860,000 | | AmerisourceBergen Corp. | | | 49,269,400 |
| 525,000 | | Baxter International, Inc. | | | 17,839,500 |
| 900,000 | | Bristol-Myers Squibb Co. | | | 22,914,000 |
| 1,175,000 | | HCA, Inc. | | | 62,944,750 |
| 600,000 | | Wyeth | | | 25,308,000 |
| | | | |
|
|
| | | | | | 178,275,650 |
| | | | |
|
|
| | | INDUSTRIALS — 12.89% | | | |
| 1,850,000 | | AGCO Corp.(a) | | | 33,762,500 |
| 700,000 | | Arlington Tankers | | | 16,450,000 |
| 2,875,000 | | Cendant Corp. | | | 59,052,500 |
| 1,350,000 | | Deluxe Corp. | | | 53,811,000 |
| 120,200 | | Dolby Laboratories, Inc.,
Class A(a) | | | 2,824,700 |
| 1,775,000 | | Empresa Brasileira de Aeronautica S.A. ADR | | | 55,557,500 |
| 1,150,000 | | Gol Linhas Aereas Inteligentes S.A. ADR(a) | | | 28,899,500 |
| 1,425,000 | | Overnite Corp. | | | 45,585,750 |
| 1,100,000 | | Ryder Systems, Inc. | | | 45,870,000 |
| 1,650,000 | | Tyco International Ltd. | | | 55,770,000 |
| 1,100,000 | | Union Pacific Corp. | | | 76,670,000 |
| 3,300,000 | | United Rentals, Inc.(a) | | | 66,693,000 |
| 550,000 | | United Technologies Corp. | | | 55,913,000 |
| | | | |
|
|
| | | | | | 596,859,450 |
| | | | |
|
|
| | | INFORMATION TECHNOLOGY — 5.61% |
| 1,970 | | Computer Associates
International, Inc. | | | 53,387 |
| 3,400,000 | | Harris Corp. | | | 111,010,000 |
| 2,575,000 | | Nokia Oyj ADR | | | 39,732,250 |
See Notes to Financial Statements.
16
Excelsior Funds, Inc.
Portfolio of Investments — March 31, 2005
Value and Restructuring Fund — (continued)
| | | | | |
Shares
| | | | Value
|
| | | | | | |
| COMMON STOCKS — (continued) | | |
| | | INFORMATION TECHNOLOGY — (continued) |
| 1,300,000 | | Plantronics, Inc. | | $ | 49,504,000 |
| 1,200,000 | | Texas Instruments, Inc.(c) | | | 30,588,000 |
| 2,325,000 | | Vishay Intertechnology, Inc.(a) | | | 28,899,750 |
| | | | |
|
|
| | | | | | 259,787,387 |
| | | | |
|
|
| | | RAW/INTERMEDIATE MATERIALS — 7.00% |
| 550,000 | | Cambrex Corp. | | | 11,715,000 |
| 2,450,000 | | Celanese Corp., Class A(a) | | | 44,075,500 |
| 400,000 | | Eagle Materials, Inc., Class B | | | 31,520,000 |
| 1,300,000 | | Foundation Coal Holdings, Inc. | | | 30,563,000 |
| 1,775,000 | | Georgia-Pacific Corp. | | | 62,994,750 |
| 1,200,000 | | Lafarge Corp. | | | 70,140,000 |
| 1,025,000 | | PPG Industries, Inc. | | | 73,308,000 |
| | | | |
|
|
| | | | | | 324,316,250 |
| | | | |
|
|
| | | REAL ESTATE — 4.19% | | | |
| 1,150,000 | | Capital Lease Funding, Inc. | | | 12,707,500 |
| 1,920,000 | | Diamondrock Hospitality Co.(a)(b) | | | 20,448,000 |
| 1,875,000 | | Fieldstone Investment Corp.(b) | | | 27,225,000 |
| 2,275,000 | | Friedman Billings Ramsey Group, Inc., Class A | | | 36,104,250 |
| 1,450,000 | | Host Marriott Corp. | | | 24,012,000 |
| 1,300,000 | | Luminent Mortgage Capital, Inc. | | | 14,274,000 |
| 1,000,000 | | Peoples Choice Financial Corp.(a)(b) | | | 10,000,000 |
| 135,000 | �� | PHH Corp.(a) | | | 2,952,450 |
| 1,600,000 | | Provident Senior Living Trust(b) | | | 25,840,000 |
| 1,200,000 | | Saxon Capital, Inc. | | | 20,640,000 |
| | | | |
|
|
| | | | | | 194,203,200 |
| | | | |
|
|
| | | TELECOMMUNICATION — 4.33% |
| 1,625,000 | | America Movil S.A. de C.V.,
Series L ADR | | | 83,850,000 |
| 1,325,000 | | EchoStar Communications, Inc., Class A | | | 38,756,250 |
| 788,300 | | Iowa Telecommunications Services, Inc. | | | 15,371,850 |
| 1,900,000 | | Nextel Communications, Inc., Class A(a) | | | 53,998,000 |
| 575,400 | | Valor Communications, Inc. | | | 8,326,038 |
| | | | |
|
|
| | | | | | 200,302,138 |
| | | | |
|
|
| | | | | |
Shares
| | | | Value
|
| | | | | | |
| COMMON STOCKS — (continued) | | |
| | | UTILITIES — 2.23% | | | |
| 8,000,000 | | Calpine Corp.(a) | | $ | 22,400,000 |
| 1,350,000 | | Centerpoint Energy, Inc. | | | 16,240,500 |
| 1,050,000 | | Duke Energy Corp. | | | 29,410,500 |
| 649,275 | | Public Service Enterprise
Group, Inc. | | | 35,314,067 |
| | | | |
|
|
| | | | | | 103,365,067 |
| | | | |
|
|
| | | TOTAL COMMON STOCKS
(Cost $3,195,937,037) | | | 4,401,565,791 |
| | | | |
|
|
| FOREIGN COMMON STOCKS — 1.39% | | |
| | | ITALY — 0.94% | | | |
| 4,570,000 | | Enel S.p.A | | | 43,724,120 |
| | | | |
|
|
| | | UNITED KINGDOM — 0.45% |
| 1,200,000 | | Severn Trent plc | | | 20,744,379 |
| | | | |
|
|
| | | TOTAL FOREIGN
COMMON STOCKS
(Cost $45,124,797) | | | 64,468,499 |
| | | | |
|
|
| CONVERTIBLE PREFERRED STOCKS — 2.43% |
| | | CONSUMER DISCRETIONARY — 1.03% |
| 931,400 | | Adelphia Communications, Preferred Exchange, 7.50%, In Default | | | 186,280 |
| 1,050,000 | | Ford Motor Co. Capital Trust II, Preferred Exchange, 6.50% | | | 47,607,000 |
| | | | |
|
|
| | | | | | 47,793,280 |
| | | | |
|
|
| | | FINANCIAL — 0.21% | | | |
| 300,000 | | Genworth Financial, Inc., Preferred Exchange, 6.00% | | | 9,630,000 |
| | | | |
|
|
| | | HEALTH CARE — 1.10% | | | |
| 942,400 | | Baxter International, Inc., Preferred Exchange, 7.00% | | | 50,748,240 |
| | | | |
|
|
| | | RAW/INTERMEDIATE MATERIALS — 0.09% |
| 150,000 | | Celanese Corp., Preferred Exchange, 4.25% | | | 4,162,500 |
| | | | |
|
|
| | | TOTAL CONVERTIBLE PREFERRED STOCKS
(Cost $120,528,219) | | | 112,334,020 |
| | | | |
|
|
See Notes to Financial Statements.
17
Excelsior Funds, Inc.
Portfolio of Investments — March 31, 2005
Value and Restructuring Fund — (continued)
| | | | | |
Principal
| | | | Value
|
| | | | | | |
| REPURCHASE AGREEMENT — 1.06% |
| $49,122,000 | | JP Morgan Chase Securities, Inc., 2.30%, dated 3/31/05, to be repurchased 4/01/05, repurchase price $49,125,138 (collateralized by Federal National Mortgage Association MTN, par value $49,061,000, 4.63%, maturing 10/15/14; total market value $50,168,130) | | $ | 49,122,000 |
| | | | |
|
|
| | | TOTAL REPURCHASE AGREEMENT
(Cost $49,122,000) | | | 49,122,000 |
| | | | |
|
|
| | | | | | |
TOTAL INVESTMENTS
(Cost $3,410,712,053)(e) | | 99.94 | % | | $ | 4,627,490,310 |
OTHER ASSETS IN EXCESS OF LIABILITIES | | 0.06 | | | | 2,601,616 |
| | |
|
| |
|
|
NET ASSETS | | 100.00 | % | | $ | 4,630,091,926 |
| | |
|
| |
|
|
| (a) | Non-income producing security. |
| (b) | Security, or part of security, exempt from registration under Rule 144A of the Securities Act of 1933. This security may be resold in transactions exempt from registration, normally to qualified institutional buyers. At March 31, 2005, these securities amounted to $107,471,000 or 2.32% of net assets. |
| (c) | All or part of the security is held as collateral. |
| (d) | Registered Investment Company |
| (e) | Unrealized appreciation (depreciation) of securities: |
| | | | |
Unrealized
Appreciation
| | Unrealized
(Depreciation)
| | Net Unrealized
Appreciation/
(Depreciation)
|
$1,399,947,607 | | $(183,169,350) | | $1,216,778,257 |
ADR—American Depository Receipt
In Default—Security in default on income payments.
MTN—Medium Term Note
plc—public limited company
| | | | | | |
Contracts
| | | | Value
| |
| CALL OPTIONS WRITTEN: (0.04)% | | | |
| (12,000) | | Texas Instruments, Expires
7/19/05, strike price 30 | | $ | (360,000 | ) |
| (3,828) | | Devon Energy, Expires
7/19/05, strike price 50 | | | (918,720 | ) |
| (672) | | Devon Energy, Expires
7/19/05, strike price 55 | | | (67,200 | ) |
| (3,500) | | Burlington Resources, Expires
8/23/05, strike price 55 | | | (647,500 | ) |
| | | | |
|
|
|
| | | TOTAL CALL OPTIONS WRITTEN
(Premiums received $2,633,972) | | $ | (1,993,420 | ) |
| | | | |
|
|
|
See Notes to Financial Statements.
18
Excelsior Funds, Inc.
Portfolio of Investments — March 31, 2005
Value and Restructuring Fund — (continued)
The summary of the Fund’s investments as of March 31, 2005 is as follows: (Unaudited)
| | | | | | | |
Sector Diversification
| | % of
Net
Assets
| | | Market Value
| |
Consumer Discretionary | | 21.86 | % | | $ | 1,011,582,163 | |
Financial | | 17.05 | | | | 789,375,766 | |
Energy | | 12.97 | | | | 600,703,750 | |
Industrials | | 12.89 | | | | 596,859,450 | |
Raw/Intermediate Materials | | 7.09 | | | | 328,478,750 | |
Information Technology | | 5.61 | | | | 259,787,387 | |
Health Care | | 4.95 | | | | 229,023,890 | |
Telecommunication | | 4.33 | | | | 200,302,138 | |
Consumer Staples | | 4.32 | | | | 200,218,250 | |
Real Estate | | 4.19 | | | | 194,203,200 | |
Utilities | | 3.62 | | | | 167,833,566 | |
Repurchase Agreements | | 1.06 | | | | 49,122,000 | |
| | |
|
| |
|
|
|
Total Investment | | 99.94 | % | | $ | 4,627,490,310 | |
Call Options Written | | (0.04 | ) | | | (1,993,420 | ) |
Other Assets and Liabilities (Net) | | 0.10 | | | | 4,595,036 | |
| | |
|
| |
|
|
|
Net Assets | | 100.00 | % | | $ | 4,630,091,926 | |
| | |
|
| |
|
|
|
See Notes to Financial Statements.
19
Excelsior Funds Trust
Portfolio of Investments — March 31, 2005
Mid Cap Value Fund
| | | | | |
Shares
| | | | Value
|
| | | | | | |
| COMMON STOCKS — 97.99% | | |
| | | CONSUMER DISCRETIONARY — 28.51% |
| 85,900 | | Autozone, Inc.(a) | | $ | 7,361,630 |
| 90,400 | | Best Buy Co., Inc. | | | 4,882,504 |
| 126,600 | | Black & Decker Corp. | | | 10,000,133 |
| 562,200 | | Blockbuster, Inc., Class A | | | 4,964,226 |
| 217,000 | | Brink’s Co. | | | 7,508,200 |
| 452,000 | | Callaway Golf Co. | | | 5,785,600 |
| 85,000 | | Centex Corp. | | | 4,867,950 |
| 375,000 | | Interpublic Group of Companies, Inc.(a) | | | 4,605,000 |
| 270,000 | | Limited Brands | | | 6,561,000 |
| 264,300 | | Newell Rubbermaid, Inc. | | | 5,798,742 |
| 149,200 | | Officemax, Inc. | | | 4,998,200 |
| 135,600 | | Sherwin-Williams Co. | | | 5,965,044 |
| 203,400 | | TJX Cos., Inc. | | | 5,009,742 |
| 208,000 | | Zale Corp.(a) | | | 6,181,760 |
| | | | |
|
|
| | | | | | 84,489,731 |
| | | | |
|
|
| | | CONSUMER STAPLES — 2.37% |
| 205,000 | | Dean Foods Co.(a) | | | 7,031,500 |
| | | | |
|
|
| | | ENERGY — 9.23% |
| 217,000 | | Devon Energy Corp. | | | 10,361,750 |
| 153,700 | | Noble Corp. | | | 8,639,477 |
| 117,600 | | Occidental Petroleum Corp. | | | 8,369,592 |
| | | | |
|
|
| | | | | | 27,370,819 |
| | | | |
|
|
| | | FINANCIAL — 13.02% |
| 167,300 | | Ace Ltd. | | | 6,904,471 |
| 189,900 | | CIT Group, Inc. | | | 7,216,200 |
| 904,000 | | Instinet Group, Inc.(a) | | | 5,315,520 |
| 72,400 | | Lehman Brothers Holding, Inc. | | | 6,817,184 |
| 122,100 | | RenaissanceRe Holdings Ltd. | | | 5,702,070 |
| 298,400 | | Sovereign Bancorp, Inc. | | | 6,612,544 |
| | | | |
|
|
| | | | | | 38,567,989 |
| | | | |
|
|
| | | HEALTH CARE — 5.09% |
| 316,400 | | Health Management Associates, Inc., Class A | | | 8,283,352 |
| 198,900 | | Shire Pharmaceuticals plc ADR | | | 6,818,292 |
| | | | |
|
|
| | | | | | 15,101,644 |
| | | | |
|
|
| | | INDUSTRIALS — 13.00% |
| 227,000 | | Empresa Brasileira de Aeronautica S.A. ADR | | | 7,105,100 |
| 153,700 | | Lincoln Electric Holdings, Inc. | | | 4,623,296 |
| | | | | |
Shares
| | | | Value
|
| | | | | | |
| COMMON STOCKS — (continued) | | |
| | | INDUSTRIALS — (continued) |
| 194,400 | | Mueller Industries, Inc. | | $ | 5,472,360 |
| 379,700 | | Onex Corp. | | | 6,199,742 |
| 406,800 | | United Rentals, Inc.(a) | | | 8,221,428 |
| 176,300 | | York International Corp. | | | 6,907,434 |
| | | | |
|
|
| | | | | | 38,529,360 |
| | | | |
|
|
| | | INFORMATION TECHNOLOGY — 11.39% |
| 280,000 | | Avaya, Inc.(a) | | | 3,270,400 |
| 200,000 | | Cabot Microelectronics Corp.(a) | | | 6,276,000 |
| 245,000 | | Electronic Data Systems Corp. | | | 5,064,150 |
| 280,400 | | Harris Corp. | | | 9,155,060 |
| 365,000 | | Symbol Technologies, Inc. | | | 5,288,850 |
| 379,700 | | Vishay Intertechnology, Inc.(a) | | | 4,719,671 |
| | | | |
|
|
| | | | | | 33,774,131 |
| | | | |
|
|
| | | RAW/INTERMEDIATE MATERIALS — 5.04% |
| 228,800 | | Aracruz Cellulose S.A. ADR | | | 8,191,040 |
| 189,900 | | Georgia-Pacific Corp. | | | 6,739,551 |
| | | | |
|
|
| | | | | | 14,930,591 |
| | | | |
|
|
| | | REAL ESTATE — 4.62% |
| 325,500 | | Friedman Billings Ramsey Group, Inc., Class A | | | 5,165,685 |
| 126,600 | | St. Joe Co. | | | 8,520,180 |
| | | | |
|
|
| | | | | | 13,685,865 |
| | | | |
|
|
| | | UTILITIES — 5.72% |
| 1,988,800 | | Calpine Corp.(a) | | | 5,568,640 |
| 200,000 | | Centerpoint Energy, Inc. | | | 2,406,000 |
| 406,800 | | EL Paso Corp. | | | 4,303,944 |
| 248,600 | | Williams Cos., Inc. | | | 4,676,166 |
| | | | |
|
|
| | | | | | 16,954,750 |
| | | | |
|
|
| | | TOTAL COMMON STOCKS
(Cost $218,138,324) | | | 290,436,380 |
| | | | |
|
|
| FOREIGN COMMON STOCKS — 1.69% | | |
| | | NETHERLANDS — 1.69% |
| 99,500 | | Hunter Douglas NV | | | 5,015,311 |
| | | | |
|
|
| | | TOTAL FOREIGN
COMMON STOCKS
(Cost $3,662,399) | | | 5,015,311 |
| | | | |
|
|
See Notes to Financial Statements.
20
Excelsior Funds Trust
Portfolio of Investments — March 31, 2005
Mid Cap Value Fund — (continued)
| | | | | |
Principal
| | | | Value
|
| | | | | | |
| REPURCHASE AGREEMENT — 0.19% | | |
| $573,000 | | JP Morgan Chase Securities, Inc., 2.30%, dated 3/31/05, to be repurchased 4/01/05, repurchase price $573,037 (collateralized by Federal National Mortgage Association MTN, par value
$572,000, 4.63%, maturing
10/15/14; total market value $585,200) | | $ | 573,000 |
| | | | |
|
|
| | | TOTAL REPURCHASE
AGREEMENT
(Cost $573,000) | | | 573,000 |
| | | | |
|
|
| | | | | | |
| | | | | | Value
|
TOTAL INVESTMENTS
(Cost $222,373,723)(b) | | 99.87 | % | | $ | 296,024,691 |
OTHER ASSETS IN EXCESS OF LIABILITIES | | 0.13 | | | | 390,997 |
| | |
|
| |
|
|
NET ASSETS | | 100.00 | % | | $ | 296,415,688 |
| | |
|
| |
|
|
| (a) | Non-income producing security. |
| (b) | Unrealized appreciation (depreciation) of securities: |
| | | | |
Unrealized
Appreciation
| | Unrealized
(Depreciation)
| | Net Unrealized
Appreciation/
(Depreciation)
|
| $82,748,653 | | $(9,097,685) | | $73,650,968 |
ADR—American Depository Receipt
MTN—Medium Term Note
plc—public limited company
The summary of the Fund’s investments as of March 31, 2005 is as follows: (Unaudited)
| | | | | | |
Sector Diversification
| | % of
Net
Assets
| | | Market Value
|
Consumer Discretionary | | 30.20 | % | | $ | 89,505,042 |
Financial | | 13.02 | | | | 38,567,989 |
Industrials | | 13.00 | | | | 38,529,360 |
Information Technology | | 11.39 | | | | 33,774,131 |
Energy | | 9.23 | | | | 27,370,819 |
Utilities | | 5.72 | | | | 16,954,750 |
Health Care | | 5.09 | | | | 15,101,644 |
Raw/Intermediate Materials | | 5.04 | | | | 14,930,591 |
Real Estate | | 4.62 | | | | 13,685,865 |
Consumer Staples | | 2.37 | | | | 7,031,500 |
Repurchase Agreements | | 0.19 | | | | 573,000 |
| | |
|
| |
|
|
Total Investment | | 99.87 | % | | $ | 296,024,691 |
Other Assets and Liabilities (Net) | | 0.13 | | | | 390,997 |
| | |
|
| |
|
|
Net Assets | | 100.00 | % | | $ | 296,415,688 |
| | |
|
| |
|
|
See Notes to Financial Statements.
21
Excelsior Funds Trust
Portfolio of Investments — March 31, 2005
International Equity Fund
| | | | | |
Shares
| | | | Value
|
| | | | | | |
| COMMON STOCKS — 96.64% | | |
| | | AUSTRALIA — 0.99% | | | |
| 12,275 | | Rio Tinto, Ltd. | | $ | 428,351 |
| | | | |
|
|
| | | BELGIUM — 3.59% | | | |
| 19,100 | | Dexia | | | 454,379 |
| 19,200 | | Fortis S.A. | | | 547,114 |
| 5,500 | | Umicore | | | 558,306 |
| | | | |
|
|
| | | | | | 1,559,799 |
| | | | |
|
|
| | | CANADA — 1.13% | | | |
| 12,155 | | Suncor Energy, Inc. | | | 489,434 |
| | | | |
|
|
| | | CHINA — 3.31% | | | |
| 411,700 | | Cafe de Coral Holdings, Ltd. (Hong Kong) | | | 469,802 |
| 1,096,000 | | Far East Consortium Int'L, Ltd. (Hong Kong)(a) | | | 467,247 |
| 55,000 | | Sun Hung Kai Properties, Ltd. (Hong Kong) | | | 498,923 |
| | | | |
|
|
| | | | | | 1,435,972 |
| | | | |
|
|
| | | FINLAND — 1.02% | | | |
| 22,800 | | Fortum Oyj | | | 443,970 |
| | | | |
|
|
| | | FRANCE — 9.10% | | | |
| 17,300 | | AXA S.A. | | | 460,900 |
| 9,600 | | BNP Paribas S.A. | | | 680,158 |
| 12,400 | | Carrefour S.A. | | | 658,140 |
| 8,100 | | Compagnie Generale de Geophysique S.A. (CGG)(a) | | | 708,822 |
| 8,608 | | Sanofi-Aventis S.A. | | | 725,936 |
| 3,079 | | TotalFinaElf S.A. | | | 720,502 |
| | | | |
|
|
| | | | | | 3,954,458 |
| | | | |
|
|
| | | GERMANY — 6.22% | | | |
| 2,700 | | Adidas-Salomon AG | | | 429,004 |
| 14,700 | | Bayerische Motoren Werke AG | | | 666,822 |
| 8,100 | | Fielmann AG | | | 546,056 |
| 10,400 | | MAN AG | | | 463,810 |
| 47,050 | | SGL Carbon AG(a) | | | 597,770 |
| | | | |
|
|
| | | | | | 2,703,462 |
| | | | |
|
|
| | | GREECE — 0.99% | | | |
| 24,400 | | Hellenic Telecommunication S.A. | | | 430,839 |
| | | | |
|
|
| | | INDIA — 1.21% | | | |
| 13,500 | | State Bank of India GDR(b) | | | 525,825 |
| | | | |
|
|
| | | | | |
Shares
| | | | Value
|
| | | | | | |
| COMMON STOCKS — (continued) | | |
| | | INDONESIA — 1.07% | | | |
| 986,800 | | PT Telekomunikasi Indonesia Tbk | | $ | 466,258 |
| | | | |
|
|
| | | IRELAND — 2.92% | | | |
| 27,501 | | Anglo Irish Bank plc | | | 688,817 |
| 36,600 | | Depfa Bank plc(a) | | | 578,881 |
| | | | |
|
|
| | | | | | 1,267,698 |
| | | | |
|
|
| | | ITALY — 3.87% | | | |
| 177,900 | | Cassa di Risparmio di Firenze S.p.A. (Carifirenze) | | | 458,271 |
| 31,850 | | ENI S.p.A. | | | 827,064 |
| 23,350 | | Permasteelisa S.p.A. | | | 396,558 |
| | | | |
|
|
| | | | | | 1,681,893 |
| | | | |
|
|
| | | JAPAN — 19.64% | | | |
| 13,200 | | Canon, Inc. | | | 707,989 |
| 79,946 | | Chiyoda Corp. | | | 832,981 |
| 7,800 | | Don Quijote Co., Ltd. | | | 457,647 |
| 645 | | eAccess, Ltd. | | | 547,502 |
| 21,600 | | FamilyMart Co., Ltd. | | | 636,687 |
| 8,400 | | FANUC Co., Ltd. | | | 525,759 |
| 6,400 | | Hoya Corp. | | | 704,445 |
| 2,900 | | Keyence Corp. | | | 671,946 |
| 49 | | Millea Holdings, Inc. | | | 713,026 |
| 28,300 | | Mimasu Semiconducotor Industry Co., Ltd. | | | 427,384 |
| 63 | | Mitsubishi Tokyo Financial Group, Inc. | | | 546,523 |
| 98,500 | | Mitsui Osk Lines, Ltd. | | | 633,054 |
| 43,400 | | Nissan Motors Co., Ltd. | | | 444,910 |
| 14,300 | | Takeda Chemical Co., Ltd. | | | 681,619 |
| | | | |
|
|
| | | | | | 8,531,472 |
| | | | |
|
|
| | | MALAYSIA — 0.88% | | | |
| 186,700 | | Public Bank Berhad | | | 380,770 |
| | | | |
|
|
| | | MEXICO — 0.50% | | | |
| 6,025 | | Cemex S.A. de C.V. ADR | | | 218,406 |
| | | | |
|
|
| | | NETHERLANDS — 1.51% | | | |
| 55,700 | | Qiagen NV(a) | | | 657,121 |
| | | | |
|
|
| | | NORWAY — 2.90% | | | |
| 68,500 | | Telenor ASA | | | 616,066 |
| 42,500 | | Yara International ASA(a) | | | 645,432 |
| | | | |
|
|
| | | | | | 1,261,498 |
| | | | |
|
|
See Notes to Financial Statements.
22
Excelsior Funds Trust
Portfolio of Investments — March 31, 2005
International Equity Fund — (continued)
| | | | | |
Shares
| | | | Value
|
| | | | | | |
| COMMON STOCKS — (continued) | | |
| | | SOUTH KOREA — 1.41% | | | |
| 1,240 | | Samsung Electronic Co., Ltd. | | $ | 612,273 |
| | | | |
|
|
| | | SPAIN — 3.68% | | | |
| 6,900 | | Fomento de Construcciones y Contratas S.A. (FCC) | | | 352,715 |
| 25,100 | | Repsol YPF S.A. | | | 664,474 |
| 33,358 | | Telefonica S.A. | | | 581,230 |
| | | | |
|
|
| | | | | | 1,598,419 |
| | | | |
|
|
| | | SWEDEN — 1.45% | | | |
| 14,800 | | Modern Times Group (MTG) AB, Class B(a) | | | 447,889 |
| 43,900 | | Ortivus AB(a) | | | 180,035 |
| | | | |
|
|
| | | | | | 627,924 |
| | | | |
|
|
| | | SWITZERLAND — 4.05% | | | |
| 19 | | Lindt & Spruengli AG | | | 288,240 |
| 8,360 | | Novartis AG | | | 389,910 |
| 4,800 | | Roche Holdings AG | | | 514,343 |
| 6,700 | | UBS AG, Registered Shares | | | 565,613 |
| | | | |
|
|
| | | | | | 1,758,106 |
| | | | |
|
|
| | | TAIWAN — 2.45% | | | |
| 138,000 | | Hon Hai Precision, Inc. | | | 612,847 |
| 53,300 | | Taiwan Semiconductor
Manufacturing Co, Ltd. ADR | | | 451,984 |
| | | | |
|
|
| | | | | | 1,064,831 |
| | | | |
|
|
| | | THAILAND — 0.98% | | | |
| 63,300 | | Siam Cement Public Co., Ltd.
(Foreign Shares) | | | 426,469 |
| | | | |
|
|
| | | UNITED KINGDOM — 21.77% | | | |
| 32,700 | | Alliance Unichem plc | | | 477,866 |
| 97,336 | | BAE Systems plc | | | 477,209 |
| 65,800 | | BG Group | | | 511,246 |
| 67,300 | | Cadbury Schweppes plc | | | 674,526 |
| 63,600 | | Davis Service Group plc | | | 525,094 |
| 28,762 | | GlaxoSmithKline plc | | | 659,140 |
| 49,300 | | Lloyds TSB Group | | | 445,218 |
| 52,500 | | Paragon Group plc | | | 396,750 |
| 14,280 | | Reckitt Benckiser plc | | | 453,787 |
| 21,411 | | Royal Bank of Scotland Group plc | | | 681,204 |
| 180,100 | | Sage Group plc (The) | | | 684,775 |
| | | | | |
Shares
| | | | Value
|
| | | | | |
| COMMON STOCKS — (continued) | | |
| | | UNITED KINGDOM — (continued) | | | |
| 151,263 | | Serco Group plc | | $ | 698,016 |
| 62,000 | | Shire Pharmaceuticals Group plc | | | 708,087 |
| 66,410 | | Stolt Offshore S.A.(a) | | | 512,394 |
| 18,600 | | SurfControl plc(a) | | | 220,508 |
| 248,855 | | Vodafone Group plc | | | 660,573 |
| 179,554 | | William Morrison Supermarkets plc | | | 664,889 |
| | | �� | |
|
|
| | | | | | 9,451,282 |
| | | | |
|
|
| | | TOTAL COMMON STOCKS
(Cost $34,044,810) | | | 41,976,530 |
| | | | |
|
|
| PREFERRED STOCKS — 2.26% | | |
| | | GERMANY — 1.15% | | | |
| 8,100 | | Rhoen-Klinikum AG | | | 499,851 |
| | | | |
|
|
| | | SOUTH KOREA — 1.11% | | | |
| 13,800 | | Hyundai Motor Co., Ltd. | | | 483,225 |
| | | | |
|
|
| | | TOTAL PREFERRED STOCKS
(Cost $604,505) | | | 983,076 |
| | | | |
|
|
| | | | | | |
TOTAL INVESTMENTS
(Cost $34,649,315)(c) | | 98.90 | % | | $ | 42,959,606 |
OTHER ASSETS IN EXCESS OF LIABILITIES | | 1.10 | | | | 479,800 |
| | |
|
| |
|
|
NET ASSETS | | 100.00 | % | | $ | 43,439,406 |
| | |
|
| |
|
|
| (a) | Non-income producing security. |
| (b) | Security exempt from registration under Rule 144A of the Securities Act of 1933. This security may be resold in transactions exempt from registration, normally to qualified institutional buyers. At March 31, 2005, these securities amounted to $525,825 or 1.21% of net assets. |
| (c) | Unrealized appreciation (depreciation) of securities: |
| | | | |
Unrealized
Appreciation
| | Unrealized
(Depreciation)
| | Net Unrealized
Appreciation/
(Depreciation)
|
$9,075,472 | | $(765,181) | | $8,310,291 |
ADR—American Depository Receipt
GDR—Global Depository Receipt
Ltd.—Limited
plc—Public limited company
See Notes to Financial Statements.
23
Excelsior Funds Trust
Portfolio of Investments — March 31, 2005
International Equity Fund — (continued)
The summary of the Fund’s investments as of March 31, 2005 is as follows: (Unaudited)
| | | | | | |
Sector Diversification
| | % of
Net
Assets
| | | Market Value
|
Financial | | 18.70 | % | | $ | 8,123,450 |
Industrials | | 14.33 | | | | 6,224,028 |
Consumer Discretionary | | 12.20 | | | | 5,286,485 |
Health Care | | 11.08 | | | | 4,812,288 |
Energy | | 10.20 | | | | 4,433,936 |
Consumer Staples | | 9.12 | | | | 3,962,691 |
Telecommunication | | 6.34 | | | | 2,754,965 |
Technology | | 5.22 | | | | 2,268,977 |
Raw/Intermediate Materials | | 5.13 | | | | 2,229,861 |
Information Technology | | 3.34 | | | | 1,452,785 |
Real Estate | | 2.22 | | | | 966,170 |
Utilities | | 1.02 | | | | 443,970 |
| | |
|
| |
|
|
Total Investment | | 98.90 | % | | $ | 42,959,606 |
Other Assets and Liabilities (Net) | | 1.10 | | | | 479,800 |
| | |
|
| |
|
|
Net Assets | | 100.00 | % | | $ | 43,439,406 |
| | |
|
| |
|
|
See Notes to Financial Statements.
24
Excelsior Funds Trust
Portfolio of Investments — March 31, 2005
Total Return Bond Fund
| | | | | | | | | | |
Principal
| | | | Rate
| | | Maturity
Date
| | Value
|
| | | | | | | | | | | |
COLLATERALIZED MORTGAGE OBLIGATIONS — 10.40% |
| $2,580,055 | | Countrywide Alternative Loan Trust,
2004-16CB 1A2 | | 5.50 | % | | 07/25/34 | | $ | 2,593,245 |
| 3,974,642 | | Federal Home Loan Mortgage Corp.
1602 PH | | 6.00 | | | 04/15/23 | | | 4,045,220 |
| 6,747,832 | | Wells Fargo Mortgage Backed Securities Trust, 2004-EE 3A1 | | 3.99 | | | 01/25/35 | | | 6,622,570 |
| 2,267,016 | | Wells Fargo Mortgage Backed Securities Trust,
2005-AR1 1A1 | | 4.57 | | | 02/25/35 | | | 2,245,081 |
| | | | | | | | | |
|
|
| | | TOTAL COLLATERALIZED
MORTGAGE OBLIGATIONS
(Cost $15,693,369) | | | 15,506,116 |
| | | | | | | | | |
|
|
COMMERCIAL MORTGAGE-BACKED SECURITIES — 21.34% |
| 3,635,042 | | Asset Securitization Corp.,
1997-D4 A4(a) | | 7.00 | | | 04/14/29 | | | 4,047,880 |
| 1,020,000 | | Bank of America Commercial Mortgage, Inc.,
2004-1 A4 | | 4.76 | | | 11/10/39 | | | 998,162 |
| 3,139,391 | | DLJ Commercial Mortgage Corp., 2000-CF1 A1A | | 7.45 | | | 06/10/33 | | | 3,197,588 |
| 1,760,000 | | Greenwich Capital Commercial Funding Corp., 2004-GG1 A1 | | 5.32 | | | 06/10/36 | | | 1,790,588 |
| 2,430 | | LB Commericial Conduit Mortgage Trust, 1999-C1 A1 | | 6.41 | | | 06/15/31 | | | 2,487 |
| 1,071,155 | | Morgan Stanley Dean Witter Capital I,
2003-TOP9 A2 | | 4.74 | | | 11/13/36 | | | 1,056,435 |
| 3,000,000 | | Mortgage Capital Funding, Inc.,
1996-MC1 G(b) | | 7.15 | | | 06/15/06 | | | 3,093,758 |
| 3,828,624 | | Mortgage Capital Funding, Inc.,
1998-MC1 C | | 6.95 | | | 03/18/30 | | | 4,068,085 |
| 2,624,113 | | Nomura Asset Securities Corp.,
1998-D6 A4(a) | | 6.92 | | | 03/15/30 | | | 3,010,520 |
| 5,162,189 | | Salomon Brothers Mortgage Securities VII, 2001-C2 A2 | | 6.17 | | | 02/13/10 | | | 5,409,072 |
| 3,260,783 | | Wachovia Bank Commercial Mortgage Trust,
2002-C1 A4 | | 6.29 | | | 04/15/34 | | | 3,513,207 |
| 1,600,000 | | Wachovia Bank Commercial Mortgage Trust,
2004-C12 A3 | | 5.23 | | | 07/15/41 | | | 1,633,650 |
| | | | | | | | | |
|
|
| | | TOTAL COMMERCIAL MORTGAGE-BACKED SECURITIES
(Cost $30,777,010) | | | 31,821,432 |
| | | | | | | | | |
|
|
| | | | | | | | | | |
Principal
| | | | Rate
| | | Maturity
Date
| | Value
|
| | | | | | | | | | | |
CORPORATE BONDS — 24.17% |
| $3,743,000 | | American Express Co. | | 5.50 | % | | 09/12/06 | | $ | 3,819,009 |
| 3,183,350 | | Bank One Corp.(c) | | 7.88 | | | 08/01/10 | | | 3,625,040 |
| 1,000,000 | | British Telecommunications plc | | 8.88 | | | 12/15/30 | | | 1,332,489 |
| 1,375,000 | | CIT Group, Inc.(c) | | 5.88 | | | 10/15/08 | | | 1,427,223 |
| 800,000 | | Citigroup, Inc. | | 6.63 | | | 06/15/32 | | | 892,030 |
| 2,796,186 | | DaimlerChrysler NA Holding Corp. | | 6.40 | | | 05/15/06 | | | 2,855,602 |
| 1,901,407 | | Deutsche Telekom International Finance, Multi-Coupon
Bond | | 8.50 | | | 06/15/10 | | | 2,186,770 |
| 5,205,208 | | General Electric Capital Corp. MTN | | 6.00 | | | 06/15/12 | | | 5,545,846 |
| 2,060,922 | | Household Finance Corp. | | 8.00 | | | 07/15/10 | | | 2,357,627 |
| 2,300,000 | | International Lease Finance Corp. | | 4.50 | | | 05/01/08 | | | 2,285,149 |
| 1,776,654 | | JP Morgan Chase & Co. | | 5.75 | | | 01/02/13 | | | 1,846,256 |
| 3,277,000 | | Lehman Brothers Holdings, Inc. | | 8.25 | | | 06/15/07 | | | 3,549,253 |
| 1,430,000 | | Sprint Capital Corp. | | 8.38 | | | 03/15/12 | | | 1,671,238 |
| 1,030,000 | | Time Warner Cos., Inc. | | 7.25 | | | 10/15/17 | | | 1,167,974 |
| 1,316,359 | | Weyerhaeuser Co. | | 6.88 | | | 12/15/33 | | | 1,461,873 |
| | | | | | | | | |
|
|
| | | TOTAL CORPORATE BONDS
(Cost $34,344,567) | | | 36,023,379 |
| | | | | | | | | |
|
|
TAX-EXEMPT SECURITIES — 3.25% |
| 2,000,000 | | Arizona State, Water Infrastructure Finance Authority, Revenue Bonds, Series A | | 5.00 | | | 10/01/16 | | | 2,157,500 |
| 1,800,000 | | California State, Infrastructure & Economic Development Bank, Revenue Bonds, Bay Area Toll Bridges Project, Series A | | 5.25 | | | 07/01/16 | | | 1,959,750 |
| 690,000 | | Massachusetts Bay Transportation Authority, Massachusetts Sales Tax, Revenue Bonds, Series A | | 5.00 | | | 07/01/31 | | | 733,125 |
| | | | | | | | | |
|
|
| | | TOTAL TAX-EXEMPT SECURITIES
(Cost $4,973,934) | | | 4,850,375 |
| | | | | | | | | |
|
|
FOREIGN GOVERNMENT OBLIGATION — 1.30% |
| 1,875,000 | | United Mexican States | | 6.38 | | | 01/16/13 | | | 1,945,313 |
| | | | | | | | | |
|
|
| | | TOTAL FOREIGN GOVERNMENT OBLIGATION
(Cost $1,907,932) | | | 1,945,313 |
| | | | | | | | | |
|
|
See Notes to Financial Statements.
25
Excelsior Funds Trust
Portfolio of Investments — March 31, 2005
Total Return Bond Fund — (continued)
| | | | | | | | | | |
Principal
| | | | Rate
| | | Maturity
Date
| | Value
|
| | | | | | | | | | | |
U.S. GOVERNMENT AGENCY BONDS & NOTES — 5.53% |
| | | FANNIE MAE — 3.35% | | | | | | | | |
| $5,000,000 | | Discount Note | | 2.73 | % | | 05/04/05 | | $ | 4,987,488 |
| | | | | | | | | |
|
|
| | | FREDDIE MAC — 2.18% | | | |
| 2,824,201 | | | | 6.25 | | | 07/15/32 | | | 3,253,694 |
| | | | | | | | | |
|
|
| | | TOTAL U.S. GOVERNMENT AGENCY BONDS & NOTES
(Cost $8,168,609) | | | 8,241,182 |
| | | | | | | | | |
|
|
U.S. GOVERNMENT AGENCY MORTGAGE PASS THROUGH SECURITIES — 13.56% |
| | | FEDERAL NATIONAL MORTGAGE ASSOCIATION — 12.70% |
| 3,478,033 | | Pool # 11996, May TBA | | 5.00 | | | 05/01/35 | | | 3,389,998 |
| 109,514 | | Pool # 190319 | | 6.50 | | | 02/01/32 | | | 113,903 |
| 1,435,000 | | Pool # 2221, April TBA | | 4.50 | | | 04/01/35 | | | 1,361,456 |
| 100,328 | | Pool # 252212 | | 6.50 | | | 01/01/29 | | | 104,529 |
| 81,483 | | Pool # 254406 | | 6.50 | | | 08/01/32 | | | 84,718 |
| 45,698 | | Pool # 502922 | | 6.50 | | | 07/01/29 | | | 47,580 |
| 11,787 | | Pool # 509676 | | 6.50 | | | 08/01/29 | | | 12,273 |
| 55,395 | | Pool # 535506 | | 6.50 | | | 08/01/30 | | | 57,676 |
| 37,957 | | Pool # 535911 | | 6.50 | | | 05/01/31 | | | 39,498 |
| 154,035 | | Pool # 535923 | | 6.50 | | | 05/01/31 | | | 160,209 |
| 65,022 | | Pool # 535933 | | 6.50 | | | 05/01/31 | | | 67,628 |
| 39,337 | | Pool # 545264 | | 6.50 | | | 09/01/31 | | | 40,914 |
| 17,151 | | Pool # 545697 | | 6.50 | | | 06/01/32 | | | 17,832 |
| 26,314 | | Pool # 545699 | | 6.50 | | | 06/01/32 | | | 27,358 |
| 180,839 | | Pool # 545759 | | 6.50 | | | 07/01/32 | | | 188,017 |
| 12,979 | | Pool # 547757 | | 6.50 | | | 11/01/30 | | | 13,506 |
| 17,896 | | Pool # 556702 | | 6.50 | | | 11/01/30 | | | 18,622 |
| 180,461 | | Pool # 559894 | | 6.50 | | | 04/01/31 | | | 187,694 |
| 31,846 | | Pool # 562567 | | 6.50 | | | 02/01/31 | | | 33,123 |
| 7,330 | | Pool # 581332 | | 6.50 | | | 05/01/31 | | | 7,624 |
| 27,574 | | Pool # 583053 | | 6.50 | | | 05/01/31 | | | 28,679 |
| 7,675 | | Pool # 591237 | | 6.50 | | | 08/01/31 | | | 7,982 |
| 3,059,994 | | Pool # 618322 | | 6.00 | | | 12/01/31 | | | 3,131,772 |
| 68,073 | | Pool # 662505 | | 6.50 | | | 10/01/32 | | | 70,775 |
| 2,468,227 | | Pool # 702861 | | 5.00 | | | 04/01/18 | | | 2,469,572 |
| 3,122,078 | | Pool # 728826 ARM(a) | | 4.10 | | | 07/01/33 | | | 3,100,831 |
| 1,529,803 | | Pool # 805386 ARM(a) | | 4.94 | | | 01/01/35 | | | 1,531,745 |
| 2,760,000 | | Pool # 815479 | | 4.50 | | | 03/01/35 | | | 2,620,793 |
| | | | | | | | | |
|
|
| | | | | | | | | | | 18,936,307 |
| | | | | | | | | |
|
|
| | | GOVERNMENT NATIONAL MORTGAGE
ASSOCIATION — 0.86% |
| 3,957 | | Pool # 356873 | | 6.50 | | | 05/15/23 | | | 4,135 |
| 23,486 | | Pool # 479087 | | 8.00 | | | 01/15/30 | | | 25,304 |
| 316,187 | | Pool # 479088 | | 8.00 | | | 01/15/30 | | | 340,661 |
| 322,887 | | Pool # 80185 ARM(a) | | 3.38 | | | 04/20/28 | | | 327,313 |
| 190,923 | | Pool # 80205 ARM(a) | | 3.38 | | | 06/20/28 | | | 193,562 |
| 379,659 | | Pool # 80311 ARM(a) | | 3.50 | | | 08/20/29 | | | 384,626 |
| | | | | | | | | |
|
|
| | | | | | | | | | | 1,275,601 |
| | | | | | | | | |
|
|
| | | TOTAL U.S. GOVERNMENT AGENCY MORTGAGE PASS THROUGH SECURITIES
(Cost $20,208,309) | | | 20,211,908 |
| | | | | | | | | |
|
|
| | | | | | | | | | |
Principal
| | | | Rate
| | | Maturity
Date
| | Value
|
| | | | | | | | | | | |
U.S. GOVERNMENT SECURITIES — 15.18% |
| | | U.S. TREASURY PRINCIPAL ONLY STRIPS — 7.71% |
| $ 6,130,000 | | | | 0.00 | % | | 05/15/17 | | $ | 3,424,954 |
| 16,736,882 | | | | 0.00 | | | 02/15/20 | | | 8,064,734 |
| | | | | | | | | |
|
|
| | | | | | | | | | | 11,489,688 |
| | | | | | | | | |
|
|
| | | U.S. TREASURY INFLATION PROTECTED
BONDS — 3.44% |
| 4,651,200 | | | | 3.88 | | | 01/15/09 | | | 5,129,343 |
| | | | | | | | | |
|
|
| | | U.S. TREASURY NOTES — 4.03% |
| 820,000 | | | | 3.50 | | | 12/15/09 | | | 796,425 |
| 3,935,000 | | | | 7.63 | | | 11/15/22 | | | 5,211,868 |
| | | | | | | | | |
|
|
| | | | | | | | | | | 6,008,293 |
| | | | | | | | | |
|
|
| | | TOTAL U.S. GOVERNMENT SECURITIES
(Cost $21,844,141) | | | 22,627,324 |
| | | | | | | | | |
|
|
Shares
| | | | | | | | | |
REGISTERED INVESTMENT COMPANIES — 5.33% |
| 3,971,836 | | Dreyfus Government Cash Management Fund | | | 3,971,836 |
| 3,971,836 | | Fidelity U.S. Treasury II Fund | | | 3,971,836 |
| | | | | | | | | |
|
|
| | | TOTAL REGISTERED
INVESTMENT COMPANIES
(Cost $7,943,672) | | | 7,943,672 |
| | | | | | | | | |
|
|
| | | | | | | |
TOTAL INVESTMENTS
(Cost $145,861,543)(d) | | 100.06 | % | | $ | 149,170,701 | |
LIABILITIES IN EXCESS OF OTHER ASSETS | | (0.06 | ) | | | (88,068 | ) |
| | |
|
| |
|
|
|
NET ASSETS | | 100.00 | % | | $ | 149,082,633 | |
| | |
|
| |
|
|
|
| (a) | Variable Rate Security—The rate disclosed is as of March 31, 2005. |
| (b) | Security exempt from registration under Rule 144A of the Securities Act of 1933. This security may be resold in transactions exempt from registration, normally to qualified institutional buyers. At March 31, 2005, these securities amounted to $3,093,758 or 2.08% of net assets. |
| (c) | All or part of the security is segregated by the Fund’s custodian to cover future purchase commitments. |
| (d) | Unrealized appreciation (depreciation) of securities: |
| | | | |
Unrealized
Appreciation
| | Unrealized
(Depreciation)
| | Net Unrealized
Appreciation/
(Depreciation)
|
| $4,068,050 | | $(758,892) | | $3,309,158 |
ARM—Adjustable Rate Mortgage
Discount Note—The rate reported is the discount rate at the time of purchase.
MTN—Medium Term Note
Multi-Coupon Bond—Coupon rate may increase or decrease in response to a change in the quality rating by an independent rating agency.
plc—public limited company
STRIPS—Separately Traded Registered Interest and Principal Securities
TBA—To Be Announced
See Notes to Financial Statements.
26
Excelsior Funds Trust
Portfolio of Investments — March 31, 2005
Total Return Bond Fund — (continued)
The summary of the Fund’s investments as of March 31, 2005 is as follows: (Unaudited)
| | | | | | | |
Portfolio Diversification
| | % of
Net
Assets
| | | Value
| |
U.S. Government & Agency Securities | | 34.26 | % | | $ | 51,080,414 | |
Corporate Bonds | | 24.17 | | | | 36,023,379 | |
Commercial Mortgage-Backed Securities | | 21.35 | | | | 31,821,432 | |
Collateralized Mortgage Obligations | | 10.40 | | | | 15,506,116 | |
Registered Investment Company | | 5.33 | | | | 7,943,672 | |
Tax-Exempt Securities | | 3.25 | | | | 4,850,375 | |
Foreign Government Obligation | | 1.30 | | | | 1,945,313 | |
| | |
|
| |
|
|
|
Total Investments | | 100.06 | % | | $ | 149,170,701 | |
Other Assets and Liabilities (Net) | | (0.06 | ) | | | (88,068 | ) |
| | |
|
| |
|
|
|
Net Assets | | 100.00 | % | | $ | 149,082,633 | |
| | |
|
| |
|
|
|
See Notes to Financial Statements.
27
Excelsior Funds Trust
Portfolio of Investments — March 31, 2005
Income Fund
| | | | | | | | | | |
Principal
| | | | Rate
| | | Maturity
Date
| | Value
|
| | | | | | | | | | | |
COLLATERALIZED MORTGAGE OBLIGATIONS — 7.91% |
| $1,353,616 | | Countrywide Alternative
Loan Trust,
2004-22CB 1A1 | | 6.00 | % | | 10/25/34 | | $ | 1,381,309 |
| 5,358,332 | | Wells Fargo Mortgage Backed Securities Trust,
2004-EE 3A1 | | 3.99 | | | 01/25/35 | | | 5,258,863 |
| 1,626,338 | | Wells Fargo Mortgage Backed Securities Trust,
2005-AR1 1A1 | | 4.57 | | | 02/25/35 | | | 1,610,602 |
| | | | | | | | | |
|
|
| | | TOTAL COLLATERALIZED MORTGAGE OBLIGATIONS
(Cost $8,360,328) | | | 8,250,774 |
| | | | | | | | | |
|
|
COMMERCIAL MORTGAGE-BACKED SECURITIES — 13.01% |
| 589,958 | | Asset Securitization Corp.,
1997-D4 A4(a) | | 7.00 | | | 04/14/29 | | | 656,961 |
| 1,203,431 | | Bear Stearns Adjustable Rate Mortgage Trust, 2004-10, 15A1(a) | | 4.50 | | | 01/25/35 | | | 1,202,749 |
| 1,780,000 | | CS First Boston Mortgage Securities Corp.,
2001-CK3 A2 | | 6.04 | | | 06/15/34 | | | 1,810,410 |
| 1,646,516 | | DLJ Commercial Mortgage Corp.,
2000-CF1 A1A | | 7.45 | | | 06/10/33 | | | 1,677,038 |
| 1,569,121 | | DLJ Mortgage Acceptance Corp., 1996-CF2 A3(b) | | 7.38 | | | 11/12/21 | | | 1,607,650 |
| 1,781,000 | | GMAC Commercial Mortgage Securities,
1999-C1(a) | | 6.87 | | | 05/15/33 | | | 1,912,467 |
| 173,845 | | Morgan Stanley Dean Witter Capital I,
2003-TOP9 A2 | | 4.74 | | | 11/13/36 | | | 171,456 |
| 621,376 | | Mortgage Capital Funding, Inc.,
1998-MC1 C | | 6.95 | | | 03/18/30 | | | 660,240 |
| 425,887 | | Nomura Asset Securities Corp.,
1998-D6 A4(a) | | 6.92 | | | 03/15/30 | | | 488,600 |
| 2,232,811 | | Salomon Brothers Mortgage Securities VII, 2001-C2 A2 | | 6.17 | | | 02/13/10 | | | 2,339,595 |
| 964,217 | | Wachovia Bank Commercial Mortgage Trust,
2002-C1 A4 | | 6.29 | | | 04/15/34 | | | 1,038,859 |
| | | | | | | | | |
|
|
| | | TOTAL COMMERCIAL MORTGAGE-BACKED SECURITIES
(Cost $13,895,392) | | | 13,566,025 |
| | | | | | | | | |
|
|
| | | | | | | | | | |
Principal
| | | | Rate
| | | Maturity
Date
| | Value
|
| | | | | | | | | | | |
CORPORATE BONDS — 19.62% |
| $ 516,650 | | Bank One Corp. | | 7.88 | % | | 08/01/10 | | $ | 588,335 |
| 600,000 | | British Telecommunications plc, | | 8.88 | | | 12/15/30 | | | 799,493 |
| 600,000 | | Caterpillar Financial Service Corp. MTN | | 3.00 | | | 02/15/07 | | | 588,041 |
| 965,000 | | CIT Group, Inc. | | 5.88 | | | 10/15/08 | | | 1,001,651 |
| 1,170,000 | | Citigroup, Inc. | | 6.63 | | | 06/15/32 | | | 1,304,594 |
| 1,743,814 | | DaimlerChrysler NA Holding Corp. | | 6.40 | | | 05/15/06 | | | 1,780,869 |
| 308,593 | | Deutsche Telekom International Finance, Multi-Coupon Bond | | 8.50 | | | 06/15/10 | | | 354,907 |
| 825,000 | | Ford Motor Credit Co. | | 6.88 | | | 02/01/06 | | | 836,218 |
| 844,792 | | General Electric Capital Corp. MTN | | 6.00 | | | 06/15/12 | | | 900,077 |
| 1,221,000 | | Goldman Sachs Group, Inc. | | 6.13 | | | 02/15/33 | | | 1,251,676 |
| 78 | | Household Finance Corp. | | 8.00 | | | 07/15/10 | | | 89 |
| 380,000 | | International Lease Finance Corp. | | 4.50 | | | 05/01/08 | | | 377,546 |
| 1,388,346 | | JP Morgan Chase & Co. | | 5.75 | | | 01/02/13 | | | 1,442,736 |
| 1,100,000 | | Lehman Brothers Holdings, Inc.(a) | | 2.79 | | | 04/20/07 | | | 1,101,441 |
| 1,760,000 | | MBIA Global Funding, llc(b) | | 2.88 | | | 11/30/06 | | | 1,722,989 |
| 1,500,000 | | Merrill Lynch & Co. MTN | | 5.00 | | | 02/03/14 | | | 1,469,522 |
| 1,200,000 | | Metlife, Inc. | | 5.00 | | | 11/24/13 | | | 1,185,608 |
| 1,200,000 | | Morgan Stanley | | 4.75 | | | 04/01/14 | | | 1,142,543 |
| 1,900,000 | | Pepsi Bottling Group, llc(c) | | 2.45 | | | 10/16/06 | | | 1,856,295 |
| 683,641 | | Weyerhaeuser Co. | | 6.88 | | | 12/15/33 | | | 759,213 |
| | | | | | | | | |
|
|
| | | TOTAL CORPORATE BONDS
(Cost $20,509,682) | | | 20,463,843 |
| | | | | | | | | |
|
|
TAX-EXEMPT SECURITIES — 1.48% |
| 530,000 | | California State Economic Recovery, General Obligation Bonds, Series A, (FGIC) | | 5.25 | | | 07/01/14 | | | 584,325 |
| 900,000 | | Massachusetts Bay Transportation Authority, Massachusetts Sales Tax, Revenue Bonds, Series A | | 5.00 | | | 07/01/31 | | | 956,250 |
| | | | | | | | | |
|
|
| | | TOTAL TAX-EXEMPT SECURITIES
(Cost $1,571,356) | | | 1,540,575 |
| | | | | | | | | |
|
|
See Notes to Financial Statements.
28
Excelsior Funds Trust
Portfolio of Investments — March 31, 2005
Income Fund — (continued)
| | | | | | | | | | |
Principal
| | | | Rate
| | | Maturity
Date
| | Value
|
| | | | | | | | | | | |
FOREIGN GOVERNMENT OBLIGATION — 0.88% | | | |
| $ 300,000 | | United Mexican States | | 10.38 | % | | 02/17/09 | | $ | 354,750 |
| 545,000 | | United Mexican States | | 6.63 | | | 03/03/15 | | | 567,890 |
| | | | | | | | | |
|
|
| | | TOTAL FOREIGN GOVERNMENT OBLIGATION
(Cost $893,613) | | | 922,640 |
| | | | | | | | | |
|
|
U.S. GOVERNMENT AGENCY BONDS & NOTES — 13.30% |
| | | FANNIE MAE — 7.72% | | | | | | |
| 2,500,000 | | | | 6.25 | | | 02/01/11 | | | 2,671,335 |
| 4,000,000 | | Discount Note | | 2.73 | | | 05/04/05 | | | 3,989,990 |
| 3,000,000 | | Discount Note | | 5.61 | | | 10/09/19 | | | 1,382,460 |
| | | | | | | | | |
|
|
| | | | | | | | | | | 8,043,785 |
| | | | | | | | | |
|
|
| | | FREDDIE MAC — 3.44% | | | | | | |
| 3,115,799 | | | | 6.25 | | | 07/15/32 | | | 3,589,637 |
| | | | | | | | | |
|
|
| | | RESOLUTION FUNDING CORP. — 2.14% |
| 4,851,000 | | Principal Only
STRIPS | | 0.00 | | | 07/15/20 | | | 2,234,992 |
| | | | | | | | | |
|
|
| | | TOTAL U.S. GOVERNMENT AGENCY BONDS & NOTES
(Cost $13,361,168) | | | 13,868,414 |
| | | | | | | | | |
|
|
U.S. GOVERNMENT AGENCY MORTGAGE PASS THROUGH SECURITIES — 36.13% |
| | | FEDERAL HOME LOAN MORTGAGE
CORPORATION — 6.93% |
| 3,272,867 | | Pool # E96460 | | 5.00 | | | 05/01/18 | | | 3,278,180 |
| 857,562 | | Pool # M80779 | | 5.00 | | | 11/01/09 | | | 864,416 |
| 3,092,536 | | Pool # M80812 | | 4.50 | | | 04/01/10 | | | 3,082,500 |
| | | | | | | | | |
|
|
| | | | | | | | | | | 7,225,096 |
| | | | | | | | | |
|
|
| | | FEDERAL NATIONAL MORTGAGE
ASSOCIATION — 20.08% |
| 1,852,257 | | Pool # 11996,
May TBA | | 5.00 | | | 05/01/35 | | | 1,805,373 |
| 17,774 | | Pool # 190319 | | 6.50 | | | 02/01/32 | | | 18,486 |
| 357,377 | | Pool # 251502 | | 6.50 | | | 02/01/13 | | | 373,338 |
| 16,283 | | Pool # 252212 | | 6.50 | | | 01/01/29 | | | 16,965 |
| 153,443 | | Pool # 252806 | | 7.50 | | | 10/01/29 | | | 164,290 |
| 13,224 | | Pool # 254406 | | 6.50 | | | 08/01/32 | | | 13,749 |
| 3,500,000 | | Pool # 34738,
May TBA | | 6.00 | | | 05/01/35 | | | 3,568,907 |
| 272,136 | | Pool # 443194 | | 5.50 | | | 10/01/28 | | | 274,052 |
| 5,954 | | Pool # 450846 | | 5.50 | | | 12/01/28 | | | 5,996 |
| 488,397 | | Pool # 452035 | | 5.50 | | | 11/01/28 | | | 491,835 |
| 3,006 | | Pool # 454758 | | 5.50 | | | 12/01/28 | | | 3,027 |
| 9,218 | | Pool # 485994 | | 5.50 | | | 01/01/29 | | | 9,282 |
| 7,417 | | Pool # 502922 | | 6.50 | | | 07/01/29 | | | 7,722 |
| 1,913 | | Pool # 509676 | | 6.50 | | | 08/01/29 | | | 1,992 |
| 8,990 | | Pool # 535506 | | 6.50 | | | 08/01/30 | | | 9,361 |
| 6,160 | | Pool # 535911 | | 6.50 | | | 05/01/31 | | | 6,410 |
| 24,999 | | Pool # 535923 | | 6.50 | | | 05/01/31 | | | 26,001 |
| 10,553 | | Pool # 535933 | | 6.50 | | | 05/01/31 | | | 10,976 |
| 6,384 | | Pool # 545264 | | 6.50 | | | 09/01/31 | | | 6,640 |
| 29,350 | | Pool # 545759 | | 6.50 | | | 07/01/32 | | | 30,515 |
| 2,107 | | Pool # 547757 | | 6.50 | | | 11/01/30 | | | 2,192 |
| | | | | | | | | | |
Principal
| | | | Rate
| | | Maturity
Date
| | Value
|
| | | | | | | | | | | |
U.S. GOVERNMENT AGENCY MORTGAGE PASS THROUGH SECURITIES — (continued) |
| | | FEDERAL NATIONAL MORTGAGE
ASSOCIATION — (continued) |
| $ 2,904 | | Pool # 556702 | | 6.50 | % | | 11/01/30 | | $ | 3,022 |
| 29,288 | | Pool # 559894 | | 6.50 | | | 04/01/31 | | | 30,462 |
| 754,173 | | Pool # 561435 | | 5.50 | | | 11/01/29 | | | 759,483 |
| 5,169 | | Pool # 562567 | | 6.50 | | | 02/01/31 | | | 5,376 |
| 318,195 | | Pool # 578543 | | 5.50 | | | 04/01/31 | | | 319,675 |
| 4,475 | | Pool # 583053 | | 6.50 | | | 05/01/31 | | | 4,655 |
| 116,288 | | Pool # 627259 | | 5.50 | | | 02/01/32 | | | 116,754 |
| 1,480,298 | | Pool # 632551 | | 5.50 | | | 02/01/32 | | | 1,486,239 |
| 581,566 | | Pool # 632576 | | 5.50 | | | 02/01/32 | | | 584,271 |
| 613,878 | | Pool # 645136 | | 6.50 | | | 06/01/32 | | | 638,246 |
| 11,048 | | Pool # 662505 | | 6.50 | | | 10/01/32 | | | 11,486 |
| 2,182,151 | | Pool # 704440 | | 5.00 | | | 05/01/18 | | | 2,183,340 |
| 96,499 | | Pool # 710585 | | 5.50 | | | 05/01/33 | | | 96,819 |
| 2,237,033 | | Pool # 777206 | | 4.00 | | | 05/01/19 | | | 2,142,835 |
| 2,282,376 | | Pool # 786423 ARM(a) | | 4.63 | | | 07/01/34 | | | 2,271,422 |
| 3,189,551 | | Pool # 805386 ARM(a) | | 4.94 | | | 01/01/35 | | | 3,193,600 |
| 22,081 | | Pool # C74339 | | 5.00 | | | 12/01/32 | | | 21,685 |
| 199,567 | | Pool # C74469 | | 5.00 | | | 12/01/32 | | | 195,989 |
| 39,860 | | Pool # C74676 | | 5.00 | | | 12/01/32 | | | 39,146 |
| | | | | | | | | |
|
|
| | | | | | | | | | | 20,951,614 |
| | | | | | | | | |
|
|
| | | GOVERNMENT NATIONAL MORTGAGE
ASSOCIATION — 9.12% |
| 268,478 | | Pool # 15453 | | 8.50 | | | 11/15/17 | | | 291,928 |
| 81,826 | | Pool # 434772 | | 9.00 | | | 06/15/30 | | | 90,547 |
| 125,089 | | Pool # 471660 | | 7.50 | | | 03/15/28 | | | 134,297 |
| 186,562 | | Pool # 472028 | | 6.50 | | | 05/15/28 | | | 195,303 |
| 145,798 | | Pool # 475847 | | 6.50 | | | 06/15/28 | | | 152,629 |
| 3,812 | | Pool # 479087 | | 8.00 | | | 01/15/30 | | | 4,107 |
| 51,316 | | Pool # 479088 | | 8.00 | | | 01/15/30 | | | 55,288 |
| 213,556 | | Pool # 503711 | | 7.00 | | | 05/15/29 | | | 226,066 |
| 67,782 | | Pool # 525556 | | 8.00 | | | 01/15/30 | | | 73,081 |
| 11,553 | | Pool # 525945 | | 9.00 | | | 07/15/30 | | | 12,784 |
| 590,631 | | Pool # 575441 | | 6.50 | | | 12/15/31 | | | 617,633 |
| 1,420,367 | | Pool # 598127 | | 5.50 | | | 03/15/18 | | | 1,461,213 |
| 2,137,251 | | Pool # 607668 | | 5.50 | | | 02/15/18 | | | 2,198,713 |
| 1,132,959 | | Pool # 615639 | | 4.50 | | | 09/15/33 | | | 1,086,227 |
| 794,830 | | Pool # 780548 | | 8.50 | | | 12/15/17 | | | 864,255 |
| 635,742 | | Pool # 780865 | | 9.50 | | | 11/15/17 | | | 702,088 |
| 306,285 | | Pool # 781036 | | 8.00 | | | 10/15/17 | | | 329,218 |
| 474,457 | | Pool # 781084 | | 9.00 | | | 12/15/17 | | | 516,716 |
| 52,404 | | Pool # 80185 ARM(a) | | 3.38 | | | 04/20/28 | | | 53,122 |
| 253,783 | | Pool # 80205 ARM(a) | | 3.38 | | | 06/20/28 | | | 257,291 |
| 199,159 | | Pool # 80311 ARM(a) | | 3.50 | | | 08/20/29 | | | 201,764 |
| | | | | | | | | |
|
|
| | | | | | | | | | | 9,524,270 |
| | | | | | | | | |
|
|
| | | TOTAL U.S. GOVERNMENT AGENCY MORTGAGE PASS THROUGH SECURITIES
(Cost $37,638,518) | | | 37,700,980 |
| | | | | | | | | |
|
|
See Notes to Financial Statements.
29
Excelsior Funds Trust
Portfolio of Investments — March 31, 2005
Income Fund — (continued)
| | | | | | | | | | |
Principal
| | | | Rate
| | | Maturity
Date
| | Value
|
| | | | | | | | | | | |
U.S. GOVERNMENT SECURITIES — 3.33% |
| | | U.S. TREASURY PRINCIPAL ONLY STRIPS — 1.37% |
| $2,968,118 | | | | 0.00 | % | | 02/15/20 | | $ | 1,430,200 |
| | | | | | | | | |
|
|
| | | U.S. TREASURY INFLATION PROTECTED
BONDS — 0.52% |
| 445,000 | | | | 3.50 | | | 01/15/11 | | | 544,673 |
| | | | | | | | | |
|
|
| | | U.S. TREASURY NOTES — 1.44% |
| 1,130,000 | | | | 7.63 | | | 11/15/22 | | | 1,496,673 |
| | | | | | | | | |
|
|
| | | TOTAL U.S. GOVERNMENT SECURITIES
(Cost $3,427,258) | | | 3,471,546 |
| | | | | | | | | |
|
|
Shares
| | | | | | | | | |
REGISTERED INVESTMENT COMPANIES — 4.32% |
| 2,254,975 | | Dreyfus Government Cash Management Fund | | | 2,254,975 |
| 2,254,975 | | Fidelity U.S. Treasury II Fund | | | 2,254,975 |
| | | | | | | | | |
|
|
| | | TOTAL REGISTERED
INVESTMENT COMPANIES
(Cost $4,509,950) | | | 4,509,950 |
| | | | | | | | | |
|
|
| | | | | | |
TOTAL INVESTMENTS
(Cost $104,167,265)(d) | | 99.98 | % | | $ | 104,294,747 |
OTHER ASSETS IN EXCESS OF LIABILITIES | | 0.02 | | | | 16,235 |
| | |
|
| |
|
|
NET ASSETS | | 100.00 | % | | $ | 104,310,982 |
| | |
|
| |
|
|
| (a) | Variable Rate Security—The rate disclosed is as of March 31, 2005. |
| (b) | Security exempt from registration under Rule 144A of the Securities Act of 1933. This security may be resold in transactions exempt from registration, normally to qualified institutional buyers. At March 31, 2005, these securities amounted to $3,330,639 or 3.19% of net assets. |
| (c) | All or part of the security is segregated by the Fund’s custodian to cover future purchase commitments. |
| (d) | Unrealized appreciation (depreciation) of securities: |
| | | | |
Unrealized
Appreciation
| | Unrealized
(Depreciation)
| | Net Unrealized
Appreciation/
(Depreciation)
|
| $1,340,530 | | $(1,213,048) | | $127,482 |
ARM—Adjustable Rate Mortgage
Discount Note—The rate reported is the discount rate at the time of purchase.
llc—Limited Liability Company
MTN—Medium Term Note
Multi-Coupon Bond—Coupon rate may increase or decrease in response to a change in the quality rating by an independent rating agency.
plc—public limited company
STRIPS—Separately Traded Registered Interest and Principal Securities
TBA—To Be Announced
The summary of the Fund’s investments as of March 31, 2005 is as follows: (Unaudited)
| | | | | | |
Portfolio Diversification
| | % of
Net
Assets
| | | Value
|
U.S. Government & Agency Securities | | 52.76 | % | | $ | 55,040,940 |
Corporate Bonds | | 19.62 | | | | 20,463,843 |
Commercial Mortgage-Backed Securities | | 13.01 | | | | 13,566,025 |
Collateralized Mortgage Obligations | | 7.91 | | | | 8,250,774 |
Registered Investment Company | | 4.32 | | | | 4,509,950 |
Tax-Exempt Securities | | 1.48 | | | | 1,540,575 |
Foreign Government Obligation | | 0.88 | | | | 922,640 |
| | |
|
| |
|
|
Total Investments | | 99.98 | % | | $ | 104,294,747 |
Other Assets and Liabilities (Net) | | 0.02 | | | | 16,235 |
| | |
|
| |
|
|
Net Assets | | 100.00 | % | | $ | 104,310,982 |
| | |
|
| |
|
|
See Notes to Financial Statements.
30
Excelsior Funds Trust
Portfolio of Investments — March 31, 2005
High Yield Fund
| | | | | | | | | | |
Principal
| | | | Rate
| | | Maturity
Date
| | Value
|
| | | | | | | | | | | |
CORPORATE BONDS — 95.78% |
| | | ADVERTISING PERIODICALS — 1.32% | | | |
| $ 976,000 | | Dex Media West llc/ Dex Media Finance Co. | | 9.88 | % | | 08/15/13 | | $ | 1,088,240 |
| 1,000,000 | | RH Donnelley Finance Corp.(a) | | 10.88 | | | 12/15/12 | | | 1,152,500 |
| | | | | | | | | |
|
|
| | | | | | | | | | | 2,240,740 |
| | | | | | | | | |
|
|
| | | AGRICULTURAL CHEMICALS — 2.53% |
| 500,000 | | IMC Global, Inc.,
Series B | | 11.25 | | | 06/01/11 | | | 557,500 |
| 2,000,000 | | IMC Global, Inc.,
Series B, Unsecured | | 11.25 | | | 06/01/11 | | | 2,230,000 |
| 1,298,000 | | Terra Capital, Inc. | | 11.50 | | | 06/01/10 | | | 1,492,700 |
| | | | | | | | | |
|
|
| | | | | | | | | | | 4,280,200 |
| | | | | | | | | |
|
|
| | | AUTO-TRUCK PARTS & EQUIPMENT — 3.48% |
| 1,000,000 | | Accuride Corp.(a) | | 8.50 | | | 02/01/15 | | | 980,000 |
| 4,000,000 | | Collins & Aikman Products(a) | | 12.88 | | | 08/15/12 | | | 1,800,000 |
| 2,000,000 | | Dana Corp. | | 9.00 | | | 08/15/11 | | | 2,190,976 |
| 1,000,000 | | Dura Operating Corp. | | 8.63 | | | 04/15/12 | | | 922,500 |
| | | | | | | | | |
|
|
| | | | | | | | | | | 5,893,476 |
| | | | | | | | | |
|
|
| | | CABLE TV — 1.06% | | | |
| 1,000,000 | | Charter Communications Holdings II | | 10.25 | | | 09/15/10 | | | 1,020,000 |
| 1,000,000 | | Charter Communications Holdings llc/ Charter Communications Holdings Capital Corp. | | 8.63 | | | 04/01/09 | | | 772,500 |
| | | | | | | | | |
|
|
| | | | | | | | | | | 1,792,500 |
| | | | | | | | | |
|
|
| | | CASINO HOTELS — 11.43% | | | |
| 2,000,000 | | Ameristar Casinos, Inc. | | 10.75 | | | 02/15/09 | | | 2,185,000 |
| 2,000,000 | | Aztar Corp. | | 7.88 | | | 06/15/14 | | | 2,125,000 |
| 1,000,000 | | Boyd Gaming Corp. | | 8.75 | | | 04/15/12 | | | 1,082,500 |
| 2,000,000 | | Caesars Entertainment, Inc. | | 8.88 | | | 09/15/08 | | | 2,192,500 |
| 1,680,000 | | Kerzner International, Ltd. | | 8.88 | | | 08/15/11 | | | 1,801,800 |
| 2,000,000 | | MGM Mirage, Inc. | | 8.50 | | | 09/15/10 | | | 2,190,000 |
| 2,000,000 | | Penn National Gaming, Inc. | | 8.88 | | | 03/15/10 | | | 2,120,000 |
| 2,000,000 | | Poster Financial Group | | 8.75 | | | 12/01/11 | | | 2,080,000 |
| 1,000,000 | | Resorts International Hotel and Casino, Inc. | | 11.50 | | | 03/15/09 | | | 1,138,750 |
| 2,250,000 | | River Rock Entertainment | | 9.75 | | | 11/01/11 | | | 2,463,750 |
| | | | | | | | | |
|
|
| | | | | | | | | | | 19,379,300 |
| | | | | | | | | |
|
|
| | | | | | | | | | |
Principal
| | | | Rate
| | | Maturity
Date
| | Value
|
| | | | | | | | | | | |
CORPORATE BONDS — (continued) |
| | | CELLULAR TELECOM — 3.18% | | | |
| $2,000,000 | | American Cellular Corp. | | 10.00 | % | | 08/01/11 | | $ | 1,840,000 |
| 1,000,000 | | Centennial Cellular Operating Co./ Centennial Communications Corp. | | 10.13 | | | 06/15/13 | | | 1,105,000 |
| 1,000,000 | | Dobson Communications Corp. | | 8.88 | | | 10/01/13 | | | 785,000 |
| 500,000 | | Rogers Wireless, Inc. | | 7.50 | | | 03/15/15 | | | 516,250 |
| 1,000,000 | | Western Wireless Corp. | | 9.25 | | | 07/15/13 | | | 1,140,000 |
| | | | | | | | | |
|
|
| | | | | | | | | | | 5,386,250 |
| | | | | | | | | |
|
|
| | | CHEMICALS – DIVERSIFIED — 3.27% | | | |
| 2,000,000 | | Equistar Chemicals
L.P./Equistar Funding Corp. | | 10.63 | | | 05/01/11 | | | 2,245,000 |
| 2,000,000 | | Lyondell Chemical Co. | | 9.50 | | | 12/15/08 | | | 2,140,000 |
| 1,000,000 | | Lyondell Chemical Co. | | 10.50 | | | 06/01/13 | | | 1,150,000 |
| | | | | | | | | |
|
|
| | | | | | | | | | | 5,535,000 |
| | | | | | | | | |
|
|
| | | CHEMICALS – PLASTICS — 1.29% | | | |
| 1,000,000 | | PolyOne Corp. | | 10.63 | | | 05/15/10 | | | 1,110,000 |
| 1,000,000 | | PolyOne Corp. | | 8.88 | | | 05/01/12 | | | 1,070,000 |
| | | | | | | | | |
|
|
| | | | | | | | | | | 2,180,000 |
| | | | | | | | | |
|
|
| | | CHEMICALS – SPECIALTY — 2.28% | | | |
| 1,500,000 | | Crompton Corp. | | 9.88 | | | 08/01/12 | | | 1,717,500 |
| 2,000,000 | | Johnsondiversey, Inc., Series B | | 9.63 | | | 05/15/12 | | | 2,150,000 |
| | | | | | | | | |
|
|
| | | | | | | | | | | 3,867,500 |
| | | | | | | | | |
|
|
| | | COMMERCIAL SERVICES — 1.77% | | | |
| 2,000,000 | | Iron Mountain, Inc. | | 8.63 | | | 04/01/13 | | | 2,020,000 |
| 1,000,000 | | Iron Mountain, Inc. | | 7.75 | | | 01/15/15 | | | 987,500 |
| | | | | | | | | |
|
|
| | | | | | | | | | | 3,007,500 |
| | | | | | | | | |
|
|
| | | COMPUTER SERVICES — 0.59% | | | |
| 1,000,000 | | Unisys Corp. | | 7.88 | | | 04/01/08 | | | 1,005,000 |
| | | | | | | | | |
|
|
| | | CONSUMER PRODUCTS – MISCELLANEOUS — 1.26% |
| 2,000,000 | | Armkel llc/ Armkel Finance | | 9.50 | | | 08/15/09 | | | 2,132,500 |
| | | | | | | | | |
|
|
| | | CONTAINERS – METAL/GLASS — 4.18% |
| 2,500,000 | | Ball Corp. | | 6.88 | | | 12/15/12 | | | 2,578,125 |
| 3,000,000 | | Crown European Holdings S.A. | | 10.88 | | | 03/01/13 | | | 3,480,000 |
| 1,000,000 | | Owens-Illinois, Inc. | | 7.50 | | | 05/15/10 | | | 1,030,000 |
| | | | | | | | | |
|
|
| | | | | | | | | | | 7,088,125 |
| | | | | | | | | |
|
|
See Notes to Financial Statements.
31
Excelsior Funds Trust
Portfolio of Investments — March 31, 2005
High Yield Fund — (continued)
| | | | | | | | | | |
Principal
| | | | Rate
| | | Maturity
Date
| | Value
|
| | | | | | | | | | | |
CORPORATE BONDS — (continued) |
| | | CONTAINERS – PAPER/PLASTIC — 3.32% |
| $2,000,000 | | Graham Packaging Co.(a) | | 8.50 | % | | 10/15/12 | | $ | 2,000,000 |
| 2,000,000 | | Radnor Holdings, Inc. | | 11.00 | | | 03/15/10 | | | 1,480,000 |
| 2,000,000 | | Stone Container Corp. | | 9.75 | | | 02/01/11 | | | 2,140,000 |
| | | | | | | | | |
|
|
| | | | | | | | | | | 5,620,000 |
| | | | | | | | | |
|
|
| | | COSMETICS & TOILETRIES — 0.42% |
| 750,000 | | Del Laboratories, Inc.(a) | | 8.00 | | | 02/01/12 | | | 720,000 |
| | | | | | | | | |
|
|
| | | DISTRIBUTION/WHOLESALE — 1.14% |
| 2,000,000 | | Nebraska Book Co. | | 8.63 | | | 03/15/12 | | | 1,935,000 |
| | | | | | | | | |
|
|
| | | DIVERSIFIED OPERATIONS — 0.73% | | | |
| 1,340,000 | | Stena AB | | 7.00 | | | 12/01/16 | | | 1,239,500 |
| | | | | | | | | |
|
|
| | | ELECTRIC – GENERATION — 0.97% |
| 1,500,000 | | AES Corp. | | 9.50 | | | 06/01/09 | | | 1,640,625 |
| | | | | | | | | |
|
|
| | | ELECTRIC – INTERGRATED — 2.68% |
| 2,000,000 | | CMS Energy Corp. | | 9.88 | | | 10/15/07 | | | 2,170,000 |
| 2,305,000 | | PSEG Energy Holdings, Inc. | | 7.75 | | | 04/16/07 | | | 2,368,388 |
| | | | | | | | | |
|
|
| | | | | | | | | | | 4,538,388 |
| | | | | | | | | |
|
|
| | | FORESTRY — 0.57% | | | |
| 1,000,000 | | Tembec Industries, Inc. | | 8.63 | | | 06/30/09 | | | 965,000 |
| | | | | | | | | |
|
|
| | | FUNERAL SERVICES & RELATED ITEMS — 1.22% |
| 1,000,000 | | Service Corp. International | | 7.70 | | | 04/15/09 | | | 1,030,000 |
| 1,000,000 | | Service Corp. International, Unsecured | | 7.70 | | | 04/15/09 | | | 1,030,000 |
| | | | | | | | | |
|
|
| | | | | | | | | | | 2,060,000 |
| | | | | | | | | |
|
|
| | | GAS – DISTRIBUTION — 1.22% |
| 2,000,000 | | SEMCO Energy, Inc. | | 7.75 | | | 05/15/13 | | | 2,066,338 |
| | | | | | | | | |
|
|
| | | HOME FURNISHINGS — 0.62% |
| 1,000,000 | | Sealy Mattress Co. | | 8.25 | | | 06/15/14 | | | 1,042,500 |
| | | | | | | | | |
|
|
| | | LIFE/HEALTH INSURANCE — 1.24% |
| 2,000,000 | | Americo Life, Inc.(a) | | 7.88 | | | 05/01/13 | | | 2,099,464 |
| | | | | | | | | |
|
|
| | | MACHINE TOOLS & RELATED PRODUCTS — 0.71% |
| 1,250,000 | | Thermadyne Holdings Corp. | | 9.25 | | | 02/01/14 | | | 1,200,000 |
| | | | | | | | | |
|
|
| | | MACHINERY – FARM — 1.24% |
| 2,000,000 | | AGCO Corp. | | 9.50 | | | 05/01/08 | | | 2,095,000 |
| | | | | | | | | |
|
|
| | | MEDICAL – DRUGS — 0.30% |
| 500,000 | | Warner Chilcott Corp.(a) | | 8.75 | | | 02/01/15 | | | 502,500 |
| | | | | | | | | |
|
|
| | | | | | | | | | |
Principal
| | | | Rate
| | | Maturity
Date
| | Value
|
| | | | | | | | | | | |
CORPORATE BONDS — (continued) |
| | | MEDICAL – HOSPITALS — 0.62% |
| $1,000,000 | | IASIS Healthcare
llc/ IASIS Capital Corp. | | 8.75 | % | | 06/15/14 | | $ | 1,042,500 |
| | | | | | | | | |
|
|
| | | MEDICAL PRODUCTS — 0.58% |
| 1,000,000 | | Encore Medical IHC, Inc.,(a) | | 9.75 | | | 10/01/12 | | | 975,000 |
| | | | | | | | | |
|
|
| | | METAL – ALUMINUM — 4.18% |
| 12,033,000 | | Ormet Corp., In Default(a) | | 11.00 | | | 08/15/08 | | | 7,099,470 |
| | | | | | | | | |
|
|
| | | METAL PROCESSORS & FABRICATORS — 0.32% |
| 500,000 | | Mueller Group, Inc. | | 10.00 | | | 05/01/12 | | | 540,000 |
| | | | | | | | | |
|
|
| | | MISCELLANEOUS MANUFACTURING — 1.63% |
| 2,000,000 | | IPC Acquisition Corp. | | 11.50 | | | 12/15/09 | | | 2,200,000 |
| 500,000 | | Reddy Ice Group, Inc. | | 8.88 | | | 08/01/11 | | | 556,250 |
| | | | | | | | | |
|
|
| | | | | | | | | | | 2,756,250 |
| | | | | | | | | |
|
|
| | | MULTI-LINE INSURANCE — 1.35% |
| 2,128,000 | | Allmerica Financial Corp. | | 7.63 | | | 10/15/25 | | | 2,279,875 |
| | | | | | | | | |
|
|
| | | MUSIC — 1.58% |
| 1,600,000 | | Warner Music Group | | 7.38 | | | 04/15/14 | | | 1,648,000 |
| 1,000,000 | | WMG Holdings Corp.(a) | | 7.39 | | | 12/15/11 | | | 1,025,000 |
| | | | | | | | | |
|
|
| | | | | | | | | | | 2,673,000 |
| | | | | | | | | |
|
|
| | | OFFICE AUTOMATION & EQUIPMENT — 1.52% |
| 1,000,000 | | Xerox Capital
Trust I | | 8.00 | | | 02/01/27 | | | 1,000,000 |
| 1,500,000 | | Xerox Corp. | | 7.63 | | | 06/15/13 | | | 1,567,500 |
| | | | | | | | | |
|
|
| | | | | | | | | | | 2,567,500 |
| | | | | | | | | |
|
|
| | | OIL – EXPLORATION & PRODUCTION — 0.94% |
| 1,500,000 | | Baytex Energy, Ltd. | | 9.63 | | | 07/15/10 | | | 1,590,000 |
| | | | | | | | | |
|
|
| | | OIL REFINING & MARKETING — 1.32% |
| 2,000,000 | | Premcor Refining Group, Inc. | | 9.50 | | | 02/01/13 | | | 2,235,000 |
| | | | | | | | | |
|
|
| | | PAPER & RELATED PRODUCTS — 4.88% |
| 2,500,000 | | Caraustar Industries, Inc. | | 9.88 | | | 04/01/11 | | | 2,625,000 |
| 2,000,000 | | Intertape Polymer US, Inc. | | 8.50 | | | 08/01/14 | | | 1,966,170 |
| 2,000,000 | | Mercer International, Inc. | | 9.25 | | | 02/15/13 | | | 1,890,000 |
| 1,750,000 | | Norske Skog Canada, Series D | | 8.63 | | | 06/15/11 | | | 1,811,250 |
| | | | | | | | | |
|
|
| | | | | | | | | | | 8,292,420 |
| | | | | | | | | |
|
|
See Notes to Financial Statements.
32
Excelsior Funds Trust
Portfolio of Investments — March 31, 2005
High Yield Fund — (continued)
| | | | | | | | | | |
Principal
| | | | Rate
| | | Maturity
Date
| | Value
|
| | | | | | | | | | | |
CORPORATE BONDS — (continued) |
| | | PHYSICIANS PRACTICE MANAGEMENT — 2.04% |
| $2,000,000 | | Ameripath, Inc. | | 10.50 | % | | 04/01/13 | | $ | 1,990,000 |
| 1,000,000 | | US Oncology Holdings, Inc.(a) | | 8.62 | | | 03/15/15 | | | 942,500 |
| 500,000 | | US Oncology Holdings, Inc.(a) | | 9.00 | | | 08/15/12 | | | 527,500 |
| | | | | | | | | |
|
|
| | | | | | | | | | | 3,460,000 |
| | | | | | | | | |
|
|
| | | REITS – HOTELS — 0.64% |
| 1,000,000 | | La Quinta Properties, Inc. | | 8.88 | | | 03/15/11 | | | 1,080,000 |
| | | | | | | | | |
|
|
| | | RENTAL AUTO/EQUIPMENT — 1.14% |
| 2,000,000 | | United Rentals, Inc. | | 7.75 | | | 11/15/13 | | | 1,940,000 |
| | | | | | | | | |
|
|
| | | RESORTS/THEME PARKS — 0.54% |
| 1,000,000 | | Six Flags, Inc. | | 9.63 | | | 06/01/14 | | | 922,500 |
| | | | | | | | | |
|
|
| | | RETAIL – ARTS & CRAFTS — 1.25% |
| 2,000,000 | | Michaels Stores, Inc. | | 9.25 | | | 07/01/09 | | | 2,112,500 |
| | | | | | | | | |
|
|
| | | RETAIL – DISCOUNT — 0.61% |
| 1,000,000 | | Shopko Stores | | 9.25 | | | 03/15/22 | | | 1,040,000 |
| | | | | | | | | |
|
|
| | | RETAIL – DRUG STORE — 1.15% |
| 2,000,000 | | Jean Coutu Group, Inc. | | 8.50 | | | 08/01/14 | | | 1,942,500 |
| | | | | | | | | |
|
|
| | | RETAIL – MAJOR DEPARTMENT STORE — 1.20% |
| 1,500,000 | | JC Penney Co., Inc. | | 8.00 | | | 03/01/10 | | | 1,500,000 |
| 500,000 | | Saks, Inc. | | 8.25 | | | 11/15/08 | | | 527,500 |
| | | | | | | | | |
|
|
| | | | | | | | | | | 2,027,500 |
| | | | | | | | | |
|
|
| | | SATELLITE TELECOM — 1.19% |
| 1,000,000 | | Inmarsat Finance plc | | 7.63 | | | 06/30/12 | | | 995,000 |
| 1,000,000 | | Intelsat Bermuda, Ltd.(a) | | 8.63 | | | 01/15/15 | | | 1,020,000 |
| | | | | | | | | |
|
|
| | | | | | | | | | | 2,015,000 |
| | | | | | | | | |
|
|
| | | SCHOOLS — 0.57% |
| 1,000,000 | | Knowledge Learning Center(a) | | 7.75 | | | 02/01/15 | | | 965,000 |
| | | | | | | | | |
|
|
| | | SEISMIC DATA COLLECTION — 1.24% |
| 1,997,000 | | Compagnie Generale de Geophysique S.A. | | 10.63 | | | 11/15/07 | | | 2,106,835 |
| | | | | | | | | |
|
|
| | | STEEL – PRODUCERS — 1.45% |
| 1,000,000 | | AK Steel Corp. | | 7.75 | | | 06/15/12 | | | 962,500 |
| 1,298,000 | | United States Steel, Inc. | | 10.75 | | | 08/01/08 | | | 1,492,700 |
| | | | | | | | | |
|
|
| | | | | | | | | | | 2,455,200 |
| | | | | | | | | |
|
|
| | | TELEPHONE – INTERGRATED — 6.71% |
| 3,000,000 | | Cincinnati Bell, Inc. | | 8.38 | | | 01/15/14 | | | 2,955,000 |
| 500,000 | | Cincinnati Bell, Inc., MTN | | 6.33 | | | 12/30/05 | | | 497,500 |
| 1,000,000 | | Citizens Communications | | 9.25 | | | 05/15/11 | | | 1,095,000 |
| 1,000,000 | | Consolidated Communications Holdings, Inc.(a) | | 9.75 | | | 04/01/12 | | | 1,060,000 |
| | | | | | | | | | |
Principal
| | | | Rate
| | | Maturity
Date
| | Value
|
| | | | | | | | | | | |
CORPORATE BONDS — (continued) |
| | | TELEPHONE – INTERGRATED — (continued) |
| $1,000,000 | | Eircom Funding | | 8.25 | % | | 08/15/13 | | $ | 1,087,500 |
| 1,000,000 | | Madison River Capital llc/ Madison River Financial Corp. | | 13.25 | | | 03/01/10 | | | 1,070,000 |
| 3,000,000 | | Qwest Services Corp.(a) | | 14.50 | | | 12/15/14 | | | 3,622,500 |
| | | | | | | | | |
|
|
| | | | | | | | | | | 11,387,500 |
| | | | | | | | | |
|
|
| | | TRANSPORTATION – MARINE — 1.98% |
| 3,000,000 | | Overseas Shipholding Group | | 8.75 | | | 12/01/13 | | | 3,360,000 |
| | | | | | | | | |
|
|
| | | TRANSPORTATION – RAIL — 1.13% |
| 1,750,000 | | Kansas City Southern | | 9.50 | | | 10/01/08 | | | 1,907,500 |
| | | | | | | | | |
|
|
| | | TOTAL CORPORATE BONDS
(Cost $162,745,201) | | | 162,285,456 |
| | | | | | | | | |
|
|
U.S. GOVERNMENT & AGENCY OBLIGATION — 2.18% |
| | | FEDERAL HOME LOAN BANK – DISCOUNT
NOTE — 2.18% |
| 3,700,000 | | | | 2.38 | | | 04/01/05 | | | 3,699,755 |
| | | | | | | | | |
|
|
| | | TOTAL U.S. GOVERNMENT & AGENCY OBLIGATION
(Cost $3,700,000) | | | 3,699,755 |
| | | | | | | | | |
|
|
| | | | | | |
TOTAL INVESTMENTS
(Cost $166,457,693)(b) | | 97.96 | % | | $ | 165,985,211 |
OTHER ASSETS IN EXCESS OF LIABILITIES | | 2.04 | | | | 3,461,857 |
| | |
|
| |
|
|
NET ASSETS | | 100.00 | % | | $ | 169,447,068 |
| | |
|
| |
|
|
| (a) | Security exempt from registration under Rule 144A of the Securities Act of 1933. This security may be resold in transactions exempt from registration, normally to qualified institutional buyers. At March 31, 2005, these securities amounted to $26,491,434 or 15.63% of net assets. |
| (b) | Unrealized appreciation (depreciation) of securities: |
| | | | |
Unrealized
Appreciation
| | Unrealized
(Depreciation)
| | Net Unrealized
Appreciation/
(Depreciation)
|
$4,824,005 | | $(5,296,487) | | $(472,482) |
Discount Note—The rate reported on the Portfolio of Investments is the discount rate at the time of purchase.
In Default—Security in default on interest payments
llc—Limited Liability Company
L.P.—Limited Partnership
Ltd.—Limited
MTN—Medium Term Note
plc—public limited company
Unsecured—Issued in exchange of 144A security
See Notes to Financial Statements.
33
Excelsior Funds Trust
Portfolio of Investments — March 31, 2005
High Yield Fund — (continued)
The summary of the Fund’s investments as of March 31, 2005 is as follows: (Unaudited)
| | | | | | |
Sector Diversification
| | % of
Net
Assets
| | | Market Value
|
Consumer Discretionary | | 30.20 | % | | $ | 51,174,016 |
Raw/Intermediate Materials | | 27.96 | | | | 47,382,915 |
Telecommunication | | 9.90 | | | | 16,773,750 |
Technology | | 5.25 | | | | 8,889,335 |
Industrials | | 5.10 | | | | 8,638,250 |
Energy | | 4.94 | | | | 8,363,388 |
Health Care | | 4.75 | | | | 8,040,000 |
Financials | | 2.58 | | | | 4,379,339 |
Utilities | | 2.19 | | | | 3,706,963 |
U.S. Government & Agency Obligations | | 2.18 | | | | 3,699,755 |
Consumer Staples | | 1.68 | | | | 2,852,500 |
Real Estate | | 0.64 | | | | 1,080,000 |
Information Technology | | 0.59 | | | | 1,005,000 |
| | |
|
| |
|
|
Total Investment | | 97.96 | % | | $ | 165,985,211 |
Other Assets and Liabilities (Net) | | 2.04 | | | | 3,461,857 |
| | |
|
| |
|
|
Net Assets | | 100.00 | % | | $ | 169,447,068 |
| | |
|
| |
|
|
See Notes to Financial Statements.
34
Excelsior Funds Trust
Portfolio of Investments — March 31, 2005
Equity Core Fund
| | | | | |
Shares
| | | | Value
|
| | | | | |
| COMMON STOCKS — 92.86% | | |
| | | CONSUMER DISCRETIONARY — 16.21% |
| 28,422 | | Autozone, Inc.(a) | | $ | 2,435,764 |
| 82,193 | | Dillards, Inc., Class A | | | 2,210,992 |
| 72,378 | | Eastman Kodak Co. | | | 2,355,904 |
| 107,406 | | Furniture Brands International, Inc. | | | 2,342,525 |
| 66,505 | | John Wiley & Sons, Class A | | | 2,344,301 |
| 68,517 | | Leggett & Platt, Inc. | | | 1,978,771 |
| 29,733 | | Timberland Co., Class A(a) | | | 2,108,962 |
| | | | |
|
|
| | | | | | 15,777,219 |
| | | | |
|
|
| | | CONSUMER STAPLES — 7.51% |
| 52,157 | | Anheuser Busch Cos., Inc. | | | 2,471,720 |
| 69,643 | | Sysco Corp. | | | 2,493,220 |
| 35,839 | | Wm. Wrigley Jr. Co. | | | 2,349,963 |
| | | | |
|
|
| | | | | | 7,314,903 |
| | | | |
|
|
| | | ENERGY — 5.06% |
| 43,660 | | Exxon Mobil Corp. | | | 2,602,136 |
| 57,932 | | Suncor Energy, Inc. | | | 2,329,446 |
| | | | |
|
|
| | | | | | 4,931,582 |
| | | | |
|
|
| | | FINANCIAL — 13.89% |
| 75,338 | | American Capital Strategies Ltd. | | | 2,366,367 |
| 41,348 | | American International Group, Inc. | | | 2,291,093 |
| 28 | | Berkshire Hathaway, Inc., Class A(a) | | | 2,435,999 |
| 21,535 | | Lehman Brothers Holding, Inc. | | | 2,027,736 |
| 73,578 | | North Fork Bancorporation, Inc. | | | 2,041,054 |
| 50,672 | | RenaissanceRe Holdings Ltd. | | | 2,366,382 |
| | | | |
|
|
| | | | | | 13,528,631 |
| | | | |
|
|
| | | HEALTH CARE — 10.38% |
| 38,533 | | Johnson & Johnson | | | 2,587,876 |
| 48,163 | | Medtronic, Inc. | | | 2,453,905 |
| 45,223 | | Novo-Nordisk A/S ADR | | | 2,524,348 |
| 47,311 | | Roche Holdings Ltd., Sponsored ADR | | | 2,544,371 |
| | | | |
|
|
| | | | | | 10,110,500 |
| | | | |
|
|
| | | INDUSTRIALS — 7.97% |
| 1,164,791 | | Bombardier, Inc., Class B | | | 2,598,649 |
| 70,752 | | General Electric Co. | | | 2,551,317 |
| 342,999 | | Quanta Services, Inc.(a) | | | 2,617,082 |
| | | | |
|
|
| | | | | | 7,767,048 |
| | | | |
|
|
| | | INFORMATION TECHNOLOGY — 12.00% |
| 563,849 | | 3com Corp.(a) | | | 2,007,302 |
| 67,785 | | Analog Devices, Inc. | | | 2,449,750 |
| 98,847 | | Molex, Inc., Class A | | | 2,332,789 |
| 88,343 | | National Instruments Corp. | | | 2,389,678 |
| 55,607 | | Pitney Bowes, Inc. | | | 2,508,989 |
| | | | |
|
|
| | | | | | 11,688,508 |
| | | | |
|
|
| | | | | |
Shares
| | | | Value
|
| | | | | |
| COMMON STOCKS — (continued) | | |
| | | RAW/INTERMEDIATE MATERIALS — 10.12% |
| 67,485 | | Aracruz Cellulose S.A. ADR | | $ | 2,415,963 |
| 48,717 | | E.I. Du Pont de Nemours & Co. | | | 2,496,259 |
| 36,733 | | Monsanto Co /New | | | 2,369,279 |
| 45,244 | | Vulcan Materials Company | | | 2,571,216 |
| | | | |
|
|
| | | | | | 9,852,717 |
| | | | |
|
|
| | | REAL ESTATE — 2.14% |
| 31,000 | | St. Joe Co. | | | 2,086,300 |
| | | | |
|
|
| | | UTILITIES — 7.58% |
| 163,116 | | AES Corp.(a) | | | 2,671,840 |
| 180,250 | | Centerpoint Energy, Inc. | | | 2,168,408 |
| 240,812 | | EL Paso Corp. | | | 2,547,791 |
| | | | |
|
|
| | | | | | 7,388,039 |
| | | | |
|
|
| | | TOTAL COMMON STOCKS
(Cost $89,999,131) | | | 90,445,447 |
| | | | |
|
|
| FOREIGN COMMON STOCKS — 2.60% |
| | | GERMANY — 2.60% |
| 55,897 | | Bayerische Motoren Werke AG | | | 2,535,601 |
| | | | |
|
|
| | | TOTAL FOREIGN
COMMON STOCKS
(Cost $2,486,080) | | | 2,535,601 |
| | | | |
|
|
Principal
| | | | |
| REPURCHASE AGREEMENT — 4.98% | | |
| $4,851,000 | | JP Morgan Chase Securities, Inc., 2.30%, dated 3/31/05, to be repurchased 4/01/05, repurchase price $4,851,310 (collateralized by Federal National Mortgage Association MTN, par value $4,845,000, 4.63%, maturing 10/15/14; total market value $4,954,334) | | | 4,851,000 |
| | | | |
|
|
| | | TOTAL REPURCHASE AGREEMENT
(Cost $4,851,000) | | | 4,851,000 |
| | | | |
|
|
| | | | | | | | | |
TOTAL INVESTMENTS
(Cost $97,336,211)(b) | | 100.44 | % | | $ | 97,832,048 | |
LIABILITIES IN EXCESS OF
OTHER ASSETS | | | | (0.44 | ) | | | (426,415 | ) |
| | |
| |
|
| |
|
|
|
NET ASSETS | | | | 100.00 | % | | $ | 97,405,633 | |
| | |
| |
|
| |
|
|
|
| (a) | Non-income producing security. |
| (b) | Unrealized appreciation (depreciation) of securities: |
| | | | |
Unrealized
Appreciation
| | Unrealized
(Depreciation)
| | Net Unrealized
Appreciation/
(Depreciation)
|
| $3,409,171 | | $(2,913,334) | | $495,837 |
ADR—American Depository Receipt
MTN—Medium Term Note
See Notes to Financial Statements.
35
Excelsior Funds Trust
Portfolio of Investments — March 31, 2005
Equity Core Fund — (continued)
The summary of the Fund’s investments as of March 31, 2005 is as follows: (Unaudited)
| | | | | | | |
Sector Diversification
| | % of
Net
Assets
| | | Market Value
| |
Consumer Discretionary | | 18.81 | % | | $ | 18,312,820 | |
Financial | | 13.89 | | | | 13,528,631 | |
Information Technology | | 12.00 | | | | 11,688,508 | |
Health Care | | 10.38 | | | | 10,110,500 | |
Raw/Intermediate Materials | | 10.12 | | | | 9,852,717 | |
Industrials | | 7.97 | | | | 7,767,048 | |
Utilities | | 7.58 | | | | 7,388,039 | |
Consumer Staples | | 7.51 | | | | 7,314,903 | |
Energy | | 5.06 | | | | 4,931,582 | |
Repurchase Agreements | | 4.98 | | | | 4,851,000 | |
Real Estate | | 2.14 | | | | 2,086,300 | |
| | |
|
| |
|
|
|
Total Investment | | 100.44 | % | | $ | 97,832,048 | |
Other Assets and Liabilities (Net) | | (0.44 | ) | | | (426,415 | ) |
| | |
|
| |
|
|
|
Net Assets | | 100.00 | % | | $ | 97,405,633 | |
| | |
|
| |
|
|
|
See Notes to Financial Statements.
36
[THIS PAGE INTENTIONALLY LEFT BLANK]
Excelsior Funds
Statements of Assets and Liabilities
March 31, 2005
| | | | | | | | | | | | |
| | | |
| | | Money
Fund
| | | Value and
Restructuring
Fund
| | | Mid Cap
Value
Fund
| |
ASSETS: | | | | | | | | | | | | |
Investments, at cost — see accompanying portfolios | | $ | 1,596,594,915 | | | $ | 3,410,712,053 | | | $ | 222,373,723 | |
| | |
|
|
| |
|
|
| |
|
|
|
Investments, at value (including Repurchase Agreements) (Note 1) | | $ | 1,596,594,915 | | | $ | 4,627,490,310 | | | $ | 296,024,691 | |
Cash | | | — | | | | 225,238 | | | | 25,086 | |
Foreign currency
(cost $0, $0, $0, $155,012, $0, $0, $0, $0 respectively) | | | — | | | | — | | | | — | |
Dividends and interest receivable | | | 584,798 | | | | 6,369,844 | | | | 357,646 | |
Receivable for investments sold | | | 149,704,688 | | | | 939,466 | | | | — | |
Receivable for fund shares sold | | | 26,723,967 | | | | 13,216,442 | | | | 459,092 | |
Foreign withholding tax receivable | | | — | | | | — | | | | — | |
| | |
|
|
| |
|
|
| |
|
|
|
Total Assets | | | 1,773,608,368 | | | | 4,648,241,300 | | | | 296,866,515 | |
| | |
|
|
| |
|
|
| |
|
|
|
LIABILITIES: | | | | | | | | | | | | |
Payable for investments purchased | | | — | | | | 7,476,843 | | | | — | |
Options written, at value (Premiums received: Value and Restructuring Fund — $2,633,972) | | | — | | | | 1,993,420 | | | | — | |
Payable for fund shares redeemed | | | 39,937,498 | | | | 3,182,790 | | | | 112,965 | |
Payable for dividends declared | | | 2,587,123 | | | | — | | | | — | |
Investment advisory fees payable (Note 2) | | | 35,632 | | | | 2,377,259 | | | | 146,134 | |
Administration fees payable (Note 2) | | | 205,957 | | | | 594,778 | | | | 40,142 | |
Shareholder servicing fees payable (Note 2) | | | 240,885 | | | | 1,364,406 | | | | 117,275 | |
Directors’/Trustees’ fees and expenses payable (Note 2) | | | — | | | | — | | | | 32 | |
Cash overdraft | | | — | | | | — | | | | — | |
Accrued expenses and other payables | | | 260,858 | | | | 1,159,878 | | | | 34,279 | |
| | |
|
|
| |
|
|
| |
|
|
|
Total Liabilities | | | 43,267,953 | | | | 18,149,374 | | | | 450,827 | |
| | |
|
|
| |
|
|
| |
|
|
|
NET ASSETS | | $ | 1,730,340,415 | | | $ | 4,630,091,926 | | | $ | 296,415,688 | |
| | |
|
|
| |
|
|
| |
|
|
|
NET ASSETS consist of: | | | | | | | | | | | | |
Undistributed (distributions in excess of) net investment income | | $ | — | | | $ | 8,690,692 | | | $ | 388,063 | |
Accumulated net realized gain (loss) on investments, foreign currency transactions and written options | | | (35,637 | ) | | | (165,739,268 | ) | | | (146,340 | ) |
Unrealized appreciation (depreciation) of investments, foreign currency translations and written options | | | — | | | | 1,217,406,843 | | | | 73,650,968 | |
Par value (Note 5) | | | 1,730,581 | | | | 111,826 | | | | 177 | |
Paid in capital in excess of par value | | | 1,728,645,471 | | | | 3,569,621,833 | | | | 222,522,820 | |
| | |
|
|
| |
|
|
| |
|
|
|
Net Assets | | $ | 1,730,340,415 | | | $ | 4,630,091,926 | | | $ | 296,415,688 | |
| | |
|
|
| |
|
|
| |
|
|
|
Net Assets: | | | | | | | | | | | | |
Institutional Shares | | $ | 625,287,251 | | | $ | 161,015,995 | | | $ | 81,570,415 | |
Shares | | | 1,105,053,164 | | | | 4,469,074,789 | | | | 214,844,139 | |
Retirement Shares | | | — | | | | 1,142 | | | | 1,134 | |
Shares outstanding (Note 5): | | | | | | | | | | | | |
Institutional Shares | | | 625,288,256 | | | | 3,888,844 | | | | 4,852,989 | |
Shares | | | 1,105,292,365 | | | | 107,937,578 | | | | 12,808,139 | |
Retirement Shares | | | — | | | | 28 | | | | 68 | |
NET ASSET VALUE PER SHARE (net assets ÷ shares outstanding): | | | | | | | | | | | | |
Institutional Shares | | | $1.00 | | | | $41.40 | | | | $16.81 | |
| | |
|
|
| |
|
|
| |
|
|
|
Shares | | | $1.00 | | | | $41.40 | | | | $16.77 | |
| | |
|
|
| |
|
|
| |
|
|
|
Retirement Shares | | | — | | | | $41.49 | | | | $16.78 | |
| | |
|
|
| |
|
|
| |
|
|
|
See Notes to Financial Statements.
38
| | | | | | | | | | | | | | | | |
| | | | |
International
Equity
Fund
| | | Total Return
Bond
Fund
| | Income
Fund
| | | High
Yield
Fund
| | | Equity
Core
Fund
|
| | | | | | | | | | | | | | | | | |
| $ | 34,649,315 | | | $ | 145,861,543 | | $ | 104,167,265 | | | $ | 166,457,693 | | | $ | 97,336,211 |
|
|
| |
|
| |
|
|
| |
|
|
| |
|
|
$ |
42,959,606 |
| | $ | 149,170,701 | | $ | 104,294,747 | | | $ | 165,985,211 | | | $ | 97,832,048 |
| | — | | | | — | | | — | | | | — | | | | 214,386 |
|
151,999 |
| | | — | | | — | | | | — | | | | — |
| | 118,572 | | | | 1,195,869 | | | 703,193 | | | | 3,770,987 | | | | 70,477 |
| | 863,667 | | | | 3,787,148 | | | 5,031,659 | | | | 1,252,132 | | | | — |
| | — | | | | 289,663 | | | — | | | | 920,433 | | | | 419,000 |
| | 31,660 | | | | — | | | — | | | | — | | | | 6,212 |
|
|
| |
|
| |
|
|
| |
|
|
| |
|
|
| | 44,125,504 | | | | 154,443,381 | | | 110,029,599 | | | | 171,928,763 | | | | 98,542,123 |
|
|
| |
|
| |
|
|
| |
|
|
| |
|
|
| | | | | | | | | | | | | | | | | |
| | — | | | | 4,742,044 | | | 5,369,824 | | | | 525,028 | | | | 958,864 |
| | — | | | | — | | | — | | | | — | | | | — |
| | 15,600 | | | | 398 | | | — | | | | 890,048 | | | | 123,453 |
| | — | | | | 518,292 | | | 280,686 | | | | 753,861 | | | | — |
| | 18,031 | | | | 32,435 | | | 21,182 | | | | 78,832 | | | | 28,797 |
| | 7,712 | | | | 19,534 | | | 13,637 | | | | 23,025 | | | | 10,652 |
| | — | | | | 7,679 | | | — | | | | 35,843 | | | | 7,225 |
| | — | | | | 34 | | | 9 | | | | 45 | | | | — |
| | 621,603 | | | | — | | | — | | | | 120,143 | | | | — |
| | 23,152 | | | | 40,332 | | | 33,279 | | | | 54,870 | | | | 7,499 |
|
|
| |
|
| |
|
|
| |
|
|
| |
|
|
| | 686,098 | | | | 5,360,748 | | | 5,718,617 | | | | 2,481,695 | | | | 1,136,490 |
|
|
| |
|
| |
|
|
| |
|
|
| |
|
|
| $ | 43,439,406 | | | $ | 149,082,633 | | $ | 104,310,982 | | | $ | 169,447,068 | | | $ | 97,405,633 |
|
|
| |
|
| |
|
|
| |
|
|
| |
|
|
| | | | | | | | | | | | | | | | | |
| $ | 421,803 | | | $ | 3,298 | | $ | (1,454 | ) | | $ | (1,124,014 | ) | | $ | 96,881 |
| | | | | | | | | | | | | | | | | |
| | (19,647,716 | ) | | | 563,701 | | | 5,561 | | | | (61,284,586 | ) | | | 8,255 |
| | | | | | | | | | | | | | | | | |
| | 8,310,856 | | | | 3,309,158 | | | 127,482 | | | | (472,482 | ) | | | 495,790 |
| | 56 | | | | 205 | | | 150 | | | | 363 | | | | 89 |
| | 54,354,407 | | | | 145,206,271 | | | 104,179,243 | | | | 232,327,787 | | | | 96,804,618 |
|
|
| |
|
| |
|
|
| |
|
|
| |
|
|
| $ | 43,439,406 | | | $ | 149,082,633 | | $ | 104,310,982 | | | $ | 169,447,068 | | | $ | 97,405,633 |
|
|
| |
|
| |
|
|
| |
|
|
| |
|
|
| | | | | | | | | | | | | | | | | |
| $ | 43,439,406 | | | $ | 149,082,633 | | $ | 104,310,982 | | | $ | 13,307,909 | | | $ | 53,826,466 |
| | — | | | | — | | | — | | | | 156,139,159 | | | | 43,579,167 |
| | — | | | | — | | | — | | | | — | | | | — |
| | | | | | | | | | | | | | | | | |
| | 5,565,759 | | | | 20,455,951 | | | 14,980,402 | | | | 2,853,076 | | | | 4,900,329 |
| | — | | | | — | | | — | | | | 33,455,324 | | | | 3,969,574 |
| | — | | | | — | | | — | | | | — | | | | — |
| | | | | | | | | | | | | | | | | |
| | $7.80 | | | | $7.29 | | | $6.96 | | | | $4.66 | | | | $10.98 |
|
|
| |
|
| |
|
|
| |
|
|
| |
|
|
| | — | | | | — | | | — | | | | $4.67 | | | | $10.98 |
|
|
| |
|
| |
|
|
| |
|
|
| |
|
|
| | — | | | | — | | | — | | | | — | | | | — |
|
|
| |
|
| |
|
|
| |
|
|
| |
|
|
See Notes to Financial Statements.
39
Excelsior Funds
Statements of Operations
For the Year Ended March 31, 2005
| | | | | | | | | | | | |
| | | |
| | | Money
Fund
| | | Value and
Restructuring
Fund
| | | Mid Cap
Value
Fund
| |
INVESTMENT INCOME: | | | | | | | | | | | | |
Dividend income | | $ | — | | | $ | 74,083,694 | | | $ | 7,606,258 | |
Interest income | | | 27,818,905 | | | | 844,797 | | | | 52,134 | |
Less: Foreign taxes withheld | | | — | | | | (844,437 | ) | | | (66,107 | ) |
| | |
|
|
| |
|
|
| |
|
|
|
Total Income | | | 27,818,905 | | | | 74,084,054 | | | | 7,592,285 | |
| | |
|
|
| |
|
|
| |
|
|
|
EXPENSES: | | | | | | | | | | | | |
Investment advisory fees (Note 2) | | | 4,004,089 | | | | 22,824,694 | | | | 1,982,815 | |
Shareholder servicing fees — Shares (Note 2) | | | 2,860,544 | | | | 9,095,957 | | | | 501,132 | |
Shareholder servicing fees — Institutional Shares (Note 2) | | | — | | | | — | | | | 78,304 | |
Administration fees (Note 2) | | | 2,424,662 | | | | 5,757,405 | | | | 462,079 | |
Transfer agent fees | | | 127,811 | | | | 1,733,417 | | | | 114,517 | |
Legal and audit fees | | | 315,004 | | | | 801,738 | | | | 85,678 | |
Re-audit expenses (Note 2) | | | 118,853 | | | | 267,371 | | | | 27,416 | |
Custodian fees | | | 66,509 | | | | 172,635 | | | | 14,936 | |
Registration and filing fees | | | 49,104 | | | | 100,852 | | | | 38,415 | |
Shareholder reports | | | 72,274 | | | | 373,999 | | | | 30,099 | |
Directors’/Trustees’ fees and expenses (Note 2) | | | 45,115 | | | | 98,402 | | | | 12,616 | |
Amortization of offering costs | | | — | | | | — | | | | — | |
Miscellaneous expenses | | | 82,346 | | | | 212,159 | | | | 18,999 | |
| | |
|
|
| |
|
|
| |
|
|
|
Total Expenses | | | 10,166,311 | | | | 41,438,629 | | | | 3,367,006 | |
| | |
|
|
| |
|
|
| |
|
|
|
Fees waived and reimbursed by: | | | | | | | | | | | | |
Investment Adviser (Note 2) | | | (3,555,089 | ) | | | — | | | | (222,455 | ) |
Administrator (Note 2) | | | (273,411 | ) | | | (557,110 | ) | | | (47,237 | ) |
Re-audit expenses paid by Investment Adviser (Note 2) | | | (118,853 | ) | | | (267,371 | ) | | | (27,416 | ) |
| | |
|
|
| |
|
|
| |
|
|
|
Net Expenses | | | 6,218,958 | | | | 40,614,148 | | | | 3,069,898 | |
| | |
|
|
| |
|
|
| |
|
|
|
NET INVESTMENT INCOME | | | 21,599,947 | | | | 33,469,906 | | | | 4,522,387 | |
| | |
|
|
| |
|
|
| |
|
|
|
REALIZED AND UNREALIZED GAIN (LOSS) ON INVESTMENTS (NOTE 1): | | | | | | | | | | | | |
Net realized gain (loss) on: | | | | | | | | | | | | |
Security transactions | | | 6,919 | | | | 25,789,853 | | | | 12,483,472 | |
Foreign currency transactions | | | — | | | | 101 | | | | 2,133 | |
Written options | | | — | | | | 2,015,708 | | | | — | |
| | |
|
|
| |
|
|
| |
|
|
|
Total net realized gain | | | 6,919 | | | | 27,805,662 | | | | 12,485,605 | |
Change in unrealized appreciation (depreciation) of investments, foreign currency translations and written options during the year | | | — | | | | 348,650,183 | | | | 10,433,850 | |
| | |
|
|
| |
|
|
| |
|
|
|
Net realized and unrealized gain (loss) on investments, foreign currency transactions and written options | | | 6,919 | | | | 376,455,845 | | | | 22,919,455 | |
| | |
|
|
| |
|
|
| |
|
|
|
Net increase in net assets resulting from operations | | $ | 21,606,866 | | | $ | 409,925,751 | | | $ | 27,441,842 | |
| | |
|
|
| |
|
|
| |
|
|
|
See Notes to Financial Statements.
40
| | | | | | | | | | | | | | | | | | |
| | | | |
International
Equity
Fund
| | | Total Return
Bond
Fund
| | | Income
Fund
| | | High
Yield
Fund
| | | Equity
Core
Fund
| |
| | | | | | | | | | | | | | | | | | | |
| $ | 847,205 | | | $ | — | | | $ | — | | | $ | — | | | $ | 326,946 | |
| | 11,842 | | | | 7,507,583 | | | | 5,178,284 | | | | 14,252,775 | | | | 40,473 | |
| | (100,659 | ) | | | — | | | | — | | | | — | | | | (8,499 | ) |
|
|
| |
|
|
| |
|
|
| |
|
|
| |
|
|
|
| | 758,388 | | | | 7,507,583 | | | | 5,178,284 | | | | 14,252,775 | | | | 358,920 | |
|
|
| |
|
|
| |
|
|
| |
|
|
| |
|
|
|
| | | | | | | | | | | | | | | | | | | |
| | 363,572 | | | | 990,601 | | | | 725,570 | | | | 1,479,257 | | | | 150,883 | |
| | — | | | | — | | | | — | | | | 391,840 | | | | 7,876 | |
| | 64 | | | | 15,239 | | | | 514 | | | | — | | | | — | |
| | 72,715 | | | | 230,895 | | | | 169,124 | | | | 280,116 | | | | 30,439 | |
| | 10,143 | | | | 11,580 | | | | 11,160 | | | | 45,470 | | | | 11,690 | |
| | 24,807 | | | | 47,142 | | | | 38,724 | | | | 54,921 | | | | 12,695 | |
| | 7,305 | | | | 15,455 | | | | 12,508 | | | | 17,634 | | | | 3,293 | |
| | 32,740 | | | | 13,118 | | | | 14,188 | | | | 8,603 | | | | 5,256 | |
| | 16,401 | | | | 21,707 | | | | 21,305 | | | | 41,659 | | | | 3,438 | |
| | 2,718 | | | | 13,151 | | | | 8,521 | | | | 16,899 | | | | 4,217 | |
| | 1,617 | | | | 7,409 | | | | 5,159 | | | | 8,164 | | | | 397 | |
| | — | | | | — | | | | — | | | | — | | | | 74,592 | |
| | 7,711 | | | | 19,105 | | | | 23,777 | | | | 24,568 | | | | 2,552 | |
|
|
| |
|
|
| |
|
|
| |
|
|
| |
|
|
|
| | 539,793 | | | | 1,385,402 | | | | 1,030,550 | | | | 2,369,131 | | | | 307,328 | |
|
|
| |
|
|
| |
|
|
| |
|
|
| |
|
|
|
| | | | | | | | | | | | | | | | | | | |
| | (199,076 | ) | | | (580,845 | ) | | | (439,551 | ) | | | (451,580 | ) | | | (100,187 | ) |
| | (5,562 | ) | | | (25,533 | ) | | | (19,160 | ) | | | (29,194 | ) | | | (1,008 | ) |
| | (7,305 | ) | | | (15,455 | ) | | | (12,508 | ) | | | (17,634 | ) | | | (3,293 | ) |
|
|
| |
|
|
| |
|
|
| |
|
|
| |
|
|
|
| | 327,850 | | | | 763,569 | | | | 559,331 | | | | 1,870,723 | | | | 202,840 | |
|
|
| |
|
|
| |
|
|
| |
|
|
| |
|
|
|
| | 430,538 | | | | 6,744,014 | | | | 4,618,953 | | | | 12,382,052 | | | | 156,080 | |
|
|
| |
|
|
| |
|
|
| |
|
|
| |
|
|
|
| | | | | | | | | | | | | | | | | | | |
| | | | | | | | | | | | | | | | | | | |
| | | | | | | | | | | | | | | | | | | |
| | 4,320,742 | | | | 606,338 | | | | 467,060 | | | | 1,684,436 | | | | 20,575 | |
| | (8,889 | ) | | | — | | | | — | | | | — | | | | (2,893 | ) |
| | — | | | | — | | | | — | | | | — | | | | — | |
|
|
| |
|
|
| |
|
|
| |
|
|
| |
|
|
|
| | 4,311,853 | | | | 606,338 | | | | 467,060 | | | | 1,684,436 | | | | 17,682 | |
|
940,094 |
| | | (6,549,134 | ) | | | (3,580,154 | ) | | | (3,437,364 | ) | | | 495,790 | |
|
|
| |
|
|
| |
|
|
| |
|
|
| |
|
|
|
| | | | | | | | | | | | | | | | | | | |
| | 5,251,947 | | | | (5,942,796 | ) | | | (3,113,094 | ) | | | (1,752,928 | ) | | | 513,472 | |
|
|
| |
|
|
| |
|
|
| |
|
|
| |
|
|
|
| $ | 5,682,485 | | | $ | 801,218 | | | $ | 1,505,859 | | | $ | 10,629,124 | | | $ | 669,552 | |
|
|
| |
|
|
| |
|
|
| |
|
|
| |
|
|
|
See Notes to Financial Statements.
41
Excelsior Funds
Statements of Changes in Net Assets
| | | | | | | | |
| |
| | | Money Fund
| |
| | | Year Ended March 31,
| |
| | | 2005
| | | 2004
| |
Net investment income | | $ | 21,599,947 | | | $ | 14,865,550 | |
Net realized gain (loss) on investments and foreign currency transactions | | | 6,919 | | | | (23,975 | ) |
Net realized gain (loss) on written options | | | — | | | | — | |
Change in unrealized appreciation of investments, foreign currency translations and written options during the year | | | — | | | | — | |
| | |
|
|
| |
|
|
|
Net increase in net assets resulting from operations | | | 21,606,866 | | | | 14,841,575 | |
| | |
|
|
| |
|
|
|
Distributions to shareholders: | | | | | | | | |
From net investment income | | | | | | | | |
Institutional Shares | | | (6,978,835 | ) | | | (4,902,755 | ) |
Shares | | | (14,621,112 | ) | | | (9,962,795 | ) |
| | |
|
|
| |
|
|
|
Total distributions | | | (21,599,947 | ) | | | (14,865,550 | ) |
| | |
|
|
| |
|
|
|
Increase (decrease) in net assets from fund share transactions (Note 5): | | | | | | | | |
Institutional Shares | | | 155,097,235 | | | | (77,930,018 | ) |
Shares | | | (36,514,934 | ) | | | (646,272,448 | ) |
Retirement Shares | | | — | | | | — | |
| | |
|
|
| |
|
|
|
Total from fund share transactions | | | 118,582,301 | | | | (724,202,466 | ) |
| | |
|
|
| |
|
|
|
Net increase (decrease) in net assets | | | 118,589,220 | | | | (724,226,441 | ) |
| | |
|
|
| |
|
|
|
NET ASSETS: | | | | | | | | |
Beginning of year | | | 1,611,751,195 | | | | 2,335,977,636 | |
| | |
|
|
| |
|
|
|
End of year (1) | | $ | 1,730,340,415 | | | $ | 1,611,751,195 | |
| | |
|
|
| |
|
|
|
(1) Including undistributed net investment income (accumulated net investment loss) | | $ | — | | | $ | — | |
| | |
|
|
| |
|
|
|
See Notes to Financial Statements.
42
| | | | | | | | | | | | | | | | | | | | | | |
| | |
Value and Restructuring Fund
| | | Mid Cap Value Fund
| | | International Equity Fund
| |
Year Ended March 31,
| | | Year Ended March 31,
| | | Year Ended March 31,
| |
2005
| | | 2004
| | | 2005
| | | 2004
| | | 2005
| | | 2004
| |
| $ | 33,469,906 | | | $ | 18,590,937 | | | $ | 4,522,387 | | | $ | 637,981 | | | $ | 430,538 | | | $ | 479,286 | |
| | 25,789,954 | | | | 26,130,547 | | | | 12,485,605 | | | | 3,623,320 | | | | 4,311,853 | | | | 1,459,695 | |
| | 2,015,708 | | | | (1,694,222 | ) | | | — | | | | — | | | | — | | | | — | |
|
348,650,183 |
| | | 978,738,539 | | | | 10,433,850 | | | | 74,173,832 | | | | 940,094 | | | | 16,169,741 | |
|
|
| |
|
|
| |
|
|
| |
|
|
| |
|
|
| |
|
|
|
| | 409,925,751 | | | | 1,021,765,801 | | | | 27,441,842 | | | | 78,435,133 | | | | 5,682,485 | | | | 18,108,722 | |
|
|
| |
|
|
| |
|
|
| |
|
|
| |
|
|
| |
|
|
|
| | | | | | | | | | | | | | | | | | | | | | | |
| | | | | | | | | | | | | | | | | | | | | | | |
| | (542,162 | ) | | | (230,193 | ) | | | (1,745,081 | ) | | | (226,937 | ) | | | (65,782 | ) | | | (478,646 | ) |
| | (31,399,379 | ) | | | (16,015,057 | ) | | | (2,985,864 | ) | | | (306,909 | ) | | | — | | | | — | |
|
|
| |
|
|
| |
|
|
| |
|
|
| |
|
|
| |
|
|
|
| | (31,941,541 | ) | | | (16,245,250 | ) | | | (4,730,945 | ) | | | (533,846 | ) | | | (65,782 | ) | | | (478,646 | ) |
|
|
| |
|
|
| |
|
|
| |
|
|
| |
|
|
| |
|
|
|
| | | | | | | | | | | | | | | | | | | | | | | |
| | 118,620,109 | | | | 27,115,289 | | | | (27,789,884 | ) | | | 31,858,348 | | | | 2,224,548 | | | | (11,055,877 | ) |
| | 850,392,716 | | | | 691,737,456 | | | | 14,044,442 | | | | 51,526,480 | | | | — | | | | — | |
| | 1,089 | | | | — | | | | 1,151 | | | | — | | | | — | | | | — | |
|
|
| |
|
|
| |
|
|
| |
|
|
| |
|
|
| |
|
|
|
| | 969,013,914 | | | | 718,852,745 | | | | (13,744,291 | ) | | | 83,384,828 | | | | 2,224,548 | | | | (11,055,877 | ) |
|
|
| |
|
|
| |
|
|
| |
|
|
| |
|
|
| |
|
|
|
| | 1,346,998,124 | | | | 1,724,373,296 | | | | 8,966,606 | | | | 161,286,115 | | | | 7,841,251 | | | | 6,574,199 | |
|
|
| |
|
|
| |
|
|
| |
|
|
| |
|
|
| |
|
|
|
| | | | | | | | | | | | | | | | | | | | | | | |
| | 3,283,093,802 | | | | 1,558,720,506 | | | | 287,449,082 | | | | 126,162,967 | | | | 35,598,155 | | | | 29,023,956 | |
|
|
| |
|
|
| |
|
|
| |
|
|
| |
|
|
| |
|
|
|
| $ | 4,630,091,926 | | | $ | 3,283,093,802 | | | $ | 296,415,688 | | | $ | 287,449,082 | | | $ | 43,439,406 | | | $ | 35,598,155 | |
|
|
| |
|
|
| |
|
|
| |
|
|
| |
|
|
| |
|
|
|
| $ | 8,690,692 | | | $ | 6,850,019 | | | $ | 388,063 | | | $ | 232,080 | | | $ | 421,803 | | | $ | 65,947 | |
|
|
| |
|
|
| |
|
|
| |
|
|
| |
|
|
| |
|
|
|
See Notes to Financial Statements.
43
Excelsior Funds
Statements of Changes in Net Assets
| | | | | | | | |
| |
| | | Total Return Bond Fund
| |
| |
| | | Year Ended March 31,
| |
| | | 2005
| | | 2004
| |
Net investment income | | $ | 6,744,014 | | | $ | 8,723,613 | |
Net realized gain (loss) on investments and foreign currency transactions | | | 606,338 | | | | 6,258,133 | |
Change in unrealized appreciation (depreciation) of investments and foreign currency translations during the year | | | (6,549,134 | ) | | | (3,766,022 | ) |
| | |
|
|
| |
|
|
|
Net increase in net assets resulting from operations | | | 801,218 | | | | 11,215,724 | |
| | |
|
|
| |
|
|
|
Distributions to shareholders: | | | | | | | | |
From net investment income | | | | | | | | |
Institutional Shares | | | (6,757,222 | ) | | | (8,824,881 | ) |
Shares | | | — | | | | — | |
Tax return of capital | | | | | | | | |
Institutional Shares | | | — | | | | — | |
Shares | | | — | | | | — | |
From net realized gain on investments | | | | | | | | |
Institutional Shares | | | (1,954,501 | ) | | | (5,161,373 | ) |
Shares | | | — | | | | — | |
| | |
|
|
| |
|
|
|
Total distributions | | | (8,711,723 | ) | | | (13,986,254 | ) |
| | |
|
|
| |
|
|
|
Increase (decrease) in net assets from fund share transactions (Note 5): | | | | | | | | |
Institutional Shares | | | (3,699,026 | ) | | | (108,072,548 | ) |
Shares | | | — | | | | — | |
| | |
|
|
| |
|
|
|
Total from fund share transactions | | | (3,699,026 | ) | | | (108,072,548 | ) |
| | |
|
|
| |
|
|
|
Net increase (decrease) in net assets | | | (11,609,531 | ) | | | (110,843,078 | ) |
| | |
|
|
| |
|
|
|
NET ASSETS: | | | | | | | | |
Beginning of year | | | 160,692,164 | | | | 271,535,242 | |
| | |
|
|
| |
|
|
|
End of year (1) | | $ | 149,082,633 | | | $ | 160,692,164 | |
| | |
|
|
| |
|
|
|
(1) Including undistributed (distributions in excess of) net investment income | | $ | 3,298 | | | $ | — | |
| | |
|
|
| |
|
|
|
| * | | Equity Core Fund commenced operations on March 31, 2004. |
See Notes to Financial Statements.
44
| | | | | | | | | | | | | | | | | | | | | |
| | |
Income Fund
| | | High Yield Fund
| | | Equity Core Fund
|
Year Ended March 31,
| | | Year Ended March 31,
| | | Year Ended
March 31,
| | | Period Ended
March 31,
|
2005
| | | 2004
| | | 2005
| | | 2004
| | | 2005
| | | 2004*
|
| $ | 4,618,953 | | | $ | 5,660,377 | | | $ | 12,382,052 | | | $ | 14,179,264 | | | $ | 156,080 | | | $ | — |
| | 467,060 | | | | 970,223 | | | | 1,684,436 | | | | (26,899,527 | ) | | | 17,682 | | | | — |
| | (3,580,154 | ) | | | 231,309 | | | | (3,437,364 | ) | | | 57,311,938 | | | | 495,790 | | | | — |
|
|
| |
|
|
| |
|
|
| |
|
|
| |
|
|
| |
|
|
| | 1,505,859 | | | | 6,861,909 | | | | 10,629,124 | | | | 44,591,675 | | | | 669,552 | | | | — |
|
|
| |
|
|
| |
|
|
| |
|
|
| |
|
|
| |
|
|
| | | | | | | | | | | | | | | | | | | | | | |
| | | | | | | | | | | | | | | | | | | | | | |
| | (5,047,776 | ) | | | (5,960,426 | ) | | | (1,404,626 | ) | | | (1,882,202 | ) | | | — | | | | — |
| | — | | | | — | | | | (10,208,446 | ) | | | (8,984,610 | ) | | | (56,745 | ) | | | — |
| | | | | | | | | | | | | | | | | | | | | | |
| | — | | | | — | | | | — | | | | (510,855 | ) | | | — | | | | — |
| | — | | | | — | | | | — | | | | (2,649,803 | ) | | | — | | | | — |
| | | | | | | | | | | | | | | | | | | | | | |
| | (287,292 | ) | | | (1,148,222 | ) | | | — | | | | — | | | | — | | | | — |
| | — | | | | — | | | | — | | | | — | | | | (12,320 | ) | | | — |
|
|
| |
|
|
| |
|
|
| |
|
|
| |
|
|
| |
|
|
| | (5,335,068 | ) | | | (7,108,648 | ) | | | (11,613,072 | ) | | | (14,027,470 | ) | | | (69,065 | ) | | | — |
|
|
| |
|
|
| |
|
|
| |
|
|
| |
|
|
| |
|
|
| | | | | | | | | | | | | | | | | | | | | | |
| | (7,902,918 | ) | | | 11,074,869 | | | | (9,399,526 | ) | | | (20,356,959 | ) | | | 55,457,333 | | | | — |
| | — | | | | — | | | | 5,713,795 | | | | (4,682,644 | ) | | | 41,347,713 | | | | 100 |
|
|
| |
|
|
| |
|
|
| |
|
|
| |
|
|
| |
|
|
| | (7,902,918 | ) | | | 11,074,869 | | | | (3,685,731 | ) | | | (25,039,603 | ) | | | 96,805,046 | | | | 100 |
|
|
| |
|
|
| |
|
|
| |
|
|
| |
|
|
| |
|
|
| | (11,732,127 | ) | | | 10,828,130 | | | | (4,669,679 | ) | | | 5,524,602 | | | | 97,405,533 | | | | 100 |
|
|
| |
|
|
| |
|
|
| |
|
|
| |
|
|
| |
|
|
| | | | | | | | | | | | | | | | | | | | | | |
| | 116,043,109 | | | | 105,214,979 | | | | 174,116,747 | | | | 168,592,145 | | | | 100 | | | | — |
|
|
| |
|
|
| |
|
|
| |
|
|
| |
|
|
| |
|
|
| $ | 104,310,982 | | | $ | 116,043,109 | | | $ | 169,447,068 | | | $ | 174,116,747 | | | $ | 97,405,633 | | | $ | 100 |
|
|
| |
|
|
| |
|
|
| |
|
|
| |
|
|
| |
|
|
| $ | (1,454 | ) | | $ | — | | | $ | (1,124,014 | ) | | $ | (1,621,594 | ) | | $ | 96,881 | | | $ | 100 |
|
|
| |
|
|
| |
|
|
| |
|
|
| |
|
|
| |
|
|
See Notes to Financial Statements.
45
Excelsior Funds
Financial Highlights — Selected Per Share Data and Ratios
| | | | | | | | | | | | | | | | | | | | | | | | | | | |
| | | | | | | |
| | | Net Asset Value,
Beginning of
Year
| | Net
Investment
Income
| | | Net Realized and
Unrealized Gain (Loss)
of Investments and
Options
| | | Total From
Investment
Operations
| | | Dividends
From Net
Investment
Income
| | | Distributions From
Net Realized Gain
on Investments
and Options
| | | Total
Distributions
| |
MONEY FUND | | | | | | | | | | | | | | | | | | | | | | | | | | | |
Institutional Shares — (12/16/99*) | | | | | | | | | | | | | | | | | | | | | | | | | | | |
Year Ended March 31, | | | | | | | | | | | | | | | | | | | | | | | | | | | |
2005 | | $ | 1.00 | | $ | 0.02 | (3) | | $ | (0.01 | )(3) | | $ | 0.01 | | | $ | (0.01 | ) | | | — | | | $ | (0.01 | ) |
2004 | | | 1.00 | | | 0.01 | | | | — | | | | 0.01 | | | | (0.01 | ) | | | — | | | | (0.01 | ) |
2003 | | | 1.00 | | | 0.01 | | | | — | (2) | | | 0.01 | | | | (0.01 | ) | | | — | | | | (0.01 | ) |
2002 | | | 1.00 | | | 0.03 | | | | — | (2) | | | 0.03 | | | | (0.03 | ) | | | — | | | | (0.03 | ) |
2001 | | | 1.00 | | | 0.06 | | | | — | | | | 0.06 | | | | (0.06 | ) | | | — | | | | (0.06 | ) |
VALUE AND RESTRUCTURING FUND | | | | | | | | | | | | | | | | | | | | | |
Institutional Shares — (09/30/02*) | | | | | | | | | | | | | | | | | | | | | | | | | | | |
Year Ended March 31, | | | | | | | | | | | | | | | | | | | | | | | | | | | |
2005 | | $ | 37.56 | | $ | 0.42 | (3) | | $ | 3.84 | (3) | | $ | 4.26 | | | $ | (0.42 | ) | | | — | | | $ | (0.42 | ) |
2004 | | | 23.65 | | | 0.32 | (3) | | | 13.89 | (3) | | | 14.21 | | | | (0.30 | ) | | | — | | | | (0.30 | ) |
Period Ended March 31, 2003 | | | 22.92 | | | 0.22 | | | | 0.59 | | | | 0.81 | | | | (0.08 | ) | | | — | | | | (0.08 | ) |
MID CAP VALUE FUND | | | | | | | | | | | | | | | | | | | | | | | | |
Institutional Shares — (06/01/96*) | | | | | | | | | | | | | | | | | | | | | | | | | | | |
Year Ended March 31, | | | | | | | | | | | | | | | | | | | | | | | | | | | |
2005 | | $ | 15.78 | | $ | 0.25 | (3) | | $ | 1.04 | (3) | | $ | 1.29 | | | $ | (0.26 | ) | | | — | | | $ | (0.26 | ) |
2004 | | | 10.25 | | | 0.07 | (3) | | | 5.51 | (3) | | | 5.58 | | | | (0.05 | ) | | | — | | | | (0.05 | ) |
2003 | | | 13.28 | | | 0.05 | (3) | | | (3.04 | )(3) | | | (2.99 | ) | | | (0.04 | ) | | | — | | | | (0.04 | ) |
2002 | | | 11.97 | | | 0.04 | (3) | | | 1.67 | (3) | | | 1.71 | | | | (0.04 | ) | | $ | (0.36 | ) | | | (0.40 | ) |
2001 | | | 21.32 | | | 0.40 | | | | (1.27 | ) | | | (0.87 | ) | | | (0.40 | ) | | | (8.08 | ) | | | (8.48 | ) |
INTERNATIONAL EQUITY FUND | | | | | | | | | | | | | | | | | | | | | |
Institutional Shares — (01/24/95*) | | | | | | | | | | | | | | | | | | | | | | | | | | | |
Year Ended March 31, | | | | | | | | | | | | | | | | | | | | | | | | | | | |
2005 | | $ | 6.69 | | $ | 0.08 | (3) | | $ | 1.04 | (3) | | $ | 1.12 | | | $ | (0.01 | ) | | | — | | | $ | (0.01 | ) |
2004 | | | 4.09 | | | 0.08 | | | | 2.59 | | | | 2.67 | | | | (0.07 | ) | | | — | | | | (0.07 | ) |
2003 | | | 5.85 | | | 0.07 | | | | (1.77 | ) | | | (1.70 | ) | | | (0.06 | ) | | | — | | | | (0.06 | ) |
2002 | | | 6.93 | | | 0.04 | | | | (0.86 | ) | | | (0.82 | ) | | | (0.06 | ) | | $ | (0.20 | ) | | | (0.26 | ) |
2001 | | | 13.78 | | | 0.02 | | | | (4.39 | ) | | | (4.37 | ) | | | (0.02 | ) | | | (2.46 | ) | | | (2.48 | ) |
* Commencement of Operations.
| (1) | Expense ratios before waiver of fees and reimbursement of expenses (if any) by advisor and administrator. |
| (2) | Amount represents less than $0.01 per share. |
| (3) | For comparative purposes per share amounts are based on average shares outstanding. |
| (5) | Amount represents less than $1,000. |
| (7) | The information presented reflects the impact of the low level of assets at the beginning of the period and throughout the period ended March 31, 2003. Percentage amounts to less than 0.005%. |
See Notes to Financial Statements.
46
| | | | | | | | | | | | | | | | | | | | |
| | | | | | |
Net Asset Value,
End of Year
| | Total
Return
| | | Net Assets, End
of Year (000’s)
| | | Ratio of Net
Operating Expenses
to Average
Net Assets
| | | Ratio of Gross
Operating Expenses
to Average
Net Assets (1)
| | | Ratio of Net
Investment
Income to
Average Net Assets
| | | Portfolio
Turnover
Rate
| |
| | | | | | | | | | | | | | | | | | | | | |
| | | | | | | | | | | | | | | | | | | | | |
| | | | | | | | | | | | | | | | | | | | | |
| $ | 1.00 | | 1.55 | % | | $ | 625,287 | | | 0.21 | % | | 0.46 | % | | 1.52 | % | | — | |
| | 1.00 | | 0.87 | % | | | 470,189 | | | 0.25 | % | | 0.53 | % | | 0.86 | % | | — | |
| | 1.00 | | 1.41 | % | | | 548,126 | | | 0.24 | % | | 0.49 | % | | 1.41 | % | | — | |
| | 1.00 | | 2.98 | % | | | 309,829 | | | 0.25 | % | | 0.54 | % | | 2.83 | % | | — | |
| | 1.00 | | 6.19 | % | | | 282,659 | | | 0.25 | % | | 0.49 | % | | 6.09 | % | | — | |
| | | | | | | | | | | | | | | | | | | | | |
| | | | | | | | | | | | | | | | | | | | | |
| | | | | | | | | | | | | | | | | | | | | |
| $ | 41.40 | | 11.44 | % | | $ | 161,016 | | | 0.83 | % | | 0.84 | % | | 1.05 | % | | 8 | % |
| | 37.56 | | 60.46 | % | | | 38,243 | | | 0.74 | % | | 0.89 | % | | 1.00 | % | | 4 | % |
| | 23.65 | | 3.54 | %(4) | | | — | (5) | | 0.00 | %(6)(7) | | 0.00 | %(6)(7) | | 1.90 | %(6) | | 16 | % |
| | | | | | | | | | | | | | | | | | | | | |
| | | | | | | | | | | | | | | | | | | | | |
| | | | | | | | | | | | | | | | | | | | | |
| $ | 16.81 | | 8.18 | % | | $ | 81,570 | | | 0.89 | % | | 0.99 | % | | 1.59 | % | | 28 | % |
| | 15.78 | | 54.60 | % | | | 100,729 | | | 0.74 | % | | 0.98 | % | | 0.49 | % | | 13 | % |
| | 10.25 | | -22.58 | % | | | 45,017 | | | 0.76 | % | | 0.91 | % | | 0.44 | % | | 28 | % |
| | 13.28 | | 14.53 | % | | | 53,900 | | | 0.80 | % | | 0.95 | % | | 0.33 | % | | 24 | % |
| | 11.97 | | -1.99 | % | | | 40,993 | | | 0.80 | % | | 0.96 | % | | 2.27 | % | | 95 | % |
| | | | | | | | | | | | | | | | | | | | | |
| | | | | | | | | | | | | | | | | | | | | |
| | | | | | | | | | | | | | | | | | | | | |
| $ | 7.80 | | 16.98 | % | | $ | 43,439 | | | 0.90 | % | | 1.48 | % | | 1.18 | % | | 59 | % |
| | 6.69 | | 65.55 | % | | | 35,598 | | | 0.90 | % | | 1.44 | % | | 1.32 | % | | 59 | % |
| | 4.09 | | (29.26 | )% | | | 29,024 | | | 0.87 | % | | 1.29 | % | | 1.07 | % | | 71 | % |
| | 5.85 | | (12.16 | )% | | | 52,405 | | | 0.90 | % | | 1.38 | % | | 0.75 | % | | 52 | % |
| | 6.93 | | (36.32 | )% | | | 74,240 | | | 0.90 | % | | 1.41 | % | | 0.20 | % | | 52 | % |
See Notes to Financial Statements.
47
Excelsior Funds
Financial Highlights — Selected Per Share Data and Ratios
| | | | | | | | | | | | | | | | | | | | | | | | | | | |
| | | | | | | |
| | | Net Asset Value,
Beginning of
Year
| | Net
Investment
Income
| | | Net Realized and
Unrealized Gain (Loss)
of Investments
| | | Total From
Investment
Operations
| | | Dividends
From Net
Investment
Income
| | | Distributions From
Net Realized Gain
on Investments
| | | Total
Distributions
| |
TOTAL RETURN BOND FUND | | | | | | | | | | | | | | | | | | | | | |
Institutional Shares — (01/19/95*) | | | | | | | | | | | | | | | | | | | | | | | | | | | |
Year Ended March 31, | | | | | | | | | | | | | | | | | | | | | | | | | | | |
2005 | | $ | 7.66 | | $ | 0.33 | (2) | | $ | (0.27 | )(2) | | $ | 0.06 | | | $ | (0.33 | ) | | $ | (0.10 | ) | | $ | (0.43 | ) |
2004 | | | 7.78 | | | 0.34 | | | | 0.08 | | | | 0.42 | | | | (0.34 | ) | | | (0.20 | ) | | | (0.54 | ) |
2003 | | | 7.37 | | | 0.40 | | | | 0.48 | | | | 0.88 | | | | (0.40 | ) | | | (0.07 | ) | | | (0.47 | ) |
2002 | | | 7.46 | | | 0.43 | | | | (0.09 | ) | | | 0.34 | | | | (0.43 | ) | | | — | | | | (0.43 | ) |
2001 | | | 7.01 | | | 0.44 | | | | 0.45 | | | | 0.89 | | | | (0.44 | ) | | | — | | | | (0.44 | ) |
INCOME FUND | | | | | | | | | | | | | | | | | | | | | | | | |
Institutional Shares — (01/16/95*) | | | | | | | | | | | | | | | | | | | | | | | | | | | |
Year Ended March 31, | | | | | | | | | | | | | | | | | | | | | | | | | | | |
2005 | | $ | 7.21 | | $ | 0.29 | (2) | | $ | (0.20 | )(2) | | $ | 0.09 | | | $ | (0.32 | ) | | $ | (0.02 | ) | | $ | (0.34 | ) |
2004 | | | 7.21 | | | 0.34 | | | | 0.07 | | | | 0.41 | | | | (0.34 | ) | | | (0.07 | ) | | | (0.41 | ) |
2003 | | | 6.93 | | | 0.39 | | | | 0.31 | | | | 0.70 | | | | (0.39 | ) | | | (0.03 | ) | | | (0.42 | ) |
2002 | | | 7.01 | | | 0.40 | | | | (0.04 | ) | | | 0.36 | | | | (0.40 | ) | | | (0.04 | ) | | | (0.44 | ) |
2001 | | | 6.66 | | | 0.43 | | | | 0.35 | | | | 0.78 | | | | (0.43 | ) | | | — | | | | (0.43 | ) |
HIGH YIELD FUND | | | | | | | | | | | | | | | | | | | | | | | | |
Institutional Shares — (10/31/00*) | | | | | | | | | | | | | | | | | | | | | | | | | | | |
Year Ended March 31, | | | | | | | | | | | | | | | | | | | | | | | | | | | |
2005 | | $ | 4.71 | | $ | 0.32 | (2) | | $ | (0.06 | )(2) | | $ | 0.26 | | | $ | (0.31 | ) | | | — | | | $ | (0.31 | ) |
2004 | | | 3.99 | | | 0.35 | (2) | | | 0.72 | (2) | | | 1.07 | (5) | | | (0.35 | ) | | | — | | | | (0.35 | ) |
2003 | | | 6.20 | | | 0.93 | (2) | | | (1.58 | )(2) | | | (0.65 | )(6) | | | (1.56 | ) | | | — | | | | (1.56 | ) |
2002 | | | 7.26 | | | 1.09 | | | | (1.01 | ) | | | 0.08 | | | | (1.10 | ) | | $ | (0.04 | ) | | | (1.14 | ) |
Period Ended March 31, 2001 | | | 7.00 | | | 0.28 | | | | 0.26 | | | | 0.54 | | | | (0.28 | ) | | | — | | | | (0.28 | ) |
EQUITY CORE FUND | | | | | | | | | | | | | | | | | | | | | | | | |
Institutional Shares — (01/31/05*) | | | | | | | | | | | | | | | | | | | | | | | | | | | |
Period Ended March 31, 2005 | | $ | 10.84 | | $ | 0.02 | (3) | | $ | 0.12 | (3) | | $ | 0.14 | | | | — | | | $ | — | | | $ | — | |
* Commencement of Operations.
| (1) | Expense ratios before waiver of fees and reimbursement of expenses (if any) by advisor and administrator. |
| (2) | For comparative purposes per share amounts are based on average shares outstanding. |
| (5) | Includes a tax return of capital of $(0.08). |
| (6) | Includes a tax return of capital of $(0.51). |
See Notes to Financial Statements.
48
| | | | | | | | | | | | | | | | | | | |
| | | | | | |
Net Asset Value,
End of Year
| | Total
Return
| | | Net Assets, End
of Year (000’s)
| | Ratio of Net
Operating Expenses
to Average
Net Assets
| | | Ratio of Gross
Operating Expenses
to Average
Net Assets (1)
| | | Ratio of Net
Investment
Income to
Average Net Assets
| | | Portfolio
Turnover
Rate
| |
| | | | | | | | | | | | | | | | | | | | |
| | | | | | | | | | | | | | | | | | | | |
| | | | | | | | | | | | | | | | | | | | |
| $ | 7.29 | | 0.75 | % | | $ | 149,083 | | 0.50 | % | | 0.91 | % | | 4.42 | % | | 48 | % |
| | 7.66 | | 5.61 | % | | | 160,692 | | 0.50 | % | | 0.89 | % | | 4.32 | % | | 43 | % |
| | 7.78 | | 12.27 | % | | | 271,535 | | 0.50 | % | | 0.82 | % | | 5.15 | % | | 106 | % |
| | 7.37 | | 4.65 | % | | | 285,551 | | 0.50 | % | | 0.87 | % | | 5.70 | % | | 113 | % |
| | 7.46 | | 13.19 | % | | | 304,882 | | 0.50 | % | | 0.87 | % | | 6.27 | % | | 110 | % |
| | | | | | | | | | | | | | | | | | | | |
| | | | | | | | | | | | | | | | | | | | |
| | | | | | | | | | | | | | | | | | | | |
| $ | 6.96 | | 1.24 | % | | $ | 104,311 | | 0.50 | % | | 0.92 | % | | 4.13 | % | | 40 | % |
| | 7.21 | | 5.81 | % | | | 116,043 | | 0.50 | % | | 0.89 | % | | 4.47 | % | | 57 | % |
| | 7.21 | | 10.36 | % | | | 105,215 | | 0.50 | % | | 0.81 | % | | 5.38 | % | | 59 | % |
| | 6.93 | | 5.18 | % | | | 111,309 | | 0.50 | % | | 0.87 | % | | 5.54 | % | | 88 | % |
| | 7.01 | | 12.18 | % | | | 107,193 | | 0.50 | % | | 0.87 | % | | 6.49 | % | | 119 | % |
| | | | | | | | | | | | | | | | | | | | |
| | | | | | | | | | | | | | | | | | | | |
| | | | | | | | | | | | | | | | | | | | |
| $ | 4.66 | | 5.80 | % | | $ | 13,308 | | 0.80 | % | | 1.07 | % | | 6.71 | % | | 70 | % |
| | 4.71 | | 27.76 | % | | | 22,641 | | 0.80 | % | | 1.11 | % | | 7.91 | % | | 170 | % |
| | 3.99 | | (10.30 | )% | | | 37,250 | | 0.83 | % | | 1.10 | % | | 19.14 | % | | 153 | % |
| | 6.20 | | 1.53 | % | | | 48,241 | | 0.78 | % | | 1.10 | % | | 17.81 | % | | 311 | % |
| | 7.26 | | 7.88 | % | | | 17,862 | | 0.80 | % | | 1.22 | % | | 9.63 | % | | 169 | % |
| | | | | | | | | | | | | | | | | | | | |
| | | | | | | | | | | | | | | | | | | | |
| $ | 10.98 | | 2.14 | %(3) | | $ | 53,826 | | 0.80 | %(4) | | 1.21 | %(4) | | 0.87 | %(4) | | 13 | % |
See Notes to Financial Statements.
49
EXCELSIOR FUNDS
NOTES TO FINANCIAL STATEMENTS
1. Significant Accounting Policies:
Excelsior Funds, Inc. (“Excelsior Fund”) was incorporated under the laws of the State of Maryland on August 2, 1984. Excelsior Funds Trust (the “Trust”) is a statutory trust organized under the laws of the State of Delaware on April 27, 1994. Excelsior Fund and the Trust are registered under the Investment Company Act of 1940 (the “1940 Act”), as amended as open-ended diversified management investment companies, with the exception of Energy and Natural Resources Fund and Real Estate Fund, each of which are non-diversified.
Excelsior Fund and the Trust currently offer shares in fifteen and seven managed investment portfolios, respectively, each having its own investment objectives and policies. The following is a summary of significant accounting policies for Money Fund and Value and Restructuring Fund, portfolios of Excelsior Fund and for Mid Cap Value Fund, International Equity Fund, Total Return Bond Fund, Income Fund, High Yield Fund and Equity Core Fund, portfolios of the Trust (the “Funds”). Such policies are in conformity with accounting principles generally accepted in the United States of America and are consistently followed by Excelsior Fund and the Trust in the preparation of their financial statements. The preparation of financial statements requires management to make estimates and assumptions that affect the reported amounts and disclosures in the financial statements. Actual results could differ from these estimates.
The Money Fund, High Yield Fund and Equity Core Fund offer two classes of shares: Institutional Shares and Shares. The Mid Cap Value Fund and Value and Restructuring Fund offer three classes of shares: Institutional Shares, Shares and Retirement Shares. The Financial Highlights of the Shares and Retirement Shares as well as the financial statements for the remaining portfolios of Excelsior Fund and the Trust are presented separately.
The Institutional Share Class of Excelsior Emerging Markets Fund was established on March 31, 2005 with seed capital in the amount of $500. The Class commenced operations on April 1, 2005 and, on which date, began to participate in the income, expenses, and realized and unrealized gains and losses of the Fund.
(a) Portfolio valuation:
Investments in securities that are traded on recognized domestic and foreign stock exchanges are valued at the last sale price on the exchange on which such securities are primarily traded or at the last quoted sale price on a national securities market. Securities traded over-the-counter are valued each business day on the basis of closing over-the-counter sale prices. Equity securities that are traded on the NASDAQ National Market System for which quotations are readily available are valued at the official closing price. Securities for which there were no transactions are valued at the last quoted sales price for the most recent day such prices were available. Securities for which market quotations are not readily available are valued in good faith at fair value pursuant to procedures adopted by the Board of Directors with regard to Excelsior Fund and the Board of Trustees with regard to the Trust.
50
Short-term debt instruments that mature in 60 days or less are valued at amortized cost, which approximates market value. The amortized cost method values a security at its cost at the time of purchase (or at its market value 61 days before maturity) and thereafter assumes a constant amortization to maturity of any bond premium or discount. Investments in securities that are primarily traded on foreign securities exchanges are generally valued at the preceding closing values of such securities on their respective exchanges, except that when a significant event has occurred subsequent to the close of such foreign exchange and prior to the time at which the Fund’s net asset value is determined, then such securities are valued in good faith at fair value in accordance with procedures adopted by the Board of Directors with regard to Excelsior Fund and the Board of Trustees with regard to the Trust.
Investment valuation, other assets and liabilities initially expressed in foreign currencies are converted each business day into U.S. dollars based upon current exchange rates. Purchases and sales of foreign investments and income and expenses are converted into U.S. dollars based upon currency exchange rates prevailing on the respective dates of such transactions. The Funds do not isolate that portion of gains and losses on investment securities that is due to changes in the foreign exchange rates from that which is due to changes in market prices of such securities. The Funds report gains and losses on foreign currency related transactions as realized and unrealized gains or losses for financial reporting purposes, whereas such components are treated as ordinary income or loss for federal income tax purposes.
(b) Forward foreign currency exchange contracts:
The Funds’ participation in forward currency exchange contracts will be limited to hedging involving either specific transactions or portfolio positions. Transaction hedging involves the purchase or sale of foreign currency with respect to specific receivables or payables of a Fund generally arising in connection with the purchase or sale of its portfolio securities. Risk may arise upon entering into these contracts from the potential inability of counterparties to meet the terms of their contracts and is generally limited to the amount of unrealized gain on the contracts, if any, at the date of default. Risk may also arise from unanticipated movements in the value of foreign currency relative to the U.S. dollar. Contracts are marked to market daily and the change in market value is recorded as unrealized appreciation or depreciation. Realized gains or losses arising from such transactions are included in net realized gains or losses from foreign currency transactions.
The Funds had no forward foreign currency exchange contracts outstanding as of March 31, 2005.
(c) Covered call options written:
Each Fund may engage in writing covered call options. By writing a covered call option, a Fund forgoes the opportunity to profit from an increase in the market price of the underlying security above the exercise price, except insofar as the premium represents such a profit.
When a Fund writes an option, an amount equal to the net premium (the premium less the commission) received by that Fund is included in the liability section of that Fund’s statement of assets and liabilities as a deferred credit. The amount of the deferred credit will be subsequently marked to market to reflect the current value of the option written. The current value of the traded
51
option is the last sale price or, in the absence of a sale, the last quoted sale price for the most recent day such price was available. If an option expires on the stipulated expiration date, or if the Fund involved enters into a closing purchase transaction, the Fund will realize a gain (or loss if the cost of a closing purchase transaction exceeds the net premium received when the option is sold), and the deferred credit related to such option will be eliminated. If an option is exercised, the Fund involved may deliver the underlying security from its portfolio or purchase the underlying security in the open market. In either event, the proceeds of the sale will be increased by the net premium originally received, and the Fund involved will realize a gain or loss. Premiums from expired call options written by the Fund and net gains from closing purchase transactions are treated as short-term capital gains for Federal income tax purposes, and losses on closing purchase transactions are short-term capital losses.
There is no assurance that a liquid secondary market on an exchange will exist for any particular option. A covered option writer, unable to effect a closing purchase transaction, will not be able to sell the underlying security until the option expires or is delivered upon exercise. As a result, the writer in such circumstances will be subject to the risk of market decline in the underlying security during such period and to the risk that market values increase beyond the option exercise price, in each case to the extent not offset by the net premium. A Fund will write an option on a particular security only if the Adviser believes that a liquid secondary market will exist on an exchange for options of the same series, which will permit the Fund to make a closing purchase transaction in order to close out its position.
During the year ended March 31, 2005, the Value and Restructuring Fund had the following written option transactions:
| | | | | | | |
| Written Option Transactions | | Number of
Contracts
| | | Premiums
| |
Outstanding, beginning of period | | (15,385 | ) | | $ | (2,153,485 | ) |
Options written | | (33,294 | ) | | | (5,171,714 | ) |
Options expired | �� | 20,604 | | | | 2,596,637 | |
Options exercised | | 4,175 | | | | 1,312,069 | |
Options terminated in closing purchase transactions | | 3,900 | | | | 782,521 | |
| | |
|
| |
|
|
|
Outstanding, end of year | | (20,000 | ) | | $ | (2,633,972 | ) |
| | |
|
| |
|
|
|
(d) Security transactions and investment income:
Security transactions are recorded on a trade date basis. Realized gains and losses on investments sold are recorded on the basis of identified cost. Interest income, adjusted for amortization of premiums and, when appropriate, discounts on investments, is earned from settlement date and is recorded on the accrual basis. Dividend income is recorded on the ex-dividend date, except for certain dividends from foreign securities, which are recorded as soon as the Funds are informed of the dividend.
(e) Concentration of risks:
The International Equity Fund invests primarily in securities of companies that are located in or conduct a substantial amount of their business in foreign countries, including emerging market countries. Prices of securities in foreign markets generally, and emerging markets in particular,
52
have historically been more volatile than prices in U.S. markets. Some countries in which the Fund may invest require government approval for the repatriation of investment income, capital or the proceeds of sales of securities by foreign investors. In addition, if there is deterioration in a country’s balance of payments or for other reasons, a country may impose temporary restrictions on foreign capital remittances abroad.
The High Yield Fund is subject to special risks associated with investments in high yield bonds, which involve greater risk of default or downgrade and are more volatile than investment grade securities due to actual or perceived changes in an issuer’s creditworthiness. In addition, issuers of high yield bonds may be more susceptible than other issuers to economic downturns. High yield bonds are subject to the risk that the issuer may not be able to pay interest or dividends and ultimately repay principal upon maturity. Discontinuation of these payments could adversely affect the market value of the security.
(f) Repurchase agreements:
The Funds may purchase portfolio securities from financial institutions deemed to be creditworthy by the investment adviser subject to the seller’s agreement to repurchase and the Funds’ agreement to resell such securities at mutually agreed upon prices. Securities purchased subject to such repurchase agreements are deposited with the Funds’ custodian or sub-custodian or are maintained in the Federal Reserve/Treasury book-entry system and must have, at all times, an aggregate market value not less than the repurchase price (including accrued interest).
Default or bankruptcy of the seller may, however, expose the applicable Fund to possible delay in connection with the disposition of the securities or loss to the extent that proceeds from a sale of the underlying securities were less than the repurchase price under the agreement.
(g) TBA Purchase Commitments:
The Total Return Bond Fund and Income Fund may enter into “TBA” (To Be Announced) purchase commitments to purchase securities for a fixed price at a future date, typically not exceeding 45 days. TBA purchase commitments may be considered securities in themselves, and involve a risk of loss if the value of the security to be purchased declines prior to settlement date. The Funds must maintain liquid securities having a value not less than the purchase price (including accrued interest) for such purchase commitments. Unsettled TBA purchase commitments are valued at the current market value of the underlying securities, according to the procedures described under “Portfolio Valuation” above.
(h) Mortgage Dollar Rolls:
The Total Return Bond Fund and Income Fund may enter into mortgage dollar rolls (principally in securities referred to as TBA, (see note 1(g)) in which the Funds sell mortgage securities for delivery in the current month and simultaneously contract to repurchase similar, but not identical, securities at an agreed upon price on a fixed date. The Funds account for such dollar rolls as purchases and sales and receive compensation in consideration for entering into the commitment to repurchase. The Funds must maintain liquid securities having a value not less than the repurchase price (including accrued interest) for such dollar rolls. The market value of the securities that the Funds are required to repurchase may decline below the agreed upon repurchase price of those securities.
53
(i) Distributions to shareholders:
Dividends equal to all or substantially all of each Fund’s net investment income will be declared and paid as follows: for the Money Fund, Total Return Bond Fund, Income Fund and High Yield Fund, dividends will be declared daily and paid monthly; for the Value and Restructuring Fund, Mid Cap Value Fund and Equity Core Fund, dividends will be declared and paid quarterly; and for the International Equity Fund, dividends will be declared and paid semiannually. Net realized capital gains, unless offset by any available capital loss carryforward, are distributed at least annually. Dividends and distributions are recorded on the ex-dividend date.
(j) Expense allocation:
Expenses directly attributable to a Fund are charged to that Fund. Other expenses are allocated to the respective Funds based on average daily net assets. Expenses attributable to a specific class of shares, such as shareholder servicing fees, are charged directly to that class.
(k) Organization and offering costs:
Organization costs of the Equity Core Fund, which commenced operations on March 31, 2004, have been expensed as incurred. Offering costs, including costs of printing initial prospectuses and registration fees, were amortized to expense over twelve months.
2. Investment Advisory Fee, Administration Fee, Shareholder Servicing Fees and Related Party Transactions:
United States Trust Company of New York (“U.S. Trust NY”) and U.S. Trust Company, N.A. (together the “Adviser”), acting through their respective registered investment advisory divisions, U.S. Trust New York Asset Management Division and U.S. Trust Company, N.A. Asset Management Division, serve as the investment adviser to each Fund. For the services provided pursuant to the Investment Advisory Agreements, the Adviser receives a fee, computed daily and paid monthly, at the following annual contractual percentages of each Fund’s average daily net assets:
| | | |
Money Fund | | 0.25 | % |
Value and Restructuring Fund | | 0.60 | % |
Mid Cap Value Fund | | 0.65 | % |
International Equity Fund | | 1.00 | % |
Total Return Bond Fund | | 0.65 | % |
Income Fund | | 0.65 | % |
High Yield Fund | | 0.80 | % |
Equity Core Fund | | 0.75 | % |
U.S. Trust NY is a state-chartered bank and trust company and a member bank of the Federal Reserve System. U.S. Trust Company, N.A. is a national bank organized under the laws of the United States. Each is a wholly-owned subsidiary of U.S. Trust Corporation, a registered bank holding company. U.S. Trust Corporation is a wholly-owned subsidiary of The Charles Schwab Corporation (“Schwab”).
U.S. Trust Company, N.A., and BISYS Fund Services Ohio, Inc. (collectively, the “Administrators”) provide administrative services to the Funds. For the services provided to the Funds, the Administrators
54
are entitled jointly to annual fees, computed daily and paid monthly, based on the combined aggregate average daily net assets of Excelsior Fund, Excelsior Tax-Exempt Funds, Inc. (“Excelsior Tax-Exempt Fund”) and the Trust (excluding the international equity portfolios of Excelsior Fund and the Trust), all of which are affiliated investment companies, as follows: 0.200% of the first $200 million, 0.175% of the next $200 million and 0.150% over $400 million. The Administrators are entitled jointly to annual fees, computed daily and paid monthly, at the annual rate of 0.20% of the average daily net assets of the International Equity Fund, International Fund, Pacific/Asia Fund and Emerging Markets Fund. Administration fees payable by each Fund of the three investment companies are determined in proportion to the relative average daily net assets of the respective Fund for the period paid. For the five month period ended August 31, 2004, U.S. Trust Company, N.A. voluntarily agreed to waive a portion of its administration fee in an amount equal to an annual rate of 0.04% of the average daily net assets of each Fund. For the year ended March 31, 2005, administration fees charged by U.S. Trust Company, N.A. were as follows:
| | | | | | | | | | |
| | | Administration
Fees
| | Waiver
Administration
Fees
| | | Net
Administration
Fees
|
Money Fund | | $ | 2,424,662 | | $ | (273,411 | ) | | $ | 2,151,251 |
Value and Restructuring Fund | | | 5,757,405 | | | (557,110 | ) | | | 5,200,295 |
Mid Cap Value Fund | | | 462,079 | | | (47,237 | ) | | | 414,842 |
International Equity Fund | | | 72,715 | | | (5,562 | ) | | | 67,153 |
Total Return Bond Fund | | | 230,895 | | | (25,533 | ) | | | 205,362 |
Income Fund | | | 169,124 | | | (19,160 | ) | | | 149,964 |
High Yield Fund | | | 280,116 | | | (29,194 | ) | | | 250,922 |
Equity Core Fund | | | 30,439 | | | (1,008 | ) | | | 29,431 |
From time to time, in its sole discretion, U.S. Trust may undertake to waive a portion or all of the fees payable to it and may also reimburse the Funds for a portion of other expenses. For the year ended March 31, 2005, U.S. Trust has contractually agreed to waive investment advisory fees and to reimburse other ordinary operating expenses to the extent necessary to keep total operating expenses from exceeding the following annual percentages of each Fund’s average daily net assets:
| | | |
Money Fund — Institutional Shares | | 0.25 | % |
Value and Restructuring Fund — Institutional Shares | | 0.89 | % |
Mid Cap Value Fund — Institutional Shares | | 0.89 | % |
International Equity Fund — Institutional Shares | | 0.90 | % |
Total Return Bond Fund — Institutional Shares | | 0.50 | % |
Income Fund — Institutional Shares | | 0.50 | % |
High Yield Fund — Institutional Shares | | 0.80 | % |
Equity Core Fund — Institutional Shares | | 0.80 | % |
Money Fund — Shares | | 0.50 | % |
Value and Restructuring Fund — Shares | | 1.14 | % |
Mid Cap Value Fund — Shares | | 1.14 | % |
High Yield Fund — Shares | | 1.05 | % |
Equity Core Fund — Shares | | 1.05 | % |
Value and Restructuring Fund — Retirement Shares | | 1.64 | % |
Mid Cap Value Fund — Retirement Shares | | 1.64 | % |
55
For the year ended March 31, 2005, pursuant to the above, investment advisory fees waived by U.S. Trust were as follows:
| | | | |
Money Fund — Institutional Shares | | $ | (1,012,791 | ) |
Value and Restructuring Fund — Institutional Shares | | | — | |
Mid Cap Value Fund — Institutional Shares | | | (75,630 | ) |
International Equity Fund — Institutional Shares | | | (199,076 | ) |
Total Return Bond Fund — Institutional Shares | | | (580,845 | ) |
Income Fund — Institutional Shares | | | (439,551 | ) |
High Yield Fund — Institutional Shares | | | (52,357 | ) |
Equity Core Fund — Institutional Shares | | | (12,398 | ) |
Money Fund — Shares | | | (2,542,298 | ) |
Value and Restructuring Fund — Shares | | | — | |
Mid Cap Value Fund — Shares | | | (146,825 | ) |
High Yield Fund — Shares | | | (399,223 | ) |
Equity Core Fund — Shares | | | (87,789 | ) |
Value and Restructuring Fund — Retirement Shares | | | — | |
Mid Cap Value Fund — Retirement Shares | | | — | |
The Funds have entered into shareholder servicing agreements with various service organizations, which include Charles Schwab & Co. Inc. (“CS & Co.”) and U.S. Trust. Services included in the servicing agreements are assisting in processing purchase, exchange and redemption requests; transmitting and receiving funds in connection with customer orders to purchase, exchange or redeem shares; and providing periodic statements. Shareholder servicing fees are incurred on a Fund or class level (where applicable). In consideration for these services, each service organization receives a fee, computed daily and paid monthly, at an annual rate up to 0.25% of the average daily net assets of the Funds’ shares held by each service organizations’ customers (excluding the Institutional Shares of the Money Fund which pays a fee of up to 0.15% of the average daily net assets of it shares). The adviser, out of its own resources, may additionally compensate certain organizations for providing these services.
For the year ended March 31, 2005, shareholder servicing fees paid to CS & Co. and U.S. Trust were as follows:
| | | |
Money Fund | | $ | 2,833,215 |
Value and Restructuring Fund | | | 4,751,166 |
Mid Cap Value Fund | | | 520,007 |
International Equity Fund | | | 40 |
Total Return Bond Fund | | | 11,397 |
Income Fund | | | 82 |
High Yield Fund | | | 361,159 |
Equity Core Fund | | | 45 |
Effective January 1, 2005 BISYS Fund Services Limited Partnership became the Distributor for the Funds. Prior to January 1, 2005, Edgewood Services, Inc. (a wholly-owned subsidiary of Federated Investors, Inc.) served as the Distributor of the Funds. Shares of each Portfolio are sold without a sales charge on a continuous basis by the Distributor.
56
Certain Funds have adopted a Distribution Plan pursuant to Rule 12b-1 under the 1940 Act, under which they may compensate the Distributor monthly for its services that are intended to result in the sale of Fund Shares (in the case of Mid Cap Value Fund and High Yield Fund) or Retirement Shares (in the case of Value and Restructuring Fund and Mid Cap Value Fund), in an amount not to exceed the annual rate of 0.25% or 0.50%, respectively, of the average daily net asset value of such Fund’s Shares or Retirement Shares. There were no fees charged for the year ended March 31, 2005.
Effective July 31, 2004, each Independent Director/Trustee of the Funds receives a total annual fee of $100,000 paid by the Funds and other affiliated investment companies managed by the Adviser. The Chairman of the Board receives an additional $30,000, the Chairman of the Audit Committee receives an additional $15,000, and the Chairman of the Nominating Committee receives an additional $5,000 for serving in those capacities. Prior to July 31, 2004, each Independent Director of Excelsior Fund received an annual fee of $15,000, plus a meeting fee of $2,500 for each meeting attended. The Chairman received an additional annual fee of $7,500. Independent Trustees of the Trust received an annual fee of $6,000, plus a meeting fee of $1,000 for each meeting attended. The Chairman of the Board received an additional annual fee of $5,000. Each member of the Nominating Committee received a meeting fee of $3,000 for each meeting attended. In addition, Directors and Trustees are reimbursed by Excelsior Fund and the Trust, respectively, for reasonable expenses incurred when acting in their capacity as Directors and Trustees.
The Funds’ Board of Directors/Trustees selected Deloitte & Touche LLP in November of 2004 to be their registered public accounting firm and to re-audit the Funds’ March 31, 2004 financial statements. All expenses in connection with the re-audit, including costs of audit, legal services, and printing and mailing of the financial statements, were paid by the Adviser. Such expenses are reflected in the Statements of Operations as “re-audit expenses” and the corresponding expense waiver “re-audit expenses paid by Investment Adviser.”
3. Purchases, Sales and Maturities of Securities:
For the year ended March 31, 2005, purchases, sales and maturities of securities, excluding short-term investments and U.S. Government Agency obligations, for the Funds aggregated:
| | | | | | |
| | | Purchases
| | Sales &
Maturities
|
Value and Restructuring Fund | | $ | 1,249,651,610 | | $ | 304,807,240 |
Mid Cap Value Fund | | | 83,791,436 | | | 90,195,837 |
International Equity Fund | | | 24,121,364 | | | 20,996,139 |
Total Return Bond Fund | | | 30,038,254 | | | 34,877,807 |
Income Fund | | | 16,273,893 | | | 31,618,669 |
High Yield Fund | | | 118,879,720 | | | 119,981,184 |
Equity Core Fund | | | 95,222,823 | | | 2,758,187 |
57
For the year ended March 31, 2005, purchases, sales and maturities of U.S. Government Agency obligations for the Funds aggregated:
| | | | | | |
| | | Purchases
| | Sales &
Maturities
|
Total Return Bond Fund | | $ | 34,554,434 | | $ | 34,314,474 |
Income Fund | | | 26,079,661 | | | 22,367,817 |
4. Federal Taxes:
It is the policy of Excelsior Fund and the Trust that each Fund qualify or continue to qualify as a regulated investment company, by complying with the requirements of the Internal Revenue Code applicable to regulated investment companies, and by distributing substantially all of its taxable earnings to its shareholders.
In order to avoid a federal excise tax, each Fund is required to distribute certain minimum amounts of net realized capital gain and net investment income for the respective twelve month periods ending October 31 and December 31 each year.
Net realized gains of the Funds derived in certain countries are subject to certain foreign taxation.
Dividends and distributions are determined in accordance with federal income tax regulations and may differ from accounting principles generally accepted in the United States of America. These differences are primarily due to differing treatments for net operating losses, foreign currency transactions, passive foreign investment companies, deferral of losses on wash sales and net capital losses and net currency losses incurred after October 31 through the end of the fiscal year (“Post-October losses”). To the extent these differences are permanent, adjustments are made to the appropriate equity accounts in the period that these differences arise. Accordingly, the following reclassifications, as of March 31, 2005, were made to/from the following accounts:
| | | | | | | | | | | | |
| | | Undistributed
Net Investment
Income
| | | Accumulated
Net Realized
Gain (Loss)
| | | Paid-In-Capital
| |
Money Fund | | | — | | | $ | 5,131 | | | $ | (5,131 | ) |
Value and Restructuring Fund | | $ | 312,308 | | | | (312,308 | ) | | | — | |
Mid Cap Value Fund | | | 364,541 | | | | (9,893,533 | ) | | | 9,528,992 | |
International Equity Fund | | | (8,898 | ) | | | 8,864 | | | | 34 | |
Total Return Bond Fund | | | 16,506 | | | | (16,507 | ) | | | 1 | |
Income Fund | | | 427,369 | | | | (427,369 | ) | | | — | |
High Yield Fund | | | (271,400 | ) | | | 271,398 | | | | 2 | |
Equity Core Fund | | | (2,454 | ) | | | 2,893 | | | | (439 | ) |
58
The tax character of dividends and distributions declared during the years ended March 31, 2005 and March 31, 2004 were as follows:
| | | | | | | | | | | | |
| | | Ordinary
Income
| | Long-Term
Capital Gain
| | Return of
Capital
| | Total
|
Money Fund | | | | | | | | | | | | |
2005 | | $ | 19,959,001 | | | — | | | — | | $ | 19,959,001 |
2004 | | | 14,865,550 | | | — | | | — | | | 14,865,550 |
Value and Restructuring Fund | | | | | | | | | | | | |
2005 | | | 31,941,541 | | | — | | | — | | | 31,941,541 |
2004 | | | 16,245,250 | | | — | | | — | | | 16,245,250 |
Mid Cap Value Fund | | | | | | | | | | | | |
2005 | | | 4,730,945 | | | — | | | — | | | 4,730,945 |
2004 | | | 533,846 | | | — | | | — | | | 533,846 |
International Equity Fund | | | | | | | | | | | | |
2005 | | | 65,782 | | | — | | | — | | | 65,782 |
2004 | | | 478,646 | | | — | | | — | | | 478,646 |
Total Return Bond Fund | | | | | | | | | | | | |
2005 | | | 7,193,606 | | $ | 1,617,447 | | | — | | | 8,811,053 |
2004 | | | 10,812,380 | | | — | | | — | | | 10,812,380 |
Income Fund | | | | | | | | | | | | |
2005 | | | 5,222,484 | | | 276,425 | | | — | | | 5,498,909 |
2004 | | | 6,871,085 | | | — | | | — | | | 6,871,085 |
High Yield Fund | | | | | | | | | | | | |
2005 | | | 11,801,334 | | | — | | | — | | | 11,801,334 |
2004 | | | 10,866,812 | | | — | | $ | 3,160,658 | | | 14,027,470 |
Equity Core Fund | | | | | | | | | | | | |
2005 | | | 69,065 | | | — | | | — | | | 69,065 |
2004* | | | — | | | — | | | — | | | — |
| * | Equity Core Fund commenced operations on March 31, 2004. |
As of March 31, 2005, the components of distributable earnings (accumulated losses) on a tax basis were as follows:
| | | | | | | | | | | | | | | | | | | | | | | | | | |
| | | Undistributed
Ordinary
Income
| | Undistributed
Long-Term
Capital
Gain
| | Distributions
Payable
| | | Accumulated
Capital and
Other
Losses
| | | Post-
October
Losses
| | | Unrealized
Appreciation
(Depreciation)
| | | Total
Accumulated
Earnings/
(Deficit)
| |
Money Fund | | $ | 2,587,123 | | | — | | $ | (2,587,123 | ) | | $ | (35,637 | ) | | | — | | | | — | | | $ | (35,637 | ) |
Value and Restructuring Fund | | | 10,697,424 | | | — | | | — | | | | (165,302,979 | ) | | | — | | | $ | 1,214,963,822 | | | | 1,060,358,267 | |
Mid Cap Value Fund | | | 388,063 | | | — | | | — | | | | (121,536 | ) | | | — | | | | 73,626,164 | | | | 73,892,691 | |
International Equity Fund | | | 425,780 | | | — | | | — | | | | (19,500,663 | ) | | $ | (3,977 | ) | | | 8,163,803 | | | | (10,915,057 | ) |
Total Return Bond Fund | | | 521,590 | | $ | 589,233 | | | (518,292 | ) | | | — | | | | — | | | | 3,283,626 | | | | 3,876,157 | |
Income Fund | | | 284,794 | | | — | | | (280,686 | ) | | | — | | | | — | | | | 127,482 | | | | 131,590 | |
High Yield Fund | | | 281,497 | | | — | | | (753,861 | ) | | | (61,203,778 | ) | | | — | | | | (1,204,936 | ) | | | (62,881,078 | ) |
Equity Core Fund | | | 167,351 | | | — | | | — | | | | (59,322 | ) | | | (2,893 | ) | | | 495,790 | | | | 600,926 | |
Post-October losses are deemed to arise on the first business day of a Fund’s next taxable year.
59
For federal income tax purposes, capital loss carryforwards may be carried forward and applied against future capital gains. To the extent that such carryforwards are utilized, capital gains distributions will be reduced. At March 31, 2005, the following Funds had capital loss carryforwards available to offset future net capital gains through the indicated expiration dates:
| | | | | | | | | | | | | | | |
| | | Expires
| | |
| | | 2010
| | 2011
| | 2012
| | 2013
| | Total
|
Money Fund | | | — | | $ | 11,662 | | $ | 23,975 | | | — | | $ | 35,637 |
Value and Restructuring Fund | | $ | 7,063,026 | | | 130,876,419 | | | 27,363,534 | | | — | | | 165,302,979 |
Mid Cap Value Fund | | | — | | | 121,536 | | | — | | | — | | | 121,536 |
International Equity Fund | | | 1,684,979 | | | 16,143,552 | | | 1,672,132 | | | — | | | 19,500,663 |
High Yield Fund | | | 2,181,571 | | | 17,456,849 | | | 40,103,941 | | $ | 1,461,417 | | | 61,203,778 |
At March 31, 2005, aggregate gross unrealized appreciation for all securities and call options written for which there was an excess of value over estimated tax cost and aggregate gross unrealized depreciation for all securities for which there was an excess of estimated tax cost over value is as follows:
| | | | | | | | | | | | | | |
| | | Federal Tax Cost
| | Tax Basis
Unrealized
Appreciation
| | Tax Basis
Unrealized
(Depreciation)
| | | Net Unrealized
Appreciation
(Depreciation)
| |
Money Fund | | $ | 1,596,594,914 | | | — | | | — | | | | — | |
Value and Restructuring Fund | | | 3,413,155,075 | | $ | 1,398,133,172 | | $ | (183,169,350 | ) | | $ | 1,214,963,822 | |
Mid Cap Value Fund | | | 222,398,527 | | | 82,723,849 | | | (9,097,685 | ) | | | 73,626,164 | |
International Equity Fund | | | 34,796,933 | | | 8,928,984 | | | (765,181 | ) | | | 8,163,803 | |
Total Return Bond Fund | | | 145,887,075 | | | 4,042,518 | | | (758,892 | ) | | | 3,283,626 | |
Income Fund | | | 104,167,265 | | | 1,340,530 | | | (1,213,048 | ) | | | 127,482 | |
High Yield Fund | | | 167,190,147 | | | 4,286,188 | | | (5,491,124 | ) | | | (1,204,936 | ) |
Equity Core Fund | | | 97,336,211 | | | 3,409,171 | | | (2,913,381 | ) | | | 495,790 | |
5. Capital Transactions:
Excelsior Fund has authorized capital of 35 billion shares of Common Stock, 29.3756 billion of which is currently classified to represent interests in certain classes of shares. Authorized capital currently offered for each Fund is as follows: 4 billion shares of the Money Fund; and 1.5 billion shares of the Value and Restructuring Fund. Each share has a par value of $0.001 and represents an equal proportionate interest in the particular Fund with other shares of the same Fund, and is entitled to such dividends and distributions of taxable earnings on the assets belonging to such Fund as are declared at the discretion of Excelsior Fund’s Board of Directors.
The Trust has authorized an unlimited number of shares of beneficial interest of each class of each Fund. Each share has a par value of $0.00001 and represents an equal proportionate interest in the particular Fund with other shares of the same Fund, and is entitled to such dividends and distributions of taxable earnings on the assets belonging to such Fund as are declared at the discretion of the Trust’s Board of Trustees.
60
A redemption fee of 2% of the value of the shares redeemed or exchanged is imposed on shares of the International Equity Fund redeemed or exchanged 30 days or less after their date of purchase. The redemption fee is intended to limit short-term trading in the Fund.
Capital Share Transactions
| | | | | | | | | | | | | | |
| | | Money Fund
| |
| | | Year Ended
03/31/05
| | | Year Ended
03/31/04
| |
| | | Shares
| | | Amounts
| | | Shares
| | | Amounts
| |
Sold | | | | | | | | | | | | | | |
Institutional Shares | | 4,191,107,467 | | | $ | 4,191,107,467 | | | 2,751,605,010 | | | $ | 2,751,605,010 | |
Shares | | 3,782,584,603 | | | | 3,782,584,603 | | | 4,664,084,234 | | | | 4,664,084,234 | |
Issued as reinvestment of dividends | | | | | | | | | | | | | | |
Institutional Shares | | 2,099,572 | | | | 2,099,573 | | | 2,186,353 | | | | 2,186,353 | |
Shares | | 1,188,525 | | | | 1,188,499 | | | 784,932 | | | | 784,932 | |
Redeemed | | | | | | | | | | | | | | |
Institutional Shares | | (4,038,109,800 | ) | | | (4,038,109,805 | ) | | (2,831,721,381 | ) | | | (2,831,721,381 | ) |
Shares | | (3,820,288,035 | ) | | | (3,820,288,036 | ) | | (5,311,141,614 | ) | | | (5,311,141,614 | ) |
| | |
|
| |
|
|
| |
|
| |
|
|
|
Net Increase (Decrease) | | 118,582,332 | | | $ | 118,582,301 | | | (724,202,466 | ) | | $ | (724,202,466 | ) |
| | |
|
| |
|
|
| |
|
| |
|
|
|
| |
| | | Value and Restructuring Fund
| |
| | | Year Ended
03/31/05
| | | Year Ended
03/31/04
| |
| | | Shares
| | | Amounts
| | | Shares
| | | Amounts
| |
Sold | | | | | | | | | | | | | | |
Institutional Shares | | 3,740,751 | | | $ | 154,963,204 | | | 1,036,754 | | | $ | 27,794,739 | |
Shares | | 39,449,835 | | | | 1,550,480,361 | | | 38,649,596 | | | | 1,265,514,960 | |
Retirement Shares | | 103 | | | | 4,238 | | | — | | | | — | |
Issued as reinvestment of dividends | | | | | | | | | | | | | | |
Institutional Shares | | 3,356 | | | | 131,791 | | | 1,230 | | | | 36,028 | |
Shares | | 647,698 | | | | 24,887,348 | | | 408,200 | | | | 11,870,494 | |
Redeemed | | | | | | | | | | | | | | |
Institutional Shares | | (873,380 | ) | | | (36,474,886 | ) | | (19,867 | ) | | | (715,478 | ) |
Shares | | (18,527,714 | ) | | | (724,974,993 | ) | | (18,583,380 | ) | | | (585,647,998 | ) |
Retirement Shares | | (75 | ) | | | (3,149 | ) | | — | | | | — | |
| | |
|
| |
|
|
| |
|
| |
|
|
|
Net Increase (Decrease) | | 24,440,574 | | | $ | 969,013,914 | | | 21,492,533 | | | $ | 718,852,745 | |
| | |
|
| |
|
|
| |
|
| |
|
|
|
61
| | | | | | | | | | | | | | |
| | | Mid Cap Value Fund
| |
| | | Year Ended
03/31/05
| | | Year Ended
03/31/04
| |
| | | Shares
| | | Amounts
| | | Shares
| | | Amounts
| |
Sold | | | | | | | | | | | | | | |
Institutional Shares | | 1,440,444 | | | $ | 23,328,088 | | | 3,131,670 | | | $ | 45,488,248 | |
Shares | | 4,506,275 | | | | 71,247,527 | | | 9,417,352 | | | | 127,160,451 | |
Retirement Shares | | 68 | | | | 1,150 | | | — | | | | — | |
Issued as reinvestment of dividends: | | | | | | | | | | | | | | |
Institutional Shares | | 40,959 | | | | 681,342 | | | 179 | | | | 2,276 | |
Shares | | 65,005 | | | | 1,086,350 | | | 7,386 | | | | 94,100 | |
Redeemed: | | | | | | | | | | | | | | |
Institutional Shares | | (1,119,376 | ) | | | (18,369,260 | ) | | (1,138,246 | ) | | | (13,632,176 | ) |
Shares | | (3,620,972 | ) | | | (58,289,434 | ) | | (5,489,526 | ) | | | (75,728,071 | ) |
Redemption in-kind | | (1,892,982 | ) | | | (33,430,054 | ) | | — | | | | — | |
| | |
|
| |
|
|
| |
|
| |
|
|
|
Net Increase (Decrease) | | (580,579 | ) | | $ | (13,744,291 | ) | | 5,928,815 | | | $ | 83,384,828 | |
| | |
|
| |
|
|
| |
|
| |
|
|
|
| |
| | | International Equity Fund
| |
| | | Year Ended 03/31/05
| | | Year Ended 03/31/04
| |
| | | Shares
| | | Amounts
| | | Shares
| | | Amounts
| |
Sold | | | | | | | | | | | | | | |
Institutional Shares | | 1,059,280 | | | $ | 7,974,143 | | | 418,845 | | | $ | 2,379,118 | |
Issued as reinvestment of dividends | | | | | | | | | | | | | | |
Institutional Shares | | 40 | | | | 259 | | | 1,107 | | | | 6,566 | |
Redeemed | | | | | | | | | | | | | | |
Institutional Shares | | (815,524 | ) | | | (5,749,854 | ) | | (2,195,599 | ) | | | (13,441,737 | ) |
Redemption fee | | — | | | | — | | | — | | | | 176 | |
| | |
|
| |
|
|
| |
|
| |
|
|
|
Net Increase (Decrease) | | 243,796 | | | $ | 2,224,548 | | | (1,775,647 | ) | | $ | (11,055,877 | ) |
| | |
|
| |
|
|
| |
|
| |
|
|
|
| | | | | | | | | | | | | | |
| | | Total Return Bond Fund
| |
| | | Year Ended
03/31/05
| | | Year Ended
03/31/04
| |
| | | Shares
| | | Amounts
| | | Shares
| | | Amounts
| |
Sold | | | | | | | | | | | | | | |
Institutional Shares | | 2,849,885 | | | $ | 21,160,938 | | | 4,137,791 | | | $ | 31,647,140 | |
Issued as reinvestment of dividends | | | | | | | | | | | | | | |
Institutional Shares | | 40,672 | | | | 301,257 | | | 88,484 | | | | 673,212 | |
Redeemed: | | | | | | | | | | | | | | |
Institutional Shares | | (3,400,416 | ) | | | (25,161,221 | ) | | (13,364,713 | ) | | | (102,819,304 | ) |
Redemption in-kind | | — | | | | — | | | (4,810,960 | ) | | | (37,573,596 | ) |
| | |
|
| |
|
|
| |
|
| |
|
|
|
Net Increase (Decrease) | | (509,859 | ) | | $ | (3,699,026 | ) | | (13,949,398 | ) | | $ | (108,072,548 | ) |
| | |
|
| |
|
|
| |
|
| |
|
|
|
62
| | | | | | | | | | | | | | |
| | | Income Fund
| |
| | | Year Ended 03/31/05
| | | Year Ended 03/31/04
| |
| | | Shares
| | | Amounts
| | | Shares
| | | Amounts
| |
Sold | | | | | | | | | | | | | | |
Institutional Shares | | 2,254,174 | | | $ | 15,861,795 | | | 1,664,784 | | | $ | 12,013,218 | |
Contribution in-kind | | — | | | | — | | | 5,189,723 | | | | 37,573,596 | |
Issued as reinvestment of dividends | | | | | | | | | | | | | | |
Institutional Shares | | 182,097 | | | | 1,278,324 | | | 257,966 | | | | 1,846,929 | |
Redeemed | | | | | | | | | | | | | | |
Institutional Shares | | (3,555,711 | ) | | | (25,043,037 | ) | | (5,614,327 | ) | | | (40,358,874 | ) |
| | |
|
| |
|
|
| |
|
| |
|
|
|
Net Increase (Decrease) | | (1,119,440 | ) | | $ | (7,902,918 | ) | | 1,498,146 | | | $ | 11,074,869 | |
| | |
|
| |
|
|
| |
|
| |
|
|
|
| |
| | | High Yield Fund
| |
| | | Year Ended 03/31/05
| | | Year Ended 03/31/04
| |
| | | Shares
| | | Amounts
| | | Shares
| | | Amounts
| |
Sold | | | | | | | | | | | | | | |
Institutional Shares | | 1,316,771 | | | $ | 6,247,385 | | | 1,199,226 | | | $ | 5,249,685 | |
Shares | | 21,515,855 | | | | 101,230,357 | | | 32,989,833 | | | | 146,064,602 | |
Issued as reinvestment of dividends | | | | | | | | | | | | | | |
Institutional Shares | | 8,493 | | | | 40,222 | | | 6,757 | | | | 29,643 | |
Shares | | 414,836 | | | | 1,961,707 | | | 367,138 | | | | 1,637,682 | |
Redeemed | | | | | | | | | | | | | | |
Institutional Shares | | (3,282,976 | ) | | | (15,687,133 | ) | | (5,737,764 | ) | | | (25,636,287 | ) |
Shares | | (20,658,816 | ) | | | (97,478,269 | ) | | (34,133,033 | ) | | | (152,384,928 | ) |
| | |
|
| |
|
|
| |
|
| |
|
|
|
Net Increase (Decrease) | | (685,837 | ) | | $ | (3,685,731 | ) | | (5,307,843 | ) | | $ | (25,039,603 | ) |
| | |
|
| |
|
|
| |
|
| |
|
|
|
| |
| | | Equity Core Fund*
| |
| | | Year Ended 03/31/05
| | | Period Ended 03/31/04
| |
| | | Shares
| | | Amounts
| | | Shares
| | | Amounts
| |
Sold | | | | | | | | | | | | | | |
Institutional Shares | | 4,994,257 | | | $ | 56,502,175 | | | — | | | $ | — | |
Shares | | 4,146,420 | | | | 43,209,200 | | | 10 | | | | 100 | |
Issued as reinvestment of dividends | | | | | | | | | | | | | | |
Shares | | 2,246 | | | | 23,331 | | | — | | | | — | |
Redeemed | | | | | | | | | | | | | | |
Institutional Shares | | (93,928 | ) | | | (1,044,842 | ) | | — | | | | — | |
Shares | | (179,102 | ) | | | (1,884,818 | ) | | — | | | | — | |
| | |
|
| |
|
|
| |
|
| |
|
|
|
Net Increase (Decrease) | | 8,869,893 | | | $ | 96,805,046 | | | 10 | | | $ | 100 | |
| | |
|
| |
|
|
| |
|
| |
|
|
|
| * | Equity Core Fund commenced operations on March 31, 2004. |
63
6. Line of Credit:
During the year ended March 31, 2005, the Funds and other affiliated funds participated in a $50 million unsecured line of credit provided by a syndication of banks under a line of credit agreement. A commitment fee, equal to an annual rate of 0.15% of the average daily unused portion of the line of credit, is allocated among the participating Funds at the end of each quarter, and is included in miscellaneous expenses on the statements of operations. For the year ended March 31, 2005, the Funds had no borrowings under the agreement. Effective March 9, 2005, the unsecured line of credit was terminated.
7. Guarantees:
In the normal course of business, the Funds enter into contracts that provide general indemnifications. The Funds’ maximum exposure under these arrangements is dependent on future claims that may be made against the Funds, and therefore, cannot be established; however, based on experience, the risk of loss from such claims is considered remote.
8. Legal Proceedings:
The Adviser and Excelsior Funds, Inc., Excelsior Tax-Exempt Funds, Inc., and Excelsior Funds Trust (the “Companies”) were contacted in September, 2003 by the Office of the New York State Attorney General (the “NYAG”), and the Adviser was contacted by the Securities and Exchange Commission (the “SEC”) in connection with their investigations of practices in the mutual fund industry identified as “market timing” and “late trading” of mutual fund shares (the “Investigations”). The Adviser and the Companies have cooperated with respect to these Investigations. As disclosed previously by the Adviser and its affiliates, with respect to the Adviser, these investigations have focused on circumstances in which a small number of parties were permitted to engage in short-term trading of certain Excelsior Funds. The short-term trading activities permitted under these arrangements have been terminated and the Adviser has strengthened its policies and procedures to deter frequent trading in the Companies.
Five class actions filed against the Companies and two derivative actions purportedly brought on behalf of each of the Companies and each of the funds have been transferred to the United District Court for the District of Maryland for coordinated or consolidated pre-trial proceedings in a matter styled In Re Mutual Funds Investment Litigation, MDL Docket No. 1586. Lead plaintiffs were appointed and additional defendants were added (generally consisting of current and former directors and officers of the Companies). The five class actions were then consolidated and a single amended complaint was filed on or about September 29, 2004. Plaintiffs in the consolidated class action are seeking unspecified monetary damages from claimed injuries arising from allegedly illegal and improper mutual fund trading practices, as well as disgorgement of investment advisory fees, rescission and restitution of unspecified funds. The two derivative actions were also consolidated into a new amended complaint, also filed on or about September 29, 2004. Plaintiffs in the consolidated derivative action are seeking, on behalf of the Companies, unspecified monetary damages for similar claimed injuries, as well as removal of Excelsior Fund directors, removal of U.S. Trust as advisor to the Excelsior Funds, rescission of its investment advisory contracts and disgorgement of management fees and compensation relating to the Excelsior Funds.
The defendants in the consolidated actions have moved to dismiss such actions, and the Maryland court is scheduled to hear oral argument on the motions to dismiss on June 16-17, 2005. The defendants
64
will not be required to answer the complaints until such motions have been decided, and discovery in the actions is currently stayed.
While the ultimate outcome of these matters cannot be predicted with any certainty at this time, based on currently available information, the Adviser believes that the likelihood is remote that the pending private lawsuits and Investigations will have a material adverse financial impact on the Companies, and further believes that the pending Investigations and private lawsuits are not likely to materially affect the Adviser’s ability to provide investment management services to the Companies.
9. Other Federal Tax Information (Unaudited):
For corporate shareholders, the following percentage of the total ordinary income distributions paid during the fiscal year ended March 31, 2005, qualify for the corporate dividends received deduction for the following Funds:
| | | |
Fund
| | Percentage
| |
Value and Restructuring Fund | | 99.85 | % |
Mid Cap Value Fund | | 93.48 | % |
65
REPORT OF INDEPENDENT REGISTERED PUBLIC ACCOUNTING FIRM
To the Board of Directors/Trustees and Shareholders of
Excelsior Funds Trust and Excelsior Funds, Inc.
We have audited the accompanying statements of assets and liabilities, including the portfolios of investments, of the Money Fund, Value and Restructuring Fund, Mid Cap Value Fund, International Equity Fund, Total Return Bond Fund, Income Fund, High Yield Fund, and Equity Core Fund (six of the portfolios constituting the Excelsior Funds Trust and two of the portfolios constituting the Excelsior Funds, Inc.) (collectively, the “Funds”) as of March 31, 2005, and the related statements of operations for the year then ended, the statement of changes in net assets and the financial highlights (Institutional Shares) for each of the two years in the period then ended. These financial statements and financial highlights are the responsibility of the Funds’ management. Our responsibility is to express an opinion on these financial statements and financial highlights based on our audits. The financial highlights for each of the years in the three year period ended March 31, 2003 were audited by other auditors whose reports dated May 16, 2003, expressed an unqualified opinion on those financial highlights.
We conducted our audits in accordance with the standards of the Public Company Accounting Oversight Board (United States). Those standards require that we plan and perform the audit to obtain reasonable assurance about whether the financial statements and financial highlights are free of material misstatement. The Funds are not required to have, nor were we engaged to perform, an audit of their internal control over financial reporting. Our audit included consideration of internal control over financial reporting as a basis for designing audit procedures that are appropriate in the circumstances, but not for the purpose of expressing an opinion on the effectiveness of the Funds’ internal control over financial reporting. Accordingly, we express no such opinion. An audit also includes examining, on a test basis, evidence supporting the amounts and disclosures in the financial statements, assessing the accounting principles used and significant estimates made by management, as well as evaluating the overall financial statement presentation. Our procedures included confirmation of securities owned as of March 31, 2005, by correspondence with the custodian and brokers; where replies were not received from brokers, we performed other auditing procedures. We believe that our audits provide a reasonable basis for our opinion.
In our opinion, the financial statements and financial highlights referred to above present fairly, in all material respects, the financial position of Money Fund, Value and Restructuring Fund, Mid Cap Value Fund, International Equity Fund, Total Return Bond Fund, Income Fund, High Yield Fund, and Equity Core Fund as of March 31, 2005, the results of their operations for the year then ended, and the changes in their net assets and the financial highlights for each of the two years in the period then ended, in conformity with accounting principles generally accepted in the United States of America.
DELOITTE & TOUCHE LLP
New York, New York
May 27, 2005
66
Directors/Trustees and Officers of the Excelsior Funds Complex (Unaudited)
Information pertaining to the Directors/Trustees and Officers of Excelsior Fund, Excelsior Tax-Exempt Fund and Excelsior Funds Trust (each a “Company” and collectively, the “Excelsior Funds Complex”) is set forth below. Directors/Trustees who are not deemed to be “interested persons” of the Excelsior Funds Complex as defined in the 1940 Act are referred to as “Independent Board Members.” Directors/Trustees who are deemed to be “interested persons” of the Excelsior Funds Complex are referred to as “Interested Board Members”. The following information is as of May 20, 2005.
| | | | | | |
Name and Address(1) Age Time Served with the Excelsior Funds Complex
| | Principal Occupation
During the Past Five Years
| | Number of
Portfolios in Fund
Complex Overseen by Director/
Trustee(3)
| | Other Directorships Held by Director/
Trustee(4)
|
DIRECTORS/TRUSTEES(2)
INDEPENDENT BOARD MEMBERS | | | | |
Frederick S. Wonham
Age: 74
Since 1997 | | Retired. Chairman of the Boards and Director (since 1997) and President and Treasurer (from 1995 to February 2002) of Excelsior Funds, Inc. and Excelsior Tax-Exempt Funds, Inc.; Chairman of the Board and Trustee (since 1997) and President and Treasurer (from 1995 to February 2002) of Excelsior Funds Trust. | | 29 | | None. |
| | | |
Rodman L. Drake
Age: 62
Since 1994 | | Director of Excelsior Funds, Inc. and Excelsior Tax-Exempt Funds, Inc. (since 1996); Trustee of Excelsior Funds Trust (since 1994); Director, Crystal River Capital Inc. (a private REIT) (since March 2005); Director, Parson Brinkerhoff, Inc. (engineering firm) (since 1995); Co-Founder of Baringo Capital LLC (since 2002); President, Continuation Investments Group, Inc. (from 1997 to 2001). | | 29 | | Director and Chairman, Hyperion Total Return Fund, Inc., Hyperion Strategic Mortgage Fund Inc., and Hyperion 2005 Term Trust Inc. (since 1991); Director, Jackson Hewitt Inc. (since June 2004). |
| | | |
Morrill Melton ("Mel") Hall, Jr.
Age: 60
Since 2000 | | Director of Excelsior Funds, Inc. and Excelsior Tax-Exempt Funds, Inc. (since 2000); Trustee of Excelsior Funds Trust (since 2000); Chairman and Chief Executive Officer, Comprehensive Health Services, Inc. (health care management and administration) (since 1991). | | 29 | | None. |
| | | |
Roger M. Lynch
Age: 64
Since 2001 | | Retired. Director of Excelsior Funds, Inc. and Excelsior Tax-Exempt Funds, Inc. and Trustee of Excelsior Funds Trust (since 2001); Director, SLD Commodities, Inc. (importer of nuts) (since 1991); President, Corporate Asset Funding Co., Inc. (asset securitization) (from 1987 to 1999); Limited Partner (from 1986 to 1999), Goldman Sachs & Co. | | 29 | | None. |
67
| | | | | | |
Name and Address(1) Age Time Served with the Excelsior Funds Complex
| | Principal Occupation
During the Past Five Years
| | Number of
Portfolios in Fund
Complex Overseen by Director/
Trustee(3)
| | Other Directorships Held by Director/
Trustee(4)
|
Jonathan Piel
Age: 66
Since 1994 | | Retired. Director, Excelsior Funds, Inc. and Excelsior Tax-Exempt Funds, Inc. (since 1996); Trustee, Excelsior Funds Trust (since 1994). | | 29 | | None. |
| | | |
John. D. Collins
Age: 66
Since 2005 | | Retired. Director, Excelsior Funds, Inc. and Excelsior Tax-Exempt Funds, Inc. (since 2005); Trustee, Excelsior Funds Trust (since 2005). Consultant, KPMG, LLP (from July 1999 to June 2000); Partner, KPMG, LLP (from March 1962 to June 1999). | | 29 | | Director, CCC Information Services Inc. (software to automate process of settling automobile claims) (since September 2004); Director, Mrs. Fields’ Companies, Inc. (consumer products) (since December 2004). |
| INTERESTED BOARD MEMBER(5) | | | | | | |
James L. Bailey
114 West 47th Street
New York, NY 10036
Age: 59
Since 2004 | | Chief Operating Officer of U.S. Trust Corporation (since December 2004) and Executive Vice President of U.S. Trust Corporation and United States Trust Company of New York (since 2003); President, Excelsior Funds, Inc., Excelsior Tax-Exempt Funds, Inc. and Excelsior Funds Trust (from 2003 to July 2004); Consultant in the financial services industry (from August 2000 to January 2003); Executive Vice President of Citicorp (from 1992 to August 2000). | | 29 | | None. |
| OFFICERS | | | | | | |
Mary Martinez
114 West 47th Street
New York, NY 10036
Age: 45
President
Since July 2004 | | Managing Director of United States Trust Company of New York (since 2003) and Chief Executive Officer of National Private Banking (sine October 2004); Managing Director and Director of Relationship Management Service, Marketing, Information and Technology at Bessemer Trust (from 1998 to 2003). | | N/A | | N/A |
| | | |
Joseph Trainor, CFA
114 West 47th Street
New York, NY 10036
Age: 44
Vice President
Since February 2004 | | Managing Director of United States Trust Company of New York and President, U.S. Trust Institutional (since 2003); President of MFS Institutional Advisors (from 1998 to 2002). | | N/A | | N/A |
68
| | | | | | |
Name and Address(1) Age Time Served with the Excelsior Funds Complex
| | Principal Occupation
During the Past Five Years
| | Number of
Portfolios in Fund
Complex Overseen by Director/
Trustee(3)
| | Other Directorships Held by Director/
Trustee(4)
|
Agnes Mullady
225 High Ridge Road
Stamford, CT 06905
Age: 46
Treasurer/Chief Financial and
Chief Accounting Officer
Since February 2004 | | Senior Vice President, U.S. Trust Company, N.A. (since 2004); Chief Financial Officer, AMIC Distribution Partners (from 2002 to 2004); Controller Reserve Management Corporation, Reserve Management Company, Inc. and Reserve Partners, Inc. (from 2000 to 2002); Vice President and Treasurer, Northstar Funds; Senior Vice President and Chief Financial Officer, Northstar Investment Management Corp.; President and Treasurer, Northstar Administrators Corp.; and Vice President and Treasurer, Northstar Distributors, Inc. (from 1993 to 2000). | | N/A | | N/A |
| | | |
Scott Rhodes
225 High Ridge Road
Stamford, CT 06905
Age: 46
Vice President and Assistant Treasurer Since November 2004 | | Vice President, U.S. Trust Company, N.A. (since August 2004); Vice President, BlackRock Financial Management, Inc. (2004); Controller, Mutual Funds, American Skandia Investment Services, Inc. and Assistant Treasurer, American Skandia Trust and American Skandia Advisor Funds, Inc. (from 1996 to 2003). | | N/A | | N/A |
| | | |
Alexandra Poe
114 West 47th Street
New York, NY 10036
Age: 44
Secretary and Chief Legal Officer
Since May 2004 | | Senior Vice President and Assistant General Counsel, United States Trust Company of New York (since May 2004); Chief Legal Officer for Managed Accounts and Alternative Investment Strategies, Prudential Investments (from 2001 to 2004); Senior Vice President and General Counsel, US Investment Management and Global Hedge Funds and President of the Schroder Mutual Funds, Schroders (from 1996 to 2001). | | N/A | | N/A |
| | | |
Sharon M. Davison
114 West 47th Street
New York, NY 10036
Age: 50
Chief Compliance Officer
Since September 2004 | | Senior Vice President of U.S. Trust Company of New York (since 2001); Director of Securities and Corporate Compliance (since 2001); Director of Special Investigations-New York Stock Exchange Division of Market Surveillance (from 2000 to 2001); Senior Counsel-New York Stock Exchange Division of Market Surveillance (from 1997 to 2000). | | N/A | | N/A |
69
| | | | | | |
Name and Address(1) Age Time Served with the Excelsior Funds Complex
| | Principal Occupation
During the Past Five Years
| | Number of
Portfolios in Fund
Complex Overseen by Director/
Trustee(3)
| | Other Directorships Held by Director/ Trustee(4)
|
Wyndham Clark
225 High Ridge Road
Stamford, CT 06905
Age: 47
Anti-Money Laundering Officer
Since May 2004 | | Vice President and AML Officer, U.S. Trust Company, N.A. (since 2003); Vice President and Deputy Director Risk Management, IBJ Whitehall (banking) (from 2001 to 2002); and Vice President and Chief Risk Officer, EMAC, LLC (commercial lender, asset backed security issuer) (from 1999 to 2001). | | N/A | | N/A |
| | | |
Ralph Pastore
225 High Ridge Road
Stamford, CT 06905
Age: 35
Vice President
Since May 2005 | | Vice President, U.S. Trust Company, N.A. (since 2001); Director, Mutual Fund Operations, American Skandia Investment Services, Inc. (from 1998 to 2001) | | N/A | | N/A |
| (1) | Each independent director/trustee may be contacted by writing to Excelsior Funds, 225 High Ridge Road, Stamford, CT 06905. |
| (2) | Each director/trustee shall hold office until the election and qualification of his or her successor, or until he or she sooner dies, resigns or is removed. The officers of each Company shall hold office for a one year term and until their respective successors are chosen and qualified, or in each case until he or she sooner dies, resigns, is removed, or becomes disqualified in accordance with each Company’s by-laws. |
| (3) | The Excelsior Funds Complex consists of all registered investment companies (Excelsior Funds Inc., Excelsior Tax-Exempt Funds, Inc. and Excelsior Funds Trust) for which U.S. Trust serves as investment adviser. As of May 20, 2005, the Excelsior Funds Complex consisted of 29 Funds. |
| (4) | Directorships of companies required to report to the Securities and Exchange Commission under the Securities Exchange Act of 1934 (i.e., “public companies”) or other investment companies registered under the 1940 Act. |
| (5) | “Interested person” of the Company is defined in the 1940 Act. Mr. Bailey is considered an “interested person” because of his affiliation with the Adviser. |
For more information regarding the Directors/Trustees and Officers, please refer to the Statement of Additional Information, which is available upon request by calling 1-800-446-1012.
70
DISCLOSURE OF FUND EXPENSES (Unaudited)
We believe it is important for you to understand the impact of fees regarding your investment. As a shareholder of the fund, you incur ongoing, or operating costs, which include costs for portfolio management, administrative services, and shareholder reports (like this one), among others. Operating expenses, which are deducted from a fund’s gross income, directly reduce the investment return of the fund. A fund’s expenses are expressed as a percentage of its average net assets. This figure is known as the expense ratio. The following examples are intended to help you understand the ongoing costs (in dollars) of investing in your fund and to compare these costs with those of other mutual funds. The examples are based on an investment of $1,000 made at the beginning of the period shown and held for the entire period.
The table on the following page illustrates your fund’s costs in two ways.
| | · | Actual expenses. This section provides information about actual account values and actual expenses based on the Funds’ actual return for the period. This section is designed to help you to estimate the actual expenses after fee waivers that you paid over the period. The “Ending Account Value” shown is derived from the fund’s actual return, and the fourth column shows the dollar amount that would have been paid by an investor who started with $1,000 in the fund. You may use the information here, together with the amount you invested, to estimate the expenses that you paid over the period. |
To do so, simply divide your account value by $1,000 (for example, an $8,600 account value divided by $1,000=$8.6), then multiply the result by the number given for your fund under the heading “Expenses Paid During Period”.
| | · | Hypothetical expenses. This section provides information about hypothetical account values and hypothetical expenses that would have been incurred by an investor in the Fund based on an assumed rate of return of 5% per year before expenses. This section is designed to help you compare your fund’s costs with those of other mutual funds. It assumes that the fund had a return of 5% before expenses during the year, but that the expense ratio is unchanged. In this case, because the return used is not the fund’s actual return, the results cannot be used to estimate the actual ending account balance or expenses you paid for the period. You may use this information to compare the ongoing costs of investing in your Fund and other funds. To do so, compare this 5% hypothetical example with the 5% hypothetical examples that appear in shareholder reports of other funds. |
71
DISCLOSURE OF FUND EXPENSES (Unaudited) (Continued)
Please note that the expenses shown in the table are meant to highlight and help you compare ongoing costs only, which are described in the Prospectus. Therefore, the hypothetical example is useful in comparing ongoing costs only, and will not help you determine the relative total costs of owning different funds.
| | | | | | | | | | | | |
| | | Beginning
Account
Value
9/30/2004
| | Ending
Account
Value
3/31/2005
| | Annualized
Expense
Ratios**
| | | Expenses
Paid
During
Period*
|
Actual Fund Return | | | | | | | | | | | | |
Money Fund — Institutional Shares | | $ | 1,000.00 | | $ | 1,010.10 | | 0.21 | % | | $ | 1.05 |
Value and Restructuring Fund — Institutional Shares | | | 1,000.00 | | | 1,094.90 | | 0.83 | | | | 4.34 |
Mid Cap Value Fund — Institutional Shares | | | 1,000.00 | | | 1,108.90 | | 0.89 | | | | 4.68 |
International Equity Fund — Institutional Shares | | | 1,000.00 | | | 1,172.70 | | 0.90 | | | | 4.88 |
Total Return Bond Fund — Institutional Shares | | | 1,000.00 | | | 1,004.60 | | 0.50 | | | | 2.50 |
Income Fund — Institutional Shares | | | 1,000.00 | | | 1,007.50 | | 0.50 | | | | 2.50 |
High Yield Fund — Institutional Shares | | | 1,000.00 | | | 1,022.00 | | 0.80 | | | | 4.03 |
Equity Core Fund — Institutional Shares*** | | | 1,000.00 | | | 1,021.40 | | 0.80 | | | | 1.31 |
| | | | |
Hypothetical 5% Return | | | | | | | | | | | | |
Money Fund — Institutional Shares | | | 1,000.00 | | | 1,023.88 | | 0.21 | | | | 1.06 |
Value and Restructuring Fund — Institutional Shares | | | 1,000.00 | | | 1,020.79 | | 0.83 | | | | 4.18 |
Mid Cap Value Fund — Institutional Shares | | | 1,000.00 | | | 1,020.49 | | 0.89 | | | | 4.48 |
International Equity Fund — Institutional Shares | | | 1,000.00 | | | 1,020.44 | | 0.90 | | | | 4.53 |
Total Return Bond Fund — Institutional Shares | | | 1,000.00 | | | 1,022.44 | | 0.50 | | | | 2.52 |
Income Fund — Institutional Shares | | | 1,000.00 | | | 1,022.44 | | 0.50 | | | | 2.52 |
High Yield Fund — Institutional Shares | | | 1,000.00 | | | 1,020.94 | | 0.80 | | | | 4.03 |
Equity Core Fund — Institutional Shares**** | | | 1,000.00 | | | 1,020.94 | | 0.80 | | | | 4.03 |
| * | Expenses are equal to the Fund’s annualized expense ratio multiplied by the average account value over the period, multiplied by the number of days in the most recent fiscal half-year (182) then divided by 365. |
| ** | Annualized expense ratios of certain Funds are after fee waivers and expense reimbursements by the investment adviser. Absent such waivers and reimbursements, expenses paid during the period would have been greater. |
| *** | Information shown reflects values for the period from January 31, 2005 (date of commencement of operations) to March 31, 2005 and has been calculated using expense ratios and rates of return for the same time period. |
| **** | Information shown reflects values using the expense ratios for the period from January 31, 2005 (date of commencement of operations) to March 31, 2005 and has been annualized to reflect values for the period from September 30, 2004 to March 31, 2005. |
72
AR-INST-0305/43799

FIXED INCOMEFUNDS
ANNUAL REPORT
March 31, 2005
TABLE OF CONTENTS
For shareholder account information, current price and yield quotations, or to make an initial purchase or obtain a prospectus, call 1-800-446-1012, from overseas, call 617-483-7297.
| · | Internet Address: http://www.excelsiorfunds.com |
This report must be preceded or accompanied by a current prospectus.
A description of the policies and procedures that Excelsior Funds use to determine how to vote proxies relating to portfolio securities, as well as information relating to how a Fund voted proxies relating to portfolio securities during the most recent 12-month period ended June 30, is available (i) without charge, upon request, by calling 1-800-446-1012, or (ii) by accessing the Excelsior Funds’ internet address and (iii) on the Commission’s website at http://www.sec.gov.
Excelsior Funds file their June 30 and December 31 schedule of portfolio holdings with the Securities and Exchange Commission, on Form N-Q, within sixty days after the applicable reporting period. Excelsior Funds Form N-Q is available on the Commission’s website at http://www.sec.gov, and may be reviewed and copied at the Commission’s Public Reference Room in Washington, DC. Information on the operation of the Public Reference Room may be obtained by calling 1-800-SEC-0330.
You should consider the Fund’s investment objectives, risks and expenses carefully before you invest. Information about these and other important subjects is in the Fund’s prospectus, which you should read carefully before investing.
Excelsior Funds, Inc., Excelsior Funds Trust and Excelsior Tax-Exempt Funds, Inc. are distributed by BISYS Fund Services Limited Partnership.
You may write to Excelsior Funds, Inc., Excelsior Funds Trust and Excelsior Tax-Exempt Funds, Inc. at the following address:
Excelsior Funds
P.O. Box 8529
Boston, MA 02266-8529
SHARES IN THE FUNDS ARE NOT DEPOSITS OR OBLIGATIONS OF, OR GUARANTEED OR ENDORSED BY, UNITED STATES TRUST COMPANY OF NEW YORK, U.S. TRUST COMPANY, N.A., THEIR PARENT AND AFFILIATES AND SHARES ARE NOT INSURED BY THE FEDERAL DEPOSIT INSURANCE CORPORATION, THE FEDERAL RESERVE BOARD, OR ANY OTHER AGENCY. INVESTMENTS IN THE FUNDS INVOLVE INVESTMENT RISKS, INCLUDING POSSIBLE LOSS OF PRINCIPAL. FUND SHARES ARE NOT INSURED OR GUARANTEED BY THE U.S. GOVERNMENT.
LETTER TO SHAREHOLDERS
March 31, 2005
Dear Fellow Shareholder:
The fiscal year ended March 31, 2005 was marked by a continuing uptrend in broad based market indices. Financial markets spent much of 2004 waiting to see who would win the U.S. Presidential election. Stocks rose in the post-election period, posting gains from the first week of November to year end. The markets held their ground despite higher than anticipated energy prices. On December 14th, the Standard & Poor’s 500 Index closed above 1200 for the first time since August of 2001, and stocks retained most of their year-end 2004 gains during the first quarter of 2005. Also, the Federal Reserve monetary policy took hold, with its seventh increase in the Federal Funds rate to 2.75% as of the end of the first quarter of 2005.
Going forward, our overall investment theme reflects a preference for goods versus services, real versus financial assets, and “old economy” sectors and industries stocks versus the so-called “new economy”. Creating the cities and the infrastructure that are springing up in giant global emerging economies has raised overall levels of demand for commodities that are in relatively short supply, particularly after a decade or more of capital under investment in tangible producing sectors. We expect to focus on opportunities for above-market returns, and our portfolio managers will aim to capitalize on these prospects as they take shape.
As always, we value your confidence in selecting Excelsior to fulfill your investment needs. We strongly believe that Excelsior’s array of funds will help meet the full range of your financial objectives.
Sincerely,

Mary Martinez
President
1
| | FIXED INCOME MARKET REVIEW |
Despite the strong crosscurrents of rising market interest rates and growing inflationary pressures, the fixed-income marketplace held up relatively well for the twelve-month period ended March 31, 2005. Whether corporate or municipal, long or short-term, high quality or high yield, the fixed-income market indices generally trended upwards during the reporting period.
During the first fiscal quarter, U.S. Treasuries declined in price, suffering one of the worst three-month periods in a decade as the economy and the jobs market heated up. The Federal Reserve raised its federal funds target by 25 basis points, or one-quarter of one percent, to 1.25%, the first increase since May 2000.
After performing strongly earlier in 2004, asset-backed and commercial-mortgage-backed securities (CMBS) posted weaker returns relative to Treasuries. The underperformance was primarily due to the rise in interest rate swap spreads since these sectors are tightly correlated to swap spread movements. In addition, a surge in CMBS issuance in June also negatively impacted spreads. Meanwhile, residential mortgage-backed securities posted stronger relative results.
Prices for U.S. Treasury securities rebounded in the second fiscal quarter, pushing bond yields lower. This decrease in yields occurred even as the Federal Reserve continued to raise its target short-term interest rate. The Fed’s rate-setting committee increased its target short-term federal funds rate twice during the quarter, to 1.75%. Although short Treasury rates moderately declined in the quarter, the intermediate to long end of the Treasury curve experienced a decline in yields and the yield curve continued to flatten.
The third fiscal quarter saw further interest rate hikes on the part of the Federal Reserve, with two additional increases of 25 basis points bringing the target federal funds rate to 2.25%. These moves brought short-term rates to their highest levels in more than three years, although the yield curve flattened even further as the intermediate and long end of the Treasury curve experienced a less dramatic rise in yields.
Meanwhile, the municipal market took the Federal Reserve’s actions in stride with surprisingly little movement in residential mortgage rates. After jumping last spring when the Fed signaled its intention to raise short-term interest rates, longer-term municipal yields actually came back down when the Fed’s tightening began in earnest in June.
The reporting period’s final quarter proved challenging for the fixed-income markets. The Fed raised rates twice more, bringing the federal funds rate to 2.75%. A market sell-off in bonds was precipitated by Federal Reserve Chairman Alan Greenspan’s pronouncement mid-way through the quarter that low long-term yields, combined with rising short-term yields, posed a “conundrum” in the market. Then in March, the Fed indicated for the first time in this tightening cycle that it is concerned about inflationary pressures. The fixed-income market’s sentiment worsened further after General Motors announced that its earnings and cash flow for 2005 would be much lower than anticipated. As a result, the majority of fixed-income indices came under pressure during the quarter.
2
EXCELSIOR FUNDS, INC. | MANAGED INCOME FUND |
The Fund’s strong relative performance in the first fiscal quarter was largely the result of the portfolio’s barbell position and shorter duration, which benefited as yields rose and the Treasury yield curve flattened. In the second fiscal quarter, the portfolio’s barbell position continued to benefit from further flattening in the Treasury yield curve. Another positive contributor that benefited from declining interest rates was the portfolio’s higher weighted coupon in the mortgage sector. In the third fiscal quarter, the Fund maintained its defensive positioning to rising interest rates and the bias to a continued flattening of the yield curve. This strategy was a positive contributor to returns along with the portfolio’s allocation to residential mortgages and commercial mortgage backed securities. Our allocation to high yield securities again added value over the quarter and throughout the year as below investment grade corporate spreads continued to tighten throughout this period. In the final quarter of the reporting period, the Fund declined but held up better than its index. The Fund’s defensive posture to rising rates and positioning for a flattening yield curve were the largest contributors to its outperformance. A moderately underweight allocation in investment grade corporate bonds also aided returns this quarter as the investment grade corporate market lost ground over the period.
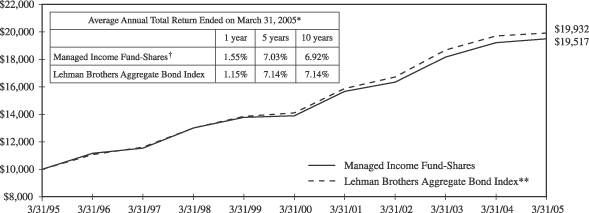
Past performance is not predictive of future performance. Investment returns and principal values will vary and shares may be worth more or less at redemption than their original cost.
The above illustration compares a $10,000 investment made in the Fund and a broad-based index over the past ten fiscal years. The chart assumes all dividends and capital gain distributions are reinvested. The Fund’s performance takes into account fees and expenses. The index does not take into account charges, fees and other expenses. Further information relating to Fund performance is contained in the Financial Highlights section of the Prospectus and elsewhere in this report.
| * | | Total return represents the change during the period in a hypothetical account with dividends reinvested. |
| ** | | Source: Lehman Brothers—the Lehman Brothers Aggregate Bond Index is an unmanaged, fixed income, market value-weighted index that includes treasury issues, agency issues, corporate bond issues and mortgage-backed securities. |
| † | | Currently certain fees are waived. Had such fees not been waived, returns would have been lower. Returns do not reflect the deduction of taxes that a shareholder would pay on Fund distributions or the redemption of shares. |
3
EXCELSIOR FUNDS, INC. | INTERMEDIATE-TERM MANAGED INCOME FUND |
In the first fiscal quarter, the Fund maintained a defensive posture to interest rate increases. Sector exposure favored non-Treasury issues for their added yield and positive relative performance versus Treasury securities in a strengthening economy. Securities with call features, such as, mortgages and callable agencies, were overweighted based on valuation levels, and the shorter duration of the overall portfolio aided relative returns. In the second fiscal quarter, the Fund reestablished a more defensive posture due to rising interest rates by shortening duration and improving quality. The Fund maintained its shorter-than-benchmark duration in the third fiscal quarter and was underweighted to corporates as the sector appeared fully valued. However, underweight exposure to corporate bonds proved to be a drag on performance. In the reporting period’s final quarter, the Fund remained defensively positioned with a duration below its benchmark with an underweight concentrated in 2-year to 5-year maturities, which generally perform poorly when the Fed is raising rates. The “barbell” structure continued to be employed with an overweight in 10-year and longer maturity securities and cash equivalents.

Past performance is not predictive of future performance. Investment returns and principal values will vary and shares may be worth more or less at redemption than their original cost.
The above illustration compares a $10,000 investment made in the Fund and a broad-based index over the past ten fiscal years. The chart assumes all dividends and capital gain distributions are reinvested. The Fund’s performance takes into account fees and expenses. The index does not take into account charges, fees and other expenses. Further information relating to Fund performance is contained in the Financial Highlights section of the Prospectus and elsewhere in this report.
| * | | Total return represents the change during the period in a hypothetical account with dividends reinvested. |
| ** | | Source: Lehman Brothers—The Lehman Brothers Intermediate Govt/Credit Index is an unmanaged total return performance benchmark composed of U.S. Government agencies and U.S. Treasury securities and investment grade corporate debt, selected as representative of the market with maturities of one to ten years. |
| † | | Currently certain fees are waived. Had such fees not been waived, returns would have been lower. Returns do not reflect the deduction of taxes that a shareholder would pay on Fund distributions or the redemption of shares. |
4
EXCELSIOR FUNDS, INC. | SHORT-TERM GOVERNMENT SECURITIES FUND |
The Fund moderately outperformed its benchmark in the first fiscal quarter as we increased the allocation to agency mortgage-backed securities and slightly trimmed the portfolio’s weighting to Treasury securities. Meanwhile, duration began the reporting period relatively close to the benchmark’s. Durations were reduced to a very short average life in the second fiscal quarter. During the third fiscal quarter, the Fund maintained its exposure to higher-yielding mortgage and asset-backed sectors, while duration was shortened even further as the yield curve flattened further. Meanwhile, spread sectors delivered strong performance again and the Fund continued to hold these securities for their added income. In the reporting period’s final quarter, the Fund outperformed its index as holdings of higher-yielding mortgage and asset-backed securities benefited returns. U.S. Treasury rates increased during the first quarter as the economy exhibited signs of continued strength. But declining levels of implied volatility seem to suggest that rates would remain more subdued for the time being unless the inflation picture or the valuation of the U.S. dollar became more problematic. At period’s end, the Fund’s duration was 1.61 years with an average yield that exceeded the benchmark’s.
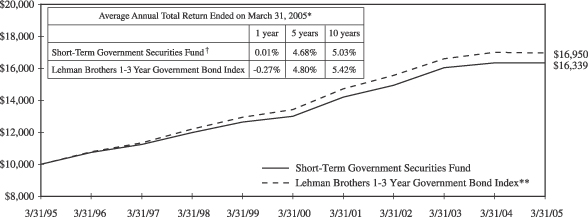
Past performance is not predictive of future performance. Investment returns and principal values will vary and shares may be worth more or less at redemption than their original cost.
The above illustration compares a $10,000 investment made in the Fund and a broad-based index over the past ten fiscal years. The chart assumes all dividends and capital gain distributions are reinvested. The Fund’s performance takes into account fees and expenses. The index does not take into account charges, fees and other expenses. Further information relating to Fund performance is contained in the Financial Highlights section of the Prospectus and elsewhere in this report.
| * | | Total return represents the change during the period in a hypothetical account with dividends reinvested. |
| ** | | Source: Lehman Brothers—The Lehman Brothers 1-3 Year Government Bond Index is an unmanaged total return performance benchmark composed of U.S. Government agencies and U.S. Treasury securities with maturities of one to three years. |
| † | | Currently certain fees are waived. Had such fees not been waived, returns would have been lower. Returns do not reflect the deduction of taxes that a shareholder would pay on Fund distributions or the redemption of shares. |
5
EXCELSIOR FUNDS TRUST | HIGH YIELD FUND |
The key drivers of high yield market performance in the first fiscal quarter were the ongoing improvement in default rates and the nearly 100-basis-point increase in U.S. interest rates. Relative to the Merrill High Yield Index, we had overweight positions in paper/packaging, chemicals, and metals/mining to benefit from strong economic growth and in gaming to reduce portfolio volatility. In the second fiscal quarter, we positioned the portfolio for moderate volatility in an environment of solid economic growth and stable or moderately rising interest rates, holding issues with high coupons trading near their call prices. As a result, the Fund did not fully participate in the strong performance of the high yield sector during the quarter as interest rates fell. The Fund’s relative underperformance in the third fiscal quarter was almost entirely due to underweight exposure to high-volatility, lower-tier securities. However, it is important to note that our underweighting of lower-tier credits reflected concerns surrounding possible principal risk from rising interest rates and uncertainty surrounding national and international political events. In the reporting period’s final quarter, the Fund’s performance was notably mixed with January and particularly March suffering negative returns. During the quarter, our positions in chemicals and metals, along with certain telecom holdings, helped the Fund outperform the Index. However, our underweight in energy as well as holdings in automotive suppliers modestly impaired performance. Finally, the Fund’s shorter duration relative to the Index was somewhat beneficial to performance, as Treasury yields continued to rise throughout the quarter.
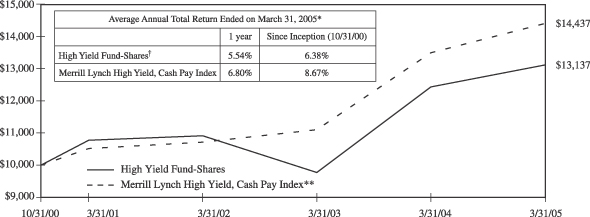
Past performance is not predictive of future performance. Investment returns and principal values will vary and shares may be worth more or less at redemption than their original cost. Securities rated below investment grade generally entail greater market, credit, and liquidity risks than investment grade securities.
The above illustration compares a $10,000 investment made in the Fund and a broad-based index since October 31, 2000 (inception date). The chart assumes all dividends and capital gain distributions are reinvested. The Fund’s performance takes into account fees and expenses. The index does not take into account charges, fees and other expenses. Further information relating to Fund performance is contained in the Financial Highlights section of the Prospectus and elsewhere in this report.
| * | | Total return represents the change during the period in a hypothetical account with dividends reinvested. |
| ** | | Source: Merrill Lynch—The Merrill Lynch High Yield, Cash Pay Index is an unmanaged index comprised of publicly placed, non-convertible, coupon bearing domestic debt. Issues in the index are less than investment grade as rated by Standard & Poor’s Ratings Group or Moody’s Investors Service, Inc., and must not be in default. Issues have a term to maturity of at least one year. |
| † | | Currently certain fees are waived. Had such fees not been waived, returns would have been lower. Returns do not reflect the deduction of taxes that a shareholder would pay on Fund distributions or the redemption of shares. |
6
EXCELSIOR TAX-EXEMPT FUNDS, INC. | LONG-TERM TAX-EXEMPT FUND |
The Excelsior Long-Term Tax-Exempt Fund began the second quarter of 2004 with roughly 42% cash; early in the period, as the market sold off, we began to put money back to work; at its lowest point, cash stood at 25%. As the market picked up, however, we sold into the recovery, bringing the cash level back up to 40%. Essentially, while we did engage in some opportunistic trading in the quarter—which benefited the Fund—we largely maintained a defensive structure to the portfolio. Additional portfolio activity in the period included selling of several higher-coupon (5.75%) bonds and the purchase of several 5% coupon bonds, structuring heavily in the 25- to 30-year range.
The Fund began the third quarter of 2004 with roughly 43% cash. We began to put the money back to work, bringing cash down to roughly 23% by quarter end. We focused on a combination of longer and intermediate issues, and higher coupons with longer calls. Discount bonds were virtually impossible to find in the period. Most of the money was put into the 12- to 13-year range; the average maturity of the portfolio increased by roughly a year to the 16-year area. This number is deceptive, however, as the bonds are trading to 8-, 9-, or 10-year calls. The Fund had a solid quarter overall, given some advance refundings.
Through the fourth quarter of 2004, the Fund maintained its largely defensive posture in continued expectation of rising interest rates. On December 31, the portfolio’s average maturity was about 15 years, with most bonds trading to 8- or 9-year call dates, and the cash equivalent position was 27%. Both numbers were virtually the same when the quarter began. With the exception of a few opportunistic December trades that contributed positively to the Fund’s performance, the portfolio was largely unchanged during the period. The impact of the year’s rate hikes was not felt at the long end of the yield curve, where rates closed the year not far from where they started despite some interim volatility. By keeping a significant percentage of fund assets in cash equivalents, the Fund benefited from rising rates at the short end, while maintaining the flexibility to invest further out should the yield curve steepen and reward investors for the added risk of longer maturities.
For the first quarter of 2005, the Excelsior Long-Term Tax-Exempt Fund maintained the defensive posture it has held for some time in anticipation of higher interest rates. The cash position increased from 26% on December 31, 2004 to 36% three months later. This rise resulted from a combination of result of new cash coming into the Fund as transactions intended to bring the Fund’s average maturity from down 15 years at the beginning of the quarter to 13 years at the end. Call dates on bonds in the portfolio were between seven and nine years.
7
EXCELSIOR TAX-EXEMPT FUNDS, INC. | LONG-TERM TAX-EXEMPT FUND |
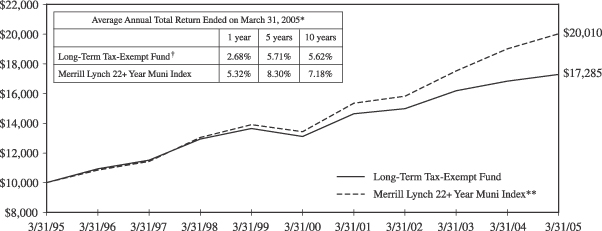
Past performance is not predictive of future performance. Investment returns and principal values will vary and shares may be worth more or less at redemption than their original cost. A portion of the Fund’s income may be subject to the Alternative Minimum Tax and some investors may be subject to certain state and local taxes.
The above illustration compares a $10,000 investment made in the Fund and a broad-based index over the past ten fiscal years. The chart assumes all dividends and capital gain distributions are reinvested. The Fund’s performance takes into account fees and expenses. The index does not take into account charges, fees and other expenses. Further, information relating to Fund performance is contained in the Financial Highlights section of the Prospectus and elsewhere in this report.
| * | | Total return represents the change during the period in a hypothetical account with dividends reinvested. |
| ** | | Source: Merrill Lynch—the Merrill Lynch 22+ Year Muni Index consists of bonds with an outstanding par which is greater than or equal to 25 million and a maturity range greater than or equal to 22 years. |
| † | | Currently certain fees are waived. Had such fees not been waived, returns would have been lower. Returns do not reflect the deduction of taxes that a shareholder would pay on Fund distributions or the redemption of shares. |
8
EXCELSIOR TAX-EXEMPT FUNDS, INC. | INTERMEDIATE-TERM TAX-EXEMPT FUND |
During the second quarter of 2004, redemptions reduced the Excelsior Intermediate-Term Tax-Exempt Fund’s cash by about 3%. The Fund’s average life—at roughly six years—finished the quarter where it started. The Fund’s slight underperformance relative to peers can be attributed to its longer average maturity relative to the average of other Funds in the group.
Portfolio activity for the Excelsior Intermediate-Term Tax-Exempt Fund was minimal during the third quarter, as we were satisfied with the structure of the Fund. During the period, we lost about 4% cash to redemptions, which brought the number from 23.5% to 19.5%. The average maturity of the Fund has remained at roughly 6.2 years even with the passage of time because of refunding.
Managers of the Fund had no reason to change strategies during the 2004 fourth quarter, maintaining roughly 80% of fund assets in non-callable bonds with an average life of close to 6 years and a 20% cash position. Virtually no trades occurred in the portfolio during the quarter, other than one sale to cover redemptions without changing the cash position. Although the Federal Reserve increased the federal funds rate by a total of 50 basis points during the quarter—and 125 basis points during the year—the moves have yet to make any significant impact on intermediate- to long-term rates. As a result, the Fund remains positioned for a rising rate environment with a healthy portion of cash and an average life near the midpoint of the 3-10 year range defined by the Fund’s investment objective. With a curve where a 10-year muni yields only about 80 basis points more than one maturing in five years, the Fund favors shorter life and lower risk.
The first quarter of 2005 was exceptionally quiet for Excelsior Intermediate Tax-Exempt Fund. The portfolio remained in a holding pattern, with no purchases or sales in the period. With expectations for a continued rise in interest rates, and virtually no incentive to trade, we held our defensive posture. New money coming into the Fund increased the cash position from 21% to 23% and reduced the average maturity to 5.5 years. The reward of extending maturities any further at this point falls short of the risk that prices will fall as the market pushes longer-term rates up.
9
EXCELSIOR TAX-EXEMPT FUNDS, INC. | INTERMEDIATE-TERM TAX-EXEMPT FUND |
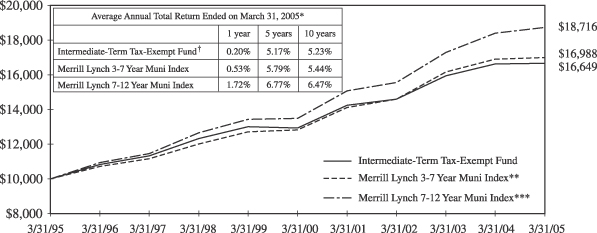
Past performance is not predictive of future performance. Investment returns and principal values will vary and shares may be worth more or less at redemption than their original cost. A portion of the Fund’s income may be subject to the Alternative Minimum Tax and some investors may be subject to certain state and local taxes.
The above illustration compares a $10,000 investment made in the Fund and broad-based indices over the past ten fiscal years. The chart assumes all dividends and capital gain distributions are reinvested. The Fund’s performance takes into account fees and expenses. The indices do not take into account charges, fees and other expenses. Further information relating to Fund performance is contained in the Financial Highlights section of the Prospectus and elsewhere in this report.
| * | | Total return represents the change during the period in a hypothetical account with dividends reinvested. |
| ** | | Source: Merrill Lynch—the Merrill Lynch 3-7 Year Muni Index is a widely-accepted unmanaged market-weighted index comprised of fixed-rate, coupon-bearing bonds issued within five years of the most recent month-end with greater than $50 million principal amount having a Moody’s investment grade rating and maturities of three to seven years. |
| *** | | Source: Merrill Lynch—the Merrill Lynch 7-12 Year Muni Index is a widely-accepted unmanaged market-weighted index comprised of fixed-rate, coupon-bearing bonds issued within five years of the most recent month-end with greater than $50 million principal amount having a Moody’s investment grade rating and maturities of seven to twelve years. |
| † | | Currently certain fees are waived. Had such fees not been waived, returns would have been lower. Returns do not reflect the deduction of taxes that a shareholder would pay on Fund distributions or the redemption of shares. |
10
EXCELSIOR TAX-EXEMPT FUNDS, INC. | SHORT-TERM TAX-EXEMPT SECURITIES FUND |
After a first quarter marked by significant cash inflows for the Excelsior Short-Term Tax-Exempt Fund, the second quarter, on the other hand, saw redemptions mount, bringing cash levels down; we sold securities as a result in an effort to maintain cash at roughly 40%, with a 1.7-year average life, most due in the three-year area.
The third quarter saw minimal portfolio activity in the Fund. We maintained roughly 40% cash and equivalents in the period; the drag here was negligible as the yield (at about 1.4%-1.5%) was similar to yields obtainable out in the 1-year area and not much lower than what we could get out at two years. We maintained an average maturity of 1.5 years and remain cautious.
The Fund ended the year close to where it began in terms of portfolio structure. Although considerable cash came into the Fund during the first half of 2004 as market-shy investors sought liquidity and tax-exempt yield, redemptions became more the norm as the stock market gained momentum. The barbell strategy, deployed when inflows were strong, continues to serve the portfolio well, however. Approximately 45% of Fund assets were held in cash equivalents, reaping the benefit of short-term rate hikes while creating the flexibility to invest when the yield curve warrants an extension of maturities. Most of the remainder of the portfolio was invested primarily in triple-A-rated securities closer to the three-year maximum average maturity, resulting in a short average life of 19 months. The Fund astutely avoided investing too many assets in the two-four year maturity range, where returns did not compensate for risk.
The Fund finished the first quarter of 2005 in a barbell formation, with about 44% in cash and the remainder invested in the two-to-two-and-a-half- year maturity range where yields ended the quarter about 40 basis points higher than they began. With a short average maturity in the fund of about 15 months, the Fund has the flexibility to take advantage of the market’s anticipation of future rate hikes.
11
EXCELSIOR TAX-EXEMPT FUNDS, INC. | SHORT-TERM TAX-EXEMPT SECURITIES FUND |
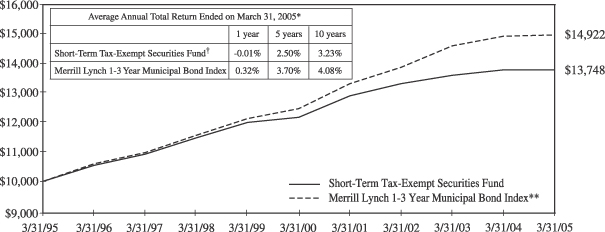
Past performance is not predictive of future performance. Investment returns and principal values will vary and shares may be worth more or less at redemption than their original cost. A portion of the Fund’s income may be subject to the Alternative Minimum Tax and some investors may be subject to certain state and local taxes.
The above illustration compares a $10,000 investment made in the Fund and a broad-based index over the past ten fiscal years. The chart assumes all dividends and capital gain distributions are reinvested. The Fund’s performance takes into account fees and expenses. The index does not take into account charges, fees and other expenses. Further information relating to Fund performance is contained in the Financial Highlights section of the Prospectus and elsewhere in this report.
| * | | Total return represents the change during the period in a hypothetical account with dividends reinvested. |
| ** | | Source: Merrill Lynch—the Merrill Lynch 1-3 Year Municipal Bond Index is a widely-accepted unmanaged market-weighted index comprised of fixed-rate, coupon-bearing bonds issued within five years of the most recent month-end with greater than $50 million principal amount having a Moody’s investment grade rating and maturities of one to three years. |
| † | | Currently certain fees are waived. Had such fees not been waived, returns would have been lower. Returns do not reflect the deduction of taxes that a shareholder would pay on Fund distributions or the redemption of shares. |
12
EXCELSIOR TAX-EXEMPT FUNDS, INC. | NEW YORK INTERMEDIATE-TERM TAX-EXEMPT FUND |
During the second quarter of 2004, redemptions reduced the Excelsior New York Intermediate-Term Tax-Exempt Fund’s cash from 26% to roughly 20%. The Fund’s average life—at roughly six years—finished the quarter where it started. The Fund’s slight underperformance relative to peers can be attributed to its longer average maturity relative to the average of other Funds in the group.
Portfolio activity for the Fund was minimal during the third quarter, as we were satisfied with the structure of the Fund. During the period, we lost about 4% cash to redemptions, bringing the number from 20% to 16%. The average maturity of the Fund has remained at roughly 6 years even with the passage of time because of refunding.
The Fund performed in line with its peer group during the fourth quarter of 2004, with a strategy that continued to anticipate a rising interest rate environment. Over 80% of the portfolio was invested in non-callable bonds from New York state and municipal issuers. A cash-equivalent position of close to 20% brings the fund’s average life to approximately six years, consistent with where it began the quarter. Minimal trading during the period achieved diversification objectives with a neutral impact on performance.
During the first quarter of 2005, the only transaction in the Excelsior New York Intermediate-Term Tax-Exempt Fund was one sale that realized a gain and brought the portfolio’s average maturity down to 5.5 years. In a market that had been waiting for longer-term rates to rise for some time, the Fund was best positioned at this point on the yield curve, given its investment objectives, maturity parameters and the risk-reward relationships in the bond market. The cash position grew from 22% to 26% of the portfolio as the result of this sale, positioning the Fund to act when conditions warrant. Except for this one transaction, the portfolio was in a holding pattern for the quarter.
13
EXCELSIOR TAX-EXEMPT FUNDS, INC. | NEW YORK INTERMEDIATE-TERM TAX-EXEMPT FUND |
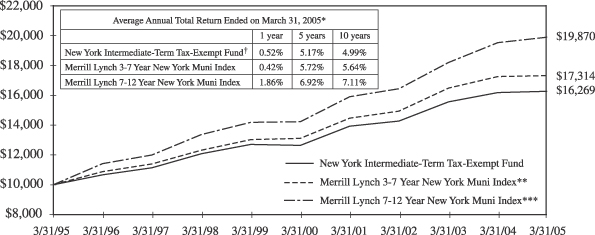
Past performance is not predictive of future performance. Investment returns and principal values will vary and shares may be worth more or less at redemption than their original cost. A portion of the Fund’s income may be subject to the Alternative Minimum Tax.
The above illustration compares a $10,000 investment made in the Fund and broad-based indices over the past ten fiscal years. The chart assumes all dividends and capital gain distributions are reinvested. The Fund’s performance takes into account fees and expenses. The indices do not take into account charges, fees and other expenses. Further information relating to Fund performance is contained in the Financial Highlights section of the Prospectus and elsewhere in this report.
| * | | Total return represents the change during the period in a hypothetical account with dividends reinvested. |
| ** | | Source: Merrill Lynch—the Merrill Lynch 3-7 Year New York Muni Index is a widely-accepted unmanaged market-weighted index comprised of fixed-rate, coupon-bearing bonds of New York Municipalities issued within five years of the most recent month-end with greater than $50 million principal amount having a Moody’s investment grade rating and maturities of three to seven years. |
| *** | | Source: Merrill Lynch—the Merrill Lynch 7-12 Year New York Muni Index is a widely-accepted unmanaged market-weighted index comprised of fixed-rate, coupon-bearing bonds of New York Municipalities issued within five years of the most recent month-end with greater than $50 million principal amount having a Moody’s investment grade rating and maturities of seven to twelve years. |
| † | | Currently certain fees are waived. Had such fees not been waived, returns would have been lower. Returns do not reflect the deduction of taxes that a shareholder would pay on Fund distributions or the redemption of shares. |
14
EXCELSIOR TAX-EXEMPT FUNDS, INC. | CALIFORNIA TAX-EXEMPT INCOME FUND |
During the first fiscal quarter, the successful new issuance of $7.9 billion California Economic Recovery bonds was instrumental in changing the tone of the California market. The record bond sale averted a cash shortage. Moodys, citing that the trend of economic recovery is now well established, raised the State’s general obligation debt to A3 from Baa1 and has given it a positive outlook. By quarter-end, yields on AAA California bonds maturing less than 10 years were lower than AAA national bonds with similar maturities and structure. As a result intermediate, high quality California bonds performed better than comparable national bonds. The Excelsior California Tax-Exempt Income Fund took advantage of the higher yields and modestly lengthened the portfolio to an average maturity of just under 4.5 years.
During the second fiscal quarter, California’s general obligation debt was raised three levels by Standard & Poor’s. The liquidity concerns of the last year dissipated while the economy and tax revenues improved. The secondary market was the source of bonds purchased in the Fund. Though California was the largest issuer of bonds through the quarter, the sectors and structure of the new issues did not meet our needs. In the low interest rate environment of the quarter, we looked for relative value along the yield curve. The intermediate range (5 to 10 years) provided the highest incremental yield pick-up. The average maturity remained at just over four years and we continued to manage the portfolio defensively and purchase bonds inside of ten years.
For the third fiscal quarter the spread between California yields and national yields remained within historical norms. California yields were slightly lower than national yields, but California bonds remained the choice for clients in the highest Federal and California tax brackets. The Fund was managed to defend the portfolio against higher interest rates. While we did see rates rise in the quarter and for the year, we did not see the large increase in bond rates that many expected in 2004. The average maturity remained at approximately 4 years while we maintained our somewhat defensive position.
During the fourth fiscal quarter, ending March 31, 2005, the Federal Open Market Committee maintained the stance that the risk of heightened inflationary pressures versus the risk of economic weakness remained “balanced”. They continued a series of increases and raised the Fed Funds rate at each of the two meetings during the quarter to 2.75%.
In the fourth quarter, the yield curve continued to flatten as short-term yields followed the Fed Funds higher, while longer-term yields were slower-moving. Two-year Treasury yields increased by 71 basis points to 3.78%. 10-year Treasury yields rose a more modest 26 basis points to yield 4. 48%. Five- year AAA municipal bond yields were higher by approximately 50 basis points to 2.79%. Ten-year AAA yields increased about 28 basis points to yield 3.92%. Thirty-year bonds were unchanged at 4.58%. Intermediate portfolios underperformed versus longer term portfolios as a result of the further flattening of the yield curve. Price declines in intermediate bonds exceeded coupon income, resulting in negative total returns. The yield spread between California and national bonds was mixed during the quarter. In the 5-year range, California yields increased slightly more than their national counterparts and in the 10-year maturity range, national bond yields increased slightly more than California bonds. The spread between national and California bonds remained within historical norms. As rates moved up during the quarter, we took advantage of the higher rates and purchased bonds at higher yields. The intention was to slowly increase the average maturity of the portfolio, which ended the quarter at 4.3 years, and to purchase bonds where the incremental yield pick-up is of the most value.
15
EXCELSIOR TAX-EXEMPT FUNDS, INC. | CALIFORNIA TAX-EXEMPT INCOME FUND |
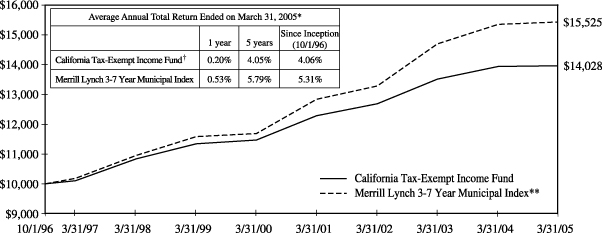
Past performance is not predictive of future performance. Investment returns and principal values will vary and shares may be worth more or less at redemption than their original cost. A portion of the Fund’s income may be subject to the Alternative Minimum Tax.
The above illustration compares a $10,000 investment made in the Fund and a broad-based index since 10/1/96 (inception date). The chart assumes all dividends and capital gain distributions are reinvested. The Fund’s performance takes into account fees and expenses. The index does not take into account charges, fees and other expenses. Further information relating to Fund performance is contained in the Financial Highlights section of the Prospectus and elsewhere in this report.
| * | | Total return represents the change during the period in a hypothetical account with dividends reinvested. |
| ** | | Source: Merrill Lynch—the Merrill Lynch 3-7 Year Municipal Index is a widely-accepted unmanaged market-weighted index comprised of fixed-rate, coupon-bearing bonds issued within five years of the most recent month-end with greater than $50 million principal amount having a Moody’s investment grade rating and maturities of three to seven years. |
| † | | Currently certain fees are waived. Had such fees not been waived, returns would have been lower. Returns do not reflect the deduction of taxes that a shareholder would pay on Fund distributions or the redemption of shares. |
16
Excelsior Funds, Inc.
Portfolio of Investments — March 31, 2005
Managed Income Fund
| | | | | | | | | | | |
| | | | | | | | | | | | |
Principal
| | | | Rate
| | | Maturity
Date
| | Value
|
| | ASSET BACKED SECURITIES — 2.04% |
| $ | 2,156,712 | | CIT RV Trust,
1999-A A4 | | 6.16 | % | | 06/15/13 | | $ | 2,177,136 |
| | 2,161,000 | | Residential Asset Mortgage Products, Inc.,
2003-FZ4 A2(a) | | 2.81 | | | 07/25/27 | | | 2,144,814 |
| | | | | | | | | | |
|
|
| | | | TOTAL ASSET BACKED SECURITIES
(Cost $4,273,185) | | | 4,321,950 |
| | | | | | | | | | |
|
|
| | COLLATERALIZED MORTGAGE OBLIGATIONS — 13.76% |
| | 2,701,071 | | Citigroup Mortgage Loan Trust,
2004-HYB4 WA(a) | | 4.49 | | | 12/25/34 | | | 2,687,565 |
| | 3,062,141 | | Countrywide Alternative Loan Trust,
2004-16CB 1A2 | | 5.50 | | | 07/25/34 | | | 3,077,796 |
| | 2,034,936 | | Countrywide Alternative Loan Trust,
2004-22CB 1A1 | | 6.00 | | | 10/25/34 | | | 2,076,568 |
| | 3,265,044 | | Wells Fargo Mortgage Backed Securities Trust, 2004-EE 3A1 | | 3.99 | | | 01/25/35 | | | 3,204,434 |
| | | | | | | | | | |
|
|
| | | | | 11,046,363 |
| | | | | | | | | | |
|
|
| | | | FEDERAL HOME LOAN MORTGAGE
CORPORATION — 7.07% |
| | 9,568,125 | | 1602 PH | | 6.00 | | | 04/15/23 | | | 9,738,026 |
| | 5,033,552 | | 2333 UZ | | 6.50 | | | 07/15/31 | | | 5,248,183 |
| | | | | | | | | | |
|
|
| | | | | | | | | | | | 14,986,209 |
| | | | | | | | | | |
|
|
| | | | GOVERNMENT NATIONAL MORTGAGE ASSOCIATION — 1.48% |
| | 3,000,000 | | 2005-25 B | | 6.21 | | | 03/16/21 | | | 3,127,349 |
| | | | | | | | | | |
|
|
| | | | TOTAL COLLATERALIZED MORTGAGE OBLIGATIONS
(Cost $29,294,034) | | | 29,159,921 |
| | | | | | | | | | |
|
|
| | COMMERCIAL MORTGAGE-BACKED SECURITIES — 16.33% |
| | 1,477,000 | | Bank of America Commercial Mortgage, Inc.,
2004-1 A4 | | 4.76 | | | 11/10/39 | | | 1,445,378 |
| | 3,705,581 | | Chase Commercial Mortgage Securities Corp., 1997-2 D
| | 6.60 | | | 12/19/29 | | | 3,899,755 |
| | 1,689,000 | | Greenwich Capital Commercial Funding Corp.,
2004-GG1 A1 | | 5.32 | | | 06/10/36 | | | 1,718,354 |
| | 2,000,000 | | Morgan Stanley Capital I, 1997-C1F(b) | | 6.85 | | | 02/15/20 | | | 2,100,107 |
| | 3,601,000 | | Morgan Stanley Capital I, 1999-WF1 B | | 6.32 | | | 11/15/31 | | | 3,798,947 |
| | 3,150,000 | | Morgan Stanley Dean Witter Capital I,
2000-LIF2 C | | 7.50 | | | 10/15/33 | | | 3,524,429 |
| | 4,000,000 | | Mortgage Capital Funding, Inc.,
1996-MC1 G | | 7.15 | | | 06/15/06 | | | 4,125,009 |
| | | | | | | | | | | |
| | | | | | | | | | | | |
Principal
| | | | Rate
| | | Maturity
Date
| | Value
|
| | COMMERCIAL MORTGAGE-BACKED SECURITIES — (continued) |
| $ | 1,009,000 | | Mortgage Capital Funding, Inc.,
1996-MC2 D | | 7.26 | % | | 10/20/06 | | $ | 1,052,172 |
| | 836,000 | | Mortgage Capital Funding, Inc.,
1997-MC2 C(a) | | 6.88 | | | 11/20/27 | | | 881,797 |
| | 3,061,000 | | Mortgage Capital Funding, Inc.,
1998-MC1 C | | 6.95 | | | 03/18/30 | | | 3,252,450 |
| | 2,521,000 | | Nomura Asset Securities Corp.,
1998-D6 A4(a) | | 7.61 | | | 03/15/30 | | | 2,892,223 |
| | 3,601,000 | | Wachovia Bank Commercial Mortgage Trust,
2003-C9 A3 | | 4.61 | | | 12/15/35 | | | 3,560,007 |
| | 2,305,000 | | Wachovia Bank Commercial Mortgage Trust,
2004-C12 A3 | | 5.23 | | | 07/15/41 | | | 2,353,477 |
| | | | | | | | | | |
|
|
| | | | TOTAL COMMERCIAL MORTGAGE-BACKED SECURITIES
(Cost $33,891,204) | | | 34,604,105 |
| | | | | | | | | | |
|
|
| | CORPORATE BONDS — 14.11% |
| | 505,000 | | AK Steel Corp. | | 7.75 | | | 06/15/12 | | | 486,063 |
| | 1,117,000 | | America Movil S.A. | | 4.13 | | | 03/01/09 | | | 1,074,240 |
| | 3,421,000 | | Bank One Texas N.A. | | 6.25 | | | 02/15/08 | | | 3,587,344 |
| | 700,000 | | British Telecommunications plc | | 8.88 | | | 12/15/30 | | | 932,742 |
| | 1,081,000 | | CIT Group, Inc. | | 5.88 | | | 10/15/08 | | | 1,122,056 |
| | 961,000 | | CMS Energy Corp. | | 9.88 | | | 10/15/07 | | | 1,042,685 |
| | 1,441,000 | | Comcast Cable Communications | | 6.88 | | | 06/15/09 | | | 1,546,122 |
| | 1,441,000 | | DaimlerChrysler N.A. Holding Corp. | | 7.20 | | | 09/01/09 | | | 1,550,876 |
| | 1,081,000 | | Deutsche Telekom International Finance | | 8.75 | | | 06/15/30 | | | 1,413,408 |
| | 181,000 | | Hercules, Inc. | | 11.13 | | | 11/15/07 | | | 207,245 |
| | 2,773,000 | | Household Finance Corp. | | 8.00 | | | 07/15/10 | | | 3,172,220 |
| | 649,000 | | IMC Global, Inc.,
Series B | | 10.88 | | | 06/01/08 | | | 743,105 |
| | 1,437,000 | | International Lease Finance Corp. | | 4.50 | | | 05/01/08 | | | 1,427,721 |
| | 2,881,000 | | Merrill Lynch & Co. MTN | | 5.00 | | | 02/03/14 | | | 2,822,461 |
| | 1,441,000 | | Prudential Financial, Inc. | | 5.10 | | | 09/20/14 | | | 1,426,740 |
| | 627,000 | | PSEG Energy Holdings, Inc. | | 8.63 | | | 02/15/08 | | | 661,485 |
| | 800,000 | | Qwest Services Corp.(b) | | 14.00 | | | 12/15/10 | | | 926,000 |
| | 1,596,000 | | Sprint Capital Corp. | | 8.38 | | | 03/15/12 | | | 1,865,242 |
| | 1,153,000 | | Time Warner Cos., Inc. | | 7.25 | | | 10/15/17 | | | 1,307,450 |
See Notes to Financial Statements.
17
Excelsior Funds, Inc.
Portfolio of Investments — March 31, 2005
Managed Income Fund — (continued)
| | | | | | | | | | | |
| | | | | | | | | | | | |
Principal
| | | | Rate
| | | Maturity
Date
| | Value
|
| | CORPORATE BONDS — (continued) |
| $ | 1,441,000 | | Wal-Mart Stores | | 4.13 | % | | 02/15/11 | | $ | 1,395,861 |
| | 1,081,000 | | Weyerhaeuser Co. | | 6.88 | | | 12/15/33 | | | 1,200,497 |
| | | | | | | | | | |
|
|
| | | | TOTAL CORPORATE BONDS
(Cost $28,568,554) | | | 29,911,563 |
| | | | | | | | | | |
|
|
| | TAX-EXEMPT SECURITIES — 4.22% |
| | 3,169,000 | | New York State Dormitory Authority, Personal Income Tax Revenue Bonds, Series B,
(AMBAC) | | 5.50 | | | 03/15/28 | | | 3,624,544 |
| | 1,441,000 | | New York State Dormitory Authority, Personal Income Tax Revenue Bonds, Series B,
(AMBAC) | | 5.50 | | | 03/15/30 | | | 1,648,144 |
| | 3,601,000 | | University of Texas Revenue Bonds, Series B | | 5.00 | | | 08/15/33 | | | 3,677,521 |
| | | | | | | | | | |
|
|
| | | | TOTAL TAX-EXEMPT SECURITIES
(Cost $9,257,739) | | | 8,950,209 |
| | | | | | | | | | |
|
|
| | FOREIGN GOVERNMENT OBLIGATION — 1.06% |
| | 2,161,000 | | United Mexican States | | 6.38 | | | 01/16/13 | | | 2,242,038 |
| | | | | | | | | | |
|
|
| | | | TOTAL FOREIGN GOVERNMENT OBLIGATION
(Cost $2,198,956) | | | 2,242,038 |
| | | | | | | | | | |
|
|
| | U.S. GOVERNMENT AGENCY BONDS & NOTES — 10.64% |
| | | | FANNIE MAE — 10.64% | | | |
| | 2,000,000 | | | | 6.25 | | | 02/01/11 | | | 2,137,068 |
| | 18,000,000 | | Discount Note(c) | | 2.73 | | | 05/04/05 | | | 17,954,955 |
| | 5,329,000 | | Discount Note | | 6.25 | | | 10/09/19 | | | 2,455,710 |
| | | | | | | | | | |
|
|
| | | | | | | | | | | | 22,547,733 |
| | | | | | | | | | |
|
|
| | | | TOTAL U.S. GOVERNMENT AGENCY BONDS & NOTES
(Cost $22,250,923) | | | 22,547,733 |
| | | | | | | | | | |
|
|
| U.S. GOVERNMENT AGENCY MORTGAGE PASS THROUGH
SECURITIES — 26.19% |
| | | | FEDERAL HOME LOAN MORTGAGE
CORPORATION — 3.18% |
| | 3,355,322 | | Pool # A20105 | | 5.00 | | | 04/01/34 | | | 3,285,094 |
| | 3,397,249 | | Pool # C01811 | | 5.00 | | | 04/01/34 | | | 3,326,143 |
| | 136,304 | | Pool # C71221 | | 5.00 | | | 09/01/32 | | | 133,860 |
| | | | | | | | | | |
|
|
| | | | | | | | | | | | 6,745,097 |
| | | | | | | | | | |
|
|
| | | | FEDERAL NATIONAL MORTGAGE
ASSOCIATION — 18.92% |
| | 23,988,889 | | Pool # 11996,
May TBA | | 5.00 | | | 05/01/35 | | | 23,381,682 |
| | 1,282,401 | | Pool # 387203 | | 4.80 | | | 01/01/12 | | | 1,286,394 |
| | 1,095,029 | | Pool # 387204 | | 4.80 | | | 01/01/12 | | | 1,098,439 |
| | 5,182,934 | | Pool # 618322 | | 6.00 | | | 12/01/31 | | | 5,304,508 |
| | | | | | | | | | | |
| | | | | | | | | | | | |
Principal/
Shares
| | | | Rate
| | | Maturity
Date
| | Value
|
| U.S. GOVERNMENT AGENCY MORTGAGE PASS THROUGH
SECURITIES — (continued) |
| | | | FEDERAL NATIONAL MORTGAGE
ASSOCIATION — (continued) |
| $ | 2,724,099 | | Pool # 728826 ARM(a) | | 4.10 | % | | 07/01/33 | | $ | 2,705,560 |
| | 6,299,361 | | Pool # 805386 ARM(a) | | 4.94 | | | 01/01/35 | | | 6,307,357 |
| | | | | | | | | | |
|
|
| | | | | | | | | | | | 40,083,940 |
| | | | | | | | | | |
|
|
| | | | GOVERNMENT NATIONAL MORTGAGE
ASSOCIATION — 4.09% |
| | 548,861 | | Pool # 2562 | | 6.00 | | | 03/20/28 | | | 564,684 |
| | 771,468 | | Pool # 267812 | | 8.50 | | | 06/15/17 | | | 841,436 |
| | 2,571,829 | | Pool # 3413 | | 4.50 | | | 07/20/33 | | | 2,457,698 |
| | 2,414,218 | | Pool # 3442 | | 5.00 | | | 09/20/33 | | | 2,381,738 |
| | 36,755 | | Pool # 532751 | | 9.00 | | | 08/15/30 | | | 40,672 |
| | 136,374 | | Pool # 568670 | | 6.50 | | | 04/15/32 | | | 142,611 |
| | 398,889 | | Pool # 780548 | | 8.50 | | | 12/15/17 | | | 433,731 |
| | 391,833 | | Pool # 780865 | | 9.50 | | | 11/15/17 | | | 432,724 |
| | 717,221 | | Pool # 781084 | | 9.00 | | | 12/15/17 | | | 781,102 |
| | 578,818 | | Pool # 80311
ARM(a) | | 3.50 | | | 08/20/29 | | | 586,391 |
| | | | | | | | | | |
|
|
| | | | | | | | | | | | 8,662,787 |
| | | | | | | | | | |
|
|
| | | | TOTAL U.S. GOVERNMENT AGENCY MORTGAGE PASS THROUGH SECURITIES
(Cost $55,007,487) | | | 55,491,824 |
| | | | | | | | | | |
|
|
| | U.S. GOVERNMENT SECURITIES — 11.17% |
| | | | U.S. TREASURY PRINCIPAL ONLY STRIPS — 4.44% |
| | 4,836,000 | | | | 0.00 | | | 05/15/17 | | | 2,714,785 |
| | 4,545,000 | | | | 0.00 | | | 05/15/17 | | | 2,539,382 |
| | 8,642,000 | | | | 0.00 | | | 02/15/20 | | | 4,164,182 |
| | | | | | | | | | |
|
|
| | | | | | | | | | | | 9,418,349 |
| | | | | | | | | | |
|
|
| | | | U.S. TREASURY INFLATION PROTECTED
BONDS — 2.70% |
| | 1,675,595 | | | | 3.88 | | | 01/15/09 | | | 1,847,846 |
| | 3,000,000 | | | | 4.25 | | | 01/15/10 | | | 3,870,789 |
| | | | | | | | | | |
|
|
| | | | | | | | | | | | 5,718,635 |
| | | | | | | | | | |
|
|
| | | | U.S. TREASURY NOTES — 4.03% |
| | 7,000,000 | | (c) | | 3.63 | | | 01/15/10 | | | 6,833,750 |
| | 1,285,000 | | | | 7.63 | | | 11/15/22 | | | 1,701,970 |
| | | | | | | | | | |
|
|
| | | | | | | | | | | | 8,535,720 |
| | | | | | | | | | |
|
|
| | | | TOTAL U.S. GOVERNMENT SECURITIES
(Cost $23,517,454) | | | 23,672,704 |
| | | | | | | | | | |
|
|
| | REGISTERED INVESTMENT COMPANIES — 0.72% |
| | 764,706 | | Dreyfus Government Cash Management Fund | | | 764,706 |
| | 764,706 | | Fidelity U.S. Treasury II Fund | | | 764,705 |
| | | | | | | | | | |
|
|
| | | | TOTAL REGISTERED INVESTMENT COMPANIES
(Cost $1,529,411) | | | 1,529,411 |
| | | | | | | | | | |
|
|
See Notes to Financial Statements.
18
Excelsior Funds, Inc.
Portfolio of Investments — March 31, 2005
Managed Income Fund — (continued)
| | | | | | | |
| | | | | | Value
| |
TOTAL INVESTMENTS
(Cost $209,787,935)(d) | | 100.24 | % | | $ | 212,431,458 | |
| | | | | | | | |
LIABILITIES IN EXCESS OF OTHER ASSETS | | 0.24 | | | | (498,472 | ) |
| | |
|
| |
|
|
|
NET ASSETS | | 100.00 | % | | $ | 211,932,986 | |
| | |
|
| |
|
|
|
| (a) | Variable Rate Security—The rate disclosed is as of March 31, 2005. |
| (b) | Security exempt from registration under Rule 144A of the Securities Act of 1933. This security may be resold in transactions exempt from registration, normally to qualified institutional buyers. At March 31, 2005, these securities amounted to $3,026,107 or 1.43% of net assets. |
| (c) | All or part of the security is segregated by the fund’s custodian to cover future purchase commitments. |
| (d) | Unrealized appreciation (depreciation) of securities: |
| | | | |
Unrealized
Appreciation
| | Unrealized
(Depreciation)
| | Net Unrealized
Appreciation/
(Depreciation)
|
| $3,669,100 | | $(1,025,577) | | $2,643,523 |
AMBAC—American Municipal Bond Assurance Corp.
ARM—Adjustable Rate Mortgage
Discount Note—The rate reported is the discount rate at the time of purchase.
MTN—Medium Term Note
plc—public limited company
STRIPS—Separately Traded Registered Interest and Principal Securities
TBA—To Be Announced
The summary of the Fund’s investments as of March 31, 2005 is as follows: (Unaudited)
| | | | | | | |
Portfolio Diversification
| | % of
Net
Assets
| | | Value
| |
U.S. Government & Agency Securities | | 48.00 | % | | $ | 101,712,261 | |
Commercial Mortgage-Backed Securities | | 16.33 | | | | 34,604,105 | |
Corporate Bonds | | 14.11 | | | | 29,911,563 | |
Collateralized Mortgage Obligations | | 13.76 | | | | 29,159,921 | |
Tax-Exempt Securities | | 4.22 | | | | 8,950,209 | |
Asset Backed Securities | | 2.04 | | | | 4,321,950 | |
Foreign Government Obligation | | 1.06 | | | | 2,242,038 | |
Registered Investment Company | | 0.72 | | | | 1,529,411 | |
| | |
|
| |
|
|
|
Total Investments | | 100.24 | % | | $ | 212,431,458 | |
Other Assets and Liabilities (Net) | | (0.24 | ) | | | (498,472 | ) |
| | |
|
| |
|
|
|
Net Assets | | 100.00 | % | | $ | 211,932,986 | |
| | |
|
| |
|
|
|
See Notes to Financial Statements.
19
Excelsior Funds, Inc.
Portfolio of Investments — March 31, 2005
Intermediate-Term Managed Income Fund
| | | | | | | | | | | |
| | | | | | | | | | | | |
Principal
| | | | Rate
| | | Maturity
Date
| | Value
|
| | ASSET BACKED SECURITIES — 3.21% |
| $ | 2,000,000 | | Capital One Master Trust, 2001-6 C(a) | | 6.70 | % | | 06/15/11 | | $ | 2,108,750 |
| | 3,485,000 | | Capital One Multi-Asset Execution Trust,
2003-A1 A1(b) | | 3.20 | | | 01/15/09 | | | 3,497,569 |
| | 1,625,000 | | Capital One Multi-Asset Execution Trust,
2003-B1 B1(b) | | 3.98 | | | 02/17/09 | | | 1,641,058 |
| | 2,670,000 | | Chase Credit Card Master Trust,
2001-1 C(b) | | 3.66 | | | 06/16/08 | | | 2,683,687 |
| | 1,071,614 | | Chase Funding Mortgage Loan Asset Backed Certificates, 2003-3 2A2(b) | | 3.12 | | | 04/25/33 | | | 1,074,939 |
| | 2,000,000 | | MBNA Master Credit Card Trust USA, 2000-K C(a)(b) | | 3.61 | | | 03/17/08 | | | 1,999,688 |
| | 180,055 | | Residential Asset Mortgage Products, Inc.,
2003-RS8 AI1(b) | | 3.01 | | | 08/25/21 | | | 180,060 |
| | | | | | | | | | |
|
|
| | | | TOTAL ASSET BACKED SECURITIES
(Cost $13,192,026) | | | 13,185,751 |
| | | | | | | | | | |
|
|
| | COLLATERALIZED MORTGAGE OBLIGATIONS — 9.62% |
| | 2,138,663 | | Bank of America Mortgage Securities 2003-A 2A1 | | 3.98 | | | 02/25/33 | | | 2,111,645 |
| | 5,031,932 | | Bear Stearns ARM,
2004-1 11A3(b) | | 3.50 | | | 04/25/34 | | | 4,996,464 |
| | 5,865,669 | | Countrywide Alternative Loan Trust,
2004-22CB 1A1 | | 6.00 | | | 10/25/34 | | | 5,985,673 |
| | 3,117,575 | | Wells Fargo Mortgage Backed Securities Trust,
2004-EE 3A1 | | 3.99 | | | 01/25/35 | | | 3,059,702 |
| | 4,435,466 | | Wells Fargo Mortgage Backed Securities Trust,
2005-AR1 1A1 | | 4.57 | | | 02/25/35 | | | 4,392,550 |
| | | | | | | | | | |
|
|
| | | | | | | | | | | | 20,546,034 |
| | | | | | | | | | |
|
|
| | | | FEDERAL HOME LOAN MORTGAGE
CORPORATION — 2.37% |
| | 2,999,098 | | 2386 QH | | 6.50 | | | 10/15/30 | | | 3,042,935 |
| | 6,647,678 | | 2406 PE | | 6.50 | | | 08/15/30 | | | 6,693,869 |
| | | | | | | | | | |
|
|
| | | | | | | | | | | | 9,736,804 |
| | | | | | | | | | |
|
|
| | | | FEDERAL NATIONAL MORTGAGE
ASSOCIATION — 0.87% |
| | 3,557,543 | | 2001-42 QG | | 6.50 | | | 07/25/30 | | | 3,564,948 |
| | | | | | | | | | |
|
|
| | | | | | | | | | | |
| | | | | | | | | | | | |
Principal
| | | | Rate
| | | Maturity
Date
| | Value
|
| | COLLATERALIZED MORTGAGE OBLIGATIONS — (continued) |
| | | | GOVERNMENT NATIONAL MORTGAGE
ASSOCIATION — 1.37% |
| $ | 2,800,000 | | 2005-10 MW | | 4.67 | % | | 09/16/25 | | $ | 2,753,931 |
| | 2,925,000 | | 2005-14 B | | 4.48 | | | 08/16/32 | | | 2,856,947 |
| | | | | | | | | | |
|
|
| | | | | | | | | | | | 5,610,878 |
| | | | | | | | | | |
|
|
| | | | TOTAL COLLATERALIZED
MORTGAGE OBLIGATIONS
(Cost $39,876,165) | | | 39,458,664 |
| | | | | | | | | | |
|
|
| | COMMERCIAL MORTGAGE-BACKED SECURITIES — 14.75% |
| | 4,327,000 | | Bear Stearns Commercial Mortgage Securities, 2005-PWR7 A3 | | 5.12 | | | 02/11/41 | | | 4,325,648 |
| | 2,000,000 | | Commercial Mortgage Asset Trust,
1999-C1 B | | 7.23 | | | 01/17/32 | | | 2,296,213 |
| | 3,556,000 | | Commercial Mortgage Asset Trust,
1999-C2 C | | 7.80 | | | 11/17/32 | | | 4,246,677 |
| | 2,667,506 | | DLJ Mortgage Acceptance Corp., 1996-CF2 A3(a) | | 7.38 | | | 11/12/21 | | | 2,733,006 |
| | 3,955,456 | | DLJ Mortgage Acceptance Corp., 1997-CF2 A1B(a) | | 6.82 | | | 10/15/30 | | | 4,137,189 |
| | 3,900,000 | | GMAC Commercial Mortgage Securities, Inc., 1999-C1 C | | 6.59 | | | 05/15/33 | | | 4,167,427 |
| | 1,847,468 | | LB-UBS Commercial Mortgage Trust,
2001-C2 A1 | | 6.27 | | | 06/15/20 | | | 1,928,667 |
| | 3,713,081 | | Midland Realty Acceptance Corp., 1996-C2 B | | 7.34 | | | 01/25/29 | | | 3,855,134 |
| | 3,085,000 | | Morgan Stanley Dean Witter Capital I,
2003-TOP9 A2 | | 4.74 | | | 11/13/36 | | | 3,042,606 |
| | 3,104,000 | | Morgan Stanley Dean Witter Capital I,
2005-HQ5 A4 | | 5.17 | | | 01/14/42 | | | 3,114,185 |
| | 3,000,000 | | Mortgage Capital Funding, Inc.,
1996-MC1 G | | 7.15 | | | 06/15/06 | | | 3,093,758 |
| | 2,402,770 | | Mortgage Capital Funding, Inc.,
1996-MC2 C | | 7.22 | | | 12/21/26 | | | 2,500,914 |
| | 3,410,000 | | Nomura Asset Securities Corp.,
1998-D6 A1B | | 6.59 | | | 03/15/30 | | | 3,612,143 |
| | 4,025,000 | | Nomura Asset Securities Corp.,
1998-D6 A4(b) | | 7.61 | | | 03/15/30 | | | 4,617,691 |
| | 1,435,000 | | Wachovia Bank Commercial Mortgage Trust,
2002-C1 A4 | | 6.29 | | | 04/15/34 | | | 1,546,086 |
See Notes to Financial Statements.
20
Excelsior Funds, Inc.
Portfolio of Investments — March 31, 2005
Intermediate-Term Managed Income Fund — (continued)
| | | | | | | | | | | |
| | | | | | | | | | | | |
Principal
| | | | Rate
| | | Maturity
Date
| | Value
|
| | COMMERCIAL MORTGAGE-BACKED SECURITIES — (continued) |
| $ | 6,525,000 | | Wachovia Bank Commercial Mortgage Trust,
2003-C9 A3 | | 4.61 | % | | 12/15/35 | | $ | 6,450,720 |
| | 4,775,000 | | Wachovia Bank Commercial Mortgage Trust,
2004-C12 A3 | | 5.23 | | | 07/15/41 | | | 4,875,425 |
| | | | | | | | | | |
|
|
| | | | TOTAL COMMERCIAL MORTGAGE-BACKED SECURITIES
(Cost $60,534,913) | | | 60,543,489 |
| | | | | | | | | | |
|
|
| | CORPORATE BONDS — 28.78% |
| | 500,000 | | AK Steel Corp. | | 7.75 | | | 06/15/12 | | | 481,250 |
| | 3,150,000 | | Allstate Life Global Funding Trust | | 3.85 | | | 01/25/08 | | | 3,102,788 |
| | 1,720,000 | | America Movil S.A. | | 4.13 | | | 03/01/09 | | | 1,654,157 |
| | 1,810,000 | | Bank One Corp. | | 7.63 | | | 10/15/26 | | | 2,205,938 |
| | 4,155,000 | | Caterpillar Financial Services Corp. MTN | | 2.35 | | | 09/15/06 | | | 4,060,269 |
| | 500,000 | | Cincinnati Bell, Inc. | | 8.38 | | | 01/15/14 | | | 492,500 |
| | 2,570,000 | | Cit Group, Inc. | | 5.00 | | | 02/01/15 | | | 2,483,121 |
| | 1,100,000 | | CMS Energy Corp. | | 9.88 | | | 10/15/07 | | | 1,193,500 |
| | 167,000 | | Compagnie Generale de Geophysique S.A. | | 10.63 | | | 11/15/07 | | | 176,185 |
| | 2,975,000 | | Continental Cablevision | | 9.00 | | | 09/01/08 | | | 3,350,594 |
| | 1,835,000 | | Credit Suisse First Boston (USA), Inc. | | 3.88 | | | 01/15/09 | | | 1,785,272 |
| | 2,040,000 | | DaimlerChrysler NA Holding Corp. | | 4.05 | | | 06/04/08 | | | 1,981,126 |
| | 6,000,000 | | FedEx Corp. | | 2.65 | | | 04/01/07 | | | 5,814,264 |
| | 3,150,000 | | Ford Motor
Credit Co. | | 6.88 | | | 02/01/06 | | | 3,192,834 |
| | 2,290,000 | | Ford Motor
Credit Co. | | 5.80 | | | 01/12/09 | | | 2,187,124 |
| | 2,897,961 | | Hainan Airways(b) | | 3.01 | | | 12/15/07 | | | 2,897,961 |
| | 250,000 | | Hercules, Inc. | | 11.13 | | | 11/15/07 | | | 286,250 |
| | 5,645,000 | | Household Finance Corp. | | 8.00 | | | 07/15/10 | | | 6,457,694 |
| | 350,000 | | IMC Global, Inc., Series B | | 10.88 | | | 06/01/08 | | | 400,750 |
| | 5,500,000 | | International Lease Finance Corp. | | 4.75 | | | 01/13/12 | | | 5,331,189 |
| | 5,300,000 | | John Deere Capital Corp. MTN(b) | | 2.85 | | | 07/11/05 | | | 5,303,943 |
| | 2,685,000 | | John Deere Capital Corp. MTN | | 3.38 | | | 10/01/07 | | | 2,622,619 |
| | 4,130,000 | | JP Morgan Chase & Co. | | 5.25 | | | 05/30/07 | | | 4,211,373 |
| | 3,435,000 | | Legg Mason, Inc. | | 6.75 | | | 07/02/08 | | | 3,666,581 |
| | 5,000,000 | | Lehman Brothers Holdings, Inc. | | 4.25 | | | 01/27/10 | | | 4,873,100 |
| | 4,065,000 | | Limited Brands, Inc. | | 5.25 | | | 11/01/14 | | | 3,862,238 |
| | | | | | | | | | | |
| | | | | | | | | | | | |
Principal
| | | | Rate
| | | Maturity
Date
| | Value
|
| | CORPORATE BONDS — (continued) |
| $ | 2,130,000 | | Mercantile Bancorp | | 7.30 | % | | 06/15/07 | | $ | 2,261,031 |
| | 75,000 | | Merrill Lynch & Co. | | 3.00 | | | 04/30/07 | | | 73,385 |
| | 5,100,000 | | Morgan Stanley | | 4.75 | | | 04/01/14 | | | 4,855,807 |
| | 2,000,000 | | Nationwide Life Global Funding, Inc.(a) | | 5.35 | | | 02/15/07 | | | 2,037,292 |
| | 1,955,000 | | Nisource Finance Corp. | | 7.88 | | | 11/15/10 | | | 2,229,439 |
| | 3,625,000 | | Pepsi Bottling
Group, llc | | 2.45 | | | 10/16/06 | | | 3,541,614 |
| | 1,975,000 | | Prudential Financial, Inc. | | 5.10 | | | 09/20/14 | | | 1,955,455 |
| | 1,200,000 | | Qwest Services Corp(a) | | 14.00 | | | 12/15/10 | | | 1,389,000 |
| | 1,750,000 | | Susquehanna Bancshares, Inc. | | 6.05 | | | 11/01/12 | | | 1,818,313 |
| | 1,915,000 | | Telefonos de
Mexico S.A. | | 4.50 | | | 11/19/08 | | | 1,882,727 |
| | 4,185,000 | | Textron Financial Corp. MTN(b) | | 3.94 | | | 04/24/06 | | | 4,236,777 |
| | 2,415,000 | | Time Warner Entertainment | | 8.38 | | | 03/15/23 | | | 2,959,039 |
| | 3,850,000 | | US Bank NA | | 2.87 | | | 02/01/07 | | | 3,773,612 |
| | 5,075,000 | | Wachovia Corp. | | 3.50 | | | 08/15/08 | | | 4,925,414 |
| | 1,555,000 | | Wachovia Corp. | | 5.25 | | | 08/01/14 | | | 1,559,427 |
| | 2,225,000 | | Wells Fargo Bank NA | | 7.80 | | | 06/15/10 | | | 2,243,877 |
| | 2,268,000 | | Weyerhauser Co. | | 5.25 | | | 12/15/09 | | | 2,312,065 |
| | | | | | | | | | |
|
|
| | | | TOTAL CORPORATE BONDS
(Cost $118,812,620) | | | 118,128,894 |
| | | | | | | | | | |
|
|
| | TAX-EXEMPT SECURITIES — 0.69% |
| | 2,600,000 | | California State, Infrastructure & Economic Development Bank, Revenue Bonds, Bay Area Toll Bridges Project, Series A | | 5.25 | | | 07/01/16 | | | 2,830,750 |
| | | | | | | | | | |
|
|
| | | | TOTAL TAX-EXEMPT SECURITIES
(Cost $2,832,977) | | | 2,830,750 |
| | | | | | | | | | |
|
|
| | FOREIGN GOVERNMENT OBLIGATION — 0.51% |
| | 1,990,000 | | United Mexican States | | 6.63 | | | 03/03/15 | | | 2,073,580 |
| | | | | | | | | | |
|
|
| | | | TOTAL FOREIGN GOVERNMENT OBLIGATION
(Cost $1,947,209) | | | 2,073,580 |
| | | | | | | | | | |
|
|
| | U.S. GOVERNMENT AGENCY BONDS & NOTES — 11.91% |
| | | | FANNIE MAE — 9.66% | | | |
| | 8,125,000 | | | | 2.81 | | | 09/28/06 | | | 7,983,861 |
| | 6,150,000 | | | | 3.29 | | | 11/30/06 | | | 6,085,554 |
| | 8,125,000 | | | | 3.63 | | | 01/19/07 | | | 8,073,845 |
| | 775,000 | | | | 4.00 | | | 02/22/07 | | | 772,094 |
| | 11,330,000 | | | | 7.25 | | | 01/15/10 | | | 12,648,925 |
| | 4,050,000 | | | | 5.50 | | | 07/18/12 | | | 4,075,304 |
| | | | | | | | | | |
|
|
| | | | | | | | | | | | 39,639,583 |
| | | | | | | | | | |
|
|
See Notes to Financial Statements.
21
Excelsior Funds, Inc.
Portfolio of Investments — March 31, 2005
Intermediate-Term Managed Income Fund — (continued)
| | | | | | | | | | | | |
| | | | | | | | | | | | | |
Principal
| | | | Rate
| | | Maturity
Date
| | | Value
|
| | U.S. GOVERNMENT AGENCY BONDS & NOTES — (continued) |
| | | | FREDDIE MAC — 2.25% | | | | | | | |
| $ | 5,845,000 | | | | 3.00 | % | | 09/29/06 | | | $ | 5,754,186 |
| | 3,355,000 | | | | 5.13 | | | 07/15/12 | | | | 3,436,792 |
| | 50,000 | | MTN | | 2.85 | | | 01/05/07 | | | | 49,089 |
| | | | | | | | | | | |
|
|
| | | | | | | | | | | | | 9,240,067 |
| | | | | | | | | | | |
|
|
| | | | TOTAL U.S. GOVERNMENT AGENCY BONDS & NOTES
(Cost $49,223,440) | | | | 48,879,650 |
| | | | | | | | | | | |
|
|
| U.S. GOVERNMENT AGENCY MORTGAGE PASS THROUGH
SECURITIES — 11.08% |
| | | | FEDERAL NATIONAL MORTGAGE
ASSOCIATION — 7.90% |
| | 4,625,959 | | Pool # 254800 | | 5.50 | | | 07/01/23 | | | | 4,674,521 |
| | 2,350,000 | | Pool # 360500 | | 6.26 | | | 09/01/13 | | | | 2,548,611 |
| | 2,630,000 | | Pool # 385538 | | 4.79 | | | 11/01/12 | | | | 2,586,108 |
| | 1,221,678 | | Pool # 545290 | | 7.50 | | | 10/01/16 | | | | 1,288,913 |
| | 342,999 | | Pool # 577218 | | 6.00 | | | 04/01/31 | | | | 351,045 |
| | 6,335 | | Pool # 578823 | | 5.50 | | | 04/01/31 | | | | 6,365 |
| | 2,410,980 | | Pool # 624250 | | 6.00 | | | 01/01/17 | | | | 2,491,187 |
| | 261,344 | | Pool # 625797 | | 6.00 | | | 01/01/17 | | | | 270,038 |
| | 4,476,508 | | Pool # 704372 ARM(b) | | 4.51 | | | 05/01/33 | | | | 4,445,860 |
| | 1,076,375 | | Pool # 709693 | | 5.50 | | | 06/01/28 | | | | 1,083,956 |
| | 719,096 | | Pool # 709698 | | 5.50 | | | 06/01/33 | | | | 721,477 |
| | 1,581,202 | | Pool # 725786 | | 6.08 | | | 06/01/09 | | | | 1,653,506 |
| | 2,278,088 | | Pool # 728826 ARM(b) | | 4.10 | | | 07/01/33 | | | | 2,262,584 |
| | 8,003,410 | | Pool # 805386 ARM(b) | | 4.94 | | | 01/01/35 | | | | 8,013,568 |
| | | | | | | | | | | |
|
|
| | | | | | | | | | | | | 32,397,739 |
| | | | | | | | | | | |
|
|
| | | | GOVERNMENT NATIONAL MORTGAGE ASSOCIATION — 3.18% |
| | 21,891 | | Pool # 195801 | | 8.50 | | | 01/15/17 | | | | 23,818 |
| | 9,998 | | Pool # 195833 | | 8.50 | | | 04/15/17 | | | | 10,878 |
| | 3,744,731 | | Pool # 3319 | | 5.00 | | | 12/20/32 | | | | 3,694,557 |
| | 3,706 | | Pool # 334299 | | 8.00 | | | 05/15/23 | | | | 4,000 |
| | 4,376,825 | | Pool # 3442 | | 5.00 | | | 09/20/33 | | | | 4,317,941 |
| | 426,998 | | Pool # 367412 | | 6.00 | | | 11/15/23 | | | | 438,934 |
| | 1,824,860 | | Pool # 604726 | | 4.50 | | | 10/15/33 | | | | 1,749,589 |
| | 2,943,531 | | Pool # 608288 | | 4.50 | | | 09/15/33 | | | | 2,822,117 |
| | | | | | | | | | | |
|
|
| | | | | | | | | | | | | 13,061,834 |
| | | | | | | | | | | |
|
|
| | | | TOTAL U.S. GOVERNMENT AGENCY MORTGAGE PASS THROUGH SECURITIES
(Cost $45,790,398) | | | | 45,459,573 |
| | | | | | | | | | | |
|
|
| | U.S. GOVERNMENT SECURITIES — 15.97% | | | | |
| | | | U.S. TREASURY BILL — 1.22% | | | | |
| | 5,000,000 | | | | 2.46 | | | 05/05/05 | (c) | | | 4,987,873 |
| | | | | | | | | | | |
|
|
| | | | U.S. TREASURY PRINCIPAL ONLY STRIPS — 2.78% |
| | 23,690,000 | | | | 0.00 | | | 02/15/20 | | | | 11,415,121 |
| | | | | | | | | | | |
|
|
| | | | | | | | | | | |
| | | | | | | | | | | | |
Principal/
Shares
| | | | Rate
| | | Maturity
Date
| | Value
|
| | U.S. GOVERNMENT SECURITIES — (continued) |
| | | | U.S. TREASURY NOTES — 11.97% |
| $ | 25,830,000 | | | | 2.00 | % | | 08/31/05 | | $ | 25,721,024 |
| | 21,630,000 | | | | 5.00 | | | 02/15/11 | | | 22,465,567 |
| | 980,000 | | | | 4.25 | | | 11/15/13 | | | 964,879 |
| | | | | | | | | | |
|
|
| | | | | | | | | | | | 49,151,470 |
| | | | | | | | | | |
|
|
| | | | TOTAL U.S. GOVERNMENT
SECURITIES (Cost $65,680,856) | | | 65,554,464 |
| | | | | | | | | | |
|
|
| | REGISTERED INVESTMENT COMPANIES — 3.04% |
| | 6,243,085 | | Dreyfus Government Cash Management Fund | | | 6,243,085 |
| | 6,243,085 | | Fidelity U.S. Treasury II Fund | | | 6,243,084 |
| | | | | | | | | | |
|
|
| | | | TOTAL REGISTERED INVESTMENT COMPANIES
(Cost $12,486,169) | | | 12,486,169 |
| | | | | | | | | | |
|
|
| | | | | | | | |
TOTAL INVESTMENTS
(Cost $410,376,775)(d) | | 99.56 | % | | $ | 408,600,984 |
OTHER ASSETS IN EXCESS OF LIABILITIES | | 0.44 | | | | 1,791,377 |
| | |
|
| |
|
|
NET ASSETS | | 100.00 | % | | $ | 410,392,361 |
| | |
|
| |
|
|
| (a) | Security exempt from registration under Rule 144A of the Securities Act of 1933. This security may be resold in transactions exempt from registration, normally to qualified institutional buyers. At March 31, 2005, these securities amounted to $14,404,925 or 3.51% of net assets. |
| (b) | Variable Rate Security—The rate disclosed is as of March 31, 2005. |
| (c) | The rate shown is the effective yield at the time of purchase. |
| (d) | Unrealized appreciation (depreciation) of securities: |
| | | | |
Unrealized
Appreciation
| | Unrealized
(Depreciation)
| | Net Unrealized
Appreciation/
(Depreciation)
|
| $3,162,102 | | $(4,937,893) | | $(1,775,791) |
ARM—Adjustable Rate Mortgage
llc—Limited Liability Company
MTN—Medium Term Note
STRIPS—Separately Traded Registered Interest and Principal Securities
See Notes to Financial Statements.
22
Excelsior Funds, Inc.
Portfolio of Investments — March 31, 2005
Intermediate-Term Managed Income Fund — (continued)
The summary of the Fund’s investments as of March 31, 2005 is as follows: (Unaudited)
| | | | | | |
Portfolio Diversification
| | % of
Net
Assets
| | | Value
|
U.S. Government & Agency Securities | | 38.96 | % | | $ | 159,893,687 |
Corporate Bonds | | 28.78 | | | | 118,128,894 |
Commercial Mortgage-Backed Securities | | 14.75 | | | | 60,543,489 |
Collateralized Mortgage Obligations | | 9.62 | | | | 39,458,664 |
Asset Backed Securities | | 3.21 | | | | 13,185,751 |
Registered Investment Company | | 3.04 | | | | 12,486,169 |
Tax-Exempt Securities | | 0.69 | | | | 2,830,750 |
Foreign Government Obligation | | 0.51 | | | | 2,073,580 |
| | |
|
| |
|
|
Total Investments | | 99.56 | % | | $ | 408,600,984 |
Other Assets and Liabilities (Net) | | 0.44 | | | | 1,791,377 |
| | |
|
| |
|
|
Net Assets | | 100.00 | % | | $ | 410,392,361 |
| | |
|
| |
|
|
See Notes to Financial Statements.
23
Excelsior Funds, Inc.
Portfolio of Investments — March 31, 2005
Short-Term Government Securities Fund
| | | | | | | | | | | |
| | | | | | | | | | | | |
Principal
| | | | Rate
| | | Maturity
Date
| | Value
|
| | ASSET BACKED SECURITIES — 2.73% |
| $ | 5,000,000 | | Citifinancial Mortgage Securities, Inc., Step Bond, 2003-4 AF2 | | 2.66 | % | | 10/25/33 | | $ | 4,975,919 |
| | 6,000,000 | | Residential Asset Mortgage Products, Inc., 2004-RS6 AI3 | | 4.54 | | | 08/25/28 | | | 6,010,696 |
| | | | | | | | | | |
|
|
| | | | TOTAL ASSET BACKED SECURITIES
(Cost $11,071,784) | | | 10,986,615 |
| | | | | | | | | | |
|
|
| | COLLATERALIZED MORTGAGE OBLIGATIONS — 33.29% |
| | 7,374,995 | | Bank of America Mortgage Securities, 2004-B 2A2(a) | | 4.14 | | | 03/25/34 | | | 7,214,069 |
| | 5,812,546 | | Bear Stearns ARM, 2004-1 11A3(a) | | 3.50 | | | 04/25/34 | | | 5,771,575 |
| | 5,356,515 | | Countrywide Alternative Loan Trust,
2004-16CB 1A2 | | 5.50 | | | 07/25/34 | | | 5,383,899 |
| | | | | | | | | | |
|
|
| | | | | | | | | | | | 18,369,543 |
| | | | | | | | | | |
|
|
| | | | FEDERAL HOME LOAN MORTGAGE
CORPORATION — 15.79% |
| | 4,352,735 | | 2333 KA, | | 6.50 | | | 07/15/31 | | | 4,495,252 |
| | 4,044,557 | | 2659 NC | | 4.00 | | | 04/15/15 | | | 4,046,057 |
| | 9,900,371 | | 2731 EA | | 3.50 | | | 01/15/11 | | | 9,889,796 |
| | 6,391,827 | | 2743 HA | | 4.50 | | | 11/15/09 | | | 6,431,615 |
| | 6,200,000 | | 2752 PA | | 3.50 | | | 11/15/08 | | | 6,187,155 |
| | 6,500,000 | | 2772 YA | | 3.50 | | | 12/15/11 | | | 6,470,204 |
| | 8,835,000 | | 2807 NL | | 3.50 | | | 01/15/15 | | | 8,804,149 |
| | 8,835,000 | | 2808 PA | | 4.00 | | | 09/15/12 | | | 8,840,595 |
| | 8,239,471 | | 2836 TA | | 5.00 | | | 10/15/27 | | | 8,364,770 |
| | | | | | | | | | |
|
|
| | | | | | | | | | | | 63,529,593 |
| | | | | | | | | | |
|
|
| | | | FEDERAL NATIONAL MORTGAGE
ASSOCIATION — 12.94% |
| | 6,919,000 | | 1997-M5 C | | 6.74 | | | 08/25/07 | | | 7,242,798 |
| | 1,502,465 | | 2001-M2 A | | 6.22 | | | 01/25/09 | | | 1,530,563 |
| | 5,337,958 | | 2002-89 CA | | 5.00 | | | 04/25/16 | | | 5,381,683 |
| | 8,600,000 | | 2003-16 PB | | 4.50 | | | 11/25/12 | | | 8,617,038 |
| | 6,163,306 | | 2003-89 DX | | 3.50 | | | 05/25/15 | | | 6,144,237 |
| | 8,337,422 | | 2004-1 HA | | 3.50 | | | 03/25/11 | | | 8,322,248 |
| | 9,276,173 | | 2004-50 MA | | 4.50 | | | 05/25/19 | | | 9,298,159 |
| | 5,617,067 | | 2004-W4 A1 | | 2.75 | | | 06/25/34 | | | 5,563,490 |
| | | | | | | | | | |
|
|
| | | | | | | | | | | | 52,100,216 |
| | | | | | | | | | |
|
|
| | | | TOTAL COLLATERALIZED MORTGAGE OBLIGATIONS
(Cost $136,213,447) | | | 133,999,352 |
| | | | | | | | | | |
|
|
| | COMMERCIAL MORTGAGE-BACKED SECURITIES — 8.14% |
| | 6,990,000 | | Chase Commercial Mortgage Securities Corp., 1996-2 C | | 6.90 | | | 11/19/28 | | | 7,273,046 |
| | 6,000,000 | | Greenwich Capital Commercial Funding Corp.,
2004-GG1 A2 | | 3.84 | | | 06/10/36 | | | 5,933,662 |
| | | | | | | | | | | |
| | | | | | | | | | | | |
Principal
| | | | Rate
| | | Maturity
Date
| | Value
|
| | COMMERCIAL MORTGAGE-BACKED SECURITIES — (continued) |
| $ | 5,000,000 | | JP Morgan Chase Commercial Mortgage Securities Corp.,
2005-LDP1 A2 | | 4.63 | % | | 03/15/46 | | $ | 4,983,792 |
| | 316,905 | | LB Commercial Conduit Mortgage Trust,
1998-C1 A2 | | 6.40 | | | 02/18/30 | | | 318,625 |
| | 5,028,684 | | Morgan Stanley Capital, 1996-C1 C(b) | | 7.39 | | | 02/15/28 | | | 5,110,544 |
| | 5,000,000 | | Mortgage Capital Funding, Inc.,
1996-MC1 C | | 7.80 | | | 06/15/28 | | | 5,157,988 |
| | 3,000,000 | | Mortgage Capital Funding, Inc.,
2005-HQ5 A1 | | 4.52 | | | 01/14/42 | | | 3,001,406 |
| | 997,365 | | Nationslink Funding Corp., 1998-2 A1 | | 6.00 | | | 08/20/30 | | | 1,004,164 |
| | | | | | | | | | |
|
|
| | | | TOTAL COMMERCIAL MORTGAGE-BACKED SECURITIES
(Cost $34,041,834) | | | 32,783,227 |
| | | | | | | | | | |
|
|
| | U.S. GOVERNMENT AGENCY BONDS & NOTES — 11.46% |
| | | | FANNIE MAE — 5.40% | | | | | | |
| | 13,000,000 | | | | 3.00 | | | 11/22/06 | | | 12,806,430 |
| | 6,000,000 | | | | 3.29 | | | 11/30/06 | | | 5,937,126 |
| | 3,000,000 | | | | 3.63 | | | 01/19/07 | | | 2,981,112 |
| | | | | | | | | | |
|
|
| | | | | | | | | | | | 21,724,668 |
| | | | | | | | | | |
|
|
| | | | FEDERAL HOME LOAN BANK — 2.81% | | | |
| | 11,500,000 | | | | 3.38 | | | 09/14/07 | | | 11,320,002 |
| | | | | | | | | | |
|
|
| | | | FREDDIE MAC — 3.25% | | | | | | |
| | 13,250,000 | | MTN | | 2.15 | | | 02/17/06 | | | 13,077,710 |
| | | | | | | | | | |
|
|
| | | | TOTAL U.S. GOVERNMENT AGENCY BONDS & NOTES
(Cost $46,760,258) | | | 46,122,380 |
| | | | | | | | | | |
|
|
| U.S. GOVERNMENT AGENCY MORTGAGE PASS THROUGH
SECURITIES — 25.19% |
| | | | FEDERAL HOME LOAN MORTGAGE
CORPORATION — 3.49% |
| | 4,802,684 | | Pool # 1B1081 ARM(a) | | 3.81 | | | 09/01/33 | | | 4,882,832 |
| | 639,748 | | Pool # C68593 | | 7.00 | | | 11/01/28 | | | 676,713 |
| | 5,183,611 | | Pool # E01582 | | 6.00 | | | 01/01/19 | | | 5,357,419 |
| | 3,179,617 | | Pool # M90903 | | 4.00 | | | 03/01/09 | | | 3,150,808 |
| | | | | | | | | | |
|
|
| | | | | | | | | | | | 14,067,772 |
| | | | | | | | | | |
|
|
| | | | FEDERAL NATIONAL MORTGAGE
ASSOCIATION — 20.84% |
| | 1,604,868 | | Pool # 253509 | | 7.50 | | | 11/01/15 | | | 1,693,191 |
| | 1,498,623 | | Pool # 254196 | | 6.00 | | | 02/01/17 | | | 1,548,478 |
| | 4,039,962 | | Pool # 254475 | | 6.50 | | | 10/01/17 | | | 4,219,890 |
| | 4,919,227 | | Pool # 254800 | | 5.50 | | | 07/01/23 | | | 4,970,868 |
| | 1,316,419 | | Pool # 323572 | | 7.50 | | | 01/01/29 | | | 1,413,558 |
| | 2,111,872 | | Pool # 323597 | | 6.50 | | | 01/01/29 | | | 2,200,094 |
See Notes to Financial Statements.
24
Excelsior Funds, Inc.
Portfolio of Investments — March 31, 2005
Short-Term Government Securities Fund — (continued)
| | | | | | | | | | | |
| | | | | | | | | | | | |
Principal
| | | | Rate
| | | Maturity
Date
| | Value
|
| U.S. GOVERNMENT AGENCY MORTGAGE PASS THROUGH
SECURITIES — (continued) |
| | | | FEDERAL NATIONAL MORTGAGE
ASSOCIATION — (continued) |
| $ | 11,600,000 | | Pool # 34738, TBA | | 6.00 | % | | 05/01/35 | | $ | 11,828,380 |
| | 2,787,835 | | Pool # 375575 | | 6.60 | | | 12/01/07 | | | 2,906,188 |
| | 653,478 | | Pool # 516210 | | 8.00 | | | 08/01/14 | | | 691,393 |
| | 71,610 | | Pool # 517390 | | 8.00 | | | 11/01/11 | | | 75,783 |
| | 681,671 | | Pool # 535377 | | 8.00 | | | 06/01/15 | | | 721,105 |
| | 2,425,741 | | Pool # 535863 | | 6.00 | | | 03/01/16 | | | 2,507,152 |
| | 525,539 | | Pool # 535981 | | 8.00 | | | 01/01/16 | | | 555,940 |
| | 653,042 | | Pool # 545362 ARM(a) | | 5.86 | | | 12/01/31 | | | 666,117 |
| | 2,427,702 | | Pool # 555412 | | 6.00 | | | 04/01/18 | | | 2,508,530 |
| | 390,187 | | Pool # 612310 | | 6.00 | | | 09/01/16 | | | 403,168 |
| | 2,700,012 | | Pool # 634195 | | 7.50 | | | 10/01/28 | | | 2,899,249 |
| | 3,000,000 | | Pool # 725704 | | 6.00 | | | 08/01/34 | | | 3,067,251 |
| | 5,786,541 | | Pool # 766684 ARM(a) | | 4.45 | | | 03/01/34 | | | 5,764,687 |
| | 6,304,883 | | Pool # 770870 ARM(a) | | 4.35 | | | 04/01/34 | | | 6,238,235 |
| | 4,758,560 | | Pool # 780840 | | 4.50 | | | 06/01/34 | | | 4,733,486 |
| | 7,368,731 | | Pool # 786076 ARM(a) | | 4.79 | | | 07/01/34 | | | 7,345,877 |
| | 9,959,457 | | Pool # 786423 ARM(a) | | 4.63 | | | 07/01/34 | | | 9,911,658 |
| | 4,999,916 | | Pool # 805386 ARM(a) | | 4.94 | | | 01/01/35 | | | 5,006,263 |
| | | | | | | | | | |
|
|
| | | | | | | | | | | | 83,876,541 |
| | | | | | | | | | |
|
|
| | | | GOVERNMENT NATIONAL MORTGAGE ASSOCIATION — 0.86% |
| | 635,024 | | Pool # 780240 | | 8.50 | | | 09/15/09 | | | 656,554 |
| | 152,263 | | Pool # 780752 | | 8.50 | | | 04/15/10 | | | 153,753 |
| | 758,853 | | Pool # 781036 | | 8.00 | | | 10/15/17 | | | 815,671 |
| | 927,502 | | Pool # 781181 | | 9.00 | | | 12/15/09 | | | 976,828 |
| | 246,379 | | Pool # 80385(a) | | 3.25 | | | 03/20/30 | | | 248,963 |
| | 583,946 | | Pool # 8378(a) | | 3.75 | | | 07/20/18 | | | 590,881 |
| | | | | | | | | | |
|
|
| | | | | | | | | | | | 3,442,650 |
| | | | | | | | | | |
|
|
| | | | TOTAL U.S. GOVERNMENT AGENCY MORTGAGE PASS THROUGH SECURITIES
(Cost $102,239,175) | | | 101,386,963 |
| | | | | | | | | | |
|
|
| | U.S. GOVERNMENT SECURITIES — 16.51% |
| | | | U.S. TREASURY INFLATION PROTECTED
BONDS — 2.84% |
| | 10,623,600 | | | | 3.63 | | | 01/15/08 | | | 11,425,480 |
| | | | | | | | | | |
|
|
| | | | | | | | | | | |
| | | | | | | | | | | | |
Principal/
Shares
| | | | Rate
| | | Maturity
Date
| | Value
|
| | U.S. GOVERNMENT SECURITIES — (continued) |
| | | | U.S. TREASURY NOTES — 13.67% |
| $ | 9,500,000 | | | | 1.63 | % | | 02/28/06 | | $ | 9,348,589 |
| | 22,500,000 | | | | 2.50 | | | 05/31/06 | | | 22,231,057 |
| | 11,390,000 | | | | 2.75 | | | 07/31/06 | | | 11,262,307 |
| | 5,000,000 | | | | 3.13 | | | 01/31/07 | | | 4,943,360 |
| | 7,150,000 | | | | 4.38 | | | 05/15/07 | | | 7,229,880 |
| | | | | | | | | | |
|
|
| | | | | | | | | | | | 55,015,193 |
| | | | | | | | | | |
|
|
| | | | TOTAL U.S. GOVERNMENT SECURITIES
(Cost $67,181,386) | | | 66,440,673 |
| | | | | | | | | | |
|
|
| | REGISTERED INVESTMENT COMPANIES — 3.35% |
| | 6,738,974 | | Dreyfus Government Cash Management Fund | | | 6,738,974 |
| | 6,738,975 | | Fidelity U.S. Treasury II Fund | | | 6,738,976 |
| | | | | | | | | | |
|
|
| | | | TOTAL REGISTERED INVESTMENT COMPANIES
(Cost $13,477,950) | | | 13,477,950 |
| | | | | | | | | | |
|
|
| | | | | | | |
TOTAL INVESTMENTS
(Cost $410,985,834)(c) | | 100.67 | % | | $ | 405,197,160 | |
LIABILITIES IN EXCESS OF OTHER ASSETS | | (0.67 | ) | | | (2,679,353 | ) |
| | |
|
| |
|
|
|
NET ASSETS | | 100.00 | % | | $ | 402,517,807 | |
| | |
|
| |
|
|
|
| (a) | Variable Rate Security—The rate disclosed is as of March 31, 2005. |
| (b) | Security exempt from registration under Rule 144A of the Securities Act of 1933. This security may be resold in transactions exempt from registration, normally to qualified institutional buyers. At March 31, 2005, these securities amounted to $5,110,544 or 1.27% of net assets. |
| (c) | Unrealized appreciation (depreciation) of securities: |
| | | | |
Unrealized
Appreciation
| | Unrealized
(Depreciation)
| | Net Unrealized
Appreciation/
(Depreciation)
|
$209,593 | | $(5,998,267) | | $(5,788,674) |
ARM—Adjustable Rate Mortgage
MTN—Medium Term Note
Step Bond—Coupon rate increases in increments to maturity. Rate disclosed is as of March 31, 2005.
TBA—To Be Announced
See Notes to Financial Statements.
25
Excelsior Funds, Inc.
Portfolio of Investments — March 31, 2005
Short-Term Government Securities Fund — (continued)
The summary of the Fund’s investments as of March 31, 2005 is as follows: (Unaudited)
| | | | | | | |
Portfolio Diversification
| | % of
Net
Assets
| | | Value
| |
U.S. Government & Agency Securities | | 53.16 | % | | $ | 213,950,016 | |
Collateralized Mortgage Obligations | | 33.29 | | | | 133,999,352 | |
Commercial Mortgage-Backed Securities | | 8.14 | | | | 32,783,227 | |
Registered Investment Company | | 3.35 | | | | 13,477,950 | |
Asset Backed Securities | | 2.73 | | | | 10,986,615 | |
| | |
|
| |
|
|
|
Total Investments | | 100.67 | % | | $ | 405,197,160 | |
Other Assets and Liabilities (Net) | | (0.67 | ) | | | (2,679,353 | ) |
| | |
|
| |
|
|
|
Net Assets | | 100.00 | % | | $ | 402,517,807 | |
| | |
|
| |
|
|
|
See Notes to Financial Statements.
26
Excelsior Funds Trust
Portfolio of Investments — March 31, 2005
High Yield Fund
| | | | | | | | | | | |
Principal
| | | | Rate
| | | Maturity
Date
| | Value
|
| | | | | | | | | | | | |
| | CORPORATE BONDS — 95.78% | | | |
| | | | ADVERTISING PERIODICALS — 1.32% |
| $ | 976,000 | | Dex Media West llc/Dex Media Finance Co. | | 9.88 | % | | 08/15/13 | | $ | 1,088,240 |
| | 1,000,000 | | RH Donnelley Finance Corp.(a) | | 10.88 | | | 12/15/12 | | | 1,152,500 |
| | | | | | | | | | |
|
|
| | | | | | | | | | | | 2,240,740 |
| | | | | | | | | | |
|
|
| | | | AGRICULTURAL CHEMICALS — 2.53% |
| | 500,000 | | IMC Global, Inc., Series B | | 11.25 | | | 06/01/11 | | | 557,500 |
| | 2,000,000 | | IMC Global, Inc., Series B, Unsecured | | 11.25 | | | 06/01/11 | | | 2,230,000 |
| | 1,298,000 | | Terra Capital, Inc. | | 11.50 | | | 06/01/10 | | | 1,492,700 |
| | | | | | | | | | |
|
|
| | | | | | | | | | | | 4,280,200 |
| | | | | | | | | | |
|
|
| | | | AUTO – TRUCK PARTS & EQUIPMENT — 3.48% |
| | 1,000,000 | | Accuride Corp.(a) | | 8.50 | | | 02/01/15 | | | 980,000 |
| | 4,000,000 | | Collins & Aikman Products(a) | | 12.88 | | | 08/15/12 | | | 1,800,000 |
| | 2,000,000 | | Dana Corp. | | 9.00 | | | 08/15/11 | | | 2,190,976 |
| | 1,000,000 | | Dura Operating Corp. | | 8.63 | | | 04/15/12 | | | 922,500 |
| | | | | | | | | | |
|
|
| | | | | | | | | | | | 5,893,476 |
| | | | | | | | | | |
|
|
| | | | CABLE TV — 1.06% |
| | 1,000,000 | | Charter Communications Holdings II | | 10.25 | | | 09/15/10 | | | 1,020,000 |
| | 1,000,000 | | Charter Communications Holdings llc/ Charter Communications Holdings Capital Corp. | | 8.63 | | | 04/01/09 | | | 772,500 |
| | | | | | | | | | |
|
|
| | | | | | | | | | | | 1,792,500 |
| | | | | | | | | | |
|
|
| | | | CASINO HOTELS — 11.43% |
| | 2,000,000 | | Ameristar Casinos, Inc. | | 10.75 | | | 02/15/09 | | | 2,185,000 |
| | 2,000,000 | | Aztar Corp. | | 7.88 | | | 06/15/14 | | | 2,125,000 |
| | 1,000,000 | | Boyd Gaming Corp. | | 8.75 | | | 04/15/12 | | | 1,082,500 |
| | 2,000,000 | | Caesars Entertainment, Inc. | | 8.88 | | | 09/15/08 | | | 2,192,500 |
| | 1,680,000 | | Kerzner International, Ltd. | | 8.88 | | | 08/15/11 | | | 1,801,800 |
| | 2,000,000 | | MGM Mirage, Inc. | | 8.50 | | | 09/15/10 | | | 2,190,000 |
| | 2,000,000 | | Penn National Gaming, Inc. | | 8.88 | | | 03/15/10 | | | 2,120,000 |
| | 2,000,000 | | Poster Financial Group | | 8.75 | | | 12/01/11 | | | 2,080,000 |
| | 1,000,000 | | Resorts International Hotel and Casino, Inc. | | 11.50 | | | 03/15/09 | | | 1,138,750 |
| | 2,250,000 | | River Rock Entertainment | | 9.75 | | | 11/01/11 | | | 2,463,750 |
| | | | | | | | | | |
|
|
| | | | | | | | | | | | 19,379,300 |
| | | | | | | | | | |
|
|
| | | | | | | | | | | |
Principal
| | | | Rate
| | | Maturity
Date
| | Value
|
| | | | | | | | | | | | |
| | CORPORATE BONDS — (continued) | | | |
| | | | CELLULAR TELECOM — 3.18% |
| $ | 2,000,000 | | American Cellular Corp. | | 10.00 | % | | 08/01/11 | | $ | 1,840,000 |
| | 1,000,000 | | Centennial Cellular Operating Co./Centennial Communications Corp. | | 10.13 | | | 06/15/13 | | | 1,105,000 |
| | 1,000,000 | | Dobson Communications Corp. | | 8.88 | | | 10/01/13 | | | 785,000 |
| | 500,000 | | Rogers Wireless, Inc. | | 7.50 | | | 03/15/15 | | | 516,250 |
| | 1,000,000 | | Western Wireless Corp. | | 9.25 | | | 07/15/13 | | | 1,140,000 |
| | | | | | | | | | |
|
|
| | | | | | | | | | | | 5,386,250 |
| | | | | | | | | | |
|
|
| | | | CHEMICALS – DIVERSIFIED — 3.27% | | | |
| | 2,000,000 | | Equistar Chemicals L.P./ Equistar Funding Corp. | | 10.63 | | | 05/01/11 | | | 2,245,000 |
| | 2,000,000 | | Lyondell Chemical Co. | | 9.50 | | | 12/15/08 | | | 2,140,000 |
| | 1,000,000 | | Lyondell Chemical Co. | | 10.50 | | | 06/01/13 | | | 1,150,000 |
| | | | | | | | | | |
|
|
| | | | | | | | | | | | 5,535,000 |
| | | | | | | | | | |
|
|
| | | | CHEMICALS – PLASTICS — 1.29% | | | |
| | 1,000,000 | | PolyOne Corp. | | 10.63 | | | 05/15/10 | | | 1,110,000 |
| | 1,000,000 | | PolyOne Corp. | | 8.88 | | | 05/01/12 | | | 1,070,000 |
| | | | | | | | | | |
|
|
| | | | | | | | | | | | 2,180,000 |
| | | | | | | | | | |
|
|
| | | | CHEMICALS – SPECIALTY — 2.28% | | | |
| | 1,500,000 | | Crompton Corp. | | 9.88 | | | 08/01/12 | | | 1,717,500 |
| | 2,000,000 | | Johnsondiversey, Inc., Series B | | 9.63 | | | 05/15/12 | | | 2,150,000 |
| | | | | | | | | | |
|
|
| | | | | | | | | | | | 3,867,500 |
| | | | | | | | | | |
|
|
| | | | COMMERCIAL SERVICES — 1.77% | | | |
| | 2,000,000 | | Iron Mountain, Inc. | | 8.63 | | | 04/01/13 | | | 2,020,000 |
| | 1,000,000 | | Iron Mountain, Inc. | | 7.75 | | | 01/15/15 | | | 987,500 |
| | | | | | | | | | |
|
|
| | | | | | | | | | | | 3,007,500 |
| | | | | | | | | | |
|
|
| | | | COMPUTER SERVICES — 0.59% | | | |
| | 1,000,000 | | Unisys Corp. | | 7.88 | | | 04/01/08 | | | 1,005,000 |
| | | | | | | | | | |
|
|
| | | | CONSUMER PRODUCTS – MISCELLANEOUS — 1.26% |
| | 2,000,000 | | Armkel llc/ Armkel Finance | | 9.50 | | | 08/15/09 | | | 2,132,500 |
| | | | | | | | | | |
|
|
| | | | CONTAINERS – METAL/GLASS — 4.18% |
| | 2,500,000 | | Ball Corp. | | 6.88 | | | 12/15/12 | | | 2,578,125 |
| | 3,000,000 | | Crown European Holdings S.A. | | 10.88 | | | 03/01/13 | | | 3,480,000 |
| | 1,000,000 | | Owens-Illinois, Inc. | | 7.50 | | | 05/15/10 | | | 1,030,000 |
| | | | | | | | | | |
|
|
| | | | | | | | | | | | 7,088,125 |
| | | | | | | | | | |
|
|
See Notes to Financial Statements.
27
Excelsior Funds Trust
Portfolio of Investments — March 31, 2005
High Yield Fund — (continued)
| | | | | | | | | | | |
Principal
| | | | Rate
| | | Maturity
Date
| | Value
|
| | | | | | | | | | | | |
| | CORPORATE BONDS — (continued) | | | |
| | | | CONTAINERS – PAPER/PLASTIC — 3.32% |
| $ | 2,000,000 | | Graham Packaging Co.(a) | | 8.50 | % | | 10/15/12 | | $ | 2,000,000 |
| | 2,000,000 | | Radnor Holdings, Inc. | | 11.00 | | | 03/15/10 | | | 1,480,000 |
| | 2,000,000 | | Stone Container Corp. | | 9.75 | | | 02/01/11 | | | 2,140,000 |
| | | | | | | | | | |
|
|
| | | | | | | | | | | | 5,620,000 |
| | | | | | | | | | |
|
|
| | | | COSMETICS & TOILETRIES — 0.42% | | | |
| | 750,000 | | Del Laboratories, Inc.(a) | | 8.00 | | | 02/01/12 | | | 720,000 |
| | | | | | | | | | |
|
|
| | | | DISTRIBUTION/WHOLESALE — 1.14% | | | |
| | 2,000,000 | | Nebraska Book Co. | | 8.63 | | | 03/15/12 | | | 1,935,000 |
| | | | | | | | | | |
|
|
| | | | DIVERSIFIED OPERATIONS — 0.73% | | | |
| | 1,340,000 | | Stena AB | | 7.00 | | | 12/01/16 | | | 1,239,500 |
| | | | | | | | | | |
|
|
| | | | ELECTRIC – GENERATION — 0.97% | | | |
| | 1,500,000 | | AES Corp. | | 9.50 | | | 06/01/09 | | | 1,640,625 |
| | | | | | | | | | |
|
|
| | | | ELECTRIC – INTERGRATED — 2.68% | | | |
| | 2,000,000 | | CMS Energy Corp. | | 9.88 | | | 10/15/07 | | | 2,170,000 |
| | 2,305,000 | | PSEG Energy Holdings, Inc. | | 7.75 | | | 04/16/07 | | | 2,368,388 |
| | | | | | | | | | |
|
|
| | | | | | | | | | | | 4,538,388 |
| | | | | | | | | | |
|
|
| | | | FORESTRY — 0.57% | | | |
| | 1,000,000 | | Tembec Industries, Inc. | | 8.63 | | | 06/30/09 | | | 965,000 |
| | | | | | | | | | |
|
|
| | | | FUNERAL SERVICES & RELATED ITEMS — 1.22% |
| | 1,000,000 | | Service Corp. International | | 7.70 | | | 04/15/09 | | | 1,030,000 |
| | 1,000,000 | | Service Corp. International, Unsecured | | 7.70 | | | 04/15/09 | | | 1,030,000 |
| | | | | | | | | | |
|
|
| | | | | | | | | | | | 2,060,000 |
| | | | | | | | | | |
|
|
| | | | GAS – DISTRIBUTION — 1.22% |
| | 2,000,000 | | SEMCO Energy, Inc. | | 7.75 | | | 05/15/13 | | | 2,066,338 |
| | | | | | | | | | |
|
|
| | | | HOME FURNISHINGS — 0.62% |
| | 1,000,000 | | Sealy Mattress Co. | | 8.25 | | | 06/15/14 | | | 1,042,500 |
| | | | | | | | | | |
|
|
| | | | LIFE/HEALTH INSURANCE — 1.24% |
| | 2,000,000 | | Americo Life, Inc.(a) | | 7.88 | | | 05/01/13 | | | 2,099,464 |
| | | | | | | | | | |
|
|
| | | | MACHINE TOOLS & RELATED PRODUCTS — 0.71% |
| | 1,250,000 | | Thermadyne Holdings Corp. | | 9.25 | | | 02/01/14 | | | 1,200,000 |
| | | | | | | | | | |
|
|
| | | | MACHINERY – FARM — 1.24% |
| | 2,000,000 | | AGCO Corp. | | 9.50 | | | 05/01/08 | | | 2,095,000 |
| | | | | | | | | | |
|
|
| | | | MEDICAL – DRUGS — 0.30% |
| | 500,000 | | Warner Chilcott Corp.(a) | | 8.75 | | | 02/01/15 | | | 502,500 |
| | | | | | | | | | |
|
|
| | | | | | | | | | | |
Principal
| | | | Rate
| | | Maturity
Date
| | Value
|
| | | | | | | | | | | | |
| | CORPORATE BONDS — (continued) | | | |
| | | | MEDICAL – HOSPITALS — 0.62% |
| $ | 1,000,000 | | IASIS Healthcare llc/ IASIS Capital Corp. | | 8.75 | % | | 06/15/14 | | $ | 1,042,500 |
| | | | | | | | | | |
|
|
| | | | MEDICAL PRODUCTS — 0.58% |
| | 1,000,000 | | Encore Medical IHC, Inc.,(a) | | 9.75 | | | 10/01/12 | | | 975,000 |
| | | | | | | | | | |
|
|
| | | | METAL – ALUMINUM — 4.18% |
| | 12,033,000 | | Ormet Corp., In Default(a) | | 11.00 | | | 08/15/08 | | | 7,099,470 |
| | | | | | | | | | |
|
|
| | | | METAL PROCESSORS & FABRICATORS — 0.32% |
| | 500,000 | | Mueller Group, Inc. | | 10.00 | | | 05/01/12 | | | 540,000 |
| | | | | | | | | | |
|
|
| | | | MISCELLANEOUS MANUFACTURING — 1.63% |
| | 2,000,000 | | IPC Acquisition Corp. | | 11.50 | | | 12/15/09 | | | 2,200,000 |
| | 500,000 | | Reddy Ice Group, Inc. | | 8.88 | | | 08/01/11 | | | 556,250 |
| | | | | | | | | | |
|
|
| | | | | | | | | | | | 2,756,250 |
| | | | | | | | | | |
|
|
| | | | MULTI-LINE INSURANCE — 1.35% |
| | 2,128,000 | | Allmerica Financial Corp. | | 7.63 | | | 10/15/25 | | | 2,279,875 |
| | | | | | | | | | |
|
|
| | | | MUSIC — 1.58% |
| | 1,600,000 | | Warner Music Group | | 7.38 | | | 04/15/14 | | | 1,648,000 |
| | 1,000,000 | | WMG Holdings Corp.(a) | | 7.39 | | | 12/15/11 | | | 1,025,000 |
| | | | | | | | | | |
|
|
| | | | | | | | | | | | 2,673,000 |
| | | | | | | | | | |
|
|
| | | | OFFICE AUTOMATION & EQUIPMENT — 1.52% |
| | 1,000,000 | | Xerox Capital Trust I | | 8.00 | | | 02/01/27 | | | 1,000,000 |
| | 1,500,000 | | Xerox Corp. | | 7.63 | | | 06/15/13 | | | 1,567,500 |
| | | | | | | | | | |
|
|
| | | | | | | | | | | | 2,567,500 |
| | | | | | | | | | |
|
|
| | | | OIL – EXPLORATION & PRODUCTION — 0.94% |
| | 1,500,000 | | Baytex Energy, Ltd. | | 9.63 | | | 07/15/10 | | | 1,590,000 |
| | | | | | | | | | |
|
|
| | | | OIL REFINING & MARKETING — 1.32% |
| | 2,000,000 | | Premcor Refining Group, Inc. | | 9.50 | | | 02/01/13 | | | 2,235,000 |
| | | | | | | | | | |
|
|
| | | | PAPER & RELATED PRODUCTS — 4.88% |
| | 2,500,000 | | Caraustar Industries, Inc. | | 9.88 | | | 04/01/11 | | | 2,625,000 |
| | 2,000,000 | | Intertape Polymer US, Inc. | | 8.50 | | | 08/01/14 | | | 1,966,170 |
| | 2,000,000 | | Mercer International, Inc. | | 9.25 | | | 02/15/13 | | | 1,890,000 |
| | 1,750,000 | | Norske Skog Canada, Series D | | 8.63 | | | 06/15/11 | | | 1,811,250 |
| | | | | | | | | | |
|
|
| | | | | | | | | | | | 8,292,420 |
| | | | | | | | | | |
|
|
See Notes to Financial Statements.
28
Excelsior Funds Trust
Portfolio of Investments — March 31, 2005
High Yield Fund — (continued)
| | | | | | | | | | | |
Principal
| | | | Rate
| | | Maturity
Date
| | Value
|
| | | | | | | | | | | | |
| | CORPORATE BONDS — (continued) | | | |
| | | | PHYSICIANS PRACTICE MANAGEMENT — 2.04% |
| $ | 2,000,000 | | Ameripath, Inc. | | 10.50 | % | | 04/01/13 | | $ | 1,990,000 |
| | 1,000,000 | | US Oncology Holdings, Inc(a) | | 8.62 | | | 03/15/15 | | | 942,500 |
| | 500,000 | | US Oncology Holdings, Inc.(a) | | 9.00 | | | 08/15/12 | | | 527,500 |
| | | | | | | | | | |
|
|
| | | | | | | | | | | | 3,460,000 |
| | | | | | | | | | |
|
|
| | | | REITS – HOTELS — 0.64% |
| | 1,000,000 | | La Quinta Properties, Inc. | | 8.88 | | | 03/15/11 | | | 1,080,000 |
| | | | | | | | | | |
|
|
| | | | RENTAL AUTO/EQUIPMENT — 1.14% |
| | 2,000,000 | | United Rentals, Inc. | | 7.75 | | | 11/15/13 | | | 1,940,000 |
| | | | | | | | | | |
|
|
| | | | RESORTS/THEME PARKS — 0.54% |
| | 1,000,000 | | Six Flags, Inc. | | 9.63 | | | 06/01/14 | | | 922,500 |
| | | | | | | | | | |
|
|
| | | | RETAIL – ARTS & CRAFTS — 1.25% |
| | 2,000,000 | | Michaels Stores, Inc. | | 9.25 | | | 07/01/09 | | | 2,112,500 |
| | | | | | | | | | |
|
|
| | | | RETAIL – DISCOUNT — 0.61% |
| | 1,000,000 | | Shopko Stores | | 9.25 | | | 03/15/22 | | | 1,040,000 |
| | | | | | | | | | |
|
|
| | | | RETAIL – DRUG STORE — 1.15% |
| | 2,000,000 | | Jean Coutu Group, Inc. | | 8.50 | | | 08/01/14 | | | 1,942,500 |
| | | | | | | | | | |
|
|
| | | | RETAIL – MAJOR DEPARTMENT STORE — 1.20% |
| | 1,500,000 | | JC Penney Co., Inc. | | 8.00 | | | 03/01/10 | | | 1,500,000 |
| | 500,000 | | Saks, Inc. | | 8.25 | | | 11/15/08 | | | 527,500 |
| | | | | | | | | | |
|
|
| | | | | | | | | | | | 2,027,500 |
| | | | | | | | | | |
|
|
| | | | SATELLITE TELECOM — 1.19% |
| | 1,000,000 | | Inmarsat Finance plc | | 7.63 | | | 06/30/12 | | | 995,000 |
| | 1,000,000 | | Intelsat Bermuda, Ltd.(a) | | 8.63 | | | 01/15/15 | | | 1,020,000 |
| | | | | | | | | | |
|
|
| | | | | | | | | | | | 2,015,000 |
| | | | | | | | | | |
|
|
| | | | SCHOOLS — 0.57% |
| | 1,000,000 | | Knowledge Learning Center(a) | | 7.75 | | | 02/01/15 | | | 965,000 |
| | | | | | | | | | |
|
|
| | | | SEISMIC DATA COLLECTION — 1.24% |
| | 1,997,000 | | Compagnie Generale de Geophysique S.A. | | 10.63 | | | 11/15/07 | | | 2,106,835 |
| | | | | | | | | | |
|
|
| | | | STEEL – PRODUCERS — 1.45% |
| | 1,000,000 | | AK Steel Corp. | | 7.75 | | | 06/15/12 | | | 962,500 |
| | 1,298,000 | | United States Steel, Inc. | | 10.75 | | | 08/01/08 | | | 1,492,700 |
| | | | | | | | | | |
|
|
| | | | | | | | | | | | 2,455,200 |
| | | | | | | | | | |
|
|
| | | | TELEPHONE – INTERGRATED — 6.71% |
| | 3,000,000 | | Cincinnati Bell, Inc. | | 8.38 | | | 01/15/14 | | | 2,955,000 |
| | 500,000 | | Cincinnati Bell, Inc., MTN | | 6.33 | | | 12/30/05 | | | 497,500 |
| | 1,000,000 | | Citizens Communications | | 9.25 | | | 05/15/11 | | | 1,095,000 |
| | | | | | | | | | | |
Principal
| | | | Rate
| | | Maturity
Date
| | Value
|
| | | | | | | | | | | | |
| | CORPORATE BONDS — (continued) | | | |
| | | | TELEPHONE – INTERGRATED — (continued) |
| $ | 1,000,000 | | Consolidated Communications Holdings, Inc.(a) | | 9.75 | % | | 04/01/12 | | $ | 1,060,000 |
| | 1,000,000 | | Eircom Funding | | 8.25 | | | 08/15/13 | | | 1,087,500 |
| | 1,000,000 | | Madison River Capital llc/ Madison River Financial Corp. | | 13.25 | | | 03/01/10 | | | 1,070,000 |
| | 3,000,000 | | Qwest Services Corp.(a) | | 14.50 | | | 12/15/14 | | | 3,622,500 |
| | | | | | | | | | |
|
|
| | | | | | | | | | | | 11,387,500 |
| | | | | | | | | | |
|
|
| | | | TRANSPORTATION – MARINE — 1.98% |
| | 3,000,000 | | Overseas Shipholding Group | | 8.75 | | | 12/01/13 | | | 3,360,000 |
| | | | | | | | | | |
|
|
| | | | TRANSPORTATION – RAIL — 1.13% |
| | 1,750,000 | | Kansas City Southern | | 9.50 | | | 10/01/08 | | | 1,907,500 |
| | | | | | | | | | |
|
|
| | | | TOTAL CORPORATE BONDS
(Cost $162,745,201) | | | 162,285,456 |
| | | | | | | | | | |
|
|
| | U.S. GOVERNMENT & AGENCY OBLIGATION — 2.18% |
| | | | FEDERAL HOME LOAN BANK – DISCOUNT
NOTE — 2.18% |
| | 3,700,000 | | | | 2.38 | | | 04/01/05 | | | 3,699,755 |
| | | | | | | | | | |
|
|
| | | | TOTAL U.S. GOVERNMENT & AGENCY OBLIGATION (Cost $3,700,000) | | | 3,699,755 |
| | | | | | | | | | |
|
|
| | | | | | |
TOTAL INVESTMENTS
(Cost $166,457,693)(b) | | 97.96 | % | | $ | 165,985,211 |
OTHER ASSETS IN EXCESS OF LIABILITIES | | 2.04 | | | | 3,461,857 |
| | |
|
| |
|
|
NET ASSETS | | 100.00 | % | | $ | 169,447,068 |
| | |
|
| |
|
|
| (a) | Security exempt from registration under Rule 144A of the Securities Act of 1933. This security may be resold in transactions exempt from registration, normally to qualified institutional buyers. At March 31, 2005, these securities amounted to $26,491,434 or 15.63% of net assets. |
| (b) | Unrealized appreciation (depreciation) of securities: |
| | | | |
Unrealized
Appreciation
| | Unrealized
(Depreciation)
| | Net Unrealized
Appreciation/
(Depreciation)
|
| $4,824,005 | | $(5,296,487) | | $(472,482) |
Discount Note—The rate reported on the Portfolio of Investments is the discount rate at the time of purchase.
In Default—Security in default on interest payments
llc—Limited Liability Company
L.P.—Limited Partnership
Ltd.—Limited
MTN—Medium Term Note
plc—public limited company
Unsecured—Issued in exchange of 144A security
See Notes to Financial Statements.
29
Excelsior Funds Trust
Portfolio of Investments — March 31, 2005
High Yield Fund — (continued)
The summary of the Fund’s investments as of March 31, 2005 is as follows: (Unaudited)
| | | | | | |
Sector Diversification
| | % of
Net
Assets
| | | Market Value
|
Consumer Discretionary | | 30.20 | % | | $ | 51,174,016 |
Raw/Intermediate Materials | | 27.96 | | | | 47,382,915 |
Telecommunication | | 9.90 | | | | 16,773,750 |
Technology | | 5.25 | | | | 8,889,335 |
Industrials | | 5.10 | | | | 8,638,250 |
Energy | | 4.94 | | | | 8,363,388 |
Health Care | | 4.75 | | | | 8,040,000 |
Financials | | 2.58 | | | | 4,379,339 |
Utilities | | 2.19 | | | | 3,706,963 |
U.S. Government & Agency Obligations | | 2.18 | | | | 3,699,755 |
Consumer Staples | | 1.68 | | | | 2,852,500 |
Real Estate | | 0.64 | | | | 1,080,000 |
Information Technology | | 0.59 | | | | 1,005,000 |
| | |
|
| |
|
|
Total Investment | | 97.96 | % | | $ | 165,985,211 |
Other Assets and Liabilities (Net) | | 2.04 | | | | 3,461,857 |
| | |
|
| |
|
|
Net Assets | | 100.00 | % | | $ | 169,447,068 |
| | |
|
| |
|
|
See Notes to Financial Statements.
30
Excelsior Tax-Exempt Funds, Inc.
Portfolio of Investments — March 31, 2005
Long-Term Tax-Exempt Fund
| | | | | | | | | | | |
| | | | | | | | | | |
Principal
| | | | Rate
| | | Maturity
Date
| | Value
|
| TAX-EXEMPT CASH EQUIVALENT SECURITIES — 31.04% |
| $ | 2,500,000 | | Fairfax County, Virgina, Economic Development Authority, Smithsonian Institution Revenue Bonds, Series A, (SPA: Bank of America N.A.)(a) | | 2.20 | % | | 12/01/33 | | $ | 2,500,000 |
| | 2,500,000 | | Marshall County, West Virginia, Pollution Control, Mountaineer Carbon Revenue Bonds(a) | | 2.30 | | | 12/01/20 | | | 2,500,000 |
| | 2,500,000 | | Michigan State University Revenue Bonds, Series B, (SPA: Landesbank Hessen-Thueringen)(a) | | 2.22 | | | 02/15/26 | | | 2,500,000 |
| | 2,500,000 | | New Jersey State, Sports & Exposition Authority Revenue Bonds, Series B-1, (MBIA) (SPA: JP Morgan Chase Bank)(a) | | 2.20 | | | 03/01/21 | | | 2,500,000 |
| | 2,500,000 | | Palm Beach County, Florida, School Board Certificate Participation, (AMBAC) (SPA: Dexia Credit Local)(a) | | 2.23 | | | 08/01/29 | | | 2,500,000 |
| | 2,500,000 | | Pennsylvania State University Revenue Bonds, Series A, (SPA: JP Morgan Chase Bank)(a) | | 2.26 | | | 04/01/31 | | | 2,500,000 |
| | 2,000,000 | | Uinta County, Wyoming, Pollution Control, Chevron (USA), Inc. Project Revenue Bonds(a) | | 2.28 | | | 08/15/20 | | | 2,000,000 |
| | 2,500,000 | | University of Missouri Revenue Bonds, Systems Facilities, Series B(a) | | 2.30 | | | 11/01/30 | | | 2,500,000 |
| | | | | | | | | | |
|
|
| | | | TOTAL TAX-EXEMPT CASH EQUIVALENT SECURITIES
(Cost $19,500,000) | | | 19,500,000 |
| | | | | | | | | | |
|
|
| | | | | | | | | | | |
| | | | | | | | | | |
Principal
| | | | Rate
| | | Maturity
Date
| | Value
|
| TAX-EXEMPT SECURITIES — 49.98% | | |
| $ | 3,000,000 | | Clark County, Nevada, School District General Obligation Bonds, Series A, (FSA) | | 5.00 | % | | 06/15/15 | | $ | 3,245,520 |
| | 3,000,000 | | Connecticut State, Health & Educational Facilities Authority Revenue Bonds, Connecticut State University Systems, Series E, (FGIC) | | 5.00 | | | 11/01/33 | | | 3,093,300 |
| | 3,000,000 | | Maryland State, State & Local Facilities Loan General Obligation Bonds, 1st Series | | 5.00 | | | 08/01/16 | | | 3,263,010 |
| | 3,000,000 | | New York City, New York, Municipal Water Finance Authority Revenue Bonds, Water & Sewer Systems, Series C | | 5.00 | | | 06/15/35 | | | 3,084,420 |
| | 3,000,000 | | New York State, Environmental Facilities Revenue Bonds, Clean Water & Drinking Revolving Foods, 2nd Resolution | | 5.00 | | | 06/15/33 | | | 3,091,290 |
| | 3,000,000 | | North Carolina State, Public Improvement General Obligation Bonds, Series A | | 5.00 | | | 03/01/16 | | | 3,260,280 |
| | 3,000,000 | | Orlando & Orange County, Florida, Expressway Authority Revenue Bonds, Series B, (AMBAC) | | 5.00 | | | 07/01/35 | | | 3,091,680 |
| | 3,000,000 | | Seattle, Washington, Municipal Light & Power Revenue Bonds, (FSA) | | 5.00 | | | 11/01/28 | | | 3,094,830 |
| | 3,000,000 | | University of California Revenue Bonds, Multiple Purpose Projects, Series Q, (FSA) | | 5.00 | | | 09/01/34 | | | 3,078,540 |
| | 3,000,000 | | University of North Carolina Revenue Bonds, Series Q, (FSA) | | 5.00 | | | 12/01/33 | | | 3,089,040 |
| | | | | | | | | | |
|
|
| | | | TOTAL TAX-EXEMPT SECURITIES
(Cost $30,920,866) | | | 31,391,910 |
| | | | | | | | | | |
|
|
See Notes to Financial Statements.
31
Excelsior Tax-Exempt Funds, Inc.
Portfolio of Investments — March 31, 2005
Long-Term Tax-Exempt Fund — (continued)
| | | | | | | | | | | |
| | | | | | | | | | |
Principal/
Shares
| | | | Rate
| | | Maturity
Date
| | Value
|
| TAX-EXEMPT SECURITIES – ESCROWED IN U.S.
GOVERNMENTS — 14.96% |
| $ | 3,000,000 | | Houston, Texas, Water & Sewer System Revenue Bonds, Series A, (FSA), (Prerefunded 12/01/12 @ 100) | | 5.00 | % | | 12/01/30 | | $ | 3,257,790 |
| | 2,500,000 | | Long Island Power Authority, New York Electric System Revenue Bonds, Series A, (FSA), (Escrowed to Maturity) | | 5.25 | | | 12/01/14 | | | 2,786,300 |
| | 3,000,000 | | Pennsylvania State General Obligation Bonds, 2nd Series, (FSA), (Prerefunded 05/01/12 @ 100) | | 5.50 | | | 05/01/16 | | | 3,354,990 |
| | | | | | | | | | |
|
|
| | | | TOTAL TAX-EXEMPT SECURITIES –ESCROWED IN U.S. GOVERNMENTS (Cost $9,009,103) | | | 9,399,080 |
| | | | | | | | | | |
|
|
| | REGISTERED INVESTMENT COMPANIES — 1.26% |
| | 1 | | BlackRock Muni Fund | | | 1 |
| | 789,718 | | Dreyfus Tax Exempt Cash Fund | | | 789,718 |
| | | | | | | | | | |
|
|
| | | | TOTAL REGISTERED INVESTMENT COMPANIES
(Cost $789,719) | | | 789,719 |
| | | | | | | | | | |
|
|
| | | | | | |
TOTAL INVESTMENTS
(Cost $60,219,688)(b) | | 97.24 | % | | $ | 61,080,709 |
OTHER ASSETS IN EXCESS OF LIABILITIES | | 2.76 | | | | 1,736,428 |
| | |
|
| |
|
|
NET ASSETS | | 100.00 | % | | $ | 62,817,137 |
| | |
|
| |
|
|
| (a) | Variable Rate Security—The rate disclosed is as of March 31, 2005. |
| (b) | Unrealized appreciation (depreciation) of securities: |
| | | | |
Unrealized
Appreciation
| | Unrealized
(Depreciation)
| | Net Unrealized
Appreciation/
(Depreciation)
|
| $963,983 | | $(102,962) | | $861,021 |
AMBAC—American Municipal Bond Assurance Corp.
FGIC—Financial Guaranty Insurance Corp.
FSA—Financial Security Assurance
MBIA—Municipal Bond Insurance Association
SPA—Standby Purchase Agreement
Notes: (The following notes have not been audited by Deloitte & Touche LLP):
These municipal securities meet the three highest ratings assigned by Moody’s Investors Services, Inc. or Standard and Poor’s Corporation or, where not rated, are determined by the Advisor, under the supervision of the Board of Directors, to be of comparable quality at the time of purchase to rated instruments that may be acquired by the Fund.
At March 31, 2005, approximately 15% of the net assets are invested in municipal securities that have letter of credit enhancement features or escrows in U.S. Government securities backing them, on which the Fund relies. Without such features, the securities may or may not meet the quality standards of securities purchased by the Fund.
See Notes to Financial Statements.
32
Excelsior Tax-Exempt Funds, Inc.
Portfolio of Investments — March 31, 2005
Long-Term Tax-Exempt Fund — (continued)
The summary of the Fund’s investments as of March 31, 2005 is as follows: (Unaudited)
| | | | | | |
State Diversification
| | % of
Net
Assets
| | | Market Value
|
New York | | 14.27 | % | | $ | 8,962,010 |
North Carolina | | 10.11 | | | | 6,349,320 |
Pennsylvania | | 9.32 | | | | 5,854,990 |
Florida | | 8.90 | | | | 5,591,680 |
Maryland | | 5.19 | | | | 3,263,010 |
Texas | | 5.19 | | | | 3,257,790 |
Nevada | | 5.17 | | | | 3,245,520 |
Washington | | 4.93 | | | | 3,094,830 |
Connecticut | | 4.92 | | | | 3,093,300 |
California | | 4.90 | | | | 3,078,540 |
Michigan | | 3.98 | | | | 2,500,000 |
Missouri | | 3.98 | | | | 2,500,000 |
New Jersey | | 3.98 | | | | 2,500,000 |
Virginia | | 3.98 | | | | 2,500,000 |
West Virginia | | 3.98 | | | | 2,500,000 |
Wyoming | | 3.18 | | | | 2,000,000 |
Registered Investment Company | | 1.26 | | | | 789,719 |
| | |
|
| |
|
|
Total Investments | | 97.24 | % | | $ | 61,080,709 |
Other Assets and Liabilities (Net) | | 2.76 | | | | 1,736,428 |
| | |
|
| |
|
|
Net Assets | | 100.00 | % | | $ | 62,817,137 |
| | |
|
| |
|
|
See Notes to Financial Statements.
33
Excelsior Tax-Exempt Funds, Inc.
Portfolio of Investments — March 31, 2005
Intermediate-Term Tax-Exempt Fund
| | | | | | | | | | |
Principal
| | | | Rate
| | | Maturity
Date
| | Value
|
| | | | | | | | | | | |
TAX-EXEMPT CASH EQUIVALENT SECURITIES — 19.65% |
| $10,000,000 | | Alaska State Housing Finance Authority Revenue Bonds, Capital Project, Series C, (MBIA)(a) | | 2.25 | % | | 07/01/22 | | $ | 10,000,000 |
| 14,800,000 | | Iowa State Finance Authority Revenue Bonds, Multi-Family Housing, Village Court Association, Series B(a) | | 2.28 | | | 11/01/15 | | | 14,800,000 |
| 6,500,000 | | Jackson County, Mississippi, Pollution Control Revenue Bonds, Chevron (USA), Inc. Project(a) | | 2.28 | | | 06/01/23 | | | 6,500,000 |
| 14,710,000 | | Kansas State, Department of Transportation Highway Revenue Bonds, Series C-1, (SPA: Westdeutsche Landesbank/Dexia Credit Local)(a) | | 2.22 | | | 09/01/19 | | | 14,710,000 |
| 12,000,000 | | Massachusetts Bay Transportation Authority General Obligation Bonds, Transportation Systems, (SPA: Westdeutsche Landesbank)(a) | | 2.25 | | | 03/01/30 | | | 12,000,000 |
| 10,685,000 | | Valdez, Alaska, Marine Revenue Bonds, BP Pipelines, Inc. Project, Series C(a) | | 2.30 | | | 07/01/37 | | | 10,685,000 |
| | | | | | | | | |
|
|
| | | TOTAL TAX-EXEMPT CASH EQUIVALENT SECURITIES
(Cost $68,695,000) | | | 68,695,000 |
| | | | | | | | | |
|
|
TAX-EXEMPT SECURITIES — 69.78% |
| 10,000,000 | | Clark County, Nevada, School District General Obligation Bonds, Series B, (FSA) | | 5.00 | | | 06/15/12 | | | 10,840,300 |
| 10,000,000 | | Colorado Springs, Colorado, Utilities Revenue Bonds, Series A | | 5.25 | | | 11/15/10 | | | 10,937,400 |
| | | | | | | | | | |
Principal
| | | | Rate
| | | Maturity
Date
| | Value
|
| | | | | | | | | | | |
TAX-EXEMPT SECURITIES — (continued) |
| $10,000,000 | | Connecticut State Special Tax Obligation Revenue Bonds, Transportation Infrastructure, Series A, (FGIC) | | 5.50 | % | | 10/01/10 | | $ | 11,032,900 |
| 10,000,000 | | Cook County, Illinois, General Obligation Bonds, Series D, (AMBAC) | | 5.25 | | | 11/15/11 | | | 10,931,900 |
| 10,000,000 | | Dallas, Texas, Water Works & Sewer System Revenue Bonds, (FSA) | | 5.38 | | | 10/01/12 | | | 11,114,500 |
| 10,000,000 | | Detroit, Michigan, Sewer Disposal Revenue Bonds, Series A, (FSA) | | 5.00 | | | 07/01/14 | | | 10,782,800 |
| 10,000,000 | | Flordia State Division Board Finance Department, General Services Revenue Bonds, Department of Environmental Protection-Preservation 2000, Series A, (FSA) | | 6.00 | | | 07/01/13 | | | 11,581,400 |
| 10,000,000 | | Hawaii State General Obligation Bonds, Series CY, (FSA) | | 5.50 | | | 02/01/12 | | | 11,126,900 |
| 10,000,000 | | Illinois State General Obligation Bonds, First Series, (MBIA) | | 5.50 | | | 08/01/14 | | | 11,206,700 |
| 10,000,000 | | Illinois State Sales Tax Revenue Bonds, First Series, (FSA) | | 5.25 | | | 06/15/13 | | | 10,968,000 |
| 10,000,000 | | Jefferson County, Colorado, School District General Obligation Bonds, (MBIA) | | 6.50 | | | 12/15/11 | | | 11,730,400 |
| 10,000,000 | | Los Angeles, California, Department of Water & Power Revenue Bonds, Series B, (MBIA) | | 5.00 | | | 07/01/13 | | | 10,930,300 |
| 10,000,000 | | Maryland State Capital Improvement General Obligation Bonds, State & Local Facilities, 1st Lien, Series A | | 5.25 | | | 03/01/13 | | | 11,089,800 |
See Notes to Financial Statements.
34
Excelsior Tax-Exempt Funds, Inc.
Portfolio of Investments — March 31, 2005
Intermediate-Term Tax-Exempt Fund — (continued)
| | | | | | | | | | |
Principal
| | | | Rate
| | | Maturity
Date
| | Value
|
| | | | | | | | | | | |
TAX-EXEMPT SECURITIES — (continued) |
| $10,000,000 | | Michigan State Building Authority Revenue Bonds, Facilities Program, Series I, (FSA) | | 5.25 | % | | 10/15/14 | | $ | 10,986,500 |
| 10,000,000 | | New Jersey State General Obligation Bonds, Series D | | 6.00 | | | 02/15/11 | | | 11,291,300 |
| 20,000,000 | | New Jersey State Transportation Trust Fund Authority, Transportation Systems Revenue Bonds, Series C, (FSA) | | 5.50 | | | 12/15/10 | | | 22,069,600 |
| 10,000,000 | | New York State Dormitory Authority, State University Educational Facilities Revenue Bonds, Series B, (FSA) | | 5.25 | | | 05/15/11 | | | 10,960,700 |
| 10,000,000 | | Pennsylvania State General Obligation Bonds | | 5.50 | | | 02/01/13 | | | 11,162,000 |
| 10,000,000 | | Pennsylvania State General Obligation Bonds, First Series, (MBIA) | | 5.25 | | | 02/01/12 | | | 10,989,700 |
| 10,000,000 | | Pennsylvania State General Obligation Bonds, Second Series, (FGIC) | | 5.25 | | | 10/01/14 | | | 11,087,200 |
| 10,000,000 | | South Carolina State Public Services Authority Revenue Bonds, Series A, (FSA) | | 5.50 | | | 01/01/11 | | | 11,086,000 |
| | | | | | | | | |
|
|
| | | TOTAL TAX-EXEMPT SECURITIES
(Cost $238,749,771) | | | 243,906,300 |
| | | | | | | | | |
|
|
TAX-EXEMPT SECURITIES – BACKED BY LETTERS OF
CREDIT — 2.86% |
| 10,000,000 | | Pennsylvania State, Higher Educational Facilities Authority Revenue Bonds, Association of Independent Colleges, Series E-3 (PNC Bank N.A.)(a) | | 2.26 | | | 11/01/14 | | | 10,000,000 |
| | | | | | | | | |
|
|
| | | TOTAL TAX-EXEMPT SECURITIES – BACKED BY LETTERS OF CREDIT
(Cost $10,000,000) | | | 10,000,000 |
| | | | | | | | | |
|
|
| | | | | | | | | | |
Principal/
Shares
| | | | Rate
| | | Maturity
Date
| | Value
|
| | | | | | | | | | | |
TAX-EXEMPT SECURITIES – ESCROWED IN U.S.
GOVERNMENTS — 6.27% |
| $10,000,000 | | Chicago, Illinois, Metropolitan Water Reclamation District Authority General Obligation Bonds, Series A, (Escrowed to Maturity) | | 5.25 | % | | 12/01/10 | | $ | 10,938,700 |
| 10,000,000 | | New Jersey State Transportation Trust Fund Authority, Transportation Systems Revenue Bonds, Series A, (Escrowed to Maturity) | | 5.25 | | | 06/15/11 | | | 10,972,300 |
| | | | | | | | | |
|
|
| | | TOTAL TAX-EXEMPT SECURITIES – ESCROWED IN U.S. GOVERNMENTS
(Cost $20,986,974) | | | 21,911,000 |
| | | | | | | | | |
|
|
REGISTERED INVESTMENT COMPANIES — 0.58% |
| 443,400 | | BlackRock Muni Fund | | | 443,400 |
| 1,580,048 | | Dreyfus Tax Exempt Cash Fund | | | 1,580,048 |
| | | | | | | | | |
|
|
| | | TOTAL REGISTERED INVESTMENT COMPANIES
(Cost $2,023,448) | | | 2,023,448 |
| | | | | | | | | |
|
|
| | | | | | | | |
TOTAL INVESTMENTS
(Cost $340,455,193)(b) | | 99.14 | % | | $ | 346,535,748 |
OTHER ASSETS IN EXCESS OF LIABILITIES | | 0.86 | | | | 3,004,050 |
| | |
|
| |
|
|
NET ASSETS | | 100.00 | % | | $ | 349,539,798 |
| | |
|
| |
|
|
| (a) | Variable Rate Security—The rate disclosed is as of March 31, 2005. |
| (b) | Unrealized appreciation (depreciation) of securities: |
| | | | |
Unrealized
Appreciation
| | Unrealized
(Depreciation)
| | Net Unrealized
Appreciation/
(Depreciation)
|
$7,740,577 | | $(1,660,022) | | $6,080,555 |
AMBAC—American Municipal Bond Assurance Corp.
FGIC—Financial Guaranty Insurance Corp.
FSA—Financial Security Assurance
MBIA—Municipal Bond Insurance Association
SPA—Standby Purchase Agreement
See Notes to Financial Statements.
35
Excelsior Tax-Exempt Funds, Inc.
Portfolio of Investments — March 31, 2005
Intermediate-Term Tax-Exempt Fund — (continued)
Notes: (The following notes have not been audited by Deloitte & Touche LLP):
These municipal securities meet the three highest ratings assigned by Moody’s Investors Services, Inc. or Standard and Poor’s Corporation or, where not rated, are determined by the Advisor, under the supervision of the Board of Directors, to be of comparable quality at the time of purchase to rated instruments that may be acquired by the Fund.
At March 31, 2005, approximately 9% of the net assets are invested in municipal securities that have letter of credit enhancement features or escrows in U.S. Government securities backing them, on which the Fund relies. Without such features, the securities may or may not meet the quality standards of securities purchased by the Fund.
The summary of the Fund’s investments as of March 31, 2005 is as follows: (Unaudited)
| | | | | | |
State Diversification
| | % of
Net
Assets
| | | Market Value
|
New Jersey | | 12.68 | % | | $ | 44,333,200 |
Illinois | | 12.60 | | | | 44,045,300 |
Pennsylvania | | 12.37 | | | | 43,238,900 |
Colorado | | 6.48 | | | | 22,667,800 |
Michigan | | 6.23 | | | | 21,769,300 |
Alaska | | 5.92 | | | | 20,685,000 |
Iowa | | 4.23 | | | | 14,800,000 |
Kansas | | 4.21 | | | | 14,710,000 |
Massachusetts | | 3.43 | | | | 12,000,000 |
Florida | | 3.31 | | | | 11,581,400 |
Hawaii | | 3.18 | | | | 11,126,900 |
Texas | | 3.18 | | | | 11,114,500 |
Maryland | | 3.17 | | | | 11,089,800 |
South Carolina | | 3.17 | | | | 11,086,000 |
Connecticut | | 3.16 | | | | 11,032,900 |
New York | | 3.14 | | | | 10,960,700 |
California | | 3.14 | | | | 10,930,300 |
Nevada | | 3.10 | | | | 10,840,300 |
Mississippi | | 1.86 | | | | 6,500,000 |
Registered Investment Company | | 0.58 | | | | 2,023,448 |
| | |
|
| |
|
|
Total Investments | | 99.14 | % | | $ | 346,535,748 |
Other Assets and Liabilities (Net) | | 0.86 | | | | 3,004,050 |
| | |
|
| |
|
|
Net Assets | | 100.00 | % | | $ | 349,539,798 |
| | |
|
| |
|
|
See Notes to Financial Statements.
36
Excelsior Tax-Exempt Funds, Inc.
Portfolio of Investments — March 31, 2005
Short-Term Tax-Exempt Securities Fund
| | | | | | | | | | |
| | | | | | | | | | | |
Principal
| | | | Rate
| | | Maturity
Date
| | Value
|
TAX-EXEMPT CASH EQUIVALENT SECURITIES — 31.94% |
| $10,000,000 | | Detroit, Michigan,
Water Supply System Revenue Bonds,
Series C, (FGIC) (SPA: FGIC-SPI)(a) | | 2.27 | % | | 07/01/29 | | $ | 10,000,000 |
| 11,500,000 | | Gwinnett County, Georgia, Development Authority Revenue Bonds, Civic & Cultural Center Project (SPA: Landesbank Hessen)(a) | | 2.28 | | | 09/01/31 | | | 11,500,000 |
| 10,000,000 | | Michigan
Technological University Revenue Bonds, Series A, (AMBAC) (SPA: Bank of America)(a) | | 2.30 | | | 10/01/18 | | | 10,000,000 |
| 11,500,000 | | Orlando, Florida, Utilities Commission Water & Electric Revenue Bonds, Series A (SPA: Bayerische Landesbank)(a) | | 2.23 | | | 10/01/17 | | | 11,500,000 |
| 11,500,000 | | Pennsylvania Higher Education Facilities Authority Revenue Bonds, Carnegie Mellon University Project, Series C (SPA: Morgan Guaranty Trust)(a) | | 2.29 | | | 11/01/29 | | | 11,500,000 |
| 10,350,000 | | Pennsylvania State University Revenue Bonds, Series A (GO of University) (SPA: Westdeutsche Landesbank)(a) | | 2.26 | | | 03/01/32 | | | 10,350,000 |
| 11,500,000 | | Triborough Bridge & Tunnel Authority, New York, Revenue Bonds, Series B, (AMBAC) (SPA: State Street Bank and Trust)(a) | | 2.27 | | | 01/01/32 | | | 11,500,000 |
| | | | | | | | | |
|
|
| | | TOTAL TAX-EXEMPT CASH EQUIVALENT SECURITIES
(Cost $76,350,000) | | | 76,350,000 |
| | | | | | | | | |
|
|
| | | | | | | | | | |
| | | | | | | | | | | |
Principal
| | | | Rate
| | | Maturity
Date
| | Value
|
TAX-EXEMPT SECURITIES — 56.23% |
| $10,000,000 | | California State Economic Recovery General Obligation Bonds, Series A | | 5.00 | % | | 07/01/07 | | $ | 10,464,900 |
| 10,000,000 | | Florida State Board of Education Capital Outlay General Obligation Bonds, Series A | | 5.00 | | | 06/01/07 | | | 10,441,800 |
| 6,000,000 | | Georgia State Road & Thruway Authority Revenue Bonds | | 4.00 | | | 10/01/07 | | | 6,155,880 |
| 5,000,000 | | Massachusetts State General Obligation Bonds, Series B | | 4.00 | | | 08/01/06 | | | 5,086,350 |
| 20,000,000 | | Memphis, Tennessee, Electric System Revenue Bonds, Series A, (FSA) | | 5.00 | | | 12/01/07 | | | 21,028,599 |
| 10,000,000 | | Montgomery County, Maryland, General Obligation Bonds, Series A | | 5.00 | | | 11/01/07 | | | 10,542,100 |
| 5,000,000 | | Nassau County, New York, Interim Finance Authority Revenue Bonds, Series B | | 4.00 | | | 11/15/05 | | | 5,043,600 |
| 10,000,000 | | New Jersey State Economic Development Authority Revenue Bonds, School Facilities, Series F | | 5.00 | | | 06/15/07 | | | 10,436,400 |
| 10,000,000 | | New York City, New York, Transitional Finance Authority Revenue Bonds, Future Tax,
Sub-Series D1 | | 5.00 | | | 11/01/07 | | | 10,519,200 |
| 5,000,000 | | Seattle, Washington, Municipal Light & Power Revenue Bonds, (FSA) | | 5.00 | | | 11/01/06 | | | 5,166,400 |
| 10,000,000 | | Texas State Public Finance Authority General Obligation Bonds, Series A | | 5.25 | | | 10/01/07 | | | 10,552,900 |
| 20,000,000 | | Texas State Public Finance Authority Revenue Bonds, Series A, (FSA) | | 5.00 | | | 12/15/07 | | | 21,016,400 |
| 8,000,000 | | University of Maryland Revenue Bonds, Auxiliary Facility & Tuition, Series A | | 5.00 | | | 04/01/05 | | | 8,000,647 |
| | | | | | | | | |
|
|
| | | TOTAL TAX-EXEMPT SECURITIES
(Cost $136,460,152) | | | 134,455,176 |
| | | | | | | | | |
|
|
See Notes to Financial Statements.
37
Excelsior Tax-Exempt Funds, Inc.
Portfolio of Investments — March 31, 2005
Short-Term Tax-Exempt Securities Fund — (continued)
| | | | | | | | | | |
Principal/
Shares
| | | | Rate
| | | Maturity
Date
| | Value
|
| | | | | | | | | | | |
TAX-EXEMPT SECURITIES – BACKED BY LETTERS OF
CREDIT — 8.16% |
| $ 9,500,000 | | New York City, New York, General Obligation Bonds, Sub-Series C-4 (BNP Paribas)(a) | | 2.23 | % | | 08/01/20 | | $ | 9,500,000 |
| 10,000,000 | | New York State
Housing Finance Agency Service
Revenue Bonds,
Series E (BNP Paribas)(a) | | 2.23 | | | 03/15/27 | | | 10,000,000 |
| | | | | | | | | |
|
|
| | | TOTAL TAX-EXEMPT SECURITIES – BACKED BY LETTERS OF CREDIT
(Cost $19,500,000) | | | 19,500,000 |
| | | | | | | | | |
|
|
REGISTERED INVESTMENT COMPANIES — 0.77% |
| 1 | | BlackRock Muni Fund | | | 1 |
| 1,830,236 | | Dreyfus Tax Exempt Cash Fund | | | 1,830,236 |
| | | | | | | | | |
|
|
| | | TOTAL REGISTERED INVESTMENT COMPANIES
(Cost $1,830,237) | | | 1,830,237 |
| | | | | | | | | |
|
|
| | | | | | | | |
TOTAL INVESTMENTS
(Cost $234,140,389)(b) | | 97.10 | % | | $ | 232,135,413 |
OTHER ASSETS IN EXCESS OF
LIABILITIES | | 2.90 | | | | 6,924,622 |
| | |
|
| |
|
|
NET ASSETS | | 100.00 | % | | $ | 239,060,035 |
| | |
|
| |
|
|
| (a) | Variable Rate Security—The rate disclosed is as of March 31, 2005. |
| (b) | Unrealized appreciation (depreciation) of securities: |
| | | | |
Unrealized
Appreciation
| | Unrealized
(Depreciation)
| | Net Unrealized
Appreciation/
(Depreciation)
|
$647 | | $(2,005,623) | | $(2,004,976) |
AMBAC—American Municipal Bond Assurance Corp.
FGIC—Financial Guaranty Insurance Corp.
FGIC—SPI—Financial Guaranty Insurance Corp. Securities Purchase, Inc.
FSA—Financial Security Assurance
SPA—Standby Purchase Agreement
Notes (The following notes have not been audited by Deloitte & Touche LLP):
These municipal securities meet the three highest ratings assigned by Moody’s Investors Services, Inc. or Standard and Poor’s Corporation or, where not rated, are determined by the Advisor, under the supervision of the Board of Directors, to be of comparable quality at the time of purchase to rated instruments that may be acquired by the Fund.
At March 31, 2005, approximately 8% of the net assets are invested in municipal securities that have letter of credit enhancement features or escrows in U.S. Government securities backing them, on which the Fund relies. Without such features, the securities may or may not meet the quality standards of securities purchased by the Fund.
The summary of the Fund’s investments as of March 31, 2005 is as follows: (Unaudited)
| | | | | | |
State Diversification
| | % of
Net
Assets
| | | Market Value
|
New York | | 19.48 | % | | $ | 46,562,800 |
Texas | | 13.20 | | | | 31,569,300 |
Florida | | 9.18 | | | | 21,941,800 |
Pennsylvania | | 9.14 | | | | 21,850,000 |
Tennessee | | 8.80 | | | | 21,028,600 |
Michigan | | 8.37 | | | | 20,000,000 |
Maryland | | 7.76 | | | | 18,542,746 |
Georgia | | 7.38 | | | | 17,655,880 |
California | | 4.38 | | | | 10,464,900 |
New Jersey | | 4.36 | | | | 10,436,400 |
Washington | | 2.16 | | | | 5,166,400 |
Massachusetts | | 2.13 | | | | 5,086,350 |
Registered Investment Company | | 0.76 | | | | 1,830,237 |
| | |
|
| |
|
|
Total Investments | | 97.10 | % | | $ | 232,135,413 |
Other Assets and Liabilities (Net) | | 2.90 | | | | 6,924,622 |
| | |
|
| |
|
|
Net Assets | | 100.00 | % | | $ | 239,060,035 |
| | |
|
| |
|
|
See Notes to Financial Statements.
38
Excelsior Tax-Exempt Fund, Inc.
Portfolio of Investments — March 31, 2005
New York Intermediate-Term Tax-Exempt Fund
| | | | | | | | | | |
| | | | | | | | | | | |
Principal
| | | | Rate
| | | Maturity
Date
| | Value
|
TAX-EXEMPT CASH EQUIVALENT SECURITIES — 16.53% |
| $ 2,100,000 | | Erie County, New York, Water Authority Revenue Bonds,
Series A,
(AMBAC) (SPA: National Australia
Bank)(a) | | 2.26 | % | | 12/1/16 | | $ | 2,100,000 |
| 4,000,000 | | New York City, New York, Municipal Water Finance Authority, Water & Sewer Systems Revenue Bonds, Series C, (FGIC) (SPA:
FGIC-SPI)(a) | | 2.24 | | | 6/15/23 | | | 4,000,000 |
| 2,750,000 | | New York State Dormitory Authority, Mental Health Services Revenue Bonds, Sub-Series
D-2A, (MBIA) (SPA: JP Morgan Chase Bank)(a) | | 2.28 | | | 2/15/31 | | | 2,750,000 |
| 4,500,000 | | Niagara Falls, New York, Bridge Commission Toll Revenue Bonds, Series A, (FGIC) (SPA: Credit Local de France)(a) | | 2.26 | | | 10/1/19 | | | 4,500,000 |
| 3,000,000 | | Port Authority of New York & New Jersey, Special Obligation Revenue Bonds, Versatile Structure Obligations, Series 5, (SPA: Morgan Guaranty Trust)(a) | | 2.24 | | | 5/1/19 | | | 3,000,000 |
| 6,500,000 | | Suffolk County, New York, Water Authority, Bond Anticipation Notes, (SPA: Bank of Nova Scotia)(a) | | 2.22 | | | 1/1/08 | | | 6,500,000 |
| | | | | | | | | |
|
|
| | | TOTAL TAX-EXEMPT CASH EQUIVALENT SECURITIES
(Cost $22,850,000) | | | 22,850,000 |
| | | | | | | | | |
|
|
TAX-EXEMPT SECURITIES — 60.42% |
| 10,000,000 | | Long Island Power Authority, New York Electric Authority Revenue Bonds,
Series A, (AMBAC) | | 5.50 | | | 12/1/11 | | | 11,121,300 |
| | | | | | | | | | |
| | | | | | | | | | | |
Principal
| | | | Rate
| | | Maturity
Date
| | Value
|
TAX-EXEMPT SECURITIES — (continued) |
| $15,000,000 | | Nassau County, New York, Interim Finance Authority Revenue Bonds, Series B, (AMBAC) | | 5.00 | % | | 11/15/12 | | $ | 16,293,000 |
| 6,000,000 | | New York City, New York, Transitional Finance Authority Revenue Bonds, Series A | | 5.25 | | | 11/1/10 | | | 6,533,580 |
| 5,000,000 | | New York State Dormitory Authority, New York University Revenue Bonds, Series A, (AMBAC) | | 5.75 | | | 7/1/12 | | | 5,648,800 |
| 6,000,000 | | New York State Dormitory Authority, Revenue Bonds, Series B | | 5.25 | | | 11/15/23 | | | 6,471,480 |
| 6,000,000 | | New York State Dormitory Authority, State Personal Income Tax Revenue Bonds, Series A | | 5.50 | | | 3/15/12 | | | 6,648,180 |
| 6,000,000 | | New York State Environmental Facilties Revenue Bonds, Municipal Water, Project K | | 5.00 | | | 6/15/12 | | | 6,531,900 |
| 5,000,000 | | New York State Local Government Assistance Corporation Revenue Bonds, Series A-1, (FSA) | | 5.00 | | | 4/1/12 | | | 5,422,700 |
| 6,000,000 | | New York State Thruway Authority Revenue Bonds, Local Highway & Bridge Project, Series C, (MBIA) | | 5.50 | | | 4/1/12 | | | 6,663,660 |
| 6,000,000 | | New York State Thruway Authority, State Personal Income Tax Revenue Bonds, Series A, (AMBAC) | | 5.00 | | | 3/15/16 | | | 6,472,860 |
| 5,000,000 | | Puerto Rico Electric Power Authority Revenue Bonds, Series BB, (MBIA) | | 6.00 | | | 7/1/11 | | | 5,718,950 |
| | | | | | | | | |
|
|
| | | TOTAL TAX-EXEMPT SECURITIES
(Cost $83,610,786) | | | 83,526,410 |
| | | | | | | | | |
|
|
See Notes to Financial Statements.
39
Excelsior Tax-Exempt Fund, Inc.
Portfolio of Investments — March 31, 2005
New York Intermediate-Term Tax-Exempt Fund — (continued)
| | | | | | | | | | |
Principal/ Shares
| | | | Rate
| | | Maturity
Date
| | Value
|
| | | | | | | | | | | |
TAX-EXEMPT SECURITIES – BACKED BY LETTERS OF
CREDIT — 8.90% |
| $ 6,500,000 | | New York City, New York, General Obligation Bonds, Sub-Series H-3, (Bank of
New York)(a) | | 2.21 | % | | 3/1/34 | | $ | 6,500,000 |
| 5,800,000 | | New York State Dormitory Authority, Oxford University Revenue Bonds, (Landesbank Hessen)(a) | | 2.30 | | | 7/1/23 | | | 5,800,000 |
| | | | | | | | | |
|
|
| | | TOTAL TAX-EXEMPT SECURITIES –BACKED BY LETTERS OF CREDIT
(Cost $12,300,000) | | | 12,300,000 |
| | | | | | | | | |
|
|
TAX-EXEMPT SECURITIES – ESCROWED IN
U.S. GOVERNMENTS — 12.91% |
| 10,000,000 | | Long Island Power Authority, New York Electric System Revenue Bonds,
Series A, (FSA) (Escrowed to Maturity) | | 5.25 | | | 12/1/14 | | | 11,145,200 |
| 6,000,000 | | New York State Metropolitan Transportation Authority Revenue Bonds, Service Contract, Series 8, (FSA) (Prerefunded
07/01/13 @ 100) | | 5.38 | | | 7/1/21 | | | 6,707,760 |
| | | | | | | | | |
|
|
| | | TOTAL TAX-EXEMPT SECURITIES –ESCROWED IN U.S. GOVERNMENTS (Cost $18,077,523) | | | 17,852,960 |
| | | | | | | | | |
|
|
REGISTERED INVESTMENT COMPANIES — 0.32% |
| 1 | | Dreyfus New York Tax Exempt Cash Fund | | | 1 |
| 447,785 | | Provident Institutional New York Money Market Fund | | | 447,785 |
| | | | | | | | | |
|
|
| | | TOTAL REGISTERED INVESTMENT COMPANIES
(Cost $447,786) | | | 447,786 |
| | | | | | | | | |
|
|
| | | | | | | | | | |
TOTAL INVESTMENTS
(Cost $137,286,096)(b) | | 99.08 | % | | | | | | $ | 136,977,156 |
OTHER ASSETS IN EXCESS OF LIABILITIES | | 0.92 | | | | | | | | 1,275,750 |
| | |
|
| | | | | |
|
|
NET ASSETS | | 100.00 | % | | | | | | $ | 138,252,906 |
| | |
|
| | | | | |
|
|
| (a) | Variable Rate Security—The rate disclosed is as of March 31, 2005. |
| (b) | Unrealized appreciation (depreciation) of securities: |
| | | | |
Unrealized
Appreciation
| | Unrealized
(Depreciation)
| | Net
Unrealized
Appreciation/
(Depreciation)
|
| $950,876 | | $(1,259,816) | | $(308,940) |
AMBAC—American Municipal Bond Assurance Corp.
FGIC—Financial Guaranty Insurance Corp.
FSA—Financial Security Assurance
MBIA—Municipal Bond Insurance Association
SPA—Standby Purchase Agreement
Notes (The following notes have not been audited by Deloitte & Touche LLP):
These municipal securities meet the three highest ratings assigned by Moody’s Investors Services, Inc. or Standard and Poor’s Corporation or, where not rated, are determined by the Advisor, under the supervision of the Board of Directors, to be of comparable quality at the time of purchase to rated instruments that may be acquired by the Fund.
At March 31, 2005, approximately 22% of the net assets are invested in municipal securities that have letter of credit enhancement features or escrows in U.S. Government securities backing them, on which the Fund relies. Without such features, the securities may or may not meet the quality standards of securities purchased by the Fund.
At March 31,2005, approximately 96% of the net assets are invested in New York municipal securities. Economic changes affecting the state and certain of its public bodies and municipalities may affect the ability of issuers to pay the required principal and interest payments of the municipal securities.
See Notes to Financial Statements.
40
Excelsior Tax-Exempt Fund, Inc.
Portfolio of Investments — March 31, 2005
New York Intermediate-Term Tax-Exempt Fund — (continued)
The summary of the Fund’s investments as of March 31, 2005 is as follows: (Unaudited)
| | | | | | |
Portfolio Diversification
| | % of
Net
Assets
| | | Value
|
Revenue Bonds | | 67.55 | % | | $ | 93,376,410 |
Backed by Letters of Credit | | 8.90 | | | | 12,300,000 |
Escrowed to Maturity | | 8.06 | | | | 11,145,200 |
Prerefunded | | 4.85 | | | | 6,707,760 |
Anticipation Notes | | 4.70 | | | | 6,500,000 |
General Obligation Bonds | | 4.70 | | | | 6,500,000 |
Registered Investment Companies | | 0.32 | | | | 447,786 |
| | |
|
| |
|
|
Total Investments | | 99.08 | % | | $ | 136,977,156 |
Other Assets and Liabilities (Net) | | 0.92 | | | | 1,275,750 |
| | |
|
| |
|
|
Net Assets | | 100.00 | % | | $ | 138,252,906 |
| | |
|
| |
|
|
See Notes to Financial Statements.
41
Excelsior Tax-Exempt Funds, Inc.
Portfolio of Investments — March 31, 2005
California Tax-Exempt Income Fund
| | | | | | | | | | |
| | | | | | | | | | | |
Principal
| | | | Rate
| | | Maturity
Date
| | Value
|
TAX-EXEMPT SECURITIES — 91.81% |
| $ 545,000 | | Alameda-Contra Costa, California, Certificates of Participation, Transportation District, (AMBAC) | | 4.00 | % | | 08/01/12 | | $ | 557,824 |
| 595,000 | | Berkeley, California, Unified School District, General Obligation Bonds, (FGIC) | | 4.38 | | | 08/01/06 | | | 608,774 |
| 35,000 | | California Educational Facilities Authority, Santa Clara University Revenue Bonds, (MBIA) | | 4.90 | | | 09/01/06 | | | 36,108 |
| 750,000 | | California Educational Facilities Authority, Stanford University Revenue Bonds,
Series R | | 5.00 | | | 11/01/11 | | | 824,760 |
| 1,000,000 | | California State Department of Transportation Revenue Bonds, Federal Highway Grant Anticipation Bonds, Series A, (FGIC) | | 4.50 | | | 02/01/13 | | | 1,055,250 |
| 1,000,000 | | California State Department of Water Resources Central Valley Project Revenue Bonds, Series T | | 5.00 | | | 12/01/11 | | | 1,077,690 |
| 500,000 | | California State Department of Water Resources Central Valley Project Revenue Bonds, Series U | | 4.00 | | | 12/01/06 | | | 511,505 |
| 1,000,000 | | California State Department of Water Resources Central Valley Project Revenue Bonds, Series Y | | 5.00 | | | 12/01/10 | | | 1,092,400 |
| 1,000,000 | | California State Economic Recovery, General Obligation Bonds, Series A, (FGIC) | | 5.25 | | | 07/01/14 | | | 1,103,820 |
| 750,000 | | California State General Obligation Bonds | | 6.25 | | | 04/01/08 | | | 816,270 |
| 750,000 | | California State General Obligation Bonds, (MBIA) | | 7.50 | | | 10/01/07 | | | 833,408 |
| | | | | | | | | | |
| | | | | | | | | | | |
Principal
| | | | Rate
| | | Maturity
Date
| | Value
|
TAX-EXEMPT SECURITIES — (continued) |
| $ 750,000 | | California State Infrastructure & Economic Development Bank Revenue Bonds, Bay Area Toll Bridges, Series A, (FSA) | | 5.00 | % | | 07/01/11 | | $ | 819,113 |
| 250,000 | | California State Public Works Board, Lease Revenue Bonds, Department of Corrections, Series D, (MBIA) | | 4.85 | | | 09/01/08 | | | 265,695 |
| 1,000,000 | | California State University Systemwide Revenue Bonds, Series A, (AMBAC) | | 5.00 | | | 11/01/12 | | | 1,093,430 |
| 1,000,000 | | California Statewide Communities Development Authority Revenue Bonds, California Endowment | | 5.00 | | | 07/01/13 | | | 1,093,030 |
| 315,000 | | Central Coast Water Authority, California, Revenue Bonds, State Water Project,
Series A, (AMBAC) | | 6.00 | | | 10/01/05 | | | 320,509 |
| 1,000,000 | | Central Valley School District Financing Authority, California, School District General Obligation Bonds, Series A, (MBIA)(a) | | 6.15 | | | 08/01/09 | | | 1,123,300 |
| 1,100,000 | | Cerritos, California, Public Financing Authority Tax Allocation Bonds, Redevelopment Project, Series A, (AMBAC) | | 3.00 | | | 11/01/10 | | | 1,080,321 |
| 545,000 | | Chino Basin, California, Regional Financing Authority Revenue Bonds, Municipal Water District Sewer System Project, (AMBAC) | | 7.00 | | | 08/01/05 | | | 553,088 |
| 350,000 | | Contra Costa County, California, Certificates of Participation, Capital Projects, (AMBAC) | | 4.63 | | | 02/01/07 | | | 362,079 |
See Notes to Financial Statements.
42
Excelsior Tax-Exempt Funds, Inc.
Portfolio of Investments — March 31, 2005
California Tax-Exempt Income Fund — (continued)
| | | | | | | | | | |
| | | | | | | | | | | |
Principal
| | | | Rate
| | | Maturity
Date
| | Value
|
TAX-EXEMPT SECURITIES — (continued) |
| $ 550,000 | | Contra Costa, California, Transportation Authority Sales Tax Revenue Bonds, Series A, (FGIC) | | 6.00 | % | | 03/01/07 | | $ | 583,688 |
| 1,000,000 | | Contra Costa, California, Transportation Authority Sales Tax Revenue Bonds, Series A, (FGIC) | | 6.00 | | | 03/01/08 | | | 1,087,210 |
| 750,000 | | East Bay, California, Regional Park District Authority General Obligation Bonds | | 5.00 | | | 09/01/07 | | | 789,180 |
| 250,000 | | Escondido, California, Unified School District General Obligation Bonds, Series A, (FGIC) | | 5.00 | | | 09/01/08 | | | 267,075 |
| 1,150,000 | | Fairfield-Suisun, California, Unified School District General Obligation Bonds, (MBIA) | | 4.25 | | | 08/01/10 | | | 1,211,501 |
| 975,000 | | Foothill-De Anza, California, Community College District General Obligation Bonds, (FGIC) | | 5.00 | | | 08/01/14 | | | 1,049,120 |
| 155,000 | | Fresno, California, Sewer Revenue Bonds, Series A-1, (AMBAC) | | 4.80 | | | 09/01/06 | | | 159,695 |
| 750,000 | | Glendale, California, Unified School District General Obligation Bonds, Series D, (MBIA) | | 4.50 | | | 09/01/13 | | | 784,785 |
| 745,000 | | Los Altos, California, School District General Obligation Bonds, Series A, (FSA) | | 5.00 | | | 08/01/06 | | | 768,259 |
| 300,000 | | Los Angeles County, California, Public Works Financing Authority Revenue Bonds, Regional Park & Open Space District, Series A | | 5.25 | | | 10/01/05 | | | 304,128 |
| 500,000 | | Los Angeles, California, Department of Airports Revenue Bonds, Series A, (FGIC) | | 6.00 | | | 05/15/05 | | | 502,257 |
| | | | | | | | | | |
| | | | | | | | | | | |
Principal
| | | | Rate
| | | Maturity
Date
| | Value
|
TAX-EXEMPT SECURITIES — (continued) |
| $1,000,000 | | Los Angeles, California, Department of Water & Power Revenue Bonds, Power System, Series A,
Sub-Series A-1,
(MBIA) | | 5.00 | % | | 07/01/14 | | $ | 1,084,150 |
| 1,000,000 | | Los Angeles, California, General Obligation Bonds, Series A, (MBIA) | | 4.00 | | | 09/01/13 | | | 1,022,930 |
| 150,000 | | Los Angeles, California, Municipal Improvement Corporation Sanitation Equipment Charge Revenue Bonds, Series A, (FSA) | | 4.88 | | | 02/01/06 | | | 152,901 |
| 750,000 | | Los Angeles, California, Municipal Improvement Corporation Sanitation Equipment Charge Revenue Bonds, Series B, (AMBAC) | | 4.60 | | | 02/01/06 | | | 762,840 |
| 1,000,000 | | Los Angeles, California, Sanitation Equipment Charge Revenue Bonds, Series A, (FSA) | | 5.00 | | | 02/01/10 | | | 1,082,120 |
| 500,000 | | Los Angeles, California, Unified School District General Obligation Bonds, Series F, (FSA) | | 4.50 | | | 07/01/13 | | | 528,885 |
| 1,000,000 | | Los Angeles, California, Wastewater System Revenue Bonds, Series A, (FGIC) | | 5.50 | | | 06/01/10 | | | 1,110,980 |
| 370,000 | | Marin, California, Municipal Water District Revenue Bonds, (AMBAC) | | 4.00 | | | 07/01/10 | | | 385,066 |
| 700,000 | | Metropolitan Water District of Southern California, General Obligation Bonds | | 4.25 | | | 03/01/08 | | | 728,119 |
| 1,000,000 | | Metropolitan Water District of Southern California, General Obligation Bonds, Series A | | 3.00 | | | 03/01/08 | | | 1,005,530 |
| 960,000 | | Metropolitan Water District of Southern California, Revenue Bonds | | 5.75 | | | 07/01/09 | | | 1,061,078 |
See Notes to Financial Statements.
43
Excelsior Tax-Exempt Funds, Inc.
Portfolio of Investments — March 31, 2005
California Tax-Exempt Income Fund — (continued)
| | | | | | | | | | |
| | | | | | | | | | | |
Principal
| | | | Rate
| | | Maturity
Date
| | Value
|
TAX-EXEMPT SECURITIES — (continued) |
| $ 120,000 | | Metropolitan Water District of Southern California, Revenue Bonds, Series B, (MBIA) | | 5.25 | % | | 07/01/07 | | $ | 126,400 |
| 1,000,000 | | Modesto, California, Irrigation District Financing Authority Certificates of Participation,
Series A, (MBIA) | | 4.00 | | | 07/01/09 | | | 1,040,300 |
| 975,000 | | Modesto, California, Irrigation District Financing Authority Revenue Bonds, Series A, (MBIA) | | 5.45 | | | 10/01/07 | | | 1,034,085 |
| 1,000,000 | | Moulton-Niguel, California, Water District General Obligation Bonds, (AMBAC) | | 4.00 | | | 09/01/10 | | | 1,039,400 |
| 500,000 | | Napa County, California, Flood Protection & Watershed Improvement Revenue Bonds, Series A, (FGIC) | | 5.00 | | | 06/15/13 | | | 533,725 |
| 250,000 | | Northern California Power Agency, Public Power Revenue Bonds, Geothermal Project, Series A, (AMBAC) | | 5.50 | | | 07/01/05 | | | 251,863 |
| 125,000 | | Northern California Power Agency, Public Power Revenue Bonds, Series A, (AMBAC) | | 5.60 | | | 07/01/06 | | | 129,521 |
| 250,000 | | Novato, California, General Obligation Bonds, Series A, (MBIA) | | 6.25 | | | 08/01/07 | | | 269,400 |
| 1,100,000 | | Orange County, California, Local Transportation Authority Sales Tax Revenue Bonds, 1st Senior, (AMBAC) | | 6.00 | | | 02/15/08 | | | 1,194,511 |
| 1,000,000 | | Orange County, California, Local Transportation Authority Sales Tax Revenue Bonds, 2nd Senior, (FGIC) | | 6.00 | | | 02/15/07 | | | 1,060,030 |
| | | | | | | | | | |
| | | | | | | | | | | |
Principal
| | | | Rate
| | | Maturity
Date
| | Value
|
TAX-EXEMPT SECURITIES — (continued) |
| $1,000,000 | | Oxnard, California, Wastewater District Financing Authority Revenue Bonds, (FGIC) | | 3.50 | % | | 06/01/09 | | $ | 1,020,160 |
| 1,000,000 | | Rancho, California, Water District Financing Authority Revenue Bonds, Series A, (FSA) | | 5.50 | | | 08/01/10 | | | 1,114,280 |
| 255,000 | | Sacramento, California, City Financing Authority Lease Revenue Bonds, Series A, (AMBAC) | | 5.05 | | | 11/01/06 | | | 264,519 |
| 300,000 | | San Bernardino County, California, Certificates of Participation, Medical Center Financing Project, (MBIA) | | 5.50 | | | 08/01/07 | | | 318,147 |
| 1,000,000 | | San Diego County, California, Certificates of Participation, (AMBAC) | | 5.00 | | | 11/01/11 | | | 1,090,430 |
| 250,000 | | San Diego, California, General Obligation Bonds, Public Safety Communication Project | | 6.50 | | | 07/15/08 | | | 275,055 |
| 1,000,000 | | San Diego, California, Public Facilities Financing Authority Sewer Revenue Bonds, (FGIC) | | 5.20 | | | 05/15/13 | | | 1,023,460 |
| 300,000 | | San Diego, California, Public Facilities Financing Authority Sewer Revenue Bonds, Series B, (FGIC) | | 5.00 | | | 05/15/08 | | | 316,767 |
| 1,000,000 | | San Diego, California, Public Facilities Financing Authority Water Revenue Bonds, (MBIA) | | 5.00 | | | 08/01/11 | | | 1,093,260 |
| 875,000 | | San Francisco, California, Bay Area Rapid Transit District, Sales Tax Revenue Bonds | | 5.50 | | | 07/01/07 | | | 925,103 |
| 1,500,000 | | San Francisco, California, City & County Airports Commission, Airport Revenue Bonds, 2nd Series, Issue 20, (MBIA) | | 5.00 | | | 05/01/06 | | | 1,538,444 |
See Notes to Financial Statements.
44
Excelsior Tax-Exempt Funds, Inc.
Portfolio of Investments — March 31, 2005
California Tax-Exempt Income Fund — (continued)
| | | | | | | | | | |
| | | | | | | | | | | |
Principal
| | | | Rate
| | | Maturity
Date
| | Value
|
TAX-EXEMPT SECURITIES — (continued) |
| $1,000,000 | | San Francisco, California, City & County General Obligation Bonds, (FSA) | | 5.00 | % | | 06/15/08 | | $ | 1,066,740 |
| 680,000 | | San Francisco, California, City & County General Obligation Bonds, Series 1, (FGIC) | | 4.50 | | | 06/15/05 | | | 682,951 |
| 1,020,000 | | San Francisco, California, City & County Parking Authority Revenue Bonds, Parking Meter Project, Series 1, (FGIC) | | 4.00 | | | 06/01/06 | | | 1,036,942 |
| 625,000 | | San Jose, California, Redevelopment Agency Tax Allocation Bonds, Merged Area Redevelopment Project, (AMBAC) | | 4.75 | | | 08/01/05 | | | 629,800 |
| 500,000 | | San Jose, California, Redevelopment Agency Tax Allocation Bonds, Merged Area Redevelopment Project, (AMBAC) | | 5.00 | | | 08/01/07 | | | 525,815 |
| 750,000 | | San Mateo County, California, Transportation District, Sales Tax Revenue Bonds, Series A, (FSA) | | 5.00 | | | 06/01/09 | | | 808,778 |
| 800,000 | | San Mateo, Foster City, California, School District General Obligation Bonds, (FSA) | | 4.00 | | | 09/01/13 | | | 816,440 |
| 510,000 | | Santa Barbara, California, Waterfront Certificates of Participation, (AMBAC) | | 4.13 | | | 10/01/12 | | | 528,115 |
| 1,075,000 | | Santa Clara County, California, Financing Authority Revenue Bonds, Multiple Facilities Project, Series A, (AMBAC) | | 4.50 | | | 05/15/12 | | | 1,113,464 |
| 500,000 | | Santa Clara County, California, Transportation District, Sales Tax Revenue Bonds, Series A | | 4.50 | | | 06/01/06 | | | 511,305 |
| | | | | | | | | | |
| | | | | | | | | | | |
Principal
| | | | Rate
| | | Maturity
Date
| | Value
|
TAX-EXEMPT SECURITIES — (continued) |
| $1,000,000 | | Southern California Public Power Authority Revenue Bonds, Transmission Project, Series A, (MBIA) | | 5.25 | % | | 07/01/09 | | $ | 1,079,600 |
| 1,000,000 | | Southern California Public Power Authority Revenue Bonds, Transmission Project, Series B, (FSA) | | 4.25 | | | 07/01/11 | | | 1,050,250 |
| 600,000 | | University of California Revenue Bonds, Multi-Purpose Projects, Series F, (FGIC) | | 5.00 | | | 09/01/08 | | | 625,182 |
| | | | | | | | | |
|
|
| | | TOTAL TAX-EXEMPT SECURITIES
(Cost $56,881,446) | | | 57,794,113 |
| | | | | | | | | |
|
|
TAX-EXEMPT SECURITIES – ESCROWED IN U.S.
GOVERNMENTS — 3.58% |
| 100,000 | | California State Educational Facilities Authority Revenue Bonds, Santa Clara University, (MBIA) (Escrowed to Maturity) | | 4.90 | | | 09/01/06 | | | 103,222 |
| 125,000 | | Los Angeles, California, Department of Water & Power Electric Plant Revenue Bonds, (AMBAC) (Escrowed to Maturity) | | 4.60 | | | 08/15/06 | | | 126,089 |
| 40,000 | | Metropolitan Water District of Southern California, Waterworks Revenue Bonds (Escrowed to Maturity) | | 5.75 | | | 07/01/09 | | | 44,195 |
| 80,000 | | Metropolitan Water District of Southern California, Waterworks Revenue Bonds, Series B, (MBIA) (Prerefunded 07/01/06 @ 102) | | 5.25 | | | 07/01/07 | | | 84,165 |
| 125,000 | | Northern California Power Agency Revenue Bonds, Public Power,
Series A, (AMBAC) (Escrowed to Maturity) | | 5.60 | | | 07/01/06 | | | 129,615 |
See Notes to Financial Statements.
45
Excelsior Tax-Exempt Funds, Inc.
Portfolio of Investments — March 31, 2005
California Tax-Exempt Income Fund — (continued)
| | | | | | | | | | |
| | | | | | | | | | | |
Principal/ Shares
| | | | Rate
| | | Maturity
Date
| | Value
|
TAX-EXEMPT SECURITIES – ESCROWED IN U.S.
GOVERNMENTS — (continued) |
| $ 400,000 | | Sacramento County, California, Sanitation District Financing Authority Revenue Bonds (Escrowed to Maturity) | | 5.50 | % | | 12/01/05 | | $ | 408,136 |
| 825,000 | | San Bernardino County, California, Certificates of Participation, Medical Center Financing Project, Series A, (MBIA) (Prerefunded 08/01/05 @ 102) | | 5.50 | | | 08/01/22 | | | 849,898 |
| 500,000 | | San Francisco, California, Bay Area Rapid Transit District, Sales Tax Revenue Bonds, (FGIC) (Prerefunded 07/01/05 @ 101) | | 5.50 | | | 07/01/20 | | | 508,795 |
| | | | | | | | | |
|
|
| | | TOTAL TAX-EXEMPT SECURITIES –
ESCROWED IN U.S. GOVERNMENTS
(Cost $2,226,065) | | | 2,254,115 |
| | | | | | | | | |
|
|
REGISTERED INVESTMENT COMPANIES — 5.10% |
| 1,537,436 | | BlackRock California Money Fund | | | 1,537,436 |
| 1,670,387 | | Federated California Money Fund | | | 1,670,387 |
| | | | | | | | | |
|
|
| | | TOTAL REGISTERED INVESTMENT COMPANIES
(Cost $3,207,823) | | | 3,207,823 |
| | | | | | | | | |
|
|
| | | | | | | |
TOTAL INVESTMENTS
(Cost $62,315,334)(b) | | 100.49 | % | | $ | 63,256,051 | |
LIABILITIES IN EXCESS OF OTHER ASSETS | | (0.49 | ) | | | (306,960 | ) |
| | |
|
| |
|
|
|
NET ASSETS | | 100.00 | % | | $ | 62,949,091 | |
| | |
|
| |
|
|
|
| (a) | All or part of the security is segregated by the fund’s custodian to cover future purchase commitments. |
| (b) | Unrealized appreciation (depreciation) of securities: |
| | | | |
Unrealized
Appreciation
| | Unrealized
(Depreciation)
| | Net Unrealized
Appreciation/
(Depreciation)
|
$1,174,205 | | $(233,488) | | $940,717 |
AMBAC—American Municipal Bond Assurance Corp.
FGIC—Financial Guaranty Insurance Corp.
FSA—Financial Security Assurance
MBIA—Municipal Bond Insurance Association
Notes: (The following notes have not been audited by Deloitte & Touche LLP):
These municipal securities meet the three highest ratings assigned by Moody’s Investors Services, Inc. or Standard and Poor’s Corporation or, where not rated, are determined by the Advisor, under the supervision of the Board of Directors, to be of comparable quality at the time of purchase to rated instruments that may be acquired by the Fund.
At March 31, 2005, approximately 4% of the net assets are invested in municipal securities that have letter of credit enhancement features or escrows in U.S. Government securities backing them, on which the Fund relies. Without such features, the securities may or may not meet the quality standards of securities purchased by the Fund.
At March 31, 2005, approximately, 95% of the net assets are invested in California municipal securities. Economic changes affecting the state and certain of its public bodies and municipalities may affect the ability of issuers to pay the required principal and interest payments of the municipal securities.
See Notes to Financial Statements.
46
Excelsior Tax-Exempt Funds, Inc.
Portfolio of Investments — March 31, 2005
California Tax-Exempt Income Fund — (continued)
The summary of the Fund’s investments as of March 31, 2005 is as follows: (Unaudited)
| | | | | | | |
Portfolio Diversification
| | % of
Net
Assets
| | | Value
| |
Revenue Bonds | | 55.40 | % | | $ | 34,870,340 | |
General Obligation Bonds | | 26.67 | | | | 16,790,942 | |
Certificates of Participation | | 6.19 | | | | 3,896,895 | |
Registered Investment Companies | | 5.10 | | | | 3,207,823 | |
Tax Allocation Bonds | | 3.55 | | | | 2,235,936 | |
Prerefunded | | 2.29 | | | | 1,442,858 | |
Escrowed to Maturity | | 1.29 | | | | 811,257 | |
| | |
|
| |
|
|
|
Total Investments | | 100.49 | % | | $ | 63,256,051 | |
Other Assets and Liabilities (Net) | | (0.49 | ) | | | (306,960 | ) |
| | |
|
| |
|
|
|
Net Assets | | 100.00 | % | | $ | 62,949,091 | |
| | |
|
| |
|
|
|
See Notes to Financial Statements.
47
Excelsior Funds
Statements of Assets and Liabilities
March 31, 2005
| | | | | | | | | | | | | | | |
| | | | |
| | | Managed
Income
Fund
| | Intermediate-
Term
Managed
Income
Fund
| | | Short-Term
Government
Securities
Fund
| | | High
Yield
Fund
| |
ASSETS: | | | | | | | | | | | | | | | |
Investments, at cost — see accompanying portfolios | | $ | 209,787,935 | | $ | 410,376,775 | | | $ | 410,985,834 | | | $ | 166,457,693 | |
| | |
|
| |
|
|
| |
|
|
| |
|
|
|
Investments, at value (Note 1) | | $ | 212,431,458 | | $ | 408,600,984 | | | $ | 405,197,160 | | | $ | 165,985,211 | |
Cash | | | 12,563 | | | 17,876 | | | | 201,195 | | | | — | |
Interest receivable | | | 1,235,057 | | | 2,851,586 | | | | 1,901,807 | | | | 3,770,987 | |
Receivable for investments sold | | | 25,557,790 | | | — | | | | 7,803,586 | | | | 1,252,132 | |
Receivable for fund shares sold | | | 244,407 | | | 678,849 | | | | 823,236 | | | | 920,433 | |
| | |
|
| |
|
|
| |
|
|
| |
|
|
|
Total Assets: | | | 239,481,275 | | | 412,149,295 | | | | 415,926,984 | | | | 171,928,763 | |
LIABILITIES: | | | | | | | | | | | | | | | |
Payable for dividends declared | | | 428,319 | | | 1,139,984 | | | | 885,694 | | | | 753,861 | |
Payable for investments purchased | | | 26,389,789 | | | — | | | | 11,842,517 | | | | 525,028 | |
Payable for fund shares redeemed | | | 507,723 | | | 368,636 | | | | 387,397 | | | | 890,048 | |
Investment advisory fees payable (Note 2) | | | 65,342 | | | 67,836 | | | | 40,202 | | | | 78,832 | |
Administration fees payable (Note 2) | | | 27,375 | | | 52,175 | | | | 51,693 | | | | 23,025 | |
Shareholder servicing fees payable (Note 2) | | | 28,830 | | | 51,168 | | | | 90,853 | | | | 35,843 | |
Directors’/Trustees’ fees and expenses payable (Note 2) | | | 9 | | | 36 | | | | 301 | | | | 45 | |
Cash overdraft | | | — | | | — | | | | — | | | | 120,143 | |
Accrued expenses and other payables | | | 100,902 | | | 77,099 | | | | 110,520 | | | | 54,870 | |
| | |
|
| |
|
|
| |
|
|
| |
|
|
|
Total Liabilities: | | | 27,548,289 | | | 1,756,934 | | | | 13,409,177 | | | | 2,481,695 | |
| | |
|
| |
|
|
| |
|
|
| |
|
|
|
NET ASSETS: | | $ | 211,932,986 | | $ | 410,392,361 | | | $ | 402,517,807 | | | $ | 169,447,068 | |
| | |
|
| |
|
|
| |
|
|
| |
|
|
|
NET ASSETS consist of: | | | | | | | | | | | | | | | |
Undistributed (distributions in excess of) net investment income | | $ | 9,744 | | $ | 108,371 | | | $ | 35,416 | | | $ | (1,124,014 | ) |
Accumulated net realized gain (loss) on investment | | | 1,913,595 | | | 1,015,485 | | | | (7,407,519 | ) | | | (61,284,586 | ) |
Unrealized appreciation (depreciation) of investments | | | 2,643,523 | | | (1,775,791 | ) | | | (5,788,674 | ) | | | (472,482 | ) |
Par value (Note 5) | | | 23,151 | | | 57,315 | | | | 57,469 | | | | 363 | |
Paid in capital in excess of par value | | | 207,342,973 | | | 410,986,981 | | | | 415,621,115 | | | | 232,327,787 | |
| | |
|
| |
|
|
| |
|
|
| |
|
|
|
Net Assets | | $ | 211,932,986 | | $ | 410,392,361 | | | $ | 402,517,807 | | | $ | 169,447,068 | |
| | |
|
| |
|
|
| |
|
|
| |
|
|
|
Net Assets: | | | | | | | | | | | | | | | |
Shares | | $ | 211,931,836 | | $ | 410,392,361 | | | $ | 402,517,807 | | | $ | 156,139,159 | |
Institutional Shares | | | — | | | — | | | | — | | | | 13,307,909 | |
Retirement Shares | | | 1,150 | | | — | | | | — | | | | — | |
Shares outstanding (Note 5): | | | | | | | | | | | | | | | |
Shares | | | 23,150,973 | | | 57,314,794 | | | | 57,469,089 | | | | 33,455,324 | |
Institutional Shares | | | — | | | — | | | | — | | | | 2,853,076 | |
Retirement Shares | | | 126 | | | — | | | | — | | | | — | |
NET ASSET VALUE PER SHARE (net assets ÷ shares outstanding) | | | | | | | | | | | | | | | |
Shares | | | $9.15 | | | $7.16 | | | | $7.00 | | | | $4.67 | |
| | |
|
| |
|
|
| |
|
|
| |
|
|
|
Institutional Shares | | | — | | | — | | | | — | | | | $4.66 | |
| | |
|
| |
|
|
| |
|
|
| |
|
|
|
Retirement Shares | | | $9.16 | | | — | | | | — | | | | — | |
| | |
|
| |
|
|
| |
|
|
| |
|
|
|
See Notes to Financial Statements.
48
| | | | | | | | | | | | | | | | | |
| | | | |
Long-Term
Tax-Exempt
Fund
| | | Intermediate-
Term
Tax-Exempt
Fund
| | Short-Term
Tax-Exempt
Securities
Fund
| | | New York
Intermediate-
Term
Tax-Exempt
Fund
| | | California
Tax-Exempt
Income
Fund
| |
| | | | | | | | | | | | | | | | | | |
| $ | 60,219,688 | | | $ | 340,455,193 | | $ | 234,140,389 | | | $ | 137,286,096 | | | $ | 62,315,334 | |
|
|
| |
|
| |
|
|
| |
|
|
| |
|
|
|
| $ | 61,080,709 | | | $ | 346,535,748 | | $ | 232,135,413 | | | $ | 136,977,156 | | | $ | 63,256,051 | |
| | — | | | | 1,085 | | | — | | | | 9,392 | | | | — | |
| | 595,337 | | | | 3,983,393 | | | 2,460,483 | | | | 1,622,268 | | | | 690,377 | |
| | 1,406,819 | | | | — | | | 4,797,906 | | | | — | | | | — | |
| | 90 | | | | 183,890 | | | 826,267 | | | | — | | | | 310,000 | |
|
|
| |
|
| |
|
|
| |
|
|
| |
|
|
|
| | 63,082,955 | | | | 350,704,116 | | | 240,220,069 | | | | 138,608,816 | | | | 64,256,428 | |
| | | | | | | | | | | | | | | | | | |
| | 120,118 | | | | 752,786 | | | 268,064 | | | | 243,432 | | | | 128,065 | |
| | — | | | | — | | | — | | | | — | | | | 1,143,618 | |
| | 78,202 | | | | 169,533 | | | 756,597 | | | | 1,785 | | | | — | |
| | 13,223 | | | | 59,115 | | | 31,149 | | | | 39,140 | | | | — | |
| | 8,141 | | | | 45,049 | | | 31,827 | | | | 18,063 | | | | 5,238 | |
| | 16,136 | | | | 66,268 | | | 26,441 | | | | 19,878 | | | | 7,868 | |
| | 19 | | | | 108 | | | 75 | | | | 51 | | | | 19 | |
| | — | | | | — | | | — | | | | — | | | | — | |
| | 29,979 | | | | 71,459 | | | 45,881 | | | | 33,561 | | | | 22,529 | |
|
|
| |
|
| |
|
|
| |
|
|
| |
|
|
|
| | 265,818 | | | | 1,164,318 | | | 1,160,034 | | | | 355,910 | | | | 1,307,337 | |
|
|
| |
|
| |
|
|
| |
|
|
| |
|
|
|
| $ | 62,817,137 | | | $ | 349,539,798 | | $ | 239,060,035 | | | $ | 138,252,906 | | | $ | 62,949,091 | |
|
|
| |
|
| |
|
|
| |
|
|
| |
|
|
|
| | | | | | | | | | | | | | | | | | |
| $ | 1,526 | | | $ | 4,425 | | $ | 5,326 | | | $ | 2,760 | | | $ | 1,659 | |
| | (262,322 | ) | | | 367,896 | | | (389,388 | ) | | | 1,825,238 | | | | (975 | ) |
| | 861,021 | | | | 6,080,555 | | | (2,004,976 | ) | | | (308,940 | ) | | | 940,717 | |
| | 6,241 | | | | 37,146 | | | 33,544 | | | | 15,875 | | | | 8,659 | |
| | 62,210,671 | | | | 343,049,776 | | | 241,415,529 | | | | 136,717,973 | | | | 61,999,031 | |
|
|
| |
|
| |
|
|
| |
|
|
| |
|
|
|
| $ | 62,817,137 | | | $ | 349,539,798 | | $ | 239,060,035 | | | $ | 138,252,906 | | | $ | 62,949,091 | |
|
|
| |
|
| |
|
|
| |
|
|
| |
|
|
|
| | | | | | | | | | | | | | | | | | |
| $ | 62,817,137 | | | $ | 349,539,798 | | $ | 239,060,035 | | | $ | 138,252,906 | | | $ | 62,949,091 | |
| | — | | | | — | | | — | | | | — | | | | — | |
| | — | | | | — | | | — | | | | — | | | | — | |
| | | | | | | | | | | | | | | | | | |
| | 6,240,665 | | | | 37,146,248 | | | 33,544,498 | | | | 15,875,072 | | | | 8,658,639 | |
| | — | | | | — | | | — | | | | — | | | | — | |
| | — | | | | — | | | — | | | | — | | | | — | |
| | | | |
| | | | | | | | | | | | | | | | | | |
| | $10.07 | | | | $9.41 | | | $7.13 | | | | $8.71 | | | | $7.27 | |
|
|
| |
|
| |
|
|
| |
|
|
| |
|
|
|
| | — | | | | — | | | — | | | | — | | | | — | |
|
|
| |
|
| |
|
|
| |
|
|
| |
|
|
|
| | — | | | | — | | | — | | | | — | | | | — | |
|
|
| |
|
| |
|
|
| |
|
|
| |
|
|
|
See Notes to Financial Statements.
49
Excelsior Funds
Statements of Operations
Year Ended March 31, 2005
| | | | | | | | | | | | | | | | |
| | | | |
| | | Managed
Income
Fund
| | | Intermediate-
Term
Managed
Income
Fund
| | | Short-Term
Government
Securities
Fund
| | | High
Yield
Fund
| |
INVESTMENT INCOME: | | | | | | | | | | | | | | | | |
Interest | | $ | 12,833,462 | | | $ | 16,316,282 | | | $ | 13,976,881 | | | $ | 14,252,775 | |
Dividend | | | 82,331 | | | | — | | | | — | | | | — | |
| | |
|
|
| |
|
|
| |
|
|
| |
|
|
|
Total Income | | | 12,915,793 | | | | 16,316,282 | | | | 13,976,881 | | | | 14,252,775 | |
EXPENSES: | | | | | | | | | | | | | | | | |
Investment advisory fees (Note 2) | | | 1,976,828 | | | | 1,381,522 | | | | 1,318,396 | | | | 1,479,257 | |
Administration fees (Note 2) | | | 399,281 | | | | 597,889 | | | | 665,654 | | | | 280,116 | |
Shareholder servicing fees — Shares (Note 2) | | | 637,856 | | | | 947,335 | | | | 1,098,664 | | | | 391,840 | |
Legal and audit fees | | | 70,024 | | | | 93,603 | | | | 104,751 | | | | 54,921 | |
Re-audit expenses (Note 2) | | | 26,987 | | | | 36,315 | | | | 41,679 | | | | 17,634 | |
Custodian fees | | | 12,964 | | | | 23,928 | | | | 30,907 | | | | 8,603 | |
Registration and filing fees | | | 29,013 | | | | 23,029 | | | | 25,425 | | | | 41,659 | |
Shareholder reports | | | 20,156 | | | | 20,791 | | | | 27,200 | | | | 16,899 | |
Transfer agent fees | | | 153,507 | | | | 45,353 | | | | 102,367 | | | | 45,470 | |
Directors’/Trustees’ fees and expenses (Note 2) | | | 7,269 | | | | 10,639 | | | | 12,385 | | | | 8,164 | |
Miscellaneous expenses | | | 25,976 | | | | 37,565 | | | | 35,517 | | | | 24,568 | |
| | |
|
|
| |
|
|
| |
|
|
| |
|
|
|
Total Expenses | | | 3,359,861 | | | | 3,217,969 | | | | 3,462,945 | | | | 2,369,131 | |
Fees waived and reimbursed by: | | | | | | | | | | | | | | | | |
Investment Adviser (Note 2) | | | (912,503 | ) | | | (752,670 | ) | | | (703,376 | ) | | | (451,580 | ) |
Administrator (Note 2) | | | (43,265 | ) | | | (65,368 | ) | | | (75,529 | ) | | | (29,194 | ) |
Re-audit expenses paid by Investment Adviser (Note 2) | | | (26,987 | ) | | | (36,315 | ) | | | (41,679 | ) | | | (17,634 | ) |
| | |
|
|
| |
|
|
| |
|
|
| |
|
|
|
Net Expenses | | | 2,377,106 | | | | 2,363,616 | | | | 2,642,361 | | | | 1,870,723 | |
| | |
|
|
| |
|
|
| |
|
|
| |
|
|
|
NET INVESTMENT INCOME | | | 10,538,687 | | | | 13,952,666 | | | | 11,334,520 | | | | 12,382,052 | |
| | |
|
|
| |
|
|
| |
|
|
| |
|
|
|
REALIZED AND UNREALIZED GAIN (LOSS) ON INVESTMENTS (Note 1) | | | | | | | | | | | | | | | | |
Net realized gain (loss) on security transactions | | | 3,809,789 | | | | 1,414,970 | | | | (3,590,260 | ) | | | 1,684,436 | |
Change in unrealized appreciation/depreciation of investments during the period | | | (9,984,664 | ) | | | (14,217,960 | ) | | | (7,603,787 | ) | | | (3,437,364 | ) |
| | |
|
|
| |
|
|
| |
|
|
| |
|
|
|
Net realized and unrealized (loss) on investments | | | (6,174,875 | ) | | | (12,802,990 | ) | | | (11,194,047 | ) | | | (1,752,928 | ) |
| | |
|
|
| |
|
|
| |
|
|
| |
|
|
|
Net increase (decrease) in net assets resulting from operations | | $ | 4,363,812 | | | $ | 1,149,676 | | | $ | 140,473 | | | $ | 10,629,124 | |
| | |
|
|
| |
|
|
| |
|
|
| |
|
|
|
See Notes to Financial Statements.
50
| | | | | | | | | | | | | | | | | | |
| | | | |
Long-Term
Tax-Exempt
Fund
| | | Intermediate-
Term
Tax-Exempt
Fund
| | | Short-Term
Tax-Exempt
Securities
Fund
| | | New York
Intermediate-
Term
Tax-Exempt
Fund
| | | California
Tax-Exempt
Income
Fund
| |
| | | | | | | | | | | | | | | | | | | |
| $ | 2,333,844 | | | $ | 12,082,920 | | | $ | 5,097,711 | | | $ | 5,029,365 | | | $ | 2,340,593 | |
| | — | | | | — | | | | — | | | | — | | | | — | |
|
|
| |
|
|
| |
|
|
| |
|
|
| |
|
|
|
| | 2,333,844 | | | | 12,082,920 | | | | 5,097,711 | | | | 5,029,365 | | | | 2,340,593 | |
| | | | | | | | | | | | | | | | | | | |
| | 328,579 | | | | 1,262,089 | | | | 845,414 | | | | 769,441 | | | | 317,727 | |
| | 99,562 | | | | 546,216 | | | | 426,960 | | | | 233,154 | | | | 96,272 | |
| | 158,375 | | | | 883,466 | | | | 676,333 | | | | 369,332 | | | | 152,509 | |
| | 30,129 | | | | 86,664 | | | | 70,164 | | | | 46,855 | | | | 27,615 | |
| | 10,528 | | | | 31,092 | | | | 28,570 | | | | 16,850 | | | | 9,535 | |
| | 6,353 | | | | 15,671 | | | | 14,480 | | | | 9,614 | | | | 7,289 | |
| | 16,420 | | | | 20,812 | | | | 18,656 | | | | 16,498 | | | | 17,504 | |
| | 5,211 | | | | 24,558 | | | | 17,383 | | | | 10,173 | | | | 4,092 | |
| | 28,446 | | | | 35,264 | | | | 19,027 | | | | 16,671 | | | | 13,505 | |
| | 2,530 | | | | 13,545 | | | | 10,556 | | | | 5,908 | | | | 2,352 | |
| | 8,122 | | | | 23,821 | | | | 18,865 | | | | 12,168 | | | | 17,045 | |
|
|
| |
|
|
| |
|
|
| |
|
|
| |
|
|
|
| | 694,255 | | | | 2,943,198 | | | | 2,146,408 | | | | 1,506,664 | | | | 665,445 | |
| | | | | | | | | | | | | | | | | | | |
| | (145,612 | ) | | | (501,508 | ) | | | (371,474 | ) | | | (228,828 | ) | | | (309,048 | ) |
| | (11,284 | ) | | | (61,864 | ) | | | (51,897 | ) | | | (27,280 | ) | | | (28,478 | ) |
| | | | |
| | (10,528 | ) | | | (31,092 | ) | | | (28,570 | ) | | | (16,850 | ) | | | (9,535 | ) |
|
|
| |
|
|
| |
|
|
| |
|
|
| |
|
|
|
| | 526,831 | | | | 2,348,734 | | | | 1,694,467 | | | | 1,233,706 | | | | 318,384 | |
|
|
| |
|
|
| |
|
|
| |
|
|
| |
|
|
|
| | 1,807,013 | | | | 9,734,186 | | | | 3,403,244 | | | | 3,795,659 | | | | 2,022,209 | |
|
|
| |
|
|
| |
|
|
| |
|
|
| |
|
|
|
| | | | |
| | | | | | | | | | | | | | | | | | | |
| | 285,872 | | | | 374,010 | | | | (389,388 | ) | | | 2,398,438 | | | | (311 | ) |
| | | | | | | | | | | | | | | | | | | |
| | (549,586 | ) | | | (10,001,492 | ) | | | (3,435,518 | ) | | | (5,684,669 | ) | | | (1,976,428 | ) |
|
|
| |
|
|
| |
|
|
| |
|
|
| |
|
|
|
| | (263,714 | ) | | | (9,627,482 | ) | | | (3,824,906 | ) | | | (3,286,231 | ) | | | (1,976,739 | ) |
|
|
| |
|
|
| |
|
|
| |
|
|
| |
|
|
|
| | | | |
| $ | 1,543,299 | | | $ | 106,704 | | | $ | (421,662 | ) | | $ | 509,428 | | | $ | 45,470 | |
|
|
| |
|
|
| |
|
|
| |
|
|
| |
|
|
|
See Notes to Financial Statements.
51
Excelsior Funds
Statements of Changes in Net Assets
| | | | | | | | | | | | | | | | |
| | |
| | | Managed Income Fund
| | | Intermediate-Term Managed
Income Fund
| |
| | | Year Ended March 31,
| | | Year Ended March 31,
| |
| | | 2005
| | | 2004
| | | 2005
| | | 2004
| |
Net investment income | | $ | 10,538,687 | | | $ | 11,400,699 | | | $ | 13,952,666 | | | $ | 14,207,657 | |
Net realized gain (loss) on security transactions | | | 3,809,789 | | | | 2,230,517 | | | | 1,414,970 | | | | 4,745,495 | |
Change in unrealized appreciation (depreciation) of investments during the period | | | (9,984,664 | ) | | | 1,241,354 | | | | (14,217,960 | ) | | | 1,253,132 | |
| | |
|
|
| |
|
|
| |
|
|
| |
|
|
|
Net increase (decrease) in net assets resulting from operations | | | 4,363,812 | | | | 14,872,570 | | | | 1,149,676 | | | | 20,206,284 | |
| | |
|
|
| |
|
|
| |
|
|
| |
|
|
|
Distributions to shareholders: | | | | | | | | | | | | | | | | |
From net investment income | | | | | | | | | | | | | | | | |
Shares | | | (10,706,658 | ) | | | (11,408,944 | ) | | | (14,239,514 | ) | | | (14,252,672 | ) |
Institutional Shares | | | — | | | | — | | | | — | | | | — | |
Retirement Shares | | | (4 | ) | | | — | | | | — | | | | — | |
Tax Return of Capital | | | | | | | | | | | | | | | | |
Shares | | | — | | | | — | | | | — | | | | — | |
Institutional Shares | | | — | | | | — | | | | — | | | | — | |
From net realized gain on investments | | | (1,392,832 | ) | | | (4,038,025 | ) | | | (572,247 | ) | | | (5,570,809 | ) |
| | |
|
|
| |
|
|
| |
|
|
| |
|
|
|
Total distributions | | | (12,099,494 | ) | | | (15,446,969 | ) | | | (14,811,761 | ) | | | (19,823,481 | ) |
| | |
|
|
| |
|
|
| |
|
|
| |
|
|
|
Increase (decrease) in net assets from fund share transactions (Note 5) | | | | | | | | | | | | | | | | |
Shares | | | (49,359,232 | ) | | | (23,580,863 | ) | | | 10,787,119 | | | | 8,257,424 | |
Institutional Shares | | | — | | | | — | | | | — | | | | — | |
Retirement Shares | | | 1,054 | | | | — | | | | — | | | | — | |
| | |
|
|
| |
|
|
| |
|
|
| |
|
|
|
Total from fund share transactions | | | (49,358,178 | ) | | | (23,580,863 | ) | | | 10,787,119 | | | | 8,257,424 | |
| | |
|
|
| |
|
|
| |
|
|
| |
|
|
|
Net increase (decrease) in net assets | | | (57,093,860 | ) | | | (24,155,262 | ) | | | (2,874,966 | ) | | | 8,640,227 | |
| | |
|
|
| |
|
|
| |
|
|
| |
|
|
|
NET ASSETS: | | | | | | | | | | | | | | | | |
Beginning of period | | | 269,026,846 | | | | 293,182,108 | | | | 413,267,327 | | | | 404,627,100 | |
| | |
|
|
| |
|
|
| |
|
|
| |
|
|
|
End of period (1) | | $ | 211,932,986 | | | $ | 269,026,846 | | | $ | 410,392,361 | | | $ | 413,267,327 | |
| | |
|
|
| |
|
|
| |
|
|
| |
|
|
|
(1) Including undistributed (distributions in excess of) net investment income | | $ | 9,744 | | | $ | — | | | $ | 108,371 | | | $ | — | |
| | |
|
|
| |
|
|
| |
|
|
| |
|
|
|
See Notes to Financial Statements.
52
| | | | | | | | | | | | | | | | | | | | | | |
| | |
Short-Term Government
Securities Fund
| | | High Yield Fund
| | | Long-Term Tax-Exempt Fund
| |
Year Ended March 31,
| | | Year Ended March 31,
| | | Year Ended March 31,
| |
2005
| | | 2004
| | | 2005
| | | 2004
| | | 2005
| | | 2004
| |
| $ | 11,334,520 | | | $ | 10,940,751 | | | $ | 12,382,052 | | | $ | 14,179,264 | | | $ | 1,807,013 | | | $ | 2,199,992 | |
| | (3,590,260 | ) | | | 1,337,588 | | | | 1,684,436 | | | | (26,899,527 | ) | | | 285,872 | | | | 2,026,982 | |
| | (7,603,787 | ) | | | (3,868,234 | ) | | | (3,437,364 | ) | | | 57,311,938 | | | | (549,586 | ) | | | (1,032,776 | ) |
|
|
| |
|
|
| |
|
|
| |
|
|
| |
|
|
| |
|
|
|
| | 140,473 | | | | 8,410,105 | | | | 10,629,124 | | | | 44,591,675 | | | | 1,543,299 | | | | 3,194,198 | |
|
|
| |
|
|
| |
|
|
| |
|
|
| |
|
|
| |
|
|
|
| | | | | | | | | | | | | | | | | | | | | | | |
| | | | | | | | | | | | | | | | | | | | | | | |
| | (13,634,235 | ) | | | (13,530,916 | ) | | | (10,208,446 | ) | | | (8,984,610 | ) | | | (1,805,611 | ) | | | (2,199,868 | ) |
| | — | | | | — | | | | (1,404,626 | ) | | | (1,882,202 | ) | | | — | | | | — | |
| | — | | | | — | | | | — | | | | — | | | | — | | | | — | |
| | | | | | | | | | | | | | | | | | | | | | | |
| | — | | | | — | | | | — | | | | (2,649,803 | ) | | | — | | | | — | |
| | — | | | | — | | | | — | | | | (510,855 | ) | | | — | | | | — | |
| | — | | | | (1,503,956 | ) | | | — | | | | — | | | | — | | | | — | |
|
|
| |
|
|
| |
|
|
| |
|
|
| |
|
|
| |
|
|
|
| | (13,634,235 | ) | | | (15,034,872 | ) | | | (11,613,072 | ) | | | (14,027,470 | ) | | | (1,805,611 | ) | | | (2,199,868 | ) |
|
|
| |
|
|
| |
|
|
| |
|
|
| |
|
|
| |
|
|
|
| | | | | | | | | | | | | | | | | | | | | | | |
| | (53,206,126 | ) | | | (23,676,320 | ) | | | 5,713,795 | | | | (4,682,644 | ) | | | (9,703,641 | ) | | | (23,176,722 | ) |
| | — | | | | — | | | | (9,399,526 | ) | | | (20,356,959 | ) | | | — | | | | — | |
| | — | | | | — | | | | — | | | | — | | | | — | | | | — | |
|
|
| |
|
|
| |
|
|
| |
|
|
| |
|
|
| |
|
|
|
| | (53,206,126 | ) | | | (23,676,320 | ) | | | (3,685,731 | ) | | | (25,039,603 | ) | | | (9,703,641 | ) | | | (23,176,722 | ) |
|
|
| |
|
|
| |
|
|
| |
|
|
| |
|
|
| |
|
|
|
| | (66,699,888 | ) | | | (30,301,087 | ) | | | (4,669,679 | ) | | | 5,524,602 | | | | (9,965,953 | ) | | | (22,182,392 | ) |
|
|
| |
|
|
| |
|
|
| |
|
|
| |
|
|
| |
|
|
|
| | | | | | | | | | | | | | | | | | | | | | | |
| | 469,217,695 | | | | 499,518,782 | | | | 174,116,747 | | | | 168,592,145 | | | | 72,783,090 | | | | 94,965,482 | |
|
|
| |
|
|
| |
|
|
| |
|
|
| |
|
|
| |
|
|
|
| $ | 402,517,807 | | | $ | 469,217,695 | | | $ | 169,447,068 | | | $ | 174,116,747 | | | $ | 62,817,137 | | | $ | 72,783,090 | |
|
|
| |
|
|
| |
|
|
| |
|
|
| |
|
|
| |
|
|
|
$ |
35,416 |
| | $ | (900 | ) | | $ | (1,124,014 | ) | | $ | (1,621,594 | ) | | $ | 1,526 | | | $ | 124 | |
|
|
| |
|
|
| |
|
|
| |
|
|
| |
|
|
| |
|
|
|
See Notes to Financial Statements.
53
Excelsior Funds
Statements of Changes in Net Assets
| | | | | | | | | | | | | | | | |
| | |
| | | Intermediate-Term
Tax-Exempt Fund
| | | Short-Term Tax-Exempt
Securities Fund
| |
| | | Year Ended March 31,
| | | Year Ended March 31,
| |
| | | 2005
| | | 2004
| | | 2005
| | | 2004
| |
Net investment income | | $ | 9,734,186 | | | $ | 10,391,572 | | | $ | 3,403,244 | | | $ | 3,469,027 | |
Net realized gain (loss) on security transactions | | | 374,010 | | | | 6,421,021 | | | | (389,388 | ) | | | 138,268 | |
Change in unrealized appreciation (depreciation) of investments during the period | | | (10,001,492 | ) | | | (435,500 | ) | | | (3,435,518 | ) | | | 573,155 | |
| | |
|
|
| |
|
|
| |
|
|
| |
|
|
|
Net increase (decrease) in net assets resulting from operations | | | 106,704 | | | | 16,377,093 | | | | (421,662 | ) | | | 4,180,450 | |
| | |
|
|
| |
|
|
| |
|
|
| |
|
|
|
Distributions to shareholders: | | | | | | | | | | | | | | | | |
From net investment income | | | | | | | | | | | | | | | | |
Shares | | | (9,735,305 | ) | | | (10,386,027 | ) | | | (3,408,178 | ) | | | (3,456,342 | ) |
From net realized gain on investments | | | (1,550,278 | ) | | | (13,530,881 | ) | | | (50,253 | ) | | | — | |
| | |
|
|
| |
|
|
| |
|
|
| |
|
|
|
Total distributions | | | (11,285,583 | ) | | | (23,916,908 | ) | | | (3,458,431 | ) | | | (3,456,342 | ) |
| | |
|
|
| |
|
|
| |
|
|
| |
|
|
|
Increase (decrease) in net assets from fund share transactions (Note 5) | | | (26,905,099 | ) | | | (11,938,064 | ) | | | (117,663,509 | ) | | | 68,597,584 | |
| | |
|
|
| |
|
|
| |
|
|
| |
|
|
|
Net increase (decrease) in net assets | | | (38,083,978 | ) | | | (19,477,879 | ) | | | (121,543,602 | ) | | | 69,321,692 | |
| | |
|
|
| |
|
|
| |
|
|
| |
|
|
|
NET ASSETS: | | | | | | | | | | | | | | | | |
Beginning of period | | | 387,623,776 | | | | 407,101,655 | | | | 360,603,637 | | | | 291,281,945 | |
| | |
|
|
| |
|
|
| |
|
|
| |
|
|
|
End of period (1) | | $ | 349,539,798 | | | $ | 387,623,776 | | | $ | 239,060,035 | | | $ | 360,603,637 | |
| | |
|
|
| |
|
|
| |
|
|
| |
|
|
|
(1) Including undistributed net investment income | | $ | 4,425 | | | $ | 5,545 | | | $ | 5,326 | | | $ | 12,685 | |
| | |
|
|
| |
|
|
| |
|
|
| |
|
|
|
See Notes to Financial Statements.
54
| | | | | | | | | | | | | | |
| |
New York Intermediate-Term
Tax-Exempt Fund
| | | California Tax-Exempt
Income Fund
| |
Year Ended March 31,
| | | Year Ended March 31,
| |
2005
| | | 2004
| | | 2005
| | | 2004
| |
| $ | 3,795,659 | | | $ | 4,388,322 | | | $ | 2,022,209 | | | $ | 2,027,620 | |
| | 2,398,438 | | | | 4,269,437 | | | | (311 | ) | | | (664 | ) |
| | (5,684,669 | ) | | | (1,558,337 | ) | | | (1,976,428 | ) | | | (12,855 | ) |
|
|
| |
|
|
| |
|
|
| |
|
|
|
|
509,428 |
| | | 7,099,422 | | | | 45,470 | | | | 2,014,101 | |
|
|
| |
|
|
| |
|
|
| |
|
|
|
| | | | | | | | | | | | | | | |
| | | | | | | | | | | | | | | |
| | (3,794,893 | ) | | | (4,385,426 | ) | | | (2,021,815 | ) | | | (2,026,301 | ) |
| | (1,466,615 | ) | | | (5,786,218 | ) | | | — | | | | — | |
|
|
| |
|
|
| |
|
|
| |
|
|
|
| | (5,261,508 | ) | | | (10,171,644 | ) | | | (2,021,815 | ) | | | (2,026,301 | ) |
|
|
| |
|
|
| |
|
|
| |
|
|
|
| | | | | | | | | | | | | | | |
| | (35,102,085 | ) | | | (6,220,877 | ) | | | (1,968,940 | ) | | | 712,830 | |
|
|
| |
|
|
| |
|
|
| |
|
|
|
| | (39,854,165 | ) | | | (9,293,099 | ) | | | (3,945,285 | ) | | | 700,630 | |
|
|
| |
|
|
| |
|
|
| |
|
|
|
| | | | | | | | | | | | | | | |
| | 178,107,071 | | | | 187,400,170 | | | | 66,894,376 | | | | 66,193,746 | |
|
|
| |
|
|
| |
|
|
| |
|
|
|
| $ | 138,252,906 | | | $ | 178,107,071 | | | $ | 62,949,091 | | | $ | 66,894,376 | |
|
|
| |
|
|
| |
|
|
| |
|
|
|
| $ | 2,760 | | | $ | 2,025 | | | $ | 1,659 | | | $ | 1,264 | |
|
|
| |
|
|
| |
|
|
| |
|
|
|
See Notes to Financial Statements.
55
Excelsior Funds
Financial Highlights — Selected Per Share Data and Ratios
| | | | | | | | | | | | | | | | | | | | | | | | | | | |
| | | | | | | |
| | | Net Asset Value
Beginning of
Period
| | Net
Investment
Income
| | | Net Realized and
Unrealized Gain (Loss)
on Investments
| | | Total From
Investment
Operations
| | | Distributions
From Net
Investment
Income
| | | Distributions From
Net Realized Gain
on Investments
| | | Total
Distributions
| |
MANAGED INCOME FUND | | | | | | | | | | | | | | | | | | | | | |
Shares — (01/09/86*) | | | | | | | | | | | | | | | | | | | | | | | | | | | |
Year Ended March 31, | | | | | | | | | | | | | | | | | | | | | | | | | | | |
2005 | | $ | 9.43 | | $ | 0.37 | (2) | | $ | (0.23 | ) | | $ | 0.14 | | | $ | (0.37 | ) | | $ | (0.05 | ) | | $ | (0.42 | ) |
2004 | | | 9.43 | | | 0.38 | | | | 0.14 | | | | 0.52 | | | | (0.38 | ) | | | (0.14 | ) | | | (0.52 | ) |
2003 | | | 8.95 | | | 0.47 | | | | 0.50 | | | | 0.97 | | | | (0.48 | ) | | | (0.01 | ) | | | (0.49 | ) |
2002 | | | 9.11 | | | 0.49 | | | | (0.10 | ) | | | 0.39 | | | | (0.50 | ) | | | (0.05 | ) | | | (0.55 | ) |
2001 | | | 8.55 | | | 0.50 | | | | 0.56 | | | | 1.06 | | | | (0.50 | ) | | | — | | | | (0.50 | ) |
INTERMEDIATE-TERM MANAGED INCOME FUND | | | | | | | | | | | | | | | | | |
Shares — (12/31/92*) | | | | | | | | | | | | | | | | | | | | | | | | | | | |
Year Ended March 31, | | | | | | | | | | | | | | | | | | | | | | | | | | | |
2005 | | $ | 7.40 | | $ | 0.26 | (2) | | $ | (0.22 | ) | | $ | 0.03 | | | $ | (0.26 | ) | | $ | (0.01 | ) | | $ | (0.27 | ) |
2004 | | | 7.39 | | | 0.26 | | | | 0.11 | | | | 0.37 | | | | (0.26 | ) | | | (0.10 | ) | | | (0.36 | ) |
2003 | | | 7.10 | | | 0.37 | | | | 0.36 | | | | 0.73 | | | | (0.40 | ) | | | (0.04 | ) | | | (0.44 | ) |
2002 | | | 7.18 | | | 0.39 | | | | (0.06 | ) | | | 0.33 | | | | (0.39 | ) | | | (0.02 | ) | | | (0.41 | ) |
2001 | | | 6.77 | | | 0.42 | | | | 0.41 | | | | 0.83 | | | | (0.42 | ) | | | — | | | | (0.42 | ) |
SHORT-TERM GOVERNMENT SECURITIES FUND | | | | | | | | | | | | | | | | | |
Shares — (12/31/92*) | | | | | | | | | | | | | | | | | | | | | | | | | | | |
Year Ended March 31, | | | | | | | | | | | | | | | | | | | | | | | | | | | |
2005 | | $ | 7.22 | | $ | 0.18 | (2) | | $ | (0.18 | ) | | | — | | | $ | (0.22 | ) | | | — | | | $ | (0.22 | ) |
2004 | | | 7.31 | | | 0.16 | | | | (0.03 | ) | | $ | 0.13 | | | | (0.20 | ) | | $ | (0.02 | ) | | | (0.22 | ) |
2003 | | | 7.11 | | | 0.26 | | | | 0.25 | | | | 0.51 | | | | (0.26 | ) | | | (0.05 | ) | | | (0.31 | ) |
2002 | | | 7.09 | | | 0.33 | | | | 0.05 | | | | 0.38 | | | | (0.34 | ) | | | (0.02 | ) | | | (0.36 | ) |
2001 | | | 6.87 | | | 0.39 | | | | 0.22 | | | | 0.61 | | | | (0.39 | ) | | | — | | | | (0.39 | ) |
HIGH YIELD FUND | | | | | | | | | | | | | | | | | | | | | |
Shares — (10/31/00*) | | | | | | | | | | | | | | | | | | | | | | | | | | | |
Year Ended March 31, | | | | | | | | | | | | | | | | | | | | | | | | | | | |
2005 | | $ | 4.71 | | $ | 0.34 | (2) | | $ | (0.08 | ) | | $ | 0.26 | | | $ | (0.30 | ) | | | — | | | $ | (0.30 | ) |
2004 | | | 3.99 | | | 0.35 | (2) | | | 0.71 | (2) | | | 1.06 | | | | (0.34 | )(3) | | | — | | | | (0.34 | ) |
2003 | | | 6.20 | | | 0.88 | (2) | | | (1.54 | )(2) | | | (0.66 | ) | | | (1.55 | )(4) | | | — | | | | (1.55 | ) |
2002 | | | 7.26 | | | 1.08 | | | | (1.01 | ) | | | 0.07 | | | | (1.09 | ) | | $ | (0.04 | ) | | | (1.13 | ) |
2001 | | | 7.00 | | | 0.27 | | | | 0.26 | | | | 0.53 | | | | (0.27 | ) | | | — | | | | (0.27 | ) |
* Commencement of Operations.
| (1) | Expense ratios before waiver to fees and reimbursement of expenses by adviser and administrator. |
| (2) | For comparative purposes per share amounts are based on average shares outstanding. |
| (3) | Includes a tax return of capital of $(0.08). |
| (4) | Includes a tax return of capital of $(0.51). |
See Notes to Financial Statements.
56
| | | | | | | | | | | | | | | | | | | | | | | |
| | | | | | | |
Net Asset Value,
End of Period
| | Total
Return
| | | Net Assets, End
of Period (000’s)
| | Ratio of Net
Operating Expenses
to Average
Net Assets
| | | Ratio of Gross
Operating Expenses
to Average
Net Assets (1)
| | | Ratio of Net
Investement
Income to
Average Net Assets
| | | Portfolio
Turnover
Rate
| | | Fee
Waivers
(Note 2)
| |
| | | | | | | | | | | | | | | | | | |
| | | | | | | | | | | | | | | | | | | | | | | | |
| | | | | | | | | | | | | | | | | | | | | | | | |
| $ | 9.15 | | 1.55 | % | | $ | 211,932 | | 0.90 | % | | 1.27 | % | | 3.99 | % | | 90 | % | | $ | 0.03 | (2) |
| | 9.43 | | 5.74 | % | | | 269,027 | | 0.87 | % | | 1.11 | % | | 4.06 | % | | 84 | % | | | 0.02 | |
| | 9.43 | | 11.07 | % | | | 293,182 | | 0.84 | % | | 0.95 | % | | 5.10 | % | | 120 | % | | | 0.01 | |
| | 8.95 | | 4.34 | % | | | 247,804 | | 0.87 | % | | 1.04 | % | | 5.39 | % | | 129 | % | | | 0.02 | |
| | 9.11 | | 12.80 | % | | | 252,173 | | 0.88 | % | | 1.01 | % | | 5.81 | % | | 99 | % | | | 0.01 | |
| | | | | | | | | | | | | | | | | | | | | | | | |
| | | | | | | | | | | | | | | | | | | | | | | | |
| | | | | | | | | | | | | | | | | | | | | | | | |
| $ | 7.16 | | 0.45 | % | | $ | 410,392 | | 0.60 | % | | 0.81 | % | | 3.53 | % | | 59 | % | | $ | 0.02 | (2) |
| | 7.40 | | 5.25 | % | | | 413,267 | | 0.56 | % | | 0.69 | % | | 3.56 | % | | 85 | % | | | 0.01 | |
| | 7.39 | | 10.50 | % | | | 404,627 | | 0.53 | % | | 0.69 | % | | 4.56 | % | | 98 | % | | | 0.01 | |
| | 7.10 | | 4.60 | % | | | 273,267 | | 0.52 | % | | 0.69 | % | | 5.47 | % | | 117 | % | | | 0.01 | |
| | 7.18 | | 12.73 | % | | | 219,600 | | 0.56 | % | | 0.69 | % | | 6.11 | % | | 108 | % | | | 0.01 | |
| | | | | | | | | | | | | | | | | | |
| | | | | | | | | | | | | | | | | | | | | | | | |
| | | | | | | | | | | | | | | | | | | | | | | | |
| $ | 7.00 | | 0.01 | % | | $ | 402,518 | | 0.60 | % | | 0.79 | % | | 2.57 | % | | 106 | % | | $ | 0.01 | (2) |
| | 7.22 | | 1.90 | % | | | 469,218 | | 0.53 | % | | 0.67 | % | | 2.26 | % | | 231 | % | | | 0.01 | |
| | 7.31 | | 7.27 | % | | | 499,519 | | 0.49 | % | | 0.64 | % | | 3.22 | % | | 170 | % | | | 0.01 | |
| | 7.11 | | 5.35 | % | | | 193,780 | | 0.51 | % | | 0.61 | % | | 4.33 | % | | 75 | % | | | 0.01 | |
| | 7.09 | | 9.14 | % | | | 75,694 | | 0.57 | % | | 0.67 | % | | 5.59 | % | | 118 | % | | | 0.01 | |
| | | | | | | | | | | | | | | | | | |
| | | | | | | | | | | | | | | | | | | | | | | | |
| | | | | | | | | | | | | | | | | | | | | | | | |
| $ | 4.67 | | 5.54 | % | | $ | 156,139 | | 1.04 | % | | 1.30 | % | | 6.50 | % | | 70 | % | | $ | 0.01 | (2) |
| | 4.71 | | 27.45 | % | | | 151,476 | | 1.05 | % | | 1.36 | % | | 7.79 | % | | 170 | % | | | 0.01 | |
| | 3.99 | | (10.49 | )% | | | 131,342 | | 1.08 | % | | 1.35 | % | | 18.06 | % | | 153 | % | | | 0.01 | |
| | 6.20 | | 1.27 | % | | | 172,890 | | 1.03 | % | | 1.35 | % | | 17.56 | % | | 310 | % | | | 0.02 | |
| | 7.26 | | 7.76 | %(5) | | | 57,670 | | 1.05 | %(6) | | 1.55 | %(6) | | 9.43 | %(6) | | 169 | %(6) | | | 0.01 | |
See Notes to Financial Statements.
57
Excelsior Funds
Financial Highlights — Selected Per Share Data and Ratios
| | | | | | | | | | | | | | | | | | | | | | | | | | |
| | | | | | | |
| | | Net Asset Value
Beginning of
Period
| | Net
Investment
Income
| | | Net Realized and
Unrealized Gain (Loss)
on Investments
| | | Total From
Investment
Operations
| | Distributions From Net
Investment
Income
| | | Distributions From
Net Realized Gain
on Investments
| | | Total
Distributions
| |
LONG-TERM TAX-EXEMPT FUND | |
Shares — (02/05/86*) | | | | | | | | | | | | | | | | | | | | | | | | | | |
Year Ended March 31, | | | | | | | | | | | | | | | | | | | | | | | | | | |
2005 | | $ | 10.08 | | $ | 0.27 | (2) | | $ | (0.01 | ) | | $ | 0.27 | | $ | (0.28 | ) | | | — | | | $ | (0.28 | ) |
2004 | | | 9.95 | | | 0.26 | | | | 0.13 | | | | 0.39 | | | (0.26 | ) | | | — | | | | (0.26 | ) |
2003 | | | 9.48 | | | 0.29 | | | | 0.47 | | | | 0.76 | | | (0.29 | ) | | | — | | | | (0.29 | ) |
2002 | | | 9.62 | | | 0.36 | | | | (0.14 | ) | | | 0.22 | | | (0.36 | ) | | | — | | | | (0.36 | ) |
2001 | | | 8.99 | | | 0.40 | | | | 0.63 | | | | 1.03 | | | (0.40 | ) | | | — | | | | (0.40 | ) |
INTERMEDIATE-TERM TAX-EXEMPT FUND | |
Shares — (12/03/85*) | | | | | | | | | | | | | | | | | | | | | | | | | | |
Year Ended March 31, | | | | | | | | | | | | | | | | | | | | | | | | | | |
2005 | | $ | 9.69 | | $ | 0.26 | (2) | | $ | (0.24 | ) | | $ | 0.02 | | $ | (0.26 | ) | | $ | (0.04 | ) | | $ | (0.30 | ) |
2004 | | | 9.88 | | | 0.26 | | | | 0.15 | | | | 0.41 | | | (0.26 | ) | | | (0.34 | ) | | | (0.60 | ) |
2003 | | | 9.39 | | | 0.31 | | | | 0.55 | | | | 0.86 | | | (0.31 | ) | | | (0.06 | ) | | | (0.37 | ) |
2002 | | | 9.57 | | | 0.35 | | | | (0.12 | ) | | | 0.23 | | | (0.35 | ) | | | (0.06 | ) | | | (0.41 | ) |
2001 | | | 9.06 | | | 0.38 | | | | 0.51 | | | | 0.89 | | | (0.38 | ) | | | — | | | | (0.38 | ) |
SHORT-TERM TAX-EXEMPT SECURITIES FUND | |
Shares — (12/31/92*) | | | | | | | | | | | | | | | | | | | | | | | | | | |
Year Ended March 31, | | | | | | | | | | | | | | | | | | | | | | | | | | |
2005 | | $ | 7.22 | | $ | 0.09 | (2) | | $ | (0.09 | ) | | | — | | $ | (0.09 | ) | | | — | (3) | | $ | (0.09 | ) |
2004 | | | 7.20 | | | 0.08 | | | | 0.02 | | | $ | 0.10 | | | (0.08 | ) | | | — | | | | (0.08 | ) |
2003 | | | 7.17 | | | 0.12 | | | | 0.03 | | | | 0.15 | | | (0.12 | ) | | | — | | | | (0.12 | ) |
2002 | | | 7.15 | | | 0.20 | | | | 0.03 | | | | 0.23 | | | (0.20 | ) | | $ | (0.01 | ) | | | (0.21 | ) |
2001 | | | 7.02 | | | 0.28 | | | | 0.13 | | | | 0.41 | | | (0.28 | ) | | | — | | | | (0.28 | ) |
NEW YORK INTERMEDIATE-TERM TAX-EXEMPT FUND | |
Shares — (05/31/90*) | | | | | | | | | | | | | | | | | | | | | | | | | | |
Year Ended March 31, | | | | | | | | | | | | | | | | | | | | | | | | | | |
2005 | | $ | 8.97 | | $ | 0.22 | (2) | | $ | (0.17 | ) | | $ | 0.05 | | $ | (0.22 | ) | | $ | (0.09 | ) | | $ | (0.31 | ) |
2004 | | | 9.12 | | | 0.22 | | | | 0.14 | | | | 0.36 | | | (0.22 | ) | | | (0.29 | ) | | | (0.51 | ) |
2003 | | | 8.74 | | | 0.27 | | | | 0.51 | | | | 0.78 | | | (0.27 | ) | | | (0.13 | ) | | | (0.40 | ) |
2002 | | | 8.83 | | | 0.31 | | | | (0.09 | ) | | | 0.22 | | | (0.31 | ) | | | — | | | | (0.31 | ) |
2001 | | | 8.34 | | | 0.33 | | | | 0.49 | | | | 0.82 | | | (0.33 | ) | | | — | | | | (0.33 | ) |
CALIFORNIA TAX-EXEMPT INCOME FUND | |
Shares — (10/01/96*) | | | | | | | | | | | | | | | | | | | | | | | | | | |
Year Ended March 31, | | | | | | | | | | | | | | | | | | | | | | | | | | |
2005 | | $ | 7.49 | | $ | 0.23 | (2) | | $ | (0.22 | ) | | $ | 0.01 | | $ | (0.23 | ) | | | — | | | $ | (0.23 | ) |
2004 | | | 7.49 | | | 0.24 | | | | — | | | | 0.24 | | | (0.24 | ) | | | — | | | | (0.24 | ) |
2003 | | | 7.27 | | | 0.25 | | | | 0.22 | | | | 0.47 | | | (0.25 | ) | | | — | (3) | | | (0.25 | ) |
2002 | | | 7.30 | | | 0.26 | | | | (0.02 | ) | | | 0.24 | | | (0.26 | ) | | $ | (0.01 | ) | | | (0.27 | ) |
2001 | | | 7.07 | | | 0.26 | | | | 0.23 | | | | 0.49 | | | (0.26 | ) | | | — | | | | (0.26 | ) |
* Commencement of Operations.
| (1) | Expense ratios before waiver of fees and reimbursement of expenses by adviser and administrator. |
| (2) | For comparative purposes, per share amounts are based on average shares outstanding. |
| (3) | Amount represents less than $0.01 per share. |
See Notes to Financial Statements.
58
| | | | | | | | | | | | | | | | | | | | | | | |
| | | | | | | |
Net Asset Value,
End of Period
| | Total
Return
| | | Net Assets, End
of Period (000’s)
| | Ratio of Net
Operating Expenses
to Average
Net Assets
| | | Ratio of Gross
Operating Expenses
to Average
Net Assets (1)
| | | Ratio of Net
Investment
Income to
Average Net Assets
| | | Portfolio
Turnover
Rate
| | | Fee
Waivers
(Note 2)
| |
| | | | | | | | | | | | | | | | | | | | | | | | |
| | | | | | | | | | | | | | | | | | | | | | | | |
| | | | | | | | | | | | | | | | | | | | | | | | |
| $ | 10.07 | | 2.68 | % | | $ | 62,817 | | 0.80 | % | | 1.05 | % | | 2.74 | % | | 87 | % | | $ | 0.03 | (2) |
| | 10.08 | | 4.01 | % | | | 72,783 | | 0.73 | % | | 0.80 | % | | 2.64 | % | | 111 | % | | | 0.01 | |
| | 9.95 | | 8.12 | % | | | 94,965 | | 0.70 | % | | 0.77 | % | | 2.99 | % | | 51 | % | | | 0.01 | |
| | 9.48 | | 2.29 | % | | | 115,178 | | 0.72 | % | | 0.82 | % | | 3.66 | % | | 35 | % | | | 0.01 | |
| | 9.62 | | 11.69 | % | | | 135,515 | | 0.77 | % | | 0.83 | % | | 4.33 | % | | 60 | % | | | 0.01 | |
| | | | | | | | | | | | | | | | | | | | | | | | |
| | | | | | | | | | | | | | | | | | | | | | | | |
| | | | | | | | | | | | | | | | | | | | | | | | |
| $ | 9.41 | | 0.20 | % | | $ | 349,540 | | 0.65 | % | | 0.81 | % | | 2.69 | % | | — | | | $ | 0.02 | (2) |
| | 9.69 | | 4.19 | % | | | 387,624 | | 0.56 | % | | 0.63 | % | | 2.60 | % | | 31 | % | | | 0.01 | |
| | 9.88 | | 9.31 | % | | | 407,102 | | 0.51 | % | | 0.59 | % | | 3.15 | % | | 48 | % | | | 0.01 | |
| | 9.39 | | 2.41 | % | | | 370,018 | | 0.52 | % | | 0.64 | % | | 3.67 | % | | 67 | % | | | 0.01 | |
| | 9.57 | | 10.07 | % | | | 341,170 | | 0.57 | % | | 0.64 | % | | 4.17 | % | | 84 | % | | | 0.01 | |
| | | | | | | | | | | | | | | | | | | | | | | | |
| | | | | | | | | | | | | | | | | | | | | | | | |
| | | | | | | | | | | | | | | | | | | | | | | | |
| $ | 7.13 | | (0.01 | )% | | $ | 239,060 | | 0.60 | % | | 0.76 | % | | 1.21 | % | | 10 | % | | $ | 0.01 | (2) |
| | 7.22 | | 1.40 | % | | | 360,604 | | 0.47 | % | | 0.59 | % | | 1.12 | % | | 99 | % | | | 0.01 | |
| | 7.20 | | 2.04 | % | | | 291,282 | | 0.46 | % | | 0.58 | % | | 1.57 | % | | 31 | % | | | 0.01 | |
| | 7.17 | | 3.20 | % | | | 165,690 | | 0.48 | % | | 0.55 | % | | 2.60 | % | | 111 | % | | | 0.01 | |
| | 7.15 | | 5.94 | % | | | 83,336 | | 0.58 | % | | 0.65 | % | | 3.97 | % | | 42 | % | | | — | |
| | | | | | | | | | | | | | | | | | | | | | | | |
| | | | | | | | | | | | | | | | | | | | | | | | |
| | | | | | | | | | | | | | | | | | | | | | | | |
| $ | 8.71 | | 0.52 | % | | $ | 138,253 | | 0.80 | % | | 0.98 | % | | 2.46 | % | | 15 | % | | $ | 0.02 | (2) |
| | 8.97 | | 4.06 | % | | | 178,107 | | 0.68 | % | | 0.73 | % | | 2.41 | % | | 42 | % | | | — | (3) |
| | 9.12 | | 8.96 | % | | | 187,400 | | 0.67 | % | | 0.72 | % | | 2.96 | % | | 43 | % | | | — | (3) |
| | 8.74 | | 2.54 | % | | | 178,608 | | 0.67 | % | | 0.72 | % | | 3.53 | % | | 45 | % | | | — | |
| | 8.83 | | 10.02 | % | | | 144,421 | | 0.73 | % | | 0.75 | % | | 3.90 | % | | 39 | % | | | — | |
| | | | | | | | | | | | | | | | | | | | | | | | |
| | | | | | | | | | | | | | | | | | | | | | | | |
| | | | | | | | | | | | | | | | | | | | | | | | |
| $ | 7.27 | | 0.20 | % | | $ | 62,949 | | 0.50 | % | | 1.05 | % | | 3.18 | % | | 10 | % | | $ | 0.04 | (2) |
| | 7.49 | | 3.19 | % | | | 66,894 | | 0.50 | % | | 0.90 | % | | 3.14 | % | | 15 | % | | | 0.03 | |
| | 7.49 | | 6.59 | % | | | 66,194 | | 0.46 | % | | 0.50 | % | | 3.36 | % | | 9 | % | | | — | (3) |
| | 7.27 | | 3.32 | % | | | 58,230 | | 0.50 | % | | 0.87 | % | | 3.55 | % | | 4 | % | | | 0.03 | |
| | 7.30 | | 7.09 | % | | | 54,605 | | 0.50 | % | | 0.97 | % | | 3.69 | % | | 6 | % | | | 0.03 | |
See Notes to Financial Statements.
59
EXCELSIOR FUNDS
NOTES TO FINANCIAL STATEMENTS
1. Significant Accounting Policies:
Excelsior Funds, Inc. (“Excelsior Fund”) was incorporated under the laws of the State of Maryland on August 2, 1984. Excelsior Tax-Exempt Funds, Inc. (“Excelsior Tax-Exempt Fund”) was incorporated under the laws of the State of Maryland on August 8, 1984. Excelsior Funds Trust (the “Trust”) is a statutory trust organized under the laws of the State of Delaware on April 27, 1994. Excelsior Fund, Excelsior Tax-Exempt Fund and the Trust are registered under the Investment Company Act of 1940 (the “1940 Act”), as amended, as open-ended diversified management investment companies with the exception of New York Intermediate-Term Tax-Exempt Fund, California Tax-Exempt Income Fund, New York Tax-Exempt Money Fund, Energy and Natural Resources Fund and Real Estate Fund, each of which are non-diversified.
Excelsior Fund, Excelsior Tax-Exempt Fund and the Trust currently offer shares in fifteen, seven and seven managed investment portfolios, respectively, each having its own investment objectives and policies. The following is a summary of significant accounting policies for Managed Income Fund, Intermediate-Term Managed Income Fund and Short-Term Government Securities Fund, portfolios of Excelsior Fund, Long-Term Tax-Exempt Fund, Intermediate-Term Tax-Exempt Fund, Short-Term Tax-Exempt Securities Fund, New York Intermediate-Term Tax-Exempt Fund and California Tax-Exempt Income Fund, portfolios of Excelsior Tax-Exempt Fund, and High Yield Fund, a portfolio of the Trust (collectively, the “Funds”). Such policies are in conformity with accounting principles generally accepted in the United States of America and are consistently followed by Excelsior Fund, Excelsior Tax-Exempt Fund and the Trust in the preparation of their financial statements. The preparation of financial statements requires management to make estimates and assumptions that affect the reported amounts and disclosures in the financial statements. Actual results could differ from these estimates.
The High Yield Fund offers two classes of shares: Shares and Institutional Shares. The Managed Income Fund offers two classes of shares: Shares and Retirement Shares. The Financial Highlights of the Institutional Shares and Retirement Shares as well as the financial statements for the remaining portfolios of Excelsior Fund, Excelsior Tax-Exempt Fund and the Trust are presented separately.
(a) Portfolio valuation:
Investments in securities that are traded on recognized domestic and foreign stock exchanges are valued at the last sale price on the exchange on which such securities are primarily traded or at the last quoted sale price on a national securities market. Securities traded over-the-counter are valued each business day on the basis of closing over-the-counter bid prices. Securities for which there were no transactions are valued at the last quoted sales price for the most recent day such prices were available. Short-term debt instruments that mature in 60 days or less are valued at amortized cost, which approximates market value. The amortized cost method values a security at its cost at the time of purchase (or at its market value 61 days before maturity) and thereafter assumes a constant amortization to maturity of any bond premium or discount. Securities and other assets for which market quotations are not readily available are valued in good faith at fair value pursuant to procedures adopted by the Board of Directors with regard to Excelsior Fund and Excelsior Tax-Exempt Fund and the Board of Trustees with regard to the Trust.
60
Investments in securities that are primarily traded on foreign securities exchanges are generally valued at the preceding closing values of such securities on their respective exchanges, except that when a significant event has occurred subsequent to the close of such foreign exchange and prior to the time at which the Fund’s net asset value is determined, then such securities are valued in good faith at fair value in accordance with procedures adopted by the Board of Directors with regard to Excelsior Fund and the Board of Trustees with regard to the Trust.
Investment valuations and other assets and liabilities initially expressed in foreign currencies are converted each business day into U.S. dollars based upon current exchange rates. Purchases and sales of foreign investments and income and expenses are converted into U.S. dollars based upon currency exchange rates prevailing on the respective dates of such transactions. The Funds do not isolate the portion of gains and losses on investment securities that is due to changes in foreign exchange rates from that which is due to changes in market prices of such securities. The Funds report gains and losses on foreign currency related transactions as realized and unrealized gains and losses for financial reporting purposes, whereas such components are treated as ordinary income or loss for Federal income tax purposes.
(b) Concentration of risks:
The High Yield Fund is subject to special risks associated with investments in high yield bonds, which involve greater risk of default or downgrade and are more volatile than investment grade securities due to actual or perceived changes in an issuer’s creditworthiness. In addition, issuers of high yield bonds may be more susceptible than other issuers to economic downturns. High yield bonds are subject to the risk that the issuer may not be able to pay interest or dividends and ultimately repay principal upon maturity. Discontinuation of these payments could adversely affect the market value of the security.
At March 31, 2005, approximately, 96% of the net assets of the New York Intermediate-Term Tax-Exempt Fund is invested in New York municipal securities and 95% of the net assets of the California Tax-Exempt Income Fund is invested in California municipal securities. Economic changes affecting the states and certain of its public bodies and municipalities may affect the ability of issuers to pay the required principal and interest payments of the municipal securities.
(c) Security transactions and investment income:
Security transactions are recorded on a trade date basis. Realized gains and losses on investments sold are recorded on the basis of identified cost. Interest income, adjusted for amortization of premiums and, when appropriate, discounts on investments, is earned from settlement date and is recorded on the accrual basis. Dividend income is recorded on the ex-dividend date, except for certain dividends from foreign securities, which are recorded as soon as the Funds are informed of the dividend.
(d) Repurchase agreements:
The Funds may purchase portfolio securities from financial institutions deemed to be creditworthy by the investment adviser subject to the seller’s agreement to repurchase and the Funds’ agreement to resell such securities at mutually agreed upon prices. Securities purchased
61
subject to such repurchase agreements are deposited with the Funds’ custodian or sub-custodian or are maintained in the Federal Reserve/Treasury book-entry system and must have, at all times, an aggregate market value not less than the repurchase price (including accrued interest).
Default or bankruptcy of the seller may, however, expose the applicable Fund to possible delay in connection with the disposition of the securities or loss to the extent that proceeds from a sale of the underlying securities were less than the repurchase price under the agreement.
(e) TBA purchase commitments:
The Managed Income Fund, Intermediate-Term Managed Income Fund and Short-Term Government Securities Fund may enter into “TBA” (To Be Announced) purchase commitments to purchase securities for a fixed price at a future date, typically not exceeding 45 days. TBA purchase commitments may be considered securities in themselves, and involve risk of loss if the value of the security to be purchased declines prior to settlement date. The Funds must maintain liquid securities having a value not less than the purchase price (including accrued interest) for such purchase commitments. Unsettled TBA purchase commitments are valued at the current market value of the underlying securities, according to the procedures described under “Portfolio Valuation” above.
(f) Mortgage dollar rolls:
The Funds may enter into mortgage dollar rolls (principally in securities referred to as TBA, (see note 1(e)) in which the Funds sell mortgage securities for delivery in the current month and simultaneously contract to repurchase similar, but not identical, securities at an agreed upon price on a fixed date. The Funds account for such dollar rolls as repurchases and sales and receive compensation in consideration for entering into the commitment to repurchase. The Funds must maintain liquid securities having a value not less that the repurchase price (including accrued interest) for such dollar rolls. The market value of the securities that the Funds are required to repurchase may decline below the agreed upon repurchase price of those securities.
(g) Distributions to shareholders:
Dividends from net investment income are declared daily and paid monthly. Net realized capital gains, unless offset by any available capital loss carryforward, are distributed at least annually. Dividends and distributions are recorded on the ex-dividend date.
(h) Expense allocation:
Expenses directly attributable to a Fund are charged to that Fund. Other expenses are allocated to the respective Fund based on average daily net assets. Expenses attributable to a specific class of shares, such as shareholder servicing fees, are charged directly to that class.
2. Investment Advisory Fee, Administration Fee, Shareholder Servicing Fees and Related Party Transactions:
United States Trust Company of New York (“U.S. Trust NY”) and U.S. Trust Company, N.A. (together, the “Adviser” or “U.S. Trust”), acting through their respective registered investment advisory divisions, U.S. Trust NY Asset Management Division and U.S. Trust Company, N.A. Asset Management
62
Division, serve as the investment adviser to the Funds. For the services provided pursuant to the Investment Advisory Agreements, the Adviser receives a fee, computed daily and paid monthly, as follows:
| | | |
Managed Income Fund | | 0.75 | % |
Intermediate-Term Managed Income Fund | | 0.35 | % |
Short-Term Government Securities Fund | | 0.30 | % |
High Yield Fund | | 0.80 | % |
Long-Term Tax-Exempt Fund | | 0.50 | % |
Intermediate-Term Tax-Exempt Fund | | 0.35 | % |
Short-Term Tax-Exempt Securities Fund | | 0.30 | % |
New York Intermediate-Term Tax-Exempt Fund | | 0.50 | % |
California Tax-Exempt Income Fund | | 0.50 | % |
U.S. Trust NY is a state-chartered bank and trust company and a member bank of the Federal Reserve System. U.S. Trust Company, N.A. is a national bank organized under the laws of the United States. Each is a wholly-owned subsidiary of U.S. Trust Corporation, a registered bank holding company. U.S. Trust Corporation is a wholly-owned subsidiary of The Charles Schwab Corporation (“Schwab”).
U.S. Trust Company, N.A., and BISYS Fund Services Ohio, Inc. (collectively, the “Administrators”) provide administrative services to the Funds. For the services provided to the Funds, the Administrators are entitled jointly to annual fees, computed daily and paid monthly, based on the combined aggregate average daily net assets of Excelsior Fund, Excelsior Tax-Exempt Fund and the Trust (excluding the international equity portfolios of Excelsior Fund and the Trust), all of which are affiliated investment companies, as follows: 0.200% of the first $200 million, 0.175% of the next $200 million and 0.150% over $400 million. The Administrators are entitled jointly to annual fees, computed daily and paid monthly, at the annual rate of 0.20% of the average daily net assets of the International Equity Fund, International Fund, Pacific/Asia Fund and Emerging Markets Fund. Administration fees payable by each Fund of the three investment companies are determined in proportion to the relative average daily net assets of the respective Funds for the period paid. For the five month period ended August 31, 2004, U.S. Trust Company, N.A. voluntarily agreed to waive a portion of its administration fee in an amount equal to an annual rate of 0.04% of the average daily net assets of each Fund. For the year ended March 31, 2005, administration fees charged by U.S. Trust Company, N.A. were as follows:
| | | | | | | | | | |
| | | Administration
Fees
| | Waiver
Administration
Fees
| | | Net
Administration
Fees
|
Managed Income Fund | | $ | 399,281 | | $ | (43,265 | ) | | $ | 356,016 |
Intermediate-Term Managed Income Fund | | | 597,889 | | | (65,368 | ) | | | 532,521 |
Short-Term Government Securities Fund | | | 665,654 | | | (75,529 | ) | | | 590,125 |
High Yield Fund | | | 280,116 | | | (29,194 | ) | | | 250,922 |
Long-Term Tax-Exempt Fund | | | 99,562 | | | (11,284 | ) | | | 88,278 |
Intermediate-Term Tax-Exempt Fund | | | 546,216 | | | (61,864 | ) | | | 484,352 |
Short-Term Tax-Exempt Securities Fund | | | 426,960 | | | (51,897 | ) | | | 375,063 |
New York Intermediate-Term Tax-Exempt Fund | | | 233,154 | | | (27,280 | ) | | | 205,874 |
California Tax-Exempt Income Fund | | | 96,272 | | | (28,478 | ) | | | 67,794 |
63
From time to time, in its sole discretion, U.S. Trust may undertake to waive a portion or all of the fees payable to it and may also reimburse the Funds for a portion of other expenses. For the year ended March 31, 2005, U.S. Trust has contractually agreed to waive investment advisory fees and to reimburse other ordinary operating expenses to the extent necessary to keep total operating expenses from exceeding the following annual percentages of each Fund’s average daily net assets:
| | | |
Managed Income Fund — Shares | | 0.90 | % |
Intermediate-Term Managed Income Fund — Shares | | 0.65 | % |
Short-Term Government Securities Fund — Shares | | 0.60 | % |
High Yield Fund — Shares | | 1.05 | % |
Long-Term Tax-Exempt Fund — Shares | | 0.80 | % |
Intermediate-Term Tax-Exempt Fund — Shares | | 0.65 | % |
Short-Term Tax-Exempt Securities Fund — Shares | | 0.60 | % |
New York Intermediate-Term Tax-Exempt Fund — Shares | | 0.80 | % |
California Tax-Exempt Income Fund — Shares | | 0.50 | % |
High Yield Fund — Institutional Shares | | 0.80 | % |
Managed Income Fund — Retirement Shares | | 1.40 | % |
For the year ended March 31, 2005, pursuant to the above, investment advisory fees waived by U.S. Trust were as follows:
| | | | |
Managed Income Fund | | $ | (912,503 | ) |
Intermediate-Term Managed Income Fund | | | (752,670 | ) |
Short-Term Government Securities Fund | | | (703,376 | ) |
High Yield Fund | | | (451,580 | ) |
Long-Term Tax-Exempt Fund | | | (145,612 | ) |
Intermediate-Term Tax-Exempt Fund | | | (501,508 | ) |
Short-Term Tax-Exempt Securities Fund | | | (371,474 | ) |
New York Intermediate-Term Tax-Exempt Fund | | | (228,828 | ) |
California Tax-Exempt Income Fund | | | (309,048 | ) |
The Funds have entered into shareholder servicing agreements with various service organizations, which include Charles Schwab & Co. Inc. (“CS & Co.”) and U.S. Trust. Services included in the servicing agreements are assisting in processing purchase, exchange and redemption requests; transmitting and receiving funds in connection with customer orders to purchase, exchange or redeem shares; and providing periodic statements. Shareholder servicing fees are incurred on a Fund or class level (where applicable). In consideration for these services, each service organization receives a fee, computed daily and paid monthly, at an annual rate up to 0.25% of the average daily net assets of the Funds’ shares held by each service organizations’ customers. The Adviser, out of its own resources, may additionally compensate certain organizations for providing these services.
64
For the year ended March 31, 2005, shareholder servicing fees paid to CS & Co. and U.S. Trust were as follows:
| | | |
Managed Income Fund | | $ | 565,074 |
Intermediate-Term Managed Income Fund | | | 948,257 |
Short-Term Government Securities Fund | | | 997,890 |
High Yield Fund | | | 361,159 |
Long-Term Tax-Exempt Fund | | | 147,258 |
Intermediate-Term Tax-Exempt Fund | | | 863,787 |
Short-Term Tax-Exempt Securities Fund | | | 691,681 |
New York Intermediate-Term Tax-Exempt Fund | | | 372,282 |
California Tax-Exempt Income Fund | | | 154,220 |
Effective January 1, 2005, BISYS Fund Services Limited Partnership became the Distributor for the Funds. Prior to January 1, 2005, Edgewood Services, Inc. (a wholly-owned subsidiary of Federated Investors, Inc.), served as the Distributor of the Funds. Shares of each Fund are sold without a sales charge on a continuous basis by the Distributor.
Certain Funds have adopted a Distribution Plan pursuant to Rule 12b-1 under the 1940 Act, under which they may compensate the Distributor monthly for its services that are intended to result in the sale of Fund Shares (in the case of High Yield Fund) or Retirement Shares (in the case of Managed Income Fund), in an amount not to exceed the annual rate of 0.25% or 0.50%, respectively, of the average daily net asset value of such Fund’s Shares or Retirement Shares. There were no fees charged for the year ended March 31, 2005.
Effective July 31, 2004, each Independent Director/Trustee of the Funds receives a total annual fee of $100,000 paid by the Funds and other affiliated investment companies managed by the Adviser. The Chairman of the Board receives an additional $30,000, the Chairman of the Audit Committee receives an additional $15,000, and the Chairman of the Nominating Committee receives an additional $5,000 for serving in those capacities. Prior to July 31, 2004, each Independent Director of Excelsior Fund received an annual fee of $15,000, plus a meeting fee of $2,500 for each meeting attended. The Chairman received an additional annual fee of $7,500. Independent Trustees of the Trust received an annual fee of $6,000, plus a meeting fee of $1,000 for each meeting attended. The Chairman of the Board received an additional annual fee of $5,000. Each member of the Nominating Committee received a meeting fee of $3,000 for each meeting attended. In addition, Directors and Trustees are reimbursed by Excelsior Fund, Excelsior Tax-Exempt Fund and the Trust, respectively, for reasonable expenses incurred when acting in their capacity as Directors and Trustees.
The Funds’ Board of Directors/Trustees selected Deloitte & Touche LLP in November of 2004 to be their registered public accounting firm and to re-audit the Funds’ March 31, 2004 financial statements. All expenses in connection with the re-audit, including costs of audit, legal services, and printing and mailing of the financial statements, were paid by the Adviser. Such expenses are reflected in the Statements of Operations as “re-audit expenses” and the corresponding expense waiver “re-audit expenses paid by Investment Adviser.”
65
3. Purchases, Sales and Maturities of Securities:
For the year ended March 31, 2005, purchases, sales and maturities of securities, excluding short-term investments, for the Funds aggregated:
| | | | | | |
| | | Purchases
| | Sales and
Maturities
|
Managed Income Fund | | | | | | |
U.S. Government | | $ | 123,990,498 | | $ | 142,161,091 |
Other | | | 80,751,542 | | | 98,954,519 |
Intermediate-Term Managed Income Fund | | | | | | |
U.S. Government | | | 101,670,729 | | | 70,269,505 |
Other | | | 131,372,681 | | | 150,704,103 |
Short-Term Government Securities Fund | | | | | | |
U.S. Government | | | 332,687,164 | | | 350,063,590 |
Other | | | 113,237,475 | | | 135,051,623 |
High Yield Fund | | | 118,879,720 | | | 119,981,184 |
Long-Term Tax-Exempt Fund | | | 39,129,720 | | | 40,660,515 |
Intermediate-Term Tax-Exempt Fund | | | — | | | 11,026,950 |
Short-Term Tax-Exempt Securities Fund | | | 16,124,850 | | | 69,388,305 |
New York Intermediate-Term Tax-Exempt Fund | | | 17,942,400 | | | 43,735,160 |
California Tax-Exempt Income Fund | | | 6,222,667 | | | 6,249,111 |
4. Federal Taxes:
It is the policy of Excelsior Fund, Excelsior Tax-Exempt Fund and the Trust that each Fund qualify or continue to qualify as a regulated investment company, by complying with the requirements of the Internal Revenue Code applicable to regulated investment companies, and by distributing substantially all of its taxable earnings to its shareholders.
In order to avoid a federal excise tax, each Fund is required to distribute certain minimum amounts of net realized capital gain and net investment income for the respective twelve-month periods ending October 31 and December 31 each year.
Net realized gains of the Funds derived in certain countries are subject to certain foreign taxation.
Dividends and distributions are determined in accordance with federal income tax regulations and may differ from accounting principles generally accepted in the United States of America. These differences are primarily due to differing treatments for deferral of losses on wash sales and net capital losses incurred after October 31 and within the taxable year (“Post-October losses”). To the extent these differences are permanent, adjustments are made to the appropriate equity accounts in the period that these differences arise. Accordingly, the following reclassifications have been made to/from the following accounts:
66
| | | | | | | | | | | | |
| | | Undistributed
Net
Investment
Income
| | | Accumulated
Net Realized
Gain (Loss)
| | | Paid-In
Capital
| |
Managed Income Fund | | $ | 177,719 | | | $ | (1,724,997 | ) | | $ | 1,547,278 | |
Intermediate-Term Managed Income Fund | | | 395,219 | | | | (395,219 | ) | | | — | |
Short-Term Government Securities Fund | | | 2,336,031 | | | | (2,336,033 | ) | | | 2 | |
High Yield Fund | | | (271,400 | ) | | | 271,398 | | | | 2 | |
Long-Term Tax-Exempt Fund | | | — | | | | (4 | ) | | | 4 | |
Intermediate-Term Tax-Exempt Fund | | | (1 | ) | | | 1 | | | | — | |
Short-Term Tax-Exempt Securities Fund | | | (2,425 | ) | | | 2,423 | | | | 2 | |
New York Intermediate-Term Tax-Exempt Fund | | | (31 | ) | | | (2 | ) | | | 33 | |
California Tax-Exempt Income Fund | | | 1 | | | | — | | | | (1 | ) |
The tax character of dividends and distributions declared during the years ended March 31, 2005 and March 31, 2004 were as follows:
| | | | | | | | | | | | | | | |
| | | Ordinary
Income
| | Tax-Exempt
Income
| | Long-Term
Capital Gain
| | Return of
Capital
| | Total
|
Managed Income Fund | | | | | | | | | | | | | | | |
2005 | | $ | 11,633,310 | | | — | | $ | 1,031,057 | | | — | | $ | 12,664,367 |
2004 | | | 12,669,037 | | | — | | | 2,777,932 | | | — | | | 15,446,969 |
Intermediate-Term Managed
Income Fund | | | | | | | | | | | | | | | |
2005 | | | 14,305,244 | | | — | | | 572,247 | | | — | | | 14,877,491 |
2004 | | | 15,706,998 | | | — | | | 4,116,483 | | | — | | | 19,823,481 |
Short-Term Government
Securities Fund | | | | | | | | | | | | | | | |
2005 | | | 13,966,986 | | | — | | | — | | | — | | | 13,966,986 |
2004 | | | 15,034,872 | | | — | | | — | | | — | | | 15,034,872 |
High Yield Fund | | | | | | | | | | | | | | | |
2005 | | | 11,801,334 | | | — | | | — | | | — | | | 11,801,334 |
2004 | | | 10,866,812 | | | — | | | — | | $ | 3,160,658 | | | 14,027,470 |
Long-Term Tax-Exempt Fund | | | | | | | | | | | | | | | |
2005 | | | — | | $ | 1,833,293 | | | — | | | — | | | 1,833,293 |
2004 | | | — | | | 2,199,868 | | | — | | | — | | | 2,199,868 |
Intermediate-Term Tax-Exempt Fund | | | | | | | | | | | | | | | |
2005 | | | 256,062 | | | 9,828,278 | | | 1,294,216 | | | — | | | 11,378,556 |
2004 | | | 1,128,243 | | | 10,386,027 | | | 12,402,638 | | | — | | | 23,916,908 |
Short-Term Tax-Exempt
Securities Fund | | | | | | | | | | | | | | | |
2005 | | | 24,949 | | | 3,424,866 | | | 22,878 | | | — | | | 3,472,693 |
2004 | | | — | | | 3,456,342 | | | — | | | — | | | 3,456,342 |
New York Intermediate-Term
Tax-Exempt Fund | | | | | | | | | | | | | | | |
2005 | | | — | | | 3,894,510 | | | 1,466,615 | | | — | | | 5,361,125 |
2004 | | | 303,039 | | | 4,386,298 | | | 5,482,307 | | | — | | | 10,171,644 |
California Tax-Exempt Income Fund | | | | | | | | | | | | | | | |
2005 | | | — | | | 2,063,597 | | | — | | | — | | | 2,063,597 |
2004 | | | — | | | 2,026,301 | | | — | | | — | | | 2,026,301 |
67
As of March 31, 2005, the components of distributable earnings (accumulated losses) on a tax basis were as follows:
| | | | | | | | | | | | | | | | | | | | | | | | | | | | |
| | | Undistributed
Ordinary
Income
| | Undistributed
Tax-Exempt
Income
| | Undistributed
Long-Term
Capital Gains
| | Distributions
Payable
| | | Accumulated
Capital and
Other Losses
| | | Post
October
Losses
| | Unrealized
Appreciation/
(Depreciation)
| | | Total
| |
Managed Income Fund | | $ | 1,159,172 | | | — | | $ | 1,192,486 | | $ | (428,319 | ) | | | — | | | | — | | $ | 2,643,523 | | | $ | 4,566,862 | |
Intermediate-Term Managed Income Fund | | | 1,248,355 | | | — | | | 1,063,363 | | | (1,139,984 | ) | | | — | | | | — | | | (1,823,669 | ) | | | (651,935 | ) |
Short-Term Government Securities Fund | | | 921,110 | | | — | | | — | | | (885,694 | ) | | $ | (9,073,286 | ) | | $ | 1,665,767 | | | (5,788,674 | ) | | | (13,160,777 | ) |
High Yield Fund | | | 281,497 | | | — | | | — | | | (753,861 | ) | | | (61,203,778 | ) | | | — | | | (1,204,936 | ) | | | (62,881,078 | ) |
Long-Term Tax-Exempt Fund | | | — | | $ | 120,242 | | | — | | | (120,118 | ) | | | (262,322 | ) | | | — | | | 862,423 | | | | 600,225 | |
Intermediate-Term Tax-Exempt Fund | | | — | | | 757,211 | | | 367,896 | | | (752,786 | ) | | | — | | | | — | | | 6,080,555 | | | | 6,452,876 | |
Short-Term Tax-Exempt Securities Fund | | | — | | | 273,390 | | | — | | | (268,064 | ) | | | (491,548 | ) | | | 102,160 | | | (2,004,976 | ) | | | (2,389,038 | ) |
New York Intermediate-Term Tax-Exempt Fund | | | — | | | 246,192 | | | 1,825,238 | | | (243,432 | ) | | | — | | | | — | | | (308,940 | ) | | | 1,519,058 | |
California Tax-Exempt Income Fund | | | — | | | 129,231 | | | — | | | (128,065 | ) | | | (975 | ) | | | — | | | 941,210 | | | | 941,401 | |
Post-October losses are deemed to arise on the first business day of a Fund’s next taxable year.
For federal income tax purposes, capital loss carryforwards may be carried forward and applied against future capital gains. To the extent that such carryforwards are utilized, capital gains distributions will be reduced. At March 31, 2005, the following Funds had capital loss carryforwards available to offset future net capital gains through the indicated expiration dates:
| | | | | | | | | | | | | | | | | | |
| | | Expires
|
| | | 2009
| | 2010
| | 2011
| | 2012
| | 2013
| | Total
|
Short-Term Government Securities Fund | | | — | | | — | | | — | | $ | 1,481,228 | | $ | 4,260,524 | | $ | 5,741,752 |
High Yield Fund | | | — | | $ | 2,181,571 | | $ | 17,456,849 | | | 40,103,941 | | | 1,461,417 | | | 61,203,778 |
Long-Term Tax-Exempt Fund | | $ | 262,322 | | | — | | | — | | | — | | | — | | | 262,322 |
Short-Term Tax-Exempt Securities Fund | | | — | | | — | | | — | | | — | | | 287,228 | | | 287,228 |
California Tax-Exempt Income Fund | | | — | | | — | | | — | | | 664 | | | 311 | | | 975 |
68
At March 31, 2005, aggregate gross unrealized appreciation for all securities and call options written for which there was an excess of value over estimated tax cost and aggregate gross unrealized depreciation for all securities for which there was an excess of estimated tax cost over value is as follows:
| | | | | | | | | | | | | | |
| | | Federal Tax
Cost
| | Tax Basis
Unrealized
Appreciation
| | Tax Basis
Unrealized
(Depreciation)
| | | Net
Unrealized
Appreciation
(Depreciation)
| |
Managed Income Fund | | $ | 209,787,935 | | $ | 3,669,100 | | $ | (1,025,577 | ) | | $ | 2,643,523 | |
Intermediate-Term Managed Income Fund | | | 410,424,653 | | | 3,162,101 | | | (4,985,770 | ) | | | (1,823,669 | ) |
Short-Term Government Securities Fund | | | 410,985,834 | | | 209,593 | | | (5,998,267 | ) | | | (5,788,674 | ) |
High Yield Fund | | | 167,190,147 | | | 4,286,188 | | | (5,491,124 | ) | | | (1,204,936 | ) |
Long-Term Tax-Exempt Fund | | | 60,218,286 | | | 963,983 | | | (101,560 | ) | | | 862,423 | |
Intermediate-Term Tax-Exempt Fund | | | 340,455,193 | | | 7,740,577 | | | (1,660,022 | ) | | | 6,080,555 | |
Short-Term Tax-Exempt Securities Fund | | | 234,140,389 | | | 647 | | | (2,005,623 | ) | | | (2,004,976 | ) |
New York Intermediate-Term Tax-Exempt Fund | | | 137,286,096 | | | 950,875 | | | (1,259,815 | ) | | | (308,940 | ) |
California Tax-Exempt Income Fund | | | 62,314,841 | | | 1,174,698 | | | (233,488 | ) | | | 941,210 | |
5. Capital Transactions:
Excelsior Fund has authorized capital of 35 billion shares of Common Stock, 29.3756 billion of which is currently classified to represent interests in certain classes of shares. Authorized capital currently offered for each Fund is as follows: 750 million shares of the Managed Income Fund; 1.5 billion shares of the Intermediate-Term Managed Income Fund; and 1 billion shares of the Short-Term Government Securities Fund. Each share has a par value of $0.001 and represents an equal proportionate interest in the particular Fund with other shares of the same Fund, and is entitled to such dividends and distributions of taxable earnings on the assets belonging to such Fund as are declared at the discretion of Excelsior Fund’s Board of Directors.
Excelsior Tax-Exempt Fund has authorized capital of 24 billion shares of Common Stock, 15 billion of which is currently classified to represent interests in certain classes of shares. Authorized capital currently offered for each Fund is as follows: 1.5 billion shares each of Long-Term Tax-Exempt Fund, Intermediate-Term Tax-Exempt Fund, Short-Term Tax-Exempt Securities Fund, New York Intermediate-Term Tax-Exempt Fund and California Tax-Exempt Income Fund. Each share has a par value of $0.001 and represents an equal proportionate interest in the particular Fund with other shares of the same Fund, and is entitled to such dividends and distributions of taxable and tax-exempt earnings on the assets belonging to such Fund as are declared at the discretion of Excelsior Tax-Exempt Fund’s Board of Directors.
The Trust has authorized an unlimited number of shares of beneficial interest of each class of each Fund. Each share has a par value of $0.00001 and represents an equal proportionate interest in the particular Fund with other shares of the same Fund, and is entitled to such dividends and distributions of taxable earnings on the assets belonging to such Fund as are declared at the discretion of the Trust’s Board of Trustees.
69
| | | | | | | | | | | | | | |
| | | Managed Income Fund
| |
| | | Year Ended
3/31/05
| | | Year Ended
3/31/04
| |
| | | Shares
| | | Amount
| | | Shares
| | | Amount
| |
Sold | | | | | | | | | | | | | | |
Shares | | 7,544,152 | | | $ | 69,875,602 | | | 6,431,529 | | | $ | 60,736,685 | |
Retirement Shares | | 126 | | | | 1,050 | | | — | | | | — | |
Issued as reinvestment of dividends | | | | | | | | | | | | | | |
Shares | | 331,579 | | | | 3,062,096 | | | 447,581 | | | | 4,191,949 | |
Retirement Shares | | — | | | | 4 | | | — | | | | — | |
Redeemed | | | | | | | | | | | | | | |
Shares | | (4,431,412 | ) | | | (40,768,322 | ) | | (9,433,164 | ) | | | (88,509,497 | ) |
Redemption in-kind | | (8,833,002 | ) | | | (81,528,608 | ) | | | | | | | |
| | |
|
| |
|
|
| |
|
| |
|
|
|
Net Increase (Decrease) | | (5,388,557 | ) | | $ | (49,358,178 | ) | | (2,554,054 | ) | | $ | (23,580,863 | ) |
| | |
|
| |
|
|
| |
|
| |
|
|
|
| |
| | | Intermediate-Term Managed Income Fund
| |
| | | Year Ended
3/31/05
| | | Year Ended
3/31/04
| |
| | | Shares
| | | Amount
| | | Shares
| | | Amount
| |
Sold: | | 15,055,086 | | | $ | 109,213,526 | | | 17,987,899 | | | $ | 133,005,733 | |
Contribution in-kind | | 1,044,029 | | | | 7,590,091 | | | | | | | | |
Issued as reinvestment of dividends: | | 158,208 | | | | 1,145,388 | | | 161,101 | | | | 1,185,497 | |
Redeemed: | | (14,791,878 | ) | | | (107,161,886 | ) | | (17,028,047 | ) | | | (125,933,806 | ) |
| | |
|
| |
|
|
| |
|
| |
|
|
|
Change in net assets | | 1,465,445 | | | $ | 10,787,119 | | | 1,120,953 | | | $ | 8,257,424 | |
| | |
|
| |
|
|
| |
|
| |
|
|
|
| |
| | | Short-Term Government Securities Fund
| |
| | | Year Ended
03/31/05
| | | Year Ended
03/31/04
| |
| | | Shares
| | | Amount
| | | Shares
| | | Amount
| |
Sold | | 28,457,660 | | | $ | 201,824,477 | | | 52,359,121 | | | $ | 379,822,103 | |
Issued as reinvestment of dividends | | 289,189 | | | | 2,044,988 | | | 222,097 | | | | 1,603,649 | |
Redeemed | | (36,290,718 | ) | | | (257,075,591 | ) | | (55,936,678 | ) | | | (405,102,072 | ) |
| | |
|
| |
|
|
| |
|
| |
|
|
|
Change in net assets | | (7,543,869 | ) | | $ | (53,206,126 | ) | | (3,355,460 | ) | | $ | (23,676,320 | ) |
| | |
|
| |
|
|
| |
|
| |
|
|
|
70
| | | | | | | | | | | | | | |
| | | High Yield Fund
| |
| | | Year Ended
03/31/05
| | | Year Ended
03/31/04
| |
| | | Shares
| | | Amount
| | | Shares
| | | Amount
| |
Sold: | | | | | | | | | | | | | | |
Shares | | 21,515,855 | | | $ | 101,230,357 | | | 32,989,833 | | | $ | 146,064,602 | |
Institutional Shares | | 1,316,771 | | | | 6,247,385 | | | 1,199,226 | | | | 5,249,685 | |
Issued as reinvestment of dividends: | | | | | | | | | | | | | | |
Shares | | 414,836 | | | | 1,961,707 | | | 367,138 | | | | 1,637,682 | |
Institutional Shares | | 8,493 | | | | 40,222 | | | 6,757 | | | | 29,643 | |
Redeemed: | | | | | | | | | | | | | | |
Shares | | (20,658,816 | ) | | | (97,478,269 | ) | | (34,133,033 | ) | | | (152,384,928 | ) |
Institutional Shares | | (3,282,976 | ) | | | (15,687,133 | ) | | (5,737,764 | ) | | | (25,636,287 | ) |
| | |
|
| |
|
|
| |
|
| |
|
|
|
Change in net assets | | (685,837 | ) | | $ | (3,685,731 | ) | | (5,307,843 | ) | | $ | (25,039,603 | ) |
| | |
|
| |
|
|
| |
|
| |
|
|
|
| |
| | | Long-Term Tax-Exempt Fund
| |
| | | Year Ended
03/31/05
| | | Year Ended
03/31/04
| |
| | | Shares
| | | Amount
| | | Shares
| | | Amount
| |
Sold | | 1,003,168 | | | $ | 9,987,153 | | | 1,973,824 | | | $ | 19,719,700 | |
Issued as reinvestment of dividends | | 31,144 | | | | 312,137 | | | 33,235 | | | | 330,955 | |
Redeemed | | (2,011,361 | ) | | | (20,002,931 | ) | | (4,333,803 | ) | | | (43,227,377 | ) |
| | |
|
| |
|
|
| |
|
| |
|
|
|
Change in net assets | | (977,049 | ) | | $ | (9,703,641 | ) | | (2,326,744 | ) | | $ | (23,176,722 | ) |
| | |
|
| |
|
|
| |
|
| |
|
|
|
| |
| | | Intermediate-Term Tax-Exempt Fund
| |
| | | Year Ended
03/31/05
| | | Year Ended
03/31/04
| |
| | | Shares
| | | Amount
| | | Shares
| | | Amount
| |
Sold | | 7,418,489 | | | $ | 70,630,402 | | | 10,553,521 | | | $ | 104,290,828 | |
Issued as reinvestment of dividends | | 107,050 | | | | 1,019,228 | | | 183,521 | | | | 1,779,145 | |
Redeemed | | (10,361,672 | ) | | | (98,554,729 | ) | | (11,939,158 | ) | | | (118,008,037 | ) |
| | |
|
| |
|
|
| |
|
| |
|
|
|
Change in net assets | | (2,836,133 | ) | | $ | (26,905,099 | ) | | (1,202,116 | ) | | $ | (11,938,064 | ) |
| | |
|
| |
|
|
| |
|
| |
|
|
|
| |
| | | Short-Term Tax-Exempt Securities Fund
| |
| | | Year Ended
03/31/05
| | | Year Ended
03/31/04
| |
| | | Shares
| | | Amount
| | | Shares
| | | Amount
| |
Sold | | 13,545,164 | | | $ | 97,050,761 | | | 29,901,468 | | | $ | 215,547,037 | |
Issued as reinvestment of dividends | | 23,592 | | | | 168,982 | | | 17,156 | | | | 123,645 | |
Redeemed | | (29,996,244 | ) | | | (214,883,252 | ) | | (20,414,339 | ) | | | (147,073,098 | ) |
| | |
|
| |
|
|
| |
|
| |
|
|
|
Change in net assets | | (16,427,488 | ) | | $ | (117,663,509 | ) | | 9,504,285 | | | $ | 68,597,584 | |
| | |
|
| |
|
|
| |
|
| |
|
|
|
71
| | | | | | | | | | | | | | |
| | | New York Intermediate-Term Tax-Exempt Fund
| |
| | | Year Ended
03/31/05
| | | Year Ended
03/31/04
| |
| | | Shares
| | | Amount
| | | Shares
| | | Amount
| |
Sold | | 2,053,754 | | | $ | 18,150,200 | | | 4,175,816 | | | $ | 38,017,393 | |
Issued as reinvestment of dividends | | 67,207 | | | | 593,357 | | | 120,743 | | | | 1,083,430 | |
Redeemed | | (6,111,053 | ) | | | (53,845,642 | ) | | (4,975,150 | ) | | | (45,321,700 | ) |
| | |
|
| |
|
|
| |
|
| |
|
|
|
Change in net assets | | (3,990,092 | ) | | $ | (35,102,085 | ) | | (678,591 | ) | | $ | (6,220,877 | ) |
| | |
|
| |
|
|
| |
|
| |
|
|
|
| |
| | | California Tax-Exempt Income Fund
| |
| | | Year Ended
03/31/05
| | | Year Ended
03/31/04
| |
| | | Shares
| | | Amount
| | | Shares
| | | Amount
| |
Sold | | 3,278,532 | | | $ | 24,146,853 | | | 2,479,328 | | | $ | 18,593,918 | |
Issued as reinvestment of dividends | | 42,748 | | | | 314,174 | | | 17,600 | | | | 131,929 | |
Redeemed | | (3,595,284 | ) | | | (26,429,967 | ) | | (2,405,845 | ) | | | (18,013,017 | ) |
| | |
|
| |
|
|
| |
|
| |
|
|
|
Change in net assets | | (274,004 | ) | | $ | (1,968,940 | ) | | 91,083 | | | $ | 712,830 | |
| | |
|
| |
|
|
| |
|
| |
|
|
|
6. Line of Credit:
During the year ended March 31, 2005, the Funds and other affiliated funds participated in a $50 million unsecured line of credit provided by a syndication of banks under a line of credit agreement. A commitment fee, equal to an annual rate of 0.15% of the average daily unused portion of the line of credit, is allocated among the participating Funds at the end of each quarter, and is included in miscellaneous expenses on the statements of operations. For the year ended March 31, 2005, the Funds had no borrowings under the agreement. Effective March 9, 2005, the unsecured line of credit was terminated.
7. Guarantees:
In the normal course of business, the Funds enter into contracts that provide general indemnifications. The Funds’ maximum exposure under these arrangements is dependent on future claims that may be made against the Funds, and, therefore, cannot be established; however, based on experience, the risk of loss from such claims is considered remote.
8. Legal Proceedings:
The Adviser and Excelsior Funds, Inc., Excelsior Tax-Exempt Funds, Inc., and Excelsior Funds Trust (the “Companies”) were contacted in September, 2003 by the Office of the New York State Attorney General (the “NYAG”), and the Adviser was contacted by the Securities and Exchange Commission (the “SEC”) in connection with their investigations of practices in the mutual fund industry identified as “market timing” and “late trading” of mutual fund shares (the “Investigations”). The Adviser and the Companies have cooperated with respect to these Investigations. As disclosed previously by the Adviser and its affiliates, with respect to the Adviser, these investigations have focused on circumstances in which a small number of parties were permitted to engage in short-term trading of certain Excelsior Funds. The short-term trading activities permitted under these arrangements have been terminated and the Adviser has strengthened its policies and procedures to deter frequent trading in the Companies.
72
Five class actions filed against the Companies and two derivative actions purportedly brought on behalf of each of the Companies and each of the funds have been transferred to the United District Court for the District of Maryland for coordinated or consolidated pre-trial proceedings in a matter styled In Re Mutual Funds Investment Litigation, MDL Docket No. 1586. Lead plaintiffs were appointed and additional defendants were added (generally consisting of current and former directors and officers of the Companies). The five class actions were then consolidated and a single amended complaint was filed on or about September 29, 2004. Plaintiffs in the consolidated class action are seeking unspecified monetary damages from claimed injuries arising from allegedly illegal and improper mutual fund trading practices, as well as disgorgement of investment advisory fees, rescission and restitution of unspecified funds. The two derivative actions were also consolidated into a new amended complaint, also filed on or about September 29, 2004. Plaintiffs in the consolidated derivative action are seeking, on behalf of the Companies, unspecified monetary damages for similar claimed injuries, as well as removal of Excelsior Fund directors, removal of U.S. Trust as advisor to the Excelsior Funds, rescission of its investment advisory contracts and disgorgement of management fees and compensation relating to the Excelsior Funds.
The defendants in the consolidated actions have moved to dismiss such actions, and the Maryland court is scheduled to hear oral argument on the motions to dismiss on June 16-17, 2005. The defendants will not be required to answer the complaints until such motions have been decided, and discovery in the actions is currently stayed.
While the ultimate outcome of these matters cannot be predicted with any certainty at this time, based on currently available information, the Adviser believes that the likelihood is remote that the pending private lawsuits and Investigations will have a material adverse financial impact on the Companies, and further believes that the pending Investigations and private lawsuits are not likely to materially affect the Adviser’s ability to provide investment management services to the Companies.
73
REPORT OF INDEPENDENT REGISTERED PUBLIC ACCOUNTING FIRM
To the Board of Directors/Trustees and Shareholders of
Excelsior Funds, Inc., Excelsior Funds Trust, and Excelsior Tax-Exempt Funds, Inc.
We have audited the accompanying statements of assets and liabilities, including the portfolios of investments, of the Managed Income Fund, Intermediate-Term Managed Income Fund, Short-Term Government Securities Fund, High Yield Fund, Long-Term Tax-Exempt Fund, Intermediate-Term Tax-Exempt Fund, Short Term Tax-Exempt Securities Fund, New York Intermediate-Term Tax-Exempt Fund, and California Tax-Exempt Income Fund (three of the portfolios constituting the Excelsior Funds, Inc., one of the portfolios constituting the Excelsior Funds Trust, and five of the portfolios constituting the Excelsior Tax-Exempt Funds, Inc.) (collectively, the “Funds”) as of March 31, 2005, and the related statements of operations for the year then ended, and the statements of changes in net assets and the financial highlights (Shares) for each of the two years in the period then ended. These financial statements and financial highlights are the responsibility of the Funds’ management. Our responsibility is to express an opinion on these financial statements and financial highlights based on our audits. The financial highlights for each of the years in the three year period ended March 31, 2003 were audited by other auditors whose reports dated May 16, 2003, expressed an unqualified opinion on those financial highlights.
We conducted our audits in accordance with the standards of the Public Company Accounting Oversight Board (United States). Those standards require that we plan and perform the audit to obtain reasonable assurance about whether the financial statements and financial highlights are free of material misstatement. The Funds are not required to have, nor were we engaged to perform, an audit of their internal control over financial reporting. Our audit included consideration of internal control over financial reporting as a basis for designing audit procedures that are appropriate in the circumstances, but not for the purpose of expressing an opinion on the effectiveness of the Funds’ internal control over financial reporting. Accordingly, we express no such opinion. An audit also includes examining, on a test basis, evidence supporting the amounts and disclosures in the financial statements, assessing the accounting principles used and significant estimates made by management, as well as evaluating the overall financial statement presentation. Our procedures included confirmation of securities owned as of March 31, 2005, by correspondence with the custodian and brokers; where replies were not received from brokers, we performed other auditing procedures. We believe that our audits provide a reasonable basis for our opinion.
In our opinion, the financial statements and financial highlights referred to above present fairly, in all material respects, the financial position of Managed Income Fund, Intermediate-Term Managed Income Fund, Short-Term Government Securities Fund, High Yield Fund, Long-Term Tax-Exempt Fund, Intermediate-Term Tax-Exempt Fund, Short Term Tax-Exempt Securities Fund, New York Intermediate-Term Tax-Exempt Fund, and California Tax-Exempt Income Fund as of March 31, 2005, the results of their operations, and the changes in their net assets and the financial highlights for each of the two years in the period then ended, in conformity with accounting principles generally accepted in the United States of America.
DELOITTE & TOUCHE LLP
New York, New York
May 27, 2005
74
Directors/Trustees and Officers of the Excelsior Funds Complex (Unaudited)
Information pertaining to the Directors/Trustees and Officers of Excelsior Fund, Excelsior Tax-Exempt Fund and Excelsior Funds Trust (each a “Company” and collectively, the “Excelsior Funds Complex”) is set forth below. Directors/Trustees who are not deemed to be “interested persons” of the Excelsior Funds Complex as defined in the 1940 Act are referred to as “Independent Board Members.” Directors/Trustees who are deemed to be “interested persons” of the Excelsior Funds Complex are referred to as “Interested Board Members”. The following information is as of May 20, 2005.
| | | | | | |
Name and Address(1) Age Time Served with the Excelsior Funds Complex
| | Principal Occupation
During the Past Five Years
| | Number of
Portfolios in Fund
Complex Overseen by Director/
Trustee(3)
| | Other Directorships Held by Director/Trustee(4)
|
DIRECTORS/TRUSTEES(2) INDEPENDENT BOARD MEMBERS | | | | | | |
Frederick S. Wonham
Age: 74
Since 1997 | | Retired. Chairman of the Boards and Director (since 1997) and President and Treasurer (from 1995 to February 2002) of Excelsior Funds, Inc. and Excelsior Tax-Exempt Funds, Inc.; Chairman of the Board and Trustee (since 1997) and President and Treasurer (from 1995 to February 2002) of Excelsior Funds Trust. | | 29 | | None. |
| | | |
Rodman L. Drake
Age: 62
Since 1994 | | Director of Excelsior Funds, Inc. and Excelsior Tax-Exempt Funds, Inc. (since 1996); Trustee of Excelsior Funds Trust (since 1994); Director, Crystal River Capital Inc. (a private REIT) (since March 2005); Director, Parson Brinkerhoff, Inc. (engineering firm) (since 1995); Co-Founder of Baringo Capital LLC (since 2002); President, Continuation Investments Group, Inc. (from 1997 to 2001). | | 29 | | Director and Chairman, Hyperion Total Return Fund, Inc., Hyperion Strategic Mortgage Fund Inc., and Hyperion 2005 Term Trust Inc. (since 1991); Director, Jackson Hewitt Inc. (since June 2004). |
| | | |
Morrill Melton (“Mel”) Hall, Jr.
Age: 60
Since 2000 | | Director of Excelsior Funds, Inc. and Excelsior Tax-Exempt Funds, Inc. (since 2000); Trustee of Excelsior Funds Trust (since 2000); Chairman and Chief Executive Officer, Comprehensive Health Services, Inc. (health care management and administration) (since 1991). | | 29 | | None. |
| | | |
Roger M. Lynch
Age: 64
Since 2001 | | Retired. Director of Excelsior Funds, Inc. and Excelsior Tax- Exempt Funds, Inc. and Trustee of Excelsior Funds Trust (since 2001); Director, SLD Commodities, Inc. (importer of nuts) (since 1991); President, Corporate Asset Funding Co., Inc. (asset securitization) (from 1987 to 1999); Limited Partner (from 1986 to 1999), Goldman Sachs & Co. | | 29 | | None. |
75
| | | | | | |
Name and Address(1) Age Time Served with the Excelsior Funds Complex
| | Principal Occupation
During the Past Five Years
| | Number of
Portfolios in Fund
Complex Overseen by Director/
Trustee(3)
| | Other Directorships Held by Director/Trustee(4)
|
Jonathan Piel
Age: 66
Since 1994 | | Retired. Director, Excelsior Funds, Inc. and Excelsior Tax-Exempt Funds, Inc. (since 1996); Trustee, Excelsior Funds Trust (since 1994). | | 29 | | None. |
| | | |
John. D. Collins
Age: 66
Since 2005 | | Retired. Director, Excelsior Funds, Inc. and Excelsior Tax-Exempt Funds, Inc. (since 2005); Trustee, Excelsior Funds Trust (since 2005). Consultant, KPMG, LLP (from July 1999 to June 2000); Partner, KPMG, LLP (from March 1962 to June 1999). | | 29 | | Director, CCC Information Services Inc. (software to automate process of settling automobile claims)(since September 2004); Director, Mrs. Fields’ Companies, Inc. (consumer products)(since December 2004). |
| INTERESTED BOARD MEMBER(5) | | | | | | |
James L. Bailey
114 West 47th Street
New York, NY 10036
Age: 59
Since 2004 | | Chief Operating Officer of U.S. Trust Corporation (since December 2004) and Executive Vice President of U.S. Trust Corporation and United States Trust Company of New York (since 2003); President, Excelsior Funds, Inc., Excelsior Tax-Exempt Funds, Inc. and Excelsior Funds Trust (from 2003 to July 2004); Consultant in the financial services industry (from August 2000 to January 2003); Executive Vice President of Citicorp (from 1992 to August 2000). | | 29 | | None. |
| OFFICERS | | | | | | |
Mary Martinez
114 West 47th Street
New York, NY 10036
Age: 45
President
Since July 2004 | | Managing Director of United States Trust Company of New York (since 2003) and Chief Executive Officer of National Private Banking (since October 2004); Managing Director and Director of Relationship Management Service, Marketing, Information and Technology at Bessemer Trust (from 1998 to 2003). | | N/A | | N/A |
| | | |
Joseph Trainor, CFA
114 West 47th Street
New York, NY 10036
Age: 44
Vice President
Since February 2004 | | Managing Director of United States Trust Company of New York and President, U.S. Trust Institutional (since 2003); President of MFS Institutional Advisors (from 1998 to 2002). | | N/A | | N/A |
76
| | | | | | |
Name and Address(1) Age Time Served with the Excelsior Funds Complex
| | Principal Occupation
During the Past Five Years
| | Number of
Portfolios in Fund
Complex Overseen by Director/
Trustee(3)
| | Other Directorships Held by Director/Trustee(4)
|
Agnes Mullady
225 High Ridge Road Stamford, CT 06905
Age: 46
Treasurer/Chief Financial and Chief Accounting Officer
Since February 2004 | | Senior Vice President, U.S. Trust Company, N.A. (since 2004); Chief Financial Officer, AMIC Distribution Partners (from 2002 to 2004); Controller Reserve Management Corporation, Reserve Management Company, Inc. and Reserve Partners, Inc. (from 2000 to 2002); Vice President and Treasurer, Northstar Funds; Senior Vice President and Chief Financial Officer, Northstar Investment Management Corp.; President and Treasurer, Northstar Administrators Corp.; and Vice President and Treasurer, Northstar Distributors, Inc. (from 1993 to 2000). | | N/A | | N/A |
| | | |
Scott Rhodes
225 High Ridge Road Stamford, CT 06905
Age: 46
Vice President and Assistant Treasurer
Since November 2004 | | Vice President, U.S. Trust Company, N.A. (since August 2004); Vice President, BlackRock Financial Management, Inc. (2004); Controller, Mutual Funds, American Skandia Investment Services, Inc. and Assistant Treasurer, American Skandia Trust and American Skandia Advisor Funds, Inc. (from 1996 to 2003). | | N/A | | N/A |
| | | |
Alexandra Poe
114 West 47th Street
New York, NY 10036
Age: 44
Secretary and Chief Legal Officer
Since May 2004 | | Senior Vice President and Assistant General Counsel, United States Trust Company of New York (since May 2004); Chief Legal Officer for Managed Accounts and Alternative Investment Strategies, Prudential Investments (from 2001 to 2004); Senior Vice President and General Counsel, US Investment Management and Global Hedge Funds and President of the Schroder Mutual Funds, Schroders (from 1996 to 2001). | | N/A | | N/A |
| | | |
Sharon M. Davison
114 West 47th Street
New York, NY 10036
Age: 50
Chief Compliance Officer Since September 2004 | | Senior Vice President of U.S. Trust Company of New York (since 2001); Director of Securities and Corporate Compliance (since 2001); Director of Special Investigations-New York Stock Exchange Division of Market Surveillance (from 2000 to 2001); Senior Counsel-New York Stock Exchange Division of Market Surveillance (from 1997 to 2000). | | N/A | | N/A |
77
| | | | | | |
Name and Address(1) Age Time Served with the Excelsior Funds Complex
| | Principal Occupation
During the Past Five Years
| | Number of
Portfolios in Fund
Complex Overseen by Director/
Trustee(3)
| | Other Directorships Held by Director/Trustee(4)
|
Wyndham Clark
225 High Ridge Road Stamford, CT 06905
Age: 47
Anti-Money Laundering Officer
Since May 2004 | | Vice President and AML Officer, U.S. Trust Company, N.A. (since 2003); Vice President and Deputy Director Risk Management, IBJ Whitehall (banking) (from 2001 to 2002); and Vice President and Chief Risk Officer, EMAC, LLC (commercial lender, asset backed security issuer) (from 1999 to 2001). | | N/A | | N/A |
| | | |
Ralph Pastore
225 High Ridge Road
Stamford, CT 06905
Age: 35
Vice President
Since May 2005 | | Vice President, U.S. Trust Company, N.A. (since 2001); Director, Mutual Fund Operations, American Skandia Investment Services, Inc. (from 1998 to 2001) | | N/A | | N/A |
| (1) | Each independent director/trustee may be contacted by writing to Excelsior Funds, 225 High Ridge Road, Stamford, CT 06905. |
| (2) | Each director/trustee shall hold office until the election and qualification of his or her successor, or until he or she sooner dies, resigns or is removed. The officers of each Company shall hold office for a one year term and until their respective successors are chosen and qualified, or in each case until he or she sooner dies, resigns, is removed, or becomes disqualified in accordance with each Company’s by-laws. |
| (3) | The Excelsior Funds Complex consists of all registered investment companies (Excelsior Funds Inc., Excelsior Tax-Exempt Funds, Inc. and Excelsior Funds Trust) for which U.S. Trust serves as investment adviser. As of May 20, 2005, the Excelsior Funds Complex consisted of 29 Funds. |
| (4) | Directorships of companies required to report to the Securities and Exchange Commission under the Securities Exchange Act of 1934 (i.e., “public companies”) or other investment companies registered under the 1940 Act. |
| (5) | “Interested person” of the Company is defined in the 1940 Act. Mr. Bailey is considered an “interested person” because of his affiliation with the Adviser. |
For more information regarding the Directors/Trustees and Officers, please refer to the Statement of Additional Information, which is available upon request by calling 1-800-446-1012.
78
DISCLOSURE OF FUND EXPENSES (Unaudited)
We believe it is important for you to understand the impact of fees regarding your investment. As a shareholder of the fund, you incur ongoing, or operating costs, which include costs for portfolio management, administrative services, and shareholder reports (like this one), among others. Operating expenses, which are deducted from a fund’s gross income, directly reduce the investment return of the fund. A fund’s expenses are expressed as a percentage of its average net assets. This figure is known as the expense ratio. The following examples are intended to help you understand the ongoing costs (in dollars) of investing in your fund and to compare these costs with those of other mutual funds. The examples are based on an investment of $1,000 made at the beginning of the period shown and held for the entire period.
The table on the following page illustrates your fund’s costs in two ways.
| | • | | Actual expenses. This section provides information about actual account values and actual expenses based on the Funds’ actual return for the period. This section is designed to help you to estimate the actual expenses after fee waivers that you paid over the period. The “Ending Account Value” shown is derived from the fund’s actual return, and the fourth column shows the dollar amount that would have been paid by an investor who started with $1,000 in the fund. You may use the information here, together with the amount you invested, to estimate the expenses that you paid over the period. |
To do so, simply divide your account value by $1,000 (for example, an $8,600 account value divided by $1,000 = $8.6), then multiply the result by the number given for your fund under the heading “Expenses Paid During Period”.
| | • | | Hypothetical expenses. This section provides information about hypothetical account values and hypothetical expenses that would have been incurred by an investor in the Fund based on an assumed rate of return of 5% per year before expenses. This section is designed to help you compare your fund’s costs with those of other mutual funds. It assumes that the fund had a return of 5% before expenses during the year, but that the expense ratio is unchanged. In this case, because the return used is not the fund’s actual return, the results cannot be used to estimate the actual ending account balance or expenses you paid for the period. You may use this information to compare the ongoing costs of investing in your Fund and other funds. To do so, compare this 5% hypothetical example with the 5% hypothetical examples that appear in shareholder reports of other funds. |
79
DISCLOSURE OF FUND EXPENSES (Unaudited) (Continued)
Please note that the expenses shown in the table are meant to highlight and help you compare ongoing costs only, which are described in the Prospectus. Therefore, the hypothetical example is useful in comparing ongoing costs only, and will not help you determine the relative total costs of owning different funds.
| | | | | | | | | | | | |
| | | Beginning
Account
Value
09/30/04
| | Ending
Account
Value
03/31/05
| | Annualized
Expense
Ratios*
| | | Expenses
Paid
During
Period**
|
Actual Fund Return | | | | | | | | | | | | |
Managed Income Fund — Shares | | $ | 1,000.00 | | $ | 1,005.80 | | 0.90 | % | | $ | 4.50 |
Intermediate-Term Managed Income Fund — Shares | | | 1,000.00 | | | 1,000.20 | | 0.60 | | | | 2.99 |
Short-Term Government Securities Fund — Shares | | | 1,000.00 | | | 1,001.00 | | 0.60 | | | | 2.99 |
High Yield Fund — Shares | | | 1,000.00 | | | 1,020.70 | | 1.04 | | | | 5.24 |
Long-Term Tax-Exempt Fund — Shares | | | 1,000.00 | | | 1,012.30 | | 0.80 | | | | 4.01 |
Intermediate-Term Tax-Exempt Fund — Shares | | | 1,000.00 | | | 995.00 | | 0.65 | | | | 3.23 |
Short-Term Tax-Exempt Securities Fund — Shares | | | 1,000.00 | | | 998.60 | | 0.60 | | | | 2.99 |
New York Intermediate-Term Tax-Exempt Fund — Shares | | | 1,000.00 | | | 995.10 | | 0.80 | | | | 3.98 |
California Tax-Exempt Income Fund — Shares | | | 1,000.00 | | | 998.20 | | 0.50 | | | | 2.49 |
| | | | |
Hypothetical 5% Return | | | | | | | | | | | | |
Managed Income Fund — Shares | | | 1,000.00 | | | 1,020.44 | | 0.90 | | | | 4.53 |
Intermediate-Term Managed Income Fund — Shares | | | 1,000.00 | | | 1,021.94 | | 0.60 | | | | 3.02 |
Short-Term Government Securities Fund — Shares | | | 1,000.00 | | | 1,021.94 | | 0.60 | | | | 3.02 |
High Yield Fund — Shares | | | 1,000.00 | | | 1,019.75 | | 1.04 | | | | 5.24 |
Long-Term Tax-Exempt Fund — Shares | | | 1,000.00 | | | 1,020.94 | | 0.80 | | | | 4.03 |
Intermediate-Term Tax-Exempt Fund — Shares | | | 1,000.00 | | | 1,021.69 | | 0.65 | | | | 3.28 |
Short-Term Tax-Exempt Securities Fund — Shares | | | 1,000.00 | | | 1,021.94 | | 0.60 | | | | 3.02 |
New York Intermediate-Term Tax-Exempt Fund — Shares | | | 1,000.00 | | | 1,020.94 | | 0.80 | | | | 4.03 |
California Tax-Exempt Income Fund — Shares | | | 1,000.00 | | | 1,022.44 | | 0.50 | | | | 2.52 |
| * | Annualized expense ratios of certain funds are after fee waivers and expense reimbursements by the investment adviser. Absent such waivers and reimbursements, expenses paid during the period would have been greater. |
| ** | Expenses are equal to the Fund’s annualized expense ratio multiplied by the average account value over the period, multiplied by the number of days in the most recent fiscal half-year (182) then divided by 365. |
80
AR-FIXEDINC-0305/43797
The registrant has adopted a code of ethics that applies to the registrant’s principal executive officer, principal financial officer, principal accounting officer or controller, or persons performing similar functions. This code of ethics is included as an Exhibit 12 (a)(1).
During the period covered by the report, with respect to the registrant’s code of ethics that applies to its principal executive officer, principal financial officer, principal accounting officer or controller, or persons performing similar functions; there have been no amendments to, nor any waivers granted from, a provision that relates to any element of the code of ethics definition enumerated in paragraph (b) of this Item 2.
| Item 3. | Audit Committee Financial Expert. |
3(a)(1) The registrant’s board of directors has determined that the registrant has at least one audit committee financial expert serving on its audit committee.
3(a)(2) The audit committee financial experts are Frederick S. Wonham and Rodman L. Drake, who are “independent” for purposes of this Item 3 of Form N-CSR.
| Item 4. | Principal Accountant Fees and Services. |
For the fiscal years ended March 31, 2005 and March 31, 2004, the aggregate fees billed by Deloitte & Touche LLP for professional services rendered for the audits of the financial statements, or services that are normally provided in connection with statutory and regulatory filings or engagements for the fiscal year for the Registrant are shown in the table below.
| | | | |
| | | 2005
|
| | | All fees and services to the Registrant that were pre-approved
| | All fees and services to services Affiliates that were pre-approved
|
(a) Audit Fees (1) | | $475,822 | | N/A |
(b) Audit-Related Fees (2) | | $ 20,477 | | $0 |
(c) Tax Fees (3) | | $104,000 | | $0 |
(d) All Other Fees (4) | | $ 0 | | $0 |
| | | | |
| | | 2004
|
| | | All fees and services to the Registrant that were pre-approved
| | All fees and services to services Affiliates that were pre-approved
|
(a) Audit Fees (1) | | $498,342 | | N/A |
(b) Audit-Related Fees (2) | | $ 0 | | $0 |
(c) Tax Fees (3) | | $ 0 | | $0 |
(d) All Other Fees (4) | | $ 0 | | $0 |
Notes:
| (1) | Audit fees include amounts related to the audit of the Registrant’s annual financial statements and services normally provided by the accountant in connection with statutory and regulatory filings. |
| (2) | For the fiscal year ended March 31, 2005, there were audit related fees of $20,477 for assurance and related services by Deloitte & Touche. Such assurance services included a review of the accounting conversion on December 13, 2004 for the Registrant. For the fiscal year ended March 31, 2004, there were no fees for assurance and related services by Deloitte & Touche LLP reasonably related to the performance of the audit of the Registrant’s financial statements that were not reported under (a) of this item. |
| (3) | For the fiscal year ended March 31, 2005, the aggregate tax fees billed for professional services rendered by Deloitte & Touche LLP for tax compliance, tax advice, and tax planning were $104,000. Such tax services included the review of income and excise tax returns for the Registrant. For the fiscal year ended March 31, 2004 there were no tax fees billed for professional services rendered by Deloitte & Touche LLP for tax compliance, tax advice, and tax planning. |
| (4) | For the fiscal years ended March 31, 2005 and March 31, 2004, there were no fees billed for professional services rendered by Deloitte & Touche LLP to the Registrant, other than the services reported in (a) through (c) of this Item. |
(e) (1) The audit committee has adopted policies and procedures that require pre-approval of audit and non-audit services for the Funds and certain other services provided to the Fund’s affiliates in accordance with Rule 2-01 (c) (7) of Regulation S-X. The pre-approval requirement for non-audit services for the Funds, the Funds’ investment adviser and the adviser’s control affiliates may be waived if: (i) the aggregate amount of all services provided constitutes not more than 5% of the total amount of revenues paid to the Funds’ independent accountant by the Funds and the Funds’ investment adviser and its control affiliates that provide ongoing services to the Funds during the fiscal year in which the services are provided that would have to be pre-approved by the Funds’ Audit Committee; (ii) such services were not recognized at the time of the engagement to be non-audit services; and (iii) such services are promptly brought to the attention of the Audit Committee and approved prior to the completion of the audit by the Audit Committee or by its designated Audit Committee member (s).
(e)(2) Percentage of fees billed applicable to non-audit services pursuant to waiver of pre-approval requirement were as follows:
| | | | |
| | | 2005
| | 2004
|
Audit-Related Fees | | N/A | | N/A |
Tax Fees | | N/A | | N/A |
All Other Fees | | N/A | | N/A |
(f) Not applicable.
(g) For the fiscal years ended March 31, 2005 and March 31, 2004, the aggregate non-audit fees billed by Deloitte & Touche LLP for services rendered to the Registrant and the Advisers and any entity controlling, controlled by, or under common control with the Advisers that provided ongoing services to the Registrant were $1,248,972 and $1,072,000, respectively.
(h) The Registrant’s Audit Committee has considered whether its principal accountant’s provision of non-audit services that were rendered to the Registrant’s investment adviser, and any control persons of the investment adviser that provides ongoing services to the Registrant, that were not pre-approved pursuant to paragraph (c) (7) (ii) of Rule 2-01 of Regulation S-X, is compatible with maintaining the principal accountant’s independence.
| Item 5. | Audit Committee of Listed Registrants. |
Not applicable.
| Item 6. | Schedule of Investments. |
Complete schedule of investments is included in Item 1.
| Item 7. | Disclosure of Proxy Voting Policies and Procedures for Closed-End Management Investment Companies. |
Not applicable.
| Item 8. | Portfolio Managers of Closed-End Management Investment Companies. |
Not applicable.
| Item 9. | Purchases of Equity Securities by Closed-End Management Investment Company and Affiliated Purchasers. |
Not applicable.
| Item 10. | Submission of Matters to a Vote of Security Holders. |
There have been no material changes to the procedures by which shareholders may recommend nominees to the Registrant’s board of directors after Registrant last provided disclosure in response to the requirement of Item 7(d) (2) (ii) (G) of Schedule 14A, or this Item 10.
| Item 11. | Controls and Procedures. |
The registrant’s principal executive officer and principal financial officer have concluded, based on their evaluation of the registrant’s disclosure controls and procedures as conducted within 90 days of the filing date of this report, that these disclosure controls and procedures are adequately designed and are operating effectively to ensure that information required to be disclosed by the registrant on Form N-CSR is (i) accumulated and communicated to the investment company’s management, including its certifying officers, to allow timely decisions regarding required disclosure; and (ii) recorded, processed, summarized and reported within the time periods specified in the Securities and Exchange Commission’s rules and forms.
There were no changes in the registrant’s internal control over financial reporting that occurred during the second fiscal quarter of the period covered by this report that have materially affected or are reasonably likely to materially affect, the registrant’s internal control over financial reporting.
(a)(1) Code of Business Conduct and Ethics for principle executive and senior financial officers, attached hereto.
(a)(2) A separate certification for the principal executive officer and the principal financial officer of the registrant as required by Rule 30a-2 (a) under the Investment Company Act of 1940, as amended (17 CFR 270.30a-2(a)), are filed herewith.
(b) Officer certifications as required by Rule 30a-2 (b) under the Investment Company Act of 1940, as amended (17 CFR 270.30a-2(b)) also accompany this filing as an Exhibit.
SIGNATURES
Pursuant to the requirements of the Securities Exchange Act of 1934 and the Investment Company Act of 1940, the registrant has duly caused this report to be signed on its behalf by the undersigned, thereunto duly authorized.
| | |
| (Registrant) Excelsior Funds, Inc |
| |
| By (Signature and Title)* | | /s/ Mary Martinez |
| | | Mary Martinez President |
Date 06/09/05
Pursuant to the requirements of the Securities Exchange Act of 1934 and the Investment Company Act of 1940, this report has been signed below by the following persons on behalf of the registrant and in the capacities and on the dates indicated.
| | |
| |
| By (Signature and Title)* | | /s/ Mary Martinez |
| | | Mary Martinez President |
Date 06/09/05
| | |
| |
| By (Signature and Title)* | | /s/ Agnes Mullady |
| | | Agnes Mullady Treasurer, Chief Financial Officer and Chief Accounting Officer |
Date 06/09/05
| * | Print the name and title of each signing officer under his or her signature. |