| | |
OMB APPROVAL |
OMB Number: | | 3235-0570 |
Expires: | | September 30, 2007 |
Estimated average burden |
hours per response | | 19.4 |
UNITED STATES
SECURITIES AND EXCHANGE COMMISSION
Washington, D.C. 20549
FORM N-CSR
CERTIFIED SHAREHOLDER REPORT OF REGISTERED
MANAGEMENT INVESTMENT COMPANIES
| | |
| Investment Company Act file number 811-04088 |
Excelsior Funds, Inc.
|
| (Exact name of registrant as specified in charter) |
| | |
101 Montgomery Street San Francisco, CA 94104 |
| (Address of principal executive offices) (Zip code) |
BISYS Fund Services
3435 Stelzer Road
Columbus, Ohio 43219
|
| (Name and address of agent for service) |
Registrant’s telephone number, including area code: 1-415-627-7000
Date of fiscal year end: March 31, 2007
Date of reporting period: March 31, 2007
| Item 1. | Reports to Stockholders. |

EQUITY FUNDS
ANNUAL REPORT
March 31, 2007
TABLE OF CONTENTS
For shareholder account information, current price and yield quotations, or to make an initial purchase or obtain a prospectus, call (800) 446-1012, from overseas, call (617) 483-7297.
| · | | Internet Address: http://www.excelsiorfunds.com |
This report must be preceded or accompanied by a current prospectus.
You should consider the Funds’ investment objectives, risks and expenses carefully before you invest. Information about these and other important subjects is in the Funds’ prospectus, which you should read carefully before investing.
Nothing in this report represents a recommendation of a security by the investment adviser. Manager views and portfolio holdings may have changed since the report date.
Investments in equity securities are subject to sudden and unpredictable drops in value and periods of lackluster performance.
Funds which concentrate their investments in one economic sector or in a geographical region may expose an investor to greater volatility. When used as part of a broader investment portfolio, these funds may serve to reduce overall portfolio volatility. Currency fluctuations, differences in security regulation, accounting standards, and foreign taxation regulation are among the risks associated with foreign investing as well as political risk—investing in emerging markets may accentuate these risks.
Small cap stocks may be less liquid and subject to greater price volatility.
Value-based investments are subject to the risk that the broad market may not recognize their intrinsic value.
A description of the policies and procedures that Excelsior Funds use to determine how to vote proxies relating to portfolio securities, as well as information relating to how a Fund voted proxies relating to portfolio securities during the most recent 12-month period ended June 30, is available (i) without charge, upon request, by calling (800) 446-1012, or (ii) by accessing the Excelsior Funds’ internet address and (iii) on the Commission’s website at http://www.sec.gov.
Excelsior Funds file their June 30 and December 31 schedule of portfolio holdings with the Securities and Exchange Commission, on Form N-Q, within sixty days after the applicable reporting period. Excelsior Funds Form N-Q is available on the Commission’s website at http://www.sec.gov, and may be reviewed and copied at the Commission’s Public Reference Room in Washington, DC. Information on the operation of the Public Reference Room may be obtained by calling (800) SEC-0330.
A schedule of each Fund’s portfolio holdings, as of the end of the prior month, is also available on the Funds’ website at www. excelsiorfunds.com. This schedule is updated monthly, typically by the 15th calendar day, after the end of each month. The Funds may terminate or modify this policy at anytime.
Excelsior Funds, Inc. and Excelsior Funds Trust are distributed by BISYS Fund Services Limited Partnership.
You may write to Excelsior Funds, Inc. and Excelsior Funds Trust at the following address:
Excelsior Funds
P.O. Box 8529
Boston, MA 02266-8529
Notice About Duplicate Mailings
The Excelsior Funds have adopted a policy that allows the Funds to send only one copy of a Fund’s prospectus and annual and semi-annual reports to certain shareholders residing at the same “household.” This reduces Fund expenses, which benefits you and other shareholders. If you do not want your mailings to be “householded,” please call (800) 542-1061 or contact your financial intermediary.
SHARES OF THE FUNDS ARE NOT DEPOSITS OR OBLIGATIONS OF, OR GUARANTEED OR ENDORSED BY, ANY BANK, AND THE SHARES ARE NOT FEDERALLY INSURED BY THE FEDERAL DEPOSIT INSURANCE CORPORATION, BANK INSURANCE FUND, FEDERAL RESERVE BOARD, OR ANY OTHER GOVERNMENTAL AGENCY. FUND SHARES ARE NOT INSURED OR GUARANTEED BY THE U.S. GOVERNMENT. AN INVESTMENT IN A FUND IS SUBJECT TO RISK OF PRINCIPAL.
LETTER TO SHAREHOLDERS
March 31, 2007
Dear Valued Excelsior Fund Shareholder,
I am pleased to bring you the annual report for the year ended March 31, 2007 for the Excelsior Funds. The funds in this report are part of the Excelsior Fund family which has over $20 billion in assets as of the end of the reporting period and includes a wide array of asset classes and investment strategies designed to meet the individual investor’s investment needs.
By now, you have received notification that on November 20, 2006, The Charles Schwab Corporation (“Schwab”) announced an agreement to sell the U.S. Trust Corporation (“U.S. Trust”), a wholly-owned subsidiary of Schwab, to the Bank of America Corporation (“Bank of America”) (the “Sale”). The Sale involves all of U.S. Trust’s subsidiaries, including the Excelsior Funds’ investment advisers, UST Advisers, Inc. (“USTA”) and United States Trust Company National Association, on behalf of its asset management division, U.S. Trust New York Asset Management (“USTNA”). Consequently, the Excelsior Funds will need to enter into new investment advisory agreements with USTA and USTNA.
At a meeting held on January 8, 2007, the Board approved new investment advisory agreements under which, subject to approval by the Excelsior Funds’ shareholders, USTA and USTNA will continue to serve as investment advisers to the Excelsior Funds after the Sale is completed. At the same meeting, the Board directed that the new investment advisory agreements be submitted to the shareholders of each Fund for approval.
A Special Meeting of Shareholders of Excelsior Funds, Inc., Excelsior Tax-Exempt Funds, Inc and Excelsior Funds Trust and each of their funds was held on March 30, 2007. The number of votes necessary to conduct the Special Meeting and approve the new investment advisory agreements was obtained for each fund except the Value and Restructuring, Energy and Natural Resources and Treasury Money Funds. The Special Meeting for Value and Restructuring, Energy and Natural Resources and Treasury Money Funds was adjourned for the purpose of soliciting additional proxies, and we anticipate that the new investment advisory agreements will be approved by the shareholders of these funds at a subsequent Special Meeting.
The integration of U.S. Trust, Bank of America's private bank and its ultra high net worth extension will create the nation’s largest private wealth management firm with assets under management of over $260 billion and total client assets of almost $420 billion.
We at the Excelsior Funds are excited about our future within Bank of America and remain committed to helping you with your long-term investment goals. Thank you for investing with us.
Sincerely,

Evelyn Dilsaver
President
1
EXCELSIOR FUNDS | EQUITY MARKET REVIEW |
Equity Market Review
After breezing through the end of the Funds’ fourth fiscal quarter, the financial markets generally, and equities in particular—encountered severe headwinds as the Excelsior Funds began their new fiscal year in April of 2006. Emerging markets in particular fell 4.3% in the fiscal first quarter. Non-U.S. equities overall, however, managed to achieve a small gain, thanks to advances in Europe. The U.S. equity market declined during these first three months as well (the S&P 500 Index was down 1.4%, while the Russell 1000 Index declined 1.7%), amidst concerns about the Federal Reserve’s (Fed) tightening policy, inflation, and gradually mounting worries about global growth and a hard landing in the U.S. Small caps were bested by large caps (the Russell 2000 Index was down 5% in the quarter), with small cap growth stocks the weakest-performing market segment. Value outperformed growth no matter the market cap as investors became defensive. In this period, energy, utilities and integrated oils were the best-performing sectors. Technology and health care were the weakest-performing sectors in the period.
Volatility continued unabated through the first part of the summer, until August, when investor appetite for risk returned, and the equity markets rebounded strongly. The long-anticipated Fed pause and a drop in energy prices were among the reasons for the improving environment. For the fiscal second quarter, the S&P 500 Index, for instance, saw a 5.7% advance. Large caps continued their outperformance versus mid- and small-cap stocks, and value continued to best growth, although growth did appear to be gaining a better footing in the period. Among economic sectors, financial services rallied on the Fed pause, while technology, health care and utilities (telecom) sectors all were given a boost by strong M&A activity in the period. Non-U.S. equity markets, paced by Continental Europe, were mostly up in the quarter, although a slightly stronger U.S. dollar had an impact on results. Japanese and emerging markets saw a rebound as well.
The positive conditions continued into the fiscal third quarter, given the Fed’s decision not to raise rates, lower oil prices, and encouraging inflation numbers. For the quarter, the S&P 500 Index achieved a 6.7% gain. While large cap stocks were strong in the period, they did give away their leadership position to small caps. Value continued to outperform growth. On a sector basis, performance across sectors was strong overall, although energy (integrated oils) saw the largest gains; health care saw the smallest advance, given investor concerns over a Democrat-controlled Congress.
The final fiscal quarter (the first calendar quarter of 2007) saw volatility return to the markets with a large sell-off in late February, although most of the world’s equity markets managed to come in basically flat for the three-month period. International markets, led by the developed markets, advanced in the period, and in most cases outpaced the U.S. market.
Outlook
The current market environment is similar to conditions that prevailed at the end of December. At that time, the markets were dealing with excess noise on the health of the economy—related specifically to inflation and slowing growth in the U.S., and how that slowing growth would impact economies around the world. Later, in the first months of the new calendar year, equities saw a sharp correction sparked by weakness in the sub-prime mortgage sector. While leading inflation indicators remained weak, actual inflation had yet to roll over, and concerns were mounting that earnings would come in better than expected. The fear was the Fed would not be able to cut interest rates anytime soon.
2
EXCELSIOR FUNDS | EQUITY MARKET REVIEW |
Right now, the focus continues on earnings. For our part, we still expect to see some muted earnings growth in 2007 accompanied by a bit of P/E expansion as rates come down. We’re also expecting a re-acceleration of the equity market to occur toward year-end, after we work through what we expect will be a typical summer dry period. Our rationale? Inflation is not much of a concern (which should become increasingly apparent in coming months), economic growth is slowing, and we believe the Fed has ample ammunition to cut interest rates—and is likely to do so in the next several months, thereby averting a growth slowdown becoming a recession.
Equities should, as a result, continue overweight relative to fixed income, even though we believe yields will be lower by year-end. Within equities, we continue to believe non-U.S. growth and valuations are more attractive than they are in the U.S., driven in large part by continued growth in Europe and Japan. European equity markets continue to benefit from huge deal flow. Japan is making its way out of a long slump, and we’re still at the early stages of the adjustment process. Within the U.S., we plan to focus on high-quality cash-generating businesses that provide a decent yield, as well as selective growth stories.
3
EXCELSIOR FUNDS, INC. | BLENDED EQUITY FUND |
Performance Summary
For the fiscal year ended March 31, 2007, the Excelsior Blended Equity Fund slightly underperformed the S&P 500 Index. To be more specific, the actively managed portion of the Fund outperformed, while the quantitative overlay portion brought the overall portfolio closer to the S&P 500 Index.
Performance Attribution
The strongest performers for the trailing year were spread across sectors. Utility company TXU Corporation was the top performer, followed by Exxon Mobil, pharmaceutical companies Novo Nordisk and Abbott Laboratories, and the auction house Sotheby’s. Underperformers were focused in the consumer sector, including Furniture Brands, Timberland, and Eastman Kodak, as well as land-owner and developer St. Joe, and technology company National Instruments.
The utilities sector was the best-performing sector from a relative standpoint, followed by the health care and industrials sectors, while stock selection in consumer discretionary and no weight in telecommunications services hurt Fund performance.
Portfolio Activity
In the past 12 months, the active portion of the Fund has included a move away from direct exposure to the U.S. consumer and into revenues generated in currencies other than the U.S. dollar. This has been motivated by a concern that the U.S. economy is entering a cyclical slowdown that will translate into a challenging business environment for companies earning revenues in already-weak U.S. dollars. In addition, we continued to build on several themes: the growing impact of biotechnology, as represented by investments including Monsanto, Roche, NovoNordisk and Senomyx; the changing nature and pricing of energy (ExxonMobil, Suncor, AES, El Paso, BorgWarner); and global expansion (Expeditors International, GE, NYSE Group). From an overall investment standpoint, we continue to seek out companies with excellent corporate culture and management or those stocks that are simply cheap.
In keeping with these themes, additions to the active portion of the fund included stocks with a global reach, such as the Singapore Exchange, NYSE Group and Expeditors International of Washington; beneficiaries of the changing nature of energy use, including International Rectifier and Borg Warner; and a biotech, Senomyx. Eliminations included companies undergoing significant changes during a time likely to make a successful restructuring difficult, including Eastman Kodak, Analog Devices and Furniture Brands.
Selected Additions:
| • | The Singapore Exchange (SGX.SI) is a global capital markets exchange focused on a combination of domestic and foreign stocks and derivative products. The Exchange is an exceptionally well-managed business that is well positioned globally and functions within a regulatory environment closely aligned to business goals. It is led by an innovative and driven management and is growing rapidly in a wide variety of products. The Exchange sits at the fulcrum of several trends in global capital markets. |
4
EXCELSIOR FUNDS, INC. | BLENDED EQUITY FUND |
| • | Microchip’s corporate culture separates it from its competition and has helped lead the company back from the edge of bankruptcy and into a high-margin, high-efficiency market leader. Microchip’s powerful corporate culture is central to our investment thesis. A good example of this culture is the sales force incentive—people are paid not on commission, but on company-wide metrics. This has led to a more collegial and satisfying relationship with customers, who are in turn measurably more loyal. This kind of company-driven and customer-focused thinking is critical to market gains and to margin growth, in our view. |
| • | RHJ International is the publicly traded investment vehicle of Ripplewood. Among Ripplewood’s best-known transactions are the acquisitions of Japan Telecom, the largest leveraged buyout in Japan, and The Long-Term Credit Bank of Japan, since renamed Shinsei Bank. |
| • | Expeditors International of Washington is a high-quality company in the rapidly growing global freight forwarding and logistics industry. The industry is highly fragmented with no logistics provider having greater than low-single-digit market share. As freight forwarding grows globally and Expeditors takes some share, the company has the opportunity to grow at a rapid pace. Expeditors fits in our portfolio of companies that treat their employees well. Each company office is its own profit center, and there is no limit to how much a manager can earn if successful. The corporate culture has led to low turnover, a distinct advantage in an industry where repeat business is almost entirely relationship-driven. |
Selected Eliminations:
| • | Analog Devices (ADI) was eliminated based on a combination of fundamental and valuation concerns. Specifically, ADI’s power management segment has been underperforming and losing share to more effective competitors; the DSP unit has also been losing share and will likely continue to do so. |
| • | Furniture Brands was eliminated to realize losses and raise funds for new investments. The company has been unable to weather the difficult environment in residential furniture in spite of a three-year long restructuring effort. |
| • | At Eastman Kodak, the speed with which traditional revenues were drying up accelerated and new revenue generation showed signs of coming on slower than projected. |
| • | At the time of elimination from the Fund, AutoZone had not lived up to its potential market-share gains in the commercial space and had been giving up share in its strongest markets. In addition, hoped-for margin growth hadn’t materialized. |
Outlook
The active investment team of the Excelsior Blended Equity Fund continues to seek investment opportunities within—but not limited to—the three themes outlined above that fit in our dual strategy of investing in companies with excellent corporate cultures or those that are simply cheap. This strategy is combined with a quantitative risk overlay which has been developed to dampen Fund volatility relative to the S&P 500 Index.
Richard Bayles
Managing Director and Senior Portfolio Manager
5
EXCELSIOR FUNDS, INC. | BLENDED EQUITY FUND |

Past performance is not predictive of future performance. Investment returns and principal values will vary and shares may be worth more or less at redemption than their original cost.
The above illustration compares a $10,000 investment made in the Fund and a broad-based index over the past ten fiscal years. The chart assumes all dividends and capital gain distributions are reinvested. The Fund’s performance takes into account fees and expenses. The index does not take into account charges, fees and other expenses. Further information relating to Fund performance is contained in the Financial Highlights section of the Prospectus and elsewhere in this report.
| | | |
| | |
Expense Ratio (As of 7/31/06) | | Shares | |
Gross Expense Ratio | | 1.21 | % |
Net Expense Ratio | | 1.10 | % |
The expense information in the table reflects contractual fee waivers currently in effect. This information is included in the most current prospectus available to current and prospective shareholders of the Fund. The Adviser has contractually agreed to waive fees or reimburse expenses in order to keep total operating expenses from exceeding 1.10%. The waiver agreement may not be terminated before July 31, 2007. In addition, this agreement will renew automatically for an additional 12 month term unless the Adviser terminates the agreement by providing written notice to the Fund prior to the expiration of the current term.
| * | | Total return represents the change during the period in a hypothetical account with dividends reinvested. |
| ** | | Source: Standard & Poor’s Corporation—Reflects the reinvestment of income dividends and, where applicable, capital gain distributions. The Standard & Poor’s 500 Composite Stock Price Index is a widely accepted unmanaged index of U.S. stock market performance. |
| † | | Currently certain fees are waived. Had certain fees not been waived, returns would have been lower. Returns do not reflect the deduction of taxes that a shareholder would pay on Fund distributions or the redemption of shares. Returns do not reflect the 2% fee imposed on shares redeemed 30 days or less after their date of purchase. |
6
EXCELSIOR FUNDS, INC. | ENERGY AND NATURAL RESOURCES FUND |
Performance Summary
For the fiscal year ended March 31, 2007, the Excelsior Energy and Natural Resources Fund successfully navigated a highly volatile commodity price environment, modestly underperforming the S&P 500 Index.
Performance Attribution
End-point to end-point, crude oil prices were essentially flat at approximately $66.00 per barrel. On an interim basis, however, crude soared to $77.00 per barrel in August 2006—in the midst of the Iran nuclear stalemate—and subsequently plummeted to a low of nearly $50.00 per barrel in January 2007 in reaction to rising inventory levels and an unusually warm January across the Northern Hemisphere.
Following a five-year run-up in crude oil prices from $20.00 per barrel in 2001 to $77.00 per barrel in August 2006, the market is now struggling to determine a mid-cycle or ‘normalized’ price band which, we believe, could prove to be $50.00 to $70.00 per barrel, or an average of $60.00 per barrel in 2007.
Given the aforementioned price volatility, outperformance was concentrated in small-capitalization names with strong unit volume growth; i.e., HudBay Minerals a beneficiary of soaring zinc prices; Arena Resources, an emerging oil producer, and Kodiak Oil & Gas, an early cycle natural gas producer. Two large-capitalization names also contributed, notably Phelps Dodge—which was acquired by Freeport McMoran Copper and Gold—and ExxonMobil—which showed strong production volume growth and benefited from its defensive characteristics in a volatile energy tape.
Portfolio Activity
As we enter the second calendar quarter of 2007, we maintain a barbell strategy with a blend of large capitalization and small capitalization stocks. We initiated positions in two refiners, Valero Energy and Sunoco, which are benefiting from strong motor gasoline demand and restructuring. We also initiated positions in Deere & Company, a derivative on the explosive demand for ethanol and a beneficiary of rising corn prices; Energy Conversion Devices, a play on both batteries for hybrid engines and the manufacture of solar film; and participated in the initial public offering of Claymont Steel, a producer of customized steel plate, a critical ingredient for infrastructure development such as bridge repair and ethanol tank railroad car components.
Overall, we reduced positions in the major oils in January, concerned with the prospect of several quarters of flat to down earnings—given difficult comparisons with last year, when crude averaged $70.00 during the June and September quarters of 2006. The proceeds sourced an increase in our natural resource component in an effort to dampen volatility due to oil and gas prices.
Outlook
We will continue to take advantage of underlying commodity price volatility to buy select names on price dips and remain constructive on the energy and natural resource sector. Producers are challenged to replace production and reserves in a strong demand environment led by the ongoing industrialization and urbanization of China and emerging economies of Brazil and India.
The greatest threat to the end of the energy cycle is escalating crude oil prices, which could eventually choke off demand and induce a global recession. We believe that OPEC is well aware of this risk and has sufficient spare capacity to (1) contain a potential spike in oil prices and (2) ratchet down production to defend a $50.00 floor and manage a mid-cycle price believed to be in the $60.00 per
7
EXCELSIOR FUNDS, INC. | ENERGY AND NATURAL RESOURCES FUND |
barrel area. While cautious on North American natural gas prices near term due to high storage levels upon the exit of winter, we would look to add to gas–levered names on potential breaks in the natural gas price toward $6.00 per MCF (1,000 cubic feet), the lower end of our forecasted $6.00 to $8.00 per MCF range.
After several years of strong free cash flow, company balance sheets are vastly improved. Value-enhancing levers include dividend increases, share repurchase and merger activity.
Michael E. Hoover
Managing Director and Portfolio Manager
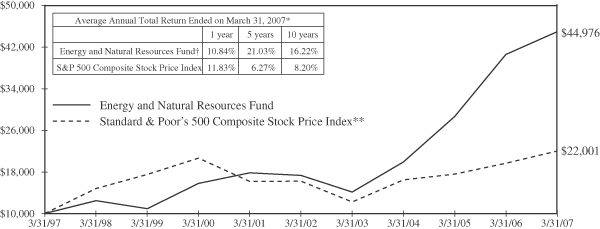
Past performance is not predictive of future performance. Investment returns and principal values will vary and shares may be worth more or less at redemption than their original cost. Concentration in one economic sector may subject an investor to greater volatility.
The above illustration compares a $10,000 investment made in the Fund and a broad-based index over the past ten fiscal years. The chart assumes all dividends and capital gain distributions are reinvested. The Fund’s performance takes into account fees and expenses. The index does not take into account charges, fees and other expenses. Further information relating to Fund performance is contained in the Financial Highlights section of the Prospectus and elsewhere in this report.
| | | |
Expense Ratio (As of 7/31/06) | | Shares | |
Gross Expense Ratio | | 1.13 | % |
This information is included in the most current prospectus available to current and prospective shareholders of the Fund. The Adviser has contractually agreed to waive fees or reimburse expenses in order to keep total operating expenses from exceeding 1.25%. The waiver agreement may not be terminated before July 31, 2007. In addition, this agreement will renew automatically for an additional 12 month term unless the Adviser terminates the agreement by providing written notice to the Fund prior to the expiration of the current term.
| * | | Total return represents the change during the period in a hypothetical account with dividends reinvested. |
| ** | | Source: Standard & Poor’s Corporation—Reflects the reinvestment of income dividends and, where applicable, capital gain distributions. The Standard & Poor’s 500 Composite Stock Price Index is a widely accepted unmanaged index of U.S. stock market performance. |
| † | | Certain fees may be waived. Had certain fees not been waived, returns would have been lower. Returns do not reflect the deduction of taxes that a shareholder would pay on Fund distributions or the redemption of shares. One year returns presented in the table differs from the return presented in the Financial Highlights. Returns do not reflect the 2% fee imposed on shares redeemed 30 days or less after their date of purchase. |
8
EXCELSIOR FUNDS TRUST | EQUITY INCOME FUND |
Performance Summary
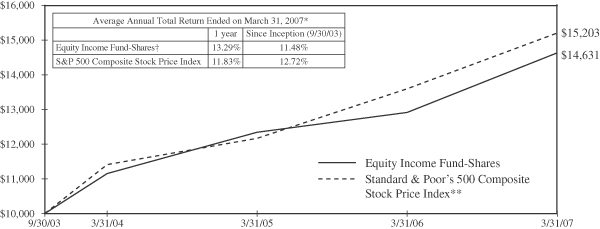
The Excelsior Equity Income Fund outperformed the S&P 500 Index over the last twelve months. This outcome is a result of our efforts to grow our income stream by purchasing stocks at attractive initial yields and by owning companies with progressive dividend policies. The Fund concentrates on investing in stocks that offer above-average dividend yields or have the potential to grow their dividends at above-average rates.
Performance Attribution
The strongest contributors to performance were RPM International, Chevron and AT&T. RPM, one of our largest holdings and best performers, has industrial operations that are growing nicely and legacy asbestos costs that are moderating. Chevron’s total returns are directly related to their outstanding earnings growth amidst a strong energy price environment. Telecom stocks underperformed in 2005 despite improving industry fundamentals, so AT&T’s recent strong performance is a culmination of investor recognition of improving fundamentals while the stock was trading at low valuations. In addition, AT&T’s acquisitions (purchasing the historic AT&T and Bellsouth in the last 18 months) are being viewed more favorably today in light of improving industry fundamentals.
Our worst contributors to performance were Home Depot, Halliburton and WP Stewart. We continue to hold Home Depot and Halliburton and like their respective outlooks. We fortunately sold W.P. Stewart in the summer of 2006 at higher prices than today’s. We lost confidence in W.P. Stewart’s turnaround, despite efforts to fix their asset accumulation problems. As part of our sell discipline, if a company is not making fundamental progress versus our expectations over a 2 year time frame, we will exit the stock.
We believe Halliburton remains attractive because its Energy Services Group has excellent growth opportunities. Global demand for energy services should be strong for several years, resulting in strong volume and significant pricing power for Halliburton and its peers. Halliburton has a particularly strong business serving North America’s gas production needs, but this opportunity is overshadowed by short-term concerns of a North American natural gas overhang. The value of the Energy Services Group within Halliburton has been obscured by the lumpy and controversial business of Kellogg, Brown and Root (KBR). The separation of KBR from Halliburton should help highlight the value of the Energy Services Group.
Portfolio Activity
During the last year, we initiated four new significant positions: Home Depot, SuperValu, Penn West Energy and Xilinx.
Home Depot operates in a favorable retail category. Lowe’s and Home Depot have less formidable competitors in their segment compared to any other big box category; this dynamic is supported by excellent growth and profit margins for both companies. Furthermore, the housing stock has expanded greatly over the last 10 years, which bodes well for future home improvement spending.
All in all, sales should grow at least 5-10% over the next several years and earnings per share (EPS) should grow approximately 10% plus. The company sells for 12x earnings and produces considerable free cash flow. We believe their acquisitions and their large repurchases of stock are high quality investments. Their dividend payout ratio is 35% and it is likely to modestly increase over time. The stock’s current yield is 2.4%; the company increased its dividend by 125% over the last year.
9
EXCELSIOR FUNDS TRUST | EQUITY INCOME FUND |
SuperValu, a grocery retailer, is engaged in a transforming deal by teaming up with Cerberus and CVS to purchase the assets of Albertsons. SuperValu acquired the best stores within the Albertsons network, with Cerberus and CVS purchasing the balance of the supermarket and stand-alone pharmacy locations. As a result, SuperValu’s base increased by 1,200 stores; its revenue should increase from $19 billion to $45 billion. Importantly, about 75% of its revenue will be from regions where it is either #1 or #2 in market share.
Penn West Energy Trust is a Canadian income trust with significant gas and oil production potential. It has three long-term projects worthy of note: 1) it has begun to farm out some of its 4.3 million acres of undeveloped land. Farming out is a minimally capital intensive method to monetize its large strategic land position; 2) the Seal Oil Sands Project has the potential to greatly enhance the company’s level of heavy oil production. (Initially, primary methods of production are being employed in the Seal project, resulting in less capital intensity. Ultimately, tertiary methods will be needed to greatly enhance production.) 3) it has begun to employ carbon dioxide recovery techniques to its largest conventional oil field, Pembina. Carbon flooding has been very successful in the U.S.
The semiconductor sector represents a growing source of dividend growth as more of these companies recognize the importance of returning excess capital to shareholders in an efficient manner. We like Xilinx because it has a growth business that requires modest capital in order to grow. As a result, it has accumulated a large cash balance ($4.00 per share). Xilinx initiated a dividend 3 years ago in recognition of its strong cash flow and large cash balance, and it has since grown it rapidly. Today, the payout ratio is approximately 45% and yield is 1.8%. The yield could be considered higher if the extra cash were disbursed through a special dividend immediately.
Outlook
The outlook for a dividend-focused approach is positive. Dividend-paying stocks have led the market higher over the last few years, a trend that looks sustainable for the foreseeable future. Since the tax law changes in 2003, the number of companies paying dividends has increased, the average rate of dividend increase has accelerated, and the stocks that pay dividends have outperformed as a group.
Despite these positive developments, the average payout ratio for S&P 500 companies remains historically low because recent earnings growth has been very strong. We believe many companies can “afford” to increase their payout ratio without negatively impacting their growth prospects.
We remain enthusiastic about the earnings growth opportunities for the companies in the Fund and we think that their current valuations are reasonable. In fact, many of our companies have experienced valuation compression over the last two years as earnings growth has outpaced share price appreciation. The fundamental drivers of growth are intact, capital market liquidity is great, investor sentiment is healthy, and valuations are attractive. We remain bullish on the prospects for our companies.
Thomas W. Vail
Managing Director and
Senior Portfolio Manager
Brian V. DiRubbio
Senior Vice President and
Senior Portfolio Manager
10
EXCELSIOR FUNDS TRUST | EQUITY INCOME FUND |
Past performance is not predictive of future performance. Investment returns and principal values will vary and shares may be worth more or less at redemption than their original cost.
The above illustration compares a $10,000 investment made in the Fund and a broad-based index since 9/30/03 (inception date). The chart assumes all dividends and capital gain distributions are reinvested. The Fund’s performance takes into account fees and expenses. The index does not take into account charges, fees and other expenses. Further information relating to Fund performance is contained in the Financial Highlights section of the Prospectus and elsewhere in this report.
| | | |
| | |
Expense Ratio (As of 7/31/06) | | Shares | |
Gross Expense Ratio | | 1.22 | % |
Net Expense Ratio | | 1.10 | % |
The expense information in the table reflects contractual fee waivers currently in effect. This information is included in the most current prospectus available to current and prospective shareholders of the Fund. The Adviser has contractually agreed to waive fees or reimburse expenses in order to keep total operating expenses from exceeding 1.10%. The waiver agreement may not be terminated before July 31, 2007. In addition, this agreement will renew automatically for an additional 12 month term unless the Adviser terminates the agreement by providing written notice to the Fund prior to the expiration of the current term.
| * | | Total return represents the change during the period in a hypothetical account with dividends reinvested. |
| ** | | Source: Standard & Poor’s Corporation—Reflects the reinvestment of income dividends and, where applicable, capital gain distributions. The Standard & Poor’s 500 Composite Stock Price Index is a widely accepted unmanaged index of U.S. stock market performance. |
| † | | Currently certain fees are waived. Had such fees not been waived, returns would have been lower. Returns do not reflect the deduction of taxes that a shareholder would pay on Fund distributions or the redemption of shares. Returns do not reflect the 2% fee imposed on shares redeemed 30 days or less after their date of purchase. |
11
EXCELSIOR FUNDS TRUST | EQUITY OPPORTUNITIES FUND |
Performance Summary
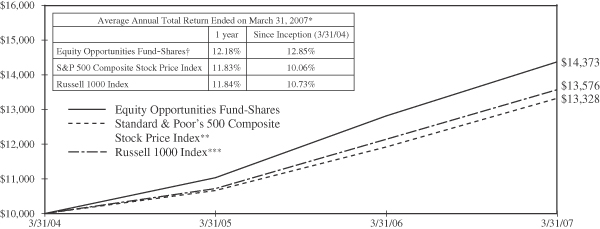
For the year ended March 31, 2007, the Excelsior Equity Opportunities Fund outperformed the S&P 500 Index. The relative outperformance can largely be attributed to individual stock picking in the industrials and health care sectors, and our sector overweight in materials and utilities. Offsetting this outperformance were individual stocks in the information technology and consumer discretionary sectors.
Performance Attribution
The strongest performers in the fiscal year were concentrated in the industrials and materials sector, led by Quanta, Bombardier, Vulcan, Monsanto, Rolls-Royce and Nucor. Sotheby’s and pharmaceutical company Novo Nordisk were strong performers as were financial firms New York Stock Exchange and American Capital Strategies, and utilities CenterPoint Energy and AES. Underperformers came from the consumer and technology sectors, including technology companies 3Com, Analog Devices and National Instruments; Furniture Brands, Timberland, and Eastman Kodak in the consumer space; and land-owner and developer St. Joe.
Portfolio Activity
Over the past 12 months, the Fund has included a move away from direct exposure to the U.S. consumer and into revenues generated in currencies other than the U.S. dollar. This has been motivated by a concern that the U.S. economy is entering a cyclical slowdown that will translate into a challenging business environment for companies earning revenues in already-weak U.S. dollars. In addition, we continued to build on several themes: the growing impact of biotechnology (as represented by investments including Monsanto, Roche, NovoNordisk and Senomyx); the changing nature and pricing of energy (ExxonMobil, Suncor, AES, El Paso, BorgWarner), and global expansion (Expeditors International, GE, NYSE Group). From an overall investment standpoint, we continue to seek out companies with excellent corporate culture and management or those stocks that are simply cheap.
In keeping with these themes, our additions included stocks with global reach, such as Olam International, the Singapore Exchange, NYSE Group and Expeditors International of Washington; beneficiaries of the changing nature of energy use, including International Rectifier and Borg Warner; and a biotech, Senomyx. Eliminations included companies undergoing significant changes during a time likely to make a successful restructuring difficult, including Eastman Kodak, Analog Devices and Furniture Brands.
Selected Additions:
| • | Olam International (OLAM.SI) is a global supply chain manager of agricultural products and food ingredients. The company directly sources goods from over 40 countries and supplies 3,800 customers in 55 countries. Olam’s business model is unique in that it is integrated from the farm gate to the factory—without owning the underlying production process. Olam has projected earnings CAGR at 25%, giving confidence that there is significant growth ahead as the company expands into new commodities, new geographies and into an acquisitive growth phase. |
| • | The Singapore Exchange (SGX.SI) is a global capital markets exchange focused on a combination of domestic and foreign stocks and derivative products. The Exchange is an exceptionally well-managed business that is well positioned globally and functions within a regulatory environment closely aligned to business goals. It is led by an innovative and driven management and is growing rapidly in a wide variety of products. The Exchange sits at the fulcrum of several trends in global capital markets. |
12
EXCELSIOR FUNDS TRUST | EQUITY OPPORTUNITIES FUND |
| • | Microchip’s corporate culture separates it from its competition and has helped lead the company back from the edge of bankruptcy and into a high-margin, high-efficiency market leader. Microchip’s powerful corporate culture is central to our investment thesis. A good example of this culture is the sales force incentive—people are paid not on commission, but on company-wide metrics. This has led to a more collegial and satisfying relationship with customers, who are in turn measurably more loyal. This kind of company-driven and customer-focused thinking is critical to market gains and to margin growth, in our view. |
| • | RHJ International is the publicly traded investment vehicle of Ripplewood. Among Ripplewood’s best-known transactions are the acquisitions of Japan Telecom, the largest leveraged buyout in Japan, and The Long-Term Credit Bank of Japan, since renamed Shinsei Bank. |
| • | Expeditors International of Washington is a high-quality company in the rapidly growing global freight forwarding and logistics industry. The industry is highly fragmented with no logistics provider having greater than low-single-digit market share. As freight forwarding grows globally and Expeditors takes some share, the company has the opportunity to grow at a rapid pace. Expeditors fits in our portfolio of companies that treat their employees well. Each company office is its own profit center, and there is no limit to how much a manager can earn if successful. The corporate culture has led to low turnover, a distinct advantage in an industry where repeat business is almost entirely relationship-driven. |
Selected Eliminations:
| • | Analog Devices (ADI) was eliminated based on a combination of fundamental and valuation concerns. Specifically, ADI’s power management segment has been underperforming and losing share to more effective competitors; the Digital Signal Processors unit has also been losing share and will likely continue to do so. |
| • | Furniture Brands was eliminated to realize losses and raise funds for new investments. The company has been unable to weather the difficult environment in residential furniture in spite of a three-year long restructuring effort. |
| • | At Eastman Kodak, the speed with which traditional revenues were drying up accelerated and new revenue generation showed signs of coming on slower than projected. |
| • | At the time of elimination from the Fund, AutoZone had not lived up to its potential market-share gains in the commercial space and had been giving up share in its strongest markets. In addition, hoped-for margin growth hadn’t materialized. |
Outlook
The Equity Opportunities team continues to seek investment opportunities within—but not limited to—the three themes outlined above that fit in our dual strategy of investing in companies with excellent corporate cultures or those that are simply cheap.
Richard Bayles
Managing Director and
Senior Portfolio Manager
Fatima Dickey
Managing Director and
Portfolio Manager
13
EXCELSIOR FUNDS TRUST | EQUITY OPPORTUNITIES FUND |
Past performance is not predictive of future performance. Investment returns and principal values will vary and shares may be worth more or less at redemption than their original cost.
The above illustration compares a $10,000 investment made in the Fund and a broad-based index since 3/31/04 (inception date). The chart assumes all dividends and capital gain distributions are reinvested. The Fund’s performance takes into account fees and expenses. The index does not take into account charges, fees and other expenses. Further information relating to Fund performance is contained in the Financial Highlights section of the Prospectus and elsewhere in this report.
| | | |
| | |
Expense Ratio
(As of 7/31/06) | | Shares | |
Gross Expense Ratio | | 1.31 | % |
Net Expense Ratio | | 1.05 | % |
The expense information in the table reflects contractual fee waivers currently in effect. This information is included in the most current prospectus available to current and prospective shareholders of the Fund. The Adviser has contractually agreed to waive fees or reimburse expenses in order to keep total operating expenses from exceeding 1.05%. The waiver agreement may not be terminated before July 31, 2007. In addition, this agreement will renew automatically for an additional 12 month term unless the Adviser terminates the agreement by providing written notice to the Fund prior to the expiration of the current term.
| * | | Total return represents the change during the period in a hypothetical account with dividends reinvested. |
| ** | | Source: Standard & Poor’s Corporation—Reflects the reinvestment of income dividends and, where applicable, capital gain distributions. The Standard & Poor’s 500 Composite Stock Price Index is a widely accepted unmanaged index of U.S. stock market performance. |
| *** | | Source: Frank Russell Company—The Russell 1000 Index measures the performance of the 1,000 largest companies in the Russell 3000 Index, which represents approximately 92% of the total market capitalization of the Russell 3000 Index. The Index includes dividends reinvested. |
| † | | Currently certain fees are waived. Had such fees not been waived, returns would have been lower. Returns do not reflect the deduction of taxes that a shareholder would pay on Fund distributions or the redemption of shares. Returns do not reflect the 2% fee imposed on shares redeemed 30 days or less after their date of purchase. |
14
EXCELSIOR FUNDS, INC. | LARGE CAP GROWTH FUND |
Performance Summary
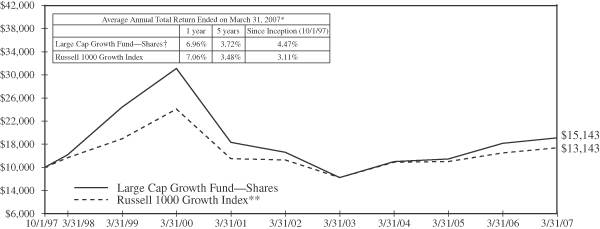
The Excelsior Large Cap Growth Fund over the year ended March 31, 2007 posted solid results, in line with the Russell 1000 Growth Index. That said, it was a difficult year for growth investors. First, earnings growth for the overall market, originally expected to be mid-single digits a year ago, turned out to be in the mid-teens, which was consistent with the price gain of the broad-market S&P 500 Index and double the long-term average rate of EPS growth. In this type of earnings environment, investors were unwilling to pay a premium for high growth companies. Additionally, technology, which represented one of our largest weights, was beaten down by stock options investigations and concerns about the sustainability of growth. Fortunately, the market has gone a long way towards sorting out the good from the bad regarding stock options.
Performance Attribution
Our stock picking helped overcome the above-mentioned drags and deliver positive absolute and benchmark-relative returns. From a sector perspective, we generated positive returns versus the Russell 1000 Growth Index in technology, health care and telecom stocks. Conversely, our picks in the industrial, financial and consumer discretionary sectors hurt. Also, the lack of exposure to materials, utilities and consumer staples was a modest drag. On an individual stock basis, our top five positive contributors in the past year were Research in Motion, Apple Inc., Coach, America Movil and Akamai Technologies. On the flip side, Amgen, Corporate Executive Board, Broadcom, Sallie Mae and eBay were the most significant negative contributors.
Portfolio Activity
We made several company changes to the Excelsior Large Cap Growth Fund in the past year, with eight new additions and ten deletions. We eliminated positions in Carnival Cruise, Dell, Patterson Companies, PetSmart, Wellpoint, Medtronic, SAP, Caremark, Teva Pharmaceuticals and Yahoo. We initiated positions in Akamai, Allergan, Corning, Best Buy, Corporate Executive Board, Intuitive Surgical, Adobe Systems and Las Vegas Sands. We expect these additions to generate EPS growth of 25%, on average, over the next 12 to 18 months, thereby providing attractive total return opportunities. Here are some brief business descriptions of these new additions.
Akamai (AKAM) is the leading provider of content and application delivery services that speed up how content is distributed over the internet, thus enabling organizations to expand and optimize their online content, applications, and business processes better without the required IT investment that would otherwise be necessary to support this growth.
Allergan (AGN) is a global specialty pharmaceutical and medical device company targeting the ophthalmology, neuroscience, medical dermatology and medical aesthetics markets. AGN’s future growth should come from its three core franchises—Ophthalmology, Neurology (Botox) and Aesthetics.
Corning (GLW) is a global technology company with operations in four business segments: Display Technologies, Telecommunications, Environmental Technologies and Life Sciences. GLW stands to benefit from several trends: increased LCD TV penetration, demand for notebook displays and flat-screen monitors, increased fiber deployments, and emissions control regulations.
15
EXCELSIOR FUNDS, INC. | LARGE CAP GROWTH FUND |
Best Buy (BBY) is a leading retailer of consumer electronics, home office, entertainment software, appliances and related services. The company is in the sweet spot of two product cycles, digital TVs and video games, which should continue to drive demand for its products. In addition, the expansion of its Geek Squad and Best Buy for Business platforms is expected to drive incremental growth opportunities.
Corporate Executive Board (EXBD) provides “best practices” research, decision support tools and executive education focusing on corporate strategy, operations and general management issues. The company’s membership-based model permits its clients to learn about the best practices of leading corporations at a fraction of the cost of a customized analysis.
Intuitive Surgical (ISRG) is the market leader in robotic-assisted minimally invasive surgery. The company’s da Vinci surgical system is used primarily in urologic, gynecologic, cardiothoracic and general surgery procedures. Clinically, the benefits and patient outcomes from robotic-assisted minimally invasive surgery are superior to conventional endoscopic surgery.
Adobe Systems (ADBE) is a leading developer of software for creative professionals and consumer hobbyists. Through its broad portfolio of software offerings, ADBE is well positioned to take advantage of several secular trends including the transition to Web 2.0 and rich internet applications, the shift to online advertising, and the increase in digital media consumption.
Las Vegas Sands (LVS) currently operates The Venetian Resort Hotel Casino and Sands Expo and Convention Center in Las Vegas, as well as the Sands Macao. LVS has an aggressive development pipeline being driven by the booming growth of the middle class in China, easing travel restrictions, and a healthy appetite for gaming and leisure consumption. Within a five-hour flight of nearly half of the world’s population, and offering the only legal gaming market in China, the Macao market has quickly become the most significant growth opportunity for gaming operators.
Outlook
Our outlook for growth investing remains positive. While there is no shortage of things to be concerned about, including geo-political angst, energy market volatility, the bursting of a housing bubble and the potential for an economic recession, we see reasons to be optimistic. Economic growth is moderating, but we believe a recession is unlikely. Diplomats are hard at work, sub-prime problems are currently contained, unemployment is low, inflation is low, and corporate profitability is still close to all-time highs. Equities appear attractive from a valuation perspective relative to bonds and real estate; growth stocks in particular look historically cheap relative to value stocks and the market in general. Corporate balance sheets are in good shape and returns on equity in the aggregate are close to all-time highs. After 18 consecutive quarters of double-digit EPS growth from S&P 500 companies, we are now transitioning to a mid-single-digit growth world for 2007. As with the mid-80s and mid-90s mid-cycle slowdowns, this transition may lead investors to pay a premium once again for companies capable of sustaining premium earnings growth like those found in the Excelsior Large Cap Growth Fund.
Thomas M. Gavin, CFA
President and CIO of the Growth Equity Group
16
EXCELSIOR FUNDS, INC. | LARGE CAP GROWTH FUND |
Past performance is not predictive of future performance. Investment returns and principal values will vary and shares may be worth more or less at redemption than their original cost.
The above illustration compares a $10,000 investment made in the Fund and a broad-based index since 10/1/97 (inception date). The chart assumes all dividends and capital gain distributions are reinvested. The Fund’s performance takes into account fees and expenses. The index does not take into account charges, fees and other expenses. Further information relating to Fund performance is contained in the Financial Highlights section of the Prospectus and elsewhere in this report.
| | | |
| | |
Expense Ratio (As of 7/31/06) | | Shares | |
Gross Expense Ratio | | 1.23 | % |
Net Expense Ratio | | 1.20 | % |
The expense information in the table reflects contractual fee waivers currently in effect. This information is included in the most current prospectus available to current and prospective shareholders of the Fund. The Adviser has contractually agreed to waive fees or reimburse expenses in order to keep total operating expenses from exceeding 1.20%. The waiver agreement may not be terminated before July 31, 2007. In addition, this agreement will renew automatically for an additional 12 month term unless the Adviser terminates the agreement by providing written notice to the Fund prior to the expiration of the current term.
| * | | Total return represents the change during the period in a hypothetical account with dividends reinvested. |
| ** | | Source: Frank Russell Company—The Russell 1000 Growth Index is an unmanaged index composed of those Russell 1000 Index companies with higher price-to-book ratios and higher forecasted growth values. The Russell 1000 Index is composed of the 1000 largest companies in The Russell 3000 Index which is composed of 3,000 of the largest U.S. companies by market capitalization. The Index includes dividends reinvested. |
| † | | Currently certain fees are waived. Had certain fees not been waived, returns would have been lower. Returns do not reflect the deduction of taxes that a shareholder would pay on Fund distributions or the redemption of shares. Returns do not reflect the 2% fee imposed on shares redeemed 30 days or less after their date of purchase. |
17
EXCELSIOR FUNDS TRUST MID CAP VALUE AND RESTRUCTURING FUND | |
Performance Summary
A renewed awareness of risk and volatility stands as the hallmark of the past year. While second quarter activity was driven almost wholly by a reaction to new “management” at the Federal Reserve Bank, the third quarter was marked by defensiveness as investors worried whether interest rates were enough to contain inflation, or too much so as to cause recession. This was followed by a clear break in favor of higher stock prices at the end of 2006, only to be followed by a volatile first quarter of 2007 as credit risk emerged in the sub-prime lending sector.
The common assumption that risk has been underpriced, while stated broadly, applies mostly to segments of the fixed income market. The equity market has experienced the opposite, with risk largely overpriced. This has brought on the current wave of leveraged buyouts, debt-financed corporate mergers and debt-financed special dividends—exactly what should happen. We expect it to continue until debt and equity markets reflect a similar view of the future, an event at least as likely to come by way of higher stock prices as by lower bond prices.
To be sure, segments of the equity market, notably stocks of companies heavily involved in high-risk lending, experienced sharp declines and a few bankruptcies. This is normal and necessary in a well-functioning market where businesses, taking on undue risk and betting incorrectly, lose. Left to its own devices, the still inexpensive, broader equity market is likely to rise to levels consistent with the favorable long-term conditions of low inflation and high profitability.
Winners, losers and new additions combined to push the Fund ahead nicely for the past twelve months, roughly in line with broad market measures though behind the Russell Mid-Cap Value Index, which bested nearly all categories with over a 17% return. Divergence from the benchmark is common given the Fund’s relative concentration and emphasis on companies undergoing change, though we prefer it more when the Fund diverges positively from the benchmark as opposed to lagging. Nonetheless, the Fund’s annual performance relative to the index is not surprising considering the pervasive emphasis on near-term risk, which we are willing to bear, in the most recent quarter.
Performance Attribution
The Fund benefited from heightened deal making and debt-financed dividends. The acquisition of Symbol Technologies by Motorola closed in the past quarter. Dean Foods and Health Management Associates raised substantial cash from debt offerings and paid special dividends to shareholders, with the stocks reacting favorably to the distributions. A number of other holdings seem primed to take similar action or be acquired outright.
The strongest performer in the Fund for the year was Mastercard, purchased on its attractively priced initial public offering in the summer, which rose 177%. Other strong performers for the past twelve months were Kennametal, Tempur-Pedic, Sherwin Williams, First Marblehead and Echostar. Kennametal fits well with our strategy of investing in good businesses in the midst of substantial transitions and with attractively valued stocks. Kennametal’s management is moving the company from a largely commodity-focused manufacturing and distribution business toward a higher-margin, faster-growing, advanced materials business. Continued progress and a well-received tuck-in acquisition propelled the stock, which is up nicely since being added to the portfolio six months ago.
18
EXCELSIOR FUNDS TRUST | MID CAP VALUE AND RESTRUCTURING FUND |
Conversely, International Coal and Centex weighed on portfolio results. International Coal Group disappointed after numerous setbacks on both mining and operational fronts delayed fundamental improvement. The stock was sold from the portfolio. The Fund’s small remaining investment in homebuilder Centex was down as further malaise set in to the housing market.
Portfolio Activity
Oshkosh Truck, a company we have long admired, was added to the portfolio following its acquisition of JLG Industries, another company we nearly purchased many times. Management of Oshkosh has a long history of levering the company’s balance sheet in order to make sizeable acquisitions. With strong cash flow, the company has always improved its debt position following acquisitions and integrated new companies well. We expect similar results this time and believe there are plentiful opportunities for the combined company to grow revenues and increase margins. The stock’s decline in advance of the merger precipitated our purchase.
E*Trade, Leucadia National and Progressive were all added to the portfolio in the last three months. E*Trade is undergoing a rapid transition from a broker-focused earnings model to a fuller financial services franchise, while producing strong margin improvement and growth in the process. The Fund has owned both Progressive and Leucadia in the past, with good results. We re-purchased Progressive near its lowest price to book in 10 years and at a roughly 10% earnings yield. Progressive generates very high returns on equity and excellent underwriting margins; and while near-term results may be pressured, long-term returns may have potential to be excellent.
Funding for the new purchases came from sales of Sovereign Bancorp, Zale Corp, Blockbuster, Callaway Golf and Doral Financial. Sovereign stock rallied nicely under pressure from activist shareholders. Stock of Zale rose as consumers proved more resilient than many had expected. Neither stock represented particularly strong value any longer when compared to alternatives. The sale of Zale also reduced the portfolio’s retail exposure a bit.
Outlook
The Fund continues to display the attractive valuation and fundamental characteristics that mark our way of investing. The median stock in the portfolio sells at 14× expected earnings, 10× cash flow and 2.4× book value, all discounts to market benchmarks despite attractive earnings growth forecasts and high levels of profitability. There is plenty of evidence suggesting choppy waters ahead. If a liquidity crunch in credit markets occurs, it will take a heavy toll on equity markets in the short term—but that is far from a foregone conclusion. Over an extended horizon, we expect the trend in stock prices to be up. The Fund is invested as such and so represents very good value in our estimation.
Tim Evnin
Managing Director and Senior Portfolio Manager
John McDermott, CFA
Managing Director and Senior Portfolio Manager
19
EXCELSIOR FUNDS TRUST | MID CAP VALUE AND RESTRUCTURING FUND |
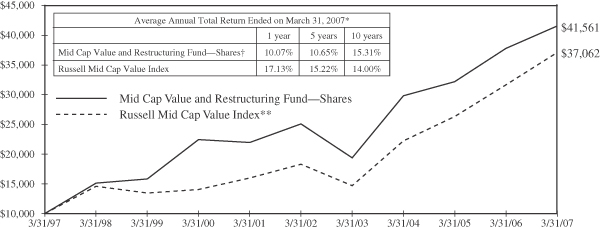
Past performance is not predictive of future performance. Investment returns and principal values will vary and shares may be worth more or less at redemption than their original cost.
The above illustration compares a $10,000 investment made in the Fund and a broad-based index over the past ten fiscal years. The chart assumes all dividends and capital gain distributions are reinvested. The Fund’s performance takes into account fees and expenses. The index does not take into account charges, fees and other expenses. Further information relating to Fund performance is contained in the Financial Highlights section of the Prospectus and elsewhere in this report.
| | | |
| | |
Expense Ratio (As of 7/31/06) | | Shares | |
Gross Expense Ratio | | 1.13 | % |
This information is included in the most current prospectus available to current and prospective shareholders of the Fund. The Adviser has contractually agreed to waive fees or reimburse expenses in order to keep total operating expenses from exceeding 1.14%. The waiver agreement may not be terminated before July 31, 2007. In addition, this agreement will renew automatically for an additional 12 month term unless the Adviser terminates the agreement by providing written notice to the Fund prior to the expiration of the current term.
| * | | Total return represents the change during the period in a hypothetical account with dividends reinvested. |
| ** | | Source: Frank Russell Company—The Russell Mid Cap Value Index measures the performance of medium-sized value-oriented securities. |
| † | | Certain fees may be waived. Had certain fees not been waived, returns would have been lower. Returns do not reflect the deduction of taxes that a shareholder would pay on Fund distributions or the redemption of shares. Returns do not reflect the 2% fee imposed on shares redeemed 30 days or less after their date of purchase. |
20
EXCELSIOR FUNDS, INC. | REAL ESTATE FUND |
Performance Summary
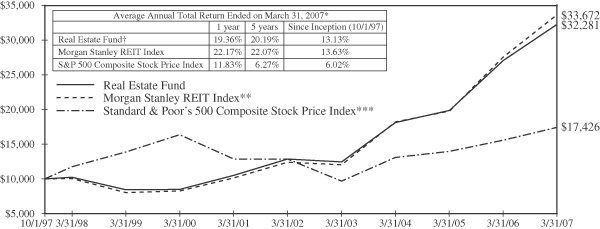
For the twelve months ending in March 2007, the REIT universe performed well, with the Morgan Stanley REIT Index providing a total return of over 22%. This result outpaced most major market indices. Thematically the year was characterized by strong fundamentals resulting from good economic growth, as well as continued investor appetite for real estate. Throughout the past year, the group continued to attract capital—both the public markets, where real estate-dedicated funds experienced positive flows; and private capital, which has been put to work in buyouts of public real estate companies. Acquisitions of public companies for cash from private buyers led to a recycling of the capital back into the segment by real estate-dedicated investors. The one area of general economic weakness, housing, has not had a marked impact on the broader real estate market to date. In the various sectors there has been little new supply built, as commercial developers have been remarkably disciplined. As a result of these positive fundamentals, we continued to observe dividend growth at many REITs this past year. Of the National Association of REITs (NAREIT) universe of 142 REITs, 79 increased their dividend rates paid over the past 12 months.
Performance Attribution
Among the major property sectors, regional mall REITs had the best performance during the year; this performance was weighted toward year end. For the early part of this period, the regional malls lagged. The office companies also performed well during this period, with the best performance coming in the December quarter, at the height of the acquisition activity. Of the major sectors, the apartment REITs had the worst performance during the year ending March 2007; this sector actually outperformed in the beginning of the period, but underperformed more recently. Of the smaller sub-sectors of REITs, the health care companies had a very good year, whereas the manufactured housing companies fared poorly.
During the year, the fund underperformed the Morgan Stanley REIT benchmark. Although it is a small sector, our positioning in health care detracted most from performance over the past 12 months. We were underweight the sector and did not have exposure to some of the stronger performers. Also affecting our performance were some of the non-REITs; St. Joe, the land company based in the panhandle of Florida, was our worst performer this year.
Our best sector for the year was the office sector, where security selection improved results. The best total return came from Equity Office, a company that was purchased in the first quarter of 2007. Other strong performers in the office sector were S. L. Green and a smaller company, Digital Realty.
Portfolio Activity
During the year, several of our holdings—Equity Office, Trizec and Pan Pacific Realty—were purchased for cash. We sold three other companies: Brandywine Realty, Healthcare Realty Trust and Republic Properties. In each case we were disappointed in the results; in the case of Healthcare Realty, we felt there were better opportunities among other health care-related REITs.
During the year, our purchases included three newly public companies, Douglas Emmett, Digital Realty and Kite Realty. Douglas Emmett is an office company based in Southern California; Digital provides technology-related real estate; Kite is a small cap company focused on retail development and ownership.
21
EXCELSIOR FUNDS, INC. | REAL ESTATE FUND |
We also purchased Ventas and Health Care REIT to complement our health care exposure. And lastly, we initiated a position in Taubman to provide greater exposure in regional malls.
Outlook
Economic activity and job creation are important for the underlying fundamentals of all real estate. Throughout this real estate cycle, there has been relatively less new supply in the office markets, driving a positive leasing environment across that important sector. In the apartment business, economic activity and a cooling housing market made for strong fundamentals. However, the conversion of apartment units to condominiums is no longer taking place, creating a headwind for some of the apartment companies.
To date, the acquisition appetite remains healthy, particularly from private buyers, providing a bonus to real estate valuations. We will carefully watch the credit markets in the coming months. The concerns about risk in the single-family mortgage business could move beyond that business into other real estate-related businesses but have not done so thus far.
Joan Ellis, CFA
Managing Director and
Senior Portfolio Manager
22
EXCELSIOR FUNDS, INC. REAL ESTATE FUND | |
Past performance is not predictive of future performance. Investment returns and principal values will vary and shares may be worth more or less at redemption than their original cost. Concentration in one economic sector may subject an investor to greater volatility.
The above illustration compares a $10,000 investment made in the Fund and broad-based indices since 10/1/97 (inception date). The chart assumes all dividends and capital gain distributions are reinvested. The Fund’s performance takes into account fees and expenses. The indices do not take into account charges, fees and other expenses. Further information relating to Fund performance is contained in the Financial Highlights section of the Prospectus and elsewhere in this report.
| | | |
| | |
Expense Ratio (As of 7/31/06) | | Shares | |
Gross Expense Ratio | | 1.52 | % |
Net Expense Ratio | | 1.25 | % |
The expense information in the table reflects contractual fee waivers currently in effect. This information is included in the most current prospectus available to current and prospective shareholders of the Fund. The Adviser has contractually agreed to waive fees or reimburse expenses in order to keep total operating expenses from exceeding 1.25%. The waiver agreement may not be terminated before July 31, 2007. In addition, this agreement will renew automatically for an additional 12 month term unless the Adviser terminates the agreement by providing written notice to the Fund prior to the expiration of the current term.
| * | | Total return represents the change during the period in a hypothetical account with dividends reinvested. |
| ** | | Source: Morgan Stanley & Co., Incorporated—Reflects the reinvestment of income dividends and, where applicable, capital gain distributions. The Morgan Stanley REIT Index is an unmanaged capitalization-weighted index composed of the largest and most actively traded REITs designed to provide a broad measure of real estate equity performance. |
| *** | | Source: Standard & Poor’s Corporation—Reflects the reinvestment of income dividends and, where applicable, capital gain distributions. The Standard & Poor’s 500 Composite Stock Price Index is a widely accepted unmanaged index of U.S. stock market performance. |
| † | | Currently certain fees are waived. Had certain fees not been waived, returns would have been lower. Returns do not reflect the deduction of taxes that a shareholder would pay on Fund distributions or the redemption of shares. Returns do not reflect the 2% fee imposed on shares redeemed 30 days or less after their date of purchase. |
23
EXCELSIOR FUNDS, INC. | SMALL CAP FUND |
Performance Summary
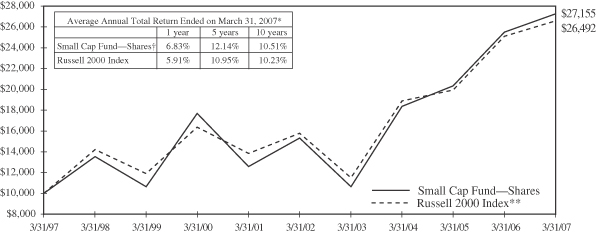
For the Excelsior Small Cap Fund, results for the fiscal year ended March 31, 2007, came in well ahead of the Russell 2000 Index.
The year can best be characterized as highly volatile, given the summer’s 10% correction and February 27, 2007 sell-off that seemed to hit most equity asset classes in the same way, with declines of 3%-4%. The Fund’s investment program, however, always centers on stock selection rather than market calls; as a result, we had a handful of significant contributors that overpowered a relatively few laggards.
The enduring run in the small-cap asset class is now in its ninth year of outperformance relative to large stocks, as identified by the S&P 500 Index. For those attempting to time a switch from “small” to “large” to achieve relative performance, it has been a tough call. Obviously, the longer the run lasts, the more likely it is to turn at some point, but our valuation work and studies of other small cap cycles continue to be inconclusive in divining a locus in this cycle. Meanwhile, the combined effects of excess liquidity, driven by hedge funds and private equity partnerships, and the powerful trends of mergers, acquisitions and management-led buyouts should contribute to the drive of small companies in 2007 or at a minimum put a floor under the asset class. For our part, we just do what we do and try to be astute about it. Compared with many of our peers, the Excelsior Small Cap Fund holds relatively few positions, at 38. If and when a turn occurs, larger portfolios will reflect merely a call on the assets class. Our limited, stock-focused, approach should clearly differentiate our effort, for better or worse.
This is an interesting time. In the corporate real estate market, we witnessed a battle between Blackstone Group and Vornado Properties to overpay for the REIT, Equity Office Properties. When the smoke cleared, the new owner had paid an historically low “cap” rate and an historically high dollar price—this after a six-year period of outperformance by the entire sector. Today’s valuations do not leave much room for the little calamities that visit from time to time—lenders tightening standards (post the sub-prime mortgage sector collapse), higher long-term interest rates as the yield curve returns to its normal shape, a tenant going broke, etc. Elsewhere a private equity firm, Fortress Group, had its initial public offering; on the basis of a price-to-earnings metric, breathless new investors priced it at twice the valuation of Goldman Sachs, an excellent company with a hundred-year history that does many of the same things Fortress does and many other things as well. Another interesting headline was seen in the Wall Street Journal on April 2, 2007: “Eager Investors Lift Margin Debt To New Heights”. We are not bearish, but we are alert to extremes in the system that could produce some unhappy results.
Performance Attribution
Viewing the account-specific analysis, we will first look at annual attribution. While most economic sectors within the portfolio were positive, our most significant overweighted commitments to the consumer discretionary, industrials, and information technology sectors collaborated to provide returns in excess of the index’s return. Our largest underweighted sectors were consumer staples, health care, finance, and materials. Between these major over/under weighted sectors, we deployed capital fairly efficiently in the fiscal year as the decision to overweight one sector at the expense of another was additive.
24
EXCELSIOR FUNDS, INC. | SMALL CAP FUND |
Stock-by-stock contribution was diverse by sector or theme; however, technology had the most representatives with CommScope (coaxial cable), Varian Semiconductor (up 90% in the fiscal year), FLIR (infrared cameras), Manhattan Associates (warehouse/inventory management software), Forrester Research (independent market and technology application), and Innovative Solutions (flat panel avionics displays; up approximately 75% in the fiscal year). Other significant contributors rounding out the top ten were long-term holdings Sotheby’s (the auction house), Kansas City Southern Railway, Quanta Services (electric and cable transmission), and Philadelphia Consolidated Insurance (niche property and casualty insurance).
The specific detractors were difficult to pin down by sector. NYSE market maker firm LaBranche and CACI Corp were the most notable detractors. In technology, Keane (information technology), Cabot Microdevices (semiconductor polishing), and Power Integrated Devices (energy saving microchips) all had a negative impact on annual returns. Others included Simpson Manufacturing (building related), and Thor Industries (RVs).
Portfolio Activity
For the year, the Fund saw little major activity. We sold outright our long-term position in Park National Corp. While Park has produced outstanding operating results, it operates in no-to-declining growth markets in Ohio. The combination of low revenue growth and an inverted curve has made earnings growth a challenge. Also eliminated was another longtime holding, CACI Corp. This provider of information technology services, primarily to the U.S. government, has seen project funding dry up as the Iraq War has subsumed available resources. Earnings growth has gone from flat to down. Elsewhere, EGL Logistics is the object of a management/private equity buyout, and Keane is in the process of being acquired by Caritor.
Outlook
We have never been inclined to make directional market projections, but rather seek individual investments that we believe represent low risk and above-average potential reward—as identified by a set of financial statistics, strong beliefs, fundamental principles, and judgment. This approach has served our investors well. On that count, we seek to continue to find many new and exciting companies that should contribute to performance in the quarters and years ahead.
Douglas H. Pyle
Managing Director and
Senior Portfolio Manager
25
EXCELSIOR FUNDS, INC. SMALL CAP FUND | |
Past performance is not predictive of future performance. Investment returns and principal values will vary and shares may be worth more or less at redemption than their original cost. There is greater volatility associated with an investment in the Small Cap Market.
The above illustration compares a $10,000 investment made in the Fund and a broad-based index over the past ten fiscal years. The chart assumes all dividends and capital gain distributions are reinvested. The Fund’s performance takes into account fees and expenses. The index does not take into account charges, fees and other expenses. Further information relating to Fund performance is contained in the Financial Highlights section of the Prospectus and elsewhere in this report.
| | | |
| | |
Expense Ratio (As of 7/31/06) | | Shares | |
Gross Expense Ratio | | 1.21 | % |
This information is included in the most current prospectus available to current and prospective shareholders of the Fund. The Adviser has contractually agreed to waive fees or reimburse expenses in order to keep total operating expenses from exceeding 1.25%. The waiver agreement may not be terminated before July 31, 2007. In addition, this agreement will renew automatically for an additional 12 month term unless the Adviser terminates the agreement by providing written notice to the Fund prior to the expiration of the current term.
| * | | Total return represents the change during the period in a hypothetical account with dividends reinvested. |
| ** | | Source: Frank Russell Company—The Russell 2000 Index is an unmanaged index and is composed of the 2,000 smallest companies in the Russell 3000 Index. The Russell 3000 Index is composed of 3,000 of the largest U.S. companies by market capitalization. The index includes dividends reinvested. |
| † | | Certain fees may be waived. Had certain fees not been waived, returns would have been lower. Returns do not reflect the deduction of taxes that a shareholder would pay on Fund distributions or the redemption of shares. Returns do not reflect the 2% fee imposed on shares redeemed 30 days or less after their date of purchase. |
26
EXCELSIOR FUNDS, INC. VALUE AND RESTRUCTURING FUND | |
Performance Summary
This year’s performance results were in many respects a replay of last year’s. In both years, purveyors of industrial commodities, especially those driving growth in the emerging markets, were where the action was and a meaningful contributor to the Fund’s gains. That said, it has been an increasingly difficult environment for low P/E stocks, our bread-and-butter in terms of investing. With all the talk about slowing economic growth and decelerating earnings, perhaps this should have come as no surprise, as our companies typically carry more financial and operating risk. Moreover, tactically we are focused in the more cyclical sectors of the S&P 500 universe, which bore the brunt of a second-half 2006 sell-off in anticipation of these slowing trends. Our dilemma is, that these very sectors generally still offer investors substantial long term value and are often undergoing solid restructuring trends, which we find so attractive.
The other major performance contributor was from the unusually high level of merger and acquisition (M&A) activity. This trend has shown little sign of abating because stocks remain at attractive valuation levels and because corporations and large investors are flush with cash and looking for enhanced productivity and oversized returns. The Fund has been a continued beneficiary of buyouts because we seek out undervalued companies where management actions, either through restructuring or M&A activity, can create shareholder value.
The combination of these two dominant trends in the stock market helped provide a solid gain for the Fund, which was in line with the S&P 500 Index over the past twelve months but behind the Russell 1000 Value Index.
Performance Attribution
Copper producer Southern Copper Corporation and its majority stock owner Grupo Mexico were among the best performers. Southern Copper has gained approximately 89% in the past twelve months; Grupo Mexico has surged since we purchased it late last year. In addition, both companies pay very attractive dividends, with yields of approximately 9% and 4%, respectively. Although quite volatile and unpredictable, copper prices are expected to continue easing this year and next, mitigating against continued outsized stock price gains.
Two companies with worldwide operations benefited from the strong global trends mentioned above. Tractor manufacturer AGCO Corporation and chemical company Celanese both continued their year-end surge, gaining close to 80% and 50%, respectively, during the past twelve months. We think AGCO discounts much of the strength in tractor sales while Celanese still appears undervalued, even after the Dutch auction buyback of shares by the company.
Performance bright spots during the past year also included some of our Latin American and financial stocks. Copa Holdings, a Pan-American airline, gained over 130%; Mexican cellular provider America Movil, our largest holding, continued its performance tear, gaining 41%. Mastercard, purchased at its initial public offering in May, gained 177%.
On the downside, Centex was one of the biggest disappointments during the past twelve months, losing more than a quarter of its value. This was especially painful since it remains such a large holding
27
EXCELSIOR FUNDS, INC. | VALUE AND RESTRUCTURING FUND |
in the Fund. At these levels, the stock sells at adjusted tangible book value and amply discounts the deep slide in homebuilding. We believe book value offers strong downside protection for such a solid company, which should perform much better as the inventory of unsold homes is depleted.
Other detractors to performance were some repeat losers, including International Coal, Plantronics and XM Satellite Radio. We added shares to each of these companies with the expectation of better prices concomitant with improving fundamentals.
Portfolio Activity
During the year we upgraded quality in the portfolio by eliminating companies with weaker fundamentals and/or less attractive valuations. These included Doral, CF Industries, Deluxe Corp. and Interpublic Group. With the proceeds we added new companies to the portfolio, including Capital One Financial, Murphy Oil, Schnitzer Steel and Smurfit-Stone. We view Capital One’s acquisition of North Fork Bancorp positively and multiple enhancing for its stock longer term. The other companies, selling oil, steel and scrap, and boxes, respectively, are direct beneficiaries of the global growth phenomenon driving our economy and the stock market. We like their businesses, management savvy, and current valuation characteristics, and believe they fit in nicely with our philosophy of finding companies that are either restructuring or in consolidating industries and with long term value appeal.
Outlook
As we near the “sell in May and go away” seasonally weak period for the stock market, we are keeping our fingers crossed that the Fund can sustain its absolute and relative gains through the summer. If Fed funds rates are reduced sooner rather than later, it should. If worries about sub-prime lending, surging inflation and housing woes deepen, market volatility will probably continue. A rate cut will be especially beneficial to the Fund because of our overweighting in the cyclical and financial sectors of the market. On the other hand, the weakness in the economy that would likely precipitate such a rate reduction could be particularly detrimental to these same sectors. So a continuation of the “Goldilocks” economy is our hope. At this point, we believe this is the most likely outcome.
We are in our fifteenth year of investing in companies undergoing some form of restructuring or industry consolidation. We buy these companies when we believe they are undervalued and sell them when they no longer appear cheap. Today’s portfolio, we believe, possesses much the same value characteristics as it has for the previous fourteen years. The median company sells at less than 11 times price to cash flow, versus 12.4× for the S&P 500, and at a little more than 15× expected 2007 earnings, also a discount to the S&P 500 multiple. Yet the companies in the Fund are expected next year to have earnings growth much higher than that of the S&P 500, and with higher ROE’s (Return on Equity).
David J. Williams, CFA
Managing Director and
Senior Portfolio Manager
28
EXCELSIOR FUNDS, INC. | VALUE AND RESTRUCTURING FUND |
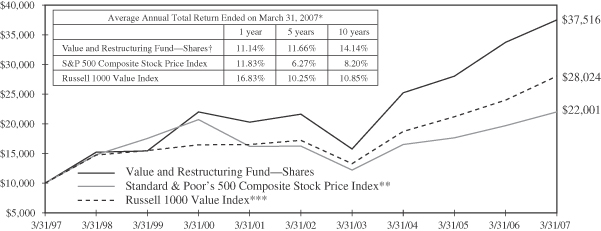
Past performance is not predictive of future performance. Investment returns and principal values will vary and shares may be worth more or less at redemption than their original cost.
The above illustration compares a $10,000 investment made in the Fund and a broad-based index over the past ten fiscal years. The chart assumes all dividends and capital gain distributions are reinvested. The Fund’s performance takes into account fees and expenses. The index does not take into account charges, fees and other expenses. Further information relating to Fund performance is contained in the Financial Highlights section of the Prospectus and elsewhere in this report.
| | | |
| | |
Expense Ratio (As of 7/31/06) | | Shares | |
Gross Expense Ratio | | 1.05 | % |
This information is included in the most current prospectus available to current and prospective shareholders of the Fund. The Adviser has contractually agreed to waive fees or reimburse expenses in order to keep total operating expenses from exceeding 1.14%. The waiver agreement may not be terminated before July 31, 2007. In addition, this agreement will renew automatically for an additional 12 month term unless the Adviser terminates the agreement by providing written notice to the Fund prior to the expiration of the current term.
| * | | Total return represents the change during the period in a hypothetical account with dividends reinvested. |
| ** | | Source: Standard & Poor’s Corporation—Reflects the reinvestment of income dividends and, where applicable, capital gain distributions. The Standard & Poor’s 500 Composite Stock Price Index is a widely accepted unmanaged index of U.S. stock market performance. |
| *** | | Source: Frank Russell Company—The Russell 1000 Value Index is an unmanaged index composed of those Russell 1000 Index companies with lower price-to-book ratios and lower forecasted growth values. The Russell 1000 Index is composed of the 1000 largest companies in The Russell 3000 Index which is composed of 3,000 of the largest U.S. companies by market capitalization. The Index includes dividends reinvested. |
| † | | Certain fees may be waived. Had certain fees not been waived, returns would have been lower. Returns do not reflect the deduction of taxes that a shareholder would pay on Fund distributions or the redemption of shares. Returns do not reflect the 2% fee imposed on shares redeemed 30 days or less after their date of purchase. |
29
EXCELSIOR FUNDS, INC. | EMERGING MARKETS FUND |
Performance Summary
In the last fiscal year, emerging markets performed much better than might have been expected given the two crises that book-ended the year. The first crisis occurred in May/June 2006 and was sparked by fears stemming from excessive carry trade activity, falling commodity prices, and U.S. interest-rate concerns. The weakness at fiscal year end stemmed once again from carry trade fears, with concerns over the U.S. sub-prime mortgage market added to the mix.
In addition to these two broad-based periods of weakness, individual countries had to overcome walls of worry at different times. For instance, Latin American elections, especially in Brazil and Mexico, caused uncertainty, but the results ended up pleasing investors. Thailand implemented currency controls but negated that decision in a matter of days. And China’s stock market suffered from the Chinese government expressing concern over its growth rate (the Chinese economy continues to run hot, a constant risk factor). Finally, certain emerging markets proved susceptible to falling oil prices.
The ability to withstand these uncertainties could define 2006/2007 as the year emerging markets came of age. In times past, any one of these events could have curtailed sentiment for some time, but for the fiscal year ended March 31, 2007, the emerging markets were up over 20%.
Performance Attribution
The Excelsior Emerging Markets Fund was able to keep pace most of the year, even during the two weak periods discussed above. As we entered the final fiscal quarter, however, the situation began to change; the leaders of 2006 started to lag as smaller markets took over leadership from the large markets of Brazil, Russia, and China. Since the Fund was underweighted in smaller markets, and still favored China and Russia, the Fund struggled in the first calendar quarter of 2007, causing the Fund to underperform the benchmark for the fiscal year. However, we are confident in our country weightings, which favor the BRIC countries (Brazil, Russia, India, and China), in particular China, over the long term.
Portfolio Activity
In keeping with our low turnover, portfolio sales of positions in their entirety were limited in the fiscal year. KGHM, a leading copper producer in Poland; Polyus Gold, a Russian gold mining company; and Rostelecom, Russia’s long-distance provider were all sold. It is just by coincidence that all three were in Central Europe. KGHM and Polyus were sold in anticipation of commodity prices falling. Rostelecom was sold as its price target had been reached.
In Poland, PKO Bank, a large commercial bank was sold. In Brazil, the Fund sold Telemar Norte Leste (Telemar), a telecommunications company; Telemar attempted a restructuring that failed, and prospects in both its fixed and mobile businesses were not living up to our expectations.
The Fund established a new position in Gafisa, a Brazilian homebuilder. Falling inflation and interest rates are increasing the affordability and demand for homes in Brazil. Although there are quite a few Brazilian real estate plays at present, Gafisa is one of the most liquid, thanks to its ADR.
30
EXCELSIOR FUNDS, INC. | EMERGING MARKETS FUND |
Chunghwa Telecom, Taiwan’s leading telecommunications company was also added. Not only is the stock exposed to a sector we find very attractive, but it also sports a high yield.
Outlook
External drivers, such as exports, have been the driving forces behind emerging market returns, but this may be changing. New drivers are emerging that may propel solid returns in the years to come. We believe that these new drivers will be domestic in nature. Emerging market countries have generated strong export growth and attracted investment, both of which are funding sources that can facilitate domestic economic development. We believe these funds will find their way into demand for infrastructure, domestic consumption, and telecommunications. Also, financial firms (such as banks) should be able to prosper from demand for new products and the growth of financing opportunities.
There has been a wealth transfer from the developed to emerging world. Few emerging market economies are exhibiting strained financial conditions. A base has been created that could fuel future returns. In this new era of emerging markets, the BRIC countries will continue to play a significant role. Growth is strong, and investment is high in these large, growing countries. The Fund continues to seek out opportunities in these markets. In addition to the stalwart BRIC category, new and smaller markets may rise in stature. Countries such as Vietnam and many African nations, also called frontier markets, may boost the next phase of emerging markets performance.
In short, we believe emerging markets are well entrenched in a long-term bull market (though nothing is ever totally smooth in emerging markets and near term performance could be volatile) driven by a variety of countries, both large and small. To profit from these opportunities we will continue to employ a combination of top-down and bottom-up analysis in our process. Long term, this mixed approach has worked well, and we believe it will continue to do so going forward.
In closing, we believe emerging markets are here to stay and do warrant a long-term allocation in a wide variety of portfolios.
Donald Elefson, CFA
Managing Director and Portfolio Manager
31
EXCELSIOR FUNDS, INC. EMERGING MARKETS FUND | |
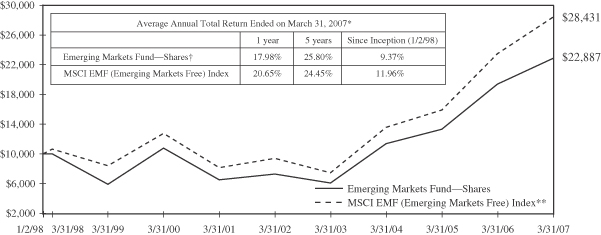
Past performance is not predictive of future performance. Investment returns and principal values will vary and shares may be worth more or less at redemption than their original cost. International investing is subject to special risks such as currency fluctuations and differences in accounting and taxation standards.
The above illustration compares a $10,000 investment made in the Fund and a broad-based index since 1/2/98 (inception date). For comparative purposes, the value of the index on 12/31/97 is used as the beginning value on 1/2/98. The chart assumes all dividends and capital gain distributions are reinvested. The Fund’s performance takes into account fees and expenses. The index does not take into account charges, fees and other expenses. Further information relating to Fund performance is contained in the Financial Highlights section of the Prospectus and elsewhere in this report.
| | | |
| | |
Expense Ratio (As of 7/31/06) | | Shares | |
Gross Expense Ratio | | 1.92 | % |
Net Expense Ratio | | 1.85 | % |
The expense information in the table reflects contractual fee waivers currently in effect. This information is included in the most current prospectus available to current and prospective shareholders of the Fund. The Adviser has contractually agreed to waive fees or reimburse expenses in order to keep total operating expenses from exceeding 1.85%. The waiver agreement may not be terminated before July 31, 2007. In addition, this agreement will renew automatically for an additional 12 month term unless the Adviser terminates the agreement by providing written notice to the Fund prior to the expiration of the current term.
| * | | Total return represents the change during the period in a hypothetical account with dividends reinvested. |
| ** | | Source: Morgan Stanley & Co., Incorporated—Morgan Stanley Capital International EMF (Emerging Markets Free) Index is a widely-accepted, unmanaged index composed of a sample of companies representative of the market structure of 26 global emerging market countries. The Index includes dividends reinvested. |
| † | | Currently certain fees are waived. Had such fees not been waived, returns would have been lower. Returns do not reflect the deduction of taxes that a shareholder would pay on Fund distributions or the redemption of shares. Returns do not reflect the 2% fee imposed on shares redeemed 30 days or less after their date of purchase. |
32
EXCELSIOR FUNDS, INC. INTERNATIONAL FUND | |
Performance Summary
International equity markets continued to strongly outperform the U.S. market for the year ending March 31, 2007. The performance differential was quite considerable, with the MSCI World ex-US Index producing a gain of over 20% compared to a gain of approximately 12% for the S&P 500 Index for the period. The strong positive comparison benefited from continuing U.S. dollar weakness versus most major currencies, with the exception of the Japanese yen.
The performance of the strongest and the weakest markets varied again to a considerable extent. Among the developed markets, Singapore returned approximately 45% for the year in U.S. dollar terms, followed by Spain (+38) and Australia (+35%). Singapore benefited from the strong economy and stock markets of China, whereas Spain strengthened based on takeover activity and Australia surprised with strong domestic economic growth. The weakest developed markets were Japan (+3.0%) and Canada (+12.1%). The Japanese stock market took a breather after superb performance in 2005, amid concerns about the underlying strength of the economic recovery. Emerging markets were somewhat neutral to developed returns last year as the MSCI EM Index performed in line with developed markets. The BRIC countries—Brazil, Russia, India and China—outperformed their brethren again, with a return of approximately 27%. Overall, the strongest performing major emerging market for the year was China (+47%), closely followed by Mexico (+40%) and Indonesia (+36%).
Performance Attribution
The Fund underperformed its benchmark for the year ending March 31, 2007. Stock selection produced an overall positive contribution to returns. Our overweight position in the telecommunications services sector was also helpful in this regard. Negative contributors to return were our overweight positions in information technology and health care, as well as our underweight position in utilities. Utilities, telecommunications services and consumer staples were the best performing sectors for the year. The weakest sectors were information technology and energy, with single digit returns, followed by health care. The Fund’s sector weightings stayed remarkably stable throughout the year. Health care, information technology, telecommunications services and consumer discretionary remains overweight, whereas our underweight sectors are financials, materials and utilities. Only the extent of the underweight and overweight percentages varied throughout the year. Individual stock performance contribution varied widely from quarter to quarter. Consistent with our investment philosophy, portfolio turnover was kept to a minimum.
Norwegian video conferencing solutions provider Tandberg ASA was the strongest performer in the fiscal year, returning over 100% during the period. Other strong contributors to performance included the German carbon and graphite materials producer SGL Carbon AG; Wm Morrison Supermarkets PLC; telecommunications company Telenor ASA; and Serco Group PLC, a commercial services company. Japanese stocks were some of the worst performers, including banking holding company, Mitsubishi UFJ Financial Group; Japan-based discount retailer Don Quijote Company; electronics and appliance retailer Yamada Denki Company; and electro-optics company Hoya Corporation. We continue to hold these positions as we have confidence in the recovery of the Japanese economy.
Portfolio Activity
In Asia, we sold Samsung Electronics, Hyundai Motor and Advanced Info Services.
33
EXCELSIOR FUNDS, INC. | INTERNATIONAL FUND |
In Europe, we eliminated our positions in Depfa and Sanofi-Aventis due to concerns about the visibility of future growth. The German industrial conglomerate MAN was sold due to its involvement in a complicated and potentially disadvantageous M&A situation. We also sold Altana AG and British Sky Broadcasting Group plc. We felt that Altana had reached its full valuation potential subsequent to the disposal of its pharmaceuticals business. Concerns about the strategic direction of BSkyB caused us to sell our holdings in this company.
In Canada, we eliminated our holdings in Rona and Suncor for future earnings visibility reasons.
The Fund’s replacements for these holdings include the Canadian apparel manufacturer Gildan Activewear and Canadian National Railway. We established positions in the Australian-based specialty pharmaceutical company CSL and in Synthes, the Swiss medical products provider specializing in orthopedic trauma surgery.
Other purchases included Greek Postal Savings Bank and Reed Elsevier. Reed Elsevier is an international publishing group specializing in scientific, legal and business-to-business materials. Both companies feature strong earnings growth potential and reasonable valuations.
Outlook
We are continuing to maintain a very positive stance on international equities as an asset class. Our reasoning is based on key considerations in regard to earnings growth, comparative valuations, currency considerations and diversification benefits.
Europe continues to benefit from the EU expansion toward Central and Eastern Europe. Japan has seen positive GDP growth for the last five years now, and the foundations for the continuing recovery of the Japanese economy remain strong. Strong export performance to both the U.S. and China is expected to continue. Real estate prices in Tokyo are also confirming an overall sound recovery. Economic growth in most emerging markets continues to surprise on the upside, as well.
Most international markets currently trade at a 20-25% discount to the U.S. market as measured in terms of price to cash flow and price to book value relationships. We anticipate a continuation of the measured approach that most central banks have taken over the recent past and so expect few monetary policy surprises.
We anticipate a continued, if somewhat weaker, performance contribution from a weaker U.S dollar. Continued current account and federal budget deficits remain a concern to most market participants. The anticipated increase in short-term Eurozone interest rates will also negatively influence the relative interest rate relationship between the Dollar and the Euro, thus validating the recent strong performances of the Euro and the British Pound.
We are continuing to anticipate positive benefits from international diversification as the magnitude of anticipated returns should outpace opportunities in the U.S. The U.S. stock market accounts for about half of world market capitalization, which implies that the other half of investment opportunities lies elsewhere. Given our anticipated scenario above, this environment lends itself to enhanced returns from strong stock selection.
Reiner Triltsch, CFA
Managing Director Portfolio Manager and Head of International Equities
34
EXCELSIOR FUNDS, INC. INTERNATIONAL FUND | |
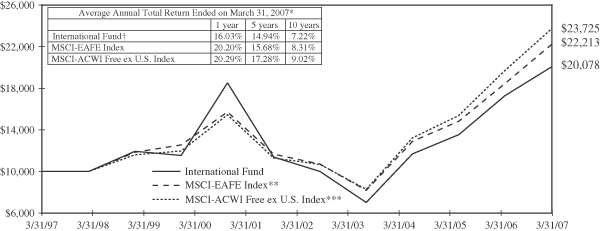
Past performance is not predictive of future performance. Investment returns and principal values will vary and shares may be worth more or less at redemption than their original cost. International investing is subject to special risks such as currency fluctuations and differences in accounting and taxation standards.
The above illustration compares a $10,000 investment made in the Fund and broad-based indices over the past ten fiscal years. The chart assumes all dividends and capital gain distributions are reinvested. The Fund’s performance takes into account fees and expenses. The indices do not take into account charges, fees and other expenses. Further information relating to Fund performance is contained in the Financial Highlights section of the Prospectus and elsewhere in this report.
| | | |
| | |
Expense Ratio (As of 7/31/06) | | Shares | |
Gross Expense Ratio | | 1.58 | % |
Net Expense Ratio | | 1.50 | % |
The expense information in the table reflects contractual fee waivers currently in effect. This information is included in the most current prospectus available to current and prospective shareholders of the Fund. The Adviser has contractually agreed to waive fees or reimburse expenses in order to keep total operating expenses from exceeding 1.50%. The waiver agreement may not be terminated before July 31, 2007. In addition, this agreement will renew automatically for an additional 12 month term unless the Adviser terminates the agreement by providing written notice to the Fund prior to the expiration of the current term.
| * | | Total return represents the change during the period in a hypothetical account with dividends reinvested. |
| ** | | Source: Morgan Stanley & Co., Incorporated—Morgan Stanley Capital International EAFE (Europe, Australia, Asia, Far East) Index is a widely accepted, unmanaged index composed of a sample of companies from 21 countries representing the developed stock markets outside North America. |
| *** | | Source: Morgan Stanley & Co., Incorporated—Morgan Stanley Capital International All Country World Index Free ex U.S. is a widely accepted, unmanaged index of global stock market performance comprising 47 countries with developed and emerging markets excluding the United States. |
| † | | Currently certain fees are waived. Had such fees not been waived returns would have been lower. Returns do not reflect the deduction of taxes that a shareholder would pay on Fund distributions or the redemption of shares. Returns do not reflect the 2% fee imposed on shares redeemed 30 days or less after their date of purchase. |
35
EXCELSIOR FUNDS, INC. | PACIFIC/ASIA FUND |
Performance Summary
From a relative standpoint, the year was a difficult one for the Excelsior Pacific/Asia Fund, which trailed the MSCI AC Asia Pacific Index. Our overweight in Japanese small and mid-cap names was the main culprit. We continued fine-tuning the Fund’s exposure by country and sector, which resulted in higher than normal turnover for the most recent six months. The most significant change from a year ago was an in line weighting for Australia.
Currency had little effect on the fund’s performance over the past year. The Yen was essentially flat for the twelve months; however, we saw strength from the Australian dollar, up about 12%. Emerging markets currencies showed strength across the board, with the Thai Baht up about 16%, and the Malaysian Ringgit up about 6% as the outlook for that country remains firm for a number of reasons. The emerging opportunities in Malaysia and the Philippines look like they are the beginning of a new direction, both macro-economically and politically, for these two countries.
Performance Attribution
The top five contributors to performance in the past year were Indian telecom service provider Bharti Airtel Ltd; CSL Ltd., the Australian blood products company; Japanese-based interactive gaming company Nintendo; China Mobile; and Telekom Indonesia. For the fiscal year, the majority of the underperformance centered on our overweight in Japanese small and mid capitalization stocks. Poor performers included Japan-based discount retailer Don Quijote Company; electronics and appliance retailer Yamada Denki Company; Neomax, a seller of magnet, ceramic and ally products; and Gourmet Navigator, an internet search service provider for restaurants. The Fund’s holdings in Emerging Asia and the telecommunications services sector were the strongest performers from a relative standpoint.
Portfolio Activity
Over the course of the fiscal year, we decreased our Japanese exposure from over 60% to around 50%. We made some significant changes in the holdings, in many cases taking profits from successful investments made in the past. We brought our Australia weighting in line with the benchmark by adding two Australian banks, Commonwealth Bank and St. George’s Bank. We initiated exposure to Malaysia late last year and added further to it in the first quarter of 2007. We increased our Philippines weighting by adding two new holdings in the first quarter of 2007. We had already purchased Philippines telecom company, Global Telecom, in 2006. Other changes in the portfolio included decreasing the Fund’s weighting in technology and energy throughout the year and increasing our weighting in financial services.
Outlook
Throughout the last year the Asian markets, and Japan in particular, were quite volatile. We believe this volatility arose because investors were worried that U.S. housing demand is collapsing, that the U.S. economy is going into recession, and that this will be followed by a sharp slowdown in global growth. We would, however, encourage investors to look at the strong recent growth in the U.S. monetary base, which would certainly argue against excessive pessimism. Our views on the global economy may be of more interest, at least as viewed through the prism of our company universe—the 8,000 or so companies
36
EXCELSIOR FUNDS, INC. | PACIFIC/ASIA FUND |
listed in Japan and the rest of Asia. From what we see, there is little or no evidence of a slowdown. In fact, global economic growth appears to be accelerating. Results from the Japanese shipping companies tell us that, over the last few months, load factors have improved, and the steel companies talk of very tight markets and further price rises. Similarly, the evidence from the technology sector is encouraging. Monthly order figures from a range of companies indicate that the pace and timing of the recovery vary across industry sub-sectors; but almost without exception, these companies tell us that, over the last few months, inventories have declined and orders are recovering.
The Japanese economy is perceived as being particularly sensitive to changes in external demand. This perception goes a long way toward explaining the volatility of the last few weeks. However, there are several reasons to believe that Japan’s domestic economic growth will accelerate over the next year. In fact, GDP figures already show an improvement in consumption. The first reason for further optimism is the likelihood that earnings growth will pick up as some of the fruits of five years of strong corporate earnings growth, with, incidentally, a sixth to come, are finally being passed on to employees. The second reason for optimism relates to rising asset prices insomuch as these “increases in wealth” translate into higher consumption. In the richer areas of central Tokyo, where prices of residential real estate have nearly doubled over the last two years, there is already evidence of the impact of this “feel good” factor. We expect to see this expand outwards over the next year.
In China, we believe that the Shanghai and Shenzhen markets are due for a steep correction. Foreign investment managers own less that 1% of these markets, which are being driven by a speculative frenzy in China. The Chinese companies listed on the Hong Kong exchange as H shares have already corrected and their valuations are reasonable.
David J. Linehan, CFA
Managing Director and
Portfolio Manager
37
EXCELSIOR FUNDS, INC. PACIFIC/ASIA FUND | |
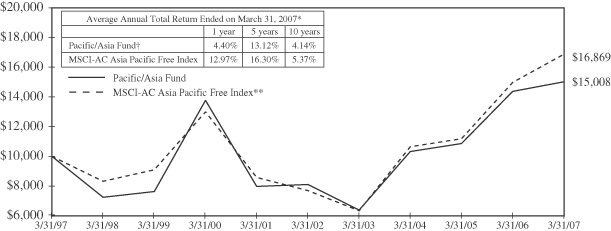
Past performance is not predictive of future performance. Investment returns and principal values will vary and shares may be worth more or less at redemption than their original cost. International investing is subject to special risks such as currency fluctuations and differences in accounting and taxation standards.
The above illustration compares a $10,000 investment made in the Fund and a broad-based index over the past ten fiscal years. The chart assumes all dividends and capital gain distributions are reinvested. The Fund’s performance takes into account fees and expenses. The index does not take into account charges, fees and other expenses. Further information relating to Fund performance is contained in the Financial Highlights section of the Prospectus and elsewhere in this report.
| | | |
| | |
Expense Ratio (As of 7/31/06) | | Shares | |
Gross Expense Ratio | | 1.62 | % |
This information is included in the most current prospectus available to current and prospective shareholders of the Fund. The Adviser has contractually agreed to waive fees or reimburse expenses in order to keep total operating expenses from exceeding 1.65%. The waiver agreement may not be terminated before July 31, 2007. In addition, this agreement will renew automatically for an additional 12 month term unless the Adviser terminates the agreement by providing written notice to the Fund prior to the expiration of the current term.
| * | | Total return represents the change during the period in a hypothetical account with dividends reinvested. |
| ** | | Source: Morgan Stanley & Co., Incorporated—The Morgan Stanley Capital International All Country Asia Pacific Free Index is a widely-accepted, unmanaged index composed of a sample of companies representative of the market structure of 10 developed and emerging market countries: China Free, Hong Kong, Japan, Indonesia, Korea, Malaysia, Philippines, Singapore, Taiwan and Thailand. The Index aims to capture 85% of the free float adjusted market capitalization in each industry group, in each country, for those securities not subject to foreign ownership restrictions. The Index includes dividends reinvested. |
| † | | Certain fees may be waived. Had such fees not been waived, returns would have been lower. Returns do not reflect the deduction of taxes that a shareholder would pay on Fund distributions or the redemption of shares. Returns do not reflect the 2% fee imposed on shares redeemed 30 days or less after their date of purchase. |
38
Excelsior Funds, Inc.
Portfolio of Investments — March 31, 2007
Blended Equity Fund
| | | | | |
| Shares | | | | Value |
| | | | | |
| COMMON STOCKS — 97.34% | | |
| | CONSUMER DISCRETIONARY — 10.30% |
| 66,610 | | BorgWarner, Inc. | | $ | 5,023,726 |
| 36,000 | | Dillards, Inc., Class A | | | 1,178,280 |
| 98,800 | | eBay(a) | | | 3,275,220 |
| 1,155 | | Interpublic Group of Companies, Inc.(a) | | | 14,218 |
| 157,000 | | John Wiley & Sons, Class A | | | 5,928,320 |
| 119,870 | | Life Time Fitness, Inc.(a) | | | 6,162,517 |
| 139,800 | | Sotheby’s Holdings, Inc., Class A | | | 6,218,304 |
| 176,400 | | Target Corp. | | | 10,453,464 |
| 116,800 | | Timberland Co., Class A(a) | | | 3,040,304 |
| | | | | |
| | | | | 41,294,353 |
| | | | | |
| | CONSUMER STAPLES — 7.61% |
| 88,200 | | Altria Group, Inc. | | | 7,744,842 |
| 129,200 | | Anheuser Busch Cos., Inc. | | | 6,519,432 |
| 51,200 | | Kellogg Co. | | | 2,633,216 |
| 163,657 | | Senomyx, Inc.(a) | | | 2,026,074 |
| 156,100 | | Wal-Mart Stores, Inc. | | | 7,328,895 |
| 63,500 | | Wm. Wrigley Jr. Co. | | | 3,234,055 |
| 19,974 | | Wm. Wrigley Jr. Co., Class B | | | 1,014,679 |
| | | | | |
| | | | | 30,501,193 |
| | | | | |
| | ENERGY — 9.79% |
| 104,063 | | Apache Corp. | | | 7,357,254 |
| 37,100 | | Chevron Corp. | | | 2,743,916 |
| 512,161 | | EL Paso Corp. | | | 7,410,970 |
| 169,772 | | Exxon Mobil Corp. | | | 12,809,297 |
| 13,200 | | Royal Dutch Shell plc ADR | | | 875,160 |
| 105,500 | | Suncor Energy, Inc. ADR | | | 8,054,925 |
| | | | | |
| | | | | 39,251,522 |
| | | | | |
| | FINANCIAL — 21.83% |
| 278,467 | | Aegon N.V. | | | 5,552,632 |
| 139,400 | | American Capital Strategies Ltd. | | | 6,176,814 |
| 92,600 | | American Express Co. | | | 5,222,640 |
| 56,591 | | American International Group, Inc. | | | 3,804,047 |
| 18,520 | | Ameriprise Financial, Inc. | | | 1,058,233 |
| 168,520 | | Bank of America Corp. | | | 8,597,890 |
| 67 | | Berkshire Hathaway, Inc., Class A(a) | | | 7,302,330 |
| 27,850 | | Goldman Sachs Group, Inc. | | | 5,754,646 |
| 222,300 | | Leucadia National Corp. | | | 6,540,066 |
| | | | | |
| Shares | | | | Value |
| | | | | |
| COMMON STOCKS — (continued) | | |
| | FINANCIAL — (continued) |
| 49,088 | | Mellon Financial Corp. | | $ | 2,117,656 |
| 55,600 | | Merrill Lynch & Co., Inc. | | | 4,540,852 |
| 85,000 | | NYSE Group, Inc.(a) | | | 7,968,750 |
| 59,000 | | Progressive Corp. | | | 1,287,380 |
| 97,500 | | RenaissanceRe Holdings Ltd. | | | 4,888,650 |
| 213,100 | | State Street Corp. | | | 13,798,225 |
| 73,800 | | Washington Mutual, Inc. | | | 2,980,044 |
| | | | | |
| | | | | 87,590,855 |
| | | | | |
| | HEALTH CARE — 11.10% | | | |
| 180,800 | | Abbott Laboratories | | | 10,088,640 |
| 22,100 | | Genzyme Corp. — General Division(a) | | | 1,326,442 |
| 18,100 | | Hospira, Inc.(a) | | | 740,290 |
| 178,744 | | Johnson & Johnson | | | 10,771,113 |
| 101,100 | | Medtronic, Inc. | | | 4,959,966 |
| 93,600 | | Novo-Nordisk A/S ADR | | | 8,473,608 |
| 239,679 | | Pfizer, Inc. | | | 6,054,292 |
| 9,000 | | Roche Holdings Ltd. ADR | | | 792,513 |
| 51,100 | | Schering Plough Corp. | | | 1,303,561 |
| | | | | |
| | | | | 44,510,425 |
| | | | | |
| | INDUSTRIALS — 12.02% | | | |
| 2,122,000 | | Bombardier, Inc., Class B(a) | | | 8,566,514 |
| 115,600 | | Canadian National Railway Co. | | | 5,102,584 |
| 52,100 | | Dover Corp. | | | 2,543,001 |
| 82,600 | | Expeditors International of Washington, Inc. | | | 3,413,032 |
| 387,069 | | General Electric Co. | | | 13,686,759 |
| 91,749 | | Quanta Services, Inc.(a) | | | 2,313,910 |
| 118,413 | | Rolls-Royce Group plc ADR | | | 5,766,713 |
| 96,858 | | Simpson Manufacturing Co., Inc. | | | 2,987,101 |
| 35,000 | | Tyco International Ltd. | | | 1,104,250 |
| 78,500 | | Waste Management, Inc. | | | 2,701,185 |
| | | | | |
| | | | | 48,185,049 |
| | | | | |
| | INFORMATION TECHNOLOGY — 10.23% |
| 674,200 | | 3com Corp.(a) | | | 2,636,122 |
| 432,065 | | Cisco Systems, Inc.(a) | | | 11,030,619 |
| 42,250 | | International Rectifier Corp.(a) | | | 1,614,373 |
| 110,345 | | Microchip Technology, Inc. | | | 3,920,558 |
| 316,700 | | Microsoft Corp. | | | 8,826,429 |
| 183,500 | | National Instruments Corp. | | | 4,813,205 |
See Notes to Financial Statements.
39
Excelsior Funds, Inc.
Portfolio of Investments — March 31, 2007
Blended Equity Fund — (continued)
| | | | | |
| Shares | | | | Value |
| | | | | |
| COMMON STOCKS — (continued) | | |
| | INFORMATION TECHNOLOGY — (continued) |
| 141,200 | | NCR Corp.(a) | | $ | 6,745,124 |
| 50,000 | | Nvidia Corp.(a) | | | 1,439,000 |
| | | | | |
| | | | | 41,025,430 |
| | | | | |
| | MATERIALS — 5.87% |
| 119,300 | | Aracruz Cellulose S.A. ADR | | | 6,259,671 |
| 136,000 | | Nucor Corp. | | | 8,857,680 |
| 72,350 | | Vulcan Materials Co. | | | 8,427,328 |
| | | | | |
| | | | | 23,544,679 |
| | | | | |
| | REAL ESTATE — 1.48% | | | |
| 113,400 | | St. Joe Co. | | | 5,931,954 |
| | | | | |
| | UTILITIES — 7.11% | | | |
| 351,600 | | AES Corp.(a) | | | 7,566,432 |
| 294,600 | | Sierra Pacific Resources(a) | | | 5,120,148 |
| 247,000 | | TXU Corp. | | | 15,832,700 |
| | | | | |
| | | | | 28,519,280 |
| | | | | |
| | Total COMMON STOCKS
(Cost $208,186,325) | | | 390,354,740 |
| | | | | |
| FOREIGN COMMON STOCKS — 2.34% | | |
| | BELGIUM — 0.77% | | | |
| 153,500 | | RHJ International(a) | | | 3,075,454 |
| | | | | |
| | GERMANY — 1.32% | | | |
| 90,050 | | Bayerische Motoren Werke AG | | | 5,319,042 |
| | | | | |
| | SINGAPORE — 0.25% | | | |
| 232,500 | | Singapore Exchange Ltd. | | | 999,971 |
| | | | | |
| | TOTAL FOREIGN COMMON STOCKS
(Cost $8,084,275) | | | 9,394,467 |
| | | | | |
| | | | | | |
Principal Amount | | | | Value |
| | | | | | |
| REPURCHASE AGREEMENT — 0.29% | | |
| $ | 1,150,000 | | JP Morgan Chase Securities, Inc., 5.06%, dated 03/30/07, to be repurchased 04/02/07, repurchase price $1,150,485 (collateralized by U.S. Government Obligation, par value $913,000, 7.13%, 01/15/30; total market value $1,163,553) | | $ | 1,150,000 |
| | | | | | |
| | | TOTAL REPURCHASE AGREEMENT
(Cost $1,150,000) | | | 1,150,000 |
| | | | | | |
| | | | | | |
TOTAL INVESTMENTS
(Cost $217,420,600) | | 99.97 | % | | $ | 400,899,207 |
OTHER ASSETS IN EXCESS OF LIABILITIES | | 0.03 | | | | 123,598 |
| | | | | | |
NET ASSETS | | 100.00 | % | | $ | 401,022,805 |
| | | | | | |
| (a) | Non-income producing security. |
ADR—American Depositary Receipt
Ltd.—Limited
plc—Public Limited Company
At March 31, 2007, the prices of certain foreign securities held by the Fund aggregating $9,394,467 were adjusted from their closing market prices following the guidelines adopted by the Fund’s board of trustees.
See Notes to Financial Statements.
40
Excelsior Funds, Inc.
Portfolio of Investments — March 31, 2007
Blended Equity Fund — (continued)
The summary of the Fund’s investments as of March 31, 2007 is as follows: (Unaudited)
| | | | | | |
Sector Diversification | | % of
Net
Assets | | | Value |
Financial | | 22.85 | % | | $ | 91,666,280 |
Industrials | | 12.02 | | | | 48,185,049 |
Consumer Discretionary | | 11.62 | | | | 46,613,395 |
Health Care | | 11.10 | | | | 44,510,425 |
Information Technology | | 10.23 | | | | 41,025,430 |
Energy | | 9.79 | | | | 39,251,522 |
Consumer Staples | | 7.61 | | | | 30,501,193 |
Utilities | | 7.11 | | | | 28,519,280 |
Materials | | 5.87 | | | | 23,544,679 |
Real Estate | | 1.48 | | | | 5,931,954 |
Repurchase Agreement | | 0.29 | | | | 1,150,000 |
| | | | | | |
Total Investment | | 99.97 | % | | $ | 400,899,207 |
Other Assets in Excess of Liabilities | | 0.03 | | | | 123,598 |
| | | | | | |
Net Assets | | 100.00 | % | | $ | 401,022,805 |
| | | | | | |
See Notes to Financial Statements.
41
Excelsior Funds, Inc.
Portfolio of Investments — March 31, 2007
Energy and Natural Resources Fund
| | | | | |
| Shares | | | | Value |
| | | | | |
| COMMON STOCKS — 96.47% | | |
| | ENERGY— 67.26% | | | |
| 125,000 | | Allis-Chalmers Energy, Inc.(a) | | $ | 1,968,750 |
| 225,000 | | Arena Resources, Inc.(a) | | | 11,277,000 |
| 200,000 | | Atwood Oceanics, Inc.(a) | | | 11,738,000 |
| 162,740 | | BP plc ADR | | | 10,537,415 |
| 225,000 | | Chevron Corp. | | | 16,641,000 |
| 150,000 | | ConocoPhillips | | | 10,252,500 |
| 206,388 | | Devon Energy Corp. | | | 14,286,177 |
| 200,000 | | Endeavor International Corp.(a) | | | 410,000 |
| 350,000 | | Energy Conversion Devices, Inc.(a) | | | 12,229,000 |
| 225,000 | | Exxon Mobil Corp. | | | 16,976,250 |
| 1,830,163 | | Gasco Energy, Inc.(a) | | | 4,465,598 |
| 110,000 | | GlobalSantaFe Corp. | | | 6,784,800 |
| 300,000 | | Grant Prideco, Inc.(a) | | | 14,952,000 |
| 100,000 | | Hercules Offshore, Inc.(a) | | | 2,626,000 |
| 3,650,000 | | Kodiak Oil & Gas Corp. ADR(a) | | | 19,053,000 |
| 134,600 | | Nabors Industries Ltd.(a) | | | 3,993,582 |
| 150,000 | | National-Oilwell, Inc.(a) | | | 11,668,500 |
| 206,600 | | Newfield Exploration Co.(a) | | | 8,617,286 |
| 300,000 | | Nova Biosource Fuels, Inc.(a) | | | 825,000 |
| 450,000 | | Parallel Petroleum Corp.(a) | | | 10,327,500 |
| 633,700 | | Petroquest Energy, Inc.(a) | | | 7,407,953 |
| 225,000 | | Quicksilver Resources, Inc.(a) | | | 8,948,250 |
| 297,000 | | Range Resources Corp. | | | 9,919,800 |
| 231,000 | | Schlumberger Ltd. | | | 15,962,100 |
| 252,600 | | Southwestern Energy Co.(a) | | | 10,351,548 |
| 112,800 | | Suncor Energy, Inc. ADR | | | 8,612,280 |
| 250,000 | | Sunoco, Inc. | | | 17,610,000 |
| 175,000 | | Teton Energy Corp.(a) | | | 847,000 |
| 562,400 | | TETRA Technologies, Inc.(a) | | | 13,896,904 |
| 100,000 | | Transocean Sedco Forex, Inc.(a) | | | 8,170,000 |
| 113,400 | | Ultra Petroleum Corp.(a) | | | 6,024,942 |
| 300,000 | | Valero Energy | | | 19,347,000 |
| 394,500 | | Willbros Group, Inc.(a) | | | 8,892,030 |
| 166,666 | | XTO Energy, Inc. | | | 9,134,963 |
| | | | | |
| | | | | 334,754,128 |
| | | | | |
| | INDUSTRIALS — 9.18% | | | |
| 150,000 | | Deere & Co. | | | 16,296,000 |
| 440,000 | | DryShips, Inc. | | | 9,913,200 |
| | | | | |
| Shares | | | | Value |
| | | | | |
| COMMON STOCKS — (continued) | | |
| | INDUSTRIALS — (continued) | | | |
| 350,000 | | General Electric Co. | | $ | 12,376,000 |
| 453,550 | | Omega Navigation Enterprises, Inc., Class A ADR | | | 7,088,987 |
| | | | | |
| | | | | 45,674,187 |
| | | | | |
| | MATERIALS — 17.52% | | | |
| 200,000 | | Alcan, Inc. | | | 10,440,000 |
| 147,500 | | Aracruz Cellulose S.A. ADR | | | 7,739,325 |
| 11,400 | | Arizona Star Resource Corp.(a) | | | 135,660 |
| 680,000 | | Claymont Steel Holdings, Inc.(a) | | | 13,552,400 |
| 350,000 | | Companhia Vale do Rio Doce ADR | | | 12,946,500 |
| 211,496 | | Freeport-McMoRan Copper & Gold, Inc. ADR | | | 13,998,920 |
| 700,000 | | HudBay Minerals, Inc. ADR(a) | | | 12,336,100 |
| 56,500 | | Ivanhoe Mines Ltd.(a) | | | 648,620 |
| 700,000 | | Kinross Gold Corp.(a) | | | 9,653,000 |
| 400,000 | | Yamana Gold, Inc. | | | 5,744,000 |
| | | | | |
| | | | | 87,194,525 |
| | | | | |
| | UTILITIES — 2.51% | | | |
| 200,000 | | Consolidated Water Co. Ltd. | | | 4,742,000 |
| 272,000 | | Williams Cos., Inc. | | | 7,741,120 |
| | | | | |
| | | | | 12,483,120 |
| | | | | |
| | TOTAL COMMON STOCKS
(Cost $428,360,162) | | | 480,105,960 |
| | | | | |
| | |
| Contracts | | | | |
| PUT OPTION PURCHASED — 0.24% | | |
| 13,400 | | Energy Select Sector Spider Fund Expires 06/16/07
strike price 56 | | | 1,206,000 |
| | | | | |
| | TOTAL PUT OPTION PURCHASED
(Cost $1,131,362) | | | 1,206,000 |
| | | | | |
See Notes to Financial Statements.
42
Excelsior Funds, Inc.
Portfolio of Investments — March 31, 2007
Energy and Natural Resources Fund — (continued)
| | | | | | |
Principal
Amount | | | | Value |
| | | | | | |
| REPURCHASE AGREEMENT — 4.70% | | |
| $ | 23,402,000 | | JP Morgan Chase Securities, Inc., 5.06%, dated 03/30/07, to be repurchased 04/02/07, repurchase price $23,411,868 (collateralized by U.S. Government Obligations, ranging in par value $3,194,000-$10,405,000, 3.30%-5.25%, 02/13/08-01/27/20; total market value $23,632,144) | | $ | 23,402,000 |
| | | | | | |
| | | TOTAL REPURCHASE AGREEMENT
(Cost $23,402,000) | | | 23,402,000 |
| | | | | | |
| | | | | | | |
TOTAL INVESTMENTS
(Cost $452,893,524) | | 101.41 | % | | $ | 504,713,960 | |
LIABILITIES IN EXCESS OF OTHER ASSETS | | (1.41 | ) | | | (7,038,079 | ) |
| | | | | | | |
NET ASSETS | | 100.00 | % | | $ | 497,675,881 | |
| | | | | | | |
| (a) | Non-income producing security. |
ADR—American Depositary Receipt
Ltd.—Limited
plc—Public Limited Company
The summary of the Fund’s investments as of March 31, 2007 is as follows: (Unaudited)
| | | | | | | |
Sector Diversification | | % of
Net
Assets | | | Market Value | |
Energy | | 67.26 | % | | $ | 334,754,128 | |
Materials | | 17.52 | | | | 87,194,525 | |
Industrials | | 9.18 | | | | 45,674,187 | |
Repurchase Agreement | | 4.70 | | | | 23,402,000 | |
Utilities | | 2.51 | | | | 12,483,120 | |
Put Options Purchased | | 0.24 | | | | 1,206,000 | |
| | | | | | | |
Total Investment | | 101.41 | % | | $ | 504,713,960 | |
Liabilities in Excess of Other Assets | | (1.41 | ) | | | (7,038,079 | ) |
| | | | | | | |
Net Assets | | 100.00 | % | | $ | 497,675,881 | |
| | | | | | | |
See Notes to Financial Statements.
43
Excelsior Funds Trust
Portfolio of Investments — March 31, 2007
Equity Income Fund
| | | | | |
| Shares | | | | Value |
| | | | | |
| COMMON STOCKS — 91.59% | | |
| | CONSUMER DISCRETIONARY — 9.21% |
| 110,000 | | CBS Corp., Class B | | $ | 3,364,900 |
| 100,000 | | Circuit City Stores, Inc. | | | 1,853,000 |
| 90,000 | | Home Depot, Inc. | | | 3,306,600 |
| 8,000 | | Idearc, Inc. | | | 280,800 |
| 140,000 | | Leggett & Platt, Inc. | | | 3,173,800 |
| 225,000 | | Newell Rubbermaid, Inc. | | | 6,995,250 |
| 135,000 | | Time Warner, Inc. | | | 2,662,200 |
| 5,000 | | Time Warner Cable, Inc.,
Class A(a) | | | 187,350 |
| | | | | |
| | | | | 21,823,900 |
| | | | | |
| | CONSUMER STAPLES — 5.53% | | | |
| 78,000 | | Altria Group, Inc. | | | 6,849,180 |
| 160,000 | | SUPERVALU, Inc. | | | 6,251,200 |
| | | | | |
| | | | | 13,100,380 |
| | | | | |
| | ENERGY — 9.69% | | | |
| 70,000 | | BP plc ADR | | | 4,532,500 |
| 112,000 | | Chevron Corp. | | | 8,283,520 |
| 195,000 | | Halliburton Co. | | | 6,189,300 |
| 135,000 | | Penn West Energy Trust | | | 3,966,300 |
| | | | | |
| | | | | 22,971,620 |
| | | | | |
| | FINANCIAL — 18.96% | | | |
| 300,000 | | Arthur J. Gallagher & Co. | | | 8,499,000 |
| 113,000 | | Citigroup, Inc. | | | 5,801,420 |
| 105,000 | | Freddie Mac | | | 6,246,450 |
| 185,000 | | Mellon Financial Corp. | | | 7,980,900 |
| 80,000 | | Morgan Stanley | | | 6,300,800 |
| 95,000 | | RenaissanceRe Holdings Ltd. | | | 4,763,300 |
| 153,000 | | U.S. BanCorp. | | | 5,350,410 |
| | | | | |
| | | | | 44,942,280 |
| | | | | |
| | HEALTH CARE — 6.59% | | | |
| 75,000 | | Medtronic, Inc. | | | 3,679,500 |
| 105,000 | | Novartis AG ADR | | | 5,736,150 |
| 80,000 | | Pharmaceutical Holders Trust Index Fund | | | 6,213,600 |
| | | | | |
| | | | | 15,629,250 |
| | | | | |
| | INDUSTRIALS — 10.73% | | | |
| 160,000 | | Dover Corp. | | | 7,809,600 |
| 195,000 | | General Electric Co. | | | 6,895,200 |
| 170,000 | | Honeywell International, Inc. | | | 7,830,200 |
| 60,000 | | Hubbell, Inc., Class B | | | 2,894,400 |
| | | | | |
| | | | | 25,429,400 |
| | | | | |
| | | | | |
| Shares | | | | Value |
| | | | | |
| COMMON STOCKS — (continued) | | |
| | INFORMATION TECHNOLOGY — 12.33% |
| 225,000 | | Electronic Data Systems Corp. | | $ | 6,228,000 |
| 145,000 | | Linear Technology Corp. | | | 4,580,550 |
| 210,000 | | Microsoft Corp. | | | 5,852,700 |
| 290,000 | | Nokia Oyj ADR | | | 6,646,800 |
| 230,000 | | Xilinx, Inc. | | | 5,917,900 |
| | | | | |
| | | | | 29,225,950 |
| | | | | |
| | MATERIALS — 13.54% | | | |
| 284,310 | | Domtar Corp.(a) | | | 2,646,926 |
| 67,000 | | Eastman Chemical Co. | | | 4,243,110 |
| 235,000 | | Packaging Corp. of America | | | 5,734,000 |
| 56,047 | | Pope Resources Ltd. | | | 2,248,606 |
| 32,000 | | Rayonier, Inc. | �� | | 1,376,000 |
| 395,000 | | RPM, Inc. | | | 9,124,500 |
| 90,000 | | Weyerhaeuser Co. | | | 6,726,600 |
| | | | | |
| | | | | 32,099,742 |
| | | | | |
| | TELECOMMUNICATION SERVICES — 5.01% |
| 147,000 | | AT&T, Inc. | | | 5,796,210 |
| 160,000 | | Verizon Communications, Inc. | | | 6,067,200 |
| | | | | |
| | | | | 11,863,410 |
| | | | | |
| | TOTAL COMMON STOCKS
(Cost $178,895,931) | | | 217,085,932 |
| | | | | |
| FOREIGN COMMON STOCKS — 3.39% | | |
| | UNITED KINGDOM — 3.39% | | | |
| 466,720 | | Pearson plc | | | 8,028,863 |
| | | | | |
| | TOTAL FOREIGN
COMMON STOCKS
(Cost $5,553,970) | | | 8,028,863 |
| | | | | |
| CONVERTIBLE PREFERRED STOCKS — 2.69% | | |
| | CONSUMER DISCRETIONARY — 2.42% |
| 76,000 | | Ford Motor Co. Capital Trust II, Preferred Exchange, 6.50% | | | 2,717,760 |
| 133,000 | | General Motors Corp., Series C, Preferred Exchange, 6.25% | | | 3,019,100 |
| | | | | |
| | | | | 5,736,860 |
| | | | | |
| | ENERGY — 0.27% | | | |
| 16,000 | | EL Paso Energy Capital Trust I, Preferred Exchange, 4.75% | | | 640,000 |
| | | | | |
| | TOTAL CONVERTIBLE PREFERRED STOCKS
(Cost $5,311,099) | | | 6,376,860 |
| | | | | |
See Notes to Financial Statements.
44
Excelsior Funds Trust
Portfolio of Investments — March 31, 2007
Equity Income Fund — (continued)
| | | | | | |
| Contracts | | | | Value |
| | | | | | |
| CALL OPTIONS PURCHASED — 1.42% | | |
| | 500 | | Circuit City Stores, Inc. Expires 01/17/09 strike price 17.50 | | $ | 210,000 |
| | 915 | | Circuit City Stores, Inc. Expires 01/17/09 strike price 20 | | | 274,500 |
| | 1,100 | | Home Depot, Inc. Expires 01/18/08 strike price 35 | | | 473,000 |
| | 200 | | Home Depot, Inc. Expires 01/17/09 strike price 30 | | | 182,000 |
| | 2,300 | | Time Warner, Inc. Expires 01/18/08 strike price 15(b) | | | 1,311,000 |
| | 300 | | Time Warner, Inc. Expires 01/17/09 strike price 15 | | | 177,000 |
| | 500 | | Xilinx, Inc. Expires
01/18/08 strike price 20 | | | 340,000 |
| | 500 | | Xilinx, Inc. Expires
01/17/09 strike price 20 | | | 395,000 |
| | | | | | |
| | | TOTAL CALL OPTIONS PURCHASED (Cost $3,717,864) | | | 3,362,500 |
| | | | | | |
| | |
Principal
Amount | | | | |
| REPURCHASE AGREEMENT — 0.53% | | |
| $ | 1,248,000 | | JP Morgan Chase Securities, Inc., 5.06%, dated 3/30/07, to be repurchased 4/02/07, repurchase price $1,248,526 (collateralized by U.S. Government Obligation, par value $1,270,000, 4.88%, 01/27/20; total market value $1,258,834) | | | 1,248,000 |
| | | | | | |
| | | TOTAL REPURCHASE AGREEMENT
(Cost $1,248,000) | | $ | 1,248,000 |
| | | | | | |
| | | | | | |
TOTAL INVESTMENTS
(Cost $194,726,864) | | 99.62 | % | | $ | 236,102,155 |
OTHER ASSETS IN EXCESS OF LIABILITIES | | 0.38 | | | | 901,563 |
| | | | | | |
NET ASSETS | | 100.00 | % | | $ | 237,003,718 |
| | | | | | |
| (a) | Non-income producing security. |
| (b) | Fair valued as of March 31, 2007. |
ADR—American Depositary Receipt
Ltd.—Limited
plc—Public limited company
When-issued—Security that is conditionally traded on an exchange prior to the date the security in issued.
At March 31, 2007, the prices of certain foreign securities held by the Fund aggregating $8,028,863 were adjusted from their closing market prices following the guidelines adopted by the Fund’s board of trustees.
See Notes to Financial Statements.
45
Excelsior Funds Trust
Portfolio of Investments — March 31, 2007
Equity Income Fund — (continued)
The summary of the Fund’s investments as of March 31, 2007 is as follows: (Unaudited)
| | | | | | |
Sector Diversification | | % of
Net
Assets | | | Value |
Financial | | 18.96 | % | | $ | 44,942,280 |
Consumer Discretionary | | 15.02 | | | | 35,589,623 |
Materials | | 13.54 | | | | 32,099,742 |
Information Technology | | 12.33 | | | | 29,225,950 |
Industrials | | 10.73 | | | | 25,429,400 |
Energy | | 9.96 | | | | 23,611,620 |
Health Care | | 6.59 | | | | 15,629,250 |
Consumer Staples | | 5.53 | | | | 13,100,380 |
Telecommunication | | 5.01 | | | | 11,863,410 |
Call Options Purchased | | 1.42 | | | | 3,362,500 |
Repurchase Agreement | | 0.53 | | | | 1,248,000 |
| | | | | | |
Total Investment | | 99.62 | % | | $ | 236,102,155 |
Other Assets in Excess of Liabilities | | 0.38 | | | | 901,563 |
| | | | | | |
Net Assets | | 100.00 | % | | $ | 237,003,718 |
| | | | | | |
See Notes to Financial Statements.
46
Excelsior Funds Trust
Portfolio of Investments — March 31, 2007
Equity Opportunities Fund
| | | | | |
| Shares | | | | Value |
| | | | | |
| COMMON STOCKS — 90.31% | | |
| | CONSUMER DISCRETIONARY — 11.74% |
| 105,750 | | BorgWarner, Inc. | | $ | 7,975,665 |
| 148,100 | | Dillards, Inc., Class A | | | 4,847,313 |
| 155,000 | | John Wiley & Sons, Class A | | | 5,852,800 |
| 148,450 | | Life Time Fitness, Inc.(a) | | | 7,631,815 |
| 203,200 | | Sotheby’s Holdings, Inc.,
Class A | | | 9,038,336 |
| 167,000 | | Timberland Co., Class A(a) | | | 4,347,010 |
| | | | | |
| | | | | 39,692,939 |
| | | | | |
| | CONSUMER STAPLES — 4.42% | | | |
| 144,600 | | Anheuser Busch Cos., Inc. | | | 7,296,516 |
| 220,000 | | Senomyx, Inc.(a) | | | 2,723,600 |
| 96,600 | | Wm. Wrigley Jr. Co. | | | 4,919,838 |
| | | | | |
| | | | | 14,939,954 |
| | | | | |
| | ENERGY — 8.52% | | | |
| 98,000 | | Apache Corp. | | | 6,928,600 |
| 571,000 | | EL Paso Corp. | | | 8,262,370 |
| 87,500 | | Exxon Mobil Corp. | | | 6,601,875 |
| 91,550 | | Suncor Energy, Inc. ADR | | | 6,989,843 |
| | | | | |
| | | | | 28,782,688 |
| | | | | |
| | FINANCIAL — 16.24% | | | |
| 386,100 | | Aegon N.V. | | | 7,698,834 |
| 155,000 | | American Capital Strategies Ltd. | | | 6,868,050 |
| 79 | | Berkshire Hathaway, Inc., Class A(a) | | | 8,610,210 |
| 41,500 | | Lehman Brothers Holding, Inc. | | | 2,907,905 |
| 269,000 | | Leucadia National Corp. | | | 7,913,980 |
| 106,000 | | NYSE Group, Inc.(a) | | | 9,937,499 |
| 206,000 | | Progressive Corp. | | | 4,494,920 |
| 128,000 | | RenaissanceRe Holdings Ltd. | | | 6,417,920 |
| | | | | |
| | | | | 54,849,318 |
| | | | | |
| | HEALTH CARE — 8.42% | | | |
| 97,100 | | Johnson & Johnson | | | 5,851,246 |
| 105,000 | | Medtronic, Inc. | | | 5,151,300 |
| 105,100 | | Novo-Nordisk A/S ADR | | | 9,514,703 |
| 90,150 | | Roche Holdings Ltd. ADR | | | 7,938,339 |
| | | | | |
| | | | | 28,455,588 |
| | | | | |
| | INDUSTRIALS — 15.95% | | | |
| 2,833,000 | | Bombardier, Inc., Class B(a) | | | 11,436,820 |
| 127,700 | | Canadian National Railway Co. | | | 5,636,678 |
| 150,200 | | Expeditors International of Washington, Inc. | | | 6,206,264 |
| | | | | |
| Shares | | | | Value |
| | | | | |
| COMMON STOCKS — (continued) | | |
| | INDUSTRIALS — (continued) | | | |
| 160,100 | | General Electric Co. | | $ | 5,661,136 |
| 426,200 | | Quanta Services, Inc.(a) | | | 10,748,764 |
| 181,700 | | Rolls-Royce Group plc ADR | | | 8,848,790 |
| 173,700 | | Simpson Manufacturing Co., Inc. | | | 5,356,908 |
| | | | | |
| | | | | 53,895,360 |
| | | | | |
| | INFORMATION TECHNOLOGY — 5.82% |
| 1,430,000 | | 3com Corp.(a) | | | 5,591,300 |
| 86,400 | | International Rectifier Corp.(a) | | | 3,301,344 |
| 152,400 | | Microchip Technology, Inc. | | | 5,414,772 |
| 205,000 | | National Instruments Corp. | | | 5,377,150 |
| | | | | |
| | | | | 19,684,566 |
| | | | | |
| | MATERIALS — 11.45% | | | |
| 120,250 | | Aracruz Cellulose S.A. ADR | | | 6,309,518 |
| 20,500 | | IPSCO, Inc. | | | 2,693,700 |
| 184,300 | | Monsanto Co. | | | 10,129,128 |
| 127,900 | | Nucor Corp. | | | 8,330,127 |
| 96,400 | | Vulcan Materials Co. | | | 11,228,672 |
| | | | | |
| | | | | 38,691,145 |
| | | | | |
| | REAL ESTATE — 1.56% | | | |
| 101,100 | | St. Joe Co. | | | 5,288,541 |
| | | | | |
| | UTILITIES — 6.19% | | | |
| 430,600 | | AES Corp.(a) | | | 9,266,512 |
| 239,000 | | Centerpoint Energy, Inc. | | | 4,287,660 |
| 424,100 | | Sierra Pacific Resources(a) | | | 7,370,858 |
| | | | | |
| | | | | 20,925,030 |
| | | | | |
| | TOTAL COMMON STOCKS
(Cost $251,082,492) | | | 305,205,129 |
| | | | | |
| FOREIGN COMMON STOCKS — 5.90% | | |
| | BELGIUM — 1.77% | | | |
| 299,000 | | RHJ International(a) | | | 5,990,623 |
| | | | | |
| | GERMANY — 1.66% | | | |
| 95,200 | | Bayerische Motoren Werke AG | | | 5,623,241 |
| | | | | |
| | SINGAPORE — 2.47% | | | |
| 1,600,000 | | Olam International Ltd. | | | 3,213,760 |
| 1,190,385 | | Singapore Exchange Ltd. | | | 5,119,786 |
| | | | | |
| | | | | 8,333,546 |
| | | | | |
| | TOTAL FOREIGN COMMON STOCKS
(Cost $18,425,117) | | | 19,947,410 |
| | | | | |
See Notes to Financial Statements.
47
Excelsior Funds Trust
Portfolio of Investments — March 31, 2007
Equity Opportunities Fund — (continued)
| | | | | | |
Principal
Amount | | | | Value |
| | | | | | |
| REPURCHASE AGREEMENT — 3.87% | | |
| $ | 13,082,000 | | JP Morgan Chase Securities, Inc., 5.06%, dated 3/30/07, to be repurchased 4/02/07, repurchase price $13,087,516 (collateralized by U.S. Government Obligations, ranging in par value $4,185,000-$4,500,000, 4.60%-5.46%, 04/11/08-03/08/13; total market value $13,232,533) | | $ | 13,082,000 |
| | | | | | |
| | | TOTAL REPURCHASE AGREEMENT
(Cost $13,082,000) | | | 13,082,000 |
| | | | | | |
| | | | | | | |
TOTAL INVESTMENTS
(Cost $282,589,609) | | 100.08 | % | | $ | 338,234,539 | |
LIABILITIES IN EXCESS OF OTHER ASSETS | | (0.08 | ) | | | (254,789 | ) |
| | | | | | | |
NET ASSETS | | 100.00 | % | | $ | 337,979,750 | |
| | | | | | | |
| (a) | Non-income producing security. |
ADR—American Depositary Receipt
Ltd.—Limited
At March 31, 2007, the prices of certain foreign securities held by the Fund aggregating $19,947,410 were adjusted from their closing market prices following the guidelines adopted by the Fund’s board of trustees.
See Notes to Financial Statements.
48
Excelsior Funds Trust
Portfolio of Investments — March 31, 2007
Equity Opportunities Fund — (continued)
The summary of the Fund’s investments as of March 31, 2007 is as follows: (Unaudited)
| | | | | | | |
Sector Diversification | | % of
Net
Assets | | | Value | |
Financial | | 19.53 | % | | $ | 65,959,727 | |
Industrials | | 15.95 | | | | 53,895,360 | |
Consumer Discretionary | | 13.40 | | | | 45,316,180 | |
Materials | | 11.45 | | | | 38,691,145 | |
Energy | | 8.52 | | | | 28,782,688 | |
Health Care | | 8.42 | | | | 28,455,588 | |
Utilities | | 6.19 | | | | 20,925,030 | |
Information Technology | | 5.82 | | | | 19,684,566 | |
Consumer Staples | | 5.37 | | | | 18,153,714 | |
Repurchase Agreements | | 3.87 | | | | 13,082,000 | |
Real estate | | 1.56 | | | | 5,288,541 | |
| | | | | | | |
Total Investment | | 100.08 | % | | $ | 338,234,539 | |
Other Assets in Excess of Liabilities | | (0.08 | ) | | | (254,789 | ) |
| | | | | | | |
Net Assets | | 100.00 | % | | $ | 337,979,750 | |
| | | | | | | |
See Notes to Financial Statements.
49
Excelsior Funds, Inc.
Portfolio of Investments — March 31, 2007
Large Cap Growth Fund
| | | | | |
| Shares | | | | Value |
| | | | | |
| COMMON STOCKS — 99.05% | | |
| | CONSUMER DISCRETIONARY — 18.33% |
| 422,700 | | Best Buy Co., Inc. | | $ | 20,593,944 |
| 476,700 | | Coach, Inc.(a) | | | 23,858,835 |
| 756,000 | | eBay(a) | | | 25,061,400 |
| 253,200 | | Las Vegas Sands Corp.(a) | | | 21,929,652 |
| 663,300 | | Lowes Companies, Inc. | | | 20,887,317 |
| 709,700 | | Starbucks Corp.(a) | | | 22,256,192 |
| | | | | |
| | | | | 134,587,340 |
| | | | | |
| | FINANCIAL — 8.80% | | | |
| 50,800 | | Chicago Mercantile Exchange | | | 27,048,968 |
| 294,100 | | Lehman Brothers Holding, Inc. | | | 20,607,587 |
| 414,600 | | SLM Corp. | | | 16,957,140 |
| | | | | |
| | | | | 64,613,695 |
| | | | | |
| | HEALTH CARE — 26.89% | | | |
| 195,155 | | Alcon, Inc. | | | 25,725,332 |
| 241,800 | | Allergan, Inc. | | | 26,796,276 |
| 354,800 | | Amgen, Inc.(a) | | | 19,826,224 |
| 564,900 | | Celgene Corp.(a) | | | 29,634,654 |
| 287,300 | | Genentech, Inc.(a) | | | 23,593,076 |
| 390,758 | | Gilead Sciences, Inc.(a) | | | 29,892,987 |
| 200,300 | | Intuitive Surgical, Inc.(a) | | | 24,350,471 |
| 207,112 | | Zimmer Holdings, Inc.(a) | | | 17,689,436 |
| | | | | |
| | | | | 197,508,456 |
| | | | | |
| | INDUSTRIALS — 6.60% | | | |
| 361,131 | | Corporate Executive Board Co. | | | 27,431,511 |
| 510,000 | | Expeditors International of | | | |
| | Washington, Inc. | | | 21,073,200 |
| | | | | |
| | | | | 48,504,711 |
| | | | | |
| | INFORMATION TECHNOLOGY — 34.17% |
| 572,500 | | Adobe Systems, Inc.(a) | | | 23,873,250 |
| 591,700 | | Akamai Technologies, Inc.(a) | | | 29,537,664 |
| 317,100 | | Apple Computer, Inc.(a) | | | 29,461,761 |
| 729,487 | | Broadcom Corp., Class A(a) | | | 23,394,648 |
| 1,083,500 | | Corning, Inc.(a) | | | 24,638,790 |
| 431,815 | | Electronic Arts, Inc.(a) | | | 21,746,203 |
| 60,873 | | Google, Inc., Class A(a) | | | 27,889,574 |
| 368,406 | | Infosys Technologies Ltd. ADR | | | 18,512,402 |
| 716,100 | | Qualcomm, Inc. | | | 30,548,825 |
| 155,900 | | Research In Motion Ltd.(a) | | | 21,278,791 |
| | | | | |
| | | | | 250,881,908 |
| | | | | |
| | | | | | |
| Shares | | | | Value |
| | | | | | |
| COMMON STOCKS — (continued) | | |
| | | TELECOMMUNICATION SERVICES — 4.26% |
| | 655,200 | | America Movil S.A. de C.V.,
Series L ADR | | $ | 31,312,008 |
| | | | | | |
| | | TOTAL COMMON STOCKS
(Cost $603,454,025) | | | 727,408,118 |
| | | | | | |
Principal
Amount | | | | |
| REPURCHASE AGREEMENT — 0.93% | | |
| $ | 6,859,000 | | JP Morgan Chase Securities, Inc., 5.06%, dated 3/30/07, to be repurchased 4/02/07, repurchase price $6,861,892 (collateralized by U.S. Government Obligation, par value $6,820,000, 3.63%, 06/20/07; total market value $6,927,670) | | | 6,859,000 |
| | | | | | |
| | | TOTAL REPURCHASE AGREEMENT
(Cost $6,859,000) | | $ | 6,859,000 |
| | | | | | |
| | | | | | |
TOTAL INVESTMENTS
(Cost $610,313,025) | | 99.98 | % | | $ | 734,267,118 |
OTHER ASSETS IN EXCESS OF LIABILITIES | | 0.02 | | | | 169,005 |
| | | | | | |
NET ASSETS | | 100.00 | % | | $ | 734,436,123 |
| | | | | | |
| (a) | Non-income producing security |
ADR—American Depositary Receipt
Ltd.—Limited
See Notes to Financial Statements.
50
Excelsior Funds, Inc.
Portfolio of Investments — March 31, 2007
Large Cap Growth Fund — (continued)
The summary of the Fund’s investments as of March 31, 2007 is as follows: (Unaudited)
| | | | | | |
Sector Diversification | | % of
Net
Assets | | | Value |
Information Technology | | 34.17 | % | | $ | 250,881,908 |
Health Care | | 26.89 | | | | 197,508,456 |
Consumer Discretionary | | 18.33 | | | | 134,587,340 |
Financial | | 8.80 | | | | 64,613,695 |
Industrials | | 6.60 | | | | 48,504,711 |
Telecommunication | | 4.26 | | | | 31,312,008 |
Repurchase Agreement | | 0.93 | | | | 6,859,000 |
| | | | | | |
Total Investment | | 99.98 | % | | $ | 734,267,118 |
Other Assets in Excess of Liabilities | | 0.02 | | | | 169,005 |
| | | | | | |
Net Assets | | 100.00 | % | | $ | 734,436,123 |
| | | | | | |
See Notes to Financial Statements.
51
Excelsior Funds Trust
Portfolio of Investments — March 31, 2007
Mid Cap Value and Restructuring Fund
| | | | | |
| Shares | | | | Value |
| | | | | |
| COMMON STOCKS — 95.77% | | |
| | CONSUMER DISCRETIONARY — 23.84% |
| 71,900 | | Autozone, Inc.(a) | | $ | 9,213,266 |
| 105,000 | | Black & Decker Corp. | | | 8,570,100 |
| 112,900 | | Centex Corp. | | | 4,716,962 |
| 330,000 | | Constellation Brands, Inc.(a) | | | 6,989,400 |
| 190,600 | | EchoStar Communications, Inc.(a) | | | 8,277,758 |
| 135,800 | | Limited Brands | | | 3,538,948 |
| 323,200 | | Onex Corp. | | | 8,977,526 |
| 167,700 | | Sherwin-Williams Co. | | | 11,074,909 |
| 348,200 | | Tempur-Pedic International, Inc. | | | 9,049,718 |
| 280,000 | | TJX Cos., Inc. | | | 7,548,800 |
| | | | | |
| | | | | 77,957,387 |
| | | | | |
| | CONSUMER STAPLES — 2.57% |
| 180,000 | | Dean Foods Co.(a) | | | 8,413,200 |
| | | | | |
| | ENERGY — 10.95% | | | |
| 121,800 | | Cimarex Energy Co. | | | 4,509,036 |
| 133,300 | | Devon Energy Corp. | | | 9,227,026 |
| 349,800 | | EL Paso Corp. | | | 5,061,606 |
| 130,000 | | Noble Corp. | | | 10,228,400 |
| 137,800 | | Occidental Petroleum Corp. | | | 6,794,918 |
| | | | | |
| | | | | 35,820,986 |
| | | | | |
| | FINANCIAL — 19.78% | | | |
| 95,000 | | Ace Ltd. | | | 5,420,700 |
| 167,700 | | CIT Group, Inc. | | | 8,874,684 |
| 340,000 | | E*TRADE Group, Inc.(a) | | | 7,214,800 |
| 8,000 | | Employers Holdings, Inc.(a) | | | 160,160 |
| 157,000 | | First Marblehead Corp. | | | 7,047,730 |
| 116,600 | | Lehman Brothers Holding, Inc. | | | 8,170,162 |
| 140,000 | | Leucadia National Corp. | | | 4,118,800 |
| 61,400 | | Mastercard, Inc., Class A | | | 6,523,136 |
| 170,000 | | Progressive Corp. | | | 3,709,400 |
| 90,000 | | RenaissanceRe Holdings Ltd. | | | 4,512,600 |
| 270,000 | | W.R. Berkley Corp. | | | 8,942,400 |
| | | | | |
| | | | | 64,694,572 |
| | | | | |
| | HEALTH CARE — 4.44% | | | |
| 331,300 | | Health Management Associates, Inc., Class A | | | 3,601,231 |
| 176,700 | | Shire Pharmaceuticals plc ADR | | | 10,937,730 |
| | | | | |
| | | | | 14,538,961 |
| | | | | |
| | | | | |
| Shares | | | | Value |
| | | | | |
| COMMON STOCKS — (continued) | | |
| | INDUSTRIALS — 20.38% | | | |
| 130,000 | | Autoliv, Inc. | | $ | 7,424,300 |
| 187,700 | | Brink’s Co. | | | 11,909,565 |
| 247,000 | | Empresa Brasileira de Aeronautica S.A. ADR | | | 11,327,420 |
| 150,000 | | Kennametal, Inc. | | | 10,141,500 |
| 36,000 | | Lincoln Electric Holdings, Inc. | | | 2,144,160 |
| 172,700 | | Mueller Industries, Inc. | | | 5,198,270 |
| 175,000 | | Oshkosh Truck Corp. | | | 9,275,000 |
| 335,300 | | United Rentals, Inc.(a) | | | 9,220,750 |
| | | | | |
| | | | | 66,640,965 |
| | | | | |
| | INFORMATION TECHNOLOGY — 4.78% |
| 140,000 | | Electronic Data Systems Corp. | | | 3,875,200 |
| 230,900 | | Harris Corp. | | | 11,764,355 |
| | | | | |
| | | | | 15,639,555 |
| | | | | |
| | MATERIALS — 4.63% | | | |
| 205,700 | | Aracruz Cellulose S.A. ADR | | | 10,793,079 |
| 129,700 | | Cabot Microelectronics Corp.(a) | | | 4,346,247 |
| | | | | |
| | | | | 15,139,326 |
| | | | | |
| | REAL ESTATE — 1.66% | | | |
| 103,800 | | St. Joe Co. | | | 5,429,778 |
| | | | | |
| | UTILITIES — 2.74% | | | |
| 315,000 | | Williams Cos., Inc. | | | 8,964,900 |
| | | | | |
| | TOTAL COMMON STOCKS
(Cost $202,502,426) | | | 313,239,630 |
| | | | | |
| FOREIGN COMMON STOCKS — 2.14% | | |
| | NETHERLANDS — 2.14% | | | |
| 79,500 | | Hunter Douglas NV | | | 7,013,633 |
| | | | | |
| | TOTAL FOREIGN COMMON STOCKS
(Cost $2,926,238) | | | 7,013,633 |
| | | | | |
| CONVERTIBLE PREFERRED STOCKS — 0.18% | | |
| | CONSUMER DISCRETIONARY — 0.18% |
| 400 | | Blockbuster, Inc., Preferred Exchange | | | 597,600 |
| | | | | |
| | TOTAL CONVERTIBLE PREFERRED STOCKS
(Cost $400,000) | | | 597,600 |
| | | | | |
See Notes to Financial Statements.
52
Excelsior Funds Trust
Portfolio of Investments — March 31, 2007
Mid Cap Value and Restructuring Fund — (continued)
| | | | | | |
Principal
Amount | | | | Value |
| | | | | | |
| REPURCHASE AGREEMENT — 1.85% | | |
| $ | 6,066,000 | | JP Morgan Chase Securities, Inc., 5.06%, dated 03/30/07, to be repurchased 04/02/07, repurchase price $6,068,558 (collateralized by U.S. Government Obligation,
par value $5,876,000, 6.25%, 05/16/16; total market value $6,202,699) | | $ | 6,066,000 |
| | | | | | |
| | | TOTAL REPURCHASE AGREEMENT
(Cost $6,066,000) | | | 6,066,000 |
| | | | | | |
| | | | | | |
TOTAL INVESTMENTS
(Cost $211,894,664) | | 99.94 | % | | $ | 326,916,863 |
OTHER ASSETS IN EXCESS OF LIABILITIES | | 0.06 | | | | 199,906 |
| | | | | | |
NET ASSETS | | 100.00 | % | | $ | 327,116,769 |
| | | | | | |
| (a) | Non-income producing security. |
ADR—American Depositary Receipt
Ltd.—Limited
plc—Public Limited Company
At March 31, 2007, the prices of certain foreign securities held by the Fund aggregating $7,013,633 were adjusted from their closing market prices following the guidelines adopted by the Fund’s board of trustees.
The summary of the Fund’s investments as of March 31, 2007 is as follows: (Unaudited)
| | | | | | |
Sector Diversification | | % of
Net
Assets | | | Market Value |
Consumer Discretionary | | 26.16 | | | $ | 85,568,620 |
Industrials | | 20.38 | | | | 66,640,965 |
Financial | | 19.78 | | | | 64,694,572 |
Energy | | 10.95 | | | | 35,820,986 |
Information Technology | | 4.78 | | | | 15,639,555 |
Materials | | 4.63 | | | | 15,139,326 |
Health Care | | 4.44 | | | | 14,538,961 |
Utilities | | 2.74 | | | | 8,964,900 |
Consumer Staples | | 2.57 | | | | 8,413,200 |
Repurchase Agreement. | | 1.85 | | | | 6,066,000 |
Real Estate | | 1.66 | | | | 5,429,778 |
| | | | | | |
Total Investment | | 99.94 | % | | $ | 326,916,863 |
Other Assets in Excess of Liabilities | | 0.06 | | | | 199,906 |
| | | | | | |
Net Assets | | 100.00 | % | | $ | 327,116,769 |
| | | | | | |
See Notes to Financial Statements.
53
Excelsior Funds, Inc.
Portfolio of Investments — March 31, 2007
Real Estate Fund
| | | | | |
| Shares | | | | Value |
| | | | | |
| COMMON STOCKS — 98.84% | | |
| | CONSUMER DISCRETIONARY — 1.92% |
| 45,000 | | Starwood Hotels & Resorts Worldwide, Inc. | | $ | 2,918,250 |
| | | | | |
| | FINANCIAL — 3.08% | | | |
| 100,000 | | iStar Financial, Inc. | | | 4,683,000 |
| | | | | |
| | INDUSTRIALS — 1.68% | | | |
| 50,700 | | Alexander & Baldwin, Inc. | | | 2,557,308 |
| | | | | |
| | REAL ESTATE — 91.77% | | | |
| 80,000 | | AMB Property Corp. | | | 4,703,200 |
| 39,500 | | Apartment Investment & Management Co., Class A | | | 2,278,755 |
| 90,000 | | Archstone-Smith Trust | | | 4,885,200 |
| 37,784 | | AvalonBay Communities, Inc. | | | 4,911,920 |
| 80,000 | | BioMed Realty Trust, Inc. | | | 2,104,000 |
| 55,000 | | Boston Properties, Inc. | | | 6,457,000 |
| 38,300 | | Camden Property Trust | | | 2,692,873 |
| 55,100 | | Cedar Shopping Centers, Inc. | | | 892,620 |
| 110,000 | | Cousins Properties, Inc. | | | 3,614,600 |
| 80,000 | | Digital Reality Trust, Inc. | | | 3,192,000 |
| 100,000 | | Douglas Emmett, Inc. | | | 2,553,000 |
| 105,000 | | Duke Realty Corp. | | | 4,564,350 |
| 120,000 | | Equity Inns, Inc. | | | 1,965,600 |
| 111,820 | | Equity Residential | | | 5,393,079 |
| 60,000 | | Federal Realty Investment Trust | | | 5,437,200 |
| 69,600 | | Forest City Enterprises, Inc.,
Class A | | | 4,606,128 |
| 80,000 | | Health Care REIT, Inc. | | | 3,512,000 |
| 30,000 | | Highland Hospitality Corp. | | | 534,000 |
| 45,300 | | Home Properties of New York, Inc. | | | 2,392,293 |
| 148,910 | | Host Marriott Corp. | | | 3,917,822 |
| 113,032 | | Kimco Realty Corp. | | | 5,509,180 |
| 160,000 | | Kite Realty Group Trust | | | 3,192,000 |
| 100,000 | | Liberty Property Trust | | | 4,872,000 |
| 40,700 | | Macerich Co. | | | 3,759,052 |
| 55,000 | | Maguire Properties, Inc. | | | 1,955,800 |
| 103,124 | | Prologis | | | 6,695,841 |
| 50,100 | | Public Storage, Inc. | | | 4,742,967 |
| 160,000 | | Senior Housing Properties Trust | | | 3,824,000 |
| 63,000 | | Simon Property Group, Inc. | | | 7,008,750 |
| 25,600 | | SL Green Realty Corp. | | | 3,511,808 |
| 57,300 | | St. Joe Co. | | | 2,997,363 |
| | | | | | |
| Shares | | | | Value |
| | | | | | |
| COMMON STOCKS — (continued) | | |
| | | REAL ESTATE — (continued) | | | |
| | 70,000 | | Taubman Centers, Inc. | | $ | 4,059,300 |
| | 140,300 | | U-Store-It Trust | | | 2,822,836 |
| | 75,000 | | Ventas, Inc. | | | 3,159,750 |
| | 55,000 | | Vornado Realty Trust | | | 6,563,700 |
| | 89,175 | | Weingarten Realty Investors | | | 4,241,163 |
| | | | | | |
| | | | | | 139,523,150 |
| | | | | | |
| | | TELECOMMUNICATION SERVICES — 0.39% |
| | 18,300 | | Crown Castle International Corp.(a) | | | 587,979 |
| | | | | | |
| | | TOTAL COMMON STOCKS
(Cost $97,709,064) | | | 150,269,687 |
| | | | | | |
Principal
Amount | | | | |
| REPURCHASE AGREEMENT — 1.24% | | |
| $ | 1,882,000 | | JP Morgan Chase Securities, Inc., 5.06%, dated 3/30/07, to be repurchased 4/02/07, repurchase price $1,882,794 (collateralized by U.S. Government Obligation,
par value $1,840,000,
5.65%, 10/24/13; total market value $1,927,049) | | | 1,882,000 |
| | | | | | |
| | | TOTAL REPURCHASE AGREEMENT
(Cost $1,882,000) | | $ | 1,882,000 |
| | | | | | |
| | | | | | | |
TOTAL INVESTMENTS
(Cost $99,591,064) | | 100.08 | % | | $ | 152,151,687 | |
LIABILITIES IN EXCESS OF OTHER ASSETS | | (0.08 | ) | | | (125,711 | ) |
| | | | | | | |
NET ASSETS | | 100.00 | % | | $ | 152,025,976 | |
| | | | | | | |
| (a) | Non-income producing security |
REIT—Real Estate Investment Trust
See Notes to Financial Statements.
54
Excelsior Funds, Inc.
Portfolio of Investments — March 31, 2007
Real Estate Fund — (continued)
The summary of the Fund’s investments as of March 31, 2007 is as follows: (Unaudited)
| | | | | | | |
Sector Diversification | | % of
Net
Assets | | | Value | |
Real Estate | | 91.77 | % | | $ | 139,523,150 | |
Financial | | 3.08 | | | | 4,683,000 | |
Consumer Discretionary | | 1.92 | | | | 2,918,250 | |
Industrials | | 1.68 | | | | 2,557,308 | |
Repurchase Agreement | | 1.24 | | | | 1,882,000 | |
Telecommunication Services | | 0.39 | | | | 587,979 | |
| | | | | | | |
Total Investment | | 100.08 | % | | $ | 152,151,687 | |
Liabilities in Excess of Other Assets | | (0.08 | ) | | | (125,711 | ) |
| | | | | | | |
Net Assets | | 100.00 | % | | $ | 152,025,976 | |
| | | | | | | |
See Notes to Financial Statements.
55
Excelsior Funds, Inc.
Portfolio of Investments — March 31, 2007
Small Cap Fund
| | | | | |
| Shares | | | | Value |
| | | | | |
| COMMON STOCKS — 98.79% | | |
| | CONSUMER DISCRETIONARY —18.92% |
| 860,000 | | Cabelas, Inc.(a) | | $ | 21,336,600 |
| 220,000 | | Columbia Sportswear Co. | | | 13,708,200 |
| 500,000 | | Leapfrog Enterprises, Inc.(a) | | | 5,350,000 |
| 1,200,000 | | Nautilus, Inc. | | | 18,516,000 |
| 600,000 | | Oakley, Inc. | | | 12,084,000 |
| 540,000 | | Sotheby’s Holdings, Inc.,
Class A | | | 24,019,200 |
| 700,000 | | Talbots, Inc. | | | 16,534,000 |
| 380,000 | | Thor Industries, Inc. | | | 14,968,200 |
| 200,000 | | Urban Outfitters, Inc.(a) | | | 5,302,000 |
| | | | | |
| | | | | 131,818,200 |
| | | | | |
| | CONSUMER SERVICES — 2.04% |
| 340,000 | | P.F. Chang’s China Bistro, Inc.(a) | | | 14,239,200 |
| | | | | |
| | ENERGY — 4.52% | | | |
| 540,000 | | Helix Energy Solutions Group, Inc.(a) | | | 20,136,600 |
| 460,000 | | TETRA Technologies, Inc.(a) | | | 11,366,600 |
| | | | | |
| | | | | 31,503,200 |
| | | | | |
| | FINANCIAL — 12.11% | | | |
| 380,000 | | GFI Group, Inc.(a) | | | 25,828,600 |
| 200,000 | | Greenhill & Co., Inc. | | | 12,278,000 |
| 360,000 | | Jefferies Group, Inc. | | | 10,422,000 |
| 540,000 | | Nara Bancorp, Inc. | | | 9,455,400 |
| 600,000 | | Philadelphia Consolidated Holdings Corp.(a) | | | 26,394,000 |
| | | | | |
| | | | | 84,378,000 |
| | | | | |
| | HEALTH CARE — 6.29% | | | |
| 460,000 | | Arrow International, Inc. | | | 14,793,600 |
| 520,000 | | Kensey Nash Corp.(a) | | | 15,860,000 |
| 300,000 | | Molina Healthcare, Inc.(a) | | | 9,177,000 |
| 1,000,000 | | Orthovita, Inc.(a) | | | 2,920,000 |
| 40,000 | | Pharmanet Development Group, Inc.(a) | | | 1,040,000 |
| | | | | |
| | | | | 43,790,600 |
| | | | | |
| | INDUSTRIALS — 29.75% | | | |
| 660,000 | | FLIR Systems, Inc.(a) | | | 23,542,200 |
| 740,000 | | FTI Consulting, Inc.(a) | | | 24,856,600 |
| | | | | |
| Shares | | | | Value |
| | | | | |
| COMMON STOCKS — (continued) | | |
| | INDUSTRIALS — (continued) | | | |
| 700,000 | | Hewitt Associates, Inc.,
Class A(a) | | $ | 20,461,000 |
| 930,000 | | Innovative Solutions & Support, Inc.(a) | | | 23,547,600 |
| 660,000 | | Kansas City Southern(a) | | | 23,482,800 |
| 1,200,000 | | MPS Group, Inc.(a) | | | 16,980,000 |
| 1,000,000 | | Quanta Services, Inc.(a) | | | 25,220,000 |
| 520,000 | | Shaw Group, Inc.(a) | | | 16,260,400 |
| 600,000 | | Simpson Manufacturing Co., Inc. | | | 18,504,000 |
| 260,000 | | Triumph Group, Inc. | | | 14,388,400 |
| | | | | |
| | | | | 207,243,000 |
| | | | | |
| | INFORMATION TECHNOLOGY — 19.69% |
| 500,000 | | CommScope, Inc.(a) | | | 21,450,000 |
| 660,000 | | Forrester Research, Inc.(a) | | | 18,717,600 |
| 1,100,000 | | Kulicke & Soffa Industries, Inc.(a) | | | 10,175,000 |
| 880,000 | | Manhattan Associates, Inc.(a) | | | 24,138,400 |
| 700,000 | | Plantronics, Inc. | | | 16,534,000 |
| 400,000 | | Power Integrations(a) | | | 9,060,000 |
| 600,000 | | Technitrol, Inc. | | | 15,714,000 |
| 400,000 | | Varian Semiconductor Equipment Associates, Inc.(a) | | | 21,352,000 |
| | | | | |
| | | | | 137,141,000 |
| | | | | |
| | MATERIALS — 1.92% | | | |
| 400,000 | | Cabot Microelectronics Corp.(a) | | | 13,404,000 |
| | | | | |
| | TELECOMMUNICATION SERVICES — 2.13% |
| 1,400,000 | | Andrew Corp.(a) | | | 14,826,000 |
| | | | | |
| | UTILITIES — 1.42% | | | |
| 440,000 | | Aqua America, Inc. | | | 9,878,000 |
| | | | | |
| | TOTAL COMMON STOCKS
(Cost $479,327,610) | | | 688,221,200 |
| | | | | |
See Notes to Financial Statements.
56
Excelsior Funds, Inc.
Portfolio of Investments — March 31, 2007
Small Cap Fund — (continued)
| | | | | | |
Principal
Amount | | | | Value |
| | | | | | |
| REPURCHASE AGREEMENT — 1.53% | | |
| $ | 10,628,000 | | JP Morgan Chase Securities, Inc., 5.06%, dated 3/30/07, to be repurchased 4/02/07, repurchase price $10,632,482
(collateralized by U.S. Government Obligation,
par value $10,507,000,
6.13%, 12/01/17; total market value $10,840,729) | | $ | 10,628,000 |
| | | | | | |
| | | TOTAL REPURCHASE AGREEMENT
(Cost $10,628,000) | | | 10,628,000 |
| | | | | | |
| | | | | | | |
TOTAL INVESTMENTS
(Cost $489,955,610) | | 100.32 | % | | $ | 698,849,200 | |
LIABILITIES IN EXCESS OF OTHER ASSETS | | (0.32 | ) | | | (2,256,893 | ) |
| | | | | | | |
NET ASSETS | | 100.00 | % | | $ | 696,592,307 | |
| | | | | | | |
| (a) | Non-income producing security |
The summary of the Fund’s investments as of March 31, 2007 is as follows: (Unaudited)
| | | | | | | |
Sector Diversification | | % of
Net
Assets | | | Value | |
Industrials | | 29.75 | % | | $ | 207,243,000 | |
Information Technology | | 19.69 | | | | 137,141,000 | |
Consumer Discretionary | | 18.92 | | | | 131,818,200 | |
Financial | | 12.11 | | | | 84,378,000 | |
Health Care | | 6.29 | | | | 43,790,600 | |
Energy | | 4.52 | | | | 31,503,200 | |
Telecommunication Services | | 2.13 | | | | 14,826,000 | |
Consumer Services | | 2.04 | | | | 14,239,200 | |
Materials | | 1.92 | | | | 13,404,000 | |
Repurchase Agreement | | 1.53 | | | | 10,628,000 | |
Utilities | | 1.42 | | | | 9,878,000 | |
| | | | | | | |
Total Investment | | 100.32 | % | | $ | 698,849,200 | |
Liabilities in Excess of Other Assets | | (0.32 | ) | | | (2,256,893 | ) |
| | | | | | | |
Net Assets | | 100.00 | % | | $ | 696,592,307 | |
| | | | | | | |
See Notes to Financial Statements.
57
Excelsior Funds, Inc.
Portfolio of Investments — March 31, 2007
Value and Restructuring Fund
| | | | | |
| Shares | | | | Value |
| | | | | |
| COMMON STOCKS — 95.33% | | |
| | CONSUMER DISCRETIONARY — 11.92% |
| 2,600,000 | | Black & Decker Corp. | | $ | 212,212,000 |
| 2,600,000 | | CBS Corp., Class B | | | 79,534,000 |
| 3,250,000 | | Centex Corp. | | | 135,785,000 |
| 1,800,000 | | EchoStar Communications, Inc.(a)(b) | | | 78,174,000 |
| 850,000 | | Harman International Industries, Inc.(b) | | | 81,668,000 |
| 3,000,000 | | Leggett & Platt, Inc. | | | 68,010,000 |
| 2,700,000 | | Newell Rubbermaid, Inc. | | | 83,943,000 |
| 3,200,000 | | TJX Cos., Inc. | | | 86,272,000 |
| 5,800,000 | | XM Satellite Radio Holdings, Inc., Class A(a) | | | 74,936,000 |
| 2,650,000 | | Zale Corp.(a) | | | 69,907,000 |
| | | | | |
| | | | | 970,441,000 |
| | | | | |
| | CONSUMER STAPLES — 4.87% |
| 2,200,000 | | Avon Products, Inc. | | | 81,972,000 |
| 1,700,000 | | ConAgra Foods, Inc. | | | 42,347,000 |
| 2,500,000 | | Dean Foods Co.(a) | | | 116,850,000 |
| 2,050,000 | | Loews Corp. — Carolina Group | | | 155,000,500 |
| | | | | |
| | | | | 396,169,500 |
| | | | | |
| | ENERGY — 15.68% | | | |
| 1,900,000 | | Anadarko Petroleum Corp. | | | 81,662,000 |
| 2,800,000 | | ConocoPhillips | | | 191,380,000 |
| 2,450,000 | | Devon Energy Corp. | | | 169,589,000 |
| 8,791 | | Dynegy, Inc., Class A(a) | | | 81,405 |
| 5,800,000 | | EL Paso Corp. | | | 83,926,000 |
| 1,450,000 | | Murphy Oil Corp. | | | 77,430,000 |
| 2,150,000 | | Noble Energy, Inc. | | | 128,247,500 |
| 1,975,000 | | Petrobras ADR | | | 196,532,250 |
| 4,200,000 | | Petrohawk Energy Corp.(a) | | | 55,314,000 |
| 944,900 | | Pinnacle Gas Resources, Inc.(a)(c)(d)(e) | | | 10,393,900 |
| 2,750,000 | | Rossetta Resources, Inc.(a) | | | 56,485,000 |
| 2,000,000 | | Spectra Energy Corp. | | | 52,540,000 |
| 2,500,000 | | Todco, Class A(a) | | | 100,825,000 |
| 2,500,000 | | W&T Offshore, Inc. | | | 72,325,000 |
| | | | | |
| | | | | 1,276,731,055 |
| | | | | |
| | FINANCIAL — 22.15% | | | |
| 2,650,000 | | Ace Ltd. | | | 151,209,000 |
| 1,950,000 | | AerCap Holdings NV ADR(a) | | | 56,764,500 |
| | | | | |
| Shares | | | | Value |
| | | | | |
| COMMON STOCKS — (continued) | | |
| | FINANCIAL — (continued) | | | |
| 3,850,000 | | Amvescap plc ADR | | $ | 85,085,000 |
| 2,800,000 | | Apollo Investment Corp.(f) | | | 59,920,000 |
| 1,200,000 | | Capital One Financial Corp. | | | 90,552,000 |
| 2,403,260 | | CastlePoint Holdings Ltd.(a) | | | 39,293,301 |
| 1,900,000 | | CIT Group, Inc. | | | 100,548,000 |
| 2,450,000 | | Citigroup, Inc. | | | 125,783,000 |
| 1,650,000 | | Freddie Mac | | | 98,158,500 |
| 1,000,000 | | Genworth Financial, Inc. | | | 34,940,000 |
| 2,000,000 | | JP Morgan Chase & Co. | | | 96,760,000 |
| 1,750,000 | | Lehman Brothers Holding, Inc. | | | 122,622,500 |
| 2,700,000 | | Loews Corp. | | | 122,661,000 |
| 700,000 | | Marsh & McLennan Cos., Inc. | | | 20,503,000 |
| 400,000 | | Mastercard, Inc., Class A(b) | | | 42,496,000 |
| 3,500,000 | | MCG Capital Corp. | | | 65,660,000 |
| 1,850,000 | | Metlife, Inc. | | | 116,827,500 |
| 2,100,000 | | Morgan Stanley | | | 165,396,000 |
| 1,250,000 | | PNC Financial Services Group, Inc. | | | 89,962,500 |
| 3,000,000 | | Primus Guaranty Ltd.(a) | | | 36,900,000 |
| 2,000,000 | | Washington Mutual, Inc. | | | 80,760,000 |
| | | | | |
| | | | | 1,802,801,801 |
| | | | | |
| | HEALTH CARE — 3.30% | | | |
| 1,850,000 | | AmerisourceBergen Corp. | | | 97,587,500 |
| 2,200,000 | | Baxter International, Inc. | | | 115,874,000 |
| 2,000,000 | | Bristol-Myers Squibb Co. | | | 55,520,000 |
| | | | | |
| | | | | 268,981,500 |
| | | | | |
| | INDUSTRIALS — 14.05% | | | |
| 2,900,000 | | AGCO Corp.(a) | | | 107,213,000 |
| 1,100,000 | | Aries Maritime Transport Ltd. | | | 9,031,000 |
| 1,050,181 | | Arlington Tankers | | | 25,057,319 |
| 2,100,000 | | Copa Holdings S.A., Class A | | | 108,129,000 |
| 2,583,500 | | Empresa Brasileira de Aeronautica S.A. ADR | | | 118,479,310 |
| 3,500,000 | | Gol Linhas Aereas Inteligentes S.A. ADR | | | 106,505,000 |
| 1,000,000 | | Omega Navigation Enterprises, Inc., Class A ADR | | | 15,630,000 |
| 1,100,000 | | Rockwell Automation, Inc. | | | 65,857,000 |
| 1,900,000 | | Ryder Systems, Inc. | | | 93,746,000 |
| 3,100,000 | | Tyco International Ltd. | | | 97,805,000 |
| 1,700,000 | | Union Pacific Corp. | | | 172,635,000 |
See Notes to Financial Statements.
58
Excelsior Funds, Inc.
Portfolio of Investments — March 31, 2007
Value and Restructuring Fund — (continued)
| | | | | |
| Shares | | | | Value |
| | | | | |
| COMMON STOCKS — (continued) | | |
| | INDUSTRIALS — (continued) | | | |
| 4,250,000 | | United Rentals, Inc.(a) | | $ | 116,875,000 |
| 1,650,000 | | United Technologies Corp. | | | 107,250,000 |
| | | | | |
| | | | | 1,144,212,629 |
| | | | | |
| | INFORMATION TECHNOLOGY — 5.26% |
| 4,200,000 | | Harris Corp. | | | 213,990,000 |
| 900,000 | | International Business Machines Corp. | | | 84,834,000 |
| 3,850,000 | | Nokia Oyj ADR | | | 88,242,000 |
| 1,750,000 | | Plantronics, Inc. | | | 41,335,000 |
| | | | | |
| | | | | 428,401,000 |
| | | | | |
| | MATERIALS — 11.07% | | | |
| 3,300,000 | | Alpha Natural Resources, Inc.(a) | | | 51,579,000 |
| 4,000,000 | | Celanese Corp., Class A | | | 123,360,000 |
| 4,550,000 | | CONSOL Energy, Inc. | | | 178,041,500 |
| 1,100,000 | | Eagle Materials, Inc. | | | 49,093,000 |
| 1,500,000 | | Foundation Coal Holdings, Inc. | | | 51,510,000 |
| 750,000 | | Freeport-McMoRan Copper & Gold, Inc. | | | 49,642,500 |
| 4,600,000 | | International Coal Group, Inc.(a) | | | 24,150,000 |
| 1,400,000 | | PPG Industries, Inc. | | | 98,434,000 |
| 1,700,000 | | Schnitzer Steel Industries, Inc. | | | 68,289,000 |
| 4,000,000 | | Smurfit-Stone Container Corp.(a) | | | 45,040,000 |
| 1,800,000 | | Southern Copper Corp. | | | 128,988,000 |
| 2,300,000 | | Tronox, Inc. | | | 33,120,000 |
| | | | | |
| | | | | 901,247,000 |
| | | | | |
| | REAL ESTATE — 2.44% |
| 3,820,000 | | Diamondrock Hospitality Co. | | | 72,580,000 |
| 1,000,000 | | FBR Capital Markets Corp.(a)(d)(e) | | | 15,250,000 |
| 2,050,000 | | Host Marriott Corp. | | | 53,935,500 |
| 3,000,000 | | Peoples Choice Financial Corp.(a)(d)(e) | | | 4,500,000 |
| 900,000 | | Ventas, Inc. | | | 37,917,000 |
| 2,140,500 | | Vintage Wine Trust, Inc.(d)(e) | | | 14,448,375 |
| | | | | |
| | | | | 198,630,875 |
| | | | | |
| | | | | |
| Shares | | | | Value |
| | | | | |
| COMMON STOCKS — (continued) | | |
| | TELECOMMUNICATION SERVICES — 4.59% |
| 5,500,000 | | America Movil S.A. de C.V., Series L ADR(b) | | $ | 262,845,000 |
| 1,842,000 | | Datapath, Inc.(a)(d)(e) | | | 17,499,000 |
| 2,600,000 | | Sprint Nextel Corp. | | | 49,296,000 |
| 3,000,000 | | Windstream Corp. | | | 44,070,000 |
| | | | | |
| | | | | 373,710,000 |
| | | | | |
| | TOTAL COMMON STOCKS
(Cost $5,086,518,227) | | | 7,761,326,360 |
| | | | | |
| FOREIGN COMMON STOCKS — 3.07% | | |
| | GERMANY — 0.96% | | | |
| 1,500,000 | | Lanxess AG(a) | | | 77,534,540 |
| | | | | |
| | ITALY — 0.66% | | | |
| 5,000,000 | | Enel S.p.A | | | 53,541,373 |
| | | | | |
| | MEXICO — 0.62% | | | |
| 11,000,000 | | Grupo Mexico S.A.B. de C.V., Series B | | | 50,835,939 |
| | | | | |
| | SWITZERLAND — 0.83% | | | |
| 950,000 | | Petroplus Holdings AG(a) | | | 67,644,880 |
| | | | | |
| | TOTAL FOREIGN COMMON STOCKS (Cost $177,913,078) | | | 249,556,732 |
| | | | | |
| CONVERTIBLE PREFERRED STOCKS — 1.28% |
| | CONSUMER DISCRETIONARY — 1.03% |
| 2,350,000 | | Ford Motor Co. Capital Trust II, Preferred Exchange, 6.50% | | | 84,036,000 |
| | | | | |
| | MATERIALS — 0.25% | | | |
| 500,000 | | Celanese Corp., Preferred Exchange, 4.25% | | | 20,437,500 |
| | | | | |
| | TOTAL CONVERTIBLE PREFERRED STOCKS
(Cost $98,271,130) | | | 104,473,500 |
| | | | | |
See Notes to Financial Statements.
59
Excelsior Funds, Inc.
Portfolio of Investments �� March 31, 2007
Value and Restructuring Fund — (continued)
| | | | | | |
Principal
Amount | | | | Value |
| | | | | | |
| REPURCHASE AGREEMENT — 0.24% | | |
| $ | 19,528,000 | | JP Morgan Chase Securities, Inc., 5.06%, dated 3/30/07, to be repurchased 4/02/07, repurchase price $19,536,234 (collateralized by U.S. Government Obligations, ranging in par value $3,775,000-$5,340,000, 4.13%-6.25%, 07/17/09-03/02/21; total market value $19,629,004) | | $ | 19,528,000 |
| | | | | | |
| | | TOTAL REPURCHASE AGREEMENT
(Cost $19,528,000) | | | 19,528,000 |
| | | | | | |
| | | | | | |
TOTAL INVESTMENTS
(Cost $5,382,230,435) | | 99.92 | % | | $ | 8,134,884,592 |
OTHER ASSETS IN EXCESS OF LIABILITIES | | 0.08 | | | | 6,272,224 |
| | | | | | |
NET ASSETS | | 100.00 | % | | $ | 8,141,156,816 |
| | | | | | |
| (a) | Non-income producing security. |
| (b) | All or part of the security is segregated by the Fund’s custodian to cover future purchase commitments. |
| (c) | Fair valued as of March 31, 2007. |
| (d) | Security exempt from registration under Rule 144A of the Securities Act of 1933. This security may be resold in transactions exempt from registration, normally to qualified institutional buyers. At March 31, 2007 these securities amounted to $62,091,275 or 0.76% of net assets. |
| (e) | Represents an illiquid security as of March 31, 2007. |
| (f) | Closed-end Management Investment Company. |
ADR—American Depositary Receipt
Ltd.—Limited
plc—Public Limited Company
At March 31, 2007, the prices of certain foreign securities held by the Fund aggregating $249,556,732 were adjusted from their closing market prices following the guidelines adopted by the Fund’s board of trustees.
| | | | | | |
Contracts | | | | Value | |
| CALL OPTIONS WRITTEN: | | | |
| (10,000) | | America Movil S.A. de C.V., Expires 05/18/07 strike price 50 | | $ | (1,400,000 | ) |
| (5,000) | | EchoStar Communications, Inc., Expires 06/15/07 strike price 45 | | | (875,000 | ) |
| (4,000) | | Harmon International Industries, Inc., Expires 04/20/07
strike price 105 | | | (40,000 | ) |
| (4,000) | | Mastercard, Inc., Expires 04/20/07 strike price 105 | | | (1,520,000 | ) |
| | | | | | |
| | TOTAL CALL OPTIONS WRITTEN
(Premiums received $6,678,258) | | $ | (3,835,000 | ) |
| | | | | | |
See Notes to Financial Statements.
60
Excelsior Funds, Inc.
Portfolio of Investments — March 31, 2007
Value and Restructuring Fund — (continued)
The summary of the Fund’s investments as of March 31, 2007 is as follows: (Unaudited)
| | | | | | |
Sector Diversification | | % of
Net
Assets | | | Value |
Financial | | 22.15 | % | | $ | 1,802,801,801 |
Energy | | 16.51 | | | | 1,344,375,935 |
Industrials | | 15.01 | | | | 1,221,747,169 |
Consumer Discretionary | | 12.95 | | | | 1,054,477,000 |
Materials | | 11.94 | | | | 972,520,439 |
Consumer Staples | | 5.53 | | | | 449,710,873 |
Information Technology | | 5.26 | | | | 428,401,000 |
Telecommunication Services | | 4.59 | | | | 373,710,000 |
Health Care | | 3.30 | | | | 268,981,500 |
Real Estate | | 2.44 | | | | 198,630,875 |
Repurchase Agreement | | 0.24 | | | | 19,528,000 |
| | | | | | |
Total Investment | | 99.92 | % | | $ | 8,134,884,592 |
Other Assets in Excess of Liabilities | | 0.08 | | | | 6,272,224 |
| | | | | | |
Net Assets | | 100.00 | % | | $ | 8,141,156,816 |
| | | | | | |
See Notes to Financial Statements.
61
Excelsior Funds, Inc.
Portfolio of Investments — March 31, 2007
Emerging Markets Fund
| | | | | |
| Shares | | | | Value |
| | | | | |
| COMMON STOCKS — 90.40% | | |
| | ARGENTINA — 1.75% |
| 931,800 | | Telecom Argentina S.A. ADR(a) | | $ | 19,884,612 |
| | | | | |
| | BRAZIL — 7.35% | | | |
| 841,674 | | Arcelor Brazil S.A. | | | 19,700,232 |
| 431,400 | | Companhia Vale do Rio Doce S.A. | | | 15,983,985 |
| 516,832 | | Diagnosticos da America S.A.(a) | | | 11,419,344 |
| 210,000 | | Gafisa S.A. ADR(a) | | | 5,355,000 |
| 398,800 | | Gol Linhas Aereas Inteligentes S.A. ADR | | | 12,135,484 |
| 215,400 | | Uniao de Bancos Brasileiros S.A. | | | 18,838,884 |
| | | | | |
| | | | | 83,432,929 |
| | | | | |
| | CHILE — 0.86% | | | |
| 195,000 | | Banco Santander Chile S.A. ADR | | | 9,724,650 |
| | | | | |
| | CHINA — 13.94% | | | |
| 23,275,000 | | Bank of Communications Ltd., Class H (Hong Kong) | | | 23,836,803 |
| 27,271,300 | | Chaoda Mordern Agriculture Holdings Ltd. (Hong Kong) | | | 19,132,698 |
| 42,614,000 | | China Construction Bank, Class H (Hong Kong) | | | 24,240,683 |
| 620,797 | | China Mobile Ltd. ADR
(Hong Kong) | | | 27,842,744 |
| 20,961,000 | | China Petroleum & Chemical Corp., Class H
(Hong Kong) | | | 17,695,045 |
| 17,823,252 | | Far East Consortium International Ltd. (Hong Kong) | | | 7,488,513 |
| 2,647,000 | | Industrial & Commercial Bank of China (Hong Kong)(a) | | | 1,471,330 |
| 15,539,400 | | People’s Food Holdings Ltd. | | | 15,331,163 |
| 131,700 | | PetroChina Co. Ltd. ADR | | | 15,420,753 |
| 8,447,000 | | Texwinca Holdings Ltd. (Hong Kong) | | | 5,691,008 |
| | | | | |
| | | | | 158,150,740 |
| | | | | |
| | COLUMBIA — 0.96% | | | |
| 392,800 | | Bancolombia S.A. ADR | | | 10,876,632 |
| | | | | |
| | INDIA — 4.47% | | | |
| 339,350 | | ICICI Bank Ltd. ADR | | | 12,471,113 |
| 240,400 | | India Fund, Inc.(b) | | | 9,168,856 |
| | | | | |
| Shares | | | | Value |
| | | | | |
| COMMON STOCKS — (continued) | | |
| | INDIA — (continued) | | | |
| 222,900 | | State Bank of India GDR(c)(d) | | $ | 14,000,128 |
| 655,700 | | Suzlon Energy Ltd. | | | 15,026,990 |
| | | | | |
| | | | | 50,667,087 |
| | | | | |
| | INDONESIA — 3.51% | | | |
| 28,198,700 | | PT Indocement Tunggal Prakarsa Tbk | | | 15,712,804 |
| 22,402,700 | | PT Telekomunikasi Indonesia Tbk | | | 24,119,251 |
| | | | | |
| | | | | 39,832,055 |
| | | | | |
| | MALAYSIA — 4.51% | | | |
| 1,882,600 | | Genting Berhad | | | 21,644,856 |
| 6,454,950 | | Public Bank Berhad | | | 16,796,781 |
| 4,404,300 | | Telekom Malaysia Berhad | | | 12,743,885 |
| | | | | |
| | | | | 51,185,522 |
| | | | | |
| | MEXICO — 10.68% | | | |
| 428,100 | | America Movil S.A. de C.V., Series L ADR | | | 20,458,899 |
| 405,244 | | Cemex S.A.B de C.V. ADR | | | 13,271,741 |
| 262,600 | | Grupo Aeroportuario del Pacifico S.A. de C.V. ADR | | | 11,291,800 |
| 801,355 | | Grupo Elektra S.A. | | | 12,453,662 |
| 2,124,100 | | Grupo Televisa S.A. | | | 12,651,633 |
| 363,380 | | Telefonos de Mexico S.A. de C.V., Series L ADR | | | 12,136,892 |
| 5,959,029 | | Urbi Desarrollos Urbanos S.A. de C.V.(a) | | | 24,650,417 |
| 3,330,082 | | Wal-Mart de Mexico S.A. de C.V. | | | 14,221,989 |
| | | | | |
| | | | | 121,137,033 |
| | | | | |
| | RUSSIA — 8.25% | | | |
| 210,200 | | Lukoil Co. ADR | | | 18,161,280 |
| 103,200 | | MMC Norilsk Nickel ADR | | | 19,143,600 |
| 368,100 | | Mobile TeleSystems ADR | | | 20,598,876 |
| 421,350 | | OAO Gazprom ADR | | | 17,645,323 |
| 464,000 | | RBC Information Systems ADR(a) | | | 18,096,000 |
| | | | | |
| | | | | 93,645,079 |
| | | | | |
| | SOUTH AFRICA — 6.97% | | | |
| 2,911,042 | | African Bank Investments Ltd. | | | 12,159,057 |
| 704,600 | | Gold Fields Ltd. ADR | | | 13,021,008 |
See Notes to Financial Statements.
62
Excelsior Funds, Inc.
Portfolio of Investments — March 31, 2007
Emerging Markets Fund — (continued)
| | | | | |
| Shares | | | | Value |
| | | | | |
| COMMON STOCKS — (continued) | | |
| | SOUTH AFRICA — (continued) |
| 1,522,224 | | MTN Group Ltd. | | $ | 20,644,880 |
| 405,500 | | Sasol Ltd. | | | 13,548,385 |
| 861,916 | | Telekom South Africa Ltd. | | | 19,703,763 |
| | | | | |
| | | | | 79,077,093 |
| | | | | |
| | SOUTH KOREA — 13.39% | | | |
| 337,802 | | Hana Financial Group, Inc. | | | 17,448,510 |
| 650,638 | | KT Corp. ADR | | | 14,567,785 |
| 421,680 | | LG Cable Ltd. | | | 18,391,544 |
| 120,562 | | LG Home Shopping, Inc. | | | 8,748,113 |
| 13,000 | | Lotte Chilsung Beverage Co. Ltd. | | | 16,574,190 |
| 135,810 | | NCSoft Corp.(a) | | | 8,922,644 |
| 101,567 | | Pacific Corp. | | | 14,917,642 |
| 63,570 | | Samsung Electronic Co. Ltd. | | | 37,914,018 |
| 614,685 | | SK Telecom Co. Ltd. ADR | | | 14,395,923 |
| | | | | |
| | | | | 151,880,369 |
| | | | | |
| | TAIWAN — 7.19% | | | |
| 817,900 | | Chunghwa Telecom Co. Ltd. ADR | | | 16,292,568 |
| 3,114,471 | | Hon Hai Precision, Inc. | | | 20,814,502 |
| 6,673,453 | | President Chain Store Corp. | | | 16,314,127 |
| 11,780,387 | | Synnex Technology International Corp. | | | 14,581,583 |
| 233,704 | | Taiwan Semiconductor Manufacturing Co. Ltd. | | | 475,681 |
| 1,212,264 | | Taiwan Semiconductor Manufacturing Co. Ltd. ADR | | | 13,031,838 |
| | | | | |
| | | | | 81,510,299 |
| | | | | |
| | THAILAND — 0.99% | | | |
| 5,867,900 | | Advanced Info Service Public Co. Ltd. (Foreign Shares) | | | 11,246,697 |
| | | | | |
| | TURKEY — 2.13% | | | |
| 872,210 | | Akbank T.A.S. ADR(c)(d) | | | 11,692,325 |
| 1,112,582 | | Arcelik A.S. | | | 7,500,339 |
| 1,016,704 | | Turkiye Vakiflar Bankasi T.A.O.(a) | | | 2,282,098 |
| 1,065,000 | | Turkiye Vakiflar Bankasi T.A.O., Class D | | | 2,655,359 |
| | | | | |
| | | | | 24,130,121 |
| | | | | |
| | | | | | |
| Shares | | | | Value |
| | | | | | |
| COMMON STOCKS — (continued) | | |
| | | UNITED KINGDOM — 3.45% |
| | 428,800 | | Anglo American plc (South Africa shares) | | $ | 22,641,042 |
| | 712,500 | | Kazakhmys plc | | | 16,481,436 |
| | | | | | |
| | | | | | 39,122,478 |
| | | | | | |
| | | TOTAL COMMON STOCKS
(Cost $658,437,278) | | | 1,025,503,396 |
| | | | | | |
| PREFERRED STOCKS — 5.39% | | |
| | | BRAZIL — 4.54% | | | |
| | 769,836 | | Banco Bradesco S.A. | | | 15,701,021 |
| | 315,754,000 | | Companhia Energetica de Minas Gerais | | | 15,486,405 |
| | 906,800 | | Petroleo Brasileiro S.A. | | | 20,317,463 |
| | | | | | |
| | | | | | 51,504,889 |
| | | | | | |
| | | SOUTH KOREA — 0.85% | | | |
| | 246,300 | | Hyundai Motor Co. Ltd. | | | 9,641,771 |
| | | | | | |
| | | TOTAL PREFERRED STOCKS
(Cost $28,204,675) | | | 61,146,660 |
| | | | | | |
Principal
Amount | | | | |
| REPURCHASE AGREEMENT — 4.10% | | |
| $ | 46,464,000 | | JP Morgan Chase Securities, Inc., 5.06%, dated 03/30/07, to be repurchased 04/02/07, repurchase price $46,483,592
(collateralized by U.S. Government Obligations, ranging in par value $1,400,000-$8,000,000, 2.35%-5.81%, 07/09/07-02/22/16; total market value $47,043,406) | | | 46,464,000 |
| | | | | | |
| | | TOTAL REPURCHASE AGREEMENT
(Cost $46,464,000) | | $ | 46,464,000 |
| | | | | | |
| | | | | | |
TOTAL INVESTMENTS
(Cost $733,105,953) | | 99.89 | % | | $ | 1,133,114,056 |
OTHER ASSETS IN EXCESS OF LIABILITIES | | 0.11 | | | | 1,299,423 |
| | | | | | |
NET ASSETS | | 100.00 | % | | $ | 1,134,413,479 |
| | | | | | |
See Notes to Financial Statements.
63
Excelsior Funds, Inc.
Portfolio of Investments — March 31, 2007
Emerging Markets Fund — (continued)
| (a) | Non-income producing security |
| (b) | Closed-end Management Investment Company |
| (c) | Security exempt from registration under Rule 144A of the Securities Act of 1933. This security may be resold in transactions exempt from registration, normally to qualified institutional buyers. At March 31, 2007, these securities amounted to $25,692,453 or 2.26% of net assets. |
| (d) | Represents an illiquid security as of March 31, 2007. |
ADR—American Depositary Receipt
GDR—Global Depositary Receipt
Ltd.—Limited
plc—Public Limited Company
At March 31, 2007, the prices of certain foreign securities held by the fund aggregating $681,294,860 were adjusted from their closing market prices following the guidelines adopted by the fund’s board of trustees.
The summary of the Fund’s investments as of March 31, 2007 is as follows: (Unaudited)
| | | | | | |
Sector Diversification | | % of
Net
Assets | | | Value |
Telecommunication Services | | 20.68 | % | | $ | 234,636,776 |
Financial | | 17.78 | | | | 201,683,886 |
Industrials | | 12.18 | | | | 138,241,847 |
Materials | | 10.42 | | | | 118,188,134 |
Energy | | 10.20 | | | | 115,656,321 |
Consumer Discretionary | | 8.94 | | | | 101,367,158 |
Information Technology | | 7.96 | | | | 90,332,041 |
Consumer Staples | | 5.81 | | | | 65,955,693 |
Repurchase Agreement | | 4.10 | | | | 46,464,000 |
Health Care | | 1.01 | | | | 11,419,344 |
Investment Companies | | 0.81 | | | | 9,168,856 |
| | | | | | |
Total Investment | | 99.89 | % | | $ | 1,133,114,056 |
Other Assets in Excess of Liabilities | | 0.11 | | | | 1,299,423 |
| | | | | | |
Net Assets | | 100.00 | % | | $ | 1,134,413,479 |
| | | | | | |
See Notes to Financial Statements.
64
Excelsior Funds, Inc.
Portfolio of Investments — March 31, 2007
International Fund
| | | | | |
| Shares | | | | Value |
| | | | | |
| COMMON STOCKS — 96.80% | | |
| | AUSTRALIA — 3.39% | | | |
| 180,100 | | CSL Ltd. | | $ | 11,970,062 |
| 151,213 | | Rio Tinto Ltd. | | | 9,621,493 |
| | | | | |
| | | | | 21,591,555 |
| | | | | |
| | BELGIUM — 1.45% | | | |
| 51,600 | | Umicore | | | 9,209,370 |
| | | | | |
| | CANADA — 2.76% | | | |
| 173,000 | | Canadian National Railway Co. | | | 7,632,265 |
| 168,600 | | Gildan Activewear, Inc.(a) | | | 9,933,114 |
| | | | | |
| | | | | 17,565,379 |
| | | | | |
| | CHINA — 2.28% | | | |
| 59,400 | | PetroChina Co. Ltd. ADR | | | 6,955,146 |
| 653,000 | | Sun Hung Kai Properties Ltd.
(Hong Kong) | | | 7,547,181 |
| | | | | |
| | | | | 14,502,327 |
| | | | | |
| | FINLAND — 2.60% | | | |
| 259,400 | | Fortum Oyj | | | 7,553,772 |
| 391,100 | | Nokia Oyj | | | 9,010,767 |
| | | | | |
| | | | | 16,564,539 |
| | | | | |
| | FRANCE — 6.87% | | | |
| 218,728 | | AXA S.A. | | | 9,300,999 |
| 69,950 | | BNP Paribas S.A. | | | 7,315,627 |
| 125,056 | | Carrefour S.A. | | | 9,165,254 |
| 45,234 | | Compagnie Generale de Geophysique S.A. (CGG)(a) | | | 9,520,020 |
| 120,756 | | Total S.A. | | | 8,435,187 |
| | | | | |
| | | | | 43,737,087 |
| | | | | |
| | GERMANY — 6.09% | | | |
| 164,100 | | Adidas-Salomon AG | | | 8,938,409 |
| 140,200 | | Bayerische Motoren Werke AG | | | 8,281,285 |
| 160,300 | | Rhoen-Klinikum AG | | | 9,620,800 |
| 362,300 | | SGL Carbon AG(a) | | | 11,937,113 |
| | | | | |
| | | | | 38,777,607 |
| | | | | |
| | GREECE — 1.35% | | | |
| 342,400 | | Greek Postal Savings Bank(a) | | | 8,628,459 |
| | | | | |
| | INDONESIA — 1.42% | | | |
| 8,413,600 | | PT Telekomunikasi Indonesia Tbk | | | 9,058,271 |
| | | | | |
| | | | | |
| Shares | | | | Value |
| | | | | |
| COMMON STOCKS — (continued) | | |
| | IRELAND — 1.49% | | | |
| 443,137 | | Bank of Ireland | | $ | 9,505,023 |
| | | | | |
| | ITALY — 2.31% | | | |
| 231,590 | | ENI S.p.A. | | | 7,535,552 |
| 280,336 | | Permasteelisa S.p.A. | | | 7,166,773 |
| | | | | |
| | | | | 14,702,325 |
| | | | | |
| | JAPAN — 22.09% | | | |
| 179,000 | | Canon, Inc. | | | 9,612,903 |
| 395,700 | | Casio Computer Co. Ltd. | | | 8,626,608 |
| 428,963 | | Chiyoda Corp. | | | 9,371,104 |
| 372,400 | | Don Quijote Co. Ltd. | | | 7,262,637 |
| 104,500 | | FANUC Co. Ltd. | | | 9,684,151 |
| 248,000 | | Hoya Corp. | | | 8,194,705 |
| 32,400 | | Keyence Corp. | | | 7,291,073 |
| 94,400 | | Kyocera Corp. | | | 8,870,248 |
| 204,100 | | Millea Holdings, Inc. | | | 7,522,394 |
| 840 | | Mitsubishi Tokyo Financial Group, Inc. | | | 9,465,649 |
| 452,000 | | Nikon Corp. | | | 9,488,277 |
| 4,500 | | NTT DoCoMo, Inc. | | | 8,291,357 |
| 963,000 | | Sumitomo Trust & Banking Co. Ltd. | | | 9,992,651 |
| 160,000 | | Takeda Pharmaceutical Co. Ltd. | | | 10,478,438 |
| 1,022,700 | | The Bank of Fukuoka Ltd.(b). | | | 8,162,696 |
| 90,700 | | Yamada Denki Co. Ltd. | | | 8,414,968 |
| | | | | |
| | | | | 140,729,859 |
| | | | | |
| | MEXICO — 2.46% | | | |
| 175,300 | | America Movil S.A. de C.V.,
Series L ADR | | | 8,377,587 |
| 222,924 | | Cemex S.A.B de C.V. ADR | | | 7,300,761 |
| | | | | |
| | | | | 15,678,348 |
| | | | | |
| | NETHERLANDS — 3.14% |
| 249,400 | | ABN Amro Holding NV | | | 10,745,042 |
| 544,900 | | Qiagen NV(a) | | | 9,246,638 |
| | | | | |
| | | | | 19,991,680 |
| | | | | |
| | NORWAY — 3.46% | | | |
| 559,900 | | Tandberg ASA | | | 11,580,908 |
| 591,800 | | Telenor ASA | | | 10,451,745 |
| | | | | |
| | | | | 22,032,653 |
| | | | | |
| | SINGAPORE — 1.66% | | | |
| 752,000 | | DBS Group Holdings Ltd. | | | 10,587,671 |
| | | | | |
See Notes to Financial Statements.
65
Excelsior Funds, Inc.
Portfolio of Investments — March 31, 2007
International Fund — (continued)
| | | | | |
| Shares | | | | Value |
| | | | | |
| COMMON STOCKS — (continued) | | |
| | SPAIN — 4.04% | | | |
| 513,000 | | Banco Santander Central Hispano S.A. | | $ | 9,157,121 |
| 241,000 | | Repsol YPF S.A. | | | 8,119,989 |
| 381,246 | | Telefonica S.A. | | | 8,441,669 |
| | | | | |
| | | | | 25,718,779 |
| | | | | |
| | SWEDEN — 1.55% | | | |
| 183,800 | | Svenska Cellulosa AB | | | 9,843,177 |
| | | | | |
| | SWITZERLAND — 4.71% |
| 252,400 | | Micronas Semiconductor AG | | | 5,238,986 |
| 49,310 | | Roche Holdings AG | | | 8,761,769 |
| 71,600 | | Synthes, Inc. | | | 8,867,886 |
| 119,900 | | UBS AG(a) | | | 7,151,930 |
| | | | | |
| | | | | 30,020,571 |
| | | | | |
| | TAIWAN — 2.95% | | | |
| 1,527,241 | | Hon Hai Precision, Inc. | | | 10,206,793 |
| 800,808 | | Taiwan Semiconductor Manufacturing Co. Ltd. ADR | | | 8,608,686 |
| | | | | |
| | | | | 18,815,479 |
| | | | | |
| | TURKEY — 1.17% | | | |
| 1,101,800 | | Arcelik A.S. | | | 7,427,654 |
| | | | | |
| | UNITED KINGDOM — 17.56% |
| 692,600 | | BG Group | | | 9,989,649 |
| 804,700 | | Cadbury Schweppes plc | | | 10,341,382 |
| 314,673 | | GlaxoSmithKline plc | | | 8,684,944 |
| 438,400 | | HSBC Holdings plc | | | 7,676,017 |
| 671,500 | | Paragon Group plc | | | 7,664,914 |
| 172,877 | | Reckitt Benckiser plc | | | 9,014,282 |
| 694,000 | | Reed Elsevier plc | | | 8,314,845 |
| 240,242 | | Royal Bank of Scotland Group plc | | | 9,403,981 |
| 1,785,500 | | Sage Group plc (The) | | | 9,087,223 |
| 1,176,942 | | Serco Group plc | | | 10,644,672 |
| 509,400 | | Shire plc | | | 10,515,250 |
| 1,730,276 | | William Morrison Supermarkets plc | | | 10,513,091 |
| | | | | |
| | | | | 111,850,250 |
| | | | | |
| | TOTAL COMMON STOCKS
(Cost $459,574,539) | | | 616,538,063 |
| | | | | |
| | | | | | |
Principal
Amount | | | | Value |
| | | | | | |
| REPURCHASE AGREEMENT — 3.84% | | |
| $ | 24,450,000 | | JP Morgan Chase Securities, Inc., 5.06%, dated 03/30/06, to be repurchased 4/02/07, repurchase price $24,460,310 (collateralized by U.S. Government Obligations, ranging in par value $7,330,000- $9,285,000, 2.75%-5.30%, 03/14/08-07/21/20; total market value $24,717,230) | | $ | 24,450,000 |
| | | | | | |
| | | TOTAL REPURCHASE AGREEMENT
(Cost $24,450,000) | | | 24,450,000 |
| | | | | | |
| | | | | | | |
TOTAL INVESTMENTS
(Cost $484,024,539) | | 100.64 | % | | $ | 640,988,063 | |
LIABILITIES IN EXCESS OF OTHER ASSETS | | (0.64 | ) | | | (4,046,916 | ) |
| | | | | | | |
NET ASSETS | | 100.00 | % | | $ | 636,941,147 | |
| | | | | | | |
| (a) | Non-income producing security. |
| (b) | Fair valued as of March 31, 2007. |
ADR—American Depositary Receipt
Ltd.—Limited
plc—Public Limited Company
At March 31, 2007, the prices of certain foreign securities held by the fund aggregating $585,295,883 were adjusted from their closing market prices following the guidelines adopted by the fund’s board of trustees.
See Notes to Financial Statements.
66
Excelsior Funds, Inc.
Portfolio of Investments — March 31, 2007
International Fund — (continued)
The summary of the Fund’s investments as of March 31, 2007 is as follows: (Unaudited)
| | | | | | | |
Sector Diversification | | % of
Net
Assets | | | Value | |
Financial | | 23.40 | % | | $ | 149,073,996 | |
Industrials | | 13.80 | | | | 87,943,842 | |
Health Care | | 10.82 | | | | 68,899,150 | |
Telecommunication Services | | 10.24 | | | | 65,212,303 | |
Consumer Discretionary | | 9.61 | | | | 61,200,074 | |
Information Technology | | 9.39 | | | | 59,819,544 | |
Energy | | 7.94 | | | | 50,555,544 | |
Consumer Staples | | 7.45 | | | | 47,448,977 | |
Repurchase Agreement | | 3.84 | | | | 24,450,000 | |
Materials | | 2.96 | | | | 18,830,862 | |
Utilities | | 1.19 | | | | 7,553,771 | |
| | | | | | | |
Total Investment | | 100.64 | % | | $ | 640,988,063 | |
Liabilities in Excess of Other Assets | | (0.64 | ) | | | (4,046,916 | ) |
| | | | | | | |
Net Assets | | 100.00 | % | | $ | 636,941,147 | |
| | | | | | | |
See Notes to Financial Statements.
67
Excelsior Funds, Inc.
Portfolio of Investments — March 31, 2007
Pacific/Asia Fund
| | | | | |
| Shares | | | | Value |
| | | | | |
| COMMON STOCKS — 96.66% | | |
| | AUSTRALIA — 14.86% | | | |
| 318,500 | | Brambles Ltd.(a) | | $ | 3,503,036 |
| 98,600 | | Commonwealth Bank of Australia | | | 4,002,398 |
| 77,800 | | CSL Ltd. | | | 5,170,853 |
| 104,000 | | Incitec Pivot Ltd. | | | 4,154,534 |
| 60,775 | | Rio Tinto Ltd. | | | 3,867,037 |
| 146,000 | | St George Bank Ltd. | | | 4,127,644 |
| 215,100 | | Woolworths Ltd. | | | 4,722,402 |
| 166,100 | | Zinifex Ltd. | | | 2,113,496 |
| | | | | |
| | | | | 31,661,400 |
| | | | | |
| | CHINA — 10.36% | | | |
| 115,100 | | Aluminum Corp. of China Ltd. ADR | | | 2,991,449 |
| 452,900 | | Bank of East Asia Ltd. (Hong Kong) | | | 2,633,898 |
| 3,663,000 | | Chaoda Mordern Agriculture Holdings Ltd. (Hong Kong) | | | 2,569,847 |
| 70,800 | | China Mobile Ltd. ADR (Hong Kong) | | | 3,175,381 |
| 970,100 | | FU JI Food & Catering Services Ltd. (Hong Kong) | | | 3,048,999 |
| 11,595,000 | | NagaCorp Ltd. (Hong Kong)(a) | | | 2,765,336 |
| 179,000 | | Sun Hung Kai Properties Ltd. (Hong Kong) | | | 2,068,829 |
| 2,161,000 | | Synear Food Holdings Ltd.(a) | | | 2,836,788 |
| | | | | |
| | | | | 22,090,527 |
| | | | | |
| | INDIA — 1.79% | | | |
| 218,800 | | Bharti Tele-Ventures Ltd.(a) | | | 3,827,887 |
| | | | | |
| | INDONESIA — 3.70% | | | |
| 61,500 | | Freeport-McMoRan Copper & Gold, Inc. | | | 4,070,685 |
| 3,553,300 | | PT Telekomunikasi Indonesia Tbk | | | 3,825,563 |
| | | | | |
| | | | | 7,896,248 |
| | | | | |
| | JAPAN — 48.25% | | | |
| 81,100 | | Canon, Inc. | | | 4,355,343 |
| 186,800 | | Casio Computer Co. Ltd. | | | 4,072,404 |
| 210,145 | | Chiyoda Corp. | | | 4,590,817 |
| 229,800 | | Don Quijote Co. Ltd. | | | 4,481,616 |
| 49,400 | | FANUC Co. Ltd. | | | 4,577,962 |
| 81,200 | | Hoya Corp. | | | 2,683,105 |
| | | | | |
| Shares | | | | Value |
| | | | | |
| COMMON STOCKS — (continued) | | |
| | JAPAN — (continued) | | | |
| 19,800 | | Keyence Corp. | | $ | 4,455,656 |
| 181,600 | | KOMATSU Ltd. | | | 3,803,910 |
| 108,600 | | Kurita Water Industries Ltd. | | | 2,615,951 |
| 36,400 | | Kyocera Corp. | | | 3,420,307 |
| 112,000 | | Millea Holdings, Inc. | | | 4,127,918 |
| 418 | | Mitsubishi Tokyo Financial Group, Inc. | | | 4,710,287 |
| 173,000 | | Nikon Corp. | | | 3,631,575 |
| 16,000 | | Nintendo Co. Ltd. | | | 4,643,377 |
| 11,900 | | ORIX Corp. | | | 3,088,151 |
| 1,992,000 | | Sanyo Electric Co. Ltd.(a) | | | 3,391,236 |
| 84,000 | | Sumitomo Realty & Development Co. Ltd. | | | 3,173,235 |
| 458,200 | | Sumitomo Trust & Banking Co. Ltd. | | | 4,754,552 |
| 89,800 | | Takata Corp. | | | 3,567,001 |
| 64,800 | | Takeda Pharmaceutical Co. Ltd. | | | 4,243,768 |
| 671,000 | | The Bank of Fukuoka Ltd.(b) | | | 5,355,597 |
| 161,000 | | Tokuyama Corp. | | | 2,804,744 |
| 34,500 | | Tokyo Electron Ltd. | | | 2,403,428 |
| 325,000 | | Toshiba Corp. | | | 2,164,427 |
| 67,500 | | Toyota Motor Corp. | | | 4,323,496 |
| 169,900 | | Urban Corp. | | | 2,485,559 |
| 365,500 | | Yamaguchi Financial Group, Inc. | | | 4,905,267 |
| | | | | |
| | | | | 102,830,689 |
| | | | | |
| | MALAYSIA — 2.79% | | | |
| 384,700 | | iShares MSCI Malaysia Index Fund(c) | | | 4,170,148 |
| 3,305,000 | | Mulpha International Berhad(a) | | | 1,785,315 |
| | | | | |
| | | | | 5,955,463 |
| | | | | |
| | PHILIPPINES — 3.68% | | | |
| 116,110 | | Globe Telecom, Inc. | | | 2,955,982 |
| 9,886,900 | | SM Prime Holdings, Inc. | | | 2,352,565 |
| 7,078,300 | | Universal Robina Corp. | | | 2,526,732 |
| | | | | |
| | | | | 7,835,279 |
| | | | | |
| | SINGAPORE — 2.49% | | | |
| 210,000 | | DBS Group Holdings Ltd. | | | 2,956,663 |
| 4,968,000 | | Silverlake Axis Ltd. | | | 2,344,238 |
| | | | | |
| | | | | 5,300,901 |
| | | | | |
See Notes to Financial Statements.
68
Excelsior Funds, Inc.
Portfolio of Investments — March 31, 2007
Pacific/Asia Fund — (continued)
| | | | | |
| Shares | | | | Value |
| | | | | |
| COMMON STOCKS — (continued) | | |
| | SOUTH KOREA — 1.64% | | | |
| 167,700 | | Woori Investment & Securities Co. Ltd. | | $ | 3,504,866 |
| | | | | |
| | TAIWAN — 4.43% | | | |
| 756,994 | | Hon Hai Precision, Inc. | | | 5,059,111 |
| 406,747 | | Taiwan Semiconductor Manufacturing Co. Ltd. ADR | | | 4,372,530 |
| | | | | |
| | | | | 9,431,641 |
| | | | | |
| | THAILAND — 2.67% | | | |
| 8,420,900 | | Amata Corp. Public Co. Ltd. (Foreign Shares) | | | 2,644,761 |
| 1,576,700 | | Siam Commercial Public Co. Ltd. (Foreign Shares) | | | 3,043,387 |
| | | | | |
| | | | | 5,688,148 |
| | | | | |
| | TOTAL COMMON STOCKS
(Cost $179,844,730) | | | 206,023,049 |
| | | | | |
| | | | | | |
Principal
Amount | | | | Value |
| | | | | | |
| REPURCHASE AGREEMENT — 0.96% | | |
| $ | 2,042,000 | | JP Morgan Chase Securities, Inc., 5.06%, dated 03/30/07, to be repurchased 04/02/07, repurchase price $2,042,861
(collateralized by U.S. Government Obligations, ranging in par value $60,000-$2,000,000, 4.88%-5.15%, 08/16/10-08/03/12; total market value $2,054,406) | | $ | 2,042,000 |
| | | | | | |
| | | TOTAL REPURCHASE AGREEMENT
(Cost $2,042,000) | | | 2,042,000 |
| | | | | | |
| | | | | | |
TOTAL INVESTMENTS
(Cost $181,886,730) | | 97.62 | % | | $ | 208,065,049 |
OTHER ASSETS IN EXCESS OF LIABILITIES | | 2.38 | | | | 5,067,394 |
| | | | | | |
NET ASSETS | | 100.00 | % | | $ | 213,132,443 |
| | | | | | |
| (a) | Non-income producing security |
| (b) | Fair valued as of March 31, 2007 |
ADR—American Depositary Receipt
Ltd.—Limited
At March 31, 2007, the prices of certain foreign securities held by the fund aggregating $177,987,708 were adjusted from their closing market prices following the guidelines adopted by the fund’s board of trustees.
See Notes to Financial Statements.
69
Excelsior Funds, Inc.
Portfolio of Investments — March 31, 2007
Pacific/Asia Fund — (continued)
The summary of the Fund’s investments as of March 31, 2007 is as follows: (Unaudited)
| | | | | | |
Sector Diversification | | % of
Net
Assets | | | Value |
Financial | | 23.12 | % | | $ | 49,279,458 |
Consumer Discretionary | | 19.85 | | | | 42,312,526 |
Information Technology | | 11.56 | | | | 24,638,062 |
Industrials | | 11.01 | | | | 23,467,771 |
Materials | | 8.13 | | | | 17,319,433 |
Real Estate | | 6.80 | | | | 14,497,782 |
Telecommunication | | 4.76 | | | | 10,161,718 |
Health Care | | 4.42 | | | | 9,414,622 |
Consumer Staples | | 3.82 | | | | 8,145,578 |
Exchange Trade Funds | | 1.96 | | | | 4,170,148 |
Utility | | 1.23 | | | | 2,615,951 |
Repurchase Agreement | | 0.96 | | | | 2,042,000 |
| | | | | | |
Total Investment | | 97.62 | % | | $ | 208,065,049 |
Other Assets in Excess of Liabilities | | 2.38 | | | | 5,067,394 |
| | | | | | |
Net Assets | | 100.00 | % | | $ | 213,132,443 |
| | | | | | |
See Notes to Financial Statements.
70
[THIS PAGE INTENTIONALLY LEFT BLANK]
Excelsior Funds
Statements of Assets and Liabilities
March 31, 2007
| | | | | | |
| | |
| | |
Blended
Equity
Fund | | Energy and
Natural Resources
Fund |
ASSETS: | | | | | | |
Investments, at cost — see accompanying portfolios | | $ | 217,420,600 | | $ | 452,893,524 |
| | | | | | |
Investments, at value (including Repurchase Agreements) (Note 1) | | $ | 400,899,207 | | $ | 504,713,960 |
Cash | | | 10,156 | | | — |
Foreign currency (cost $1,300, $0, $0, $3,023, $0 and $0 respectively) | | | 1,934 | | | — |
Dividends and interest receivable | | | 737,260 | | | 205,083 |
Receivable for investments sold | | | — | | | 3,352,012 |
Receivable for fund shares sold | | | 6,489 | | | 1,044,275 |
Reclaims receivable | | | — | | | — |
Prepaid expenses | | | 6,321 | | | 6,863 |
| | | | | | |
Total Assets | | | 401,661,367 | | | 509,322,193 |
LIABILITIES: | | | | | | |
Payable for investments purchased | | | — | | | 10,678,767 |
Cash overdraft | | | — | | | 110,504 |
Payable for fund shares redeemed | | | 138,135 | | | 409,000 |
Payable for forward foreign currency contracts | | | — | | | — |
Investment advisory fees payable (Note 2) | | | 212,143 | | | 243,489 |
Administration fees payable (Note 2) | | | 51,926 | | | 62,329 |
Distribution and shareholder servicing fees payable (Note 2) | | | 120,401 | | | 13,014 |
Accrued expenses and other payables | | | 115,957 | | | 129,209 |
| | | | | | |
Total Liabilities | | | 638,562 | | | 11,646,312 |
| | | | | | |
NET ASSETS | | $ | 401,022,805 | | $ | 497,675,881 |
| | | | | | |
NET ASSETS consist of: | | | | | | |
Undistributed (distributions in excess of) net investment income | | $ | 718,038 | | $ | 137,666 |
Accumulated net realized gain (loss) on investments, foreign currency transactions and written options | | | 30,332,663 | | | 29,101,941 |
Unrealized appreciation of investments, foreign currency translations and written options | | | 183,479,242 | | | 51,820,436 |
Par value (Note 5) | | | 11,340 | | | 21,361 |
Paid in capital in excess of par value | | | 186,481,522 | | | 416,594,477 |
| | | | | | |
Net Assets | | $ | 401,022,805 | | $ | 497,675,881 |
| | | | | | |
Net Assets: | | | | | | |
Shares | | $ | 401,022,805 | | $ | 497,675,881 |
Institutional Shares | | | — | | | — |
Retirement Shares | | | — | | | — |
Shares outstanding (Note 5): | | | | | | |
Shares | | | 11,340,302 | | | 21,361,475 |
Institutional Shares | | | — | | | — |
Retirement Shares | | | — | | | — |
NET ASSET VALUE PER SHARE (net assets ÷ shares outstanding): | | | | | | |
Shares | | | $35.36 | | | $23.30 |
| | | | | | |
Institutional Shares | | | — | | | — |
| | | | | | |
Retirement Shares | | | — | | | — |
| | | | | | |
| (a) | | Due to rounding net assets divided by shares outstanding does not equal the net asset value per share. |
See Notes to Financial Statements.
72
| | | | | | | | | | | | | |
| | | |
Equity
Income
Fund | | | Equity
Opportunities
Fund | | | Large Cap
Growth
Fund | | | Mid Cap Value
and
Restructuring
Fund |
| | | | | | | | | | | | | |
| $ | 194,726,864 | | | $ | 282,589,609 | | | $ | 610,313,025 | | | $ | 211,894,664 |
| | | | | | | | | | | | | | |
| $ | 236,102,155 | | | $ | 338,234,539 | | | $ | 734,267,118 | | | $ | 326,916,863 |
| | 315 | | | | 38,115 | | | | 219 | | | | 810 |
| | — | | | | 3,247 | | | | — | | | | — |
| | 632,927 | | | | 528,278 | | | | 1,928 | | | | 209,475 |
| | — | | | | 21,193 | | | | — | | | | — |
| | 625,896 | | | | 736,458 | | | | 1,146,238 | | | | 2,101,242 |
| | — | | | | 48,271 | | | | — | | | | — |
| | 3,106 | | | | 3,712 | | | | 23,315 | | | | 3,946 |
| | | | | | | | | | | | | | |
| | 237,364,399 | | | | 339,613,813 | | | | 735,438,818 | | | | 329,232,336 |
| | | | | | | | | | | | | |
| | — | | | | 1,225,148 | | | | — | | | | — |
| | — | | | | — | | | | — | | | | — |
| | 87,922 | | | | 70,900 | | | | 220,101 | | | | 1,737,971 |
| | — | | | | 87 | | | | — | | | | — |
| | 122,556 | | | | 149,107 | | | | 455,534 | | | | 175,356 |
| | 30,684 | | | | 42,365 | | | | 94,995 | | | | 41,710 |
| | 59,303 | | | | 69,896 | | | | 155,789 | | | | 61,976 |
| | 60,216 | | | | 76,560 | | | | 76,276 | | | | 98,554 |
| | | | | | | | | | | | | | |
| | 360,681 | | | | 1,634,063 | | | | 1,002,695 | | | | 2,115,567 |
| | | | | | | | | | | | | | |
| $ | 237,003,718 | | | $ | 337,979,750 | | | $ | 734,436,123 | | | $ | 327,116,769 |
| | | | | | | | | | | | | | |
| | | | | | | | | | | | | |
| $ | 1,016,788 | | | $ | 575,259 | | | $ | — | | | $ | 3,066,218 |
|
431,735 |
| | | (4,072,107 | ) | | | (124,103,097 | ) | | | 6,611,985 |
|
41,375,425 |
| | | 55,645,420 | | | | 123,954,093 | | | | 115,022,199 |
| | 249 | | | | 239 | | | | 69,260 | | | | 151 |
| | 194,179,521 | | | | 285,830,939 | | | | 734,515,867 | | | | 202,416,216 |
| | | | | | | | | | | | | | |
| $ | 237,003,718 | | | $ | 337,979,750 | | | $ | 734,436,123 | | | $ | 327,116,769 |
| | | | | | | | | | | | | | |
| | | | | | | | | | | | | |
| $ | 237,002,569 | | | $ | 277,877,240 | | | $ | 718,424,273 | | | $ | 294,451,533 |
| | — | | | | 60,102,510 | | | | 16,008,781 | | | | 31,567,913 |
| | 1,149 | | | | — | | | | 3,069 | | | | 1,097,323 |
| | | | | | | | | | | | | |
| | 24,928,172 | | | | 19,613,009 | | | | 67,751,307 | | | | 13,624,483 |
| | — | | | | 4,237,238 | | | | 1,508,238 | | | | 1,454,320 |
| | 120 | | | | — | | | | 294 | | | | 51,093 |
| | | | | | | | | | | | | |
| | $9.51 | | | | $14.17 | | | | $10.60 | | | | $21.61 |
| | | | | | | | | | | | | | |
| | — | | | | $14.18 | | | | $10.61 | | | | $21.71 |
| | | | | | | | | | | | | | |
| | $9.54 | (a) | | | — | | | | $10.45 | (a) | | | $21.48 |
| | | | | | | | | | | | | | |
See Notes to Financial Statements.
73
Excelsior Funds
Statements of Assets and Liabilities
March 31, 2007
| | | | | | |
| | |
| | | Real
Estate
Fund | | Small
Cap
Fund |
ASSETS: | | | | | | |
Investments, at cost — see accompanying portfolios | | $ | 99,591,064 | | $ | 489,955,610 |
| | | | | | |
Investments, at value (including Repurchase Agreements) (Note 1) | | $ | 152,151,687 | | $ | 698,849,200 |
Cash | | | 101,783 | | | 138 |
Foreign currency (cost $0, $0, $531, $644,844, $434,610 and $66,038 respectively) | | | — | | | — |
Dividends and interest receivable | | | 274,431 | | | 44,438 |
Receivable for investments sold | | | 67,455 | | | 635,754 |
Receivable for fund shares sold | | | 488,606 | | | 1,073,553 |
Receivable for forward foreign currency contracts | | | — | | | — |
Reclaims receivable | | | — | | | — |
Prepaid expenses | | | 2,114 | | | 9,077 |
| | | | | | |
Total Assets | | | 153,086,076 | | | 700,612,160 |
LIABILITIES: | | | | | | |
Payable for investments purchased | | | — | | | 2,700,153 |
Options written, at value (Premium received: Value and Restructuring Fund — $6,678,258) | | | — | | | — |
Payable for capital gains tax | | | — | | | — |
Payable for fund shares redeemed | | | 867,595 | | | 541,128 |
Payable for forward foreign currency contracts | | | — | | | — |
Investment advisory fees payable (Note 2) | | | 90,035 | | | 430,849 |
Administration fees payable (Note 2) | | | 20,444 | | | 87,859 |
Distribution and shareholder servicing fees payable (Note 2) | | | 28,963 | | | 140,440 |
Directors’/Trustees’ fees and expenses payable (Note 2) | | | — | | | — |
Accrued expenses and other payables | | | 53,063 | | | 119,424 |
| | | | | | |
Total Liabilities | | | 1,060,100 | | | 4,019,853 |
| | | | | | |
NET ASSETS | | $ | 152,025,976 | | $ | 696,592,307 |
| | | | | | |
NET ASSETS consist of: | | | | | | |
Undistributed (distributions in excess of) net investment income | | $ | 529,195 | | $ | — |
Accumulated net realized gain (loss) on investments, foreign currency transactions and written options | | | 5,592,127 | | | 7,530,919 |
Unrealized appreciation of investments, foreign currency translations and written options | | | 52,560,623 | | | 208,893,590 |
Par value (Note 5) | | | 13,191 | | | 36,269 |
Paid in capital in excess of par value | | | 93,330,840 | | | 480,131,529 |
| | | | | | |
Net Assets | | $ | 152,025,976 | | $ | 696,592,307 |
| | | | | | |
Net Assets: | | | | | | |
Shares | | $ | 152,025,976 | | $ | 694,765,080 |
Institutional Shares | | | — | | | — |
Retirement Shares | | | — | | | 1,827,227 |
Shares outstanding (Note 5): | | | | | | |
Shares | | | 13,191,240 | | | 36,172,462 |
Institutional Shares | | | — | | | — |
Retirement Shares | | | — | | | 96,286 |
NET ASSET VALUE PER SHARE (net assets ÷ shares outstanding): | | | | | | |
Shares | | | $11.52 | | | $19.21 |
| | | | | | |
Institutional Shares | | | — | | | — |
| | | | | | |
Retirement Shares | | | — | | | $18.98 |
| | | | | | |
See Notes to Financial Statements.
74
| | | | | | | | | | | | |
| | | |
Value and
Restructuring
Fund | | | Emerging
Markets
Fund | | International
Fund | | | Pacific/Asia
Fund |
| | | | | | | | | | | | |
| $ | 5,382,230,435 | | | $ | 733,105,953 | | $ | 484,024,539 | | | $ | 181,886,730 |
| | | | | | | | | | | | | |
| $ | 8,134,884,592 | | | $ | 1,133,114,056 | | $ | 640,988,063 | | | $ | 208,065,049 |
| | 14,546 | | | | 635 | | | 578 | | | | 191,759 |
| | 589 | | | | 645,073 | | | 436,648 | | | | 66,289 |
| | 11,412,758 | | | | 3,221,408 | | | 2,245,628 | | | | 882,129 |
| | 13,711,725 | | | | — | | | — | | | | 4,445,273 |
| | 20,321,987 | | | | 919,142 | | | 662,473 | | | | 99,234 |
| | — | | | | — | | | 5,805 | | | | 8,425 |
| | — | | | | 3,212 | | | 205,382 | | | | — |
| | 120,997 | | | | 14,496 | | | 7,618 | | | | 3,094 |
| | | | | | | | | | | | | |
| | 8,180,467,194 | | | | 1,137,918,022 | | | 644,552,195 | | | | 213,761,252 |
| | | | | | | | | | | | |
| | 16,781,959 | | | | — | | | 6,504,494 | | | | — |
| | 3,835,000 | | | | — | | | — | | | | — |
| | — | | | | — | | | — | | | | 204,793 |
| | 10,778,197 | | | | 1,627,177 | | | 242,050 | | | | 59,220 |
| | 6,774 | | | | — | | | 5,258 | | | | — |
| | 4,057,059 | | | | 1,117,311 | | | 487,323 | | | | 180,471 |
| | 1,036,177 | | | | 190,498 | | | 105,736 | | | | 36,421 |
| | 1,777,666 | | | | 230,887 | | | 117,531 | | | | 44,764 |
| | 6,591 | | | | — | | | — | | | | — |
| | 1,030,955 | | | | 338,670 | | | 148,656 | | | | 103,140 |
| | | | | | | | | | | | | |
| | 39,310,378 | | | | 3,504,543 | | | 7,611,048 | | | | 628,809 |
| | | | | | | | | | | | | |
| $ | 8,141,156,816 | | | $ | 1,134,413,479 | | $ | 636,941,147 | | | $ | 213,132,443 |
| | | | | | | | | | | | | |
| | | | | | | | | | | | |
| $ | 16,648,966 | | | $ | 163,806 | | $ | 300,494 | | | $ | — |
| | (49,675,559 | ) | | | 2,849,442 | | | (57,946,554 | ) | | | 18,842,919 |
| | 2,755,490,696 | | | | 400,039,421 | | | 156,985,320 | | | | 25,982,758 |
| | 149,837 | | | | 80,656 | | | 33,412 | | | | 18,186 |
| | 5,418,542,876 | | | | 731,280,154 | | | 537,568,475 | | | | 168,288,580 |
| | | | | | | | | | | | | |
| $ | 8,141,156,816 | | | $ | 1,134,413,479 | | $ | 636,941,147 | | | $ | 213,132,443 |
| | | | | | | | | | | | | |
| | | | | | | | | | | | |
| $ | 7,767,712,682 | | | $ | 1,092,481,335 | | $ | 636,941,147 | | | $ | 213,132,443 |
| | 370,518,321 | | | | 41,932,144 | | | — | | | | — |
| | 2,925,813 | | | | — | | | — | | | | — |
| | | | | | | | | | | | |
| | 142,964,239 | | | | 77,681,696 | | | 33,412,413 | | | | 18,186,156 |
| | 6,818,985 | | | | 2,974,447 | | | — | | | | — |
| | 53,880 | | | | — | | | — | | | | — |
| | | | | | | | | | | | |
| | $54.33 | | | | $14.06 | | | $19.06 | | | | $11.72 |
| | | | | | | | | | | | | |
| | $54.34 | | | | $14.10 | | | — | | | | — |
| | | | | | | | | | | | | |
| | $54.30 | | | | — | | | — | | | | — |
| | | | | | | | | | | | | |
See Notes to Financial Statements.
75
Excelsior Funds
Statements of Operations
For the Year Ended March 31, 2007
| | | | | | | | |
| | |
| | |
Blended
Equity
Fund | | | Energy and
Natural Resources
Fund | |
INVESTMENT INCOME: | | | | | | | | |
Dividend income | | $ | 7,639,461 | | | $ | 5,301,902 | |
Interest income | | | 95,269 | | | | 1,710,506 | |
Less: Foreign taxes withheld | | | (86,744 | ) | | | (35,654 | ) |
| | | | | | | | |
Total Income | | | 7,647,986 | | | | 6,976,754 | |
EXPENSES: | | | | | | | | |
Investment advisory fees (Note 2) | | | 3,250,401 | | | | 3,057,358 | |
Shareholder servicing fees — Shares (Note 2) | | | 1,040,124 | | | | 1,222,932 | |
Distribution and shareholder servicing fees — Retirement Shares (Note 2) | | | — | | | | — | |
Administration fees (Note 2) | | | 654,041 | | | | 768,995 | |
Transfer agent fees | | | 134,108 | | | | 435,830 | |
Legal and audit fees | | | 28,470 | | | | 45,014 | |
Custodian fees | | | 26,079 | | | | 61,518 | |
Directors’/Trustees’ fees and expenses (Note 2) | | | 17,649 | | | | 18,750 | |
Miscellaneous expenses | | | 98,750 | | | | 137,556 | |
| | | | | | | | |
Total Expenses | | | 5,249,622 | | | | 5,747,953 | |
Fees waived and reimbursed by: | | | | | | | | |
Investment Adviser (Note 2) | | | (482,548 | ) | | | — | |
Administrator (Note 2) | | | (3,461 | ) | | | (4,244 | ) |
Custody earning credits | | | (4,407 | ) | | | (22,995 | ) |
| | | | | | | | |
Net Expenses | | | 4,759,206 | | | | 5,720,714 | |
| | | | | | | | |
NET INVESTMENT INCOME (LOSS) | | | 2,888,780 | | | | 1,256,040 | |
| | | | | | | | |
REALIZED AND UNREALIZED GAIN (LOSS) ON INVESTMENTS (Note 1): | | | | | | | | |
Net realized gain (loss) on: | | | | | | | | |
Security transactions | | | 50,142,210 | | | | 49,290,030 | |
Net realized gains from redemptions in-kind | | | — | | | | — | |
Foreign currency transactions | | | (440 | ) | | | — | |
Written options | | | — | | | | — | |
| | | | | | | | |
Total net realized gain (loss) | | | 50,141,770 | | | | 49,290,030 | |
Change in unrealized appreciation (depreciation) of investments, foreign currency translations and written options during the year | | | (8,774,573 | ) | | | (6,347,488 | ) |
| | | | | | | | |
Net realized and unrealized gain (loss) on investments, foreign currency transactions and written options | | | 41,367,197 | | | | 42,942,542 | |
| | | | | | | | |
Net increase in net assets resulting from operations | | $ | 44,255,977 | | | $ | 44,198,582 | |
| | | | | | | | |
See Notes to Financial Statements.
76
| | | | | | | | | | | | | | |
| | | |
Equity
Income
Fund | | | Equity
Opportunities
Fund | | | Large Cap
Growth
Fund | | | Mid Cap Value
and
Restructuring
Fund | |
| | | | | | | | | | | | | | |
| $ | 6,252,714 | | | $ | 3,437,790 | | | $ | 2,458,581 | | | $ | 6,244,366 | |
| | 52,535 | | | | 544,924 | | | | 841,708 | | | | 139,982 | |
| | (36,689 | ) | | | (67,722 | ) | | | (76,949 | ) | | | (50,757 | ) |
| | | | | | | | | | | | | | | |
| | 6,268,560 | | | | 3,914,992 | | | | 3,223,340 | | | | 6,333,591 | |
| | | | | | | | | | | | | | |
| | 1,622,085 | | | | 1,842,685 | | | | 4,689,122 | | | | 1,889,491 | |
| | 540,692 | | | | 471,667 | | | | 1,550,709 | | | | 618,540 | |
| | 9 | | | | — | | | | 12 | | | | 720 | |
| | 326,390 | | | | 370,773 | | | | 943,523 | | | | 438,688 | |
| | 21,161 | | | | 32,575 | | | | 99,116 | | | | 92,953 | |
| | 31,262 | | | | 42,908 | | | | 77,595 | | | | 33,086 | |
| | 23,306 | | | | 37,137 | | | | 35,120 | | | | 19,910 | |
| | 11,440 | | | | 11,673 | | | | 21,322 | | | | 13,487 | |
| | 42,818 | | | | 103,047 | | | | 103,152 | | | | 83,107 | |
| | | | | | | | | | | | | | | |
| | 2,619,163 | | | | 2,912,465 | | | | 7,519,671 | | | | 3,189,982 | |
| | | | | | | | | | | | | | |
| | (240,094 | ) | | | (475,587 | ) | | | (30,328 | ) | | | (3,989 | ) |
| | (8,005 | ) | | | (11,224 | ) | | | (6,217 | ) | | | (10,966 | ) |
| | (584 | ) | | | (4,184 | ) | | | (3,856 | ) | | | (1,830 | ) |
| | | | | | | | | | | | | | | |
| | 2,370,480 | | | | 2,421,470 | | | | 7,479,270 | | | | 3,173,197 | |
| | | | | | | | | | | | | | | |
| | 3,898,080 | | | | 1,493,522 | | | | (4,255,930 | ) | | | 3,160,394 | |
| | | | | | | | | | | | | | | |
| | | | | | | | | | | | | | |
| | | | | | | | | | | | | | |
| | 6,646,316 | | | | (1,521,686 | ) | | | 11,805,044 | | | | 8,600,856 | |
| | — | | | | — | | | | — | | | | 23,046,664 | |
| | 5,938 | | | | (3,821 | ) | | | — | | | | 1,444 | |
| | 70,586 | | | | — | | | | — | | | | — | |
| | | | | | | | | | | | | | | |
| | 6,722,840 | | | | (1,525,507 | ) | | | 11,805,044 | | | | 31,648,964 | |
|
16,574,010 |
| | | 31,286,902 | | | | 37,708,433 | | | | (10,315,446 | ) |
| | | | | | | | | | | | | | | |
|
23,296,850 |
| | | 29,761,395 | | | | 49,513,477 | | | | 21,333,518 | |
| | | | | | | | | | | | | | | |
| $ | 27,194,930 | | | $ | 31,254,917 | | | $ | 45,257,547 | | | $ | 24,493,912 | |
| | | | | | | | | | | | | | | |
See Notes to Financial Statements.
77
Excelsior Funds
Statements of Operations
For the Year Ended March 31, 2007
| | | | | | | | |
| | |
| | | Real
Estate
Fund | | | Small
Cap
Fund | |
INVESTMENT INCOME: | | | | | | | | |
Dividend income | | $ | 2,488,383 | | | $ | 3,234,961 | |
Interest income | | | 156,634 | | | | 184,934 | |
Less: Foreign taxes withheld | | | (251 | ) | | | — | |
| | | | | | | | |
Total Income | | | 2,644,766 | | | | 3,419,895 | |
EXPENSES: | | | | | | | | |
Investment advisory fees (Note 2) | | | 1,350,037 | | | | 4,604,755 | |
Shareholder servicing fees — Shares (Note 2) | | | 337,508 | | | | 1,534,149 | |
Shareholder servicing fees — Institutional Shares (Note 2) | | | — | | | | — | |
Distribution and shareholder servicing fees — Retirement Shares (Note 2) | | | — | | | | 2,276 | |
Administration fees (Note 2) | | | 203,735 | | | | 926,552 | |
Transfer agent fees | | | 68,269 | | | | 188,887 | |
Legal and audit fees | | | 26,857 | | | | 37,683 | |
Custodian fees | | | 11,272 | | | | 46,257 | |
Directors’/Trustees’ fees and expenses (Note 2) | | | 9,402 | | | | 21,848 | |
Miscellaneous expenses | | | 56,931 | | | | 114,086 | |
| | | | | | | | |
Total Expenses | | | 2,064,011 | | | | 7,476,493 | |
Fees waived and reimbursed by: | | | | | | | | |
Investment Adviser (Note 2) | | | (376,465 | ) | | | — | |
Administrator (Note 2) | | | (1,304 | ) | | | (5,981 | ) |
Custody earning credits | | | (1,524 | ) | | | (6,785 | ) |
| | | | | | | | |
Net Expenses | | | 1,684,718 | | | | 7,463,727 | |
| | | | | | | | |
NET INVESTMENT INCOME (LOSS) | | | 960,048 | | | | (4,043,832 | ) |
| | | | | | | | |
REALIZED AND UNREALIZED GAIN (LOSS) ON INVESTMENTS (Note 1): | | | | | | | | |
Net realized gain (loss) on: | | | | | | | | |
Security transactions | | | 18,405,693 | | | | 32,537,688 | |
Foreign currency transactions | | | — | | | | — | |
Written options | | | — | | | | — | |
| | | | | | | | |
Total net realized gain (loss) | | | 18,405,693 | | | | 32,537,688 | |
Change in unrealized appreciation (depreciation) of investments, foreign currency translations and written options during the year | | | 2,835,641 | | | | 18,105,369 | |
| | | | | | | | |
Net realized and unrealized gain (loss) on investments, foreign currency transactions and written options | | | 21,241,334 | | | | 50,643,057 | |
| | | | | | | | |
Net increase in net assets resulting from operations | | $ | 22,201,382 | | | $ | 46,599,225 | |
| | | | | | | | |
See Notes to Financial Statements.
78
| | | | | | | | | | | | | | |
| | | |
Value and
Restructuring
Fund | | | Emerging
Markets
Fund | | | International
Fund | | | Pacific/Asia
Fund | |
| | | | | | | | | | | | | | |
| $ | 139,630,565 | | | $ | 24,558,726 | | | $ | 11,647,422 | | | $ | 3,751,080 | |
| | 3,266,334 | | | | 1,899,340 | | | | 683,501 | | | | 105,743 | |
| | (892,911 | ) | | | (2,389,117 | ) | | | (1,154,691 | ) | | | (345,597 | ) |
| | | | | | | | | | | | | | | |
| | 142,003,988 | | | | 24,068,949 | | | | 11,176,232 | | | | 3,511,226 | |
| | | | | | | | | | | | | | |
| | 43,686,889 | | | | 12,810,571 | | | | 5,613,015 | | | | 2,243,913 | |
| | 16,702,594 | | | | 2,482,494 | | | | 1,403,249 | | | | 560,976 | |
| | 96,083 | | | | — | | | | — | | | | — | |
| | 10,250 | | | | — | | | | — | | | | — | |
| | 10,988,075 | | | | 2,049,708 | | | | 1,122,611 | | | | 448,786 | |
| | 2,073,728 | | | | 323,774 | | | | 127,871 | | | | 52,781 | |
| | 334,628 | | | | 86,464 | | | | 54,495 | | | | 30,525 | |
| | 471,097 | | | | 1,399,093 | | | | 290,036 | | | | 178,814 | |
| | 190,517 | | | | 31,782 | | | | 19,701 | | | | 11,588 | |
| | 1,139,363 | | | | 261,313 | | | | 151,876 | | | | 83,381 | |
| | | | | | | | | | | | | | | |
| | 75,693,224 | | | | 19,445,199 | | | | 8,782,854 | | | | 3,610,764 | |
| | | | | | | | | | | | | | |
| | — | | | | (565,179 | ) | | | (363,344 | ) | | | — | |
| | (69,676 | ) | | | (9,754 | ) | | | (5,446 | ) | | | (1,839 | ) |
| | (54,238 | ) | | | (15,564 | ) | | | (5,189 | ) | | | (2,537 | ) |
| | | | | | | | | | | | | | | |
| | 75,569,310 | | | | 18,854,702 | | | | 8,408,875 | | | | 3,606,388 | |
| | | | | | | | | | | | | | | |
| | 66,434,678 | | | | 5,214,247 | | | | 2,767,357 | | | | (95,162 | ) |
| | | | | | | | | | | | | | | |
| | | | | | | | | | | | | | |
| | | | | | | | | | | | | | |
| | 95,436,544 | | | | 48,908,433 | | | | 25,086,509 | | | | 29,897,013 | |
| | (12,160 | ) | | | (39,140 | ) | | | (6,358 | ) | | | (214,502 | ) |
| | 1,331,652 | | | | — | | | | — | | | | — | |
| | | | | | | | | | | | | | | |
| | 96,756,036 | | | | 48,869,293 | | | | 25,080,151 | | | | 29,682,511 | |
|
645,371,791 |
| | | 100,008,846 | | | | 54,216,954 | | | | (22,701,298 | ) |
| | | | | | | | | | | | | | | |
|
742,127,827 |
| | | 148,878,139 | | | | 79,297,105 | | | | 6,981,213 | |
| | | | | | | | | | | | | | | |
| $ | 808,562,505 | | | $ | 154,092,386 | | | $ | 82,064,462 | | | $ | 6,886,051 | |
| | | | | | | | | | | | | | | |
See Notes to Financial Statements.
79
Excelsior Funds
Statements of Changes in Net Assets
| | | | | | | | | | | | | | | | |
| | |
| | | Blended Equity Fund | | | Energy and Natural
Resources Fund | |
| | | Year Ended March 31, | | | Year Ended March 31, | |
| | | 2007 | | | 2006 | | | 2007 | | | 2006 | |
Net investment income (loss) | | $ | 2,888,780 | | | $ | 2,467,089 | | | $ | 1,256,040 | | | $ | (21,733 | ) |
Net realized gain (loss) on investments and foreign currency transactions | | | 50,141,770 | | | | 49,674,409 | | | | 49,290,030 | | | | 137,515,027 | |
Net realized gains from redemptions in-kind | | | — | | | | — | | | | — | | | | — | |
Net realized gain (loss) on written options | | | — | | | | — | | | | — | | | | — | |
Change in unrealized appreciation (depreciation) of investments, foreign currency translations and written options during the year | | | (8,774,573 | ) | | | (3,482,518 | ) | | | (6,347,488 | ) | | | (1,094,592 | ) |
| | | | | | | | | | | | | | | | |
Net increase in net assets resulting from operations | | | 44,255,977 | | | | 48,658,980 | | | | 44,198,582 | | | | 136,398,702 | |
| | | | | | | | | | | | | | | | |
Distributions to shareholders: | | | | | | | | | | | | | | | | |
From net investment income | | | | | | | | | | | | | | | | |
Shares | | | (2,741,626 | ) | | | (2,711,511 | ) | | | (1,125,652 | ) | | | — | |
Institutional Shares | | | — | | | | — | | | | — | | | | — | |
Retirement Shares | | | — | | | | — | | | | — | | | | — | |
From net realized gain on investments | | | | | | | | | | | | | | | | |
Shares | | | (62,158,929 | ) | | | (31,936,512 | ) | | | (96,892,494 | ) | | | (86,145,231 | ) |
Institutional shares | | | — | | | | — | | | | — | | | | — | |
Retirement Shares | | | — | | | | — | | | | — | | | | — | |
| | | | | | | | | | | | | | | | |
Total distributions | | | (64,900,555 | ) | | | (34,648,023 | ) | | | (98,018,146 | ) | | | (86,145,231 | ) |
| | | | | | | | | | | | | | | | |
Increase (decrease) in net assets from fund share transactions (Note 5) | | | (38,641,827 | ) | | | (20,604,889 | ) | | | 28,989,505 | | | | 179,919,764 | |
| | | | | | | | | | | | | | | | |
Net increase (decrease) in net assets | | | (59,286,405 | ) | | | (6,593,932 | ) | | | (24,830,059 | ) | | | 230,173,235 | |
| | | | | | | | | | | | | | | | |
NET ASSETS: | | | | | | | | | | | | | | | | |
Beginning of year | | | 460,309,210 | | | | 466,903,142 | | | | 522,505,940 | | | | 292,332,705 | |
| | | | | | | | | | | | | | | | |
End of year(1) | | $ | 401,022,805 | | | $ | 460,309,210 | | | $ | 497,675,881 | | | $ | 522,505,940 | |
| | | | | | | | | | | | | | | | |
(1) Including undistributed (distributions in excess of) net investment income | | $ | 718,038 | | | $ | 510,112 | | | $ | 137,666 | | | $ | — | |
| | | | | | | | | | | | | | | | |
See Notes to Financial Statements.
80
| | | | | | | | | | | | | | | | | | | | | | | | | | | | | | |
| | | |
| Equity Income Fund | | | Equity Opportunities Fund | | | Large Cap Growth Fund | | | Mid Cap Value
and Restructuring Fund | |
| Year Ended March 31, | | | Year Ended March 31, | | | Year Ended March 31, | | | Year Ended March 31, | |
| 2007 | | | 2006 | | | 2007 | | | 2006 | | | 2007 | | | 2006 | | | 2007 | | | 2006 | |
| $ | 3,898,080 | | | $ | 5,148,119 | | | $ | 1,493,522 | | | $ | 838,846 | | | $ | (4,255,930 | ) | | $ | (1,492,015 | ) | | $ | 3,160,394 | | | $ | 286,682 | |
|
6,652,254 |
| | | (5,658,097 | ) | | | (1,525,507 | ) | | | (2,557,056 | ) | | | 11,805,044 | | | | 3,004,935 | | | | 8,602,300 | | | | (1,834,247 | ) |
| | — | | | | — | | | | — | | | | — | | | | — | | | | — | | | | 23,046,664 | | | | — | |
| | 70,586 | | | | (17,851 | ) | | | — | | | | — | | | | — | | | | — | | | | — | | | | — | |
|
16,574,010 |
| | | 10,334,632 | | | | 31,286,902 | | | | 23,862,728 | | | | 37,708,433 | | | | 59,460,912 | | | | (10,315,446 | ) | | | 51,686,678 | |
| | | | | | | | | | | | | | | | | | | | | | | | | | | | | | | |
| | 27,194,930 | | | | 9,806,803 | | | | 31,254,917 | | | | 22,144,518 | | | | 45,257,547 | | | | 60,973,832 | | | | 24,493,912 | | | | 50,139,113 | |
| | | | | | | | | | | | | | | | | | | | | | | | | | | | | | | |
| | | | | | | | | | | | | | | | | | | | | | | | | | | | | | |
| | | | | | | | | | | | | | | | | | | | | | | | | | | | | | |
| | (4,109,886 | ) | | | (4,741,203 | ) | | | (851,918 | ) | | | (261,632 | ) | | | — | | | | — | | | | (69,200 | ) | | | (377,856 | ) |
| | — | | | | — | | | | (425,370 | ) | | | (312,869 | ) | | | — | | | | — | | | | (28,083 | ) | | | (320,565 | ) |
| | (15 | ) | | | (18 | ) | | | — | | | | — | | | | — | | | | — | | | | — | | | | — | |
| | | | | | | | | | | | | | | | | | | | | | | | | | | | | | |
| | — | | | | (591,743 | ) | | | — | | | | — | | | | — | | | | — | | | | (6,735 | ) | | | — | |
| | — | | | | — | | | | — | | | | — | | | | — | | | | — | | | | (812 | ) | | | — | |
| | — | | | | (3 | ) | | | — | | | | — | | | | — | | | | — | | | | — | | | | — | |
| | | | | | | | | | | | | | | | | | | | | | | | | | | | | | | |
| | (4,109,901 | ) | | | (5,332,967 | ) | | | (1,277,288 | ) | | | (574,501 | ) | | | — | | | | — | | | | (104,830 | ) | | | (698,421 | ) |
| | | | | | | | | | | | | | | | | | | | | | | | | | | | | | | |
|
8,064,710 |
| | | 5,710,595 | | | | 121,147,723 | | | | 67,878,748 | | | | 136,983,006 | | | | 281,160,848 | | | | (36,769,439 | ) | | | (6,359,254 | ) |
| | | | | | | | | | | | | | | | | | | | | | | | | | | | | | | |
| | 31,149,739 | | | | 10,184,431 | | | | 151,125,352 | | | | 89,448,765 | | | | 182,240,553 | | | | 342,134,680 | | | | (12,380,357 | ) | | | 43,081,438 | |
| | | | | | | | | | | | | | | | | | | | | | | | | | | | | | | |
| | | | | | | | | | | | | | | | | | | | | | | | | | | | | | |
| | 205,853,979 | | | | 195,669,548 | | | | 186,854,398 | | | | 97,405,633 | | | | 552,195,570 | | | | 210,060,890 | | | | 339,497,126 | | | | 296,415,688 | |
| | | | | | | | | | | | | | | | | | | | | | | | | | | | | | | |
| $ | 237,003,718 | | | $ | 205,853,979 | | | $ | 337,979,750 | | | $ | 186,854,398 | | | $ | 734,436,123 | | | $ | 552,195,570 | | | $ | 327,116,769 | | | $ | 339,497,126 | |
| | | | | | | | | | | | | | | | | | | | | | | | | | | | | | | |
| | | | | | | |
| $ | 1,016,788 | | | $ | 1,253,478 | | | $ | 575,259 | | | $ | 362,846 | | | $ | — | | | $ | — | | | $ | 3,066,218 | | | $ | — | |
| | | | | | | | | | | | | | | | | | | | | | | | | | | | | | | |
See Notes to Financial Statements.
81
Excelsior Funds
Statements of Changes in Net Assets
| | | | | | | | | | | | | | | | |
| | |
| | |
Real Estate Fund | | | Small Cap Fund | |
| | | Year Ended March 31, | | | Year Ended March 31, | |
| | | 2007 | | | 2006 | | | 2007 | | | 2006 | |
Net investment income (loss) | | $ | 960,048 | | | $ | 934,448 | | | $ | (4,043,832 | ) | | $ | (3,315,401 | ) |
Net realized gain (loss) on investments and foreign currency transactions | | | 18,405,693 | | | | 13,523,778 | | | | 32,537,688 | | | | 29,148,540 | |
Net realized gain (loss) on written options | | | — | | | | — | | | | — | | | | — | |
Change in unrealized appreciation (depreciation) of investments, foreign currency translations and written options during the year | | | 2,835,641 | | | | 22,502,084 | | | | 18,105,369 | | | | 96,294,626 | |
| | | | | | | | | | | | | | | | |
Net increase in net assets resulting from operations | | | 22,201,382 | | | | 36,960,310 | | | | 46,599,225 | | | | 122,127,765 | |
| | | | | | | | | | | | | | | | |
Distributions to shareholders: | | | | | | | | | | | | | | | | |
From net investment income | | | | | | | | | | | | | | | | |
Shares | | | (1,161,313 | ) | | | (2,183,412 | ) | | | — | | | | — | |
Institutional Shares | | | — | | | | — | | | | — | | | | — | |
Retirement Shares | | | — | | | | — | | | | — | | | | — | |
Return of Capital Shares | | | (640,355 | ) | | | — | | | | — | | | | — | |
From net realized gain on investments | | | | | | | | | | | | | | | | |
Shares | | | (18,263,524 | ) | | | (9,669,590 | ) | | | (43,578,479 | ) | | | (26,879,094 | ) |
Institutional shares | | | — | | | | — | | | | — | | | | — | |
Retirement Shares | | | — | | | | — | | | | (3,801 | ) | | | (53 | ) |
| | | | | | | | | | | | | | | | |
Total distributions | | | (20,065,192 | ) | | | (11,853,002 | ) | | | (43,582,280 | ) | | | (26,879,147 | ) |
| | | | | | | | | | | | | | | | |
Increase (decrease) in net assets from fund share transactions (Note 5) | | | 22,261,378 | | | | (10,368,268 | ) | | | 94,185,168 | | | | 15,919,054 | |
| | | | | | | | | | | | | | | | |
Net increase (decrease) in net assets | | | 24,397,568 | | | | 14,739,040 | | | | 97,202,113 | | | | 111,167,672 | |
| | | | | | | | | | | | | | | | |
NET ASSETS: | | | | | | | | | | | | | | | | |
Beginning of year | | | 127,628,408 | | | | 112,889,368 | | | | 599,390,194 | | | | 488,222,522 | |
| | | | | | | | | | | | | | | | |
End of year(1) | | $ | 152,025,976 | | | $ | 127,628,408 | | | $ | 696,592,307 | | | $ | 599,390,194 | |
| | | | | | | | | | | | | | | | |
(1) Including undistributed (distributions in excess of) net investment income | | | 529,195 | | | $ | 137,934 | | | $ | — | | | $ | — | |
| | | | | | | | | | | | | | | | |
See Notes to Financial Statements.
82
| | | | | | | | | | | | | | | | | | | | | | | | | | | | | | |
| | | |
Value and
Restructuring Fund | | | Emerging Markets Fund | | | International Fund | | | Pacific/Asia Fund | |
| Year Ended March 31, | | | Year Ended March 31, | | | Year Ended March 31, | | | Year Ended March 31, | |
| 2007 | | | 2006 | | | 2007 | | | 2006 | | | 2007 | | | 2006 | | | 2007 | | | 2006 | |
| $ | 66,434,678 | | | $ | 62,768,364 | | | $ | 5,214,247 | | | $ | 6,417,946 | | | $ | 2,767,357 | | | $ | 1,707,098 | | | $ | (95,162 | ) | | $ | 377,487 | |
|
95,424,384 |
| | | 25,898,526 | | | | 48,869,293 | | | | 9,661,036 | | | | 25,080,151 | | | | 17,116,817 | | | | 29,682,511 | | | | 17,380,537 | |
| | 1,331,652 | | | | (7,456,185 | ) | | | — | | | | — | | | | — | | | | — | | | | — | | | | — | |
|
645,371,791 |
| | | 892,712,062 | | | | 100,008,846 | | | | 233,002,829 | | | | 54,216,954 | | | | 66,475,218 | | | | (22,701,298 | ) | | | 33,439,543 | |
| | | | | | | | | | | | | | | | | | | | | | | | | | | | | | | |
| | 808,562,505 | | | | 973,922,767 | | | | 154,092,386 | | | | 249,081,811 | | | | 82,064,462 | | | | 85,299,133 | | | | 6,886,051 | | | | 51,197,567 | |
| | | | | | | | | | | | | | | | | | | | | | | | | | | | | | | |
| | | | | | | | | | | | | | | | | | | | | | | | | | | | | | |
| | | | | | | | | | | | | | | | | | | | | | | | | | | | | | |
| | (64,324,804 | ) | | | (50,184,813 | ) | | | (5,716,045 | ) | | | (5,703,935 | ) | | | (2,551,050 | ) | | | (2,396,031 | ) | | | — | | | | (1,686,498 | ) |
| | (3,526,597 | ) | | | (2,339,479 | ) | | | (252,640 | ) | | | (210,171 | ) | | | — | | | | — | | | | — | | | | — | |
| | (4,928 | ) | | | (1,311 | ) | | | — | | | | — | | | | — | | | | — | | | | — | | | | — | |
| | — | | | | — | | | | — | | | | — | | | | — | | | | — | | | | — | | | | — | |
| | | | | | | | | | | | | | | | | | | | | | | | | | | | | | |
| | — | | | | — | | | | (51,272,417 | ) | | | — | | | | — | | | | — | | | | (7,507,933 | ) | | | — | |
| | — | | | | — | | | | (1,858,765 | ) | | | — | | | | — | | | | — | | | | — | | | | — | |
| | — | | | | — | | | | — | | | | — | | | | — | | | | — | | | | — | | | | — | |
| | | | | | | | | | | | | | | | | | | | | | | | | | | | | | | |
| | (67,856,329 | ) | | | (52,525,603 | ) | | | (59,099,867 | ) | | | (5,914,106 | ) | | | (2,551,050 | ) | | | (2,396,031 | ) | | | (7,507,933 | ) | | | (1,686,498 | ) |
| | | | | | | | | | | | | | | | | | | | | | | | | | | | | | | |
| | 918,433,748 | | | | 930,527,802 | | | | 17,298,560 | | | | 345,786,429 | | | | 35,143,298 | | | | 199,059,569 | | | | (30,209,902 | ) | | | 59,874,379 | |
| | | | | | | | | | | | | | | | | | | | | | | | | | | | | | | |
| | 1,659,139,924 | | | | 1,851,924,966 | | | | 112,291,079 | | | | 588,954,134 | | | | 114,656,710 | | | | 281,962,671 | | | | (30,831,784 | ) | | | 109,385,448 | |
| | | | | | | | | | | | | | | | | | | | | | | | | | | | | | | |
| | | | | | | | | | | | | | | | | | | | | | | | | | | | | | |
| | 6,482,016,892 | | | | 4,630,091,926 | | | | 1,022,122,400 | | | | 433,168,266 | | | | 522,284,437 | | | | 240,321,766 | | | | 243,964,227 | | | | 134,578,779 | |
| | | | | | | | | | | | | | | | | | | | | | | | | | | | | | | |
| $ | 8,141,156,816 | | | $ | 6,482,016,892 | | | $ | 1,134,413,479 | | | $ | 1,022,122,400 | | | $ | 636,941,147 | | | $ | 522,284,437 | | | $ | 213,132,443 | | | $ | 243,964,227 | |
| | | | | | | | | | | | | | | | | | | | | | | | | | | | | | | |
| | | | | | | |
| $ | 16,648,966 | | | $ | 19,146,231 | | | $ | 163,806 | | | $ | 1,061,119 | | | $ | 300,494 | | | $ | 90,545 | | | $ | — | | | $ | (477,107 | ) |
| | | | | | | | | | | | | | | | | | | | | | | | | | | | | | | |
See Notes to Financial Statements.
83
Excelsior Funds
Financial Highlights — Selected Per Share Data and Ratios
| | | | | | | | | | | | | | | | | | | | | | | |
| | | Net Asset Value,
Beginning of
Year | | Net
Investment
Income (Loss) | | | Net Realized and
Unrealized
Gain (Loss) of
Investments
and Options | | | Total From
Investment
Operations | | | Dividends
From Net
Investment
Income | | | Distributions From
Net Realized Gain
on Investments
and Options | |
BLENDED EQUITY FUND — (04/25/85*) | | | | | | | | | | | | | | | | | |
Shares: | | | | | | | | | | | | | | | | | | | | | | | |
Year Ended March 31, | | | | | | | | | | | | | | | | | | | | | | | |
2007 | | $ | 37.27 | | $ | 0.25 | (2) | | $ | 3.61 | (2) | | $ | 3.86 | | | $ | (0.23 | ) | | $ | (5.54 | ) |
2006 | | | 36.12 | | | 0.19 | (2) | | | 3.67 | (2) | | | 3.86 | | | | (0.21 | ) | | | (2.50 | ) |
2005 | | | 33.64 | | | 0.30 | (2) | | | 2.66 | (2) | | | 2.96 | | | | (0.28 | ) | | | (0.20 | ) |
2004 | | | 25.67 | | | 0.14 | | | | 7.99 | | | | 8.13 | | | | (0.16 | ) | | | — | |
2003 | | | 35.17 | | | 0.17 | | | | (7.97 | ) | | | (7.80 | ) | | | (0.15 | ) | | | (1.55 | ) |
ENERGY AND NATURAL RESOURCES FUND — (12/31/92*) | | | | | | | | | | | | | |
Shares: | | | | | | | | | | | | | | | | | | | | | | | |
Year Ended March 31, | | | | | | | | | | | | | | | | | | | | | | | |
2007 | | $ | 25.99 | | $ | 0.06 | (2) | | $ | 2.50 | (2) | | $ | 2.56 | | | $ | (0.06 | ) | | $ | (5.19 | ) |
2006 | | | 22.34 | | | — | (2)(3) | | | 9.04 | (2) | | | 9.04 | | | | — | | | | (5.39 | ) |
2005 | | | 16.45 | | | 0.02 | (2) | | | 6.99 | (2) | | | 7.01 | | | | (0.05 | ) | | | (1.07 | ) |
2004 | | | 11.72 | | | 0.06 | | | | 4.71 | | | | 4.77 | | | | (0.04 | ) | | | — | |
2003 | | | 14.40 | | | 0.04 | | | | (2.67 | ) | | | (2.63 | ) | | | (0.05 | ) | | | — | |
EQUITY INCOME FUND — (09/30/03*) | | | | | | | | | | | | | | | | | |
Shares: | | | | | | | | | | | | | | | | | | | | | | | |
Year Ended March 31, | | | | | | | | | | | | | | | | | | | | | | | |
2007 | | $ | 8.56 | | $ | 0.16 | (2) | | $ | 0.96 | (2) | | $ | 1.12 | | | $ | (0.17 | ) | | | — | |
2006 | | | 8.39 | | | 0.20 | (2) | | | 0.17 | (2) | | | 0.37 | | | | (0.18 | ) | | $ | (0.02 | ) |
2005 | | | 7.76 | | | 0.19 | (2) | | | 0.63 | (2) | | | 0.82 | | | | (0.17 | ) | | | (0.02 | ) |
Period Ended March 31, 2004 | | | 7.00 | | | 0.07 | | | | 0.73 | | | | 0.80 | | | | (0.04 | ) | | | — | |
EQUITY OPPORTUNITIES FUND — (03/31/04*) | | | | | | | | | | | | | | | | | |
Shares: | | | | | | | | | | | | | | | | | | | | | | | |
Year Ended March 31, | | | | | | | | | | | | | | | | | | | | | | | |
2007 | | $ | 12.70 | | $ | 0.07 | (2) | | $ | 1.47 | (2) | | $ | 1.54 | | | $ | (0.07 | ) | | | — | |
2006 | | | 10.98 | | | 0.07 | (2) | | | 1.70 | (2) | | | 1.77 | | | | (0.05 | ) | | | — | |
2005 | | | 10.00 | | | 0.08 | (2) | | | 0.95 | (2) | | | 1.03 | | | | (0.04 | ) | | $ | (0.01 | ) |
LARGE CAP GROWTH FUND — (10/01/97*) | | | | | | | | | | | | | | | | | |
Shares: | | | | | | | | | | | | | | | | | | | | | | | |
Year Ended March 31, | | | | | | | | | | | | | | | | | | | | | | | |
2007 | | $ | 9.91 | | $ | (0.07 | )(2) | | $ | 0.76 | (2) | | $ | 0.69 | | | | — | | | | — | |
2006 | | | 8.04 | | | (0.04 | )(2) | | | 1.91 | (2) | | | 1.87 | | | | — | | | | — | |
2005 | | | 7.71 | | | (0.05 | )(2) | | | 0.38 | (2) | | | 0.33 | | | | — | | | | — | |
2004 | | | 5.79 | | | (0.05 | )(2) | | | 1.97 | (2) | | | 1.92 | | | | — | | | | — | |
2003 | | | 8.83 | | | (0.01 | )(2) | | | (3.03 | )(2) | | | (3.04 | ) | | | — | | | | — | |
MID CAP VALUE AND RESTRUCTURING FUND — (06/01/96*) | | | | | | | | | | | | | |
Shares: | | | | | | | | | | | | | | | | | | | | | | | |
Year Ended March 31, | | | | | | | | | | | | | | | | | | | | | | | |
2007 | | $ | 19.64 | | $ | 0.23 | (2) | | $ | 1.75 | (2) | | $ | 1.98 | | | $ | (0.01 | ) | | | — | (3) |
2006 | | | 16.77 | | | — | (2)(3) | | | 2.90 | (2) | | | 2.90 | | | | (0.03 | ) | | | — | |
2005 | | | 15.75 | | | 0.23 | (2) | | | 1.02 | (2) | | | 1.25 | | | | (0.23 | ) | | | — | |
2004 | | | 10.24 | | | 0.03 | (2) | | | 5.51 | (2) | | | 5.54 | | | | (0.03 | ) | | | — | |
2003 | | | 13.29 | | | 0.02 | (2) | | | (3.05 | )(2) | | | (3.03 | ) | | | (0.02 | ) | | | — | |
| * | Commencement of Operations. |
| (1) | Expense ratios before waiver of fees and reimbursement of expenses (if any) by adviser and administrator. |
| (2) | For comparative purposes per share amounts are based on average shares outstanding. |
| (3) | Amount represents less than $0.01 per share. |
| (6) | The ratio of net operating expenses for Energy and Natural Resources Fund and Equity Opportunities Fund would have been 1.13% and 1.05%, respectively, if custody credits had not been included. |
See Notes to Financial Statements.
84
| | | | | | | | | | | | | | | | | | | | | | | |
Total
Distributions | | | Net Asset
Value,
End of
Year | | Total
Return | | | Net Assets,
End of
Year
(000’s) | | Ratio of Net
Operating
Expenses
to Average
Net Assets | | | Ratio of Gross
Operating
Expenses to
Average
Net Assets (1) | | | Ratio of Net
Investment
Income (Loss)
to Average
Net Assets | | | Portfolio
Turnover
Rate | |
| | | | | | | | | | | | | | | | | | | | | | | |
| | | | | | | | | | | | | | | | | | | | | | | |
| | | | | | | | | | | | | | | | | | | | | | | |
| $ | (5.77 | ) | | $ | 35.36 | | 10.66 | % | | $ | 401,023 | | 1.10 | % | | 1.21 | % | | 0.68 | % | | 10 | % |
| | (2.71 | ) | | | 37.27 | | 11.10 | % | | | 460,309 | | 1.08 | % | | 1.21 | % | | 0.53 | % | | 22 | % |
| | (0.48 | ) | | | 36.12 | | 8.85 | % | | | 466,903 | | 1.05 | % | | 1.24 | % | | 0.86 | % | | 19 | % |
| | (0.16 | ) | | | 33.64 | | 31.75 | % | | | 573,242 | | 0.99 | % | | 1.10 | % | | 0.45 | % | | 24 | % |
| | (1.70 | ) | | | 25.67 | | (22.45 | )% | | | 469,013 | | 0.96 | % | | 1.11 | % | | 0.59 | % | | 36 | % |
| | | | | | | | | | | | | | | | | | | | | | | |
| | | | | | | | | | | | | | | | | | | | | | | |
| | | | | | | | | | | | | | | | | | | | | | | |
| $ | (5.25 | ) | | $ | 23.30 | | 10.84 | % | | $ | 497,676 | | 1.12 | %(6) | | 1.13 | % | | 0.25 | % | | 279 | % |
| | (5.39 | ) | | | 25.99 | | 41.42 | % | | | 522,506 | | 1.13 | % | | 1.13 | % | | (0.01 | )% | | 234 | % |
| | (1.12 | ) | | | 22.34 | | 43.97 | % | | | 292,333 | | 1.10 | % | | 1.15 | % | | 0.12 | % | | 111 | % |
| | (0.04 | ) | | | 16.45 | | 40.84 | % | | | 150,035 | | 0.99 | % | | 1.13 | % | | 0.45 | % | | 91 | % |
| | (0.05 | ) | | | 11.72 | | (18.30 | )% | | | 92,440 | | 1.01 | % | | 1.19 | % | | 0.35 | % | | 78 | % |
| | | | | | | | | | | | | | | | | | | | | | | |
| | | | | | | | | | | | | | | | | | | | | | | |
| | | | | | | | | | | | | | | | | | | | | | | |
| $ | (0.17 | ) | | $ | 9.51 | | 13.29 | % | | $ | 237,003 | | 1.10 | % | | 1.21 | % | | 1.80 | % | | 27 | % |
| | (0.20 | ) | | | 8.56 | | 4.62 | % | | | 205,853 | | 1.06 | % | | 1.22 | % | | 2.41 | % | | 46 | % |
| | (0.19 | ) | | | 8.39 | | 10.73 | % | | | 195,668 | | 1.05 | % | | 1.26 | % | | 2.35 | % | | 19 | % |
| | (0.04 | ) | | | 7.76 | | 11.48 | %(4) | | | 100,024 | | 1.05 | %(5) | | 1.17 | %(5) | | 2.44 | %(5) | | 6 | %(4) |
| | | | | | | | | | | | | | | | | | | | | | | |
| | | | | | | | | | | | | | | | | | | | | | | |
| | | | | | | | | | | | | | | | | | | | | | | |
| $ | (0.07 | ) | | $ | 14.17 | | 12.18 | % | | $ | 277,877 | | 1.04 | %(6) | | 1.24 | % | | 0.56 | % | | 11 | % |
| | (0.05 | ) | | | 12.70 | | 16.16 | % | | | 132,406 | | 1.05 | % | | 1.31 | % | | 0.57 | % | | 17 | % |
| | (0.05 | ) | | | 10.98 | | 10.30 | % | | | 43,579 | | 1.05 | % | | 1.59 | % | | 0.74 | % | | 13 | % |
| | | | | | | | | | | | | | | | | | | | | | | |
| | | | | | | | | | | | | | | | | | | | | | | |
| | | | | | | | | | | | | | | | | | | | | | | |
| | — | | | $ | 10.60 | | 6.96 | % | | $ | 718,424 | | 1.20 | % | | 1.20 | % | | (0.68 | )% | | 33 | % |
| | — | | | | 9.91 | | 23.26 | % | | | 552,194 | | 1.10 | % | | 1.23 | % | | (0.48 | )% | | 24 | % |
| | — | | | | 8.04 | | 4.28 | % | | | 210,060 | | 1.05 | % | | 1.28 | % | | (0.59 | )% | | 25 | % |
| | — | | | | 7.71 | | 33.16 | % | | | 127,231 | | 1.05 | % | | 1.18 | % | | (0.74 | )% | | 79 | % |
| | — | | | | 5.79 | | (34.43 | )% | | | 73,894 | | 1.04 | % | | 1.21 | % | | (0.21 | )% | | 56 | % |
| | | | | | | | | | | | | | | | | | | | | | | |
| | | | | | | | | | | | | | | | | | | | | | | |
| | | | | | | | | | | | | | | | | | | | | | | |
| $ | (0.01 | ) | | $ | 21.61 | | 10.07 | % | | $ | 294,452 | | 1.13 | % | | 1.13 | % | | 1.12 | % | | 25 | % |
| | (0.03 | ) | | | 19.64 | | 17.32 | % | | | 237,531 | | 1.13 | % | | 1.13 | % | | 0.02 | % | | 23 | % |
| | (0.23 | ) | | | 16.77 | | 7.93 | % | | | 214,844 | | 1.06 | % | | 1.16 | % | | 1.42 | % | | 28 | % |
| | (0.03 | ) | | | 15.75 | | 54.21 | % | | | 186,720 | | 0.99 | % | | 1.23 | % | | 0.24 | % | | 13 | % |
| | (0.02 | ) | | | 10.24 | | (22.81 | )% | | | 81,146 | | 1.01 | % | | 1.15 | % | | 0.20 | % | | 28 | % |
See Notes to Financial Statements.
85
Excelsior Funds
Financial Highlights — Selected Per Share Data and Ratios
| | | | | | | | | | | | | | | | | | | | | | | | | | | |
| | | | | | | |
| | | Net Asset Value,
Beginning of
Year | | Net
Investment
Income (Loss) | | | Net Realized and
Unrealized
Gain (Loss) of
Investments
and Options | | | Total From
Investment
Operations | | | Dividends
From Net
Investment
Income | | | Distributions
from Return
of Capital | | | Distributions
From Net
Realized
Gain on
Investments
and Options | |
REAL ESTATE FUND — (10/01/97*) | | | | | | | | | | | | | | | | | |
Shares: | | | | | | | | | | | | | | | | | | | | | | | | | | | |
Year Ended March 31, | | | | | | | | | | | | | | | | | | | | | |
2007 | | $ | 11.46 | | $ | 0.08 | (2) | | $ | 1.78 | (2) | | $ | 1.86 | | | $ | (0.08 | ) | | $ | (0.06 | ) | | $ | (1.66 | ) |
2006 | | | 9.30 | | | 0.08 | (2) | | | 3.10 | (2) | | | 3.18 | | | | (0.19 | ) | | | — | | | | (0.83 | ) |
2005 | | | 9.17 | | | 0.17 | (2) | | | 0.68 | (2) | | | 0.85 | | | | (0.22 | ) | | | — | | | | (0.50 | ) |
2004 | | | 6.61 | | | 0.29 | (2) | | | 2.64 | (2) | | | 2.93 | | | | (0.31 | ) | | | — | | | | (0.06 | ) |
2003 | | | 7.10 | | | 0.28 | (2) | | | (0.52 | )(2) | | | (0.24 | ) | | | (0.25 | ) | | | — | | | | — | |
SMALL CAP FUND — (12/31/92*) | | | | | | | | | | | | | | | | | | | | | |
Shares: | | | | | | | | | | | | | | | | | | | | | | | | | | | |
Year Ended March 31, | | | | | | | | | | | | | | | | | | | | | |
2007 | | $ | 19.23 | | $ | (0.12 | )(2) | | $ | 1.36 | (2) | | $ | 1.24 | | | | — | | | | — | | | $ | (1.26 | ) |
2006 | | | 16.14 | | | (0.11 | )(2) | | | 4.09 | (2) | | | 3.98 | | | | — | | | | — | | | | (0.89 | ) |
2005 | | | 14.59 | | | (0.10 | )(2) | | | 1.65 | (2) | | | 1.55 | | | | — | | | | — | | | | — | |
2004 | | | 8.47 | | | (0.02 | )(2) | | | 6.14 | (2) | | | 6.12 | | | | — | | | | — | | | | — | |
2003 | | | 12.19 | | | (0.03 | )(2) | | | (3.69 | )(2) | | | (3.72 | ) | | | — | | | | — | | | | — | |
VALUE AND RESTRUCTURING FUND — (12/31/92*) | | | | | | | | | | | | | |
Shares: | | | | | | | | | | | | | | | | | | | | | | | | | | | |
Year Ended March 31, | | | | | | | | | | | | | | | | | | | | | |
2007 | | $ | 49.36 | | $ | 0.45 | (2) | | $ | 5.00 | (2) | | $ | 5.45 | | | $ | (0.48 | ) | | | — | | | | — | |
2006 | | | 41.40 | | | 0.53 | (2) | | | 7.88 | (2) | | | 8.41 | | | | (0.45 | ) | | | — | | | | — | |
2005 | | | 37.57 | | | 0.34 | (2) | | | 3.83 | (2) | | | 4.17 | | | | (0.34 | ) | | | — | | | | — | |
2004 | | | 23.66 | | | 0.24 | | | | 13.90 | | | | 14.14 | | | | (0.23 | ) | | | — | | | | — | |
2003 | | | 32.63 | | | 0.17 | | | | (9.01 | ) | | | (8.84 | ) | | | (0.13 | ) | | | — | | | | — | |
EMERGING MARKETS FUND — (01/02/98*) | | | | | | | | | | | | | | | | | |
Shares: | | | | | | | | | | | | | | | | | | | | | | | | | | | |
Year Ended March 31, | | | | | | | | | | | | | | | | | | | | | |
2007 | | $ | 12.60 | | $ | 0.07 | (2) | | $ | 2.16 | (2) | | $ | 2.23 | | | $ | (0.08 | ) | | | — | | | $ | (0.69 | ) |
2006 | | | 8.73 | | | 0.10 | (2) | | | 3.87 | (2) | | | 3.97 | | | | (0.10 | ) | | | — | | | | — | |
2005 | | | 7.67 | | | 0.12 | (2) | | | 1.18 | (2) | | | 1.30 | | | | (0.08 | ) | | | — | | | | (0.16 | ) |
2004 | | | 4.12 | | | 0.05 | | | | 3.55 | | | | 3.60 | | | | (0.05 | ) | | | — | | | | — | |
2003 | | | 4.95 | | | 0.02 | | | | (0.84 | ) | | | (0.82 | ) | | | (0.01 | ) | | | — | | | | — | |
INTERNATIONAL FUND — (07/21/87*) | | | | | | | | | | | | | | | | | |
Shares: | | | | | | | | | | | | | | | | | | | | | | | | | | | |
Year Ended March 31, | | | | | | | | | | | | | | | | | | | | | |
2007 | | $ | 16.51 | | $ | 0.09 | (2) | | $ | 2.54 | (2) | | $ | 2.63 | | | $ | (0.08 | ) | | | — | | | | — | |
2006 | | | 13.05 | | | 0.07 | (2) | | | 3.51 | (2) | | | 3.58 | | | | (0.12 | ) | | | — | | | | — | |
2005 | | | 11.28 | | | 0.06 | (2) | | | 1.71 | (2) | | | 1.77 | | | | — | (3) | | | — | | | | — | |
2004 | | | 6.83 | | | 0.09 | | | | 4.44 | | | | 4.53 | | | | (0.08 | ) | | | — | | | | — | |
2003 | | | 9.75 | | | 0.10 | | | | (2.99 | ) | | | (2.89 | ) | | | (0.03 | ) | | | — | | | | — | |
PACIFIC / ASIA FUND — (12/31/92*) | | | | | | | | | | | | | | | | | |
Shares: | | | | | | | | | | | | | | | | | | | | | | | | | | | |
Year Ended March 31, | | | | | | | | | | | | | | | | | | | | | |
2007 | | $ | 11.61 | | | — | (2)(3) | | $ | 0.50 | (2) | | $ | 0.50 | | | | — | | | | — | | | $ | (0.39 | ) |
2006 | | | 8.88 | | $ | 0.02 | (2) | | | 2.82 | (2) | | | 2.84 | | | $ | (0.11 | ) | | | — | | | | — | |
2005 | | | 8.44 | | | 0.03 | (2) | | | 0.42 | (2) | | | 0.45 | | | | (0.01 | ) | | | — | | | | — | |
2004 | | | 5.21 | | | 0.01 | | | | 3.22 | | | | 3.23 | | | | — | | | | — | | | | — | |
2003 | | | 6.68 | | | 0.01 | | | | (1.43 | ) | | | (1.42 | ) | | | (0.05 | ) | | | — | | | | — | |
| * | Commencement of Operations. |
| (1) | Expense ratios before waiver of fees and reimbursement of expenses (if any) by adviser and administrator. |
| (2) | For comparative purposes per share amounts are based on average shares outstanding. |
| (3) | Amount represents less than $0.01 per share. |
See Notes to Financial Statements.
86
| | | | | | | | | | | | | | | | | | | | | | | |
| | | | | | | |
Total
Distributions | | | Net Asset
Value,
End of
Year | | Total
Return | | | Net Assets,
End of
Year
(000’s) | |
Ratio of Net
Operating
Expenses
to Average
Net Assets | | | Ratio of Gross
Operating
Expenses to
Average
Net Assets (1) | | | Ratio of Net
Investment
Income (Loss)
to Average
Net Assets | | | Portfolio
Turnover
Rate | |
| | | | | | | | | | | | | | | | | | | | | | | |
| | | | | | | | | | | | | | | | | | | | | | | |
| | | | | | | | | | | | | | | | | | | | | | | |
| $ | (1.80 | ) | | $ | 11.52 | | 19.36 | % | | $ | 152,026 | | 1.25 | % | | 1.53 | % | | 0.71 | % | | 38 | % |
| | (1.02 | ) | | | 11.46 | | 36.03 | % | | | 127,628 | | 1.23 | % | | 1.52 | % | | 0.77 | % | | 14 | % |
| | (0.72 | ) | | | 9.30 | | 9.90 | % | | | 112,889 | | 1.20 | % | | 1.56 | % | | 1.89 | % | | 17 | % |
| | (0.37 | ) | | | 9.17 | | 45.65 | % | | | 122,874 | | 1.20 | % | | 1.35 | % | | 3.67 | % | | 38 | % |
| | (0.25 | ) | | | 6.61 | | (3.49 | )% | | | 79,374 | | 1.17 | % | | 1.23 | % | | 4.09 | % | | 23 | % |
| | | | | | | | | | | | | | | | | | | | | | | |
| | | | | | | | | | | | | | | | | | | | | | | |
| | | | | | | | | | | | | | | | | | | | | | | |
| $ | (1.26 | ) | | $ | 19.21 | | 6.83 | % | | $ | 694,765 | | 1.22 | % | | 1.22 | % | | (0.66 | )% | | 52 | % |
| | (0.89 | ) | | | 19.23 | | 25.37 | % | | | 599,389 | | 1.09 | % | | 1.11 | % | | (0.64 | )% | | 65 | % |
| | — | | | | 16.14 | | 10.62 | % | | | 488,221 | | 1.05 | % | | 1.08 | % | | (0.64 | )% | | 61 | % |
| | — | | | | 14.59 | | 72.26 | % | | | 352,457 | | 0.83 | % | | 0.98 | % | | (0.20 | )% | | 82 | % |
| | — | | | | 8.47 | | (30.52 | )% | | | 156,324 | | 0.83 | % | | 1.05 | % | | (0.31 | )% | | 105 | % |
| | | | | | | | | | | | | | | | | | | | | | | |
| | | | | | | | | | | | | | | | | | | | | | | |
| | | | | | | | | | | | | | | | | | | | | | | |
| $ | (0.48 | ) | | $ | 54.33 | | 11.14 | % | | $ | 7,767,713 | | 1.05 | % | | 1.05 | % | | 0.90 | % | | 13 | % |
| | (0.45 | ) | | | 49.36 | | 20.45 | % | | | 6,230,754 | | 1.05 | % | | 1.05 | % | | 1.18 | % | | 12 | % |
| | (0.34 | ) | | | 41.40 | | 11.16 | % | | | 4,469,075 | | 1.07 | % | | 1.09 | % | | 0.87 | % | | 8 | % |
| | (0.23 | ) | | | 37.57 | | 60.06 | % | | | 3,244,851 | | 0.99 | % | | 1.14 | % | | 0.78 | % | | 4 | % |
| | (0.13 | ) | | | 23.66 | | (27.13 | )% | | | 1,558,721 | | 0.99 | % | | 1.12 | % | | 0.65 | % | | 16 | % |
| | | | | | | | | | | | | | | | | | | | | | | |
| | | | | | | | | | | | | | | | | | | | | | | |
| | | | | | | | | | | | | | | | | | | | | | | |
| $ | (0.77 | ) | | $ | 14.06 | | 17.98 | % | | $ | 1,092,481 | | 1.85 | % | | 1.90 | % | | 0.50 | % | | 16 | % |
| | (0.10 | ) | | | 12.60 | | 45.85 | % | | | 996,666 | | 1.81 | % | | 1.92 | % | | 1.00 | % | | 7 | % |
| | (0.24 | ) | | | 8.73 | | 17.07 | % | | | 433,168 | | 1.70 | % | | 1.90 | % | | 1.44 | % | | 21 | % |
| | (0.05 | ) | | | 7.67 | | 87.57 | % | | | 209,161 | | 1.65 | % | | 1.92 | % | | 0.81 | % | | 14 | % |
| | (0.01 | ) | | | 4.12 | | (16.62 | )% | | | 30,049 | | 1.61 | % | | 1.84 | % | | 0.51 | % | | 43 | % |
| | | | | | | | | | | | | | | | | | | | | | | |
| | | | | | | | | | | | | | | | | | | | | | | |
| | | | | | | | | | | | | | | | | | | | | | | |
| $ | (0.08 | ) | | $ | 19.06 | | 16.03 | % | | $ | 636,941 | | 1.50 | % | | 1.56 | % | | 0.49 | % | | 28 | % |
| | (0.12 | ) | | | 16.51 | | 27.70 | % | | | 522,284 | | 1.50 | % | | 1.58 | % | | 0.52 | % | | 26 | % |
| | — | | | | 13.05 | | 15.71 | % | | | 240,322 | | 1.50 | % | | 1.61 | % | | 0.52 | % | | 66 | % |
| | (0.08 | ) | | | 11.28 | | 66.51 | % | | | 130,143 | | 1.38 | % | | 1.49 | % | | 0.92 | % | | 58 | % |
| | (0.03 | ) | | | 6.83 | | (29.72 | )% | | | 89,679 | | 1.40 | % | | 1.57 | % | | 0.55 | % | | 73 | % |
| | | | | | | | | | | | | | | | | | | | | | | |
| | | | | | | | | | | | | | | | | | | | | | | |
| | | | | | | | | | | | | | | | | | | | | | | |
| $ | (0.39 | ) | | $ | 11.72 | | 4.40 | % | | $ | 213,132 | | 1.61 | % | | 1.61 | % | | (0.04 | )% | | 92 | % |
| | (0.11 | ) | | | 11.61 | | 32.35 | % | | | 243,964 | | 1.59 | % | | 1.62 | % | | 0.22 | % | | 68 | % |
| | (0.01 | ) | | | 8.88 | | 5.32 | % | | | 134,579 | | 1.50 | % | | 1.64 | % | | 0.35 | % | | 90 | % |
| | — | | | | 8.44 | | 62.00 | % | | | 114,830 | | 1.45 | % | | 1.58 | % | | 0.20 | % | | 58 | % |
| | (0.05 | ) | | | 5.21 | | (21.44 | )% | | | 27,330 | | 1.51 | % | | 1.66 | % | | 0.15 | % | | 73 | % |
See Notes to Financial Statements.
87
EXCELSIOR FUNDS
NOTES TO FINANCIAL STATEMENTS
| 1. | Significant Accounting Policies: |
Excelsior Funds, Inc. (“Excelsior Fund”) was incorporated under the laws of the State of Maryland on August 2, 1984. Excelsior Funds Trust (the “Trust”) is a statutory trust organized under the laws of the State of Delaware on April 27, 1994. Excelsior Fund and the Trust are registered under the Investment Company Act of 1940, as amended (the “1940 Act”), as open-ended diversified management investment companies with the exception of Energy and Natural Resources Fund and Real Estate Fund, each of which is non-diversified.
Excelsior Fund and the Trust currently offer shares in fifteen and five managed investment portfolios, respectively, each having its own investment objectives and policies. The following is a summary of significant accounting policies for Blended Equity Fund, Energy and Natural Resources Fund, Large Cap Growth Fund, Real Estate Fund, Small Cap Fund, Value and Restructuring Fund, Emerging Markets Fund, International Fund and Pacific/Asia Fund, portfolios of Excelsior Fund, and Equity Opportunities Fund (formerly the Equity Core Fund), Equity Income Fund and Mid Cap Value and Restructuring Fund, portfolios of the Trust. Such policies are in conformity with accounting principles generally accepted in the United States of America and are consistently followed by Excelsior Fund and the Trust (each a “Fund”, collectively the “Funds”) in the preparation of their financial statements. The preparation of financial statements requires management to make estimates and assumptions that affect the reported amounts and disclosures in the financial statements. Actual results could differ from these estimates.
The Blended Equity Fund, Energy and Natural Resources Fund, Real Estate Fund, International Fund and Pacific/Asia Fund offer one class of shares: Shares. The Equity Opportunities Fund and Emerging Markets Fund offer two classes of shares: Shares and Institutional Shares. The Equity Income Fund and Small Cap Fund offer two classes of shares: Shares and Retirement Shares. The Large Cap Growth Fund, Mid Cap Value and Restructuring Fund and the Value and Restructuring Fund offer three classes of shares: Shares, Institutional Shares and Retirement Shares. The Financial Highlights of the Institutional Shares and Retirement Shares as well as the financial statements for the remaining portfolios of Excelsior Fund and the Trust are presented separately.
(a) Portfolio valuation:
Investments in securities that are traded on a recognized domestic and foreign stock exchanges are valued at the last sale price on the exchange on which such securities are primarily traded or at the last quoted sale price on a national securities market. Securities traded over-the-counter are valued each business day on the basis of closing over-the-counter sale prices. Equity securities that are traded on the NASDAQ National Market System for which quotations are readily available are valued at the official closing price. Securities for which there were no transactions are valued at the last quoted sales price for the most recent day such prices were available. Securities for which market quotations or valuation by pricing agent are not readily available are valued in good faith at fair value pursuant to procedures adopted by the Board of Directors with regard to Excelsior Fund and the Board of Trustees with regard to the Trust. The Funds have engaged a third party fair value
88
service provider to systematically recommend the adjustment of closing market prices of securities traded principally in foreign markets. Short-term debt instruments that mature in 60 days or less are valued at amortized cost, which approximates market value.
Investment valuations and other assets and liabilities initially expressed in foreign currencies are converted each business day into U.S. dollars based upon current exchange rates. Purchases and sales of foreign investments and income and expenses are converted into U.S. dollars based upon currency exchange rates prevailing on the respective dates of such transactions. The Funds do not isolate the portion of gains and losses on investment securities that is due to changes in foreign exchange rates from that which is due to changes in market prices of such securities. The Funds report gains and losses on foreign currency related transactions as realized and unrealized gains and losses for financial reporting purposes, whereas such components are treated as ordinary income or loss for federal income tax purposes.
(b) Forward foreign currency exchange contracts:
The Funds’ participation in forward currency exchange contracts will be limited to hedging involving either specific transactions or portfolio positions. Transaction hedging involves the purchase or sale of foreign currency with respect to specific receivables or payables of a Fund generally arising in connection with the purchase or sale of its portfolio securities. Risk may arise upon entering into these contracts from the potential inability of counterparties to meet the terms of their contracts and is generally limited to the amount of unrealized gain on the contracts, if any, at the date of default. Risk may also arise from unanticipated movements in the value of foreign currency relative to the U.S. dollar. Contracts are marked to market daily and the change in market value is recorded as unrealized appreciation or depreciation. Realized gains or losses arising from such transactions are included in net realized gains or losses from foreign currency transactions.
The Equity Opportunities Fund had the following forward foreign currency contracts outstanding as of March 31, 2007:
| | | | | | | | | |
Settlement Dates | | Currency to
Receive | | In
Exchange
For | | Unrealized
Appreciation | |
Foreign Currency Purchases: | | | | | | | | | |
04/04/07 | | EUR 60,160 | | $ | 80,445 | | $ | (87 | ) |
89
The International Fund had the following forward foreign currency contracts outstanding as of March 31, 2007:
| | | | | | | | | |
Settlement Dates | | Currency to
Receive | | In
Exchange
For | | Unrealized
Appreciation
(Depreciation) | |
Foreign Currency Purchases: | | | | | | | | | |
04/02/07 | | CHF 604,251 | | $ | 497,261 | | $ | 147 | |
04/02/07 | | EUR 325,007 | | | 433,527 | | | 586 | |
04/02/07 | | EUR 414,389 | | | 552,753 | | | 747 | |
04/02/07 | | EUR 435,004 | | | 580,251 | | | 784 | |
04/04/07 | | EUR 570,759 | | | 764,531 | | | (2,138 | ) |
04/04/07 | | EUR 364,552 | | | 488,318 | | | (1,365 | ) |
04/04/07 | | EUR 296,734 | | | 397,475 | | | (1,111 | ) |
04/02/07 | | GBP 200,928 | | | 394,542 | | | 806 | |
04/02/07 | | GBP 363,358 | | | 713,491 | | | 1,458 | |
04/02/07 | | GBP 311,862 | | | 612,372 | | | 1,252 | |
04/04/07 | | GBP 189,814 | | | 374,123 | | | (644 | ) |
04/03/07 | | JPY 35,170,200 | | | 298,483 | | | 25 | |
The Pacific/Asia Fund had the following forward foreign currency contracts outstanding as of March 31, 2007:
| | | | | | | | | | |
Settlement Dates | | Currency to
Receive | | | In
Exchange
For | | | Unrealized
Appreciation
(Depreciation) |
Foreign Currency Purchases: | | | | | | | | | | |
04/02/07 | | JPY (82,848,348 | ) | | $ | (711,603 | ) | | $ | 8,425 |
The Value and Restructuring Fund had the following forward foreign currency contracts outstanding as of March 31, 2007:
| | | | | | | | | |
Settlement Dates | | Currency to
Receive | | In
Exchange
For | | Unrealized
Appreciation
(Depreciation) | |
Foreign Currency Purchases: | | | | | | | | | |
04/04/07 | | CHF 4,345,557 | | $ | 3,584,260 | | $ | (6,774 | ) |
Currency Legend:
(c) Covered call options written:
Certain Funds may engage in writing covered call options. By writing a covered call option, a Fund forgoes the opportunity to profit from an increase in the market price of the underlying security above the exercise price, except insofar as the premium represents such a profit.
90
When a Fund writes an option, an amount equal to the net premium (the premium less the commission) received by that Fund is included in the liability section of that Fund’s statement of assets and liabilities as a deferred credit. The amount of the deferred credit will be subsequently marked to market to reflect the current value of the option written. The current value of the traded option is the last sale price or, in the absence of a sale, the last quoted sale price for the most recent day such price was available. If an option expires on the stipulated expiration date, or if the Fund involved enters into a closing purchase transaction, the Fund will realize a gain (or loss if the cost of a closing purchase transaction exceeds the net premium received when the option is sold), and the deferred credit related to such option will be eliminated. If an option is exercised, the Fund involved may deliver the underlying security from its portfolio or purchase the underlying security in the open market. In either event, the proceeds of the sale will be increased by the net premium originally received, and the Fund involved will realize a gain or loss. Premiums from expired call options written by the Fund and net gains from closing purchase transactions are treated as short-term capital gains for Federal income tax purposes, and losses on closing purchase transactions are short-term capital losses.
There is no assurance that a liquid secondary market on an exchange will exist for any particular option. A covered option writer, unable to effect a closing purchase transaction, will not be able to sell the underlying security until the option expires or is delivered upon exercise. As a result, the writer in such circumstances will be subject to the risk of market decline in the underlying security during such period and to the risk that market values increase beyond the option exercise price, in each case to the extent not offset by the net premium. A Fund will write an option on a particular security only if the Adviser believes that a liquid secondary market will exist on an exchange for options of the same series, which will permit the Fund to make a closing purchase transaction in order to close out its position.
During the year ended March 31, 2007, the Equity Income Fund had the following written option transactions:
| | | | | | | |
| Written Option Transactions | | Number of
Contracts | | | Premiums | |
Outstanding, beginning of year | | — | | | $ | — | |
Options written | | (1,000 | ) | | | (151,152 | ) |
Options expired | | — | | | | — | |
Options exercised | | — | | | | — | |
Options terminated in closing purchase transactions | | 1,000 | | | | 151,152 | |
| | | | | | | |
Outstanding, end of year | | — | | | $ | — | |
| | | | | | | |
91
During the year ended March 31, 2007, the Value and Restructuring Fund had the following written option transactions:
| | | | | | | |
| Written Option Transactions | | Number of
Contracts | | | Premiums | |
Outstanding, beginning of year | | (4,468 | ) | | $ | (1,760,972 | ) |
Options written | | (28,000 | ) | | | (7,314,498 | ) |
Options expired | | 4,468 | | | | 1,760,972 | |
Options exercised | | — | | | | — | |
Options terminated in closing purchase transactions | | 5,000 | | | | 636,240 | |
| | | | | | | |
Outstanding, end of year | | (23,000 | ) | | $ | (6,678,258 | ) |
| | | | | | | |
(d) Concentration of risks:
The Emerging Markets Fund, International Fund and Pacific/Asia Fund invest primarily in securities of companies that are located in or conduct a substantial amount of their business in foreign countries, including emerging market countries. Prices of securities in foreign markets generally, and emerging markets in particular, have historically been more volatile than prices in U.S. markets. Some countries in which the Funds may invest require government approval for the repatriation of investment income, capital or the proceeds of sales of securities by foreign investors. In addition, if there is deterioration in a country’s balance of payments or for other reasons, a country may impose temporary restrictions on foreign capital remittances abroad.
(e) Security transactions and investment income:
Security transactions are recorded on a trade date basis. Realized gains and losses on investments sold are recorded on the basis of identified cost. Interest income, adjusted for amortization of premiums and discounts on investments, is earned from settlement date and is recorded on the accrual basis. Dividend income is recorded on the ex-dividend date, except for certain dividends from foreign securities, which are recorded as soon as the Funds are informed of the dividend.
(f) Redemption in-kind:
In certain circumstances, the Funds may distribute portfolio securities rather than cash as payment for a redemption of a Funds shares (redemption in-kind). For financial reporting purposes, the Funds recognize a gain on the in-kind redemptions to the extent the value of the distributed securities on the date of redemption exceeds the cost of those securities; the Funds recognize a loss if cost exceeds value. Gains and losses realized on the redemptions in-kind are not recognized for tax purposes, and are reclassified from undistributed realized gain (losses) to paid-in capital. During the year ended March 31, 2007, the Mid Cap Value and Restructuring Fund realized $23,046,664 of net gains on $66,339,150 of redemptions in-kind.
(g) Repurchase agreements:
The Funds may enter into agreements with financial institutions deemed to be creditworthy by the investment adviser subject to the seller’s agreement to repurchase and the Funds’ agreement to
92
resell such securities at mutually agreed upon prices. The repurchase agreements are collateralized by U.S. Government obligations. The value of the collateral underlying the repurchase agreements will always be at least equal to the repurchase price, including any accrued interest earned on the repurchase agreement. If the counter-party defaults, and the fair value of the collateral declines, realization of the collateral by the Funds may be delayed or limited.
Default or bankruptcy of the seller may, however, expose the applicable Fund to possible delay in connection with the disposition of the securities or loss to the extent that proceeds from a sale of the underlying securities were less than the repurchase price under the agreement.
(h) TBA purchase commitments:
Certain Funds may enter into “TBA” (To Be Announced) purchase commitments to purchase securities for a fixed price at a future date, typically not exceeding 45 days. TBA purchase commitments may be considered securities in themselves, and involve risk of loss if the value of the security to be purchased declines prior to settlement date. The Funds must maintain liquid securities having a value not less than the purchase price (including accrued interest) for such purchase commitments. Unsettled TBA purchase commitments are valued at the current market value of the underlying securities, according to the procedures described under “Portfolio Valuation” above.
(i) Distributions to shareholders:
Dividends equal to all or substantially all of each Fund’s net investment income will be declared and paid as follows: for the Blended Equity Fund, Energy and Natural Resources Fund, Equity Opportunities Fund, Equity Income Fund, Large Cap Growth Fund, Mid Cap Value and Restructuring Fund, Real Estate Fund, Small Cap Fund and Value and Restructuring Fund, dividends will be declared and paid quarterly; and for the Emerging Markets Fund, International Fund and Pacific/Asia Fund, dividends will be declared and paid semiannually. Net realized capital gains, unless offset by any available capital loss carryforward, are distributed at least annually. Dividends and distributions are recorded on the ex-dividend date.
(j) Expense allocation:
Expenses directly attributable to a Fund are charged to that Fund. Other expenses are allocated to the respective Fund based on average daily net assets. Expenses attributable to a specific class of shares, such as shareholder servicing and distribution fees, are charged directly to that class.
(k) Borrowing:
The Funds may obtain temporary bank loans from banks and custodians to use for meeting shareholder redemptions or for temporary or emergency purposes. The board of trustees approved an agreement between Excelsior Fund and the Trust and their custodian, JPMorgan Chase Bank, N.A., under which the Funds may participate in an uncommitted line of credit in the aggregate principal amount of $150 million. The Funds pay interest on the amounts they borrow at negotiated rates based on the terms of the agreement. There was no borrowing from the line of credit for any Funds during the year ended March 31, 2007.
93
(l) Custody Credits:
Each Fund has an arrangement with its custodian bank under which the Fund receives a credit for its uninvested cash balance to offset its custody fees. The credit amounts (if any) are disclosed in the statement of operations as a reduction to the Fund’s operating expenses.
(m) New accounting standards:
In September 2006, the Financial Accounting Standards Board (FASB) issued Statement of Financial Accounting Standards No. 157, “Fair Value Measurements” (SFAS No. 157). SFAS No. 157 defines fair value, establishes a framework for measuring fair value in accordance with generally accepted accounting principles and expands disclosure about fair value measurements. SFAS No. 157 is effective for fiscal years beginning after November 15, 2007. Management is currently evaluating the impact the adoption of SFAS No. 157 will have on the Fund’s financial statements.
In July 2006, the FASB released FASB Interpretation No. 48 “Accounting for Uncertainty in Income Taxes” (“FIN 48”). FIN 48 provides guidance for how uncertain tax positions should be recognized, measured, presented and disclosed in the financial statements. FIN 48 requires the evaluation of tax positions taken or expected to be taken in the course of preparing the Fund’s tax return to determine whether the tax positions are “more-likely-than-not” of being sustained by the applicable tax authority. Tax positions not deemed to meet the more-likely-than-not threshold would be recorded as a tax benefit or expense in the period of determination. Adoption of FIN 48 is required no later than the last business day of the first financial statement reporting period for fiscal years beginning after December 15, 2006. A Fund with a fiscal year ending March 31 will implement FIN 48 no later than September 28, 2007, and it is to be applied to all open tax years as of the effective date. Management is currently evaluating the impact of the adoption of FIN 48 to the financial statements.
| 2. | Investment Advisory Fee, Administration Fee, Shareholder Servicing Fees and Related Party Transactions: |
The Funds are advised by U.S. Trust New York Asset Management Division (“NYAMD”), a separate identifiable division of United States Trust Company, National Association (“USTNA”), or UST Advisers, Inc. (“USTA” and together with NYAMD, the “Advisers”). USTA is a wholly-owned subsidiary of USTNA. USTNA is a wholly-owned subsidiary of U.S. Trust Corporation, a registered bank holding company, which, in turn, is a wholly-owned subsidiary of The Charles Schwab Corporation. For the services provided pursuant to the Investment Advisory Agreements, each Adviser receives a fee, computed daily and paid monthly, as follows:
| | | |
Blended Equity Fund | | 0.75 | % |
Energy and Natural Resources Fund | | 0.60 | % |
Equity Income Fund | | 0.75 | % |
Equity Opportunities Fund | | 0.75 | % |
Large Cap Growth Fund | | 0.75 | % |
Mid Cap Value and Restructuring Fund | | 0.65 | % |
Real Estate Fund | | 1.00 | % |
94
| | | |
Small Cap Fund | | 0.75 | % |
Value and Restructuring Fund | | 0.60 | % |
Emerging Markets Fund | | 1.25 | % |
International Fund | | 1.00 | % |
Pacific/Asia Fund | | 1.00 | % |
On November 20, 2006, The Charles Schwab Corporation (“Schwab”) announced an agreement to sell the U.S. Trust Corporation (“U.S. Trust”) a wholly-owned subsidiary of Schwab, to the Bank of America Corporation (the “Sale”). The Sale includes all of U.S. Trust’s subsidiaries, including USTA and USTNA. The completion of the Sale may result in the assignment of the current investment advisory agreements and termination in accordance with their terms. Therefore, the Board of Trustees/Directors approved the new investment advisory agreements at the same advisory fee rates disclosed above in January 2007 and Shareholders of each Fund approved the new agreements during meetings held in March and April 2007. It is anticipated that the sale will close early in the third quarter of 2007.
USTA and BISYS Fund Services, Ohio, Inc. (collectively, the “Administrators”) provide administrative services to the Funds. For the services provided to the Funds, the Administrators are entitled jointly to annual fees, computed daily and paid monthly, based on the combined aggregate average daily net assets of Excelsior Fund, Excelsior Tax-Exempt Funds, Inc. (“Excelsior Tax-Exempt Fund”) and the Trust (excluding the international equity portfolios of Excelsior Fund and the Trust), all of which are affiliated investment companies, as follows: 0.200% of the first $200 million, 0.175% of the next $200 million and 0.150% over $400 million. The Administrators are entitled jointly to annual fees, computed daily and paid monthly, at the annual rate of 0.20% of the average daily net assets of the Emerging Markets Fund, International Equity Fund, International Fund and Pacific/Asia Fund. Administration fees payable by each Fund of the Excelsior Fund, the Trust and Excelsior Tax-Exempt Fund are determined in proportion to the relative average daily net assets of the respective Fund for the period paid. For the year ended March 31, 2007, administration fees paid to USTA were as follows:
| | | |
| | | Administration
Fees paid to UST
Advisers, Inc. |
Blended Equity Fund | | $ | 589,980 |
Energy and Natural Resources Fund | | | 693,670 |
Equity Income Fund | | | 294,433 |
Equity Opportunities Fund | | | 334,488 |
Large Cap Growth Fund | | | 851,157 |
Mid Cap Value and Restructuring Fund | | | 395,738 |
Real Estate Fund | | | 183,791 |
Small Cap Fund | | | 835,832 |
Value and Restructuring Fund | | | 9,912,241 |
Emerging Markets Fund | | | 1,898,623 |
International Fund | | | 1,039,850 |
Pacific/Asia Fund | | | 415,692 |
BISYS Fund Services Ohio, Inc., waived Administration fees as presented on the Statements of Operations.
95
From time to time, in its sole discretion, each Adviser may undertake to waive a portion or all of the fees payable to it and may also reimburse the Funds for a portion of other expenses. For the year ended March 31, 2007, the Advisers have contractually agreed to waive investment advisory fees, through, at least, July 31, 2007, and to reimburse other operating expenses to the extent necessary to keep total operating expenses from exceeding the following annual percentages of each Fund’s average daily net assets:
| | | |
Blended Equity Fund — Shares | | 1.10 | % |
Energy and Natural Resources Fund — Shares | | 1.25 | % |
Equity Income Fund — Shares | | 1.10 | % |
Equity Opportunities Fund — Shares | | 1.05 | % |
Large Cap Growth Fund — Shares | | 1.20 | % |
Mid Cap Value and Restructuring Fund — Shares | | 1.14 | % |
Real Estate Fund — Shares | | 1.25 | % |
Small Cap Fund — Shares | | 1.25 | % |
Value and Restructuring Fund — Shares | | 1.14 | % |
Emerging Markets Fund — Shares | | 1.85 | % |
International Fund — Shares | | 1.50 | % |
Pacific/Asia Fund — Shares | | 1.65 | % |
Equity Opportunities Fund — Institutional Shares | | 0.80 | % |
Large Cap Growth Fund — Institutional Shares* | | 0.95 | % |
Mid Cap Value and Restructuring Fund — Institutional shares | | 0.89 | % |
Value and Restructuring Fund — Institutional Shares | | 0.89 | % |
Emerging Markets Fund — Institutional Shares | | 1.60 | % |
Equity Income Fund — Retirement Shares | | 1.60 | % |
Large Cap Growth Fund — Retirement shares | | 1.70 | % |
Mid Cap Value and Restructuring Fund — Retirement Shares | | 1.64 | % |
Small Cap Fund — Retirement Shares | | 1.75 | % |
Value and Restructuring Fund — Retirement Shares | | 1.64 | % |
| * | Large Cap Growth Fund — Institutional Shares commenced operations on November 9, 2006. |
For the year ended March 31, 2007, pursuant to the above, investment advisory fees waived by the Advisers were as follows:
| | | |
Blended Equity Fund | | $ | 482,548 |
Energy and Natural Resources Fund | | | — |
Equity Income Fund | | | 240,094 |
Equity Opportunities Fund | | | 475,587 |
Large Cap Growth Fund | | | 30,328 |
Mid Cap Value and Restructuring Fund | | | 3,989 |
Real Estate Fund | | | 376,465 |
Small Cap Fund | | | — |
Value and Restructuring Fund | | | — |
Emerging Markets Fund | | | 565,179 |
International Fund | | | 363,344 |
Pacific/Asia Fund | | | — |
96
The Funds have entered into shareholder servicing agreements with various service organizations, which include Charles Schwab & Co. Inc. (“CS & Co.”) and USTA. Services included in the servicing agreements include assistance in processing purchase, exchange and redemption requests; transmitting and receiving funds in connection with customer orders to purchase, exchange or redeem shares; and providing periodic statements. Shareholder servicing fees are incurred on a Fund or class level (where applicable). In consideration for these services, each service organization receives a fee from the Funds, computed daily and paid monthly, at an annual rate up to 0.25% of the average daily net assets of the Fund’s shares held by each service organization’s customers. The Advisers, out of their own resources, may additionally compensate certain organizations for providing these and other services.
For the year ended March 31, 2007, shareholder servicing fees paid to CS & Co. and USTA were as follows:
| | | |
Blended Equity Fund | | $ | 955,893 |
Energy and Natural Resources Fund | | | 730,100 |
Equity Income Fund | | | 526,446 |
Equity Opportunities Fund | | | 464,758 |
Large Cap Growth Fund | | | 1,426,385 |
Mid Cap Value and Restructuring Fund | | | 530,044 |
Real Estate Fund | | | 244,041 |
Small Cap Fund | | | 1,357,921 |
Value and Restructuring Fund | | | 9,637,460 |
Emerging Markets Fund | | | 1,705,286 |
International Fund | | | 1,252,118 |
Pacific/Asia Fund | | | 514,303 |
BISYS Fund Services Limited Partnership (the “Distributor”), serves as the Distributor of the Funds. Shares of each Fund are sold without a sales charge on a continuous basis by the Distributor.
Certain Funds have adopted a Distribution Plan pursuant to Rule 12b-1 under the 1940 Act, under which they may compensate the Distributor monthly for its services that are intended to result in the sale of Fund Shares (in the case of Mid Cap Value and Restructuring Fund) or Retirement Shares (in the case of Equity Income Fund, Large Cap Growth Fund, Mid Cap Value and Restructuring Fund, Small Cap Fund and Value and Restructuring Fund), in an amount not to exceed the annual rate of 0.25% or 0.50%, respectively, of the average daily net asset value of such Fund’s Shares or Retirement Shares. For the year ended March 31, 2007, fees paid for Retirement Shares of the Equity Income Fund, Large Cap Growth Fund, Mid Cap Value and Restructuring Fund, Small Cap Fund and Value and Restructuring Fund were $5, $8, $480, $1,538 and $6,926, respectively.
The board of trustees/directors may include people who are officers and/or trustees of other fund families affiliated to the investment adviser. Federal securities law limits the percentage of the “interested persons” who may serve on a trust’s board, and the Funds are in compliance with these limitations. The funds did not pay any of the interested persons for their service as trustees/directors, but did pay non-interested persons (independent trustees), as noted in each fund’s Statement of Operations.
97
| 3. | Purchases, Sales and Maturities of Securities: |
For the year ended March 31, 2007, purchases, sales and maturities of securities for the Funds, excluding short-term investments and written options transactions, aggregated:
| | | | | | |
| | | Purchases* | | Sales and
Maturities* |
Blended Equity Fund | | $ | 41,251,543 | | $ | 138,568,105 |
Energy and Natural Resources Fund | | | 1,377,166,299 | | | 1,453,159,118 |
Equity Income Fund | | | 64,891,652 | | | 59,073,738 |
Equity Opportunities Fund | | | 144,444,173 | | | 25,938,491 |
Large Cap Growth Fund | | | 346,922,787 | | | 198,866,947 |
Mid Cap Value and Restructuring Fund | | | 74,873,791 | | | 113,235,162 |
Real Estate Fund | | | 54,008,528 | | | 50,207,674 |
Small Cap Fund | | | 362,658,964 | | | 318,273,911 |
Value and Restructuring Fund | | | 1,940,746,100 | | | 930,382,978 |
Emerging Markets Fund | | | 153,446,034 | | | 156,632,161 |
International Fund | | | 180,795,134 | | | 154,588,628 |
Pacific/Asia Fund | | | 203,769,287 | | | 242,711,553 |
| * | There were no purchases or sales of U.S. government securities during the year ended March 31, 2007. |
It is the policy of Excelsior Fund and the Trust that each Fund continue to qualify as a regulated investment company, by complying with the requirements of the Internal Revenue Code applicable to regulated investment companies, and by distributing substantially all of its taxable earnings to its shareholders.
In order to avoid a federal excise tax, each Fund is required to distribute certain minimum amounts of net realized capital gain and net investment income for the respective twelve-month periods ending October 31 and December 31 each calendar year.
Net realized gains of the Funds derived in certain countries are subject to certain foreign taxation.
Dividends and distributions are determined in accordance with federal income tax regulations and may differ from accounting principles generally accepted in the United States of America. These differences are primarily due to differing treatments for net operating losses, foreign currency transactions, passive foreign investment companies, partnership income, deferral of losses on wash sales, dividends received from real estate investment trusts, and net capital losses and net currency losses incurred after October 31 through the end of the fiscal year (“Post-October losses”). To the extent these differences are permanent in nature, such amounts are reclassified within the composition of net assets based on their federal tax-basis treatment; temporary differences do not require reclassification.
98
Accordingly, the following reclassifications, as of March 31, 2007, were made to/from the following accounts:
| | | | | | | | | | | | |
| | | Undistributed
Net Investment
Income | | | Accumulated
Net Realized
Gain (Loss) | | | Paid-In-Capital | |
Blended Equity Fund | | $ | 60,772 | | | $ | 440 | | | $ | (61,212 | ) |
Energy and Natural Resources Fund | | | 7,278 | | | | — | | | | (7,278 | ) |
Equity Income Fund | | | (24,869 | ) | | | 24,869 | | | | — | |
Equity Opportunities Fund | | | (3,821 | ) | | | 3,821 | | | | — | |
Large Cap Growth Fund | | | 4,255,930 | | | | — | | | | (4,255,930 | ) |
Mid Cap Value and Restructuring Fund | | | 3,107 | | | | (23,048,108 | ) | | | 23,045,001 | |
Real Estate Fund* | | | 1,232,881 | | | | (414,908 | ) | | | (817,973 | ) |
Small Cap Fund | | | 4,043,832 | | | | — | | | | (4,043,832 | ) |
Value and Restructuring Fund | | | (1,075,614 | ) | | | 1,078,111 | | | | (2,497 | ) |
Emerging Markets Fund | | | (142,875 | ) | | | 142,873 | | | | 2 | |
International Fund | | | (6,358 | ) | | | 6,358 | | | | — | |
Pacific / Asia Fund | | | 572,269 | | | | (572,269 | ) | | | — | |
| * | The Real Estate Fund has a tax year end of June 30. |
The tax character of dividends and distributions declared during the years ended March 31, 2007 and March 31, 2006 were as follows:
| | | | | | | | | | | | |
| | | Ordinary
Income | | Long-Term
Capital Gain | | Return
of Capital | | Total* |
Blended Equity Fund | | | | | | | | | | | | |
Year ended March 31, 2007 | | $ | 3,124,137 | | $ | 61,776,418 | | | — | | $ | 64,900,555 |
Year ended March 31, 2006 | | | 6,255,308 | | | 28,392,715 | | | — | | | 34,648,023 |
Energy and Natural Resources Fund | | | | | | | | | | | | |
Year ended March 31, 2007 | | | 39,548,106 | | | 58,470,040 | | | — | | | 98,018,146 |
Year ended March 31, 2006 | | | 44,558,560 | | | 41,586,671 | | | — | | | 86,145,231 |
Equity Income Fund | | | | | | | | | | | | |
Year ended March 31, 2007 | | | 4,109,901 | | | — | | | — | | | 4,109,901 |
Year ended March 31, 2006 | | | 5,332,967 | | | — | | | — | | | 5,332,967 |
Equity Opportunities Fund | | | | | | | | | | | | |
Year ended March 31, 2007 | | | 1,277,288 | | | — | | | — | | | 1,277,288 |
Year ended March 31, 2006 | | | 574,501 | | | — | | | — | | | 574,501 |
Large Cap Growth Fund | | | | | | | | | | | | |
Year ended March 31, 2007 | | | — | | | — | | | — | | | — |
Year ended March 31, 2006 | | | — | | | — | | | — | | | — |
Mid Cap Value and Restructuring Fund | | | | | | | | | | | | |
Year ended March 31, 2007 | | | 97,283 | | | 7,547 | | | — | | | 104,830 |
Year ended March 31, 2006 | | | 675,482 | | | — | | $ | 22,939 | | | 698,421 |
Real Estate Fund | | | | | | | | | | | | |
Year ended March 31, 2007 | | | 950,031 | | | 18,297,188 | | | 817,973 | | | 20,065,192 |
Year ended March 31, 2006 | | | 1,544,111 | | | 9,654,009 | | | 654,882 | | | 11,853,002 |
Small Cap Fund | | | | | | | | | | | | |
Year ended March 31, 2007 | | | 2,271,022 | | | 41,311,258 | | | — | | | 43,582,280 |
Year ended March 31, 2006 | | | — | | | 26,879,147 | | | — | | | 26,879,147 |
99
| | | | | | | | | | | |
| | | Ordinary
Income | | Long-Term
Capital Gain | | Return
of Capital | | Total* |
Value and Restructuring Fund | | | | | | | | | | | |
Year ended March 31, 2007 | | $ | 67,856,329 | | | — | | — | | $ | 67,856,329 |
Year ended March 31, 2006 | | | 52,525,603 | | | — | | — | | | 52,525,603 |
Emerging Markets Fund | | | | | | | | | | | |
Year ended March 31, 2007 | | | 7,542,032 | | $ | 51,557,835 | | — | | | 59,099,867 |
Year ended March 31, 2006 | | | 5,914,106 | | | — | | — | | | 5,914,106 |
International Fund | | | | | | | | | | | |
Year ended March 31, 2007 | | | 2,551,050 | | | — | | — | | | 2,551,050 |
Year ended March 31, 2006 | | | 2,396,031 | | | — | | — | | | 2,396,031 |
Pacific/Asia Fund | | | | | | | | | | | |
Year ended March 31, 2007 | | | — | | | 7,507,933 | | — | | | 7,507,933 |
Year ended March 31, 2006 | | | 1,686,498 | | | — | | — | | | 1,686,498 |
| * | The total distributions paid may differ from the Statement of Changes in Net Assets because for tax purposes, dividends are recognized when actually paid. |
As of March 31, 2007 (except for Real Estate Fund which is as of June 30, 2006), the components of distributable earnings (accumulated losses) on a tax basis were as follows:
| | | | | | | | | | | | | | | | | |
| | | Undistributed
Ordinary
Income | | Undistributed
Long-Term
Capital Gain | | Accumulated
Capital and
Other Losses | | | Unrealized
Appreciation
(Depreciation) | | Total
Accumulated
Earnings/
(Deficit) | |
Blended Equity Fund | | $ | 2,177,419 | | $ | 28,873,282 | | | — | | | $ | 183,479,242 | | $ | 214,529,943 | |
Energy and Natural Resources Fund | | | 25,942,703 | | | 5,914,104 | | | — | | | | 49,203,236 | | | 81,060,043 | |
Equity Income Fund | | | 1,088,747 | | | 884,717 | | | — | | | | 40,922,443 | | | 42,895,907 | |
Equity Opportunities Fund | | | 604,832 | | | — | | $ | (3,994,207 | ) | | | 55,567,607 | | | 52,178,232 | |
Large Cap Growth Fund | | | — | | | — | | | (124,103,097 | ) | | | 123,954,093 | | | (149,004 | ) |
Mid Cap Value and Restructuring Fund | | | 3,066,218 | | | 6,619,753 | | | — | | | | 115,014,431 | | | 124,700,402 | |
Real Estate Fund(1) | | | 2,382,464 | | | 3,734,876 | | | — | | | | 52,564,605 | | | 58,681,945 | |
Small Cap Fund | | | — | | | 8,347,130 | | | — | | | | 208,077,379 | | | 216,424,509 | |
Value and Restructuring Fund | | | 19,173,059 | | | — | | | (48,831,557 | ) | | | 2,754,129,333 | | | 2,724,470,835 | |
Emerging Markets Fund | | | 163,806 | | | 4,133,434 | | | (1,283,992 | ) | | | 400,039,421 | | | 403,052,669 | |
International Fund | | | 300,494 | | | — | | | (56,371,355 | ) | | | 155,410,121 | | | 99,339,260 | |
Pacific/Asia Fund | | | 5,610,721 | | | 13,232,198 | | | — | | | | 26,187,552 | | | 45,030,471 | |
| (1) | The components of distributable earnings for the Real Estate Fund are estimated at March 31, 2007. The actual amounts to be distributed will not be determined until June 30, 2007, when the portfolio completes its tax year end. |
Post-October losses are deemed to arise on the first business day of a Fund’s next taxable year. As of March 31, 2007, the Equity Opportunities Fund and Value and Restructuring Fund deferred, on a tax basis, post-October losses of $920,049 and $1,537,981, respectively.
100
For federal income tax purposes, capital loss carryforwards may be carried forward and applied against future capital gains. To the extent that such carryforwards are utilized, capital gains distributions will be reduced. At March 31, 2007, the following Funds had capital loss carryforwards available to offset future net capital gains through the indicated expiration dates:
| | | | | | | | | | | | | | | | | | | | | |
| | | Expires |
| | | 2010 | | 2011 | | 2012 | | 2013 | | 2014 | | 2015 | | Total |
Equity Opportunities Fund | | | — | | | — | | | — | | | — | | $ | 880,333 | | $ | 2,193,825 | | $ | 3,074,158 |
Large Cap Growth Fund | | $ | 18,217,588 | | $ | 83,374,895 | | $ | 22,030,449 | | $ | 480,165 | | | — | | | — | | | 124,103,097 |
Value and Restructuring Fund | | | — | | | 19,930,042 | | | 27,363,534 | | | — | | | — | | | — | | | 47,293,576 |
Emerging Markets Fund | | | — | | | — | | | 1,247,253 | | | — | | | 36,739 | | | — | | | 1,283,992 |
International Fund | | | — | | | 41,230,170 | | | 15,141,185 | | | — | | | — | | | — | | | 56,371,355 |
At March 31, 2007, aggregate gross unrealized appreciation for all securities for which there was an excess of value over estimated tax cost and aggregate gross unrealized depreciation for all securities for which there was an excess of estimated tax cost over value is as follows:
| | | | | | | | | | | | | | |
| | | Federal
Tax
Cost | | Tax Basis
Unrealized
Appreciation | | | Tax Basis
Unrealized
(Depreciation) | | | Net
Unrealized
Appreciation |
Blended Equity Fund | | $ | 217,420,600 | | $ | 185,732,555 | | | $ | (2,253,948 | ) | | $ | 183,478,607 |
Energy and Natural Resources Fund | | | 455,510,724 | | | (53,695,811 | ) | | | (4,492,575 | ) | | | 49,203,236 |
Equity Income Fund | | | 195,179,846 | | | 42,742,397 | | | | (1,820,088 | ) | | | 40,922,309 |
Equity Opportunities Fund | | | 282,667,509 | | | 61,863,632 | | | | (6,296,602 | ) | | | 55,567,030 |
Large Cap Growth Fund | | | 610,313,025 | | | 150,431,767 | | | | (26,477,674 | ) | | | 123,954,093 |
Mid Cap Value and Restructuring Fund | | | 211,902,432 | | | 123,240,542 | | | | (8,226,111 | ) | | | 115,014,431 |
Real Estate Fund | | | 99,587,082 | | | 53,753,123 | | | | (1,188,518 | ) | | | 52,564,605 |
Small Cap Fund | | | 490,771,821 | | | 213,733,622 | | | | (5,656,243 | ) | | | 208,077,379 |
Value and Restructuring Fund | | | 5,383,591,798 | | | 2,919,161,151 | | | | (167,868,357 | ) | | | 2,751,292,794 |
Emerging Markets Fund | | | 733,105,953 | | | 422,523,941 | | | | (22,515,838 | ) | | | 400,008,103 |
International Fund | | | 485,599,739 | | | 163,788,088 | | | | (8,399,764 | ) | | | 155,388,324 |
Pacific/Asia Fund | | | 181,886,730 | | | 32,072,384 | | | | (5,894,065 | ) | | | 26,178,319 |
Excelsior Fund has authorized capital of 35 billion shares of Common Stock, 29.3756 billion of which is currently classified to represent interests in certain classes of shares. Authorized capital currently offered for each Fund is as follows: 2.25 billion shares of the Blended Equity Fund; 1.5 billion shares of the Value and Restructuring Fund; 1 billion shares each of the Energy and Natural Resources Fund, Large Cap Growth Fund, Small Cap Fund and Pacific/Asia Fund; 875 million shares of the International Fund; and 500 million shares each of Real Estate Fund and Emerging Markets Fund. Each share has a par value of $0.001 and represents an equal proportionate interest in the particular Fund with other shares of the same Fund, and is entitled to such dividends and distributions of taxable earnings on the assets belonging to such Fund as are declared at the discretion of Excelsior Fund’s Board of Directors.
The Trust has authorized an unlimited number of shares of beneficial interest of each class of each Fund. Each share has a par value of $0.00001 and represents an equal proportionate interest in the
101
particular Fund with other shares of the same Fund, and is entitled to such dividends and distributions of taxable earnings on the assets belonging to such Fund as are declared at the discretion of the Trust’s Board of Trustees.
A redemption fee of 2% of the value of the shares redeemed or exchanged is imposed on shares of the Emerging Markets Fund, International Fund and Pacific/Asia Fund redeemed or exchanged 30 days or less after their date of purchase.
On shares purchased on or after October 16, 2006, a redemption fee of 2% of the value of the shares redeemed or exchanged was imposed on shares of the Blended Equity Fund, Energy and Natural Resources Fund, Equity Income Fund, Equity Opportunities Fund, Large Cap Growth Fund, Mid Cap Value and Restructuring Fund, Real Estate Fund, Small Cap Fund and Value and Restructuring Fund redeemed or exchanged 30 days or less after their date of purchase. The redemption fee is intended to limit short-term trading in the Fund.
| | | | | | | | | | | | | | |
| | | Blended Equity Fund | |
| | | Year Ended
03/31/07 | | | Year Ended
03/31/06 | |
| | | Shares | | | Amounts | | | Shares | | | Amounts | |
Sold: | | | | | | | | | | | | | | |
Shares | | 756,712 | | | $ | 27,714,455 | | | 1,870,587 | | | $ | 68,518,652 | |
Issued as reinvestment of dividends: | | | | | | | | | | | | | | |
Shares | | 748,017 | | | | 26,093,797 | | | 347,955 | | | | 12,334,603 | |
Redeemed: | | | | | | | | | | | | | | |
Shares | | (2,516,153 | ) | | | (92,450,787 | ) | | (2,792,336 | ) | | | (101,458,144 | ) |
Redemption fee | | — | | | | 708 | | | — | | | | — | |
| | | | | | | | | | | | | | |
Net Increase (Decrease) | | (1,011,424 | ) | | $ | (38,641,827 | ) | | (573,794 | ) | | $ | (20,604,889 | ) |
| | | | | | | | | | | | | | |
| |
| | | Energy and Natural Resources Fund | |
| | | Year Ended
03/31/07 | | | Year Ended
03/31/06 | |
| | | Shares | | | Amounts | | | Shares | | | Amounts | |
Sold: | | | | | | | | | | | | | | |
Shares | | 7,858,261 | | | $ | 196,905,145 | | | 11,735,419 | | | $ | 298,534,628 | |
Issued as reinvestment of dividends: | | | | | | | | | | | | | | |
Shares | | 3,247,628 | | | | 72,274,154 | | | 2,467,953 | | | | 61,748,177 | |
Redeemed: | | | | | | | | | | | | | | |
Shares | | (9,844,958 | ) | | | (240,193,110 | ) | | (7,186,594 | ) | | | (180,363,041 | ) |
Redemption fee | | — | | | | 3,316 | | | — | | | | — | |
| | | | | | | | | | | | | | |
Net Increase (Decrease) | | 1,260,931 | | | $ | 28,989,505 | | | 7,016,778 | | | $ | 179,919,764 | |
| | | | | | | | | | | | | | |
102
| | | | | | | | | | | | | | |
| | | Equity Income Fund | |
| | | Year Ended
03/31/07 | | | Year Ended
03/31/06 | |
| | | Shares | | | Amounts | | | Shares | | | Amounts | |
Sold: | | | | | | | | | | | | | | |
Shares | | 4,666,621 | | | $ | 41,851,327 | | | 8,070,602 | | | $ | 67,137,307 | |
Subscription-in-kind | | 526,198 | | | | 4,483,204 | | | — | | | | — | |
Retirement Shares | | — | | | | — | | | — | | | | — | |
Issued as reinvestment of dividends: | | | | | | | | | | | | | | |
Shares | | 77,298 | | | | 675,808 | | | 115,326 | | | | 946,155 | |
Retirement Shares | | 1 | | | | 15 | | | 3 | | | | 21 | |
Redeemed: | | | | | | | | | | | | | | |
Shares | | (4,395,745 | ) | | | (38,945,714 | ) | | (7,466,868 | ) | | | (62,372,729 | ) |
Retirement Shares | | — | | | | — | | | (20 | ) | | | (159 | ) |
Redemption fee | | — | | | | 70 | | | — | | | | — | |
| | | | | | | | | | | | | | |
Net Increase (Decrease) | | 874,373 | | | $ | 8,064,710 | | | 719,043 | | | $ | 5,710,595 | |
| | | | | | | | | | | | | | |
| |
| | | Equity Opportunities Fund | |
| | | Year Ended
03/31/07 | | | Year Ended
03/31/06 | |
| | | Shares | | | Amounts | | | Shares | | | Amounts | |
Sold: | | | | | | | | | | | | | | |
Shares | | 11,404,243 | | | $ | 151,491,788 | | | 7,067,834 | | | $ | 81,801,143 | |
Institutional Shares | | 944,747 | | | | 12,184,733 | | | 682,540 | | | | 8,048,568 | |
Issued as reinvestment of dividends: | | | | | | | | | | | | | | |
Shares | | 12,057 | | | | 154,087 | | | 5,937 | | | | 66,688 | |
Institutional Shares | | 3,799 | | | | 48,632 | | | 4,259 | | | | 47,760 | |
Redeemed: | | | | | | | | | | | | | | |
Shares | | (2,227,805 | ) | | | (29,659,176 | ) | | (618,831 | ) | | | (7,153,110 | ) |
Institutional Shares | | (992,875 | ) | | | (13,081,976 | ) | | (1,305,561 | ) | | | (14,932,301 | ) |
Redemption fee | | — | | | | 9,635 | | | — | | | | — | |
| | | | | | | | | | | | | | |
Net Increase (Decrease) | | 9,144,166 | | | $ | 121,147,723 | | | 5,836,178 | | | $ | 67,878,748 | |
| | | | | | | | | | | | | | |
| |
| | | Large Cap Growth Fund | |
| | | Year Ended
03/31/07 | | | Year Ended
03/31/06 | |
| | | Shares | | | Amounts | | | Shares | | | Amounts | |
Sold: | | | | | | | | | | | | | | |
Shares | | 26,983,018 | | | $ | 268,887,660 | | | 33,887,361 | | | $ | 319,718,556 | |
Institutional shares | | 1,518,333 | | | | 15,997,075 | | | — | | | | — | |
Retirement Shares | | 172 | | | | 1,807 | | | — | | | | — | |
Issued as reinvestment of dividends: | | | | | | | | | | | | | | |
Shares | | — | | | | — | | | — | | | | — | |
Institutional shares | | — | | | | — | | | — | | | | — | |
Retirement Shares | | — | | | | — | | | — | | | | — | |
Redeemed: | | | | | | | | | | | | | | |
Shares | | (14,969,954 | ) | | | (147,806,621 | ) | | (4,286,908 | ) | | | (38,557,547 | ) |
Institutional shares | | (10,095 | ) | | | (106,750 | ) | | — | | | | — | |
Retirement Shares | | — | | | | — | | | (20 | ) | | | (161 | ) |
Redemption fee | | — | | | | 9,835 | | | — | | | | — | |
| | | | | | | | | | | | | | |
Net Increase (Decrease) | | 13,521,474 | | | $ | 136,983,006 | | | 29,600,433 | | | $ | 281,160,848 | |
| | | | | | | | | | | | | | |
103
| | | | | | | | | | | | | | |
| | | Mid Cap Value and Restructuring Fund | |
| | | Year Ended
03/31/07 | | | Year Ended
03/31/06 | |
| | | Shares | | | Amounts | | | Shares | | | Amounts | |
Sold: | | | | | | | | | | | | | | |
Shares | | 3,915,673 | | | $ | 81,532,520 | | | 2,206,027 | | | $ | 39,222,163 | |
Institutional Shares | | 174,817 | | | | 3,499,002 | | | 1,449,107 | | | | 26,024,928 | |
Retirement Shares | | 51,153 | | | | 1,086,065 | | | — | | | | — | |
Issued as reinvestment of dividends: | | | | | | | | | | | | | | |
Shares | | 1,544 | | | | 28,679 | | | 8,110 | | | | 140,000 | |
Institutional Shares | | 211 | | | | 3,893 | | | 12,203 | | | | 211,487 | |
Retirement Shares | | — | | | | — | | | — | | | | — | |
Redeemed: | | | | | | | | | | | | | | |
Shares | | (2,387,520 | ) | | | (47,782,321 | ) | | (2,927,490 | ) | | | (51,792,912 | ) |
Institutional Shares | | (435,896 | ) | | | (8,797,430 | ) | | (1,134,926 | ) | | | (20,164,758 | ) |
Redemption-in-kind | | (3,464,185 | ) | | | (66,339,150 | ) | | — | | | | — | |
Retirement Shares | | (118 | ) | | | (2,475 | ) | | (10 | ) | | | (162 | ) |
Redemption fee | | — | | | | 1,778 | | | — | | | | — | |
| | | | | | | | | | | | | | |
Net Increase (Decrease) | | (2,144,321 | ) | | $ | (36,769,439 | ) | | (386,979 | ) | | $ | (6,359,254 | ) |
| | | | | | | | | | | | | | |
| |
| | | Real Estate Fund | |
| | | Year Ended
03/31/07 | | | Year Ended
03/31/06 | |
| | | Shares | | | Amounts | | | Shares | | | Amounts | |
Sold: | | | | | | | | | | | | | | |
Shares | | 6,066,112 | | | $ | 67,240,470 | | | 2,543,667 | | | $ | 26,383,102 | |
Issued as reinvestment of dividends: | | | | | | | | | | | | | | |
Shares | | 910,832 | | | | 9,232,819 | | | 503,603 | | | | 5,093,280 | |
Redeemed: | | | | | | | | | | | | | | |
Shares | | (4,921,193 | ) | | | (54,217,167 | ) | | (4,046,632 | ) | | | (41,844,650 | ) |
Redemption fee | | — | | | | 5,256 | | | — | | | | — | |
| | | | | | | | | | | | | | |
Net Increase (Decrease) | | 2,055,751 | | | $ | 22,261,378 | | | (999,362 | ) | | $ | (10,368,268 | ) |
| | | | | | | | | | | | | | |
| |
| | | Small Cap Fund | |
| | | Year Ended
03/31/07 | | | Year Ended
03/31/06 | |
| | | Shares | | | Amounts | | | Shares | | | Amounts | |
Sold: | | | | | | | | | | | | | | |
Shares | | 11,007,156 | | | $ | 202,519,992 | | | 7,764,353 | | | $ | 131,311,856 | |
Retirement Shares | | 100,714 | | | | 1,845,960 | | | — | | | | — | |
Issued as reinvestment of dividends: | | | | | | | | | | | | | | |
Shares | | 873,688 | | | | 15,909,286 | | | 431,637 | | | | 7,363,728 | |
Retirement Shares | | 211 | | | | 3,801 | | | 3 | | | | 53 | |
Redeemed: | | | | | | | | | | | | | | |
Shares | | (6,873,489 | ) | | | (126,011,173 | ) | | (7,277,592 | ) | | | (122,756,430 | ) |
Retirement Shares | | (4,702 | ) | | | (85,527 | ) | | (10 | ) | | | (153 | ) |
Redemption fee | | — | | | | 2,829 | | | — | | | | — | |
| | | | | | | | | | | | | | |
Net Increase (Decrease) | | 5,103,578 | | | $ | 94,185,168 | | | 918,391 | | | $ | 15,919,054 | |
| | | | | | | | | | | | | | |
104
| | | | | | | | | | | | | | |
| | | Value and Restructuring Fund | |
| | | Year Ended
03/31/07 | | | Year Ended
03/31/06 | |
| | | Shares | | | Amounts | | | Shares | | | Amounts | |
Sold: | | | | | | | | | | | | | | |
Shares | | 40,342,962 | | | $ | 2,018,418,152 | | | 42,481,646 | | | $ | 1,944,842,088 | |
Institutional Shares | | 2,608,744 | | | | 127,478,205 | | | 1,588,442 | | | | 71,855,109 | |
Retirement Shares | | 62,302 | | | | 3,214,887 | | | 18,213 | | | | 867,236 | |
Issued as reinvestment of dividends: | | | | | | | | | | | | | | |
Shares | | 1,056,240 | | | | 51,956,233 | | | 922,183 | | | | 40,504,847 | |
Institutional Shares | | 59,732 | | | | 2,938,434 | | | 45,241 | | | | 1,988,952 | |
Retirement Shares | | 99 | | | | 4,928 | | | 26 | | | | 1,182 | |
Redeemed: | | | | | | | | | | | | | | |
Shares | | (24,661,734 | ) | | | (1,238,518,628 | ) | | (25,114,636 | ) | | | (1,109,338,591 | ) |
Institutional Shares | | (921,391 | ) | | | (45,845,721 | ) | | (450,627 | ) | | | (20,187,467 | ) |
Retirement Shares | | (26,673 | ) | | | (1,242,118 | ) | | (115 | ) | | | (5,554 | ) |
Redemption fee | | — | | | | 29,376 | | | — | | | | — | |
| | | | | | | | | | | | | | |
Net Increase (Decrease) | | 18,520,281 | | | $ | 918,433,748 | | | 19,490,373 | | | $ | 930,527,802 | |
| | | | | | | | | | | | | | |
| |
| | | Emerging Markets Fund | |
| | | Year Ended
03/31/07 | | | Year Ended
03/31/06 | |
| | | Shares | | | Amounts | | | Shares | | | Amounts | |
Sold: | | | | | | | | | | | | | | |
Shares | | 28,426,163 | | | $ | 377,247,582 | | | 42,050,024 | | | $ | 456,622,978 | |
Institutional Shares | | 889,054 | | | | 12,242,049 | | | 2,017,803 | | | | 17,803,340 | |
Issued as reinvestment of dividends: | | | | | | | | | | | | | | |
Shares | | 2,899,020 | | | | 39,144,568 | | | 386,361 | | | | 3,758,608 | |
Institutional Shares | | 104,377 | | | | 1,425,589 | | | 232 | | | | 2,572 | |
Redeemed: | | | | | | | | | | | | | | |
Shares | | (32,751,548 | ) | | | (412,372,175 | ) | | (12,959,098 | ) | | | (132,393,423 | ) |
Institutional Shares | | (35,905 | ) | | | (493,380 | ) | | (1,171 | ) | | | (11,586 | ) |
Redemption fee | | — | | | | 104,327 | | | — | | | | 3,940 | |
| | | | | | | | | | | | | | |
Net Increase (Decrease) | | (468,839 | ) | | $ | 17,298,560 | | | 31,494,151 | | | $ | 345,786,429 | |
| | | | | | | | | | | | | | |
| |
| | | International Fund | |
| | | Year Ended
03/31/07 | | | Year Ended
03/31/06 | |
| | | Shares | | | Amounts | | | Shares | | | Amounts | |
Sold: | | | | | | | | | | | | | | |
Shares | | 12,392,725 | | | $ | 216,269,580 | | | 18,984,322 | | | $ | 280,689,209 | |
Issued as reinvestment of dividends: | | | | | | | | | | | | | | |
Shares | | 53,302 | | | | 824,056 | | | 55,479 | | | | 722,890 | |
Redeemed: | | | | | | | | | | | | | | |
Shares | | (10,667,987 | ) | | | (182,002,787 | ) | | (5,816,678 | ) | | | (82,366,546 | ) |
Redemption fee | | — | | | | 52,449 | | | — | | | | 14,016 | |
| | | | | | | | | | | | | | |
Net Increase (Decrease) | | 1,778,040 | | | $ | 35,143,298 | | | 13,223,123 | | | $ | 199,059,569 | |
| | | | | | | | | | | | | | |
105
| | | | | | | | | | | | | | |
| | | Pacific/Asia Fund | |
| | | Year Ended
03/31/07 | | | Year Ended
03/31/06 | |
| | | Shares | | | Amounts | | | Shares | | | Amounts | |
Sold: | | | | | | | | | | | | | | |
Shares | | 3,211,949 | | | $ | 36,092,669 | | | 9,073,692 | | | $ | 91,473,426 | |
Issued as reinvestment of dividends: | | | | | | | | | | | | | | |
Shares | | 244,088 | | | | 2,750,870 | | | 64,603 | | | | 565,926 | |
Redeemed: | | | | | | | | | | | | | | |
Shares | | (6,281,359 | ) | | | (69,083,541 | ) | | (3,276,867 | ) | | | (32,167,866 | ) |
Redemption fee | | — | | | | 30,100 | | | — | | | | 2,893 | |
| | | | | | | | | | | | | | |
Net Increase (Decrease) | | (2,825,322 | ) | | $ | (30,209,902 | ) | | 5,861,428 | | | $ | 59,874,379 | |
| | | | | | | | | | | | | | |
In the normal course of business, the Funds enter into contracts that provide general indemnifications. The Funds’ maximum exposure under these arrangements is dependent on future claims that may be made against the Funds and, therefore, cannot be established; however, based on experience, the risk of loss from such claims is considered remote.
United States Trust Company of New York and U.S. Trust Company, N.A. (formerly, co-investment advisers to the Funds, together referred to herein as “U.S. Trust”), Excelsior Funds, Excelsior Tax-Exempt Funds and Trust (the “Companies”), U.S. Trust, Schwab and several individuals and third parties were named in four fund shareholder class actions and two derivative actions which alleged that U.S. Trust, the Companies, and others allowed certain parties to engage in illegal and improper mutual fund trading practices, which allegedly caused financial injury to the shareholders of certain of the Funds advised by U.S. Trust. Each seeks unspecified monetary damages and related equitable relief.
The class and derivative actions described above were transferred to the United States District Court for the District of Maryland for coordinated and consolidated pre-trial proceedings. In November 2005, the Maryland court dismissed many of the plaintiffs’ claims in both the class and derivative actions. The court entered implementing orders on February 24, 2006. All claims against the Companies have been dismissed. Plaintiffs’ claims against U.S. Trust and certain individuals under Sections 10(b) and 20(a) of the Securities Exchange Act and Sections 36(b) and 48(a) of the Investment Company Act, however, have not been dismissed. Plaintiffs’ Section 48(a) claims against parent entities U.S. Trust and Schwab also remain.
While the ultimate outcome of these matters cannot be predicted with any certainty at this time, based on currently available information, U.S. Trust believes that the likelihood is remote that the pending litigation will have a material adverse financial impact on the Companies, or materially affect U.S. Trust’s ability to provide investment management services to the Companies.
106
REPORT OF INDEPENDENT REGISTERED PUBLIC ACCOUNTING FIRM
To the Board of Directors/Trustees and Shareholders of
Excelsior Funds, Inc. and Excelsior Funds Trust
In our opinion, the accompanying statements of assets and liabilities, including the portfolios of investments, and the related statements of operations and of changes in net assets and the financial highlights present fairly, in all material respects, the financial position of the Blended Equity Fund, Energy and Natural Resources Fund, Equity Income Fund, Equity Opportunities Fund, Large Cap Growth Fund, Mid Cap Value and Restructuring Fund, Real Estate Fund, Small Cap Fund, Value and Restructuring Fund, Emerging Markets Fund, International Fund and Pacific/Asia Fund (nine portfolios of Excelsior Funds, Inc. and three portfolios of Excelsior Funds Trust, hereafter referred to as the “Funds”) at March 31, 2007, and the results of each of their operations, the changes in each of their net assets and the financial highlights for the year then ended, in conformity with accounting principles generally accepted in the United States of America. These financial statements and financial highlights (hereafter referred to as “financial statements”) are the responsibility of the Funds’ management; our responsibility is to express an opinion on these financial statements based on our audit. We conducted our audit of these financial statements in accordance with the standards of the Public Company Accounting Oversight Board (United States). Those standards require that we plan and perform the audit to obtain reasonable assurance about whether the financial statements are free of material misstatement. An audit includes examining, on a test basis, evidence supporting the amounts and disclosures in the financial statements, assessing the accounting principles used and significant estimates made by management, and evaluating the overall financial statement presentation. We believe that our audit, which included confirmation of securities at March 31, 2007 by correspondence with the custodian and brokers, provides a reasonable basis for our opinion. The statements of changes in net assets and financial highlights of the Funds for each of the years in the period ended March 31, 2006 were audited by other auditors whose report dated May 22, 2006 expressed an unqualified opinion on those statements.
PRICEWATERHOUSECOOPERS LLP
San Francisco, California
May 18, 2007
107
PROXY VOTING RESULTS (Unaudited)
On November 20, 2006, Schwab announced an agreement to sell U.S. Trust, a wholly-owned subsidiary of Schwab, to the Bank of America (the “Sale”). The Sale includes all of U.S. Trust’s subsidiaries, including USTA and USTNA.
Under Section 15 of the 1940 Act, the change in ownership of U.S. Trust may result in the assignment, and automatic termination, of the Funds’ current investment advisory agreements with USTA and USTNA (the “Current Advisory Agreements”). Consequently, the Funds will need to enter into new investment advisory agreements with USTA and USTNA upon the closing of the Sale (the “New Advisory Agreements”), which requires the approval of both the Board of Directors and the shareholders of the Funds. At a meeting held on January 8, 2007, the Board approved New Advisory Agreements under which, subject to approval by the Funds’ shareholders, USTA and USTNA will continue to serve as investment advisers to the Funds after the Sale is completed. At the same meeting, the Board directed that the New Advisory Agreements be submitted to the shareholders of each Fund for approval.
A Special Meeting of Shareholders of Excelsior Funds, Excelsior Tax-Exempt Funds and Trust and each of their Funds was held on March 30, 2007, for the purpose of seeking shareholder approval of the following proposal: to approve new investment advisory agreements by and among USTA, USTNA and the Companies, on behalf of the Funds. The Special Meeting for Excelsior Funds with respect to the Value and Restructuring Fund, Energy and Natural Resources and Treasury Money Funds was adjourned for the purpose of soliciting additional proxies, and subsequently held on April 30, 2007. The number of votes necessary to conduct the Special Meetings and approve the proposal was obtained. The results of the votes of shareholders are listed below:
EXCELSIOR FUNDS, INC.
| | | | | | |
Fund | | For | | Against | | Abstain |
Blended Equity Fund | | 6,164,047.545 | | 67,952.751 | | 73,977.210 |
Core Bond Fund | | 42,419,131.502 | | 102,811.034 | | 103,300.208 |
Emerging Markets Fund | | 40,519,375.591 | | 385,533.770 | | 2,387,530.558 |
Energy and Natural Resources Fund | | 10,149,963.059 | | 261,710.922 | | 349,760.892 |
Government Money Fund | | 172,737,336.070 | | 747,772.190 | | 420,358.000 |
Intermediate-Term Bond Fund | | 44,858,545.970 | | 241,685.152 | | 66,016.000 |
International Fund | | 21,282,762.400 | | 54,899.414 | | 128,924.192 |
Large Cap Growth Fund | | 42,848,198.375 | | 89,295.014 | | 404,672.705 |
Money Fund | | 674,980,999.600 | | 1,166,673.210 | | 410,474.540 |
Pacific/Asia Fund | | 12,624,395.052 | | 35,293.746 | | 146,970.828 |
Real Estate Fund | | 6,828,766.866 | | 23,944.228 | | 74,532.837 |
Short-Term Government Securities Fund | | 19,900,726.363 | | 26,705.441 | | 160,992.698 |
Small Cap Fund | | 20,778,531.495 | | 77,734.183 | | 230,771.291 |
Treasury Money Fund | | 147,661,994.420 | | 8,327.040 | | 953,491.100 |
Value and Restructuring Fund | | 71,659,202.229 | | 1,308,059.398 | | 2,313,244.343 |
108
PROXY VOTING RESULTS (Continued)
EXCELSIOR TAX-EXEMPT FUNDS, INC.
| | | | | | |
Fund | | For | | Against | | Abstain |
California Short-Intermediate Term Tax-Exempt Income Fund | | 5,620,954.755 | | 30,312.000 | | 19,754.000 |
Intermediate-Term Tax-Exempt Fund | | 25,090,015.155 | | 30,070.577 | | 76,826.198 |
Long-Term Tax-Exempt Fund | | 3,628,610.926 | | 33,702.423 | | 40,804.648 |
New York Intermediate-Term Tax-Exempt Fund | | 9,319,329.057 | | 13,806.000 | | 36,899.000 |
New York Tax-Exempt Money Fund | | 275,209,603.310 | | 4,686,548.000 | | 63,196.000 |
Short-Term Tax-Exempt Securities Fund | | 8,452,657.301 | | 72,849.000 | | 359,587.000 |
Tax-Exempt Money Fund | | 1,356,339,634.110 | | 11,586,764.280 | | 2,023,751.550 |
|
| EXCELSIOR FUNDS TRUST |
| | | |
Fund | | For | | Against | | Abstain |
Equity Income Fund | | 15,004,710.199 | | 69,167.666 | | 28,045.000 |
Equity Opportunities Fund | | 15,890,842.151 | | 16,544.962 | | 771.000 |
High Yield Fund | | 15,794,959.655 | | 30,927.324 | | 249,577.222 |
International Equity Fund | | 5,138,808.000 | | .000 | | .000 |
Mid Cap Value and Restructuring Fund | | 7,879,533.211 | | 19,517.123 | | 87,756.460 |
109
ADDITIONAL FEDERAL TAX INFORMATION
| Other | Federal Tax Information (Unaudited): |
For corporate shareholders, the following percentage of the total ordinary income distributions paid during the fiscal year ended March 31, 2007, qualify for the corporate dividends received deduction for the following Funds:
| | | |
Fund | | Percentage | |
Blended Equity Fund | | 100.00 | % |
Energy and Natural Resources Fund | | 5.17 | % |
Equity Income Fund | | 100.00 | % |
Equity Opportunities Fund | | 100.00 | % |
Mid Cap Value and Restructuring Fund | | 100.00 | % |
Small Cap Fund | | 98.82 | % |
Value and Restructuring Fund | | 100.00 | % |
For the year ended March 31, 2007, the following Funds paid qualified dividend income for purposes of reduced individual federal income tax rates of:
| | | |
Fund | | Percentage | |
Blended Equity Fund | | 100.00 | % |
Energy and Natural Resources Fund | | 4.79 | % |
Equity Income Fund | | 100.00 | % |
Equity Opportunities Fund | | 100.00 | % |
Mid Cap Value and Restructuring Fund | | 100.00 | % |
Small Cap Fund | | 98.63 | % |
Value and Restructuring Fund | | 100.00 | % |
Emerging Markets Fund | | 100.00 | % |
International Fund | | 100.00 | % |
Pacific/Asia Fund | | 33.31 | % |
The following Funds paid out the amounts of Long Term Capital Gains for the year ended March 31, 2007:
| | | |
Fund | | Long Term
Capital Gains |
Blended Equity Fund | | $ | 61,776,418 |
Energy and Natural Resources Fund | | | 58,470,040 |
Mid Cap Value and Restructuring Fund | | | 7,547 |
Small Cap Fund | | | 41,311,258 |
Emerging Markets Fund | | | 51,557,837 |
Pacific/Asia Fund | | | 7,507,933 |
The following Funds passed through the amounts of Foreign Tax Credits for the year ended March 31, 2007:
| | | |
Fund | | Foreign Tax
Credits |
Emerging Markets Fund | | $ | 1,906,057 |
International Fund | | | 1,086,746 |
110
APPROVAL OF INVESTMENT ADVISORY AGREEMENTS (Unaudited)
In November 2006, representatives of Schwab, U.S. Trust, and the Funds’ investment advisers, USTA and USTNA (together, USTA and USTNA are referred to as the “Advisers) informed the Board that Schwab had entered into a stock purchase agreement with the Bank of America under which Schwab would sell U.S. Trust to Bank of America (the “Sale”). Representatives of Schwab, U.S. Trust, and the Advisers also informed the Board that, because the Sale includes all of U.S. Trust’s subsidiaries, such as USTA and USTNA, the completion of the Sale may be deemed to be an “assignment” (as defined in the 1940 Act) of the Funds’ current investment advisory agreements (the “Current Advisory Agreements”) resulting in the termination of the Current Advisory Agreements in accordance with their terms. To provide continuity in investment advisory services, representatives of U.S. Trust, the Advisers, and Bank of America proposed that the Board approve new investment advisory agreements (the “New Advisory Agreements”) under which, subject to shareholder approval, USTA and USTNA would continue to serve as investment advisers to the Funds after the completion of the Sale.
In advance of its December 6-7, 2006 meeting, the Board of Directors/Trustees requested and received from Bank of America, U.S. Trust, and the Advisers, various materials providing information regarding the Sale and its impact on (i) the Funds and their shareholders, (ii) the investment advisory services provided to the Funds by the USTA and USTNA and (iii) the administration services provided to the Funds by USTA. After receiving and reviewing these materials, the Board discussed at their December 6-7, 2006 meeting, the proposal to approve the New Advisory Agreements. Representatives from Bank of America, U.S. Trust, the Advisers, and Schwab attended the meeting and presented additional oral and written information to the Board to assist the Board in its considerations. These representatives assured the Board that Bank of America did not anticipate that there will be any reduction in the scope of or material adverse change in the nature or quality of, the investment advisory services to the Funds under the New Advisory Agreements. These representatives noted that a plan would be put into place designed to provide for the continuity of the investment advisory services under the New Advisory Agreements.
Additionally, representatives from Bank of America discussed the extensive experience and resources dedicated to Bank of America’s large mutual fund business, assuring the Board that Bank of America would seek to provide the Funds with the same or better quality of services with respect to the administration services currently provided by USTA. Representatives from Bank of America noted that: (i) the size and scale of Bank of America’s mutual fund business could produce potential savings for the Funds’ shareholders through reduced administrative costs and (ii) there was the potential for significant negotiating power in any future vendor discussions resulting from the Funds being part of the larger Bank of America fund complex.
The Board then discussed the written materials that the Board received before the meeting and the oral presentations and all other information that the Board received or discussed at the December 6-7, 2006 meeting. At the conclusion of the meeting, the Board decided to schedule another in-person Board meeting on January 8, 2007 to allow the Board to further consider the proposal to approve the New Advisory Agreements.
In anticipation of the January 8, 2007 Board meeting, legal counsel for the Directors/Trustees who are not interested persons (as defined in the 1940 Act) (“Independent Directors”) sent an information
111
APPROVAL OF INVESTMENT ADVISORY AGREEMENTS (Continued)
request letter to U.S. Trust and Schwab to solicit further information that the Board deemed to be relevant to their consideration of the New Advisory Agreements, including a discussion of, among other matters, (a) a detailed timeline and plan for the orderly transition of the administration and oversight of the Funds; (b) the extent to which key personnel of the Advisers who manage day-to-day investment operations of the Funds are expected to continue to be employed by the Advisers after the Sale; (c) the experience and qualifications of new key administrative personnel that Bank of America proposes to involve in Fund matters; (d) any enhanced compliance policies and procedures adopted by Bank of America in response to mutual fund regulatory and compliance issues; (e) any anticipated financial benefits of the Sale to Fund shareholders; (f) any anticipated changes in the Funds’ fees and operating expenses; (g) any anticipated structural changes to the Excelsior Funds complex; (h) any conflicts of interest between the other business interests of Bank of America and its affiliates and the operations of the Funds; and (i) any limitations on the Funds’ investment operations that would arise as a result of the Funds’ being affiliated with Bank of America. The responses by Bank of America, U.S. Trust, the Advisers and Schwab were provided to the Board for their review prior to the January 8, 2007 Board meeting, and the Board was provided with the opportunity to request any additional materials.
At the Board’s meeting on January 8, 2007, Bank of America, U.S. Trust, the Advisers, and Schwab provided additional written and oral information on the Sale and the impact of the Sale on the Advisers and the Funds and their shareholders. During the meeting, representatives from Bank of America and the Advisers, who were present at the meeting, assured the Board that Bank of America does not anticipate that there will be any reduction in the scope of, or material adverse change in the nature or quality of, the investment advisory services to the Funds under the New Advisory Agreements. Additionally, representatives from Bank of America, and the Advisers represented to the Board that Bank of America personnel would seek to provide the same or better quality of services with respect to the administration services currently provided by USTA. It was noted that a plan for the orderly transition of the administration and oversight of the Funds had been developed to ensure that there would be no disruption of Fund operations or other adverse consequences to the Funds and their shareholders. In addition, Bank of America provided, and the Board discussed, information regarding the potential applicability of certain regulatory orders relating to the Columbia Funds and the legacy Nations Funds.
The Board then deliberated on the approval of the New Advisory Agreements in light of all the information it had received. The Independent Directors, assisted by their independent legal counsel, met in executive session to discuss the New Advisory Agreements. After deliberating in executive session, the entire Board reconvened to discuss the approval of the New Advisory Agreements.
At the conclusion of the January 8, 2007 Board meeting, the Board, including all of the Independent Directors, unanimously concluded (a) that the approval of the New Advisory Agreements would be in the best interests of the shareholders and the Funds and (b) to recommend the approval of the New Advisory Agreements to shareholders. In concluding to approve the New Advisory Agreements and to recommend their approval to shareholders, the Board considered, with the assistance of independent legal counsel, the information and materials provided to the Board and a variety of specific factors discussed at the meetings, including, as discussed below, the Board’s prior conclusions when determining whether to approve the continuation of the Current Advisory Agreements.
112
APPROVAL OF INVESTMENT ADVISORY AGREEMENTS (Continued)
At the January 8, 2007 Board meeting, the Board concluded it was reasonable to take into account the conclusions the Board made when considering and evaluating the renewal of the Current Advisory Agreements (the “Annual Review”), which occurred at the September 29, 2006 in-person Board meeting, as part of its considerations to approve the New Advisory Agreements. The Board’s conclusion in this regard was based on (i) the fact that the New Advisory Agreements are identical to the Current Advisory Agreements in all material respects, including the investment advisory fees payable by the Funds to the Advisers and (ii) assurances by Bank of America and the Advisers that there would be no reduction or material adverse change in the nature or quality of the investment advisory services to the Funds under the New Advisory Agreements.
In addition to the conclusions formed with respect to the Annual Review, the Board considered specific information at the January 8, 2007 Board meeting concerning the Sale and its impact on the Advisers and the Funds and their shareholders, as they considered appropriate, including but not limited to the following:
| | • | | a detailed timeline and plan for the orderly transition of the administration and oversight of the Funds; |
| | • | | assurances by Bank of America and the Advisers that Bank of America does not anticipate that there will be any reduction in the scope of, or material adverse change in the nature or quality of, the investment advisory services to the Funds under the New Advisory Agreements; |
| | • | | an explanation of the extent to which key personnel of the Advisers who manage the day-to-day investment operations of the Funds are expected to continue to be employed by the Advisers after the Sale; |
| | • | | the experience and qualifications of new key administrative, financial, compliance and legal personnel that Bank of America proposes to involve in Fund matters; |
| | • | | the enhanced compliance policies and procedures adopted by Bank of America in response to mutual fund regulatory and compliance issues; |
| | • | | the anticipated financial benefits of the Sale to Fund shareholders including (i) access for the Funds to a large distribution network both on the retail, institutional and retirement platforms, as well as to Bank of America’s Private Bank and Wealth Management areas; (ii) the potential for a positive impact on Fund operating expenses resulting from an increase in assets; and (iii) the potential for significant negotiating power in any future vendor discussions resulting from the Funds being part of the larger Bank of America fund complex; |
| | • | | a representation from the Advisers and Bank of America that neither the Companies nor their shareholders would bear any costs of the Meeting or the costs of any solicitation in connection with the Meeting; |
| | • | | a representation from Bank of America that Bank of America would extend the Advisers’ commitments under the Expense Limitation Agreements currently in place with the Funds for a period of two years following the closing of the Sale, subject to the Board’s prior approval of any changes to those Expense Limitation Agreements; |
113
APPROVAL OF INVESTMENT ADVISORY AGREEMENTS (Continued)
| | • | | a discussion of the anticipated structural changes to the Excelsior Funds complex and a representation from Bank of America that the class structure of the Excelsior Funds was currently being evaluated by its product teams and that the results of that analysis would be presented to the Board for consideration at a future meeting; |
| | • | | the policies and procedures adopted by Bank of America that are intended to identify, monitor and mitigate any conflicts of interest between the other business interests of Bank of America and its affiliates and the operations of the Funds; and |
| | • | | a representation from U.S. Trust and Schwab that no material adverse impact on the Funds’ investment operations is expected as a result of the Funds being affiliated with Bank of America. |
The Board concluded, within the context of its full deliberations, that each of the representations, assurances and informational items provided by the Advisers, U.S. Trust, Bank of America and Schwab set forth above supported the approval of the New Advisory Agreements.
In the course of their deliberations, the Board did not identify any particular information or factor that was all-important or controlling. Based on its evaluation of the information and the conclusions with respect thereto at its meetings on September 29, 2006, December 6-7, 2006 and January 8, 2007, the Board, including all of the Independent Directors, unanimously: (a) concluded that the terms of the New Advisory Agreements are fair and reasonable; (b) concluded that the Advisers’ fees are reasonable in light of the services to be provided by the Advisers to the Companies; (c) concluded that the approval of the New Advisory Agreements would be in the best interests of the shareholders and the Funds; and (d) concluded to recommend the approval of the New Advisory Agreements to shareholders.
114
Directors/Trustees and Officers (Unaudited)
The tables below provide information pertaining to the Directors/Trustees and Officers of the Companies. The mailing address for each Director/Trustee is Excelsior Funds, 101 Montgomery Street, San Francisco, CA 94104.
| | | | | | | | | | |
Name and
Year of Birth | | Position(s) Held
with the
Company(1) | | Term of
Office(2) and
Length of Time
Served | | Principal Occupation(s)
During Past Five Years | | Number of
Funds in the
Fund Complex
Overseen by
Board Member | | Other
Directorships
Held by Board Member(6) |
| INDEPENDENT DIRECTORS/TRUSTEES | | | | | | |
Rodman L. Drake
Year of Birth: 1943 | | Director/Trustee; Chairman, Full Board | | Trustee of Excelsior Funds Trust since 1994; Director of Excelsior Funds, Inc. and Excelsior Tax Exempt Funds Inc. since 1996 | | Co-Founder of Baringo Capital LLC (since 2002); President, Continuation Investments Group, Inc. (1997 to 2001). | | 38(3) | | BOARD 1 — Director and Chairman, Hyperion Total Return Fund, Inc. and Hyperion Strategic Mortgage Fund Inc. (since 1991). BOARD 2 — Director, Jackson Hewitt Tax Service Inc. (since June 2004). BOARD 3 — Director, Student Loan Corporation (since May 2005). BOARD 4 — Celgene Corporation (since April 2006). |
| | | | | |
Morrill Melton Hall, Jr.
Year of Birth: 1944 | | Director/Trustee; Chairman, Investment Oversight Committee | | Director/Trustee of each Company since 2000 | | Chairman (since 1984) and Chief Executive Officer (since 1991), Comprehensive Health Services, Inc. (health care management and administration). | | 38(3) | | None |
| | | | | |
Jonathan Piel
Year of Birth: 1938 | | Director/Trustee | | Trustee of Excelsior Funds Trust since 1994; Director of Excelsior Funds, Inc. and Excelsior Tax Exempt Funds Inc. since 1996 | | Cable television producer and website designer; Editor, Scientific American (1984-1986), and Vice President, Scientific American Inc., (1986-1994); Director, National Institute of Social Sciences; Member Advisory Board, The Stone Age Institute, Bloomington, Indiana. | | 38(3) | | None |
| | | | | |
John D. Collins
Year of Birth: 1938 | | Director/Trustee; Chairman, Audit and Compliance Committee | | Director/Trustee of each Company since 2005 | | Retired. Consultant, KPMG, LLP (July 1999 to June 2000); Partner, KPMG, LLP (March 1962 to June 1999). | | 38(3) | | BOARD 1 — Director, Mrs. Fields Famous Brands LLC (consumer products) (since December 2004). |
115
| | | | | | | | | | |
Name and
Year of Birth | | Position(s) Held
with the
Company(1) | | Term of
Office(2) and
Length of Time
Served | | Principal Occupation(s)
During Past Five Years | | Number of
Funds in the
Fund Complex
Overseen by
Board Member | | Other
Directorships
Held by Board Member(6) |
Mariann Byerwalter
Year of Birth: 1960 | | Director/Trustee; Chairman, Marketing, Distribution and Shareholder Services Committee | | Director/Trustee of each Company since 2006 | | Chairman of JDN Corporate Advisory LLC (1996 to 2001); Vice President for Business Affairs and Chief Financial Officer of Stanford University (1996-2001); Special Adviser to the President of Stanford University (2001). | | 95(4) | | BOARD 1 — Director, Redwood Trust, Inc. (mortgage finance). BOARD 2 — Director, PMI Group, Inc. (mortgage insurance). |
| | | | | |
Nils H. Hakansson
Year of Birth: 1937 | | Director/Trustee | | Director/Trustee of each Company since 2006 | | Sylvan C. Coleman Professor of Finance and Accounting, Emeritus, Haas School of Business University of California, Berkeley (since 2003); Sylvan C. Coleman Professor of Finance and Accounting, Haas School of Business, University of California, Berkeley (July 1977 to January 2003). | | 38(3) | | None |
| | | | | |
William A. Hasler
Year of Birth: 1941 | | Director/Trustee; Chairman, Governance Committee | | Director/Trustee of each Company since 2006 | | Retired. Dean Emeritus of the Haas School of Business at the University of California, Berkeley; until February 2004, Co-Chief Executive Officer, Aphton Corporation (bio-pharmaceuticals). | | 95(4) | | BOARD 1 — Director, Aphton Corporation. BOARD 2 — Director, Mission West Properties (commercial real estate). BOARD 3 — Director, TOUSA (home building). BOARD 4 — Director, Harris Stratex Networks (a network equipment corporation). BOARD 5 — Director, Genitope Corp. (bio-pharmaceuticals). BOARD 6 — Director, Solectron Corporation where he is also Non-Executive Chairman (manufacturing). BOARD 7 — Director, Ditech Communications Corporation (voice communications technology). |
116
| | | | | | | | | | |
Name and
Year of Birth | | Position(s) Held
with the
Company(1) | | Term of
Office(2) and
Length of Time
Served | | Principal Occupation(s)
During Past Five Years | | Number of
Funds in the
Fund Complex
Overseen by
Board Member | | Other
Directorships
Held by Board Member(6) |
| INTERESTED DIRECTORS/TRUSTEES | | | | | | |
Randall W. Merk(5)
Year of Birth: 1954 | | Director/Trustee | | Director/Trustee of each Company since 2006 | | Executive Vice President, Charles Schwab & Co., Inc. (2002-present); President, Schwab Financial Product, Charles Schwab & Co., Inc. (2002-present); Director, Charles Schwab Asset Management (Ireland) Limited; Charles Schwab Worldwide Funds PLC; Director, Charles Schwab Bank N.A. (since 2006). Prior to September 2002, President and Chief Investment Officer, American Century Investment Management, and Director, American Century Companies, Inc.; Until June 2001, Chief Investment Officer — Fixed Income, American Century Companies, Inc. | | 95(4) | | None |
117
| | | | | | |
Name, Address and Year of Birth | | Position(s) Held
with the
Company(1) | | Term of
Office(2) and
Length of Time
Served | | Principal Occupation(s)
During Past Five Years |
| OFFICERS | | | | | | |
Evelyn Dilsaver
101 Montgomery St.
San Francisco, CA 94104
Year of Birth: 1955 | | President | | Since
February
2006 | | President and Chief Executive Officer, Laudus Variable Insurance Trust, Laudus Trust, The Charles Schwab Family of Funds, Schwab Investments, Schwab Annuity Portfolios and Schwab Capital Trust; President, Chief Executive Officer, and Director, Charles Schwab Investment Management, Inc. President, UST Advisers, Inc.’s Mutual Fund Division since March 2006. From June 2003 to July 2004, Senior Vice President, Asset Management Products and Services Enterprise, Charles Schwab & Co., Inc. Prior to June 2003, Executive Vice President, Chief Financial Officer, and Chief Administrative Officer, U.S. Trust, a subsidiary of The Charles Schwab Corporation. |
| | | |
Leo Grohowski
114 West 47th Street
New York, NY 10036
Year of Birth: 1958 | | Vice President | | Since
February
2006 | | Executive Vice President and Chief Investment Officer, U.S. Trust (October 2005 to present); Chief Investment Officer, Deutsche Asset Management Americas and Scudder Investments (2002-2005); and Chief Investment Officer, Deutsche Bank Private Banking (1999-2002). |
| | | |
Mary Martinez
114 West 47th Street
New York, NY 10036
Year of Birth: 1960 | | Vice President | | Since
February
2006 | | Managing Director of United States Trust Company, National Association (since 2003) and Chief Operating Officer of Asset Management (since December 2005) and Chief Executive Officer of National Private Banking (October 2004 to December 2005); Managing Director and Director of Relationship Management Service, Marketing, Information and Technology at Bessemer Trust (1998 to 2003). |
| | | |
Catherine MacGregor
101 Montgomery St.
San Francisco, CA 94104
Year of Birth: 1964 | | Vice President | | Since
September
2006 | | Vice President, Charles Schwab & Co., Inc. and Charles Schwab Investment Management, Inc. (since July 2005); Chief Counsel, Laudus Variable Insurance Trust and Laudus Trust (since September 2006); Chief Legal Officer, Vice President, Laudus Variable Insurance Trust and Laudus Trust (since March 2007); Vice President, The Charles Schwab Family of Funds, Schwab Investments, Schwab Capital Trust and Schwab Annuity Portfolios; Senior Associate, Paul Hastings Janofsky & Walker LLP (1999 to July 2005). |
| | | |
Joseph Trainor, CFA
114 West 47th Street
New York, NY 10036
Year of Birth: 1961 | | Vice President | | Since
February
2004 | | Managing Director of United States Trust Company, National Association (since 2003) and President, U.S. Trust Institutional; President of MFS Institutional Advisors (1998 to 2002). |
| | | |
George Pereira
101 Montgomery St.
San Francisco, CA 94104
Year of Birth: 1964 | | Treasurer/Chief Financial and Chief Accounting Officer | | Since
December
2005 | | Chief Financial Officer, Laudus Variable Insurance Trust, Laudus Trust, The Charles Schwab Family of Funds, Schwab Investments, Schwab Annuity Portfolios and Schwab Capital Trust; Senior Vice President and Chief Financial Officer, Charles Schwab Investment Management, Inc.; Director, Charles Schwab Asset Management (Ireland) Limited; Sr. Vice President, Financial Reporting, Charles Schwab & Co., Inc. (December 1999 to November 2004); Chief Financial Officer, UST Advisers, Inc.’s Mutual Fund Division (since March 2006). |
118
| | | | | | |
Name, Address and Year of Birth | | Position(s) Held
with the
Company(1) | | Term of
Office(2) and
Length of Time
Served | | Principal Occupation(s)
During Past Five Years |
Randall Fillmore
101 Montgomery St.
San Francisco, CA 94104
Year of Birth: 1960 | | Chief Compliance Officer | | Since
June
2006 | | Senior Vice President, Institutional Compliance and Chief Compliance Officer, Charles Schwab Investment Management, Inc. Chief Compliance Officer, The Charles Schwab Family of Funds, Schwab Investments, Schwab Capital Trust and Schwab Annuity Portfolios, Laudus Trust and Laudus Variable Insurance Trust; Vice President, Charles Schwab & Co., Inc., and Charles Schwab Investment Management, Inc. (2002-2003); Vice President, Internal Audit, Charles Schwab and Co., Inc. (2000-2002). |
| | | |
Wyndham Clark
225 High Ridge Road
Stamford, CT 06905
Year of Birth: 1958 | | Anti-Money Laundering Officer | | Since
May
2004 | | Vice President and AML Officer, UST Advisers, Inc. (since 2003); Vice President and Deputy Director Risk Management, IBJ Whitehall (banking) (2001 to 2002); Vice President and Chief Risk Officer, EMAC, LLC (commercial lender, asset backed security issuer) (1999 to 2001). |
| | | |
Koji E. Felton
101 Montgomery St.
San Francisco, CA 94104
Year of Birth: 1961 | | Secretary and Chief Legal Officer | | Since
June
2006 | | Secretary and Chief Legal Officer, The Charles Schwab Family of Funds, Schwab Investments, Schwab Capital Trust and Schwab Annuity Portfolios; Senior Vice President, Chief Counsel and Corporate Secretary, Charles Schwab Investment Management, Inc.; Senior Vice President and Deputy General Counsel, Charles Schwab & Co., Inc. Prior to June 1998, Branch Chief in Enforcement at U.S. Securities and Exchange Commission in San Francisco. |
| (1) | Each Director/Trustee serves in the same capacity as described above for each registered investment company included in the Excelsior Funds family (Excelsior Funds Inc., Excelsior Tax-Exempt Funds, Inc. and Excelsior Funds Trust) (together, the “Excelsior Funds Family”) and the Laudus Funds family (Laudus Trust and Laudus Variable Insurance Trust) (together, the “Laudus Funds Family”). Each officer serves in the same capacity as described above for each registered investment company included in the Excelsior Funds Family. |
(2) | Each Director/Trustee shall hold office until the election and qualification of his or her successor, or until he or she dies, resigns or is removed. The Excelsior Funds retirement policy requires that Independent Directors/Trustees retire no later than December 31st of the year during which he or she reaches 72 years of age. The officers of each Company hold office for a one-year term and until their respective successors are chosen and qualified, or, in each case, until he or she sooner dies, resigns, is removed, or becomes disqualified in accordance with the Company’s by-laws. |
| (3) | This number includes all registered investment companies included in the Excelsior Funds Family and the Laudus Funds Family, each of which is part of the Schwab Mutual Fund Family (as defined below). As of March 31, 2007, the Excelsior Funds Family and the Laudus Funds Family, in the aggregate, consisted of 38 funds. As of March 31, 2007, the Excelsior Funds Family consisted of 27 funds. |
| (4) | This number includes all registered investment companies included in the Schwab Mutual Fund family (Excelsior Funds, Inc., Excelsior Tax-Exempt Funds Inc., Excelsior Funds Trust, Laudus Trust, Laudus Variable Insurance Trust, The Charles Schwab Family of Funds, Schwab Investments, Schwab Annuity Portfolios and Schwab Capital Trust) (together, the “Schwab Mutual Fund Family”). As of March 31, 2007, the Schwab Mutual Fund Family consisted of 95 funds. |
| (5) | Mr. Merk is considered an “interested person” of the Companies (as defined in the 1940 Act) because of his affiliation with the Companies’ Advisers. |
| (6) | This column includes only directorships of companies required to report to the SEC under the Securities Exchange Act of 1934 (i.e., public companies) or other investment companies registered under the 1940 Act that are not part of the Schwab Mutual Fund Family. |
119
DISCLOSURE OF FUND EXPENSES (Unaudited)
We believe it is important for you to understand the impact of fees regarding your investment. As a shareholder of the fund, you incur ongoing, or operating costs, which include costs for portfolio management, administrative services, and shareholder reports (like this one), among others. Operating expenses, which are deducted from a fund’s gross income, directly reduce the investment return of the fund. A fund’s expenses are expressed as a percentage of its average net assets. This figure is known as the expense ratio. The following examples are intended to help you understand the ongoing costs (in dollars) of investing in your fund and to compare these costs with those of other mutual funds. The examples are based on an investment of $1,000 made at the beginning of the period shown and held for the entire period.
The table on the following page illustrates your fund’s costs in two ways.
| | • | | Actual expenses. This section provides information about actual account values and actual expenses based on the Funds’ actual return for the period. This section is designed to help you to estimate the actual expenses after fee waivers that you paid over the period. The “Ending Account Value” shown is derived from the fund’s actual return, and the fourth column shows the dollar amount that would have been paid by an investor who started with $1,000 in the fund. You may use the information here, together with the amount you invested, to estimate the expenses that you paid over the period. |
To do so, simply divide your account value by $1,000 (for example, an $8,600 account value divided by $1,000 = 8.6), then multiply the result by the number given for your fund under the heading “Expenses Paid During Period”.
| | • | | Hypothetical expenses. This section provides information about hypothetical account values and hypothetical expenses that would have been incurred by an investor in the Fund based on an assumed rate of return of 5% per year before expenses. This section is designed to help you compare your fund’s costs with those of other mutual funds. It assumes that the fund had a return of 5% before expenses during the year, but that the expense ratio is unchanged. In this case, because the return used is not the fund’s actual return, the results cannot be used to estimate the actual ending account balance or expenses you paid for the period. You may use this information to compare the ongoing costs of investing in your Fund and other funds. To do so, compare this 5% hypothetical example with the 5% hypothetical examples that appear in shareholder reports of other funds. |
120
DISCLOSURE OF FUND EXPENSES (Continued)
Please note that the expenses shown in the table are meant to highlight and help you compare ongoing costs only, which are described in the Prospectus. Therefore, the hypothetical example is useful in comparing ongoing costs only, and will not help you determine the relative total costs of owning different funds.
| | | | | | | | | | | | |
| | | Beginning
Account
Value
10/01/2006 | | Ending
Account
Value
03/31/2007 | | Annualized
Expense
Ratios* | | | Expenses
Paid
During
Period** |
Actual Fund Return | | | | | | | | | | | | |
Blended Equity Fund — Shares | | $ | 1,000.00 | | $ | 1,082.10 | | 1.10 | % | | $ | 5.71 |
Energy and Natural Resources Fund — Shares | | | 1,000.00 | | | 1,189.70 | | 1.12 | | | | 6.11 |
Equity Income Fund — Shares | | | 1,000.00 | | | 1,086.00 | | 1.09 | | | | 5.67 |
Equity Opportunities Fund — Shares | | | 1,000.00 | | | 1,111.80 | | 1.04 | | | | 5.48 |
Large Cap Growth Fund — Shares | | | 1,000.00 | | | 1,075.10 | | 1.20 | | | | 6.21 |
Mid Cap Value and Restructuring Fund — Shares | | | 1,000.00 | | | 1,096.40 | | 1.13 | | | | 5.91 |
Real Estate Fund — Shares | | | 1,000.00 | | | 1,107.90 | | 1.25 | | | | 6.57 |
Small Cap Fund — Shares | | | 1,000.00 | | | 1,119.50 | | 1.23 | | | | 6.50 |
Value and Restructuring Fund — Shares | | | 1,000.00 | | | 1,121.10 | | 1.04 | | | | 5.50 |
Emerging Markets Fund — Shares | | | 1,000.00 | | | 1,168.40 | | 1.85 | | | | 10.00 |
International Fund — Shares | | | 1,000.00 | | | 1,129.10 | | 1.50 | | | | 7.96 |
Pacific / Asia Fund — Shares | | | 1,000.00 | | | 1,116.10 | | 1.61 | | | | 8.49 |
| | | | |
Hypothetical 5% Return | | | | | | | | | | | | |
Blended Equity Fund — Shares | | | 1,000.00 | | | 1,019.45 | | 1.10 | | | | 5.54 |
Energy and Natural Resources Fund — Shares | | | 1,000.00 | | | 1,019.35 | | 1.12 | | | | 5.64 |
Equity Income Fund — Shares | | | 1,000.00 | | | 1,019.50 | | 1.09 | | | | 5.49 |
Equity Opportunities Fund — Shares | | | 1,000.00 | | | 1,019.75 | | 1.04 | | | | 5.24 |
Large Cap Growth Fund — Shares | | | 1,000.00 | | | 1,018.95 | | 1.20 | | | | 6.04 |
Mid Cap Value and Restructuring Fund — Shares | | | 1,000.00 | | | 1,019.30 | | 1.13 | | | | 5.69 |
Real Estate Fund — Shares | | | 1,000.00 | | | 1,018.70 | | 1.25 | | | | 6.29 |
Small Cap Fund — Shares | | | 1,000.00 | | | 1,018.80 | | 1.23 | | | | 6.19 |
Value and Restructuring Fund — Shares | | | 1,000.00 | | | 1,019.75 | | 1.04 | | | | 5.24 |
Emerging Markets Fund — Shares | | | 1,000.00 | | | 1,015.71 | | 1.85 | | | | 9.30 |
International Fund — Shares | | | 1,000.00 | | | 1,017.45 | | 1.50 | | | | 7.54 |
Pacific / Asia Fund — Shares | | | 1,000.00 | | | 1,016.90 | | 1.61 | | | | 8.10 |
| * | Annualized expense ratios of certain funds are after fee waivers and expense reimbursements by the investment adviser. Absent such waivers and reimbursements, expenses paid during the period would have been greater. |
| ** | Expenses are equal to the Fund’s annualized expense ratio multiplied by the average account value over the period, multiplied by the number of days in the most recent fiscal half-year (182) then divided by 365. |
121
AR-EQUITIES-0307

FIXED INCOMEFUNDS
ANNUAL REPORT
March 31, 2007
TABLE OF CONTENTS
For shareholder account information, current price and yield quotations, or to make an initial purchase or obtain a prospectus, call (800) 446-1012, from overseas, call (617) 483-7297.
| · | | Internet Address: http://www.excelsiorfunds.com |
This report must be preceded or accompanied by a current prospectus.
You should consider the Funds’ investment objectives, risks and expenses carefully before you invest. Information about these and other important subjects is in the Funds’ prospectus, which you should read carefully before investing.
Nothing in this report represents a recommendation of a security by the investment adviser. Manager views and portfolio holdings may have changed since the report date.
Investments in fixed income securities are subject to interest rate risks. The principal value of a bond falls when interest rates rise and rise when interest rates fall. During periods of rising interest rates, the value of a bond investment is at greater risk than during periods of stable or falling rates.
A description of the policies and procedures that Excelsior Funds use to determine how to vote proxies relating to portfolio securities, as well as information relating to how a Fund voted proxies relating to portfolio securities during the most recent 12-month period ended June 30, is available (i) without charge, upon request, by calling (800) 446-1012, or (ii) by accessing the Excelsior Funds’ internet address and (iii) on the Commission’s website at http://www.sec.gov.
Excelsior Funds file their June 30 and December 31 schedule of portfolio holdings with the Securities and Exchange Commission, on Form N-Q, within sixty days after the applicable reporting period. Excelsior Funds Form N-Q is available on the Commission’s website at http://www.sec.gov, and may be reviewed and copied at the Commission’s Public Reference Room in Washington, DC. Information on the operation of the Public Reference Room may be obtained by calling (800) SEC-0330.
A schedule of each Fund’s portfolio holdings, as of the end of the prior month, is also available on the Funds’ website at www.excelsiorfunds.com. This schedule is updated monthly, typically by the 15th calendar day, after the end of each month. The Funds may terminate or modify this policy at anytime.
Excelsior Funds, Inc., Excelsior Funds Trust and Excelsior Tax-Exempt Funds, Inc. are distributed by BISYS Fund Services Limited Partnership.
You may write to Excelsior Funds, Inc., Excelsior Funds Trust and Excelsior Tax-Exempt Funds, Inc. at the following address:
Excelsior Funds
P.O. Box 8529
Boston, MA 02266-8529
Notice About Duplicate Mailings
The Excelsior Funds have adopted a policy that allows the Funds to send only one copy of a Fund’s prospectus and annual and semi-annual reports to certain shareholders residing at the same “household.” This reduces Fund expenses, which benefits you and other shareholders. If you do not want your mailings to be “householded,” please call (800) 542-1061 or contact your financial intermediary.
SHARES OF THE FUNDS ARE NOT DEPOSITS OR OBLIGATIONS OF, OR GUARANTEED OR ENDORSED BY, ANY BANK, AND THE SHARES ARE NOT FEDERALLY INSURED BY THE FEDERAL DEPOSIT INSURANCE CORPORATION, BANK INSURANCE FUND, FEDERAL RESERVE BOARD, OR ANY OTHER GOVERNMENTAL AGENCY. FUND SHARES ARE NOT INSURED OR GUARANTEED BY THE U.S. GOVERNMENT. AN INVESTMENT IN A FUND IS SUBJECT TO RISK OF PRINCIPAL.
LETTER TO SHAREHOLDERS
March 31, 2007
Dear Valued Excelsior Fund Shareholder,
I am pleased to bring you the annual report for the year ended March 31, 2007 for the Excelsior Funds. The funds in this report are part of the Excelsior Fund family which has over $20 billion in assets as of the end of the reporting period and includes a wide array of asset classes and investment strategies designed to meet the individual investor’s investment needs.
By now, you have received notification that on November 20, 2006, The Charles Schwab Corporation (“Schwab”) announced an agreement to sell the U.S. Trust Corporation (“U.S. Trust”), a wholly-owned subsidiary of Schwab, to the Bank of America Corporation (“Bank of America”) (the “Sale”). The Sale involves all of U.S. Trust’s subsidiaries, including the Excelsior Funds’ investment advisers, UST Advisers, Inc. (“USTA”) and United States Trust Company National Association, on behalf of its asset management division, U.S. Trust New York Asset Management (“USTNA”). Consequently, the Excelsior Funds will need to enter into new investment advisory agreements with USTA and USTNA.
At a meeting held on January 8, 2007, the Board approved new investment advisory agreements under which, subject to approval by the Excelsior Funds’ shareholders, USTA and USTNA will continue to serve as investment advisers to the Excelsior Funds after the Sale is completed. At the same meeting, the Board directed that the new investment advisory agreements be submitted to the shareholders of each Fund for approval.
A Special Meeting of Shareholders of Excelsior Funds, Inc., Excelsior Tax-Exempt Funds, Inc. and Excelsior Funds Trust and each of their funds was held on March 30, 2007. The number of votes necessary to conduct the Special Meeting and approve the new investment advisory agreements was obtained for each fund except the Value and Restructuring, Energy and Natural Resources and Treasury Money Funds. The Special Meeting for Value and Restructuring, Energy and Natural Resources and Treasury Money Funds was adjourned for the purpose of soliciting additional proxies, and we anticipate that the new investment advisory agreements will be approved by the shareholders of these funds at a subsequent Special Meeting.
The integration of U.S. Trust, Bank of America’s private bank and its ultra high net worth extension will create the nation’s largest private wealth management firm with assets under management of over $260 billion and total client assets of almost $420 billion.
We at the Excelsior Funds are excited about our future within Bank of America and remain committed to helping you with your long-term investment goals. Thank you for investing with us.
Sincerely,

Evelyn Dilsaver
President
1
EXCELSIOR FUNDS FIXED INCOME MARKET REVIEW | |
Bond Market Review
Yields generally declined across intermediate and longer maturity levels but rose on the front end of the curve over the course of the fiscal year ended March 31, 2007. The Federal Reserve (Fed) increased the target short-term federal funds rate twice in the period (both times in the second quarter of 2006), raising it from 4.75% to 5.25%, which is where it still stands.
The yield curve ended the fiscal year inverted as money-market rates continued to out-yield longer maturity Treasury issues. After remaining flat for most of the past year, the yield curve steepened towards a more normalized shape from the two-year to 30-year maturity range. In March, the ten-year yield was above the two-year yield, the first time in over six months.
Overall for the fiscal year, bonds earned a solid return of 6.59% as represented by the Lehman Aggregate Index. Investment grade corporate bonds, as represented by the Lehman U.S. Credit Index, returned 7.1% and posted positive excess returns (over duration equivalent Treasuries) of almost 1%. The spread between corporate bond yields and Treasuries remained narrow over the course of the fiscal year, a reflection of continued strong investor demand as corporate default rates hovered near historic lows. A record $1.07 trillion in corporate bonds were issued in 2006, versus $770 billion in 2005, as companies took advantage of relatively low borrowing costs. Commercial mortgage-backed securities (CMBS) was another strong spread sector over the period, generating 0.67% of excess returns. So far in this credit cycle, strong fundamentals and heavy buying by foreign investors have contributed to spread compression.
In the municipal market, low interest rates, narrow intermarket long-term yield spreads, tighter credit spreads and issuer use of swaps and other derivatives for funding purposes combined to create one of the highest-volume years on record. Foreign buyers, seeking to take advantage of spreads between BMA (the Bond Market Association synthetic municipal yield curve) and LIBOR (the London Interbank Offered Rate), were significant municipal market participants. While the municipal curve is flat by historical domestic market standards, it has been steeper than alternative fixed income vehicles; thus, many foreign and domestic buyers leveraged their holdings. For the same reasons, numerous municipal hedge funds were birthed, adding additional buying support to the market.
Outlook
We believe the U.S. economy is in a period of below-trend growth levels. Going forward much will depend on the employment situation, which continues to hold firm. The timing of any lowering of rates by the Fed will be a function of equity market strength and unemployment reports. We do believe that weakness in the economy will eventually cause the yield curve to steepen and rates to fall, especially at the shorter end of the yield curve. History has shown that after a long period of a stable Fed funds rate (such as we have seen in the past nine months), a reversal of policy (in this case, from tightening to easing) carries a very high probability.
Inflation-protected Treasury securities (TIPSs) are close to their breakeven highs over the near-term. Breakevens should remain near these current levels as the Fed continues to take a vigilant stance towards inflation regardless of the market’s view on forward rates. There should be opportunities to add to this sector later in the year at relatively attractive levels should the Fed enter a period of sustained easing.
2
EXCELSIOR FUNDS FIXED INCOME MARKET REVIEW | |
In lower-grade credits, some caution seems appropriate in the high-yield market. We believe high yield spreads will remain range bound over the quarter as economic activity moderates and the housing situation becomes clearer. Despite spreads widening over the quarter, they remain significantly lower than long-term averages. Should a weak economy materialize, default rates will increase faster than currently expected and high yield spreads likely would expand.
In terms of both residential and commercial mortgage backed securities, the tremors from the sub-prime market have been relatively contained so far this year. Prepayment volatility should remain low as MBS refinancing will not meaningfully accelerate unless rates decline substantially at the longer end of the curve. CMBS spreads appear very attractive relative to corporate bonds, offering similar yield with higher credit quality. We favor shorter-maturity adjustable-rate (Hybrid ARM’s) issues as they continue to offer satisfactory return expectations with substantial protection from volatile markets.
In the municipal bond market, as long as the forces of low interest rates, a flat yield curve and tighter spreads persist, we anticipate that the refunding of municipal bonds will continue and may put pressure on secondary market profits, particularly in the long end of the market. Should profitability of leveraged tender option bond programs continue to compress, forcing the sale of securities, the long end could come under even greater pressure. Our current view is to maintain a shorter duration profile than the index, with overweightings concentrated on the front end of the yield curve.
3
EXCELSIOR TAX-EXEMPT FUNDS, INC. | CALIFORNIA SHORT-INTERMEDIATE TERM |
TAX-EXEMPT INCOME FUND
Performance Summary
For the first time in many years, the municipal yield curve inverted from zero to five years, with five-year rates offering lower yields than one-year rates. Alternative Minimum Tax (AMT) outperformed non-AMT slightly, and short non-investment grade outperformed high grades. Along the yield curve spectrum, the two- to four-year part of the curve outperformed all other maturities.
Low interest rates, narrow inter-market long-term yield spreads, tighter credit spreads and issuer use of swaps and other derivatives for funding purposes combined to create one of the highest-volume years on record, with new issue municipal bond supply surging over 49% in Q1 2007 over Q1 2006. In the last quarter of the fiscal year, California was the largest issuer, bringing to market over $20 billion in new bonds. As a result, yields on in-state securities increased slightly more than those on national bonds, narrowing the yield differential between California and national municipals.
Foreign buyers, seeking to take advantage of spreads between BMA and LIBOR, were significant municipal market participants. While the municipal curve is flat by historical domestic market standards, one- to 30-year yields are steeper than alternative fixed income vehicles; thus, many foreign and domestic buyers have leveraged their holdings. For the same reasons, numerous municipal hedge funds were birthed, adding additional buying support to the market.
Performance Attribution and Portfolio Positioning
For the year, the Fund underperformed its benchmark on a net-of-fees basis. Early in the year, the Fund was neutral to slightly short duration relative to the index, and extended out on the yield curve when the Fed began to migrate to a neutral stance on interest rates. The Fund maintained a longer duration until the first calendar quarter of 2007, when duration and average maturity were shortened in anticipation of increased California supply along with seasonal yield increases. The Fund’s underperformance was primarily due to the high overall quality of securities held and its avoidance of purchasing securities which are subject to AMT. Additionally, the Fund did not hold any leveraged securities. Cash was maintained at minimal levels.
Outlook
As long as the forces of low interest rates, a flat yield curve and tighter spreads persist, we anticipate that refunding of municipal bonds will continue, and may put pressure on secondary market profits, particularly in the long end of the market. Should profitability of leveraged tender option bond programs continue to compress, forcing the sale of securities, the long and long/intermediate part of the curve could come under even greater pressure. We plan to maintain a shorter-duration profile than the index, with curve overweights concentrated on the front end of the yield curve. Although the high yield market has had a stellar run, we believe that credit spreads are too compressed, and so are unwilling to add securities for little return.
Kathleen Meyer
Senior Vice President and
Senior Portfolio Manager
4
EXCELSIOR TAX-EXEMPT FUNDS, INC. | CALIFORNIA SHORT-INTERMEDIATE TERM TAX-EXEMPT INCOME FUND |
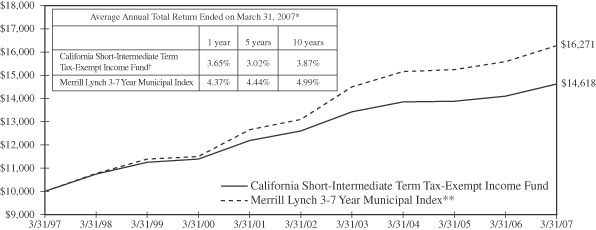
Past performance is not predictive of future performance. Investment returns and principal values will vary and shares may be worth more or less at redemption than their original cost. A portion of the Fund’s income may be subject to the Alternative Minimum Tax.
The above illustration compares a $10,000 investment made in the Fund and a broad-based index for the past ten fiscal year. The chart assumes all dividends and capital gain distributions are reinvested. The Fund’s performance takes into account fees and expenses. The index does not take into account charges, fees and other expenses. Further information relating to Fund performance is contained in the Financial Highlights section of the Prospectus and elsewhere in this report.
| | | |
| | |
Expense Ratio
(As of 7/31/06) | | Shares | |
Gross Expense Ratio | | 1.03 | % |
Net Expense Ratio | | 0.50 | % |
The expense information in the table reflects contractual fee waivers currently in effect. This information is included in the most current prospectus available to current and prospective shareholders of the Fund. The Adviser has contractually agreed to waive fees or reimburse expenses in order to keep total operating expenses from exceeding 0.50%. The waiver agreement may not be terminated before July 31, 2007. In addition, this agreement will renew automatically for an additional 12 month term unless the Adviser terminates the agreement by providing written notice to the Fund prior to the expiration of the current term.
| * | | Total return represents the change during the period in a hypothetical account with dividends reinvested. |
| ** | | Source: Merrill Lynch—the Merrill Lynch 3-7 Year Municipal Index is a widely-accepted unmanaged market-weighted index comprised of fixed-rate, coupon-bearing bonds issued within five years of the most recent month-end with greater than $50 million principal amount having a Moody’s investment grade rating and maturities of three to seven years. |
| † | | Currently certain fees are waived. Had such fees not been waived, returns would have been lower. Returns do not reflect the deduction of taxes that a shareholder would pay on Fund distributions or the redemption of shares. |
5
EXCELSIOR FUNDS, INC. | CORE BOND FUND |
Performance Summary
The Excelsior Core Bond Fund underperformed the Lehman Brothers Aggregate Bond Index for the Fund’s fiscal year ending March 31, 2007.
Yields generally declined across intermediate and longer maturity levels but rose on the front end of the curve over the course of the fiscal year. The Fed increased the target short-term federal funds rate twice in the period, bringing it to 5.25% from 4.75%. Both rate hikes occurred in the second calendar quarter of 2006, and the Fed has left its target short-term interest rate unchanged since that time.
The yield curve ended the fiscal year inverted as money-market rates continue to out-yield longer-maturity Treasury issues. After remaining flat for most of the past year, the yield curve steepened towards a more normalized shape from the two-year to 30-year maturity range. In March, the ten-year yield was above the two-year yield—the first time that’s happened in more than six months.
Overall for the fiscal year, bonds earned a solid return of 6.59% as represented by the Lehman Brothers Aggregate Bond Index. Investment-grade corporate bonds, as represented by the Lehman U.S. Credit Index, returned 7.1% and posted positive excess returns (over duration-equivalent Treasuries) of almost 1%. The spread between corporate bond yields and Treasuries remained narrow throughout the year, a reflection of continued strong investor demand as corporate default rates hovered near historic lows. A record $1.07 trillion in corporate bonds were issued in 2006, compared with $770 billion in 2005 as companies took advantage of relatively low borrowing costs. The commercial mortgage-backed securities (CMBS) sector was also strong in the period, generating 0.67% of excess returns. So far in this credit cycle, strong fundamentals and heavy buying by foreign investors have contributed to spread compression.
Performance Attribution and Portfolio Positioning
Within sectors, the decision to overweight commercial mortgage backed securities proved beneficial as the sector generated strong excess returns in the period. Furthermore, allocation and selection in residential mortgages added to returns, specifically in floating-rate, shorter-maturity issues. Conversely, while the underweight allocation to investment-grade credit detracted from results; issue selection within this sector and exposure to select high yield issues helped results during the year.
We continue to hold overweight positions in mortgages to maintain portfolio yield levels and a high credit quality relative to the benchmark. Portfolios are generally underweight in Treasury and Agency securities. Our strategy has been to underweight the agency and corporate bonds favored by the foreign buyers and find better values in commercial mortgages (CMBS) and residential adjustable-rate mortgages.
During the fiscal year, the Fund’s duration and curve positioning were additive to results. The Fund typically maintained a narrow duration band around the benchmark, yet its tactical moves (longer than benchmark for the second half of 2006) were additive to results. The Fund has been positioned for an eventual steepening of the Treasury yield curve. This positioning has not hurt returns and should be rewarded in the coming months.
The Fund ended the fiscal year positioned slightly shorter duration than the benchmark from a tactical perspective. We expect an end to Fed rate hikes, and ultimately a move to lower market rates, which would warrant moving the Fund to a slightly longer-than-benchmark duration position later in the year. Fund positions have been migrated to better capitalize on our expectation of lower yields and a
6
EXCELSIOR FUNDS, INC. | CORE BOND FUND |
steepening yield curve. We have made no major changes to our overall allocation in the credit sector, although we have actively eliminated select issuers in the auto sector and added to positions in the consumer sector. Throughout the year, the Fund maintained a minimum allocation to securities rated less than single-A, choosing to emphasize higher-quality issues.
The Portfolio yield exceeded that of the benchmark over the course of the year.
Outlook
We believe the U.S. economy is in a period of below-trend growth. Going forward, much will depend on the employment situation, which continues to hold firm. The timing of any lowering of rates by the Fed will be a function of equity market strength and unemployment reports. We do believe that weakness in the economy will eventually cause the yield curve to steepen and rates to fall, especially at the shorter end of the yield curve. History has shown that after a long period of a stable federal funds rate (such as the past nine months), a reversal of policy (in this case, from tightening to easing) carries a high probability.
From a duration standpoint, the Fund is positioned slightly short-duration from its benchmark on a tactical basis due to favorable seasonal patterns. We are positioned for further spread widening and yield-curve steepening in response to the more volatile equity markets and slower economic growth. We have positioned the Fund for a more normally sloped yield curve, which we believe offers the potential for significant reward.
Inflation-protected Treasury securities (TIPSs) are close to their breakeven highs over the near term. Breakevens should remain near these levels as the Fed continues to take a vigilant stance toward inflation regardless of the market’s view on forward rates. There should be opportunities to add to this sector later in the year at relatively attractive levels should the Fed enter a period of sustained easing.
We remain underweight the credit sector in general; corporate bonds present little value at present spread levels. Even with the widening of spreads in the first quarter (fiscal fourth quarter), we are still near the historic tight levels seen over the past decade. Leveraged buyouts and shareholder enhancement activities remain threats for corporate bonds. With event risk already high, the environment could worsen given a sell-off in equities as private equity groups should inevitably increase LBO-related activities.
In lower-grade credits, some caution seems appropriate in the high-yield market, although we do believe it’s prudent to maintain a minimal allocation. We believe high yield spreads will remain range bound over the quarter as economic activity moderates and the housing situation becomes clearer. Despite spreads widening during the first quarter of 2007, they remain significantly lower than long-term averages. Should a weak economy materialize, default rates would increase faster than currently expected and high yield spreads likely would expand.
The Fund remains overweight in both residential and commercial mortgage backed securities. The tremors from the sub-prime market have been relatively contained so far. Prepayment volatility should remain low as MBS refinancing will not meaningfully accelerate unless rates decline substantially at the longer end of the curve. CMBS spreads appear attractive relative to corporate bonds, offering similar yield with higher credit quality. We continue to concentrate on adding older deals that feature better underwriting standards than are prevalent in the current market. We favor shorter-maturity adjustable-rate (Hybrid ARMs) issues as they continue to offer satisfactory return expectations with substantial protection from volatile markets.
Alexander R. Powers
Managing Director
Portfolio Manager and Head of Fixed
Income Investments
7
EXCELSIOR FUNDS, INC. | CORE BOND FUND |
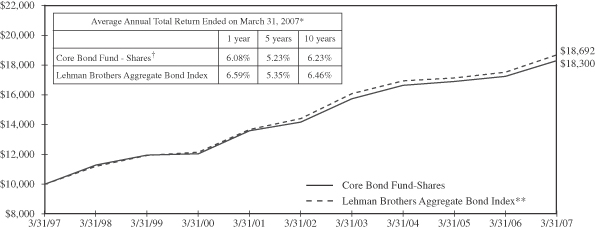
Past performance is not predictive of future performance. Investment returns and principal values will vary and shares may be worth more or less at redemption than their original cost.
The above illustration compares a $10,000 investment made in the Fund and a broad-based index over the past ten fiscal years. The chart assumes all dividends and capital gain distributions are reinvested. The Fund’s performance takes into account fees and expenses. The index does not take into account charges, fees and other expenses. Further information relating to Fund performance is contained in the Financial Highlights section of the Prospectus and elsewhere in this report.
| | | |
| | |
Expense Ratio
(As of 7/31/06) | | Shares | |
Gross Expense Ratio | | 1.30 | % |
Net Expense Ratio | | 0.90 | % |
The expense information in the table reflects contractual fee waivers currently in effect. This information is included in the most current prospectus available to current and prospective shareholders of the Fund. The Adviser has contractually agreed to waive fees or reimburse expenses in order to keep total operating expenses from exceeding 0.90%. The waiver agreement may not be terminated before July 31, 2007. In addition, this agreement will renew automatically for an additional 12 month term unless the Adviser terminates the agreement by providing written notice to the Fund prior to the expiration of the current term.
| * | | Total return represents the change during the period in a hypothetical account with dividends reinvested. |
| ** | | Source: Lehman Brothers—the Lehman Brothers Aggregate Bond Index is an unmanaged, fixed income, market value-weighted index that includes treasury issues, agency issues, corporate bond issues and mortgage-backed securities. |
| † | | Currently certain fees are waived. Had such fees not been waived, returns would have been lower. Returns do not reflect the deduction of taxes that a shareholder would pay on Fund distributions or the redemption of shares. |
8
EXCELSIOR FUNDS TRUST | HIGH YIELD FUND |
Performance Summary
For the year ended March 31, 2007, the Merrill Lynch High Yield, Cash Pay Index returned almost 12%, with each quarter generating a positive return. Lower-rated credits (CCC and below) significantly outperformed, generating an 18% return for the year; BB-rated debt lagged modestly, returning about 10%. Declining interest rates, particularly in the September quarter, and stable equity markets from August through February were significant contributors to strong performance in high yield. Over the year, the spread of high yield versus U.S. Treasuries declined modestly, with a sharp contraction beginning in September, ending the year at 3.20%. That level is well below the longer term average of 4.75%. Default rates, a key driver of high yield spreads, declined from 2.8% to 1.6% during the year, to near record lows. The best performing sectors during the year were entertainment, automotive, retail, airlines, and cable TV. Rails, gaming, leisure, aerospace, and energy were the weakest performers. Every category generated a positive return for the year. New issue supply was $163 billion. Rating upgrades versus downgrades were fairly constant and slightly positive during the year.
Performance Attribution and Portfolio Positioning
For the fiscal year, the Excelsior High Yield Fund outperformed the Merrill Lynch High Yield, Cash Pay Index. Based on industry categories, the Fund was overweight some underperforming groups; but individual security selection, primarily low single B-rated and CCC-rated issuers in retail and telecom in particular, outperformed their industry categories and the Index. About 1.30% of the Fund’s performance was generated by Ormet Aluminum, a company that emerged from bankruptcy in April 2005; the Fund has held this name for several years. Several developments related to this holding in the 3rd and 4th calendar quarters of 2006 contributed importantly to the outperformance of this name. First, a significant distribution of common equity to original creditors (which included the Fund) was made. Second, a successful rights offering and a 10:1 stock split substantially enhanced the enterprise and per share value of Ormet. The Fund pared its holding in this name when the position grew to over 5% of the Fund as the valuation increased. The objective was to take some profits and moderate Fund volatility. At the end of the year, the holding was reduced to about 3%. We continue to believe there is significant potential upside in this name although probably not before the 3rd calendar quarter of this year.
Outlook
In spite of the current low spread versus U.S. Treasuries and the slowing economy, we remain moderately constructive on the high yield asset class. Over several decades, high yield spreads have tracked closely with default rates, with periods of divergence infrequent and short lived. For a number of recent months, high yield spreads have significantly exceeded default rates. We believe this is due to investor concern that default rates may rise sharply as a consequence of a slowing economy and the result of the recent sharp increase in low-rated debt (historically a precursor of rising defaults). Default rates over the last twelve months currently are near record low levels. We believe that the enormous refinancing of debt maturities at low interest rates that has occurred over the last several years will mitigate the negative effects of slow economic growth, particularly if the economy accelerates in the 2nd half of this year. High yield default rates projected out 12 months by Moody’s and S & P have continued to moderate and now are at levels that remain well below longer term averages. Current high yield spread levels are comparable to projected defaults a year from now. We believe actual defaults likely will fall below current estimates and thereby rationalize or even reduce current spreads. This assumes a modest and temporary economic slowdown. However, until investors become more confident that default rates will not increase sharply, a more cautious approach to high yield is appropriate.
A.K. Rodgers Ratcliffe, CFA
Senior Vice President and Senior Portfolio Manager
Adam Moss
Senior Vice President and Senior Portfolio Manager
9
EXCELSIOR FUNDS TRUST | HIGH YIELD FUND |
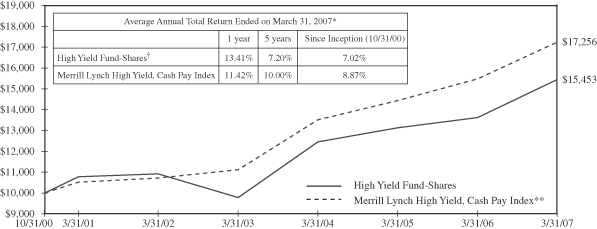
Past performance is not predictive of future performance. Investment returns and principal values will vary and shares may be worth more or less at redemption than their original cost. Securities rated below investment grade generally entail greater market, credit, and liquidity risks than investment grade securities.
The above illustration compares a $10,000 investment made in the Fund and a broad-based index since 10/31/00 (inception date). The chart assumes all dividends and capital gain distributions are reinvested. The Fund’s performance takes into account fees and expenses. The index does not take into account charges, fees and other expenses. Further information relating to Fund performance is contained in the Financial Highlights section of the Prospectus and elsewhere in this report.
| | | |
| | |
Expense Ratio
(As of 7/31/06) | | Shares | |
Gross Expense Ratio | | 1.29 | % |
Net Expense Ratio | | 1.05 | % |
The expense information in the table reflects contractual fee waivers currently in effect. This information is included in the most current prospectus available to current and prospective shareholders of the Fund. The Adviser has contractually agreed to waive fees or reimburse expenses in order to keep total operating expenses from exceeding 1.05%. The waiver agreement may not be terminated before July 31, 2007. In addition, this agreement will renew automatically for an additional 12 month term unless the Adviser terminates the agreement by providing written notice to the Fund prior to the expiration of the current term.
| * | | Total return represents the change during the period in a hypothetical account with dividends reinvested. |
| ** | | Source: Merrill Lynch—The Merrill Lynch High Yield, Cash Pay Index is an unmanaged index comprised of publicly placed, non-convertible, coupon bearing domestic debt. Issues in the index are less than investment grade as rated by Standard & Poor’s Ratings Group or Moody’s Investors Service, Inc., and must not be in default. Issues have a term to maturity of at least one year. |
| † | | Currently certain fees are waived. Had such fees not been waived, returns would have been lower. Returns do not reflect the deduction of taxes that a shareholder would pay on Fund distributions or the redemption of shares. Returns do not reflect the 2% fee imposed on shares redeemed 30 days or less after their date of purchase. |
10
EXCELSIOR FUNDS, INC. | INTERMEDIATE-TERM BOND FUND |
Performance Summary
The Excelsior Intermediate-Term Bond Fund underperformed the Lehman Intermediate Government/Credit Index for the fiscal year ended March 31, 2007.
Yields generally declined across intermediate and longer maturity levels but rose on the front end of the curve over the course of the fiscal year. The Fed increased the target short-term federal funds rate twice in the period, bringing it to 5.25% from 4.75%. Both rate hikes occurred in the second calendar quarter of 2006, and the Fed has left its target short-term interest rate unchanged since that time.
The yield curve ended the fiscal year inverted as money-market rates continue to out-yield longer-maturity Treasury issues. After remaining flat for most of the past year, the yield curve steepened towards a more normalized shape from the two-year to 30-year maturity range. In March, the ten-year yield was above the two-year yield—the first time that’s happened in more than six months.
Overall for the fiscal year, bonds earned a solid return of 6.59% as represented by the Lehman Brothers Aggregate Bond Index. Investment-grade corporate bonds, as represented by the Lehman U.S. Credit Index, returned 7.1% and posted positive excess returns (over duration-equivalent Treasuries) of almost 1%. The spread between corporate bond yields and Treasuries remained narrow throughout the year, a reflection of continued strong investor demand as corporate default rates hovered near historic lows. A record $1.07 trillion in corporate bonds were issued in 2006, compared with $770 billion in 2005 as companies took advantage of relatively low borrowing costs. The commercial mortgage-backed securities (CMBS) sector was also strong in the period, generating 0.67% of excess returns. So far in this credit cycle, strong fundamentals and heavy buying by foreign investors have contributed to spread compression.
Performance Attribution and Portfolio Positioning
Within sectors, the decision to overweight commercial mortgage backed securities proved beneficial as the sector generated strong excess returns in the period. Furthermore, allocation and selection in residential mortgages added to returns, specifically in floating-rate, shorter-maturity issues. Conversely, while the underweight allocation to investment-grade credit detracted from results; issue selection within this sector and exposure to select high yield issues helped results during the year.
We continue to hold overweight positions in mortgages to maintain portfolio yield levels and a high credit quality relative to the benchmark. Portfolios are generally underweight in Treasury and Agency securities. Our strategy has been to underweight the agency and corporate bonds favored by the foreign buyers and find better values in commercial mortgages (CMBS) and residential adjustable-rate mortgages.
During the fiscal year, the Fund’s duration and curve positioning were additive to results. The Fund typically maintained a narrow duration band around the benchmark, yet its tactical moves (longer than benchmark for the second half of 2006) were additive to results. The Fund has been positioned for an eventual steepening of the Treasury yield curve. This positioning has not hurt returns and should be rewarded in the coming months.
The Fund ended the fiscal year positioned slightly shorter duration than the benchmark from a tactical perspective. We expect an end to Fed rate hikes, and ultimately a move to lower market rates, which would warrant moving the Fund to a slightly longer-than-benchmark duration position later in the year. Fund positions have been migrated to better capitalize on our expectation of lower yields and a
11
EXCELSIOR FUNDS, INC. | INTERMEDIATE-TERM BOND FUND |
steepening yield curve. We have made no major changes to our overall allocation in the credit sector, although we have actively eliminated select issuers in the auto sector and added to positions in the consumer sector. Throughout the year, the Fund maintained a minimum allocation to securities rated less than single-A, choosing to emphasize higher-quality issues.
Outlook
We believe the U.S. economy is in a period of below-trend growth. Going forward, much will depend on the employment situation, which continues to hold firm. The timing of any lowering of rates by the Fed will be a function of equity market strength and unemployment reports. We do believe that weakness in the economy will eventually cause the yield curve to steepen and rates to fall, especially at the shorter end of the yield curve. History has shown that after a long period of a stable federal funds rate (such as the past nine months), a reversal of policy (in this case, from tightening to easing) carries a high probability.
From a duration standpoint, the Fund is positioned slightly short-duration from its benchmark on a tactical basis due to favorable seasonal patterns. We are positioned for further spread widening and yield-curve steepening in response to the more volatile equity markets and slower economic growth. We have positioned the Fund for a more normally sloped yield curve, which we believe offers the potential for significant reward.
Inflation-protected Treasury securities (TIPSs) are close to their breakeven highs over the near term. Breakevens should remain near these levels as the Fed continues to take a vigilant stance toward inflation regardless of the market’s view on forward rates. There should be opportunities to add to this sector later in the year at relatively attractive levels should the Fed enter a period of sustained easing.
We remain underweight the credit sector in general; corporate bonds present little value at present spread levels. Even with the widening of spreads in the first quarter (fiscal fourth quarter), we are still near the historic tight levels seen over the past decade. Leveraged buyouts and shareholder enhancement activities remain threats for corporate bonds. With event risk already high, the environment could worsen given a sell-off in equities as private equity groups would inevitably increase LBO-related activities.
In lower-grade credits, some caution seems appropriate in the high-yield market, although we do believe it’s prudent to maintain a minimal allocation. We believe high yield spreads will remain range bound over the quarter as economic activity moderates and the housing situation becomes clearer. Despite spreads widening during the first quarter of 2007, they remain significantly lower than long-term averages. Should a weak economy materialize, default rates would increase faster than currently expected and high yield spreads likely would expand.
The Fund remains overweight in both residential and commercial mortgage backed securities. The tremors from the sub-prime market have been relatively contained so far. Prepayment volatility should remain low as MBS refinancing will not meaningfully accelerate unless rates decline substantially at the longer end of the curve. CMBS spreads appear attractive relative to corporate bonds, offering similar yield with higher credit quality. We continue to concentrate on adding older deals that feature better underwriting standards than are prevalent in the current market. We favor shorter-maturity adjustable-rate (Hybrid ARMs) issues as they continue to offer satisfactory return expectations with substantial protection from volatile markets.
Alexander R. Powers
Managing Director
Portfolio Manager and Head of Fixed Income Investments
12
EXCELSIOR FUNDS, INC. | INTERMEDIATE-TERM BOND FUND |
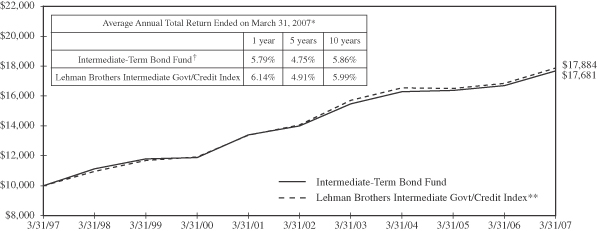
Past performance is not predictive of future performance. Investment returns and principal values will vary and shares may be worth more or less at redemption than their original cost.
The above illustration compares a $10,000 investment made in the Fund and a broad-based index over the past ten fiscal years. The chart assumes all dividends and capital gain distributions are reinvested. The Fund’s performance takes into account fees and expenses. The index does not take into account charges, fees and other expenses. Further information relating to Fund performance is contained in the Financial Highlights section of the Prospectus and elsewhere in this report.
| | | |
| | |
Expense Ratio
(As of 7/31/06) | | Shares | |
Gross Expense Ratio | | 0.81 | % |
Net Expense Ratio | | 0.75 | % |
The expense information in the table reflects contractual fee waivers currently in effect. This information is included in the most current prospectus available to current and prospective shareholders of the Fund. The Adviser has contractually agreed to waive fees or reimburse expenses in order to keep total operating expenses from exceeding 0.75%. The waiver agreement may not be terminated before July 31, 2007. In addition, this agreement will renew automatically for an additional 12 month term unless the Adviser terminates the agreement by providing written notice to the Fund prior to the expiration of the current term.
| * | | Total return represents the change during the period in a hypothetical account with dividends reinvested. |
| ** | | Source: Lehman Brothers—The Lehman Brothers Intermediate Govt/Credit Index is an unmanaged total return performance benchmark composed of U.S. Government agencies and U.S. Treasury securities and investment grade corporate debt, selected as representative of the market with maturities of one to ten years. |
| † | | Currently certain fees are waived. Had such fees not been waived, returns would have been lower. Returns do not reflect the deduction of taxes that a shareholder would pay on Fund distributions or the redemption of shares. |
13
EXCELSIOR TAX-EXEMPT FUNDS, INC. | INTERMEDIATE-TERM TAX-EXEMPT FUND |
Performance Summary
For the first time in many years, the municipal yield curve inverted from zero to five years, with five-year rates offering lower yields than one-year rates. Non-investment-grade securities significantly outperformed investment-grade bonds, and AMT bonds slightly outperformed non-AMT. Low interest rates, narrow intermarket long-term yield spreads, tighter credit spreads and issuer use of swaps and other derivatives for funding purposes combined to create one of the highest volume years on record, with new issue municipal bond supply surging over 49% in Q1 2007 over Q1 2006. Foreign buyers, seeking to take advantage of spreads between BMA (the Bond Market Association synthetic municipal yield curve) and LIBOR, were significant municipal market participants. While the municipal curve is flat by historical domestic market standards, one to 30-year yields are steeper than alternative fixed income vehicles; thus, many foreign and domestic buyers leveraged their holdings. For the same reasons, numerous municipal hedge funds were birthed, adding additional buying support to the market.
Performance Attribution and Portfolio Positioning
For the year, the Fund underperformed its benchmark on a net-of-fees basis. The Fund remained neutral to slightly long duration for most of the year, with most of the overweighting occurring in both the longer and four to six year part of the yield curve. Additionally, the Fund had a slight underweight in two- to three- years, which underperformed during the first half of the year, but significantly outperformed later in the year. Cash was kept in the 3% range in order to maximize yield. Although we strived to increase the Fund’s overall yield through the inclusion of higher yielding securities, the Fund remains of high investment quality. Thus, the Fund maintained a slightly lower yield than the Index throughout the year, with much of the gap due to AMT bonds and higher yielding sectors inherent in the Index. The Fund avoids holding bonds that are subject to the AMT. Additionally, our underweight in housing and airport bonds negatively impacted performance (note that the majority of bonds issued in these sectors are subject to the AMT). The Fund did not hold any leveraged securities during the fiscal year ending March 31, 2007.
Purchases were concentrated on bonds, with long maturities priced to a short call or to a short/intermediate average life. The Fund purchased both New Jersey Tobacco and Golden State Tobacco bonds, which were priced attractively relative to similar bonds issued by other states. While they carry long-term maturities, their turbo sinking fund nature results in an average life of 4.5 years. We believe these bonds offer higher than market yield, with the defensive characteristics of shorter securities. While we held a neutral position in California bonds throughout much of the year, more recently we sold in-state securities in anticipation of large new issue volume during the first half of 2007.
Outlook
As long as the forces of low interest rates, a flat yield curve and tighter spreads persist, we anticipate that the refunding of municipal bonds will continue and may put pressure on secondary market profits, particularly in the long end of the market. Should profitability of leveraged tender option bond programs continue to compress, forcing the sale of securities, the long and long/intermediate part of the curve could come under even greater pressure. We plan to maintain our overweight in New York relative to California, as the former has initiated long-term planning and proactive budget management,
14
EXCELSIOR TAX-EXEMPT FUNDS, INC. | INTERMEDIATE-TERM TAX-EXEMPT FUND |
which should help provide ballast against any regional economic downturns, while the latter is expected to increase debt issuance over the coming quarter. We plan to maintain a shorter duration profile than the index, with curve overweightings concentrated on the front end of the yield curve. Although the high yield market has had a stellar run, we believe that credit spreads are too compressed; we are not willing to add securities for little return. We also expect to maintain approximately 5% in cash.
Pamela Hunter
Managing Director and Senior Portfolio Manager
15
EXCELSIOR TAX-EXEMPT FUNDS, INC. | INTERMEDIATE-TERM TAX-EXEMPT FUND |

Past performance is not predictive of future performance. Investment returns and principal values will vary and shares may be worth more or less at redemption than their original cost. A portion of the Fund’s income may be subject to the Alternative Minimum Tax and some investors may be subject to certain state and local taxes.
The above illustration compares a $10,000 investment made in the Fund and broad-based indices over the past ten fiscal years. The chart assumes all dividends and capital gain distributions are reinvested. The Fund’s performance takes into account fees and expenses. The indices do not take into account charges, fees and other expenses. Further information relating to Fund performance is contained in the Financial Highlights section of the Prospectus and elsewhere in this report.
| | | |
| | |
Expense Ratio
(As of 7/31/06) | | Shares | |
Gross Expense Ratio | | 0.80 | % |
Net Expense Ratio | | 0.65 | % |
The expense information in the table reflects contractual fee waivers currently in effect. This information is included in the most current prospectus available to current and prospective shareholders of the Fund. The Adviser has contractually agreed to waive fees or reimburse expenses in order to keep total operating expenses from exceeding 0.65%. The waiver agreement may not be terminated before July 31, 2007. In addition, this agreement will renew automatically for an additional 12 month term unless the Adviser terminates the agreement by providing written notice to the Fund prior to the expiration of the current term.
| * | | Total return represents the change during the period in a hypothetical account with dividends reinvested. |
| ** | | Source: Merrill Lynch—the Merrill Lynch 3-7 Year Muni Index is a widely-accepted unmanaged market-weighted index comprised of fixed-rate, coupon-bearing bonds issued within five years of the most recent month-end with greater than $50 million principal amount having a Moody’s investment grade rating and maturities of three to seven years. |
| *** | | Source: Merrill Lynch—the Merrill Lynch 7-12 Year Muni Index is a widely-accepted unmanaged market-weighted index comprised of fixed-rate, coupon-bearing bonds issued within five years of the most recent month-end with greater than $50 million principal amount having a Moody’s investment grade rating and maturities of seven to twelve years. |
| † | | Currently certain fees are waived. Had such fees not been waived, returns would have been lower. Returns do not reflect the deduction of taxes that a shareholder would pay on Fund distributions or the redemption of shares. |
16
EXCELSIOR TAX-EXEMPT FUNDS, INC. | LONG-TERM TAX-EXEMPT FUND |
Performance Summary
For the first time in many years, the municipal yield curve inverted from zero to five years, with five-year rates offering lower yields than one-year rates. Non-investment-grade securities significantly outperformed investment-grade bonds, and AMT bonds slightly outperformed non-AMT. Low interest rates, narrow intermarket long-term yield spreads, tighter credit spreads and issuer use of swaps and other derivatives for funding purposes combined to create one of the highest-volume years on record, with new issue municipal bond supply surging over 49% in Q1 2007 over Q1 2006. Foreign buyers, seeking to take advantage of spreads between BMA and LIBOR, were significant municipal market participants. While the municipal curve is flat by historical domestic market standards, one to 30-year yields are steeper than alternative fixed income vehicles; thus, many foreign and domestic buyers leveraged their holdings. For the same reasons, numerous municipal hedge funds were birthed, adding additional buying support to the market.
Performance Attribution and Portfolio Positioning
For the year, the Fund was in line with its benchmark, net of fees. A duration that was slightly longer than the Merrill Lynch 22+ Year Municipal Index was maintained through much of the year. During the first half, the Fund maintained a duration underweight in the short end and an underweight in the long end. Yield remained lower than the Index, due to an underweighting in bonds subject to the AMT, as the Fund avoids holding securities which are subject to this tax. Additionally, AMT bonds are issued in higher-yielding sectors. Finally, the Fund was overweighted in California and New York bonds, both of which outperformed the market. Additionally, the Fund did not hold any leveraged securities.
The Fund’s management strove to increase the overall yield by increasing exposure to the health care sector, and to new issuers to the market that carried higher rates than the overall market, including bonds issued to build stadiums (Queens and Yankee stadiums), regional redevelopment (Hudson Yards, NY) and Bay Area Tolls. Additionally, the Fund purchased tobacco bonds in New Jersey and California that were priced attractively relative to similar bonds issued by other states. Their turbo sinking fund nature results in an average life significantly shorter than the overall maturity, and offers the defensive characteristics of shorter bonds.
In addition to increasing yield, purchases were focused across the yield curve in an attempt to diversify risk. As long bonds were the year’s top performers, we overweighted that part of the curve relative to the Index for much of the year. As the curve flattened, we concentrated purchases in the front end of the yield curve and maintained a cash position of approximately 5%, as the spread between short-term and long-term yields compressed.
Outlook
As long as the forces of low interest rates, a flat yield curve and tighter spreads persist, we anticipate that the refunding of municipal bonds will continue and may put pressure on secondary market profits, particularly in the long end of the market. Should profitability of leveraged tender option bond programs continue to compress, forcing the sale of securities, the long end could come under even greater pressure. We plan to maintain our overweight in New York relative to California, as the former has initiated long term planning and proactive budget management, which will help provide ballast
17
EXCELSIOR TAX-EXEMPT FUNDS, INC. | LONG-TERM TAX-EXEMPT FUND |
against any regional economic downturns. We plan to maintain a shorter duration profile than the index, with overweightings concentrated on the front end of the yield curve. Although the high yield market has had a stellar run, we believe that credit spreads are too compressed and we thus are not willing to add securities for little return. While we expect to maintain cash in the 5% area, over the near-term we will increase our cash exposure to take advantage of seasonal, tax related short-term yield hikes.
Pamela Hunter
Managing Director and Senior Portfolio Manager
18
EXCELSIOR TAX-EXEMPT FUNDS, INC. | LONG-TERM TAX-EXEMPT FUND |
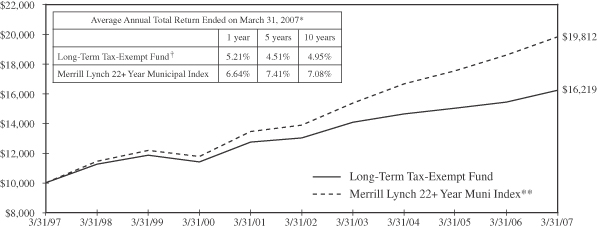
Past performance is not predictive of future performance. Investment returns and principal values will vary and shares may be worth more or less at redemption than their original cost. A portion of the Fund’s income may be subject to the Alternative Minimum Tax and some investors may be subject to certain state and local taxes.
The above illustration compares a $10,000 investment made in the Fund and a broad-based index over the past ten fiscal years. The chart assumes all dividends and capital gain distributions are reinvested. The Fund’s performance takes into account fees and expenses. The index does not take into account charges, fees and other expenses. Further, information relating to Fund performance is contained in the Financial Highlights section of the Prospectus and elsewhere in this report.
| | | |
| | |
Expense Ratio
(As of 7/31/06) | | Shares | |
Gross Expense Ratio | | 1.02 | % |
Net Expense Ratio | | 0.80 | % |
The expense information in the table reflects contractual fee waivers currently in effect. This information is included in the most current prospectus available to current and prospective shareholders of the Fund. The Adviser has contractually agreed to waive fees or reimburse expenses in order to keep total operating expenses from exceeding 0.80%. The waiver agreement may not be terminated before July 31, 2007. In addition, this agreement will renew automatically for an additional 12 month term unless the Adviser terminates the agreement by providing written notice to the Fund prior to the expiration of the current term.
| * | | Total return represents the change during the period in a hypothetical account with dividends reinvested. |
| ** | | Source: Merrill Lynch—the Merrill Lynch 22+ Year Muni Index consists of bonds with an outstanding par which is greater than or equal to 25 million and a maturity range greater than or equal to 22 years. |
| † | | Currently certain fees are waived. Had such fees not been waived, returns would have been lower. Returns do not reflect the deduction of taxes that a shareholder would pay on Fund distributions or the redemption of shares. |
19
EXCELSIOR TAX-EXEMPT FUNDS, INC. | NEW YORK INTERMEDIATE-TERM TAX-EXEMPT FUND |
Performance Summary
For the first time in many years, the municipal yield curve inverted from zero to five years, with five-year rates offering lower yields than one-year rates. Non-investment-grade securities significantly outperformed investment-grade bonds, with New York high yield securities returning slightly more than national. AMT bonds slightly outperformed non-AMT. Low interest rates, narrow intermarket long-term yield spreads, tighter credit spreads and issuer use of swaps and other derivatives for funding purposes combined to create one of the highest-volume years on record, with new issue municipal bond supply surging over 49% in Q1 2007 over Q1 2006. New York new issue supply increased by 40% in the last quarter alone. Foreign buyers, seeking to take advantage of spreads between BMA and LIBOR, were significant municipal market participants. While the municipal curve is flat by historical domestic market standards, one to 30-year yields are steeper than alternative fixed income vehicles; thus, many foreign and domestic buyers leveraged their holdings. For the same reasons, numerous municipal hedge funds were birthed, adding additional buying support to the market.
Performance Attribution and Portfolio Positioning
For the year, the Fund underperformed its benchmarks net of fees. We maintained a duration slightly longer than the Indices for much of the year, until early December, when we switched to a neutral, and then slightly short duration. Much of the later underweighting occurred in the eight to twelve year part of the curve. Additionally, the Fund had a slight underweight in the top performing two to four year part of the curve. This was countered by an overweight in cash and five-year duration exposure. As BMA rates increased, the effect muted curve underperformance, which resulted in an overall positive curve contribution for the year. Although we have increased the Fund’s overall yield, the Fund remained lower in yield relative to the Indices; however, much of the gap was due to an underweight in AMT paper and the higher yielding sectors inherent in the Indices. The Fund avoids holding bonds that are subject to the AMT. The Fund was underweighted in the transportation sector, due to the concentration of NY agency issuers that fell under the auspices of the same obligor. Additionally, the Fund did not hold any leveraged securities.
Purchases were concentrated on bonds maturing across the yield curve, in order to diversify risk. The Fund’s management strove to increase the overall yield by increasing exposure to the health care sector, and to new issuers to the market that carried higher rates than the overall market, including bonds issued to build stadiums (Queens and Yankee stadiums), as well as regional redevelopment (Hudson Yards Redevelopment Project). As long bonds were the year’s top performers, we overweighted that part of the curve relative to the Indices for much of the year. As the curve flattened, we concentrated purchases in the front end of the yield curve and maintained a cash position of approximately 5%, as the spread between short term and long term yields compressed.
Later in the year, we sold some of our long positions in order to hedge against potential mass liquidation of the similar securities by leveraged arbitrageurs. Additionally, agency sales were concentrated in the ten-year part of the yield curve, thus shortening the average maturity of the fund by half a year.
20
EXCELSIOR TAX-EXEMPT FUNDS, INC. | NEW YORK INTERMEDIATE-TERM TAX-EXEMPT FUND |
Outlook
As long as the forces of low interest rates, a flat yield curve and tighter spreads persist, we anticipate that the refunding of municipal bonds will continue and may put pressure on secondary market profits, particularly in the long end of the market. Should the profitability of leveraged tender option bond programs continue to compress, forcing the sale of securities, the long and long/intermediate part of the curve could come under even greater pressure. We will continue to migrate down the curve to take advantage of steepening from the short end. The State of New York has initiated long term planning and proactive budget management, which should help to provide ballast against any regional economic downturns. In anticipation of potential upgrades, we are concentrating our purchase on state agency debt, keeping in mind diversification restrictions. We plan to maintain a shorter duration profile than the index, with curve overweightings concentrated on the front end of the yield curve. Although the New York high yield market has had a stellar run, we believe that credit spreads are too compressed and are thus unwilling to add securities for little return. We also expect to maintain approximately 5% in cash.
Pamela Hunter
Managing Director and Senior Portfolio Manager
21
EXCELSIOR TAX-EXEMPT FUNDS, INC. | NEW YORK INTERMEDIATE-TERM TAX-EXEMPT FUND |
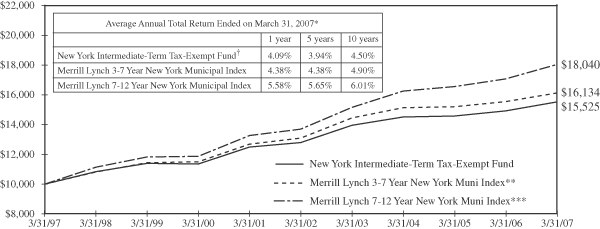
Past performance is not predictive of future performance. Investment returns and principal values will vary and shares may be worth more or less at redemption than their original cost. A portion of the Fund’s income may be subject to the Alternative Minimum Tax.
The above illustration compares a $10,000 investment made in the Fund and broad-based indices over the past ten fiscal years. The chart assumes all dividends and capital gain distributions are reinvested. The Fund’s performance takes into account fees and expenses. The indices do not take into account charges, fees and other expenses. Further information relating to Fund performance is contained in the Financial Highlights section of the Prospectus and elsewhere in this report.
| | | |
| | |
Expense Ratio
(As of 7/31/06) | | Shares | |
Gross Expense Ratio | | 0.98 | % |
Net Expense Ratio | | 0.80 | % |
The expense information in the table reflects contractual fee waivers currently in effect. This information is included in the most current prospectus available to current and prospective shareholders of the Fund. The Adviser has contractually agreed to waive fees or reimburse expenses in order to keep total operating expenses from exceeding 0.80%. The waiver agreement may not be terminated before July 31, 2007. In addition, this agreement will renew automatically for an additional 12 month term unless the Adviser terminates the agreement by providing written notice to the Fund prior to the expiration of the current term.
| * | | Total return represents the change during the period in a hypothetical account with dividends reinvested. |
| ** | | Source: Merrill Lynch—the Merrill Lynch 3-7 Year New York Muni Index is a widely-accepted unmanaged market-weighted index comprised of fixed-rate, coupon-bearing bonds of New York Municipalities issued within five years of the most recent month-end with greater than $50 million principal amount having a Moody’s investment grade rating and maturities of three to seven years. |
| *** | | Source: Merrill Lynch—the Merrill Lynch 7-12 Year New York Muni Index is a widely-accepted unmanaged market-weighted index comprised of fixed-rate, coupon-bearing bonds of New York Municipalities issued within five years of the most recent month-end with greater than $50 million principal amount having a Moody’s investment grade rating and maturities of seven to twelve years. |
| † | | Currently certain fees are waived. Had such fees not been waived, returns would have been lower. Returns do not reflect the deduction of taxes that a shareholder would pay on Fund distributions or the redemption of shares. |
22
EXCELSIOR FUNDS, INC. | SHORT-TERM GOVERNMENT SECURITIES FUND |
Performance Summary
The Excelsior Short-Term Government Fund in the fiscal year ending March 31, 2007, performed in line with its benchmark. The yield-to-maturity of 5.21% at the end of the period represented a yield advantage relative to the Lehman Brothers 1-3 Year Government Bond Index and a slightly longer duration.
Performance Attribution and Portfolio Positioning
The Fund remained overweight mortgage-backed securities throughout the period in an effort to capitalize on the significant yield advantage mortgages offer, especially in periods where rate volatility remains contained. Investments in this asset class included substantial concentrations in hybrid ARMs, so-called because of the fixed/floating-rate nature of their underlying loans. Hybrid ARMs offer similar yield advantages to fixed-rate mortgages but with a lower sensitivity to changes in interest rates. The floating rate nature of the underlying loans offers additional protection to the Fund should rates move substantially in either direction. Positions in callable agency debentures were added midway through the period. They too offer substantial benefits versus their non-callable counterparts when rates remain subdued.
The Fund currently maintains no exposure TIPs. TIPs have performed well of late, but continued vigilance on the part of the Fed should cap breakevens near current levels. We do not expect the circumstances that caused energy prices to spike recently to continue indefinitely. Positive carry seasonally prevalent in the TIPs sector does present an opportunity for the near term.
The combined percentage of mortgage-backed and asset-backed investments in the Fund is currently 58%. In addition to the hybrid ARMs mentioned earlier, positions exist in both premium-priced, non-amortizing fixed-rate mortgage securities and structured mortgage-backed assets with short final maturity dates. Both represent mortgage-backed cash flows that are more bulleted in nature than would otherwise be available in the mortgage-backed market and should perform well in the bull-steepening scenario that we expect to take place. Futures positions exist in the Fund to help protect against losses, should a steepening scenario transpire. The longer rates remain at current levels, the more pressure will begin to build.
Outlook
The U.S. economy has remained resilient in spite of continued deterioration in the housing sector. The Fed has resisted lowering rates in deference to increased concerns regarding the outlook for inflation. Uncertainty regarding the timing of this policy change has kept interest rates range-bound. Moreover, the Fed’s stance has subsequently caused the Treasury yield curve to remain inverted, with yields at the shorter end of the maturity spectrum higher than those at the longer end.
We believe, and market expectations are, that the Federal Reserve will eventually need to lower rates to keep the economy growing. Fallout from the current housing crisis has caused a general tightening of credit, which should ultimately cause the Fed to respond by cutting interest rates, thereby lowering all yields and steepening the yield curve.
Michael Zazzarino
Managing Director and Senior
Portfolio Manager
23
EXCELSIOR FUNDS, INC. | SHORT-TERM GOVERNMENT SECURITIES FUND |
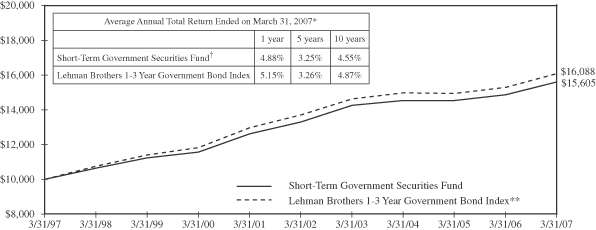
Past performance is not predictive of future performance. Investment returns and principal values will vary and shares may be worth more or less at redemption than their original cost.
The above illustration compares a $10,000 investment made in the Fund and a broad-based index over the past ten fiscal years. The chart assumes all dividends and capital gain distributions are reinvested. The Fund’s performance takes into account fees and expenses. The index does not take into account charges, fees and other expenses. Further information relating to Fund performance is contained in the Financial Highlights section of the Prospectus and elsewhere in this report.
| | | |
| | |
Expense Ratio
(As of 7/31/06) | | Shares | |
Gross Expense Ratio | | 0.77 | % |
Net Expense Ratio | | 0.75 | % |
The expense information in the table reflects contractual fee waivers currently in effect. This information is included in the most current prospectus available to current and prospective shareholders of the Fund. The Adviser has contractually agreed to waive fees or reimburse expenses in order to keep total operating expenses from exceeding 0.75%. The waiver agreement may not be terminated before July 31, 2007. In addition, this agreement will renew automatically for an additional 12 month term unless the Adviser terminates the agreement by providing written notice to the Fund prior to the expiration of the current term.
| * | | Total return represents the change during the period in a hypothetical account with dividends reinvested. |
| ** | | Source: Lehman Brothers—The Lehman Brothers 1-3 Year Government Bond Index is an unmanaged total return performance benchmark composed of U.S. Government agencies and U.S. Treasury securities with maturities of one to three years. |
| † | | Currently certain fees are waived. Had such fees not been waived, returns would have been lower. Returns do not reflect the deduction of taxes that a shareholder would pay on Fund distributions or the redemption of shares. |
24
EXCELSIOR TAX-EXEMPT FUNDS, INC. | SHORT-TERM TAX-EXEMPT SECURITIES FUND |
Performance Summary
For the first time in many years, the municipal yield curve inverted from zero to five years, with five-year rates offering lower yields than one-year rates. Non-investment-grade securities significantly outperformed investment-grade bonds on the short end of the curve, doubling the return of investment-grades, and AMT bonds slightly outperformed non-AMT. Along the yield curve spectrum, the four to six year part of the curve was the short end’s top-performing maturity range.
Low interest rates, narrow intermarket long-term yield spreads, tighter credit spreads and issuer use of swaps and other derivatives for funding purposes combined to create one of the highest-volume years on record, with new issue municipal bond supply surging over 49% in Q1 2007 over Q1 2006. Foreign buyers, seeking to take advantage of spreads between BMA and LIBOR, were significant municipal market participants. While the municipal curve is flat by historical domestic market standards, one to 30-year yields are steeper than alternative fixed income vehicles; thus, many foreign and domestic buyers leveraged their holdings. For the same reasons, numerous municipal hedge funds were birthed, adding additional buying support to the market. As a result, the increase in tender option bond programs created for this buying universe also resulted in new variable rate demand note programs (the floating rate portion of tender option bonds), resulting in higher short term yields, as measured by the Bond Market Association’s Index of tax-exempt money market rates.
Performance Attribution and Portfolio Positioning
For the year, the Fund underperformed the benchmark net of fees. The Fund’s duration remained approximately a half year short relative to the Index, with most of the underweighting occurring in the five-year part of the yield curve. As a result, the Fund underperformed the Index. Yields were slightly lower than the Index, due primarily to the AMT holdings in the Index as well as the shorter maturity. Newly created variable rate demand note programs (the floating side of tender option securities) kept BMA rates relatively high; thus, the Fund did not suffer yield underperformance. The Fund avoids holding bonds that are subject to the AMT. Most of the high-yielding sectors fall within the AMT; thus, we did not gain the price appreciation realized by much of the non- and lower-investment-grade sectors. Additionally, the Fund did not hold any leveraged securities. At year end, the Fund held a cash equivalent position of 7%.
Purchases were concentrated on bonds offering higher yields within non-AMT sectors. The Fund added exposure to the tobacco bond sector by purchasing New Jersey Tobaccos with a final maturity of 2010. As the yield curve inverted, we sold longer securities that yielded less than the BMA cash rate.
Outlook
As long as the forces of low interest rates, a flat yield curve and tighter spreads persist, we anticipate that the refunding of municipal bonds will continue, and may put pressure on secondary market profits, particularly in the long end of the market. Should leveraged tender option bond programs begin to unwind, it is likely that variable-rate demand note programs (the floating rate piece of fixed rate synthetics) would be collapsed in turn, creating less cash equivalent supply in the municipal bond market. As we approach the tax season, seasonal selling of municipal money market funds to meet tax
25
EXCELSIOR TAX-EXEMPT FUNDS, INC. | SHORT-TERM TAX-EXEMPT SECURITIES FUND |
obligations should keep pressure on BMA rates near term. Because the forces of supply and demand may be neutralized this year, the Fund is likely to keep cash at around 10% until the high tax season has passed.
Pamela Hunter
Managing Director and Senior Portfolio Manager
26
EXCELSIOR TAX-EXEMPT FUNDS, INC. | SHORT-TERM TAX-EXEMPT SECURITIES FUND |
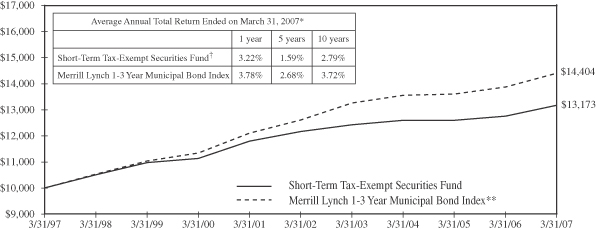
Past performance is not predictive of future performance. Investment returns and principal values will vary and shares may be worth more or less at redemption than their original cost. A portion of the Fund’s income may be subject to the Alternative Minimum Tax and some investors may be subject to certain state and local taxes.
The above illustration compares a $10,000 investment made in the Fund and a broad-based index over the past ten fiscal years. The chart assumes all dividends and capital gain distributions are reinvested. The Fund’s performance takes into account fees and expenses. The index does not take into account charges, fees and other expenses. Further information relating to Fund performance is contained in the Financial Highlights section of the Prospectus and elsewhere in this report.
| | | |
| | |
Expense Ratio
(As of 7/31/06) | | Shares | |
Gross Expense Ratio | | 0.77 | % |
Net Expense Ratio | | 0.60 | % |
The expense information in the table reflects contractual fee waivers currently in effect. This information is included in the most current prospectus available to current and prospective shareholders of the Fund. The Adviser has contractually agreed to waive fees or reimburse expenses in order to keep total operating expenses from exceeding 0.60%. The waiver agreement may not be terminated before July 31, 2007. In addition, this agreement will renew automatically for an additional 12 month term unless the Adviser terminates the agreement by providing written notice to the Fund prior to the expiration of the current term.
| * | | Total return represents the change during the period in a hypothetical account with dividends reinvested. |
| ** | | Source: Merrill Lynch—the Merrill Lynch 1-3 Year Municipal Bond Index is a widely-accepted unmanaged market-weighted index comprised of fixed-rate, coupon-bearing bonds issued within five years of the most recent month-end with greater than $50 million principal amount having a Moody’s investment grade rating and maturities of one to three years. |
| † | | Currently certain fees are waived. Had such fees not been waived, returns would have been lower. Returns do not reflect the deduction of taxes that a shareholder would pay on Fund distributions or the redemption of shares. |
27
Excelsior Tax-Exempt Funds, Inc.
Portfolio of Investments — March 31, 2007
California Short-Intermediate Tax-Exempt Income Fund
| | | | | | | | | | | |
Principal
Amount | | | | Rate | | | Maturity
Date | | Value |
| | | | | | | | | | | |
| | TAX-EXEMPT SECURITIES — 85.19% | | | |
| $ | 1,500,000 | | Anaheim, California, Public Financing Authority Revenue Bonds, Distribution Systems, (AMBAC) | | 5.00 | % | | 10/01/13 | | $ | 1,619,700 |
| | 1,000,000 | | California State Department of Transportation Revenue Bonds, Federal Highway Grant Anticipation Bonds, Series A, (FGIC) | | 4.50 | | | 02/01/13 | | | 1,046,330 |
| | 1,000,000 | | California State Department of Water Resources Central Valley Project Revenue Bonds, Series Y | | 5.00 | | | 12/01/10 | | | 1,051,040 |
| | 1,500,000 | | California State Department of Water Resources Revenue Bonds, Series W, (AMBAC) | | 5.50 | | | 12/01/09 | | | 1,576,620 |
| | 3,000,000 | | California State Economic Recovery, General Obligation Bonds, Series B, (Mandatory Put 07/01/07 @ 100) | | 5.00 | | | 07/01/23 | | | 3,009,720 |
| | 1,000,000 | | California State Economic Recovery, Special Sales Tax Revenue Bonds, Series A, (FGIC) | | 5.25 | | | 07/01/14 | | | 1,096,950 |
| | 750,000 | | California State General Obligation Bonds | | 6.25 | | | 04/01/08 | | | 769,928 |
| | 2,000,000 | | California State General Obligation Bonds | | 5.00 | | | 02/01/11 | | | 2,095,480 |
| | 1,000,000 | | California State University Systemwide Revenue Bonds, Series A, (AMBAC) | | 5.00 | | | 11/01/12 | | | 1,069,600 |
| | 1,000,000 | | California Statewide Communities Development Authority Revenue Bonds, California Endowment | | 5.00 | | | 07/01/13 | | | 1,074,110 |
| | 3,000,000 | | California Statewide Communities Development Authority Revenue Bonds, John Muir Health, Series A | | 5.00 | | | 08/15/17 | | | 3,203,250 |
| | | | | | | | | | | |
Principal
Amount | | | | Rate | | | Maturity
Date | | Value |
| | | | | | | | | | | |
| | TAX-EXEMPT SECURITIES — (continued) | | | |
| $ | 1,000,000 | | Central Valley, California, School District Financing Authority Revenue Bonds, Series A, (MBIA) | | 6.15 | % | | 08/01/09 | | $ | 1,057,010 |
| | 1,000,000 | | Contra Costa, California, Transportation Authority Sales Tax Revenue Bonds, Series A, (FGIC) | | 6.00 | | | 03/01/08 | | | 1,022,300 |
| | 975,000 | | Foothill- De Anza, California, Community College District General Obligation Bonds, (FGIC) | | 5.00 | | | 08/01/14 | | | 1,037,644 |
| | 1,000,000 | | Golden State Tobacco Securitization Corporation, California, Tobacco Settlement Revenue Bonds, Enhanced-Asset Backed, Series A | | 5.00 | | | 06/01/15 | | | 1,007,180 |
| | 3,500,000 | | Los Angeles County, California, Metropolitan Transportation Authority Sales Tax Revenue Bonds, Series A, (FSA) | | 5.25 | | | 07/01/10 | | | 3,664,674 |
| | 1,000,000 | | Los Angeles, California, Department of Water & Power Revenue Bonds, Power System, Series A, Sub-Series A-1, (MBIA) | | 5.00 | | | 07/01/14 | | | 1,074,110 |
| | 1,000,000 | | Los Angeles, California, General Obligation Bonds, Series A, (MBIA) | | 4.00 | | | 09/01/13 | | | 1,022,110 |
| | 1,000,000 | | Los Angeles, California, Sanitation Equipment Charge Revenue Bonds, (FGIC) | | 5.00 | | | 02/01/13 | | | 1,072,380 |
| | 1,000,000 | | Los Angeles, California, Sanitation Equipment Charge Revenue Bonds, Series A, (FSA) | | 5.00 | | | 02/01/10 | | | 1,039,970 |
| | 1,500,000 | | Los Angeles, California, Waste Water System Revenue Bonds, Series B, (MBIA) | | 5.00 | | | 06/01/10 | | | 1,566,660 |
See Notes to Financial Statements.
28
Excelsior Tax-Exempt Funds, Inc.
Portfolio of Investments — March 31, 2007
California Short-Intermediate Tax-Exempt Income Fund — (continued)
| | | | | | | | | | | |
Principal
Amount | | | | Rate | | | Maturity
Date | | Value |
| | | | | | | | | | | |
| | TAX-EXEMPT SECURITIES — (continued) | | | |
| $ | 1,000,000 | | Napa County, California, Flood Protection & Watershed Improvement Authority, General Obligation Bonds, (AMBAC) | | 4.50 | % | | 06/15/12 | | $ | 1,044,200 |
| | 1,150,000 | | Orange County, California, Local Transportation Authority Sales Tax Revenue Bonds, (AMBAC) | | 6.20 | | | 02/14/11 | | | 1,240,770 |
| | 1,100,000 | | Orange County, California, Local Transportation Authority Sales Tax Revenue Bonds, 1st Senior, (AMBAC) | | 6.00 | | | 02/15/08 | | | 1,123,331 |
| | 1,000,000 | | Rancho, California, Water District Financing Authority Revenue Bonds, Series A, (FSA) | | 5.50 | | | 08/01/10 | | | 1,062,210 |
| | 1,000,000 | | San Diego County, California, Certificates of Participation, (AMBAC) | | 5.00 | | | 11/01/11 | | | 1,059,840 |
| | 1,000,000 | | San Diego, California, Public Facilities Financing Authority Sewer Revenue Bonds, (FGIC) | | 5.20 | | | 05/15/13 | | | 1,001,730 |
| | 1,000,000 | | San Diego, California, Public Facilities Financing Authority Water Revenue Bonds, (MBIA) | | 5.00 | | | 08/01/11 | | | 1,058,850 |
| | 1,000,000 | | San Francisco, California, City & County General Obligation Bonds, (FSA) | | 5.00 | | | 06/15/08 | | | 1,018,210 |
| | 1,000,000 | | San Francisco, California, City & County Public Utilities Communication Clean Water Revenue Bond, (MBIA) | | 5.00 | | | 10/01/13 | | | 1,074,290 |
| | 3,000,000 | | San Francisco, California, State Building Authority Lease Revenue Bonds, California State & San Francisco Civic Center, Series A | | 5.00 | | | 12/01/12 | | | 3,187,860 |
| | | | | | | | | | | |
Principal
Amount | | | | Rate | | | Maturity
Date | | Value |
| | | | | | | | | | | |
| | TAX-EXEMPT SECURITIES — (continued) | | | |
| $ | 1,000,000 | | San Mateo, Foster City, California, School Facilities Financing Authority Revenue Bond, (FSA) | | 4.00 | % | | 08/15/12 | | $ | 1,021,280 |
| | 1,075,000 | | Santa Clara County, California, Financing Authority Lease Revenue Bonds, Multiple Facilities Project, Series A, (AMBAC) | | 4.50 | | | 05/15/12 | | | 1,094,468 |
| | 1,000,000 | | Southern California Public Power Authority Revenue Bonds, Transmission Project, Series A, (MBIA) | | 5.25 | | | 07/01/09 | | | 1,031,100 |
| | 1,000,000 | | Southern California Public Power Authority Revenue Bonds, Transmission Project, Series B, (FSA) | | 4.25 | | | 07/01/11 | | | 1,028,490 |
| | | | | | | | | | | |
| | | TOTAL TAX-EXEMPT SECURITIES
(Cost $48,162,886) | | | 48,223,395 |
| | | | | | | | | | | |
| TAX-EXEMPT SECURITIES – ESCROWED IN U.S.
GOVERNMENTS — 11.13% |
| | 2,000,000 | | Riverside, California, Water Revenue Bonds, (FGIC) (Prerefunded 10/01/11 @ 101) | | 5.00 | | | 10/01/26 | | | 2,138,220 |
| | 1,000,000 | | Sacramento, California, City Financing Authority Revenue Bonds, City Hall, Series A, (FSA) (Prerefunded 12/01/12 @ 100) | | 5.25 | | | 12/01/17 | | | 1,086,410 |
| | 3,000,000 | | San Diego County, California, Water Authority Certificates of Participation, Series A, (FGIC) (Prerefunded 05/01/08 @ 101) | | 5.00 | | | 05/01/14 | | | 3,076,860 |
| | | | | | | | | | | |
| | | TOTAL TAX-EXEMPT SECURITIES —ESCROWED IN U.S. GOVERNMENTS
(Cost $6,378,711) | | | 6,301,490 |
| | | | | | | | | | | |
See Notes to Financial Statements.
29
Excelsior Tax-Exempt Funds, Inc.
Portfolio of Investments — March 31, 2007
California Short-Intermediate Tax-Exempt Income Fund — (continued)
| | | | | | | | | |
| | | | |
| Shares | | | | | | | | | Value |
| REGISTERED INVESTMENT COMPANIES — 2.62% |
| 1,026,164 | | BlackRock California Money Fund | | $ | 1,026,164 |
| 455,820 | | Federated California Money Fund | | | 455,820 |
| | | | | | | | | |
| | TOTAL REGISTERED INVESTMENT COMPANIES
(Cost $1,481,984) | | | 1,481,984 |
| | | | | | | | | |
| | | | | | | | | | |
TOTAL INVESTMENTS
(Cost $56,023,581) | | 98.94 | % | | $ | 56,006,869 |
OTHER ASSETS IN EXCESS OF LIABILITIES | | 1.06 | | | | 598,358 |
| | | | | | |
NET ASSETS | | 100.00 | % | | $ | 56,605,227 |
| | | | | | |
AMBAC—American Municipal Bond Assurance Corp.
FGIC—Financial Guaranty Insurance Corp.
FSA—Financial Security Assurance
MBIA—Municipal Bond Insurance Association
Notes (The following notes have not been audited by PricewaterhouseCoopers LLP):
These municipal securities meet the three highest ratings assigned by Moody’s Investors Services, Inc. or Standard and Poor’s Corporation or, where not rated, are determined by the Advisor, under the supervision of the Board of Directors, to be of comparable quality at the time of purchase to rated instruments that may be acquired by the Fund.
At March 31, 2007, approximately 11% of the net assets are invested in municipal securities that have letter of credit enhancement features or escrows in U.S. Government securities backing them, on which the Fund relies. Without such features, the securities may or may not meet the quality standards of securities purchased by the Fund.
At March 31, 2007, approximately, 96% of the net assets are invested in California municipal securities. Economic changes affecting the state and certain of its public bodies and municipalities may affect the ability of issuers to pay the required principal and interest payments of the municipal securities.
The summary of the Fund’s investments as of March 31, 2007 is as follows: (Unaudited)
| | | | | | |
Portfolio Diversification | | % of
Net
Assets | | | Value |
Revenue Bonds | | 65.66 | % | | $ | 37,166,263 |
General Obligation Bonds | | 17.66 | | | | 9,997,292 |
Prerefunded | | 11.13 | | | | 6,301,490 |
Registered Investment Companies | | 2.62 | | | | 1,481,984 |
Certificates of Participation | | 1.87 | | | | 1,059,840 |
| | | | | | |
Total Investments | | 98.94 | % | | $ | 56,006,869 |
Other Assets in Excess of Liabilities | | 1.06 | | | | 598,358 |
| | | | | | |
Net Assets | | 100.00 | % | | $ | 56,605,227 |
| | | | | | |
See Notes to Financial Statements.
30
Excelsior Funds, Inc.
Portfolio of Investments — March 31, 2007
Core Bond Fund
| | | | | | | | | | | |
Principal
Amount | | | | Rate | | | Maturity
Date | | Value |
| | | | | | | | | | | |
| | ASSET BACKED SECURITIES — 0.77% |
| $ | 4,200,000 | | Capital Auto Receivables Asset Trust, 2006-SN1AC B(a) | | 5.50 | % | | 04/20/10 | | $ | 4,220,546 |
| | | | | | | | | | | |
| | | TOTAL ASSET BACKED SECURITIES
(Cost $4,199,070) | | | 4,220,546 |
| | | | | | | | | | | |
| | COLLATERALIZED MORTGAGE OBLIGATIONS — 7.74% |
| | | NON-GOVERNMENTAL AGENCY COLLATERALIZED MORTGAGE OBLIGATIONS — 6.71% |
| | 581,837 | | Bear Stearns Adjustable Rate Mortgage Trust, 2004-10, 15A1(b) | | 4.50 | | | 01/25/35 | | | 574,878 |
| | 1,970,974 | | Citigroup Mortgage Loan Trust, 2004-HYB4 WA(b) | | 4.46 | | | 12/25/34 | | | 1,947,220 |
| | 3,066,439 | | Countrywide Alternative Loan Trust, 2004-16CB 1A2 | | 5.50 | | | 07/25/34 | | | 3,034,154 |
| | 1,840,406 | | Countrywide Alternative Loan Trust, 2004-22CB 1A1 | | 6.00 | | | 10/25/34 | | | 1,845,870 |
| | 8,256,407 | | Indymac Index Mortgage Loan Trust, 2004-AR4 3A(b) | | 4.74 | | | 08/25/34 | | | 8,239,692 |
| | 7,906,553 | | JP Morgan Mortgage Trust, 2005-A6 1A1(b) | | 5.15 | | | 09/25/35 | | | 7,834,919 |
| | 10,915,388 | | Wells Fargo Mortgage Backed Securities Trust, 2004-EE 3A1 | | 3.99 | | | 12/25/34 | | | 10,709,611 |
| | 2,852,286 | | Wells Fargo Mortgage Backed Securities Trust, 2005-AR1 1A1(b) | | 5.54 | | | 02/25/35 | | | 2,806,770 |
| | | | | | | | | | | |
| | | | | | | | | | | 36,993,114 |
| | | | | | | | | | | |
| | | FEDERAL HOME LOAN MORTGAGE CORPORATION — 0.48% |
| | 2,580,601 | | 2333 UZ | | 6.50 | | | 07/15/31 | | | 2,644,186 |
| | | | | | | | | | | |
| | | FEDERAL NATIONAL MORTGAGE
ASSOCIATION — 0.55% |
| | 3,080,000 | | 2003-17 QT | | 5.00 | | | 08/25/27 | | | 3,058,976 |
| | | | | | | | | | | |
| | | TOTAL COLLATERALIZED MORTGAGE OBLIGATIONS
(Cost $43,170,173) | | | 42,696,276 |
| | | | | | | | | | | |
| | | | | | | | | | | |
Principal
Amount | | | | Rate | | | Maturity
Date | | Value |
| | | | | | | | | | | |
| | COMMERCIAL MORTGAGE-BACKED SECURITIES — 11.77% |
| $ | 4,225,000 | | Asset Securitization Corp., 1997-D4 A4(b) | | 7.26 | % | | 04/14/29 | | $ | 4,443,489 |
| | 2,497,000 | | Bank of America Commercial Mortgage, Inc., 2004-1 A4 | | 4.76 | | | 11/10/39 | | | 2,426,294 |
| | 5,000,000 | | Bear Stearns Commercial Mortgage Securities, 2006-PW13 A3(b) | | 5.52 | | | 09/11/41 | | | 5,064,335 |
| | 1,000,000 | | Credit Suisse First Boston Mortgage Securities Corp., 2002-CKS4 G(a)(b) | | 6.01 | | | 11/15/36 | | | 1,026,906 |
| | 1,781,000 | | GMAC Commercial Mortgage Securities, 1999-C1(b) | | 6.84 | | | 05/15/33 | | | 1,832,944 |
| | 3,449,000 | | Greenwich Capital Commercial Funding Corp., 2004-GG1 A1 | | 5.32 | | | 06/10/36 | | | 3,460,227 |
| | 3,150,000 | | Morgan Stanley Dean Witter Capital I, 2000-LIF2 C | | 7.50 | | | 10/15/33 | | | 3,370,250 |
| | 1,245,000 | | Morgan Stanley Dean Witter Capital I, 2003-TOP9 A2 | | 4.74 | | | 11/13/36 | | | 1,217,836 |
| | 5,571,000 | | Nomura Asset Securities Corp., 1998-D6 A4(b) | | 6.91 | | | 03/15/30 | | | 6,266,777 |
| | 4,225,000 | | Wachovia Bank Commercial Mortgage Trust, 2002-C1 A4 | | 6.29 | | | 04/15/34 | | | 4,427,224 |
| | 3,601,000 | | Wachovia Bank Commercial Mortgage Trust, 2003-C9 A3 | | 4.61 | | | 12/15/35 | | | 3,535,827 |
| | 6,099,000 | | Wachovia Bank Commercial Mortgage Trust, 2004-C12 A2 | | 5.00 | | | 07/15/41 | | | 6,069,355 |
| | 3,905,000 | | Wachovia Bank Commercial Mortgage Trust, 2004-C12 A3 | | 5.23 | | | 07/15/41 | | | 3,917,688 |
| | 17,926,000 | | Wachovia Bank Commercial Mortgage Trust, 2005-C20 A5 | | 5.09 | | | 07/15/42 | | | 17,862,640 |
| | | | | | | | | | | |
| | | TOTAL COMMERCIAL MORTGAGE-BACKED SECURITIES
(Cost $65,218,292) | | | 64,921,792 |
| | | | | | | | | | | |
See Notes to Financial Statements.
31
Excelsior Funds, Inc.
Portfolio of Investments — March 31, 2007
Core Bond Fund — (continued)
| | | | | | | | | | | |
Principal
Amount | | | | Rate | | | Maturity
Date | | Value |
| | | | | | | | | | | |
| | CORPORATE BONDS — 17.21% |
| $ | 2,665,000 | | Alcan, Inc. | | 5.00 | % | | 06/01/15 | | $ | 2,556,172 |
| | 2,615,000 | | America Movil S.A. de C.V. | | 5.50 | | | 03/01/14 | | | 2,586,792 |
| | 955,000 | | America Movil S.A. de C.V. | | 6.38 | | | 03/01/35 | | | 940,731 |
| | 5,700,000 | | Bank One Corp. | | 7.88 | | | 08/01/10 | | | 6,168,494 |
| | 4,000,000 | | Barlcays Bank plc(a)(b) | | 5.93 | | | 12/31/49 | | | 4,004,312 |
| | 3,245,000 | | Bear Stearns Co., Inc. | | 5.70 | | | 11/15/14 | | | 3,273,712 |
| | 5,520,000 | | Bottling Group LLC | | 5.50 | | | 04/01/16 | | | 5,551,072 |
| | 2,300,000 | | British Telecommunications plc | | 8.88 | | | 12/15/30 | | | 3,157,930 |
| | 2,000,000 | | Caterpillar, Inc. | | 5.70 | | | 08/15/16 | | | 2,040,552 |
| | 2,000,000 | | Citigroup, Inc. | | 4.25 | | | 07/29/09 | | | 1,967,694 |
| | 1,441,000 | | Comcast Cable Communications | | 6.88 | | | 06/15/09 | | | 1,491,932 |
| | 1,441,000 | | DaimlerChrysler N.A. Holding Corp. | | 7.20 | | | 09/01/09 | | | 1,504,165 |
| | 2,000,000 | | Deutsche Telekom International Finance | | 5.38 | | | 03/23/11 | | | 2,011,018 |
| | 1,310,000 | | Deutsche Telekom International Finance, Multi-Coupon Bond | | 8.00 | | | 06/15/10 | | | 1,420,061 |
| | 1,500,000 | | Deutsche Telekom International Finance, Multi-Coupon Bond | | 8.25 | | | 06/15/30 | | | 1,857,987 |
| | 1,700,000 | | Ford Motor Credit Co. | | 8.63 | | | 11/01/10 | | | 1,734,886 |
| | 2,000,000 | | General Electric Capital Corp. MTN | | 6.00 | | | 06/15/12 | | | 2,078,068 |
| | 1,400,000 | | General Electric Captial Corp. | | 5.00 | | | 11/15/11 | | | 1,395,871 |
| | 5,834,000 | | Household Finance Corp. | | 8.00 | | | 07/15/10 | | | 6,323,892 |
| | 1,388,000 | | JP Morgan Chase & Co. | | 5.75 | | | 01/02/13 | | | 1,423,488 |
| | 2,000,000 | | Lehman Brothers Holdings, Inc. | | 5.75 | | | 01/03/17 | | | 2,004,138 |
| | 885,000 | | Metlife, Inc. | | 5.00 | | | 11/24/13 | | | 876,299 |
| | 2,000,000 | | Morgan Stanley | | 6.75 | | | 04/15/11 | | | 2,115,350 |
| | 685,000 | | Nisource Finance Corp. | | 5.25 | | | 09/15/17 | | | 646,955 |
| | 3,825,000 | | Oracle Corp. | | 5.25 | | | 01/15/16 | | | 3,771,844 |
| | 1,441,000 | | Prudential Financial, Inc. | | 5.10 | | | 09/20/14 | | | 1,414,409 |
| | 4,500,000 | | RBS Capital Trust III(b)(c) | | 5.51 | | | 09/30/14 | | | 4,427,483 |
| | 1,670,000 | | Sprint Capital Corp.(d) | | 8.75 | | | 03/15/32 | | | 1,969,797 |
| | 4,100,000 | | Target Corp. | | 5.88 | | | 07/15/16 | | | 4,219,195 |
| | | | | | | | | | | |
Principal
Amount | | | | Rate | | | Maturity
Date | | Value |
| | | | | | | | | | | |
| | CORPORATE BONDS — (continued) |
| $ | 2,600,000 | | TCI Communications, Inc. | | 9.80 | % | | 02/01/12 | | $ | 3,078,156 |
| | 2,183,000 | | Time Warner Cos., Inc. | | 7.25 | | | 10/15/17 | | | 2,409,853 |
| | 2,000,000 | | UBS Preferred Funding Trust I | | 8.62 | | | 10/29/49 | | | 2,210,662 |
| | 2,441,000 | | Wal-Mart Stores, Inc. | | 4.13 | | | 02/15/11 | | | 2,365,151 |
| | 1,735,000 | | Wal-Mart Stores, Inc. | | 5.00 | | | 04/05/12 | | | 1,728,492 |
| | 5,350,000 | | Wells Fargo & Co. | | 5.00 | | | 11/15/14 | | | 5,196,273 |
| | 950,000 | | Xerox Corp. | | 6.40 | | | 03/15/16 | | | 977,099 |
| | 2,000,000 | | YUM! Brands, Inc. | | 6.25 | | | 04/15/16 | | | 2,055,456 |
| | | | | | | | | | | |
| | | TOTAL CORPORATE BONDS
(Cost $93,910,972) | | | 94,955,441 |
| | | | | | | | | | | |
| | TAX-EXEMPT SECURITIES — 0.32% |
| | 1,590,000 | | Massachusetts Bay Transition Authority, Massachusetts Sales Tax, Revenue Bonds, Series A | | 5.00 | | | 07/01/31 | | | 1,761,561 |
| | | | | | | | | | | |
| | | TOTAL TAX-EXEMPT SECURITIES (Cost $1,753,931) | | | 1,761,561 |
| | | | | | | | | | | |
| | U.S. GOVERNMENT AGENCY BONDS & NOTES — 2.38% |
| | | FANNIE MAE — 1.43% | | | |
| | 7,500,000 | | MTN | | 6.25 | | | 02/01/11 | | | 7,867,613 |
| | | | | | | | | | | |
| | | FREDDIE MAC — 0.50% | | | |
| | 2,440,000 | | | | 6.25 | | | 07/15/32 | | | 2,779,167 |
| | | | | | | | | | | |
| | | RESOLUTION FUNDING
CORPORATION — 0.45% |
| | 4,851,000 | | Principal Only STRIPS(e) | | 0.00 | | | 07/15/20 | | | 2,475,984 |
| | | | | | | | | | | |
| | | TOTAL U.S. GOVERNMENT AGENCY BONDS & NOTES
(Cost $12,830,645) | | | 13,122,764 |
| | | | | | | | | | | |
| U.S. GOVERNMENT AGENCY MORTGAGE PASS THROUGH
SECURITIES — 39.55% |
| | | FEDERAL HOME LOAN MORTGAGE
CORPORATION — 10.62% |
| | 6,330,169 | | Pool # 1G1898 ARM(b) | | 5.92 | | | 06/01/36 | | | 6,371,234 |
| | 2,546,198 | | Pool # A20105 | | 5.00 | | | 04/01/34 | | | 2,465,415 |
| | 9,347,243 | | Pool # A47411 | | 4.50 | | | 10/01/35 | | | 8,790,449 |
| | 2,294,453 | | Pool # A48132 | | 7.00 | | | 12/01/35 | | | 2,367,650 |
| | 5,494,792 | | Pool # B19861 | | 4.50 | | | 08/01/20 | | | 5,320,510 |
| | 2,721,826 | | Pool # C01811 | | 5.00 | | | 04/01/34 | | | 2,635,471 |
| | 130,854 | | Pool # C71221 | | 5.00 | | | 09/01/32 | | | 126,844 |
| | 20,702 | | Pool # C74339 | | 5.00 | | | 12/01/32 | | | 20,068 |
| | 162,308 | | Pool # C74469 | | 5.00 | | | 12/01/32 | | | 157,334 |
| | 32,310 | | Pool # C74676 | | 5.00 | | | 12/01/32 | | | 31,319 |
| | 2,320,547 | | Pool # E96460 | | 5.00 | | | 05/01/18 | | | 2,294,384 |
| | 4,527,416 | | Pool # G01842 | | 4.50 | | | 06/01/35 | | | 4,257,728 |
| | 18,109,227 | | Pool # G18105 | | 5.00 | | | 03/01/21 | | | 17,859,820 |
| | 2,496,422 | | Pool # J01383 | | 5.50 | | | 03/01/21 | | | 2,501,698 |
| | 3,518,057 | | Pool # J02497 | | 4.50 | | | 09/01/20 | | | 3,406,473 |
| | | | | | | | | | | |
| | | | | | | | | | | 58,606,397 |
| | | | | | | | | | | |
See Notes to Financial Statements.
32
Excelsior Funds, Inc.
Portfolio of Investments — March 31, 2007
Core Bond Fund — (continued)
| | | | | | | | | | | |
Principal
Amount | | | | Rate | | | Maturity
Date | | Value |
| | | | | | | | | | | |
| U.S. GOVERNMENT AGENCY MORTGAGE PASS THROUGH
SECURITIES — (continued) |
| | | FEDERAL NATIONAL MORTGAGE ASSOCIATION — 26.85% |
| $ | 203,140 | | Pool # 251502 | | 6.50 | % | | 02/01/13 | | $ | 208,079 |
| | 84,901 | | Pool # 252806 | | 7.50 | | | 10/01/29 | | | 88,996 |
| | 1,197,709 | | Pool # 255896 | | 6.50 | | | 08/01/35 | | | 1,222,557 |
| | 5,032,302 | | Pool # 256269 | | 5.50 | | | 06/01/36 | | | 4,979,818 |
| | 10,462,685 | | Pool # 357824 | | 5.50 | | | 06/01/35 | | | 10,363,931 |
| | 1,232,108 | | Pool # 387203 | | 4.80 | | | 01/01/12 | | | 1,220,457 |
| | 1,052,084 | | Pool # 387204 | | 4.80 | | | 01/01/12 | | | 1,042,136 |
| | 220,898 | | Pool # 443194 | | 5.50 | | | 10/01/28 | | | 219,820 |
| | 3,905 | | Pool # 450846 | | 5.50 | | | 12/01/28 | | | 3,886 |
| | 342,368 | | Pool # 452035 | | 5.50 | | | 11/01/28 | | | 340,697 |
| | 2,306 | | Pool # 454758 | | 5.50 | | | 12/01/28 | | | 2,295 |
| | 580,710 | | Pool # 561435 | | 5.50 | | | 11/01/29 | | | 577,876 |
| | 303,582 | | Pool # 578543 | | 5.50 | | | 04/01/31 | | | 301,098 |
| | 112,425 | | Pool # 627259 | | 5.50 | | | 02/01/32 | | | 111,518 |
| | 963,020 | | Pool # 632551 | | 5.50 | | | 02/01/32 | | | 955,252 |
| | 527,269 | | Pool # 632576 | | 5.50 | | | 02/01/32 | | | 522,955 |
| | 224,747 | | Pool # 694655 | | 5.50 | | | 04/01/33 | | | 222,905 |
| | 1,585,620 | | Pool # 702861 | | 5.00 | | | 04/01/18 | | | 1,567,896 |
| | 1,446,560 | | Pool # 704440 | | 5.00 | | | 05/01/18 | | | 1,430,391 |
| | 63,525 | | Pool # 710585 | | 5.50 | | | 05/01/33 | | | 63,004 |
| | 374,864 | | Pool # 735224 | | 5.50 | | | 02/01/35 | | | 371,792 |
| | 5,754,009 | | Pool # 745275 | | 5.00 | | | 02/01/36 | | | 5,564,857 |
| | 23,425,967 | | Pool # 745432 | | 5.50 | | | 04/01/36 | | | 23,204,855 |
| | 1,038,365 | | Pool # 781859 | | 4.50 | | | 12/01/34 | | | 977,121 |
| | 1,430,339 | | Pool # 786423 ARM(b) | | 4.59 | | | 07/01/34 | | | 1,430,408 |
| | 453,699 | | Pool # 797680 | | 4.50 | | | 10/01/35 | | | 426,940 |
| | 653,931 | | Pool # 805373 | | 4.50 | | | 01/01/35 | | | 615,362 |
| | 6,888,911 | | Pool # 805386 ARM(b) | | 4.86 | | | 01/01/35 | | | 6,887,599 |
| | 753,922 | | Pool # 812268 | | 5.50 | | | 05/01/35 | | | 746,806 |
| | 2,384,829 | | Pool # 815479 | | 4.50 | | | 03/01/35 | | | 2,242,304 |
| | 1,311,382 | | Pool # 819361 | | 4.50 | | | 04/01/35 | | | 1,232,440 |
| | 539,362 | | Pool # 820492 | | 5.50 | | | 05/01/35 | | | 534,271 |
| | 789,575 | | Pool # 820989 | | 5.50 | | | 04/01/35 | | | 782,123 |
| | 743,939 | | Pool # 821567 | | 5.50 | | | 06/01/35 | | | 736,917 |
| | 1,825,542 | | Pool # 822799 | | 4.50 | | | 04/01/35 | | | 1,716,442 |
| | 6,286,038 | | Pool # 829321 | | 4.50 | | | 09/01/35 | | | 5,910,363 |
| | 568,677 | | Pool # 835359 | | 4.50 | | | 09/01/35 | | | 534,691 |
| | 10,562,691 | | Pool # 835751 | | 4.50 | | | 08/01/35 | | | 9,931,429 |
| | 1,876,908 | | Pool # 835760 | | 4.50 | | | 09/01/35 | | | 1,764,738 |
| | 1,946,275 | | Pool # 836512 | | 4.50 | | | 10/01/20 | | | 1,884,356 |
| | 4,297,768 | | Pool # 839240 | | 4.50 | | | 09/01/35 | | | 4,040,919 |
| | 6,727,655 | | Pool # 840687 | | 5.00 | | | 09/01/35 | | | 6,506,496 |
| | 2,818,014 | | Pool # 843510 | | 4.50 | | | 11/01/20 | | | 2,728,362 |
| | 2,389,000 | | Pool # 844085 | | 5.00 | | | 11/01/35 | | | 2,310,466 |
| | 1,856,381 | | Pool # 844797 | | 4.50 | | | 10/01/35 | | | 1,745,438 |
| | 1,895,300 | | Pool # 844901 | | 4.50 | | | 10/01/20 | | | 1,835,003 |
| | 5,733,376 | | Pool # 867438 | | 4.50 | | | 05/01/36 | | | 5,388,279 |
| | 5,280,419 | | Pool # 880084 | | 6.00 | | | 03/01/36 | | | 5,319,669 |
| | 6,234,661 | | Pool # 883084 | | 6.50 | | | 07/01/36 | | | 6,360,137 |
| | 721,630 | | Pool # 893426 | | 6.00 | | | 09/01/36 | | | 726,994 |
| | 3,087,754 | | Pool # 895271 | | 6.50 | | | 09/01/36 | | | 3,149,897 |
| | 15,651,495 | | Pool #745515 | | 5.00 | | | 05/01/36 | | | 15,136,980 |
| | | | | | | | | | | |
| | | | | | | | | | | 148,190,021 |
| | | | | | | | | | | |
| | | | | | | | | | | |
Principal
Amount | | | | Rate | | | Maturity
Date | | Value |
| | | | | | | | | | | |
| U.S. GOVERNMENT AGENCY MORTGAGE PASS THROUGH
SECURITIES — (continued) |
| | | GOVERNMENT NATIONAL MORTGAGE ASSOCIATION — 2.08% |
| $ | 317,132 | | Pool # 2562 | | 6.00 | % | | 03/20/28 | | $ | 322,114 |
| | 427,574 | | Pool # 267812 | | 8.50 | | | 06/15/17 | | | 457,649 |
| | 1,826,845 | | Pool # 3413 | | 4.50 | | | 07/20/33 | | | 1,723,974 |
| | 1,692,191 | | Pool # 3442 | | 5.00 | | | 09/20/33 | | | 1,643,012 |
| | 3,126 | | Pool # 356873 | | 6.50 | | | 05/15/23 | | | 3,212 |
| | 29,602 | | Pool # 434772 | | 9.00 | | | 06/15/30 | | | 32,159 |
| | 62,379 | | Pool # 471660 | | 7.50 | | | 03/15/28 | | | 65,169 |
| | 138,881 | | Pool # 472028 | | 6.50 | | | 05/15/28 | | | 143,024 |
| | 59,613 | | Pool # 475847 | | 6.50 | | | 06/15/28 | | | 61,392 |
| | 20,827 | | Pool # 479087 | | 8.00 | | | 01/15/30 | | | 22,100 |
| | 301,056 | | Pool # 479088 | | 8.00 | | | 01/15/30 | | | 319,463 |
| | 117,882 | | Pool # 503711 | | 7.00 | | | 05/15/29 | | | 123,326 |
| | 41,810 | | Pool # 525556 | | 8.00 | | | 01/15/30 | | | 44,367 |
| | 10,943 | | Pool # 525945 | | 9.00 | | | 07/15/30 | | | 11,888 |
| | 11,128 | | Pool # 532751 | | 9.00 | | | 08/15/30 | | | 12,090 |
| | 107,703 | | Pool # 568670 | | 6.50 | | | 04/15/32 | | | 110,712 |
| | 200,931 | | Pool # 575441 | | 6.50 | | | 12/15/31 | | | 206,730 |
| | 648,104 | | Pool # 598127 | | 5.50 | | | 03/15/18 | | | 652,006 |
| | 1,382,950 | | Pool # 607668 | | 5.50 | | | 02/15/18 | | | 1,391,277 |
| | 804,063 | | Pool # 615639 | | 4.50 | | | 09/15/33 | | | 762,300 |
| | 159,755 | | Pool # 780086 | | 8.50 | | | 11/15/17 | | | 169,766 |
| | 730,469 | | Pool # 780548 | | 8.50 | | | 12/15/17 | | | 776,244 |
| | 558,792 | | Pool # 780865 | | 9.50 | | | 11/15/17 | | | 606,479 |
| | 184,481 | | Pool # 781036 | | 8.00 | | | 10/15/17 | | | 194,274 |
| | 690,973 | | Pool # 781084 | | 9.00 | | | 12/15/17 | | | 739,239 |
| | 178,286 | | Pool # 80185 ARM(b) | | 5.38 | | | 04/20/28 | | | 180,114 |
| | 205,478 | | Pool # 80205 ARM(b) | | 5.38 | | | 06/20/28 | | | 207,590 |
| | 487,576 | | Pool # 80311 ARM(b) | | 5.50 | | | 08/20/29 | | | 492,754 |
| | | | | | | | | | | |
| | | | | | | | | | | 11,474,424 |
| | | | | | | | | | | |
| | | TOTAL U.S. GOVERNMENT AGENCY MORTGAGE PASS THROUGH SECURITIES
(Cost $217,605,864) | | | 218,270,842 |
| | | | | | | | | | | |
| | U.S. GOVERNMENT SECURITIES — 12.34% |
| | | U.S. TREASURY INFLATION PROTECTED
BONDS — 0.86% |
| | 300,000 | | | | 4.25 | | | 01/15/10 | | | 383,812 |
| | 445,000 | | | | 3.50 | | | 01/15/11 | | | 546,429 |
| | 1,050,000 | | | | 2.00 | | | 01/15/14 | | | 1,139,021 |
| | 2,500,000 | | | | 2.38 | | | 01/15/25 | | | 2,702,006 |
| | | | | | | | | | | |
| | | | | | | | | | | 4,771,268 |
| | | | | | | | | | | |
| | | U.S. TREASURY NOTES — 11.48% |
| | 520,000 | | (f) | | 4.63 | | | 09/30/08 | | | 519,147 |
| | 3,970,000 | | | | 3.63 | | | 01/15/10 | | | 3,874,629 |
| | 26,285,000 | | | | 4.50 | | | 11/15/10 | | | 26,264,498 |
| | 24,450,000 | | | | 7.63 | | | 11/15/22 | | | 31,643,654 |
| | 885,000 | | | | 4.50 | | | 02/15/36 | | | 834,389 |
| | 200,000 | | | | 4.75 | | | 02/15/37 | | | 196,875 |
| | | | | | | | | | | |
| | | | | | | | | | | 63,333,192 |
| | | | | | | | | | | |
| | | TOTAL U.S. GOVERNMENT SECURITIES
(Cost $68,307,564) | | | 68,104,460 |
| | | | | | | | | | | |
See Notes to Financial Statements.
33
Excelsior Funds, Inc.
Portfolio of Investments — March 31, 2007
Core Bond Fund — (continued)
| | | | | | | | | |
| Contracts | | | | | | | | Value |
| CALL OPTION PURCHASED — 0.00% |
| 10 | | Euro Dollar Future, Expires 12/17/07 strike price 95.75 | | $ | 1,813 |
| | | | | | | | | |
| | TOTAL CALL OPTION PURCHASED (Cost $3,025) | | | 1,813 |
| | | | | | | | | |
| Shares | | | | | | | | |
| REGISTERED INVESTMENT COMPANIES — 7.67% |
| 21,150,173 | | Dreyfus Government Cash Management Fund | | | 21,150,173 |
| 21,150,172 | | Fidelity U.S. Treasury II Fund | | | 21,150,172 |
| | | | | | | | | |
| | TOTAL REGISTERED INVESTMENT COMPANIES
(Cost $42,300,345) | | | 42,300,345 |
| | | | | | | | | |
| | | | | | | | | | |
TOTAL INVESTMENTS
(Cost $549,299,881) | | 99.75 | % | | | | | | $ | 550,355,840 |
OTHER ASSETS IN EXCESS OF LIABILITIES | | 0.25 | | | | | | | | 1,363,933 |
| | | | | | | | | | |
NET ASSETS | | 100.00 | % | | | | | | $ | 551,719,773 |
| | | | | | | | | | |
| (a) | Security exempt from registration under Rule 144A of the Securities Act of 1933. This security may be resold in transactions exempt from registration, normally to qualified institutional buyers. At March 31, 2007, these securities amounted to $9,251,764 or 1.68% of net assets. |
| (b) | Variable Rate Security—The rate disclosed is as of March 31, 2007. |
| (c) | Perpetual Security—Stated maturity is first par call date. |
| (d) | All or part of the security is segregated by the Fund’s custodian to cover future purchase commitments. |
| (f) | All or part of the security serves as collateral for futures contracts. |
ARM—Adjustable Rate Mortgage
LLC—Limited Liability Company
MTN—Medium Term Note
Multi-Coupon Bond—Coupon rate may increase or decrease in response to a change in the quality rating by an independent rating agency.
plc—Public Limited Company
STRIPS—Separately Traded Registered Interest and Principal Securities
| | | | | | | | | | | |
| Contracts | | | | | Value | | | Unrealized
Appreciation/
Depreciation | |
| FUTURES CONTRACTS | |
| Long — | | | | | | | | | | | |
| 85 | | | U.S. 2 Year Treasury Note, expiring June 29, 2007 (notional amount $17,435,838) | | $ | 17,415,703 | | | $ | (20,135 | ) |
| Short — | | | | | | | | | | | |
| (30 | ) | | U.S. Long-Term Treasury Bond, expiring June 20, 2007 (notional amount $(3,398,363)) | | | (3,337,500 | ) | | | 60,863 | |
| | | | | | | | | | | |
| | | TOTAL FUTURES CONTRACTS (Total notional amount $14,037,475) | | $ | 14,078,203 | | | $ | 40,728 | |
| | | | | | | | | | | |
The summary of the Fund’s investments as of March 31, 2007 is as follows: (Unaudited)
| | | | | | |
Portfolio Diversification | | % of
Net
Assets | | | Value |
U.S. Government & Agency Securities | | 54.27 | % | | $ | 299,498,066 |
Corporate Bonds | | 17.21 | | | | 94,955,441 |
Commercial Mortgage-Backed Securities | | 11.77 | | | | 64,921,792 |
Collateralized Mortgage Obligations | | 7.74 | | | | 42,696,276 |
Registered Investment Companies | | 7.67 | | | | 42,300,345 |
Asset Backed Securities | | 0.77 | | | | 4,220,546 |
Tax-Exempt Securities | | 0.32 | | | | 1,761,561 |
Call Option | | 0.00 | | | | 1,813 |
| | | | | | |
Total Investments | | 99.75 | % | | $ | 550,355,840 |
Other Assets in Excess of Liabilities | | 0.25 | | | | 1,363,933 |
| | | | | | |
Net Assets | | 100.00 | % | | $ | 551,719,773 |
| | | | | | |
See Notes to Financial Statements
34
Excelsior Funds Trust
Portfolio of Investments — March 31, 2007
High Yield Fund
| | | | | | | | | | | |
Principal
Amount | | | | Rate | | | Maturity
Date | | Value |
| | | | | | | | | | | |
| | CORPORATE BONDS — 89.98% | | | | | | |
| | | ADVERTISING PERIODICALS — 2.74% |
| $ | 2,000,000 | | Dex Media Finance/West | | 8.50 | % | | 08/15/10 | | $ | 2,092,500 |
| | 1,000,000 | | RH Donnelley Finance Corp.(a) | | 10.88 | | | 12/15/12 | | | 1,080,000 |
| | | | | | | | | | | |
| | | | | | | | | | | 3,172,500 |
| | | | | | | | | | | |
| | | CABLE TV — 1.80% | | | |
| | 1,000,000 | | Echostar DBS Corp. | | 7.13 | | | 02/01/16 | | | 1,032,500 |
| | 1,000,000 | | NTL Cable plc | | 9.13 | | | 08/15/16 | | | 1,055,000 |
| | | | | | | | | | | |
| | | | | | | | | | | 2,087,500 |
| | | | | | | | | | | |
| | | CASINO HOTELS — 7.76% | | | |
| | 1,000,000 | | American Casino & Entertainment | | 7.85 | | | 02/01/12 | | | 1,040,000 |
| | 1,000,000 | | Boyd Gaming Corp. | | 7.13 | | | 02/01/16 | | | 980,000 |
| | 1,500,000 | | Majestic Star llc. | | 9.75 | | | 01/15/11 | | | 1,428,750 |
| | 1,000,000 | | MGM Mirage, Inc. | | 8.50 | | | 09/15/10 | | | 1,068,750 |
| | 2,000,000 | | Poster Financial Group | | 8.75 | | | 12/01/11 | | | 2,080,000 |
| | 1,000,000 | | Station Casinos, Inc. | | 6.63 | | | 03/15/18 | | | 890,000 |
| | 1,500,000 | | Trump Entertainment Resorts | | 8.50 | | | 06/01/15 | | | 1,515,000 |
| | | | | | | | | | | |
| | | | | | | | | | | 9,002,500 |
| | | | | | | | | | | |
| | | CELLULAR TELECOM — 1.19% |
| | 330,000 | | American Cellular Corp. | | 10.00 | | | 08/01/11 | | | 349,388 |
| | 1,000,000 | | Dobson Communications Corp. | | 8.88 | | | 10/01/13 | | | 1,030,000 |
| | | | | | | | | | | |
| | | | | | | | | | | 1,379,388 |
| | | | | | | | | | | |
| | | CHEMICALS – DIVERSIFIED — 1.39% |
| | 1,000,000 | | Lyondell Chemical Co. | | 10.50 | | | 06/01/13 | | | 1,095,000 |
| | 500,000 | | Nell AF Sarl(a) | | 8.38 | | | 08/15/15 | | | 521,250 |
| | | | | | | | | | | |
| | | | | | | | | | | 1,616,250 |
| | | | | | | | | | | |
| | | CHEMICALS – SPECIALTY — 0.91% |
| | 1,000,000 | | Tronox Worldwide LLC/Tronox Finance Corp. | | 9.50 | | | 12/01/12 | | | 1,060,000 |
| | | | | | | | | | | |
| | | COAL — 1.70% | | | |
| | 1,000,000 | | Massey Energy Co. | | 6.88 | | | 12/15/13 | | | 948,750 |
| | 1,000,000 | | Peabody Energy Corp., Series B | | 6.88 | | | 03/15/13 | | | 1,017,500 |
| | | | | | | | | | | |
| | | | | | | | | | | 1,966,250 |
| | | | | | | | | | | |
| | | COMMERCIAL SERVICES — 1.77% |
| | 1,000,000 | | Iron Mountain, Inc. | | 8.63 | | | 04/01/13 | | | 1,029,000 |
| | 1,000,000 | | Iron Mountain, Inc. | | 7.75 | | | 01/15/15 | | | 1,020,000 |
| | | | | | | | | | | |
| | | | | | | | | | | 2,049,000 |
| | | | | | | | | | | |
| | | | | | | | | | | |
Principal
Amount | | | | Rate | | | Maturity
Date | | Value |
| | | | | | | | | | | |
| | CORPORATE BONDS — (continued) | | | | | | |
| | | COMPUTER SERVICES — 0.94% |
| $ | 1,000,000 | | Sungard Data Systems, Inc. | | 10.25 | % | | 08/15/15 | | $ | 1,091,250 |
| | | | | | | | | | | |
| | | CONTAINERS – METAL/GLASS — 1.78% |
| | 1,000,000 | | Crown Americas | | 7.75 | | | 11/15/15 | | | 1,040,000 |
| | 1,000,000 | | Owens-Brockway Glass Containers | | 8.88 | | | 02/15/09 | | | 1,020,000 |
| | | | | | | | | | | |
| | | | | | | | | | | 2,060,000 |
| | | | | | | | | | | |
| | | CONTAINERS – PAPER/PLASTIC — 2.66% |
| | 1,000,000 | | Graham Packaging Co. | | 8.50 | | | 10/15/12 | | | 1,015,000 |
| | 1,000,000 | | Jefferson Smurfit Corp. | | 7.50 | | | 06/01/13 | | | 970,000 |
| | 1,000,000 | | Pregis Corp.(a) | | 12.38 | | | 10/15/13 | | | 1,100,000 |
| | | | | | | | | | | |
| | | | | | | | | | | 3,085,000 |
| | | | | | | | | | | |
| | | COSMETICS & TOILETRIES — 1.21% |
| | 1,500,000 | | Del Laboratories, Inc. | | 8.00 | | | 02/01/12 | | | 1,398,750 |
| | | | | | | | | | | |
| | | DISTRIBUTION/WHOLESALE — 0.87% |
| | 1,000,000 | | Nebraska Book Co. | | 8.63 | | | 03/15/12 | | | 1,007,500 |
| | | | | | | | | | | |
| | | DIVERSIFIED MANUFACTURING
OPERATIONS — 0.89% |
| | 1,000,000 | | Bombardier, Inc.(a) | | 8.00 | | | 11/15/14 | | | 1,035,000 |
| | | | | | | | | | | |
| | | ELECTRIC – GENERATION — 1.38% |
| | 1,500,000 | | AES Corp. | | 9.50 | | | 06/01/09 | | | 1,597,500 |
| | | | | | | | | | | |
| | | ELECTRONIC COMPONENTS – SEMICONDUCTORS — 2.19% |
| | 1,000,000 | | Amkor Technologies, Inc. | | 9.25 | | | 06/01/16 | | | 1,042,500 |
| | 500,000 | | Freescale Semiconductor(a) | | 8.88 | | | 12/15/14 | | | 500,625 |
| | 1,000,000 | | Freescale Semiconductor(a) | | 9.13 | | | 12/15/14 | | | 992,500 |
| | | | | | | | | | | |
| | | | | | | | | | | 2,535,625 |
| | | | | | | | | | | |
| | | FINANCE – AUTO LOANS — 3.00% |
| | 1,354,000 | | Ford Motor Credit Co.(a) | | 9.75 | | | 09/15/10 | | | 1,426,225 |
| | 2,000,000 | | General Motors Acceptance Corp. | | 7.75 | | | 01/19/10 | | | 2,052,842 |
| | | | | | | | | | | |
| | | | | | | | | | | 3,479,067 |
| | | | | | | | | | | |
| | | FINANCE – INVESTMENT BNKR/BRKR — 0.06% |
| | 60,000 | | BCP Crystal Holdings Corp. | | 9.63 | | | 06/15/14 | | | 68,155 |
| | | | | | | | | | | |
| | | FOOD & KINDRED PRODUCTS — 0.85% |
| | 1,000,000 | | Pinnacle Foods Finance LLC(a) | | 9.25 | | | 04/01/15 | | | 982,500 |
| | | | | | | | | | | |
See Notes to Financial Statements.
35
Excelsior Funds Trust
Portfolio of Investments — March 31, 2007
High Yield Fund — (continued)
| | | | | | | | | | | |
Principal
Amount | | | | Rate | | | Maturity
Date | | Value |
| | | | | | | | | | | |
| | CORPORATE BONDS — (continued) | | | | | | |
| | | FOOD – MISCELLANEOUS AND DIVERSIFIED — 1.78% |
| $ | 1,000,000 | | Del Monte Corporation | | 8.63 | % | | 12/15/12 | | $ | 1,040,000 |
| | 1,000,000 | | Del Monte Corporation | | 6.75 | | | 02/15/15 | | | 988,750 |
| | 40,000 | | Dole Foods Co. | | 7.25 | | | 06/15/10 | | | 38,200 |
| | | | | | | | | | | |
| | | | | | | | | | | 2,066,950 |
| | | | | | | | | | | |
| | | FUNERAL SERVICES & RELATED ITEMS — 1.30% |
| | 1,500,000 | | Service Corp. International | | 7.00 | | | 06/15/17 | | | 1,511,250 |
| | | | | | | | | | | |
| | | HEAVY CONSTRUCTION EQUIPMENT
RENTAL — 0.90% |
| | 1,000,000 | | Ahern Rentals, Inc. | | 9.25 | | | 08/15/13 | | | 1,043,750 |
| | | | | | | | | | | |
| | | HOME FURNISHINGS — 1.79% |
| | 1,000,000 | | Sealy Mattress Co. | | 8.25 | | | 06/15/14 | | | 1,052,500 |
| | 1,000,000 | | Simmons Co. | | 7.88 | | | 01/15/14 | | | 1,025,000 |
| | | | | | | | | | | |
| | | | | | | | | | | 2,077,500 |
| | | | | | | | | | | |
| | | MACHINERY – FARM — 0.45% |
| | 500,000 | | Case New Holland, Inc. | | 7.13 | | | 03/01/14 | | | 520,000 |
| | | | | | | | | | | |
| | | MACHINERY – GENERAL INDUSTRIAL — 0.88% |
| | 1,000,000 | | The Manitowoc Co., Inc. | | 7.13 | | | 11/01/13 | | | 1,020,000 |
| | | | | | | | | | | |
| | | MEDICAL – HOSPITALS — 0.90% |
| | 1,000,000 | | HCA, Inc. | | 8.75 | | | 09/01/10 | | | 1,048,750 |
| | | | | | | | | | | |
| | | MULTI-LINE INSURANCE — 1.97% |
| | 2,128,000 | | Hanover Insurance Group | | 7.63 | | | 10/15/25 | | | 2,285,349 |
| | | | | | | | | | | |
| | | MUSIC — 1.31% |
| | 1,600,000 | | Warner Music Group | | 7.38 | | | 04/15/14 | | | 1,524,000 |
| | | | | | | | | | | |
| | | OFFICE AUTOMATION & EQUIPMENT — 3.14% |
| | 1,000,000 | | Ikon Office Solutions | | 7.75 | | | 09/15/15 | | | 1,045,000 |
| | 1,000,000 | | Xerox Capital Trust I | | 8.00 | | | 02/01/27 | | | 1,020,000 |
| | 1,500,000 | | Xerox Corp. | | 7.63 | | | 06/15/13 | | | 1,573,125 |
| | | | | | | | | | | |
| | | | | | | | | | | 3,638,125 |
| | | | | | | | | | | |
| | | PAPER & RELATED PRODUCTS — 0.86% |
| | 1,000,000 | | Mercer International, Inc. | | 9.25 | | | 02/15/13 | | | 1,002,500 |
| | | | | | | | | | | |
| | | PHYSICIANS PRACTICE MANAGEMENT — 3.18% |
| | 2,000,000 | | Ameripath, Inc. | | 10.50 | | | 04/01/13 | | | 2,140,000 |
| | 500,000 | | US Oncology Holdings, Inc. | | 9.00 | | | 08/15/12 | | | 533,750 |
| | 1,000,000 | | US Oncology Holdings, Inc.(b) | | 10.58 | | | 03/15/15 | | | 1,020,000 |
| | | | | | | | | | | |
| | | | | | | | | | | 3,693,750 |
| | | | | | | | | | | |
| | | | | | | | | | | |
Principal
Amount | | | | Rate | | | Maturity
Date | | Value |
| | | | | | | | | | | |
| | CORPORATE BONDS — (continued) | | | | | | |
| | | PIPELINES — 1.75% |
| $ | 1,500,000 | | Semgroup L.P.(a) | | 8.75 | % | | 11/15/15 | | $ | 1,522,500 |
| | 500,000 | | Williams Cos.(a) | | 6.38 | | | 10/01/10 | | | 506,875 |
| | | | | | | | | | | |
| | | | | | | | | | | 2,029,375 |
| | | | | | | | | | | |
| | | RACETRACKS — 0.84% |
| | 1,000,000 | | Penn National Gaming, Inc. | | 6.75 | | | 03/01/15 | | | 970,000 |
| | | | | | | | | | | |
| | | RENTAL AUTO/EQUIPMENT — 2.68% |
| | 1,000,000 | | Avis Budget Car Rental(a) | | 7.75 | | | 05/15/16 | | | 1,020,000 |
| | 1,000,000 | | Rental Service Corp.(a) | | 9.50 | | | 12/01/14 | | | 1,065,000 |
| | 1,000,000 | | United Rentals, Inc. | | 7.75 | | | 11/15/13 | | | 1,027,500 |
| | | | | | | | | | | |
| | | | | | | | | | | 3,112,500 |
| | | | | | | | | | | |
| | | RESORTS/THEME PARKS — 0.89% |
| | 1,000,000 | | Universal City Florida Holdings(b) | | 10.11 | | | 05/01/10 | | | 1,031,250 |
| | | | | | | | | | | |
| | | RETAIL – APPAREL/SHOE — 1.10% |
| | 1,250,000 | | Burlington Coat Factory | | 11.13 | | | 04/15/14 | | | 1,275,000 |
| | | | | | | | | | | |
| | | RETAIL – ARTS & CRAFTS — 0.93% |
| | 1,000,000 | | Michaels Stores, Inc.(a) | | 11.38 | | | 11/01/16 | | | 1,077,500 |
| | | | | | | | | | | |
| | | RETAIL – DRUG STORE — 2.51% |
| | 1,000,000 | | Jean Coutu Group, Inc. | | 8.50 | | | 08/01/14 | | | 1,085,000 |
| | 1,000,000 | | Rite Aid Corp. | | 8.63 | | | 03/01/15 | | | 946,250 |
| | 1,000,000 | | Rite-Aid Corp. | | 6.88 | | | 08/15/13 | | | 880,000 |
| | | | | | | | | | | |
| | | | | | | | | | | 2,911,250 |
| | | | | | | | | | | |
| | | RETAIL – MAJOR DEPARTMENT STORE — 1.90% |
| | 1,000,000 | | Neiman Marcus Group, Inc. | | 9.00 | | | 10/15/15 | | | 1,095,000 |
| | 1,000,000 | | Saks, Inc. | | 9.88 | | | 10/01/11 | | | 1,112,500 |
| | | | | | | | | | | |
| | | | | | | | | | | 2,207,500 |
| | | | | | | | | | | |
| | | RETAIL – TOY STORE — 1.11% |
| | 1,500,000 | | Toys R Us | | 7.38 | | | 10/15/18 | | | 1,290,000 |
| | | | | | | | | | | |
| | | RETAIL – VIDEO RENTAL — 1.74% |
| | 2,000,000 | | Blockbuster, Inc.(b) | | 9.00 | | | 09/01/12 | | | 2,020,000 |
| | | | | | | | | | | |
| | | SATELLITE TELECOM — 2.54% |
| | 650,000 | | Inmarsat Finance plc | | 7.63 | | | 06/30/12 | | | 677,625 |
| | 2,000,000 | | Intelsat Bermuda Ltd. | | 11.25 | | | 06/15/16 | | | 2,270,000 |
| | | | | | | | | | | |
| | | | | | | | | | | 2,947,625 |
| | | | | | | | | | | |
| | | SCHOOLS — 1.27% |
| | 1,500,000 | | Knowledge Learning Center(a) | | 7.75 | | | 02/01/15 | | | 1,473,750 |
| | | | | | | | | | | |
See Notes to Financial Statements.
36
Excelsior Funds Trust
Portfolio of Investments — March 31, 2007
High Yield Fund — (continued)
| | | | | | | | | | | |
Principal
Amount | | | | Rate | | | Maturity
Date | | Value |
| | | | | | | | | | | |
| | CORPORATE BONDS — (continued) | | | | | | |
| | | SPECIAL PURPOSE ENTITY — 6.62% |
| $ | 5,580,000 | | Targeted Return Index Securities Trust (TRAIN), Series HY-1-2006(a)(b) | | 7.55 | % | | 05/01/16 | | $ | 5,673,856 |
| | 2,000,000 | | Wimar OPCO LLC(a)(c) | | 9.63 | | | 12/15/14 | | | 2,007,500 |
| | | | | | | | | | | |
| | | | | | | | | | | 7,681,356 |
| | | | | | | | | | | |
| | | TELECOM SERVICES — 0.89% |
| | 1,000,000 | | West Corp(a) | | 9.50 | | | 10/15/14 | | | 1,035,000 |
| | | | | | | | | | | |
| | | TELEPHONE – INTERGRATED — 8.71% |
| | 2,000,000 | | Cincinnati Bell, Inc. | | 8.38 | | | 01/15/14 | | | 2,045,000 |
| | 2,000,000 | | Citizens Communications | | 9.25 | | | 05/15/11 | | | 2,229,999 |
| | 649,000 | | Consolidated Communications Holding | | 9.75 | | | 04/01/12 | | | 687,129 |
| | 1,500,000 | | Hawaiian Telcom Communication | | 12.50 | | | 05/01/15 | | | 1,642,500 |
| | 1,250,000 | | Nordic Telephone Co. Holdings(a) | | 8.88 | | | 05/01/16 | | | 1,337,500 |
| | 1,000,000 | | Valor Telecom Enterprise | | 7.75 | | | 02/15/15 | | | 1,077,500 |
| | 1,000,000 | | Windstream Corp. | | 8.63 | | | 08/01/16 | | | 1,093,750 |
| | | | | | | | | | | |
| | | | | | | | | | | 10,113,378 |
| | | | | | | | | | | |
| | | TRAVEL SERVICES — 0.95% |
| | 1,000,000 | | Travelport, Inc.(a) | | 11.88 | | | 09/01/16 | | | 1,096,250 |
| | | | | | | | | | | |
| | | TOTAL CORPORATE BONDS
(Cost $101,609,771) | | | 104,377,393 |
| | | | | | | | | | | |
| | BANK LOANS — 0.44% | | | | | | | | |
| | | MISCELLANEOUS MANUFACTURING — 0.44% |
| | 500,000 | | IPC Acquisition Corp.(b)(d) | | 11.86 | | | 09/29/14 | | | 507,500 |
| | | | | | | | | | | |
| | | TOTAL BANK LOANS
(Cost $500,000) | | | 507,500 |
| | | | | | | | | | | |
| Shares | | | | | | | | | |
| | COMMON STOCK — 2.57% | | | | | | | | |
| | | METAL – ALUMINUM — 2.57% |
| | 152,380 | | Ormet Corp. | | | 2,979,029 |
| | | | | | | | | | | |
| | | TOTAL COMMON STOCK
(Cost $1,219,040) | | | 2,979,029 |
| | | | | | | | | | | |
| | | | | | | | | | | |
Principal
Amount | | | | Rate | | | Maturity
Date | | Value |
| | | | | | | | | | | |
| | U.S. GOVERNMENT AGENCY BONDS & NOTES — 6.12% |
| | | FEDERAL HOME LOAN BANK — 6.12% |
| $ | 7,100,000 | | Discount Note | | 0.00 | % | | 04/02/07 | | $ | 7,097,059 |
| | | | | | | | | | | |
| | | TOTAL U.S. GOVERNMENT AGENCY BONDS & NOTES
(Cost $7,099,020) | | | 7,097,059 |
| | | | | | | | | | | |
| | | | | | |
TOTAL INVESTMENTS
(Cost $110,427,831) | | 99.11 | % | | $ | 114,960,981 |
OTHER ASSETS IN EXCESS OF LIABILITIES | | 0.89 | | | | 1,035,924 |
| | | | | | |
NET ASSETS | | 100.00 | % | | $ | 115,996,905 |
| | | | | | |
| (a) | Security exempt from registration under Rule 144A of the Securities Act of 1933. This security may be resold in transactions exempt from registration, normally to qualified institutional buyers. At March 31, 2007, these securities amounted to $25,453,831 or 21.94% of net assets. |
| (b) | Variable Rate Security—The rate disclosed is as of March 31, 2007. |
| (c) | All or part of the security is segregated by the Fund’s custodian to cover future purchase commitments. |
| (d) | Fair valued as of March 31, 2007. |
Discount Note—The rate reported on the Portfolio of Investments is the discount rate at the time of purchase.
LLC—limited liability company
L.P.—Limited Partnership
Ltd.—Limited
plc—public limited company
See Notes to Financial Statements.
37
Excelsior Funds Trust
Portfolio of Investments — March 31, 2007
High Yield Fund — (continued)
The summary of the Fund’s investments as of March 31, 2007 is as follows: (Unaudited)
| | | | | | |
Sector Diversification | | % of
Net
Assets | | | Value |
Consumer Discretionary | | 39.66 | % | | $ | 46,015,698 |
Telecommunication | | 11.71 | | | | 13,582,766 |
Materials | | 9.73 | | | | 11,281,529 |
Information Technology | | 8.34 | | | | 9,675,125 |
Industrials | | 7.99 | | | | 9,263,375 |
U.S. Government & Agency Obligations | | 6.12 | | | | 7,097,059 |
Health Care | | 5.39 | | | | 6,253,750 |
Consumer Staples | | 3.83 | | | | 4,448,200 |
Financials | | 3.26 | | | | 3,779,729 |
Energy | | 1.70 | | | | 1,966,250 |
Utilities | | 1.38 | | | | 1,597,500 |
| | | | | | |
Total Investment | | 99.11 | % | | $ | 114,960,981 |
Other Assets in Excess of Liabilities | | 0.89 | | | | 1,035,924 |
| | | | | | |
Net Assets | | 100.00 | % | | $ | 115,996,905 |
| | | | | | |
See Notes to Financial Statements
38
Excelsior Funds, Inc.
Portfolio of Investments — March 31, 2007
Intermediate-Term Bond Fund
| | | | | | | | | | | |
Principal Amount | | | | Rate | | | Maturity Date | | Value |
| | | | | | | | | | | |
| | ASSET BACKED SECURITIES — 0.96% | | | | | | |
| $ | 2,200,000 | | Capital Auto Receivables Asset Trust 2006-SN1AC B(a) | | 5.50 | % | | 04/20/10 | | $ | 2,210,762 |
| | 2,000,000 | | Capital One Master Trust, 2001-6 C(a) | | 6.70 | | | 06/15/11 | | | 2,037,420 |
| | 233,473 | | Chase Funding Mortgage Loan Asset Backed Certificates, 2003-3 2A2(b) | | 5.59 | | | 04/25/33 | | | 233,618 |
| | | | | | | | | | | |
| | | TOTAL ASSET BACKED SECURITIES
(Cost $4,564,135) | | | 4,481,800 |
| | | | | | | | | | | |
| | COLLATERALIZED MORTGAGE OBLIGATIONS — 8.43% |
| | | NON-GOVERNMENTAL AGENCY COLLATERALIZED MORTGAGE OBLIGATIONS — 2.87% |
| | 1,572,211 | | Bear Stearns ARM, 2004-1 11A3(b) | | 6.09 | | | 04/25/34 | | | 1,587,991 |
| | 3,185,790 | | Countrywide Alternative Loan Trust, 2004-22CB 1A1 | | 6.00 | | | 10/25/34 | | | 3,195,248 |
| | 3,322,000 | | Washington Mutual, 2005-AR5 A3(b) | | 4.68 | | | 05/25/35 | | | 3,277,431 |
| | 2,213,850 | | Wells Fargo Mortgage Backed Securities Trust, 2004-EE 3A1 | | 3.99 | | | 12/25/34 | | | 2,172,114 |
| | 3,249,439 | | Wells Fargo Mortgage Backed Securities Trust, 2005-AR1 1A(b) | | 5.54 | | | 02/25/35 | | | 3,197,586 |
| | | | | | | | | | | |
| | | | | | | | | | | 13,430,370 |
| | | | | | | | | | | |
| | | FEDERAL HOME LOAN MORTGAGE
CORPORATION — 0.70% |
| | 3,316,447 | | R001 AE | | 4.38 | | | 04/15/15 | | | 3,253,628 |
| | | | | | | | | | | |
| | | FEDERAL NATIONAL MORTGAGE ASSOCIATION — 0.68% | | | |
| | 3,200,000 | | 2003-17 QT | | 5.00 | | | 08/25/27 | | | 3,178,156 |
| | | | | | | | | | | |
| | | GOVERNMENT NATIONAL MORTGAGE ASSOCIATION — 4.18% |
| | 10,355,000 | | 2004-45 B | | 5.18 | | | 05/16/28 | | | 10,340,594 |
| | 2,800,000 | | 2005-10 MW | | 4.67 | | | 09/16/25 | | | 2,742,903 |
| | 2,925,000 | | 2005-14 B | | 4.48 | | | 08/16/32 | | | 2,861,550 |
| | 3,573,957 | | 2006-55 AB | | 5.25 | | | 07/16/29 | | | 3,577,522 |
| | | | | | | | | | | |
| | | TOTAL COLLATERALIZED MORTGAGE OBLIGATIONS
(Cost $39,806,101) | | | 19,522,569 |
| | | | | | | | | | | |
| | | | | | | | | | | 39,384,723 |
| | | | | | | | | | | |
| | | | | | | | | | | |
Principal Amount | | | | Rate | | | Maturity Date | | Value |
| | | | | | | | | | | |
| | COMMERCIAL MORTGAGE-BACKED SECURITIES — 15.26% |
| $ | 4,350,000 | | Bank of America Commercial Mortgage, Inc., 2004-1 A4 | | 4.76 | % | | 11/10/39 | | $ | 4,226,824 |
| | 2,000,000 | | Commercial Mortgage Asset Trust, 1999-C1 B | | 7.23 | | | 01/17/32 | | | 2,208,973 |
| | 3,556,000 | | Commercial Mortgage Asset Trust, 1999-C2 C | | 7.80 | | | 11/17/32 | | | 4,044,938 |
| | 3,325,000 | | Credit Suisse First Boston Mortgage Securities Corp., 2002-CP5 G(a)(b) | | 5.88 | | | 12/15/35 | | | 3,401,175 |
| | 1,292,475 | | DLJ Mortgage Acceptance Corp., 1997-CF2 A1B(a) | | 6.82 | | | 10/15/30 | | | 1,293,703 |
| | 3,900,000 | | GMAC Commercial Mortgage Securities, Inc., 1999-C1C | | 6.59 | | | 05/15/33 | | | 3,988,095 |
| | 7,197,000 | | JP Morgan Chase Commercial Mortgage Securities Corp., 2005-CB12 AJ(b) | | 4.99 | | | 09/12/37 | | | 6,993,127 |
| | 4,500,000 | | JP Morgan Chase Commercial Mortgage Securities Corp., 2005-LDP2 A4 | | 4.74 | | | 07/15/42 | | | 4,324,239 |
| | 5,430,000 | | JP Morgan Chase Commercial Mortgage Securities Corp., 2005-LDP5 AJ(b) | | 5.30 | | | 12/15/44 | | | 5,421,837 |
| | 3,085,000 | | Morgan Stanley Dean Witter Capital I, 2003-TOP9 A2 | | 4.74 | | | 11/13/36 | | | 3,017,691 |
| | 3,104,000 | | Morgan Stanley Dean Witter Capital I, 2005-HQ5 A4 | | 5.17 | | | 01/14/42 | | | 3,072,803 |
| | 4,025,000 | | Nomura Asset Securities Corp., 1998-D6 A4(b) | | 6.91 | | | 03/15/30 | | | 4,527,693 |
| | 1,435,000 | | Wachovia Bank Commercial Mortgage Trust, 2002-C1 A4 | | 6.29 | | | 04/15/34 | | | 1,503,684 |
See Notes to Financial Statements.
39
Excelsior Funds, Inc.
Portfolio of Investments — March 31, 2007
Intermediate-Term Bond Fund — (continued)
| | | | | | | | | | | |
Principal Amount | | | | Rate | | | Maturity Date | | Value |
| | | | | | | | | | | |
| | COMMERCIAL MORTGAGE-BACKED SECURITIES — (continued) |
| $ | 6,525,000 | | Wachovia Bank Commercial Mortgage Trust, 2003-C9 A3 | | 4.61 | % | | 12/15/35 | | $ | 6,406,907 |
| | 1,719,000 | | Wachovia Bank Commercial Mortgage Trust, 2004-C12 A2 | | 5.00 | | | 07/15/41 | | | 1,710,645 |
| | 4,775,000 | | Wachovia Bank Commercial Mortgage Trust, 2004-C12 A3 | | 5.23 | | | 07/15/41 | | | 4,790,514 |
| | 6,150,000 | | Wachovia Bank Commercial Mortgage Trust, 2005-C20 A6A | | 5.11 | | | 07/15/42 | | | 6,118,731 |
| | 4,267,000 | | Wachovia Bank Commercial Mortgage Trust, 2005-C20 A5 | | 5.09 | | | 07/15/42 | | | 4,251,918 |
| | | | | | | | | | | |
| | | TOTAL COMMERCIAL MORTGAGE-BACKED SECURITIES
(Cost $72,484,005) | | | 71,303,497 |
| | | | | | | | | | | |
| | CORPORATE BONDS — 16.93% | | | | | | | | |
| | 2,550,000 | | Alcan, Inc | | 5.00 | | | 06/01/15 | | | 2,445,868 |
| | 1,720,000 | | America Movil S.A. de C.V. | | 5.50 | | | 03/01/14 | | | 1,701,446 |
| | 1,900,000 | | Bear Stearns Co., Inc. | | 5.35 | | | 02/01/12 | | | 1,903,724 |
| | 2,680,000 | | Bottling Group LLC | | 5.50 | | | 04/01/16 | | | 2,695,087 |
| | 1,190,000 | | Caterpillar, Inc. | | 5.70 | | | 08/15/16 | | | 1,214,128 |
| | 500,000 | | Cincinnati Bell, Inc. | | 8.38 | | | 01/15/14 | | | 511,250 |
| | 3,845,000 | | Cisco Systems, Inc | | 5.50 | | | 02/22/16 | | | 3,871,600 |
| | 890,000 | | CIT Group, Inc.(b) | | 6.10 | | | 03/15/67 | | | 857,877 |
| | 3,000,000 | | CVS Lease Pass Through Trust | | 6.13 | | | 08/15/16 | | | 3,102,273 |
| | 4,750,000 | | Deutsche Telekom International Finance | | 5.38 | | | 03/23/11 | | | 4,776,169 |
| | 4,000,000 | | Diageo Capital plc | | 4.38 | | | 05/03/10 | | | 3,921,408 |
| | 2,380,000 | | Federal Express Corp. | | 5.50 | | | 08/15/09 | | | 2,398,171 |
| | 1,000,000 | | Federated Retail Holding | | 5.35 | | | 03/15/12 | | | 997,382 |
| | 1,400,000 | | Ford Motor Credit Co. | | 8.63 | | | 11/01/10 | | | 1,428,729 |
| | 3,955,000 | | General Electric Capital Corp., MTN | | 5.40 | | | 02/15/17 | | | 3,958,389 |
| | 500,000 | | Iron Mountain, Inc. | | 8.63 | | | 04/01/13 | | | 514,500 |
| | | | | | | | | | | |
Principal Amount | | | | Rate | | | Maturity Date | | Value |
| | | | | | | | | | | |
| | CORPORATE BONDS — (continued) | | | | | | |
| $ | 3,790,000 | | JP Morgan Chase & Co. | | 5.15 | % | | 10/01/15 | | $ | 3,705,961 |
| | 2,960,000 | | Lehman Brothers Holdings, Inc. | | 4.25 | | | 01/27/10 | | | 2,899,501 |
| | 780,000 | | Lehman Brothers Holdings, Inc. | | 5.75 | | | 01/03/17 | | | 781,614 |
| | 2,645,000 | | Nisource Finance Corp. | | 5.25 | | | 09/15/17 | | | 2,498,097 |
| | 4,025,000 | | Oracle Corp. | | 5.25 | | | 01/15/16 | | | 3,969,065 |
| | 5,150,000 | | RBS Capital Trust III(b)(c) | | 5.51 | | | 09/30/14 | | | 5,067,007 |
| | 2,050,000 | | Southern Co. | | 5.30 | | | 01/15/12 | | | 2,063,663 |
| | 1,530,000 | | Sprint Capital Corp. | | 8.38 | | | 03/15/12 | | | 1,707,065 |
| | 4,290,000 | | Target Corp. | | 5.88 | | | 07/15/16 | | | 4,414,718 |
| | 3,595,000 | | TCI Communications, Inc. | | 9.80 | | | 02/01/12 | | | 4,256,142 |
| | 1,125,000 | | Telefonica Emisiones Sau | | 6.42 | | | 06/20/16 | | | 1,174,190 |
| | 2,415,000 | | Time Warner, Inc. | | 9.15 | | | 02/01/23 | | | 3,007,984 |
| | 1,110,000 | | Virginia Electric Power | | 5.40 | | | 01/15/16 | | | 1,098,449 |
| | 2,000,000 | | Wal-Mart Stores, Inc. | | 5.00 | | | 04/05/12 | | | 1,992,498 |
| | 1,000,000 | | Xerox Corp | | 6.40 | | | 03/15/16 | | | 1,028,525 |
| | 2,125,000 | | YUM! Brands, Inc. | | 6.25 | | | 04/15/16 | | | 2,183,922 |
| | 975,000 | | Zions Bancorp | | 5.50 | | | 11/16/15 | | | 958,445 |
| | | | | | | | | | | |
| | | TOTAL CORPORATE BONDS
(Cost $78,815,235) | | | 79,104,847 |
| | | | | | | | | | | |
| | U.S. GOVERNMENT AGENCY BONDS & NOTES — 11.51% |
| | | FEDERAL HOME LOAN BANK — 9.71% |
| | 10,000,000 | | | | 5.00 | | | 10/16/09 | | | 9,977,570 |
| | 8,700,000 | | | | 5.19 | | | 02/22/10 | | | 8,681,791 |
| | 26,525,000 | | | | 5.30 | | | 10/27/11 | | | 26,710,622 |
| | | | | | | | | | | |
| | | | | | | | | | | 45,369,983 |
| | | | | | | | | | | |
| | | FREDDIE MAC — 1.80% |
| | 3,355,000 | | | | 5.13 | | | 07/15/12 | | | 3,400,158 |
| | 5,000,000 | | MTN | | 5.25 | | | 02/24/11 | | | 5,011,315 |
| | | | | | | | | | | |
| | | TOTAL U.S. GOVERNMENT AGENCY BONDS & NOTES
(Cost $53,547,635) | | | 53,781,456 |
| | | | | | | | | | | |
| U.S. GOVERNMENT AGENCY MORTGAGE PASS THROUGH
SECURITIES — 13.08% |
| | | FEDERAL HOME LOAN MORTGAGE
CORPORATION — 1.76% |
| | 3,578,819 | | Pool # 1G1026 ARM(b) | | 5.91 | | | 07/01/36 | | | 3,602,168 |
| | 3,135,818 | | Pool # A36827 | | 5.00 | | | 08/01/35 | | | 3,033,669 |
| | 379,129 | | Pool # G18136 | | 6.00 | | | 08/01/21 | | | 385,438 |
| | 1,204,495 | | Pool # J03619 | | 6.00 | | | 10/01/21 | | | 1,224,542 |
| | | | | | | | | | | |
| | | | | | | | | | | 8,245,817 |
| | | | | | | | | | | |
See Notes to Financial Statements.
40
Excelsior Funds, Inc.
Portfolio of Investments — March 31, 2007
Intermediate-Term Bond Fund — (continued)
| | | | | | | | | | | |
Principal Amount | | | | Rate | | | Maturity Date | | Value |
| | | | | | | | | | | |
| U.S. GOVERNMENT AGENCY MORTGAGE PASS THROUGH
SECURITIES — (continued) |
| | | FEDERAL NATIONAL MORTGAGE
ASSOCIATION — 9.37% |
| $ | 2,630,000 | | Pool # 385538 | | 4.79 | % | | 11/01/12 | | $ | 2,571,221 |
| | 586,322 | | Pool # 545290 | | 7.50 | | | 10/01/16 | | | 604,267 |
| | 3,260 | | Pool # 578823 | | 5.50 | | | 04/01/31 | | | 3,233 |
| | 2,465,257 | | Pool # 704372 ARM(b) | | 4.51 | | | 05/01/33 | | | 2,437,649 |
| | 5,003,739 | | Pool # 805386 ARM(b) | | 4.86 | | | 01/01/35 | | | 5,002,786 |
| | 2,506,462 | | Pool # 811528 | | 5.00 | | | 11/01/20 | | | 2,472,702 |
| | 5,981,172 | | Pool # 831192 | | 5.00 | | | 11/01/20 | | | 5,898,093 |
| | 8,989,624 | | Pool # 851149 | | 5.00 | | | 04/01/21 | | | 8,865,670 |
| | 2,290,402 | | Pool # 868986(d) | | 5.00 | | | 05/01/21 | | | 2,258,821 |
| | 179,451 | | Pool # 872534 | | 6.00 | | | 06/01/36 | | | 180,782 |
| | 9,400,924 | | Pool # 879122 | | 5.00 | | | 05/01/21 | | | 9,271,299 |
| | 4,190,123 | | Pool # 892882 ARM(b) | | 5.86 | | | 07/01/36 | | | 4,223,082 |
| | | | | | | | | | | |
| | | | | | | | | | | 43,789,605 |
| | | | | | | | | | | |
| | GOVERNMENT NATIONAL MORTGAGE ASSOCIATION — 1.95% |
| | 12,609 | | Pool # 195801 | | 8.50 | | | 01/15/17 | | | 13,496 |
| | 8,473 | | Pool # 195833 | | 8.50 | | | 04/15/17 | | | 9,069 |
| | 2,493,668 | | Pool # 3319 | | 5.00 | | | 12/20/32 | | | 2,421,277 |
| | 1,398 | | Pool # 334299 | | 8.00 | | | 05/15/23 | | | 1,481 |
| | 3,067,835 | | Pool # 3442 | | 5.00 | | | 09/20/33 | | | 2,978,679 |
| | 302,203 | | Pool # 367412 | | 6.00 | | | 11/15/23 | | | 306,523 |
| | 1,316,805 | | Pool # 604726 | | 4.50 | | | 10/15/33 | | | 1,248,410 |
| | 2,237,273 | | Pool # 608288 | | 4.50 | | | 09/15/33 | | | 2,121,069 |
| | | | | | | | | | | |
| | | | | | | | | | | 9,100,004 |
| | | | | | | | | | | |
| | | TOTAL U.S. GOVERNMENT AGENCY MORTGAGE PASS THROUGH SECURITIES
(Cost $61,068,386) | | | 61,135,426 |
| | | | | | | | | | | |
| | U.S. TREASURY NOTES — 27.16% | | | |
| | 5,130,000 | | | | 3.13 | | | 04/15/09 | | | 4,983,513 |
| | 10,440,000 | | | | 4.00 | | | 04/15/10 | | | 10,280,143 |
| | 110,310,000 | | (e) | | 4.50 | | | 02/28/11 | | | 110,159,207 |
| | 1,540,000 | | | | 4.25 | | | 11/15/14 | | | 1,503,425 |
| | | | | | | | | | | |
| | | | | | | | | | | 121,942,775 |
| | | | | | | | | | | |
| | | TOTAL U.S. GOVERNMENT SECURITIES
(Cost $125,470,139 ) | | | 126,926,288 |
| | | | | | | | | | | |
| | | | | | | | | |
| Shares | | | | | | | | Value |
| REGISTERED INVESTMENT COMPANIES — 6.26% | | | |
| 14,615,789 | | Dreyfus Government Cash Management Fund | | | | | | $ | 14,615,789 |
| 14,615,788 | | Fidelity U.S. Treasury II Fund | | | | | | | 14,615,788 |
| | | | | | | | | |
| | TOTAL REGISTERED INVESTMENT COMPANIES
(Cost $29,231,577) | | | 29,231,577 |
| | | | | | | | | |
| | | | | | |
TOTAL INVESTMENTS
(Cost $464,987,213) | | 99.59 | % | | $ | 465,349,614 |
OTHER ASSETS IN EXCESS OF LIABILITIES | | 0.41 | | | | 1,926,229 |
| | | | | | |
NET ASSETS | | 100.00 | % | | $ | 467,275,843 |
| | | | | | |
| (a) | Security exempt from registration under Rule 144A of the Securities Act of 1933. This security may be resold in transactions exempt from registration, normally to qualified institutional buyers. At March 31, 2007, these securities amounted to $8,943,060 or 1.91% of net assets. |
| (b) | Variable Rate Security—The rate disclosed is as of March 31, 2007. |
| (c) | Perpetual Security—Stated maturity is first par call date. |
| (d) | All or part of the security is segregated by the Fund’s custodian to cover future purchase commitments. |
| (e) | All or part of the security serves as collateral for futures contracts. |
| ARM—Adjustable | Rate Mortgage |
| LLC—Limited | Liability Company |
| plc—Public | Limited Company |
| | | | | | | | | | |
| Contracts | | | | | Value | | | Unrealized
Appreciation/
Depreciation |
| FUTURES CONTRACTS | | | | | |
| Long — | | | | | |
| 120 | | | U.S. 2 Year Treasury Note, expiring June 29, 2007 (notional amount $24,543,862) | | $ | 24,586,875 | | | $ | 43,013 |
| Short — | | | | | |
| (40 | ) | | U.S. Long-Term Treasury Bond, expiring June 20, 2007 (notional amount $(4,475,681)) | | | (4,450,000 | ) | | | 25,681 |
| | | | | | | | | | |
| | | TOTAL FUTURES CONTRACTS
(Total notional amount $20,068,181) | | $ | 20,136,875 | | | $ | 68,694 |
| | | | | | | | | | |
See Notes to Financial Statements.
41
Excelsior Funds, Inc.
Portfolio of Investments — March 31, 2007
Intermediate-Term Bond Fund — (continued)
The summary of the Fund’s investments as of March 31, 2007 is as follows: (Unaudited)
| | | | | | |
Portfolio Diversification | | % of
Net
Assets | | | Value |
U.S. Government & Agency Securities | | 51.75 | % | | $ | 241,843,170 |
Corporate Bonds | | 16.93 | | | | 79,104,847 |
Commercial Mortgage-Backed Securities | | 15.26 | | | | 71,303,497 |
Collateralized Mortgage Obligations | | 8.43 | | | | 39,384,723 |
Registered Investment Companies | | 6.26 | | | | 29,231,577 |
Asset Backed Securities | | 0.96 | | | | 4,481,800 |
| | | | | | |
Total Investments | | 99.59 | % | | $ | 465,349,614 |
Other Assets in Excess of Liabilities | | 0.41 | | | | 1,926,229 |
| | | | | | |
Net Assets | | 100.00 | % | | $ | 467,275,843 |
| | | | | | |
See Notes to Financial Statements.
42
Excelsior Tax-Exempt Funds, Inc.
Portfolio of Investments — March 31, 2007
Intermediate-Term Tax-Exempt Fund
| | | | | | | | | | | |
Principal
Amount | | | | Rate | | | Maturity
Date | | Value |
| | | | | | | | | | | |
| | TAX-EXEMPT CASH EQUIVALENT SECURITIES — 4.43% |
| $ | 9,000,000 | | Tulsa County, Oklahoma, Industrial Authority Health Care Revenue Bonds, St. Francis Health System, Series B(a) | | 3.75 | % | | 12/15/27 | | $ | 9,000,000 |
| | 8,400,000 | | Valdez, Alaska, Marine Terminal Revenue Bonds, BP Pipelines Project, Series B(a) | | 3.80 | | | 07/01/37 | | | 8,400,000 |
| | | | | | | | | | | |
| | | TOTAL TAX-EXEMPT CASH EQUIVALENT SECURITIES
(Cost $17,400,000) | | | 17,400,000 |
| | | | | | | | | | | |
| | TAX-EXEMPT SECURITIES — 87.99% |
| | 1,000,000 | | Arkansas State Development Finance Authority, Tobacco Settlement Revenue Bonds, Arkansas Cancer Research Center Project, (AMBAC)(b) | | 0.00 | | | 07/01/23 | | | 492,710 |
| | 10,000,000 | | California State Bay Area Infrastructure Financing Authority Revenue Bonds, State Payment Acceleration Notes, (FGIC) | | 5.00 | | | 08/01/17 | | | 10,753,900 |
| | 4,740,000 | | California State General Obligation Bonds | | 5.00 | | | 06/01/08 | | | 4,819,822 |
| | 10,000,000 | | California State General Obligation Bonds | | 5.00 | | | 12/01/16 | | | 10,844,200 |
| | 5,000,000 | | California State General Obligation Bonds | | 5.00 | | | 08/01/21 | | | 5,292,700 |
| | 10,000,000 | | Colorado Springs, Colorado, Utilities Revenue Bonds, Series A | | 5.25 | | | 11/15/10 | | | 10,543,700 |
| | 10,000,000 | | Dallas, Texas, Water Works & Sewer System Revenue Bonds, (FSA) | | 5.38 | | | 10/01/12 | | | 10,841,000 |
| | 2,820,000 | | Detroit, Michigan, Sewage Disposal Revenue Bonds, Senior Lien, Series A, (FSA) | | 5.00 | | | 07/01/14 | | | 3,016,018 |
| | | | | | | | | | | |
Principal
Amount | | | | Rate | | | Maturity
Date | | Value |
| | | | | | | | | | | |
| | TAX-EXEMPT SECURITIES — (continued) |
| $ | 6,200,000 | | Fairfax County, Virginia, Refunding & Public Improvement General Obligation Bonds, Series A | | 5.25 | % | | 04/01/08 | | $ | 6,300,564 |
| | 10,000,000 | | Florida State Division Board Finance Department, General Services Revenue Bonds Department of Environmental Protection- Preservation 2000, Series A, (FSA) | | 6.00 | | | 07/01/13 | | | 11,246,999 |
| | 10,000,000 | | Florida State Hurricane Catastrophe Fund Finance Corporation Revenue Bonds, Series A | | 5.00 | | | 07/01/10 | | | 10,386,900 |
| | 5,000,000 | | Fresno, California, Sewer Revenue Bonds, Series A-1, (AMBAC) | | 5.25 | | | 09/01/19 | | | 5,550,050 |
| | 4,000,000 | | Golden State Tobacco Securitization Corp., California Tobacco Settlement Revenue Bonds, Series A-1 | | 4.50 | | | 06/01/27 | | | 3,901,480 |
| | 10,000,000 | | Hawaii State General Obligation Bonds, Series CY, (FSA) | | 5.50 | | | 02/01/12 | | | 10,815,700 |
| | 5,000,000 | | Houston, Texas, Independent School District General Obligation Bonds, (PSF-GTD) | | 4.50 | | | 02/15/25 | | | 5,023,500 |
| | 2,000,000 | | Illinois State Toll Highway Authority Revenue Bonds, Senior Priority, Series A-1, (FSA) | | 5.00 | | | 01/01/18 | | | 2,159,560 |
| | 5,000,000 | | Indiana Health & Educational Facilities Financing Authority Revenue Bonds, Clarian Health Obligation Group, Series B | | 5.00 | | | 02/15/22 | | | 5,232,900 |
| | 10,375,000 | | Jackson County, Missouri, Special Obligation Revenue Bonds, Harry S. Truman Sports Complex, (AMBAC) | | 5.00 | | | 12/01/09 | | | 10,739,578 |
See Notes to Financial Statements.
43
Excelsior Tax-Exempt Funds, Inc.
Portfolio of Investments — March 31, 2007
Intermediate-Term Tax-Exempt Fund — (continued)
| | | | | | | | | | | |
Principal
Amount | | | | Rate | | | Maturity
Date | | Value |
| | | | | | | | | | | |
| | TAX-EXEMPT SECURITIES — (continued) |
| $ | 10,000,000 | | Jefferson County, Colorado, School District General Obligation Bonds (MBIA) | | 6.50 | % | | 12/15/11 | | $ | 11,228,500 |
| | 10,000,000 | | Los Angeles, California, Department of Water & Power Revenue Bonds, Series B, (MBIA) | | 5.00 | | | 07/01/13 | | | 10,770,100 |
| | 5,370,000 | | Massachusetts State Construction Loan General Obligaton Bonds, Series C | | 5.00 | | | 05/01/16 | | | 5,821,939 |
| | 5,040,000 | | Miami-Dade County, Florida, Transit Sales Surtax Revenue Bonds, (XLCA) | | 5.00 | | | 07/01/19 | | | 5,405,753 |
| | 10,000,000 | | Michigan State Building Authority Revenue Bonds, Facilities Program Series I, (FSA) | | 5.25 | | | 10/15/14 | | | 10,843,500 |
| | 5,720,000 | | Nassau County, New York, Interim Finance Authority Revenue Bonds, Sales Tax Revenue, Series B, (AMBAC) | | 5.00 | | | 11/15/14 | | | 6,149,000 |
| | 10,000,000 | | New Jersey State General Obligation Bonds, Series D | | 6.00 | | | 02/15/11 | | | 10,831,700 |
| | 3,000,000 | | New Jersey State Tobacco Settlement Financing Corporation Revenue Bonds, Series 1A | | 4.25 | | | 06/01/11 | | | 3,001,770 |
| | 10,000,000 | | New Jersey State Tobacco Settlement Financing Corporation Revenue Bonds, Series 1A | | 4.50 | | | 06/01/23 | | | 9,817,800 |
| | 4,000,000 | | New Jersey State Transportation Trust Fund Authority Revenue Bonds, (FSA-CR) | | 5.25 | | | 12/15/22 | | | 4,513,480 |
| | 9,530,000 | | New Jersey State Transportation Trust Fund Authority Revenue Bonds, Grant Anticipation Bonds, Series A, (FGIC) | | 5.00 | | | 06/15/10 | | | 9,902,718 |
| | | | | | | | | | | |
Principal
Amount | | | | Rate | | | Maturity
Date | | Value |
| | | | | | | | | | | |
| | TAX-EXEMPT SECURITIES — (continued) |
| $ | 10,000,000 | | New York City, New York, Municipal Water Finance Authority, Water & Sewer System Revenue Bonds, Series A, (FSA) | | 5.38 | % | | 06/15/16 | | $ | 10,794,600 |
| | 10,000,000 | | New York State Dormitory Authority Revenue Bonds, State University Educational Facilities, Series B, (FSA) | | 5.25 | | | 05/15/11 | | | 10,617,400 |
| | 5,790,000 | | Palm Beach County, Florida, Public Improvement Revenue Bonds, Parking Facilities Expansion Project, (MBIA) | | 5.00 | | | 12/01/26 | | | 6,154,307 |
| | 5,070,000 | | Pennsylvania State, General Obligation Bonds, Series 4 | | 5.00 | | | 07/01/09 | | | 5,215,763 |
| | 5,000,000 | | Puerto Rico Commonwealth Public Improvement General Obligation Bonds, Series B | | 5.25 | | | 07/01/16 | | | 5,438,300 |
| | 10,000,000 | | San Antonio, Texas, Electric & Gas Revenue Bonds | | 5.00 | | | 02/01/17 | | | 10,707,300 |
| | 8,000,000 | | San Antonio, Texas, Electric & Gas Revenue Bonds, Series A | | 5.25 | | | 02/01/16 | | | 8,291,280 |
| | 7,600,000 | | San Joaquin Hills, California, Transportation Corridor Agency Toll Road Revenue Bonds, Series A, (MBIA)(b) | | 0.00 | | | 01/15/12 | | | 6,345,316 |
| | 5,000,000 | | South Carolina State Highway General Obligation Bonds, Series B | | 5.00 | | | 04/01/16 | | | 5,282,350 |
| | 10,000,000 | | South Carolina State Public Services Authority Revenue Bonds, Series A, (FSA) | | 5.50 | | | 01/01/11 | | | 10,623,000 |
| | 12,150,000 | | St. Louis, Missouri, Airport Revenue Bonds, Lambert International Airport Series A, (FSA) | | 5.00 | | | 07/01/21 | | | 13,056,268 |
See Notes to Financial Statements.
44
Excelsior Tax-Exempt Funds, Inc.
Portfolio of Investments — March 31, 2007
Intermediate-Term Tax-Exempt Fund — (continued)
| | | | | | | | | | | |
Principal
Amount | | | | Rate | | | Maturity
Date | | Value |
| | | | | | | | | | | |
| | TAX-EXEMPT SECURITIES — (continued) |
| $ | 2,000,000 | | St. Louis, Missouri, Airport Revenue Bonds, Lambert International Airport Series A, (FSA) | | 5.00 | % | | 07/01/25 | | $ | 2,130,220 |
| | 2,000,000 | | Texas Municipal Gas Acquisition & Supply Corp., Gas Supply Revenue Bonds, Senior Lien, Series A | | 5.25 | | | 12/15/23 | | | 2,211,940 |
| | 4,815,000 | | Texas State Public Finance Authority General Obligation Bonds, Series A | | 5.00 | | | 10/01/23 | | | 5,071,014 |
| | 3,500,000 | | Texas State Transportation Commission Revenue Bonds, First Tier | | 5.00 | | | 04/01/08 | | | 3,546,620 |
| | 6,000,000 | | Triborough Bridge & Tunnel Authority, New York, Highway Revenue Bonds, Series B | | 5.00 | | | 11/15/20 | | | 6,308,040 |
| | 6,285,000 | | Virginia State Public School Authority Revenue Bonds, 1997 Resolution, Series C | | 5.00 | | | 08/01/16 | | | 6,813,946 |
| | 10,000,000 | | Washington State Various Purposes General Obligation Bonds, Series R-03-A, (MBIA) | | 5.00 | | | 01/01/18 | | | 10,493,500 |
| | | | | | | | | | | |
| | | TOTAL TAX-EXEMPT SECURITIES
(Cost $341,055,657) | | | 345,348,705 |
| | | | | | | | | | | |
| TAX-EXEMPT SECURITIES – ESCROWED IN
U.S. GOVERNMENTS — 6.48% |
| | 12,000,000 | | Chicago, Illinois, Public Improvements General Obligation Bonds, (Prerefunded 01/01/08 @ 102) | | 5.25 | | | 01/01/27 | | | 12,376,680 |
| | 7,180,000 | | Detroit, Michigan, Sewage Disposal Revenue Bonds, Senior Lien, Series A, (Prerefunded 07/01/13 @ 100) | | 5.00 | | | 07/01/14 | | | 7,691,431 |
| | | | | | | | | | | |
Principal
Amount | | | | Rate | | | Maturity
Date | | Value |
| TAX-EXEMPT SECURITIES – ESCROWED IN U.S.
GOVERNMENTS — (continued) |
| $ | 5,000,000 | | New York State Tobacco Settlement Asset Securitizaton Corporation Revenue Bonds, Series 1, (Prerefunded 07/15/09 @ 101) | | 6.38 | % | | 07/15/39 | | $ | 5,344,650 |
| | | | | | | | | | | |
| | | TOTAL TAX-EXEMPT SECURITIES — ESCROWED IN U.S. GOVERNMENTS
(Cost $25,457,385) | | | 25,412,761 |
| | | | | | | | | | | |
| | | | |
| Shares | | | | | | | | | |
| | REGISTERED INVESTMENT COMPANIES — 0.03% |
| | 102,148 | | BlackRock Muni Fund | | | 102,148 |
| | 1 | | Dreyfus Tax Exempt Cash Fund | | | 1 |
| | | | | | | | | | | |
| | | TOTAL REGISTERED INVESTMENT COMPANIES
(Cost $102,149) | | | 102,149 |
| | | | | | | | | | | |
| | | | | | |
TOTAL INVESTMENTS
(Cost $384,015,191) | | 98.93 | % | | $ | 388,263,615 |
OTHER ASSETS IN EXCESS OF LIABILITIES | | 1.07 | | | | 4,199,410 |
| | | | | | |
NET ASSETS | | 100.00 | % | | $ | 392,463,025 |
| | | | | | |
| (a) | Variable Rate Security—The rate disclosed is as of March 31, 2007. |
AMBAC—American Municipal Bond Assurance Corp.
FGIC—Financial Guaranty Insurance Corp.
FSA—Financial Security Assurance
FSA-CR—Financial Security Assurance Custodial Receipts
MBIA—Municipal Bond Insurance Association
SPA—Standby Purchase Agreement
XLCA—XL Capital Assurance
PSF-GTD—Public School Fund—Guaranteed
Notes (The following notes have not been audited by PricewaterhouseCoopers LLP):
These municipal securities meet the three highest ratings assigned by Moody’s Investors Services, Inc. or Standard and Poor’s Corporation or, where not rated, are determined by the Advisor, under the supervision of the Board of Directors, to be of comparable quality at the time of purchase to rated instruments that may be acquired by the Fund.
See Notes to Financial Statements.
45
Excelsior Tax-Exempt Funds, Inc.
Portfolio of Investments — March 31, 2007
Intermediate-Term Tax-Exempt Fund — (continued)
At March 31, 2007, approximately 6% of the net assets are invested in municipal securities that have letter of credit enhancement features or escrows in U.S. Government securities backing them, on which the Fund relies. Without such features, the securities may or may not meet the quality standards of securities purchased by the Fund.
The summary of the Fund’s investments as of March 31, 2007 is as follows: (Unaudited)
| | | | | | |
State Diversification | | % of
Net
Assets | | | Value |
California | | 14.85 | % | | $ | 58,277,568 |
Texas | | 11.64 | | | | 45,692,653 |
New York | | 9.99 | | | | 39,213,690 |
New Jersey | | 9.70 | | | | 38,067,468 |
Florida | | 8.46 | | | | 33,193,960 |
Missouri | | 6.61 | | | | 25,926,066 |
Colorado | | 5.55 | | | | 21,772,200 |
Michigan | | 5.49 | | | | 21,550,950 |
South Carolina | | 4.05 | | | | 15,905,350 |
Illinois | | 3.70 | | | | 14,536,240 |
Virginia | | 3.34 | | | | 13,114,510 |
Hawaii | | 2.76 | | | | 10,815,700 |
Washington | | 2.67 | | | | 10,493,500 |
Oklahoma | | 2.29 | | | | 9,000,000 |
Alaska | | 2.14 | | | | 8,400,000 |
Massachusetts | | 1.48 | | | | 5,821,939 |
Puerto Rico | | 1.39 | | | | 5,438,300 |
Indiana | | 1.33 | | | | 5,232,900 |
Pennsylvania | | 1.33 | | | | 5,215,762 |
Arkansas | | 0.13 | | | | 492,710 |
Registered Investment Companies | | 0.03 | | | | 102,149 |
| | | | | | |
Total Investments | | 98.93 | % | | $ | 388,263,615 |
Other Assets in Excess of Liabilities | | 1.07 | | | | 4,199,410 |
| | | | | | |
Net Assets | | 100.00 | % | | $ | 392,463,025 |
| | | | | | |
See Notes to Financial Statements
46
Excelsior Tax-Exempt Funds, Inc.
Portfolio of Investments — March 31, 2007
Long-Term Tax-Exempt Fund
| | | | | | | | | | | |
Principal
Amount | | | | Rate | | | Maturity
Date | | Value |
| | | | | | | | | | | |
| | TAX-EXEMPT CASH EQUIVALENT SECURITIES — 3.98% |
| $ | 1,400,000 | | Tulsa County, Oklahoma, Industrial Authority Health Care Revenue Bonds, St. Francis Health System, Series B(a) | | 3.75 | % | | 12/15/27 | | $ | 1,400,000 |
| | 1,200,000 | | Valdez, Alaska, Marine Terminal Revenue Bonds, BP Pipelines Project, Series B(a) | | 3.80 | | | 07/01/37 | | | 1,200,000 |
| | | | | | | | | | | |
| | | TOTAL TAX-EXEMPT CASH EQUIVALENT SECURITIES
(Cost $2,600,000) | | | 2,600,000 |
| | | | | | | | | | | |
| | TAX-EXEMPT SECURITIES — 75.50% | | | | | | |
| | 2,500,000 | | California Statewide Communities Development Authority Revenue Bonds, Southern California Edison Co., Series A, (XLCA), (Mandatory Put 04/01/13 @ 100) | | 4.10 | | | 04/01/28 | | | 2,538,500 |
| | 2,000,000 | | Chicago, Illinois, General Obligation Bonds, (FGIC) | | 5.25 | | | 01/01/28 | | | 2,069,420 |
| | 1,000,000 | | Cincinnati, Ohio, City School District General Obligation Bonds, Classroom Construction & Improvements (FGIC) | | 5.25 | | | 12/01/30 | | | 1,156,430 |
| | 3,000,000 | | Clark County, Nevada, School District General Obligation Bonds, Series A, (FSA) | | 5.00 | | | 06/15/15 | | | 3,226,620 |
| | 2,500,000 | | Detroit, Michigan, City School District General Obligation Bonds School Building & Improvement, Series A, (FSA) | | 5.00 | | | 05/01/17 | | | 2,683,475 |
| | 2,000,000 | | District Of Columbia, General Obligation Bonds, Series A, (MBIA) | | 5.25 | | | 06/01/27 | | | 2,046,780 |
| | 2,000,000 | | Florida State Hurricane Catastrophe Fund Finance Corporation Revenue Bonds, Series A | | 5.00 | | | 07/01/10 | | | 2,077,380 |
| | | | | | | | | | | |
Principal
Amount | | | | Rate | | | Maturity
Date | | Value |
| | | | | | | | | | | |
| | TAX-EXEMPT SECURITIES — (continued) | | | | | | |
| $ | 1,800,000 | | Fort Bend, Texas, Independent School District General Obligation Bonds,
(PSF-GTD) | | 5.38 | % | | 02/15/24 | | $ | 1,846,548 |
| | 650,000 | | Indiana Health & Educational Facility Financing Authority Hospital Revenue Bonds, Clarian Health Obligation, Series A | | 5.00 | | | 02/15/39 | | | 666,335 |
| | 3,000,000 | | Johnson City, Tennessee, Health & Educational Facilities Board Hospital Revenue Bonds, Mountain States Health Alliance, Series A | | 5.50 | | | 07/01/36 | | | 3,212,850 |
| | 1,500,000 | | Mashantucket Western Pequot Tribe, Connecticut, Special Revenue Bonds(b)(c) | | 5.50 | | | 09/01/36 | | | 1,573,770 |
| | 1,000,000 | | Massachusetts State Construction Loan General Obligation Bonds, Series C | | 5.00 | | | 05/01/16 | | | 1,084,160 |
| | 2,000,000 | | Michigan State Hospital Finance Authority Revenue Bonds, Henry Ford Health Systems, Series A | | 5.25 | | | 11/15/32 | | | 2,127,160 |
| | 1,000,000 | | Montgomery, Alabama, Medical Clinic Board Health Care Facility Revenue Bonds, Jackson Hospital & Clinic | | 4.75 | | | 03/01/36 | | | 984,500 |
| | 500,000 | | New Hampshire Health & Education Facilities Authority Revenue Bonds, The Memorial Hospital | | 5.25 | | | 06/01/36 | | | 518,995 |
| | 2,000,000 | | New Jersey State Tobacco Settlement Financing Corporation Revenue Bonds, Series 1A | | 4.50 | | | 06/01/23 | | | 1,963,560 |
| | 2,000,000 | | New York City, New York, General Obligation Bonds, Series M | | 5.00 | | | 04/01/22 | | | 2,110,440 |
| | 2,000,000 | | New York City, New York, Industrial Development Agency Revenue Bonds, Queens Baseball Stadium — Pilot, (AMBAC) | | 5.00 | | | 01/01/46 | | | 2,107,080 |
See Notes to Financial Statements.
47
Excelsior Tax-Exempt Funds, Inc.
Portfolio of Investments — March 31, 2007
Long-Term Tax-Exempt Fund — (continued)
| | | | | | | | | | | |
Principal
Amount | | | | Rate | | | Maturity
Date | | Value |
| | | | | | | | | | | |
| | TAX-EXEMPT SECURITIES — (continued) | | | | | | |
| $ | 2,000,000 | | New York Metropolitan Transportation Authority Revenue Bonds, Series A, (AMBAC) | | 5.50 | % | | 11/15/14 | | $ | 2,235,480 |
| | 2,000,000 | | New York State Dormitory Authority Revenue Bonds, Non-State Supported Debt, New York University Hospital Center, Series A | | 5.00 | | | 07/01/20 | | | 2,085,180 |
| | 2,000,000 | | New York State Environmental Facilities Revenue Bonds, Clean Water & Drinking Revolving Foods, 2nd Resolution | | 5.00 | | | 06/15/26 | | | 2,117,480 |
| | 2,000,000 | | Purdue University, Indiana, Certificates of Participation | | 5.25 | | | 07/01/22 | | | 2,251,360 |
| | 2,500,000 | | San Joaquin Hills, California, Transportation Corridor Agency Toll Road Revenue Bonds, Series A, (MBIA)(d) | | 0.00 | | | 01/15/12 | | | 2,087,275 |
| | 1,500,000 | | St. Louis, Missouri, Airport Revenue Bonds, Lambert International Airport, Series A, (FSA) | | 5.00 | | | 07/01/20 | | | 1,614,495 |
| | 1,250,000 | | Tennessee Energy Acquisition Corp. Gas Revenue Bonds, Series A | | 5.25 | | | 09/01/26 | | | 1,384,200 |
| | 1,500,000 | | University of California Revenue Bonds, Series J, (MBIA) | | 5.00 | | | 05/15/12 | | | 1,596,510 |
| | | | | | | | | | | |
| | | TOTAL TAX-EXEMPT SECURITIES
(Cost $48,810,333) | | | 49,365,983 |
| | | | | | | | | | | |
| TAX-EXEMPT SECURITIES – ESCROWED IN U.S.
GOVERNMENTS — 18.28% |
| | 3,000,000 | | Houston, Texas, Water & Sewer System Revenue Bonds, Series A, (FSA) (Prerefunded 12/01/12 @ 100) | | 5.00 | | | 12/01/30 | | | 3,197,310 |
| | 2,000,000 | | Long Island Power Authority, New York Electric System Revenue Bonds, Series A, (FSA) (Escrowed to Maturity) | | 5.25 | | | 12/01/14 | | | 2,200,800 |
| | | | | | | | | | | |
Principal
Amount | | | | Rate | | | Maturity
Date | | Value |
| | | | | | | | | | | |
| TAX-EXEMPT SECURITIES – ESCROWED IN U.S.
GOVERNMENTS — (continued) |
| $ | 3,000,000 | | New Jersey State Transportation Trust Fund Authority Revenue Bonds, Transportation Systems, Series C, (Prerefunded 06/15/13 @ 100) | | 5.50 | % | | 06/15/23 | | $ | 3,299,940 |
| | 3,000,000 | | Pennsylvania State General Obligation Bonds, 2nd Series, (FSA) (Prerefunded 05/01/12 @ 100) | | 5.50 | | | 05/01/16 | | | 3,250,560 |
| | | | | | | | | | | |
| | | TOTAL TAX-EXEMPT SECURITIES — ESCROWED IN U.S. GOVERNMENTS (Cost $11,695,844) | | | 11,948,610 |
| | | | | | | | | | | |
| | | | |
| Shares | | | | | | | | | |
| | REGISTERED INVESTMENT COMPANIES — 0.49% | | | |
| | 319,451 | | BlackRock Muni Fund | | | 319,451 |
| | 1 | | Dreyfus Tax Exempt Cash Fund | | | 1 |
| | | | | | | | | | | |
| | | TOTAL REGISTERED INVESTMENT COMPANIES
(Cost $319,452) | | | 319,452 |
| | | | | | | | | | | |
| | | | | | | | | | |
TOTAL INVESTMENTS
(Cost $63,425,629) | | 98.25 | % | | $ | 64,234,045 |
OTHER ASSETS IN EXCESS OF LIABILITIES | | 1.75 | | | | 1,142,205 |
| | | | | | | | | | |
NET ASSETS | | 100.00 | % | | $ | 65,376,250 |
| | | | | | | | | | |
| (a) | Variable Rate Security—The rate disclosed is as of March 31, 2007 |
| (b) | Security exempt from registration under Rule 144A of the Securities Act of 1933. This security may be resold in transactions exempt from registration, normally to qualified institutional buyers. At March 31, 2007, these securities amounted to $1,573,770 or 2.41% of net assets. |
| (c) | Represents an illiquid security as of March 31, 2007. |
AMBAC—American Municipal Bond Assurance Corporation
FGIC—Financial Guaranty Insurance Corporation
FSA—Financial Security Assurance
MBIA—Municipal Bond Insurance Association
PSF-GTD—Public School Fund—Guaranteed
XLCA—XL Capital Assurance
See Notes to Financial Statements.
48
Excelsior Tax-Exempt Funds, Inc.
Portfolio of Investments — March 31, 2007
Long-Term Tax-Exempt Fund — (continued)
Notes (The following notes have not been audited by PricewaterhouseCoopers LLP):
These municipal securities meet the three highest ratings assigned by Moody’s Investors Services, Inc. or Standard and Poor’s Corporation or, where not rated, are determined by the Advisor, under the supervision of the Board of Directors, to be of comparable quality at the time of purchase to rated instruments that may be acquired by the Fund.
At March 31, 2007, approximately 18% of the net assets are invested in municipal securities that have letter of credit enhancement features or escrows in U.S. Government securities backing them, on which the Fund relies. Without such features, the securities may or may not meet the quality standards of securities purchased by the Fund.
The summary of the Fund’s investments as of March 31, 2007 is as follows: (Unaudited)
| | | | | | |
State Diversification | | % of
Net
Assets | | | Value |
New York | | 19.66 | % | | $ | 12,856,460 |
California | | 9.52 | | | | 6,222,285 |
New Jersey | | 8.05 | | | | 5,263,500 |
Texas | | 7.71 | | | | 5,043,858 |
Michigan | | 7.36 | | | | 4,810,635 |
Tennessee | | 7.03 | | | | 4,597,050 |
Pennsylvania | | 4.97 | | | | 3,250,560 |
Nevada | | 4.93 | | | | 3,226,620 |
Indiana | | 4.46 | | | | 2,917,695 |
Florida | | 3.18 | | | | 2,077,380 |
Illinois | | 3.17 | | | | 2,069,420 |
District Of Columbia | | 3.13 | | | | 2,046,780 |
Missouri | | 2.47 | | | | 1,614,495 |
Connecticut | | 2.41 | | | | 1,573,770 |
Oklahoma | | 2.14 | | | | 1,400,000 |
Alaska | | 1.84 | | | | 1,200,000 |
Ohio | | 1.77 | | | | 1,156,430 |
Massachusetts | | 1.66 | | | | 1,084,160 |
Alabama | | 1.51 | | | | 984,500 |
New Hampshire | | 0.79 | | | | 518,995 |
Registered Investment Companies | | 0.49 | | | | 319,452 |
| | | | | | |
Total Investments | | 98.25 | % | | $ | 64,234,045 |
Other Assets in Excess of Liabilities | | 1.75 | | | | 1,142,205 |
| | | | | | |
Net Assets | | 100.00 | % | | $ | 65,376,250 |
| | | | | | |
See Notes to Financial Statements
49
Excelsior Tax-Exempt Fund, Inc.
Portfolio of Investments — March 31, 2007
New York Intermediate-Term Tax-Exempt Fund
| | | | | | | | | | | |
Principal
Amount | | | | Rate | | | Maturity
Date | | Value |
| | | | | | | | | | | |
| | TAX-EXEMPT CASH EQUIVALENT SECURITIES — 2.97% |
| $ | 2,000,000 | | New York State Triborough Bridge & Tunnel Authority Revenue Bonds, Series A, (SPA: Dexia Credit Local)(a) | | 3.65 | % | | 11/01/35 | | $ | 2,000,000 |
| | 1,700,000 | | Port Authority of New York & New Jersey, Special Obligation Revenue Bonds, Versatile Structure Obligation, Series 2, (SPA: JP Morgan Chase & Co.)(a) | | 3.76 | | | 05/01/19 | | | 1,700,000 |
| | 500,000 | | Port Authority of New York & New Jersey, Special Obligation Revenue Bonds, Versatile Structure Obligation Series 5, (SPA: Bayerische Landesbank)(a) | | 3.75 | | | 08/01/24 | | | 500,000 |
| | | | | | | | | | | |
| | | TOTAL TAX-EXEMPT CASH EQUIVALENT SECURITIES
(Cost $4,200,000) | | | 4,200,000 |
| | | | | | | | | | | |
| TAX-EXEMPT CASH EQUIVALENT SECURITIES – BACKED BY
LETTERS OF CREDIT — 4.17% |
| | 1,400,000 | | Long Island Power Authority, New York Electric System Revenue Bonds, Sub-Series 2B, (BAYERISCHE LANDESBANK)(a) | | 3.74 | | | 05/01/33 | | | 1,400,000 |
| | 3,500,000 | | New York State Dormitory Authority Revenue Bonds, Oxford University, (LANDESBANK HESSEN)(a) | | 3.80 | | | 07/01/23 | | | 3,500,000 |
| | 1,000,000 | | New York State Metropolitan Transportation Authority Revenue Bonds, Sub-Series G2, (BNP PARIBAS)(a) | | 3.79 | | | 11/01/26 | | | 1,000,000 |
| | | | | | | | | | | |
| | | TOTAL TAX-EXEMPT CASH EQUIVALENT SECURITIES — BACKED BY LETTERS OF CREDIT
(Cost $5,900,000) | | | 5,900,000 |
| | | | | | | | | | | |
| | TAX-EXEMPT SECURITIES — 74.07% |
| | 2,565,000 | | Babylon, New York, General Obligation Bonds, (AMBAC) | | 5.00 | | | 01/01/13 | | | 2,738,651 |
| | | | | | | | | | | |
Principal
Amount | | | | Rate | | | Maturity
Date | | Value |
| | | | | | | | | | | |
| | TAX-EXEMPT SECURITIES — (continued) |
| $ | 5,000,000 | | Nassau County, New York, Interim Finance Authority, Sales Tax Revenue Bonds, Series H, (AMBAC) | | 5.25 | % | | 11/15/15 | | $ | 5,489,100 |
| | 4,000,000 | | New York City, New York, General Obligation Bonds, Series C | | 5.00 | | | 01/01/15 | | | 4,285,840 |
| | 2,430,000 | | New York City, New York, General Obligation Bonds, Series G | | 5.00 | | | 12/01/19 | | | 2,572,374 |
| | 850,000 | | New York City, New York, Industrial Development Agency Revenue Bonds, Queens Baseball Stadium, (AMBAC) | | 5.00 | | | 01/01/19 | | | 917,261 |
| | 1,000,000 | | New York City, New York, Industrial Development Agency Revenue Bonds, Queens Baseball Stadium, (AMBAC) | | 5.00 | | | 01/01/20 | | | 1,074,950 |
| | 2,280,000 | | New York City, New York, Metropolitan Transportation Authority Revenue Bonds, (CIFG) | | 5.00 | | | 11/15/22 | | | 2,441,584 |
| | 5,000,000 | | New York City, New York, Municipal Water Finance Authority, Water & Sewer System Revenue Bonds, Series A, (FSA) | | 5.38 | | | 06/15/16 | | | 5,397,300 |
| | 4,000,000 | | New York City, New York, Municipal Water Finance Authority, Water & Sewer System Revenue Bonds, Series D | | 5.13 | | | 06/15/19 | | | 4,236,160 |
| | 2,150,000 | | New York City, New York, Transitional Finance Authority Revenue Bonds, Series A | | 5.25 | | | 11/01/10 | | | 2,266,466 |
| | 3,000,000 | | New York City, New York, Transitional Finance Authority Revenue Bonds, Series A-1 | | 5.00 | | | 11/01/19 | | | 3,207,330 |
See Notes to Financial Statements.
50
Excelsior Tax-Exempt Fund, Inc.
Portfolio of Investments — March 31, 2007
New York Intermediate-Term Tax-Exempt Fund — (continued)
| | | | | | | | | | | |
Principal
Amount | | | | Rate | | | Maturity
Date | | Value |
| | | | | | | | | | | |
| | TAX-EXEMPT SECURITIES — (continued) |
| $ | 2,000,000 | | New York City, New York, Transitional Finance Authority Revenue Bonds, Series B | | 5.25 | % | | 08/01/17 | | $ | 2,154,580 |
| | 3,000,000 | | New York City, New York, Transitional Finance Authority Revenue Bonds, Series S-1 | | 5.00 | | | 07/15/11 | | | 3,151,710 |
| | 1,000,000 | | New York State Dormitory Authority Revenue Bonds, New York University, Series A | | 5.00 | | | 07/01/10 | | | 1,022,420 |
| | 1,000,000 | | New York State Dormitory Authority Revenue Bonds, New York University, Series A | | 5.00 | | | 07/01/12 | | | 1,031,400 |
| | 5,000,000 | | New York State Dormitory Authority Revenue Bonds, New York University, Series A, (AMBAC) | | 5.75 | | | 07/01/12 | | | 5,503,999 |
| | 4,720,000 | | New York State Dormitory Authority Revenue Bonds, State Personal Income Tax, Series D, (FGIC) | | 5.00 | | | 03/15/09 | | | 4,844,891 |
| | 3,525,000 | | New York State Energy Research & Development Authority, Pollution Control Revenue Bonds, Niagara Mohawk Power Project, Series A, (AMBAC) | | 5.15 | | | 11/01/25 | | | 3,666,740 |
| | 6,000,000 | | New York State Environmental Facilties Revenue Bonds, NYC Municipal Water Project, Series K | | 5.00 | | | 06/15/12 | | | 6,397,559 |
| | 5,000,000 | | New York State Local Government Assistance Corporation Revenue Bonds, Series A-1, (FSA) | | 5.00 | | | 04/01/12 | | | 5,314,850 |
| | 6,500,000 | | New York State Sales Tax Asset Receivable Corporation Revenue Bonds, Series A, (MBIA) | | 5.00 | | | 10/15/22 | | | 6,918,989 |
| | 2,500,000 | | New York State Tollway Authority, Highway & Bridge Trust Fund Revenue Bonds, Series B, (AMBAC) | | 5.00 | | | 04/01/19 | | | 2,685,950 |
| | | | | | | | | | | |
Principal
Amount | | | | Rate | | | Maturity
Date | | Value |
| | | | | | | | | | | |
| | TAX-EXEMPT SECURITIES — (continued) |
| $ | 2,015,000 | | New York State Triborough Bridge & Tunnel Authority Revenue Bonds, Series B | | 5.25 | % | | 11/15/13 | | $ | 2,195,443 |
| | 4,500,000 | | New York State Urban Development Corp. Revenue Bonds, State Personal Income Tax, Series B | | 5.00 | | | 03/15/22 | | | 4,831,830 |
| | 500,000 | | Oneida County, New York Industrial Developmental Agency, Civic Facility Revenue Bonds, Hamilton College PJ-Series A(b) | | 0.00 | | | 07/01/18 | | | 313,015 |
| | 895,000 | | Onondaga County, New York, Water Authority Revenue Bonds, Series A, (AMBAC) | | 5.00 | | | 09/15/22 | | | 953,972 |
| | 940,000 | | Onondaga County, New York, Water Authority Revenue Bonds, Series A (AMBAC) | | 5.00 | | | 09/15/23 | | | 1,001,937 |
| | 5,000,000 | | Puerto Rico Electric Power Authority Revenue Bonds, Series BB, (MBIA) | | 6.00 | | | 07/01/11 | | | 5,453,450 |
| | 1,500,000 | | Puerto Rico Public Improvement General Obligation Bonds, Series A | | 5.25 | | | 07/01/22 | | | 1,620,705 |
| | 2,000,000 | | Suffolk County, New York, Public Improvement General Obligation Bonds, Series A, (CIFG) | | 5.00 | | | 05/01/08 | | | 2,031,320 |
| | 3,750,000 | | Troy, New York, Industrial Development Authority Civic Facility Revenue Bonds, Rensselaer Polytech, Series E, (XLCA), (Mandatory Put 09/01/11 @ 100) | | 4.05 | | | 04/01/37 | | | 3,770,963 |
| | 2,425,000 | | Yonkers, New York, General Obligation Bonds, Series B, (MBIA) | | 5.00 | | | 08/01/21 | | | 2,582,771 |
| | 2,545,000 | | Yonkers, New York, General Obligation Bonds, Series B, (MBIA) | | 5.00 | | | 08/01/22 | | | 2,706,887 |
| | | | | | | | | | | |
| | | TOTAL TAX-EXEMPT SECURITIES
(Cost $103,763,301) | | | 104,782,397 |
| | | | | | | | | | | |
See Notes to Financial Statements.
51
Excelsior Tax-Exempt Fund, Inc.
Portfolio of Investments — March 31, 2007
New York Intermediate-Term Tax-Exempt Fund — (continued)
| | | | | | | | | | | |
Principal
Amount | | | | Rate | | | Maturity
Date | | Value |
| | | | | | | | | | | |
| | | TAX-EXEMPT SECURITIES – ESCROWED IN U.S. GOVERNMENTS — 17.86% |
| $ | 5,000,000 | | Long Island Power Authority, New York Electric System Revenue Bonds, Series A, (FSA) (Escrowed to Maturity) | | 5.25 | % | | 12/01/14 | | $ | 5,502,000 |
| | 3,300,000 | | New York State Metropolitan Transportation Authority Dedicated Tax Revenue Bonds, Series A, (FGIC) (Prerefunded 04/01/2010 @100) | | 5.88 | | | 04/01/21 | | | 3,514,005 |
| | 6,000,000 | | New York State Metropolitan Transportation Authority Revenue Bonds, Service Contract, Series 8, (FSA) (Prerefunded 07/01/13 @ 100) | | 5.38 | | | 07/01/21 | | | 6,579,720 |
| | 4,210,000 | | New York State Tobacco Settlement Asset Securitizaton Corporation Revenue Bonds, Series 1, (Prerefunded 07/15/09 @ 101) | | 6.38 | | | 07/15/39 | | | 4,500,195 |
| | 5,000,000 | | New York State Tollway Authority , Highway & Bridge Trust Fund Revenue Bonds, Series B, AMBAC (Prerefunded 04/01/09 @ 100) | | 5.25 | | | 04/01/24 | | | 5,162,050 |
| | | | | | | | | | | |
| | | TOTAL TAX-EXEMPT SECURITIES —ESCROWED IN U.S. GOVERNMENTS
(Cost $25,317,683) | | | 25,257,970 |
| | | | | | | | | | | |
| Shares | | | | | | | | | |
| | REGISTERED INVESTMENT COMPANIES — 0.04% | | | |
| | 1 | | Dreyfus New York Tax Exempt Cash Fund | | | 1 |
| | 55,645 | | Provident Institutional New York Money Market Fund | | | 55,645 |
| | | | | | | | | | | |
| | | TOTAL REGISTERED INVESTMENT COMPANIES
(Cost $55,646) | | | 55,646 |
| | | | | | | | | | | |
| | | | | | | | | | |
TOTAL INVESTMENTS
(Cost $139,236,630) | | 99.11 | % | | | | | | $ | 140,196,013 |
OTHER ASSETS IN EXCESS OF LIABILITIES | | 0.89 | | | | | | | | 1,258,238 |
| | | | | | | | | | |
NET ASSETS | | 100.00 | % | | | | | | $ | 141,454,251 |
| | | | | | | | | | |
| (a) | Variable Rate Security The rate disclosed is as of March 31, 2007. |
AMBAC—American Municipal Bond Assurance Corp.
CIFG—CDC IXIS Financial Guaranty
FGIC—Financial Guaranty Insurance Corp.
FSA—Financial Security Assurance
MBIA—Municipal Bond Insurance Association
SPA—Standby Purchase Agreement
XLCA—XL Capital Assurance
Notes (The following notes have not been audited by PricewaterhouseCoopers LLP):
These municipal securities meet the three highest ratings assigned by Moody’s Investors Services, Inc. or Standard and Poor’s Corporation or, where not rated, are determined by the Advisor, under the supervision of the Board of Directors, to be of comparable quality at the time of purchase to rated instruments that may be acquired by the Fund.
At March 31, 2007, approximately 22 % of the net assets are invested in municipal securities that have letter of credit enhancement features or escrows in U.S. Government securities backing them, on which the Fund relies. Without such features, the securities may or may not meet the quality standards of securities purchased by the Fund.
At March 31, 2007, approximately 99% of the net assets are invested in New York municipal securities. Economic changes affecting the state and certain of its public bodies and municipalities may affect the ability of issuers to pay the required principal and interest payments of the municipal securities.
See Notes to Financial Statements.
52
Excelsior Tax-Exempt Fund, Inc.
Portfolio of Investments — March 31, 2007
New York Intermediate-Term Tax-Exempt Fund — (continued)
The summary of the Fund’s investments as of March 31st, 2007 is as follows: (Unaudited)
| | | | | | |
Portfolio Diversification | | % of
Net
Assets | | | Value |
Revenue Bonds | | 63.93 | % | | $ | 90,443,850 |
Prerefunded | | 13.97 | | | | 19,755,970 |
General Obligation Bonds | | 13.11 | | | | 18.538,547 |
Backed by Letters of Credit | | 4.17 | | | | 5,900,000 |
Escrowed to Maturity | | 3.89 | | | | 5,502,000 |
Registered Investment Companies | | 0.04 | | | | 55,646 |
| | | | | | |
Total Investments | | 99.11 | % | | $ | 140,196,013 |
Other Assets in Excess of Liabilities | | 0.89 | | | | 1,258,238 |
| | | | | | |
Net Assets | | 100.00 | % | | $ | 141,454,251 |
| | | | | | |
See Notes to Financial Statements.
53
Excelsior Funds, Inc.
Portfolio of Investments — March 31, 2007
Short-Term Government Securities Fund
| | | | | | | | | | | |
Principal
Amount | | | | Rate | | | Maturity
Date | | Value |
| | | | | | | | | | | |
| | ASSET BACKED SECURITIES — 0.99% |
| $ | 1,648,892 | | Countrywide Home Equity Loan Trust, 2005-G 2A(a) | | 5.55 | % | | 12/15/35 | | $ | 1,650,083 |
| | 902,954 | | Residential Asset Mortgage Products, Inc., 2004-RS6 AI3 | | 4.54 | | | 08/25/28 | | | 899,585 |
| | | | | | | | | | | |
| | | TOTAL ASSET BACKED SECURITIES
(Cost $2,562,105) | | | | | | | | 2,549,668 |
| | | | | | | | | | | |
| | COLLATERALIZED MORTGAGE OBLIGATIONS — 13.70% |
| | | NON-GOVERNMENTAL AGENCY COLLATERALIZED MORTGAGE OBLIGATIONS — 10.09% |
| | 5,083,404 | | Bank of America Mortgage Securities, 2004-B 2A2(a) | | 4.10 | | | 03/25/34 | | | 5,043,531 |
| | 2,767,478 | | Bank of America Mortgage Securities, 2005-J 2A3(a) | | 5.09 | | | 11/25/35 | | | 2,743,586 |
| | 1,816,112 | | Bear Stearns ARM, 2004-1 11A3(a) | | 6.09 | | | 04/25/34 | | | 1,834,339 |
| | 2,254,902 | | Bear Stearns ARM, 2004-9 3A1(a) | | 5.24 | | | 09/25/34 | | | 2,259,732 |
| | 2,911,176 | | Countrywide Alternative Loan Trust, 2004-16CB 1A2 | | 5.50 | | | 07/25/34 | | | 2,880,526 |
| | 1,920,264 | | IMPAC CMB Trust, 2005-5 A4(a) | | 5.70 | | | 08/25/35 | | | 1,909,230 |
| | 2,138,180 | | Indymac Index Mortgage Loan Trust, 2004-AR4 3A(a) | | 4.74 | | | 08/25/34 | | | 2,133,851 |
| | 2,000,000 | | Washington Mutual Mortgage Securities Corp.,
2005-AR5 A2(a) | | 4.68 | | | 05/25/35 | | | 1,986,450 |
| | 2,882,844 | | Wells Fargo Mortgage Backed Securities Trust,
2004-AA A2(a) | | 5.00 | | | 12/25/34 | | | 2,854,448 |
| | 2,435,000 | | Wells Fargo Mortgage Backed Securities Trust, 2004-N A6 | | 4.00 | | | 08/25/34 | | | 2,383,679 |
| | | | | | | | | | | |
| | | | | | | | | | | 26,029,372 |
| | | | | | | | | | | |
| | | FEDERAL HOME LOAN MORTGAGE CORPORATION — 2.53% | | | |
| | 2,257,318 | | 2608 GK | | 4.50 | | | 03/15/17 | | | 2,224,003 |
| | 4,309,897 | | 2836 TA | | 5.00 | | | 10/15/27 | | | 4,305,752 |
| | | | | | | | | | | |
| | | | | | | | | | | 6,529,755 |
| | | | | | | | | | | |
| | | FEDERAL NATIONAL MORTGAGE
ASSOCIATION — 1.08% |
| | 2,808,107 | | 2002-89 CA | | 5.00 | | | 04/25/16 | | | 2,789,485 |
| | | | | | | | | | | |
| | | TOTAL COLLATERALIZED MORTGAGE OBLIGATIONS
(Cost $35,671,518) | | | 35,348,612 |
| | | | | | | | | | | |
| | | | | | | | | | | |
Principal
Amount | | | | Rate | | | Maturity
Date | | Value |
| | | | | | | | | | | |
| | COMMERCIAL MORTGAGE-BACKED SECURITIES — 3.25% |
| $ | 3,940,352 | | GE Capital Commercial Mortgage Corp., Series 2002-2A,
Class A2 | | 4.97 | % | | 08/11/36 | | $ | 3,927,199 |
| | 811,819 | | Greenwich Capital Commercial Funding Corp., 2004-GG1 A2 | | 3.84 | | | 06/10/36 | | | 807,308 |
| | 1,216,020 | | JP Morgan Chase Commercial Mortgage Securities Corp.,
2005-LDP2 A1(a) | | 4.33 | | | 07/15/42 | | | 1,201,152 |
| | 2,476,271 | | Mortgage Capital Funding, Inc., 2005-HQ5 A1 | | 4.52 | | | 01/14/42 | | | 2,451,591 |
| | | | | | | | | | | |
| | | TOTAL COMMERCIAL MORTGAGE-BACKED SECURITIES
(Cost $8,443,426) | | | 8,387,250 |
| | | | | | | | | | | |
| | U.S. GOVERNMENT AGENCY BONDS & NOTES — 24.69% |
| | | FANNIE MAE — 0.80% | | | |
| | 2,100,000 | | | | 3.55 | | | 01/17/08 | | | 2,074,283 |
| | | | | | | | | | | |
| | | FEDERAL HOME LOAN BANK — 17.25% |
| | 2,500,000 | | | | 3.88 | | | 02/15/08 | | | 2,473,893 |
| | 15,500,000 | | | | 4.75 | | | 06/11/08 | | | 15,454,739 |
| | 4,500,000 | | | | 5.13 | | | 07/30/08 | | | 4,509,149 |
| | 9,500,000 | | | | 5.38 | | | 07/17/09 | | | 9,604,975 |
| | 10,000,000 | | | | 5.00 | | | 10/16/09 | | | 9,977,570 |
| | 2,480,000 | | | | 5.19 | | | 02/22/10 | | | 2,474,809 |
| | | | | | | | | | | |
| | | | | | | | | | | 44,495,135 |
| | | | | | | | | | | |
| | | FREDDIE MAC — 6.64% | | | |
| | 7,150,000 | | | | 5.45 | | | 09/02/11 | | | 7,160,425 |
| | 10,000,000 | | | | 5.25 | | | 10/06/11 | | | 9,982,620 |
| | | | | | | | | | | |
| | | TOTAL U.S. GOVERNMENT AGENCY BONDS & NOTES
(Cost $63,697,313) | | | 17,143,045 |
| | | | | | | | | | | |
| | | | | | | | | | | 63,712,463 |
| | | | | | | | | | | |
| U.S. GOVERNMENT AGENCY MORTGAGE PASS THROUGH
SECURITIES — 39.96% |
| | | FEDERAL HOME LOAN MORTGAGE
CORPORATION — 17.90% |
| | 931,556 | | Pool # 1B2846 ARM(a) | | 4.95 | | | 04/01/35 | | | 931,936 |
| | 3,726,365 | | Pool # 1G0688 ARM(a) | | 5.76 | | | 01/01/36 | | | 3,754,140 |
| | 153,358 | | Pool # 1G1026 ARM(a) | | 5.91 | | | 07/01/36 | | | 154,358 |
| | 8,109,715 | | Pool # 1G1471 ARM(a) | | 5.50 | | | 01/01/37 | | | 8,151,861 |
| | 7,666,917 | | Pool # 782645 ARM(a) | | 5.43 | | | 02/01/36 | | | 7,727,457 |
| | 3,603,310 | | Pool # 847248 ARM(a) | | 5.24 | | | 03/01/34 | | | 3,642,747 |
See Notes to Financial Statements.
54
Excelsior Funds, Inc.
Portfolio of Investments — March 31, 2007
Short-Term Government Securities Fund — (continued)
| | | | | | | | | | | |
Principal
Amount | | | | Rate | | | Maturity
Date | | Value |
| | | | | | | | | | | |
| U.S. GOVERNMENT AGENCY MORTGAGE PASS THROUGH
SECURITIES — (continued) |
| | | FEDERAL HOME LOAN MORTGAGE
CORPORATION — (continued) |
| $ | 476,918 | | Pool # C68593 | | 7.00 | % | | 11/01/28 | | $ | 496,017 |
| | 2,919,895 | | Pool # G18136 | | 6.00 | | | 08/01/21 | | | 2,968,491 |
| | 8,915,289 | | Pool # J00617 | | 5.50 | | | 12/01/20 | | | 8,933,539 |
| | 9,276,531 | | Pool # J03619 | | 6.00 | | | 10/01/21 | | | 9,430,922 |
| | | | | | | | | | | |
| | | | | | | | | | | 46,191,468 |
| | | | | | | | | | | |
| | | FEDERAL NATIONAL MORTGAGE ASSOCIATION — 21.49% | | | |
| | 3,992,906 | | Pool # 256651 | | 6.00 | | | 03/01/37 | | | 4,007,546 |
| | 728,974 | | Pool # 323572 | | 7.50 | | | 01/01/29 | | | 764,730 |
| | 2,684,051 | | Pool # 375575 | | 6.60 | | | 12/01/07 | | | 2,680,937 |
| | 16,060 | | Pool # 517390 | | 8.00 | | | 11/01/11 | | | 16,485 |
| | 262,926 | | Pool # 535981 | | 8.00 | | | 01/01/16 | | | 275,040 |
| | 109,609 | | Pool # 545362 ARM(a) | | 5.96 | | | 12/01/31 | | | 109,771 |
| | 1,736,064 | | Pool # 634195 | | 7.50 | | | 10/01/28 | | | 1,821,217 |
| | 3,294,927 | | Pool # 693018 ARM(a) | | 4.36 | | | 06/01/33 | | | 3,326,851 |
| | 3,801,671 | | Pool # 735709 ARM(a) | | 4.82 | | | 06/01/35 | | | 3,761,096 |
| | 4,001,402 | | Pool # 745525 | | 5.50 | | | 05/01/21 | | | 4,011,567 |
| | 2,709,692 | | Pool # 766684 ARM(a) | | 4.42 | | | 03/01/34 | | | 2,697,130 |
| | 3,402,575 | | Pool # 770870 ARM(a) | | 4.28 | | | 04/01/34 | | | 3,372,016 |
| | 2,308,280 | | Pool # 780840 | | 4.50 | | | 06/01/34 | | | 2,307,122 |
| | 2,987,634 | | Pool # 784134 ARM(a) | | 5.46 | | | 10/01/35 | | | 3,003,494 |
| | 3,599,556 | | Pool # 786076 ARM(a) | | 4.74 | | | 07/01/34 | | | 3,597,430 |
| | 6,241,477 | | Pool # 786423 ARM(a) | | 4.59 | | | 07/01/34 | | | 6,241,780 |
| | 3,125,952 | | Pool # 805386 ARM(a) | | 4.86 | | | 01/01/35 | | | 3,125,357 |
| | 3,843,296 | | Pool # 828704 ARM(a) | | 5.00 | | | 07/01/35 | | | 3,823,994 |
| | 6,264,901 | | Pool # 871499 ARM(a) | | 5.60 | | | 04/01/36 | | | 6,321,292 |
| | 179,554 | | Pool # 892882 ARM(a) | | 5.86 | | | 07/01/36 | | | 180,966 |
| | | | | | | | | | | |
| | | | | | | | | | | 55,445,821 |
| | | | | | | | | | | |
| | | GOVERNMENT NATIONAL MORTGAGE ASSOCIATION — 0.57% |
| | 159,792 | | Pool # 780240 | | 8.50 | | | 09/15/09 | | | 159,871 |
| | 28,673 | | Pool # 780752 | | 8.50 | | | 04/15/10 | | | 28,695 |
| | 457,071 | | Pool # 781036 | | 8.00 | | | 10/15/17 | | | 481,335 |
| | 281,583 | | Pool # 781181 | | 9.00 | | | 12/15/09 | | | 287,018 |
| | 115,704 | | Pool # 80385 ARM(a) | | 5.25 | | | 03/20/30 | | | 116,710 |
| | 382,211 | | Pool # 8378 ARM(a) | | 5.75 | | | 07/20/18 | | | 386,027 |
| | | | | | | | | | | |
| | | | | | | | | | | 1,459,656 |
| | | | | | | | | | | |
| | | TOTAL U.S. GOVERNMENT AGENCY MORTGAGE PASS THROUGH SECURITIES
(Cost $103,237,952) | | | 103,096,945 |
| | | | | | | | | | | |
| | U.S. GOVERNMENT SECURITIES — 15.03% | | | |
| | | U.S. TREASURY NOTES — 15.03% | | | |
| | 250,000 | | (b) | | 4.88 | | | 04/30/08 | | | 249,971 |
| | 1,250,000 | | | | 4.88 | | | 05/31/08 | | | 1,250,586 |
| | 5,000,000 | | | | 5.00 | | | 07/31/08 | | | 5,013,280 |
| | 3,000,000 | | | | 4.63 | | | 11/15/09 | | | 3,004,569 |
| | | | | | | | | | | |
Principal
Amount | | | | Rate | | | Maturity
Date | | Value |
| | | | | | | | | | |
| | U.S. GOVERNMENT SECURITIES — (continued) | | | |
| | | U.S. TREASURY NOTES — (continued) | | | |
| $ | 29,105,000 | | | | 4.75 | % | | 02/15/10 | | $ | 29,270,986 |
| | | | | | | | | | | |
| | | | | | | | | | | 38,789,392 |
| | | | | | | | | | | |
| | | TOTAL U.S. GOVERNMENT SECURITIES (Cost $38,800,806) | | | 38,789,392 |
| | | | | | | | | | | |
| | | | |
| Shares | | | | | | | | | |
| | REGISTERED INVESTMENT COMPANIES — 1.64% |
| | 2,118,300 | | Dreyfus Government Cash Management Fund | | | 2,118,300 |
| | 2,118,302 | | Fidelity U.S. Treasury II Fund | | | 2,118,302 |
| | | | | | | | | | | |
| | | TOTAL REGISTERED INVESTMENT COMPANIES
(Cost $4,236,602) | | | 4,236,602 |
| | | | | | | | | | | |
| | | | | | |
TOTAL INVESTMENTS
(Cost $256,649,722) | | 99.26 | % | | $ | 256,120,932 |
OTHER ASSETS IN EXCESS OF LIABILITIES | | 0.74 | | | | 1,897,935 |
| | | | | | |
NET ASSETS | | 100.00 | % | | $ | 258,018,867 |
| | | | | | |
| (a) | Variable Rate Security—The rate disclosed is as of March 31, 2007. |
| (b) | All or part of security serves as collateral for futures contracts. |
ARM—Adjustable Rate Mortgage
| | | | | | | | | | | |
| Contracts | | | | | Value | | | Unrealized
Appreciation/
Depreciation | |
| FUTURES CONTRACTS | | | | | | | | |
| Long — | | | | | | | | | | | |
| 300 | | | U.S. 2 Year Treasury Note, expiring June 29, 2007 (notional amount $61,433,250) | | $ | 61,467,187 | | | $ | 33,937 | |
| 70 | | | U.S. 5 Year Treasury Note, expiring June 29, 2007 (notional amount $7,424,550) | | | 7,405,781 | | | | (18,769 | ) |
| Short — | | | | | | | | | | | |
| (180 | ) | | U.S. 10 Year Treasury Note, expiring June 20, 2007 (notional amount $(19,488,300)) | | | (19,462,500 | ) | | | 25,800 | |
| | | | | | | | | | | |
TOTAL FUTURES CONTRACTS
(Total notional amount $49,369,500) | | $ | 49,410,468 | | | $ | 40,968 | |
| | | | | | | | | | | |
See Notes to Financial Statements.
55
Excelsior Funds, Inc.
Portfolio of Investments — March 31, 2007
Short-Term Government Securities Fund — (continued)
The summary of the Fund’s investments as of March 31, 2007 is as follows: (Unaudited)
| | | | | | |
Portfolio Diversification | | % of
Net
Assets | | | Value |
U.S. Government & Agency Securities | | 79.68 | % | | $ | 205,598,800 |
Collateralized Mortgage Obligations | | 13.70 | | | | 35,348,612 |
Commercial Mortgage-Backed Securities | | 3.25 | | | | 8,387,250 |
Registered Investment Companies | | 1.64 | | | | 4,236,602 |
Asset Backed Securities | | 0.99 | | | | 2,549,668 |
| | | | | | |
Total Investments | | 99.26 | % | | $ | 256,120,932 |
Other Assets in Excess of Liabilities | | 0.74 | | | | 1,897,935 |
| | | | | | |
Net Assets | | 100.00 | % | | $ | 258,018,867 |
| | | | | | |
See Notes to Financial Statements.
56
Excelsior Tax-Exempt Funds, Inc.
Portfolio of Investments — March 31, 2007
Short-Term Tax-Exempt Securities Fund
| | | | | | | | | | | |
Principal
Amount | | | | Rate | | | Maturity
Date | | Value |
| | | | | | | | | | | |
| | TAX-EXEMPT CASH EQUIVALENT SECURITIES — 1.92% |
| $ | 2,000,000 | | Maryland State Economic Developmental Corporation Revenue Bonds(a) | | 3.80 | % | | 07/01/34 | | $ | 2,000,000 |
| | | | | | | | | | | |
| | | TOTAL TAX-EXEMPT CASH EQUIVALENT SECURITIES
(Cost $2,000,000) | | | 2,000,000 |
| | | | | | | | | | | |
| TAX-EXEMPT CASH EQUIVALENT SECURITIES — BACKED BY
LETTERS OF CREDIT — 4.42% |
| | 4,600,000 | | Ohio State Air Quality Development Authority Revenue Bonds, Ohio Edison Co., Series C, (WACHOVIA BANK N.A.)(a) | | 3.80 | | | 06/01/23 | | | 4,600,000 |
| | | | | | | | | | | |
| | | TOTAL TAX-EXEMPT CASH EQUIVALENT SECURITIES — BACKED BY LETTERS OF CREDIT
(Cost $4,600,000) | | | 4,600,000 |
| | | | | | | | | | | |
| | TAX-EXEMPT SECURITIES — 83.30% |
| | 6,000,000 | | California State General Obligation Bonds | | 5.00 | | | 06/01/08 | | | 6,101,040 |
| | 4,070,000 | | Clark County, Nevada, School District General Obligation Bonds, Series A, (FSA) | | 5.50 | | | 06/15/07 | | | 4,084,408 |
| | 5,000,000 | | Fairfax County, Virginia, Refunding & Public Improvement General Obligation Bonds, Series A | | 5.25 | | | 04/01/08 | | | 5,081,100 |
| | 890,000 | | Illinois State Housing Development Authority Multi-Family Revenue Bonds, Series G | | 3.70 | | | 07/01/08 | | | 889,430 |
| | 800,000 | | Illinois State Housing Development Authority Multi-Family Revenue Bonds, Series G | | 3.85 | | | 01/01/09 | | | 800,328 |
| | 1,810,000 | | Illinois State Housing Development Authority Multi-Family Revenue Bonds, Series G | | 3.90 | | | 01/01/10 | | | 1,807,122 |
| | 870,000 | | Illinois State Housing Development Authority Multi-Family Revenue Bonds, Series G | | 3.65 | | | 07/01/07 | | | 869,600 |
| | | | | | | | | | | |
Principal
Amount | | | | Rate | | | Maturity
Date | | Value |
| | | | | | | | | | | |
| | TAX-EXEMPT SECURITIES — (continued) |
| $ | 3,850,000 | | Jacksonville, Florida, Electric Authority Revenue Bonds,
Series 18 | | 5.00 | % | | 10/01/08 | | $ | 3,922,534 |
| | 5,035,000 | | Memphis, Tennessee, General Obligation Bonds, Series B, (MBIA) | | 5.00 | | | 11/01/08 | | | 5,140,282 |
| | 2,000,000 | | Montgomery County, Texas, General Obligation Bonds, Series B, (FSA), (Mandatory Put 09/01/08 @ 100) | | 5.00 | | | 03/01/28 | | | 2,037,500 |
| | 2,500,000 | | Montgomery County, Texas, General Obligation Bonds, Series B, (FSA), (Mandatory Put 09/01/10 @ 100) | | 5.00 | | | 03/01/29 | | | 2,597,400 |
| | 7,405,000 | | New Jersey State Economic Development Authority Revenue Bonds, Series F | | 5.00 | | | 06/15/07 | | | 7,423,512 |
| | 2,000,000 | | New Jersey State Tobacco Settlement Financing Corporation Revenue Bonds, Series 1A | | 4.13 | | | 06/01/10 | | | 1,999,020 |
| | 6,000,000 | | New York State Metropolitan Transportation Authority Revenue Bonds, Series H | | 5.25 | | | 11/15/10 | | | 6,319,980 |
| | 5,000,000 | | New York State Triborough Bridge & Tunnel Authority Revenue Bonds, (MBIA-IBC-BNY) | | 6.00 | | | 01/01/11 | | | 5,412,600 |
| | 1,250,000 | | Puerto Rico Convention Center District Authority, Hotel Occupancy Tax Revenue Bonds, Series A | | 5.00 | | | 07/01/11 | | | 1,300,725 |
| | 3,000,000 | | Reedy Creek, Florida, Improvement District Utilities Revenue Bonds, Series 2, (MBIA) | | 5.25 | | | 10/01/10 | | | 3,156,030 |
| | 5,000,000 | | San Antonio, Texas, Electric & Gas Systems Revenue Bonds,
Series A | | 5.00 | | | 02/01/10 | | | 5,193,000 |
See Notes to Financial Statements.
57
Excelsior Tax-Exempt Funds, Inc.
Portfolio of Investments — March 31, 2007
Short-Term Tax-Exempt Securities Fund — (continued)
| | | | | | | | | | | |
Principal
Amount | | | | Rate | | | Maturity
Date | | Value |
| | | | | | | | | | | |
| | TAX-EXEMPT SECURITIES — (continued) |
| $ | 3,995,000 | | South Carolina State Transportation Infrastructure, Bank Revenue Bonds,
Series A, (AMBAC) | | 5.00 | % | | 10/01/09 | | $ | 4,127,155 |
| | 7,000,000 | | Southeastern Virginia Public Services Authority Revenue Bonds, Series A, (MBIA) | | 5.25 | | | 07/01/10 | | | 7,354,410 |
| | 3,750,000 | | Tennessee State Energy Acquisition Corporation Gas Revenue Bonds,
Series A | | 5.00 | | | 09/01/09 | | | 3,849,900 |
| | 1,500,000 | | Texas State Municipal Gas Acquisition & Supply Corp., Gas Supply Revenue
Bonds, Senior Lien, Series A | | 5.00 | | | 12/15/10 | | | 1,558,830 |
| | 3,000,000 | | Texas State Transportation Commission Revenue Bonds, First Tier, Series A | | 5.00 | | | 04/01/12 | | | 3,173,460 |
| | 2,500,000 | | Troy, New York, Industrial Development Authority Civic Facility Revenue Bonds, Rensselaer Polytech, Series E, (XLCA), (Mandatory Put 09/01/11 @ 100) | | 4.05 | | | 04/01/37 | | | 2,513,975 |
| | | | | | | | | | | |
| | | TOTAL TAX-EXEMPT SECURITIES (Cost $86,770,633) | | | 86,713,341 |
| | | | | | | | | | | |
| TAX-EXEMPT SECURITIES – ESCROWED IN U.S.
GOVERNMENTS — 9.03% |
| | 4,565,000 | | Chicago, Illinois, Sales Tax Revenue Bonds, (FGIC) (Prerefunded 01/01/09 @ 101) | | 5.38 | | | 01/01/30 | | | 4,740,889 |
| | 595,000 | | New Jersey State Economic Development Authority Revenue Bonds, Series F
(Escrowed to Maturity) | | 5.00 | | | 06/15/07 | | | 596,601 |
| | | | | | | | | | | |
Principal
Amount | | | | Rate | | | Maturity
Date | | Value |
| | | | | | | | | | | |
| TAX-EXEMPT SECURITIES — ESCROWED IN U.S.
GOVERNMENTS — (continued) |
| $ | 4,030,000 | | New York City, New York, Transitional Finance Authority Revenue Bonds, Series A, (Escrowed to Maturity) | | 5.00 | % | | 11/01/07 | | $ | 4,064,013 |
| | | | | | | | | | | |
| | | TOTAL TAX-EXEMPT SECURITIES — ESCROWED IN U.S. GOVERNMENTS
(Cost $9,418,705) | | | 9,401,503 |
| | | | | | | | | | | |
| | | | |
| Shares | | | | | | | | | |
| | REGISTERED INVESTMENT COMPANIES — 0.28% |
| | 291,929 | | BlackRock Muni Fund | | | 291,929 |
| | 1 | | Dreyfus Tax Exempt Cash Fund | | | 1 |
| | | | | | | | | | | |
| | | TOTAL REGISTERED INVESTMENT COMPANIES
(Cost $291,930) | | | 291,930 |
| | | | | | | | | | | |
| | | | | | | | | | |
TOTAL INVESTMENTS
(Cost $103,081,268) | | 98.95 | % | | $ | 103,006,774 |
OTHER ASSETS IN EXCESS OF
LIABILITIES | | 1.05 | | | | 1,088,697 |
| | | | | | | | | | |
NET ASSETS | | 100.00 | % | | $ | 104,095,471 |
| | | | | | | | | | |
| (a) | Variable Rate Security—The rate disclosed is as of March 31, 2007. |
AMBAC—American Municipal Bond Assurance Corp.
BNY—Bank of New York
FGIC—Financial Guaranty Insurance Corp.
FSA—Financial Security Assurance
IBC—Insured Bond Certificates
MBIA—Municipal Bond Insurance Association
XLCA—XL Capital Assurance
Notes (The following notes have not been audited by PricewaterhouseCoopers LLP):
These municipal securities meet the three highest ratings assigned by Moody’s Investors Services, Inc. or Standard and Poor’s Corporation or, where not rated, are determined by the Advisor, under the supervision of the Board of Directors, to be of comparable quality at the time of purchase to rated instruments that may be acquired by the Fund.
At March 31, 2007, approximately 13% of the net assets are invested in municipal securities that have letter of credit enhancement features or escrows in U.S. Government securities backing them, on which the Fund relies. Without such features, the securities may or may not meet the quality standards of securities purchased by the Fund.
See Notes to Financial Statements.
58
Excelsior Tax-Exempt Funds, Inc.
Portfolio of Investments — March 31, 2007
Short-Term Tax-Exempt Securities Fund — (continued)
The summary of the Fund’s investments as of March 31, 2007 is as follows: (Unaudited)
| | | | | | |
State Diversification | | % of
Net
Assets | | | Value |
New York | | 17.59 | % | | $ | 18,310,568 |
Texas | | 13.99 | | | | 14,560,190 |
Virginia | | 11.95 | | | | 12,435,510 |
New Jersey | | 9.62 | | | | 10,019,133 |
Illinois | | 8.75 | | | | 9,107,370 |
Tennessee | | 8.64 | | | | 8,990,182 |
Florida | | 6.80 | | | | 7,078,564 |
California | | 5.86 | | | | 6,101,040 |
Ohio | | 4.42 | | | | 4,600,000 |
South Carolina | | 3.96 | | | | 4,127,154 |
Nevada | | 3.92 | | | | 4,084,408 |
Maryland | | 1.92 | | | | 2,000,000 |
Puerto Rico | | 1.25 | | | | 1,300,725 |
Registered Investment Companies | | 0.28 | | | | 291,930 |
| | | | | | |
Total Investments | | 98.95 | % | | $ | 103,006,774 |
Other Assets in Excess of Liabilities | | 1.05 | | | | 1,088,697 |
| | | | | | |
Net Assets | | 100.00 | % | | $ | 104,095,471 |
| | | | | | |
See Notes to Financial Statements.
59
Excelsior Funds
Statements of Assets and Liabilities
March 31, 2007
| | | | | | | | | | | | | | | | |
| | | | |
| | | California Short-Intermediate Term Tax-Exempt Income Fund | | | Core Bond
Fund | | | High Yield
Fund | | | Intermediate- Term Bond
Fund | |
ASSETS: | | | | | | | | | | | | | | | | |
Investments, at cost–see accompanying portfolios | | $ | 56,023,581 | | | $ | 549,299,881 | | | $ | 110,427,831 | | | $ | 464,987,213 | |
| | | | | | | | | | | | | | | | |
Investments, at value (Note 1) | | $ | 56,006,869 | | | $ | 550,355,840 | | | $ | 114,960,981 | | | $ | 465,349,614 | |
Cash | | | — | | | | 172,942 | | | | 131,318 | | | | 214,611 | |
Interest receivable | | | 732,717 | | | | 4,413,659 | | | | 2,376,317 | | | | 3,413,504 | |
Receivable for investments sold | | | — | | | | 333,651 | | | | 1,136,514 | | | | 1,999,838 | |
Receivable for fund shares sold | | | 46,540 | | | | 506,201 | | | | 503,500 | | | | 582,812 | |
Receivable from advisor | | | — | | | | — | | | | 114,221 | | | | — | |
Net receivable for variation margin on futures contracts | | | — | | | | 5,391 | | | | — | | | | 6,875 | |
Reclaims receivable | | | — | | | | — | | | | — | | | | — | |
Prepaid expenses | | | 825 | | | | 9,532 | | | | 1,593 | | | | 6,434 | |
| | | | | | | | | | | | | | | | |
Total Assets | | | 56,786,951 | | | | 555,797,216 | | | | 119,224,444 | | | | 471,573,688 | |
LIABILITIES: | | | | | | | | | | | | | | | | |
Payable for dividends declared | | | 113,224 | | | | 1,360,741 | | | | 583,926 | | | | 1,520,466 | |
Payable for investments purchased | | | — | | | | 1,742,048 | | | | 1,496,875 | | | | 2,008,125 | |
Payable for fund shares redeemed | | | 20,302 | | | | 450,371 | | | | 989,855 | | | | 423,418 | |
Investment advisory fees payable (Note 2) | | | — | | | | 170,085 | | | | — | | | | 109,044 | |
Administration fees payable (Note 2) | | | — | | | | 71,583 | | | | 1,451 | | | | 60,940 | |
Distribution and shareholder servicing fees payable (Note 2) | | | 11,567 | | | | 67,066 | | | | 25,911 | | | | 82,006 | |
Accrued expenses and other payables | | | 36,631 | | | | 215,549 | | | | 129,521 | | | | 93,846 | |
| | | | | | | | | | | | | | | | |
Total Liabilities | | | 181,724 | | | | 4,077,443 | | | | 3,227,539 | | | | 4,297,845 | |
| | | | | | | | | | | | | | | | |
NET ASSETS | | $ | 56,605,227 | | | $ | 551,719,773 | | | $ | 115,996,905 | | | $ | 467,275,843 | |
| | | | | | | | | | | | | | | | |
NET ASSETS consist of: | | | | | | | | | | | | | | | | |
Undistributed (distributions in excess of) net investment income | | $ | 741 | | | $ | 23,250 | | | $ | (496,938 | ) | | $ | (45,974 | ) |
Accumulated net realized gain (loss) on investments | | | (29,603 | ) | | | (1,867,299 | ) | | | (65,480,709 | ) | | | (5,229,655 | ) |
Unrealized appreciation (depreciation) of investments | | | (16,712 | ) | | | 1,096,687 | | | | 4,533,150 | | | | 431,095 | |
Par value (Note 5) | | | 7,904 | | | | 61,436 | | | | 241 | | | | 65,831 | |
Paid in capital in excess of par value | | | 56,642,897 | | | | 552,405,699 | | | | 177,441,161 | | | | 472,054,546 | |
| | | | | | | | | | | | | | | | |
Net Assets | | $ | 56,605,227 | | | $ | 551,719,773 | | | $ | 115,996,905 | | | $ | 467,275,843 | |
| | | | | | | | | | | | | | | | |
Net Assets: | | | | | | | | | | | | | | | | |
Shares | | $ | 56,605,227 | | | $ | 313,966,821 | | | $ | 111,687,408 | | | $ | 467,275,843 | |
Institutional Shares | | | — | | | | 237,751,881 | | | | 4,309,497 | | | | — | |
Retirement Shares | | | — | | | | 1,071 | | | | — | | | | — | |
Shares Outstanding (Note 5): | | | | | | | | | | | | | | | | |
Shares | | | 7,903,871 | | | | 34,965,727 | | | | 23,247,564 | | | | 65,831,298 | |
Institutional Shares | | | — | | | | 26,469,879 | | | | 897,626 | | | | — | |
Retirement Shares | | | — | | | | 119 | | | | — | | | | — | |
NET ASSET VALUE PER SHARE (net assets ÷ shares outstanding) | | | | | | | | | | | | | | | | |
Shares | | | $7.16 | | | | $8.98 | | | | $4.80 | | | | $7.10 | |
| | | | | | | | | | | | | | | | |
Institutional Shares | | | — | | | | $8.98 | | | | $4.80 | | | | — | |
| | | | | | | | | | | | | | | | |
Retirement Shares | | | — | | | | $8.98 | (a) | | | — | | | | — | |
| | | | | | | | | | | | | | | | |
| (a) | | Due to rounding net assets divided by shares outstanding does not equal the net asset value per share. |
See Notes to Financial Statements.
60
| | | | | | | | | | | | | | | | | |
| | | | |
Intermediate-
Term
Tax-Exempt
Fund | | | Long-Term
Tax-Exempt
Fund | | New York
Intermediate-
Term Tax-Exempt
Fund | | | Short-Term
Government
Securities
Fund | | | Short-Term
Tax-Exempt
Securities
Fund | |
| | | | | | | | | | | | | | | | | |
| $ | 384,015,191 | | | $ | 63,425,629 | | $ | 139,236,630 | | | $ | 256,649,722 | | | $ | 103,081,268 | |
| | | | | | | | | | | | | | | | | | |
| $ | 388,263,615 | | | $ | 64,234,045 | | $ | 140,196,013 | | | $ | 256,120,932 | | | $ | 103,006,774 | |
| | — | | | | — | | | — | | | | 37,614 | | | | — | |
| | 4,981,613 | | | | 854,413 | | | 1,979,702 | | | | 1,969,821 | | | | 1,476,373 | |
| | — | | | | — | | | — | | | | 756,724 | | | | — | |
| | 727,477 | | | | 522,766 | | | 50,000 | | | | 756,805 | | | | — | |
| | — | | | | — | | | — | | | | — | | | | — | |
| | — | | | | — | | | — | | | | 4,844 | | | | — | |
| | — | | | | — | | | — | | | | — | | | | — | |
| | 5,204 | | | | 923 | | | 1,902 | | | | 3,801 | | | | 1,575 | |
| | | | | | | | | | | | | | | | | | |
| | 393,977,909 | | | | 65,612,147 | | | 142,227,617 | | | | 259,650,541 | | | | 104,484,722 | |
| | | | | | | | | | | | | | | | | |
| | 1,035,945 | | | | 150,672 | | | 322,226 | | | | 689,127 | | | | 234,363 | |
| | — | | | | — | | | — | | | | — | | | | — | |
| | 189,999 | | | | 4,317 | | | 312,691 | | | | 671,543 | | | | 70,711 | |
| | 61,403 | | | | 8,403 | | | 31,907 | | | | 46,886 | | | | 307 | |
| | 51,194 | | | | 8,479 | | | 18,528 | | | | 33,750 | | | | 13,748 | |
| | 86,636 | | | | 16,553 | | | 33,607 | | | | 81,017 | | | | 3,182 | |
| | 89,707 | | | | 47,473 | | | 54,407 | | | | 109,351 | | | | 66,940 | |
| | | | | | | | | | | | | | | | | | |
| | 1,514,884 | | | | 235,897 | | | 773,366 | | | | 1,631,674 | | | | 389,251 | |
| | | | | | | | | | | | | | | | | | |
| $ | 392,463,025 | | | $ | 65,376,250 | | $ | 141,454,251 | | | $ | 258,018,867 | | | $ | 104,095,471 | |
| | | | | | | | | | | | | | | | | | |
| | | | | | | | | | | | | | | | | |
| $ | 48,700 | | | $ | 27,130 | | $ | 1,189 | | | $ | (27,406 | ) | | $ | 3,061 | |
| | (789,548 | ) | | | 268,755 | | | (746,293 | ) | | | (15,179,011 | ) | | | (2,843,991 | ) |
| | 4,248,424 | | | | 808,416 | | | 959,383 | | | | (487,822 | ) | | | (74,494 | ) |
| | 42,031 | | | | 6,449 | | | 16,398 | | | | 37,008 | | | | 14,653 | |
| | 388,913,418 | | | | 64,265,500 | | | 141,223,574 | | | | 273,676,098 | | | | 106,996,242 | |
| | | | | | | | | | | | | | | | | | |
| $ | 392,463,025 | | | $ | 65,376,250 | | $ | 141,454,251 | | | $ | 258,018,867 | | | $ | 104,095,471 | |
| | | | | | | | | | | | | | | | | | |
| | | | | | | | | | | | | | | | | |
| $ | 392,463,025 | | | $ | 65,376,250 | | $ | 141,454,251 | | | $ | 258,018,867 | | | $ | 104,095,471 | |
| | — | | | | — | | | — | | | | — | | | | — | |
| | — | | | | — | | | — | | | | — | | | | — | |
| | | | | | | | | | | | | | | | | |
| | 42,031,446 | | | | 6,448,625 | | | 16,398,410 | | | | 37,008,349 | | | | 14,652,563 | |
| | — | | | | — | | | — | | | | — | | | | — | |
| | — | | | | — | | | — | | | | — | | | | — | |
| | | | | | | | | | | | | | | | | |
| | $9.34 | | | | $10.14 | | | $8.63 | | | | $6.97 | | | | $7.10 | |
| | | | | | | | | | | | | | | | | | |
| | — | | | | — | | | — | | | | — | | | | — | |
| | | | | | | | | | | | | | | | | | |
| | — | | | | — | | | — | | | | — | | | | — | |
| | | | | | | | | | | | | | | | | | |
See Notes to Financial Statements.
61
Excelsior Funds
Statements of Operations
For the Year Ended March 31, 2007
| | | | | | | | | | | | | | | | |
| | | | |
| | | California
Short-Intermediate
Term Tax-Exempt
Income Fund | | | Core Bond
Fund | | | High Yield
Fund | | | Intermediate-
Term Bond
Fund | |
INVESTMENT INCOME: | | | | | | | | | | | | | | | | |
Interest income | | $ | 2,187,428 | | | $ | 21,099,384 | | | $ | 9,698,634 | | | $ | 22,219,156 | |
Dividend income | | | 58,763 | | | | 999,150 | | | | 65,635 | | | | 818,435 | |
| | | | | | | | | | | | | | | | |
Total Income | | | 2,246,191 | | | | 22,098,534 | | | | 9,764,269 | | | | 23,037,591 | |
EXPENSES: | | | | | | | | | | | | | | | | |
Investment advisory fees (Note 2) | | | 307,162 | | | | 2,873,544 | | | | 978,058 | | | | 1,573,622 | |
Administration fees (Note 2) | | | 92,710 | | | | 633,088 | | | | 184,503 | | | | 678,515 | |
Shareholder servicing fees- Shares (Note 2) | | | 153,581 | | | | 738,959 | | | | 286,507 | | | | 1,124,018 | |
Distribution and shareholder servicing fees- Retirement Shares (Note 2) | | | — | | | | 7 | | | | — | | | | — | |
Legal and audit fees | | | 30,033 | | | | 61,650 | | | | 481,103 | | | | 44,215 | |
Custodian fees | | | 4,287 | | | | 43,655 | | | | 14,279 | | | | 31,890 | |
Transfer agent fees | | | 14,895 | | | | 165,543 | | | | 34,437 | | | | 29,198 | |
Directors’/ Trustees’ fees and expenses (Note 2) | | | 7,397 | | | | 17,725 | | | | 9,095 | | | | 17,608 | |
Miscellaneous expenses | | | 36,329 | | | | 149,636 | | | | 66,401 | | | | 93,854 | |
| | | | | | | | | | | | | | | | |
Total Expenses | | | 646,394 | | | | 4,683,807 | | | | 2,054,383 | | | | 3,592,920 | |
Fees waived and reimbursed by: | | | | | | | | | | | | | | | | |
Investment Adviser (Note 2) | | | (307,162 | ) | | | (1,217,980 | ) | | | (522,552 | ) | | | (220,858 | ) |
Administrator (Note 2) | | | (32,228 | ) | | | (4,685 | ) | | | (271,220 | ) | | | (3,986 | ) |
Custody earning credits | | | (812 | ) | | | (8,001 | ) | | | (8,165 | ) | | | (8,412 | ) |
| | | | | | | | | | | | | | | | |
Net Expenses | | | 306,192 | | | | 3,453,141 | | | | 1,252,446 | | | | 3,359,664 | |
| | | | | | | | | | | | | | | | |
NET INVESTMENT INCOME | | | 1,939,999 | | | | 18,645,393 | | | | 8,511,823 | | | | 19,677,927 | |
| | | | | | | | | | | | | | | | |
REALIZED AND UNREALIZED GAIN (LOSS) ON INVESTMENTS (Note 1): | | | | | | | | | | | | | | | | |
Net realized gain (loss) on: | | | | | | | | | | | | | | | | |
Security transactions | | | 12,011 | | | | (67,050 | ) | | | (309,422 | ) | | | (3,117,415 | ) |
Futures | | | — | | | | — | | | | — | | | | (11,964 | ) |
| | | | | | | | | | | | | | | | |
Total net realized gain (loss) | | | 12,011 | | | | (67,050 | ) | | | (309,422 | ) | | | (3,129,379 | ) |
| | | | | | | | | | | | | | | | |
Change in unrealized appreciation (depreciation) of investments, futures and options during the year | | | 335,549 | | | | 5,359,028 | | | | 6,524,399 | | | | 8,596,210 | |
| | | | | | | | | | | | | | | | |
Net realized and unrealized gain (loss) on investments | | | 347,560 | | | | 5,291,978 | | | | 6,214,977 | | | | 5,466,831 | |
| | | | | | | | | | | | | | | | |
Net increase in net assets resulting from operations | | $ | 2,287,559 | | | $ | 23,937,371 | | | $ | 14,726,800 | | | $ | 25,144,758 | |
| | | | | | | | | | | | | | | | |
See Notes to Financial Statements.
62
| | | | | | | | | | | | | | | | | | |
| | | | |
Intermediate-
Term
Tax-Exempt
Fund | | | Long-Term
Tax-Exempt
Fund | | | New York
Intermediate-
Term Tax-Exempt
Fund | | | Short-Term
Government
Securities
Fund | | | Short-Term
Tax-Exempt
Securities
Fund | |
| | | | | | | | | | | | | | | | | | |
| $ | 14,699,859 | | | $ | 2,600,657 | | | $ | 5,214,718 | | | $ | 12,357,359 | | | $ | 4,064,636 | |
| | 110,298 | | | | 44,055 | | | | 39,308 | | | | 101,683 | | | | 24,497 | |
| | | | | | | | | | | | | | | | | | | |
| | 14,810,157 | | | | 2,644,712 | | | | 5,254,026 | | | | 12,459,042 | | | | 4,089,133 | |
| | | | | | | | | | | | | | | | | | |
| | 1,296,023 | | | | 315,596 | | | | 676,050 | | | | 849,998 | | | | 351,768 | |
| | 558,818 | | | | 95,255 | | | | 204,049 | | | | 427,588 | | | | 176,955 | |
| | 925,733 | | | | 146,753 | | | | 338,025 | | | | 708,328 | | | | 293,138 | |
| | | | | | | | | | | | | | | | | | |
| | — | | | | — | | | | — | | | | — | | | | — | |
| | 29,918 | | | | 32,861 | | | | 31,068 | | | | 29,366 | | | | 30,363 | |
| | 24,412 | | | | 7,366 | | | | 14,657 | | | | 36,651 | | | | 11,736 | |
| | 21,745 | | | | 24,736 | | | | 16,049 | | | | 97,265 | | | | 16,307 | |
| | 15,384 | | | | 7,394 | | | | 9,291 | | | | 13,609 | | | | 8,951 | |
| | 85,449 | | | | 41,825 | | | | 48,612 | | | | 73,067 | | | | 49,601 | |
| | | | | | | | | | | | | | | | | | | |
| | 2,957,482 | | | | 671,786 | | | | 1,337,801 | | | | 2,235,872 | | | | 938,819 | |
| | | | | | | | | | | | | | | | | | |
| | (550,546 | ) | | | (166,831 | ) | | | (256,114 | ) | | | (110,584 | ) | | | (235,286 | ) |
| | (1,075 | ) | | | (177 | ) | | | (388 | ) | | | (2,197 | ) | | | (286 | ) |
| | (5,895 | ) | | | (539 | ) | | | (1,535 | ) | | | (10,691 | ) | | | (4,142 | ) |
| | | | | | | | | | | | | | | | | | | |
| | 2,399,966 | | | | 504,239 | | | | 1,079,764 | | | | 2,112,400 | | | | 699,105 | |
| | | | | | | | | | | | | | | | | | | |
| | 12,410,191 | | | | 2,140,473 | | | | 4,174,262 | | | | 10,346,642 | | | | 3,390,028 | |
| | | | | | | | | | | | | | | | | | | |
| | | | | | | | | | | | | | | | | | |
| | | | | | | | | | | | | | | | | | |
| | | | | | | | | | | | | | | | | | |
| | (789,548 | ) | | | 267,714 | | | | (221,768 | ) | | | (1,580,994 | ) | | | (202,111 | ) |
| | — | | | | — | | | | — | | | | (18,146 | ) | | | — | |
| | | | | | | | | | | | | | | | | | | |
| | (789,548 | ) | | | 267,714 | | | | (221,768 | ) | | | (1,599,140 | ) | | | (202,111 | ) |
| | | | | | | | | | | | | | | | | | | |
| | | | | | | | | | | | | | | | | | |
| | | | |
| | 3,456,392 | | | | 768,194 | | | | 1,496,004 | | | | 4,796,996 | | | | 589,130 | |
| | | | | | | | | | | | | | | | | | | |
| | | | | | | | | | | | | | | | | | |
| | 2,666,844 | | | | 1,035,908 | | | | 1,274,236 | | | | 3,197,856 | | | | 387,019 | |
| | | | | | | | | | | | | | | | | | | |
| | | | | | | | | | | | | | | | | | |
| $ | 15,077,035 | | | $ | 3,176,381 | | | $ | 5,448,498 | | | $ | 13,544,498 | | | $ | 3,777,047 | |
| | | | | | | | | | | | | | | | | | | |
See Notes to Financial Statements.
63
Excelsior Funds
Statements of Changes in Net Assets
| | | | | | | | | | | | | | | | |
| | |
| | | California Short-
Intermediate Term
Tax-Exempt Income Fund | | | Core Bond Fund | |
| | | Year Ended March 31, | | | Year Ended March 31, | |
| | | 2007 | | | 2006 | | | 2007 | | | 2006 | |
Net investment income | | $ | 1,939,999 | | | $ | 2,060,305 | | | $ | 18,645,393 | | | $ | 10,061,835 | |
Net realized gain (loss) on security transactions | | | 12,011 | | | | 215,226 | | | | (67,050 | ) | | | 1,284,930 | |
Net realized gain (loss) on futures | | | — | | | | — | | | | — | | | | — | |
Change in unrealized appreciation (depreciation) of investments, futures and options during the year | | | 335,549 | | | | (1,292,978 | ) | | | 5,359,028 | | | | (7,274,735 | ) |
| | | | | | | | | | | | | | | | |
Net increase in net assets resulting from operations | | | 2,287,559 | | | | 982,553 | | | | 23,937,371 | | | | 4,072,030 | |
| | | | | | | | | | | | | | | | |
Distributions to shareholders: | | | | | | | | | | | | | | | | |
From net investment income | | | | | | | | | | | | | | | | |
Shares | | | (1,939,807 | ) | | | (2,061,472 | ) | | | (12,851,594 | ) | | | (10,218,978 | ) |
Institutional Shares | | | — | | | | — | | | | (5,693,159 | ) | | | (6,254 | ) |
Retirement Shares | | | — | | | | — | | | | (40 | ) | | | (38 | ) |
From net realized gain on investments | | | | | | | | | | | | | | | | |
Shares | | | (255,808 | ) | | | — | | | | — | | | | (3,571,500 | ) |
Institutional Shares | | | — | | | | — | | | | — | | | | (13 | ) |
Retirement Shares | | | — | | | | — | | | | — | | | | (13 | ) |
From tax return of capital | | | | | | | | | | | | | | | | |
Shares | | | — | | | | — | | | | — | | | | — | |
Institutional Shares | | | — | | | | — | | | | — | | | | — | |
| | | | | | | | | | | | | | | | |
Total distributions | | | (2,195,615 | ) | | | (2,061,472 | ) | | | (18,544,793 | ) | | | (13,796,796 | ) |
| | | | | | | | | | | | | | | | |
Increase (decrease) in net assets from fund share transactions (Note 5) | | | (9,841,880 | ) | | | 4,484,991 | | | | 263,311,270 | | | | 80,807,705 | |
| | | | | | | | | | | | | | | | |
Net increase (decrease) in net assets | | | (9,749,936 | ) | | | 3,406,072 | | | | 268,703,848 | | | | 71,082,939 | |
| | | | | | | | | | | | | | | | |
NET ASSETS: | | | | | | | | | | | | | | | | |
Beginning of year | | | 66,355,163 | | | | 62,949,091 | | | | 283,015,925 | | | | 211,932,986 | |
| | | | | | | | | | | | | | | | |
End of year(1) | | $ | 56,605,227 | | | $ | 66,355,163 | | | $ | 551,719,773 | | | $ | 283,015,925 | |
| | | | | | | | | | | | | | | | |
(1) Including undistributed (distributions in excess of) net investment income | | $ | 741 | | | $ | 492 | | | $ | 23,250 | | | $ | 2,407 | |
| | | | | | | | | | | | | | | | |
See Notes to Financial Statements.
64
| | | | | | | | | | | | | | | | | | | | | | |
| | |
| High Yield Fund | | | Intermediate-Term Bond Fund | | | Intermediate-Term
Tax-Exempt Fund | |
| Year Ended March 31, | | | Year Ended March 31, | | | Year Ended March 31, | |
| 2007 | | | 2006 | | | 2007 | | | 2006 | | | 2007 | | | 2006 | |
| $ | 8,511,823 | | | $ | 11,285,812 | | | $ | 19,677,927 | | | $ | 16,340,106 | | | $ | 12,410,191 | | | $ | 10,941,942 | |
| | (309,422 | ) | | | (4,085,478 | ) | | | (3,117,415 | ) | | | (1,475,445 | ) | | | (789,548 | ) | | | 730,630 | |
| | — | | | | — | | | | (11,964 | ) | | | — | | | | — | | | | | |
| | 6,524,399 | | | | (1,518,767 | ) | | | 8,596,210 | | | | (6,389,324 | ) | | | 3,456,392 | | | | (5,288,523 | ) |
| | | | | | | | | | | | | | | | | | | | | | | |
| | 14,726,800 | | | | 5,681,567 | | | | 25,144,758 | | | | 8,475,337 | | | | 15,077,035 | | | | 6,384,049 | |
| | | | | | | | | | | | | | | | | | | | | | | |
| | | | | | | | | | | | | | | | | | | | | | |
| | | | | | | | | | | | | | | | | | | | | | |
| | (7,813,910 | ) | | | (9,681,268 | ) | | | (19,642,311 | ) | | | (17,107,462 | ) | | | (12,408,623 | ) | | | (10,946,366 | ) |
| | (539,707 | ) | | | (1,002,532 | ) | | | — | | | | — | | | | — | | | | — | |
| | — | | | | — | | | | — | | | | — | | | | — | | | | — | |
| | | | | | | | | | | | | | | | | | | | | | |
| | — | | | | — | | | | — | | | | (1,062,921 | ) | | | (730,446 | ) | | | (367,682 | ) |
| | — | | | | — | | | | — | | | | — | | | | — | | | | — | |
| | — | | | | — | | | | — | | | | — | | | | — | | | | — | |
| | | | | | | | | | | | | | | | | | | | | | |
| | — | | | | (325,252 | ) | | | — | | | | — | | | | — | | | | — | |
| | — | | | | (28,599 | ) | | | — | | | | — | | | | — | | | | — | |
| | | | | | | | | | | | | | | | | | | | | | | |
| | (8,353,617 | ) | | | (11,037,651 | ) | | | (19,642,311 | ) | | | (18,170,383 | ) | | | (13,139,069 | ) | | | (11,314,048 | ) |
| | | | | | | | | | | | | | | | | | | | | | | |
| | (39,412,117 | ) | | | (15,055,145 | ) | | | 24,700,690 | | | | 36,375,391 | | | | 37,829,303 | | | | 8,085,957 | |
| | | | | | | | | | | | | | | | | | | | | | | |
| | (33,038,934 | ) | | | (20,411,229 | ) | | | 30,203,137 | | | | 26,680,345 | | | | 39,767,269 | | | | 3,155,958 | |
| | | | | | | | | | | | | | | | | | | | | | | |
| | | | | | | | | | | | | | | | | | | | | | |
| | 149,035,839 | | | | 169,447,068 | | | | 437,072,706 | | | | 410,392,361 | | | | 352,695,756 | | | | 349,539,798 | |
| | | | | | | | | | | | | | | | | | | | | | | |
| $ | 115,996,905 | | | $ | 149,035,839 | | | $ | 467,275,843 | | | $ | 437,072,706 | | | $ | 392,463,025 | | | $ | 352,695,756 | |
| | | | | | | | | | | | | | | | | | | | | | | |
$ | (496,938 | ) | | $ | (691,493 | ) | | $ | (45,974 | ) | | $ | (10,852 | ) | | $ | 48,700 | | | $ | 215 | |
| | | | | | | | | | | | | | | | | | | | | | | |
See Notes to Financial Statements.
65
Excelsior Funds
Statements of Changes in Net Assets
| | | | | | | | | | | | | | | | |
| | |
| | | Long-Term Tax-Exempt
Fund | | | New York Intermediate-Term
Tax-Exempt Fund | |
| | | Year Ended March 31, | | | Year Ended March 31, | |
| | | 2007 | | | 2006 | | | 2007 | | | 2006 | |
Net investment income | | $ | 2,140,473 | | | $ | 1,851,030 | | | $ | 4,174,262 | | | $ | 3,694,401 | |
Net realized gain (loss) on security transactions | | | 267,714 | | | | 654,816 | | | | (221,768 | ) | | | (524,525 | ) |
Net realized gain (loss) on futures | | | — | | | | — | | | | — | | | | — | |
Change in unrealized appreciation (depreciation) of investments during the year | | | 768,194 | | | | (820,799 | ) | | | 1,496,004 | | | | (227,681 | ) |
| | | | | | | | | | | | | | | | |
Net increase in net assets resulting from operations | | | 3,176,381 | | | | 1,685,047 | | | | 5,448,498 | | | | 2,942,195 | |
| | | | | | | | | | | | | | | | |
Ditributions to shareholders: | | | | | | | | | | | | | | | | |
From net investment income | | | | | | | | | | | | | | | | |
Shares | | | (2,140,560 | ) | | | (1,851,155 | ) | | | (4,173,194 | ) | | | (3,697,161 | ) |
From net realized gain on investments | | | | | | | | | | | | | | | | |
Shares | | | (392,493 | ) | | | — | | | | — | | | | (1,825,117 | ) |
| | | | | | | | | | | | | | | | |
Total distributions | | | (2,533,053 | ) | | | (1,851,155 | ) | | | (4,173,194 | ) | | | (5,522,278 | ) |
| | | | | | | | | | | | | | | | |
Increase (decrease) in net assets from fund share transactions (Note 5) | | | 3,475,678 | | | | (1,393,785 | ) | | | 9,152,946 | | | | (4,646,822 | ) |
| | | | | | | | | | | | | | | | |
Net increase (decrease) in net assets | | | 4,119,006 | | | | (1,559,893 | ) | | | 10,428,250 | | | | (7,226,905 | ) |
| | | | | | | | | | | | | | | | |
NET ASSETS: | | | | | | | | | | | | | | | | |
Beginning of year | | | 61,257,244 | | | | 62,817,137 | | | | 131,026,001 | | | | 138,252,906 | |
| | | | | | | | | | | | | | | | |
End of year(1) | | $ | 65,376,250 | | | $ | 61,257,244 | | | $ | 141,454,251 | | | $ | 131,026,001 | |
| | | | | | | | | | | | | | | | |
(1) Including undistributed (distributions in excess
of) net investment income | | $ | 27,130 | | | $ | 1,401 | | | $ | 1,189 | | | $ | 121 | |
| | | | | | | | | | | | | | | | |
See Notes to Financial Statements.
66
| | | | | | | | | | | | | | |
| |
Short-Term Government
Securities Fund | | | Short-Term Tax-Exempt
Securities | |
| Year Ended March 31, | | | Fund Year Ended March 31, | |
| 2007 | | | 2006 | | | 2007 | | | 2006 | |
| $ | 10,346,642 | | | $ | 10,630,035 | | | $ | 3,390,028 | | | $ | 3,454,819 | |
| | (1,580,994 | ) | | | (2,723,414 | ) | | | (202,111 | ) | | | (2,252,492 | ) |
| | (18,146 | ) | | | — | | | | — | | | | — | |
| | | | | | | | | | | | | | |
| | 4,796,996 | | | | 503,856 | | | | 589,130 | | | | 1,341,352 | |
| | | | | | | | | | | | | | | |
| | 13,544,498 | | | | 8,410,477 | | | | 3,777,047 | | | | 2,543,679 | |
| | | | | | | | | | | | | | | |
| | | | | | | | | | | | | | |
| | | | | | | | | | | | | | |
| | (11,425,192 | ) | | | (13,063,721 | ) | | | (3,386,967 | ) | | | (3,460,145 | ) |
| | | | | | | | | | | | | | |
| | — | | | | — | | | | — | | | | — | |
| | | | | | | | | | | | | | | |
| | (11,425,192 | ) | | | (13,063,721 | ) | | | (3,386,967 | ) | | | (3,460,145 | ) |
| | | | | | | | | | | | | | | |
| | | | | | | | | | | | | | |
| | (83,267,253 | ) | | | (58,697,749 | ) | | | (29,506,088 | ) | | | (104,932,090 | ) |
| | | | | | | | | | | | | | | |
| | (81,147,947 | ) | | | (63,350,993 | ) | | | (29,116,008 | ) | | | (105,848,556 | ) |
| | | | | | | | | | | | | | | |
| | | | | | | | | | | | | | |
| | 339,166,814 | | | | 402,517,807 | | | | 133,211,479 | | | | 239,060,035 | |
| | | | | | | | | | | | | | | |
| $ | 258,018,867 | | | $ | 339,166,814 | | | $ | 104,095,471 | | | $ | 133,211,479 | |
| | | | | | | | | | | | | | | |
$ | (27,406 | ) | | $ | (29,336 | ) | | $ | 3,061 | | | $ | — | |
| | | | | | | | | | | | | | | |
See Notes to Financial Statements.
67
Excelsior Funds
Financial Highlights — Selected Per Share Data and Ratios
| | | | | | | | | | | | | | | | | | | | | | | |
| | | | | | |
| | | Net Asset Value,
Beginning of
Year | | Net
Investment
Income | | | Net Realized and
Unrealized
Gain (Loss) on
Investments | | | Total From
Investment
Operations | | | Distributions
From Net
Investment
Income | | | Distributions
From Net
Realized
Gain on
Investments | |
CALIFORNIA SHORT-INTERMEDIATE TERM TAX-EXEMPT INCOME FUND — (10/01/96*) | |
Shares: | | | | | | | | | | | | | | | | | | | | | | | |
Year Ended March 31, | | | | | | | | | | | | | | | | | |
2007 | | $ | 7.16 | | $ | 0.23 | (2) | | $ | 0.03 | (2) | | $ | 0.26 | | | $ | (0.23 | ) | | $ | (0.03 | ) |
2006 | | | 7.27 | | | 0.23 | (2) | | | (0.11 | )(2) | | | 0.12 | | | | (0.23 | ) | | | — | |
2005 | | | 7.49 | | | 0.23 | (2) | | | (0.22 | )(2) | | | 0.01 | | | | (0.23 | ) | | | — | |
2004 | | | 7.49 | | | 0.24 | | | | — | | | | 0.24 | | | | (0.24 | ) | | | — | |
2003 | | | 7.27 | | | 0.25 | | | | 0.22 | | | | 0.47 | | | | (0.25 | ) | | | — | (3) |
CORE BOND FUND — (01/09/86*) | |
Shares: | | | | | | | | | | | | | | | | | | | | | | | |
Year Ended March 31, | | | | | | | | | | | | | | | | | |
2007 | | $ | 8.84 | | $ | 0.39 | (2) | | $ | 0.14 | (2) | | $ | 0.53 | | | $ | (0.39 | ) | | | — | |
2006 | | | 9.15 | | | 0.37 | (2) | | | (0.18 | )(2) | | | 0.19 | | | | (0.38 | ) | | $ | (0.12 | ) |
2005 | | | 9.43 | | | 0.37 | (2) | | | (0.23 | )(2) | | | 0.14 | | | | (0.37 | ) | | | (0.05 | ) |
2004 | | | 9.43 | | | 0.38 | | | | 0.14 | | | | 0.52 | | | | (0.38 | ) | | | (0.14 | ) |
2003 | | | 8.95 | | | 0.47 | | | | 0.50 | | | | 0.97 | | | | (0.48 | ) | | | (0.01 | ) |
HIGH YIELD FUND — (10/31/00*) | |
Shares: | | | | | | | | | | | | | | | | | | | | | | | |
Year Ended March 31, | | | | | | | | | | | | | | | | | |
2007 | | $ | 4.53 | | $ | 0.32 | (2) | | $ | 0.26 | (2) | | $ | 0.58 | | | $ | (0.31 | ) | | | — | |
2006 | | | 4.67 | | | 0.31 | (2) | | | (0.14 | )(2) | | | 0.17 | | | | (0.31 | )(4) | | | — | |
2005 | | | 4.71 | | | 0.34 | (2) | | | (0.08 | )(2) | | | 0.26 | | | | (0.30 | ) | | | — | |
2004 | | | 3.99 | | | 0.35 | (2) | | | 0.71 | (2) | | | 1.06 | | | | (0.34 | )(5) | | | — | |
2003 | | | 6.20 | | | 0.88 | (2) | | | (1.54 | )(2) | | | (0.66 | ) | | | (1.55 | )(6) | | | — | |
INTERMEDIATE-TERM BOND FUND — (12/31/92*) | |
Shares: | | | | | | | | | | | | | | | | | | | | | | | |
Year Ended March 31, | | | | | | | | | | | | | | | | | |
2007 | | $ | 7.01 | | $ | 0.31 | (2) | | $ | 0.09 | (2) | | $ | 0.40 | | | $ | (0.31 | ) | | | — | |
2006 | | | 7.16 | | | 0.27 | (2) | | | (0.12 | )(2) | | | 0.15 | | | | (0.28 | ) | | $ | (0.02 | ) |
2005 | | | 7.40 | | | 0.26 | (2) | | | (0.22 | )(2) | | | 0.03 | | | | (0.26 | ) | | | (0.01 | ) |
2004 | | | 7.39 | | | 0.26 | | | | 0.11 | | | | 0.37 | | | | (0.26 | ) | | | (0.10 | ) |
2003 | | | 7.10 | | | 0.37 | | | | 0.36 | | | | 0.73 | | | | (0.40 | ) | | | (0.04 | ) |
INTERMEDIATE-TERM TAX-EXEMPT FUND — (12/03/85*) | |
Shares: | | | | | | | | | | | | | | | | | | | | | | | |
Year Ended March 31, | | | | | | | | | | | | | | | | | |
2007 | | $ | 9.29 | | $ | 0.31 | (2) | | $ | 0.07 | (2) | | $ | 0.38 | | | $ | (0.31 | ) | | $ | (0.02 | ) |
2006 | | | 9.41 | | | 0.29 | (2) | | | (0.11 | )(2) | | | 0.18 | | | | (0.29 | ) | | | (0.01 | ) |
2005 | | | 9.69 | | | 0.26 | (2) | | | (0.24 | )(2) | | | 0.02 | | | | (0.26 | ) | | | (0.04 | ) |
2004 | | | 9.88 | | | 0.26 | | | | 0.15 | | | | 0.41 | | | | (0.26 | ) | | | (0.34 | ) |
2003 | | | 9.39 | | | 0.31 | | | | 0.55 | | | | 0.86 | | | | (0.31 | ) | | | (0.06 | ) |
| * | Commencement of operations. |
| (1) | Expense ratios before waiver of fees and reimbursement of expenses (if any) by adviser and administrator. |
| (2) | For comparative purposes, per share amounts are based on average shares outstanding. |
| (3) | Amount represents less than $0.01 per share. |
| (4) | Includes a tax return of capital of $(0.01). |
| (5) | Includes a tax return of capital of $(0.08). |
| (6) | Includes a tax return of capital of $(0.51). |
See Notes to Financial Statements.
68
| | | | | | | | | | | | | | | | | | | | | | | |
| | | | | | | |
Total
Distributions | | | Net Asset
Value,
End of
Year | | Total
Return | | | Net Assets,
End of
Year
(000’s) | | Ratio of Net
Operating
Expenses
to Average
Net Assets | | | Ratio of Gross
Operating
Expenses to
Average
Net Assets (1) | | | Ratio of Net
Investment
Income
to Average
Net Assets | | | Portfolio
Turnover
Rate | |
| | | | | | | | | | | | | | | | | | | | | | | |
| | | | | | | | | | | | | | | | | | | | | | | |
| | | | | | | | | | | | | | | | | | | | | | | |
| $ | (0.26 | ) | | $ | 7.16 | | 3.65 | % | | $ | 56,605 | | 0.50 | % | | 1.05 | % | | 3.16 | % | | 7 | % |
| | (0.23 | ) | | | 7.16 | | 1.60 | % | | | 66,355 | | 0.50 | % | | 1.03 | % | | 3.11 | % | | 48 | % |
| | (0.23 | ) | | | 7.27 | | 0.20 | % | | | 62,949 | | 0.50 | % | | 1.05 | % | | 3.18 | % | | 10 | % |
| | (0.24 | ) | | | 7.49 | | 3.19 | % | | | 66,894 | | 0.50 | % | | 0.90 | % | | 3.14 | % | | 15 | % |
| | (0.25 | ) | | | 7.49 | | 6.59 | % | | | 66,194 | | 0.46 | % | | 0.50 | % | | 3.36 | % | | 9 | % |
| | | | | | | | | | | | | | | | | | | | | | | |
| | | | | | | | | | | | | | | | | | | | | | | |
| | | | | | | | | | | | | | | | | | | | | | | |
| $ | (0.39 | ) | | $ | 8.98 | | 6.08 | % | | $ | 313,967 | | 0.90 | % | | 1.20 | % | | 4.36 | % | | 49 | % |
| | (0.50 | ) | | | 8.84 | | 2.00 | % | | | 281,767 | | 0.90 | % | | 1.30 | % | | 4.05 | % | | 95 | % |
| | (0.42 | ) | | | 9.15 | | 1.55 | % | | | 211,932 | | 0.90 | % | | 1.27 | % | | 3.99 | % | | 90 | % |
| | (0.52 | ) | | | 9.43 | | 5.74 | % | | | 269,027 | | 0.87 | % | | 1.11 | % | | 4.06 | % | | 84 | % |
| | (0.49 | ) | | | 9.43 | | 11.07 | % | | | 293,182 | | 0.84 | % | | 0.95 | % | | 5.10 | % | | 120 | % |
| | | | | | | | | | | | | | | | | | | | | | | |
| | | | | | | | | | | | | | | | | | | | | | | |
| | | | | | | | | | | | | | | | | | | | | | | |
| $ | (0.31 | ) | | $ | 4.80 | | 13.41 | % | | $ | 111,687 | | 1.05 | % | | 1.69 | % | | 6.95 | % | | 75 | % |
| | (0.31 | ) | | | 4.53 | | 3.72 | % | | | 136,991 | | 1.05 | % | | 1.29 | % | | 6.84 | % | | 62 | % |
| | (0.30 | ) | | | 4.67 | | 5.54 | % | | | 156,139 | | 1.04 | % | | 1.30 | % | | 6.50 | % | | 70 | % |
| | (0.34 | ) | | | 4.71 | | 27.45 | % | | | 151,476 | | 1.05 | % | | 1.36 | % | | 7.79 | % | | 170 | % |
| | (1.55 | ) | | | 3.99 | | (10.49 | )% | | | 131,342 | | 1.08 | % | | 1.35 | % | | 18.06 | % | | 153 | % |
| | | | | | | | | | | | | | | | | | | | | | | |
| | | | | | | | | | | | | | | | | | | | | | | |
| | | | | | | | | | | | | | | | | | | | | | | |
| $ | (0.31 | ) | | $ | 7.10 | | 5.79 | % | | $ | 467,276 | | 0.75 | % | | 0.80 | % | | 4.38 | % | | 70 | % |
| | (0.30 | ) | | | 7.01 | | 2.06 | % | | | 437,073 | | 0.72 | % | | 0.81 | % | | 3.74 | % | | 75 | % |
| | (0.27 | ) | | | 7.16 | | 0.45 | % | | | 410,392 | | 0.60 | % | | 0.81 | % | | 3.53 | % | | 59 | % |
| | (0.36 | ) | | | 7.40 | | 5.25 | % | | | 413,267 | | 0.56 | % | | 0.69 | % | | 3.56 | % | | 85 | % |
| | (0.44 | ) | | | 7.39 | | 10.50 | % | | | 404,627 | | 0.53 | % | | 0.69 | % | | 4.56 | % | | 98 | % |
| | | | | | | | | | | | | | | | | | | | | | | |
| | | | | | | | | | | | | | | | | | | | | | | |
| | | | | | | | | | | | | | | | | | | | | | | |
| $ | (0.33 | ) | | $ | 9.34 | | 4.15 | % | | $ | 392,463 | | 0.65 | % | | 0.80 | % | | 3.36 | % | | 39 | % |
| | (0.30 | ) | | | 9.29 | | 1.93 | % | | | 352,696 | | 0.65 | % | | 0.80 | % | | 3.09 | % | | 69 | % |
| | (0.30 | ) | | | 9.41 | | 0.20 | % | | | 349,540 | | 0.65 | % | | 0.81 | % | | 2.69 | % | | 0 | % |
| | (0.60 | ) | | | 9.69 | | 4.19 | % | | | 387,624 | | 0.56 | % | | 0.63 | % | | 2.60 | % | | 31 | % |
| | (0.37 | ) | | | 9.88 | | 9.31 | % | | | 407,102 | | 0.51 | % | | 0.59 | % | | 3.15 | % | | 48 | % |
See Notes to Financial Statements.
69
Excelsior Funds
Financial Highlights — Selected Per Share Data and Ratios
| | | | | | | | | | | | | | | | | | | | | | |
| | | | | | |
| | | Net Asset Value,
Beginning of
Year | | Net
Investment
Income | | | Net Realized and
Unrealized
Gain (Loss) on
Investments | | | Total From
Investment
Operations | | Dividends
From Net
Investment
Income | | | Distributions
From Net
Realized
Gain on
Investments | |
LONG-TERM TAX-EXEMPT FUND — (02/05/86*) | | | | | | | | | | | | |
Shares: | | | | | | | | | | | | | | | | | | | | | | |
Year Ended March 31, | | | | | | | | | | | | | | | | |
2007 | | $ | 10.03 | | $ | 0.35 | (2) | | $ | 0.16 | (2) | | $ | 0.51 | | $ | (0.34 | ) | | $ | (0.06 | ) |
2006 | | | 10.07 | | | 0.31 | (2) | | | (0.04 | )(2) | | | 0.27 | | | (0.31 | ) | | | — | |
2005 | | | 10.08 | | | 0.27 | (2) | | | (0.01 | )(2) | | | 0.27 | | | (0.28 | ) | | | — | |
2004 | | | 9.95 | | | 0.26 | | | | 0.13 | | | | 0.39 | | | (0.26 | ) | | | — | |
2003 | | | 9.48 | | | 0.29 | | | | 0.47 | | | | 0.76 | | | (0.29 | ) | | | — | |
NEW YORK INTERMEDIATE-TERM TAX-EXEMPT FUND — (05/31/90*) | | | | | |
Shares: | | | | | | | | | | | | | | | | | | | | | | |
Year Ended March 31, | | | | | | | | | | | | | | | | |
2007 | | $ | 8.55 | | $ | 0.27 | (2) | | $ | 0.08 | (2) | | $ | 0.35 | | $ | (0.27 | ) | | | — | |
2006 | | | 8.71 | | | 0.24 | (2) | | | (0.04 | )(2) | | | 0.20 | | | (0.24 | ) | | $ | (0.12 | ) |
2005 | | | 8.97 | | | 0.22 | (2) | | | (0.17 | )(2) | | | 0.05 | | | (0.22 | ) | | | (0.09 | ) |
2004 | | | 9.12 | | | 0.22 | | | | 0.14 | | | | 0.36 | | | (0.22 | ) | | | (0.29 | ) |
2003 | | | 8.74 | | | 0.27 | | | | 0.51 | | | | 0.78 | | | (0.27 | ) | | | (0.13 | ) |
SHORT-TERM GOVERNMENT SECURITIES FUND — (12/31/92*) | | | | | | | | |
Shares: | | | | | | | | | | | | | | | | | | | | | | |
Year Ended March 31, | | | | | | | | | | | | | | | | |
2007 | | $ | 6.92 | | $ | 0.25 | (2) | | $ | 0.08 | (2) | | $ | 0.33 | | $ | (0.28 | ) | | | — | |
2006 | | | 7.00 | | | 0.20 | (2) | | | (0.04 | )(2) | | | 0.16 | | | (0.24 | ) | | | — | |
2005 | | | 7.22 | | | 0.18 | (2) | | | (0.18 | )(2) | | | — | | | (0.22 | ) | | | — | |
2004 | | | 7.31 | | | 0.16 | | | | (0.03 | ) | | | 0.13 | | | (0.20 | ) | | $ | (0.02 | ) |
2003 | | | 7.11 | | | 0.26 | | | | 0.25 | | | | 0.51 | | | (0.26 | ) | | | (0.05 | ) |
SHORT-TERM TAX-EXEMPT SECURITIES FUND — (12/31/92*) | | | | | |
Shares: | | | | | | | | | | | | | | | | | | | | | | |
Year Ended March 31, | | | | | | | | | | | | | | | | |
2007 | | $ | 7.08 | | $ | 0.21 | (2) | | $ | 0.02 | (2) | | $ | 0.23 | | $ | (0.21 | ) | | | — | |
2006 | | | 7.13 | | | 0.14 | (2) | | | (0.05 | )(2) | | | 0.09 | | | (0.14 | ) | | | — | |
2005 | | | 7.22 | | | 0.09 | (2) | | | (0.09 | )(2) | | | — | | | (0.09 | ) | | | — | (3) |
2004 | | | 7.20 | | | 0.08 | | | | 0.02 | | | | 0.10 | | | (0.08 | ) | | | — | |
2003 | | | 7.17 | | | 0.12 | | | | 0.03 | | | | 0.15 | | | (0.12 | ) | | | — | |
| * | Commencement of operations. |
| (1) | Expense ratios before waiver of fees and reimbursement of expenses (if any) by adviser and administrator. |
| (2) | For comparative purposes, per share amounts are based on average shares outstanding. |
| (3) | Amount represents less than $0.01 per share. |
See Notes to Financial Statements.
70
| | | | | | | | | | | | | | | | | | | | | | | |
| | | | | | | |
Total
Distributions | | | Net Asset
Value,
End of
Year | | Total
Return | | | Net Assets,
End of
Year
(000’s) | | Ratio of Net
Operating
Expenses
to Average
Net Assets | | | Ratio of Gross
Operating
Expenses to
Average
Net Assets (1) | | | Ratio of Net
Investement
Income
to Average
Net Assets | | | Portfolio
Turnover
Rate | |
| | | | | | | | | | | | | | | | | | | | | | | |
| | | | | | | | | | | | | | | | | | | | | | | |
| | | | | | | | | | | | | | | | | | | | | | | |
| $ | (0.40 | ) | | $ | 10.14 | | 5.21 | % | | $ | 65,376 | | 0.80 | % | | 1.06 | % | | 3.39 | % | | 92 | % |
| | (0.31 | ) | | | 10.03 | | 2.64 | % | | | 61,257 | | 0.80 | % | | 1.02 | % | | 3.01 | % | | 88 | % |
| | (0.28 | ) | | | 10.07 | | 2.68 | % | | | 62,817 | | 0.80 | % | | 1.05 | % | | 2.74 | % | | 87 | % |
| | (0.26 | ) | | | 10.08 | | 4.01 | % | | | 72,783 | | 0.73 | % | | 0.80 | % | | 2.64 | % | | 111 | % |
| | (0.29 | ) | | | 9.95 | | 8.12 | % | | | 94,965 | | 0.70 | % | | 0.77 | % | | 2.99 | % | | 51 | % |
| | | | | | | | | | | | | | | | | | | | | | | |
| | | | | | | | | | | | | | | | | | | | | | | |
| | | | | | | | | | | | | | | | | | | | | | | |
| $ | (0.27 | ) | | $ | 8.63 | | 4.09 | % | | $ | 141,454 | | 0.80 | % | | 0.99 | % | | 3.09 | % | | 51 | % |
| | (0.36 | ) | | | 8.55 | | 2.25 | % | | | 131,026 | | 0.80 | % | | 0.98 | % | | 2.71 | % | | 83 | % |
| | (0.31 | ) | | | 8.71 | | 0.52 | % | | | 138,253 | | 0.80 | % | | 0.98 | % | | 2.46 | % | | 15 | % |
| | (0.51 | ) | | | 8.97 | | 4.06 | % | | | 178,107 | | 0.68 | % | | 0.73 | % | | 2.41 | % | | 42 | % |
| | (0.40 | ) | | | 9.12 | | 8.96 | % | | | 187,400 | | 0.67 | % | | 0.72 | % | | 2.96 | % | | 43 | % |
| | | | | | | | | | | | | | | | | | | | | | | |
| | | | | | | | | | | | | | | | | | | | | | | |
| | | | | | | | | | | | | | | | | | | | | | | |
| $ | (0.28 | ) | | $ | 6.97 | | 4.88 | % | | $ | 258,019 | | 0.75 | % | | 0.79 | % | | 3.65 | % | | 128 | % |
| | (0.24 | ) | | | 6.92 | | 2.36 | % | | | 339,167 | | 0.65 | % | | 0.77 | % | | 2.83 | % | | 118 | % |
| | (0.22 | ) | | | 7.00 | | 0.01 | % | | | 402,518 | | 0.60 | % | | 0.79 | % | | 2.57 | % | | 106 | % |
| | (0.22 | ) | | | 7.22 | | 1.90 | % | | | 469,218 | | 0.53 | % | | 0.67 | % | | 2.26 | % | | 231 | % |
| | (0.31 | ) | | | 7.31 | | 7.27 | % | | | 499,519 | | 0.49 | % | | 0.64 | % | | 3.22 | % | | 170 | % |
| | | | | | | | | | | | | | | | | | | | | | | |
| | | | | | | | | | | | | | | | | | | | | | | |
| | | | | | | | | | | | | | | | | | | | | | | |
| $ | (0.21 | ) | | $ | 7.10 | | 3.22 | % | | $ | 104,095 | | 0.60 | % | | 0.80 | % | | 2.89 | % | | 38 | % |
| | (0.14 | ) | | | 7.08 | | 1.33 | % | | | 133,211 | | 0.60 | % | | 0.77 | % | | 1.97 | % | | 111 | % |
| | (0.09 | ) | | | 7.13 | | (0.01 | )% | | | 239,060 | | 0.60 | % | | 0.76 | % | | 1.21 | % | | 10 | % |
| | (0.08 | ) | | | 7.22 | | 1.40 | % | | | 360,604 | | 0.47 | % | | 0.59 | % | | 1.12 | % | | 99 | % |
| | (0.12 | ) | | | 7.20 | | 2.04 | % | | | 291,282 | | 0.46 | % | | 0.58 | % | | 1.57 | % | | 31 | % |
See Notes to Financial Statements.
71
EXCELSIOR FUNDS
NOTES TO FINANCIAL STATEMENTS
| 1. | Significant Accounting Policies: |
Excelsior Funds, Inc. (“Excelsior Fund”) was incorporated under the laws of the State of Maryland on August 2, 1984. Excelsior Tax-Exempt Funds, Inc. (“Excelsior Tax-Exempt Fund”) was incorporated under the laws of the State of Maryland on August 8, 1984. Excelsior Funds Trust (the “Trust”) is a statutory trust organized under the laws of the State of Delaware on April 27, 1994. Excelsior Fund, Excelsior Tax-Exempt Fund and the Trust are registered under the Investment Company Act of 1940, as amended (the “1940 Act”), as open-ended diversified management investment companies with the exception of California Short-Intermediate Term Tax-Exempt Income Fund, New York Intermediate-Term Tax-Exempt Fund, New York Tax-Exempt Money Fund, Energy and Natural Resources Fund and Real Estate Fund, each of which is non-diversified.
Excelsior Fund, Excelsior Tax-Exempt Fund and the Trust currently offer shares in fifteen, seven and five managed investment portfolios, respectively, each having its own investment objectives and policies. The following is a summary of significant accounting policies for Core Bond Fund, Intermediate-Term Bond Fund and Short-Term Government Securities Fund, portfolios of Excelsior Fund, California Short-Intermediate Term Tax-Exempt Income Fund, Intermediate-Term Tax-Exempt Fund, Long-Term Tax-Exempt Fund, New York Intermediate-Term Tax-Exempt Fund and Short-Term Tax-Exempt Securities Fund, portfolios of Excelsior Tax-Exempt Fund, and High Yield Fund, a portfolio of the Trust (each a “Fund”, collectively, the “Funds”). Such policies are in conformity with accounting principles generally accepted in the United States of America and are consistently followed by Excelsior Fund, Excelsior Tax-Exempt Fund and the Trust in the preparation of their financial statements. The preparation of financial statements requires management to make estimates and assumptions that affect the reported amounts and disclosures in the financial statements. Actual results could differ from these estimates.
The California Short-Intermediate Term Tax-Exempt Income Fund, Intermediate-Term Bond Fund, Intermediate-Term Tax-Exempt Fund, Long-Term Tax-Exempt Fund, New York Intermediate-Term Tax-Exempt Fund, Short-Term Government Securities Fund and Short-Term Tax-Exempt Securities Fund offer one class of shares: Shares. The Core Bond Fund offers three classes of shares: Shares, Institutional Shares and Retirement Shares. The High Yield Fund offers two classes of shares: Shares and Institutional Shares. The Financial Highlights of the Institutional shares and Retirement Shares as well as the financial statements for the remaining portfolios of Excelsior Fund, Excelsior Tax-Exempt Fund and the Trust are presented separately.
Under a plan of reorganization adopted by the Trust, all of the assets and liabilities of the Income Fund and Total Return Bond Fund were transferred to the Institutional Shares of the Core Bond Fund. The reorganization, which qualified as a tax-free exchange for federal income tax purposes, was completed at the close of business on September 27, 2006. The following is a summary of shares outstanding, net assets, net asset value per share issued and unrealized appreciation/depreciation immediately before and after the reorganization.
72
| | | | | | | | | | | | | |
| | | Before Reorganization | | After
Reorganization |
| | | Income
Fund | | | Total Return
Bond Fund | | Core Bond
Fund | | Core Bond
Fund |
Shares: | | | | | | | | | | | | | |
Shares | | | — | | | | — | | | 32,810,661 | | | 32,810,661 |
Institutional Shares | | | 13,965,104 | | | | 18,165,949 | | | 1,824,521 | | | 26,973,187 |
Retirement Shares | | | — | | | | — | | | 117 | | | 117 |
Net Assets: | | | | | | | | | | | | | |
Shares | | $ | — | | | $ | — | | $ | 294,116,361 | | $ | 294,116,361 |
Institutional Shares | | $ | 96,434,781 | | | $ | 129,070,075 | | $ | 16,360,288 | | $ | 241,865,144 |
Retirement Shares | | $ | — | | | $ | — | | $ | 1,046 | | $ | 1,046 |
Net Asset Value: | | | | | | | | | | | | | |
Shares | | $ | — | | | $ | — | | $ | 8.96 | | $ | 8.96 |
Institutional Shares | | $ | 6.91 | | | $ | 7.11 | | $ | 8.97 | | $ | 8.97 |
Retirement Shares | | $ | — | | | $ | — | | $ | 8.97 | | $ | 8.97 |
Net unrealized appreciation/(depreciation) | | $ | (248,669 | ) | | $ | 617,540 | | $ | 740,329 | | $ | 1,109,200 |
(a) Portfolio valuation:
Short-term debt instruments that mature in 60 days or less are valued at amortized cost, which approximates market value. If available, debt securities are priced based upon valuations provided by independent, third-party pricing agents. The third-party pricing agents value debt securities at an evaluated price by employing methodologies that utilize actual market transactions, broker-supplied valuations, or other methodologies designed to identify the market value for such securities.
Investments in securities that are traded on recognized domestic and foreign stock exchanges are valued at the last sale price on the exchange on which such securities are primarily traded or at the last quoted sale price on a national securities market. Securities traded over-the-counter are valued each business day on the basis of closing over-the-counter sale prices. Equity securities that are traded on the NASDAQ National Market System for which quotations are readily available are valued at the official closing price. Securities for which market quotations or valuation by pricing agent are not readily available are valued in good faith at fair value pursuant to procedures adopted by the Board of Directors with regard to Excelsior Fund and Excelsior Tax-Exempt Fund and the Board of Trustees with regard to the Trust.
Mutual funds are valued at their respective net asset values as determined by those Funds in accordance with the 1940 Act.
(b) Concentration of risks:
The High Yield Fund is subject to special risks associated with investments in high yield bonds, which involve greater risk of default or downgrade and are more volatile than investment grade securities due to actual or perceived changes in an issuer’s creditworthiness. In addition, issuers of high yield bonds may be more susceptible than other issuers to economic downturns. High yield bonds are subject to the risk that the issuer may not be able to pay interest or dividends and ultimately repay principal upon maturity. Discontinuation of these payments could adversely affect the market value of the security.
73
At March 31, 2007, approximately 96% of the net assets of the California Short-Intermediate Term Tax-Exempt Income Fund are invested in California municipal securities and 99% of the net assets of the New York Intermediate-Term Tax-Exempt Fund are invested in New York municipal securities. Economic changes affecting a state and certain of its public bodies and municipalities may affect the ability of issuers to pay the required principal and interest payments of the municipal securities.
(c) Security transactions and investment income:
Security transactions are recorded on a trade date basis. Realized gains and losses on investments sold are recorded on the basis of identified cost. Interest income, adjusted for amortization of premiums and discounts on investments, is earned from settlement date and is recorded on the accrual basis. Dividend income is recorded on the ex-dividend date, except for certain dividends from foreign securities, which are recorded as soon as the Funds are informed of the dividend.
(d) Repurchase agreements:
The Funds may enter into agreements with financial institutions deemed to be creditworthy by the investment adviser subject to the seller’s agreement to repurchase and the Funds’ agreement to resell such securities at mutually agreed upon prices. The repurchase agreements are collateralized by U.S. Government obligations. The value of the collateral underlying the repurchase agreements will always be at least equal to the repurchase price, including any accrued interest earned on the repurchase agreement. If the counter-party defaults, and the fair value of the collateral declines, realization of the collateral by the Funds may be delayed or limited.
Default or bankruptcy of the seller may, however, expose the applicable Fund to possible delay in connection with the disposition of the securities or loss to the extent that proceeds from a sale of the underlying securities were less than the repurchase price under the agreement.
(e) Futures contracts:
Certain Funds may enter into futures contracts. Upon entering into a futures contract, the Funds deposit and maintain as cash collateral such initial margin as may be required by the exchanges on which the transaction is affected. Pursuant to the contracts, the Funds agree to receive from or pay to the broker an amount of cash equal to the daily fluctuation in the value of the contract. Such receipts or payments are known as “variation margin” and are recorded by the Funds as variation margin receivable or payable on futures contracts. During the period the futures contracts are open, changes in the value of the contracts are recognized on a daily basis to reflect the market value for the contracts at the end of each day’s trading and are recorded as unrealized gains or losses. When the contract is closed, the Funds record a realized gain or loss equal to the difference between the value of the contract at the time it was opened and the value at the time it was closed.
(f) TBA purchase commitments:
Certain Funds may enter into “TBA” (To Be Announced) purchase commitments to purchase securities for a fixed price at a future date, typically not exceeding 45 days. TBA purchase commitments may be considered securities in themselves, and involve risk of loss if the value of the security to be purchased declines prior to settlement date. The Funds must maintain liquid
74
securities having a value not less than the purchase price (including accrued interest) for such purchase commitments. Unsettled TBA purchase commitments are valued at the current market value of the underlying securities, according to the procedures described under “Portfolio Valuation” above.
(g) Mortgage dollar rolls:
Certain Funds may enter into mortgage dollar rolls (principally in securities referred to as TBA, (see note 1(f)) in which the Funds sell mortgage securities for delivery in the current month and simultaneously contract to repurchase similar, but not identical, securities at an agreed upon price on a fixed date. The Funds account for such dollar rolls as purchases and sales and receive compensation in consideration for entering into the commitment to repurchase. The Funds must maintain liquid securities having a value not less that the repurchase price (including accrued interest) for such dollar rolls. The market value of the securities that the Funds are required to repurchase may decline below the agreed upon repurchase price of those securities.
(h) Distributions to shareholders:
Dividends from net investment income are declared daily and paid monthly. Net realized capital gains, unless offset by any available capital loss carryforward, are distributed at least annually. Dividends and distributions are recorded on the ex-dividend date.
(i) Expense allocation:
Expenses directly attributable to a Fund are charged to that Fund. Other expenses are allocated to the respective Fund based on average daily net assets. Expenses attributable to a specific class of shares, such as shareholder servicing and distribution fees, are charged directly to that class.
(j) Borrowing:
The funds may obtain temporary bank loans from banks and custodians to use for meeting shareholder redemptions or for temporary or emergency purposes. The board of trustees approved an agreement between Excelsior Fund, Excelsior Tax-Exempt Fund and the Trust and their custodian, JPMorgan Chase Bank, N.A., under which the funds may participate in an uncommitted line of credit in the aggregate principal amount of $150 million. The funds pay interest on the amounts they borrow at negotiated rates based on the terms of the agreement. There was no borrowing from the line of credit for any funds during the year ended March 31, 2007.
(k) Custody Credits:
Each Fund has an arrangement with its custodian bank under which the Fund receives a credit for its uninvested cash balance to offset its custody fees. The credit amounts (if any) are disclosed in the statement of operations as a reduction to the Fund’s operating expenses.
(l) New accounting standards:
In September 2006, the Financial Accounting Standards Board (FASB) issued Statement of Financial Accounting Standards No. 157, “Fair Value Measurements” (SFAS No. 157). SFAS No. 157 defines fair value, establishes a framework for measuring fair value in accordance with generally accepted accounting principles and expands disclosure about fair value measurements. SFAS No. 157 is effective for fiscal years beginning after November 15, 2007. Management is currently evaluating the impact the adoption of SFAS No. 157 will have on the Fund’s financial statements.
75
In July 2006, the FASB released FASB Interpretation No. 48 “Accounting for Uncertainty in Income Taxes” (“FIN 48”). FIN 48 provides guidance for how uncertain tax positions should be recognized, measured, presented and disclosed in the financial statements. FIN 48 requires the evaluation of tax positions taken or expected to be taken in the course of preparing the Fund’s tax return to determine whether the tax positions are “more-likely-than-not” of being sustained by the applicable tax authority. Tax positions not deemed to meet the more-likely-than-not threshold would be recorded as a tax benefit or expense in the period of determination. Adoption of FIN 48 is required no later than the last business day of the first financial statement reporting period for fiscal years beginning after December 15, 2006. A Fund with a fiscal year ending March 31 will implement FIN 48 no later than September 28, 2007, and it is to be applied to all open tax years as of the effective date. Management is currently evaluating the impact of the adoption of FIN 48 to the financial statements.
| 2. | Investment Advisory Fee, Administration Fee, Shareholder Servicing Fees and Related Party Transactions: |
The Funds are advised by U.S. Trust New York Asset Management Division (“NYAMD”), a separate identifiable division of United States Trust Company, National Association (“USTNA”), or UST Advisers, Inc. (“USTA” and together with NYAMD, the “Advisers”). USTA is a wholly-owned subsidiary of USTNA. USTNA is a wholly-owned subsidiary of U.S. Trust Corporation, a registered bank holding company, which, in turn, is a wholly-owned subsidiary of The Charles Schwab Corporation. For the services provided pursuant to the Investment Advisory Agreements, each Adviser receives a fee, computed daily and paid monthly, as follows:
| | | |
California Short-Intermediate Term Tax-Exempt Income Fund | | 0.50 | % |
Core Bond Fund | | 0.65 | %* |
High Yield Fund | | 0.80 | % |
Intermediate-Term Bond Fund | | 0.35 | % |
Intermediate-Term Tax-Exempt Fund | | 0.35 | % |
Long-Term Tax-Exempt Fund | | 0.50 | % |
New York Intermediate-Term Tax-Exempt Fund | | 0.50 | % |
Short-Term Government Securities Fund | | 0.30 | % |
Short-Term Tax-Exempt Securities Fund | | 0.30 | % |
| * | On September 28, 2006, the Core Bond Fund changed its Investment Advisory fee to 0.65% from 0.75%. |
On November 20, 2006, The Charles Schwab Corporation (“Schwab”) announced an agreement to sell the U.S. Trust Corporation (“U.S. Trust”) a wholly-owned subsidiary of Schwab, to the Bank of America Corporation (the “Sale”). The Sale includes all of U.S. Trust’s subsidiaries, including USTA and USTNA. The completion of the Sale may result in the assignment of the current investment advisory agreements and termination in accordance with their terms. Therefore, the Board of Trustees/Directors approved the new investment advisory agreements at the same advisory fee rates disclosed above in January 2007 and Shareholders of each Fund approved the new agreements during meetings held in March and April 2007. It is anticipated that the Sale will close early in the third quarter of 2007.
76
USTA and BISYS Fund Services Ohio, Inc. (collectively, the “Administrators”) provide administrative services to the Funds. For the services provided to the Funds, the Administrators are entitled jointly to annual fees, computed daily and paid monthly, based on the combined aggregate average daily net assets of Excelsior Fund, Excelsior Tax-Exempt Fund and the Trust (excluding the international equity portfolios of Excelsior Fund and the Trust), all of which are affiliated investment companies, as follows: 0.200% of the first $200 million, 0.175% of the next $200 million and 0.150% over $400 million. The Administrators are entitled jointly to annual fees, computed daily and paid monthly, at the annual rate of 0.20% of the average daily net assets of the Emerging Markets Fund, International Equity Fund, International Fund and Pacific/Asia Fund. Administration fees payable by each Fund of the Excelsior Fund, Excelsior Tax-Exempt Fund and the Trust are determined in proportion to the relative average daily net assets of the respective Funds for the period paid. For the year ended March 31, 2007, administration fees paid to USTA were as follows:
| | | |
| | | Administration
Fees Paid to UST
Advisers, Inc. |
California Short-Intermediate Term Tax-Exempt Income Fund | | $ | 51,558 |
Core Bond Fund | | | 571,558 |
High Yield Fund | | | 114,852 |
Intermediate-Term Bond Fund | | | 612,071 |
Intermediate-Term Tax-Exempt Fund | | | 504,098 |
Long-Term Tax-Exempt Fund | | | 85,927 |
New York Intermediate-Term Tax-Exempt Fund | | | 184,067 |
Short-Term Government Securities Fund | | | 385,703 |
Short-Term Tax-Exempt Securities Fund | | | 159,621 |
BISYS Fund Services Ohio, Inc., waived Administration fees as presented on the Statements of Operations, excluding the California Short-Intermediate Term Tax-Exempt Income Fund and High Yield Fund which BISYS Fund Services Ohio, Inc., waived $158 and $3,952, respectively. USTNA waived the balance of Administration fees as presented on the Statements of Operations.
From time to time, in its sole discretion, each Adviser may undertake to waive a portion or all of the fees payable to it and may also reimburse the Funds for a portion of other expenses. For the year ended March 31, 2007, the Advisers have contractually agreed to waive investment advisory fees through, at least, July 31, 2007, and to reimburse other operating expenses to the extent necessary to keep total operating expenses from exceeding the following annual percentages of each Fund’s average daily net assets:
| | | |
California Short-Intermediate Term Tax-Exempt Income Fund — Shares | | 0.50 | % |
Core Bond Fund — Shares | | 0.90 | % |
High Yield Fund — Shares | | 1.05 | % |
Intermediate-Term Bond Fund — Shares | | 0.75 | % |
Intermediate-Term Tax-Exempt Fund — Shares | | 0.65 | % |
Long-Term Tax-Exempt Fund — Shares | | 0.80 | % |
New York Intermediate-Term Tax-Exempt Fund — Shares | | 0.80 | % |
Short-Term Government Securities Fund — Shares | | 0.75 | % |
Short-Term Tax-Exempt Securities Fund — Shares | | 0.60 | % |
Core Bond Fund — Institutional Shares | | 0.65 | % |
High Yield Fund — Institutional Shares | | 0.80 | % |
Core Bond Fund — Retirement Shares | | 1.40 | % |
77
For the year ended March 31, 2007, pursuant to the above, investment advisory fees waived by the Advisers were as follows:
| | | |
California Short-Intermediate Term Tax-Exempt Income Fund | | $ | 307,162 |
Core Bond Fund | | | 1,217,980 |
High Yield Fund | | | 522,552 |
Intermediate-Term Bond Fund | | | 220,858 |
Intermediate-Term Tax-Exempt Fund | | | 550,546 |
Long-Term Tax-Exempt Fund | | | 166,831 |
New York Intermediate-Term Tax-Exempt Fund | | | 256,114 |
Short-Term Government Securities Fund | | | 110,584 |
Short-Term Tax-Exempt Securities Fund | | | 235,286 |
The Funds have entered into shareholder servicing agreements with various service organizations, which include Charles Schwab & Co. Inc. (“CS & Co.”) and USTA. Services included in the servicing agreements include assistance in processing purchase, exchange and redemption requests; transmitting and receiving funds in connection with customer orders to purchase, exchange or redeem shares; and providing periodic statements. Shareholder servicing fees are incurred on a Fund or class level (where applicable). In consideration for these services, each service organization receives a fee from the Funds, computed daily and paid monthly, at an annual rate up to 0.25% of the average daily net assets of the Funds’ shares held by each service organization’s customers. The Advisers, out of their own resources, may additionally compensate certain organizations for providing these and other services.
For the year ended March 31, 2007, shareholder servicing fees paid to CS & Co. and USTA were as follows:
| | | |
California Short-Intermediate Term Tax-Exempt Income Fund | | $ | 144,953 |
Core Bond Fund | | | 496,810 |
High Yield Fund | | | 274,600 |
Intermediate-Term Bond Fund | | | 1,103,507 |
Intermediate-Term Tax-Exempt Fund | | | 909,928 |
Long-Term Tax-Exempt Fund | | | 140,871 |
New York Intermediate-Term Tax-Exempt Fund | | | 326,149 |
Short-Term Government Securities Fund | | | 588,475 |
Short-Term Tax-Exempt Securities Fund | | | 282,780 |
BISYS Fund Services Limited Partnership (the “Distributor”) serves as the Distributor of the Funds. Shares of each Fund are sold without a sales charge on a continuous basis by the Distributor.
Certain Funds have adopted a Distribution Plan pursuant to Rule 12b-1 under the 1940 Act, under which they may compensate the Distributor monthly for its services that are intended to result in the sale of Fund Shares (in the case of High Yield Fund) or Retirement Shares (in the case of Core Bond Fund), in an amount not to exceed the annual rate of 0.25% or 0.50%, respectively, of the average daily net asset value of such Fund’s Shares or Retirement Shares. For the year ended March 31, 2007, fees paid for Retirement Shares of Core Bond Fund were $4.
The board of trustees/directors may include people who are officers and/or trustees of other fund families affiliated to the investment adviser. Federal securities law limits the percentage of the “interested
78
persons” who may serve on a trust’s board, and the Funds are in compliance with these limitations. The funds did not pay any of the interested persons for their service as trustees/directors, but did pay non-interested persons (independent trustees), as noted in each fund’s Statement of Operations.
On June 12, 2006, the Excelsior High Yield and Intermediate-Term Bond Funds filed a lawsuit in connection with the bankruptcy of a security in which the Funds had invested. The ongoing legal expenses associated with the lawsuit are paid for by the Funds, but due to the expense limitation agreements currently in place, a significant portion of these legal expenses are being reimbursed by the Adviser. The Board has agreed that, should the Funds be successful in the lawsuit or otherwise receive compensation related to settling the case, the Advisers may request and receive reimbursement for such legal expenses that have been reimbursed to the Funds, to the extent that proceeds are available to cover such expenses. At this time, the outcome of the lawsuit cannot be determined.
| 3. | Purchases, Sales and Maturities of Securities: |
For the year ended March 31, 2007, purchases, sales and maturities of securities for the Funds, excluding short-term investments, aggregated:
| | | | | | |
| | | Purchases | | Sales and
Maturities |
California Short-Intermediate Term Tax-Exempt Income Fund | | $ | 4,383,090 | | $ | 11,806,866 |
Core Bond Fund | | | | | | |
U.S. Government | | | 143,164,160 | | | 130,390,053 |
Other | | | 56,826,501 | | | 58,962,109 |
High Yield Fund | | | 85,146,374 | | | 122,668,623 |
Intermediate-Term Bond Fund | | | | | | |
U.S. Government | | | 259,803,345 | | | 175,438,509 |
Other | | | 77,989,169 | | | 120,682,031 |
Intermediate-Term Tax-Exempt Fund | | | 179,514,181 | | | 135,503,723 |
Long-Term Tax-Exempt Fund | | | 62,297,704 | | | 53,439,363 |
New York Intermediate-Term Tax-Exempt Fund | | | 79,017,972 | | | 62,200,224 |
Short-Term Government Securities Fund | | | | | | |
U.S. Government | | | 348,251,692 | | | 409,656,572 |
Other | | | 9,665,205 | | | 36,344,895 |
Short-Term Tax-Exempt Securities Fund | | | 43,933,328 | | | 38,068,453 |
It is the policy of Excelsior Fund, Excelsior Tax-Exempt Fund and the Trust that each Fund continue to qualify as a regulated investment company, by complying with the requirements of the Internal Revenue Code applicable to regulated investment companies, and by distributing substantially all of its taxable earnings to its shareholders.
In order to avoid a federal excise tax, each Fund is required to distribute certain minimum amounts of net realized capital gain and net investment income for the respective twelve-month periods ending October 31 and December 31 each calendar year.
79
Net realized gains of the Funds derived in certain countries are subject to certain foreign taxation.
Dividends and distributions are determined in accordance with federal income tax regulations and may differ from accounting principles generally accepted in the United States of America. These differences are primarily due to differing treatments for deferral of losses on wash sales and net capital losses incurred after October 31 and within the taxable year (“Post-October losses”). To the extent these differences are permanent in nature (i.e. paydown reclasses), such amounts are reclassified within the composition of net assets based on their federal tax-basis treatment; temporary differences do not require reclassification. Accordingly, the following reclassifications have been made to/from the following accounts:
| | | | | | | | | | | | |
| | | Undistributed Net Investment
Income | | | Accumulated Net Realized Gain (Loss) | | | Paid-In-Capital | |
California Short-Intermediate Term Tax-Exempt Income Fund | | $ | 57 | | | $ | (57 | ) | | $ | — | |
Core Bond Fund | | | (79,757 | ) | | | 79,739 | | | | 18 | |
High Yield | | | 36,349 | | | | 29,285 | | | | (65,634 | ) |
Intermediate-Term Bond Fund | | | (70,738 | ) | | | 70,738 | | | | — | |
Intermediate-Term Tax-Exempt Fund | | | 46,917 | | | | (184 | ) | | | (46,733 | ) |
Long-Term Tax-Exempt Fund | | | 25,816 | | | | 1,040 | | | | (26,856 | ) |
Short-Term Government Securities Fund | | | 1,080,480 | | | | (1,080,004 | ) | | | (476 | ) |
The tax character of dividends and distributions declared during the years ended March 31, 2007 and March 31, 2006 were as follows:
| | | | | | | | | | | | | | | |
| | | Ordinary Income | | Tax-Exempt Income | | Long-Term Capital Gain | | Return of Capital | | Total* |
California Short-Intermediate Term Tax-Exempt Income Fund | | | | | | | | | | | | | | | |
Year ended March 31, 2007 | | $ | — | | $ | 1,958,947 | | $ | 255,865 | | $ | — | | $ | 2,214,812 |
Year ended March 31, 2006 | | | — | | | 2,014,082 | | | — | | | — | | | 2,014,082 |
Core Bond Fund | | | | | | | | | | | | | | | |
Year ended March 31, 2007 | | | 17,474,254 | | | — | | | — | | | — | | | 17,474,254 |
Year ended March 31, 2006 | | | 11,105,896 | | | — | | | 2,085,376 | | | — | | | 13,191,272 |
High Yield Fund | | | | | | | | | | | | | | | |
Year ended March 31, 2007 | | | 8,535,124 | | | — | | | — | | | — | | | 8,535,124 |
Year ended March 31, 2006 | | | 10,553,157 | | | — | | | — | | | 353,851 | | | 10,907,008 |
Intermediate-Term Bond Fund | | | | | | | | | | | | | | | |
Year ended March 31, 2007 | | | 19,470,592 | | | — | | | — | | | — | | | 19,470,592 |
Year ended March 31, 2006 | | | 16,649,941 | | | — | | | 1,063,363 | | | — | | | 17,713,304 |
Intermediate-Term Tax-Exempt Fund | | | | | | | | | | | | | | | |
Year ended March 31, 2007 | | | 40,388 | | | 12,244,881 | | | 730,630 | | | — | | | 13,015,899 |
Year ended March 31, 2006 | | | — | | | 10,697,181 | | | 367,896 | | | — | | | 11,065,077 |
Long-Term Tax-Exempt Fund | | | | | | | | | | | | | | | |
Year ended March 31, 2007 | | | 22,291 | | | 2,109,421 | | | 392,494 | | | — | | | 2,524,206 |
Year ended March 31, 2006 | | | — | | | 1,794,756 | | | — | | | — | | | 1,794,756 |
80
| | | | | | | | | | |
| | | Ordinary Income | | Tax-Exempt Income | | Long-Term Capital
Gain | | Return
of Capital | | Total* |
New York Intermediate-Term Tax-Exempt Fund | | | | | | | | | | |
Year ended March 31, 2007 | | — | | 4,137,826 | | — | | — | | 4,137,826 |
Year ended March 31, 2006 | | — | | 3,604,795 | | 1,825,238 | | — | | 5,430,033 |
Short-Term Government Securities Fund | | | | | | | | | | |
Year ended March 31, 2007 | | 11,619,856 | | — | | — | | — | | 11,619,856 |
Year ended March 31, 2006 | | 12,770,972 | | — | | — | | — | | 12,770,972 |
Short-Term Tax-Exempt Securities Fund | | | | | | | | | | |
Year ended March 31, 2007 | | — | | 3,424,308 | | — | | — | | 3,424,308 |
Year ended March 31, 2006 | | — | | 3,428,764 | | — | | — | | 3,428,764 |
| * | The total distributions paid may differ from the Statement of Changes in Net Assets because for tax purposes, dividends are recognized when actually paid. |
As of March 31, 2007, the components of distributable earnings (accumulated losses) on a tax basis were as follows:
| | | | | | | | | | | | | | | | | | | | | | |
| | | Undistributed
Ordinary
Income | | Undistributed
Tax-Exempt
Income | | Distributions
Payable* | | | Accumulated
Capital and
Other
Losses | | | Unrealized
Appreciation
(Depreciation)
| | | Total
Accumulated
Earnings/
(Deficit) | |
California Short-Intermediate Term Tax-Exempt Income Fund | | $ | — | | $ | 156,507 | | $ | (156,258 | ) | | $ | (29,602 | ) | | $ | (16,219 | ) | | $ | 45,574 | |
Core Bond Fund | | | 2,127,629 | | | — | | | (2,104,382 | ) | | | (1,634,009 | ) | | | 863,400 | | | | (733,365 | ) |
High Yield Fund | | | 26,428 | | | — | | | (702,997 | ) | | | (65,479,459 | ) | | | 4,698,152 | | | | (61,457,876 | ) |
Intermediate-Term Bond Fund | | | 1,722,807 | | | — | | | (1,768,781 | ) | | | (5,128,301 | ) | | | 329,741 | | | | (4,844,534 | ) |
Intermediate-Term Tax-Exempt Fund | | | — | | | 1,173,627 | | | (1,124,927 | ) | | | (789,548 | ) | | | 4,248,424 | | | | 3,507,576 | |
Long-Term Tax-Exempt Fund | | | 268,755 | | | 211,092 | | | (185,364 | ) | | | — | | | | 809,818 | | | | 1,104,301 | |
New York Intermediate-Term Tax-Exempt Fund | | | — | | | 372,234 | | | (371,045 | ) | | | (746,293 | ) | | | 959,383 | | | | 214,279 | |
Short-Term Government Securities Fund | | | 956,373 | | | — | | | (983,779 | ) | | | (15,138,043 | ) | | | (528,790 | ) | | | (15,694,239 | ) |
Short-Term Tax-Exempt Securities Fund | | | — | | | 265,165 | | | (262,104 | ) | | | (2,843,991 | ) | | | (74,494 | ) | | | (2,915,424 | ) |
| * | The total distributions payable may differ from the Statement of Assets and Liabilities because for tax purposes, dividends are recognized when actually paid. |
Post-October losses are deemed to arise on the first business day of a Fund’s next taxable year. As of March 31, 2007, the California Short-Intermediate Term Tax-Exempt Income Fund, Short-Term Government Securities Fund and, Short-Term Tax-Exempt Securities Fund deferred, on a tax basis, post-October losses of $29,602, $68,960 and $69,910, respectively.
For federal income tax purposes, capital loss carryforwards may be carried forward and applied against future capital gains. To the extent that such carryforwards are utilized, capital gains distributions
81
will be reduced. At March 31, 2007, the following Funds had capital loss carryforwards available to offset future net capital gains through the indicated expiration dates.
| | | | | | | | | | | | | | | | | | | | | |
| | | Expires |
| | | 2010 | | 2011 | | 2012 | | 2013 | | 2014 | | 2015 | | Total |
Core Bond Fund | | $ | — | | $ | — | | $ | — | | $ | — | | $ | 1,303,908 | | $ | 330,101 | | $ | 1,634,009 |
High Yield Fund | | | 440,234 | | | 17,456,849 | | | 40,103,941 | | | 1,461,417 | | | 6,017,018 | | | — | | | 65,479,459 |
Intermediate-Term Bond Fund | | | — | | | — | | | — | | | — | | | 481,322 | | | 4,646,979 | | | 5,128,301 |
Intermediate-Term Tax-Exempt Fund | | | — | | | — | | | — | | | — | | | — | | | 789,548 | | | 789,548 |
New York Intermediate-Term Tax-Exempt Fund | | | — | | | — | | | — | | | — | | | 165,776 | | | 580,517 | | | 746,293 |
Short-Term Government Securities Fund | | | — | | | — | | | 1,481,228 | | | 4,260,524 | | | 4,970,323 | | | 4,357,008 | | | 15,069,083 |
Short-Term Tax-Exempt Securities Fund | | | — | | | — | | | — | | | 287,228 | | | 518,076 | | | 1,968,777 | | | 2,774,081 |
At March 31, 2007, aggregate gross unrealized appreciation for all securities for which there was an excess of value over estimated tax cost and aggregate gross unrealized depreciation for all securities for which there was an excess of estimated tax cost over value is as follows:
| | | | | | | | | | | | | | |
| | | Federal
Tax
Cost | | Tax Basis
Unrealized
Appreciation | | Tax Basis
Unrealized
(Depreciation) | | | Net
Unrealized
Appreciation
(Depreciation) | |
California Short-Intermediate Term Tax-Exempt Income Fund | | $ | 56,023,090 | | $ | 226,511 | | $ | (242,730 | ) | | $ | (16,219 | ) |
Core Bond Fund | | | 549,492,440 | | | 4,344,919 | | | (3,481,519 | ) | | | 863,400 | |
High Yield Fund | | | 110,262,829 | | | 5,181,793 | | | (483,641 | ) | | | 4,698,152 | |
Intermediate-Term Bond Fund | | | 465,019,873 | | | 3,035,294 | | | (2,705,553 | ) | | | 329,741 | |
Intermediate-Term Tax-Exempt Fund | | | 384,015,191 | | | 4,730,854 | | | (482,430 | ) | | | 4,248,424 | |
Long-Term Tax-Exempt Fund | | | 63,424,227 | | | 897,230 | | | (87,412 | ) | | | 809,818 | |
New York Intermediate-Term Tax-Exempt Fund | | | 139,236,630 | | | 1,168,253 | | | (208,870 | ) | | | 959,383 | |
Short-Term Government Securities Fund | | | 256,649,722 | | | 590,725 | | | (1,119,515 | ) | | | (528,790 | ) |
Short-Term Tax-Exempt Securities Fund | | | 103,081,268 | | | 92,431 | | | (166,925 | ) | | | (74,494 | ) |
Excelsior Fund has authorized capital of 35 billion shares of Common Stock, 29.3756 billion of which is currently classified to represent interests in certain classes of shares. Authorized capital currently offered for each Fund is as follows: 750 million shares of the Core Bond Fund; 1.5 billion shares of the Intermediate-Term Bond Fund; and 1 billion shares of the Short-Term Government Securities Fund. Each share has a par value of $0.001 and represents an equal proportionate interest in the particular Fund with other shares of the same Fund, and is entitled to such dividends and distributions of taxable earnings on the assets belonging to such Fund as are declared at the discretion of Excelsior Fund’s Board of Directors.
Excelsior Tax-Exempt Fund has authorized capital of 24 billion shares of Common Stock, 15 billion of which is currently classified to represent interests in certain classes of shares. Authorized capital
82
currently offered for each Fund is as follows: 1.5 billion shares each of California Short-Intermediate Term Tax-Exempt Income Fund, Intermediate-Term Tax-Exempt Fund, Long-Term Tax-Exempt Fund, New York Intermediate-Term Tax-Exempt Fund and Short-Term Tax-Exempt Securities Fund. Each share has a par value of $0.001 and represents an equal proportionate interest in the particular Fund with other shares of the same Fund, and is entitled to such dividends and distributions of taxable and tax-exempt earnings on the assets belonging to such Fund as are declared at the discretion of Excelsior Tax-Exempt Fund’s Board of Directors.
The Trust has authorized an unlimited number of shares of beneficial interest of each class of each Fund. Each share has a par value of $0.00001 and represents an equal proportionate interest in the particular Fund with other shares of the same Fund, and is entitled to such dividends and distributions of taxable earnings on the assets belonging to such Fund as are declared at the discretion of the Trust’s Board of Trustees.
On shares purchased on or after October 16, 2006, a redemption fee of 2% of the value of the shares redeemed or exchanged was imposed on shares of the High Yield Fund redeemed or exchanged 30 days or less after their date of purchase. The redemption fee is intended to limit short-term trading in the Fund.
Capital Share Transactions
| | | | | | | | | | | | | | |
| | | California Short-Intermediate Term Tax-Exempt Income Fund | |
| | | Year Ended March 31, | |
| | | 2007 | | | 2006 | |
| | | Shares | | | Amounts | | | Shares | | | Amounts | |
Sold | | 2,429,521 | | | $ | 17,401,512 | | | 3,993,301 | | | $ | 28,933,240 | |
Issued as reinvestment of dividends | | 92,381 | | | | 662,564 | | | 87,807 | | | | 635,525 | |
Redeemed | | (3,890,655 | ) | | | (27,905,956 | ) | | (3,467,123 | ) | | | (25,083,774 | ) |
| | | | | | | | | | | | | | |
Net Increase (Decrease) | | (1,368,753 | ) | | $ | (9,841,880 | ) | | 613,985 | | | $ | 4,484,991 | |
| | | | | | | | | | | | | | |
| |
| | | Core Bond Fund | |
| | | Year Ended March 31, | |
| | | 2007 | | | 2006 | |
| | | Shares | | | Amounts | | | Shares | | | Amounts | |
Sold: | | | | | | | | | | | | | | |
Shares | | 9,986,679 | | | $ | 88,776,364 | | | 13,774,392 | | | $ | 125,488,152 | |
Institutional Shares | | 2,772,888 | | | | 24,623,459 | | | 141,024 | | | | 1,262,505 | |
Retirement Shares | | — | | | | — | | | — | | | | — | |
Issued in connection with merger(a) | | 25,148,666 | | | | 225,504,856 | | | — | | | | — | |
Issued as reinvestment of dividends: | | | | | | | | | | | | | | |
Shares | | 673,001 | | | | 5,989,211 | | | 681,642 | | | | 6,160,386 | |
Institutional Shares | | 113,170 | | | | 1,016,339 | | | 189 | | | | 1,685 | |
Retirement Shares | | 4 | | | | 40 | | | 5 | | | | 50 | |
Redeemed: | | | | | | | | | | | | | | |
Shares | | (7,567,445 | ) | | | (67,312,972 | ) | | (5,733,515 | ) | | | (52,104,922 | ) |
Institutional Shares | | (1,706,058 | ) | | | (15,286,027 | ) | | — | | | | — | |
Retirement Shares | | — | | | | — | | | (16 | ) | | | (151 | ) |
| | | | | | | | | | | | | | |
Net Increase (Decrease) | | 29,420,905 | | | $ | 263,311,270 | | | 8,863,721 | | | $ | 80,807,705 | |
| | | | | | | | | | | | | | |
| (a) | Effective at the close of business on September 27, 2006, the Core Bond Fund (Institutional Shares Class) acquired all of the net assets of the Income Fund and Total Return Bond Fund. |
83
| | | | | | | | | | | | | | |
| | | High Yield Fund | |
| | | Year Ended March 31, | |
| | | 2007 | | | 2006 | |
| | | Shares | | | Amounts | | | Shares | | | Amounts | |
Sold: | | | | | | | | | | | | | | |
Shares | | 6,072,661 | | | $ | 28,550,138 | | | 13,700,176 | | | $ | 62,544,844 | |
Institutional Shares | | 155,243 | | | | 699,379 | | | 853,862 | | | | 3,892,678 | |
Issued as reinvestment of dividends: | | | | | | | | | | | | | | |
Shares | | 217,741 | | | | 1,004,402 | | | 304,113 | | | | 1,384,476 | |
Institutional Shares | | 32,619 | | | | 149,603 | | | 107,579 | | | | 488,209 | |
Redeemed: | | | | | | | | | | | | | | |
Shares | | (13,302,993 | ) | | | (60,913,343 | ) | | (17,199,458 | ) | | | (78,172,561 | ) |
Institutional Shares | | (1,952,444 | ) | | | (8,902,311 | ) | | (1,152,309 | ) | | | (5,192,791 | ) |
Redemption fee | | — | | | | 15 | | | — | | | | — | |
| | | | | | | | | | | | | | |
Net Increase (Decrease) | | (8,777,173 | ) | | $ | (39,412,117 | ) | | (3,386,037 | ) | | $ | (15,055,145 | ) |
| | | | | | | | | | | | | | |
| | | | | | | | | | | | | | |
| |
| | | Intermediate-Term Bond Fund | |
| | | Year Ended March 31, | |
| | | 2007 | | | 2006 | |
| | | Shares | | | Amounts | | | Shares | | | Amounts | |
Sold | | 18,049,503 | | | $ | 127,159,970 | | | 22,398,525 | | | $ | 160,313,146 | |
Issued as reinvestment of dividends | | 362,756 | | | | 2,558,710 | | | 315,931 | | | | 2,254,952 | |
Redeemed | | (14,921,064 | ) | | | (105,017,990 | ) | | (17,689,147 | ) | | | (126,192,707 | ) |
| | | | | | | | | | | | | | |
Net Increase (Decrease) | | 3,491,195 | | | $ | 24,700,690 | | | 5,025,309 | | | $ | 36,375,391 | |
| | | | | | | | | | | | | | |
| |
| | | Intermediate-Term Tax-Exempt Fund | |
| | | Year Ended March 31, | |
| | | 2007 | | | 2006 | |
| | | Shares | | | Amounts | | | Shares | | | Amounts | |
Sold | | 12,042,682 | | | $ | 112,338,953 | | | 11,552,408 | | | $ | 108,911,261 | |
Issued as reinvestment of dividends | | 126,628 | | | | 1,181,763 | | | 109,248 | | | | 1,029,354 | |
Redeemed | | (8,123,028 | ) | | | (75,691,413 | ) | | (10,822,740 | ) | | | (101,854,658 | ) |
| | | | | | | | | | | | | | |
Net Increase (Decrease) | | 4,046,282 | | | $ | 37,829,303 | | | 838,916 | | | $ | 8,085,957 | |
| | | | | | | | | | | | | | |
| |
| | | Long-Term Tax-Exempt Fund | |
| | | Year Ended March 31, | |
| | | 2007 | | | 2006 | |
| | | Shares | | | Amounts | | | Shares | | | Amounts | |
Sold | | 912,996 | | | $ | 9,224,461 | | | 706,825 | | | $ | 7,162,254 | |
Issued as reinvestment of dividends | | 49,954 | | | | 506,450 | | | 35,734 | | | | 362,312 | |
Redeemed | | (619,542 | ) | | | (6,255,233 | ) | | (878,007 | ) | | | (8,918,351 | ) |
| | | | | | | | | | | | | | |
Net Increase (Decrease) | | 343,408 | | | $ | 3,475,678 | | | (135,448 | ) | | $ | (1,393,785 | ) |
| | | | | | | | | | | | | | |
84
| | | | | | | | | | | | | | |
| | | New York Intermediate-Term Tax-Exempt Fund | |
| | | Year Ended March 31, | |
| | | 2007 | | | 2006 | |
| | | Shares | | | Amounts | | | Shares | | | Amounts | |
Sold | | 4,902,368 | | | $ | 42,183,360 | | | 4,652,138 | | | $ | 40,444,981 | |
Issued as reinvestment of dividends | | 62,837 | | | | 540,239 | | | 78,342 | | | | 678,293 | |
Redeemed | | (3,898,713 | ) | | | (33,570,653 | ) | | (5,273,634 | ) | | | (45,770,096 | ) |
| | | | | | | | | | | | | | |
Net Increase (Decrease) | | 1,066,492 | | | $ | 9,152,946 | | | (543,154 | ) | | $ | (4,646,822 | ) |
| | | | | | | | | | | | | | |
| |
| | | Short-Term Government Securities Fund | |
| | | Year Ended March 31, | |
| | | 2007 | | | 2006 | |
| | | Shares | | | Amounts | | | Shares | | | Amounts | |
Sold | | 6,885,151 | | | $ | 47,777,743 | | | 14,063,143 | | | $ | 98,248,597 | |
Issued as reinvestment of dividends | | 430,742 | | | | 2,989,949 | | | 448,563 | | | | 3,127,286 | |
Redeemed | | (19,339,995 | ) | | | (134,034,945 | ) | | (22,948,344 | ) | | | (160,073,632 | ) |
| | | | | | | | | | | | | | |
Net Increase (Decrease) | | (12,024,102 | ) | | $ | (83,267,253 | ) | | (8,436,638 | ) | | $ | (58,697,749 | ) |
| | | | | | | | | | | | | | |
| |
| | | Short-Term Tax-Exempt Securities Fund | |
| | | Year Ended March 31, | |
| | | 2007 | | | 2006 | |
| | | Shares | | | Amounts | | | Shares | | | Amounts | |
Sold | | 2,756,608 | | | $ | 19,549,512 | | | 4,626,627 | | | $ | 32,965,430 | |
Issued as reinvestment of dividends | | 44,926 | | | | 318,627 | | | 27,420 | | | | 195,121 | |
Redeemed | | (6,961,351 | ) | | | (49,374,227 | ) | | (19,386,165 | ) | | | (138,092,641 | ) |
| | | | | | | | | | | | | | |
Net Increase (Decrease) | | (4,159,817 | ) | | $ | (29,506,088 | ) | | (14,732,118 | ) | | $ | (104,932,090 | ) |
| | | | | | | | | | | | | | |
In the normal course of business, the Funds enter into contracts that provide general indemnifications. The Funds’ maximum exposure under these arrangements is dependent on future claims that may be made against the Funds and, therefore, cannot be established; however, based on experience, the risk of loss from such claims is considered remote.
United States Trust Company of New York and U.S. Trust Company, N.A. (formerly, co-investment advisers to the Funds, together referred to herein as “U.S. Trust”), Excelsior Funds, Excelsior Tax-Exempt Funds and Trust (the “Companies”), U.S. Trust, Schwab and several individuals and third parties were named in four fund shareholder class actions and two derivative actions which alleged that U.S. Trust, the Companies, and others allowed certain parties to engage in illegal and improper mutual fund trading practices, which allegedly caused financial injury to the shareholders of certain of the Funds advised by U.S. Trust. Each seeks unspecified monetary damages and related equitable relief.
85
The class and derivative actions described above were transferred to the United States District Court for the District of Maryland for coordinated and consolidated pre-trial proceedings. In November 2005, the Maryland court dismissed many of the plaintiffs’ claims in both the class and derivative actions. The court entered implementing orders on February 24, 2006. All claims against the Companies have been dismissed. Plaintiffs’ claims against U.S. Trust and certain individuals under Sections 10(b) and 20(a) of the Securities Exchange Act and Sections 36(b) and 48(a) of the Investment Company Act, however, have not been dismissed. Plaintiffs’ Section 48(a) claims against parent entities U.S. Trust and Schwab also remain.
While the ultimate outcome of these matters cannot be predicted with any certainty at this time, based on currently available information, U.S. Trust believes that the likelihood is remote that the pending litigation will have a material adverse financial impact on the Companies, or materially affect U.S. Trust’s ability to provide investment management services to the Companies.
86
REPORT OF INDEPENDENT REGISTERED PUBLIC ACCOUNTING FIRM
To the Board of Directors/Trustees and Shareholders of
Excelsior Funds, Inc., Excelsior Funds Trust, and Excelsior Tax-Exempt Funds, Inc.
In our opinion, the accompanying statements of assets and liabilities, including the portfolios of investments, and the related statements of operations and of changes in net assets and the financial highlights present fairly, in all material respects, the financial position of the California Short Intermediate Term Tax-Exempt Income Fund, Core Bond Fund, High Yield Fund, Intermediate-Term Bond Fund, Intermediate Term Tax-Exempt Fund, Long-Term Tax-Exempt Fund, New York Intermediate Term-Tax Exempt Fund, Short-Term Government Securities Fund and Short-Term Tax-Exempt Securities Fund (three portfolios of Excelsior Funds, Inc., five portfolios of Excelsior Tax-Exempt Funds, Inc. and one portfolio of Excelsior Funds Trust, hereafter referred to as the “Funds”) at March 31, 2007, and the results of each of their operations, the changes in each of their net assets and the financial highlights for the year then ended, in conformity with accounting principles generally accepted in the United States of America. These financial statements and financial highlights (hereafter referred to as “financial statements”) are the responsibility of the Funds’ management; our responsibility is to express an opinion on these financial statements based on our audit. We conducted our audit of these financial statements in accordance with the standards of the Public Company Accounting Oversight Board (United States). Those standards require that we plan and perform the audit to obtain reasonable assurance about whether the financial statements are free of material misstatement. An audit includes examining, on a test basis, evidence supporting the amounts and disclosures in the financial statements, assessing the accounting principles used and significant estimates made by management, and evaluating the overall financial statement presentation. We believe that our audit, which included confirmation of securities at March 31, 2007 by correspondence with the custodian and brokers, provides a reasonable basis for our opinion. The statements of changes in net assets and financial highlights of the Funds for each of the years in the period ended March 31, 2006 were audited by other auditors whose report dated May 22, 2006, expressed an unqualified opinion on those statements.
PRICEWATERHOUSECOOPERS LLP
San Francisco, California
May 18, 2007
87
PROXY VOTING RESULTS (Unaudited)
On November 20, 2006, Schwab announced an agreement to sell U.S. Trust, a wholly-owned subsidiary of Schwab, to the Bank of America (the “Sale”). The Sale includes all of U.S. Trust’s subsidiaries, including USTA and USTNA.
Under Section 15 of the 1940 Act, the change in ownership of U.S. Trust may result in the assignment, and automatic termination, of the Funds’ current investment advisory agreements with USTA and USTNA (the “Current Advisory Agreements”). Consequently, the Funds will need to enter into new investment advisory agreements with USTA and USTNA upon the closing of the Sale (the “New Advisory Agreements”), which requires the approval of both the Board of Directors and the shareholders of the Funds. At a meeting held on January 8, 2007, the Board approved New Advisory Agreements under which, subject to approval by the Funds’ shareholders, USTA and USTNA will continue to serve as investment advisers to the Funds after the Sale is completed. At the same meeting, the Board directed that the New Advisory Agreements be submitted to the shareholders of each Fund for approval.
A Special Meeting of Shareholders of Excelsior Funds, Excelsior Tax-Exempt Funds and Trust and each of their Funds was held on March 30, 2007, for the purpose of seeking shareholder approval of the following proposal: to approve new investment advisory agreements by and among USTA, USTNA and the Companies, on behalf of the Funds. The Special Meeting for Excelsior Funds with respect to the Value and Restructuring Fund, Energy and Natural Resources and Treasury Money Funds was adjourned for the purpose of soliciting additional proxies, and subsequently held on April 30, 2007. The number of votes necessary to conduct the Special Meetings and approve the proposal was obtained. The results of the votes of shareholders are listed below:
EXCELSIOR FUNDS, INC.
| | | | | | |
Fund | | For | | Against | | Abstain |
Blended Equity Fund | | 6,164,047.545 | | 67,952.751 | | 73,977.210 |
Core Bond Fund | | 42,419,131.502 | | 102,811.034 | | 103,300.208 |
Emerging Markets Fund | | 40,519,375.591 | | 385,533.770 | | 2,387,530.558 |
Energy and Natural Resources Fund | | 10,149,963.059 | | 261,710.922 | | 349,760.892 |
Government Money Fund | | 172,737,336.070 | | 747,772.190 | | 420,358.000 |
Intermediate-Term Bond Fund | | 44,858,545.970 | | 241,685.152 | | 66,016.000 |
International Fund | | 21,282,762.400 | | 54,899.414 | | 128,924.192 |
Large Cap Growth Fund | | 42,848,198.375 | | 89,295.014 | | 404,672.705 |
Money Fund | | 674,980,999.600 | | 1,166,673.210 | | 410,474.540 |
Pacific/Asia Fund | | 12,624,395.052 | | 35,293.746 | | 146,970.828 |
Real Estate Fund | | 6,828,766.866 | | 23,944.228 | | 74,532.837 |
Short-Term Government Securities Fund | | 19,900,726.363 | | 26,705.441 | | 160,992.698 |
Small Cap Fund | | 20,778,531.495 | | 77,734.183 | | 230,771.291 |
Treasury Money Fund | | 147,661,994.420 | | 8,327.040 | | 953,491.100 |
Value and Restructuring Fund | | 71,659,202.229 | | 1,308,059.398 | | 2,313,244.343 |
88
PROXY VOTING RESULTS (Continued)
EXCELSIOR TAX-EXEMPT FUNDS, INC.
| | | | | | |
Fund | | For | | Against | | Abstain |
California Short-Intermediate Term Tax-Exempt Income Fund | | 5,620,954.755 | | 30,312.000 | | 19,754.000 |
Intermediate-Term Tax-Exempt Fund | | 25,090,015.155 | | 30,070.577 | | 76,826.198 |
Long-Term Tax-Exempt Fund | | 3,628,610.926 | | 33,702.423 | | 40,804.648 |
New York Intermediate-Term Tax-Exempt Fund | | 9,319,329.057 | | 13,806.000 | | 36,899.000 |
New York Tax-Exempt Money Fund | | 275,209,603.310 | | 4,686,548.000 | | 63,196.000 |
Short-Term Tax-Exempt Securities Fund | | 8,452,657.301 | | 72,849.000 | | 359,587.000 |
Tax-Exempt Money Fund | | 1,356,339,634.110 | | 11,586,764.280 | | 2,023,751.550 |
EXCELSIOR FUNDS TRUST
| | | | | | |
Fund | | For | | Against | | Abstain |
Equity Income Fund | | 15,004,710.199 | | 69,167.666 | | 28,045.000 |
Equity Opportunities Fund | | 15,890,842.151 | | 16,544.962 | | 771.000 |
High Yield Fund | | 15,794,959.655 | | 30,927.324 | | 249,577.222 |
International Equity Fund | | 5,138,808.000 | | .000 | | .000 |
Mid Cap Value and Restructuring Fund | | 7,879,533.211 | | 19,517.123 | | 87,756.460 |
89
ADDITIONAL FEDERAL TAX INFORMATION
Other Federal Tax Information (Unaudited):
The funds designate the following percentage of the distributions paid from net investment income as exempt-interest dividends for the fiscal year ended March 31, 2007.
| | | |
| | | Percentage | |
California Short-Intermediate Term Tax-Exempt Income Fund | | 100 | % |
Intermediate-Term Tax-Exempt Fund | | 100 | % |
Long-Term Tax-Exempt Fund | | 100 | % |
New York Intermediate-Term Tax-Exempt Fund | | 100 | % |
Short-Term Tax-Exempt Securities Fund | | 100 | % |
The following Funds paid out the amounts of Long Term Capital Gains for the year ended March 31, 2007:
| | | |
| | | Long Term Capital Gains |
California Short-Intermediate Term Tax-Exempt Income Fund | | $ | 255,865 |
Intermediate-Term Tax-Exempt Fund | | | 730,630 |
Long-Term Tax-Exempt Fund | | | 392,494 |
90
APPROVAL OF INVESTMENT ADVISORY AGREEMENTS (Unaudited)
In November 2006, representatives of Schwab, U.S. Trust, and the Funds’ investment advisers, USTA and USTNA (together, USTA and USTNA are referred to as the “Advisers) informed the Board that Schwab had entered into a stock purchase agreement with the Bank of America under which Schwab would sell U.S. Trust to Bank of America (the “Sale”). Representatives of Schwab, U.S. Trust, and the Advisers also informed the Board that, because the Sale includes all of U.S. Trust’s subsidiaries, such as USTA and USTNA, the completion of the Sale may be deemed to be an “assignment” (as defined in the 1940 Act) of the Funds’ current investment advisory agreements (the “Current Advisory Agreements”) resulting in the termination of the Current Advisory Agreements in accordance with their terms. To provide continuity in investment advisory services, representatives of U.S. Trust, the Advisers, and Bank of America proposed that the Board approve new investment advisory agreements (the “New Advisory Agreements”) under which, subject to shareholder approval, USTA and USTNA would continue to serve as investment advisers to the Funds after the completion of the Sale.
In advance of its December 6-7, 2006 meeting, the Board of Directors/Trustees requested and received from Bank of America, U.S. Trust, and the Advisers, various materials providing information regarding the Sale and its impact on (i) the Funds and their shareholders, (ii) the investment advisory services provided to the Funds by the USTA and USTNA and (iii) the administration services provided to the Funds by USTA. After receiving and reviewing these materials, the Board discussed at their December 6-7, 2006 meeting, the proposal to approve the New Advisory Agreements. Representatives from Bank of America, U.S. Trust, the Advisers, and Schwab attended the meeting and presented additional oral and written information to the Board to assist the Board in its considerations. These representatives assured the Board that Bank of America did not anticipate that there will be any reduction in the scope of or material adverse change in the nature or quality of, the investment advisory services to the Funds under the New Advisory Agreements. These representatives noted that a plan would be put into place designed to provide for the continuity of the investment advisory services under the New Advisory Agreements.
Additionally, representatives from Bank of America discussed the extensive experience and resources dedicated to Bank of America’s large mutual fund business, assuring the Board that Bank of America would seek to provide the Funds with the same or better quality of services with respect to the administration services currently provided by USTA. Representatives from Bank of America noted that: (i) the size and scale of Bank of America’s mutual fund business could produce potential savings for the Funds’ shareholders through reduced administrative costs and (ii) there was the potential for significant negotiating power in any future vendor discussions resulting from the Funds being part of the larger Bank of America fund complex.
The Board then discussed the written materials that the Board received before the meeting and the oral presentations and all other information that the Board received or discussed at the December 6-7, 2006 meeting. At the conclusion of the meeting, the Board decided to schedule another in-person Board meeting on January 8, 2007 to allow the Board to further consider the proposal to approve the New Advisory Agreements.
91
APPROVAL OF INVESTMENT ADVISORY AGREEMENTS (Continued)
In anticipation of the January 8, 2007 Board meeting, legal counsel for the Directors/Trustees who are not interested persons (as defined in the 1940 Act) (“Independent Directors”) sent an information request letter to U.S. Trust and Schwab to solicit further information that the Board deemed to be relevant to their consideration of the New Advisory Agreements, including a discussion of, among other matters, (a) a detailed timeline and plan for the orderly transition of the administration and oversight of the Funds; (b) the extent to which key personnel of the Advisers who manage day-to-day investment operations of the Funds are expected to continue to be employed by the Advisers after the Sale; (c) the experience and qualifications of new key administrative personnel that Bank of America proposes to involve in Fund matters; (d) any enhanced compliance policies and procedures adopted by Bank of America in response to mutual fund regulatory and compliance issues; (e) any anticipated financial benefits of the Sale to Fund shareholders; (f) any anticipated changes in the Funds’ fees and operating expenses; (g) any anticipated structural changes to the Excelsior Funds complex; (h) any conflicts of interest between the other business interests of Bank of America and its affiliates and the operations of the Funds; and (i) any limitations on the Funds’ investment operations that would arise as a result of the Funds’ being affiliated with Bank of America. The responses by Bank of America, U.S. Trust, the Advisers and Schwab were provided to the Board for their review prior to the January 8, 2007 Board meeting, and the Board was provided with the opportunity to request any additional materials.
At the Board’s meeting on January 8, 2007, Bank of America, U.S. Trust, the Advisers, and Schwab provided additional written and oral information on the Sale and the impact of the Sale on the Advisers and the Funds and their shareholders. During the meeting, representatives from Bank of America and the Advisers, who were present at the meeting, assured the Board that Bank of America does not anticipate that there will be any reduction in the scope of, or material adverse change in the nature or quality of, the investment advisory services to the Funds under the New Advisory Agreements. Additionally, representatives from Bank of America, and the Advisers represented to the Board that Bank of America personnel would seek to provide the same or better quality of services with respect to the administration services currently provided by USTA. It was noted that a plan for the orderly transition of the administration and oversight of the Funds had been developed to ensure that there would be no disruption of Fund operations or other adverse consequences to the Funds and their shareholders. In addition, Bank of America provided, and the Board discussed, information regarding the potential applicability of certain regulatory orders relating to the Columbia Funds and the legacy Nations Funds.
The Board then deliberated on the approval of the New Advisory Agreements in light of all the information it had received. The Independent Directors, assisted by their independent legal counsel, met in executive session to discuss the New Advisory Agreements. After deliberating in executive session, the entire Board reconvened to discuss the approval of the New Advisory Agreements.
At the conclusion of the January 8, 2007 Board meeting, the Board, including all of the Independent Directors, unanimously concluded (a) that the approval of the New Advisory Agreements would be in the best interests of the shareholders and the Funds and (b) to recommend the approval of the New Advisory Agreements to shareholders. In concluding to approve the New Advisory Agreements and to recommend their approval to shareholders, the Board considered, with the assistance of
92
APPROVAL OF INVESTMENT ADVISORY AGREEMENTS (Continued)
independent legal counsel, the information and materials provided to the Board and a variety of specific factors discussed at the meetings, including, as discussed below, the Board’s prior conclusions when determining whether to approve the continuation of the Current Advisory Agreements.
At the January 8, 2007 Board meeting, the Board concluded it was reasonable to take into account the conclusions the Board made when considering and evaluating the renewal of the Current Advisory Agreements (the “Annual Review”), which occurred at the September 29, 2006 in-person Board meeting, as part of its considerations to approve the New Advisory Agreements. The Board’s conclusion in this regard was based on (i) the fact that the New Advisory Agreements are identical to the Current Advisory Agreements in all material respects, including the investment advisory fees payable by the Funds to the Advisers and (ii) assurances by Bank of America and the Advisers that there would be no reduction or material adverse change in the nature or quality of the investment advisory services to the Funds under the New Advisory Agreements.
In addition to the conclusions formed with respect to the Annual Review, the Board considered specific information at the January 8, 2007 Board meeting concerning the Sale and its impact on the Advisers and the Funds and their shareholders, as they considered appropriate, including but not limited to the following:
| | • | | a detailed timeline and plan for the orderly transition of the administration and oversight of the Funds; |
| | • | | assurances by Bank of America and the Advisers that Bank of America does not anticipate that there will be any reduction in the scope of, or material adverse change in the nature or quality of, the investment advisory services to the Funds under the New Advisory Agreements; |
| | • | | an explanation of the extent to which key personnel of the Advisers who manage the day-to-day investment operations of the Funds are expected to continue to be employed by the Advisers after the Sale; |
| | • | | the experience and qualifications of new key administrative, financial, compliance and legal personnel that Bank of America proposes to involve in Fund matters; |
| | • | | the enhanced compliance policies and procedures adopted by Bank of America in response to mutual fund regulatory and compliance issues; |
| | • | | the anticipated financial benefits of the Sale to Fund shareholders including (i) access for the Funds to a large distribution network both on the retail, institutional and retirement platforms, as well as to Bank of America’s Private Bank and Wealth Management areas; (ii) the potential for a positive impact on Fund operating expenses resulting from an increase in assets; and (iii) the potential for significant negotiating power in any future vendor discussions resulting from the Funds being part of the larger Bank of America fund complex; |
| | • | | a representation from the Advisers and Bank of America that neither the Companies nor their shareholders would bear any costs of the Meeting or the costs of any solicitation in connection with the Meeting; |
93
APPROVAL OF INVESTMENT ADVISORY AGREEMENTS (Continued)
| | • | | a representation from Bank of America that Bank of America would extend the Advisers’ commitments under the Expense Limitation Agreements currently in place with the Funds for a period of two years following the closing of the Sale, subject to the Board’s prior approval of any changes to those Expense Limitation Agreements; |
| | • | | a discussion of the anticipated structural changes to the Excelsior Funds complex and a representation from Bank of America that the class structure of the Excelsior Funds was currently being evaluated by its product teams and that the results of that analysis would be presented to the Board for consideration at a future meeting; |
| | • | | the policies and procedures adopted by Bank of America that are intended to identify, monitor and mitigate any conflicts of interest between the other business interests of Bank of America and its affiliates and the operations of the Funds; and |
| | • | | a representation from U.S. Trust and Schwab that no material adverse impact on the Funds’ investment operations is expected as a result of the Funds being affiliated with Bank of America. |
The Board concluded, within the context of its full deliberations, that each of the representations, assurances and informational items provided by the Advisers, U.S. Trust, Bank of America and Schwab set forth above supported the approval of the New Advisory Agreements.
In the course of their deliberations, the Board did not identify any particular information or factor that was all-important or controlling. Based on its evaluation of the information and the conclusions with respect thereto at its meetings on September 29, 2006, December 6-7, 2006 and January 8, 2007, the Board, including all of the Independent Directors, unanimously: (a) concluded that the terms of the New Advisory Agreements are fair and reasonable; (b) concluded that the Advisers’ fees are reasonable in light of the services to be provided by the Advisers to the Companies; (c) concluded that the approval of the New Advisory Agreements would be in the best interests of the shareholders and the Funds; and (d) concluded to recommend the approval of the New Advisory Agreements to shareholders.
94
Directors/Trustees and Officers (Unaudited)
The tables below provide information pertaining to the Directors/Trustees and Officers of the Companies. The mailing address for each Director/Trustee is Excelsior Funds, 101 Montgomery Street, San Francisco, CA 94104.
| | | | | | | | | | |
Name and
Year of Birth | | Position(s) Held
with the
Company(1) | | Term of
Office(2) and
Length of Time
Served | | Principal Occupation(s)
During Past Five Years | | Number of
Funds in the
Fund Complex
Overseen by
Board Member | | Other
Directorships
Held by Board Member(6) |
| INDEPENDENT DIRECTORS/TRUSTEES | | | | | | |
Rodman L. Drake
Year of Birth: 1943 | | Director/Trustee; Chairman, Full Board | | Trustee of Excelsior Funds Trust since 1994; Director of Excelsior Funds, Inc. and Excelsior Tax Exempt Funds Inc. since 1996 | | Co-Founder of Baringo Capital LLC (since 2002); President, Continuation Investments Group, Inc. (1997 to 2001). | | 38(3) | | BOARD 1 — Director and Chairman, Hyperion Total Return Fund, Inc. and Hyperion Strategic Mortgage Fund Inc. (since 1991). BOARD 2 — Director, Jackson Hewitt Tax Service Inc. (since June 2004). BOARD 3 — Director, Student Loan Corporation (since May 2005). BOARD 4 — Celgene Corporation (since April 2006). |
| | | | | |
Morrill Melton Hall, Jr.
Year of Birth: 1944 | | Director/Trustee; Chairman, Investment Oversight Committee | | Director/Trustee of each Company since 2000 | | Chairman (since 1984) and Chief Executive Officer (since 1991), Comprehensive Health Services, Inc. (health care management and administration). | | 38(3) | | None |
| | | | | |
Jonathan Piel
Year of Birth: 1938 | | Director/Trustee | | Trustee of Excelsior Funds Trust since 1994; Director of Excelsior Funds, Inc. and Excelsior Tax Exempt Funds Inc. since 1996 | | Cable television producer and website designer; Editor, Scientific American (1984-1986), and Vice President, Scientific American Inc., (1986-1994); Director, National Institute of Social Sciences; Member Advisory Board, The Stone Age Institute, Bloomington, Indiana. | | 38(3) | | None |
| | | | | |
John D. Collins
Year of Birth: 1938 | | Director/Trustee; Chairman, Audit and Compliance Committee | | Director/Trustee of each Company since 2005 | | Retired. Consultant, KPMG, LLP (July 1999 to June 2000); Partner, KPMG, LLP (March 1962 to June 1999). | | 38(3) | | BOARD 1 — Director, Mrs. Fields Famous Brands LLC (consumer products) (since December 2004). |
95
| | | | | | | | | | |
Name and
Year of Birth | | Position(s) Held
with the
Company(1) | | Term of
Office(2) and
Length of Time
Served | | Principal Occupation(s)
During Past Five Years | | Number of
Funds in the
Fund Complex
Overseen by
Board Member | | Other
Directorships
Held by Board Member(6) |
Mariann Byerwalter
Year of Birth: 1960 | | Director/Trustee; Chairman, Marketing, Distribution and Shareholder Services Committee | | Director/Trustee of each Company since 2006 | | Chairman of JDN Corporate Advisory LLC (1996 to 2001); Vice President for Business Affairs and Chief Financial Officer of Stanford University (1996-2001); Special Adviser to the President of Stanford University (2001). | | 95(4) | | BOARD 1 — Director, Redwood Trust, Inc. (mortgage finance). BOARD 2 — Director, PMI Group, Inc. (mortgage insurance). |
| | | | | |
Nils H. Hakansson
Year of Birth: 1937 | | Director/Trustee | | Director/Trustee of each Company since 2006 | | Sylvan C. Coleman Professor of Finance and Accounting, Emeritus, Haas School of Business University of California, Berkeley (since 2003); Sylvan C. Coleman Professor of Finance and Accounting, Haas School of Business, University of California, Berkeley (July 1977 to January 2003). | | 38(3) | | None |
| | | | | |
William A. Hasler
Year of Birth: 1941 | | Director/Trustee; Chairman, Governance Committee | | Director/Trustee of each Company since 2006 | | Retired. Dean Emeritus of the Haas School of Business at the University of California, Berkeley; until February 2004, Co-Chief Executive Officer, Aphton Corporation (bio-pharmaceuticals). | | 95(4) | | BOARD 1 — Director, Aphton Corporation BOARD 2 — Director, Mission West Properties (commercial real estate). BOARD 3 — Director, TOUSA (home building). BOARD 4 — Director, Harris-Stratex Networks (a network equipment corporation). BOARD 5 — Director, Genitope Corp. (bio-pharmaceuticals). BOARD 6 — Director, Solectron Corporation where he is also Non-Executive Chairman (manufacturing). BOARD 7 — Director, Ditech Communications Corporation (voice communications technology). |
96
| | | | | | | | | | |
Name and
Year of Birth | | Position(s) Held
with the
Company(1) | | Term of
Office(2) and
Length of Time
Served | | Principal Occupation(s)
During Past Five Years | | Number of
Funds in the
Fund Complex
Overseen by
Board Member | | Other
Directorships
Held by Board Member(6) |
| INTERESTED DIRECTORS/TRUSTEES | | | | | | |
| | | | | |
Randall W. Merk(5)
Year of Birth: 1954 | | Director/Trustee | | Director/Trustee of each Company since 2006 | | Executive Vice President, Charles Schwab & Co., Inc. (2002-present); President, Schwab Financial Product, Charles Schwab & Co., Inc. (2002-present); Director, Charles Schwab Asset Management (Ireland) Limited; Charles Schwab Worldwide Funds PLC; Director, Charles Schwab Bank N.A. (since 2006). Prior to September 2002, President and Chief Investment Officer, American Century Investment Management, and Director, American Century Companies, Inc.; Until June 2001, Chief Investment Officer — Fixed Income, American Century Companies, Inc. | | 95(4) | | None |
97
| | | | | | |
Name, Address and Year of Birth | | Position(s) Held
with the
Company(1) | | Term of
Office(2) and
Length of
Time Served | | Principal Occupation(s)
During Past Five Years |
| OFFICERS | | | | | | |
Evelyn Dilsaver
101 Montgomery St.
San Francisco, CA 94104
Year of Birth: 1955 | | President | | Since
February
2006 | | President and Chief Executive Officer, Laudus Variable Insurance Trust, Laudus Trust, The Charles Schwab Family of Funds, Schwab Investments, Schwab Annuity Portfolios and Schwab Capital Trust; President, Chief Executive Officer, and Director, Charles Schwab Investment Management, Inc. President, UST Advisers, Inc.’s Mutual Fund Division since March 2006.From June 2003 to July 2004, Senior Vice President, Asset Management Products and Services Enterprise, Charles Schwab & Co., Inc. Prior to June 2003, Executive Vice President, Chief Financial Officer, and Chief Administrative Officer, U.S. Trust, a subsidiary of The Charles Schwab Corporation. |
| | | |
Leo Grohowski
114 West 47th Street
New York, NY 10036
Year of Birth: 1958 | | Vice President | | Since
February
2006 | | Executive Vice President and Chief Investment Officer, U.S. Trust (October 2005 to present); Chief Investment Officer, Deutsche Asset Management Americas and Scudder Investments (2002-2005); and Chief Investment Officer, Deutsche Bank Private Banking (1999-2002). |
| | | |
Mary Martinez
114 West 47th Street
New York, NY 10036
Year of Birth: 1960 | | Vice President | | Since
February
2006 | | Managing Director of United States Trust Company, National Association (since 2003) and Chief Operating Officer of Asset Management (since December 2005) and Chief Executive Officer of National Private Banking (October 2004 to December 2005); Managing Director and Director of Relationship Management Service, Marketing, Information and Technology at Bessemer Trust (1998 to 2003). |
| | | |
Catherine MacGregor
101 Montgomery St.
San Francisco, CA 94104
Year of Birth: 1964 | | Vice President | | Since
September
2006 | | Vice President, Charles Schwab & Co., Inc. and Charles Schwab Investment Management, Inc. (since July 2005); Chief Counsel, Laudus Variable Insurance Trust and Laudus Trust (since September 2006); Chief Legal Officer, Vice President, Laudus Variable Insurance Trust and Laudus Trust (since March 2007); Vice President, The Charles Schwab Family of Funds, Schwab Investments, Schwab Capital Trust and Schwab Annuity Portfolios; Senior Associate, Paul Hastings Janofsky & Walker LLP (1999 to July 2005). |
| | | |
Joseph Trainor, CFA
114 West 47th Street
New York, NY 10036
Year of Birth: 1961 | | Vice President | | Since
February
2004 | | Managing Director of United States Trust Company, National Association (since 2003) and President, U.S. Trust Institutional; President of MFS Institutional Advisors (1998 to 2002). |
| | | |
George Pereira
101 Montgomery St.
San Francisco, CA 94104
Year of Birth: 1964 | | Treasurer/Chief Financial and Chief Accounting Officer | | Since
December
2005 | | Chief Financial Officer, Laudus Variable Insurance Trust, Laudus Trust, The Charles Schwab Family of Funds, Schwab Investments, Schwab Annuity Portfolios and Schwab Capital Trust; Senior Vice President and Chief Financial Officer, Charles Schwab Investment Management, Inc.; Director, Charles Schwab Asset Management (Ireland) Limited; Sr. Vice President, Financial Reporting, Charles Schwab & Co., Inc. (December 1999 to November 2004); Chief Financial Officer, UST Advisers, Inc.’s Mutual Fund Division (since March 2006). |
| | | |
Randall Fillmore
101 Montgomery St.
San Francisco, CA 94104
Year of Birth: 1960 | | Chief Compliance Officer | | Since
June
2006 | | Senior Vice President, Institutional Compliance and Chief Compliance Officer, Charles Schwab Investment Management, Inc. Chief Compliance Officer, The Charles Schwab Family of Funds, Schwab Investments, Schwab Capital Trust and Schwab Annuity Portfolios, Laudus Trust and Laudus Variable Insurance Trust; Vice President, Charles Schwab & Co., Inc., and Charles Schwab Investment Management, Inc. (2002-2003); Vice President, Internal Audit, Charles Schwab and Co., Inc. (2000-2002). |
98
| | | | | | |
Name, Address and Year of Birth | | Position(s) Held
with the
Company(1) | | Term of
Office(2) and
Length of
Time Served | | Principal Occupation(s)
During Past Five Years |
Wyndham Clark
225 High Ridge Road
Stamford, CT 06905
Year of Birth: 1958 | | Anti-Money Laundering Officer | | Since
May
2004 | | Vice President and AML Officer, UST Advisers, Inc. (since 2003); Vice President and Deputy Director Risk Management, IBJ Whitehall (banking) (2001 to 2002); Vice President and Chief Risk Officer, EMAC, LLC (commercial lender, asset backed security issuer) (1999 to 2001). |
| | | |
Koji E. Felton
101 Montgomery St.
San Francisco, CA 94104
Year of Birth: 1961 | | Secretary and Chief Legal Officer | | Since
June
2006 | | Secretary and Chief Legal Officer, The Charles Schwab Family of Funds, Schwab Investments, Schwab Capital Trust and Schwab Annuity Portfolios; Senior Vice President, Chief Counsel and Corporate Secretary, Charles Schwab Investment Management, Inc.; Senior Vice President and Deputy General Counsel, Charles Schwab & Co., Inc. Prior to June 1998, Branch Chief in Enforcement at U.S. Securities and Exchange Commission in San Francisco. |
| (1) | Each Director/Trustee serves in the same capacity as described above for each registered investment company included in the Excelsior Funds family (Excelsior Funds Inc., Excelsior Tax-Exempt Funds, Inc. and Excelsior Funds Trust) (together, the “Excelsior Funds Family”) and the Laudus Funds family (Laudus Trust and Laudus Variable Insurance Trust) (together, the “Laudus Funds Family”). Each officer serves in the same capacity as described above for each registered investment company included in the Excelsior Funds Family. |
| (2) | Each Director/Trustee shall hold office until the election and qualification of his or her successor, or until he or she dies, resigns or is removed. The Excelsior Funds retirement policy requires that Independent Directors/Trustees retire no later than December 31st of the year during which he or she reaches 72 years of age. The officers of each Company hold office for a one-year term and until their respective successors are chosen and qualified, or, in each case, until he or she sooner dies, resigns, is removed, or becomes disqualified in accordance with the Company’s by-laws. |
| (3) | This number includes all registered investment companies included in the Excelsior Funds Family and the Laudus Funds Family, each of which is part of the Schwab Mutual Fund Family (as defined below). As of March 31, 2007, the Excelsior Funds Family and the Laudus Funds Family, in the aggregate, consisted of 38 funds. As of March 31, 2007, the Excelsior Funds Family consisted of 27 funds. |
| (4) | This number includes all registered investment companies included in the Schwab Mutual Fund family (Excelsior Funds, Inc., Excelsior Tax-Exempt Funds Inc., Excelsior Funds Trust, Laudus Trust, Laudus Variable Insurance Trust, The Charles Schwab Family of Funds, Schwab Investments, Schwab Annuity Portfolios and Schwab Capital Trust) (together, the “Schwab Mutual Fund Family”). As of March 31, 2007, the Schwab Mutual Fund Family consisted of 95 funds. |
| (5) | Mr. Merk is considered an “interested person” of the Companies (as defined in the 1940 Act) because of his affiliation with the Companies’ Advisers. |
| (6) | This column includes only directorships of companies required to report to the SEC under the Securities Exchange Act of 1934 (i.e., public companies) or other investment companies registered under the 1940 Act that are not part of the Schwab Mutual Fund Family. |
99
DISCLOSURE OF FUND EXPENSES (Unaudited)
We believe it is important for you to understand the impact of fees regarding your investment. As a shareholder of the fund, you incur ongoing, or operating costs, which include costs for portfolio management, administrative services, and shareholder reports (like this one), among others. Operating expenses, which are deducted from a fund’s gross income, directly reduce the investment return of the fund. A fund’s expenses are expressed as a percentage of its average net assets. This figure is known as the expense ratio. The following examples are intended to help you understand the ongoing costs (in dollars) of investing in your fund and to compare these costs with those of other mutual funds. The examples are based on an investment of $1,000 made at the beginning of the period shown and held for the entire period.
The table on the following page illustrates your fund’s costs in two ways.
| | • | | Actual expenses. This section provides information about actual account values and actual expenses based on the Funds’ actual return for the period. This section is designed to help you to estimate the actual expenses after fee waivers that you paid over the period. The “Ending Account Value” shown is derived from the fund’s actual return, and the fourth column shows the dollar amount that would have been paid by an investor who started with $1,000 in the fund. You may use the information here, together with the amount you invested, to estimate the expenses that you paid over the period. |
To do so, simply divide your account value by $1,000 (for example, an $8,600 account value divided by $1,000 = 8.6), then multiply the result by the number given for your fund under the heading “Expenses Paid During Period”.
| | • | | Hypothetical expenses. This section provides information about hypothetical account values and hypothetical expenses that would have been incurred by an investor in the Fund based on an assumed rate of return of 5% per year before expenses. This section is designed to help you compare your fund’s costs with those of other mutual funds. It assumes that the fund had a return of 5% before expenses during the year, but that the expense ratio is unchanged. In this case, because the return used is not the fund’s actual return, the results cannot be used to estimate the actual ending account balance or expenses you paid for the period. You may use this information to compare the ongoing costs of investing in your Fund and other funds. To do so, compare this 5% hypothetical example with the 5% hypothetical examples that appear in shareholder reports of other funds. |
100
DISCLOSURE OF FUND EXPENSES (Continued)
Please note that the expenses shown in the table are meant to highlight and help you compare ongoing costs only, which are described in the Prospectus. Therefore, the hypothetical example is useful in comparing ongoing costs only, and will not help you determine the relative total costs of owning different funds.
| | | | | | | | | | | | |
| | | Beginning
Account
Value
10/01/2006 | | Ending
Account
Value
03/31/2007 | | Annualized
Expense
Ratios* | | | Expenses
Paid
During
Period** |
| | | | |
Actual Fund Return | | | | | | | | | | | | |
California Short-Intermediate Term Tax-Exempt Income Fund — Shares | | $ | 1,000.00 | | $ | 1,013.20 | | 0.50 | % | | $ | 2.51 |
Core Bond Fund — Shares | | | 1,000.00 | | | 1,025.20 | | 0.90 | | | | 4.54 |
High Yield Fund — Shares | | | 1,000.00 | | | 1,103.10 | | 1.03 | | | | 5.40 |
Intermediate-Term Bond Fund — Shares | | | 1,000.00 | | | 1,025.00 | | 0.74 | | | | 3.74 |
Intermediate-Term Tax-Exempt Fund — Shares | | | 1,000.00 | | | 1,013.30 | | 0.65 | | | | 3.26 |
Long-Term Tax-Exempt Fund — Shares | | | 1,000.00 | | | 1,017.00 | | 0.80 | | | | 4.02 |
New York Intermediate-Term Tax-Exempt Fund — Shares | | | 1,000.00 | | | 1,011.90 | | 0.80 | | | | 4.01 |
Short-Term Government Securities Fund — Shares | | | 1,000.00 | | | 1,024.20 | | 0.74 | | | | 3.73 |
Short-Term Tax-Exempt Securities Fund — Shares | | | 1,000.00 | | | 1,013.20 | | 0.59 | | | | 2.96 |
| | | | |
Hypothetical 5% Return | | | | | | | | | | | | |
California Short-Intermediate Term Tax-Exempt Income Fund — Shares | | | 1,000.00 | | | 1,022.44 | | 0.50 | | | | 2.52 |
Core Bond Fund — Shares | | | 1,000.00 | | | 1,020.44 | | 0.90 | | | | 4.53 |
High Yield Fund — Shares | | | 1,000.00 | | | 1,019.80 | | 1.03 | | | | 5.19 |
Intermediate-Term Bond Fund — Shares | | | 1,000.00 | | | 1,021.24 | | 0.74 | | | | 3.73 |
Intermediate-Term Tax-Exempt Fund — Shares | | | 1,000.00 | | | 1,021.69 | | 0.65 | | | | 3.28 |
Long-Term Tax-Exempt Fund — Shares | | | 1,000.00 | | | 1,020.94 | | 0.80 | | | | 4.03 |
New York Intermediate-Term Tax-Exempt Fund — Shares | | | 1,000.00 | | | 1,020.94 | | 0.80 | | | | 4.03 |
Short-Term Government Securities Fund — Shares | | | 1,000.00 | | | 1,021.24 | | 0.74 | | | | 3.73 |
Short-Term Tax-Exempt Securities Fund — Shares | | | 1,000.00 | | | 1,021.99 | | 0.59 | | | | 2.97 |
| * | Annualized expense ratios of certain funds are after fee waivers and expense reimbursements by the investment adviser. Absent such waivers and reimbursements, expenses paid during the period would have been greater. |
| ** | Expenses are equal to the Fund’s annualized expense ratio multiplied by the average account value over the period, multiplied by the number of days in the most recent fiscal half-year (182) then divided by 365. |
101
AR-FIXEDINC-0307

MONEY MARKET
FUNDS
ANNUAL REPORT
March 31, 2007
TABLE OF CONTENTS
For shareholder account information, current price and yield quotations, or to make an initial purchase or obtain a prospectus, call (800) 446-1012, from overseas, call (617) 483-7297.
| · | | Internet Address: http://www.excelsiorfunds.com |
This report must be preceded or accompanied by a current prospectus.
You should consider the Funds’ investment objectives, risks and expenses carefully before you invest. Information about these and other important subjects is in the Funds’ prospectus, which you should read carefully before investing.
Nothing in this report represents a recommendation of a security by the investment adviser. Manager views and portfolio holdings may have changed since the report date.
A description of the policies and procedures that Excelsior Funds use to determine how to vote proxies relating to portfolio securities, as well as information relating to how a Fund voted proxies relating to portfolio securities during the most recent 12-month period ended June 30, is available (i) without charge, upon request, by calling (800) 446-1012, or (ii) by accessing the Excelsior Funds’ internet address and (iii) on the Commission’s website at http://www.sec.gov.
Excelsior Funds file their June 30 and December 31 schedule of portfolio holdings with the Securities and Exchange Commission, on Form N-Q, within sixty days after the applicable reporting period. Excelsior Funds Form N-Q is available on the Commission’s website at http://www.sec.gov, and may be reviewed and copied at the Commission’s Public Reference Room in Washington, DC. Information on the operation of the Public Reference Room may be obtained by calling (800) SEC-0330.
A schedule of each Fund’s portfolio holdings, as of the end of the prior month, is also available on the Funds’ website at www.excelsiorfunds.com. This schedule is updated monthly, typically by the 15th calendar day, after the end of each month. The Funds may terminate or modify this policy at anytime.
Excelsior Funds, Inc. and Excelsior Tax-Exempt Funds, Inc. are distributed by BISYS Fund Services Limited Partnership.
You may write to Excelsior Funds, Inc. and Excelsior Tax-Exempt Funds, Inc. at the following address:
Excelsior Funds
P.O. Box 8529
Boston, MA 02266-8529
Notice About Duplicate Mailings
The Excelsior Funds have adopted a policy that allows the Funds to send only one copy of a Fund’s prospectus and annual and semi-annual reports to certain shareholders residing at the same “household.” This reduces Fund expenses, which benefits you and other shareholders. If you do not want your mailings to be “householded,” please call (800) 542-1061 or contact your financial intermediary.
SHARES OF THE FUNDS ARE NOT DEPOSITS OR OBLIGATIONS OF, OR GUARANTEED OR ENDORSED BY, ANY BANK, AND THE SHARES ARE NOT FEDERALLY INSURED BY THE FEDERAL DEPOSIT INSURANCE CORPORATION, BANK INSURANCE FUND, FEDERAL RESERVE BOARD, OR ANY OTHER GOVERNMENTAL AGENCY. FUND SHARES ARE NOT INSURED OR GUARANTEED BY THE U.S. GOVERNMENT. ALTHOUGH THE FUNDS SEEK TO PRESERVE THE VALUE OF YOUR INVESTMENT AT $1.00 PER SHARE, IT IS POSSIBLE TO LOSE MONEY BY INVESTING IN THE FUNDS.
LETTER TO SHAREHOLDERS
March 31, 2007
Dear Valued Excelsior Fund Shareholder:
I am pleased to bring you the annual report for the year ended March 31, 2007 for the Excelsior Funds. The funds in this report are part of the Excelsior Fund family which has over $20 billion in assets as of the end of the reporting period and includes a wide array of asset classes and investment strategies designed to meet the individual investor’s investment needs.
By now, you have received notification that on November 20, 2006, The Charles Schwab Corporation (“Schwab”) announced an agreement to sell the U.S. Trust Corporation (“U.S. Trust”), a wholly-owned subsidiary of Schwab, to the Bank of America Corporation (“Bank of America”) (the “Sale”). The Sale involves all of U.S. Trust’s subsidiaries, including the Excelsior Funds’ investment advisers, UST Advisers, Inc. (“USTA”) and United States Trust Company National Association, on behalf of its asset management division, U.S. Trust New York Asset Management (“USTNA”). Consequently, the Excelsior Funds will need to enter into new investment advisory agreements with USTA and USTNA.
At a meeting held on January 8, 2007, the Board approved new investment advisory agreements under which, subject to approval by the Excelsior Funds’ shareholders, USTA and USTNA will continue to serve as investment advisers to the Excelsior Funds after the Sale is completed. At the same meeting, the Board directed that the new investment advisory agreements be submitted to the shareholders of each Fund for approval.
A Special Meeting of Shareholders of Excelsior Funds, Inc., Excelsior Tax-Exempt Funds, Inc. and Excelsior Funds Trust and each of their funds was held on March 30, 2007. The number of votes necessary to conduct the Special Meeting and approve the new investment advisory agreements was obtained for each fund except the Value and Restructuring, Energy and Natural Resources and Treasury Money Funds. The Special Meeting for Value and Restructuring, Energy and Natural Resources and Treasury Money Funds was adjourned for the purpose of soliciting additional proxies, and we anticipate that the new investment advisory agreements will be approved by the shareholders of these funds at a subsequent Special Meeting.
The integration of U.S. Trust, Bank of America’s private bank and its ultra high net worth extension will create the nation’s largest private wealth management firm with assets under management of over $260 billion and total client assets of almost $420 billion.
We at the Excelsior Funds are excited about our future within Bank of America and remain committed to helping you with your long-term investment goals. Thank you for investing with us.
Sincerely,

Evelyn Dilsaver
President
1
Excelsior Funds, Inc.
Portfolio of Investments — March 31, 2007
Government Money Fund
| | | | | | |
Principal
Amount | | | | Value |
| U.S. GOVERNMENT & AGENCY OBLIGATIONS — 67.31% |
| $ | 4,660,000 | | Federal Home Loan Bank, 5.13%, 05/01/07 | | $ | 4,659,604 |
| | 5,000,000 | | Federal Home Loan Bank, 5.28%, 03/14/08(a) | | | 5,000,000 |
| | 50,000,000 | | Federal Home Loan Bank, Discount Note, 5.15%, 04/11/07 | | | 49,928,473 |
| | 35,000,000 | | Federal Home Loan Mortgage Corporation, Discount Note, 5.13%, 06/18/07 | | | 34,610,596 |
| | 9,801,000 | | Federal National Mortgage Association, 5.25%, 04/15/07 | | | 9,800,834 |
| | 10,000,000 | | Federal National Mortgage Association, 5.30%, 01/08/08 | | | 10,000,000 |
| | 5,000,000 | | Federal National Mortgage Association, 5.50%, 01/15/08 | | | 5,010,867 |
| | 8,500,000 | | Federal National Mortgage Association, Discount Note, 5.07%, 04/04/07 | | | 8,496,409 |
| | 16,000,000 | | Federal National Mortgage Association, Discount Note, 5.15%, 04/18/07 | | | 15,961,112 |
| | 20,000,000 | | Federal National Mortgage Association, Discount Note, 5.05%, 07/03/07 | | | 19,739,083 |
| | | | | | |
| | | TOTAL U.S. GOVERNMENT & AGENCY OBLIGATIONS
(Cost $163,206,978) | | | 163,206,978 |
| | | | | | |
| | | | | |
| Shares | | | | Value |
| REGISTERED INVESTMENT COMPANY — 1.59% |
| 3,854,364 | | Dreyfus Treasury Prime Cash Management Fund | | $ | 3,854,364 |
| | | | | |
| | TOTAL REGISTERED INVESTMENT COMPANY
(Cost $3,854,364) | | | 3,854,364 |
| | | | | |
| | | | | | |
Principal
Amount | | | | |
| REPURCHASE AGREEMENT — 31.34% |
| $ | 76,000,000 | | Morgan Stanley, 5.30% dated 03/30/07, due 04/02/07, to be repurchased at $76,033,567 (collateralized by U.S. Government Obligations, ranging in par value $7,935,000-$50,000,000, 5.25%-5.50%, 02/25/08-02/18/09; total market value $77,769,302) | | $ | 76,000,000 |
| | | | | | |
| | | TOTAL REPURCHASE AGREEMENT
(Cost $76,000,000) | | | 76,000,000 |
| | | | | | |
| | | | | | | |
TOTAL INVESTMENTS
(Cost $243,061,342)(b) | | 100.24 | % | | $ | 243,061,342 | |
LIABILITIES IN EXCESS OF
OTHER ASSETS | | (0.24 | ) | | | (584,193 | ) |
| | | | | | | |
NET ASSETS | | 100.00 | % | | $ | 242,477,149 | |
| | | | | | | |
| (a) | Variable Rate Security—The rate disclosed is as of March 31, 2007. |
| (b) | Represents cost for financial reporting and federal income tax purposes. |
Discount Note—The rate reported is the discount rate at the time of purchase.
The summary of the Fund’s investments as of March 31, 2007 is as follows: (Unaudited)
| | | | | | | |
Portfolio Diversification | | % of
Net
Assets | | | Value | |
U.S. Government & Agency Obligations | | 67.31 | % | | $ | 163,206,978 | |
Repurchase Agreement | | 31.34 | | | | 76,000,000 | |
Registered Investment Company | | 1.59 | | | | 3,854,364 | |
| | | | | | | |
Total Investments | | 100.24 | % | | $ | 243,061,342 | |
Liabilities in Excess of Other Assets | | (0.24 | ) | | | (584,193 | ) |
| | | | | | | |
Net Assets | | 100.00 | % | | $ | 242,477,149 | |
| | | | | | | |
See Notes to Financial Statements.
2
Excelsior Funds, Inc.
Portfolio of Investments — March 31, 2007
Money Fund
| | | | | | |
Principal
Amount | | | | Value |
| | | | | | |
| CERTIFICATES OF DEPOSIT — 17.90% | | |
| $ | 45,000,000 | | Barclay Bank plc,
5.30%, 04/04/07 | | $ | 45,000,000 |
| | 50,000,000 | | Citibank,
5.31%, 04/30/07 | | | 50,000,000 |
| | 50,000,000 | | First Tennessee Bank,
5.29%, 06/05/07 | | | 50,000,000 |
| | 30,000,000 | | HSBC Bank,
5.30%, 05/14/07 | | | 30,000,000 |
| | 50,000,000 | | Washington Mutual Corp.,
5.26%, 06/06/07 | | | 50,000,000 |
| | | | | | |
| | | TOTAL CERTIFICATES OF DEPOSIT
(Cost $225,000,000) | | | 225,000,000 |
| | | | | | |
| COMMERCIAL PAPER — 71.77% | | |
| | 25,000,000 | | Abbott Laboratories,
Discount Note,
5.19%, 04/02/07 | | | 24,996,396 |
| | 25,000,000 | | Abbott Laboratories,
Discount Note,
5.24%, 04/10/07 | | | 24,967,250 |
| | 50,000,000 | | American General Finance Co., Discount Note,
5.27%, 04/05/07 | | | 49,970,721 |
| | 9,200,000 | | CIT Group Funding, Inc., Discount Note,
5.24%, 04/25/07 | | | 9,167,861 |
| | 15,000,000 | | CIT Group Funding, Inc., Discount Note,
5.22%, 06/29/07 | | | 14,806,425 |
| | 5,000,000 | | CIT Group Funding, Inc., Discount Note,
5.20%, 08/09/07 | | | 4,906,111 |
| | 50,000,000 | | Corporate Asset Funding Co., Inc., Discount Note,
5.25%, 04/20/07(a) | | | 49,861,458 |
| | 15,000,000 | | Falcon Asset Securitization Corp., Discount Note,
5.24%, 04/09/07(a) | | | 14,982,533 |
| | 20,000,000 | | Falcon Asset Securitization Corp., Discount Note,
5.26%, 04/18/07(a) | | | 19,950,322 |
| | | | | | |
Principal
Amount | | | | Value |
| | | | | | |
| COMMERCIAL PAPER — (continued) | | |
| $ | 14,000,000 | | Falcon Asset Securitization Corp., Discount Note,
5.24%, 04/25/07(a) | | $ | 13,951,093 |
| | 20,000,000 | | General Electric Capital Corp., Discount Note,
5.17%, 06/05/07 | | | 19,813,306 |
| | 40,000,000 | | Goldman Sachs Group, Inc., Discount Note,
5.30%, 04/03/07 | | | 39,988,222 |
| | 28,000,000 | | Govco, Inc., Discount Note,
5.25%, 04/27/07(a) | | | 27,893,833 |
| | 15,000,000 | | Govco, Inc., Discount Note,
5.24%, 05/11/07(a) | | | 14,912,667 |
| | 10,000,000 | | Govco, Inc., Discount Note,
5.23%, 05/15/07(a) | | | 9,936,078 |
| | 35,000,000 | | HBOS plc, Discount Note,
5.20%, 05/11/07 | | | 34,797,583 |
| | 20,000,000 | | HSBC Finance Corp.,
Discount Note,
5.24%, 04/12/07 | | | 19,967,978 |
| | 20,000,000 | | International Lease Finance Corp., Discount Note,
5.23%, 04/10/07 | | | 19,973,850 |
| | 30,000,000 | | John Deere Capital Corp.,
Discount Note,
5.25%, 05/11/07 | | | 29,825,000 |
| | 15,000,000 | | John Deere Capital Corp.,
Discount Note,
5.20%, 05/21/07 | | | 14,891,667 |
| | 25,000,000 | | JP Morgan Chase & Co.,
Discount Note,
5.24%, 04/11/07 | | | 24,963,611 |
| | 40,000,000 | | Procter & Gamble Co.,
Discount Note,
5.22%, 05/22/07 | | | 39,704,200 |
| | 15,000,000 | | Procter & Gamble Co.,
Discount Note,
5.21%, 06/18/07 | | | 14,830,675 |
| | 50,000,000 | | Prudential Funding Corp.,
Discount Note,
5.24%, 05/03/07 | | | 49,767,111 |
| | 55,000,000 | | Rabobank Corp.,
Discount Note,
5.39%, 04/02/07 | | | 54,991,757 |
See Notes to Financial Statements.
3
Excelsior Funds, Inc.
Portfolio of Investments — March 31, 2007
Money Fund — (continued)
| | | | | | |
Principal
Amount | | | | Value |
| | | | | | |
| COMMERCIAL PAPER — (continued) | | |
| $ | 25,000,000 | | Ranger Funding Co., LLC,
Discount Note,
5.27%, 04/09/07(a) | | $ | 24,970,722 |
| | 25,000,000 | | Ranger Funding Co., LLC,
Discount Note,
5.25%, 05/17/07(a) | | | 24,832,292 |
| | 25,000,000 | | Societe Generale,
Discount Note,
5.31%, 04/05/07 | | | 24,985,250 |
| | 15,000,000 | | Three Pillar Funding LLC,
Discount Note,
5.26%, 04/09/07(a) | | | 14,982,467 |
| | 20,000,000 | | Three Pillar Funding LLC,
Discount Note,
5.27%, 04/25/07(a) | | | 19,929,687 |
| | 12,000,000 | | Three Pillar Funding LLC,
Discount Note,
5.28%, 04/27/07(a) | | | 11,954,240 |
| | 15,000,000 | | UBS Finance Corp.,
Discount Note,
5.23%, 05/01/07 | | | 14,934,563 |
| | 35,000,000 | | UBS Finance Corp.,
Discount Note,
5.23%, 05/14/07 | | | 34,781,148 |
| | 7,595,000 | | Windmill Funding Corp.,
Discount Note,
5.25%, 04/03/07(a) | | | 7,592,785 |
| | 27,000,000 | | Windmill Funding Corp.,
Discount Note,
5.25%, 04/11/07(a) | | | 26,960,625 |
| | 20,000,000 | | Windmill Funding Corp.,
Discount Note,
5.25%, 05/03/07(a) | | | 19,906,667 |
| | 15,000,000 | | Yorktown Capital LLC,
Discount Note,
5.25%, 04/12/07(a) | | | 14,975,938 |
| | 17,619,000 | | Yorktown Capital LLC,
Discount Note,
5.26%, 04/26/07(a) | | | 17,554,642 |
| | | | | | |
| | | TOTAL COMMERCIAL PAPER
(Cost $902,178,734) | | | 902,178,734 |
| | | | | | |
| | | | | | |
Principal
Amount | | | | Value |
| | | | | | |
| U.S. GOVERNMENT & AGENCY OBLIGATIONS — 2.78% |
| $ | 20,000,000 | | Federal Home Loan Bank,
5.28%, 03/14/08(b) | | $ | 20,000,000 |
| | 15,000,000 | | Federal National Mortgage Association,
5.30%, 01/08/08 | | | 15,000,000 |
| | | | | | |
| | | TOTAL U.S. GOVERNMENT & AGENCY OBLIGATIONS
(Cost $35,000,000) | | | 35,000,000 |
| | | | | | |
| Shares | | | | |
| REGISTERED INVESTMENT COMPANY — 0.29% |
| | 3,706,303 | | Dreyfus Government Cash Management Fund | | | 3,706,303 |
| | | | | | |
| | | TOTAL REGISTERED INVESTMENT COMPANY
(Cost $3,706,303) | | | 3,706,303 |
| | | | | | |
Principal
Amount | | | | |
| REPURCHASE AGREEMENT — 7.48% | | |
| $ | 94,000,000 | | Morgan Stanley, 5.30% dated 03/30/07, due 04/02/07, to be repurchased at $94,041,517 (collateralized by U.S. Government Obligations, ranging in par value $42,065,000-$53,385,000, 5.00%-5.40%, 02/25/08-06/15/12; total market value $95,882,844) | | $ | 94,000,000 |
| | | | | | |
| | | TOTAL REPURCHASE AGREEMENT
(Cost $94,000,000) | | | 94,000,000 |
| | | | | | |
| | | | | | | |
TOTAL INVESTMENTS
(Cost $1,259,885,037)(c) | | 100.22 | % | | $ | 1,259,885,037 | |
LIABILITIES IN EXCESS OF OTHER ASSETS | | (0.22 | ) | | | (2,808,450 | ) |
| | | | | | | |
NET ASSETS | | 100.00 | % | | $ | 1,257,076,587 | |
| | | | | | | |
| (a) | Security exempt from registration under Rule 144A of the Securities Act of 1933. This security may be resold in transactions exempt from registration, normally to qualified institutional buyers. At March 31, 2007 these securities amounted to $335,148,049 or 26.66% of net assets. |
| (b) | Variable Rate Security—The rate disclosed is as of March 31, 2007. |
| (c) | Represents cost for financial reporting and federal income tax purposes. |
See Notes to Financial Statements.
4
Excelsior Funds, Inc.
Portfolio of Investments — March 31, 2007
Money Fund — (continued)
Discount Note—The rate reported is the discount rate at the time of purchase.
LLC—Limited Liability Company
plc—Public Limited Company
The summary of the Fund’s investments as of March 31, 2007 is as follows: (Unaudited)
| | | | | | | |
Portfolio Diversification | | % of
Net
Assets | | | Value | |
Commercial Paper | | 71.77 | % | | $ | 902,178,734 | |
Certificates of Deposit | | 17.90 | | | | 225,000,000 | |
Repurchase Agreement | | 7.48 | | | | 94,000,000 | |
U.S. Government & Agency Obligations | | 2.78 | | | | 35,000,000 | |
Registered Investment Company | | 0.29 | | | | 3,706,303 | |
| | | | | | | |
Total Investments | | 100.22 | % | | $ | 1,259,885,037 | |
Liabilities in Excess of Other Assets | | (0.22 | ) | | | (2,808,450 | ) |
| | | | | | | |
Net Assets | | 100.00 | % | | $ | 1,257,076,587 | |
| | | | | | | |
See Notes to Financial Statements.
5
Excelsior Tax-Exempt Funds, Inc.
Portfolio of Investments — March 31, 2007
New York Tax-Exempt Money Fund
| | | | | | |
Principal
Amount | | | | Value |
| | | | | | |
| TAX-EXEMPT CASH EQUIVALENT SECURITIES — 74.06% |
| $ | 5,000,000 | | Albany, New York, City School District General Obligations Bond Anticipation Notes, 3.75%, 07/19/07 | | $ | 5,001,881 |
| | 5,000,000 | | Albany, New York, City School District General Obligations Tax Bond Anticipation Notes, 3.75%, 10/17/07 | | | 5,003,400 |
| | 4,070,000 | | East Hampton Township, New York, General Obligation Bond Anticipation Notes, Series C, 4.13%, 08/31/07 | | | 4,080,137 |
| | 2,000,000 | | Hauppauge County, New York, School District General Obligation Bonds, Tax Anticipation Notes, 4.25%, 06/28/07 | | | 2,003,042 |
| | 4,350,000 | | Hudson Yards, New York, Infrastructure Corp. Revenue Bonds, PUTTERS, Series 1667T (FGIC), 3.69%, 08/15/14(a)(b) | | | 4,350,000 |
| | 10,000,000 | | Long Island, New York, Power Authority, Electrical Systems Revenue Bonds, P-Floats, Series 360, (FGIC), 3.69%, 12/01/17 (a)(b) | | | 10,000,000 |
| | 19,900,000 | | New York City, New York, Housing Development Corporation, Multi Family Mortgage Revenue Bonds, Series A, (FNMA), 3.63%, 10/15/41(a) | | | 19,900,000 |
| | 1,595,000 | | New York City, New York, Municipal Water Finance Authority Revenue Bonds, PUTTERS, Series 622, (AMBAC), 3.69%, 06/15/12(a)(b) | | | 1,595,000 |
| | 1,000,000 | | New York City, New York, Municipal Water Finance Authority Revenue Bonds, PUTTERS, Series 624, (AMBAC), 3.69%, 06/15/12(a)(b) | | | 1,000,000 |
| | | | | | |
Principal
Amount | | | | Value |
| | | | | | |
TAX-EXEMPT CASH EQUIVALENT
SECURITIES — (continued) |
| $ | 9,995,000 | | New York City, New York, Municipal Water Finance Authority Revenue Bonds, Water & Sewer Systems, FLOATERS, Series 726X, (MBIA), 3.68%, 06/15/27(a)(b) | | $ | 9,995,000 |
| | 8,000,000 | | New York City, New York, Transitional Finance Authority Revenue Bond Anticipation Notes, 4.25%, 06/29/07 | | | 8,013,602 |
| | 10,870,000 | | New York City, New York, Transitional Finance Authority Revenue Bonds, EAGLE, Class A, 3.71%, 02/01/31(a)(b) | | | 10,870,000 |
| | 10,485,000 | | New York City, New York, Transitional Finance Authority Revenue Bonds, FLOATERS, Series 536, (MBIA), 3.68%, 05/01/15(a)(b) | | | 10,485,000 |
| | 3,275,000 | | New York City, New York, Transitional Finance Authority Revenue Bonds, FLOATERS, Series N-11, 3.67%, 02/01/14 (a)(b) | | | 3,275,000 |
| | 8,725,000 | | New York City, New York, Transitional Finance Authority Revenue Bonds, PUTTERS, Series 468, (MBIA), 3.69%, 02/01/11(a)(b) | | | 8,725,000 |
| | 5,455,000 | | New York City, New York, Transitional Finance Authority Revenue Bonds, PUTTERS, Series 471, (FGIC), 3.69%, 02/01/11(a)(b) | | | 5,455,000 |
| | 5,000,000 | | New York State, Dormitory Authority Commercial Paper, Columbia University, 3.60%, 07/09/07 | | | 5,000,000 |
| | 10,000,000 | | New York State, Dormitory Authority Commercial Paper, Cornell University, 3.62%, 08/09/07 | | | 10,000,000 |
See Notes to Financial Statements.
6
Excelsior Tax-Exempt Funds, Inc.
Portfolio of Investments — March 31, 2007
New York Tax-Exempt Money Fund — (continued)
| | | | | | |
Principal
Amount | | | | Value |
| | | | | | |
TAX-EXEMPT CASH EQUIVALENT
SECURITIES — (continued) |
| $ | 4,500,000 | | New York State, Dormitory Authority Revenue Bonds, Secondary Issues, FLOATERS, Series 1520, 3.68%, 12/15/23(a)(b) | | $ | 4,500,000 |
| | 9,930,000 | | New York State, Dormitory Authority Revenue Bonds, Secondary Issues, P-Floats, Series 1330, (FGIC), 3.69%, 02/01/28(a)(b) | | | 9,930,000 |
| | 11,650,000 | | New York State, Environmental Facilities Corporation, Clean Water Revenue Bonds, P-Floats, Series 1165, 3.69%, 07/15/33(a)(b) | | | 11,650,000 |
| | 7,735,000 | | New York State, Environmental Facilities Corporation, Clean Water Revenue Bonds, PUTTERS, Series 1372, 3.69%, 06/15/14(a)(b) | | | 7,735,000 |
| | 11,283,000 | | New York State, Metropolitan Transportation Authority Revenue Bonds, FLOATERS, Series 848-D, (FGIC), 3.68%, 11/15/21(a)(b) | | | 11,283,000 |
| | 10,000,000 | | New York State, Metropolitan Transportation Authority Revenue Bonds, NY Dedicated Tax Fund, FLOATERS, Series 1385, (MBIA), 3.68%, 11/15/35(a)(b) | | | 10,000,000 |
| | 2,000,000 | | New York State, Mortgage Agency Revenue Bonds, FLOATERS, Series 1199, 3.68%, 10/01/27(a)(b) | | | 2,000,000 |
| | 9,995,000 | | New York State, Munitops Certificates Trust, General Obligation Bonds, (AMBAC), 3.68%, 02/01/14(a)(b) | | | 9,995,000 |
| | 11,500,000 | | New York State, Munitops Certificates Trust, Revenue Bonds, (FSA), 3.68%, 12/15/12(a)(b) | | | 11,500,000 |
| | 15,000,000 | | New York State, Munitops Certificates Trust, Revenue Bonds, (FSA), 3.68%, 08/01/13(a)(b) | | | 15,000,000 |
| | | | | | |
Principal
Amount | | | | Value |
| | | | | | |
TAX-EXEMPT CASH EQUIVALENT
SECURITIES — (continued) |
| $ | 6,500,000 | | New York State, Power Authority Extendable Commercial Paper, General Obligation Bonds, 3.65%, 06/05/07 | | $ | 6,500,000 |
| | 12,000,000 | | New York State, Power Authority General Obligation Bonds, 3.65%, 03/01/20(a) | | | 12,000,000 |
| | 8,220,000 | | New York State, Sales Tax Asset Receivable Corporation Revenue Bonds, PUTTERS, Series 564, (MBIA), 3.69%, 10/15/12(a)(b) | | | 8,220,000 |
| | 23,225,000 | | New York State, Thruway Authority Revenue Bonds, EAGLE, Class A, (AMBAC), 3.71%, 01/01/30(a)(b) | | | 23,225,000 |
| | 2,995,000 | | New York State, Triborough Bridge & Tunnel Authority Revenue Bonds, Series B, 3.64%, 01/01/33(a) | | | 2,995,000 |
| | 7,960,000 | | New York State, Triborough Bridge & Tunnel Authority Revenue Bonds, Sub-Series B3, 3.64%, 01/01/32(a) | | | 7,960,000 |
| | 18,460,000 | | New York State, Urban Development Corporation Revenue Bonds, EAGLE, Class A, 3.71%, 03/15/35(a)(b) | | | 18,460,000 |
| | 6,100,000 | | Niagara Falls, New York, Bridge Commission Toll Authority Revenue Bonds, Series A, (FGIC), 3.60%, 10/01/19(a) | | | 6,100,000 |
| | 3,235,000 | | Oneida County, New York, Industrial Development Agency Revenue Bonds, Hamilton College, (MBIA), 3.60%, 09/15/32(a) | | | 3,235,000 |
| | 1,500,000 | | Rocky Point, New York, School District General Obligation Bonds, Tax Anticipation Notes, 4.00%, 06/29/07 | | | 1,501,472 |
See Notes to Financial Statements.
7
Excelsior Tax-Exempt Funds, Inc.
Portfolio of Investments — March 31, 2007
New York Tax-Exempt Money Fund — (continued)
| | | | | | |
Principal
Amount | | | | Value |
| | | | | | |
TAX-EXEMPT CASH EQUIVALENT
SECURITIES — (continued) |
| $ | 6,000,000 | | Sag Harbor, New York, School District General Obligation Bonds, Tax Anticipation Notes, 4.25%, 06/29/07 | | $ | 6,010,272 |
| | 15,000,000 | | Suffolk County, New York, General Obligation Bonds, Tax Anticipation Notes, 4.25%, 08/16/07 | | | 15,041,465 |
| | 5,000,000 | | Suffolk County, New York, General Obligation Bonds, Tax Anticipation Notes, Series 2, 4.00%, 09/18/07(c) | | | 5,010,625 |
| | 4,225,000 | | Vestal, New York, General Obligation Bond Anticipation Notes,
3.75%, 05/25/07 | | | 4,226,407 |
| | | | | | |
| | | TOTAL TAX-EXEMPT CASH EQUIVALENT SECURITIES (Cost $338,830,303) | | | 338,830,303 |
| | | | | | |
TAX-EXEMPT CASH EQUIVALENT SECURITIES —
BACKED BY LETTERS OF CREDIT — 23.17% |
| | 4,660,000 | | Monroe County, New York, Industrial Development Agency Revenue Bonds, Civic Facilities, Greater Rochester YMCA Project, (MANUFACTURERS & TRADERS), 3.70%, 04/01/31(a) | | | 4,660,000 |
| | 1,800,000 | | New York City, New York, General Obligation Bonds, Sub-Series E3, (BANK OF AMERICA N.A.), 3.64%, 08/01/34(a) | | | 1,800,000 |
| | 8,500,000 | | New York City, New York, General Obligation Bonds, Sub-Series H1, (BANK OF NEW YORK), 3.67%, 03/01/34(a) | | | 8,500,000 |
| | 8,800,000 | | New York City, New York, Industrial Development Agency Revenue Bonds, Civic Facilities, Jewish Community Center Project, (MANUFACTURERS & TRADERS), 3.70%, 03/01/30(a) | | | 8,800,000 |
| | | | | | |
Principal
Amount | | | | Value |
| | | | | | |
TAX-EXEMPT CASH EQUIVALENT SECURITIES —
BACKED BY LETTERS OF CREDIT — (continued) |
| $ | 10,000,000 | | New York City, New York, Industrial Development Agency Revenue Bonds, Special Facilities, New York Stock Exchange Project, Series B, (BANK OF AMERICA N.A.),
3.62%, 05/01/33(a) | | $ | 10,000,000 |
| | 8,800,000 | | New York State, Commercial Paper, Series 98A, (JP MORGAN CHASE BANK-33%/BAYERISHE LANDESBANK-33%/LANDESBANK HESSEN-33%),
3.60%, 07/10/07 | | | 8,800,000 |
| | 6,730,000 | | New York State, Dormitory Authority Revenue Bonds, Catholic Health Systems Obligations, Series C, (HSBC BANK USA N.A.),
3.63%, 07/01/22(a) | | | 6,730,000 |
| | 6,600,000 | | New York State, Energy Research & Development Authority Facilities Revenue Bonds, Sub-series A-1, (WACHOVIA BANK N.A.),
3.61%, 05/01/39(a) | | | 6,600,000 |
| | 6,000,000 | | New York State, Environmental Commercial Paper, Series 97A, (BAYERISCHE LANDESBANK-50%/LANDESBANK HESSEN-50%,
3.60%, 05/16/07 | | | 6,000,000 |
| | 5,000,000 | | New York State, Environmental Commercial Paper, Series 97A, (BAYERISCHE LANDESBANK-50%/LANDESBANK HESSEN-50%),
3.62%, 05/16/07 | | | 5,000,000 |
| | 3,600,000 | | New York State, Environmental Commercial Paper, Series 97A, (BAYERISCHE LANDESBANK-50%/LANDESBANK HESSEN-50%),
3.65%, 07/11/07 | | | 3,600,000 |
| | 15,000,000 | | New York State, Environmental Quality General Obligation Bonds, Series G, (WESTDEUTSCHE LANDESBANK),
3.58%, 11/30/18(a) | | | 15,000,000 |
See Notes to Financial Statements.
8
Excelsior Tax-Exempt Funds, Inc.
Portfolio of Investments — March 31, 2007
New York Tax-Exempt Money Fund — (continued)
| | | | | | |
Principal
Amount | | | | Value |
| | | | | | |
TAX-EXEMPT CASH EQUIVALENT SECURITIES —
BACKED BY LETTERS OF CREDIT — (continued) |
| $ | 20,500,000 | | New York State, Housing Finance Agency Revenue Bonds, Service Contracts, Series I, (LANDESBANK HESSEN-THURINGEN), 3.65%, 03/15/31(a) | | $ | 20,500,000 |
| | | | | | |
| | | TOTAL TAX-EXEMPT CASH EQUIVALENT SECURITIES — BACKED BY LETTERS OF CREDIT
(Cost $105,990,000) | | | 105,990,000 |
| | | | | | |
| Shares | | | | |
| REGISTERED INVESTMENT COMPANIES — 0.09% |
| | 395,675 | | BlackRock Institutional New York Money Market Fund | | | 395,675 |
| | 1 | | Dreyfus New York Tax Exempt Fund | | | 1 |
| | | | | | |
| | | TOTAL REGISTERED INVESTMENT COMPANIES (Cost $395,676) | | | 395,676 |
| | | | | | |
| | | | | | |
TOTAL INVESTMENTS
(Cost $445,215,979)(d) | | 97.32 | % | | $ | 445,215,979 |
OTHER ASSETS IN EXCESS OF LIABILITIES | | 2.68 | | | | 12,238,616 |
| | | | | | |
NET ASSETS | | 100.00 | % | | $ | 457,454,595 |
| | | | | | |
| (a) | Variable Rate Security—The rate disclosed is as of March 31, 2007. |
| (b) | Security exempt from registration under Rule 144A of the Securities Act of 1933. This security may be resold in transactions exempt from registration, normally to qualified institutional buyers. At March 31, 2007, these securities amounted to $209,248,000 or 45.74% net assets. |
| (c) | All or part of the security is segregated by the Fund’s custodian to cover future purchase commitments. |
| (d) | Represents cost for financial reporting and federal income tax purposes. |
AMBAC—American Municipal Bond Assurance Corp.
FGIC—Financial Guaranty Insurance Corp.
FNMA—Federal National Mortgage Association
FSA—Financial Security Assurance
MBIA—Municipal Bond Insurance Association
Notes (The following notes have not been audited by PricewaterhouseCoopers LLP):
These municipal securities meet the three highest ratings assigned by Moody’s Investors Services, Inc. or Standard and Poor’s Corporation or, where not rated, are determined by the Advisor, under the supervision of the Board of Directors, to be of comparable quality at the time of purchase to rated instruments that may be acquired by the Fund.
At March 31, 2007, approximately 23% of the net assets are invested in municipal securities that have letter of credit enhancement features or escrows in U.S. Government securities backing them, on which the Fund relies. Without such features, the securities may or may not meet the quality standards of securities purchased by the Fund.
At March 31, 97% of the net assets are invested in New York municipal securities. Economic changes affecting the state and certain of its public bodies and municipalities may affect the ability of the issuers to pay the required principal and interest payments of the municipal securities.
The summary of the Fund’s investments as of March 31, 2007 is as follows: (Unaudited)
| | | | | | |
Portfolio Diversification | | % of
Net
Assets | | | Value |
Revenue Bonds | | 59.35 | % | | $ | 271,523,074 |
General Obligation Bonds | | 28.06 | | | | 128,397,229 |
Commercial Paper | | 9.82 | | | | 44,900,000 |
Registered Investment Companies | | 0.09 | | | | 395,676 |
| | | | | | |
Total Investments | | 97.32 | % | | $ | 445,215,979 |
Other Assets in Excess of Liabilities | | 2.68 | | | | 12,238,616 |
| | | | | | |
Net Assets | | 100.00 | % | | $ | 457,454,595 |
| | | | | | |
See Notes to Financial Statements.
9
Excelsior Tax-Exempt Funds, Inc.
Portfolio of Investments — March 31, 2007
Tax-Exempt Money Fund
| | | | | | |
Principal
Amount | | | | Value |
| | | | | | |
| TAX-EXEMPT CASH EQUIVALENT SECURITIES — 91.79% |
| $ | 17,385,000 | | Adams County, Colorado, School District No. 050 General Obligation Bonds, FLOATERS, Series 3804, (MBIA), 3.72%, 12/01/26(a)(b) | | $ | 17,385,000 |
| | 14,000,000 | | Anne Arundel County, Maryland, Commercial Paper, Bond Anticipation Notes, Series B,
3.55%, 04/05/07 | | | 14,000,000 |
| | 12,880,000 | | Arizona State, Agricultural Improvement & Power Distribution, Electrical Systems Revenue Bonds, Salt River Project, ROCS, 3.71%, 01/01/31(a)(b) | | | 12,880,000 |
| | 11,673,000 | | Arizona State, Highway Transportation Board Revenue Bonds, FLOATERS, Series 1539, 3.69%, 07/01/23(a)(b) | | | 11,673,000 |
| | 21,000,000 | | Arizona State, Salt River Project Commercial Paper, Series C,
3.48%, 04/05/07 | | | 21,000,000 |
| | 44,000,000 | | Austin, Texas, Water & Wastewater System Revenue Bonds, (FSA), 3.70%, 05/15/24(a) | | | 44,000,000 |
| | 10,000,000 | | Austin,Texas, Independent School District Commercial Paper, Series 2005-A, 3.61%, 04/09/07 | | | 10,000,000 |
| | 25,900,000 | | Baltimore County, Maryland, Commercial Paper, 3.65%, 04/03/07 | | | 25,900,000 |
| | 15,640,000 | | Bastrop, Texas, Munitops Certificates Trust, Independent School District General Obligation Bonds, Series 2003-23, 3.70%, 02/15/11(a)(b) | | | 15,640,000 |
| | 26,560,000 | | Boulder, Larimer, & Weld County, Colorado, School District General Obligation Bonds, FLOATERS, Series 1540, (FSA), 3.69%, 12/15/26(a)(b) | | | 26,560,000 |
| | | | | | |
Principal
Amount | | | | Value |
| | | | | | |
TAX-EXEMPT CASH EQUIVALENT
SECURITIES — (continued) |
| $ | 11,920,000 | | Brownsville, Texas, Utility Systems Revenue Bonds, PUTTERS, Series 1132, (AMBAC), 3.70%, 09/01/13(a)(b) | | $ | 11,920,000 |
| | 14,065,000 | | Bryan, Texas, Munitops Certificates Trust, Independent School District General Obligation Bonds, Series 2005-16, 3.70%, 02/15/13(a)(b) | | | 14,065,000 |
| | 40,025,000 | | California State, General Obligation Bonds, TOCS, Series HH, (FSA), 3.68%, 07/03/13(a)(b) | | | 40,025,000 |
| | 4,800,000 | | Carbon County, Wyoming, Pollution Control Revenue Bonds, Amoco Project, 3.55%, 11/01/14(a) | | | 4,800,000 |
| | 15,835,000 | | Cedar Hill, Texas, Munitops Certificates Trust, Independent School District General Obligation Bonds, Series 2005-19, 3.70%, 07/01/13(a)(b) | | | 15,835,000 |
| | 28,005,000 | | Chicago, Illinois, General Obligation Bonds, PUTTERS, Series 1277, (FSA), 3.70%, 01/01/14(a)(b) | | | 28,005,000 |
| | 20,000,000 | | Colorado State, Regional Transportation District Commercial Paper, 3.62%,10/05/07 | | | 20,000,000 |
| | 10,000,000 | | Colorado State, Regional Transportation District, Sales Tax Revenue Bonds, EAGLE, Class A, (AMBAC), 3.72%, 11/01/36(a)(b) | | | 10,000,000 |
| | 14,800,000 | | Colorado State, Regional Transportation District, Sales Tax Revenue Bonds, EAGLE, Class A, (AMBAC), 3.72%, 11/01/36(a)(b) | | | 14,800,000 |
See Notes to Financial Statements.
10
Excelsior Tax-Exempt Funds, Inc.
Portfolio of Investments — March 31, 2007
Tax-Exempt Money Fund — (continued)
| | | | | | |
Principal
Amount | | | | Value |
| | | | | | |
TAX-EXEMPT CASH EQUIVALENT
SECURITIES — (continued) |
| $ | 25,000,000 | | Colorado State, Regional Transportation District, Sales Tax Revenue Bonds, EAGLE, Class A, (AMBAC), 3.72%, 11/01/36(a)(b) | | $ | 25,000,000 |
| | 25,995,000 | | Cypress Fairbanks, Texas, Munitops Certificates Trust, Independent School District General Obligation Bonds, Series 2003-22, 3.69%, 02/15/11(a)(b) | | | 25,995,000 |
| | 10,000,000 | | Dallas, Texas, Area Rapid Transit Sales Tax Commercial Paper, Series 2001, 3.65%, 09/10/07 | | | 10,000,000 |
| | 10,000,000 | | Dallas, Texas, Area Rapid Transit Sales Tax Commercial Paper, Series 2001, 3.63%, 11/05/07 | | | 10,000,000 |
| | 16,685,000 | | Dallas, Texas, Munitops Certificates Trust, General Obligation Bonds, Series 2004-6, (PSF-GTD), 3.70%, 02/15/12(a)(b) | | | 16,685,000 |
| | 29,630,000 | | Dallas, Texas, Munitops Certificates Trust, Independent School District General Obligation Bonds, Series 2005-1, 3.70%, 08/15/12(a)(b) | | | 29,630,000 |
| | 30,851,000 | | Dallas, Texas, Water & Sewer Commercial Paper, Series B, 3.60%, 04/16/07 | | | 30,851,000 |
| | 1,404,000 | | Dallas, Texas, Water & Sewer Commercial Paper, Series B, 3.70%, 04/16/07 | | | 1,404,000 |
| | 12,500,000 | | De Soto, Texas, Independent School District, P-Float, Series 19, 3.72%, 08/15/29(a)(b) | | | 12,500,000 |
| | 12,935,000 | | Denton, Texas, Munitops Certificates Trust, General Obligation Bonds, Series 2004-21, 3.70%, 08/15/12(a)(b) | | | 12,935,000 |
| | | | | | |
Principal
Amount | | | | Value |
| | | | | | |
TAX-EXEMPT CASH EQUIVALENT
SECURITIES — (continued) |
| $ | 14,635,000 | | Detroit, Michigan, Munitops Certificates Trust, City School District General Obligation Bonds, Series 2004-39, (FGIC), 3.70%, 05/01/11(a)(b) | | $ | 14,635,000 |
| | 8,695,000 | | Detroit, Michigan, Water Supply Systems Revenue Bonds, FLOATERS, Series 1445, (FSA), 3.69%, 07/01/29(a)(b) | | | 8,695,000 |
| | 23,000,000 | | District of Columbia, Tax & Revenue Anticipation Notes, 4.25%, 09/28/07 | | | 23,061,349 |
| | 17,130,000 | | Florida State, Board of Education Lottery Revenue Bonds, ROCS, Series 542, (AMBAC), 3.71%, 07/01/25(a)(b) | | | 17,130,000 |
| | 10,480,000 | | Florida State, Munitops Certificates Trust, Revenue Bonds, (FGIC), 3.70%, 01/01/11(a)(b) | | | 10,480,000 |
| | 9,265,000 | | Frisco, Texas, Munitops Certificates Trust, General Obligation Bonds, 3.70%, 08/15/11(a)(b) | | | 9,265,000 |
| | 17,185,000 | | Fulton County, Georgia, Water & Sewage Revenue Bonds, Floating Rate Certificates, Series 1120, (FGIC), 3.69%, 01/01/30(a)(b) | | | 17,185,000 |
| | 8,500,000 | | Garden State Preservation Trust, New Jersey, Open Space & Farmland Revenue Bonds, Floating Rate Certificates, Series 860, (FSA), 3.67%, 11/01/17(a)(b) | | | 8,500,000 |
| | 9,995,000 | | Harlandale, Texas, Munitops Certificates Trust, General Obligation Bonds, Series 2005-22, 3.70%, 08/15/13(a)(b) | | | 9,995,000 |
See Notes to Financial Statements.
11
Excelsior Tax-Exempt Funds, Inc.
Portfolio of Investments — March 31, 2007
Tax-Exempt Money Fund — (continued)
| | | | | | |
Principal
Amount | | | | Value |
| | | | | | |
TAX-EXEMPT CASH EQUIVALENT
SECURITIES — (continued) |
| $ | 14,260,000 | | Hawaii State, General Obligation Bonds, ROCS, Series 6062, (FSA), 3.71%, 03/01/26(a)(b) | | $ | 14,260,000 |
| | 25,000,000 | | Hockley County, Texas, Industrial Development Corporation, Pollution Control Revenue Bonds, Amoco Project - Standard Oil Co., 3.60%, 03/01/14(a) | | | 25,000,000 |
| | 19,300,000 | | Hockley County, Texas, Industrial Development Corporation, Pollution Control Revenue Bonds, Amoco Project - Standard Oil Co., 3.55%, 11/01/19(a) | | | 19,300,000 |
| | 9,995,000 | | Houston, Texas, Munitops Certificates Trust, Independent School District General Obligation Bonds, Series 2005-35, (PSF-GTD), 3.70%, 02/15/13(a)(b) | | | 9,995,000 |
| | 12,100,000 | | Houston, Texas, Utility System Revenue Bonds, TOCS, Series A, (FSA), 3.69%, 05/15/12(a)(b) | | | 12,100,000 |
| | 8,000,000 | | Illinois State, Finance Authority Revenue Bonds, FLOATERS, Series 1489, 3.69%, 12/01/42(a)(b) | | | 8,000,000 |
| | 15,000,000 | | Indiana State, Transportation Revenue Bonds, P-Floats, PT 3980, (FGIC), 3.72%, 06/01/29(a)(b) | | | 15,000,000 |
| �� | 60,200,000 | | Intermountain Power Agency, Utah, Commercial Paper, Series B-2, 3.68%, 08/09/07 | | | 60,199,999 |
| | 14,500,000 | | Intermountain Power Agency, Utah, Power Supply Revenue Bonds, Series E, (AMBAC), 3.64%, 07/01/14 | | | 14,500,000 |
| | | | | | |
Principal
Amount | | | | Value |
| | | | | | |
TAX-EXEMPT CASH EQUIVALENT
SECURITIES — (continued) |
| $ | 14,700,000 | | Iowa State, Finance Authority Small Business Development Revenue Bonds, Multi-Family Housing, Village Court Associates, DuPont, Series B, 3.72%, 11/01/15(a) | | $ | 14,700,000 |
| | 1,300,000 | | Jacksonville, Florida, Electrical Systems Commercial Paper, 3.60%, 04/10/07 | | | 1,300,000 |
| | 20,000,000 | | Jacksonville, Florida, Electrical Systems Commercial Paper, 3.65%, 07/11/07 | | | 20,000,000 |
| | 18,700,000 | | Jacksonville, Florida, Electrical Systems Commercial Paper, 3.64%, 08/15/07 | | | 18,700,000 |
| | 14,000,000 | | Jacksonville, Florida, Electrical Systems Commercial Paper, Series 2000-A, 3.53%, 04/10/07 | | | 14,000,000 |
| | 35,000,000 | | Jacksonville, Florida, Electrical Systems Commercial Paper, Series 2000-F, 3.58%, 04/10/07 | | | 35,000,000 |
| | 16,145,000 | | Jacksonville, Florida, St. Johns River, Power Systems Revenue Bonds, PUTTERS, Series 1182, (MBIA), 3.70%, 04/01/13(a)(b) | | | 16,145,000 |
| | 8,955,000 | | Judson, Texas, Munitops Certificates Trust, General Obligation Bonds, Series 2003-36, 3.70%, 02/01/11(a)(b) | | | 8,955,000 |
| | 50,100,000 | | Kansas City, Missouri, Industrial Development Authority Revenue Bonds, Downtown Arena Project, Series C, (AMBAC), 3.68%, 04/01/40(a) | | | 50,100,000 |
| | 13,500,000 | | Kansas City, Missouri, Industrial Development Authority Revenue Bonds, Downtown Redevelopment District, Series A, (AMBAC), 3.68%, 12/01/32(a) | | | 13,500,000 |
See Notes to Financial Statements.
12
Excelsior Tax-Exempt Funds, Inc.
Portfolio of Investments — March 31, 2007
Tax-Exempt Money Fund — (continued)
| | | | | | |
Principal
Amount | | | | Value |
| | | | | | |
TAX-EXEMPT CASH EQUIVALENT
SECURITIES — (continued) |
| $ | 9,585,000 | | King County, Washington, General Obligation Bonds, PUTTERS, Series 1184, (FGIC), 3.70%, 01/01/13(a)(b) | | $ | 9,585,000 |
| | 12,800,000 | | Las Vegas, Nevada, Water District General Obligation Bonds, Series C, 3.78%, 06/01/36(a) | | | 12,800,000 |
| | 3,675,000 | | Massachusetts State, General Obligation Bonds, Series B, 3.78%, 03/01/26(a) | | | 3,675,000 |
| | 17,715,000 | | Memphis, Tennessee, Electric Systems Revenue Bonds, PUTTERS, Series 378, (MBIA), 3.70%, 12/01/11(a)(b) | | | 17,715,000 |
| | 14,200,000 | | Michigan State, Building Authority Revenue Bonds, EAGLE, Class A, (FGIC), 3.72%, 10/15/36(a)(b) | | | 14,200,000 |
| | 7,510,000 | | Michigan State, Building Authority Revenue Bonds, FLOATERS, Series 886, (MBIA), 3.69%, 10/15/17(a)(b) | | | 7,510,000 |
| | 5,185,000 | | Michigan State, Municipal Bond Authority Revenue Bonds, PUTTERS, Series 453, 3.72%, 05/01/12(a)(b) | | | 5,185,000 |
| | 25,000,000 | | Milwaukee, Wisconsin, School Revenue Anticipation Notes, 4.50%, 08/30/07 | | | 25,077,073 |
| | 45,000,000 | | New York City, New York, Municipal Water Finance Authority Commercial Paper, Series 5B, 3.65%, 06/11/07 | | | 45,000,000 |
| | 13,000,000 | | North Carolina State, Capital Facilities Finance Agency Revenue Bonds, EAGLE, Class A, 3.72%, 10/01/44(a)(b) | | | 13,000,000 |
| | | | | | |
Principal
Amount | | | | Value |
| | | | | | |
TAX-EXEMPT CASH EQUIVALENT
SECURITIES — (continued) |
| $ | 12,130,000 | | North Carolina State, General Obligation Bonds, PUTTERS, Series 465,
3.69%, 05/01/11(a)(b) | | $ | 12,130,000 |
| | 10,245,000 | | North Carolina State, General Obligation Bonds, PUTTERS, Series 466,
3.69%, 03/01/12(a)(b) | | | 10,245,000 |
| | 7,330,000 | | North Texas, Municipal Water District, Water Systems Revenue Bonds, ROCS, Series 6074, (MBIA),
3.71%, 09/01/26(a)(b) | | | 7,330,000 |
| | 7,665,000 | | Ohio State, General Obligation Bonds, PUTTERS, Series 1295,
3.70%, 05/01/14(a)(b) | | | 7,665,000 |
| | 8,400,000 | | Oklahoma State, Water Resource Board Revenue Bonds, Loan Program,
3.65%, 09/01/24(a) | | | 8,400,000 |
| | 30,000,000 | | Omaha, Nebraska, Public Power Distribution Commercial Paper,
3.68%, 04/02/07 | | | 30,000,000 |
| | 9,300,000 | | Orlando, Florida, Communication Utility Systems Revenue Bonds, PUTTERS, Series 1557,
3.70%, 10/01/13(a)(b) | | | 9,300,000 |
| | 36,200,000 | | Pennsylvania State, Turnpike Commission Revenue Bonds, Series A-2,
3.70%, 12/01/30(a) | | | 36,200,000 |
| | 9,460,000 | | Pflugerville, Texas, Munitops Certificates Trust, Independent School District General Obligation Bonds, Series 2005-17,
3.70%, 02/15/13(a)(b) | | | 9,460,000 |
| | 3,905,000 | | Phoenix, Arizona, Civic Improvement Corp., Excise Tax Revenue Bonds, EAGLE, Class A,
3.72%, 07/01/17(a)(b) | | | 3,905,000 |
See Notes to Financial Statements.
13
Excelsior Tax-Exempt Funds, Inc.
Portfolio of Investments — March 31, 2007
Tax-Exempt Money Fund — (continued)
| | | | | | |
Principal
Amount | | | | Value |
| | | | | | |
TAX-EXEMPT CASH EQUIVALENT
SECURITIES — (continued) |
| $ | 18,050,000 | | Richland County, South Carolina, School District No. 002 General Obligation Bonds, FLOATERS, Series 1646, (FGIC), 3.72%, 02/01/10(a)(b) | | $ | 18,050,000 |
| | 8,115,000 | | San Antonio, Texas, Hotel Occupancy Revenue Bonds, PUTTERS, Series 1693, (FSA), 3.70%, 02/15/12(a)(b) | | | 8,115,000 |
| | 40,000,000 | | San Antonio, Texas, Water Revenue Bonds, EAGLE, Class A, (MBIA), 3.72%, 05/15/40(a)(b) | | | 40,000,000 |
| | 14,500,000 | | San Antonio, Texas, Water Revenue Bonds, EAGLE, Class A, (MBIA), 3.72%, 05/15/40(a)(b) | | | 14,500,000 |
| | 14,000,000 | | South Carolina State, Munitops Certificates Trust, General Obligation Bonds, (FSA), 3.70%, 03/01/11(a)(b) | | | 14,000,000 |
| | 13,175,000 | | South Carolina State, Public Service Authority Revenue Bonds, PUTTERS, Series 1198, (MBIA), 3.70%, 07/01/13(a)(b) | | | 13,175,000 |
| | 44,000,000 | | St. James Parish, Louisiana, Pollution Control Commercial Paper, Texaco Project,
3.72%, 07/12/07 | | | 44,000,000 |
| | 18,715,000 | | Tarrant, Texas, Regulation Water District Revenue Bonds, FLOATERS, Series 3425. (FGIC), 3.72%, 03/01/28(a)(b) | | | 18,715,000 |
| | 7,000,000 | | Tennessee State, School Building Authority Commercial Paper, Series A, 3.60%, 04/09/07 | | | 7,000,000 |
| | | | | | |
Principal
Amount | | | | Value |
| | | | | | |
TAX-EXEMPT CASH EQUIVALENT
SECURITIES — (continued) |
| $ | 9,240,000 | | Texas State, General Obligation Bonds, PUTTERS, Series 1645,
3.72%, 10/01/14(a)(b) | | $ | 9,240,000 |
| | 22,000,000 | | Texas State, General Obligation Bonds, Series B, 3.52%, 04/01/36 | | | 22,000,000 |
| | 39,200,000 | | Texas State, Tax & Revenue Anticipation Notes, 4.50%, 08/31/07 | | | 39,331,635 |
| | 10,990,000 | | Texas State, Transportation Commission Revenue Bonds, PUTTERS, Series 1324, 3.70%, 04/01/14(a)(b) | | | 10,990,000 |
| | 9,000,000 | | Texas State, Water Development Board Revenue Bonds, State Revolving Fund, 3.82%, 07/15/26(a) | | | 9,000,000 |
| | 8,720,000 | | Thurston County, Washington, School District General Obligation Bonds, PUTTERS, Series 1108, (MBIA), 3.72%, 06/01/13(a)(b) | | | 8,720,000 |
| | 8,840,000 | | Tyler, Texas, Junior College District Revenue Bonds, FLOATERS, Series 1560, (AMBAC), 3.69%, 08/15/36(a)(b) | | | 8,840,000 |
| | 21,500,000 | | University of Hawaii, Revenue Bonds, FLOATERS, Series 1546, (MBIA), 3.69%, 10/01/36(a)(b) | | | 21,500,000 |
| | 32,000,000 | | University of North Carolina, Board of Governors Commercial Paper, Series 2004-B, 3.65%, 07/17/07 | | | 32,000,000 |
| | 13,700,000 | | University of Texas, Commercial Paper, Series A, 3.58%, 04/05/07 | | | 13,700,000 |
| | 16,800,000 | | University of Texas, Permanent University Fund Revenue Bonds, FLOATER, Series 1574, 3.69%, 07/01/26(a)(b) | | | 16,800,000 |
See Notes to Financial Statements.
14
Excelsior Tax-Exempt Funds, Inc.
Portfolio of Investments — March 31, 2007
Tax-Exempt Money Fund — (continued)
| | | | | | |
Principal
Amount | | | | Value |
| | | | | | |
TAX-EXEMPT CASH EQUIVALENT
SECURITIES — (continued) |
| $ | 8,260,000 | | University of Texas, Permanent University Fund Revenue Bonds, PUTTERS, Series 1676, 3.70%, 07/01/14(a)(b) | | $ | 8,260,000 |
| | 18,810,000 | | University of Texas, University Revenue Bonds, EAGLE, Class A, 3.72%, 08/15/37(a)(b) | | | 18,810,000 |
| | 14,150,000 | | University of Texas, University Revenue Bonds, P-Floats, MT 354, 3.71%, 08/15/20(a)(b) | | | 14,150,000 |
| | 5,535,000 | | University of Texas, University Revenue Bonds, PUTTERS, Series 592, 3.70%, 08/15/12(a)(b) | | | 5,535,000 |
| | 3,015,000 | | University of Vermont, Commercial Paper, 3.63%, 07/10/07 | | | 3,015,000 |
| | 3,300,000 | | University of Virginia, University Revenue Bonds, EAGLE, Series A, 3.72%, 06/01/33(a)(b) | | | 3,300,000 |
| | 14,288,500 | | Virginia Commonwealth, Transportation Board, Revenue Bonds, Floating Rate Certificates, Series 727, 3.69%, 05/15/19(a)(b) | | | 14,288,500 |
| | 25,000,000 | | Wake County, North Carolina, General Obligation Commercial Paper, 3.65%, 05/30/07 | | | 25,000,000 |
| | 26,075,000 | | Washington State, General Obligation Bonds, FLOATERS, Series 1161, (AMBAC), 3.69%, 07/01/24(a)(b) | | | 26,075,000 |
| | 7,590,000 | | Washington State, General Obligation Bonds, P-Floats, PT 3863, (AMBAC), 3.72%, 01/01/22(a)(b) | | | 7,590,000 |
| | | | | | |
Principal
Amount | | | | Value |
| | | | | | |
TAX-EXEMPT CASH EQUIVALENT
SECURITIES — (continued) |
| $ | 12,145,000 | | Washington State, General Obligation Bonds, P-Floats, PT 3874, (FSA), 3.72%, 01/01/30(a)(b) | | $ | 12,145,000 |
| | 9,745,000 | | Washoe County, Nevada, General Obligation Bonds, Floating Rate Certificates, Series 1241, (MBIA), 3.69%, 01/01/35(a)(b) | | | 9,745,000 |
| | 15,180,000 | | Wisconsin State, Clean Water Revenue Bonds, PUTTERS, Series 1509, 3.70%, 06/01/13(a)(b) | | | 15,180,000 |
| | 11,275,000 | | Wisconsin State, Transportation Authority Revenue Commercial Paper, 3.63%, 08/07/07 | | | 11,275,000 |
| | 39,643,000 | | Wisconsin State, Transportation Authority Revenue Commercial Paper, 3.62%, 10/05/07 | | | 39,643,000 |
| | 25,000,000 | | Wisconsin State, Transportation Authority Revenue Commercial Paper, Series 2006-B, 3.55%, 04/04/07 | | | 25,000,000 |
| | 6,830,000 | | Wisconsin State, Transportation Revenue Bonds, P-Floats, PT 3929, (FGIC), 3.72%, 07/01/26(a)(b) | | | 6,830,000 |
| | 10,240,000 | | York County, South Carolina, School District 4 General Obligation Bonds, Fort Mill, TOCS, Series F, 3.69%, 03/09/12(a)(b) | | | 10,240,000 |
| | | | | | |
| | | TOTAL TAX-EXEMPT CASH EQUIVALENT SECURITIES (Cost $1,937,329,556) | | | 1,937,329,556 |
| | | | | | |
See Notes to Financial Statements.
15
Excelsior Tax-Exempt Funds, Inc.
Portfolio of Investments — March 31, 2007
Tax-Exempt Money Fund — (continued)
| | | | | | |
Principal
Amount | | | | Value |
| | | | | | |
TAX-EXEMPT CASH EQUIVALENT SECURITIES —
BACKED BY LETTERS OF CREDIT — 7.66% |
| $ | 30,000,000 | | Atlanta, Georgia, Metropolitan Transit Authority, Sales Tax Commercial Paper, (DEXIA CREDIT LOCAL), 3.53%, 04/05/07 | | $ | 30,000,000 |
| | 15,000,000 | | Atlanta, Georgia, Metropolitan Transit Authority, Sales Tax Commercial Paper, (DEXIA CREDIT LOCAL), 3.65%, 08/08/07 | | | 15,000,000 |
| | 29,900,000 | | Baltimore, Maryland, Port Facilities Authority Revenue Bonds, (BNP PARIBAS), 3.60%, 10/14/11(a) | | | 29,900,000 |
| | 18,000,000 | | Des Moines, Iowa, Hospital Facilities Authority Revenue Bonds, Methodist Medical Center Project, (WACHOVIA BANK N.A.), 3.67%, 08/01/15(a) | | | 18,000,000 |
| | 7,000,000 | | Kenton County, Kentucky, Industrial Building Authority Revenue Bonds, Redken Labs, Inc. Project, (JP MORGAN CHASE BANK), 3.50%, 12/01/14(a) | | | 7,000,000 |
| | 36,700,000 | | Michigan State, General Obligation Anticipation Notes, Series A, (DEPFA BANK PLC), 4.25%, 09/28/07 | | | 36,807,342 |
| | 11,900,000 | | Michigan State, Municipal Bond Authority Revenue Bonds, Series B-2, (BANK OF NOVA SCOTIA), 4.50%, 08/20/07 | | | 11,937,700 |
| | 13,000,000 | | New York City, New York, Trust For Cultural Restoration Revenue Bonds, WNYC Radio, Inc., (WACHOVIA BANK N.A.), 3.63%, 04/01/26(a) | | | 13,000,000 |
| | | | | | |
| | | TOTAL TAX-EXEMPT CASH EQUIVALENT SECURITIES — BACKED BY LETTERS OF CREDIT
(Cost $161,645,042) | | | 161,645,042 |
| | | | | | |
| | | | | |
| Shares | | | | Value |
| | | | | |
| REGISTERED INVESTMENT COMPANIES — 0.05% |
| 1,143,685 | | BlackRock Muni Fund | | $ | 1,143,685 |
| 1 | | Dreyfus Tax Exempt Cash Fund | | | 1 |
| | | | | |
| | TOTAL REGISTERED INVESTMENT COMPANIES
(Cost $1,143,686) | | | 1,143,686 |
| | | | | |
| | | | | | |
TOTAL INVESTMENTS (Cost $2,100,118,284)(c) | | 99.50 | % | | $ | 2,100,118,284 |
OTHER ASSETS IN EXCESS OF LIABILITIES | | 0.50 | | | | 10,492,468 |
| | | | | | |
NET ASSETS | | 100.00 | % | | $ | 2,110,610,752 |
| | | | | | |
| (a) | Variable Rate Security—The rate disclosed is as of March 31, 2007. |
| (b) | Security exempt from registration under Rule 144A of the Securities Act of 1933. This security may be resold in transactions exempt from registration, normally to qualified institutional buyers. At March 31, 2007, these securities amounted to $1,003,896,500 or 47.56% of net assets. |
| (c) | The cost basis for federal income tax purposes is $2,100,167,823, with gross unrealized appreciation of $— and gross unrealized depreciation of $(49,539). |
AMBAC—American Municipal Bond Assurance Corp.
FGIC—Financial Guaranty Insurance Corp.
FSA—Financial Security Assurance
MBIA—Municipal Bond Insurance Association
PSF-GTD—Permanent School Fund – Guaranteed
Notes (The following notes have not been audited by PricewaterhouseCoopers LLP):
These municipal securities meet the three highest ratings assigned by Moody’s Investors Services, Inc. or Standard and Poor’s Corporation or, where not rated, are determined by the Advisor, under the supervision of the Board of Directors, to be of comparable quality at the time of purchase to rated instruments that may be acquired by the Fund.
At March 31, 2007, approximately 8% of the net assets are invested in municipal securities that have letter of credit enhancement features or escrows in U.S. Government securities backing them, on which the Fund relies. Without such features, the securities may or may not meet the quality standards of securities purchased by the Fund.
See Notes to Financial Statements.
16
Excelsior Tax-Exempt Funds, Inc.
Portfolio of Investments — March 31, 2007
Tax-Exempt Money Fund — (continued)
The summary of the Fund’s investments as of March 31, 2007 is as follows: (Unaudited)
| | | | | | |
State Diversification | | % of
Net
Assets | | | Value |
Texas | | 29.89 | % | | $ | 630,846,635 |
Florida | | 6.73 | | | | 142,055,000 |
Wisconsin | | 5.83 | | | | 123,005,073 |
Colorado | | 5.39 | | | | 113,745,000 |
Michigan | | 4.69 | | | | 98,970,042 |
North Carolina | | 4.38 | | | | 92,375,000 |
Utah | | 3.54 | | | | 74,700,000 |
Maryland | | 3.31 | | | | 69,800,000 |
Washington | | 3.04 | | | | 64,115,000 |
Missouri | | 3.01 | | | | 63,600,000 |
Georgia | | 2.95 | | | | 62,185,000 |
New York | | 2.75 | | | | 58,000,000 |
South Carolina | | 2.63 | | | | 55,465,000 |
Arizona | | 2.34 | | | | 49,458,000 |
Louisiana | | 2.08 | | | | 44,000,000 |
California | | 1.90 | | | | 40,025,000 |
Pennsylvania | | 1.72 | | | | 36,200,000 |
Illinois | | 1.71 | | | | 36,005,000 |
Hawaii | | 1.69 | | | | 35,760,000 |
Iowa | | 1.55 | | | | 32,700,000 |
Nebraska | | 1.42 | | | | 30,000,000 |
Tennessee | | 1.17 | | | | 24,715,000 |
District of Columbia | | 1.09 | | | | 23,061,350 |
Nevada | | 1.07 | | | | 22,545,000 |
Virginia | | 0.83 | | | | 17,588,500 |
Indiana | | 0.71 | | | | 15,000,000 |
New Jersey | | 0.40 | | | | 8,500,000 |
Oklahoma | | 0.40 | | | | 8,400,000 |
Ohio | | 0.36 | | | | 7,665,000 |
Kentucky | | 0.33 | | | | 7,000,000 |
Wyoming | | 0.23 | | | | 4,800,000 |
Massachusetts | | 0.17 | | | | 3,675,000 |
Vermont | | 0.14 | | | | 3,015,000 |
Registered Investment Companies | | 0.05 | | | | 1,143,684 |
| | | | | | |
Total Investments | | 99.50 | % | | $ | 2,100,118,284 |
Other Assets in Excess of Liabilities | | 0.50 | | | | 10,492,468 |
| | | | | | |
Net Assets | | 100.00 | % | | $ | 2,110,610,752 |
| | | | | | |
See Notes to Financial Statements.
17
Excelsior Funds, Inc.
Portfolio of Investments — March 31, 2007
Treasury Money Fund
| | | | | | |
Principal
Amount | | | | Value |
| U.S. GOVERNMENT & AGENCY OBLIGATION — 6.53% |
| $ | 20,000,000 | | Federal Home Loan Bank, Discount Note,
5.00%, 04/02/07 | | $ | 19,997,222 |
| | | | | | |
| | | TOTAL U.S. GOVERNMENT & AGENCY OBLIGATION
(Cost $19,997,222) | | | 19,997,222 |
| | | | | | |
| U.S. TREASURY OBLIGATIONS — 93.01% | | |
| | 90,000,000 | | 5.09%, 04/05/07(a) | | | 89,949,486 |
| | 50,000,000 | | 5.17%, 04/12/07(a) | | | 49,921,320 |
| | 56,000,000 | | 5.16%, 04/19/07(a) | | | 55,856,221 |
| | 30,000,000 | | 5.09%, 04/26/07(a) | | | 29,894,479 |
| | 30,000,000 | | 5.02%, 06/07/07(a) | | | 29,723,486 |
| | 15,000,000 | | 5.01%, 08/30/07(a) | | | 14,691,708 |
| | 15,000,000 | | 4.99%, 09/27/07(a) | | | 14,637,152 |
| | | | | | |
| | | TOTAL U.S. TREASURY OBLIGATIONS (Cost $284,673,852) | | | 284,673,852 |
| | | | | | |
| | | | | |
Shares | | | | Value |
| REGISTERED INVESTMENT COMPANY — 0.80% |
| 2,447,861 | | Dreyfus Treasury Prime Cash Management Fund | | $ | 2,447,861 |
| | | | | |
| | TOTAL REGISTERED INVESTMENT COMPANY
(Cost $2,447,861) | | | 2,447,861 |
| | | | | |
| | | | | | | |
TOTAL INVESTMENTS
(Cost $307,118,935)(b) | | 100.34 | % | | $ | 307,118,935 | |
LIABILITIES IN EXCESS OF OTHER ASSETS | | (0.34 | ) | | | (1,049,020 | ) |
| | | | | | | |
NET ASSETS | | 100.00 | % | | $ | 306,069,915 | |
| | | | | | | |
| (a) | The rate shown is the effective yield at the time of purchase. |
| (b) | Represents cost for financial reporting and federal income tax purposes. |
Discount Note—The rate reported is the discount rate at the time of purchase.
The summary of the Fund’s investments as of March 31, 2007 is as follows: (Unaudited)
| | | | | | | |
Portfolio Diversification | | % of
Net
Assets | | | Value | |
U.S. Treasury Obligations | | 93.01 | % | | $ | 284,673,852 | |
U.S. Government & Agency Obligations | | 6.53 | | | | 19,997,222 | |
Registered Investment Company | | 0.80 | | | | 2,447,861 | |
| | | | | | | |
Total Investments | | 100.34 | % | | $ | 307,118,935 | |
Liabilities in Excess of Other Assets | | (0.34 | ) | | | (1,049,020 | ) |
| | | | | | | |
Net Assets | | 100.00 | % | | $ | 306,069,915 | |
| | | | | | | |
See Notes to Financial Statements.
18
Excelsior Funds
Statements of Assets and Liabilities
March 31, 2007
| | | | | | | | | | | | | | | | | | |
| | | | | |
| | | Government
Money
Fund | | | Money
Fund | | | New York
Tax-Exempt
Money
Fund | | Tax-Exempt
Money
Fund | | | Treasury
Money
Fund |
ASSETS: | | | | | | | | | | | | | | | | | | |
Investments, at cost — see accompanying portfolios | | $ | 167,061,342 | | | $ | 1,165,885,037 | | | $ | 445,215,979 | | $ | 2,100,118,284 | | | $ | 307,118,935 |
Repurchase Agreements, at cost | | | 76,000,000 | | | | 94,000,000 | | | | — | | | — | | | | — |
| | | | | | | | | | | | | | | | | | |
Investments, at value (including Repurchase Agreements) (Note 1) | | $ | 243,061,342 | | | $ | 1,259,885,037 | | | $ | 445,215,979 | | $ | 2,100,118,284 | | | $ | 307,118,935 |
Cash | | | 970 | | | | — | | | | — | | | 494,020 | | | | — |
Dividends and interest receivable | | | 617,069 | | | | 1,925,463 | | | | 3,286,809 | | | 16,711,074 | | | | 9,732 |
Receivable for investments sold | | | — | | | | — | | | | 15,339,549 | | | — | | | | — |
Receivable for fund shares sold | | | — | | | | 449 | | | | — | | | — | | | | — |
Prepaid expenses and other assets | | | 3,045 | | | | 15,202 | | | | 6,279 | | | 28,863 | | | | 3,936 |
| | | | | | | | | | | | | | | | | | |
Total Assets | | | 243,682,426 | | | | 1,261,826,151 | | | | 463,848,616 | | | 2,117,352,241 | | | | 307,132,603 |
LIABILITIES: | | | | | | | | | | | | | | | | | | |
Payable for dividends declared | | | 992,168 | | | | 3,971,809 | | | | 1,059,061 | | | 5,500,323 | | | | 792,129 |
Payable for investments purchased | | | — | | | | — | | | | 5,003,400 | | | — | | | | — |
Cash overdraft | | | — | | | | — | | | | — | | | — | | | | 970 |
Investment advisory fees payable (Note 2) | | | 14,952 | | | | 101,971 | | | | 55,108 | | | 214,702 | | | | 37,268 |
Administration fees payable (Note 2) | | | 34,336 | | | | 158,874 | | | | 63,572 | | | 284,582 | | | | 40,753 |
Shareholder servicing fees payable (Note 2) | | | 61,645 | | | | 213,594 | | | | 137,161 | | | 476,937 | | | | 116,004 |
Accrued expenses and other payables | | | 102,176 | | | | 303,316 | | | | 75,719 | | | 264,945 | | | | 75,564 |
| | | | | | | | | | | | | | | | | | |
Total Liabilities | | | 1,205,277 | | | | 4,749,564 | | | | 6,394,021 | | | 6,741,489 | | | | 1,062,688 |
| | | | | | | | | | | | | | | | | | |
NET ASSETS | | $ | 242,477,149 | | | $ | 1,257,076,587 | | | $ | 457,454,595 | | $ | 2,110,610,752 | | | $ | 306,069,915 |
| | | | | | | | | | | | | | | | | | |
NET ASSETS consist of: | | | | | | | | | | | | | | | | | | |
Undistributed (distributions in excess of) net investment income | | $ | 8,635 | | | $ | 27,558 | | | $ | 10,638 | | $ | 9,439 | | | $ | 2,654 |
Accumulated net realized gain (loss) on investments | | | (24,683 | ) | | | (43,438 | ) | | | — | | | (49,539 | ) | | | — |
Par value (Note 4) | | | 242,565 | | | | 1,257,297 | | | | 457,445 | | | 2,110,752 | | | | 306,077 |
Paid in capital in excess of par value | | | 242,250,632 | | | | 1,255,835,170 | | | | 456,986,512 | | | 2,108,540,100 | | | | 305,761,184 |
| | | | | | | | | | | | | | | | | | |
Net Assets | | $ | 242,477,149 | | | $ | 1,257,076,587 | | | $ | 457,454,595 | | $ | 2,110,610,752 | | | $ | 306,069,915 |
| | | | | | | | | | | | | | | | | | |
Net Assets: | | | | | | | | | | | | | | | | | | |
Shares | | $ | 242,477,149 | | | $ | 644,514,478 | | | $ | 457,454,595 | | $ | 2,110,610,752 | | | $ | 306,069,915 |
Institutional Shares | | | — | | | | 612,562,109 | | | | — | | | — | | | | — |
Shares outstanding (Note 4): | | | | | | | | | | | | | | | | | | |
Shares | | | 242,565,327 | | | | 644,743,985 | | | | 457,444,867 | | | 2,110,751,842 | | | | 306,077,388 |
Institutional Shares | | | — | | | | 612,553,051 | | | | — | | | — | | | | — |
NET ASSET VALUE PER SHARE (net assets÷shares outstanding): | | | | | | | | | | | | | | | | | | |
Shares | | | $1.00 | | | | $1.00 | | | | $1.00 | | | $1.00 | | | | $1.00 |
| | | | | | | | | | | | | | | | | | |
Institutional Shares | | | — | | | | $1.00 | | | | — | | | — | | | | — |
| | | | | | | | | | | | | | | | | | |
See Notes to Financial Statements.
19
Excelsior Funds
Statements of Operations
For the Year Ended March 31, 2007
| | | | | | | | | | | | | | | | | | | | |
| | | | | |
| | | Government
Money
Fund | | | Money
Fund | | | New York
Tax-Exempt
Money
Fund | | | Tax-Exempt
Money
Fund | | | Treasury
Money
Fund | |
INVESTMENT INCOME: | | | | | | | | | | | | | | | | | | | | |
Interest income | | $ | 16,706,594 | | | $ | 70,627,174 | | | $ | 15,486,648 | | | $ | 75,609,571 | | | $ | 15,819,070 | |
Dividend income | | | 133,302 | | | | 194,029 | | | | 61,708 | | | | 225,102 | | | | 153,067 | |
| | | | | | | | | | | | | | | | | | | | |
Total Income | | | 16,839,896 | | | | 70,821,203 | | | | 15,548,356 | | | | 75,834,673 | | | | 15,972,137 | |
EXPENSES: | | | | | | | | | | | | | | | | | | | | |
Investment advisory fees (Note 2) | | | 816,378 | | | | 3,375,831 | | | | 2,193,088 | | | | 5,334,766 | | | | 973,354 | |
Administration fees (Note 2) | | | 492,820 | | | | 2,037,855 | | | | 661,928 | | | | 3,220,343 | | | | 489,640 | |
Shareholder servicing fees—Shares (Note 2) | | | 816,378 | | | | 2,058,929 | | | | 1,096,547 | | | | 5,334,766 | | | | 811,101 | |
Transfer agent fees | | | 22,985 | | | | 98,041 | | | | 22,956 | | | | 30,236 | | | | 22,039 | |
Legal and audit fees | | | 27,090 | | | | 34,136 | | | | 27,725 | | | | 49,003 | | | | 22,996 | |
Custodian fees | | | 28,718 | | | | 100,758 | | | | 45,558 | | | | 146,127 | | | | 26,816 | |
Directors’ fees and expenses (Note 2) | | | 14,037 | | | | 40,964 | | | | 17,369 | | | | 62,180 | | | | 13,578 | |
Miscellaneous expenses | | | 58,421 | | | | 174,493 | | | | 57,527 | | | | 189,531 | | | | 56,325 | |
| | | | | | | | | | | | | | | | | | | | |
Total Expenses | | | 2,276,827 | | | | 7,921,007 | | | | 4,122,698 | | | | 14,366,952 | | | | 2,415,849 | |
Fees waived and reimbursed by: | | | | | | | | | | | | | | | | | | | | |
Investment Adviser (Note 2) | | | (480,791 | ) | | | (1,811,067 | ) | | | (1,490,998 | ) | | | (2,630,445 | ) | | | (469,157 | ) |
Administrator (Note 2) | | | (2,173 | ) | | | (10,503 | ) | | | (1,336 | ) | | | (6,011 | ) | | | (2,637 | ) |
Custody earning credits | | | (7,677 | ) | | | (33,235 | ) | | | (14,641 | ) | | | (39,420 | ) | | | (2,749 | ) |
| | | | | | | | | | | | | | | | | | | | |
Net Expenses | | | 1,786,186 | | | | 6,066,202 | | | | 2,615,723 | | | | 11,691,076 | | | | 1,941,306 | |
| | | | | | | | | | | | | | | | | | | | |
NET INVESTMENT INCOME | | | 15,053,710 | | | | 64,755,001 | | | | 12,932,633 | | | | 64,143,597 | | | | 14,030,831 | |
| | | | | | | | | | | | | | | | | | | | |
REALIZED GAIN (LOSS) ON INVESTMENTS (Note 1): | | | | | | | | | | | | | | | | | | | | |
Net realized gain (loss) on security transactions | | | 2,904 | | | | (2,912 | ) | | | 770 | | | | (5,092 | ) | | | 5,100 | |
| | | | | | | | | | | | | | | | | | | | |
Net increase in net assets resulting from operations | | $ | 15,056,614 | | | $ | 64,752,089 | | | $ | 12,933,403 | | | $ | 64,138,505 | | | $ | 14,035,931 | |
| | | | | | | | | | | | | | | | | | | | |
See Notes to Financial Statements.
20
[THIS PAGE INTENTIONALLY LEFT BLANK]
Excelsior Funds
Statements of Changes in Net Assets
| | | | | | | | | | | | | | | | |
| | |
| | |
Government Money Fund | | | Money Fund | |
| | | Year Ended March 31, | | | Year Ended March 31, | |
| | | 2007 | | | 2006 | | | 2007 | | | 2006 | |
Net investment income | | $ | 15,053,710 | | | $ | 14,326,304 | | | $ | 64,755,001 | | | $ | 52,416,558 | |
Net realized gain (loss) on security transactions | | | 2,904 | | | | (224 | ) | | | (2,912 | ) | | | (4,889 | ) |
| | | | | | | | | | | | | | | | |
Net increase in net assets resulting from operations | | | 15,056,614 | | | | 14,326,080 | | | | 64,752,089 | | | | 52,411,669 | |
| | | | | | | | | | | | | | | | |
Distributions to shareholders: | | | | | | | | | | | | | | | | |
From net investment income | | | | | | | | | | | | | | | | |
Shares | | | (15,045,075 | ) | | | (14,326,304 | ) | | | (38,623,273 | ) | | | (32,581,762 | ) |
Institutional Shares | | | — | | | | — | | | | (26,104,170 | ) | | | (19,834,796 | ) |
From net realized gain on investments | | | | | | | | | | | | | | | | |
Shares | | | — | | | | — | | | | — | | | | — | |
| | | | | | | | | | | | | | | | |
Total distributions | | | (15,045,075 | ) | | | (14,326,304 | ) | | | (64,727,443 | ) | | | (52,416,558 | ) |
| | | | | | | | | | | | | | | | |
Increase (decrease) in net assets from fund share transactions (Note 4) | | | (167,762,345 | ) | | | (85,798,349 | ) | | | (298,083,731 | ) | | | (175,199,854 | ) |
| | | | | | | | | | | | | | | | |
Net increase (decrease) in net assets | | | (167,750,806 | ) | | | (85,798,573 | ) | | | (298,059,085 | ) | | | (175,204,743 | ) |
| | | | | | | | | | | | | | | | |
NET ASSETS: | | | | | | | | | | | | | | | | |
Beginning of year | | | 410,227,955 | | | | 496,026,528 | | | | 1,555,135,672 | | | | 1,730,340,415 | |
| | | | | | | | | | | | | | | | |
End of year(1) | | $ | 242,477,149 | | | $ | 410,227,955 | | | $ | 1,257,076,587 | | | $ | 1,555,135,672 | |
| | | | | | | | | | | | | | | | |
(1) Including undistributed (distributions in excess of) net investment income | | $ | 8,635 | | | $ | — | | | $ | 27,558 | | | $ | — | |
| | | | | | | | | | | | | | | | |
See Notes to Financial Statements.
22
| | | | | | | | | | | | | | | | | | | | | | |
| | |
New York Tax-Exempt
Money Fund | | | Tax-Exempt Money Fund | | | Treasury Money Fund | |
| Year Ended March 31, | | | Year Ended March 31, | | | Year Ended March 31, | |
| 2007 | | | 2006 | | | 2007 | | | 2006 | | | 2007 | | | 2006 | |
| $ | 12,932,633 | | | $ | 9,085,180 | | | $ | 64,143,597 | | | $ | 47,504,669 | | | $ | 14,030,831 | | | $ | 10,553,148 | |
| | 770 | | | | 7,841 | | | | (5,092 | ) | | | 177,930 | | | | 5,100 | | | | 19,089 | |
| | | | | | | | | | | | | | | | | | | | | | | |
| | 12,933,403 | | | | 9,093,021 | | | | 64,138,505 | | | | 47,682,599 | | | | 14,035,931 | | | | 10,572,237 | |
| | | | | | | | | | | | | | | | | | | | | | | |
| | | | | | | | | | | | | | | | | | | | | | |
| | | | | | | | | | | | | | | | | | | | | | |
| | (12,927,606 | ) | | | (9,089,166 | ) | | | (64,113,972 | ) | | | (47,540,889 | ) | | | (14,033,835 | ) | | | (10,559,242 | ) |
| | — | | | | — | | | | — | | | | — | | | | — | | | | — | |
| | | | | | | | | | | | | | | | | | | | | | |
| | — | | | | — | | | | — | | | | (83,881 | ) | | | — | | | | (14,837 | ) |
| | | | | | | | | | | | | | | | | | | | | | | |
| | (12,927,606 | ) | | | (9,089,166 | ) | | | (64,113,972 | ) | | | (47,624,770 | ) | | | (14,033,835 | ) | | | (10,574,079 | ) |
| | | | | | | | | | | | | | | | | | | | | | | |
|
9,583,689 |
| | | 38,609,252 | | | | (51,587,116 | ) | | | 124,313,013 | | | | (59,619,992 | ) | | | (62,318,509 | ) |
| | | | | | | | | | | | | | | | | | | | | | | |
| | 9,589,486 | | | | 38,613,107 | | | | (51,562,583 | ) | | | 124,370,842 | | | | (59,617,896 | ) | | | (62,320,351 | ) |
| | | | | | | | | | | | | | | | | | | | | | | |
| | | | | | | | | | | | | | | | | | | | | | |
| | 447,865,109 | | | | 409,252,002 | | | | 2,162,173,335 | | | | 2,037,802,493 | | | | 365,687,811 | | | | 428,008,162 | |
| | | | | | | | | | | | | | | | | | | | | | | |
| $ | 457,454,595 | | | $ | 447,865,109 | | | $ | 2,110,610,752 | | | $ | 2,162,173,335 | | | $ | 306,069,915 | | | $ | 365,687,811 | |
| | | | | | | | | | | | | | | | | | | | | | | |
| | | | | |
| $ | 10,638 | | | $ | 4,841 | | | $ | 9,439 | | | $ | (9,820 | ) | | $ | 2,654 | | | $ | 558 | |
| | | | | | | | | | | | | | | | | | | | | | | |
See Notes to Financial Statements.
23
Excelsior Funds
Financial Highlights — Selected Per Share Data and Ratios
| | | | | | | | | | | | | | | | | | | | | | |
| | | Net Asset Value,
Beginning of
Year | | Net
Investment
Income | | | Net Realized
Gain (Loss) on
Investments | | | Total From
Investment
Operations | | Dividends
From Net
Investment
Income | | | Distributions
From Net
Realized
Gain on
Investments | |
GOVERNMENT MONEY FUND — (05/08/85*) | | | | | | | | | | | | | | | | |
Shares: | | | | | | | | | | | | | | | | | | | | | | |
Year Ended March 31, | | | | | | | | | | | | | | | | | | | | | | |
2007 | | $ | 1.00 | | $ | 0.04610 | (2) | | $ | 0.00025 | (2) | | $ | 0.04635 | | $ | (0.04635 | ) | | | — | |
2006 | | | 1.00 | | | 0.03152 | (2) | | | 0.00024 | (2) | | | 0.03176 | | | (0.03176 | ) | | | — | |
2005 | | | 1.00 | | | 0.01250 | (2) | | | 0.00003 | | | | 0.01253 | | | (0.01253 | ) | | | — | |
2004 | | | 1.00 | | | 0.00625 | | | | — | | | | 0.00625 | | | (0.00625 | ) | | | — | |
2003 | | | 1.00 | | | 0.01199 | | | | (0.00039 | ) | | | 0.01160 | | | (0.01160 | ) | | | — | |
MONEY FUND — (05/03/85*) | | | | | | | | | | | | | | | | |
Shares: | | | | | | | | | | | | | | | | | | | | | | |
Year Ended March 31, | | | | | | | | | | | | | | | | | | | | | | |
2007 | | $ | 1.00 | | $ | 0.04691 | (2) | | $ | 0.00019 | (2) | | $ | 0.04710 | | $ | (0.04710 | ) | | | — | |
2006 | | | 1.00 | | | 0.03207 | (2) | | | 0.00015 | (2) | | | 0.03222 | | | (0.03222 | ) | | | — | |
2005 | | | 1.00 | | | 0.01275 | (2) | | | 0.00010 | | | | 0.01285 | | | (0.01285 | ) | | | — | |
2004 | | | 1.00 | | | 0.00662 | | | | — | | | | 0.00662 | | | (0.00662 | ) | | | — | |
2003 | | | 1.00 | | | 0.01255 | | | | (0.00010 | ) | | | 0.01245 | | | (0.01245 | ) | | | — | |
NEW YORK TAX-EXEMPT MONEY FUND — (08/03/98*) | | | | | | | | | | | | |
Shares: | | | | | | | | | | | | | | | | | | | | | | |
Year Ended March 31, | | | | | | | | | | | | | | | | | | | | | | |
2007 | | $ | 1.00 | | $ | 0.02948 | (2) | | $ | (0.00002 | )(2) | | $ | 0.02946 | | $ | (0.02946 | ) | | | — | |
2006 | | | 1.00 | | | 0.02150 | (2) | | | (0.00012 | )(2) | | | 0.02138 | | | (0.02138 | ) | | | — | |
2005 | | | 1.00 | | | 0.00822 | (2) | | | 0.00023 | | | | 0.00845 | | | (0.00845 | ) | | | — | |
2004 | | | 1.00 | | | 0.00491 | | | | 0.00006 | | | | 0.00497 | | | (0.00490 | ) | | $ | (0.00007 | ) |
2003 | | | 1.00 | | | 0.00884 | | | | (0.00007 | ) | | | 0.00877 | | | (0.00873 | ) | | | (0.00004 | ) |
TAX-EXEMPT MONEY FUND — (05/24/85*) | | | | | | | | | | | | | | | | |
Shares: | | | | | | | | | | | | | | | | | | | | | | |
Year Ended March 31, | | | | | | | | | | | | | | | | | | | | | | |
2007 | | $ | 1.00 | | $ | 0.03006 | (2) | | $ | (0.00001 | )(2) | | $ | 0.03005 | | $ | (0.03005 | ) | | | — | |
2006 | | | 1.00 | | | 0.02229 | (2) | | | — | (2) | | | 0.02229 | | | (0.02225 | ) | | $ | (0.00004 | ) |
2005 | | | 1.00 | | | 0.00966 | (2) | | | — | | | | 0.00966 | | | (0.00966 | ) | | | — | |
2004 | | | 1.00 | | | 0.00546 | | | | 0.00029 | | | | 0.00575 | | | (0.00560 | ) | | | (0.00015 | ) |
2003 | | | 1.00 | | | 0.00967 | | | | (0.00002 | ) | | | 0.00965 | | | (0.00964 | ) | | | (0.00001 | ) |
TREASURY MONEY FUND — (02/13/91*) | | | | | | | | | | | | | | | | |
Shares: | | | | | | | | | | | | | | | | | | | | | | |
Year Ended March 31, | | | | | | | | | | | | | | | | | | | | | | |
2007 | | $ | 1.00 | | $ | 0.04324 | (2) | | $ | 0.00013 | (2) | | $ | 0.04337 | | $ | (0.04337 | ) | | | — | |
2006 | | | 1.00 | | | 0.02855 | (2) | | | 0.00036 | (2) | | | 0.02891 | | | (0.02887 | ) | | $ | (0.00004 | ) |
2005 | | | 1.00 | | | 0.00988 | (2) | | | 0.00031 | | | | 0.01019 | | | (0.01019 | ) | | | — | |
2004 | | | 1.00 | | | 0.00484 | | | | 0.00002 | | | | 0.00486 | | | (0.00485 | ) | | | (0.00001 | ) |
2003 | | | 1.00 | | | 0.01085 | | | | 0.00004 | | | | 0.01089 | | | (0.01089 | ) | | | — | |
| * | Commencement of Operations. |
| (1) | Expense ratios before waiver of fees and reimbursement of expenses (if any) by adviser and administrator. |
| (2) | For comparative purposes per share amounts are based on average shares outstanding. |
See Notes to Financial Statements.
24
| | | | | | | | | | | | | | | | | | | | |
Total
Distributions | | | Net Asset
Value,
End of
Year | | Total
Return | | | Net Assets,
End of
Year
(000’s) | | Ratio of Net
Operating
Expenses
to Average
Net Assets | | | Ratio of Gross
Operating
Expenses to
Average
Net Assets (1) | | | Ratio of Net
Investment
Income
to Average
Net Assets | |
| | | | | | | | | | | | | | | | | | | | |
| | | | | | | | | | | | | | | | | | | | |
| | | | | | | | | | | | | | | | | | | | |
| $ | (0.04635 | ) | | $ | 1.00 | | 4.74 | % | | $ | 242,477 | | 0.55 | % | | 0.70 | % | | 4.61 | % |
| | (0.03176 | ) | | | 1.00 | | 3.22 | % | | | 410,228 | | 0.53 | % | | 0.69 | % | | 3.15 | % |
| | (0.01253 | ) | | | 1.00 | | 1.26 | % | | | 496,027 | | 0.46 | % | | 0.71 | % | | 1.25 | % |
| | (0.00625 | ) | | | 1.00 | | 0.63 | % | | | 544,721 | | 0.45 | % | | 0.54 | % | | 0.62 | % |
| | (0.01160 | ) | | | 1.00 | | 1.17 | % | | | 594,496 | | 0.39 | % | | 0.47 | % | | 1.21 | % |
| | | | | | | | | | | | | | | | | | | | |
| | | | | | | | | | | | | | | | | | | | |
| | | | | | | | | | | | | | | | | | | | |
| $ | (0.04710 | ) | | $ | 1.00 | | 4.81 | % | | $ | 644,514 | | 0.55 | % | | 0.68 | % | | 4.69 | % |
| | (0.03222 | ) | | | 1.00 | | 3.27 | % | | | 1,032,384 | | 0.53 | % | | 0.69 | % | | 3.21 | % |
| | (0.01285 | ) | | | 1.00 | | 1.29 | % | | | 1,105,053 | | 0.46 | % | | 0.70 | % | | 1.28 | % |
| | (0.00662 | ) | | | 1.00 | | 0.66 | % | | | 1,141,562 | | 0.45 | % | | 0.73 | % | | 0.67 | % |
| | (0.01245 | ) | | | 1.00 | | 1.25 | % | | | 1,787,852 | | 0.39 | % | | 0.43 | % | | 1.25 | % |
| | | | | | | | | | | | | | | | | | | | |
| | | | | | | | | | | | | | | | | | | | |
| | | | | | | | | | | | | | | | | | | | |
| $ | (0.02946 | ) | | $ | 1.00 | | 2.99 | % | | $ | 457,455 | | 0.60 | % | | 0.94 | % | | 2.95 | % |
| | (0.02138 | ) | | | 1.00 | | 2.16 | % | | | 447,865 | | 0.60 | % | | 0.94 | % | | 2.15 | % |
| | (0.00845 | ) | | | 1.00 | | 0.85 | % | | | 409,252 | | 0.55 | % | | 0.97 | % | | 0.82 | % |
| | (0.00497 | ) | | | 1.00 | | 0.50 | % | | | 490,099 | | 0.50 | % | | 0.75 | % | | 0.49 | % |
| | (0.00877 | ) | | | 1.00 | | 0.88 | % | | | 548,574 | | 0.44 | % | | 0.49 | % | | 0.89 | % |
| | | | | | | | | | | | | | | | | | | | |
| | | | | | | | | | | | | | | | | | | | |
| | | | | | | | | | | | | | | | | | | | |
| $ | (0.03005 | ) | | $ | 1.00 | | 3.05 | % | | $ | 2,110,611 | | 0.55 | % | | 0.67 | % | | 3.01 | % |
| | (0.02229 | ) | | | 1.00 | | 2.25 | % | | | 2,162,173 | | 0.53 | % | | 0.68 | % | | 2.23 | % |
| | (0.00966 | ) | | | 1.00 | | 0.97 | % | | | 2,037,802 | | 0.46 | % | | 0.69 | % | | 0.97 | % |
| | (0.00575 | ) | | | 1.00 | | 0.58 | % | | | 2,044,676 | | 0.44 | % | | 0.58 | % | | 0.56 | % |
| | (0.00965 | ) | | | 1.00 | | 0.97 | % | | | 2,281,263 | | 0.39 | % | | 0.54 | % | | 0.97 | % |
| | | | | | | | | | | | | | | | | | | | |
| | | | | | | | | | | | | | | | | | | | |
| | | | | | | | | | | | | | | | | | | | |
| $ | (0.04337 | ) | | $ | 1.00 | | 4.42 | % | | $ | 306,070 | | 0.60 | % | | 0.74 | % | | 4.32 | % |
| | (0.02891 | ) | | | 1.00 | | 2.93 | % | | | 365,688 | | 0.58 | % | | 0.74 | % | | 2.86 | % |
| | (0.01019 | ) | | | 1.00 | | 1.02 | % | | | 428,008 | | 0.55 | % | | 0.75 | % | | 0.99 | % |
| | (0.00486 | ) | | | 1.00 | | 0.49 | % | | | 519,722 | | 0.50 | % | | 0.57 | % | | 0.49 | % |
| | (0.01089 | ) | | | 1.00 | | 1.09 | % | | | 571,998 | | 0.45 | % | | 0.53 | % | | 1.08 | % |
See Notes to Financial Statements.
25
EXCELSIOR FUNDS
NOTES TO FINANCIAL STATEMENTS
| 1. | Significant Accounting Policies: |
Excelsior Funds, Inc. (“Excelsior Fund”) and Excelsior Tax-Exempt Funds, Inc. (“Excelsior Tax-Exempt Fund”) were incorporated under the laws of the State of Maryland on August 2, 1984 and August 8, 1984, respectively, and are registered under the Investment Company Act of 1940, as amended (the “1940 Act”), as open-ended diversified management investment companies with the exception of Energy and Natural Resources Fund, Real Estate Fund, California Short-Intermediate Term Tax-Exempt Income Fund, New York Intermediate-Term Tax-Exempt Fund and New York Tax-Exempt Money Fund, each of which is non-diversified.
Excelsior Fund and Excelsior Tax-Exempt Fund currently offer shares in fifteen and seven managed investment portfolios, respectively, each having its own investment objectives and policies. The following is a summary of significant accounting policies for Government Money Fund, Money Fund and Treasury Money Fund, portfolios of Excelsior Fund, and for New York Tax-Exempt Money Fund and Tax-Exempt Money Fund, portfolios of Excelsior Tax-Exempt Fund (each a “Fund”, collectively, the “Funds”). Such policies are in conformity with accounting principles generally accepted in the United States of America and are consistently followed by the Funds in the preparation of their financial statements. The preparation of financial statements requires management to make estimates and assumptions that affect the reported amounts and disclosures in the financial statements. Actual results could differ from these estimates.
All Funds except for Money Fund offer one class of shares: Shares. The Money Fund offers two classes of shares: Shares and Institutional Shares. The financial highlights of the Institutional Shares as well as the financial statements for the remaining portfolios of Excelsior Fund and Excelsior Tax-Exempt Fund are presented separately.
It is each Fund’s policy, to the extent possible, to maintain a continuous net asset value per share of $1.00. Each Fund has adopted certain investment portfolio valuation and dividend distribution policies to enable it to do so. However, there can be no assurance that the net asset value per share of the Fund will not vary.
(a) Portfolio valuation:
Securities are valued at amortized cost, which has been determined by each Fund’s Board of Directors to represent the fair value of the Funds’ investments. Amortized cost valuation involves valuing an instrument at its cost initially and, thereafter, assuming a constant amortization to maturity of any discount or premium.
Mutual funds are valued at their respective net asset values as determined by those Funds in accordance with the 1940 Act.
(b) Concentration of risks:
At March 31, 2007, approximately 97% of the net assets of the New York Tax-Exempt Money Fund were invested in New York municipal securities. Economic changes affecting New York state and certain of its public bodies and municipalities may affect the ability of issuers to pay the required principal and interest payments of the municipal securities.
26
(c) Security transactions and investment income:
Security transactions are recorded on a trade date basis. Realized gains and losses on investments sold are recorded on the basis of identified cost. Interest income, adjusted for amortization of premiums and discounts on investments, is earned from settlement date and is recorded on the accrual basis.
(d) Repurchase agreements:
The Funds may enter into agreements with financial institutions deemed to be creditworthy by the investment adviser subject to the seller’s agreement to repurchase and the Funds’ agreement to resell such securities at mutually agreed upon prices. The repurchase agreements are collateralized by U.S. Government obligations. The value of the collateral underlying the repurchase agreements will always be at least equal to the repurchase price, including any accrued interest earned on the repurchase agreement. If the counter-party defaults, and the fair value of the collateral declines, realization of the collateral by the Funds may be delayed or limited.
Default or bankruptcy of the seller may, however, expose the applicable Fund to possible delay in connection with the disposition of the underlying securities or loss to the extent that proceeds from a sale of the underlying securities were less than the repurchase price under the agreement.
(e) Distributions to shareholders:
Dividends from net investment income are declared daily and paid monthly. Net realized capital gains, unless offset by any available capital loss carryforward, are distributed to shareholders at least annually, or more frequently to maintain a net asset value of $1.00 per share.
(f) Expense allocation:
Expenses directly attributable to a Fund are charged to that Fund. Other expenses are allocated to the respective Funds based on average daily net assets. Expenses attributable to a specific class of shares, such as shareholder servicing fees, are charged directly to that class.
(g) Borrowing:
The funds may obtain temporary bank loans from banks and custodians to use for meeting shareholder redemptions or for temporary or emergency purposes. The board of trustees approved an agreement between Excelsior Fund and Excelsior Tax-Exempt Fund and their custodian, JPMorgan Chase Bank, N.A., under which the funds may participate in an uncommitted line of credit in the aggregate principal amount of $150 million. The funds pay interest on the amounts they borrow at negotiated rates based on the terms of the agreement. There was no borrowing from the line of credit for any funds during the year ended March 31, 2007.
(h) Custody Credits:
Each Fund has an arrangement with its custodian bank under which the Fund receives a credit for its uninvested cash balance to offset its custody fees. The credit amounts (if any) are disclosed in the statement of operations as a reduction to the Fund’s operating expenses.
(i) New Accounting Standards:
In September 2006, the Financial Accounting Standards Board (FASB) issued Statement of Financial Accounting Standards No. 157, “Fair Value Measurements” (SFAS No. 157). SFAS No. 157
27
defines fair value, establishes a framework for measuring fair value in accordance with generally accepted accounting principles and expands disclosure about fair value measurements. SFAS No. 157 is effective for fiscal years beginning after November 15, 2007. Management is currently evaluating the impact the adoption of SFAS No. 157 will have on the Fund’s financial statements.
In July 2006, the FASB released FASB Interpretation No. 48 “Accounting for Uncertainty in Income Taxes” (“FIN 48”). FIN 48 provides guidance for how uncertain tax positions should be recognized, measured, presented and disclosed in the financial statements. FIN 48 requires the evaluation of tax positions taken or expected to be taken in the course of preparing the Fund’s tax return to determine whether the tax positions are “more-likely-than-not” of being sustained by the applicable tax authority. Tax positions not deemed to meet the more-likely-than-not threshold would be recorded as a tax benefit or expense in the period of determination. Adoption of FIN 48 is required no later than the last business day of the first financial statement reporting period for fiscal years beginning after December 15, 2006. A fund with a fiscal year ending March 31 will implement FIN 48 no later than September 28, 2007, and it is to be applied to all open tax years as of the effective date. Management is currently evaluating the impact of the adoption of FIN 48 to the financial statements.
| 2. | Investment Advisory Fee, Administration Fee, Shareholder Servicing Fees and Related Party Transactions: |
The Funds are advised by U.S. Trust New York Asset Management Division (“NYAMD”), a separate identifiable division of United States Trust Company, National Association (“USTNA”), or UST Advisers, Inc. (“USTA” and together with NYAMD, the “Advisers”) USTA is a wholly-owned subsidiary of USTNA. USTNA is a wholly-owned subsidiary of U.S. Trust Corporation, a registered bank holding company, which, in turn, is a wholly-owned subsidiary of The Charles Schwab Corporation. For the services provided pursuant to the Investment Advisory Agreements, each Adviser receives a fee, computed daily and paid monthly, as follows:
| | | |
Government Money Fund | | 0.25 | % |
Money Fund | | 0.25 | % |
New York Tax-Exempt Money Fund | | 0.50 | % |
Tax-Exempt Money Fund | | 0.25 | % |
Treasury Money Fund | | 0.30 | % |
On November 20, 2006, The Charles Schwab Corporation (“Schwab”) announced an agreement to sell the U.S. Trust Corporation (“U.S. Trust”) a wholly-owned subsidiary of Schwab, to the Bank of America Corporation (the “Sale”). The Sale includes all of U.S. Trust’s subsidiaries, including USTA and USTNA. The completion of the Sale may result in the assignment of the current investment advisory agreements and termination in accordance with their terms. Therefore, the Board of Trustees/Directors approved the new investment advisory agreements at the same advisory fee rates disclosed above in January 2007 and Shareholders of each Fund approved the new agreements during meetings held in March and April 2007. It is anticipated that the Sale will close early in the third quarter of 2007.
USTA and BISYS Fund Services Ohio, Inc. (collectively, the “Administrators”) provide administrative services to the Funds. For the services provided to the Funds, the Administrators are
28
entitled jointly to annual fees, computed daily and paid monthly, based on the combined aggregate average daily net assets of Excelsior Fund, Excelsior Tax-Exempt Fund and Excelsior Funds Trust (excluding the international equity portfolios of Excelsior Fund and Excelsior Funds Trust), all of which are affiliated investment companies, as follows: 0.200% of the first $200 million, 0.175% of the next $200 million and 0.150% over $400 million. The Administrators are entitled jointly to annual fees, computed daily and paid monthly, at the annual rate of 0.20% of the average daily net assets of the Emerging Markets Fund, International Equity Fund, International Fund and Pacific/Asia Fund. Administration fees payable by each Fund of the Excelsior Fund, Excelsior Tax-Exempt Fund and Excelsior Funds Trust are determined in proportion to the relative average daily net assets of the respective Funds for the period paid. For the year ended March 31, 2007, administration fees paid to USTA were as follows:
| | | |
| | | Administration
Fees paid to UST
Advisers, Inc. |
Government Money Fund | | $ | 444,394 |
Money Fund | | | 1,837,900 |
New York Tax-Exempt Money Fund | | | 597,118 |
Tax-Exempt Money Fund | | | 2,904,770 |
Treasury Money Fund | | | 441,670 |
BISYS Fund Services Ohio, Inc., waived Administration fees as presented on the Statements of Operations.
From time to time, in its sole discretion, each Adviser may undertake to waive a portion or all of the fees payable to it and may also reimburse the Funds for a portion of other expenses. For the year ended March 31, 2007, the Advisers have contractually agreed to waive investment advisory fees through, at least, July 31, 2007, and to reimburse other operating expenses to the extent necessary to keep total operating expenses from exceeding the following annual percentages of each Fund’s average daily net assets:
| | | |
Government Money Fund — Shares | | 0.55 | % |
Money Fund — Shares | | 0.55 | % |
New York Tax-Exempt Money Fund — Shares | | 0.60 | % |
Tax-Exempt Money Fund — Shares | | 0.55 | % |
Treasury Money Fund — Shares | | 0.60 | % |
Money Fund — Institutional Shares | | 0.30 | % |
For the year ended March 31, 2007, pursuant to the above, investment advisory fees waived by the Advisers were as follows:
| | | |
Government Money Fund | | $ | 480,791 |
Money Fund | | | 1,811,067 |
New York Tax-Exempt Money Fund | | | 1,490,998 |
Tax-Exempt Money Fund | | | 2,630,445 |
Treasury Money Fund | | | 469,157 |
29
The Funds have entered into shareholder servicing agreements with various service organizations, which include Charles Schwab & Co. Inc. (“CS & Co.”) and USTA. Services included in the servicing agreements include assistance in processing purchase, exchange and redemption requests; transmitting and receiving funds in connection with customer orders to purchase, exchange or redeem shares; and providing periodic statements. Shareholder servicing fees are incurred on a Fund or class level (where applicable). In consideration for these services, each service organization receives a fee from the Funds, computed daily and paid monthly, at an annual rate up to 0.25% of the average daily net assets of the Funds’ shares held by each service organization’s customers, with the exception of the Institutional Shares of the Money Fund, which pays a fee of up to 0.15% of the average daily net assets of its shares. The Advisers, out of their own resources, may additionally compensate certain organizations for providing these and other services.
For the year ended March 31, 2007, shareholder servicing fees paid to CS & Co. and USTA were as follows:
| | | |
Government Money Fund | | $ | 810,283 |
Money Fund | | | 2,027,190 |
New York Tax-Exempt Money Fund | | | 1,082,994 |
Tax-Exempt Money Fund | | | 5,323,397 |
Treasury Money Fund | | | 790,082 |
BISYS Fund Services Limited Partnership (the “Distributor”) serves as the Distributor of the Funds. Shares of each Fund are sold without a sales charge on a continuous basis by the Distributor.
The board of trustees/directors may include people who are officers and/or trustees of other fund families affiliated to the investment adviser. Federal securities law limits the percentage of the “interested persons” who may serve on a trust’s board, and the Funds are in compliance with these limitations. The funds did not pay any of the interested persons for their service as trustees/directors, but did pay non-interested persons (independent trustees), as noted in each fund’s Statement of Operations.
It is the policy of the Excelsior Fund and Excelsior Tax-Exempt Fund that each Fund continue to qualify as a regulated investment company, by complying with the requirements of the Internal Revenue Code applicable to regulated investment companies and by distributing substantially all of its taxable earnings to its shareholders.
In order to avoid a federal excise tax, each Fund is required to distribute certain minimum amounts of net realized capital gain and net investment income for the respective twelve-month periods ending October 31 and December 31 each calendar year.
Dividends and distributions are determined in accordance with federal income tax regulations and may differ from accounting principles generally accepted in the United States of America. These differences are primarily due to differing dividend characterization and the expiration of capital loss
30
carryforwards. To the extent these differences are permanent in nature, such amounts are reclassified within the composition of net assets based on their federal tax-basis treatment; temporary differences do not require reclassification. Accordingly, the following reclassifications have been made to/from the following accounts:
| | | | | | | | | | | | |
| | | Undistributed
Net
Investment
Income | | | Accumulated
Net Realized
Gain (Loss) | | | Paid-In-Capital | |
Government Money Fund | | $ | — | | | $ | 393 | | | $ | (393 | ) |
New York Tax-Exempt Money Fund | | | 770 | | | | (770 | ) | | | — | |
Tax-Exempt Money Fund | | | (10,368 | ) | | | (138,496 | ) | | | 148,864 | |
Treasury Money Fund | | | 5,100 | | | | (5,100 | ) | | | — | |
The tax character of dividends and distributions declared during the years ended March 31, 2007 and March 31, 2006 were as follows:
| | | | | | | | | | | | |
| | | Ordinary
Income | | Tax-Exempt
Income | | Long-Term
Capital Gain | | Total* |
Government Money Fund | | | | | | | | | | | | |
Year ended March 31, 2007 | | $ | 15,546,941 | | $ | — | | $ | — | | $ | 15,546,941 |
Year ended March 31, 2006 | | | 13,620,350 | | | — | | | — | | | 13,620,350 |
Money Fund | | | | | | | | | | | | |
Year ended March 31, 2007 | | | 65,587,427 | | | — | | | — | | | 65,587,427 |
Year ended March 31, 2006 | | | 49,048,464 | | | — | | | — | | | 49,048,464 |
New York Tax-Exempt Money Fund | | | | | | | | | | | | |
Year ended March 31, 2007 | | | 770 | | | 12,662,681 | | | — | | | 12,663,451 |
Year ended March 31, 2006 | | | 3,001 | | | 8,506,753 | | | 4,840 | | | 8,514,594 |
Tax-Exempt Money Fund | | | | | | | | | | | | |
Year ended March 31, 2007 | | | — | | | 63,305,228 | | | — | | | 63,305,228 |
Year ended March 31, 2006 | | | 84,887 | | | 45,217,987 | | | 20,970 | | | 45,323,844 |
Treasury Money Fund | | | | | | | | | | | | |
Year ended March 31, 2007 | | | 13,964,644 | | | — | | | 5 | | | 13,964,649 |
Year ended March 31, 2006 | | | 9,920,151 | | | — | | | — | | | 9,920,151 |
* The total distributions paid may differ from the Statement of Changes in Net Assets because for tax purposes, dividends are recognized when actually paid.
31
As of March 31, 2007, the components of distributable earnings (accumulated losses) on a tax basis were as follows:
| | | | | | | | | | | | | | | | | | | | | | | | | | | | |
| | | Undistributed
Ordinary
Income | | Undistributed
Long-Term
Capital Gain | | Undistributed
Tax-Exempt
Income | | Accumulated
Earnings | | Distributions
Payable* | | | Accumulated
Capital and
Other
Losses | | | Unrealized
Depreciation | | | Total
Accumulated
Earnings/
(Deficit) | |
Government Money Fund | | $ | 1,059,385 | | $ | — | | $ | — | | $ | 1,059,385 | | $ | (1,050,750 | ) | | $ | (24,683 | ) | | $ | — | | | $ | (16,048 | ) |
Money Fund | | | 5,122,791 | | | — | | | — | | | 5,122,791 | | | (5,095,233 | ) | | | (43,438 | ) | | | — | | | | (15,880 | ) |
New York Tax-Exempt Money Fund | | | — | | | — | | | 1,249,960 | | | 1,249,960 | | | (1,239,322 | ) | | | — | | | | — | | | | 10,638 | |
Tax-Exempt Money Fund | | | — | | | — | | | 5,712,343 | | | 5,712,343 | | | (5,702,904 | ) | | | — | | | | (49,539 | ) | | | (40,100 | ) |
Treasury Money Fund | | | 1,213,314 | | | — | | | — | | | 1,213,314 | | | (1,210,660 | ) | | | — | | | | — | | | | 2,654 | |
* The total distributions payable may differ from the statement of Assets and Liabilities because for tax purposes, dividends are recognized when actually paid.
For federal income tax purposes, capital loss carryforwards may be carried forward and applied against future capital gains. To the extent that such carryforwards are utilized, capital gains distributions will be reduced. At March 31, 2007, the following Funds had capital loss carryforwards available to offset future net capital gains through the indicated expiration dates.
| | | | | | | | | | | | | | | | | | | | | |
| | | Expires |
| | | 2008 | | 2011 | | 2012 | | 2013 | | 2014 | | 2015 | | Total |
Government Money Fund | | $ | 18,903 | | $ | — | | $ | 5,556 | | $ | — | | $ | 224 | | $ | — | | $ | 24,683 |
Money Fund | | | — | | | 11,662 | | | 23,975 | | | — | | | 4,889 | | | 2,912 | | | 43,438 |
Excelsior Fund has authorized capital of 35 billion shares of Common Stock, 29.3756 billion of which is currently classified to represent interests in certain classes of shares. Excelsior Tax-Exempt Fund has authorized capital of 24 billion shares of Common Stock, 15 billion of which is currently classified to represent interests in certain classes of shares. Authorized capital currently classified for each Fund is as follows: 4 billion shares each of the Government Money Fund and Money Fund, 2.5 billion shares of Treasury Money Fund, 2 billion shares of New York Tax-Exempt Money Fund and 5.5 billion shares for Tax-Exempt Money Fund.
32
Each share has a par value of $0.001 and represents an equal proportionate interest in the particular Fund with other shares of the same Fund, and is entitled to such dividends and distributions of taxable earnings on the assets belonging to such Fund as are declared at the discretion of each Fund’s Board of Directors. Since the Funds have sold, reinvested and redeemed shares only at a constant net asset value of $1.00 per share, the number of shares represented by such sales, reinvestments and redemptions is the same as the amounts shown below for such transactions.
Capital Share Transactions
| | | | | | | | | | | | | | |
| | | Government Money Fund | |
| | | Year Ended
03/31/07 | | | Year Ended
03/31/06 | |
| | | Shares | | | Amounts | | | Shares | | | Amounts | |
Sold | | 2,027,068,990 | | | $ | 2,027,068,990 | | | 2,577,232,059 | | | $ | 2,577,232,059 | |
Issued as reinvestment of dividends | | 697,510 | | | | 697,510 | | | 735,293 | | | | 735,293 | |
Redeemed | | (2,195,528,845 | ) | | | (2,195,528,845 | ) | | (2,663,765,701 | ) | | | (2,663,765,701 | ) |
| | | | | | | | | | | | | | |
Net Increase (Decrease) | | (167,762,345 | ) | | $ | (167,762,345 | ) | | (85,798,349 | ) | | $ | (85,798,349 | ) |
| | | | | | | | | | | | | | |
| |
| | | Money Fund | |
| | | Year Ended
03/31/07 | | | Year Ended
03/31/06 | |
| | | Shares | | | Amounts | | | Shares | | | Amounts | |
Sold: | | | | | | | | | | | | | | |
Shares | | 2,599,472,390 | | | $ | 2,599,472,390 | | | 3,427,610,450 | | | $ | 3,427,610,450 | |
Institutional Shares | | 4,262,737,772 | | | | 4,262,737,772 | | | 4,731,250,373 | | | | 4,731,250,373 | |
Issued as reinvestment of dividends: | | | | | | | | | | | | | | |
Shares | | 3,330,030 | | | | 3,330,030 | | | 2,259,420 | | | | 2,259,420 | |
Institutional Shares | | 9,160,704 | | | | 9,160,704 | | | 7,428,066 | | | | 7,428,066 | |
Redeemed: | | | | | | | | | | | | | | |
Shares | | (2,990,685,747 | ) | | | (2,990,685,747 | ) | | (3,502,534,923 | ) | | | (3,502,534,923 | ) |
Institutional Shares | | (4,182,098,880 | ) | | | (4,182,098,880 | ) | | (4,841,213,240 | ) | | | (4,841,213,240 | ) |
| | | | | | | | | | | | | | |
Net Increase (Decrease) | | (298,083,731 | ) | | $ | (298,083,731 | ) | | (175,199,854 | ) | | $ | (175,199,854 | ) |
| | | | | | | | | | | | | | |
33
| | | | | | | | | | | | | | |
| | | New York Tax-Exempt Money Fund | |
| | | Year Ended
03/31/07 | | | Year Ended
03/31/06 | |
| | | Shares | | | Amounts | | | Shares | | | Amounts | |
Sold | | 2,519,812,784 | | | $ | 2,519,812,784 | | | 2,399,705,970 | | | $ | 2,399,705,970 | |
Issued as reinvestment of dividends | | 1,815,110 | | | | 1,815,110 | | | 1,554,586 | | | | 1,554,586 | |
Redeemed | | (2,512,044,205 | ) | | | (2,512,044,205 | ) | | (2,362,651,304 | ) | | | (2,362,651,304 | ) |
| | | | | | | | | | | | | | |
Net Increase (Decrease) | | 9,583,689 | | | $ | 9,583,689 | | | 38,609,252 | | | $ | 38,609,252 | |
| | | | | | | | | | | | | | |
| |
| | | Tax-Exempt Money Fund | |
| | | Year Ended
03/31/07 | | | Year Ended
03/31/06 | |
| | | Shares | | | Amounts | | | Shares | | | Amounts | |
Sold | | 9,783,446,469 | | | $ | 9,783,446,469 | | | 10,547,799,881 | | | $ | 10,547,799,881 | |
Issued as reinvestment of dividends | | 2,484,144 | | | | 2,484,144 | | | 2,207,894 | | | | 2,207,894 | |
Redeemed | | (9,837,517,729 | ) | | | (9,837,517,729 | ) | | (10,425,694,762 | ) | | | (10,425,694,762 | ) |
| | | | | | | | | | | | | | |
Net Increase (Decrease) | | (51,587,116 | ) | | $ | (51,587,116 | ) | | 124,313,013 | | | $ | 124,313,013 | |
| | | | | | | | | | | | | | |
| |
| | | Treasury Money Fund | |
| | | Year Ended
03/31/07 | | | Year Ended
03/31/06 | |
| | | Shares | | | Amounts | | | Shares | | | Amounts | |
Sold | | 1,744,655,262 | | | $ | 1,744,655,262 | | | 3,260,733,468 | | | $ | 3,260,733,468 | |
Issued as reinvestment of dividends | | 4,178,107 | | | | 4,178,107 | | | 2,191,117 | | | | 2,191,117 | |
Redeemed | | (1,808,453,361 | ) | | | (1,808,453,361 | ) | | (3,325,243,094 | ) | | | (3,325,243,094 | ) |
| | | | | | | | | | | | | | |
Net Increase (Decrease) | | (59,619,992 | ) | | $ | (59,619,992 | ) | | (62,318,509 | ) | | $ | (62,318,509 | ) |
| | | | | | | | | | | | | | |
In the normal course of business, the Funds enter into contracts that provide general indemnifications. The Funds’ maximum exposure under these arrangements is dependent on future claims that may be made against the Funds and, therefore, cannot be established; however, based on experience, the risk of loss from such claims is considered remote.
United States Trust Company of New York and U.S. Trust Company, N.A. (formerly, co-investment advisers to the Funds, together referred to herein as “U.S. Trust”), Excelsior Funds, Excelsior Tax-Exempt Funds and Trust (the “Companies”), U.S. Trust, Schwab and several individuals and third parties were named in four fund shareholder class actions and two derivative actions which alleged that U.S. Trust, the Companies, and others allowed certain parties to engage in illegal and improper mutual
34
fund trading practices, which allegedly caused financial injury to the shareholders of certain of the Funds advised by U.S. Trust. Each seeks unspecified monetary damages and related equitable relief.
The class and derivative actions described above were transferred to the United States District Court for the District of Maryland for coordinated and consolidated pre-trial proceedings. In November 2005, the Maryland court dismissed many of the plaintiffs’ claims in both the class and derivative actions. The court entered implementing orders on February 24, 2006. All claims against the Companies have been dismissed. Plaintiffs’ claims against U.S. Trust and certain individuals under Sections 10(b) and 20(a) of the Securities Exchange Act and Sections 36(b) and 48(a) of the Investment Company Act, however, have not been dismissed. Plaintiffs’ Section 48(a) claims against parent entities U.S. Trust and Schwab also remain.
While the ultimate outcome of these matters cannot be predicted with any certainty at this time, based on currently available information, U.S. Trust believes that the likelihood is remote that the pending litigation will have a material adverse financial impact on the Companies, or materially affect U.S. Trust’s ability to provide investment management services to the Companies.
35
REPORT OF INDEPENDENT REGISTERED PUBLIC ACCOUNTING FIRM
To the Board of Directors and Shareholders of
Excelsior Funds, Inc. and Excelsior Tax-Exempt Funds, Inc.
In our opinion, the accompanying statements of assets and liabilities, including the portfolios of investments, and the related statements of operations and of changes in net assets and the financial highlights present fairly, in all material respects, the financial position of the Government Money Fund, Money Fund, New York Tax-Exempt Money Fund, Tax-Exempt Money Fund and Treasury Money Fund (three portfolios of Excelsior Funds, Inc. and two portfolios of Excelsior Tax-Exempt Funds, Inc., hereafter referred to as the “Funds”) at March 31, 2007, and the results of each of their operations, the changes in each of their net assets and the financial highlights for the year then ended, in conformity with accounting principles generally accepted in the United States of America. These financial statements and financial highlights (hereafter referred to as “financial statements”) are the responsibility of the Funds’ management; our responsibility is to express an opinion on these financial statements based on our audit. We conducted our audit of these financial statements in accordance with the standards of the Public Company Accounting Oversight Board (United States). Those standards require that we plan and perform the audit to obtain reasonable assurance about whether the financial statements are free of material misstatement. An audit includes examining, on a test basis, evidence supporting the amounts and disclosures in the financial statements, assessing the accounting principles used and significant estimates made by management, and evaluating the overall financial statement presentation. We believe that our audit, which included confirmation of securities at March 31, 2007 by correspondence with the custodian and brokers, provides a reasonable basis for our opinion. The statements of changes in net assets and financial highlights of the Funds for each of the four years in the period ended March 31, 2006 were audited by other auditors whose report dated May 22, 2006 expressed an unqualified opinion on those statements.
PRICEWATERHOUSECOOPERS LLP
San Francisco, California
May 18, 2007
36
PROXY VOTING RESULTS (Unaudited)
On November 20, 2006, Schwab announced an agreement to sell U.S. Trust, a wholly-owned subsidiary of Schwab, to the Bank of America (the “Sale”). The Sale involves all of U.S. Trust’s subsidiaries, including USTA and USTNA.
Under Section 15 of the 1940 Act, the change in ownership of U.S. Trust may result in the assignment, and automatic termination, of the Funds’ current investment advisory agreements with USTA and USTNA (the “Current Advisory Agreements”). Consequently, the Funds will need to enter into new investment advisory agreements with USTA and USTNA upon the closing of the Sale (the “New Advisory Agreements”), which requires the approval of both the Board of Directors and the shareholders of the Funds. At a meeting held on January 8, 2007, the Board approved New Advisory Agreements under which, subject to approval by the Funds’ shareholders, USTA and USTNA will continue to serve as investment advisers to the Funds after the Sale is completed. At the same meeting, the Board directed that the New Advisory Agreements be submitted to the shareholders of each Fund for approval.
A Special Meeting of Shareholders of Excelsior Funds, Excelsior Tax-Exempt Funds and Trust and each of their Funds was held on March 30, 2007, for the purpose of seeking shareholder approval of the following proposal: to approve new investment advisory agreements by and among USTA, USTNA and the Companies, on behalf of the Funds. The Special Meeting for Excelsior Funds with respect to the Value and Restructuring Fund, Energy and Natural Resources and Treasury Money Funds was adjourned for the purpose of soliciting additional proxies, and subsequently held on April 30, 2007. The number of votes necessary to conduct the Special Meetings and approve the proposal was obtained. The results of the votes of shareholders are listed below:
EXCELSIOR FUNDS, INC.
| | | | | | |
Fund | | For | | Against | | Abstain |
Blended Equity Fund | | 6,164,047.545 | | 67,952.751 | | 73,977.210 |
Core Bond Fund | | 42,419,131.502 | | 102,811.034 | | 103,300.208 |
Emerging Markets Fund | | 40,519,375.591 | | 385,533.770 | | 2,387,530.558 |
Energy and Natural Resources Fund | | 10,149,963.059 | | 261,710.922 | | 349,760.892 |
Government Money Fund | | 172,737,336.070 | | 747,772.190 | | 420,358.000 |
Intermediate-Term Bond Fund | | 44,858,545.970 | | 241,685.152 | | 66,016.000 |
International Fund | | 21,282,762.400 | | 54,899.414 | | 128,924.192 |
Large Cap Growth Fund | | 42,848,198.375 | | 89,295.014 | | 404,672.705 |
Money Fund | | 674,980,999.600 | | 1,166,673.210 | | 410,474.540 |
Pacific/Asia Fund | | 12,624,395.052 | | 35,293.746 | | 146,970.828 |
Real Estate Fund | | 6,828,766.866 | | 23,944.228 | | 74,532.837 |
Short-Term Government Securities Fund | | 19,900,726.363 | | 26,705.441 | | 160,992.698 |
Small Cap Fund | | 20,778,531.495 | | 77,734.183 | | 230,771.291 |
Treasury Money Fund | | 147,661,994.420 | | 8,327.040 | | 953,491.100 |
Value and Restructuring Fund | | 71,659,202.229 | | 1,308,059.398 | | 2,313,244.343 |
37
PROXY VOTING RESULTS (Continued)
EXCELSIOR TAX-EXEMPT FUNDS, INC.
| | | | | | |
Fund | | For | | Against | | Abstain |
California Short-Intermediate Term Tax-Exempt Income Fund | | 5,620,954.755 | | 30,312.000 | | 19,754.000 |
Intermediate-Term Tax-Exempt Fund | | 25,090,015.155 | | 30,070.577 | | 76,826.198 |
Long-Term Tax-Exempt Fund | | 3,628,610.926 | | 33,702.423 | | 40,804.648 |
New York Intermediate-Term Tax-Exempt Fund | | 9,319,329.057 | | 13,806.000 | | 36,899.000 |
New York Tax-Exempt Money Fund | | 275,209,603.310 | | 4,686,548.000 | | 63,196.000 |
Short-Term Tax-Exempt Securities Fund | | 8,452,657.301 | | 72,849.000 | | 359,587.000 |
Tax-Exempt Money Fund | | 1,356,339,634.110 | | 11,586,764.280 | | 2,023,751.550 |
EXCELSIOR FUNDS TRUST
| | | | | | |
Fund | | For | | Against | | Abstain |
Equity Income Fund | | 15,004,710.199 | | 69,167.666 | | 28,045.000 |
Equity Opportunities Fund | | 15,890,842.151 | | 16,544.962 | | 771.000 |
High Yield Fund | | 15,794,959.655 | | 30,927.324 | | 249,577.222 |
International Equity Fund | | 5,138,808.000 | | .000 | | .000 |
Mid Cap Value and Restructuring Fund | | 7,879,533.211 | | 19,517.123 | | 87,756.460 |
38
ADDITIONAL FEDERAL TAX INFORMATION
Other Federal Tax Information (Unaudited):
The funds designate the following percentage of the distributions paid from net investment income as exempt-interest dividends for the fiscal year ended March 31, 2007.
| | | |
| | | Percentage | |
New York Tax-Exempt Money Fund | | 100 | % |
Tax-Exempt Money Fund | | 100 | % |
The funds designate the following amounts as long-term capital gain distribution. The amount designated may not agree with the long term capital gains in the tax character of distribution table due to utilization of earnings and profits distributed to shareholders on redemption of shares.
| | | |
| | | Amount |
Tax-Exempt Money Fund | | $ | 26,019 |
Treasury Money Fund | | | 5 |
39
APPROVAL OF INVESTMENT ADVISORY AGREEMENTS (Unaudited)
In November 2006, representatives of Schwab, U.S. Trust and the Funds’ investment advisers, USTA and USTNA (together, USTA and USTNA are referred to as the “Advisers) informed the Board that Schwab had entered into a stock purchase agreement with the Bank of America under which Schwab would sell U.S. Trust to Bank of America (the “Sale”). Representatives of Schwab, U.S. Trust, and the Advisers also informed the Board that, because the Sale includes all of U.S. Trust’s subsidiaries, such as USTA and USTNA, the completion of the Sale may be deemed to be an “assignment” (as defined in the 1940 Act) of the Funds’ current investment advisory agreements (the “Current Advisory Agreements”) resulting in the termination of the Current Advisory Agreements in accordance with their terms. To provide continuity in investment advisory services, representatives of U.S. Trust, the Advisers, and Bank of America proposed that the Board approve new investment advisory agreements (the “New Advisory Agreements”) under which, subject to shareholder approval, USTA and USTNA would continue to serve as investment advisers to the Funds after the completion of the Sale.
In advance of its December 6-7, 2006 meeting, the Board of Directors/Trustees requested and received from Bank of America, U.S. Trust, and the Advisers, various materials providing information regarding the Sale and its impact on (i) the Funds and their shareholders, (ii) the investment advisory services provided to the Funds by the USTA and USTNA and (iii) the administration services provided to the Funds by USTA. After receiving and reviewing these materials, the Board discussed at their December 6-7, 2006 meeting, the proposal to approve the New Advisory Agreements. Representatives from Bank of America, U.S. Trust, the Advisers, and Schwab attended the meeting and presented additional oral and written information to the Board to assist the Board in its considerations. These representatives assured the Board that Bank of America did not anticipate that there will be any reduction in the scope of or material adverse change in the nature or quality of, the investment advisory services to the Funds under the New Advisory Agreements. These representatives noted that a plan would be put into place designed to provide for the continuity of the investment advisory services under the New Advisory Agreements.
Additionally, representatives from Bank of America discussed the extensive experience and resources dedicated to Bank of America’s large mutual fund business, assuring the Board that Bank of America would seek to provide the Funds with the same or better quality of services with respect to the administration services currently provided by USTA. Representatives from Bank of America noted that: (i) the size and scale of Bank of America’s mutual fund business could produce potential savings for the Funds’ shareholders through reduced administrative costs and (ii) there was the potential for significant negotiating power in any future vendor discussions resulting from the Funds being part of the larger Bank of America fund complex.
The Board then discussed the written materials that the Board received before the meeting and the oral presentations and all other information that the Board received or discussed at the December 6-7, 2006 meeting. At the conclusion of the meeting, the Board decided to schedule another in-person Board meeting on January 8, 2007 to allow the Board to further consider the proposal to approve the New Advisory Agreements.
40
APPROVAL OF INVESTMENT ADVISORY AGREEMENTS (Continued)
In anticipation of the January 8, 2007 Board meeting, legal counsel for the Directors/Trustees who are not interested persons (as defined in the 1940 Act) (“Independent Directors”) sent an information request letter to U.S. Trust and Schwab to solicit further information that the Board deemed to be relevant to their consideration of the New Advisory Agreements, including a discussion of, among other matters, (a) a detailed timeline and plan for the orderly transition of the administration and oversight of the Funds; (b) the extent to which key personnel of the Advisers who manage day-to-day investment operations of the Funds are expected to continue to be employed by the Advisers after the Sale; (c) the experience and qualifications of new key administrative personnel that Bank of America proposes to involve in Fund matters; (d) any enhanced compliance policies and procedures adopted by Bank of America in response to mutual fund regulatory and compliance issues; (e) any anticipated financial benefits of the Sale to Fund shareholders; (f) any anticipated changes in the Funds’ fees and operating expenses; (g) any anticipated structural changes to the Excelsior Funds complex; (h) any conflicts of interest between the other business interests of Bank of America and its affiliates and the operations of the Funds; and (i) any limitations on the Funds’ investment operations that would arise as a result of the Funds’ being affiliated with Bank of America. The responses by Bank of America, U.S. Trust, the Advisers and Schwab were provided to the Board for their review prior to the January 8, 2007 Board meeting, and the Board was provided with the opportunity to request any additional materials.
At the Board’s meeting on January 8, 2007, Bank of America, U.S. Trust, the Advisers, and Schwab provided additional written and oral information on the Sale and the impact of the Sale on the Advisers and the Funds and their shareholders. During the meeting, representatives from Bank of America and the Advisers, who were present at the meeting, assured the Board that Bank of America does not anticipate that there will be any reduction in the scope of, or material adverse change in the nature or quality of, the investment advisory services to the Funds under the New Advisory Agreements. Additionally, representatives from Bank of America, and the Advisers represented to the Board that Bank of America personnel would seek to provide the same or better quality of services with respect to the administration services currently provided by USTA. It was noted that a plan for the orderly transition of the administration and oversight of the Funds had been developed to ensure that there would be no disruption of Fund operations or other adverse consequences to the Funds and their shareholders. In addition, Bank of America provided, and the Board discussed, information regarding the potential applicability of certain regulatory orders relating to the Columbia Funds and the legacy Nations Funds.
The Board then deliberated on the approval of the New Advisory Agreements in light of all the information it had received. The Independent Directors, assisted by their independent legal counsel, met in executive session to discuss the New Advisory Agreements. After deliberating in executive session, the entire Board reconvened to discuss the approval of the New Advisory Agreements.
At the conclusion of the January 8, 2007 Board meeting, the Board, including all of the Independent Directors, unanimously concluded (a) that the approval of the New Advisory Agreements would be in the best interests of the shareholders and the Funds and (b) to recommend the approval of the New Advisory Agreements to shareholders. In concluding to approve the New Advisory Agreements and to recommend their approval to shareholders, the Board considered, with the assistance of independent legal counsel, the information and materials provided to the Board and a variety of specific factors discussed at the meetings, including, as discussed below, the Board’s prior conclusions when determining whether to approve the continuation of the Current Advisory Agreements.
41
APPROVAL OF INVESTMENT ADVISORY AGREEMENTS (Continued)
At the January 8, 2007 Board meeting, the Board concluded it was reasonable to take into account the conclusions the Board made when considering and evaluating the renewal of the Current Advisory Agreements (the “Annual Review”), which occurred at the September 29, 2006 in-person Board meeting, as part of its considerations to approve the New Advisory Agreements. The Board’s conclusion in this regard was based on (i) the fact that the New Advisory Agreements are identical to the Current Advisory Agreements in all material respects, including the investment advisory fees payable by the Funds to the Advisers and (ii) assurances by Bank of America and the Advisers that there would be no reduction or material adverse change in the nature or quality of the investment advisory services to the Funds under the New Advisory Agreements.
In addition to the conclusions formed with respect to the Annual Review, the Board considered specific information at the January 8, 2007 Board meeting concerning the Sale and its impact on the Advisers and the Funds and their shareholders, as they considered appropriate, including but not limited to the following:
| | • | | a detailed timeline and plan for the orderly transition of the administration and oversight of the Funds; |
| | • | | assurances by Bank of America and the Advisers that Bank of America does not anticipate that there will be any reduction in the scope of, or material adverse change in the nature or quality of, the investment advisory services to the Funds under the New Advisory Agreements; |
| | • | | an explanation of the extent to which key personnel of the Advisers who manage the day-to-day investment operations of the Funds are expected to continue to be employed by the Advisers after the Sale; |
| | • | | the experience and qualifications of new key administrative, financial, compliance and legal personnel that Bank of America proposes to involve in Fund matters; |
| | • | | the enhanced compliance policies and procedures adopted by Bank of America in response to mutual fund regulatory and compliance issues; |
| | • | | the anticipated financial benefits of the Sale to Fund shareholders including (i) access for the Funds to a large distribution network both on the retail, institutional and retirement platforms, as well as to Bank of America’s Private Bank and Wealth Management areas; (ii) the potential for a positive impact on Fund operating expenses resulting from an increase in assets; and (iii) the potential for significant negotiating power in any future vendor discussions resulting from the Funds being part of the larger Bank of America fund complex; |
| | • | | a representation from the Advisers and Bank of America that neither the Companies nor their shareholders would bear any costs of the Meeting or the costs of any solicitation in connection with the Meeting; |
| | • | | a representation from Bank of America that Bank of America would extend the Advisers’ commitments under the Expense Limitation Agreements currently in place with the Funds for a period of two years following the closing of the Sale, subject to the Board’s prior approval of any changes to those Expense Limitation Agreements; |
| | • | | a discussion of the anticipated structural changes to the Excelsior Funds complex and a representation from Bank of America that the class structure of the Excelsior Funds was currently being evaluated by its product teams and that the results of that analysis would be presented to the Board for consideration at a future meeting; |
42
APPROVAL OF INVESTMENT ADVISORY AGREEMENTS (Continued)
| | • | | the policies and procedures adopted by Bank of America that are intended to identify, monitor and mitigate any conflicts of interest between the other business interests of Bank of America and its affiliates and the operations of the Funds; and |
| | • | | a representation from U.S. Trust and Schwab that no material adverse impact on the Funds’ investment operations is expected as a result of the Funds being affiliated with Bank of America. |
The Board concluded, within the context of its full deliberations, that each of the representations, assurances and informational items provided by the Advisers, U.S. Trust, Bank of America and Schwab set forth above supported the approval of the New Advisory Agreements.
In the course of their deliberations, the Board did not identify any particular information or factor that was all-important or controlling. Based on its evaluation of the information and the conclusions with respect thereto at its meetings on September 29, 2006, December 6-7, 2006 and January 8, 2007, the Board, including all of the Independent Directors, unanimously: (a) concluded that the terms of the New Advisory Agreements are fair and reasonable; (b) concluded that the Advisers’ fees are reasonable in light of the services to be provided by the Advisers to the Companies; (c) concluded that the approval of the New Advisory Agreements would be in the best interests of the shareholders and the Funds; and (d) concluded to recommend the approval of the New Advisory Agreements to shareholders.
43
Directors/Trustees and Officers (Unaudited)
The tables below provide information pertaining to the Directors/Trustees and Officers of the Companies. The mailing address for each Director/Trustee Excelsior Funds, 101 Montgomery Street, San Francisco, CA 94104.
| | | | | | | | | | |
Name and
Year of Birth | | Position(s) Held
with the
Company(1) | | Term of
Office(2) and
Length of Time
Served | | Principal Occupation(s)
During Past Five Years | | Number of
Funds in the
Fund Complex
Overseen by
Board Member | | Other
Directorships
Held by Board Member(6) |
| INDEPENDENT DIRECTORS/TRUSTEES | | | | | | |
Rodman L. Drake
Year of Birth: 1943 | | Director/Trustee; Chairman, Full Board | | Trustee of Excelsior Funds Trust since 1994; Director of Excelsior Funds, Inc. and Excelsior Tax Exempt Funds Inc. since 1996 | | Co-Founder of Baringo Capital LLC (since 2002); President, Continuation Investments Group, Inc. (1997 to 2001). | | 38(3) | | BOARD 1 — Director and Chairman, Hyperion Total Return Fund, Inc. and Hyperion Strategic Mortgage Fund Inc. (since 1991). BOARD 2 — Director, Jackson Hewitt Tax Service Inc. (since June 2004). BOARD 3 — Director, Student Loan Corporation (since May 2005). BOARD 4 — Celgene Corporation (since April 2006). |
| | | | | |
Morrill Melton Hall, Jr.
Year of Birth: 1944 | | Director/Trustee; Chairman, Investment Oversight Committee | | Director/Trustee of each Company since 2000 | | Chairman (since 1984) and Chief Executive Officer (since 1991), Comprehensive Health Services, Inc. (health care management and administration). | | 38(3) | | None. |
| | | | | |
Jonathan Piel
Year of Birth: 1938 | | Director/Trustee | | Trustee of Excelsior Funds Trust since 1994; Director of Excelsior Funds, Inc. and Excelsior Tax Exempt Funds Inc. since 1996 | | Cable television producer and website designer; Editor, Scientific American (1984-1986), and Vice President, Scientific American Inc., (1986-1994); Director, National Institute of Social Sciences; Member Advisory Board, The Stone Age Institute, Bloomington, Indiana. | | 38(3) | | None. |
| | | | | |
John D. Collins
Year of Birth: 1938 | | Director/Trustee; Chairman, Audit and Compliance Committee | | Director/Trustee of each Company since 2005 | | Retired. Consultant, KPMG, LLP (July 1999 to June 2000); Partner, KPMG, LLP (March 1962 to June 1999). | | 38(3) | | BOARD 1 — Director, Mrs. Fields Famous Brands LLC (consumer products) (since December 2004). |
44
| | | | | | | | | | |
Name and
Year of Birth | | Position(s) Held
with the
Company(1) | | Term of
Office(2) and
Length of Time
Served | | Principal Occupation(s)
During Past Five Years | | Number of
Funds in the
Fund Complex
Overseen by
Board Member | | Other
Directorships
Held by Board Member(6) |
Mariann Byerwalter
Year of Birth: 1960 | | Director/Trustee; Chairman, Marketing, Distribution and Shareholder Services Committee | | Director/Trustee of each Company since 2006 | | Chairman of JDN Corporate Advisory LLC (1996 to 2001); Vice President for Business Affairs and Chief Financial Officer of Stanford University (1996-2001); Special Adviser to the President of Stanford University (2001). | | 95(4) | | BOARD 1 — Director, Redwood Trust, Inc. (mortgage finance). BOARD 2 — Director, PMI Group, Inc. (mortgage insurance). |
| | | | | |
Nils H. Hakansson
Year of Birth: 1937 | | Director/Trustee | | Director/Trustee of each Company since 2006 | | Sylvan C. Coleman Professor of Finance and Accounting, Emeritus, Haas School of Business University of California, Berkeley (since 2003); Sylvan C. Coleman Professor of Finance and Accounting, Haas School of Business, University of California, Berkeley (July 1977 to January 2003). | | 38(3) | | None. |
| | | | | |
William A. Hasler
Year of Birth: 1941 | | Director/Trustee; Chairman, Governance Committee | | Director/Trustee of each Company since 2006 | | Retired. Dean Emeritus of the Haas School of Business at the University of California, Berkeley; until February 2004, Co-Chief Executive Officer, Aphton Corporation (bio-pharmaceuticals). | | 95(4) | | BOARD 1 — Director, Aphton Corporation.
BOARD 2 — Director, Mission West Properties (commercial real estate). BOARD 3 — Director, TOUSA (home building). BOARD 4 — Director, Harris- Stratex Networks (a network equipment corporation). BOARD 5 — Director, Genitope Corp. (bio-pharmaceuticals). BOARD 6 — Director, Solectron Corporation where he is also Non-Executive Chairman (manufacturing). BOARD 7 — Director, Ditech Communications Corporation (voice communications technology). |
45
| | | | | | | | | | |
Name and
Year of Birth | | Position(s) Held
with the
Company(1) | | Term of
Office(2) and
Length of Time
Served | | Principal Occupation(s)
During Past Five Years | | Number of
Funds in the
Fund Complex
Overseen by
Board Member | | Other
Directorships
Held by Board Member(6) |
| INTERESTED DIRECTORS/TRUSTEES | | | | | | |
Randall W. Merk(5)
Year of Birth: 1954 | | Director/Trustee | | Director/Trustee of each Company since 2006 | | Executive Vice President, Charles Schwab & Co., Inc. (2002-present); President, Schwab Financial Product, Charles Schwab & Co., Inc. (2002-present); Director, Charles Schwab Asset Management (Ireland) Limited; Charles Schwab Worldwide Funds PLC; Director, Charles Schwab Bank N.A. (since 2006). Prior to September 2002, President and Chief Investment Officer, American Century Investment Management, and Director, American Century Companies, Inc.; Until June 2001, Chief Investment Officer — Fixed Income, American Century Companies, Inc. | | 95(4) | | None. |
46
| | | | | | |
Name, Address and Year of Birth | | Position(s) Held
with the
Company(1) | | Term of
Office(2) and
Length of Time
Served | | Principal Occupation(s)
During Past Five Years |
| OFFICERS | | | | | | |
Evelyn Dilsaver
101 Montgomery St.
San Francisco, CA 94104
Year of Birth: 1955 | | President | | Since
February
2006 | | President and Chief Executive Officer. Laudus Variable Insurance Trust. Laudus Trust. The Charles Schwab Family of Funds. Schwab Investments. Schwab Annuity Portfolios and Schwab Capital Trust: President. Chief Executive Officer, and Director. Charles Schwab Investment Management. Inc. President. UST Advisers. Inc.’s Mutual Fund Division since March 2006. From June 2003 to July 2004. Senior Vice President. Asset Management Products and Services Enterprise. Charles Schwab & Co. Inc. Prior to June 2003. Executive Vice President. Chief Financial Officer and Chief Administrative Officer. U.S. Trust, a subsidiary of The Charles Schwab Corporation. |
| | | |
Leo Grohowski
114 West 47th Street
New York, NY 10036
Year of Birth: 1958 | | Vice President | | Since
February
2006 | | Executive Vice President and Chief Investment Officer, U.S. Trust (October 2005 to present); Chief Investment Officer, Deutsche Asset Management Americas and Scudder Investments (2002-2005); and Chief Investment Officer, Deutsche Bank Private Banking (1999-2002). |
| | | |
Mary Martinez
114 West 47th Street
New York, NY 10036
Year of Birth: 1960 | | Vice President | | Since
February
2006 | | Managing Director of United States Trust Company, National Association (since 2003) and Chief Operating Officer of Asset Management (since December 2005) and Chief Executive Officer of National Private Banking (October 2004 to December 2005); Managing Director and Director of Relationship Management Service, Marketing, Information and Technology at Bessemer Trust (1998 to 2003). |
| | | |
Catherine MacGregor
101 Montgomery St.
San Francisco, CA 94104
Year of Birth: 1964 | | Vice President | | Since
September
2006 | | Vice President, Charles Schwab & Co., Inc. and Charles Schwab Investment Management, Inc. (since July 2005); Chief Counsel, Laudus Variable Insurance Trust and Laudus Trust (since September 2006); Chief Legal Officer, Vice President, Laudus Variable Insurance Trust and Laudus Trust (since March 2007); Vice President, The Charles Schwab Family of Funds, Schwab Investments, Schwab Capital Trust and Schwab Annuity Portfolios; Senior Associate, Paul Hastings Janofsky & Walker LLP (1999 to July 2005). |
| | | |
Joseph Trainor, CFA
114 West 47th Street
New York, NY 10036
Year of Birth: 1961 | | Vice President | | Since
February
2004 | | Managing Director of United States Trust Company, National Association (since 2003) and President, U.S. Trust Institutional; President of MFS Institutional Advisors (1998 to 2002). |
| | | |
George Pereira
101 Montgomery St.
San Francisco, CA 94104
Year of Birth: 1964 | | Treasurer/Chief Financial and Chief Accounting Officer | | Since
December
2005 | | Chief Financial Officer, Laudus Variable Insurance Trust, Laudus Trust, The Charles Schwab Family of Funds, Schwab Investments, Schwab Annuity Portfolios and Schwab Capital Trust; Senior Vice President and Chief Financial Officer, Charles Schwab Investment Management, Inc.; Director, Charles Schwab Asset Management (Ireland) Limited; Sr. Vice President, Financial Reporting, Charles Schwab & Co., Inc. (December 1999 to November 2004); Chief Financial Officer, UST Advisers, Inc.’s Mutual Fund Division (since March 2006). |
47
| | | | | | |
Name, Address and Year of Birth | | Position(s) Held
with the
Company(1) | | Term of
Office(2) and
Length of Time
Served | | Principal Occupation(s)
During Past Five Years |
Randall Fillmore
101 Montgomery St.
San Francisco, CA 94104
Year of Birth: 1960 | | Chief Compliance Officer | | Since
June
2006 | | Senior Vice President, Institutional Compliance and Chief Compliance Officer, Charles Schwab Investment Management, Inc. Chief Compliance Officer, The Charles Schwab Family of Funds, Schwab Investments, Schwab Capital Trust and Schwab Annuity Portfolios, Laudus Trust and Laudus Variable Insurance Trust; Vice President, Charles Schwab & Co., Inc., and Charles Schwab Investment Management, Inc. (2002-2003); Vice President, Internal Audit, Charles Schwab and Co., Inc. (2000-2002). |
| | | |
Wyndham Clark
225 High Ridge Road
Stamford, CT 06905
Year of Birth: 1958 | | Anti-Money Laundering Officer | | Since
May
2004 | | Vice President and AML Officer, UST Advisers, Inc. (since 2003); Vice President and Deputy Director Risk Management, IBJ Whitehall (banking) (2001 to 2002); Vice President and Chief Risk Officer, EMAC, LLC (commercial lender, asset backed security issuer) (1999 to 2001). |
| | | |
Koji E. Felton
101 Montgomery St.
San Francisco, CA 94104
Year of Birth: 1961 | | Secretary and Chief Legal Officer | | Since
June
2006 | | Secretary and Chief Legal Officer, The Charles Schwab Family of Funds, Schwab Investments, Schwab Capital Trust and Schwab Annuity Portfolios; Senior Vice President, Chief Counsel and Corporate Secretary, Charles Schwab Investment Management, Inc.; Senior Vice President and Deputy General Counsel, Charles Schwab & Co., Inc. Prior to June 1998, Branch Chief in Enforcement at U.S. Securities and Exchange Commission in San Francisco. |
| (1) | Each Director/Trustee serves in the same capacity as described above for each registered investment company included in the Excelsior Funds family (Excelsior Funds Inc., Excelsior Tax-Exempt Funds, Inc. and Excelsior Funds Trust) (together, the “Excelsior Funds Family”) and the Laudus Funds family (Laudus Trust and Laudus Variable Insurance Trust) (together, the “Laudus Funds Family”). Each officer serves in the same capacity as described above for each registered investment company included in the Excelsior Funds Family. |
(2) | Each Director/Trustee shall hold office until the election and qualification of his or her successor, or until he or she dies, resigns or is removed. The Excelsior Funds retirement policy requires that Independent Directors/Trustees retire no later than December 31st of the year during which he or she reaches 72 years of age. The officers of each Company hold office for a one-year term and until their respective successors are chosen and qualified, or, in each case, until he or she sooner dies, resigns, is removed, or becomes disqualified in accordance with the Company’s by-laws. |
| (3) | This number includes all registered investment companies included in the Excelsior Funds Family and the Laudus Funds Family, each of which is part of the Schwab Mutual Fund Family (as defined below). As of March 31, 2007, the Excelsior Funds Family and the Laudus Funds Family, in the aggregate, consisted of 38 funds. As of March 31, 2007, the Excelsior Funds Family consisted of 27 funds. |
| (4) | This number includes all registered investment companies included in the Schwab Mutual Fund family (Excelsior Funds, Inc., Excelsior Tax-Exempt Funds Inc., Excelsior Funds Trust, Laudus Trust, Laudus Variable Insurance Trust, The Charles Schwab Family of Funds, Schwab Investments, Schwab Annuity Portfolios and Schwab Capital Trust) (together, the “Schwab Mutual Fund Family”). As of March 31, 2007, the Schwab Mutual Fund Family consisted of 95 funds. |
| (5) | Mr. Merk is considered an “interested person” of the Companies (as defined in the 1940 Act) because of his affiliation with the Companies’ Advisers. |
| (6) | This column includes only directorships of companies required to report to the SEC under the Securities Exchange Act of 1934 (i.e., public companies) or other investment companies registered under the 1940 Act that are not part of the Schwab Mutual Fund Family. |
48
DISCLOSURE OF FUND EXPENSES (Unaudited)
We believe it is important for you to understand the impact of fees regarding your investment. As a shareholder of the fund, you incur ongoing, or operating costs, which include costs for portfolio management, administrative services, and shareholder reports (like this one), among others. Operating expenses, which are deducted from a fund’s gross income, directly reduce the investment return of the fund. A fund’s expenses are expressed as a percentage of its average net assets. This figure is known as the expense ratio. The following examples are intended to help you understand the ongoing costs (in dollars) of investing in your fund and to compare these costs with those of other mutual funds. The examples are based on an investment of $1,000 made at the beginning of the period shown and held for the entire period.
The table on the following page illustrates your fund’s costs in two ways.
| | • | | Actual expenses. This section provides information about actual account values and actual expenses based on the Funds’ actual return for the period. This section is designed to help you to estimate the actual expenses after fee waivers that you paid over the period. The “Ending Account Value” shown is derived from the fund’s actual return, and the fourth column shows the dollar amount that would have been paid by an investor who started with $1,000 in the fund. You may use the information here, together with the amount you invested, to estimate the expenses that you paid over the period. |
To do so, simply divide your account value by $1,000 (for example, an $8,600 account value divided by $1,000 = 8.6), then multiply the result by the number given for your fund under the heading “Expenses Paid During Period”.
| | • | | Hypothetical expenses. This section provides information about hypothetical account values and hypothetical expenses that would have been incurred by an investor in the Fund based on an assumed rate of return of 5% per year before expenses. This section is designed to help you compare your fund’s costs with those of other mutual funds. It assumes that the fund had a return of 5% before expenses during the year, but that the expense ratio is unchanged. In this case, because the return used is not the fund’s actual return, the results cannot be used to estimate the actual ending account balance or expenses you paid for the period. You may use this information to compare the ongoing costs of investing in your Fund and other funds. To do so, compare this 5% hypothetical example with the 5% hypothetical examples that appear in shareholder reports of other funds. |
49
DISCLOSURE OF FUND EXPENSES (Continued)
Please note that the expenses shown in the table are meant to highlight and help you compare ongoing costs only, which are described in the Prospectus. Therefore, the hypothetical example is useful in comparing ongoing costs only, and will not help you determine the relative total costs of owning different funds.
| | | | | | | | | | | | |
| | | Beginning
Account
Value
10/01/2006 | | Ending
Account
Value
03/31/2007 | | Annualized
Expense
Ratios* | | | Expenses
Paid
During
Period** |
| | | | |
Actual Fund Return | | | | | | | | | | | | |
Government Money Fund — Shares | | $ | 1,000.00 | | $ | 1,023.80 | | 0.54 | % | | $ | 2.72 |
Money Fund — Shares | | | 1,000.00 | | | 1,024.20 | | 0.54 | | | | 2.73 |
New York Tax-Exempt Money Fund — Shares | | | 1,000.00 | | | 1,015.00 | | 0.59 | | | | 2.96 |
Tax-Exempt Money Fund — Shares | | | 1,000.00 | | | 1,015.20 | | 0.55 | | | | 2.76 |
Treasury Money Fund — Shares | | | 1,000.00 | | | 1,022.30 | | 0.60 | | | | 3.03 |
| | | | |
Hypothetical 5% Return | | | | | | | | | | | | |
Government Money Fund — Shares | | | 1,000.00 | | | 1,022.24 | | 0.54 | | | | 2.72 |
Money Fund — Shares | | | 1,000.00 | | | 1,022.24 | | 0.54 | | | | 2.72 |
New York Tax-Exempt Money Fund — Shares | | | 1,000.00 | | | 1,021.99 | | 0.59 | | | | 2.97 |
Tax-Exempt Money Fund — Shares | | | 1,000.00 | | | 1,022.19 | | 0.55 | | | | 2.77 |
Treasury Money Fund — Shares | | | 1,000.00 | | | 1,021.94 | | 0.60 | | | | 3.02 |
| * | Annualized expense ratios of certain funds are after fee waivers and expense reimbursements by the investment adviser. Absent such waivers and reimbursements, expenses paid during the period would have been greater. |
| ** | Expenses are equal to the Fund’s annualized expense ratio multiplied by the average account value over the period, multiplied by the number of days in the most recent fiscal half-year (182) then divided by 365. |
50
AR-MM-0307

INSTITUTIONAL SHARES
MONEY FUND
CORE BOND FUND
HIGH YIELD FUND
EQUITY OPPORTUNITIES FUND
LARGE CAP GROWTH FUND
MID CAP VALUEAND RESTRUCTURING FUND
VALUEAND RESTRUCTURING FUND
EMERGING MARKETS FUND
INTERNATIONAL EQUITY FUND
ANNUAL REPORT
March 31, 2007
TABLE OF CONTENTS
This report must be preceded or accompanied by a current prospectus.
You should consider the Funds’ investment objectives, risks and expenses carefully before you invest. Information about these and other important subjects is in the Funds’ prospectus, which you should read carefully before investing.
Nothing in this report represents a recommendation of a security by the investment adviser. Manager views and portfolio holdings may have changed since the report date.
Investments in equity securities are subject to sudden and unpredictable drops in value and periods of lackluster performance.
Funds which concentrate their investments in one economic sector or in a geographical region may expose an investor to greater volatility. When used as part of a broader investment portfolio, these funds
may serve to reduce overall portfolio volatility. Currency fluctuations, differences in security regulation, accounting standards, and foreign taxation regulation are among the risks associated with foreign investing as well as political risk—investing in emerging markets may accentuate these risks.
Small cap stocks may be less liquid and subject to greater price volatility.
Value based investments are subject to the risk that the broad market may not recognize their intrinsic value.
Investments in fixed income securities are subject to interest rate risks. The principal value of a bond falls when interest rates rise and rise when interest rates fall. During periods of rising interest rates, the value of a bond investment is at greater risk than during periods of stable or falling rates.
A description of the policies and procedures that Excelsior Funds use to determine how to vote proxies relating to portfolio securities, as well as information relating to how a Fund voted proxies relating to portfolio securities during the most recent 12-month period ended June 30, is available (i) without charge, upon request, by calling (800) 881-9358, and (ii) on the Commission’s website at http://www.sec.gov.
Excelsior Funds file their June 30 and December 31 schedule of portfolio holdings with the Securities and Exchange Commission, on Form N-Q, within sixty days after the applicable reporting period. Excelsior Funds Form N-Q is available on the Commission’s website at http://www.sec.gov, and may be reviewed and copied at the Commission’s Public Reference Room in Washington, DC. Information on the operation of the Public Reference Room may be obtained by calling (800)-SEC-0330.
Excelsior Funds Trust and Excelsior Funds, Inc. are distributed by BISYS Fund Services Limited Partnership.
A schedule of each Fund’s portfolio holdings, as of the end of the prior month, is also available on the Funds’ website at www.excelsiorfunds.com. This schedule is updated monthly, typically by the 15th calendar day, after the end of each month. The Funds may terminate or modify this policy at anytime.
Notice About Duplicate Mailings
The Excelsior Funds have adopted a policy that allows the Funds to send only one copy of a Fund’s prospectus and annual and semi-annual reports to certain shareholders residing at the same “household.” This reduces Fund expenses, which benefits you and other shareholders. If you do not want your mailings to be “householded,” please call (800) 542-1061 or contact your financial intermediary.
SHARES OF THE FUNDS ARE NOT DEPOSITS OR OBLIGATIONS OF, OR GUARANTEED OR ENDORSED BY, ANY BANK, AND THE SHARES ARE NOT FEDERALLY INSURED BY THE FEDERAL DEPOSIT INSURANCE CORPORATION, BANK INSURANCE FUND, FEDERAL RESERVE BOARD, OR ANY OTHER GOVERNMENTAL AGENCY. FUND SHARES ARE NOT INSURED OR GUARANTEED BY THE U.S. GOVERNMENT. AN INVESTMENT IN A FUND IS SUBJECT TO RISK OF PRINCIPAL. ALTHOUGH THE MONEY FUND SEEKS TO PRESERVE THE VALUE OF YOUR INVESTMENT AT $1.00 PER SHARE, IT IS POSSIBLE TO LOSE MONEY BY INVESTING IN THE MONEY FUND.
LETTER TO SHAREHOLDERS
March 31, 2007
Dear Valued Excelsior Fund Shareholder,
I am pleased to bring you the annual report for the year ended March 31, 2007 for the Excelsior Funds. The funds in this report are part of the Excelsior Fund family which has over $20 billion in assets as of the end of the reporting period and includes a wide array of asset classes and investment strategies designed to meet the individual investor’s investment needs.
By now, you have received notification that on November 20, 2006, The Charles Schwab Corporation (“Schwab”) announced an agreement to sell the U.S. Trust Corporation (“U.S. Trust”), a wholly-owned subsidiary of Schwab, to the Bank of America Corporation (“Bank of America”) (the “Sale”). The Sale involves all of U.S. Trust’s subsidiaries, including the Excelsior Funds’ investment advisers, UST Advisers, Inc. (“USTA”) and United States Trust Company National Association, on behalf of its asset management division, U.S. Trust New York Asset Management (“USTNA”). Consequently, the Excelsior Funds will need to enter into new investment advisory agreements with USTA and USTNA.
At a meeting held on January 8, 2007, the Board approved new investment advisory agreements under which, subject to approval by the Excelsior Funds’ shareholders, USTA and USTNA will continue to serve as investment advisers to the Excelsior Funds after the Sale is completed. At the same meeting, the Board directed that the new investment advisory agreements be submitted to the shareholders of each Fund for approval.
A Special Meeting of Shareholders of Excelsior Funds, Inc., Excelsior Tax-Exempt Funds, Inc and Excelsior Funds Trust and each of their funds was held on March 30, 2007. The number of votes necessary to conduct the Special Meeting and approve the new investment advisory agreements was obtained for each fund except the Value and Restructuring, Energy and Natural Resources and Treasury Money Funds. The Special Meeting for Value and Restructuring, Energy and Natural Resources and Treasury Money Funds was adjourned for the purpose of soliciting additional proxies, and we anticipate that the new investment advisory agreements will be approved by the shareholders of these funds at a subsequent Special Meeting.
The integration of U.S. Trust, Bank of America's private bank and its ultra high net worth extension will create the nation’s largest private wealth management firm with assets under management of over $260 billion and total client assets of almost $420 billion.
We at the Excelsior Funds are excited about our future within Bank of America and remain committed to helping you with your long-term investment goals. Thank you for investing with us.
Sincerely,

Evelyn Dilsaver
President
1
EXCELSIOR FUNDS | EQUITY MARKET REVIEW |
Equity Market Review
After breezing through the end of the Funds’ fourth fiscal quarter, the financial markets generally, and equities in particular—encountered severe headwinds as the Excelsior Funds began their new fiscal year in April of 2006. Emerging markets in particular fell 4.3% in the fiscal first quarter. Non-U.S. equities overall, however, managed to achieve a small gain, thanks to advances in Europe. The U.S. equity market declined during these first three months as well (the S&P 500 Index was down 1.4%, while the Russell 1000 Index declined 1.7%), amidst concerns about the Federal Reserve’s (Fed) tightening policy, inflation, and gradually mounting worries about global growth and a hard landing in the U.S. Small caps were bested by large caps (the Russell 2000 Index was down 5% in the quarter), with small cap growth stocks the weakest-performing market segment. Value outperformed growth no matter the market cap as investors became defensive. In this period, energy, utilities and integrated oils were the best-performing sectors. Technology and health care were the weakest-performing sectors in the period.
Volatility continued unabated through the first part of the summer, until August, when investor appetite for risk returned, and the equity markets rebounded strongly. The long-anticipated Fed pause and a drop in energy prices were among the reasons for the improving environment. For the fiscal second quarter, the S&P 500 Index, for instance, saw a 5.7% advance. Large caps continued their outperformance versus mid- and small-cap stocks, and value continued to best growth, although growth did appear to be gaining a better footing in the period. Among economic sectors, financial services rallied on the Fed pause, while technology, health care and utilities (telecom) sectors all were given a boost by strong M&A activity in the period. Non-U.S. equity markets, paced by Continental Europe, were mostly up in the quarter, although a slightly stronger U.S. dollar had an impact on results. Japanese and emerging markets saw a rebound as well.
The positive conditions continued into the fiscal third quarter, given the Fed’s decision not to raise rates, lower oil prices, and encouraging inflation numbers. For the quarter, the S&P 500 Index achieved a 6.7% gain. While large cap stocks were strong in the period, they did give away their leadership position to small caps. Value continued to outperform growth. On a sector basis, performance across sectors was strong overall, although energy (integrated oils) saw the largest gains; health care saw the smallest advance, given investor concerns over a Democrat-controlled Congress.
The final fiscal quarter (the first calendar quarter of 2007) saw volatility return to the markets with a large sell-off in late February, although most of the world’s equity markets managed to come in basically flat for the three-month period. International markets, led by the developed markets, advanced in the period, and in most cases outpaced the U.S. market.
Outlook
The current market environment is similar to conditions that prevailed at the end of December. At that time, the markets were dealing with excess noise on the health of the economy—related specifically to inflation and slowing growth in the U.S., and how that slowing growth would impact economies around the world. Later, in the first months of the new calendar year, equities saw a sharp correction sparked by weakness in the sub-prime mortgage sector. While leading inflation indicators remained
2
EXCELSIOR FUNDS | EQUITY MARKET REVIEW |
weak, actual inflation had yet to roll over, and concerns were mounting that earnings would come in better than expected. The fear was the Fed would not be able to cut interest rates anytime soon.
Right now, the focus continues on earnings. For our part, we still expect to see some muted earnings growth in 2007 accompanied by a bit of P/E expansion as rates come down. We’re also expecting a re-acceleration of the equity market to occur toward year-end, after we work through what we expect will be a typical summer dry period. Our rationale? Inflation is not much of a concern (which should become increasingly apparent in coming months), economic growth is slowing, and we believe the Fed has ample ammunition to cut interest rates—and is likely to do so in the next several months, thereby averting a growth slowdown becoming a recession.
Equities should, as a result, continue overweight relative to fixed income, even though we believe yields will be lower by year-end. Within equities, we continue to believe non-U.S. growth and valuations are more attractive than they are in the U.S., driven in large part by continued growth in Europe and Japan. European equity markets continue to benefit from huge deal flow. Japan is making its way out of a long slump, and we’re still at the early stages of the adjustment process. Within the U.S., we plan to focus on high-quality cash-generating businesses that provide a decent yield, as well as selective growth stories.
3
EXCELSIOR FUNDS | FIXED INCOME MARKET REVIEW |
Bond Market Review
Yields generally declined across intermediate and longer maturity levels but rose on the front end of the curve over the course of the fiscal year ended March 31, 2007. The Federal Reserve (Fed) increased the target short-term federal funds rate twice in the period (both times in the second quarter of 2006), raising it from 4.75% to 5.25%, which is where it still stands.
The yield curve ended the fiscal year inverted as money-market rates continued to out-yield longer maturity Treasury issues. After remaining flat for the most of the past year, the yield curve steepened towards a more normalized shape from the two-year to 30-year maturity range. In March, the ten-year yield was above the two-year yield, the first time in over six months.
Overall for the fiscal year, bonds earned a solid return of 6.59% as represented by the Lehman Aggregate Index. Investment grade corporate bonds, as represented by the Lehman U.S. Credit Index, returned 7.1% and posted positive excess returns (over duration equivalent Treasuries) of almost 1%. The spread between corporate bond yields and Treasuries remained narrow over the course of the fiscal year, a reflection of continued strong investor demand as corporate default rates hovered near historic lows. A record $1.07 trillion in corporate bonds were issued in 2006, versus $770 billion in 2005, as companies took advantage of relatively low borrowing costs. Commercial mortgage-backed securities (CMBS) was another strong spread sector over the period, generating 0.67% of excess returns. So far in this credit cycle, strong fundamentals and heavy buying by foreign investors have contributed to spread compression.
In the municipal market, low interest rates, narrow intermarket long-term yield spreads, tighter credit spreads and issuer use of swaps and other derivatives for funding purposes combined to create one of the highest-volume years on record. Foreign buyers, seeking to take advantage of spreads between BMA (the Bond Market Association synthetic municipal yield curve) and LIBOR (the London Interbank Offered Rate), were significant municipal market participants. While the municipal curve is flat by historical domestic market standards, it has been steeper than alternative fixed income vehicles; thus, many foreign and domestic buyers leveraged their holdings. For the same reasons, numerous municipal hedge funds were birthed, adding additional buying support to the market.
Outlook
We believe the U.S. economy is in a period of below-trend growth levels. Going forward much will depend on the employment situation, which continues to hold firm. The timing of any lowering of rates by the Fed will be a function of equity market strength and unemployment reports. We do believe that weakness in the economy will eventually cause the yield curve to steepen and rates to fall, especially at the shorter end of the yield curve. History has shown that after a long period of a stable Fed funds rate (such as we have seen in the past nine months), a reversal of policy (in this case, from tightening to easing) carries a very high probability.
Inflation-protected Treasury securities (TIPSs) are close to their breakeven highs over the near-term. Breakevens should remain near these current levels as the Fed continues to take a vigilant stance towards inflation regardless of the market’s view on forward rates. There should be opportunities to add to this sector later in the year at relatively attractive levels should the Fed enter a period of sustained easing.
4
EXCELSIOR FUNDS | FIXED INCOME MARKET REVIEW |
In lower-grade credits, some caution seems appropriate in the high-yield market. We believe high yield spreads will remain range bound over the quarter as economic activity moderates and the housing situation becomes clearer. Despite spreads widening over the quarter, they remain significantly lower than long-term averages. Should a weak economy materialize, default rates will increase faster than currently expected and high yield spreads likely would expand.
In terms of both residential and commercial mortgage backed securities, the tremors from the sub-prime market have been relatively contained so far this year. Prepayment volatility should remain low as MBS refinancing will not meaningfully accelerate unless rates decline substantially at the longer end of the curve. CMBS spreads appear very attractive relative to corporate bonds, offering similar yield with higher credit quality. We favor shorter-maturity adjustable-rate (Hybrid ARM’s) issues as they continue to offer satisfactory return expectations with substantial protection from volatile markets.
In the municipal bond market, as long as the forces of low interest rates, a flat yield curve and tighter spreads persist, we anticipate that the refunding of municipal bonds will continue and may put pressure on secondary market profits, particularly in the long end of the market. Should profitability of leveraged tender option bond programs continue to compress, forcing the sale of securities, the long end could come under even greater pressure. Our current view is to maintain a shorter duration profile than the index, with overweightings concentrated on the front end of the yield curve.
5
EXCELSIOR FUNDS, INC. | CORE BOND FUND |
Performance Summary
The Excelsior Core Bond Fund underperformed the Lehman Brothers Aggregate Bond Index for the Fund’s fiscal year ending March 31, 2007.
Yields generally declined across intermediate and longer maturity levels but rose on the front end of the curve over the course of the fiscal year. The Fed increased the target short-term federal funds rate twice in the period, bringing it to 5.25% from 4.75%. Both rate hikes occurred in the second calendar quarter of 2006, and the Fed has left its target short-term interest rate unchanged since that time.
The yield curve ended the fiscal year inverted as money-market rates continue to out-yield longer-maturity Treasury issues. After remaining flat for most of the past year, the yield curve steepened towards a more normalized shape from the two-year to 30-year maturity range. In March, the ten-year yield was above the two-year yield—the first time that’s happened in more than six months.
Overall for the fiscal year, bonds earned a solid return of 6.59% as represented by the Lehman Brothers Aggregate Bond Index. Investment-grade corporate bonds, as represented by the Lehman U.S. Credit Index, returned 7.1% and posted positive excess returns (over duration-equivalent Treasuries) of almost 1%. The spread between corporate bond yields and Treasuries remained narrow throughout the year, a reflection of continued strong investor demand as corporate default rates hovered near historic lows. A record $1.07 trillion in corporate bonds were issued in 2006, compared with $770 billion in 2005 as companies took advantage of relatively low borrowing costs. The commercial mortgage-backed securities (CMBS) sector was also strong in the period, generating 0.67% of excess returns. So far in this credit cycle, strong fundamentals and heavy buying by foreign investors have contributed to spread compression.
Performance Attribution and Portfolio Positioning
Within sectors, the decision to overweight commercial mortgage backed securities proved beneficial as the sector generated strong excess returns in the period. Furthermore, allocation and selection in residential mortgages added to returns, specifically in floating-rate, shorter-maturity issues. Conversely, while the underweight allocation to investment-grade credit detracted from results; issue selection within this sector and exposure to select high yield issues helped results during the year.
We continue to hold overweight positions in mortgages to maintain portfolio yield levels and a high credit quality relative to the benchmark. Portfolios are generally underweight in Treasury and Agency securities. Our strategy has been to underweight the agency and corporate bonds favored by the foreign buyers and find better values in commercial mortgages (CMBS) and residential adjustable-rate mortgages.
During the fiscal year, the Fund’s duration and curve positioning were additive to results. The Fund typically maintained a narrow duration band around the benchmark, yet its tactical moves (longer than benchmark for the second half of 2006) were additive to results. The Fund has been positioned for an eventual steepening of the Treasury yield curve. This positioning has not hurt returns and should be rewarded in the coming months.
6
EXCELSIOR FUNDS, INC. | CORE BOND FUND |
The Fund ended the fiscal year positioned slightly shorter duration than the benchmark from a tactical perspective. We expect an end to Fed rate hikes, and ultimately a move to lower market rates, which would warrant moving the Fund to a slightly longer-than-benchmark duration position later in the year. Fund positions have been migrated to better capitalize on our expectation of lower yields and a steepening yield curve. We have made no major changes to our overall allocation in the credit sector, although we have actively eliminated select issuers in the auto sector and added to positions in the consumer sector. Throughout the year, the Fund maintained a minimum allocation to securities rated less than single-A, choosing to emphasize higher-quality issues.
The portfolio yield exceeded that of the benchmark over the course of the year.
Outlook
We believe the U.S. economy is in a period of below-trend growth. Going forward, much will depend on the employment situation, which continues to hold firm. The timing of any lowering of rates by the Fed will be a function of equity market strength and unemployment reports. We do believe that weakness in the economy will eventually cause the yield curve to steepen and rates to fall, especially at the shorter end of the yield curve. History has shown that after a long period of a stable federal funds rate (such as the past nine months), a reversal of policy (in this case, from tightening to easing) carries a high probability.
From a duration standpoint, the Fund is positioned slightly short-duration from its benchmark on a tactical basis due to favorable seasonal patterns. We are positioned for further spread widening and yield-curve steepening in response to the more volatile equity markets and slower economic growth. We have positioned the Fund for a more normally sloped yield curve, which we believe offers the potential for significant reward.
Inflation-protected Treasury securities (TIPSs) are close to their breakeven highs over the near term. Breakevens should remain near these levels as the Fed continues to take a vigilant stance toward inflation regardless of the market’s view on forward rates. There should be opportunities to add to this sector later in the year at relatively attractive levels should the Fed enter a period of sustained easing.
We remain underweight the credit sector in general; corporate bonds present little value at present spread levels. Even with the widening of spreads in the first quarter (fiscal fourth quarter), we are still near the historic tight levels seen over the past decade. Leveraged buyouts and shareholder enhancement activities remain threats for corporate bonds. With event risk already high, the environment could worsen given a sell-off in equities as private equity groups should inevitably increase LBO-related activities.
In lower-grade credits, some caution seems appropriate in the high-yield market, although we do believe it’s prudent to maintain a minimal allocation. We believe high yield spreads will remain range bound over the quarter as economic activity moderates and the housing situation becomes clearer. Despite spreads widening during the first quarter of 2007, they remain significantly lower than long-term averages. Should a weak economy materialize, default rates would increase faster than currently expected and high yield spreads likely would expand.
7
EXCELSIOR FUNDS, INC. | CORE BOND FUND |
The Fund remains overweight in both residential and commercial mortgage backed securities. The tremors from the sub-prime market have been relatively contained so far. Prepayment volatility should remain low as MBS refinancing will not meaningfully accelerate unless rates decline substantially at the longer end of the curve. CMBS spreads appear attractive relative to corporate bonds, offering similar yield with higher credit quality. We continue to concentrate on adding older deals that feature better underwriting standards than are prevalent in the current market. We favor shorter-maturity adjustable-rate (Hybrid ARMs) issues as they continue to offer satisfactory return expectations with substantial protection from volatile markets.
Alexander R. Powers
Managing Director
Portfolio Manager and Head of Fixed
Income Investments
8
EXCELSIOR FUNDS, INC. | CORE BOND FUND |
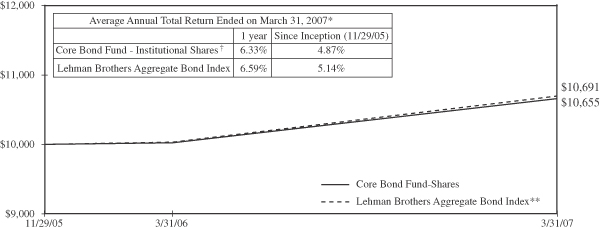
Past performance is not predictive of future performance. Investment returns and principal values will vary and shares may be worth more or less at redemption than their original cost.
The above illustration compares a $10,000 investment made in the Fund and a broad-based index over the past ten fiscal years. The chart assumes all dividends and capital gain distributions are reinvested. The Fund’s performance takes into account fees and expenses. The index does not take into account charges, fees and other expenses. Further information relating to Fund performance is contained in the Financial Highlights section of the Prospectus and elsewhere in this report.
| | | |
| | |
Expense Ratio
(As of 7/31/06) | | Shares | |
Gross Expense Ratio | | 1.22 | % |
Net Expense Ratio | | 0.65 | % |
The expense information in the table reflects contractual fee waivers currently in effect. This information is included in the most current prospectus available to current and prospective shareholders of the Fund. The Adviser has contractually agreed to waive fees or reimburse expenses in order to keep total operating expenses from exceeding 0.65%. The waiver agreement may not be terminated before July 31, 2007. In addition, this agreement will renew automatically for an additional 12 month term unless the Adviser terminates the agreement by providing written notice to the Fund prior to the expiration of the current term.
| * | | Total return represents the change during the period in a hypothetical account with dividends reinvested. |
| ** | | Source: Lehman Brothers—the Lehman Brothers Aggregate Bond Index is an unmanaged, fixed income, market value-weighted index that includes treasury issues, agency issues, corporate bond issues and mortgage-backed securities. |
| † | | Currently certain fees are waived. Had such fees not been waived, returns would have been lower. Returns do not reflect the deduction of taxes that a shareholder would pay on Fund distributions or the redemption of shares. |
9
EXCELSIOR FUNDS TRUST | HIGH YIELD FUND |
Performance Summary
For the year ended March 31, 2007, the Merrill Lynch High Yield, Cash Pay Index returned almost 12%, with each quarter generating a positive return. Lower-rated credits (CCC and below) significantly outperformed, generating an 18% return for the year; BB-rated debt lagged modestly, returning about 10%. Declining interest rates, particularly in the September quarter, and stable equity markets from August through February were significant contributors to strong performance in high yield. Over the year, the spread of high yield versus U.S. Treasuries declined modestly, with a sharp contraction beginning in September, ending the year at 3.20%. That level is well below the longer term average of 4.75%. Default rates, a key driver of high yield spreads, declined from 2.8% to 1.6% during the year, to near record lows. The best performing sectors during the year were entertainment, automotive, retail, airlines, and cable TV. Rails, gaming, leisure, aerospace, and energy were the weakest performers. Every category generated a positive return for the year. New issue supply was $163 billion. Rating upgrades versus downgrades were fairly constant and slightly positive during the year.
Performance Attribution and Portfolio Positioning
For the fiscal year, the Excelsior High Yield Fund outperformed the Merrill Lynch High Yield, Cash Pay Index. Based on industry categories, the Fund was overweight some underperforming groups; but individual security selection, primarily low single B-rated and CCC-rated issuers in retail and telecom in particular, outperformed their industry categories and the Index. About 1.30% of the Fund’s performance was generated by Ormet Aluminum, a company that emerged from bankruptcy in April 2005; the Fund has held this name for several years. Several developments related to this holding in the 3rd and 4th calendar quarters of 2006 contributed importantly to the outperformance of this name. First, a significant distribution of common equity to original creditors (which included the Fund) was made. Second, a successful rights offering and a 10:1 stock split substantially enhanced the enterprise and per share value of Ormet. The Fund pared its holding in this name when the position grew to over 5% of the Fund as the valuation increased. The objective was to take some profits and moderate Fund volatility. At the end of the year, the holding was reduced to about 3%. We continue to believe there is significant potential upside in this name although probably not before the 3rd calendar quarter of this year.
Outlook
In spite of the current low spread versus U.S. Treasuries and the slowing economy, we remain moderately constructive on the high yield asset class. Over several decades, high yield spreads have tracked closely with default rates, with periods of divergence infrequent and short lived. For a number of recent months, high yield spreads have significantly exceeded default rates. We believe this is due to investor concern that default rates may rise sharply as a consequence of a slowing economy and the result of the recent sharp increase in low-rated debt (historically a precursor of rising defaults). Default rates over the last twelve months currently are near record low levels. We believe that the enormous refinancing of debt maturities at low interest rates that has occurred over the last several years will mitigate the negative effects of slow economic growth, particularly if the economy accelerates in the 2nd half of this year. High yield default rates projected out 12 months by Moody’s and S & P have continued to moderate and now are at levels that remain well below longer term averages. Current high yield spread levels are comparable to projected defaults a year from now. We believe actual defaults likely will fall below current estimates and thereby rationalize or even reduce current spreads. This assumes a modest and temporary economic slowdown. However, until investors become more confident that default rates will not increase sharply, a more cautious approach to high yield is appropriate.
A.K. Rodgers Ratcliffe, CFA
Senior Vice President and Senior Portfolio Manager
Adam Moss
Senior Vice President and Senior Portfolio Manager
10
EXCELSIOR FUNDS TRUST | HIGH YIELD FUND |
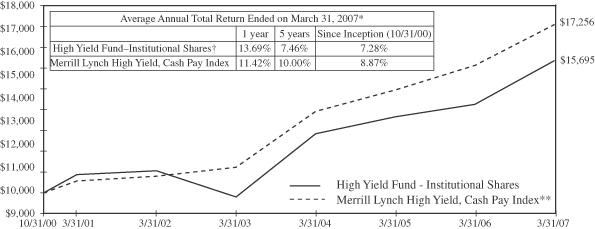
Past performance is not predictive of future performance. Investment returns and principal values will vary and shares may be worth more or less at redemption than their original cost. Securities rated below investment grade generally entail greater market, credit, and liquidity risks than investment grade securities.
The above illustration compares a $10,000 investment made in the Fund and a broad-based index since 10/31/00 (inception date). The chart assumes all dividends and capital gain distributions are reinvested. The Fund’s performance takes into account fees and expenses. The index does not take into account charges, fees and other expenses. Further information relating to Fund performance is contained in the Financial Highlights section of the Prospectus and elsewhere in this report.
| | | |
| | |
Expense Ratio
(As of 7/31/06) | | Shares | |
Gross Expense Ratio | | 1.04 | % |
Net Expense Ratio | | 0.80 | % |
The expense information in the table reflects contractual fee waivers currently in effect. This information is included in the most current prospectus available to current and prospective shareholders of the Fund. The Adviser has contractually agreed to waive fees or reimburse expenses in order to keep total operating expenses from exceeding 0.80%. The waiver agreement may not be terminated before July 31, 2007. In addition, this agreement will renew automatically for an additional 12 month term unless the Adviser terminates the agreement by providing written notice to the Fund prior to the expiration of the current term.
| * | | Total return represents the change during the period in a hypothetical account with dividends reinvested. |
| ** | | Source: Merrill Lynch—The Merrill Lynch High Yield, Cash Pay Index is an unmanaged index comprised of publicly placed, non-convertible, coupon bearing domestic debt. Issues in the index are less than investment grade as rated by Standard & Poor’s Ratings Group or Moody’s Investors Service, Inc., and must not be in default. Issues have a term to maturity of at least one year. |
| † | | Currently certain fees are waived. Had such fees not been waived, returns would have been lower. Returns do not reflect the deduction of taxes that a shareholder would pay on Fund distributions or the redemption of shares. Returns do not reflect the 2% fee imposed on shares redeemed 30 days or less after their date of purchase. |
11
EXCELSIOR FUNDS TRUST | EQUITY OPPORTUNITIES FUND |
Performance Summary
For the year ended March 31, 2007, the Excelsior Equity Opportunities Fund outperformed the S&P 500 Index. The relative outperformance can largely be attributed to individual stock picking in the industrials and health care sectors, and our sector overweight in materials and utilities. Offsetting this outperformance were individual stocks in the information technology and consumer discretionary sectors.
Performance Attribution
The strongest performers in the fiscal year were concentrated in the industrials and materials sector, led by Quanta, Bombardier, Vulcan, Monsanto, Rolls-Royce and Nucor. Sotheby’s and pharmaceutical company Novo Nordisk were strong performers as were financial firms New York Stock Exchange and American Capital Strategies, and utilities CenterPoint Energy and AES. Underperformers came from the consumer and technology sectors, including technology companies 3Com, Analog Devices and National Instruments; Furniture Brands, Timberland, and Eastman Kodak in the consumer space; and land-owner and developer St. Joe.
Portfolio Activity
Over the past 12 months, the Fund strategy has included a move away from direct exposure to the U.S. consumer and into revenues generated in currencies other than the U.S. dollar. This has been motivated by a concern that the U.S. economy is entering a cyclical slowdown that will translate into a challenging business environment for companies earning revenues in already-weak U.S. dollars. In addition, we continued to build on several themes: the growing impact of biotechnology (as represented by investments including Monsanto, Roche, NovoNordisk and Senomyx); the changing nature and pricing of energy (ExxonMobil, Suncor, AES, El Paso, BorgWarner), and global expansion (Expeditors International, GE, NYSE Group). From an overall investment standpoint, we continue to seek out companies with excellent corporate culture and management or those stocks that are simply cheap.
In keeping with these themes, our additions included stocks with global reach, such as Olam International, the Singapore Exchange, NYSE Group and Expeditors International of Washington; beneficiaries of the changing nature of energy use, including International Rectifier and Borg Warner; and a biotech, Senomyx. Eliminations included companies undergoing significant changes during a time likely to make a successful restructuring difficult, including Eastman Kodak, Analog Devices and Furniture Brands.
Selected Additions:
| • | Olam International (OLAM.SI) is a global supply chain manager of agricultural products and food ingredients. The company directly sources goods from over 40 countries and supplies 3,800 customers in 55 countries. Olam’s business model is unique in that it is integrated from the farm gate to the factory—without owning the underlying production process. Olam has projected earnings CAGR at 25%, giving confidence that there is significant growth ahead as the company expands into new commodities, new geographies and into an acquisitive growth phase. |
12
EXCELSIOR FUNDS TRUST | EQUITY OPPORTUNITIES FUND |
| • | The Singapore Exchange (SGX.SI) is a global capital markets exchange focused on a combination of domestic and foreign stocks and derivative products. The Exchange is an exceptionally well-managed business that is well positioned globally and functions within a regulatory environment closely aligned to business goals. It is led by an innovative and driven management and is growing rapidly in a wide variety of products. The Exchange sits at the fulcrum of several trends in global capital markets. |
| • | Microchip’s corporate culture separates it from its competition and has helped lead the company back from the edge of bankruptcy and into a high-margin, high-efficiency market leader. Microchip’s powerful corporate culture is central to our investment thesis. A good example of this culture is the sales force incentive—people are paid not on commission, but on company-wide metrics. This has led to a more collegial and satisfying relationship with customers, who are in turn measurably more loyal. This kind of company-driven and customer-focused thinking is critical to market gains and to margin growth, in our view. |
| • | RHJ International is the publicly traded investment vehicle of Ripplewood. Among Ripplewood’s best-known transactions are the acquisitions of Japan Telecom, the largest leveraged buyout in Japan, and The Long-Term Credit Bank of Japan, since renamed Shinsei Bank. |
| • | Expeditors International of Washington is a high-quality company in the rapidly growing global freight forwarding and logistics industry. The industry is highly fragmented with no logistics provider having greater than low-single-digit market share. As freight forwarding grows globally and Expeditors takes some share, the company has the opportunity to grow at a rapid pace. Expeditors fits in our portfolio of companies that treat their employees well. Each company office is its own profit center, and there is no limit to how much a manager can earn if successful. The corporate culture has led to low turnover, a distinct advantage in an industry where repeat business is almost entirely relationship-driven. |
Selected Eliminations:
| • | Analog Devices (ADI) was eliminated based on a combination of fundamental and valuation concerns. Specifically, ADI’s power management segment has been underperforming and losing share to more effective competitors; the Digital Signal Processors unit has also been losing share and will likely continue to do so. |
| • | Furniture Brands was eliminated to realize losses and raise funds for new investments. The company has been unable to weather the difficult environment in residential furniture in spite of a three-year long restructuring effort. |
| • | At Eastman Kodak, the speed with which traditional revenues were drying up accelerated and new revenue generation showed signs of coming on slower than projected. |
| • | At the time of elimination from the Fund, AutoZone had not lived up to its potential market-share gains in the commercial space and had been giving up share in its strongest markets. In addition, hoped-for margin growth hadn’t materialized. |
13
EXCELSIOR FUNDS TRUST | EQUITY OPPORTUNITIES FUND |
Outlook
The Equity Opportunities team continues to seek investment opportunities within—but not limited to—the three themes outlined above that fit in our dual strategy of investing in companies with excellent corporate cultures or those that are simply cheap.
Richard Bayles
Managing Director and Senior Portfolio Manager
Fatima Dickey
Managing Director and Portfolio Manager
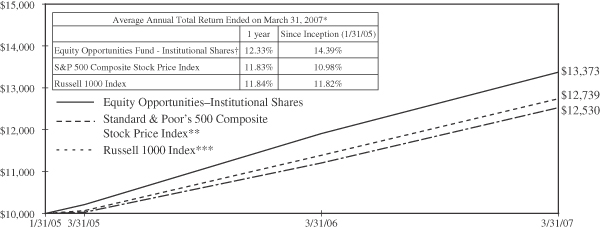
Past performance is not predictive of future performance. Investment returns and principal values will vary and shares may be worth more or less at redemption than their original cost.
The above illustration compares a $10,000 investment made in the Fund and a broad-based index since 1/31/05 (inception date). The chart assumes all dividends and capital gain distributions are reinvested. The Fund’s performance takes into account fees and expenses. The index does not take into account charges, fees and other expenses. Further information relating to Fund performance is contained in the Financial Highlights section of the Prospectus and elsewhere in this report.
| | | |
| | |
Expense Ratio
(As of 7/31/06) | | Shares | |
Gross Expense Ratio | | 1.05 | % |
Net Expense Ratio | | 0.80 | % |
The expense information in the table reflects contractual fee waivers currently in effect. This information is included in the most current prospectus available to current and prospective shareholders of the Fund. The Adviser has contractually agreed to waive fees or reimburse expenses in order to keep total operating expenses from exceeding 0.80%. The waiver agreement may not be terminated before July 31, 2007. In addition, this agreement will renew automatically for an additional 12 month term unless the Adviser terminates the agreement by providing written notice to the Fund prior to the expiration of the current term.
| * | | Total return represents the change during the period in a hypothetical account with dividends reinvested. |
| ** | | Source: Standard & Poor’s Corporation—Reflects the reinvestment of income dividends and, where applicable, capital gain distributions. The Standard & Poor’s 500 Composite Stock Price Index is a widely accepted unmanaged index of U.S. stock market performance. |
| *** | | Source: Frank Russell Company—The Russell 1000 Index measures the performance of the 1,000 largest companies in the Russell 3000 Index, which represents approximately 92% of the total market capitalization of the Russell 3000 Index. The Index includes dividends reinvested. |
| † | | Currently certain fees are waived. Had such fees not been waived, returns would have been lower. Returns do not reflect the deduction of taxes that a shareholder would pay on Fund distributions or the redemption of shares. Returns do not reflect the 2% fee imposed on shares redeemed 30 days or less after their date of purchase. |
14
EXCELSIOR FUNDS, INC. | LARGE CAP GROWTH FUND |
Performance Summary
The Excelsior Large Cap Growth Fund over the year ended March 31, 2007 posted solid results, in line with the Russell 1000 Growth Index. That said, it was a difficult year for growth investors. First, earnings growth for the overall market, originally expected to be mid-single digits a year ago, turned out to be in the mid-teens, which was consistent with the price gain of the broad-market S&P 500 Index and double the long-term average rate of EPS growth. In this type of earnings environment, investors were unwilling to pay a premium for high growth companies. Additionally, technology, which represented one of our largest weights, was beaten down by stock options investigations and concerns about the sustainability of growth. Fortunately, the market has gone a long way towards sorting out the good from the bad regarding stock options.
Performance Attribution
Our stock picking helped overcome the above-mentioned drags and deliver positive absolute and benchmark-relative returns. From a sector perspective, we generated positive returns versus the Russell 1000 Growth Index in technology, health care and telecom stocks. Conversely, our picks in the industrial, financial and consumer discretionary sectors hurt. Also, the lack of exposure to materials, utilities and consumer staples was a modest drag. On an individual stock basis, our top five positive contributors in the past year were Research in Motion, Apple Inc., Coach, America Movil and Akamai Technologies. On the flip side, Amgen, Corporate Executive Board, Broadcom, Sallie Mae and eBay were the most significant negative contributors.
Portfolio Activity
We made several company changes to the Excelsior Large Cap Growth Fund in the past year, with eight new additions and ten deletions. We eliminated positions in Carnival Cruise, Dell, Patterson Companies, PetSmart, Wellpoint, Medtronic, SAP, Caremark, Teva Pharmaceuticals and Yahoo. We initiated positions in Akamai, Allergan, Corning, Best Buy, Corporate Executive Board, Intuitive Surgical, Adobe Systems and Las Vegas Sands. We expect these additions to generate EPS growth of 25%, on average, over the next 12 to 18 months, thereby providing attractive total return opportunities. Here are some brief business descriptions of these new additions.
Akamai (AKAM) is the leading provider of content and application delivery services that speed up how content is distributed over the internet, thus enabling organizations to expand and optimize their online content, applications, and business processes better without the required IT investment that would otherwise be necessary to support this growth.
Allergan (AGN) is a global specialty pharmaceutical and medical device company targeting the ophthalmology, neuroscience, medical dermatology and medical aesthetics markets. AGN’s future growth should come from its three core franchises—Ophthalmology, Neurology (Botox) and Aesthetics.
Corning (GLW) is a global technology company with operations in four business segments: Display Technologies, Telecommunications, Environmental Technologies and Life Sciences. GLW stands to benefit from several trends: increased LCD TV penetration, demand for notebook displays and flat-screen monitors, increased fiber deployments, and emissions control regulations.
15
EXCELSIOR FUNDS, INC. | LARGE CAP GROWTH FUND |
Best Buy (BBY) is a leading retailer of consumer electronics, home office, entertainment software, appliances and related services. The company is in the sweet spot of two product cycles, digital TVs and video games, which should continue to drive demand for its products. In addition, the expansion of its Geek Squad and Best Buy for Business platforms is expected to drive incremental growth opportunities.
Corporate Executive Board (EXBD) provides “best practices” research, decision support tools and executive education focusing on corporate strategy, operations and general management issues. The company’s membership-based model permits its clients to learn about the best practices of leading corporations at a fraction of the cost of a customized analysis.
Intuitive Surgical (ISRG) is the market leader in robotic-assisted minimally invasive surgery. The company’s da Vinci surgical system is used primarily in urologic, gynecologic, cardiothoracic and general surgery procedures. Clinically, the benefits and patient outcomes from robotic-assisted minimally invasive surgery are superior to conventional endoscopic surgery.
Adobe Systems (ADBE) is a leading developer of software for creative professionals and consumer hobbyists. Through its broad portfolio of software offerings, ADBE is well positioned to take advantage of several secular trends including the transition to Web 2.0 and rich internet applications, the shift to online advertising, and the increase in digital media consumption.
Las Vegas Sands (LVS) currently operates The Venetian Resort Hotel Casino and Sands Expo and Convention Center in Las Vegas, as well as the Sands Macao. LVS has an aggressive development pipeline being driven by the booming growth of the middle class in China, easing travel restrictions, and a healthy appetite for gaming and leisure consumption. Within a five-hour flight of nearly half of the world’s population, and offering the only legal gaming market in China, the Macao market has quickly become the most significant growth opportunity for gaming operators.
Outlook
Our outlook for growth investing remains positive. While there is no shortage of things to be concerned about, including geo-political angst, energy market volatility, the bursting of a housing bubble and the potential for an economic recession, we see reasons to be optimistic. Economic growth is moderating, but we believe a recession is unlikely. Diplomats are hard at work, sub-prime problems are currently contained, unemployment is low, inflation is low, and corporate profitability is still close to all-time highs. Equities appear attractive from a valuation perspective relative to bonds and real estate; growth stocks in particular look historically cheap relative to value stocks and the market in general. Corporate balance sheets are in good shape and returns on equity in the aggregate are close to all-time highs. After 18 consecutive quarters of double-digit EPS growth from S&P 500 companies, we are now transitioning to a mid-single-digit growth world for 2007. As with the mid-80s and mid-90s mid-cycle slowdowns, this transition may lead investors to pay a premium once again for companies capable of sustaining premium earnings growth like those found in the Excelsior Large Cap Growth Fund.
Thomas M. Galvin, CFA
President and CIO of the Growth Equity Group
16
EXCELSIOR FUNDS, INC. | LARGE CAP GROWTH FUND |
| | | |
| | |
Expense Ratio
(As of 10/31/06) | | Shares | |
Gross Expense Ratio | | 0.98 | % |
Net Expense Ratio | | 0.95 | % |
The expense information in the table reflects contractual fee waivers currently in effect. This information is included in the most current prospectus available to current and prospective shareholders of the Fund. The Adviser has contractually agreed to waive fees or reimburse expenses in order to keep total operating expenses from exceeding 0.95%. The waiver agreement may not be terminated before September 30, 2007. In addition, this agreement will renew automatically for an additional 12 month term unless the Adviser terminates the agreement by providing written notice to the Fund prior to the expiration of the current term.
17
EXCELSIOR FUNDS TRUST | MID CAP VALUE AND RESTRUCTURING FUND |
Performance Summary
A renewed awareness of risk and volatility stands as the hallmark of the past year. While second quarter activity was driven almost wholly by a reaction to new “management” at the Federal Reserve Bank, the third quarter was marked by defensiveness as investors worried whether interest rates were enough to contain inflation, or too much so as to cause recession. This was followed by a clear break in favor of higher stock prices at the end of 2006, only to be followed by a volatile first quarter of 2007 as credit risk emerged in the sub-prime lending sector.
The common assumption that risk has been underpriced, while stated broadly, applies mostly to segments of the fixed income market. The equity market has experienced the opposite, with risk largely overpriced. This has brought on the current wave of leveraged buyouts, debt-financed corporate mergers and debt-financed special dividends—exactly what should happen. We expect it to continue until debt and equity markets reflect a similar view of the future, an event at least as likely to come by way of higher stock prices as by lower bond prices.
To be sure, segments of the equity market, notably stocks of companies heavily involved in high-risk lending, experienced sharp declines and a few bankruptcies. This is normal and necessary in a well-functioning market where businesses, taking on undue risk and betting incorrectly, lose. Left to its own devices, the still inexpensive, broader equity market is likely to rise to levels consistent with the favorable long-term conditions of low inflation and high profitability.
Winners, losers and new additions combined to push the Fund ahead nicely for the past twelve months, roughly in line with broad market measures though behind the Russell Mid-Cap Value Index, which bested nearly all categories with over a 17% return. Divergence from the benchmark is common given the Fund’s relative concentration and emphasis on companies undergoing change, though we prefer it more when the Fund diverges positively from the benchmark as opposed to lagging. Nonetheless, the Fund’s annual performance relative to the index is not surprising considering the pervasive emphasis on near-term risk, which we are willing to bear, in the most recent quarter.
Performance Attribution
The Fund benefited from heightened deal making and debt-financed dividends. The acquisition of Symbol Technologies by Motorola closed in the past quarter. Dean Foods and Health Management Associates raised substantial cash from debt offerings and paid special dividends to shareholders, with the stocks reacting favorably to the distributions. A number of other holdings seem primed to take similar action or be acquired outright.
The strongest performer in the Fund for the year was Mastercard, purchased on its attractively priced initial public offering in the summer, which rose 177%. Other strong performers for the past twelve months were Kennametal, Tempur-Pedic, Sherwin Williams, First Marblehead and Echostar. Kennametal fits well with our strategy of investing in good businesses in the midst of substantial transitions and with attractively valued stocks. Kennametal’s management is moving the company from a largely commodity-focused manufacturing and distribution business toward a higher-margin, faster-growing, advanced materials business. Continued progress and a well-received tuck-in acquisition propelled the stock, which is up nicely since being added to the portfolio six months ago.
18
EXCELSIOR FUNDS TRUST | MID CAP VALUE AND RESTRUCTURING FUND |
Conversely, International Coal and Centex weighed on portfolio results. International Coal Group disappointed after numerous setbacks on both mining and operational fronts delayed fundamental improvement. The stock was sold from the portfolio. The Fund’s small remaining investment in homebuilder Centex was down as further malaise set in to the housing market.
Portfolio Activity
Oshkosh Truck, a company we have long admired, was added to the portfolio following its acquisition of JLG Industries, another company we nearly purchased many times. Management of Oshkosh has a long history of levering the company’s balance sheet in order to make sizeable acquisitions. With strong cash flow, the company has always improved its debt position following acquisitions and integrated new companies well. We expect similar results this time and believe there are plentiful opportunities for the combined company to grow revenues and increase margins. The stock’s decline in advance of the merger precipitated our purchase.
E*Trade, Leucadia National and Progressive were all added to the portfolio in the last three months. E*Trade is undergoing a rapid transition from a broker-focused earnings model to a fuller financial services franchise, while producing strong margin improvement and growth in the process. The Fund has owned both Progressive and Leucadia in the past, with good results. We re-purchased Progressive near its lowest price to book in 10 years and at a roughly 10% earnings yield. Progressive generates very high returns on equity and excellent underwriting margins; and while near-term results may be pressured, long-term returns may have potential to be excellent.
Funding for the new purchases came from sales of Sovereign Bancorp, Zale Corp, Blockbuster, Callaway Golf and Doral Financial. Sovereign stock rallied nicely under pressure from activist shareholders. Stock of Zale rose as consumers proved more resilient than many had expected. Neither stock represented particularly strong value any longer when compared to alternatives. The sale of Zale also reduced the portfolio’s retail exposure a bit.
Outlook
The Fund continues to display the attractive valuation and fundamental characteristics that mark our way of investing. The median stock in the portfolio sells at 14× expected earnings, 10× cash flow and 2.4× book value, all discounts to market benchmarks despite attractive earnings growth forecasts and high levels of profitability. There is plenty of evidence suggesting choppy waters ahead. If a liquidity crunch in credit markets occurs, it will take a heavy toll on equity markets in the short term—but that is far from a foregone conclusion. Over an extended horizon, we expect the trend in stock prices to be up. The Fund is invested as such and so represents very good value in our estimation.
Tim Evnin
Managing Director and Senior Portfolio Manager
John McDermott, CFA
Managing Director and Senior Portfolio Manager
19
EXCELSIOR FUNDS TRUST | MID CAP VALUE AND RESTRUCTURING FUND |
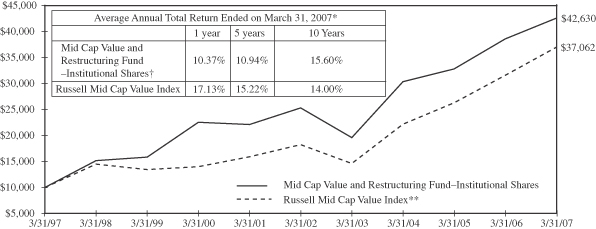
Past performance is not predictive of future performance. Investment returns and principal values will vary and shares may be worth more or less at redemption than their original cost.
The above illustration compares a $10,000 investment made in the Fund and a broad-based index over the past ten fiscal years. The chart assumes all dividends and capital gain distributions are reinvested. The Fund’s performance takes into account fees and expenses. The index does not take into account charges, fees and other expenses. Further information relating to Fund performance is contained in the Financial Highlights section of the Prospectus and elsewhere in this report.
| | | |
| | |
Expense Ratio
(As of 7/31/06) | | Shares | |
Gross Expense Ratio | | 0.88 | % |
This information is included in the most current prospectus available to current and prospective shareholders of the Fund. The Adviser has contractually agreed to waive fees or reimburse expenses in order to keep total operating expenses from exceeding 0.89%. The waiver agreement may not be terminated before July 31, 2007. In addition, this agreement will renew automatically for an additional 12 month term unless the Adviser terminates the agreement by providing written notice to the Fund prior to the expiration of the current term.
| * | | Total return represents the change during the period in a hypothetical account with dividends reinvested. |
| ** | | Source: Frank Russell Company—The Russell Mid Cap Value Index measures the performance of medium-sized value-oriented securities. |
| † | | Certain fees may be waived. Had such fees not been waived, returns would have been lower. Returns do not reflect the deduction of taxes that a shareholder would pay on Fund distributions or the redemption of shares. Returns do not reflect the 2% fee imposed on shares redeemed 30 days or less after their date of purchase. |
20
EXCELSIOR FUNDS, INC. | VALUE AND RESTRUCTURING FUND |
Performance Summary
This year’s performance results were in many respects a replay of last year’s. In both years, purveyors of industrial commodities, especially those driving growth in the emerging markets, were where the action was and a meaningful contributor to the Fund’s gains. That said, it has been an increasingly difficult environment for low P/E stocks, our bread-and-butter in terms of investing. With all the talk about slowing economic growth and decelerating earnings, perhaps this should have come as no surprise, as our companies typically carry more financial and operating risk. Moreover, tactically we are focused in the more cyclical sectors of the S&P 500 universe, which bore the brunt of a second-half 2006 sell-off in anticipation of these slowing trends. Our dilemma is, that these very sectors generally still offer investors substantial long term value and are often undergoing solid restructuring trends, which we find so attractive.
The other major performance contributor was from the unusually high level of merger and acquisition (M&A) activity. This trend has shown little sign of abating because stocks remain at attractive valuation levels and because corporations and large investors are flush with cash and looking for enhanced productivity and oversized returns. The Fund has been a continued beneficiary of buyouts because we seek out undervalued companies where management actions, either through restructuring or M&A activity, can create shareholder value.
The combination of these two dominant trends in the stock market helped provide a solid gain for the Fund, which was in line with the S&P 500 Index over the past twelve months but behind the Russell 1000 Value Index.
Performance Attribution
Copper producer Southern Copper Corporation and its majority stock owner Grupo Mexico were among the best performers. Southern Copper has gained approximately 89% in the past twelve months; Grupo Mexico has surged since we purchased it late last year. In addition, both companies pay very attractive dividends, with yields of approximately 9% and 4%, respectively. Although quite volatile and unpredictable, copper prices are expected to continue easing this year and next, mitigating against continued outsized stock price gains.
Two companies with worldwide operations benefited from the strong global trends mentioned above. Tractor manufacturer AGCO Corporation and chemical company Celanese both continued their year-end surge, gaining close to 80% and 50%, respectively, during the past twelve months. We think AGCO discounts much of the strength in tractor sales while Celanese still appears undervalued, even after the Dutch auction buyback of shares by the company.
Performance bright spots during the past year also included some of our Latin American and financial stocks. Copa Holdings, a Pan-American airline, gained over 130%; Mexican cellular provider America Movil, our largest holding, continued its performance tear, gaining 41%. Mastercard, purchased at its initial public offering in May, gained 177%.
On the downside, Centex was one of the biggest disappointments during the past twelve months, losing more than a quarter of its value. This was especially painful since it remains such a large holding
21
EXCELSIOR FUNDS, INC. | VALUE AND RESTRUCTURING FUND |
in the Fund. At these levels, the stock sells at adjusted tangible book value and amply discounts the deep slide in homebuilding. We believe book value offers strong downside protection for such a solid company, which should perform much better as the inventory of unsold homes is depleted.
Other detractors to performance were some repeat losers, including International Coal, Plantronics and XM Satellite Radio. We added shares to each of these companies with the expectation of better prices concomitant with improving fundamentals.
Portfolio Activity
During the year we upgraded quality in the portfolio by eliminating companies with weaker fundamentals and/or less attractive valuations. These included Doral, CF Industries, Deluxe Corp. and Interpublic Group. With the proceeds we added new companies to the portfolio, including Capital One Financial, Murphy Oil, Schnitzer Steel and Smurfit-Stone. We view Capital One’s acquisition of North Fork Bancorp positively and multiple enhancing for its stock longer term. The other companies, selling oil, steel and scrap, and boxes, respectively, are direct beneficiaries of the global growth phenomenon driving our economy and the stock market. We like their businesses, management savvy, and current valuation characteristics, and believe they fit in nicely with our philosophy of finding companies that are either restructuring or in consolidating industries and with long term value appeal.
Outlook
As we near the “sell in May and go away” seasonally weak period for the stock market, we are keeping our fingers crossed that the Fund can sustain its absolute and relative gains through the summer. If Fed funds rates are reduced sooner rather than later, it should. If worries about sub-prime lending, surging inflation and housing woes deepen, market volatility will probably continue. A rate cut will be especially beneficial to the Fund because of our overweighting in the cyclical and financial sectors of the market. On the other hand, the weakness in the economy that would likely precipitate such a rate reduction could be particularly detrimental to these same sectors. So a continuation of the “Goldilocks” economy is our hope. At this point, we believe this is the most likely outcome.
We are in our fifteenth year of investing in companies undergoing some form of restructuring or industry consolidation. We buy these companies when we believe they are undervalued and sell them when they no longer appear cheap. Today’s portfolio, we believe, possesses much the same value characteristics as it has for the previous fourteen years. The median company sells at less than 11 times price to cash flow, versus 12.4× for the S&P 500, and at a little more than 15× expected 2007 earnings, also a discount to the S&P 500 multiple. Yet the companies in the Fund are expected next year to have earnings growth much higher than that of the S&P 500, and with higher ROE’s (Return on Equity).
David J. Williams, CFA
Managing Director and Senior Portfolio Manager
22
EXCELSIOR FUNDS, INC. | VALUE AND RESTRUCTURING FUND |
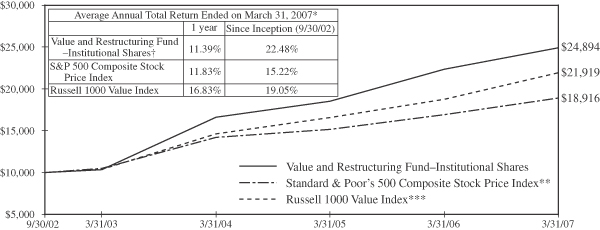
Past performance is not predictive of future performance. Investment returns and principal values will vary and shares may be worth more or less at redemption than their original cost.
The above illustration compares a $10,000 investment made in the Fund and a broad-based index since 9/30/02 (inception date). The chart assumes all dividends and capital gain distributions are reinvested. The Fund’s performance takes into account fees and expenses. The index does do not take into account charges, fees and other expenses. Further information relating to Fund performance is contained in the Financial Highlights section of the Prospectus and elsewhere in this report.
| | | |
| | |
Expense Ratio
(As of 7/31/06) | | Shares | |
Gross Expense Ratio | | 0.85 | % |
This information is included in the most current prospectus available to current and prospective shareholders of the Fund. The Adviser has contractually agreed to waive fees or reimburse expenses in order to keep total operating expenses from exceeding 0.89%. The waiver agreement may not be terminated before July 31, 2007. In addition, this agreement will renew automatically for an additional 12 month term unless the Adviser terminates the agreement by providing written notice to the Fund prior to the expiration of the current term.
| * | | Total return represents the change during the period in a hypothetical account with dividends reinvested. |
| ** | | Source: Standard & Poor’s Corporation—Reflects the reinvestment of income dividends and, where applicable, capital gain distributions. The Standard & Poor’s 500 Composite Stock Price Index is a widely accepted unmanaged index of U.S. stock market performance. |
| *** | | Source: Frank Russell Company—The Russell 1000 Value Index is an unmanaged index composed of those Russell 1000 Index companies with lower price-to-book ratios and lower forecasted growth values. The Russell 1000 Index is composed of the 1000 largest companies in The Russell 3000 Index which is composed of 3,000 of the largest U.S. companies by market capitalization. The Index includes dividends reinvested. |
| † | | Certain fees may be waived. Had such fees not been waived, returns would have been lower. Returns do not reflect the deduction of taxes that a shareholder would pay on fund distributions or the redemption of shares. Returns do not reflect the 2% fee imposed on shares redeemed 30 days or less after their date of purchase. |
23
EXCELSIOR FUNDS, INC. | EMERGING MARKETS FUND |
Performance Summary
In the last fiscal year, emerging markets performed much better than might have been expected given the two crises that book-ended the year. The first crisis occurred in May/June 2006 and was sparked by fears stemming from excessive carry trade activity, falling commodity prices, and U.S. interest-rate concerns. The weakness at fiscal year end stemmed once again from carry trade fears, with concerns over the U.S. sub-prime mortgage market added to the mix.
In addition to these two broad-based periods of weakness, individual countries had to overcome walls of worry at different times. For instance, Latin American elections, especially in Brazil and Mexico, caused uncertainty, but the results ended up pleasing investors. Thailand implemented currency controls but negated that decision in a matter of days. And China’s stock market suffered from the Chinese government expressing concern over its growth rate (the Chinese economy continues to run hot, a constant risk factor). Finally, certain emerging markets proved susceptible to falling oil prices.
The ability to withstand these uncertainties could define 2006/2007 as the year emerging markets came of age. In times past, any one of these events could have curtailed sentiment for some time, but for the fiscal year ended March 31, 2007, the emerging markets were up over 20%.
Performance Attribution
The Excelsior Emerging Markets Fund was able to keep pace most of the year, even during the two weak periods discussed above. As we entered the final fiscal quarter, however, the situation began to change; the leaders of 2006 started to lag as smaller markets took over leadership from the large markets of Brazil, Russia, and China. Since the Fund was underweighted in smaller markets, and still favored China and Russia, the Fund struggled in the first calendar quarter of 2007, causing the Fund to underperform the benchmark for the fiscal year. However, we are confident in our country weightings, which favor the BRIC countries (Brazil, Russia, India, and China), in particular China, over the long term.
Portfolio Activity
In keeping with our low turnover, portfolio sales of positions in their entirety were limited in the fiscal year. KGHM, a leading copper producer in Poland; Polyus Gold, a Russian gold mining company; and Rostelecom, Russia’s long-distance provider were all sold. It is just by coincidence that all three were in Central Europe. KGHM and Polyus were sold in anticipation of commodity prices falling. Rostelecom was sold as its price target had been reached.
In Poland, PKO Bank, a large commercial bank was sold. In Brazil, the Fund sold Telemar Norte Leste (Telemar), a telecommunications company; Telemar attempted a restructuring that failed, and prospects in its their fixed and mobile businesses were not living up to our expectations.
The Fund established a new position in Gafisa, a Brazilian homebuilder. Falling inflation and interest rates are increasing the affordability and demand for homes in Brazil. Although there are quite a few Brazilian real estate plays at present, Gafisa is one of the most liquid, thanks to its ADR.
24
EXCELSIOR FUNDS, INC. | EMERGING MARKETS FUND |
Chunghwa Telecom, Taiwan’s leading telecommunications company was also added. Not only is the stock exposed to a sector we find very attractive, but it also sports a high yield.
Outlook
External drivers, such as exports, have been the driving forces behind emerging market returns, but this may be changing. New drivers are emerging that may propel solid returns in the years to come. We believe that these new drivers will be domestic in nature. Emerging market countries have generated strong export growth and attracted investment, both of which are funding sources that can facilitate domestic economic development. We believe these funds will find their way into demand for infrastructure, domestic consumption, and telecommunications. Also, financial firms (such as banks) should be able to prosper from demand for new products and the growth of financing opportunities.
There has been a wealth transfer from the developed to emerging world. Few emerging market economies are exhibiting strained financial conditions. A base has been created that could fuel future returns. In this new era of emerging markets, the BRIC countries will continue to play a significant role. Growth is strong, and investment is high in these large, growing countries. The Fund continues to seek out opportunities in these markets. In addition to the stalwart BRIC category, new and smaller markets may rise in stature. Countries such as Vietnam and many African nations, also called frontier markets, may boost the next phase of emerging markets performance.
In short, we believe emerging markets are well entrenched in a long-term bull market (though nothing is ever totally smooth in emerging markets and near term performance could be volatile), driven by a variety of countries, both large and small. To profit from these opportunities we will continue to employ a combination of top-down and bottom-up analysis in our process. Long term, this mixed approach has worked well, and we believe it will continue to do so going forward.
In closing, we believe emerging markets are here to stay and do warrant a long-term allocation in a wide variety of portfolios.
Donald Elefson, CFA
Managing Director and Portfolio Manager
25
EXCELSIOR FUNDS, INC. | EMERGING MARKETS FUND |
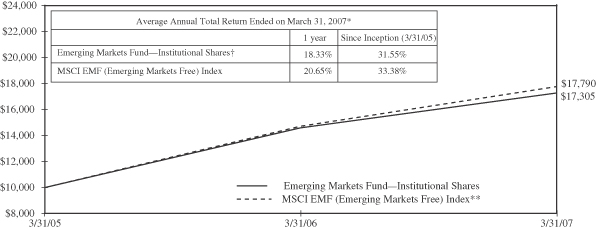
Past performance is not predictive of future performance. Investment returns and principal values will vary and shares may be worth more or less at redemption than their original cost. International investing is subject to special risks such as currency fluctuations and differences in accounting and taxation standards.
The above illustration compares a $10,000 investment made in the Fund and a broad-based index since 3/31/05 (inception date). The chart assumes all dividends and capital gain distributions are reinvested. The Fund’s performance takes into account fees and expenses. The index does not take into account charges, fees and other expenses. Further information relating to Fund performance is contained in the Financial Highlights section of the Prospectus and elsewhere in this report.
| | | |
| | |
Expense Ratio
(As of 7/31/06) | | Shares | |
Gross Expense Ratio | | 1.68 | % |
Net Expense Ratio | | 1.60 | % |
The expense information in the table reflects contractual fee waivers currently in effect. This information is included in the most current prospectus available to current and prospective shareholders of the Fund. The Adviser has contractually agreed to waive fees or reimburse expenses in order to keep total operating expenses from exceeding 1.60%. The waiver agreement may not be terminated before July 31, 2007. In addition, this agreement will renew automatically for an additional 12 month term unless the Adviser terminates the agreement by providing written notice to the Fund prior to the expiration of the current term.
| * | | Total return represents the change during the period in a hypothetical account with dividends reinvested. |
| ** | | Source: Morgan Stanley & Co., Incorporated—Morgan Stanley Capital International EMF (Emerging Markets Free) Index is a widely-accepted, unmanaged index composed of a sample of companies representative of the market structure of 26 global emerging market countries. The Index includes dividends reinvested. |
| † | | Currently certain fees are waived. Had such fees not been waived, returns would have been lower. Returns do not reflect the deduction of taxes that a shareholder would pay on Fund distributions or the redemption of shares. Returns do not reflect the 2% fee imposed on shares redeemed 30 days or less after their date of purchase. |
26
EXCELSIOR FUNDS TRUST | INTERNATIONAL EQUITY FUND |
Performance Summary
International equity markets continued to strongly outperform the U.S. market for the year ending March 31, 2007. The performance differential was quite considerable, with the MSCI World ex-US Index producing a gain of over 20% compared to a gain of approximately 12% for the S&P 500 Index for the period. The strong positive comparison benefited from continuing U.S. dollar weakness versus most major currencies, with the exception of the Japanese yen.
The performance of the strongest and the weakest markets varied again to a considerable extent. Among the developed markets, Singapore returned approximately 45% for the year in U.S. dollar terms, followed by Spain (+38) and Australia (+35%). Singapore benefited from the strong economy and stock markets of China, whereas Spain strengthened based on takeover activity and Australia surprised with strong domestic economic growth. The weakest developed markets were Japan (+3.0%) and Canada (+12.1%). The Japanese stock market took a breather after superb performance in 2005, amid concerns about the underlying strength of the economic recovery. Emerging markets were somewhat neutral to developed returns last year as the MSCI EM Index performed in line with developed markets. The BRIC countries—Brazil, Russia, India and China—outperformed their brethren again, with a return of approximately 27%. Overall, the strongest performing major emerging market for the year was China (+47%), closely followed by Mexico (+40%) and Indonesia (+36%).
Performance Attribution
The Fund underperformed its benchmark for the year ending March 31, 2007. Stock selection produced an overall positive contribution to returns. Our overweight position in the telecommunications services sector was also helpful in this regard. Negative contributors to return were our overweight positions in information technology and health care, as well as our underweight position in utilities. Utilities, telecommunications services and consumer staples were the best performing sectors for the year. The weakest sectors were information technology and energy, with single digit returns, followed by health care. The Fund’s sector weightings stayed remarkably stable throughout the year. Health care, information technology, telecommunications services and consumer discretionary remained overweight, whereas our underweight sectors are financials, materials and utilities. Only the extent of the underweight and overweight percentages varied throughout the year. Individual stock performance contribution varied widely from quarter to quarter. Consistent with our investment philosophy, portfolio turnover was kept to a minimum.
Norwegian video conferencing solutions provider Tandberg ASA was the strongest performer in the fiscal year, returning over 100% during the period. Other strong contributors to performance included the German carbon and graphite materials producer SGL Carbon AG; Wm Morrison Supermarkets PLC; telecommunications company Telenor ASA; and Serco Group PLC, a commercial services company. Japanese stocks were some of the worst performers, including banking holding company, Mitsubishi UFJ Financial Group; Japan-based discount retailer Don Quijote Company; electronics and appliance retailer Yamada Denki Company; and electro-optics company Hoya Corporation. We continue to hold these positions as we have confidence in the recovery of the Japanese economy.
Portfolio Activity
In Asia, we sold Samsung Electronics, Hyundai Motor and Advanced Info Services.
27
EXCELSIOR FUNDS TRUST | INTERNATIONAL EQUITY FUND |
In Europe, we eliminated our positions in Depfa and Sanofi-Aventis due to concerns about the visibility of future growth. The German industrial conglomerate MAN was sold due to its involvement in a complicated and potentially disadvantageous M&A situation. We also sold Altana AG and British Sky Broadcasting Group plc. We felt that Altana had reached its full valuation potential subsequent to the disposal of its pharmaceuticals business. Concerns about the strategic direction of BSkyB caused us to sell our holdings in this company.
In Canada, we eliminated our holdings in Rona and Suncor for future earnings visibility reasons.
The fund’s replacements for these holdings include the Canadian apparel manufacturer Gildan Activewear and Canadian National Railway. We established positions in the Australian-based specialty pharmaceutical company CSL and in Synthes, the Swiss medical products provider specializing in orthopedic trauma surgery.
Other purchases included Greek Postal Savings Bank and Reed Elsevier. Reed Elsevier is an international publishing group specializing in scientific, legal and business-to-business materials. Both companies feature strong earnings growth potential and reasonable valuations.
Outlook
We are continuing to maintain a very positive stance on international equities as an asset class. Our reasoning is based on key considerations in regard to earnings growth, comparative valuations, currency considerations and diversification benefits.
Europe continues to benefit from the EU expansion toward Central and Eastern Europe. Japan has seen positive GDP growth for the last five years now, and the foundations for the continuing recovery of the Japanese economy remain strong. Strong export performance to both the U.S. and China is expected to continue. Real estate prices in Tokyo are also confirming an overall sound recovery. Economic growth in most emerging markets continues to surprise on the upside, as well.
Most international markets currently trade at a 20-25% discount to the U.S. market as measured in terms of price to cash flow and price to book value relationships. We anticipate a continuation of the measured approach that most central banks have taken over the recent past and so expect few monetary policy surprises.
We anticipate a continued, if somewhat weaker, performance contribution from a weaker U.S dollar. Continued current account and federal budget deficits remain a concern to most market participants. The anticipated increase in short-term Eurozone interest rates will also negatively influence the relative interest rate relationship between the Dollar and the Euro, thus validating the recent strong performances of the Euro and the British Pound.
We are continuing to anticipate positive benefits from international diversification as the magnitude of anticipated returns should outpace opportunities in the U.S. The U.S. stock market accounts for about half of world market capitalization, which implies that the other half of investment opportunities lies elsewhere. Given our anticipated scenario above, this environment lends itself to enhanced returns from strong stock selection.
Reiner Triltsch, CFA
Managing Director, Portfolio Manager and Head of International Equities
28
EXCELSIOR FUNDS TRUST | INTERNATIONAL EQUITY FUND |
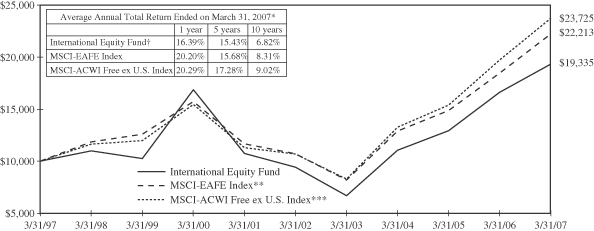
Past performance is not predictive of future performance. Investment returns and principal values will vary and shares may be worth more or less at redemption than their original cost. International investing is subject to special risks such as currency fluctuations, political risks, and differences in accounting and taxation standards.
The above illustration compares a $10,000 investment made in the Fund and broad-based indices over the past ten fiscal years. The chart assumes all dividends and capital gain distributions are reinvested. The Fund’s performance takes into account fees and expenses. The indices do not take into account charges, fees and other expenses. Further information relating to Fund performance is contained in the Financial Highlights section of the Prospectus and elsewhere in this report.
| | | |
| | |
Expense Ratio
(As of 7/31/06) | | Shares | |
Gross Expense Ratio | | 1.46 | % |
Net Expense Ratio | | 1.10 | % |
The expense information in the table reflects contractual fee waivers currently in effect. This information is included in the most current prospectus available to current and prospective shareholders of the Fund. The Adviser has contractually agreed to waive fees or reimburse expenses in order to keep total operating expenses from exceeding 1.10%. The waiver agreement may not be terminated before July 31, 2007. In addition, this agreement will renew automatically for an additional 12 month term unless the Adviser terminates the agreement by providing written notice to the Fund prior to the expiration of the current term.
| * | | Total return represents the change during the period in a hypothetical account with dividends reinvested. |
| ** | | Source: Morgan Stanley & Co., Incorporated—The Morgan Stanley Capital International EAFE (Europe, Australia, Asia, Far East) Index is a widely accepted, unmanaged index composed of a sample of companies from 21 countries representing the developed stock markets outside North America. |
| *** | | Source: Morgan Stanley & Co., Incorporated—The Morgan Stanley Capital International All Country World Index Free ex U.S. Index is a widely accepted, unmanaged index of global stock market performance comprising 47 countries with developed and emerging markets excluding the United States. |
| † | | Currently certain fees are waived. Had such fees not been waived, returns would have been lower. Returns do not reflect the deduction of taxes that a shareholder would pay on Fund distributions or the redemption of shares. Returns do not reflect the 2% fee imposed on shares redeemed 30 days or less after their date of purchase. One year returns presented in the table differs from the return presented in the Financial Highlights. This is a result of the calculation of the Financial Highlights return adhering to GAAP presentation. |
29
Excelsior Funds, Inc.
Portfolio of Investments — March 31, 2007
Money Fund
| | | | | | | | | | | |
Principal
Amount | | | | Rate | | | Maturity
Date | | Value |
| | | | | | | | | | | |
| | CERTIFICATES OF DEPOSIT — 17.90% |
| $ | 45,000,000 | | Barclay Bank plc | | 5.30 | % | | 04/04/07 | | $ | 45,000,000 |
| | 50,000,000 | | Citibank | | 5.31 | | | 04/30/07 | | | 50,000,000 |
| | 50,000,000 | | First Tennessee Bank | | 5.29 | | | 06/05/07 | | | 50,000,000 |
| | 30,000,000 | | HSBC Bank | | 5.30 | | | 05/14/07 | | | 30,000,000 |
| | 50,000,000 | | Washington Mutual Corp. | | 5.26 | | | 06/06/07 | | | 50,000,000 |
| | | | | | | | | | | |
| | | TOTAL CERTIFICATES OF DEPOSIT
(Cost $225,000,000) | | | 225,000,000 |
| | | | | | | | | | | |
| | COMMERCIAL PAPER — 71.77% |
| | 25,000,000 | | Abbott Laboratories, Discount Note | | 5.19 | | | 04/02/07 | | | 24,996,396 |
| | 25,000,000 | | Abbott Laboratories, Discount Note | | 5.24 | | | 04/10/07 | | | 24,967,250 |
| | 50,000,000 | | American General Finance Co., Discount Note | | 5.27 | | | 04/05/07 | | | 49,970,721 |
| | 9,200,000 | | CIT Group Funding, Inc., Discount Note | | 5.24 | | | 04/25/07 | | | 9,167,861 |
| | 15,000,000 | | CIT Group Funding, Inc., Discount Note | | 5.22 | | | 06/29/07 | | | 14,806,425 |
| | 5,000,000 | | CIT Group Funding, Inc., Discount Note | | 5.20 | | | 08/09/07 | | | 4,906,111 |
| | 50,000,000 | | Corporate Asset Funding Co., Inc., Discount Note(a) | | 5.25 | | | 04/20/07 | | | 49,861,458 |
| | 15,000,000 | | Falcon Asset Securitization Corp., Discount Note(a) | | 5.24 | | | 04/09/07 | | | 14,982,533 |
| | 20,000,000 | | Falcon Asset Securitization Corp., Discount Note(a) | | 5.26 | | | 04/18/07 | | | 19,950,322 |
| | 14,000,000 | | Falcon Asset Securitization Corp., Discount Note(a) | | 5.24 | | | 04/25/07 | | | 13,951,093 |
| | 20,000,000 | | General Electric Capital Corp., Discount Note | | 5.17 | | | 06/05/07 | | | 19,813,306 |
| | 40,000,000 | | Goldman Sachs Group, Inc., Discount Note | | 5.30 | | | 04/03/07 | | | 39,988,222 |
| | 28,000,000 | | Govco, Inc., Discount Note(a) | | 5.25 | | | 04/27/07 | | | 27,893,833 |
| | 15,000,000 | | Govco, Inc., Discount Note(a) | | 5.24 | | | 05/11/07 | | | 14,912,667 |
| | | | | | | | | | | |
Principal
Amount | | | | Rate | | | Maturity
Date | | Value |
| | | | | | | | | | | |
| | COMMERCIAL PAPER — (continued) |
| $ | 10,000,000 | | Govco, Inc., Discount Note(a) | | 5.23 | % | | 05/15/07 | | $ | 9,936,078 |
| | 35,000,000 | | HBOS plc, Discount Note | | 5.20 | | | 05/11/07 | | | 34,797,583 |
| | 20,000,000 | | HSBC Finance Corp., Discount Note | | 5.24 | | | 04/12/07 | | | 19,967,978 |
| | 20,000,000 | | International Lease Finance Corp., Discount Note | | 5.23 | | | 04/10/07 | | | 19,973,850 |
| | 30,000,000 | | John Deere Capital Corp., Discount Note | | 5.25 | | | 05/11/07 | | | 29,825,000 |
| | 15,000,000 | | John Deere Capital Corp., Discount Note | | 5.20 | | | 05/21/07 | | | 14,891,667 |
| | 25,000,000 | | JP Morgan Chase & Co., Discount Note | | 5.24 | | | 04/11/07 | | | 24,963,611 |
| | 40,000,000 | | Procter & Gamble Co., Discount Note | | 5.22 | | | 05/22/07 | | | 39,704,200 |
| | 15,000,000 | | Procter & Gamble Co., Discount Note | | 5.21 | | | 06/18/07 | | | 14,830,675 |
| | 50,000,000 | | Prudential Funding Corp., Discount Note | | 5.24 | | | 05/03/07 | | | 49,767,111 |
| | 55,000,000 | | Rabobank Corp., Discount Note | | 5.39 | | | 04/02/07 | | | 54,991,757 |
| | 25,000,000 | | Ranger Funding Co., LLC, Discount Note(a) | | 5.27 | | | 04/09/07 | | | 24,970,722 |
| | 25,000,000 | | Ranger Funding Co., LLC, Discount Note(a) | | 5.25 | | | 05/17/07 | | | 24,832,292 |
| | 25,000,000 | | Societe Generale, Discount Note | | 5.31 | | | 04/05/07 | | | 24,985,250 |
| | 15,000,000 | | Three Pillar Funding LLC, Discount Note(a) | | 5.26 | | | 04/09/07 | | | 14,982,467 |
| | 20,000,000 | | Three Pillar Funding LLC, Discount Note(a) | | 5.27 | | | 04/25/07 | | | 19,929,687 |
| | 12,000,000 | | Three Pillar Funding LLC, Discount Note(a) | | 5.28 | | | 04/27/07 | | | 11,954,240 |
| | 15,000,000 | | UBS Finance Corp., Discount Note | | 5.23 | | | 05/01/07 | | | 14,934,563 |
| | 35,000,000 | | UBS Finance Corp., Discount Note | | 5.23 | | | 05/14/07 | | | 34,781,148 |
See Notes to Financial Statements.
30
Excelsior Funds, Inc.
Portfolio of Investments — March 31, 2007
Money Fund — (continued)
| | | | | | | | | | | |
Principal
Amount | | | | Rate | | | Maturity
Date | | Value |
| | | | | | | | | | | |
| | COMMERCIAL PAPER — (continued) |
| | 7,595,000 | | Windmill Funding Corp., Discount Note(a) | | 5.25 | | | 04/03/07 | | | 7,592,785 |
| $ | 27,000,000 | | Windmill Funding Corp., Discount Note(a) | | 5.25 | % | | 04/11/07 | | $ | 26,960,625 |
| | 20,000,000 | | Windmill Funding Corp., Discount Note(a) | | 5.25 | | | 05/03/07 | | | 19,906,667 |
| | 15,000,000 | | Yorktown Capital LLC, Discount Note(a) | | 5.25 | | | 04/12/07 | | | 14,975,938 |
| | 17,619,000 | | Yorktown Capital LLC, Discount Note(a) | | 5.26 | | | 04/26/07 | | | 17,554,642 |
| | | | | | | | | | | |
| | | TOTAL COMMERCIAL PAPER
(Cost $902,178,734) | | | 902,178,734 |
| | | | | | | | | | | |
| | U.S. GOVERNMENT AND AGENCY OBLIGATIONS — 2.78% |
| | 20,000,000 | | Federal Home Loan Bank(b) | | 5.28 | | | 03/14/08 | | | 20,000,000 |
| | 15,000,000 | | Federal National Mortgage Association | | 5.30 | | | 01/08/08 | | | 15,000,000 |
| | | | | | | | | | | |
| | | TOTAL U.S. GOVERNMENT AND AGENCY OBLIGATIONS
(Cost $35,000,000) | | | 35,000,000 |
| | | | | | | | | | | |
| Shares | | | | | | | | | |
| | REGISTERED INVESTMENT COMPANY — 0.29% |
| | 3,706,303 | | Dreyfus Government Cash Management Fund | | | 3,706,303 |
| | | | | | | | | | | |
| | | TOTAL REGISTERED INVESTMENT COMPANY
(Cost $3,706,303) | | | 3,706,303 |
| | | | | | | | | | | |
| | | | | | | | | | |
Principal
Amount | | | | | | | | Value |
| | | | | | | | | | |
| | REPURCHASE AGREEMENT — 7.48% |
| $ | 94,000,000 | | Morgan Stanley, 5.30% dated 03/30/07, due 04/02/07, to be repurchased at $94,041,517 (collateralized by U.S. Government Obligations, ranging in par value $42,065,000-$53,385,000, 5.00%-5.40%, 02/25/08-06/15/12; total market value $95,882,844) | | $ | 94,000,000 |
| | | | | | | | | | |
| | | TOTAL REPURCHASE AGREEMENT
(Cost $94,000,000) | | | 94,000,000 |
| | | | | | | | | | |
| | | | | | | |
TOTAL INVESTMENTS
(Cost $1,259,885,037) | | 100.22 | % | | $ | 1,259,885,037 | |
LIABILITIES IN EXCESS OF OTHER ASSETS | | (0.22 | ) | | | (2,808,450 | ) |
| | | | | | | |
NET ASSETS | | 100.00 | % | | $ | 1,257,076,587 | |
| | | | | | | |
| (a) | Security exempt from registration under Rule 144A of the Securities Act of 1933. This security may be resold in transactions exempt from registration, normally to qualified institutional buyers. At March 31, 2007 these securities amounted to $335,148,049 or 26.66% of net assets. |
| (b) | Variable Rate Security—The rate disclosed is as of March 31, 2007. |
Discount Note—The rate reported is the discount rate at the time of purchase.
LLC—Limited Liability Company
plc—Public Limited Company
The summary of the Fund’s investments as of March 31, 2007 is as follows: (Unaudited)
| | | | | | | |
Portfolio Diversification | | % of
Net
Assets | | | Value | |
Commercial Paper | | 71.77 | % | | $ | 902,178,734 | |
Certificates of Deposit | | 17.90 | | | | 225,000,000 | |
Repurchase Agreement | | 7.48 | | | | 94,000,000 | |
U.S. Government & Agency Obligations | | 2.78 | | | | 35,000,000 | |
Registered Investment Company | | 0.29 | | | | 3,706,303 | |
| | | | | | | |
Total Investments | | 100.22 | % | | $ | 1,259,885,037 | |
Liabilities in Excess of Other Assets | | (0.22 | ) | | | (2,808,450 | ) |
| | | | | | | |
Net Assets | | 100.00 | % | | $ | 1,257,076,587 | |
| | | | | | | |
See Notes to Financial Statements
31
Excelsior Funds, Inc.
Portfolio of Investments — March 31, 2007
Core Bond Fund
| | | | | | | | | | | |
Principal
Amount | | | | Rate | | | Maturity
Date | | Value |
| | | | | | | | | | | |
| | ASSET BACKED SECURITIES — 0.77% |
| $ | 4,200,000 | | Capital Auto Receivables Asset Trust,
2006-SN1AC B(a) | | 5.50 | % | | 04/20/10 | | $ | 4,220,546 |
| | | | | | | | | | | |
| | | TOTAL ASSET BACKED SECURITIES
(Cost $4,199,070) | | | 4,220,546 |
| | | | | | | | | | | |
| | COLLATERALIZED MORTGAGE OBLIGATIONS — 7.74% |
| | | NON-GOVERNMENTAL AGENCY COLLATERALIZED MORTGAGE OBLIGATIONS — 6.71% | | | |
| | 581,837 | | Bear Stearns Adjustable Rate Mortgage Trust, 2004-10, 15A1(b) | | 4.50 | | | 01/25/35 | | | 574,878 |
| | 1,970,974 | | Citigroup Mortgage Loan Trust,
2004-HYB4 WA(b) | | 4.46 | | | 12/25/34 | | | 1,947,220 |
| | 3,066,439 | | Countrywide Alternative Loan Trust,
2004-16CB 1A2 | | 5.50 | | | 07/25/34 | | | 3,034,154 |
| | 1,840,406 | | Countrywide Alternative Loan Trust,
2004-22CB 1A1 | | 6.00 | | | 10/25/34 | | | 1,845,870 |
| | 8,256,407 | | Indymac Index Mortgage Loan Trust,
2004-AR4 3A(b) | | 4.74 | | | 08/25/34 | | | 8,239,692 |
| | 7,906,553 | | JP Morgan Mortgage Trust,
2005-A6 1A1(b) | | 5.15 | | | 09/25/35 | | | 7,834,919 |
| | 10,915,388 | | Wells Fargo Mortgage Backed Securities Trust,
2004-EE 3A1 | | 3.99 | | | 12/25/34 | | | 10,709,611 |
| | 2,852,286 | | Wells Fargo Mortgage Backed Securities Trust,
2005-AR1 1A1(b) | | 5.54 | | | 02/25/35 | | | 2,806,770 |
| | | | | | | | | | | |
| | | | | | | | | | | 36,993,114 |
| | | | | | | | | | | |
| | | FEDERAL HOME LOAN MORTGAGE CORPORATION — 0.48% | | | |
| | 2,580,601 | | 2333 UZ | | 6.50 | | | 7/15/31 | | | 2,644,186 |
| | | | | | | | | | | |
| | | FEDERAL NATIONAL MORTGAGE ASSOCIATION — 0.55% | | | |
| | 3,080,000 | | 2003-17 QT | | 5.00 | | | 08/25/27 | | | 3,058,976 |
| | | | | | | | | | | |
| | | TOTAL COLLATERALIZED MORTGAGE OBLIGATIONS
(Cost $43,170,173) | | | 42,696,276 |
| | | | | | | | | | | |
| | | | | | | | | | | |
Principal
Amount | | | | Rate | | | Maturity
Date | | Value |
| | | | | | | | | | | |
| | COMMERCIAL MORTGAGE-BACKED SECURITIES — 11.77% |
| $ | 4,225,000 | | Asset Securitization Corp.,
1997-D4 A4(b) | | 7.26 | % | | 4/14/29 | | $ | 4,443,489 |
| | 2,497,000 | | Bank of America Commercial Mortgage, Inc., 2004-1 A4 | | 4.76 | | | 11/10/39 | | | 2,426,294 |
| | 5,000,000 | | Bear Stearns Commercial Mortgage Securities, 2006-PW13 A3(b) | | 5.52 | | | 09/11/41 | | | 5,064,335 |
| | 1,000,000 | | Credit Suisse First Boston Mortgage Securities Corp.,
2002-CKS4 G(a)(b) | | 6.01 | | | 11/15/36 | | | 1,026,906 |
| | 1,781,000 | | GMAC Commercial Mortgage Securities,
1999-C1(b) | | 6.84 | | | 05/15/33 | | | 1,832,944 |
| | 3,449,000 | | Greenwich Capital Commercial Funding Corp.,
2004-GG1 A1 | | 5.32 | | | 06/10/36 | | | 3,460,227 |
| | 3,150,000 | | Morgan Stanley Dean Witter Capital I,
2000-LIF2 C | | 7.50 | | | 10/15/33 | | | 3,370,250 |
| | 1,245,000 | | Morgan Stanley Dean Witter Capital I,
2003-TOP9 A2 | | 4.74 | | | 11/13/36 | | | 1,217,836 |
| | 5,571,000 | | Nomura Asset Securities Corp.,
1998-D6 A4(b) | | 6.91 | | | 03/15/30 | | | 6,266,777 |
| | 4,225,000 | | Wachovia Bank Commercial Mortgage Trust,
2002-C1 A4 | | 6.29 | | | 04/15/34 | | | 4,427,224 |
| | 3,601,000 | | Wachovia Bank Commercial Mortgage Trust,
2003-C9 A3 | | 4.61 | | | 12/15/35 | | | 3,535,827 |
| | 6,099,000 | | Wachovia Bank Commercial Mortgage Trust,
2004-C12 A2 | | 5.00 | | | 07/15/41 | | | 6,069,355 |
| | 3,905,000 | | Wachovia Bank Commercial Mortgage Trust,
2004-C12 A3 | | 5.23 | | | 07/15/41 | | | 3,917,688 |
| | 17,926,000 | | Wachovia Bank Commercial Mortgage Trust,
2005-C20 A5 | | 5.09 | | | 07/15/42 | | | 17,862,640 |
| | | | | | | | | | | |
| | | TOTAL COMMERCIAL MORTGAGE-
BACKED SECURITIES
(Cost $65,218,292) | | | 64,921,792 |
| | | | | | | | | | | |
See Notes to Financial Statements.
32
Excelsior Funds, Inc.
Portfolio of Investments — March 31, 2007
Core Bond Fund — (continued)
| | | | | | | | | | | |
Principal
Amount | | | | Rate | | | Maturity
Date | | Value |
| | | | | | | | | | | |
| | CORPORATE BONDS — 17.21% |
| $ | 2,665,000 | | Alcan, Inc., | | 5.00 | % | | 06/01/15 | | $ | 2,556,172 |
| | 2,615,000 | | America Movil S.A. de C.V. | | 5.50 | | | 03/01/14 | | | 2,586,792 |
| | 955,000 | | America Movil S.A. de C.V. | | 6.38 | | | 03/01/35 | | | 940,731 |
| | 5,700,000 | | Bank One Corp., | | 7.88 | | | 08/01/10 | | | 6,168,494 |
| | 4,000,000 | | Barlcays Bank plc(a)(b) | | 5.93 | | | 12/31/49 | | | 4,004,312 |
| | 3,245,000 | | Bear Stearns Co., Inc. | | 5.70 | | | 11/15/14 | | | 3,273,712 |
| | 5,520,000 | | Bottling Group LLC | | 5.50 | | | 04/01/16 | | | 5,551,072 |
| | 2,300,000 | | British Telecommunications plc | | 8.88 | | | 12/15/30 | | | 3,157,930 |
| | 2,000,000 | | Caterpillar, Inc. | | 5.70 | | | 08/15/16 | | | 2,040,552 |
| | 2,000,000 | | Citigroup, Inc. | | 4.25 | | | 07/29/09 | | | 1,967,694 |
| | 1,441,000 | | Comcast Cable Communications | | 6.88 | | | 06/15/09 | | | 1,491,932 |
| | 1,441,000 | | DaimlerChrysler N.A. Holding Corp. | | 7.20 | | | 09/01/09 | | | 1,504,165 |
| | 2,000,000 | | Deutsche Telekom International Finance | | 5.38 | | | 03/23/11 | | | 2,011,018 |
| | 1,310,000 | | Deutsche Telekom International Finance, Multi-Coupon Bond | | 8.00 | | | 06/15/10 | | | 1,420,061 |
| | 1,500,000 | | Deutsche Telekom International Finance, Multi-Coupon Bond | | 8.25 | | | 06/15/30 | | | 1,857,987 |
| | 1,700,000 | | Ford Motor Credit Co. | | 8.63 | | | 11/01/10 | | | 1,734,886 |
| | 2,000,000 | | General Electric Capital Corp. MTN | | 6.00 | | | 06/15/12 | | | 2,078,068 |
| | 1,400,000 | | General Electric Captial Corp. | | 5.00 | | | 11/15/11 | | | 1,395,871 |
| | 5,834,000 | | Household Finance Corp. | | 8.00 | | | 07/15/10 | | | 6,323,892 |
| | 1,388,000 | | JP Morgan Chase & Co. | | 5.75 | | | 01/02/13 | | | 1,423,488 |
| | 2,000,000 | | Lehman Brothers Holdings, Inc. | | 5.75 | | | 01/03/17 | | | 2,004,138 |
| | 885,000 | | Metlife, Inc. | | 5.00 | | | 11/24/13 | | | 876,299 |
| | 2,000,000 | | Morgan Stanley | | 6.75 | | | 04/15/11 | | | 2,115,350 |
| | 685,000 | | Nisource Finance Corp. | | 5.25 | | | 09/15/17 | | | 646,955 |
| | 3,825,000 | | Oracle Corp. | | 5.25 | | | 01/15/16 | | | 3,771,844 |
| | 1,441,000 | | Prudential Financial, Inc. | | 5.10 | | | 09/20/14 | | | 1,414,409 |
| | 4,500,000 | | RBS Capital Trust III(b)(c) | | 5.51 | | | 09/30/14 | | | 4,427,483 |
| | 1,670,000 | | Sprint Capital Corp.(d) | | 8.75 | | | 03/15/32 | | | 1,969,797 |
| | 4,100,000 | | Target Corp. | | 5.88 | | | 07/15/16 | | | 4,219,195 |
| | | | | | | | | | | |
Principal
Amount | | | | Rate | | | Maturity
Date | | Value |
| | | | | | | | | | | |
| | CORPORATE BONDS — (continued) |
| $ | 2,600,000 | | TCI Communications, Inc. | | 9.80 | % | | 02/01/12 | | $ | 3,078,156 |
| | 2,183,000 | | Time Warner Cos., Inc. | | 7.25 | | | 10/15/17 | | | 2,409,853 |
| | 2,000,000 | | UBS Preferred Funding
Trust I | | 8.62 | | | 10/29/49 | | | 2,210,662 |
| | 2,441,000 | | Wal-Mart Stores, Inc. | | 4.13 | | | 02/15/11 | | | 2,365,151 |
| | 1,735,000 | | Wal-Mart Stores, Inc. | | 5.00 | | | 04/05/12 | | | 1,728,492 |
| | 5,350,000 | | Wells Fargo & Co. | | 5.00 | | | 11/15/14 | | | 5,196,273 |
| | 950,000 | | Xerox Corp. | | 6.40 | | | 03/15/16 | | | 977,099 |
| | 2,000,000 | | YUM! Brands, Inc. | | 6.25 | | | 04/15/16 | | | 2,055,456 |
| | | | | | | | | | | |
| | | TOTAL CORPORATE BONDS
(Cost $93,910,972) | | | 94,955,441 |
| | | | | | |
| | TAX-EXEMPT SECURITIES — 0.32% | | | |
| | 1,590,000 | | Massachusetts Bay Transition Authority, Massachusetts Sales Tax, Revenue Bonds, Series A | | 5.00 | | | 07/01/31 | | | 1,761,561 |
| | | | | | | | | | | |
| | | TOTAL TAX-EXEMPT SECURITIES
(Cost $1,753,931) | | | 1,761,561 |
| | | | | | | | | | | |
| | U.S. GOVERNMENT AGENCY BONDS & NOTES — 2.38% |
| | | FANNIE MAE — 1.43% | | | |
| | 7,500,000 | | MTN | | 6.25 | | | 02/01/11 | | | 7,867,613 |
| | | | | | | | | | | |
| | | FREDDIE MAC — 0.50% | | | |
| | 2,440,000 | | | | 6.25 | | | 07/15/32 | | | 2,779,167 |
| | | | | | | | | | | |
| | | RESOLUTION FUNDING CORPORATION — 0.45% |
| | 4,851,000 | | Principal Only STRIPS(e) | | 0.00 | | | 07/15/20 | | | 2,475,984 |
| | | | | | | | | | | |
| | | TOTAL U.S. GOVERNMENT AGENCY
BONDS & NOTES
(Cost $12,830,645) | | | 13,122,764 |
| | | | | | | | | | | |
| U.S. GOVERNMENT AGENCY MORTGAGE PASS THROUGH
SECURITIES — 39.55% |
| | | FEDERAL HOME LOAN MORTGAGE CORPORATION — 10.62% | | | |
| | 6,330,169 | | Pool # 1G1898 ARM(b) | | 5.92 | | | 06/01/36 | | | 6,371,234 |
| | 2,546,198 | | Pool # A20105 | | 5.00 | | | 04/01/34 | | | 2,465,415 |
| | 9,347,243 | | Pool # A47411 | | 4.50 | | | 10/01/35 | | | 8,790,449 |
| | 2,294,453 | | Pool # A48132 | | 7.00 | | | 12/01/35 | | | 2,367,650 |
| | 5,494,792 | | Pool # B19861 | | 4.50 | | | 08/01/20 | | | 5,320,510 |
| | 2,721,826 | | Pool # C01811 | | 5.00 | | | 04/01/34 | | | 2,635,471 |
| | 130,854 | | Pool # C71221 | | 5.00 | | | 09/01/32 | | | 126,844 |
| | 20,702 | | Pool # C74339 | | 5.00 | | | 12/01/32 | | | 20,068 |
| | 162,308 | | Pool # C74469 | | 5.00 | | | 12/01/32 | | | 157,334 |
| | 32,310 | | Pool # C74676 | | 5.00 | | | 12/01/32 | | | 31,319 |
| | 2,320,547 | | Pool # E96460 | | 5.00 | | | 05/01/18 | | | 2,294,384 |
| | 4,527,416 | | Pool # G01842 | | 4.50 | | | 06/01/35 | | | 4,257,728 |
| | 18,109,227 | | Pool # G18105 | | 5.00 | | | 03/01/21 | | | 17,859,820 |
See Notes to Financial Statements.
33
Excelsior Funds, Inc.
Portfolio of Investments — March 31, 2007
Core Bond Fund — (continued)
| | | | | | | | | | | |
Principal
Amount | | | | Rate | | | Maturity
Date | | Value |
| | | | | | | | | | | |
| U.S. GOVERNMENT AGENCY MORTGAGE PASS THROUGH
SECURITIES — (continued) |
| | | FEDERAL HOME LOAN MORTGAGE CORPORATION (continued) | | | |
| $ | 2,496,422 | | Pool # J01383 | | 5.50 | % | | 03/01/21 | | $ | 2,501,698 |
| | 3,518,057 | | Pool # J02497 | | 4.50 | | | 09/01/20 | | | 3,406,473 |
| | | | | | | | | | | |
| | | | | | | | | | | 58,606,397 |
| | | | | | | | | | | |
| | | FEDERAL NATIONAL MORTGAGE ASSOCIATION — 26.85% | | | |
| | 203,140 | | Pool # 251502 | | 6.50 | | | 02/01/13 | | | 208,079 |
| | 84,901 | | Pool # 252806 | | 7.50 | | | 10/01/29 | | | 88,996 |
| | 1,197,709 | | Pool # 255896 | | 6.50 | | | 08/01/35 | | | 1,222,557 |
| | 5,032,302 | | Pool # 256269 | | 5.50 | | | 06/01/36 | | | 4,979,818 |
| | 10,462,685 | | Pool # 357824 | | 5.50 | | | 06/01/35 | | | 10,363,931 |
| | 1,232,108 | | Pool # 387203 | | 4.80 | | | 01/01/12 | | | 1,220,457 |
| | 1,052,084 | | Pool # 387204 | | 4.80 | | | 01/01/12 | | | 1,042,136 |
| | 220,898 | | Pool # 443194 | | 5.50 | | | 10/01/28 | | | 219,820 |
| | 3,905 | | Pool # 450846 | | 5.50 | | | 12/01/28 | | | 3,886 |
| | 342,368 | | Pool # 452035 | | 5.50 | | | 11/01/28 | | | 340,697 |
| | 2,306 | | Pool # 454758 | | 5.50 | | | 12/01/28 | | | 2,295 |
| | 580,710 | | Pool # 561435 | | 5.50 | | | 11/01/29 | | | 577,876 |
| | 303,582 | | Pool # 578543 | | 5.50 | | | 04/01/31 | | | 301,098 |
| | 112,425 | | Pool # 627259 | | 5.50 | | | 02/01/32 | | | 111,518 |
| | 963,020 | | Pool # 632551 | | 5.50 | | | 02/01/32 | | | 955,252 |
| | 527,269 | | Pool # 632576 | | 5.50 | | | 02/01/32 | | | 522,955 |
| | 224,747 | | Pool # 694655 | | 5.50 | | | 04/01/33 | | | 222,905 |
| | 1,585,620 | | Pool # 702861 | | 5.00 | | | 04/01/18 | | | 1,567,896 |
| | 1,446,560 | | Pool # 704440 | | 5.00 | | | 05/01/18 | | | 1,430,391 |
| | 63,525 | | Pool # 710585 | | 5.50 | | | 05/01/33 | | | 63,004 |
| | 374,864 | | Pool # 735224 | | 5.50 | | | 02/01/35 | | | 371,792 |
| | 5,754,009 | | Pool # 745275 | | 5.00 | | | 02/01/36 | | | 5,564,857 |
| | 23,425,967 | | Pool # 745432 | | 5.50 | | | 04/01/36 | | | 23,204,855 |
| | 1,038,365 | | Pool # 781859 | | 4.50 | | | 12/01/34 | | | 977,121 |
| | 1,430,339 | | Pool # 786423 ARM(b) | | 4.59 | | | 07/01/34 | | | 1,430,408 |
| | 453,699 | | Pool # 797680 | | 4.50 | | | 10/01/35 | | | 426,940 |
| | 653,931 | | Pool # 805373 | | 4.50 | | | 01/01/35 | | | 615,362 |
| | 6,888,911 | | Pool # 805386 ARM(b) | | 4.86 | | | 01/01/35 | | | 6,887,599 |
| | 753,922 | | Pool # 812268 | | 5.50 | | | 05/01/35 | | | 746,806 |
| | 2,384,829 | | Pool # 815479 | | 4.50 | | | 03/01/35 | | | 2,242,304 |
| | 1,311,382 | | Pool # 819361 | | 4.50 | | | 04/01/35 | | | 1,232,440 |
| | 539,362 | | Pool # 820492 | | 5.50 | | | 05/01/35 | | | 534,271 |
| | 789,575 | | Pool # 820989 | | 5.50 | | | 04/01/35 | | | 782,123 |
| | 743,939 | | Pool # 821567 | | 5.50 | | | 06/01/35 | | | 736,917 |
| | 1,825,542 | | Pool # 822799 | | 4.50 | | | 04/01/35 | | | 1,716,442 |
| | 6,286,038 | | Pool # 829321 | | 4.50 | | | 09/01/35 | | | 5,910,363 |
| | 568,677 | | Pool # 835359 | | 4.50 | | | 09/01/35 | | | 534,691 |
| | 10,562,691 | | Pool # 835751 | | 4.50 | | | 08/01/35 | | | 9,931,429 |
| | 1,876,908 | | Pool # 835760 | | 4.50 | | | 09/01/35 | | | 1,764,738 |
| | 1,946,275 | | Pool # 836512 | | 4.50 | | | 10/01/20 | | | 1,884,356 |
| | 4,297,768 | | Pool # 839240 | | 4.50 | | | 09/01/35 | | | 4,040,919 |
| | 6,727,655 | | Pool # 840687 | | 5.00 | | | 09/01/35 | | | 6,506,496 |
| | 2,818,014 | | Pool # 843510 | | 4.50 | | | 11/01/20 | | | 2,728,362 |
| | 2,389,000 | | Pool # 844085 | | 5.00 | | | 11/01/35 | | | 2,310,466 |
| | 1,856,381 | | Pool # 844797 | | 4.50 | | | 10/01/35 | | | 1,745,438 |
| | | | | | | | | | | |
Principal
Amount | | | | Rate | | | Maturity
Date | | Value |
| | | | | | | | | | | |
| U.S. GOVERNMENT AGENCY MORTGAGE PASS THROUGH
SECURITIES — (continued) |
| | | FEDERAL NATIONAL MORTGAGE ASSOCIATION — (continued) | | | |
| $ | 1,895,300 | | Pool # 844901 | | 4.50 | % | | 10/01/20 | | $ | 1,835,003 |
| | 5,733,376 | | Pool # 867438 | | 4.50 | | | 05/01/36 | | | 5,388,279 |
| | 5,280,419 | | Pool # 880084 | | 6.00 | | | 03/01/36 | | | 5,319,669 |
| | 6,234,661 | | Pool # 883084 | | 6.50 | | | 07/01/36 | | | 6,360,137 |
| | 721,630 | | Pool # 893426 | | 6.00 | | | 09/01/36 | | | 726,994 |
| | 3,087,754 | | Pool # 895271 | | 6.50 | | | 09/01/36 | | | 3,149,897 |
| | 15,651,495 | | Pool #745515 | | 5.00 | | | 05/01/36 | | | 15,136,980 |
| | | | | | | | | | | |
| | | | | | | | | | | 148,190,021 |
| | | | | | | | | | | |
| | | GOVERNMENT NATIONAL MORTGAGE ASSOCIATION — 2.08% | | | |
| | 317,132 | | Pool # 2562, | | 6.00 | | | 03/20/28 | | | 322,114 |
| | 427,574 | | Pool # 267812 | | 8.50 | | | 06/15/17 | | | 457,649 |
| | 1,826,845 | | Pool # 3413 | | 4.50 | | | 07/20/33 | | | 1,723,974 |
| | 1,692,191 | | Pool # 3442 | | 5.00 | | | 09/20/33 | | | 1,643,012 |
| | 3,126 | | Pool # 356873 | | 6.50 | | | 05/15/23 | | | 3,212 |
| | 29,602 | | Pool # 434772 | | 9.00 | | | 06/15/30 | | | 32,159 |
| | 62,379 | | Pool # 471660 | | 7.50 | | | 03/15/28 | | | 65,169 |
| | 138,881 | | Pool # 472028 | | 6.50 | | | 05/15/28 | | | 143,024 |
| | 59,613 | | Pool # 475847 | | 6.50 | | | 06/15/28 | | | 61,392 |
| | 20,827 | | Pool # 479087 | | 8.00 | | | 01/15/30 | | | 22,100 |
| | 301,056 | | Pool # 479088 | | 8.00 | | | 01/15/30 | | | 319,463 |
| | 117,882 | | Pool # 503711 | | 7.00 | | | 05/15/29 | | | 123,326 |
| | 41,810 | | Pool # 525556 | | 8.00 | | | 01/15/30 | | | 44,367 |
| | 10,943 | | Pool # 525945 | | 9.00 | | | 07/15/30 | | | 11,888 |
| | 11,128 | | Pool # 532751 | | 9.00 | | | 08/15/30 | | | 12,090 |
| | 107,703 | | Pool # 568670 | | 6.50 | | | 04/15/32 | | | 110,712 |
| | 200,931 | | Pool # 575441 | | 6.50 | | | 12/15/31 | | | 206,730 |
| | 648,104 | | Pool # 598127 | | 5.50 | | | 03/15/18 | | | 652,006 |
| | 1,382,950 | | Pool # 607668 | | 5.50 | | | 02/15/18 | | | 1,391,277 |
| | 804,063 | | Pool # 615639 | | 4.50 | | | 09/15/33 | | | 762,300 |
| | 159,755 | | Pool # 780086 | | 8.50 | | | 11/15/17 | | | 169,766 |
| | 730,469 | | Pool # 780548 | | 8.50 | | | 12/15/17 | | | 776,244 |
| | 558,792 | | Pool # 780865 | | 9.50 | | | 11/15/17 | | | 606,479 |
| | 184,481 | | Pool # 781036 | | 8.00 | | | 10/15/17 | | | 194,274 |
| | 690,973 | | Pool # 781084 | | 9.00 | | | 12/15/17 | | | 739,239 |
| | 178,286 | | Pool # 80185 ARM(b) | | 5.38 | | | 04/20/28 | | | 180,114 |
| | 205,478 | | Pool # 80205 ARM(b) | | 5.38 | | | 06/20/28 | | | 207,590 |
| | 487,576 | | Pool # 80311 ARM(b) | | 5.50 | | | 08/20/29 | | | 492,754 |
| | | | | | | | | | | |
| | | | | | | | | | | 11,474,424 |
| | | | | | | | | | | |
| | | TOTAL U.S. GOVERNMENT AGENCY MORTGAGE PASS THROUGH SECURITIES
(Cost $217,605,864) | | | 218,270,842 |
| | | | | | | | | | | |
| | U.S. GOVERNMENT SECURITIES — 12.34% |
| | | U.S. TREASURY INFLATION PROTECTED BONDS — 0.86% | | | |
| | 300,000 | | | | 4.25 | | | 01/15/10 | | | 383,812 |
| | 445,000 | | | | 3.50 | | | 01/15/11 | | | 546,429 |
| | 1,050,000 | | | | 2.00 | | | 01/15/14 | | | 1,139,021 |
| | 2,500,000 | | | | 2.38 | | | 01/15/25 | | | 2,702,006 |
| | | | | | | | | | | |
| | | | | | | | | | | 4,771,268 |
| | | | | | | | | | | |
See Notes to Financial Statements.
34
Excelsior Funds, Inc.
Portfolio of Investments — March 31, 2007
Core Bond Fund — (continued)
| | | | | | | | | | | |
Principal
Amount | | | | Rate | | | Maturity
Date | | Value |
| | | | | | | | | | | |
| | U.S. GOVERNMENT SECURITIES — (continued) |
| | | U.S. TREASURY NOTES — 11.48% | | | |
| $ | 520,000 | | (f) | | 4.63 | % | | 09/30/08 | | $ | 519,147 |
| | 3,970,000 | | | | 3.63 | | | 01/15/10 | | | 3,874,629 |
| | 26,285,000 | | | | 4.50 | | | 11/15/10 | | | 26,264,498 |
| | 24,450,000 | | | | 7.63 | | | 11/15/22 | | | 31,643,654 |
| | 885,000 | | | | 4.50 | | | 02/15/36 | | | 834,389 |
| | 200,000 | | | | 4.75 | | | 02/15/37 | | | 196,875 |
| | | | | | | | | | | |
| | | | | | | | | | | 63,333,192 |
| | | | | | | | | | | |
| | | TOTAL U.S. GOVERNMENT SECURITIES
(Cost $68,307,564) | | | 68,104,460 |
| | | | | | | | | | | |
| Contracts | | | | | | | | | |
| | CALL OPTION PURCHASED — 0.00% |
| | 10 | | Euro Dollar Future, Expires 12/17/07 strike price 95.75 | | | | | | | | 1,813 |
| | | | | | | | | | | |
| | | TOTAL CALL OPTION PURCHASED
(Cost $3,025) | | | 1,813 |
| | | | | | | | | | | |
| Shares | | | | | | | | | |
| | REGISTERED INVESTMENT COMPANIES — 7.67% |
| | 21,150,173 | | Dreyfus Government Cash Management Fund | | | | | | | | 21,150,173 |
| | 21,150,172 | | Fidelity U.S. Treasury II Fund | | | | | | | | 21,150,172 |
| | | | | | | | | | | |
| | | TOTAL REGISTERED INVESTMENT COMPANIES
(Cost $42,300,345) | | | 42,300,345 |
| | | | | | | | | | | |
| | | | | | | | | | |
TOTAL INVESTMENTS
(Cost $549,299,881) | | 99.75 | % | | | | | | $ | 550,355,840 |
OTHER ASSETS IN EXCESS OF LIABILITIES | | 0.25 | | | | | | | | 1,363,933 |
| | | | | | | | | | |
NET ASSETS | | 100.00 | % | | | | | | | 551,719,773 |
| | | | | | | | | | |
| (a) | Security exempt from registration under Rule 144A of the Securities Act of 1933. This security may be resold in transactions exempt from registration, normally to qualified institutional buyers. At March 31, 2007, these securities amounted to $9,251,764 or 1.68% of net assets. |
| (b) | Variable Rate Security—The rate disclosed is as of March 31, 2007. |
| (c) | Perpetual Security—Stated maturity is first par call date. |
| (d) | All or part of the security is segregated by the Fund’s custodian to cover future purchase commitments. |
| (f) | All or part of the security serves as collateral for futures contracts. |
ARM—Adjustable Rate Mortgage
LLC—Limited Liability Company
MTN—Medium Term Note
Multi-Coupon Bond—Coupon rate may increase or decrease in response to a change in the quality rating by an independent rating agency.
plc—Public Limited Company
STRIPS—Separately Traded Registered Interest and Principal Securities
| | | | | | | | |
| Contracts | | | | Value | | | Unrealized
Appreciation/
Depreciation | |
| FUTURES CONTRACTS | |
| | Long— | | | | | | |
| 85 | | U.S. 2 Year Treasury Note, expiring June 29, 2007 (notional amount $17,435,838) | | $17,415,703 | | | $(20,135 | ) |
| | Short— | | | | | | |
| (30) | | U.S. Long-Term Treasury Bond, expiring June 20, 2007 (notional amount $(3,398,363)) | | (3,337,500 | ) | | 60,863 | |
| | | | | | | | |
| | Total Futures Contracts
(Total notional amount $14,037,475) | | $14,078,203 | | | $40,728 | |
| | | | | | | | |
See Notes to Financial Statements.
35
Excelsior Funds, Inc.
Portfolio of Investments — March 31, 2007
Core Bond Fund — (continued)
The summary of the Fund’s investments as of March 31, 2007 is as follows: (Unaudited)
| | | | | | |
Portfolio Diversification | | % of
Net
Assets | | | Value |
U.S. Government & Agency Securities | | 54.27 | % | | $ | 299,498,066 |
Corporate Bonds | | 17.21 | | | | 94,955,441 |
Commercial Mortgage-Backed Securities | | 11.77 | | | | 64,921,792 |
Collateralized Mortgage Obligations | | 7.74 | | | | 42,696,276 |
Registered Investment Companies | | 7.67 | | | | 42,300,345 |
Asset Backed Securities | | 0.77 | | | | 4,220,546 |
Tax-Exempt Securities | | 0.32 | | | | 1,761,561 |
Call Option | | 0.00 | | | | 1,813 |
| | | | | | |
Total Investments | | 99.75 | % | | $ | 550,355,840 |
Other Assets in Excess of Liabilities | | 0.25 | | | | 1,363,933 |
| | | | | | |
Net Assets | | 100.00 | % | | $ | 551,719,773 |
| | | | | | |
See Notes to Financial Statements.
36
Excelsior Funds Trust
Portfolio of Investments — March 31, 2007
High Yield Fund
| | | | | | | | | | | |
Principal
Amount | | | | Rate | | | Maturity
Date | | Value |
| | | | | | | | | | | |
| | CORPORATE BONDS — 89.98% |
| | | ADVERTISING PERIODICALS — 2.74% |
| $ | 2,000,000 | | Dex Media Finance/West | | 8.50 | % | | 08/15/10 | | $ | 2,092,500 |
| | 1,000,000 | | RH Donnelley Finance Corp.(a) | | 10.88 | | | 12/15/12 | | | 1,080,000 |
| | | | | | | | | | | |
| | | | | | | | | | | 3,172,500 |
| | | | | | | | | | | |
| | | CABLE TV — 1.80% |
| | 1,000,000 | | Echostar DBS Corp. | | 7.13 | | | 02/01/16 | | | 1,032,500 |
| | 1,000,000 | | NTL Cable plc | | 9.13 | | | 08/15/16 | | | 1,055,000 |
| | | | | | | | | | | |
| | | | | | | | | | | 2,087,500 |
| | | | | | | | | | | |
| | | CASINO HOTELS — 7.76% |
| | 1,000,000 | | American Casino & Entertainment | | 7.85 | | | 02/01/12 | | | 1,040,000 |
| | 1,000,000 | | Boyd Gaming Corp. | | 7.13 | | | 02/01/16 | | | 980,000 |
| | 1,500,000 | | Majestic Star llc. | | 9.75 | | | 01/15/11 | | | 1,428,750 |
| | 1,000,000 | | MGM Mirage, Inc. | | 8.50 | | | 09/15/10 | | | 1,068,750 |
| | 2,000,000 | | Poster Financial Group | | 8.75 | | | 12/01/11 | | | 2,080,000 |
| | 1,000,000 | | Station Casinos, Inc. | | 6.63 | | | 03/15/18 | | | 890,000 |
| | 1,500,000 | | Trump Entertainment Resorts | | 8.50 | | | 06/01/15 | | | 1,515,000 |
| | | | | | | | | | | |
| | | | | | | | | | | 9,002,500 |
| | | | | | | | | | | |
| | | CELLULAR TELECOM — 1.19% |
| | 330,000 | | American Cellular Corp. | | 10.00 | | | 08/01/11 | | | 349,388 |
| | 1,000,000 | | Dobson Communications Corp. | | 8.88 | | | 10/01/13 | | | 1,030,000 |
| | | | | | | | | | | |
| | | | | | | | | | | 1,379,388 |
| | | | | | | | | | | |
| | | CHEMICALS - DIVERSIFIED — 1.39% |
| | 1,000,000 | | Lyondell Chemical Co. | | 10.50 | | | 06/01/13 | | | 1,095,000 |
| | 500,000 | | Nell AF Sarl(a) | | 8.38 | | | 08/15/15 | | | 521,250 |
| | | | | | | | | | | |
| | | | | | | | | | | 1,616,250 |
| | | | | | | | | | | |
| | | CHEMICALS - SPECIALTY — 0.91% |
| | 1,000,000 | | Tronox Worldwide LLC/Tronox Finance Corp. | | 9.50 | | | 12/01/12 | | | 1,060,000 |
| | | | | | | | | | | |
| | | COAL — 1.70% |
| | 1,000,000 | | Massey Energy Co. | | 6.88 | | | 12/15/13 | | | 948,750 |
| | 1,000,000 | | Peabody Energy Corp., Series B | | 6.88 | | | 03/15/13 | | | 1,017,500 |
| | | | | | | | | | | |
| | | | | | | | | | | 1,966,250 |
| | | | | | | | | | | |
| | | COMMERCIAL SERVICES — 1.77% | | | |
| | 1,000,000 | | Iron Mountain, Inc. | | 8.63 | | | 04/01/13 | | | 1,029,000 |
| | 1,000,000 | | Iron Mountain, Inc. | | 7.75 | | | 01/15/15 | | | 1,020,000 |
| | | | | | | | | | | |
| | | | | | | | | | | 2,049,000 |
| | | | | | | | | | | |
| | | | | | | | | | | |
Principal
Amount | | | | Rate | | | Maturity
Date | | Value |
| | | | | | | | | | | |
| | CORPORATE BONDS — (continued) |
| | | COMPUTER SERVICES — 0.94% | | | |
| $ | 1,000,000 | | Sungard Data Systems, Inc. | | 10.25 | % | | 08/15/15 | | $ | 1,091,250 |
| | | | | | | | | | | |
| | | CONTAINERS - METAL/GLASS — 1.78% | | | |
| | 1,000,000 | | Crown Americas | | 7.75 | | | 11/15/15 | | | 1,040,000 |
| | 1,000,000 | | Owens-Brockway Glass Containers | | 8.88 | | | 02/15/09 | | | 1,020,000 |
| | | | | | | | | | | |
| | | | | | | | | | | 2,060,000 |
| | | | | | | | | | | |
| | | CONTAINERS - PAPER/PLASTIC — 2.66% |
| | 1,000,000 | | Graham Packaging Co. | | 8.50 | | | 10/15/12 | | | 1,015,000 |
| | 1,000,000 | | Jefferson Smurfit Corp. | | 7.50 | | | 06/01/13 | | | 970,000 |
| | 1,000,000 | | Pregis Corp.(a) | | 12.38 | | | 10/15/13 | | | 1,100,000 |
| | | | | | | | | | | |
| | | | | | | | | | | 3,085,000 |
| | | | | | | | | | | |
| | | COSMETICS & TOILETRIES — 1.21% | | | |
| | 1,500,000 | | Del Laboratories, Inc. | | 8.00 | | | 02/01/12 | | | 1,398,750 |
| | | | | | | | | | | |
| | | DISTRIBUTION/WHOLESALE — 0.87% | | | |
| | 1,000,000 | | Nebraska Book Co. | | 8.63 | | | 03/15/12 | | | 1,007,500 |
| | | | | | | | | | | |
| | | DIVERSIFIED MANUFACTURING OPERATIONS — 0.89% | | | |
| | 1,000,000 | | Bombardier, Inc.(a) | | 8.00 | | | 11/15/14 | | | 1,035,000 |
| | | | | | | | | | | |
| | | ELECTRIC - GENERATION — 1.38% | | | |
| | 1,500,000 | | AES Corp. | | 9.50 | | | 06/01/09 | | | 1,597,500 |
| | | | | | | | | | | |
| | | ELECTRONIC COMPONENTS - SEMICONDUCTORS — 2.19% | | | |
| | 1,000,000 | | Amkor Technologies, Inc. | | 9.25 | | | 06/01/16 | | | 1,042,500 |
| | 500,000 | | Freescale Semiconductor(a) | | 8.88 | | | 12/15/14 | | | 500,625 |
| | 1,000,000 | | Freescale Semiconductor(a) | | 9.13 | | | 12/15/14 | | | 992,500 |
| | | | | | | | | | | |
| | | | | | | | | | | 2,535,625 |
| | | | | | | | | | | |
| | | FINANCE - AUTO LOANS — 3.00% | | | |
| | 1,354,000 | | Ford Motor Credit Co.(a) | | 9.75 | | | 09/15/10 | | | 1,426,225 |
| | 2,000,000 | | General Motors Acceptance Corp. | | 7.75 | | | 01/19/10 | | | 2,052,842 |
| | | | | | | | | | | |
| | | | | | | | | | | 3,479,067 |
| | | | | | | | | | | |
| | | FINANCE - INVESTMENT BNKR/BRKR — 0.06% |
| | 60,000 | | BCP Crystal Holdings Corp. | | 9.63 | | | 06/15/14 | | | 68,155 |
| | | | | | | | | | | |
| | | FOOD & KINDRED PRODUCTS — 0.85% | | | |
| | 1,000,000 | | Pinnacle Foods Finance LLC(a) | | 9.25 | | | 04/01/15 | | | 982,500 |
| | | | | | | | | | | |
See Notes to Financial Statements.
37
Excelsior Funds Trust
Portfolio of Investments — March 31, 2007
High Yield Fund — (continued)
| | | | | | | | | | | |
Principal
Amount | | | | Rate | | | Maturity
Date | | Value |
| | | | | | | | | | | |
| | CORPORATE BONDS — (continued) |
| | | FOOD - MISCELLANEOUS AND DIVERSIFIED — 1.78% |
| $ | 1,000,000 | | Del Monte Corporation | | 8.63 | % | | 12/15/12 | | $ | 1,040,000 |
| | 1,000,000 | | Del Monte Corporation | | 6.75 | | | 02/15/15 | | | 988,750 |
| | 40,000 | | Dole Foods Co. | | 7.25 | | | 06/15/10 | | | 38,200 |
| | | | | | | | | | | |
| | | | | | | | | | | 2,066,950 |
| | | | | | | | | | | |
| | | FUNERAL SERVICES & RELATED ITEMS — 1.30% |
| | 1,500,000 | | Service Corp. International | | 7.00 | | | 06/15/17 | | | 1,511,250 |
| | | | | | | | | | | |
| | | HEAVY CONSTRUCTION EQUIPMENT RENTAL — 0.90% | | | |
| | 1,000,000 | | Ahern Rentals, Inc. | | 9.25 | | | 08/15/13 | | | 1,043,750 |
| | | | | | | | | | | |
| | | HOME FURNISHINGS — 1.79% |
| | 1,000,000 | | Sealy Mattress Co. | | 8.25 | | | 06/15/14 | | | 1,052,500 |
| | 1,000,000 | | Simmons Co. | | 7.88 | | | 01/15/14 | | | 1,025,000 |
| | | | | | | | | | | |
| | | | | | | | | | | 2,077,500 |
| | | | | | | | | | | |
| | | MACHINERY - FARM — 0.45% |
| | 500,000 | | Case New Holland, Inc. | | 7.13 | | | 03/01/14 | | | 520,000 |
| | | | | | | | | | | |
| | | MACHINERY - GENERAL INDUSTRIAL — 0.88% |
| | 1,000,000 | | The Manitowoc Co., Inc. | | 7.13 | | | 11/01/13 | | | 1,020,000 |
| | | | | | | | | | | |
| | | MEDICAL - HOSPITALS — 0.90% |
| | 1,000,000 | | HCA, Inc. | | 8.75 | | | 09/01/10 | | | 1,048,750 |
| | | | | | | | | | | |
| | | MULTI-LINE INSURANCE — 1.97% |
| | 2,128,000 | | Hanover Insurance Group | | 7.63 | | | 10/15/25 | | | 2,285,349 |
| | | | | | | | | | | |
| | | MUSIC — 1.31% |
| | 1,600,000 | | Warner Music Group | | 7.38 | | | 04/15/14 | | | 1,524,000 |
| | | | | | | | | | | |
| | | OFFICE AUTOMATION & EQUIPMENT — 3.14% |
| | 1,000,000 | | Ikon Office Solutions | | 7.75 | | | 09/15/15 | | | 1,045,000 |
| | 1,000,000 | | Xerox Capital Trust I | | 8.00 | | | 02/01/27 | | | 1,020,000 |
| | 1,500,000 | | Xerox Corp. | | 7.63 | | | 06/15/13 | | | 1,573,125 |
| | | | | | | | | | | |
| | | | | | | | | | | 3,638,125 |
| | | | | | | | | | | |
| | | PAPER & RELATED PRODUCTS — 0.86% |
| | 1,000,000 | | Mercer International, Inc. | | 9.25 | | | 02/15/13 | | | 1,002,500 |
| | | | | | | | | | | |
| | | PHYSICIANS PRACTICE MANAGEMENT — 3.18% |
| | 2,000,000 | | Ameripath, Inc. | | 10.50 | | | 04/01/13 | | | 2,140,000 |
| | 500,000 | | US Oncology Holdings, Inc. | | 9.00 | | | 08/15/12 | | | 533,750 |
| | 1,000,000 | | US Oncology Holdings, Inc.(b) | | 10.58 | | | 03/15/15 | | | 1,020,000 |
| | | | | | | | | | | |
| | | | | | | | | | | 3,693,750 |
| | | | | | | | | | | |
| | | | | | | | | | | |
Principal
Amount | | | | Rate | | | Maturity
Date | | Value |
| | | | | | | | | | | |
| | CORPORATE BONDS — (continued) |
| | | PIPELINES — 1.75% |
| $ | 1,500,000 | | Semgroup L.P.(a) | | 8.75 | % | | 11/15/15 | | $ | 1,522,500 |
| | 500,000 | | Williams Cos.(a) | | 6.38 | | | 10/01/10 | | | 506,875 |
| | | | | | | | | | | |
| | | | | | | | | | | 2,029,375 |
| | | | | | | | | | | |
| | | RACETRACKS — 0.84% |
| | 1,000,000 | | Penn National Gaming, Inc. | | 6.75 | | | 03/01/15 | | | 970,000 |
| | | | | | | | | | | |
| | | RENTAL AUTO/EQUIPMENT — 2.68% | | | |
| | 1,000,000 | | Avis Budget Car Rental(a) | | 7.75 | | | 05/15/16 | | | 1,020,000 |
| | 1,000,000 | | Rental Service Corp.(a) | | 9.50 | | | 12/01/14 | | | 1,065,000 |
| | 1,000,000 | | United Rentals, Inc. | | 7.75 | | | 11/15/13 | | | 1,027,500 |
| | | | | | | | | | | |
| | | | | | | | | | | 3,112,500 |
| | | | | | | | | | | |
| | | RESORTS/THEME PARKS — 0.89% | | | |
| | 1,000,000 | | Universal City Florida Holdings(b) | | 10.11 | | | 05/01/10 | | | 1,031,250 |
| | | | | | | | | | | |
| | | RETAIL - APPAREL/SHOE — 1.10% | | | |
| | 1,250,000 | | Burlington Coat Factory | | 11.13 | | | 04/15/14 | | | 1,275,000 |
| | | | | | | | | | | |
| | | RETAIL - ARTS & CRAFTS — 0.93% | | | |
| | 1,000,000 | | Michaels Stores, Inc.(a) | | 11.38 | | | 11/01/16 | | | 1,077,500 |
| | | | | | | | | | | |
| | | RETAIL - DRUG STORE — 2.51% | | | |
| | 1,000,000 | | Jean Coutu Group, Inc. | | 8.50 | | | 08/01/14 | | | 1,085,000 |
| | 1,000,000 | | Rite Aid Corp. | | 8.63 | | | 03/01/15 | | | 946,250 |
| | 1,000,000 | | Rite-Aid Corp. | | 6.88 | | | 08/15/13 | | | 880,000 |
| | | | | | | | | | | |
| | | | | | | | | | | 2,911,250 |
| | | | | | | | | | | |
| | | RETAIL - MAJOR DEPARTMENT STORE — 1.90% |
| | 1,000,000 | | Neiman Marcus Group, Inc. | | 9.00 | | | 10/15/15 | | | 1,095,000 |
| | 1,000,000 | | Saks, Inc. | | 9.88 | | | 10/01/11 | | | 1,112,500 |
| | | | | | | | | | | |
| | | | | | | | | | | 2,207,500 |
| | | | | | | | | | | |
| | | RETAIL - TOY STORE — 1.11% | | | |
| | 1,500,000 | | Toys R Us | | 7.38 | | | 10/15/18 | | | 1,290,000 |
| | | | | | | | | | | |
| | | RETAIL - VIDEO RENTAL — 1.74% | | | |
| | 2,000,000 | | Blockbuster, Inc.(b) | | 9.00 | | | 09/01/12 | | | 2,020,000 |
| | | | | | | | | | | |
| | | SATELLITE TELECOM — 2.54% | | | |
| | 650,000 | | Inmarsat Finance plc | | 7.63 | | | 06/30/12 | | | 677,625 |
| | 2,000,000 | | Intelsat Bermuda Ltd. | | 11.25 | | | 06/15/16 | | | 2,270,000 |
| | | | | | | | | | | |
| | | | | | | | | | | 2,947,625 |
| | | | | | | | | | | |
| | | SCHOOLS — 1.27% | | | |
| | 1,500,000 | | Knowledge Learning Center(a) | | 7.75 | | | 02/01/15 | | | 1,473,750 |
| | | | | | | | | | | |
See Notes to Financial Statements.
38
Excelsior Funds Trust
Portfolio of Investments — March 31, 2007
High Yield Fund — (continued)
| | | | | | | | | | | |
Principal
Amount | | | | Rate | | | Maturity
Date | | Value |
| | | | | | | | | | | |
| | CORPORATE BONDS — (continued) |
| | | SPECIAL PURPOSE ENTITY — 6.62% | | | |
| $ | 5,580,000 | | Targeted Return Index Securities Trust (TRAIN), Series HY-1-2006(a)(b) | | 7.55 | % | | 05/01/16 | | $ | 5,673,856 |
| | 2,000,000 | | Wimar OPCO LLC(a)(c) | | 9.63 | | | 12/15/14 | | | 2,007,500 |
| | | | | | | | | | | |
| | | | | | | | | | | 7,681,356 |
| | | | | | | | | | | |
| | | TELECOM SERVICES — 0.89% | | | |
| | 1,000,000 | | West Corp(a) | | 9.50 | | | 10/15/14 | | | 1,035,000 |
| | | | | | | | | | | |
| | | TELEPHONE - INTERGRATED — 8.71% |
| | 2,000,000 | | Cincinnati Bell, Inc., | | 8.38 | | | 01/15/14 | | | 2,045,000 |
| | 2,000,000 | | Citizens Communications | | 9.25 | | | 05/15/11 | | | 2,229,999 |
| | 649,000 | | Consolidated Communications Holding | | 9.75 | | | 04/01/12 | | | 687,129 |
| | 1,500,000 | | Hawaiian Telcom Communication | | 12.50 | | | 05/01/15 | | | 1,642,500 |
| | 1,250,000 | | Nordic Telephone Co. Holdings(a) | | 8.88 | | | 05/01/16 | | | 1,337,500 |
| | 1,000,000 | | Valor Telecom Enterprise | | 7.75 | | | 02/15/15 | | | 1,077,500 |
| | 1,000,000 | | Windstream Corp. | | 8.63 | | | 08/01/16 | | | 1,093,750 |
| | | | | | | | | | | |
| | | | | | | | | | | 10,113,378 |
| | | | | | | | | | | |
| | | TRAVEL SERVICES — 0.95% | | | |
| | 1,000,000 | | Travelport, Inc.(a) | | 11.88 | | | 09/01/16 | | | 1,096,250 |
| | | | | | | | | | | |
| | | TOTAL CORPORATE BONDS
(Cost $101,609,771) | | | 104,377,393 |
| | | | | | | | | | | |
| | BANK LOANS — 0.44% |
| | | MISCELLANEOUS MANUFACTURING — 0.44% |
| | 500,000 | | IPC Acquisition Corp.(b)(d) | | 11.86 | | | 09/29/14 | | | 507,500 |
| | | | | | | | | | | |
| | | TOTAL BANK LOANS
(Cost $500,000) | | | 507,500 |
| | | | | | | | | | | |
| | | | | | | | | | | |
Shares | | | | Rate | | | Maturity
Date | | Value |
| | | | | | | | | | | |
| | COMMON STOCK — 2.57% |
| | | METAL - ALUMINUM — 2.57% | | | |
| | 152,380 | | Ormet Corp. | | | | | | | $ | 2,979,029 |
| | | | | | | | | | | |
| | | TOTAL COMMON STOCK
(Cost $1,219,040) | | | 2,979,029 |
| | | | | | | | | | | |
Principal
Amount | | | | | | | | | |
| | U.S. GOVERNMENT AGENCY BONDS & NOTES — 6.12% |
| | | FEDERAL HOME LOAN BANK — 6.12% |
| $ | 7,100,000 | | Discount Note | | 0.00 | % | | 04/02/07 | | | 7,097,059 |
| | | | | | | | | | | |
| | | TOTAL U.S. GOVERNMENT AGENCY BONDS AND NOTES
(Cost $7,099,020) | | | 7,097,059 |
| | | | | | | | | | | |
| | | | | | |
TOTAL INVESTMENTS
(Cost $110,427,831) | | 99.11 | % | | $ | 114,960,981 |
OTHER ASSETS IN EXCESS OF LIABILITIES | | 0.89 | | | | 1,035,924 |
| | | | | | |
NET ASSETS | | 100.00 | % | | $ | 115,996,905 |
| | | | | | |
| (a) | Security exempt from registration under Rule 144A of the Securities Act of 1933. This security may be resold in transactions exempt from registration, normally to qualified institutional buyers. At March 31, 2007, these securities amounted to $25,453,831 or 21.94% of net assets. |
| (b) | Variable Rate Security—The rate disclosed is as of March 31, 2007. |
| (c) | All or part of the security is segregated by the Fund’s custodian to cover future purchase commitments. |
| (d) | Fair valued as of March 31, 2007. |
Discount Note—The rate reported on the Portfolio of Investments is the discount rate at the time of purchase.
LLC—Limited Liability Company
L.P.—Limited Partnership
Ltd.—Limited
plc—public limited company
See Notes to Financial Statements.
39
Excelsior Funds Trust
Portfolio of Investments — March 31, 2007
High Yield Fund — (continued)
The summary of the Fund’s investments as of March 31, 2007 is as follows: (Unaudited)
| | | | | | |
Sector Diversification | | % of
Net
Assets | | | Value |
Consumer Discretionary | | 39.66 | % | | $ | 46,015,698 |
Telecommunication | | 11.71 | | | | 13,582,766 |
Materials | | 9.73 | | | | 11,281,529 |
Information Technology | | 8.34 | | | | 9,675,125 |
Industrials | | 7.99 | | | | 9,263,375 |
U.S. Government & Agency Obligations | | 6.12 | | | | 7,097,059 |
Health Care | | 5.39 | | | | 6,253,750 |
Consumer Staples | | 3.83 | | | | 4,448,200 |
Financials | | 3.26 | | | | 3,779,729 |
Energy | | 1.70 | | | | 1,966,250 |
Utilities | | 1.38 | | | | 1,597,500 |
| | | | | | |
Total Investment | | 99.11 | % | | $ | 114,960,981 |
Other Assets in Excess of Liabilities | | 0.89 | | | | 1,035,924 |
| | | | | | |
Net Assets | | 100.00 | % | | $ | 115,996,905 |
| | | | | | |
See Notes to Financial Statements.
40
Excelsior Funds Trust
Portfolio of Investments — March 31, 2007
Equity Opportunities Fund
| | | | | |
| Shares | | | | Value |
| | | | | |
| COMMON STOCKS — 90.31% | | |
| | | CONSUMER DISCRETIONARY — 11.74% |
| 105,750 | | BorgWarner, Inc. | | $ | 7,975,665 |
| 148,100 | | Dillards, Inc., Class A | | | 4,847,313 |
| 155,000 | | John Wiley & Sons, Class A | | | 5,852,800 |
| 148,450 | | Life Time Fitness, Inc.(a) | | | 7,631,815 |
| 203,200 | | Sotheby’s Holdings, Inc., Class A | | | 9,038,336 |
| 167,000 | | Timberland Co., Class A(a) | | | 4,347,010 |
| | | | | |
| | | | | 39,692,939 |
| | | | | |
| | | CONSUMER STAPLES — 4.42% |
| 144,600 | | Anheuser Busch Cos., Inc. | | | 7,296,516 |
| 220,000 | | Senomyx, Inc.(a) | | | 2,723,600 |
| 96,600 | | Wm. Wrigley Jr. Co. | | | 4,919,838 |
| | | | | |
| | | | | 14,939,954 |
| | | | | |
| | ENERGY — 8.52% | | | |
| 98,000 | | Apache Corp. | | | 6,928,600 |
| 571,000 | | EL Paso Corp. | | | 8,262,370 |
| 87,500 | | Exxon Mobil Corp. | | | 6,601,875 |
| 91,550 | | Suncor Energy, Inc. ADR | | | 6,989,843 |
| | | | | |
| | | | | 28,782,688 |
| | | | | |
| | FINANCIAL — 16.24% | | | |
| 386,100 | | Aegon N.V. | | | 7,698,834 |
| 155,000 | | American Capital Strategies Ltd. | | | 6,868,050 |
| 79 | | Berkshire Hathaway, Inc.,
Class A(a) | | | 8,610,210 |
| 41,500 | | Lehman Brothers Holding, Inc. | | | 2,907,905 |
| 269,000 | | Leucadia National Corp. | | | 7,913,980 |
| 106,000 | | NYSE Group, Inc.(a) | | | 9,937,499 |
| 206,000 | | Progressive Corp. | | | 4,494,920 |
| 128,000 | | RenaissanceRe Holdings Ltd. | | | 6,417,920 |
| | | | | |
| | | | | 54,849,318 |
| | | | | |
| | HEALTH CARE — 8.42% |
| 97,100 | | Johnson & Johnson | | | 5,851,246 |
| 105,000 | | Medtronic, Inc. | | | 5,151,300 |
| 105,100 | | Novo-Nordisk A/S ADR | | | 9,514,703 |
| 90,150 | | Roche Holdings Ltd. ADR | | | 7,938,339 |
| | | | | |
| | | | | 28,455,588 |
| | | | | |
| | INDUSTRIALS — 15.95% | | | |
| 2,833,000 | | Bombardier, Inc., Class B(a) | | | 11,436,820 |
| 127,700 | | Canadian National Railway Co. | | | 5,636,678 |
| 150,200 | | Expeditors International of Washington, Inc. | | | 6,206,264 |
| | | | | |
| Shares | | | | Value |
| | | | | |
| COMMON STOCKS — (continued) | | |
| | INDUSTRIALS — (continued) | | | |
| 160,100 | | General Electric Co. | | $ | 5,661,136 |
| 426,200 | | Quanta Services, Inc.(a) | | | 10,748,764 |
| 181,700 | | Rolls-Royce Group plc ADR | | | 8,848,790 |
| 173,700 | | Simpson Manufacturing Co., Inc. | | | 5,356,908 |
| | | | | |
| | | | | 53,895,360 |
| | | | | |
| | INFORMATION TECHNOLOGY — 5.82% |
| 1,430,000 | | 3com Corp.(a) | | | 5,591,300 |
| 86,400 | | International Rectifier Corp. (a) | | | 3,301,344 |
| 152,400 | | Microchip Technology, Inc. | | | 5,414,772 |
| 205,000 | | National Instruments Corp. | | | 5,377,150 |
| | | | | |
| | | | | 19,684,566 |
| | | | | |
| | MATERIALS — 11.45% |
| 120,250 | | Aracruz Cellulose S.A. ADR | | | 6,309,518 |
| 20,500 | | IPSCO, Inc. | | | 2,693,700 |
| 184,300 | | Monsanto Co. | | | 10,129,128 |
| 127,900 | | Nucor Corp. | | | 8,330,127 |
| 96,400 | | Vulcan Materials Co. | | | 11,228,672 |
| | | | | |
| | | | | 38,691,145 |
| | | | | |
| | REAL ESTATE — 1.56% |
| 101,100 | | St. Joe Co. | | | 5,288,541 |
| | | | | |
| | UTILITIES — 6.19% |
| 430,600 | | AES Corp.(a) | | | 9,266,512 |
| 239,000 | | Centerpoint Energy, Inc. | | | 4,287,660 |
| 424,100 | | Sierra Pacific Resources(a) | | | 7,370,858 |
| | | | | |
| | | | | 20,925,030 |
| | | | | |
| | TOTAL COMMON STOCKS
(Cost $251,082,492) | | | 305,205,129 |
| | | | | |
| FOREIGN COMMON STOCKS — 5.90% |
| | BELGIUM — 1.77% |
| 299,000 | | RHJ International(a) | | | 5,990,623 |
| | | | | |
| | GERMANY — 1.66% |
| 95,200 | | Bayerische Motoren Werke AG | | | 5,623,241 |
| | | | | |
| | SINGAPORE — 2.47% |
| 1,600,000 | | Olam International Ltd. | | | 3,213,760 |
| 1,190,385 | | Singapore Exchange Ltd. | | | 5,119,786 |
| | | | | |
| | | | | 8,333,546 |
| | | | | |
| | TOTAL FOREIGN COMMON STOCKS
(Cost $18,425,117) | | | 19,947,410 |
| | | | | |
See Notes to Financial Statements.
41
Excelsior Funds Trust
Portfolio of Investments — March 31, 2007
Equity Opportunities Fund — (continued)
| | | | | |
Principal
Amount | | | | Value |
| | | | | |
| REPURCHASE AGREEMENT — 3.87% |
| $13,082,000 | | JP Morgan Chase Securities, Inc., 5.06%, dated 3/30/07, to be repurchased 4/02/07, repurchase price $13,087,516 (collateralized by U.S. Government Obligations, ranging in par value $4,185,000-$4,500,000, 4.60%-5.46%, 04/11/08-03/08/13; total market value $13,232,533) | | $ | 13,082,000 |
| | | | | |
| | TOTAL REPURCHASE AGREEMENT
(Cost $13,082,000) | | | 13,082,000 |
| | | | | |
| | | | | | | |
TOTAL INVESTMENTS
(Cost $282,589,609) | | 100.08 | % | | $ | 338,234,539 | |
LIABILITIES IN EXCESS OF OTHER ASSETS | | (0.08 | ) | | | (254,789 | ) |
| | | | | | | |
NET ASSETS | | 100.00 | % | | $ | 337,979,750 | |
| | | | | | | |
| (a) | Non-income producing security. |
ADR—American Depositary Receipt
Ltd.—Limited
At March 31, 2007, the prices of certain foreign securities held by the fund aggregating $19,947,410 were adjusted from their closing market prices following the guidelines adopted by the fund’s board of trustees.
The summary of the Fund’s investments as of March 31, 2007 is as follows: (Unaudited)
| | | | | | | |
Sector Diversification | | % of
Net
Assets | | | Value | |
Financial | | 19.53 | % | | $ | 65,959,727 | |
Industrials | | 15.95 | | | | 53,895,360 | |
Consumer Discretionary | | 13.40 | | | | 45,316,180 | |
Materials | | 11.45 | | | | 38,691,145 | |
Energy | | 8.52 | | | | 28,782,688 | |
Health Care | | 8.42 | | | | 28,455,588 | |
Utilities | | 6.19 | | | | 20,925,030 | |
Information Technology | | 5.82 | | | | 19,684,566 | |
Consumer Staples | | 5.37 | | | | 18,153,714 | |
Repurchase Agreements | | 3.87 | | | | 13,082,000 | |
Real estate | | 1.56 | | | | 5,288,541 | |
| | | | | | | |
Total Investment | | 100.08 | % | | $ | 338,234,539 | |
Other Assets in Excess of Liabilities | | (0.08 | ) | | | (254,789 | ) |
| | | | | | | |
Net Assets | | 100.00 | % | | $ | 337,979,750 | |
| | | | | | | |
See Notes to Financial Statements
42
Excelsior Funds, Inc.
Portfolio of Investments — March 31, 2007
Large Cap Growth Fund
| | | | | |
| Shares | | | | Value |
| | | | | |
| COMMON STOCKS — 99.05% |
| | CONSUMER DISCRETIONARY — 18.33% |
| 422,700 | | Best Buy Co., Inc. | | $ | 20,593,944 |
| 476,700 | | Coach, Inc.(a) | | | 23,858,835 |
| 756,000 | | eBay(a) | | | 25,061,400 |
| 253,200 | | Las Vegas Sands Corp.(a) | | | 21,929,652 |
| 663,300 | | Lowes Companies, Inc. | | | 20,887,317 |
| 709,700 | | Starbucks Corp.(a) | | | 22,256,192 |
| | | | | |
| | | | | 134,587,340 |
| | | | | |
| | FINANCIAL — 8.80% |
| 50,800 | | Chicago Mercantile Exchange | | | 27,048,968 |
| 294,100 | | Lehman Brothers Holding, Inc. | | | 20,607,587 |
| 414,600 | | SLM Corp. | | | 16,957,140 |
| | | | | |
| | | | | 64,613,695 |
| | | | | |
| | HEALTH CARE — 26.89% |
| 195,155 | | Alcon, Inc. | | | 25,725,332 |
| 241,800 | | Allergan, Inc. | | | 26,796,276 |
| 354,800 | | Amgen, Inc.(a) | | | 19,826,224 |
| 564,900 | | Celgene Corp.(a) | | | 29,634,654 |
| 287,300 | | Genentech, Inc.(a) | | | 23,593,076 |
| 390,758 | | Gilead Sciences, Inc.(a) | | | 29,892,987 |
| 200,300 | | Intuitive Surgical, Inc.(a) | | | 24,350,471 |
| 207,112 | | Zimmer Holdings, Inc.(a) | | | 17,689,436 |
| | | | | |
| | | | | 197,508,456 |
| | | | | |
| | INDUSTRIALS — 6.60% |
| 361,131 | | Corporate Executive Board Co. | | | 27,431,511 |
| 510,000 | | Expeditors International of Washington, Inc. | | | 21,073,200 |
| | | | | |
| | | | | 48,504,711 |
| | | | | |
| | INFORMATION TECHNOLOGY — 34.17% |
| 572,500 | | Adobe Systems, Inc.(a) | | | 23,873,250 |
| 591,700 | | Akamai Technologies, Inc.(a) | | | 29,537,664 |
| 317,100 | | Apple Computer, Inc.(a) | | | 29,461,761 |
| 729,487 | | Broadcom Corp., Class A(a) | | | 23,394,648 |
| 1,083,500 | | Corning, Inc.(a) | | | 24,638,790 |
| 431,815 | | Electronic Arts, Inc.(a) | | | 21,746,203 |
| 60,873 | | Google, Inc., Class A(a) | | | 27,889,574 |
| 368,406 | | Infosys Technologies Ltd. ADR | | | 18,512,402 |
| 716,100 | | Qualcomm, Inc. | | | 30,548,825 |
| 155,900 | | Research In Motion Ltd.(a) | | | 21,278,791 |
| | | | | |
| | | | | 250,881,908 |
| | | | | |
| | | | | | |
| Shares | | | | Value |
| | | | | | |
| COMMON STOCKS — (continued) |
| | | TELECOMMUNICATION SERVICES — 4.26% |
| | 655,200 | | America Movil S.A. de C.V.,
Series L ADR | | $ | 31,312,008 |
| | | | | | |
| | | TOTAL COMMON STOCKS
(Cost $603,454,025) | | | 727,408,118 |
| | | | | | |
Principal
Amount | | | | |
| REPURCHASE AGREEMENT — 0.93% |
| $ | 6,859,000 | | JP Morgan Chase Securities, Inc.,
5.06%, dated 3/30/07, to be repurchased 4/02/07, repurchase price $6,861,892 (collateralized by U.S. Government Obligation, par value $6,820,000, 3.63%, 06/20/07; total market value $6,927,670) | | | 6,859,000 |
| | | | | | |
| | | TOTAL REPURCHASE AGREEMENT (Cost $6,859,000) | | $ | 6,859,000 |
| | | | | | |
| | | | | | |
TOTAL INVESTMENTS
(Cost $610,313,025) | | 99.98 | % | | $ | 734,267,118 |
OTHER ASSETS IN EXCESS OF LIABILITIES | | 0.02 | | | | 169,005 |
| | | | | | |
NET ASSETS | | 100.00 | % | | $ | 734,436,123 |
| | | | | | |
| (a) | Non-income producing security |
ADR—American Depositary Receipt
Ltd.—Limited
See Notes to Financial Statements.
43
Excelsior Funds, Inc.
Portfolio of Investments — March 31, 2007
Large Cap Growth Fund — (continued)
The summary of the Fund’s investments as of March 31, 2007 is as follows: (Unaudited)
| | | | | | |
Sector Diversification | | % of
Net
Assets | | | Value |
Information Technology | | 34.17 | % | | $ | 250,881,908 |
Health Care | | 26.89 | | | | 197,508,456 |
Consumer Discretionary | | 18.33 | | | | 134,587,340 |
Financial | | 8.80 | | | | 64,613,695 |
Industrials | | 6.60 | | | | 48,504,711 |
Telecommunication | | 4.26 | | | | 31,312,008 |
Repurchase Agreement | | 0.93 | | | | 6,859,000 |
| | | | | | |
Total Investment | | 99.98 | % | | $ | 734,267,118 |
Other Assets in Excess of Liabilities | | 0.02 | | | | 169,005 |
| | | | | | |
Net Assets | | 100.00 | % | | $ | 734,436,123 |
| | | | | | |
See Notes to Financial Statements.
44
Excelsior Funds Trust
Portfolio of Investments — March 31, 2007
Mid Cap Value and Restructuring Fund
| | | | | |
| Shares | | | | Value |
| | | | | |
| COMMON STOCKS — 95.77% | | |
| | CONSUMER DISCRETIONARY — 23.84% |
| 71,900 | | Autozone, Inc.(a) | | $ | 9,213,266 |
| 105,000 | | Black & Decker Corp. | | | 8,570,100 |
| 112,900 | | Centex Corp. | | | 4,716,962 |
| 330,000 | | Constellation Brands, Inc.(a) | | | 6,989,400 |
| 190,600 | | EchoStar Communications, Inc.(a) | | | 8,277,758 |
| 135,800 | | Limited Brands | | | 3,538,948 |
| 323,200 | | Onex Corp. | | | 8,977,526 |
| 167,700 | | Sherwin-Williams Co. | | | 11,074,909 |
| 348,200 | | Tempur-Pedic International, Inc. | | | 9,049,718 |
| 280,000 | | TJX Cos., Inc. | | | 7,548,800 |
| | | | | |
| | | | | 77,957,387 |
| | | | | |
| | CONSUMER STAPLES — 2.57% |
| 180,000 | | Dean Foods Co.(a) | | | 8,413,200 |
| | | | | |
| | ENERGY — 10.95% |
| 121,800 | | Cimarex Energy Co. | | | 4,509,036 |
| 133,300 | | Devon Energy Corp. | | | 9,227,026 |
| 349,800 | | EL Paso Corp. | | | 5,061,606 |
| 130,000 | | Noble Corp. | | | 10,228,400 |
| 137,800 | | Occidental Petroleum Corp. | | | 6,794,918 |
| | | | | |
| | | | | 35,820,986 |
| | | | | |
| | FINANCIAL — 19.78% |
| 95,000 | | Ace Ltd. | | | 5,420,700 |
| 167,700 | | CIT Group, Inc. | | | 8,874,684 |
| 340,000 | | E*TRADE Group, Inc.(a) | | | 7,214,800 |
| 8,000 | | Employers Holdings, Inc.(a) | | | 160,160 |
| 157,000 | | First Marblehead Corp. | | | 7,047,730 |
| 116,600 | | Lehman Brothers Holding, Inc. | | | 8,170,162 |
| 140,000 | | Leucadia National Corp. | | | 4,118,800 |
| 61,400 | | Mastercard, Inc., Class A | | | 6,523,136 |
| 170,000 | | Progressive Corp. | | | 3,709,400 |
| 90,000 | | RenaissanceRe Holdings Ltd. | | | 4,512,600 |
| 270,000 | | W.R. Berkley Corp. | | | 8,942,400 |
| | | | | |
| | | | | 64,694,572 |
| | | | | |
| | HEALTH CARE — 4.44% |
| 331,300 | | Health Management Associates, Inc., Class A | | | 3,601,231 |
| 176,700 | | Shire Pharmaceuticals plc ADR | | | 10,937,730 |
| | | | | |
| | | | | 14,538,961 |
| | | | | |
| | | | | |
| Shares | | | | Value |
| | | | | |
| COMMON STOCKS — (continued) | | |
| | INDUSTRIALS — 20.38% |
| 130,000 | | Autoliv, Inc. | | $ | 7,424,300 |
| 187,700 | | Brink’s Co. | | | 11,909,565 |
| 247,000 | | Empresa Brasileira de Aeronautica S.A. ADR | | | 11,327,420 |
| 150,000 | | Kennametal, Inc. | | | 10,141,500 |
| 36,000 | | Lincoln Electric Holdings, Inc. | | | 2,144,160 |
| 172,700 | | Mueller Industries, Inc. | | | 5,198,270 |
| 175,000 | | Oshkosh Truck Corp. | | | 9,275,000 |
| 335,300 | | United Rentals, Inc.(a) | | | 9,220,750 |
| | | | | |
| | | | | 66,640,965 |
| | | | | |
| | INFORMATION TECHNOLOGY — 4.78% |
| 140,000 | | Electronic Data Systems Corp. | | | 3,875,200 |
| 230,900 | | Harris Corp. | | | 11,764,355 |
| | | | | |
| | | | | 15,639,555 |
| | | | | |
| | MATERIALS — 4.63% |
| 205,700 | | Aracruz Cellulose S.A. ADR | | | 10,793,079 |
| 129,700 | | Cabot Microelectronics Corp.(a) | | | 4,346,247 |
| | | | | |
| | | | | 15,139,326 |
| | | | | |
| | REAL ESTATE — 1.66% |
| 103,800 | | St. Joe Co. | | | 5,429,778 |
| | | | | |
| | UTILITIES — 2.74% | | | |
| 315,000 | | Williams Cos., Inc. | | | 8,964,900 |
| | | | | |
| | TOTAL COMMON STOCKS
(Cost $202,502,426) | | | 313,239,630 |
| | | | | |
| FOREIGN COMMON STOCKS — 2.14% | | |
| | NETHERLANDS — 2.14% |
| 79,500 | | Hunter Douglas NV | | | 7,013,633 |
| | | | | |
| | TOTAL FOREIGN
COMMON STOCKS
(Cost $2,926,238) | | | 7,013,633 |
| | | | | |
| CONVERTIBLE PREFERRED STOCKS — 0.18% |
| | CONSUMER DISCRETIONARY — 0.18% |
| 400 | | Blockbuster, Inc., Preferred Exchange | | | 597,600 |
| | | | | |
| | TOTAL CONVERTIBLE PREFERRED STOCKS
(Cost $400,000) | | | 597,600 |
| | | | | |
See Notes to Financial Statements.
45
Excelsior Funds Trust
Portfolio of Investments — March 31, 2007
Mid Cap Value and Restructuring Fund — (continued)
| | | | | | |
Principal
Amount | | | | Value |
| | | | | | |
| REPURCHASE AGREEMENT — 1.85% | | |
| $ | 6,066,000 | | JP Morgan Chase Securities, Inc., 5.06%, dated 03/30/07, to be repurchased 04/02/07, repurchase price $6,068,558 (collateralized by U.S. Government Obligation, par value $5,876,000, 6.25%, 05/16/16; total market value $6,202,699) | | $ | 6,066,000 |
| | | | | | |
| | | TOTAL REPURCHASE AGREEMENT
(Cost $6,066,000) | | | 6,066,000 |
| | | | | | |
| | | | | | |
TOTAL INVESTMENTS
(Cost $211,894,664) | | 99.94 | % | | $ | 326,916,863 |
OTHER ASSETS IN EXCESS OF LIABILITIES | | 0.06 | | | | 199,906 |
| | | | | | |
NET ASSETS | | 100.00 | % | | $ | 327,116,769 |
| | | | | | |
| (a) | Non-income producing security. |
ADR—American Depositary Receipt
Ltd.—Limited
plc—Public Limited Company
At March 31, 2007, the prices of certain foreign securities held by the fund aggregating $7,013,633 were adjusted from their closing market prices following the guidelines adopted by the fund’s board of trustees.
The summary of the Fund’s investments as of March 31, 2007 is as follows: (Unaudited)
| | | | | | |
Sector Diversification | | % of
Net
Assets | | | Market Value |
Consumer Discretionary | | 26.16 | % | | $ | 85,568,620 |
Industrials | | 20.38 | | | | 66,640,965 |
Financial | | 19.78 | | | | 64,694,572 |
Energy | | 10.95 | | | | 35,820,986 |
Information Technology | | 4.78 | | | | 15,639,555 |
Materials | | 4.63 | | | | 15,139,326 |
Health Care | | 4.44 | | | | 14,538,961 |
Utilities | | 2.74 | | | | 8,964,900 |
Consumer Staples | | 2.57 | | | | 8,413,200 |
Repurchase Agreement. | | 1.85 | | | | 6,066,000 |
Real Estate | | 1.66 | | | | 5,429,778 |
| | | | | | |
Total Investment | | 99.94 | % | | $ | 326,916,863 |
Other Assets in Excess of Liabilities | | 0.06 | | | | 199,906 |
| | | | | | |
Net Assets | | 100.00 | % | | $ | 327,116,769 |
| | | | | | |
See Notes to Financial Statements
46
Excelsior Funds, Inc.
Portfolio of Investments — March 31, 2007
Value and Restructuring Fund
| | | | | |
| Shares | | | | Value |
| | | | | |
| COMMON STOCKS — 95.33% |
| | CONSUMER DISCRETIONARY — 11.92% |
| 2,600,000 | | Black & Decker Corp. | | $ | 212,212,000 |
| 2,600,000 | | CBS Corp., Class B | | | 79,534,000 |
| 3,250,000 | | Centex Corp. | | | 135,785,000 |
| 1,800,000 | | EchoStar Communications, Inc.(a)(b) | | | 78,174,000 |
| 850,000 | | Harman International Industries, Inc.(b) | | | 81,668,000 |
| 3,000,000 | | Leggett & Platt, Inc. | | | 68,010,000 |
| 2,700,000 | | Newell Rubbermaid, Inc. | | | 83,943,000 |
| 3,200,000 | | TJX Cos., Inc. | | | 86,272,000 |
| 5,800,000 | | XM Satellite Radio Holdings, Inc., Class A(a) | | | 74,936,000 |
| 2,650,000 | | Zale Corp.(a) | | | 69,907,000 |
| | | | | |
| | | | | 970,441,000 |
| | | | | |
| | CONSUMER STAPLES — 4.87% |
| 2,200,000 | | Avon Products, Inc. | | | 81,972,000 |
| 1,700,000 | | ConAgra Foods, Inc. | | | 42,347,000 |
| 2,500,000 | | Dean Foods Co. (a) | | | 116,850,000 |
| 2,050,000 | | Loews Corp. — Carolina Group | | | 155,000,500 |
| | | | | |
| | | | | 396,169,500 |
| | | | | |
| | ENERGY — 15.68% | | | |
| 1,900,000 | | Anadarko Petroleum Corp. | | | 81,662,000 |
| 2,800,000 | | ConocoPhillips | | | 191,380,000 |
| 2,450,000 | | Devon Energy Corp. | | | 169,589,000 |
| 8,791 | | Dynegy, Inc., Class A(a) | | | 81,405 |
| 5,800,000 | | EL Paso Corp. | | | 83,926,000 |
| 1,450,000 | | Murphy Oil Corp. | | | 77,430,000 |
| 2,150,000 | | Noble Energy, Inc. | | | 128,247,500 |
| 1,975,000 | | Petrobras ADR | | | 196,532,250 |
| 4,200,000 | | Petrohawk Energy Corp.(a) | | | 55,314,000 |
| 944,900 | | Pinnacle Gas Resources, Inc.(a)(c)(d)(e) | | | 10,393,900 |
| 2,750,000 | | Rossetta Resources, Inc.(a) | | | 56,485,000 |
| 2,000,000 | | Spectra Energy Corp. | | | 52,540,000 |
| 2,500,000 | | Todco, Class A(a) | | | 100,825,000 |
| 2,500,000 | | W&T Offshore, Inc. | | | 72,325,000 |
| | | | | |
| | | | | 1,276,731,055 |
| | | | | |
| | FINANCIAL — 22.15% | | | |
| 2,650,000 | | Ace Ltd. | | | 151,209,000 |
| 1,950,000 | | AerCap Holdings NV ADR(a) | | | 56,764,500 |
| | | | | |
| Shares | | | | Value |
| | | | | |
| COMMON STOCKS — (continued) |
| | FINANCIAL — (continued) | | | |
| 3,850,000 | | Amvescap plc ADR | | $ | 85,085,000 |
| 2,800,000 | | Apollo Investment Corp.(f) | | | 59,920,000 |
| 1,200,000 | | Capital One Financial Corp. | | | 90,552,000 |
| 2,403,260 | | CastlePoint Holdings Ltd.(a) | | | 39,293,301 |
| 1,900,000 | | CIT Group, Inc. | | | 100,548,000 |
| 2,450,000 | | Citigroup, Inc. | | | 125,783,000 |
| 1,650,000 | | Freddie Mac | | | 98,158,500 |
| 1,000,000 | | Genworth Financial, Inc. | | | 34,940,000 |
| 2,000,000 | | JP Morgan Chase & Co. | | | 96,760,000 |
| 1,750,000 | | Lehman Brothers Holding, Inc. | | | 122,622,500 |
| 2,700,000 | | Loews Corp. | | | 122,661,000 |
| 700,000 | | Marsh & McLennan Cos., Inc. | | | 20,503,000 |
| 400,000 | | Mastercard, Inc., Class A(b) | | | 42,496,000 |
| 3,500,000 | | MCG Capital Corp. | | | 65,660,000 |
| 1,850,000 | | Metlife, Inc. | | | 116,827,500 |
| 2,100,000 | | Morgan Stanley | | | 165,396,000 |
| 1,250,000 | | PNC Financial Services Group, Inc. | | | 89,962,500 |
| 3,000,000 | | Primus Guaranty Ltd.(a) | | | 36,900,000 |
| 2,000,000 | | Washington Mutual, Inc. | | | 80,760,000 |
| | | | | |
| | | | | 1,802,801,801 |
| | | | | |
| | HEALTH CARE — 3.30% |
| 1,850,000 | | AmerisourceBergen Corp. | | | 97,587,500 |
| 2,200,000 | | Baxter International, Inc. | | | 115,874,000 |
| 2,000,000 | | Bristol-Myers Squibb Co. | | | 55,520,000 |
| | | | | |
| | | | | 268,981,500 |
| | | | | |
| | INDUSTRIALS — 14.05% |
| 2,900,000 | | AGCO Corp.(a) | | | 107,213,000 |
| 1,100,000 | | Aries Maritime Transport Ltd. | | | 9,031,000 |
| 1,050,181 | | Arlington Tankers | | | 25,057,319 |
| 2,100,000 | | Copa Holdings S.A., Class A | | | 108,129,000 |
| 2,583,500 | | Empresa Brasileira de Aeronautica S.A. ADR | | | 118,479,310 |
| 3,500,000 | | Gol Linhas Aereas Inteligentes S.A. ADR | | | 106,505,000 |
| 1,000,000 | | Omega Navigation Enterprises, Inc., Class A ADR | | | 15,630,000 |
| 1,100,000 | | Rockwell Automation, Inc. | | | 65,857,000 |
| 1,900,000 | | Ryder Systems, Inc. | | | 93,746,000 |
| 3,100,000 | | Tyco International Ltd. | | | 97,805,000 |
See Notes to Financial Statements.
47
Excelsior Funds, Inc.
Portfolio of Investments — March 31, 2007
Value and Restructuring Fund — (continued)
| | | | | |
| Shares | | | | Value |
| | | | | |
| COMMON STOCKS — (continued) |
| | INDUSTRIALS — (continued) |
| 1,700,000 | | Union Pacific Corp. | | $ | 172,635,000 |
| 4,250,000 | | United Rentals, Inc.(a) | | | 116,875,000 |
| 1,650,000 | | United Technologies Corp. | | | 107,250,000 |
| | | | | |
| | | | | 1,144,212,629 |
| | | | | |
| | INFORMATION TECHNOLOGY — 5.26% |
| 4,200,000 | | Harris Corp. | | | 213,990,000 |
| 900,000 | | International Business Machines Corp. | | | 84,834,000 |
| 3,850,000 | | Nokia Oyj ADR | | | 88,242,000 |
| 1,750,000 | | Plantronics, Inc. | | | 41,335,000 |
| | | | | |
| | | | | 428,401,000 |
| | | | | |
| | MATERIALS — 11.07% |
| 3,300,000 | | Alpha Natural Resources, Inc.(a) | | | 51,579,000 |
| 4,000,000 | | Celanese Corp., Class A | | | 123,360,000 |
| 4,550,000 | | CONSOL Energy, Inc. | | | 178,041,500 |
| 1,100,000 | | Eagle Materials, Inc. | | | 49,093,000 |
| 1,500,000 | | Foundation Coal Holdings, Inc. | | | 51,510,000 |
| 750,000 | | Freeport-McMoRan Copper & Gold, Inc. | | | 49,642,500 |
| 4,600,000 | | International Coal Group, Inc.(a) | | | 24,150,000 |
| 1,400,000 | | PPG Industries, Inc. | | | 98,434,000 |
| 1,700,000 | | Schnitzer Steel Industries, Inc. | | | 68,289,000 |
| 4,000,000 | | Smurfit-Stone Container Corp.(a) | | | 45,040,000 |
| 1,800,000 | | Southern Copper Corp. | | | 128,988,000 |
| 2,300,000 | | Tronox, Inc. | | | 33,120,000 |
| | | | | |
| | | | | 901,247,000 |
| | | | | |
| | REAL ESTATE — 2.44% |
| 3,820,000 | | Diamondrock Hospitality Co. | | | 72,580,000 |
| 1,000,000 | | FBR Capital Markets Corp.(a)(d)(e) | | | 15,250,000 |
| 2,050,000 | | Host Marriott Corp. | | | 53,935,500 |
| 3,000,000 | | Peoples Choice Financial Corp.(a)(d)(e) | | | 4,500,000 |
| | | | | |
| Shares | | | | Value |
| | | | | |
| COMMON STOCKS — (continued) |
| | REAL ESTATE — (continued) |
| 900,000 | | Ventas, Inc. | | $ | 37,917,000 |
| 2,140,500 | | Vintage Wine Trust, Inc.(d)(e) | | | 14,448,375 |
| | | | | |
| | | | | 198,630,875 |
| | | | | |
| | TELECOMMUNICATION SERVICES — 4.59% |
| 5,500,000 | | America Movil S.A. de C.V., Series L ADR(b) | | | 262,845,000 |
| 1,842,000 | | Datapath, Inc.(a)(d)(e) | | | 17,499,000 |
| 2,600,000 | | Sprint Nextel Corp. | | | 49,296,000 |
| 3,000,000 | | Windstream Corp. | | | 44,070,000 |
| | | | | |
| | | | | 373,710,000 |
| | | | | |
| | TOTAL COMMON STOCKS
(Cost $5,086,518,227) | | | 7,761,326,360 |
| | | | | |
| FOREIGN COMMON STOCKS — 3.07% |
| | GERMANY — 0.96% | | | |
| 1,500,000 | | Lanxess AG(a) | | | 77,534,540 |
| | | | | |
| | ITALY — 0.66% | | | |
| 5,000,000 | | Enel S.p.A | | | 53,541,373 |
| | | | | |
| | MEXICO — 0.62% | | | |
| 11,000,000 | | Grupo Mexico S.A.B. de C.V., Series B | | | 50,835,939 |
| | | | | |
| | SWITZERLAND — 0.83% | | | |
| 950,000 | | Petroplus Holdings AG(a) | | | 67,644,880 |
| | | | | |
| | TOTAL FOREIGN COMMON STOCKS
(Cost $177,913,078) | | | 249,556,732 |
| | | | | |
| CONVERTIBLE PREFERRED STOCKS — 1.28% |
| | CONSUMER DISCRETIONARY — 1.03% |
| 2,350,000 | | Ford Motor Co. Capital Trust II, Preferred Exchange, 6.50% | | | 84,036,000 |
| | MATERIALS 0.25% | | | |
| 500,000 | | Celanese Corp., Preferred Exchange, 4.25% | | | 20,437,500 |
| | | | | |
| | TOTAL CONVERTIBLE PREFERRED STOCKS
(Cost $98,271,130) | | | 104,473,500 |
| | | | | |
See Notes to Financial Statements.
48
Excelsior Funds, Inc.
Portfolio of Investments — March 31, 2007
Value and Restructuring Fund — (continued)
| | | | | | |
Principal
Amount | | | | Value |
| | | | | | |
| REPURCHASE AGREEMENT — 0.24% |
| $ | 19,528,000 | | JP Morgan Chase Securities, Inc., 5.06%, dated 3/30/07, to be repurchased 4/02/07, repurchase price $19,536,234 (collateralized by U.S. Government Obligations, ranging in par value $3,775,000-$5,340,000, 4.13%-6.25%, 07/17/09-03/02/21; total market value $19,629,004) | | $ | 19,528,000 |
| | | | | | |
| | | TOTAL REPURCHASE AGREEMENT
(Cost $19,528,000) | | | 19,528,000 |
| | | | | | |
| | | | | | |
TOTAL INVESTMENTS
(Cost $5,382,230,435) | | 99.92 | % | | $ | 8,134,884,592 |
OTHER ASSETS IN EXCESS OF LIABILITIES | | 0.08 | | | | 6,272,224 |
| | | | | | |
NET ASSETS | | 100.00 | % | | $ | 8,141,156,816 |
| | | | | | |
| (a) | Non-income producing security. |
| (b) | All or part of the security is segregated by the Fund’s custodian to cover future purchase commitments. |
| (c) | Fair valued as of March 31, 2007. |
| (d) | Security exempt from registration under Rule 144A of the Securities Act of 1933. This security may be resold in transactions exempt from registration, normally to qualified institutional buyers. At March 31, 2007 these securities amounted to $62,091,275 or 0.76% of net assets. |
| (e) | Represents an illiquid security as of March 31, 2007. |
| (f) | Closed-end Management Investment Company. |
ADR—American Depositary Receipt
Ltd.—Limited
plc—Public Limited Company
At March 31, 2007, the prices of certain foreign securities held by the fund aggregating $249,556,732 were adjusted from their closing market prices following the guidelines adopted by the fund’s board of trustees.
| | | | | | |
| Contracts | | | | Value | |
| CALL OPTIONS WRITTEN: | | | |
| (10,000) | | America Movil S.A. de C.V., Expires 05/18/07 strike price 50 | | $ | (1,400,000 | ) |
| (5,000) | | EchoStar Communications, Inc., Expires 06/15/07 strike price 45 | | | (875,000 | ) |
| (4,000) | | Harmon International Industries, Inc., Expires 04/20/07 strike price 105 | | | (40,000 | ) |
| (4,000) | | Mastercard, Inc., Expires 04/20/07 strike price 04/20/07 | | | (1,520,000 | ) |
| | TOTAL CALL OPTIONS WRITTEN
(Premiums received $6,678,258) | | $ | (3,835,000 | ) |
| | | | | | |
See Notes to Financial Statements.
49
Excelsior Funds, Inc.
Portfolio of Investments — March 31, 2007
Value and Restructuring Fund — (continued)
The summary of the Fund’s investments as of March 31, 2007 is as follows: (Unaudited)
| | | | | | |
Sector Diversification | | % of
Net
Assets | | | Value |
Financial | | 22.15 | % | | $ | 1,802,801,801 |
Energy | | 16.51 | | | | 1,344,375,935 |
Industrials | | 15.01 | | | | 1,221,747,169 |
Consumer Discretionary | | 12.95 | | | | 1,054,477,000 |
Materials | | 11.94 | | | | 972,520,439 |
Consumer Staples | | 5.53 | | | | 449,710,873 |
Information Technology | | 5.26 | | | | 428,401,000 |
Telecommunication Services | | 4.59 | | | | 373,710,000 |
Health Care | | 3.30 | | | | 268,981,500 |
Real Estate | | 2.44 | | | | 198,630,875 |
Repurchase Agreement | | 0.24 | | | | 19,528,000 |
| | | | | | |
Total Investment | | 99.92 | % | | $ | 8,134,884,592 |
Other Assets in Excess of Liabilities | | 0.08 | | | | 6,272,224 |
| | | | | | |
Net Assets | | 100.00 | % | | $ | 8,141,156,816 |
| | | | | | |
See Notes to Financial Statements.
50
Excelsior Funds, Inc.
Portfolio of Investments — March 31, 2007
Emerging Markets Fund
| | | | | |
| Shares | | | | Value |
| | | | | |
| COMMON STOCKS — 90.40% | | |
| | ARGENTINA — 1.75% | | | |
| 931,800 | | Telecom Argentina S.A. ADR(a) | | $ | 19,884,612 |
| | | | | |
| | BRAZIL — 7.35% | | | |
| 841,674 | | Arcelor Brazil S.A. | | | 19,700,232 |
| 431,400 | | Companhia Vale do Rio Doce S.A. | | | 15,983,985 |
| 516,832 | | Diagnosticos da America S.A.(a) | | | 11,419,344 |
| 210,000 | | Gafisa S.A. ADR(a) | | | 5,355,000 |
| 398,800 | | Gol Linhas Aereas Inteligentes S.A. ADR | | | 12,135,484 |
| 215,400 | | Uniao de Bancos Brasileiros S.A. | | | 18,838,884 |
| | | | | |
| | | | | 83,432,929 |
| | | | | |
| | CHILE — 0.86% | | | |
| 195,000 | | Banco Santander Chile S.A. ADR | | | 9,724,650 |
| | | | | |
| | CHINA — 13.94% | | | |
| 23,275,000 | | Bank of Communications Ltd., Class H (Hong Kong) | | | 23,836,803 |
| 27,271,300 | | Chaoda Mordern Agriculture Holdings Ltd. (Hong Kong) | | | 19,132,698 |
| 42,614,000 | | China Construction Bank, Class H (Hong Kong) | | | 24,240,683 |
| 620,797 | | China Mobile Ltd. ADR (Hong Kong) | | | 27,842,744 |
| 20,961,000 | | China Petroleum & Chemical Corp., Class H (Hong Kong) | | | 17,695,045 |
| 17,823,252 | | Far East Consortium International Ltd. (Hong Kong) | | | 7,488,513 |
| 2,647,000 | | Industrial & Commercial Bank of China (Hong Kong)(a) | | | 1,471,330 |
| 15,539,400 | | People’s Food Holdings Ltd. | | | 15,331,163 |
| 131,700 | | PetroChina Co. Ltd. ADR | | | 15,420,753 |
| 8,447,000 | | Texwinca Holdings Ltd. (Hong Kong) | | | 5,691,008 |
| | | | | |
| | | | | 158,150,740 |
| | | | | |
| | COLUMBIA — 0.96% | | | |
| 392,800 | | Bancolombia S.A. ADR | | | 10,876,632 |
| | | | | |
| | | | | |
| Shares | | | | Value |
| | | | | |
| COMMON STOCKS — (continued) | | |
| | INDIA — 4.47% | | | |
| 339,350 | | ICICI Bank Ltd. ADR | | $ | 12,471,113 |
| 240,400 | | India Fund, Inc.(b) | | | 9,168,856 |
| 222,900 | | State Bank of India GDR(c)(d) | | | 14,000,128 |
| 655,700 | | Suzlon Energy Ltd. | | | 15,026,990 |
| | | | | |
| | | | | 50,667,087 |
| | | | | |
| | INDONESIA — 3.51% | | | |
| 28,198,700 | | PT Indocement Tunggal Prakarsa Tbk | | | 15,712,804 |
| 22,402,700 | | PT Telekomunikasi Indonesia Tbk | | | 24,119,251 |
| | | | | |
| | | | | 39,832,055 |
| | | | | |
| | MALAYSIA — 4.51% | | | |
| 1,882,600 | | Genting Berhad | | | 21,644,856 |
| 6,454,950 | | Public Bank Berhad | | | 16,796,781 |
| 4,404,300 | | Telekom Malaysia Berhad | | | 12,743,885 |
| | | | | |
| | | | | 51,185,522 |
| | | | | |
| | MEXICO — 10.68% | | | |
| 428,100 | | America Movil S.A. de C.V., Series L ADR | | | 20,458,899 |
| 405,244 | | Cemex S.A.B de C.V. ADR | | | 13,271,741 |
| 262,600 | | Grupo Aeroportuario del Pacifico S.A. de C.V. ADR | | | 11,291,800 |
| 801,355 | | Grupo Elektra S.A. | | | 12,453,662 |
| 2,124,100 | | Grupo Televisa S.A. | | | 12,651,633 |
| 363,380 | | Telefonos de Mexico S.A. de C.V., Series L ADR | | | 12,136,892 |
| 5,959,029 | | Urbi Desarrollos Urbanos S.A. de C.V.(a) | | | 24,650,417 |
| 3,330,082 | | Wal-Mart de Mexico S.A. de C.V. | | | 14,221,989 |
| | | | | |
| | | | | 121,137,033 |
| | | | | |
| | RUSSIA — 8.25% | | | |
| 210,200 | | Lukoil Co. ADR | | | 18,161,280 |
| 103,200 | | MMC Norilsk Nickel ADR | | | 19,143,600 |
| 368,100 | | Mobile TeleSystems ADR | | | 20,598,876 |
| 421,350 | | OAO Gazprom ADR | | | 17,645,323 |
| 464,000 | | RBC Information Systems ADR(a) | | | 18,096,000 |
| | | | | |
| | | | | 93,645,079 |
| | | | | |
See Notes to Financial Statements.
51
Excelsior Funds, Inc.
Portfolio of Investments — March 31, 2007
Emerging Markets Fund — (continued)
| | | | | |
| Shares | | | | Value |
| | | | | |
| COMMON STOCKS — (continued) | | |
| | SOUTH AFRICA — 6.97% | | | |
| 2,911,042 | | African Bank Investments Ltd. | | $ | 12,159,057 |
| 704,600 | | Gold Fields Ltd. ADR | | | 13,021,008 |
| 1,522,224 | | MTN Group Ltd. | | | 20,644,880 |
| 405,500 | | Sasol Ltd. | | | 13,548,385 |
| 861,916 | | Telekom South Africa Ltd. | | | 19,703,763 |
| | | | | |
| | | | | 79,077,093 |
| | | | | |
| | SOUTH KOREA — 13.39% | | | |
| 337,802 | | Hana Financial Group, Inc. | | | 17,448,510 |
| 650,638 | | KT Corp. ADR | | | 14,567,785 |
| 421,680 | | LG Cable Ltd. | | | 18,391,544 |
| 120,562 | | LG Home Shopping, Inc. | | | 8,748,113 |
| 13,000 | | Lotte Chilsung Beverage Co. Ltd. | | | 16,574,190 |
| 135,810 | | NCSoft Corp.(a) | | | 8,922,644 |
| 101,567 | | Pacific Corp. | | | 14,917,642 |
| 63,570 | | Samsung Electronic Co. Ltd. | | | 37,914,018 |
| 614,685 | | SK Telecom Co. Ltd. ADR | | | 14,395,923 |
| | | | | |
| | | | | 151,880,369 |
| | | | | |
| | TAIWAN — 7.19% | | | |
| 817,900 | | Chunghwa Telecom Co. Ltd. ADR | | | 16,292,568 |
| 3,114,471 | | Hon Hai Precision, Inc. | | | 20,814,502 |
| 6,673,453 | | President Chain Store Corp. | | | 16,314,127 |
| 11,780,387 | | Synnex Technology International Corp. | | | 14,581,583 |
| 233,704 | | Taiwan Semiconductor Manufacturing Co. Ltd. | | | 475,681 |
| 1,212,264 | | Taiwan Semiconductor Manufacturing Co. Ltd. ADR | | | 13,031,838 |
| | | | | |
| | | | | 81,510,299 |
| | | | | |
| | THAILAND — 0.99% | | | |
| 5,867,900 | | Advanced Info Service Public Co. Ltd. (Foreign Shares) | | | 11,246,697 |
| | | | | |
| | TURKEY — 2.13% | | | |
| 872,210 | | Akbank T.A.S. ADR(c)(d) | | | 11,692,325 |
| 1,112,582 | | Arcelik A.S. | | | 7,500,339 |
| 1,016,704 | | Turkiye Vakiflar Bankasi T.A.O.(a) | | | 2,282,098 |
| 1,065,000 | | Turkiye Vakiflar Bankasi T.A.O., Class D | | | 2,655,359 |
| | | | | |
| | | | | 24,130,121 |
| | | | | |
| | | | | | |
| Shares | | | | Value |
| | | | | | |
| COMMON STOCKS — (continued) | | |
| | | UNITED KINGDOM — 3.45% |
| | 428,800 | | Anglo American plc (South Africa shares) | | $ | 22,641,042 |
| | 712,500 | | Kazakhmys plc | | | 16,481,436 |
| | | | | | |
| | | | | | 39,122,478 |
| | | | | | |
| | | TOTAL COMMON STOCKS
(Cost $658,437,278) | | | 1,025,503,396 |
| | | | | | |
| PREFERRED STOCKS — 5.39% | | |
| | | BRAZIL — 4.54% |
| | 769,836 | | Banco Bradesco S.A. | | | 15,701,021 |
| | 315,754,000 | | Companhia Energetica de Minas Gerais | | | 15,486,405 |
| | 906,800 | | Petroleo Brasileiro S.A. | | | 20,317,463 |
| | | | | | |
| | | | | | 51,504,889 |
| | | | | | |
| | | SOUTH KOREA — 0.85% |
| | 246,300 | | Hyundai Motor Co. Ltd. | | | 9,641,771 |
| | | | | | |
| | | TOTAL PREFERRED STOCKS
(Cost $28,204,675) | | | 61,146,660 |
| | | | | | |
Principal
Amount | | | | |
| REPURCHASE AGREEMENT — 4.10% | | |
| $ | 46,464,000 | | JP Morgan Chase Securities, Inc., 5.06%, dated 03/30/07, to be repurchased 04/02/07, repurchase price $46,483,592 (collateralized by U.S. Government Obligations, ranging in par value $1,400,000-$8,000,000, 2.35%-5.81%, 07/09/07-02/22/16; total market value $47,043,406) | | | 46,464,000 |
| | | | | | |
| | | TOTAL REPURCHASE AGREEMENT
(Cost $46,464,000) | | $ | 46,464,000 |
| | | | | | |
| | | | | | |
TOTAL INVESTMENTS (Cost $733,105,953) | | 99.89 | % | | $ | 1,133,114,056 |
OTHER ASSETS IN EXCESS OF LIABILITIES | | 0.11 | | | | 1,299,423 |
| | | | | | |
NET ASSETS | | 100.00 | % | | $ | 1,134,413,479 |
| | | | | | |
See Notes to Financial Statements.
52
Excelsior Funds, Inc.
Portfolio of Investments — March 31, 2007
Emerging Markets Fund — (continued)
| (a) | Non-income producing security |
| (b) | Closed-end Management Investment Company Fund |
| (c) | Security exempt from registration under Rule 144A of the Securities Act of 1933. This security may be resold in transactions exempt from registration, normally to qualified institutional buyers. At March 31, 2007, these securities amounted to $25,692,453 or 2.26% of net assets. |
| (d) | Represents an illiquid security as of March 31, 2007. |
ADR—American Depositary Receipt
GDR—Global Depositary Receipt
Ltd.—Limited
plc—Public Limited Company
At March 31, 2007, the prices of certain foreign securities held by the fund aggregating $681,294,860 were adjusted from their closing market prices following the guidelines adopted by the fund’s board of trustees.
The summary of the Fund’s investments as of March 31, 2007 is as follows: (Unaudited)
| | | | | | |
Sector Diversification | | % of
Net
Assets | | | Value |
Telecommunication Services | | 20.68 | % | | $ | 234,636,776 |
Financial | | 17.78 | | | | 201,683,886 |
Industrials | | 12.18 | | | | 138,241,847 |
Materials | | 10.42 | | | | 118,188,134 |
Energy | | 10.20 | | | | 115,656,321 |
Consumer Discretionary | | 8.94 | | | | 101,367,158 |
Information Technology | | 7.96 | | | | 90,332,041 |
Consumer Staples | | 5.81 | | | | 65,955,693 |
Repurchase Agreement | | 4.10 | | | | 46,464,000 |
Health Care | | 1.01 | | | | 11,419,344 |
Investment Companies | | 0.81 | | | | 9,168,856 |
| | | | | | |
Total Investment | | 99.89 | % | | $ | 1,133,114,056 |
Other Assets in Excess of Liabilities | | 0.11 | | | | 1,299,423 |
| | | | | | |
Net Assets | | 100.00 | % | | $ | 1,134,413,479 |
| | | | | | |
See Notes to Financial Statements
53
Excelsior Funds Trust
Portfolio of Investments — March 31, 2007
International Equity Fund
| | | | | |
| Shares | | | | Value |
| | | | | |
| COMMON STOCKS — 96.34% |
| | AUSTRALIA — 3.34% | | | |
| 19,100 | | CSL Ltd. | | $ | 1,269,451 |
| 16,857 | | Rio Tinto Ltd. | | | 1,072,590 |
| | | | | |
| | | | | 2,342,041 |
| | | | | |
| | BELGIUM — 1.40% | | | |
| 5,500 | | Umicore | | | 981,619 |
| | | | | |
| | CANADA — 2.87% | | | |
| 20,200 | | Canadian National Railway Co. | | | 891,166 |
| 19,100 | | Gildan Activewear, Inc.(a) | | | 1,125,282 |
| | | | | |
| | | | | 2,016,448 |
| | | | | |
| | CHINA — 2.27% | | | |
| 6,400 | | PetroChina Co. Ltd. ADR | | | 749,376 |
| 73,000 | | Sun Hung Kai Properties Ltd. (Hong Kong) | | | 843,712 |
| | | | | |
| | | | | 1,593,088 |
| | | | | |
| | FINLAND — 2.55% | | | |
| 28,500 | | Fortum Oyj | | | 829,925 |
| 41,700 | | Nokia Oyj | | | 960,749 |
| | | | | |
| | | | | 1,790,674 |
| | | | | |
| | FRANCE — 6.75% | | | |
| 23,300 | | AXA S.A. | | | 990,789 |
| 7,820 | | BNP Paribas S.A. | | | 817,844 |
| 13,600 | | Carrefour S.A. | | | 996,733 |
| 4,904 | | Compagnie Generale de Geophysique S.A. (CGG)(a) | | | 1,032,104 |
| 12,916 | | Total S.A. | | | 902,223 |
| | | | | |
| | | | | 4,739,693 |
| | | | | |
| | GERMANY — 6.30% | | | |
| 18,500 | | Adidas-Salomon AG | | | 1,007,682 |
| 15,700 | | Bayerische Motoren Werke AG | | | 927,362 |
| 18,800 | | Rhoen-Klinikum AG | | | 1,128,328 |
| 41,150 | | SGL Carbon AG(a) | | | 1,355,816 |
| | | | | |
| | | | | 4,419,188 |
| | | | | |
| | GREECE — 1.34% | | | |
| 37,200 | | Greek Postal Savings Bank(a) | | | 937,438 |
| | | | | |
| | INDONESIA — 1.39% | | | |
| 907,000 | | PT Telekomunikasi Indonesia Tbk | | | 976,497 |
| | | | | |
| | | | | |
| Shares | | | | Value |
| | | | | |
| COMMON STOCKS — (continued) |
| | IRELAND —1.51% | | | |
| 49,502 | | Bank of Ireland | | $ | 1,061,788 |
| | | | | |
| | ITALY — 2.24% | | | |
| 24,250 | | ENI S.p.A. | | | 789,054 |
| 30,665 | | Permasteelisa S.p.A. | | | 783,949 |
| | | | | |
| | | | | 1,573,003 |
| | | | | |
| | JAPAN — 21.95% | | | |
| 19,200 | | Canon, Inc. | | | 1,031,104 |
| 44,100 | | Casio Computer Co. Ltd. | | | 961,419 |
| 45,946 | | Chiyoda Corp. | | | 1,003,734 |
| 40,300 | | Don Quijote Co. Ltd. | | | 785,941 |
| 11,400 | | FANUC Co. Ltd. | | | 1,056,452 |
| 27,000 | | Hoya Corp. | | | 892,166 |
| 3,800 | | Keyence Corp. | | | 855,126 |
| 10,200 | | Kyocera Corp. | | | 958,438 |
| 23,500 | | Millea Holdings, Inc. | | | 866,126 |
| 90 | | Mitsubishi Tokyo Financial Group, Inc. | | | 1,014,177 |
| 48,000 | | Nikon Corp. | | | 1,007,605 |
| 500 | | NTT DoCoMo, Inc. | | | 921,262 |
| 104,000 | | Sumitomo Trust & Banking Co. Ltd. | | | 1,079,164 |
| 17,200 | | Takeda Pharmaceutical Co. Ltd. | | | 1,126,431 |
| 116,000 | | The Bank of Fukuoka Ltd.(b) | | | 925,856 |
| 9,900 | | Yamada Denki Co. Ltd. | | | 918,503 |
| | | | | |
| | | | | 15,403,504 |
| | | | | |
| | MEXICO — 2.50% | | | |
| 19,900 | | America Movil S.A. de C.V., Series L ADR | | | 951,021 |
| 24,592 | | Cemex S.A.B de C.V. ADR | | | 805,388 |
| | | | | |
| | | | | 1,756,409 |
| | | | | |
| | NETHERLANDS — 3.05% | | | |
| 27,000 | | ABN Amro Holding NV | | | 1,163,256 |
| 57,700 | | Qiagen NV(a) | | | 979,136 |
| | | | | |
| | | | | 2,142,392 |
| | | | | |
| | NORWAY — 3.36% | | | |
| 59,600 | | Tandberg ASA | | | 1,232,760 |
| 63,700 | | Telenor ASA | | | 1,125,002 |
| | | | | |
| | | | | 2,357,762 |
| | | | | |
See Notes to Financial Statements.
54
Excelsior Funds Trust
Portfolio of Investments — March 31, 2007
International Equity Fund — (continued)
| | | | | |
Shares | | | | Value |
| | | | | |
| COMMON STOCKS — (continued) |
| | SINGAPORE — 1.67% | | | |
| 83,000 | | DBS Group Holdings Ltd. | | $ | 1,168,586 |
| | | | | |
| | SPAIN — 4.09% | | | |
| 57,200 | | Banco Santander Central Hispano S.A. | | | 1,021,028 |
| 26,200 | | Repsol YPF S.A. | | | 882,754 |
| 43,608 | | Telefonica S.A. | | | 965,582 |
| | | | | |
| | | | | 2,869,364 |
| | | | | |
| | SWEDEN — 1.50% | | | |
| 19,700 | | Svenska Cellulosa AB | | | 1,055,009 |
| | | | | |
| | SWITZERLAND — 4.76% | | | |
| 28,200 | | Micronas Semiconductor AG | | | 585,338 |
| 5,300 | | Roche Holdings AG | | | 941,744 |
| 8,100 | | Synthes, Inc. | | | 1,003,211 |
| 13,600 | | UBS AG(a) | | | 811,228 |
| | | | | |
| | | | | 3,341,521 |
| | | | | |
| | TAIWAN — 3.00% | | | |
| 167,409 | | Hon Hai Precision, Inc. | | | 1,118,820 |
| 92,022 | | Taiwan Semiconductor Manufacturing Co. Ltd. ADR | | | 989,237 |
| | | | | |
| | | | | 2,108,057 |
| | | | | |
| | TURKEY — 1.20% | | | |
| 124,700 | | Arcelik A.S. | | | 840,650 |
| | | | | |
| | UNITED KINGDOM — 17.30% | | | |
| 72,800 | | BG Group | | | 1,050,024 |
| 87,300 | | Cadbury Schweppes plc | | | 1,121,912 |
| 35,174 | | GlaxoSmithKline plc | | | 970,799 |
| 49,200 | | HSBC Holdings plc | | | 861,451 |
| 72,300 | | Paragon Group plc | | | 825,277 |
| 18,270 | | Reckitt Benckiser plc | | | 952,648 |
| 71,800 | | Reed Elsevier plc | | | 860,239 |
| 25,588 | | Royal Bank of Scotland Group plc | | | 1,001,611 |
| 200,700 | | Sage Group plc (The) | | | 1,021,454 |
| 127,349 | | Serco Group plc | | | 1,151,789 |
| 54,900 | | Shire plc | | | 1,133,269 |
| 195,554 | | William Morrison Supermarkets plc | | | 1,188,178 |
| | | | | |
| | | | | 12,138,651 |
| | | | | |
| | TOTAL COMMON STOCKS
(Cost $47,288,330) | | | 67,613,382 |
| | | | | |
| | | | | | |
Principal Amount | | | | Value |
| | | | | | |
| REPURCHASE AGREEMENT — 2.65% | | |
$
| 1,863,000
| | JP Morgan Chase Securities, Inc., 5.06%, dated 03/30/07, to be repurchased 4/02/07, repurchase price $1,863,786 (collateralized by U.S. Government Obligation, par value $1,820,000, 5.25%, 11/03/09; total market value $1,902,016) | | $ | 1,863,000 |
| | | | | | |
| | | TOTAL REPURCHASE AGREEMENT
(Cost $1,863,000) | | | 1,863,000 |
| | | | | | |
| | | | | | |
TOTAL INVESTMENTS
(Cost $49,151,330) | | 98.99 | % | | $ | 69,476,382 |
OTHER ASSETS IN EXCESS OF LIABILITIES | | 1.01 | | | | 706,722 |
| | | | | | |
NET ASSETS | | 100.00 | % | | $ | 70,183,104 |
| | | | | | |
| (a) | Non-income producing security. |
| (b) | Fair valued at March 31, 2007. |
ADR—American Depositary Receipt
Ltd.—Limited
plc—Public Limited Company
At March 31, 2007, the prices of certain foreign securities held by the fund aggregating $64,118,360 were adjusted from their closing market prices following the guidelines adopted by the fund’s board of trustees.
See Notes to Financial Statements.
55
Excelsior Funds Trust
Portfolio of Investments — March 31, 2007
International Equity Fund — (continued)
The summary of the Fund’s investments as of March 31, 2007 is as follows: (Unaudited)
| | | | | | |
Sector Diversification | | % of
Net
Assets | | | Value |
Financial | | 23.32 | % | | $ | 16,368,468 |
Industrials | | 13.90 | | | | 9,751,675 |
Health Care | | 10.79 | | | | 7,573,234 |
Telecommunication Services | | 10.16 | | | | 7,132,872 |
Consumer Discretionary | | 9.58 | | | | 6,722,932 |
Information Technology | | 9.40 | | | | 6,596,557 |
Energy | | 7.70 | | | | 5,405,535 |
Consumer Staples | | 7.38 | | | | 5,177,975 |
Materials | | 2.93 | | | | 2,054,209 |
Repurchase Agreement | | 2.65 | | | | 1,863,000 |
Utilities | | 1.18 | | | | 829,925 |
| | | | | | |
Total Investment | | 98.99 | % | | $ | 69,476,382 |
Other Assets in Excess of Liabilities | | 1.01 | | | | 706,722 |
| | | | | | |
Net Assets | | 100.00 | % | | $ | 70,183,104 |
| | | | | | |
See Notes to Financial Statements.
56
[THIS PAGE INTENTIONALLY LEFT BLANK]
Excelsior Funds
Statements of Assets and Liabilities
March 31, 2007
| | | | | | | | | | | | | | | | |
| | | | |
| | | Money
Fund | | | Core
Bond
Fund | | | High
Yield
Fund | | | Equity
Opportunities
Fund | |
ASSETS: | | | | | | | | | | | | | | | | |
Investments, at cost — see accompanying portfolios | | $ | 1,259,885,037 | | | $ | 549,299,881 | | | $ | 110,427,831 | | | $ | 282,589,609 | |
| | | | | | | | | | | | | | | | |
Investments, at value (including Repurchase Agreements) (Note 1) | | $ | 1,259,885,037 | | | $ | 550,355,840 | | | $ | 114,960,981 | | | $ | 338,234,539 | |
Cash | | | — | | | | 172,942 | | | | 131,318 | | | | 38,115 | |
Foreign currency (cost $0, $0, $0, $3,023, $0, $0, $531, $644,844 and $17,737 respectively) | | | — | | | | — | | | | — | | | | 3,247 | |
Dividends and interest receivable | | | 1,925,463 | | | | 4,413,659 | | | | 2,376,317 | | | | 528,278 | |
Receivable for investments sold | | | — | | | | 333,651 | | | | 1,136,514 | | | | 21,193 | |
Receivable for fund shares sold | | | 449 | | | | 506,201 | | | | 503,500 | | | | 736,458 | |
Receivable from advisor | | | — | | | | — | | | | 114,221 | | | | — | |
Net receivable for variation margin on futures contracts | | | — | | | | 5,391 | | | | — | | | | — | |
Reclaims receivable | | | — | | | | — | | | | — | | | | 48,271 | |
Prepaid expenses | | | 15,202 | | | | 9,532 | | | | 1,593 | | | | 3,712 | |
| | | | | | | | | | | | | | | | |
Total Assets | | | 1,261,826,151 | | | | 555,797,216 | | | | 119,224,444 | | | | 339,613,813 | |
LIABILITIES: | | | | | | | | | | | | | | | | |
Payable for dividends declared | | | 3,971,809 | | | | 1,360,741 | | | | 583,926 | | | | — | |
Payable for investments purchased | | | — | | | | 1,742,048 | | | | 1,496,875 | | | | 1,225,148 | |
Cash overdraft | | | — | | | | — | | | | — | | | | — | |
Options written, at value (Premiums received: Value and Restructuring Fund — $6,678,258) | | | — | | | | — | | | | — | | | | — | |
Payable for fund shares redeemed | | | — | | | | 450,371 | | | | 989,855 | | | | 70,900 | |
Payable for forward foreign currency contracts | | | — | | | | — | | | | — | | | | 87 | |
Investment advisory fees payable (Note 2) | | | 101,971 | | | | 170,085 | | | | — | | | | 149,107 | |
Administration fees payable (Note 2) | | | 158,874 | | | | 71,583 | | | | 1,451 | | | | 42,365 | |
Distribution and shareholder servicing fees payable (Note 2) | | | 213,594 | | | | 67,066 | | | | 25,911 | | | | 69,896 | |
Directors’/Trustees’ fees and expenses payable (Note 2) | | | — | | | | — | | | | — | | | | — | |
Accrued expenses and other payables | | | 303,316 | | | | 215,549 | | | | 129,521 | | | | 76,560 | |
| | | | | | | | | | | | | | | | |
Total Liabilities | | | 4,749,564 | | | | 4,077,443 | | | | 3,227,539 | | | | 1,634,063 | |
| | | | | | | | | | | | | | | | |
NET ASSETS | | $ | 1,257,076,587 | | | $ | 551,719,773 | | | $ | 115,996,905 | | | $ | 337,979,750 | |
| | | | | | | | | | | | | | | | |
NET ASSETS consist of: | | | | | | | | | | | | | | | | |
Undistributed (distributions in excess of) net investment income | | $ | 27,558 | | | $ | 23,250 | | | $ | (496,938 | ) | | $ | 575,259 | |
Accumulated net realized gain (loss) on investments, foreign currency transactions and written options | | | (43,438 | ) | | | (1,867,299 | ) | | | (65,480,709 | ) | | | (4,072,107 | ) |
Unrealized appreciation of investments, foreign currency translations and written options | | | — | | | | 1,096,687 | | | | 4,533,150 | | | | 55,645,420 | |
Par value (Note 5) | | | 1,257,297 | | | | 61,436 | | | | 241 | | | | 239 | |
Paid in capital in excess of par value | | | 1,255,835,170 | | | | 552,405,699 | | | | 177,441,161 | | | | 285,830,939 | |
| | | | | | | | | | | | | | | | |
Net Assets | | $ | 1,257,076,587 | | | $ | 551,719,773 | | | $ | 115,996,905 | | | $ | 337,979,750 | |
| | | | | | | | | | | | | | | | |
Net Assets: | | | | | | | | | | | | | | | | |
Institutional Shares | | $ | 612,562,109 | | | $ | 237,751,881 | | | $ | 4,309,497 | | | $ | 60,102,510 | |
Shares | | | 644,514,478 | | | | 313,966,821 | | | | 111,687,408 | | | | 277,877,240 | |
Retirement Shares | | | — | | | | 1,071 | | | | — | | | | — | |
Shares outstanding (Note 5): | | | | | | | | | | | | | | | | |
Institutional Shares | | | 612,553,051 | | | | 26,469,879 | | | | 897,626 | | | | 4,237,238 | |
Shares | | | 644,743,985 | | | | 34,965,727 | | | | 23,247,564 | | | | 19,613,009 | |
Retirement Shares | | | — | | | | 119 | | | | — | | | | — | |
NET ASSET VALUE PER SHARE (net assets ÷ shares outstanding): | | | | | | | | | | | | | | | | |
Institutional Shares | | | $1.00 | | | | $8.98 | | | | $4.80 | | | | $14.18 | |
| | | | | | | | | | | | | | | | |
Shares | | | $1.00 | | | | $8.98 | | | | $4.80 | | | | $14.17 | |
| | | | | | | | | | | | | | | | |
Retirement Shares | | | — | | | | $ 8.98 | (a) | | | — | | | | — | |
| | | | | | | | | | | | | | | | |
| (a) | | Due to rounding net assets divided by shares outstanding does not equal the net asset value per share. |
See Notes to Financial Statements.
58
| | | | | | | | | | | | | | | | |
| | | | |
Large Cap
Growth
Fund | | | Mid Cap Value
and
Restructuring Fund | | Value and
Restructuring
Fund | | | Emerging
Markets
Fund | | International
Equity
Fund | |
| | | | | | | | | | | | | | | | |
| $ | 610,313,025 | | | $ | 211,894,664 | | $ | 5,382,230,435 | | | $ | 733,105,953 | | $ | 49,151,330 | |
| | | | | | | | | | | | | | | | | |
| $ | 734,267,118 | | | $ | 326,916,863 | | $ | 8,134,884,592 | | | $ | 1,133,114,056 | | $ | 69,476,382 | |
| | 219 | | | | 810 | | | 14,546 | | | | 635 | | | 287 | |
| | — | | | | — | | | 589 | | | | 645,073 | | | 17,736 | |
| | 1,928 | | | | 209,475 | | | 11,412,758 | | | | 3,221,408 | | | 248,529 | |
| | — | | | | — | | | 13,711,725 | | | | — | | | — | |
| | 1,146,238 | | | | 2,101,242 | | | 20,321,987 | | | | 919,142 | | | 573,052 | |
| | — | | | | — | | | — | | | | — | | | — | |
| | — | | | | — | | | — | | | | — | | | — | |
| | — | | | | — | | | — | | | | 3,212 | | | 32,615 | |
| | 23,315 | | | | 3,946 | | | 120,997 | | | | 14,496 | | | 952 | |
| | | | | | | | | | | | | | | | | |
| | 735,438,818 | | | | 329,232,336 | | | 8,180,467,194 | | | | 1,137,918,022 | | | 70,349,553 | |
| | | | | | | | | | | | | | | | |
| | — | | | | — | | | — | | | | — | | | — | |
| | — | | | | — | | | 16,781,959 | | | | — | | | 83,581 | |
| | — | | | | — | | | — | | | | — | | | — | |
| | — | | | | — | | | 3,835,000 | | | | — | | | — | |
| | 220,101 | | | | 1,737,971 | | | 10,778,197 | | | | 1,627,177 | | | 931 | |
| | — | | | | — | | | 6,774 | | | | — | | | 234 | |
| | 455,534 | | | | 175,356 | | | 4,057,059 | | | | 1,117,311 | | | 33,540 | |
| | 94,995 | | | | 41,710 | | | 1,036,177 | | | | 190,498 | | | 11,514 | |
| | 155,789 | | | | 61,976 | | | 1,777,666 | | | | 230,887 | | | — | |
| | — | | | | — | | | 6,591 | | | | — | | | — | |
| | 76,276 | | | | 98,554 | | | 1,030,955 | | | | 338,670 | | | 36,649 | |
| | | | | | | | | | | | | | | | | |
| | 1,002,695 | | | | 2,115,567 | | | 39,310,378 | | | | 3,504,543 | | | 166,449 | |
| | | | | | | | | | | | | | | | | |
| $ | 734,436,123 | | | $ | 327,116,769 | | $ | 8,141,156,816 | | | $ | 1,134,413,479 | | $ | 70,183,104 | |
| | | | | | | | | | | | | | | | | |
| | | | | | | | | | | | | | | | |
| $ | — | | | $ | 3,066,218 | | $ | 16,648,966 | | | $ | 163,806 | | $ | 157,223 | |
| | (124,103,097 | ) | | | 6,611,985 | | | (49,675,559 | ) | | | 2,849,442 | | | (10,297,960 | ) |
| | 123,954,093 | | | | 115,022,199 | | | 2,755,490,696 | | | | 400,039,421 | | | 20,327,563 | |
| | 69,260 | | | | 151 | | | 149,837 | | | | 80,656 | | | 62 | |
| | 734,515,867 | | | | 202,416,216 | | | 5,418,542,876 | | | | 731,280,154 | | | 59,996,216 | |
| | | | | | | | | | | | | | | | | |
| $ | 734,436,123 | | | $ | 327,116,769 | | $ | 8,141,156,816 | | | $ | 1,134,413,479 | | $ | 70,183,104 | |
| | | | | | | | | | | | | | | | | |
| | | | | | | | | | | | | | | | |
| $ | 16,008,781 | | | $ | 31,567,913 | | $ | 370,518,321 | | | $ | 41,932,144 | | $ | 70,183,104 | |
| | 718,424,273 | | | | 294,451,533 | | | 7,767,712,682 | | | | 1,092,481,335 | | | — | |
| | 3,069 | | | | 1,097,323 | | | 2,925,813 | | | | — | | | — | |
| | | | | | | | | | | | | | | | |
| | 1,508,238 | | | | 1,454,320 | | | 6,818,985 | | | | 2,974,447 | | | — | |
| | 67,751,307 | | | | 13,624,483 | | | 142,964,239 | | | | 77,681,696 | | | 6,162,865 | |
| | 294 | | | | 51,093 | | | 53,880 | | | | — | | | — | |
| | | | | | | | | | | | | | | | |
| | $10.61 | | | | $21.71 | | | $54.34 | | | | $14.10 | | | $11.39 | |
| | | | | | | | | | | | | | | | | |
| | $10.60 | | | | $21.61 | | | $54.33 | | | | $14.06 | | | $— | |
| | | | | | | | | | | | | | | | | |
| | $10.45 | (a) | | | $21.48 | | | $54.30 | | | | — | | | $— | |
| | | | | | | | | | | | | | | | | |
See Notes to Financial Statements.
59
Excelsior Funds
Statements of Operations
For the Year Ended March 31, 2007
| | | | | | | | | | | | | | | | |
| | | | |
| | | Money
Fund | | | Core
Bond
Fund | | | High
Yield
Fund | | |
Equity
Opportunities
Fund | |
INVESTMENT INCOME: | | | | | | | | | | | | | | | | |
Dividend income | | $ | 194,029 | | | $ | 999,150 | | | $ | 65,635 | | | $ | 3,437,790 | |
Interest income | | | 70,627,174 | | | | 21,099,384 | | | | 9,698,634 | | | | 544,924 | |
Less: Foreign taxes withheld | | | — | | | | — | | | | — | | | | (67,722 | ) |
| | | | | | | | | | | | | | | | |
Total Income | | | 70,821,203 | | | | 22,098,534 | | | | 9,764,269 | | | | 3,914,992 | |
EXPENSES: | | | | | | | | | | | | | | | | |
Investment advisory fees (Note 2) | | | 3,375,831 | | | | 2,873,544 | | | | 978,058 | | | | 1,842,685 | |
Shareholder servicing fees — Institutional Shares (Note 2) | | | — | | | | — | | | | — | | | | — | |
Shareholder servicing fees — Shares (Note 2) | | | 2,058,929 | | | | 738,959 | | | | 286,507 | | | | 471,667 | |
Distribution and shareholder servicing fees — Retirement Shares (Note 2) | | | — | | | | 7 | | | | — | | | | — | |
Administration fees (Note 2) | | | 2,037,855 | | | | 633,088 | | | | 184,503 | | | | 370,773 | |
Transfer agent fees | | | 98,041 | | | | 165,543 | | | | 34,437 | | | | 32,575 | |
Legal and audit fees | | | 34,136 | | | | 61,650 | | | | 481,103 | | | | 42,908 | |
Custodian fees | | | 100,758 | | | | 43,655 | | | | 14,279 | | | | 37,137 | |
Directors’/Trustees’ fees and expenses (Note 2) | | | 40,964 | | | | 17,725 | | | | 9,095 | | | | 11,673 | |
Miscellaneous expenses | | | 174,493 | | | | 149,636 | | | | 66,401 | | | | 103,047 | |
| | | | | | | | | | | | | | | | |
Total Expenses | | | 7,921,007 | | | | 4,683,807 | | | | 2,054,383 | | | | 2,912,465 | |
Fees waived and reimbursed by: | | | | | | | | | | | | | | | | |
Investment Adviser (Note 2) | | | (1,811,067 | ) | | | (1,217,980 | ) | | | (522,552 | ) | | | (475,587 | ) |
Administrator (Note 2) | | | (10,503 | ) | | | (4,685 | ) | | | (271,220 | ) | | | (11,224 | ) |
Custody earning credits | | | (33,235 | ) | | | (8,001 | ) | | | (8,165 | ) | | | (4,184 | ) |
| | | | | | | | | | | | | | | | |
Net Expenses | | | 6,066,202 | | | | 3,453,141 | | | | 1,252,446 | | | | 2,421,470 | |
| | | | | | | | | | | | | | | | |
NET INVESTMENT INCOME (LOSS) | | | 64,755,001 | | | | 18,645,393 | | | | 8,511,823 | | | | 1,493,522 | |
| | | | | | | | | | | | | | | | |
REALIZED AND UNREALIZED GAIN (LOSS) ON INVESTMENTS (NOTE 1): | | | | | | | | | | | | | | | | |
Net realized gain (loss) on: | | | | | | | | | | | | | | | | |
Security transactions | | | (2,912 | ) | | | (67,050 | ) | | | (309,422 | ) | | | (1,521,686 | ) |
Net realized gains from redemptions in-kind | | | — | | | | — | | | | — | | | | — | |
Foreign currency transactions | | | — | | | | — | | | | — | | | | (3,821 | ) |
Written options | | | — | | | | — | | | | — | | | | — | |
| | | | | | | | | | | | | | | | |
Total net realized gain (loss) | | | (2,912 | ) | | | (67,050 | ) | | | (309,422 | ) | | | (1,525,507 | ) |
Change in unrealized appreciation (depreciation) of investments, foreign currency translations and written options during the period | | | — | | | | 5,359,028 | | | | 6,524,399 | | | | 31,286,902 | |
| | | | | | | | | | | | | | | | |
Net realized and unrealized gain (loss) on investments, foreign currency transactions and written options | | | (2,912 | ) | | | 5,291,978 | | | | 6,214,977 | | | | 29,761,395 | |
| | | | | | | | | | | | | | | | |
| | | | |
Net increase in net assets resulting from operations | | $ | 64,752,089 | | | $ | 23,937,371 | | | $ | 14,726,800 | | | $ | 31,254,917 | |
| | | | | | | | | | | | | | | | |
See Notes to Financial Statements.
60
| | | | | | | | | | | | | | | | | | |
| | | | |
Large Cap
Growth
Fund | | | Mid Cap
Value and
Restructuring
Fund | | | Value and
Restructuring
Fund | | | Emerging
Markets
Fund | | | International
Equity
Fund | |
| | | | | | | | | | | | | | | | | | |
| $ | 2,458,581 | | | $ | 6,244,366 | | | $ | 139,630,565 | | | $ | 24,558,726 | | | $ | 1,312,151 | |
| | 841,708 | | | | 139,982 | | | | 3,266,334 | | | | 1,899,340 | | | | 62,687 | |
| | (76,949 | ) | | | (50,757 | ) | | | (892,911 | ) | | | (2,389,117 | ) | | | (131,060 | ) |
| | | | | | | | | | | | | | | | | | | |
| | 3,223,340 | | | | 6,333,591 | | | | 142,003,988 | | | | 24,068,949 | | | | 1,243,778 | |
| | | | | | | | | | | | | | | | | | |
| | 4,689,122 | | | | 1,889,491 | | | | 43,686,889 | | | | 12,810,571 | | | | 642,176 | |
| | | | |
| | — | | | | — | | | | 96,083 | | | | — | | | | 113 | |
| | 1,550,709 | | | | 618,540 | | | | 16,702,594 | | | | 2,482,494 | | | | — | |
| | | | |
| | 12 | | | | 720 | | | | 10,250 | | | | — | | | | — | |
| | 943,523 | | | | 438,688 | | | | 10,988,075 | | | | 2,049,708 | | | | 128,436 | |
| | 99,116 | | | | 92,953 | | | | 2,073,728 | | | | 323,774 | | | | 9,038 | |
| | 77,595 | | | | 33,086 | | | | 334,628 | | | | 86,464 | | | | 34,682 | |
| | 35,120 | | | | 19,910 | | | | 471,097 | | | | 1,399,093 | | | | 37,935 | |
| | 21,322 | | | | 13,487 | | | | 190,517 | | | | 31,782 | | | | 7,394 | |
| | 103,152 | | | | 83,107 | | | | 1,139,363 | | | | 261,313 | | | | 53,825 | |
| | | | | | | | | | | | | | | | | | | |
| | 7,519,671 | | | | 3,189,982 | | | | 75,693,224 | | | | 19,445,199 | | | | 913,599 | |
| | | | | | | | | | | | | | | | | | |
| | (30,328 | ) | | | (3,989 | ) | | | — | | | | (565,179 | ) | | | (207,236 | ) |
| | (6,217 | ) | | | (10,966 | ) | | | (69,676 | ) | | | (9,754 | ) | | | (2,319 | ) |
| | (3,856 | ) | | | (1,830 | ) | | | (54,238 | ) | | | (15,564 | ) | | | (523 | ) |
| | | | | | | | | | | | | | | | | | | |
| | 7,479,270 | | | | 3,173,197 | | | | 75,569,310 | | | | 18,854,702 | | | | 703,521 | |
| | | | | | | | | | | | | | | | | | | |
| | (4,255,930 | ) | | | 3,160,394 | | | | 66,434,678 | | | | 5,214,247 | | | | 540,257 | |
| | | | | | | | | | | | | | | | | | | |
| | | | | | | | | | | | | | | | | | |
| | | | | | | | | | | | | | | | | | |
| | 11,805,044 | | | | 8,600,856 | | | | 95,436,544 | | | | 48,908,433 | | | | 4,984,682 | |
| | — | | | | 23,046,664 | | | | — | | | | — | | | | — | |
| | — | | | | 1,444 | | | | (12,160 | ) | | | (39,140 | ) | | | (15,727 | ) |
| | — | | | | — | | | | 1,331,652 | | | | — | | | | — | |
| | | | | | | | | | | | | | | | | | | |
| | 11,805,044 | | | | 31,648,964 | | | | 96,756,036 | | | | 48,869,293 | | | | 4,968,955 | |
|
37,708,433 |
| | | (10,315,446 | ) | | | 645,371,791 | | | | 100,008,846 | | | | 4,336,996 | |
| | | | | | | | | | | | | | | | | | | |
|
49,513,477 |
| | | 21,333,518 | | | | 742,127,827 | | | | 148,878,139 | | | | 9,305,951 | |
| | | | | | | | | | | | | | | | | | | |
| | | | |
| $ | 45,257,547 | | | $ | 24,493,912 | | | $ | 808,562,505 | | | $ | 154,092,386 | | | $ | 9,846,208 | |
| | | | | | | | | | | | | | | | | | | |
See Notes to Financial Statements.
61
Excelsior Funds
Statements of Changes in Net Assets
| | | | | | | | | | | | | | | | |
| | |
| | | Money Fund | | | Core Bond Fund | |
| | | Year Ended March 31, | | | Year Ended March 31, | |
| | | 2007 | | | 2006 | | | 2007 | | | 2006 | |
Net investment income (loss) | | $ | 64,755,001 | | | $ | 52,416,558 | | | $ | 18,645,393 | | | $ | 10,061,835 | |
Net realized gain (loss) on investments and foreign currency transactions | | | (2,912 | ) | | | (4,889 | ) | | | (67,050 | ) | | | 1,284,930 | |
Net realized gain (loss) on written options | | | — | | | | — | | | | — | | | | — | |
Change in unrealized appreciation (depreciation) of investments, foreign currency translations and written options during the period | | | — | | | | — | | | | 5,359,028 | | | | (7,274,735 | ) |
| | | | | | | | | | | | | | | | |
Net increase in net assets resulting from operations | | | 64,752,089 | | | | 52,411,669 | | | | 23,937,371 | | | | 4,072,030 | |
| | | | | | | | | | | | | | | | |
Distributions to shareholders: | | | | | | | | | | | | | | | | |
From net investment income | | | | | | | | | | | | | | | | |
Institutional Shares | | | (26,104,170 | ) | | | (19,834,796 | ) | | | (5,693,159 | ) | | | (6,254 | ) |
Shares | | | (38,623,273 | ) | | | (32,581,762 | ) | | | (12,851,594 | ) | | | (10,218,978 | ) |
Retirement Shares | | | — | | | | — | | | | (40 | ) | | | (38 | ) |
From net realized gain on investments | | | | | | | | | | | | | | | | |
Institutional shares | | | — | | | | — | | | | — | | | | (13 | ) |
Shares | | | — | | | | — | | | | — | | | | (3,571,500 | ) |
Retirement Shares | | | — | | | | — | | | | — | | | | (13 | ) |
From tax return of capital | | | | | | | | | | | | | | | | |
Institutional Shares | | | — | | | | — | | | | — | | | | — | |
Shares | | | — | | | | — | | | | — | | | | — | |
| | | | | | | | | | | | | | | | |
Total distributions | | | (64,727,443 | ) | | | (52,416,558 | ) | | | (18,544,793 | ) | | | (13,796,796 | ) |
| | | | | | | | | | | | | | | | |
Increase (decrease) in net assets from fund share transactions (Note 5) | | | (298,083,731 | ) | | | (175,199,854 | ) | | | 263,311,270 | | | | 80,807,705 | |
| | | | | | | | | | | | | | | | |
Net increase (decrease) in net assets | | | (298,059,085 | ) | | | (175,204,743 | ) | | | 268,703,848 | | | | 71,082,939 | |
| | | | | | | | | | | | | | | | |
NET ASSETS: | | | | | | | | | | | | | | | | |
Beginning of period | | | 1,555,135,672 | | | | 1,730,340,415 | | | | 283,015,925 | | | | 211,932,986 | |
| | | | | | | | | | | | | | | | |
End of period (1) | | $ | 1,257,076,587 | | | $ | 1,555,135,672 | | | $ | 551,719,773 | | | $ | 283,015,925 | |
| | | | | | | | | | | | | | | | |
(1) Including undistributed (distributions in excess of) net investment income | | $ | 27,558 | | | $ | — | | | $ | 23,250 | | | $ | 2,407 | |
| | | | | | | | | | | | | | | | |
See Notes to Financial Statements.
62
| | | | | | | | | | | | | | | | | | | | | | |
| | |
| High Yield Fund | | | Equity Opportunities Fund | | | Large Cap Growth Fund | |
| Year Ended March 31, | | | Year Ended March 31, | | | Year Ended March 31, | |
| 2007 | | | 2006 | | | 2007 | | | 2006 | | | 2007 | | | 2006 | |
| $ | 8,511,823 | | | $ | 11,285,812 | | | $ | 1,493,522 | | | $ | 838,846 | | | $ | (4,255,930 | ) | | $ | (1,492,015 | ) |
| | (309,422 | ) | | | (4,085,478 | ) | | | (1,525,507 | ) | | | (2,557,056 | ) | | | 11,805,044 | | | | 3,004,935 | |
| | — | | | | — | | | | — | | | | — | | | | — | | | | — | |
| | | | | |
| | 6,524,399 | | | | (1,518,767 | ) | | | 31,286,902 | | | | 23,862,728 | | | | 37,708,433 | | | | 59,460,912 | |
| | | | | | | | | | | | | | | | | | | | | | | |
| | 14,726,800 | | | | 5,681,567 | | | | 31,254,917 | | | | 22,144,518 | | | | 45,257,547 | | | | 60,973,832 | |
| | | | | | | | | | | | | | | | | | | | | | | |
| | | | | | | | | | | | | | | | | | | | | | |
| | | | | | | | | | | | | | | | | | | | | | |
| | (539,707 | ) | | | (1,002,532 | ) | | | (425,370 | ) | | | (312,869 | ) | | | — | | | | — | |
| | (7,813,910 | ) | | | (9,681,268 | ) | | | (851,918 | ) | | | (261,632 | ) | | | — | | | | — | |
| | — | | | | — | | | | — | | | | — | | | | — | | | | — | |
| | | | | | | | | | | | | | | | | | | | | | |
| | — | | | | — | | | | — | | | | — | | | | — | | | | — | |
| | — | | | | — | | | | — | | | | — | | | | — | | | | — | |
| | — | | | | — | | | | — | | | | — | | | | — | | | | — | |
| | | | | | | | | | | | | | | | | | | | | | |
| | — | | | | (28,599 | ) | | | — | | | | — | | | | — | | | | — | |
| | — | | | | (325,252 | ) | | | — | | | | — | | | | — | | | | — | |
| | | | | | | | | | | | | | | | | | | | | | | |
| | (8,353,617 | ) | | | (11,037,651 | ) | | | (1,277,288 | ) | | | (574,501 | ) | | | — | | | | — | |
| | | | | | | | | | | | | | | | | | | | | | | |
| | | | | |
| | (39,412,117 | ) | | | (15,055,145 | ) | | | 121,147,723 | | | | 67,878,748 | | | | 136,983,006 | | | | 281,160,848 | |
| | | | | | | | | | | | | | | | | | | | | | | |
| | (33,038,934 | ) | | | (20,411,229 | ) | | | 151,125,352 | | | | 89,448,765 | | | | 182,240,553 | | | | 342,134,680 | |
| | | | | | | | | | | | | | | | | | | | | | | |
| | | | | | | | | | | | | | | | | | | | | | |
| | 149,035,839 | | | | 169,447,068 | | | | 186,854,398 | | | | 97,405,633 | | | | 552,195,570 | | | | 210,060,890 | |
| | | | | | | | | | | | | | | | | | | | | | | |
| $ | 115,996,905 | | | $ | 149,035,839 | | | $ | 337,979,750 | | | $ | 186,854,398 | | | $ | 734,436,123 | | | $ | 552,195,570 | |
| | | | | | | | | | | | | | | | | | | | | | | |
| | | | | |
| $ | (496,938 | ) | | $ | (691,493 | ) | | $ | 575,259 | | | $ | 362,846 | | | $ | — | | | $ | — | |
| | | | | | | | | | | | | | | | | | | | | | | |
See Notes to Financial Statements.
63
Excelsior Funds
Statements of Changes in Net Assets
| | | | | | | | | | | | | | | | |
| | |
| | | Mid Cap Value and
Restructuring
Fund | | | Value and
Restructuring
Fund | |
| | | Year Ended March 31, | | | Year Ended March 31, | |
| | | 2007 | | | 2006 | | | 2007 | | | 2006 | |
Net investment income (loss) | | $ | 3,160,394 | | | $ | 286,682 | | | $ | 66,434,678 | | | $ | 62,768,364 | |
Net realized gain (loss) on investments and foreign currency transactions | | | 8,602,300 | | | | (1,834,247 | ) | | | 95,424,384 | | | | 25,898,526 | |
Net realized gains from redemptions in-kind | | | 23,046,664 | | | | — | | | | — | | | | — | |
Net realized gain (loss) on written options | | | — | | | | — | | | | 1,331,652 | | | | (7,456,185 | ) |
Change in unrealized appreciation (depreciation) of investments, foreign currency translations and written options during the period | | | (10,315,446 | ) | | | 51,686,678 | | | | 645,371,791 | | | | 892,712,062 | |
| | | | | | | | | | | | | | | | |
Net increase in net assets resulting from operations | | | 24,493,912 | | | | 50,139,113 | | | | 808,562,505 | | | | 973,922,767 | |
| | | | | | | | | | | | | | | | |
Distributions to shareholders: | | | | | | | | | | | | | | | | |
From net investment income | | | | | | | | | | | | | | | | |
Institutional Shares | | | (28,083 | ) | | | (320,565 | ) | | | (3,526,597 | ) | | | (2,339,479 | ) |
Shares | | | (69,200 | ) | | | (377,856 | ) | | | (64,324,804 | ) | | | (50,184,813 | ) |
Retirement Shares | | | — | | | | — | | | | (4,928 | ) | | | (1,311 | ) |
From net realized gain on investments | | | | | | | | | | | | | | | | |
Institutional shares | | | (812 | ) | | | — | | | | — | | | | — | |
Shares | | | (6,735 | ) | | | — | | | | — | | | | — | |
Retirement Shares | | | — | | | | — | | | | — | | | | — | |
From tax return of capital | | | | | | | | | | | | | | | | |
Institutional Shares | | | — | | | | — | | | | — | | | | — | |
Shares | | | — | | | | — | | | | — | | | | — | |
| | | | | | | | | | | | | | | | |
Total distributions | | | (104,830 | ) | | | (698,421 | ) | | | (67,856,329 | ) | | | (52,525,603 | ) |
| | | | | | | | | | | | | | | | |
Increase (decrease) in net assets from fund share transactions (Note 5) | | | (36,769,439 | ) | | | (6,359,254 | ) | | | 918,433,748 | | | | 930,527,802 | |
| | | | | | | | | | | | | | | | |
Net increase (decrease) in net assets | | | (12,380,357 | ) | | | 43,081,438 | | | | 1,659,139,924 | | | | 1,851,924,966 | |
| | | | | | | | | | | | | | | | |
NET ASSETS: | | | | | | | | | | | | | | | | |
Beginning of period | | | 339,497,126 | | | | 296,415,688 | | | | 6,482,016,892 | | | | 4,630,091,926 | |
| | | | | | | | | | | | | | | | |
End of period(1) | | $ | 327,116,769 | | | $ | 339,497,126 | | | $ | 8,141,156,816 | | | $ | 6,482,016,892 | |
| | | | | | | | | | | | | | | | |
(1) Including undistributed (distributions in excess of) net investment income | | $ | 3,066,218 | | | $ | — | | | $ | 16,648,966 | | | $ | 19,146,231 | |
| | | | | | | | | | | | | | | | |
See Notes to Financial Statements.
64
| | | | | | | | | | | | | | | | | | |
| | | |
Emerging Markets
Fund | | | International Equity
Fund | | | | | |
| Year Ended March 31, | | | Year Ended March 31, | | | | | |
| 2007 | | | 2006 | | | 2007 | | | 2006 | | | | | |
| $ | 5,214,247 | | | $ | 6,417,946 | | | $ | 540,257 | | | $ | 465,786 | | | | | |
|
48,869,293 |
| | | 9,661,036 | | | | 4,968,955 | | | | 4,340,680 | | | | | |
| | — | | | | — | | | | — | | | | — | | | | | |
| | — | | | | — | | | | — | | | | — | | | | | |
| | 100,008,846 | | | | 233,002,829 | | | | 4,336,996 | | | | 7,679,711 | | | | | |
| | | | | | | | | | | | | | | | | | | |
| | 154,092,386 | | | | 249,081,811 | | | | 9,846,208 | | | | 12,486,711 | | | | | |
| | | | | | | | | | | | | | | | | | | |
| | | | | | | | | | | | | | | | | | |
| | | | | | | | | | | | | | | | | | |
| | (252,640 | ) | | | (210,171 | ) | | | (492,367 | ) | | | (738,048 | ) | | | | |
| | (5,716,045 | ) | | | (5,703,935 | ) | | | — | | | | — | | | | | |
| | — | | | | — | | | | — | | | | — | | | | | |
| | | | | | | | | | | | | | | | | | |
| | (1,858,765 | ) | | | — | | | | — | | | | — | | | | | |
| | (51,272,417 | ) | | | — | | | | — | | | | — | | | | | |
| | — | | | | — | | | | — | | | | — | | | | | |
| | | | | | | | | | | | | | | | | | |
| | — | | | | — | | | | — | | | | — | | | | | |
| | — | | | | — | | | | — | | | | — | | | | | |
| | | | | | | | | | | | | | | | | | | |
| | (59,099,867 | ) | | | (5,914,106 | ) | | | (492,367 | ) | | | (738,048 | ) | | | | |
| | | | | | | | | | | | | | | | | | | |
| | 17,298,560 | | | | 345,786,429 | | | | 587,093 | | | | 5,054,635 | | | | | |
| | | | | | | | | | | | | | | | | | | |
| | 112,291,079 | | | | 588,954,134 | | | | 9,940,934 | | | | 16,802,764 | | | | | |
| | | | | | | | | | | | | | | | | | | |
| | | | | | | | | | | | | | | | | | |
| | 1,022,122,400 | | | | 433,168,266 | | | | 60,242,170 | | | | 43,439,406 | | | | | |
| | | | | | | | | | | | | | | | | | | |
| $ | 1,134,413,479 | | | $ | 1,022,122,400 | | | $ | 70,183,104 | | | $ | 60,242,170 | | | | | |
| | | | | | | | | | | | | | | | | | | |
| | | | | |
| $ | 163,806 | | | $ | 1,061,119 | | | $ | 157,223 | | | $ | 125,060 | | | | | |
| | | | | | | | | | | | | | | | | | | |
See Notes to Financial Statements.
65
Excelsior Funds
Financial Highlights — Selected Per Share Data and Ratios
| | | | | | | | | | | | | | | | | | | | | | | |
| | | | | | |
| | | Net Asset Value,
Beginning of
Year | | Net
Investment
Income | | | Net Realized and
Unrealized
Gain (Loss) of
Investments
and Options | | | Total From
Investment
Operations | | | Dividends
From Net
Investment
Income | | | Distributions
From Net
Realized
Gain on
Investments
and Options | |
MONEY FUND — (12/16/99*) | | | | | | | | | | | | | | | | | |
Institutional Shares: | | | | | | | | | | | | | | | | | | | | | | | |
Year Ended March 31, | | | | | | | | | | | | | | | | | | | | | | | |
2007 | | $ | 1.00 | | $ | 0.05 | (2) | | $ | — | (2) | | $ | 0.05 | | | $ | (0.05 | ) | | $ | — | |
2006 | | | 1.00 | | | 0.04 | (2) | | | (0.01 | )(2) | | | 0.03 | | | | (0.03 | ) | | | — | |
2005 | | | 1.00 | | | 0.02 | (2) | | | (0.01 | )(2) | | | 0.01 | | | | (0.01 | ) | | | — | |
2004 | | | 1.00 | | | 0.01 | | | | — | | | | 0.01 | | | | (0.01 | ) | | | — | |
2003 | | | 1.00 | | | 0.01 | | | | — | (3) | | | 0.01 | | | | (0.01 | ) | | | — | |
CORE BOND FUND — (11/29/05*) | | | | | | | | | | | | | | | | | |
Institutional Shares: | | | | | | | | | | | | | | | | | | | | | | | |
Year Ended March 31, | | | | | | | | | | | | | | | | | | | | | | | |
2007 | | $ | 8.84 | | $ | 0.41 | (2) | | $ | 0.14 | (2) | | $ | 0.55 | | | $ | (0.41 | ) | | $ | — | |
Period Ended March 31, | | | | | | | | | | | | | | | | | | | | | | | |
2006 | | | 9.07 | | | 0.13 | (2) | | | (0.11 | )(2) | | | 0.02 | | | | (0.13 | ) | | | (0.12 | ) |
HIGH YIELD FUND — (10/31/00*) | | | | | | | | | | | | | | | | | |
Institutional Shares: | | | | | | | | | | | | | | | | | | | | | | | |
Year Ended March 31, | | | | | | | | | | | | | | | | | | | | | | | |
2007 | | $ | 4.52 | | $ | 0.33 | (2) | | $ | 0.28 | (2) | | $ | 0.61 | | | $ | (0.33 | ) | | $ | — | |
2006 | | | 4.66 | | | 0.32 | (2) | | | (0.14 | )(2) | | | 0.18 | | | | (0.32 | )(6) | | | — | |
2005 | | | 4.71 | | | 0.32 | (2) | | | (0.06 | )(2) | | | 0.26 | | | | (0.31 | ) | | | — | |
2004 | | | 3.99 | | | 0.35 | (2) | | | 0.72 | (2) | | | 1.07 | | | | (0.35 | )(7) | | | — | |
2003 | | | 6.20 | | | 0.93 | (2) | | | (1.58 | )(2) | | | (0.65 | ) | | | (1.56 | )(8) | | | — | |
EQUITY OPPORTUNITIES FUND — (01/31/05*) | | | | | | | | | | | | | | | | | |
Institutional Shares: | | | | | | | | | | | | | | | | | | | | | | | |
Year Ended March 31, | | | | | | | | | | | | | | | | | | | | | | | |
2007 | | $ | 12.72 | | $ | 0.10 | (2) | | $ | 1.46 | (2) | | $ | 1.56 | | | $ | (0.10 | ) | | $ | — | |
2006 | | | 10.98 | | | 0.09 | (2) | | | 1.72 | (2) | | | 1.81 | | | | (0.07 | ) | | | — | |
Period Ended March 31, | | | | | | | | | | | | | | | | | | | | | | | |
2005 | | | 10.84 | | | 0.02 | (2) | | | 0.12 | (2) | | | 0.14 | | | | — | | | | — | |
LARGE CAP GROWTH FUND — (11/09/06*) | | | | | | | | | | | | | | | | | |
Institutional Shares: | | | | | | | | | | | | | | | | | | | | | | | |
Period Ended March 31, | | | | | | | | | | | | | | | | | | | | | | | |
2007 | | $ | 10.13 | | $ | (0.02 | )(2) | | $ | 0.50 | (2) | | $ | 0.48 | | | $ | — | | | $ | — | |
| * | Commencement of Operations. |
| (1) | Expense ratios before waiver of fees and reimbursement of expenses (if any) by adviser and administrator. |
| (2) | For comparative purposes per share amounts are based on average shares outstanding. |
| (3) | Amount represents less than $0.01 per share. |
| (6) | Includes a tax return of capital of $(0.01). |
| (7) | Includes a tax return of capital of $(0.08). |
| (8) | Includes a tax return of capital of $(0.51). |
| (9) | The ratio of net operating expenses would have been 0.80%, if custody credits had not been included. |
See Notes to Financial Statements.
66
| | | | | | | | | | | | | | | | | | | | | | | |
| | | | | | | |
Total
Distributions | | | Net Asset
Value,
End of
Year | | Total
Return | | | Net Assets,
End of
Year
(000’s) | |
Ratio of Net
Operating
Expenses to
Average
Net Assets | | | Ratio of Gross
Operating
Expenses
to Average
Net Assets (1) | | | Ratio of Net
Investment
Income
to Average
Net Assets | | | Portfolio
Turnover
Rate | |
| | | | | | | | | | | | | | | | | | | | | | | |
| | | | | | | | | | | | | | | | | | | | | | | |
| | | | | | | | | | | | | | | | | | | | | | | |
| $ | (0.05 | ) | | $ | 1.00 | | 5.07 | % | | $ | 612,562 | | 0.30 | % | | 0.43 | % | | 4.96 | % | | — | |
| | (0.03 | ) | | | 1.00 | | 3.53 | % | | | 522,751 | | 0.29 | % | | 0.44 | % | | 3.54 | % | | — | |
| | (0.01 | ) | | | 1.00 | | 1.55 | % | | | 625,287 | | 0.21 | % | | 0.46 | % | | 1.52 | % | | — | |
| | (0.01 | ) | | | 1.00 | | 0.87 | % | | | 470,189 | | 0.25 | % | | 0.53 | % | | 0.86 | % | | — | |
| | (0.01 | ) | | | 1.00 | | 1.41 | % | | | 548,126 | | 0.24 | % | | 0.49 | % | | 1.41 | % | | — | |
| | | | | | | | | | | | | | | | | | | | | | | |
| | | | | | | | | | | | | | | | | | | | | | | |
| | | | | | | | | | | | | | | | | | | | | | | |
| $ | (0.41 | ) | | $ | 8.98 | | 6.33 | % | | $ | 237,752 | | 0.65 | % | | 0.91 | % | | 4.61 | % | | 49 | % |
| | | | | | | | | | | | | | | | | | | | | | | |
| | (0.25 | ) | | | 8.84 | | 0.20 | %(4) | | | 1,248 | | 0.66 | %(5) | | 1.22 | %(5) | | 4.56 | %(5) | | 95 | %(4) |
| | | | | | | | | | | | | | | | | | | | | | | |
| | | | | | | | | | | | | | | | | | | | | | | |
| | | | | | | | | | | | | | | | | | | | | | | |
| $ | (0.33 | ) | | $ | 4.80 | | 13.69 | % | | $ | 4,309 | | 0.79 | %(9) | | 1.35 | % | | 7.19 | % | | 75 | % |
| | (0.32 | ) | | | 4.52 | | 4.19 | % | | | 12,045 | | 0.80 | % | | 1.04 | % | | 7.09 | % | | 62 | % |
| | (0.31 | ) | | | 4.66 | | 5.80 | % | | | 13,308 | | 0.80 | % | | 1.07 | % | | 6.71 | % | | 70 | % |
| | (0.35 | ) | | | 4.71 | | 27.76 | % | | | 22,641 | | 0.80 | % | | 1.11 | % | | 7.91 | % | | 170 | % |
| | (1.56 | ) | | | 3.99 | | (10.30 | )% | | | 37,250 | | 0.83 | % | | 1.10 | % | | 19.14 | % | | 153 | % |
| | | | | | | | | | | | | | | | | | | | | | | |
| | | | | | | | | | | | | | | | | | | | | | | |
| | | | | | | | | | | | | | | | | | | | | | | |
| $ | (0.10 | ) | | $ | 14.18 | | 12.33 | % | | $ | 60,103 | | 0.79 | %(9) | | 0.99 | % | | 0.78 | % | | 11 | % |
| | (0.07 | ) | | | 12.72 | | 16.55 | % | | | 54,449 | | 0.80 | % | | 1.05 | % | | 0.78 | % | | 17 | % |
| | | | | | | | | | | | | | | | | | | | | | | |
| | — | | | | 10.98 | | 2.14 | %(4) | | | 53,826 | | 0.80 | %(5) | | 1.21 | %(5) | | 0.87 | %(5) | | 13 | %(4) |
| | | | | | | | | | | | | | | | | | | | | | | |
| | | | | | | | | | | | | | | | | | | | | | | |
| | | | | | | | | | | | | | | | | | | | | | | |
| $ | ��� | | | $ | 10.61 | | 4.73 | %(4) | | $ | 16,009 | | 0.95 | %(5) | | 0.96 | %(5) | | (0.54 | )%(5) | | 33 | %(4) |
See Notes to Financial Statements.
67
Excelsior Funds
Financial Highlights—Selected Per Share Data and Ratios
| | | | | | | | | | | | | | | | | | | | | | | |
| | | | | | |
| | | Net Asset Value,
Beginning of
Year | | Net
Investment
Income | | | Net Realized and
Unrealized
Gain (Loss) of
Investments
and Options | | | Total From
Investment
Operations | | | Dividends
From Net
Investment
Income | | | Distributions
From Net
Realized
Gain on
Investments
and Options | |
MID CAP VALUE AND RESTRUCTURING FUND — (06/01/96*) | | | | | | | | | | | | | |
Institutional Shares: | | | | | | | | | | | | | | | | | | | | | | | |
Year Ended March 31, | | | | | | | | | | | | | | | | | | | | | | | |
2007 | | $ | 19.69 | | $ | 0.18 | (2) | | $ | 1.86 | (2) | | $ | 2.04 | | | $ | (0.02 | ) | | $ | — | (3) |
2006 | | | 16.81 | | | 0.05 | (2) | | | 2.90 | (2) | | | 2.95 | | | | (0.07 | ) | | | — | |
2005 | | | 15.78 | | | 0.25 | (2) | | | 1.04 | (2) | | | 1.29 | | | | (0.26 | ) | | | — | |
2004 | | | 10.25 | | | 0.07 | (2) | | | 5.51 | (2) | | | 5.58 | | | | (0.05 | ) | | | — | |
2003 | | | 13.28 | | | 0.05 | (2) | | | (3.04 | )(2) | | | (2.99 | ) | | | (0.04 | ) | | | — | |
VALUE AND RESTRUCTURING FUND — (09/30/02*) | | | | | | | | | | | | | |
Institutional Shares: | | | | | | | | | | | | | | | | | | | | | | | |
Year Ended March 31, | | | | | | | | | | | | | | | | | | | | | | | |
2007 | | $ | 49.36 | | $ | 0.56 | (2) | | $ | 5.00 | (2) | | $ | 5.56 | | | $ | (0.58 | ) | | $ | — | |
2006 | | | 41.40 | | | 0.63 | (2) | | | 7.87 | (2) | | | 8.50 | | | | (0.54 | ) | | | — | |
2005 | | | 37.56 | | | 0.42 | (2) | | | 3.84 | (2) | | | 4.26 | | | | (0.42 | ) | | | — | |
2004 | | | 23.65 | | | 0.32 | (2) | | | 13.89 | (2) | | | 14.21 | | | | (0.30 | ) | | | — | |
Period Ended March 31, | | | | | | | | | | | | | | | | | | | | | | | |
2003 | | | 22.92 | | | 0.22 | | | | 0.59 | | | | 0.81 | | | | (0.08 | ) | | | — | |
EMERGING MARKETS FUND — (03/31/05*) | | | | | | | | | | | | | | | | | |
Institutional Shares: | | | | | | | | | | | | | | | | | | | | | | | |
Year Ended March 31, | | | | | | | | | | | | | | | | | | | | | | | |
2007 | | $ | 12.62 | | $ | 0.12 | (2) | | $ | 2.15 | (2) | | $ | 2.27 | | | $ | (0.10 | ) | | $ | (0.69 | ) |
2006 | | | 8.81 | | | 0.13 | (2) | | | 3.79 | (2) | | | 3.92 | | | | (0.11 | ) | | | — | |
INTERNATIONAL EQUITY FUND — (01/24/95*) | | | | | | | | | | | | | | | | | |
Institutional Shares: | | | | | | | | | | | | | | | | | | | | | | | |
Year Ended March 31, | | | | | | | | | | | | | | | | | | | | | | | |
2007 | | $ | 9.87 | | $ | 0.09 | (2) | | $ | 1.51 | (2) | | $ | 1.60 | | | $ | (0.08 | ) | | $ | — | |
2006 | | | 7.80 | | | 0.08 | (2) | | | 2.12 | (2) | | | 2.20 | | | | (0.13 | ) | | | — | |
2005 | | | 6.69 | | | 0.08 | (2) | | | 1.04 | (2) | | | 1.12 | | | | (0.01 | ) | | | — | |
2004 | | | 4.09 | | | 0.08 | | | | 2.59 | | | | 2.67 | | | | (0.07 | ) | | | — | |
2003 | | | 5.85 | | | 0.07 | | | | (1.77 | ) | | | (1.70 | ) | | | (0.06 | ) | | | — | |
| * | Commencement of Operations. |
| (1) | Expense ratios before waiver of fees and reimbursement of expenses (if any) by adviser and administrator. |
| (2) | For comparative purposes per share amounts are based on average shares outstanding. |
| (3) | Amount represents less than $0.01 per share. |
| (6) | Amount represents less than $1,000. |
| (7) | The information presented reflects the impact of the low level of assets at the beginning of the period and throughout the period ended March 31, 2003. Percentage amounts to less than 0.005%. |
See Notes to Financial Statements.
68
| | | | | | | | | | | | | | | | | | | | | | | | |
| | | | | | | |
Total
Distributions | | | Net Asset
Value,
End of
Year | | Total
Return | | | Net Assets,
End of
Year
(000’s) | | |
Ratio of Net
Operating
Expenses
to Average
Net Assets | | | Ratio of Gross
Operating
Expenses to
Average
Net Assets (1) | | | Ratio of Net
Investment
Income
to Average
Net Assets | | | Portfolio
Turnover
Rate | |
| | | | | | | | | | | | | | | | | | | | | | | | |
| | | | | | | | | | | | | | | | | | | | | | | | |
| | | | | | | | | | | | | | | | | | | | | | | | |
| $ | (0.02 | ) | | $ | 21.71 | | 10.37 | % | | $ | 31,568 | | | 0.87 | % | | 0.88 | % | | 0.87 | % | | 25 | % |
| | (0.07 | ) | | | 19.69 | | 17.58 | % | | | 101,965 | | | 0.88 | % | | 0.88 | % | | 0.27 | % | | 23 | % |
| | (0.26 | ) | | | 16.81 | | 8.18 | % | | | 81,570 | | | 0.89 | % | | 0.99 | % | | 1.59 | % | | 28 | % |
| | (0.05 | ) | | | 15.78 | | 54.60 | % | | | 100,729 | | | 0.74 | % | | 0.98 | % | | 0.49 | % | | 13 | % |
| | (0.04 | ) | | | 10.25 | | (22.58 | )% | | | 45,017 | | | 0.76 | % | | 0.91 | % | | 0.44 | % | | 28 | % |
| | | | | | | | | | | | | | | | | | | | | | | | |
| | | | | | | | | | | | | | | | | | | | | | | | |
| | | | | | | | | | | | | | | | | | | | | | | | |
| $ | (0.58 | ) | | $ | 54.34 | | 11.39 | % | | $ | 370,518 | | | 0.84 | % | | 0.84 | % | | 1.12 | % | | 13 | % |
| | (0.54 | ) | | | 49.36 | | 20.70 | % | | | 250,367 | | | 0.85 | % | | 0.85 | % | | 1.39 | % | | 12 | % |
| | (0.42 | ) | | | 41.40 | | 11.44 | % | | | 161,016 | | | 0.83 | % | | 0.84 | % | | 1.05 | % | | 8 | % |
| | (0.30 | ) | | | 37.56 | | 60.46 | % | | | 38,243 | | | 0.74 | % | | 0.89 | % | | 1.00 | % | | 4 | % |
| | | | | | | | | | | | | | | | | | | | | | | | |
| | (0.08 | ) | | | 23.65 | | 3.54 | %(4) | | | — | (6) | | 0.00 | %(5)(7) | | 0.00 | %(5)(7) | | 1.90 | %(5) | | 16 | %(4) |
| | | | | | | | | | | | | | | | | | | | | | | | |
| | | | | | | | | | | | | | | | | | | | | | | | |
| | | | | | | | | | | | | | | | | | | | | | | | |
| $ | (0.79 | ) | | $ | 14.10 | | 18.33 | % | | $ | 41,932 | | | 1.60 | % | | 1.66 | % | | 0.70 | % | | 16 | % |
| | (0.11 | ) | | | 12.62 | | 46.25 | %(4) | | | 25,457 | | | 1.56 | %(5) | | 1.68 | %(5) | | 1.23 | %(5) | | 7 | %(4) |
| | | | | | | | | | | | | | | | | | | | | | | | |
| | | | | | | | | | | | | | | | | | | | | | | | |
| | | | | | | | | | | | | | | | | | | | | | | | |
| $ | (0.08 | ) | | $ | 11.39 | | 16.39 | % | | $ | 70,183 | | | 1.10 | % | | 1.42 | % | | 0.84 | % | | 31 | % |
| | (0.13 | ) | | | 9.87 | | 28.72 | % | | | 60,242 | | | 1.04 | % | | 1.46 | % | | 0.97 | % | | 34 | % |
| | (0.01 | ) | | | 7.80 | | 16.98 | % | | | 43,439 | | | 0.90 | % | | 1.48 | % | | 1.18 | % | | 59 | % |
| | (0.07 | ) | | | 6.69 | | 65.55 | % | | | 35,598 | | | 0.90 | % | | 1.44 | % | | 1.32 | % | | 59 | % |
| | (0.06 | ) | | | 4.09 | | (29.26 | )% | | | 29,024 | | | 0.87 | % | | 1.29 | % | | 1.07 | % | | 71 | % |
See Notes to Financial Statements.
69
EXCELSIOR FUNDS
NOTES TO FINANCIAL STATEMENTS
| 1. | Significant Accounting Policies: |
Excelsior Funds, Inc. (“Excelsior Fund”) was incorporated under the laws of the State of Maryland on August 2, 1984. Excelsior Funds Trust (the “Trust”) is a statutory trust organized under the laws of the State of Delaware on April 27, 1994. Excelsior Fund and the Trust are registered under the Investment Company Act of 1940, as amended (the “1940 Act”), as open-ended diversified management investment companies, with the exception of Energy and Natural Resources Fund and Real Estate Fund, each of which is non-diversified.
Excelsior Fund and the Trust currently offer shares in fifteen and five managed investment portfolios, respectively, each having its own investment objectives and policies. The following is a summary of significant accounting policies for Money Fund, Core Bond Fund, Large Cap Growth Fund, Value and Restructuring Fund and Emerging Markets Fund, portfolios of Excelsior Fund and for High Yield Fund, Equity Opportunities Fund (formerly the Equity Core Fund), Mid Cap Value and Restructuring Fund and International Equity Fund, portfolios of the Trust (each a “Fund”, collectively, the “Funds”). Such policies are in conformity with accounting principles generally accepted in the United States of America and are consistently followed by Excelsior Fund and the Trust in the preparation of their financial statements. The preparation of financial statements requires management to make estimates and assumptions that affect the reported amounts and disclosures in the financial statements. Actual results could differ from these estimates.
The International Equity Fund offers one class of shares: Institutional Shares. The Money Fund, High Yield Fund, Equity Opportunities Fund and Emerging Markets Fund offer two classes of shares: Institutional Shares and Shares. The Core Bond Fund, Large Cap Growth Fund, Mid Cap Value and Restructuring Fund and Value and Restructuring Fund offer three classes of shares: Institutional Shares, Shares and Retirement Shares. The Financial Highlights of the Shares and Retirement Shares as well as the financial statements for the remaining portfolios of Excelsior Fund and the Trust are presented separately.
Under a plan of reorganization adopted by the Trust, all of the assets and liabilities of the Income Fund and Total Return Bond Fund were transferred to the Institutional Shares of the Core Bond Fund. The reorganization, which qualified as a tax-free exchange for federal income tax purposes, was completed at the close of business on September 27, 2006. The following is a summary of shares outstanding, net assets, net asset value per share issued and unrealized appreciation/depreciation immediately before and after the reorganization.
70
| | | | | | | | | | | | | |
| | | Before Reorganization | | After Reorganization |
| | | Income
Fund | | | Total Return
Bond Fund | | Core Bond
Fund | | Core Bond
Fund |
Shares: | | | | | | | | | | | | | |
Shares | | | — | | | | — | | | 32,810,661 | | | 32,810,661 |
Institutional Shares | | | 13,965,104 | | | | 18,165,949 | | | 1,824,521 | | | 26,973,187 |
Retirement Shares | | | — | | | | — | | | 117 | | | 117 |
Net Assets: | | | | | | | | | | | | | |
Shares | | $ | — | | | $ | — | | $ | 294,116,361 | | $ | 294,116,361 |
Institutional Shares | | $ | 96,434,781 | | | $ | 129,070,075 | | $ | 16,360,288 | | $ | 241,865,144 |
Retirement Shares | | $ | — | | | $ | — | | $ | 1,046 | | $ | 1,046 |
Net Asset Value: | | | | | | | | | | | | | |
Shares | | $ | — | | | $ | — | | $ | 8.96 | | $ | 8.96 |
Institutional Shares | | $ | 6.91 | | | $ | 7.11 | | $ | 8.97 | | $ | 8.97 |
Retirement Shares | | $ | — | | | $ | — | | $ | 8.97 | | $ | 8.97 |
Net unrealized appreciation/(depreciation) | | $ | (248,669 | ) | | $ | 617,540 | | $ | 740,329 | | $ | 1,109,200 |
(a) Portfolio valuation:
Investments in securities that are traded on recognized domestic and foreign stock exchanges are valued at the last sale price on the exchange on which such securities are primarily traded or at the last quoted sale price on a national securities market. Securities traded over-the-counter are valued each business day on the basis of closing over-the-counter sale prices. Equity securities that are traded on the NASDAQ National Market System for which quotations are readily available are valued at the official closing price. Securities for which there were no transactions are valued at the last quoted sales price for the most recent day such prices were available. Securities for which market quotations or valuation by pricing agent are not readily available are valued in good faith at fair value pursuant to procedures adopted by the Board of Directors with regard to Excelsior Fund and the Board of Trustees with regard to the Trust. The Funds have engaged a third party fair value service provider to systematically recommend the adjustment of closing market prices of securities traded principally in foreign markets.
Short-term debt instruments that mature in 60 days or less and all securities in the Money Fund are valued at amortized cost, which approximates market value. If available, debt securities are priced based upon valuations provided by independent, third-party pricing agents. The third-party pricing agents value debt securities at an evaluated price by employing methodologies that utilize actual market transactions, broker-supplied valuations, or other methodologies designed to identify the market value for such securities.
Investment valuations and other assets and liabilities initially expressed in foreign currencies are converted each business day into U.S. dollars based upon current exchange rates. Purchases and sales of foreign investments and income and expenses are converted into U.S. dollars based upon currency exchange rates prevailing on the respective dates of such transactions. The Funds do not isolate that portion of gains and losses on investment securities that is due to changes in the foreign exchange rates from that which is due to changes in market prices of such securities. The Funds
71
report gains and losses on foreign currency related transactions as realized and unrealized gains or losses for financial reporting purposes, whereas such components are treated as ordinary income or loss for federal income tax purposes.
Mutual funds are valued at their respective net asset values as determined by those Funds in accordance with the 1940 Act.
(b) Forward foreign currency exchange contracts:
The Funds’ participation in forward currency exchange contracts will be limited to hedging involving either specific transactions or portfolio positions. Transaction hedging involves the purchase or sale of foreign currency with respect to specific receivables or payables of a Fund generally arising in connection with the purchase or sale of its portfolio securities. Risk may arise upon entering into these contracts from the potential inability of counterparties to meet the terms of their contracts and is generally limited to the amount of unrealized gain on the contracts, if any, at the date of default. Risk may also arise from unanticipated movements in the value of foreign currency relative to the U.S. dollar. Contracts are marked to market daily and the change in market value is recorded as unrealized appreciation or depreciation. Realized gains or losses arising from such transactions are included in net realized gains or losses from foreign currency transactions.
The Equity Opportunities Fund had the following forward foreign currency contracts outstanding as of March 31, 2007:
| | | | | | | | | |
Settlement Dates | | Currency to
Receive | | In
Exchange
For | | Unrealized
Appreciation
(Depreciation) | |
Foreign Currency Purchases: | | | | | | | | | |
04/04/07 | | EUR 60,160 | | $ | 80,445 | | $ | (87 | ) |
The International Equity Fund had the following forward foreign currency contracts outstanding as of March 31, 2007:
| | | | | | | | | |
Settlement Dates | | Currency to
Receive | | In
Exchange
For | | Unrealized
Appreciation
(Depreciation) | |
Foreign Currency Purchases: | | | | | | | | | |
04/04/07 | | EUR 62,575 | | $ | 83,819 | | $ | (234 | ) |
72
The Value and Restructuring Fund had the following forward foreign currency contracts outstanding as of March 31, 2007:
| | | | | | | | | |
Settlement Dates | | Currency to
Receive | | In
Exchange
For | | Unrealized
Appreciation
(Depreciation) | |
Foreign Currency Purchases: | | | | | | | | | |
04/04/07 | | CHF 4,345,557 | | $ | 3,584,260 | | $ | (6,774 | ) |
Currency Legend:
CHF Swiss Franc
EUR Euro
(c) Covered call options written:
Certain Funds (excludes Money Fund) may engage in writing covered call options. By writing a covered call option, a Fund forgoes the opportunity to profit from an increase in the market price of the underlying security above the exercise price, except insofar as the premium represents such a profit.
When a Fund writes an option, an amount equal to the net premium (the premium less the commission) received by that Fund is included in the liability section of that Fund’s statement of assets and liabilities as a deferred credit. The amount of the deferred credit will be subsequently marked to market to reflect the current value of the option written. The current value of the traded option is the last sale price or, in the absence of a sale, the last quoted sale price for the most recent day such price was available. If an option expires on the stipulated expiration date, or if the Fund involved enters into a closing purchase transaction, the Fund will realize a gain (or loss if the cost of a closing purchase transaction exceeds the net premium received when the option is sold), and the deferred credit related to such option will be eliminated. If an option is exercised, the Fund involved may deliver the underlying security from its portfolio or purchase the underlying security in the open market. In either event, the proceeds of the sale will be increased by the net premium originally received, and the Fund involved will realize a gain or loss. Premiums from expired call options written by the Fund and net gains from closing purchase transactions are treated as short-term capital gains for Federal income tax purposes, and losses on closing purchase transactions are short-term capital losses.
There is no assurance that a liquid secondary market on an exchange will exist for any particular option. A covered option writer, unable to effect a closing purchase transaction, will not be able to sell the underlying security until the option expires or is delivered upon exercise. As a result, the writer in such circumstances will be subject to the risk of market decline in the underlying security during such period and to the risk that market values increase beyond the option exercise price, in each case to the extent not offset by the net premium. A Fund will write an option on a particular security only if the Adviser believes that a liquid secondary market will exist on an exchange for options of the same series, which will permit the Fund to make a closing purchase transaction in order to close out its position.
73
During the year ended March 31, 2007, the Value and Restructuring Fund had the following written option transactions:
| | | | | | | |
| Written Option Transactions | | Number of
Contracts | | | Premiums | |
Outstanding, beginning of year | | (4,468 | ) | | $ | (1,760,972 | ) |
Option written | | (28,000 | ) | | | (7,314,498 | ) |
Options expired | | 4,468 | | | | 1,760,972 | |
Options exercised | | — | | | | — | |
Options terminated in closing purchase transactions | | 5,000 | | | | 636,240 | |
| | | | | | | |
Outstanding, end of year | | (23,000 | ) | | $ | (6,678,258 | ) |
| | | | | | | |
(d) Security transactions and investment income:
Security transactions are recorded on a trade date basis. Realized gains and losses on investments sold are recorded on the basis of identified cost. Interest income, adjusted for amortization of premiums and discounts on investments, is earned from settlement date and is recorded on the accrual basis. Dividend income is recorded on the ex-dividend date, except for certain dividends from foreign securities, which are recorded as soon as the Funds are informed of the dividend.
(e) Redemption in-kind:
In certain circumstances, the Funds may distribute portfolio securities rather than cash as payment for a redemption of a Funds shares (redemption in-kind). For financial reporting purposes, the Funds recognize a gain on the in-kind redemptions to the extent the value of the distributed securities on the date of redemption exceeds the cost of those securities; the Funds recognize a loss if cost exceeds value. Gains and losses realized on the redemptions in-kind are not recognized for tax purposes, and are reclassified from undistributed realized gain (losses) to paid-in capital. During the year ended March 31, 2007, the Mid Cap Value and Restructuring Fund realized $23,046,664 of net gains on $66,339,150 of redemptions in-kind.
(f) Concentration of risks:
The Emerging Markets Fund and International Equity Fund invest primarily in securities of companies that are located in or conduct a substantial amount of their business in foreign countries, including emerging market countries. Prices of securities in foreign markets generally, and emerging markets in particular, have historically been more volatile than prices in U.S. markets. Some countries in which the Funds may invest require government approval for the repatriation of investment income, capital or the proceeds of sales of securities by foreign investors. In addition, if there is deterioration in a country’s balance of payments or for other reasons, a country may impose temporary restrictions on foreign capital remittances abroad.
The High Yield Fund is subject to special risks associated with investments in high yield bonds, which involve greater risk of default or downgrade and are more volatile than investment grade securities due to actual or perceived changes in an issuer’s creditworthiness. In addition, issuers of high yield bonds may be more susceptible than other issuers to economic downturns. High yield
74
bonds are subject to the risk that the issuer may not be able to pay interest or dividends and ultimately repay principal upon maturity. Discontinuation of these payments could adversely affect the market value of the security.
(g) Repurchase agreements:
The Funds may enter into agreements with financial institutions deemed to be creditworthy by the investment adviser subject to the seller’s agreement to repurchase and the Funds’ agreement to resell such securities at mutually agreed upon prices. The repurchase agreements are collateralized by U.S. Government obligations. The value of the collateral underlying the repurchase agreements will always be at least equal to the repurchase price, including any accrued interest earned on the repurchase agreement. If the counter-party defaults, and the fair value of the collateral declines, realization of the collateral by the Funds may be delayed or limited.
Default or bankruptcy of the seller may, however, expose the applicable Fund to possible delay in connection with the disposition of the securities or loss to the extent that proceeds from a sale of the underlying securities were less than the repurchase price under the agreement.
(h) Futures Contracts:
Certain Funds may enter into futures contracts. Upon entering into a futures contract, the Funds deposit and maintain as cash collateral such initial margin as may be required by the exchanges on which the transaction is affected. Pursuant to the contracts, the Funds agree to receive from or pay to the broker an amount of cash equal to the daily fluctuation in the value of the contract. Such receipts or payments are known as “variation margin” and are recorded by the Funds as variation margin receivable or payable on futures contracts. During the period the futures contracts are open, changes in the value of the contracts are recognized on a daily basis to reflect the market value for the contracts at the end of each day’s trading and are recorded as unrealized gains or losses. When the contract is closed, the Funds record a realized gain or loss equal to the difference between the value of the contract at the time it was opened and the value at the time it was closed.
(i) TBA purchase commitments:
Certain Funds may enter into “TBA” (To Be Announced) purchase commitments to purchase securities for a fixed price at a future date, typically not exceeding 45 days. TBA purchase commitments may be considered securities in themselves, and involve risk of loss if the value of the security to be purchased declines prior to settlement date. The Funds must maintain liquid securities having a value not less than the purchase price (including accrued interest) for such purchase commitments. Unsettled TBA purchase commitments are valued at the current market value of the underlying securities, according to the procedures described under “Portfolio Valuation” above.
(j) Distributions to shareholders:
Dividends equal to all or substantially all of each Fund’s net investment income will be declared and paid as follows: for the Money Fund, Core Bond Fund and High Yield Fund, dividends will be declared daily and paid monthly; for the Equity Opportunities Fund, Large Cap Growth Fund, Mid Cap Value and Restructuring Fund and Value and Restructuring Fund, dividends will be declared
75
and paid quarterly; and for the Emerging Markets Fund and International Equity Fund, dividends will be declared and paid semiannually. Net realized capital gains, unless offset by any available capital loss carryforward, are distributed at least annually. Dividends and distributions are recorded on the ex-dividend date.
(k) Expense allocation:
Expenses directly attributable to a Fund are charged to that Fund. Other expenses are allocated to the respective Fund based on average daily net assets. Expenses attributable to a specific class of shares, such as shareholder servicing and distribution fees, are charged directly to that class.
(l) Borrowing:
The funds may obtain temporary bank loans from banks and custodians to use for meeting shareholder redemptions or for temporary or emergency purposes. The board of trustees approved an agreement between Excelsior Fund and the Trust and their custodian, JPMorgan Chase Bank, N.A., under which the funds may participate in an uncommitted line of credit in the aggregate principal amount of $150 million. The funds pay interest on the amounts they borrow at negotiated rates based on the terms of the agreement. There was no borrowing from the line of credit for any funds during the year ended March 31, 2007.
(m) Custody Credits:
Each Fund has an arrangement with its custodian bank under which the Fund receives a credit for its uninvested cash balance to offset its custody fees. The credit amounts (if any) are disclosed in the statement of operations as a reduction to the Fund’s operating expenses.
(n) New Accounting Standards:
In September 2006, the Financial Accounting Standards Board (FASB) issued Statement of Financial Accounting Standards No. 157, “Fair Value Measurements” (SFAS No. 157). SFAS No. 157 defines fair value, establishes a framework for measuring fair value in accordance with generally accepted accounting principles and expands disclosure about fair value measurements. SFAS No. 157 is effective for fiscal years beginning after November 15, 2007. Management is currently evaluating the impact the adoption of SFAS No. 157 will have on the Fund’s financial statements.
In July 2006, the FASB released FASB Interpretation No. 48 “Accounting for Uncertainty in Income Taxes” (“FIN 48”). FIN 48 provides guidance for how uncertain tax positions should be recognized, measured, presented and disclosed in the financial statements. FIN 48 requires the evaluation of tax positions taken or expected to be taken in the course of preparing the Fund’s tax return to determine whether the tax positions are “more-likely-than-not” of being sustained by the applicable tax authority. Tax positions not deemed to meet the more-likely-than-not threshold would be recorded as a tax benefit or expense in the period of determination. Adoption of FIN 48 is required no later than the last business day of the first financial statement reporting period for fiscal years beginning after December 15, 2006. A fund with a fiscal year ending March 31 will implement FIN 48 no later than September 28, 2007, and it is to be applied to all open tax years as of the effective date. Management is currently evaluating the impact of the adoption of FIN 48 to the financial statements.
76
| 2. | Investment Advisory Fee, Administration Fee, Shareholder Servicing Fees and Related Party Transactions: |
The Funds are advised by U.S. Trust New York Asset Management Division (“NYAMD”), a separate identifiable division of United States Trust Company, National Association (“USTNA”), or UST Advisers, Inc. (“USTA” and together with NYAMD, the “Advisers”), USTA is a wholly-owned subsidiary of USTNA. USTNA is a wholly-owned subsidiary of U.S. Trust Corporation, a registered bank holding company, which, in turn, is a wholly-owned subsidiary of The Charles Schwab Corporation. For the services provided pursuant to the Investment Advisory Agreements, each Adviser receives a fee, computed daily and paid monthly, as follows:
| | | |
Money Fund | | 0.25 | % |
Core Bond Fund | | 0.65 | %* |
High Yield Fund | | 0.80 | % |
Equity Opportunities Fund | | 0.75 | % |
Large Cap Growth Fund | | 0.75 | % |
Mid Cap Value and Restructuring Fund | | 0.65 | % |
Value and Restructuring Fund | | 0.60 | % |
Emerging Markets Fund | | 1.25 | % |
International Equity Fund | | 1.00 | % |
| * | On September 28, 2006, the Core Bond Fund changed its Investment Advisory fee to 0.65% from 0.75%. |
On November 20, 2006, The Charles Schwab Corporation (“Schwab”) announced an agreement to sell the U.S. Trust Corporation (“U.S. Trust”) a wholly-owned subsidiary of Schwab, to the Bank of America Corporation (the “Sale”). The Sale includes all of U.S. Trust’s subsidiaries, including USTA and USTNA. The completion of the Sale may result in the assignment of the current investment advisory agreements and termination in accordance with their terms. Therefore, the Board of Trustees/Directors approved the new investment advisory agreements at the same advisory fee rates disclosed above in January 2007 and Shareholders of each Fund approved the new agreements during meetings held in March and April 2007. It is anticipated that the sale will close early in the third quarter of 2007.
77
USTA and BISYS Fund Services Ohio, Inc. (collectively, the “Administrators”) provide administrative services to the Funds. For the services provided to the Funds, the Administrators are entitled jointly to annual fees, computed daily and paid monthly, based on the combined aggregate average daily net assets of Excelsior Fund, Excelsior Tax-Exempt Funds, Inc. (“Excelsior Tax-Exempt Fund”) and the Trust (excluding the international equity portfolios of Excelsior Fund and the Trust), all of which are affiliated investment companies, as follows: 0.200% of the first $200 million, 0.175% of the next $200 million and 0.150% over $400 million. The Administrators are entitled jointly to annual fees, computed daily and paid monthly, at the annual rate of 0.20% of the average daily net assets of the Emerging Markets Fund, International Equity Fund, International Fund and Pacific/Asia Fund. Administration fees payable by each Fund of the Excelsior Fund, the Trust and Excelsior Tax-Exempt Fund are determined in proportion to the relative average daily net assets of the respective Fund for the period paid. For the year ended March 31, 2007, administration fees paid to USTA were as follows:
| | | |
| | | Administration
Fees paid to UST
Advisers, Inc. |
Money Fund | | $ | 1,837,900 |
Core Bond Fund | | | 571,558 |
High Yield Fund | | | 114,852 |
Equity Opportunities Fund | | | 334,488 |
Large Cap Growth Fund | | | 851,157 |
Mid Cap Value and Restructuring Fund | | | 395,738 |
Value and Restructuring Fund | | | 9,912,241 |
Emerging Markets Fund | | | 1,898,623 |
International Equity Fund | | | 118,967 |
BISYS Fund Services Ohio, Inc., waived Administration fees as presented on the Statements of Operations, excluding the High Yield Fund which BISYS Fund Services Ohio, Inc., waived $3,952. USTNA waived the balance of Administration fees as presented on the Statements of Operations.
From time to time, in its sole discretion, each Adviser may undertake to waive a portion or all of the fees payable to it and may also reimburse the Funds for a portion of other expenses. For the year ended March 31, 2007, the Advisers have contractually agreed to waive investment advisory fees through, at least, July 31, 2007, (October 31, 2007, for the Large Cap Growth Fund—Institutional Shares), and to reimburse other operating expenses, to the extent necessary to keep total operating expenses from exceeding the following annual percentages of each Fund’s average daily net assets:
| | | |
Money Fund — Institutional Shares | | 0.30 | % |
Core Bond Fund — Institutional Shares | | 0.65 | % |
High Yield Fund — Institutional Shares | | 0.80 | % |
Equity Opportunities Fund — Institutional Shares | | 0.80 | % |
Large Cap Growth Fund — Institutional Shares* | | 0.95 | % |
Mid Cap Value and Restructuring Fund — Institutional Shares | | 0.89 | % |
Value and Restructuring Fund — Institutional Shares | | 0.89 | % |
Emerging Markets Fund — Institutional Shares | | 1.60 | % |
International Equity Fund — Institutional Shares | | 1.10 | % |
78
| | | |
Money Fund — Shares | | 0.55 | % |
Core Bond Fund — Shares | | 0.90 | % |
High Yield Fund — Shares | | 1.05 | % |
Equity Opportunities Fund — Shares | | 1.05 | % |
Large Cap Growth Fund — Shares | | 1.20 | % |
Mid Cap Value and Restructuring Fund — Shares | | 1.14 | % |
Value and Restructuring Fund — Shares | | 1.14 | % |
Emerging Markets Fund — Shares | | 1.85 | % |
Core Bond Fund — Retirement Shares | | 1.40 | % |
Large Cap Growth Fund — Retirement Shares | | 1.70 | % |
Mid Cap Value and Restructuring Fund — Retirement Shares | | 1.64 | % |
Value and Restructuring Fund — Retirement Shares | | 1.64 | % |
| | * | Large Cap Growth Fund—Institutional Shares commenced operations on November 9, 2006. |
For the year ended March 31, 2007, pursuant to the above, investment advisory fees waived by the Advisers were as follows:
| | | |
Money Fund | | $ | 1,811,067 |
Core Bond Fund | | | 1,217,980 |
High Yield Fund | | | 522,552 |
Equity Opportunities Fund | | | 475,587 |
Large Cap Growth Fund | | | 30,328 |
Mid Cap Value and Restructuring Fund | | | 3,989 |
Value and Restructuring Fund | | | — |
Emerging Markets Fund | | | 565,179 |
International Equity Fund | | | 207,236 |
The Funds have entered into shareholder servicing agreements with various service organizations, which include Charles Schwab & Co. Inc. (“CS & Co.”) and USTA. Services included in the servicing agreements include assistance in processing purchase, exchange and redemption requests; transmitting and receiving funds in connection with customer orders to purchase, exchange or redeem shares; and providing periodic statements. Shareholder servicing fees are incurred on a Fund or class level (where applicable). In consideration for these services, each service organization receives a fee from the Funds, computed daily and paid monthly, at an annual rate up to 0.25% of the average daily net assets of the Funds’ shares held by each service organization’s customers (excluding the Institutional Shares of the Money Fund which pays a fee of up to 0.15% of the average daily net assets of it shares). The Advisers, out of their own resources, may additionally compensate certain organizations for providing these and other services.
For the year ended March 31, 2007, shareholder servicing fees paid to CS & Co. and USTA were as follows:
| | | |
Money Fund | | $ | 2,027,190 |
Core Bond Fund | | | 496,810 |
High Yield Fund | | | 274,600 |
79
| | | |
Equity Opportunities Fund | | $ | 464,758 |
Large Cap Growth Fund | | | 1,426,385 |
Mid Cap Value and Restructuring Fund | | | 530,044 |
Value and Restructuring Fund | | | 9,637,460 |
Emerging Markets Fund | | | 1,705,286 |
International Equity Fund | | | 271 |
BISYS Fund Services Limited Partnership (the “Distributor”) serves as the Distributor of the Funds. Shares of each Fund are sold without a sales charge on a continuous basis by the Distributor.
Certain Funds have adopted a Distribution Plan pursuant to Rule 12b-1 under the 1940 Act, under which they may compensate the Distributor monthly for its services that are intended to result in the sale of Fund Shares (in the case of High Yield Fund and Mid Cap Value and Restructuring Fund) or Retirement Shares (in the case of Core Bond Fund, Large Cap Growth Fund, Mid Cap Value and Restructuring Fund and Value and Restructuring Fund), in an amount not to exceed the annual rate of 0.25% or 0.50%, respectively, of the average daily net asset value of such Fund’s Shares or Retirement Shares. For the year ended March 31, 2007, fees paid for Retirement Shares of the Core Bond Fund, Large Cap Growth Fund, Mid Cap Value and Restructuring Fund and Value and Restructuring Fund were $4, $8, $480 and $6,926, respectively.
The board of trustees/directors may include people who are officers and/or trustees of other fund families affiliated to the investment adviser. Federal securities law limits the percentage of the “interested persons” who may serve on a trust’s board, and the Funds are in compliance with these limitations. The funds did not pay any of the interested persons for their service as trustees/directors, but did pay non-interested persons (independent trustees), as noted in each fund’s Statement of Operations.
On June 12, 2006, the Excelsior High Yield and Intermediate-Term Bond Funds filed a lawsuit in connection with the bankruptcy of a security in which the Funds had invested. The ongoing legal expenses associated with the lawsuit are paid for by the Funds, but due to the expense limitation agreements currently in place, a significant portion of these legal expenses are being reimbursed by the Adviser. The Board has agreed that, should the Funds be successful in the lawsuit or otherwise receive compensation related to settling the case, the Advisers may request and receive reimbursement for such legal expenses that have been reimbursed to the Funds, to the extent that proceeds are available to cover such expenses. At this time, the outcome of the lawsuit cannot be determined.
| 3. | Purchases, Sales and Maturities of Securities: |
For the year ended March 31, 2007, purchases, sales and maturities of securities for the Funds, excluding short-term investments and written options transactions, aggregated:
| | | | | | |
| | | Purchases | | Sales and
Maturities |
Core Bond Fund | | | | | | |
U.S. Government | | $ | 143,164,160 | | $ | 130,390,053 |
Other | | | 56,826,501 | | | 58,962,109 |
80
| | | | | | |
| | | Purchases | | Sales and
Maturities |
High Yield Fund | | $ | 85,146,374 | | $ | 122,668,623 |
Equity Opportunities Fund | | | 144,444,173 | | | 25,938,491 |
Large Cap Growth Fund | | | 346,922,787 | | | 198,866,947 |
Mid Cap Value and Restructuring Fund | | | 74,873,791 | | | 113,235,162 |
Value and Restructuring Fund | | | 1,940,746,100 | | | 930,382,978 |
Emerging Markets Fund | | | 153,446,034 | | | 156,632,161 |
International Equity Fund | | | 19,594,376 | | | 20,188,017 |
It is the policy of Excelsior Fund and the Trust that each Fund continue to qualify as a regulated investment company, by complying with the requirements of the Internal Revenue Code applicable to regulated investment companies, and by distributing substantially all of its taxable earnings to its shareholders.
In order to avoid a federal excise tax, each Fund is required to distribute certain minimum amounts of net realized capital gain and net investment income for the respective twelve-month periods ending October 31 and December 31 each year.
Net realized gains of the Funds derived in certain countries are subject to certain foreign taxation.
Dividends and distributions are determined in accordance with federal income tax regulations and may differ from accounting principles generally accepted in the United States of America. These differences are primarily due to differing treatments for net operating losses, foreign currency transactions, passive foreign investment companies, deferral of losses on wash sales and net capital losses and net currency losses incurred after October 31 through the end of the fiscal year (“Post-October losses”). To the extent these differences are permanent in nature, such amounts are reclassified within the composition of net assets based on their federal tax-basis treatment; temporary differences do not require reclassification. Accordingly, the following reclassifications, as of March 31, 2007, were made to/from the following accounts:
| | | | | | | | | | | | |
| | | Undistributed
Net Investment
Income | | | Accumulated
Net Realized
Gain (Loss) | | | Paid-In-
Capital | |
Core Bond Fund | | $ | (79,757 | ) | | $ | 79,739 | | | | 18 | |
High Yield | | | 36,349 | | | | 29,285 | | | | (65,634 | ) |
Equity Opportunities Fund | | | (3,821 | ) | | | 3,821 | | | | — | |
Large Cap Growth Fund | | | 4,255,930 | | | | — | | | $ | (4,255,930 | ) |
Mid Cap Value and Restructuring Fund | | | 3,107 | | | | (23,048,108 | ) | | | 23,045,001 | |
Value and Restructuring Fund | | | (1,075,614 | ) | | | 1,078,111 | | | | (2,497 | ) |
Emerging Markets Fund | | | (142,875 | ) | | | 142,873 | | | | 2 | |
International Equity Fund | | | (15,727 | ) | | | 15,727 | | | | — | |
81
The tax character of dividends and distributions declared during the years ended March 31, 2007 and March 31, 2006 were as follows:
| | | | | | | | | | | | |
| | | Ordinary
Income | | Long-Term
Capital Gain | | Return of
Capital | | Total* |
Money Fund | | | | | | | | | | | | |
Year ended March 31, 2007 | | $ | 65,587,427 | | | — | | | — | | $ | 65,587,427 |
Year ended March 31, 2006 | | | 49,048,464 | | | — | | | — | | | 49,048,464 |
Core Bond Fund | | | | | | | | | | | | |
Year ended March 31, 2007 | | | 17,474,254 | | | — | | | — | | | 17,474,254 |
Year ended March 31, 2006 | | | 11,105,896 | | $ | 2,085,376 | | | — | | | 13,191,272 |
High Yield Fund | | | | | | | | | | | | |
Year ended March 31, 2007 | | | 8,535,124 | | | — | | | — | | | 8,535,124 |
Year ended March 31, 2006 | | | 10,553,157 | | | — | | $ | 353,851 | | | 10,907,008 |
Equity Opportunities Fund | | | | | | | | | | | | |
Year ended March 31, 2007 | | | 1,277,288 | | | — | | | — | | | 1,277,288 |
Year ended March 31, 2006 | | | 574,501 | | | — | | | — | | | 574,501 |
Large Cap Growth Fund | | | | | | | | | | | | |
Year ended March 31, 2007 | | | — | | | — | | | — | | | — |
Year ended March 31, 2006 | | | — | | | — | | | — | | | — |
Mid Cap Value and Restructuring Fund | | | | | | | | | | | | |
Year ended March 31, 2007 | | | 97,283 | | | 7,547 | | | — | | | 104,830 |
Year ended March 31, 2006 | | | 675,482 | | | — | | | 22,939 | | | 698,421 |
Value and Restructuring Fund | | | | | | | | | | | | |
Year ended March 31, 2007 | | | 67,856,329 | | | — | | | — | | | 67,856,329 |
Year ended March 31, 2006 | | | 52,525,603 | | | — | | | — | | | 52,525,603 |
Emerging Markets Fund | | | | | | | | | | | | |
Year ended March 31, 2007 | | | 7,542,032 | | | 51,557,835 | | | — | | | 59,099,867 |
Year ended March 31, 2006 | | | 5,914,106 | | | — | | | — | | | 5,914,106 |
International Equity Fund | | | | | | | | | | | | |
Year ended March 31, 2007 | | | 492,367 | | | — | | | — | | | 492,367 |
Year ended March 31, 2006 | | | 738,048 | | | — | | | — | | | 738,048 |
| * | The total distributions paid may differ from the Statement of Changes in Net Assets because for tax purposes, dividends are recognized when actually paid. |
82
As of March 31, 2007, the components of distributable earnings (accumulated losses) on a tax basis were as follows:
| | | | | | | | | | | | | | | | | | | | | |
| | | Undistributed
Ordinary
Income | | Undistributed
Long-Term
Capital Gain | | Distributions
Payable* | | | Accumulated
Capital and
Other
Losses | | | Unrealized
Appreciation
(Depreciation) | | Total
Accumulated
Earnings/
(Deficit) | |
Money Fund | | $ | 5,122,791 | | | — | | $ | (5,095,233 | ) | | $ | (43,438 | ) | | | — | | $ | (15,880 | ) |
Core Bond Fund | | | 2,127,629 | | | — | | | (2,104,382 | ) | | | (1,634,009 | ) | | $ | 863,400 | | | (733,365 | ) |
High Yield Fund | | | 26,428 | | | — | | | (702,997 | ) | | | (65,479,459 | ) | | | 4,698,152 | | | (61,457,876 | ) |
Equity Opportunities Fund | | | 604,832 | | | — | | | — | | | | (3,994,207 | ) | | | 55,567,607 | | | 52,178,232 | |
Large Cap Growth Fund | | | — | | | — | | | — | | | | (124,103,097 | ) | | | 123,954,093 | | | (149,004 | ) |
Mid Cap Value and Restructuring Fund | | | 3,066,218 | | $ | 6,619,753 | | | — | | | | — | | | | 115,014,431 | | | 124,700,402 | |
Value and Restructuring Fund | | | 19,173,059 | | | — | | | — | | | | (48,831,557 | ) | | | 2,754,129,333 | | | 2,724,470,835 | |
Emerging Markets Fund | | | 163,806 | | | 4,133,434 | | | — | | | | (1,283,992 | ) | | | 400,039,421 | | | 403,052,669 | |
International Equity Fund | | | 156,990 | | | — | | | — | | | | (10,119,881 | ) | | | 20,149,717 | | | 10,186,826 | |
| * | The total distributions payable may differ from the Statement of Assets and Liabilities because for tax purposes, dividends are recognized when actually paid. |
Post-October losses are deemed to arise on the first business day of a Fund’s next taxable year. As of March 31, 2007, the Equity Opportunities Fund and Value and Restructuring Fund deferred, on a tax basis, post-October losses of $920,049 and $1,537,981, respectively.
For federal income tax purposes, capital loss carryforwards may be carried forward and applied against future capital gains. To the extent that such carryforwards are utilized, capital gains distributions will be reduced. At March 31, 2007, the following Funds had capital loss carryforwards available to offset future net capital gains through the indicated expiration dates:
| | | | | | | | | | | | | | | | | | | | | |
| | | Expires | | |
| | | 2010 | | 2011 | | 2012 | | 2013 | | 2014 | | 2015 | | Total |
Money Fund | | | — | | $ | 11,662 | | $ | 23,975 | | $ | — | | $ | 4,889 | | $ | 2,912 | | $ | 43,438 |
Core Bond Fund | | | — | | | — | | | — | | | — | | | 1,303,908 | | | 330,101 | | | 1,634,009 |
High Yield Fund | | $ | 440,234 | | | 17,456,849 | | | 40,103,941 | | | 1,461,417 | | | 6,017,018 | | | — | | | 65,479,459 |
Equity Opportunities Fund | | | — | | | — | | | — | | | — | | | 880,333 | | | 2,193,825 | | | 3,074,158 |
Large Cap Growth Fund | | | 18,217,588 | | | 83,374,895 | | | 22,030,449 | | | 480,165 | | | — | | | — | | | 124,103,097 |
Value and Restructuring Fund | | | — | | | 19,930,042 | | | 27,363,534 | | | — | | | — | | | — | | | 47,293,576 |
Emerging Markets Fund | | | — | | | — | | | 1,247,253 | | | — | | | 36,739 | | | — | | | 1,283,992 |
International Equity Fund | | | — | | | 8,447,749 | | | 1,672,132 | | | — | | | — | | | — | | | 10,119,881 |
83
At March 31, 2007, aggregate gross unrealized appreciation for all securities for which there was an excess of value over estimated tax cost and aggregate gross unrealized depreciation for all securities for which there was an excess of estimated tax cost over value is as follows:
| | | | | | | | | | | | | |
| | | Federal
Tax
Cost | | Tax Basis
Unrealized
Appreciation | | Tax Basis
Unrealized
(Depreciation) | | | Net Unrealized
Appreciation
(Depreciation) |
Money Fund | | $ | 1,259,885,037 | | | — | | | — | | | | — |
Core Bond Fund | | | 549,492,440 | | $ | 4,344,919 | | $ | (3,481,519 | ) | | $ | 863,400 |
High Yield Fund | | | 110,262,829 | | | 5,181,793 | | | (483,641 | ) | | | 4,698,152 |
Equity Opportunities Fund | | | 282,667,509 | | | 61,863,632 | | | (6,296,602 | ) | | | 55,567,030 |
Large Cap Growth Fund | | | 610,313,025 | | | 150,431,767 | | | (26,477,674 | ) | | | 123,954,093 |
Mid Cap Value and Restructuring Fund | | | 211,902,432 | | | 123,240,542 | | | (8,226,111 | ) | | | 115,014,431 |
Value and Restructuring Fund | | | 5,383,591,798 | | | 2,919,161,151 | | | (167,868,357 | ) | | | 2,751,292,794 |
Emerging Markets Fund | | | 733,105,953 | | | 422,523,941 | | | (22,515,838 | ) | | | 400,008,103 |
International Equity Fund | | | 49,329,409 | | | 21,093,100 | | | (946,127 | ) | | | 20,146,973 |
Excelsior Fund has authorized capital of 35 billion shares of Common Stock, 29.3756 billion of which is currently classified to represent interests in certain classes of shares. Authorized capital currently offered for each Fund is as follows: 4 billion shares of the Money Fund; 750 million shares of the Core Bond Fund; 1 billion shares of the Large Cap Growth Fund; 1.5 billion shares of the Value and Restructuring Fund; and 500 million shares of the Emerging Markets Fund. Each share has a par value of $0.001 and represents an equal proportionate interest in the particular Fund with other shares of the same Fund, and is entitled to such dividends and distributions of taxable earnings on the assets belonging to such Fund as are declared at the discretion of Excelsior Fund’s Board of Directors.
The Trust has authorized an unlimited number of shares of beneficial interest of each class of each Fund. Each share has a par value of $0.00001 and represents an equal proportionate interest in the particular Fund with other shares of the same Fund, and is entitled to such dividends and distributions of taxable earnings on the assets belonging to such Fund as are declared at the discretion of the Trust’s Board of Trustees.
A redemption fee of 2% of the value of the shares redeemed or exchanged is imposed on shares of the Emerging Markets Fund and International Equity Fund redeemed or exchanged 30 days or less after their date of purchase. The redemption fee is intended to limit short-term trading in the Fund.
On shares purchased on or after October 16, 2006, a redemption fee of 2% of the value of the shares redeemed or exchanged was imposed on shares of the High Yield Fund, Equity Opportunities Fund, Large Cap Growth Fund, Mid Cap Value and Restructuring Fund and Value and Restructuring Fund redeemed or exchanged 30 days or less after their date of purchase. The redemption fee is intended to limit short-term trading in the Fund.
84
Capital Share Transactions
| | | | | | | | | | | | | | |
| | | Money Fund | |
| | | Year Ended March 31, | |
| | | 2007 | | | 2006 | |
| | | Shares | | | Amounts | | | Shares | | | Amounts | |
Sold: | | | | | | | | | | | | | | |
Institutional Shares | | 4,262,737,772 | | | $ | 4,262,737,772 | | | 4,731,250,373 | | | $ | 4,731,250,373 | |
Shares | | 2,599,472,390 | | | | 2,599,472,390 | | | 3,427,610,450 | | | | 3,427,610,450 | |
Issued as reinvestment of dividends: | | | | | | | | | | | | | | |
Institutional Shares | | 9,160,704 | | | | 9,160,704 | | | 7,428,066 | | | | 7,428,066 | |
Shares | | 3,330,030 | | | | 3,330,030 | | | 2,259,420 | | | | 2,259,420 | |
Redeemed: | | | | | | | | | | | | | | |
Institutional Shares | | (4,182,098,880 | ) | | | (4,182,098,880 | ) | | (4,841,213,240 | ) | | | (4,841,213,240 | ) |
Shares | | (2,990,685,747 | ) | | | (2,990,685,747 | ) | | (3,502,534,923 | ) | | | (3,502,534,923 | ) |
| | | | | | | | | | | | | | |
Net Increase (Decrease) | | (298,083,731 | ) | | $ | (298,083,731 | ) | | (175,199,854 | ) | | $ | (175,199,854 | ) |
| | | | | | | | | | | | | | |
| |
| | | Core Bond Fund | |
| | | Year Ended March 31, | |
| | | 2007 | | | 2006 | |
| | | Shares | | | Amounts | | | Shares | | | Amounts | |
Sold: | | | | | | | | | | | | | | |
Institutional Shares | | 2,772,888 | | | $ | 24,623,459 | | | 141,024 | | | $ | 1,262,505 | |
Shares | | 9,986,679 | | | | 88,776,364 | | | 13,774,392 | | | | 125,488,152 | |
Retirement Shares | | — | | | | — | | | — | | | | — | |
Issued in connection with merger(a) | | 25,148,666 | | | | 225,504,856 | | | — | | | | — | |
Issued as reinvestment of dividends: | | | | | | | | | | | | | | |
Institutional Shares | | 113,170 | | | | 1,016,339 | | | 189 | | | | 1,685 | |
Shares | | 673,001 | | | | 5,989,211 | | | 681,642 | | | | 6,160,386 | |
Retirement Shares | | 4 | | | | 40 | | | 5 | | | | 50 | |
Redeemed: | | | | | | | | | | | | | | |
Institutional Shares | | (1,706,058 | ) | | | (15,286,027 | ) | | — | | | | — | |
Shares | | (7,567,445 | ) | | | (67,312,972 | ) | | (5,733,515 | ) | | | (52,104,922 | ) |
Retirement Shares | | — | | | | — | | | (16 | ) | | | (151 | ) |
| | | | | | | | | | | | | | |
Net Increase (Decrease) | | 29,420,905 | | | $ | 263,311,270 | | | 8,863,721 | | | $ | 80,807,705 | |
| | | | | | | | | | | | | | |
| (a) | Effective at the close of business on September 27, 2006, the Core Bond Fund (Institutional Share Class) acquired all of the net assets of the Income Fund and Total Return Bond Fund. |
85
| | | | | | | | | | | | | | |
| |
| | | High Yield Fund | |
| | | Year Ended March 31, | |
| | | 2007 | | | 2006 | |
| | | Shares | | | Amounts | | | Shares | | | Amounts | |
Sold: | | | | | | | | | | | | | | |
Institutional Shares | | 155,243 | | | $ | 699,379 | | | 853,862 | | | $ | 3,892,678 | |
Shares | | 6,072,661 | | | | 28,550,138 | | | 13,700,176 | | | | 62,544,844 | |
Issued as reinvestment of dividends: | | | | | | | | | | | | | | |
Institutional Shares | | 32,619 | | | | 149,603 | | | 107,579 | | | | 488,209 | |
Shares | | 217,741 | | | | 1,004,402 | | | 304,113 | | | | 1,384,476 | |
Redeemed: | | | | | | | | | | | | | | |
Institutional Shares | | (1,952,444 | ) | | | (8,902,311 | ) | | (1,152,309 | ) | | | (5,192,791 | ) |
Shares | | (13,302,993 | ) | | | (60,913,343 | ) | | (17,199,458 | ) | | | (78,172,561 | ) |
Redemption Fee | | — | | | | 15 | | | — | | | | — | |
| | | | | | | | | | | | | | |
Net Increase (Decrease) | | (8,777,173 | ) | | $ | (39,412,117 | ) | | (3,386,037 | ) | | $ | (15,055,145 | ) |
| | | | | | | | | | | | | | |
| |
| | | Equity Opportunities Fund | |
| | | Year Ended March 31, | |
| | | 2007 | | | 2006 | |
| | | Shares | | | Amounts | | | Shares | | | Amounts | |
Sold: | | | | | | | | | | | | | | |
Institutional Shares | | 944,747 | | | $ | 12,184,733 | | | 682,540 | | | $ | 8,048,568 | |
Shares | | 11,404,243 | | | | 151,491,788 | | | 7,067,834 | | | | 81,801,143 | |
Issued as reinvestment of dividends: | | | | | | | | | | | | | | |
Institutional Shares | | 3,799 | | | | 48,632 | | | 4,259 | | | | 47,760 | |
Shares | | 12,057 | | | | 154,087 | | | 5,937 | | | | 66,688 | |
Redeemed: | | | | | | | | | | | | | | |
Institutional Shares | | (992,875 | ) | | | (13,081,976 | ) | | (1,305,561 | ) | | | (14,932,301 | ) |
Shares | | (2,227,805 | ) | | | (29,659,176 | ) | | (618,831 | ) | | | (7,153,110 | ) |
Redemption Fee | | — | | | | 9,635 | | | — | | | | — | |
| | | | | | | | | | | | | | |
Net Increase (Decrease) | | 9,144,166 | | | $ | 121,147,723 | | | 5,836,178 | | | $ | 67,878,748 | |
| | | | | | | | | | | | | | |
86
| | | | | | | | | | | | | | |
| |
| | | Large Cap Growth Fund | |
| | | Year Ended March 31, | |
| | | 2007 | | | 2006 | |
| | | Shares | | | Amounts | | | Shares | | | Amounts | |
Sold: | | | | | | | | | | | | | | |
Institutional Shares | | 1,518,333 | | | $ | 15,997,075 | | | — | | | $ | — | |
Shares | | 26,983,018 | | | | 268,887,660 | | | 33,887,361 | | | | 319,718,556 | |
Retirement Shares | | 172 | | | | 1,807 | | | — | | | | — | |
Issued as reinvestment of dividends: | | | | | | | | | | | | | | |
Institutional Shares | | — | | | | — | | | — | | | | — | |
Shares | | — | | | | — | | | — | | | | — | |
Retirement Shares | | — | | | | — | | | — | | | | — | |
Redeemed: | | | | | | | | | | | | | | |
Institutional Shares | | (10,095 | ) | | | (106,750 | ) | | — | | | | — | |
Shares | | (14,969,954 | ) | | | (147,806,621 | ) | | (4,286,908 | ) | | | (38,557,547 | ) |
Retirement Shares | | — | | | | — | | | (20 | ) | | | (161 | ) |
Redemption Fee | | — | | | | 9,835 | | | — | | | | — | |
| | | | | | | | | | | | | | |
Net Increase (Decrease) | | 13,521,474 | | | $ | 136,983,006 | | | 29,600,433 | | | $ | 281,160,848 | |
| | | | | | | | | | | | | | |
| |
| | | Mid Cap Value and Restructuring Fund | |
| | | Year Ended March 31, | |
| | | 2007 | | | 2006 | |
| | | Shares | | | Amounts | | | Shares | | | Amounts | |
Sold: | | | | | | | | | | | | | | |
Institutional Shares | | 174,817 | | | $ | 3,499,002 | | | 1,449,107 | | | $ | 26,024,928 | |
Shares | | 3,915,673 | | | | 81,532,520 | | | 2,206,027 | | | | 39,222,163 | |
Retirement Shares | | 51,153 | | | | 1,086,065 | | | — | | | | — | |
Issued as reinvestment of dividends: | | | | | | | | | | | | | | |
Institutional Shares | | 211 | | | | 3,893 | | | 12,203 | | | | 211,487 | |
Shares | | 1,544 | | | | 28,679 | | | 8,110 | | | | 140,000 | |
Retirement Shares | | — | | | | — | | | — | | | | — | |
Redeemed: | | | | | | | | | | | | | | |
Institutional Shares | | (435,896 | ) | | | (8,797,430 | ) | | (1,134,926 | ) | | | (20,164,758 | ) |
Redemption-in-kind | | (3,464,185 | ) | | | (66,339,150 | ) | | — | | | | — | |
Shares | | (2,387,520 | ) | | | (47,782,321 | ) | | (2,927,490 | ) | | | (51,792,912 | ) |
Retirement Shares | | (118 | ) | | | (2,475 | ) | | (10 | ) | | | (162 | ) |
Redemption Fee | | — | | | | 1,778 | | | — | | | | — | |
| | | | | | | | | | | | | | |
Net Increase (Decrease) | | (2,144,321 | ) | | $ | (36,769,439 | ) | | (386,979 | ) | | $ | (6,359,254 | ) |
| | | | | | | | | | | | | | |
87
| | | | | | | | | | | | | | |
| |
| | | Value and Restructuring Fund | |
| | | Year Ended March 31, | |
| | | 2007 | | | 2006 | |
| | | Shares | | | Amounts | | | Shares | | | Amounts | |
Sold: | | | | | | | | | | | | | | |
Institutional Shares | | 2,608,744 | | | $ | 127,478,205 | | | 1,588,442 | | | $ | 71,855,109 | |
Shares | | 40,342,962 | | | | 2,018,418,152 | | | 42,481,646 | | | | 1,944,842,088 | |
Retirement Shares | | 62,302 | | | | 3,214,887 | | | 18,213 | | | | 867,236 | |
Issued as reinvestment of dividends: | | | | | | | | | | | | | | |
Institutional Shares | | 59,732 | | | | 2,938,434 | | | 45,241 | | | | 1,988,952 | |
Shares | | 1,056,240 | | | | 51,956,233 | | | 922,183 | | | | 40,504,847 | |
Retirement Shares | | 99 | | | | 4,928 | | | 26 | | | | 1,182 | |
Redeemed: | | | | | | | | | | | | | | |
Institutional Shares | | (921,391 | ) | | | (45,845,721 | ) | | (450,627 | ) | | | (20,187,467 | ) |
Shares | | (24,661,734 | ) | | | (1,238,518,628 | ) | | (25,114,636 | ) | | | (1,109,338,591 | ) |
Retirement Shares | | (26,673 | ) | | | (1,242,118 | ) | | (115 | ) | | | (5,554 | ) |
Redemption Fee | | — | | | | 29,376 | | | — | | | | — | |
| | | | | | | | | | | | | | |
Net Increase (Decrease) | | 18,520,281 | | | $ | 918,433,748 | | | 19,490,373 | | | $ | 930,527,802 | |
| | | | | | | | | | | | | | |
| |
| | | Emerging Markets Fund | |
| | | Year Ended March 31, | |
| | | 2007 | | | 2006 | |
| | | Shares | | | Amounts | | | Shares | | | Amounts | |
Sold: | | | | | | | | | | | | | | |
Institutional Shares | | 889,054 | | | $ | 12,242,049 | | | 2,017,803 | | | $ | 17,803,340 | |
Shares | | 28,426,163 | | | | 377,247,582 | | | 42,050,024 | | | | 456,622,978 | |
Issued as reinvestment of dividends: | | | | | | | | | | | | | | |
Institutional Shares | | 104,377 | | | | 1,425,589 | | | 232 | | | | 2,572 | |
Shares | | 2,899,020 | | | | 39,144,568 | | | 386,361 | | | | 3,758,608 | |
Redeemed: | | | | | | | | | | | | | | |
Institutional Shares | | (35,905 | ) | | | (493,380 | ) | | (1,171 | ) | | | (11,586 | ) |
Shares | | (32,751,548 | ) | | | (412,372,175 | ) | | (12,959,098 | ) | | | (132,393,423 | ) |
Redemption Fee | | — | | | | 104,327 | | | — | | | | 3,940 | |
| | | | | | | | | | | | | | |
Net Increase (Decrease) | | (468,839 | ) | | $ | 17,298,560 | | | 31,494,151 | | | $ | 345,786,429 | |
| | | | | | | | | | | | | | |
88
| | | | | | | | | | | | | | |
| |
| | | International Equity | |
| | | Year Ended March 31, | |
| | | 2007 | | | 2006 | |
| | | Shares | | | Amounts | | | Shares | | | Amounts | |
Sold: | | | | | | | | | | | | | | |
Institutional Shares | | 1,007,051 | | | $ | 10,432,135 | | | 1,232,938 | | | $ | 10,856,010 | |
Issued as reinvestment of dividends: | | | | | | | | | | | | | | |
Institutional Shares | | 9,003 | | | | 83,598 | | | 15,369 | | | | 118,649 | |
Redeemed: | | | | | | | | | | | | | | |
Institutional Shares | | (956,735 | ) | | | (9,928,640 | ) | | (710,520 | ) | | | (5,920,024 | ) |
Redemption Fee | | — | | | | — | | | — | | | | — | |
| | | | | | | | | | | | | | |
Net Increase (Decrease) | | 59,319 | | | $ | 587,093 | | | 537,787 | | | $ | 5,054,635 | |
| | | | | | | | | | | | | | |
In the normal course of business, the Funds enter into contracts that provide general indemnifications. The Funds’ maximum exposure under these arrangements is dependent on future claims that may be made against the Funds and, therefore, cannot be established; however, based on experience, the risk of loss from such claims is considered remote.
United States Trust Company of New York and U.S. Trust Company, N.A. (formerly, co-investment advisers to the Funds, together referred to herein as “U.S. Trust”), Excelsior Funds, Excelsior Tax-Exempt Funds and Trust (the “Companies”), U.S. Trust, Schwab and several individuals and third parties were named in four fund shareholder class actions and two derivative actions which alleged that U.S. Trust, the Companies, and others allowed certain parties to engage in illegal and improper mutual fund trading practices, which allegedly caused financial injury to the shareholders of certain of the Funds advised by U.S. Trust. Each seeks unspecified monetary damages and related equitable relief.
The class and derivative actions described above were transferred to the United States District Court for the District of Maryland for coordinated and consolidated pre-trial proceedings. In November 2005, the Maryland court dismissed many of the plaintiffs’ claims in both the class and derivative actions. The court entered implementing orders on February 24, 2006. All claims against the Companies have been dismissed. Plaintiffs’ claims against U.S. Trust and certain individuals under Sections 10(b) and 20(a) of the Securities Exchange Act and Sections 36(b) and 48(a) of the Investment Company Act, however, have not been dismissed. Plaintiffs’ Section 48(a) claims against parent entities U.S. Trust and Schwab also remain.
While the ultimate outcome of these matters cannot be predicted with any certainty at this time, based on currently available information, U.S. Trust believes that the likelihood is remote that the pending litigation will have a material adverse financial impact on the Companies, or materially affect U.S. Trust’s ability to provide investment management services to the Companies.
89
REPORT OF INDEPENDENT REGISTERED PUBLIC ACCOUNTING FIRM
To the Board of Trustees and Shareholders of
Excelsior Funds Trust and Excelsior Funds, Inc.
In our opinion, the accompanying statements of assets and liabilities, including the portfolios of investments, and the related statements of operations and of changes in net assets and the financial highlights present fairly, in all material respects, the financial position of the Money Fund, Core Bond Fund, High Yield Fund, Equity Opportunities Fund, Large Cap Growth Fund, Mid Cap Value and Restructuring Fund, Value and Restructuring Fund, Emerging Markets Fund and International Equity Fund (four portfolios of Excelsior Fund Trust and five portfolios of Excelsior Funds, Inc., hereafter referred to as the “Funds”) at March 31, 2007, and the results of each of their operations, the changes in each of their net assets and the financial highlights for the year then ended, in conformity with accounting principles generally accepted in the United States of America. These financial statements and financial highlights (hereafter referred to as “financial statements”) are the responsibility of the Funds’ management; our responsibility is to express an opinion on these financial statements based on our audit. We conducted our audit of these financial statements in accordance with the standards of the Public Company Accounting Oversight Board (United States). Those standards require that we plan and perform the audit to obtain reasonable assurance about whether the financial statements are free of material misstatement. An audit includes examining, on a test basis, evidence supporting the amounts and disclosures in the financial statements, assessing the accounting principles used and significant estimates made by management, and evaluating the overall financial statement presentation. We believe that our audit, which included confirmation of securities at March 31, 2007 by correspondence with the custodian and brokers, provides a reasonable basis for our opinion. The statements of changes in net assets and financial highlights of the Funds for each of the years in the period ended March 31, 2006 were audited by other auditors whose report dated May 22, 2006 expressed an unqualified opinion on those statements.
PRICEWATERHOUSECOOPERS LLP
San Francisco, California
May 18, 2007
90
PROXY VOTING RESULTS (Unaudited)
On November 20, 2006, Schwab announced an agreement to sell U.S. Trust, a wholly-owned subsidiary of Schwab, to the Bank of America (the “Sale”). The Sale includes all of U.S. Trust’s subsidiaries, including USTA and USTNA.
Under Section 15 of the 1940 Act, the change in ownership of U.S. Trust may result in the assignment, and automatic termination, of the Funds’ current investment advisory agreements with USTA and USTNA (the “Current Advisory Agreements”). Consequently, the Funds will need to enter into new investment advisory agreements with USTA and USTNA upon the closing of the Sale (the “New Advisory Agreements”), which requires the approval of both the Board of Directors and the shareholders of the Funds. At a meeting held on January 8, 2007, the Board approved New Advisory Agreements under which, subject to approval by the Funds’ shareholders, USTA and USTNA will continue to serve as investment advisers to the Funds after the Sale is completed. At the same meeting, the Board directed that the New Advisory Agreements be submitted to the shareholders of each Fund for approval.
A Special Meeting of Shareholders of Excelsior Funds, Excelsior Tax-Exempt Funds and Trust and each of their Funds was held on March 30, 2007, for the purpose of seeking shareholder approval of the following proposal: to approve new investment advisory agreements by and among USTA, USTNA and the Companies, on behalf of the Funds. The Special Meeting for Excelsior Funds with respect to the Value and Restructuring Fund, Energy and Natural Resources and Treasury Money Funds was adjourned for the purpose of soliciting additional proxies, and subsequently held on April 30, 2007. The number of votes necessary to conduct the Special Meetings and approve the proposal was obtained. The results of the votes of shareholders are listed below:
EXCELSIOR FUNDS, INC.
| | | | | | |
Fund | | For | | Against | | Abstain |
Blended Equity Fund | | 6,164,047.545 | | 67,952.751 | | 73,977.210 |
Core Bond Fund | | 42,419,131.502 | | 102,811.034 | | 103,300.208 |
Emerging Markets Fund | | 40,519,375.591 | | 385,533.770 | | 2,387,530.558 |
Energy and Natural Resources Fund | | 10,149,963.059 | | 261,710.922 | | 349,760.892 |
Government Money Fund | | 172,737,336.070 | | 747,772.190 | | 420,358.000 |
Intermediate-Term Bond Fund | | 44,858,545.970 | | 241,685.152 | | 66,016.000 |
International Fund | | 21,282,762.400 | | 54,899.414 | | 128,924.192 |
Large Cap Growth Fund | | 42,848,198.375 | | 89,295.014 | | 404,672.705 |
Money Fund | | 674,980,999.600 | | 1,166,673.210 | | 410,474.540 |
Pacific/Asia Fund | | 12,624,395.052 | | 35,293.746 | | 146,970.828 |
Real Estate Fund | | 6,828,766.866 | | 23,944.228 | | 74,532.837 |
Short-Term Government Securities Fund | | 19,900,726.363 | | 26,705.441 | | 160,992.698 |
Small Cap Fund | | 20,778,531.495 | | 77,734.183 | | 230,771.291 |
Treasury Money Fund | | 147,661,994.420 | | 8,327.040 | | 953,491.100 |
Value and Restructuring Fund | | 71,659,202.229 | | 1,308,059.398 | | 2,313,244.343 |
91
PROXY VOTING RESULTS (Continued)
EXCELSIOR TAX-EXEMPT FUNDS, INC.
| | | | | | |
Fund | | For | | Against | | Abstain |
California Short-Intermediate Term Tax-Exempt Income Fund | | 5,620,954.755 | | 30,312.000 | | 19,754.000 |
Intermediate-Term Tax-Exempt Fund | | 25,090,015.155 | | 30,070.577 | | 76,826.198 |
Long-Term Tax-Exempt Fund | | 3,628,610.926 | | 33,702.423 | | 40,804.648 |
New York Intermediate-Term Tax-Exempt Fund | | 9,319,329.057 | | 13,806.000 | | 36,899.000 |
New York Tax-Exempt Money Fund | | 275,209,603.310 | | 4,686,548.000 | | 63,196.000 |
Short-Term Tax-Exempt Securities Fund | | 8,452,657.301 | | 72,849.000 | | 359,587.000 |
Tax-Exempt Money Fund | | 1,356,339,634.110 | | 11,586,764.280 | | 2,023,751.550 |
EXCELSIOR FUNDS TRUST
| | | | | | |
Fund | | For | | Against | | Abstain |
Equity Income Fund | | 15,004,710.199 | | 69,167.666 | | 28,045.000 |
Equity Opportunities Fund | | 15,890,842.151 | | 16,544.962 | | 771.000 |
High Yield Fund | | 15,794,959.655 | | 30,927.324 | | 249,577.222 |
International Equity Fund | | 5,138,808.000 | | .000 | | .000 |
Mid Cap Value and Restructuring Fund | | 7,879,533.211 | | 19,517.123 | | 87,756.460 |
92
ADDITIONAL FEDERAL TAX INFORMATION
Other Federal Tax Information (Unaudited):
For corporate shareholders, the following percentage of the total ordinary income distributions paid during the fiscal year ended March 31, 2007, qualify for the corporate dividends received deduction for the following Funds:
| | | |
Fund | | Percentage | |
Equity Opportunities Fund | | 100.00 | % |
Mid Cap Value and Restructuring Fund | | 100.00 | % |
Value and Restructuring Fund | | 100.00 | % |
For the year ended March 31, 2007, the following Funds paid qualified dividend income for purposes of reduced individual federal income tax rates of:
| | | |
Fund | | Percentage | |
Equity Opportunities Fund | | 100.00 | % |
Mid Cap Value and Restructuring Fund | | 100.00 | % |
Value and Restructuring Fund | | 100.00 | % |
Emerging Markets Fund | | 100.00 | % |
International Equity Fund | | 100.00 | % |
The following Funds paid out the amounts of Long Term Capital Gains for the year ended March 31, 2007:
| | | |
| | | Long Term
Capital Gains |
Mid Cap Value and Restructuring Fund | | $ | 7,547 |
Emerging Markets Fund | | | 51,557,837 |
The following Funds passed through the amounts of Foreign Tax Credits for the year ended March 31, 2007:
| | | |
| | | Foreign Tax
Credits |
Emerging Markets Fund | | $ | 1,906,057 |
International Equity Fund | | | 123,275 |
93
APPROVALS OF INVESTMENT ADVISORY AGREEMENTS (Unaudited)
In November 2006, representatives of Schwab, U.S. Trust, and the Funds’ investment advisers, USTA and USTNA (together, USTA and USTNA are referred to as the “Advisers) informed the Board that Schwab had entered into a stock purchase agreement with the Bank of America under which Schwab would sell U.S. Trust to Bank of America (the “Sale”). Representatives of Schwab, U.S. Trust, and the Advisers also informed the Board that, because the Sale includes all of U.S. Trust’s subsidiaries, such as USTA and USTNA, the completion of the Sale may be deemed to be an “assignment” (as defined in the 1940 Act) of the Funds’ current investment advisory agreements (the “Current Advisory Agreements”) resulting in the termination of the Current Advisory Agreements in accordance with their terms. To provide continuity in investment advisory services, representatives of U.S. Trust, the Advisers, and Bank of America proposed that the Board approve new investment advisory agreements (the “New Advisory Agreements”) under which, subject to shareholder approval, USTA and USTNA would continue to serve as investment advisers to the Funds after the completion of the Sale.
In advance of its December 6-7, 2006 meeting, the Board of Directors/Trustees requested and received from Bank of America, U.S. Trust, and the Advisers, various materials providing information regarding the Sale and its impact on (i) the Funds and their shareholders, (ii) the investment advisory services provided to the Funds by the USTA and USTNA and (iii) the administration services provided to the Funds by USTA. After receiving and reviewing these materials, the Board discussed at their December 6-7, 2006 meeting, the proposal to approve the New Advisory Agreements. Representatives from Bank of America, U.S. Trust, the Advisers, and Schwab attended the meeting and presented additional oral and written information to the Board to assist the Board in its considerations. These representatives assured the Board that Bank of America did not anticipate that there will be any reduction in the scope of or material adverse change in the nature or quality of, the investment advisory services to the Funds under the New Advisory Agreements. These representatives noted that a plan would be put into place designed to provide for the continuity of the investment advisory services under the New Advisory Agreements.
Additionally, representatives from Bank of America discussed the extensive experience and resources dedicated to Bank of America’s large mutual fund business, assuring the Board that Bank of America would seek to provide the Funds with the same or better quality of services with respect to the administration services currently provided by USTA. Representatives from Bank of America noted that: (i) the size and scale of Bank of America’s mutual fund business could produce potential savings for the Funds’ shareholders through reduced administrative costs and (ii) there was the potential for significant negotiating power in any future vendor discussions resulting from the Funds being part of the larger Bank of America fund complex.
The Board then discussed the written materials that the Board received before the meeting and the oral presentations and all other information that the Board received or discussed at the December 6-7, 2006 meeting. At the conclusion of the meeting, the Board decided to schedule another in-person Board meeting on January 8, 2007 to allow the Board to further consider the proposal to approve the New Advisory Agreements.
94
APPROVALS OF INVESTMENT ADVISORY AGREEMENTS (Continued)
In anticipation of the January 8, 2007 Board meeting, legal counsel for the Directors/Trustees who are not interested persons (as defined in the 1940 Act) (“Independent Directors”) sent an information request letter to U.S. Trust and Schwab to solicit further information that the Board deemed to be relevant to their consideration of the New Advisory Agreements, including a discussion of, among other matters, (a) a detailed timeline and plan for the orderly transition of the administration and oversight of the Funds; (b) the extent to which key personnel of the Advisers who manage day-to-day investment operations of the Funds are expected to continue to be employed by the Advisers after the Sale; (c) the experience and qualifications of new key administrative personnel that Bank of America proposes to involve in Fund matters; (d) any enhanced compliance policies and procedures adopted by Bank of America in response to mutual fund regulatory and compliance issues; (e) any anticipated financial benefits of the Sale to Fund shareholders; (f) any anticipated changes in the Funds’ fees and operating expenses; (g) any anticipated structural changes to the Excelsior Funds complex; (h) any conflicts of interest between the other business interests of Bank of America and its affiliates and the operations of the Funds; and (i) any limitations on the Funds’ investment operations that would arise as a result of the Funds’ being affiliated with Bank of America. The responses by Bank of America, U.S. Trust, the Advisers and Schwab were provided to the Board for their review prior to the January 8, 2007 Board meeting, and the Board was provided with the opportunity to request any additional materials.
At the Board’s meeting on January 8, 2007, Bank of America, U.S. Trust, the Advisers, and Schwab provided additional written and oral information on the Sale and the impact of the Sale on the Advisers and the Funds and their shareholders. During the meeting, representatives from Bank of America and the Advisers, who were present at the meeting, assured the Board that Bank of America does not anticipate that there will be any reduction in the scope of, or material adverse change in the nature or quality of, the investment advisory services to the Funds under the New Advisory Agreements. Additionally, representatives from Bank of America, and the Advisers represented to the Board that Bank of America personnel would seek to provide the same or better quality of services with respect to the administration services currently provided by USTA. It was noted that a plan for the orderly transition of the administration and oversight of the Funds had been developed to ensure that there would be no disruption of Fund operations or other adverse consequences to the Funds and their shareholders. In addition, Bank of America provided, and the Board discussed, information regarding the potential applicability of certain regulatory orders relating to the Columbia Funds and the legacy Nations Funds.
The Board then deliberated on the approval of the New Advisory Agreements in light of all the information it had received. The Independent Directors, assisted by their independent legal counsel, met in executive session to discuss the New Advisory Agreements. After deliberating in executive session, the entire Board reconvened to discuss the approval of the New Advisory Agreements.
At the conclusion of the January 8, 2007 Board meeting, the Board, including all of the Independent Directors, unanimously concluded (a) that the approval of the New Advisory Agreements would be in the best interests of the shareholders and the Funds and (b) to recommend the approval of the New Advisory Agreements to shareholders. In concluding to approve the New Advisory Agreements and to recommend their approval to shareholders, the Board considered, with the assistance of independent legal counsel, the information and materials provided to the Board and a variety of specific factors discussed at the meetings, including, as discussed below, the Board’s prior conclusions when determining whether to approve the continuation of the Current Advisory Agreements.
95
APPROVALS OF INVESTMENT ADVISORY AGREEMENTS (Continued)
At the January 8, 2007 Board meeting, the Board concluded it was reasonable to take into account the conclusions the Board made when considering and evaluating the renewal of the Current Advisory Agreements (the “Annual Review”), which occurred at the September 29, 2006 in-person Board meeting, as part of its considerations to approve the New Advisory Agreements. The Board’s conclusion in this regard was based on (i) the fact that the New Advisory Agreements are identical to the Current Advisory Agreements in all material respects, including the investment advisory fees payable by the Funds to the Advisers and (ii) assurances by Bank of America and the Advisers that there would be no reduction or material adverse change in the nature or quality of the investment advisory services to the Funds under the New Advisory Agreements.
In addition to the conclusions formed with respect to the Annual Review, the Board considered specific information at the January 8, 2007 Board meeting concerning the Sale and its impact on the Advisers and the Funds and their shareholders, as they considered appropriate, including but not limited to the following:
| | • | | a detailed timeline and plan for the orderly transition of the administration and oversight of the Funds; |
| | • | | assurances by Bank of America and the Advisers that Bank of America does not anticipate that there will be any reduction in the scope of, or material adverse change in the nature or quality of, the investment advisory services to the Funds under the New Advisory Agreements; |
| | • | | an explanation of the extent to which key personnel of the Advisers who manage the day-to-day investment operations of the Funds are expected to continue to be employed by the Advisers after the Sale; |
| | • | | the experience and qualifications of new key administrative, financial, compliance and legal personnel that Bank of America proposes to involve in Fund matters; |
| | • | | the enhanced compliance policies and procedures adopted by Bank of America in response to mutual fund regulatory and compliance issues; |
| | • | | the anticipated financial benefits of the Sale to Fund shareholders including (i) access for the Funds to a large distribution network both on the retail, institutional and retirement platforms, as well as to Bank of America’s Private Bank and Wealth Management areas; (ii) the potential for a positive impact on Fund operating expenses resulting from an increase in assets; and (iii) the potential for significant negotiating power in any future vendor discussions resulting from the Funds being part of the larger Bank of America fund complex; |
| | • | | a representation from the Advisers and Bank of America that neither the Companies nor their shareholders would bear any costs of the Meeting or the costs of any solicitation in connection with the Meeting; |
| | • | | a representation from Bank of America that Bank of America would extend the Advisers’ commitments under the Expense Limitation Agreements currently in place with the Funds for a period of two years following the closing of the Sale, subject to the Board’s prior approval of any changes to those Expense Limitation Agreements; |
96
APPROVALS OF INVESTMENT ADVISORY AGREEMENTS (Continued)
| | • | | a discussion of the anticipated structural changes to the Excelsior Funds complex and a representation from Bank of America that the class structure of the Excelsior Funds was currently being evaluated by its product teams and that the results of that analysis would be presented to the Board for consideration at a future meeting; |
| | • | | the policies and procedures adopted by Bank of America that are intended to identify, monitor and mitigate any conflicts of interest between the other business interests of Bank of America and its affiliates and the operations of the Funds; and |
| | • | | a representation from U.S. Trust and Schwab that no material adverse impact on the Funds’ investment operations is expected as a result of the Funds being affiliated with Bank of America. |
The Board concluded, within the context of its full deliberations, that each of the representations, assurances and informational items provided by the Advisers, U.S. Trust, Bank of America and Schwab set forth above supported the approval of the New Advisory Agreements.
In the course of their deliberations, the Board did not identify any particular information or factor that was all-important or controlling. Based on its evaluation of the information and the conclusions with respect thereto at its meetings on September 29, 2006, December 6-7, 2006 and January 8, 2007, the Board, including all of the Independent Directors, unanimously: (a) concluded that the terms of the New Advisory Agreements are fair and reasonable; (b) concluded that the Advisers’ fees are reasonable in light of the services to be provided by the Advisers to the Companies; (c) concluded that the approval of the New Advisory Agreements would be in the best interests of the shareholders and the Funds; and (d) concluded to recommend the approval of the New Advisory Agreements to shareholders.
97
Directors/Trustees And Officers (Unaudited)
The tables below provide information pertaining to the Directors/Trustees and Officers of the Companies. The mailing address for each Director/Trustee is Excelsior Funds, 101 Montgomery Street, San Francisco, CA 94104.
| | | | | | | | | | |
Name and
Year of Birth | | Position(s) Held
with the
Company(1) | | Term of
Office(2) and
Length of Time
Served | | Principal Occupation(s)
During Past Five Years | | Number of
Funds in the
Fund Complex
Overseen by
Board Member | | Other
Directorships
Held by Board Member(6) |
| INDEPENDENT DIRECTORS/TRUSTEES | | | | | | |
Rodman L. Drake
Year of Birth: 1943 | | Director/Trustee; Chairman, Full Board | | Trustee of Excelsior Funds Trust since 1994; Director of Excelsior Funds, Inc. and Excelsior Tax Exempt Funds Inc. since 1996 | | Co-Founder of Baringo Capital LLC (since 2002); President, Continuation Investments Group, Inc. (1997 to 2001). | | 38(3) | | BOARD 1 — Director and Chairman, Hyperion Total Return Fund, Inc. and Hyperion Strategic Mortgage Fund Inc. (since 1991). BOARD 2 — Director, Jackson Hewitt Tax Service Inc. (since June 2004). BOARD 3 — Director, Student Loan Corporation (since May 2005). BOARD 4 — Celgene Corporation (since April 2006). |
| | | | | |
Morrill Melton Hall, Jr.
Year of Birth: 1944 | | Director/Trustee; Chairman, Investment Oversight Committee | | Director/Trustee of each Company since 2000 | | Chairman (since 1984) and Chief Executive Officer (since 1991), Comprehensive Health Services, Inc. (health care management and administration). | | 38(3) | | None |
| | | | | |
Jonathan Piel
Year of Birth: 1938 | | Director/Trustee | | Trustee of Excelsior Funds Trust since 1994; Director of Excelsior Funds, Inc. and Excelsior Tax Exempt Funds Inc. since 1996 | | Cable television producer and website designer; Editor, Scientific American (1984-1986), and Vice President, Scientific American Inc., (1986-1994); Director, National Institute of Social Sciences; Member Advisory Board, The Stone Age Institute, Bloomington, Indiana. | | 38(3) | | None |
| | | | | |
John D. Collins
Year of Birth: 1938 | | Director/Trustee; Chairman, Audit and Compliance Committee | | Director/Trustee of each Company since 2005 | | Retired. Consultant, KPMG, LLP (July 1999 to June 2000); Partner, KPMG, LLP (March 1962 to June 1999). | | 38(3) | | BOARD 1 — Director, Mrs. Fields Famous Brands LLC (consumer products) (since December 2004). |
98
| | | | | | | | | | |
Name and
Year of Birth | | Position(s) Held
with the
Company(1) | | Term of
Office(2) and
Length of Time
Served | | Principal Occupation(s)
During Past Five Years | | Number of
Funds in the
Fund Complex
Overseen by
Board Member | | Other
Directorships
Held by Board Member(6) |
Mariann Byerwalter
Year of Birth: 1960 | | Director/Trustee; Chairman, Marketing, Distribution and Shareholder Services Committee | | Director/Trustee of each Company since 2006 | | Chairman of JDN Corporate Advisory LLC (1996 to 2001); Vice President for Business Affairs and Chief Financial Officer of Stanford University (1996-2001); Special Adviser to the President of Stanford University (2001). | | 95(4) | | BOARD 1 — Director, Redwood Trust, Inc. (mortgage finance). BOARD 2 — Director, PMI Group, Inc. (mortgage insurance). |
| | | | | |
Nils H. Hakansson
Year of Birth: 1937 | | Director/Trustee | | Director/Trustee of each Company since 2006 | | Sylvan C. Coleman Professor of Finance and Accounting, Emeritus, Haas School of Business University of California, Berkeley (since 2003); Sylvan C. Coleman Professor of Finance and Accounting, Haas School of Business, University of California, Berkeley (July 1977 to January 2003). | | 38(3) | | None |
| | | | | |
William A. Hasler
Year of Birth: 1941 | | Director/Trustee; Chairman, Governance Committee | | Director/Trustee of each Company since 2006 | | Retired. Dean Emeritus of the Haas School of Business at the University of California, Berkeley; until February 2004, Co-Chief Executive Officer, Aphton Corporation (bio-pharmaceuticals). | | 95(4) | | BOARD 1 — Director, Aphton Corporation. BOARD 2 — Director, Mission West Properties (commercial real estate). BOARD 3 — Director, TOUSA (home building). BOARD 4 — Director, Harris-Stratex Networks (a network equipment corporation). BOARD 5 — Director, Genitope Corp. (bio-pharmaceuticals). BOARD 6 — Director, Solectron Corporation where he is also Non-Executive Chairman (manufacturing). BOARD 7 — Director, Ditech Communications Corporation (voice communications technology). |
99
| | | | | | | | | | |
Name and
Year of Birth | | Position(s) Held
with the
Company(1) | | Term of
Office(2) and
Length of Time
Served | | Principal Occupation(s)
During Past Five Years | | Number of
Funds in the
Fund Complex
Overseen by
Board Member | | Other
Directorships
Held by Board Member(6) |
| INTERESTED DIRECTORS/TRUSTEES | | | | | | |
| | | | | |
Randall W. Merk(5)
Year of Birth: 1954 | | Director/Trustee | | Director/Trustee of each Company since 2006 | | Executive Vice President, Charles Schwab & Co., Inc. (2002-present); President, Schwab Financial Product, Charles Schwab & Co., Inc. (2002-present); Director, Charles Schwab Asset Management (Ireland) Limited; Charles Schwab Worldwide Funds PLC; Director, Charles Schwab Bank N.A. (since 2006). Prior to September 2002, President and Chief Investment Officer, American Century Investment Management, and Director, American Century Companies, Inc.; Until June 2001, Chief Investment Officer — Fixed Income, American Century Companies, Inc. | | 95(4) | | None |
100
| | | | | | |
Name, Address and Year of Birth | | Position(s) Held
with the
Company(1) | | Term of
Office(2) and
Length of
Time Served | | Principal Occupation(s)
During Past Five Years |
| OFFICERS | | | | | | |
Evelyn Dilsaver
101 Montgomery St.
San Francisco, CA 94104
Year of Birth: 1955 | | President | | Since
February
2006 | | President and Chief Executive Officer, Laudus Variable Insurance Trust, Laudus Trust, The Charles Schwab Family of Funds, Schwab Investments, Schwab Annuity Portfolios and Schwab Capital Trust; President, Chief Executive Officer, and Director, Charles Schwab Investment Management, Inc. President, UST Advisers, Inc.’s Mutual Fund Division since March 2006. From June 2003 to July 2004, Senior Vice President, Asset Management Products and Services Enterprise, Charles Schwab & Co., Inc. Prior to June 2003, Executive Vice President, Chief Financial Officer, and Chief Administrative Officer, U.S. Trust, a subsidiary of The Charles Schwab Corporation. |
| | | |
Leo Grohowski
114 West 47th Street
New York, NY 10036
Year of Birth: 1958 | | Vice President | | Since
February
2006 | | Executive Vice President and Chief Investment Officer, U.S. Trust (October 2005 to present); Chief Investment Officer, Deutsche Asset Management Americas and Scudder Investments (2002-2005); and Chief Investment Officer, Deutsche Bank Private Banking (1999-2002). |
| | | |
Mary Martinez
114 West 47th Street
New York, NY 10036
Year of Birth: 1960 | | Vice President | | Since
February
2006 | | Managing Director of United States Trust Company, National Association (since 2003) and Chief Operating Officer of Asset Management (since December 2005) and Chief Executive Officer of National Private Banking (October 2004 to December 2005); Managing Director and Director of Relationship Management Service, Marketing, Information and Technology at Bessemer Trust (1998 to 2003). |
| | | |
Catherine MacGregor
101 Montgomery St.
San Francisco, CA 94104
Year of Birth: 1964 | | Vice President | | Since
September
2006 | | Vice President, Charles Schwab & Co., Inc. and Charles Schwab Investment Management, Inc. (since July 2005); Chief Counsel, Laudus Variable Insurance Trust and Laudus Trust (since September 2006); Chief Legal Officer, Vice President, Laudus Variable Insurance Trust and Laudus Trust (since March 2007); Vice President, The Charles Schwab Family of Funds, Schwab Investments, Schwab Capital Trust and Schwab Annuity Portfolios; Senior Associate, Paul Hastings Janofsky & Walker LLP (1999 to July 2005). |
| | | |
Joseph Trainor, CFA
114 West 47th Street
New York, NY 10036
Year of Birth: 1961 | | Vice President | | Since
February
2004 | | Managing Director of United States Trust Company, National Association (since 2003) and President, U.S. Trust Institutional; President of MFS Institutional Advisors (1998 to 2002). |
| | | |
George Pereira
101 Montgomery St.
San Francisco, CA 94104
Year of Birth: 1964 | | Treasurer/Chief Financial and Chief Accounting Officer | | Since
December
2005 | | Chief Financial Officer, Laudus Variable Insurance Trust, Laudus Trust, The Charles Schwab Family of Funds, Schwab Investments, Schwab Annuity Portfolios and Schwab Capital Trust; Senior Vice President and Chief Financial Officer, Charles Schwab Investment Management, Inc.; Director, Charles Schwab Asset Management (Ireland) Limited; Sr. Vice President, Financial Reporting, Charles Schwab & Co., Inc. (December 1999 to November 2004); Chief Financial Officer, UST Advisers, Inc.’s Mutual Fund Division (since March 2006). |
| | | |
Randall Fillmore
101 Montgomery St.
San Francisco, CA 94104
Year of Birth: 1960 | | Chief Compliance Officer | | Since
June
2006 | | Senior Vice President, Institutional Compliance and Chief Compliance Officer, Charles Schwab Investment Management, Inc. Chief Compliance Officer, The Charles Schwab Family of Funds, Schwab Investments, Schwab Capital Trust and Schwab Annuity Portfolios, Laudus Trust and Laudus Variable Insurance Trust; Vice President, Charles Schwab & Co., Inc., and Charles Schwab Investment Management, Inc. (2002-2003); Vice President, Internal Audit, Charles Schwab and Co., Inc. (2000-2002). |
101
| | | | | | |
Name, Address and Year of Birth | | Position(s) Held
with the
Company(1) | | Term of
Office(2) and
Length of
Time Served | | Principal Occupation(s)
During Past Five Years |
Wyndham Clark
225 High Ridge Road
Stamford, CT 06905
Year of Birth: 1958 | | Anti-Money Laundering Officer | | Since
May
2004 | | Vice President and AML Officer, UST Advisers, Inc. (since 2003); Vice President and Deputy Director Risk Management, IBJ Whitehall (banking) (2001 to 2002); Vice President and Chief Risk Officer, EMAC, LLC (commercial lender, asset backed security issuer) (1999 to 2001). |
| | | |
Koji E. Felton
101 Montgomery St.
San Francisco, CA 94104
Year of Birth: 1961 | | Secretary and Chief Legal Officer | | Since
June
2006 | | Secretary and Chief Legal Officer, The Charles Schwab Family of Funds, Schwab Investments, Schwab Capital Trust and Schwab Annuity Portfolios; Senior Vice President, Chief Counsel and Corporate Secretary, Charles Schwab Investment Management, Inc.; Senior Vice President and Deputy General Counsel, Charles Schwab & Co., Inc. Prior to June 1998, Branch Chief in Enforcement at U.S. Securities and Exchange Commission in San Francisco. |
| (1) | Each Director/Trustee serves in the same capacity as described above for each registered investment company included in the Excelsior Funds family (Excelsior Funds Inc., Excelsior Tax-Exempt Funds, Inc. and Excelsior Funds Trust) (together, the “Excelsior Funds Family”) and the Laudus Funds family (Laudus Trust and Laudus Variable Insurance Trust) (together, the “Laudus Funds Family”). Each officer serves in the same capacity as described above for each registered investment company included in the Excelsior Funds Family. |
(2) | Each Director/Trustee shall hold office until the election and qualification of his or her successor, or until he or she dies, resigns or is removed. The Excelsior Funds retirement policy requires that Independent Directors/Trustees retire no later than December 31st of the year during which he or she reaches 72 years of age. The officers of each Company hold office for a one-year term and until their respective successors are chosen and qualified, or, in each case, until he or she sooner dies, resigns, is removed, or becomes disqualified in accordance with the Company’s by-laws. |
| (3) | This number includes all registered investment companies included in the Excelsior Funds Family and the Laudus Funds Family, each of which is part of the Schwab Mutual Fund Complex (as defined below). As of March 31, 2007, the Excelsior Funds Family and the Laudus Funds Family, in the aggregate, consisted of 38 funds. As of March 31, 2007, the Excelsior Funds Family consisted of 27 funds. |
| (4) | This number includes all registered investment companies included in the Schwab Mutual Fund family (Excelsior Funds, Inc., Excelsior Tax-Exempt Funds Inc., Excelsior Funds Trust, Laudus Trust, Laudus Variable Insurance Trust, The Charles Schwab Family of Funds, Schwab Investments, Schwab Annuity Portfolios and Schwab Capital Trust) (together, the “Schwab Mutual Fund Family”). As of March 31, 2007, the Schwab Mutual Fund Family consisted of 95 funds. |
| (5) | Mr. Merk is considered an “interested person” of the Companies (as defined in the 1940 Act) because of his affiliation with the Companies’ Advisers. |
| (6) | This column includes only directorships of companies required to report to the SEC under the Securities Exchange Act of 1934 (i.e., public companies) or other investment companies registered under the 1940 Act that are not part of the Schwab Mutual Fund Family. |
102
DISCLOSURE OF FUND EXPENSES (Unaudited)
We believe it is important for you to understand the impact of fees regarding your investment. As a shareholder of the fund, you incur ongoing, or operating costs, which include costs for portfolio management, administrative services, and shareholder reports (like this one), among others. Operating expenses, which are deducted from a fund’s gross income, directly reduce the investment return of the fund. A fund’s expenses are expressed as a percentage of its average net assets. This figure is known as the expense ratio. The following examples are intended to help you understand the ongoing costs (in dollars) of investing in your fund and to compare these costs with those of other mutual funds. The examples are based on an investment of $1,000 made at the beginning of the period shown and held for the entire period.
The table on the following page illustrates your fund’s costs in two ways.
| | • | | Actual expenses. This section provides information about actual account values and actual expenses based on the Funds’ actual return for the period. This section is designed to help you to estimate the actual expenses after fee waivers that you paid over the period. The “Ending Account Value” shown is derived from the fund’s actual return, and the fourth column shows the dollar amount that would have been paid by an investor who started with $1,000 in the fund. You may use the information here, together with the amount you invested, to estimate the expenses that you paid over the period. |
To do so, simply divide your account value by $1,000 (for example, an $8,600 account value divided by $1,000 = 8.6), then multiply the result by the number given for your fund under the heading “Expenses Paid During Period”.
| | • | | Hypothetical expenses. This section provides information about hypothetical account values and hypothetical expenses that would have been incurred by an investor in the Fund based on an assumed rate of return of 5% per year before expenses. This section is designed to help you compare your fund’s costs with those of other mutual funds. It assumes that the fund had a return of 5% before expenses during the year, but that the expense ratio is unchanged. In this case, because the return used is not the fund’s actual return, the results cannot be used to estimate the actual ending account balance or expenses you paid for the period. You may use this information to compare the ongoing costs of investing in your Fund and other funds. To do so, compare this 5% hypothetical example with the 5% hypothetical examples that appear in shareholder reports of other funds. |
103
DISCLOSURE OF FUND EXPENSES (Continued)
Please note that the expenses shown in the table are meant to highlight and help you compare ongoing costs only, which are described in the Prospectus. Therefore, the hypothetical example is useful in comparing ongoing costs only, and will not help you determine the relative total costs of owning different funds.
| | | | | | | | | | | | |
| | | Beginning
Account
Value
10/01/2006 | | Ending
Account
Value
03/31/2007 | | Annualized
Expense
Ratios* | | | Expenses
Paid
During
Period** |
| | | | |
Actual Fund Return | | | | | | | | | | | | |
Money Fund — Institutional Shares | | $ | 1,000.00 | | $ | 1,025.40 | | 0.29 | % | | $ | 1.46 |
Core Bond Fund — Institutional Shares | | | 1,000.00 | | | 1,026.50 | | 0.65 | | | | 3.28 |
High Yield Fund — Institutional Shares | | | 1,000.00 | | | 1,104.50 | | 0.78 | | | | 4.09 |
Equity Opportunities Fund — Institutional Shares | | | 1,000.00 | | | 1,113.00 | | 0.79 | | | | 4.16 |
Large Cap Growth Fund — Institutional Shares*** | | | 1,000.00 | | | 1,033.10 | | 0.96 | | | | 3.80 |
Mid Cap Value and Restructuring Fund — Institutional Shares | | | 1,000.00 | | | 1,098.20 | | 0.88 | | | | 4.60 |
Value and Restructuring Fund — Institutional Shares | | | 1,000.00 | | | 1,122.40 | | 0.83 | | | | 4.39 |
Emerging Markets Fund — Institutional Shares | | | 1,000.00 | | | 1,170.10 | | 1.60 | | | | 8.66 |
International Equity Fund — Institutional Shares | | | 1,000.00 | | | 1,131.70 | | 1.09 | | | | 5.79 |
| | | | |
Hypothetical 5% Return | | | | | | | | | | | | |
Money Fund — Institutional Shares | | | 1,000.00 | | | 1,023.49 | | 0.29 | | | | 1.46 |
Core Bond Fund — Institutional Shares | | | 1,000.00 | | | 1,021.69 | | 0.65 | | | | 3.28 |
High Yield Fund — Institutional Shares | | | 1,000.00 | | | 1,021.04 | | 0.78 | | | | 3.93 |
Equity Opportunities Fund — Institutional Shares | | | 1,000.00 | | | 1,020.99 | | 0.79 | | | | 3.98 |
Large Cap Growth Fund — Institutional Shares**** | | | 1,000.00 | | | 1,015.72 | | 0.96 | | | | 3.76 |
Mid Cap Value and Restructuring Fund — Institutional Shares | | | 1,000.00 | | | 1,020.54 | | 0.88 | | | | 4.43 |
Value and Restructuring Fund — Institutional Shares | | | 1,000.00 | | | 1,020.79 | | 0.83 | | | | 4.18 |
Emerging Markets Fund — Institutional Shares | | | 1,000.00 | | | 1,016.95 | | 1.60 | | | | 8.05 |
International Equity Fund — Institutional Shares | | | 1,000.00 | | | 1,019.50 | | 1.09 | | | | 5.49 |
| * | Annualized expense ratios of certain funds are after fee waivers and expense reimbursements by the investment adviser. Absent such waivers and reimbursements, expenses paid during the period would have been greater. |
| ** | Expenses are equal to the Fund’s annualized expense ratio multiplied by the average account value over the period, multiplied by the number of days in the most recent fiscal half-year (182) then divided by 365. |
| *** | Information shown reflects values for the period from November 9, 2006 (date of commencement of operations) to March 31, 2007 and has been calculated using expense ratios and rates of return for the same time period. |
| **** | Information shown reflects values using the expense ratios for the period from November 9, 2006 (date of commencement of operations) to March 31, 2007 and has been annualized to reflect values for the period from October 1, 2006 to March 31, 2007 |
104
AR-INST-0307

RETIREMENT SHARES
CORE BOND FUND
EQUITY INCOME FUND
LARGE CAP GROWTH FUND
MID CAP VALUEAND RESTRUCTURING FUND
SMALL CAP FUND
VALUEAND RESTRUCTURING FUND
ANNUAL REPORT
March 31, 2007
TABLE OF CONTENTS
This report must be preceded or accompanied by a current prospectus.
You should consider the Funds’ investment objectives, risks and expenses carefully before you invest. Information about these and other important subjects is in the Funds’ prospectus, which you should read carefully before investing.
Nothing in this report represents a recommendation of a security by the investment adviser. Manager views and portfolio holdings may have changed since the report date.
Investments in equity securities are subject to sudden and unpredictable drops in value and periods of lackluster performance.
Funds which concentrate their investments in one economic sector or in a geographical region may expose an investor to greater volatility. When used as part of a broader investment portfolio, these funds may serve to reduce overall portfolio volatility. Currency fluctuations, differences in security regulation, accounting standards, and foreign taxation regulation are among the risks associated with foreign investing as well as political risk—investing in emerging markets may accentuate these risks.
Small cap stocks may be less liquid and subject to greater price volatility.
Value-based investments are subject to the risk that the broad market may not recognize their intrinsic value.
Investments in fixed income securities are subject to interest rate risks. The principal value of a bond falls when interest rates rise and rise when interest rates fall. During periods of rising interest rates, the value of a bond investment is at greater risk than during periods of stable or falling rates.
A description of the policies and procedures that Excelsior Funds use to determine how to vote proxies relating to portfolio securities, as well as information relating to how a Fund voted proxies relating to portfolio securities during the most recent 12-month period ended June 30, is available (i) without charge, upon request, by calling (800) 881-9358, and (ii) on the Commission’s website at http://www.sec.gov.
Excelsior Funds file their June 30 and December 31 schedule of portfolio holdings with the Securities and Exchange Commission, on Form N-Q, within sixty days after the applicable reporting period. Excelsior Funds Form N-Q is available on the Commission’s website at http://www.sec.gov, and may be reviewed and copied at the Commission’s Public Reference Room in Washington, DC. Information on the operation of the Public Reference Room may be obtained by calling (800)-SEC-0330.
Excelsior Funds Trust and Excelsior Funds, Inc. are distributed by BISYS Fund Services Limited Partnership.
A schedule of each Fund’s portfolio holdings, as of the end of the prior month, is also available on the Funds’ website at www.excelsiorfunds.com. This schedule is updated monthly, typically by the 15th calendar day, after the end of each month. The Funds may terminate or modify this policy at anytime.
Notice About Duplicate Mailings
The Excelsior Funds have adopted a policy that allows the Funds to send only one copy of a Fund’s prospectus and annual and semi-annual reports to certain shareholders residing at the same “household.” This reduces Fund expenses, which benefits you and other shareholders. If you do not want your mailings to be “householded,” please call (800) 542-1061 or contact your financial intermediary.
SHARES OF THE FUNDS ARE NOT DEPOSITS OR OBLIGATIONS OF, OR GUARANTEED OR ENDORSED BY, ANY BANK, AND THE SHARES ARE NOT FEDERALLY INSURED BY THE FEDERAL DEPOSIT INSURANCE CORPORATION, BANK INSURANCE FUND, FEDERAL RESERVE BOARD, OR ANY OTHER GOVERNMENTAL AGENCY. FUND SHARES ARE NOT INSURED OR GUARANTEED BY THE U.S. GOVERNMENT. AN INVESTMENT IN A FUND IS SUBJECT TO RISK OF PRINCIPAL.
LETTER TO SHAREHOLDERS
March 31, 2007
Dear Valued Excelsior Fund Shareholder,
I am pleased to bring you the annual report for the year ended March 31, 2007 for the Excelsior Funds. The funds in this report are part of the Excelsior Fund family which has over $20 billion in assets as of the end of the reporting period and includes a wide array of asset classes and investment strategies designed to meet the individual investor’s investment needs.
By now, you have received notification that on November 20, 2006, The Charles Schwab Corporation (“Schwab”) announced an agreement to sell the U.S. Trust Corporation (“U.S. Trust”), a wholly-owned subsidiary of Schwab, to the Bank of America Corporation (“Bank of America”) (the “Sale”). The Sale involves all of U.S. Trust’s subsidiaries, including the Excelsior Funds’ investment advisers, UST Advisers, Inc. (“USTA”) and United States Trust Company National Association, on behalf of its asset management division, U.S. Trust New York Asset Management (“USTNA”). Consequently, the Excelsior Funds will need to enter into new investment advisory agreements with USTA and USTNA.
At a meeting held on January 8, 2007, the Board approved new investment advisory agreements under which, subject to approval by the Excelsior Funds’ shareholders, USTA and USTNA will continue to serve as investment advisers to the Excelsior Funds after the Sale is completed. At the same meeting, the Board directed that the new investment advisory agreements be submitted to the shareholders of each Fund for approval.
A Special Meeting of Shareholders of Excelsior Funds, Inc., Excelsior Tax-Exempt Funds, Inc and Excelsior Funds Trust and each of their funds was held on March 30, 2007. The number of votes necessary to conduct the Special Meeting and approve the new investment advisory agreements was obtained for each fund except the Value and Restructuring, Energy and Natural Resources and Treasury Money Funds. The Special Meeting for Value and Restructuring, Energy and Natural Resources and Treasury Money Funds was adjourned for the purpose of soliciting additional proxies, and we anticipate that the new investment advisory agreements will be approved by the shareholders of these funds at a subsequent Special Meeting.
The integration of U.S. Trust, Bank of America’s private bank and its ultra high net worth extension will create the nation’s largest private wealth management firm with assets under management of over $260 billion and total client assets of almost $420 billion.
We at the Excelsior Funds are excited about our future within Bank of America and remain committed to helping you with your long-term investment goals. Thank you for investing with us.
Sincerely,

Evelyn Dilsaver
President
1
EXCELSIOR FUNDS | EQUITY MARKET REVIEW |
Equity Market Review
After breezing through the end of the Funds’ fourth fiscal quarter, the financial markets generally, and equities in particular—encountered severe headwinds as the Excelsior Funds began their new fiscal year in April of 2006. Emerging markets in particular fell 4.3% in the fiscal first quarter. Non-U.S. equities overall, however, managed to achieve a small gain, thanks to advances in Europe. The U.S. equity market declined during these first three months as well (the S&P 500 Index was down 1.4%, while the Russell 1000 Index declined 1.7%), amidst concerns about the Federal Reserve’s (Fed) tightening policy, inflation, and gradually mounting worries about global growth and a hard landing in the U.S. Small caps were bested by large caps (the Russell 2000 Index was down 5% in the quarter), with small cap growth stocks the weakest-performing market segment. Value outperformed growth no matter the market cap as investors became defensive. In this period, energy, utilities and integrated oils were the best-performing sectors. Technology and health care were the weakest-performing sectors in the period.
Volatility continued unabated through the first part of the summer, until August, when investor appetite for risk returned, and the equity markets rebounded strongly. The long-anticipated Fed pause and a drop in energy prices were among the reasons for the improving environment. For the fiscal second quarter, the S&P 500 Index, for instance, saw a 5.7% advance. Large caps continued their outperformance versus mid- and small-cap stocks, and value continued to best growth, although growth did appear to be gaining a better footing in the period. Among economic sectors, financial services rallied on the Fed pause, while technology, health care and utilities (telecom) sectors all were given a boost by strong M&A activity in the period. Non-U.S. equity markets, paced by Continental Europe, were mostly up in the quarter, although a slightly stronger U.S. dollar had an impact on results. Japanese and emerging markets saw a rebound as well.
The positive conditions continued into the fiscal third quarter, given the Fed’s decision not to raise rates, lower oil prices, and encouraging inflation numbers. For the quarter, the S&P 500 Index achieved a 6.7% gain. While large cap stocks were strong in the period, they did give away their leadership position to small caps. Value continued to outperform growth. On a sector basis, performance across sectors was strong overall, although energy (integrated oils) saw the largest gains; health care saw the smallest advance, given investor concerns over a Democrat-controlled Congress.
The final fiscal quarter (the first calendar quarter of 2007) saw volatility return to the markets with a large sell-off in late February, although most of the world’s equity markets managed to come in basically flat for the three-month period. International markets, led by the developed markets, advanced in the period, and in most cases outpaced the U.S. market.
Outlook
The current market environment is similar to conditions that prevailed at the end of December. At that time, the markets were dealing with excess noise on the health of the economy—related specifically to inflation and slowing growth in the U.S., and how that slowing growth would impact economies around the world. Later, in the first months of the new calendar year, equities saw a sharp correction sparked by weakness in the sub-prime mortgage sector. While leading inflation indicators remained weak, actual inflation had yet to roll over, and concerns were mounting that earnings would come in better than expected. The fear was the Fed would not be able to cut interest rates anytime soon.
2
EXCELSIOR FUNDS | EQUITY MARKET REVIEW |
Right now, the focus continues on earnings. For our part, we still expect to see some muted earnings growth in 2007 accompanied by a bit of P/E expansion as rates come down. We’re also expecting a re-acceleration of the equity market to occur toward year-end, after we work through what we expect will be a typical summer dry period. Our rationale? Inflation is not much of a concern (which should become increasingly apparent in coming months), economic growth is slowing, and we believe the Fed has ample ammunition to cut interest rates—and is likely to do so in the next several months, thereby averting a growth slowdown becoming a recession.
Equities should, as a result, continue overweight relative to fixed income, even though we believe yields will be lower by year-end. Within equities, we continue to believe non-U.S. growth and valuations are more attractive than they are in the U.S., driven in large part by continued growth in Europe and Japan. European equity markets continue to benefit from huge deal flow. Japan is making its way out of a long slump, and we’re still at the early stages of the adjustment process. Within the U.S., we plan to focus on high-quality cash-generating businesses that provide a decent yield, as well as selective growth stories.
3
EXCELSIOR FUNDS FIXED INCOME MARKET REVIEW | |
Bond Market Review
Yields generally declined across intermediate and longer maturity levels but rose on the front end of the curve over the course of the fiscal year ended March 31, 2007. The Federal Reserve (Fed) increased the target short-term federal funds rate twice in the period (both times in the second quarter of 2006), raising it from 4.75% to 5.25%, which is where it still stands.
The yield curve ended the fiscal year inverted as money-market rates continued to out-yield longer maturity Treasury issues. After remaining flat for the most of the past year, the yield curve steepened towards a more normalized shape from the two-year to 30-year maturity range. In March, the ten-year yield was above the two-year yield, the first time in over six months.
Overall for the fiscal year, bonds earned a solid return of 6.59% as represented by the Lehman Aggregate Index. Investment grade corporate bonds, as represented by the Lehman U.S. Credit Index, returned 7.1% and posted positive excess returns (over duration equivalent Treasuries) of almost 1%. The spread between corporate bond yields and Treasuries remained narrow over the course of the fiscal year, a reflection of continued strong investor demand as corporate default rates hovered near historic lows. A record $1.07 trillion in corporate bonds were issued in 2006, versus $770 billion in 2005, as companies took advantage of relatively low borrowing costs. Commercial mortgage-backed securities (CMBS) was another strong spread sector over the period, generating 0.67% of excess returns. So far in this credit cycle, strong fundamentals and heavy buying by foreign investors have contributed to spread compression.
In the municipal market, low interest rates, narrow intermarket long-term yield spreads, tighter credit spreads and issuer use of swaps and other derivatives for funding purposes combined to create one of the highest-volume years on record. Foreign buyers, seeking to take advantage of spreads between BMA (the Bond Market Association synthetic municipal yield curve) and LIBOR (the London Interbank Offered Rate), were significant municipal market participants. While the municipal curve is flat by historical domestic market standards, it has been steeper than alternative fixed income vehicles; thus, many foreign and domestic buyers leveraged their holdings. For the same reasons, numerous municipal hedge funds were birthed, adding additional buying support to the market.
Outlook
We believe the U.S. economy is in a period of below-trend growth levels. Going forward much will depend on the employment situation, which continues to hold firm. The timing of any lowering of rates by the Fed will be a function of equity market strength and unemployment reports. We do believe that weakness in the economy will eventually cause the yield curve to steepen and rates to fall, especially at the shorter end of the yield curve. History has shown that after a long period of a stable Fed funds rate (such as we have seen in the past nine months), a reversal of policy (in this case, from tightening to easing) carries a very high probability.
Inflation-protected Treasury securities (TIPSs) are close to their breakeven highs over the near-term. Breakevens should remain near these current levels as the Fed continues to take a vigilant stance towards inflation regardless of the market’s view on forward rates. There should be opportunities to add to this sector later in the year at relatively attractive levels should the Fed enter a period of sustained easing.
4
EXCELSIOR FUNDS FIXED INCOME MARKET REVIEW | |
In lower-grade credits, some caution seems appropriate in the high-yield market. We believe high yield spreads will remain range bound over the quarter as economic activity moderates and the housing situation becomes clearer. Despite spreads widening over the quarter, they remain significantly lower than long-term averages. Should a weak economy materialize, default rates will increase faster than currently expected and high yield spreads likely would expand.
In terms of both residential and commercial mortgage backed securities, the tremors from the sub-prime market have been relatively contained so far this year. Prepayment volatility should remain low as MBS refinancing will not meaningfully accelerate unless rates decline substantially at the longer end of the curve. CMBS spreads appear very attractive relative to corporate bonds, offering similar yield with higher credit quality. We favor shorter-maturity adjustable-rate (Hybrid ARM’s) issues as they continue to offer satisfactory return expectations with substantial protection from volatile markets.
In the municipal bond market, as long as the forces of low interest rates, a flat yield curve and tighter spreads persist, we anticipate that the refunding of municipal bonds will continue and may put pressure on secondary market profits, particularly in the long end of the market. Should profitability of leveraged tender option bond programs continue to compress, forcing the sale of securities, the long end could come under even greater pressure. Our current view is to maintain a shorter duration profile than the index, with overweightings concentrated on the front end of the yield curve.
5
EXCELSIOR FUNDS, INC. | CORE BOND FUND |
Performance Summary
The Excelsior Core Bond Fund underperformed the Lehman Brothers Aggregate Bond Index for the Fund’s fiscal year ending March 31, 2007.
Yields generally declined across intermediate and longer maturity levels but rose on the front end of the curve over the course of the fiscal year. The Fed increased the target short-term federal funds rate twice in the period, bringing it to 5.25% from 4.75%. Both rate hikes occurred in the second calendar quarter of 2006, and the Fed has left its target short-term interest rate unchanged since that time.
The yield curve ended the fiscal year inverted as money-market rates continue to out-yield longer-maturity Treasury issues. After remaining flat for most of the past year, the yield curve steepened towards a more normalized shape from the two-year to 30-year maturity range. In March, the ten-year yield was above the two-year yield—the first time that’s happened in more than six months.
Overall for the fiscal year, bonds earned a solid return of 6.59% as represented by the Lehman Brothers Aggregate Bond Index. Investment-grade corporate bonds, as represented by the Lehman U.S. Credit Index, returned 7.1% and posted positive excess returns (over duration-equivalent Treasuries) of almost 1%. The spread between corporate bond yields and Treasuries remained narrow throughout the year, a reflection of continued strong investor demand as corporate default rates hovered near historic lows. A record $1.07 trillion in corporate bonds were issued in 2006, compared with $770 billion in 2005 as companies took advantage of relatively low borrowing costs. The commercial mortgage-backed securities (CMBS) sector was also strong in the period, generating 0.67% of excess returns. So far in this credit cycle, strong fundamentals and heavy buying by foreign investors have contributed to spread compression.
Performance Attribution and Portfolio Positioning
Within sectors, the decision to overweight commercial mortgage backed securities proved beneficial as the sector generated strong excess returns in the period. Furthermore, allocation and selection in residential mortgages added to returns, specifically in floating-rate, shorter-maturity issues. Conversely, while the underweight allocation to investment-grade credit detracted from results; issue selection within this sector and exposure to select high yield issues helped results during the year.
We continue to hold overweight positions in mortgages to maintain portfolio yield levels and a high credit quality relative to the benchmark. Portfolios are generally underweight in Treasury and Agency securities. Our strategy has been to underweight the agency and corporate bonds favored by the foreign buyers and find better values in commercial mortgages (CMBS) and residential adjustable-rate mortgages.
During the fiscal year, the Fund’s duration and curve positioning were additive to results. The Fund typically maintained a narrow duration band around the benchmark, yet its tactical moves (longer than benchmark for the second half of 2006) were additive to results. The Fund has been positioned for an eventual steepening of the Treasury yield curve. This positioning has not hurt returns and should be rewarded in the coming months.
The Fund ended the fiscal year positioned slightly shorter duration than the benchmark from a tactical perspective. We expect an end to Fed rate hikes, and ultimately a move to lower market rates, which would warrant moving the Fund to a slightly longer-than-benchmark duration position later in the year. Fund positions have been migrated to better capitalize on our expectation of lower yields and a
6
EXCELSIOR FUNDS, INC. | CORE BOND FUND |
steepening yield curve. We have made no major changes to our overall allocation in the credit sector, although we have actively eliminated select issuers in the auto sector and added to positions in the consumer sector. Throughout the year, the Fund maintained a minimum allocation to securities rated less than single-A, choosing to emphasize higher-quality issues.
The portfolio yield exceeded that of the benchmark over the course of the year.
Outlook
We believe the U.S. economy is in a period of below-trend growth. Going forward, much will depend on the employment situation, which continues to hold firm. The timing of any lowering of rates by the Fed will be a function of equity market strength and unemployment reports. We do believe that weakness in the economy will eventually cause the yield curve to steepen and rates to fall, especially at the shorter end of the yield curve. History has shown that after a long period of a stable federal funds rate (such as the past nine months), a reversal of policy (in this case, from tightening to easing) carries a high probability.
From a duration standpoint, the Fund is positioned slightly short-duration from its benchmark on a tactical basis due to favorable seasonal patterns. We are positioned for further spread widening and yield-curve steepening in response to the more volatile equity markets and slower economic growth. We have positioned the Fund for a more normally sloped yield curve, which we believe offers the potential for significant reward.
Inflation-protected Treasury securities (TIPSs) are close to their breakeven highs over the near term. Breakevens should remain near these levels as the Fed continues to take a vigilant stance toward inflation regardless of the market’s view on forward rates. There should be opportunities to add to this sector later in the year at relatively attractive levels should the Fed enter a period of sustained easing.
We remain underweight the credit sector in general; corporate bonds present little value at present spread levels. Even with the widening of spreads in the first quarter (fiscal fourth quarter), we are still near the historic tight levels seen over the past decade. Leveraged buyouts and shareholder enhancement activities remain threats for corporate bonds. With event risk already high, the environment could worsen given a sell-off in equities as private equity groups should inevitably increase LBO-related activities.
In lower-grade credits, some caution seems appropriate in the high-yield market, although we do believe it’s prudent to maintain a minimal allocation. We believe high yield spreads will remain range bound over the quarter as economic activity moderates and the housing situation becomes clearer. Despite spreads widening during the first quarter of 2007, they remain significantly lower than long-term averages. Should a weak economy materialize, default rates would increase faster than currently expected and high yield spreads likely would expand.
The Fund remains overweight in both residential and commercial mortgage backed securities. The tremors from the sub-prime market have been relatively contained so far. Prepayment volatility should remain low as MBS refinancing will not meaningfully accelerate unless rates decline substantially at the longer end of the curve. CMBS spreads appear attractive relative to corporate bonds, offering similar yield with higher credit quality. We continue to concentrate on adding older deals that feature better
7
EXCELSIOR FUNDS, INC. | CORE BOND FUND |
underwriting standards than are prevalent in the current market. We favor shorter-maturity adjustable-rate (Hybrid ARMs) issues as they continue to offer satisfactory return expectations with substantial protection from volatile markets.
Alexander R. Powers
Managing Director
Portfolio Manager and Head of Fixed Income Investments
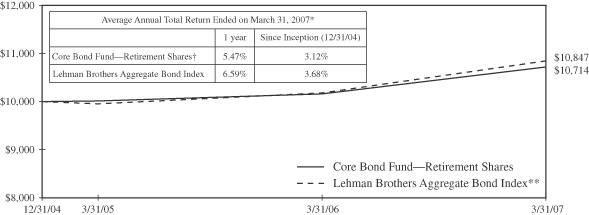
Past performance is not predictive of future performance. Investment returns and principal values will vary and shares may be worth more or less at redemption than their original cost.
The above illustration compares a $10,000 investment made in the Fund and a broad-based index since 12/31/04 (inception date). The chart assumes all dividends and capital gain distributions are reinvested. The Fund’s performance takes into account fees and expenses. The index does not take into account charges, fees and other expenses. Further information relating to Fund performance is contained in the Financial Highlights section of the Prospectus and elsewhere in this report.
| | | |
| | |
Expense Ratio | | | |
| (As of 7/31/06) | | Shares | |
Gross Expense Ratio | | 1.78 | % |
Net Expense Ratio | | 1.40 | % |
The expense information in the table reflects contractual fee waivers currently in effect. This information is included in the most current prospectus available to current and prospective shareholders of the Fund. The Adviser has contractually agreed to waive fees or reimburse expenses in order to keep total operating expenses from exceeding 1.40%. The waiver agreement may not be terminated before July 31, 2007. In addition, this agreement will renew automatically for an additional 12 month term unless the Adviser terminates the agreement by providing written notice to the Fund prior to the expiration of the current term.
| * | | Total return represents the change during the period in a hypothetical account with dividends reinvested. |
| ** | | Source: Lehman Brothers—the Lehman Brothers Aggregate Bond Index is an unmanaged, fixed income, market value-weighted index that includes treasury issues, agency issues, corporate bond issues and mortgage-backed securities. |
| † | | Currently certain fees are waived. Had such fees not been waived, returns would have been lower. Returns do not reflect the deduction of taxes that a shareholder would pay on Fund distributions or the redemption of shares. |
8
EXCELSIOR FUNDS TRUST | EQUITY INCOME FUND |
Performance Summary
The Excelsior Equity Income Fund outperformed the S&P 500 Index over the last twelve months. This outcome is a result of our efforts to grow our income stream by purchasing stocks at attractive initial yields and by owning companies with progressive dividend policies. The Fund concentrates on investing in stocks that offer above-average dividend yields or have the potential to grow their dividends at above-average rates.
Performance Attribution
The strongest contributors to performance were RPM International, Chevron and AT&T. RPM, one of our largest holdings and best performers, has industrial operations that are growing nicely and legacy asbestos costs that are moderating. Chevron’s total returns are directly related to their outstanding earnings growth amidst a strong energy price environment. Telecom stocks underperformed in 2005 despite improving industry fundamentals, so AT&T’s recent strong performance is a culmination of investor recognition of improving fundamentals while the stock was trading at low valuations. In addition, AT&T’s acquisitions (purchasing the historic AT&T and Bellsouth in the last 18 months) are being viewed more favorably today in light of improving industry fundamentals.
Our worst contributors to performance were Home Depot, Halliburton and WP Stewart. We continue to hold Home Depot and Halliburton and like their respective outlooks. We fortunately sold W.P. Stewart in the summer of 2006 at higher prices than today’s. We lost confidence in W.P. Stewart’s turnaround, despite efforts to fix their asset accumulation problems. As part of our sell discipline, if a company is not making fundamental progress versus our expectations over a 2 year time frame, we will exit the stock.
We believe Halliburton remains attractive because its Energy Services Group has excellent growth opportunities. Global demand for energy services should be strong for several years, resulting in strong volume and significant pricing power for Halliburton and its peers. Halliburton has a particularly strong business serving North America’s gas production needs, but this opportunity is overshadowed by short-term concerns of a North American natural gas overhang. The value of the Energy Services Group within Halliburton has been obscured by the lumpy and controversial business of Kellogg, Brown and Root (KBR). The separation of KBR from Halliburton should help highlight the value of the Energy Services Group.
Portfolio Activity
During the last year, we initiated four new significant positions: Home Depot, SuperValu, Penn West Energy and Xilinx.
Home Depot operates in a favorable retail category. Lowe’s and Home Depot have less formidable competitors in their segment compared to any other big box category; this dynamic is supported by excellent growth and profit margins for both companies. Furthermore, the housing stock has expanded greatly over the last 10 years, which bodes well for future home improvement spending.
All in all, sales should grow at least 5-10% over the next several years and earnings per share (EPS) should grow approximately 10% plus. The company sells for 12x earnings and produces considerable free cash flow. We believe their acquisitions and their large repurchases of stock are high quality investments. Their dividend payout ratio is 35% and it is likely to modestly increase over time. The stock’s current yield is 2.4%; the company increased its dividend by 125% over the last year.
9
EXCELSIOR FUNDS TRUST | EQUITY INCOME FUND |
SuperValu, a grocery retailer, is engaged in a transforming deal by teaming up with Cerberus and CVS to purchase the assets of Albertsons. SuperValu acquired the best stores within the Albertsons network, with Cerberus and CVS purchasing the balance of the supermarket and stand-alone pharmacy locations. As a result, SuperValu’s base increased by 1,200 stores; its revenue should increase from $19 billion to $45 billion. Importantly, about 75% of its revenue will be from regions where it is either #1 or #2 in market share.
Penn West Energy Trust is a Canadian income trust with significant gas and oil production potential. It has three long-term projects worthy of note: 1) it has begun to farm out some of its 4.3 million acres of undeveloped land. Farming out is a minimally capital intensive method to monetize its large strategic land position; 2) the Seal Oil Sands Project has the potential to greatly enhance the company’s level of heavy oil production. (Initially, primary methods of production are being employed in the Seal project, resulting in less capital intensity. Ultimately, tertiary methods will be needed to greatly enhance production.) 3) it has begun to employ carbon dioxide recovery techniques to its largest conventional oil field, Pembina. Carbon flooding has been very successful in the U.S.
The semiconductor sector represents a growing source of dividend growth as more of these companies recognize the importance of returning excess capital to shareholders in an efficient manner. We like Xilinx because it has a growth business that requires modest capital in order to grow. As a result, it has accumulated a large cash balance ($4.00 per share). Xilinx initiated a dividend 3 years ago in recognition of its strong cash flow and large cash balance, and it has since grown it rapidly. Today, the payout ratio is approximately 45% and yield is 1.8%. The yield could be higher if the extra cash were disbursed through a special dividend immediately.
Outlook
The outlook for a dividend-focused approach is positive. Dividend-paying stocks have led the market higher over the last few years, a trend that looks sustainable for the foreseeable future. Since the tax law changes in 2003, the number of companies paying dividends has increased, the average rate of dividend increase has accelerated, and the stocks that pay dividends have outperformed as a group.
Despite these positive developments, the average payout ratio for S&P 500 companies remains historically low because recent earnings growth has been very strong. We believe many companies can “afford” to increase their payout ratio without negatively impacting their growth prospects.
We remain enthusiastic about the earnings growth opportunities for the companies in the Fund and we think that their current valuations are reasonable. In fact, many of our companies have experienced valuation compression over the last two years as earnings growth has outpaced share price appreciation. The fundamental drivers of growth are intact, capital market liquidity is great, investor sentiment is healthy, and valuations are attractive. We remain bullish on the prospects for our companies.
Thomas W. Vail
Managing Director and Senior Portfolio Manager
Brian V. DiRubbio
Senior Vice President and Senior Portfolio Manager
10
EXCELSIOR FUNDS TRUST | EQUITY INCOME FUND |
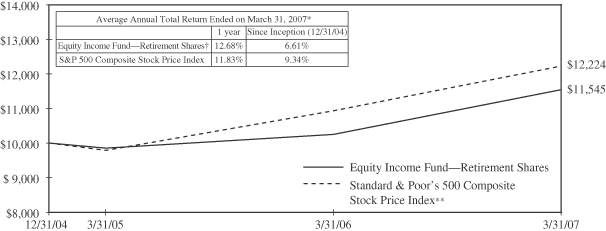
Past performance is not predictive of future performance. Investment returns and principal values will vary and shares may be worth more or less at redemption than their original cost.
The above illustration compares a $10,000 investment made in the Fund and a broad-based index since 12/31/04 (inception date). The chart assumes all dividends and capital gain distributions are reinvested. The Fund’s performance takes into account fees and expenses. The index does not take into account charges, fees and other expenses. Further information relating to Fund performance is contained in the Financial Highlights section of the Prospectus and elsewhere in this report.
| | | |
| | |
Expense Ratio | | | |
| (As of 7/31/06) | | Shares | |
Gross Expense Ratio | | 1.84 | % |
Net Expense Ratio | | 1.60 | % |
The expense information in the table reflects contractual fee waivers currently in effect. This information is included in the most current prospectus available to current and prospective shareholders of the Fund. The Adviser has contractually agreed to waive fees or reimburse expenses in order to keep total operating expenses from exceeding 1.60%. The waiver agreement may not be terminated before July 31, 2007. In addition, this agreement will renew automatically for an additional 12 month term unless the Adviser terminates the agreement by providing written notice to the Fund prior to the expiration of the current term.
| * | | Total return represents the change during the period in a hypothetical account with dividends reinvested. |
| ** | | Source: Standard & Poor’s Corporation—Reflects the reinvestment of income dividends and, where applicable, capital gain distributions. The Standard & Poor’s 500 Composite Stock Price Index is a widely accepted unmanaged index of U.S. stock market performance. |
| † | | Currently certain fees are waived. Had such fees not been waived, returns would have been lower. Returns do not reflect the deduction of taxes that a shareholder would pay on Fund distributions or the redemption of shares. Returns do not reflect the 2% fee imposed on shares redeemed 30 days or less after their date of purchase. |
11
EXCELSIOR FUNDS, INC. | LARGE CAP GROWTH FUND |
Performance Summary
The Excelsior Large Cap Growth Fund over the year ended March 31, 2007 posted solid results, in line with the Russell 1000 Growth Index. That said, it was a difficult year for growth investors. First, earnings growth for the overall market, originally expected to be mid-single digits a year ago, turned out to be in the mid-teens, which was consistent with the price gain of the broad-market S&P 500 Index and double the long-term average rate of EPS growth. In this type of earnings environment, investors were unwilling to pay a premium for high growth companies. Additionally, technology, which represented one of our largest weights, was beaten down by stock options investigations and concerns about the sustainability of growth. Fortunately, the market has gone a long way towards sorting out the good from the bad regarding stock options.
Performance Attribution
Our stock picking helped overcome the above-mentioned drags and deliver positive absolute and benchmark-relative returns. From a sector perspective, we generated positive returns versus the Russell 1000 Growth Index in technology, health care and telecom stocks. Conversely, our picks in the industrial, financial and consumer discretionary sectors hurt. Also, the lack of exposure to materials, utilities and consumer staples was a modest drag. On an individual stock basis, our top five positive contributors in the past year were Research in Motion, Apple Inc., Coach, America Movil and Akamai Technologies. On the flip side, Amgen, Corporate Executive Board, Broadcom, Sallie Mae and eBay were the most significant negative contributors.
Portfolio Activity
We made several company changes to the Excelsior Large Cap Growth Fund in the past year, with eight new additions and ten deletions. We eliminated positions in Carnival Cruise, Dell, Patterson Companies, PetSmart, Wellpoint, Medtronic, SAP, Caremark, Teva Pharmaceuticals and Yahoo. We initiated positions in Akamai, Allergan, Corning, Best Buy, Corporate Executive Board, Intuitive Surgical, Adobe Systems and Las Vegas Sands. We expect these additions to generate EPS growth of 25%, on average, over the next 12 to 18 months, thereby providing attractive total return opportunities. Here are some brief business descriptions of these new additions.
Akamai (AKAM) is the leading provider of content and application delivery services that speed up how content is distributed over the internet, thus enabling organizations to expand and optimize their online content, applications, and business processes better without the required IT investment that would otherwise be necessary to support this growth.
Allergan (AGN) is a global specialty pharmaceutical and medical device company targeting the ophthalmology, neuroscience, medical dermatology and medical aesthetics markets. AGN’s future growth should come from its three core franchises—Ophthalmology, Neurology (Botox) and Aesthetics.
Corning (GLW) is a global technology company with operations in four business segments: Display Technologies, Telecommunications, Environmental Technologies and Life Sciences. GLW stands to benefit from several trends: increased LCD TV penetration, demand for notebook displays and flat-screen monitors, increased fiber deployments, and emissions control regulations.
12
EXCELSIOR FUNDS, INC. | LARGE CAP GROWTH FUND |
Best Buy (BBY) is a leading retailer of consumer electronics, home office, entertainment software, appliances and related services. The company is in the sweet spot of two product cycles, digital TVs and video games, which should continue to drive demand for its products. In addition, the expansion of its Geek Squad and Best Buy for Business platforms is expected to drive incremental growth opportunities.
Corporate Executive Board (EXBD) provides “best practices” research, decision support tools and executive education focusing on corporate strategy, operations and general management issues. The company’s membership-based model permits its clients to learn about the best practices of leading corporations at a fraction of the cost of a customized analysis.
Intuitive Surgical (ISRG) is the market leader in robotic-assisted minimally invasive surgery. The company’s da Vinci surgical system is used primarily in urologic, gynecologic, cardiothoracic and general surgery procedures. Clinically, the benefits and patient outcomes from robotic-assisted minimally invasive surgery are superior to conventional endoscopic surgery.
Adobe Systems (ADBE) is a leading developer of software for creative professionals and consumer hobbyists. Through its broad portfolio of software offerings, ADBE is well positioned to take advantage of several secular trends including the transition to Web 2.0 and rich internet applications, the shift to online advertising, and the increase in digital media consumption.
Las Vegas Sands (LVS) currently operates The Venetian Resort Hotel Casino and Sands Expo and Convention Center in Las Vegas, as well as the Sands Macao. LVS has an aggressive development pipeline being driven by the booming growth of the middle class in China, easing travel restrictions, and a healthy appetite for gaming and leisure consumption. Within a five-hour flight of nearly half of the world’s population, and offering the only legal gaming market in China, the Macao market has quickly become the most significant growth opportunity for gaming operators.
Outlook
Our outlook for growth investing remains positive. While there is no shortage of things to be concerned about, including geo-political angst, energy market volatility, the bursting of a housing bubble and the potential for an economic recession, we see reasons to be optimistic. Economic growth is moderating, but we believe a recession is unlikely. Diplomats are hard at work, sub-prime problems are currently contained, unemployment is low, inflation is low, and corporate profitability is still close to all-time highs. Equities appear attractive from a valuation perspective relative to bonds and real estate; growth stocks in particular look historically cheap relative to value stocks and the market in general. Corporate balance sheets are in good shape and returns on equity in the aggregate are close to all-time highs. After 18 consecutive quarters of double-digit EPS growth from S&P 500 companies, we are now transitioning to a mid-single-digit growth world for 2007. As with the mid-80s and mid-90s mid-cycle slowdowns, this transition may lead investors to pay a premium once again for companies capable of sustaining premium earnings growth like those found in the Excelsior Large Cap Growth Fund.
Thomas M. Galvin, CFA
President and CIO of the Growth Equity Group
13
EXCELSIOR FUNDS, INC. | LARGE CAP GROWTH FUND |
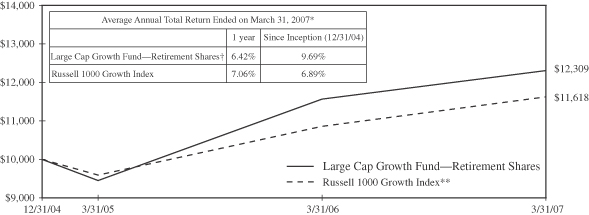
Past performance is not predictive of future performance. Investment returns and principal values will vary and shares may be worth more or less at redemption than their original cost.
The above illustration compares a $10,000 investment made in the Fund and a broad-based index since 12/31/04 (inception date). The chart assumes all dividends and capital gain distributions are reinvested. The Fund’s performance takes into account fees and expenses. The index does not take into account charges, fees and other expenses. Further information relating to Fund performance is contained in the Financial Highlights section of the Prospectus and elsewhere in this report.
| | | |
| | |
Expense Ratio | | | |
| (As of 7/31/06) | | Shares | |
Gross Expense Ratio | | 1.99 | % |
Net Expense Ratio | | 1.70 | % |
The expense information in the table reflects contractual fee waivers currently in effect. This information is included in the most current prospectus available to current and prospective shareholders of the Fund. The Adviser has contractually agreed to waive fees or reimburse expenses in order to keep total operating expenses from exceeding 1.70%. The waiver agreement may not be terminated before July 31, 2007. In addition, this agreement will renew automatically for an additional 12 month term unless the Adviser terminates the agreement by providing written notice to the Fund prior to the expiration of the current term.
| * | | Total return represents the change during the period in a hypothetical account with dividends reinvested. |
| ** | | Source: Frank Russell Company—The Russell 1000 Growth Index is an unmanaged index composed of those Russell 1000 Index companies with higher price-to-book ratios and higher forecasted growth values. The Russell 1000 Index is composed of the 1000 largest companies in The Russell 3000 Index which is composed of 3,000 of the largest U.S. companies by market capitalization. The Index includes dividends reinvested. |
| † | | Currently certain fees are waived. Had certain fees not been waived, returns would have been lower. Returns do not reflect the deduction of taxes that a shareholder would pay on Fund distributions or the redemption of shares. Returns do not reflect the 2% fee imposed on shares redeemed 30 days or less after their date of purchase. |
14
EXCELSIOR FUNDS TRUST | MID CAP VALUE AND RESTRUCTURING FUND |
Performance Summary
A renewed awareness of risk and volatility stands as the hallmark of the past year. While second quarter activity was driven almost wholly by a reaction to new “management” at the Federal Reserve Bank, the third quarter was marked by defensiveness as investors worried whether interest rates were enough to contain inflation, or too much so as to cause recession. This was followed by a clear break in favor of higher stock prices at the end of 2006, only to be followed by a volatile first quarter of 2007 as credit risk emerged in the sub-prime lending sector.
The common assumption that risk has been underpriced, while stated broadly, applies mostly to segments of the fixed income market. The equity market has experienced the opposite, with risk largely overpriced. This has brought on the current wave of leveraged buyouts, debt-financed corporate mergers and debt-financed special dividends—exactly what should happen. We expect it to continue until debt and equity markets reflect a similar view of the future, an event at least as likely to come by way of higher stock prices as by lower bond prices.
To be sure, segments of the equity market, notably stocks of companies heavily involved in high-risk lending, experienced sharp declines and a few bankruptcies. This is normal and necessary in a well-functioning market where businesses, taking on undue risk and betting incorrectly, lose. Left to its own devices, the still inexpensive, broader equity market is likely to rise to levels consistent with the favorable long-term conditions of low inflation and high profitability.
Winners, losers and new additions combined to push the Fund ahead nicely for the past twelve months, roughly in line with broad market measures though behind the Russell Mid-Cap Value Index, which bested nearly all categories with over a 17% return. Divergence from the benchmark is common given the Fund’s relative concentration and emphasis on companies undergoing change, though we prefer it more when the Fund diverges positively from the benchmark as opposed to lagging. Nonetheless, the Fund’s annual performance relative to the index is not surprising considering the pervasive emphasis on near-term risk, which we are willing to bear, in the most recent quarter.
Performance Attribution
The Fund benefited from heightened deal making and debt-financed dividends. The acquisition of Symbol Technologies by Motorola closed in the past quarter. Dean Foods and Health Management Associates raised substantial cash from debt offerings and paid special dividends to shareholders, with the stocks reacting favorably to the distributions. A number of other holdings seem primed to take similar action or be acquired outright.
The strongest performer in the Fund for the year was Mastercard, purchased on its attractively priced initial public offering in the summer, which rose 177%. Other strong performers for the past twelve months were Kennametal, Tempur-Pedic, Sherwin Williams, First Marblehead and Echostar. Kennametal fits well with our strategy of investing in good businesses in the midst of substantial transitions and with attractively valued stocks. Kennametal’s management is moving the company from a largely commodity-focused manufacturing and distribution business toward a higher-margin, faster-growing, advanced materials business. Continued progress and a well-received tuck-in acquisition propelled the stock, which is up nicely since being added to the portfolio six months ago.
15
EXCELSIOR FUNDS TRUST | MID CAP VALUE AND RESTRUCTURING FUND |
Conversely, International Coal and Centex weighed on portfolio results. International Coal Group disappointed after numerous setbacks on both mining and operational fronts delayed fundamental improvement. The stock was sold from the portfolio. The Fund’s small remaining investment in homebuilder Centex was down as further malaise set in to the housing market.
Portfolio Activity
Oshkosh Truck, a company we have long admired, was added to the portfolio following its acquisition of JLG Industries, another company we nearly purchased many times. Management of Oshkosh has a long history of levering the company’s balance sheet in order to make sizeable acquisitions. With strong cash flow, the company has always improved its debt position following acquisitions and integrated new companies well. We expect similar results this time and believe there are plentiful opportunities for the combined company to grow revenues and increase margins. The stock’s decline in advance of the merger precipitated our purchase.
E*Trade, Leucadia National and Progressive were all added to the portfolio in the last three months. E*Trade is undergoing a rapid transition from a broker-focused earnings model to a fuller financial services franchise, while producing strong margin improvement and growth in the process. The Fund has owned both Progressive and Leucadia in the past, with good results. We re-purchased Progressive near its lowest price to book in 10 years and at a roughly 10% earnings yield. Progressive generates very high returns on equity and excellent underwriting margins; and while near-term results may be pressured, long-term returns may have potential to be excellent.
Funding for the new purchases came from sales of Sovereign Bancorp, Zale Corp, Blockbuster, Callaway Golf and Doral Financial. Sovereign stock rallied nicely under pressure from activist shareholders. Stock of Zale rose as consumers proved more resilient than many had expected. Neither stock represented particularly strong value any longer when compared to alternatives. The sale of Zale also reduced the portfolio’s retail exposure a bit.
Outlook
The Fund continues to display the attractive valuation and fundamental characteristics that mark our way of investing. The median stock in the portfolio sells at 14× expected earnings, 10× cash flow and 2.4× book value, all discounts to market benchmarks despite attractive earnings growth forecasts and high levels of profitability. There is plenty of evidence suggesting choppy waters ahead. If a liquidity crunch in credit markets occurs, it will take a heavy toll on equity markets in the short term—but that is far from a foregone conclusion. Over an extended horizon, we expect the trend in stock prices to be up. The Fund is invested as such and so represents very good value in our estimation.
Tim Evnin
Managing Director and Senior Portfolio Manager
John McDermott, CFA
Managing Director and Senior Portfolio Manager
16
EXCELSIOR FUNDS TRUST | MID CAP VALUE AND RESTRUCTURING FUND |
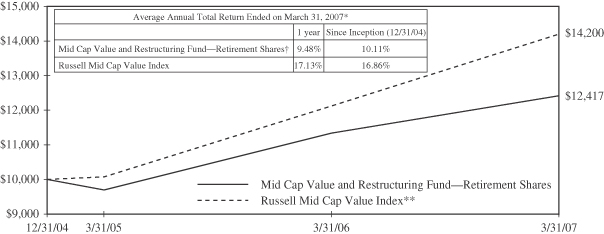
Past performance is not predictive of future performance. Investment returns and principal values will vary and shares may be worth more or less at redemption than their original cost.
The above illustration compares a $10,000 investment made in the Fund and a broad-based index since 12/31/04 (inception date). The chart assumes all dividends and capital gain distributions are reinvested. The Fund’s performance takes into account fees and expenses. The index does not take into account charges, fees and other expenses. Further information relating to Fund performance is contained in the Financial Highlights section of the Prospectus and elsewhere in this report.
| | | |
| | |
Expense Ratio | | | |
| (As of 7/31/06) | | Shares | |
Gross Expense Ratio | | 1.46 | % |
This information is included in the most current prospectus available to current and prospective shareholders of the Fund. The Adviser has contractually agreed to waive fees or reimburse expenses in order to keep total operating expenses from exceeding 1.64%. The waiver agreement may not be terminated before July 31, 2007. In addition, this agreement will renew automatically for an additional 12 month term unless the Adviser terminates the agreement by providing written notice to the Fund prior to the expiration of the current term.
| * | | Total return represents the change during the period in a hypothetical account with dividends reinvested. |
| ** | | Source: Frank Russell Company—The Russell Mid Cap Value Index measures the performance of medium-sized value-oriented securities. |
| † | | Certain fees may be waived. Had certain fees not been waived, returns would have been lower. Returns do not reflect the deduction of taxes that a shareholder would pay on Fund distributions or the redemption of shares. Returns do not reflect the 2% fee imposed on shares redeemed 30 days or less after their date of purchase. |
17
EXCELSIOR FUNDS, INC. | SMALL CAP FUND |
Performance Summary
For the Excelsior Small Cap Fund, results for the fiscal year ended March 31, 2007, came in well ahead of the Russell 2000 Index.
The year can best be characterized as highly volatile, given the summer’s 10% correction and February 27, 2007 sell-off that seemed to hit most equity asset classes in the same way, with declines of 3%-4%. The Fund’s investment program, however, always centers on stock selection rather than market calls; as a result, we had a handful of significant contributors that overpowered a relatively few laggards.
The enduring run in the small-cap asset class is now in its ninth year of outperformance relative to large stocks, as identified by the S&P 500 Index. For those attempting to time a switch from “small” to “large” to achieve relative performance, it has been a tough call. Obviously, the longer the run lasts, the more likely it is to turn at some point, but our valuation work and studies of other small cap cycles continue to be inconclusive in divining a locus in this cycle. Meanwhile, the combined effects of excess liquidity, driven by hedge funds and private equity partnerships, and the powerful trends of mergers, acquisitions and management-led buyouts should contribute to the drive of small companies in 2007 or at a minimum put a floor under the asset class. For our part, we just do what we do and try to be astute about it. Compared with many of our peers, the Excelsior Small Cap Fund holds relatively few positions, at 30. If and when a turn occurs, larger portfolios will reflect merely a call on the assets class. Our limited, stock-focused, approach should clearly differentiate our effort, for better or worse.
This is an interesting time. In the corporate real estate market, we witnessed a battle between Blackstone Group and Vornado Properties to overpay for the REIT, Equity Office Properties. When the smoke cleared, the new owner had paid an historically low “cap” rate and an historically high dollar price—this after a six-year period of outperformance by the entire sector. Today’s valuations do not leave much room for the little calamities that visit from time to time—lenders tightening standards (post the sub-prime mortgage sector collapse), higher long-term interest rates as the yield curve returns to its normal shape, a tenant going broke, etc. Elsewhere a private equity firm, Fortress Group, had its initial public offering; on the basis of a price-to-earnings metric, breathless new investors priced it at twice the valuation of Goldman Sachs, an excellent company with a hundred-year history that does many of the same things Fortress does and many other things as well. Another interesting headline was seen in the Wall Street Journal on April 2, 2007: “Eager Investors Lift Margin Debt To New Heights”. We are not bearish, but we are alert to extremes in the system that could produce some unhappy results.
Performance Attribution
Viewing the account-specific analysis, we will first look at annual attribution. While most economic sectors within the portfolio were positive, our most significant overweighted commitments to the consumer discretionary, industrials, and information technology sectors collaborated to provide returns in excess of the index’s return. Our largest underweighted sectors were consumer staples, health care, finance, and materials. Between these major over/under weighted sectors, we deployed capital fairly efficiently in the fiscal year as the decision to overweight one sector at the expense of another was additive.
18
EXCELSIOR FUNDS, INC. | SMALL CAP FUND |
Stock-by-stock contribution was diverse by sector or theme; however, technology had the most representatives with CommScope (coaxial cable), Varian Semiconductor (up 90% in the fiscal year), FLIR (infrared cameras), Manhattan Associates (warehouse/inventory management software), Forrester Research (independent market and technology application), and Innovative Solutions (flat panel avionics displays; up approximately 75% in the fiscal year). Other significant contributors rounding out the top ten were long-term holdings Sotheby’s (the auction house), Kansas City Southern Railway, Quanta Services (electric and cable transmission), and Philadelphia Consolidated Insurance (niche property and casualty insurance).
The specific detractors were difficult to pin down by sector. NYSE market maker firm LaBranche and CACI Corp were the most notable detractors. In technology, Keane (information technology), Cabot Microdevices (semiconductor polishing), and Power Integrated Devices (energy saving microchips) all had a negative impact on annual returns. Others included Simpson Manufacturing (building related), and Thor Industries (RVs).
Portfolio Activity
For the year, the Fund saw little major activity. We sold outright our long-term position in Park National Corp. While Park has produced outstanding operating results, it operates in no-to-declining growth markets in Ohio. The combination of low revenue growth and an inverted curve has made earnings growth a challenge. Also eliminated was another longtime holding, CACI Corp. This provider of information technology services, primarily to the U.S. government, has seen project funding dry up as the Iraq War has subsumed available resources. Earnings growth has gone from flat to down. Elsewhere, EGL Logistics is the object of a management/private equity buyout, and Keane is in the process of being acquired by Caritor.
Outlook
We have never been inclined to make directional market projections, but rather seek individual investments that we believe represent low risk and above-average potential reward—as identified by a set of financial statistics, strong beliefs, fundamental principles, and judgment. This approach has served our investors well. On that count, we seek to continue to find many new and exciting companies that should contribute to performance in the quarters and years ahead.
Douglas H. Pyle
Managing Director and Senior Portfolio Manager
19
EXCELSIOR FUNDS, INC. | SMALL CAP FUND |
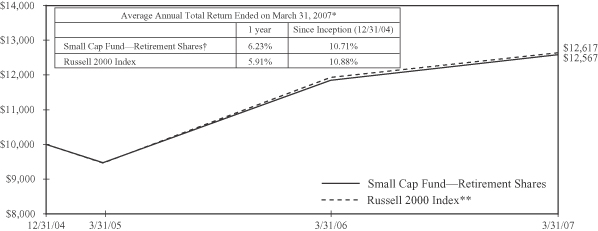
Past performance is not predictive of future performance. Investment returns and principal values will vary and shares may be worth more or less at redemption than their original cost. There is greater volatility associated with an investment in the Small Cap Market.
The above illustration compares a $10,000 investment made in the Fund and a broad-based index since 12/31/04 (inception date). The chart assumes all dividends and capital gain distributions are reinvested. The Fund’s performance takes into account fees and expenses. The index does not take into account charges, fees and other expenses. Further information relating to Fund performance is contained in the Financial Highlights section of the Prospectus and elsewhere in this report.
| | | |
| | |
Expense Ratio | | | |
| (As of 7/31/06) | | Shares | |
Gross Expense Ratio | | 1.71 | % |
This information is included in the most current prospectus available to current and prospective shareholders of the Fund. The Adviser has contractually agreed to waive fees or reimburse expenses in order to keep total operating expenses from exceeding 1.75%. The waiver agreement may not be terminated before July 31, 2007. In addition, this agreement will renew automatically for an additional 12 month term unless the Adviser terminates the agreement by providing written notice to the Fund prior to the expiration of the current term.
| * | | Total return represents the change during the period in a hypothetical account with dividends reinvested. |
| ** | | Source: Frank Russell Company—The Russell 2000 Index is an unmanaged index and is composed of the 2,000 smallest companies in the Russell 3000 Index. The Russell 3000 Index is composed of 3,000 of the largest U.S. companies by market capitalization. The index includes dividends reinvested. |
| † | | Certain fees may be waived. Had certain fees not been waived, returns would have been lower. Returns do not reflect the deduction of taxes that a shareholder would pay on Fund distributions or the redemption of shares. Returns do not reflect the 2% fee imposed on shares redeemed 30 days or less after their date of purchase. |
20
EXCELSIOR FUNDS, INC. | VALUE AND RESTRUCTURING FUND |
Performance Summary
This year’s performance results were in many respects a replay of last year’s. In both years, purveyors of industrial commodities, especially those driving growth in the emerging markets, were where the action was and a meaningful contributor to the Fund’s gains. That said, it has been an increasingly difficult environment for low P/E stocks, our bread-and-butter in terms of investing. With all the talk about slowing economic growth and decelerating earnings, perhaps this should have come as no surprise, as our companies typically carry more financial and operating risk. Moreover, tactically we are focused in the more cyclical sectors of the S&P 500 universe, which bore the brunt of a second-half 2006 sell-off in anticipation of these slowing trends. Our dilemma is, that these very sectors generally still offer investors substantial long term value and are often undergoing solid restructuring trends, which we find so attractive.
The other major performance contributor was from the unusually high level of merger and acquisition (M&A) activity. This trend has shown little sign of abating because stocks remain at attractive valuation levels and because corporations and large investors are flush with cash and looking for enhanced productivity and oversized returns. The Fund has been a continued beneficiary of buyouts because we seek out undervalued companies where management actions, either through restructuring or M&A activity, can create shareholder value.
The combination of these two dominant trends in the stock market helped provide a solid gain for the Fund, which was in line with the S&P 500 Index over the past twelve months but behind the Russell 1000 Value Index.
Performance Attribution
Copper producer Southern Copper Corporation and its majority stock owner Grupo Mexico were among the best performers. Southern Copper has gained approximately 89% in the past twelve months; Grupo Mexico has surged since we purchased it late last year. In addition, both companies pay very attractive dividends, with yields of approximately 9% and 4%, respectively. Although quite volatile and unpredictable, copper prices are expected to continue easing this year and next, mitigating against continued outsized stock price gains.
Two companies with worldwide operations benefited from the strong global trends mentioned above. Tractor manufacturer AGCO Corporation and chemical company Celanese both continued their year-end surge, gaining close to 80% and 50%, respectively, during the past twelve months. We think AGCO discounts much of the strength in tractor sales while Celanese still appears undervalued, even after the Dutch auction buyback of shares by the company.
Performance bright spots during the past year also included some of our Latin American and financial stocks. Copa Holdings, a Pan-American airline, gained over 130%; Mexican cellular provider America Movil, our largest holding, continued its performance tear, gaining 41%. Mastercard, purchased at its initial public offering in May, gained 177%.
21
EXCELSIOR FUNDS, INC. | VALUE AND RESTRUCTURING FUND |
On the downside, Centex was one of the biggest disappointments during the past twelve months, losing more than a quarter of its value. This was especially painful since it remains such a large holding in the Fund. At these levels, the stock sells at adjusted tangible book value and amply discounts the deep slide in homebuilding. We believe book value offers strong downside protection for such a solid company, which should perform much better as the inventory of unsold homes is depleted.
Other detractors to performance were some repeat losers, including International Coal, Plantronics and XM Satellite Radio. We added shares to each of these companies with the expectation of better prices concomitant with improving fundamentals.
Portfolio Activity
During the year we upgraded quality in the portfolio by eliminating companies with weaker fundamentals and/or less attractive valuations. These included Doral, CF Industries, Deluxe Corp. and Interpublic Group. With the proceeds we added new companies to the portfolio, including Capital One Financial, Murphy Oil, Schnitzer Steel and Smurfit-Stone. We view Capital One’s acquisition of North Fork Bancorp positively and multiple enhancing for its stock longer term. The other companies, selling oil, steel and scrap, and boxes, respectively, are direct beneficiaries of the global growth phenomenon driving our economy and the stock market. We like their businesses, management savvy, and current valuation characteristics, and believe they fit in nicely with our philosophy of finding companies that are either restructuring or in consolidating industries and with long term value appeal.
Outlook
As we near the “sell in May and go away” seasonally weak period for the stock market, we are keeping our fingers crossed that the Fund can sustain its absolute and relative gains through the summer. If Fed funds rates are reduced sooner rather than later, it should. If worries about sub-prime lending, surging inflation and housing woes deepen, market volatility will probably continue. A rate cut will be especially beneficial to the Fund because of our overweighting in the cyclical and financial sectors of the market. On the other hand, the weakness in the economy that would likely precipitate such a rate reduction could be particularly detrimental to these same sectors. So a continuation of the “Goldilocks” economy is our hope. At this point, we believe this is the most likely outcome.
We are in our fifteenth year of investing in companies undergoing some form of restructuring or industry consolidation. We buy these companies when we believe they are undervalued and sell them when they no longer appear cheap. Today’s portfolio, we believe, possesses much the same value characteristics as it has for the previous fourteen years. The median company sells at less than 11 times price to cash flow, versus 12.4× for the S&P 500, and at a little more than 15× expected 2007 earnings, also a discount to the S&P 500 multiple. Yet the companies in the Fund are expected next year to have earnings growth much higher than that of the S&P 500, and with higher ROE’s (Return on Equity).
David J. Williams, CFA
Managing Director and Senior Portfolio Manager
22
EXCELSIOR FUNDS, INC. | VALUE AND RESTRUCTURING FUND |
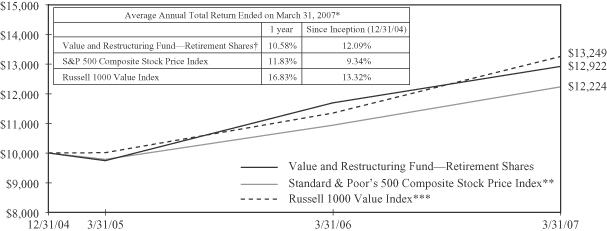
Past performance is not predictive of future performance. Investment returns and principal values will vary and shares may be worth more or less at redemption than their original cost.
The above illustration compares a $10,000 investment made in the Fund and a broad-based index since 12/31/04 (inception date). The chart assumes all dividends and capital gain distributions are reinvested. The Fund’s performance takes into account fees and expenses. The index does not take into account charges, fees and other expenses. Further information relating to Fund performance is contained in the Financial Highlights section of the Prospectus and elsewhere in this report.
| | | |
| | |
Expense Ratio | | | |
| (As of 7/31/06) | | Shares | |
Gross Expense Ratio | | 1.56 | % |
This information is included in the most current prospectus available to current and prospective shareholders of the Fund. The Adviser has contractually agreed to waive fees or reimburse expenses in order to keep total operating expenses from exceeding 1.64%. The waiver agreement may not be terminated before July 31, 2007. In addition, this agreement will renew automatically for an additional 12 month term unless the Adviser terminates the agreement by providing written notice to the Fund prior to the expiration of the current term.
| * | | Total return represents the change during the period in a hypothetical account with dividends reinvested. |
| ** | | Source: Standard & Poor’s Corporation—Reflects the reinvestment of income dividends and, where applicable, capital gain distributions. The Standard & Poor’s 500 Composite Stock Price Index is a widely accepted unmanaged index of U.S. stock market performance. |
| *** | | Source: Frank Russell Company—The Russell 1000 Value Index is an unmanaged index composed of those Russell 1000 Index companies with lower price-to-book ratios and lower forecasted growth values. The Russell 1000 Index is composed of the 1000 largest companies in The Russell 3000 Index which is composed of 3,000 of the largest U.S. companies by market capitalization. The Index includes dividends reinvested. |
| † | | Certain fees may be waived. Had certain fees not been waived, returns would have been lower. Returns do not reflect the deduction of taxes that a shareholder would pay on Fund distributions or the redemption of shares. Returns do not reflect the 2% fee imposed on shares redeemed 30 days or less after their date of purchase. |
23
Excelsior Funds, Inc.
Portfolio of Investments — March 31, 2007
Core Bond Fund
| | | | | | | | | | | |
Principal
Amount | | | | Rate | | | Maturity
Date | | Value |
| | | | | | | | | | | |
| | ASSET BACKED SECURITIES — 0.77% |
| $ | 4,200,000 | | Capital Auto Receivables Asset Trust, 2006-SN1AC B(a) | | 5.50 | % | | 04/20/10 | | $ | 4,220,546 |
| | | | | | | | | | | |
| | | TOTAL ASSET BACKED SECURITIES
(Cost $4,199,070) | | | 4,220,546 |
| | | | | | | | | | | |
| | COLLATERALIZED MORTGAGE OBLIGATIONS — 7.74% |
| | | NON-GOVERNMENTAL AGENCY COLLATERALIZED MORTGAGE OBLIGATIONS — 6.71% |
| | 581,837 | | Bear Stearns Adjustable Rate Mortgage Trust, 2004-10, 15A1(b) | | 4.50 | | | 01/25/35 | | | 574,878 |
| | 1,970,974 | | Citigroup Mortgage Loan Trust, 2004-HYB4 WA(b) | | 4.46 | | | 12/25/34 | | | 1,947,220 |
| | 3,066,439 | | Countrywide Alternative Loan Trust, 2004-16CB 1A2 | | 5.50 | | | 07/25/34 | | | 3,034,154 |
| | 1,840,406 | | Countrywide Alternative Loan Trust, 2004-22CB 1A1 | | 6.00 | | | 10/25/34 | | | 1,845,870 |
| | 8,256,407 | | Indymac Index Mortgage Loan Trust, 2004-AR4 3A(b) | | 4.74 | | | 08/25/34 | | | 8,239,692 |
| | 7,906,553 | | JP Morgan Mortgage Trust, 2005-A6 1A1(b) | | 5.15 | | | 09/25/35 | | | 7,834,919 |
| | 10,915,388 | | Wells Fargo Mortgage Backed Securities Trust, 2004-EE 3A1 | | 3.99 | | | 12/25/34 | | | 10,709,611 |
| | 2,852,286 | | Wells Fargo Mortgage Backed Securities Trust, 2005-AR1 1A1(b) | | 5.54 | | | 02/25/35 | | | 2,806,770 |
| | | | | | | | | | | |
| | | | | | | | | | | 36,993,114 |
| | | | | | | | | | | |
| | | FEDERAL HOME LOAN MORTGAGE CORPORATION — 0.48% |
| | 2,580,601 | | 2333 UZ | | 6.50 | | | 07/15/31 | | | 2,644,186 |
| | | | | | | | | | | |
| | | FEDERAL NATIONAL MORTGAGE
ASSOCIATION — 0.55% |
| | 3,080,000 | | 2003-17 QT | | 5.00 | | | 08/25/27 | | | 3,058,976 |
| | | | | | | | | | | |
| | | TOTAL COLLATERALIZED MORTGAGE OBLIGATIONS
(Cost $43,170,173) | | | 42,696,276 |
| | | | | | | | | | | |
| | | | | | | | | | | |
Principal
Amount | | | | Rate | | | Maturity
Date | | Value |
| | | | | | | | | | | |
| | COMMERCIAL MORTGAGE-BACKED SECURITIES — 11.77% |
| $ | 4,225,000 | | Asset Securitization Corp., 1997-D4 A4(b) | | 7.26 | % | | 04/14/29 | | $ | 4,443,489 |
| | 2,497,000 | | Bank of America Commercial Mortgage, Inc., 2004-1 A4 | | 4.76 | | | 11/10/39 | | | 2,426,294 |
| | 5,000,000 | | Bear Stearns Commercial Mortgage Securities, 2006-PW13 A3(b) | | 5.52 | | | 09/11/41 | | | 5,064,335 |
| | 1,000,000 | | Credit Suisse First Boston Mortgage Securities Corp., 2002-CKS4 G(a)(b) | | 6.01 | | | 11/15/36 | | | 1,026,906 |
| | 1,781,000 | | GMAC Commercial Mortgage Securities, 1999-C1(b) | | 6.84 | | | 05/15/33 | | | 1,832,944 |
| | 3,449,000 | | Greenwich Capital Commercial Funding Corp., 2004-GG1 A1 | | 5.32 | | | 06/10/36 | | | 3,460,227 |
| | 3,150,000 | | Morgan Stanley Dean Witter Capital I, 2000-LIF2 C | | 7.50 | | | 10/15/33 | | | 3,370,250 |
| | 1,245,000 | | Morgan Stanley Dean Witter Capital I, 2003-TOP9 A2 | | 4.74 | | | 11/13/36 | | | 1,217,836 |
| | 5,571,000 | | Nomura Asset Securities Corp., 1998-D6 A4(b) | | 6.91 | | | 03/15/30 | | | 6,266,777 |
| | 4,225,000 | | Wachovia Bank Commercial Mortgage Trust, 2002-C1 A4 | | 6.29 | | | 04/15/34 | | | 4,427,224 |
| | 3,601,000 | | Wachovia Bank Commercial Mortgage Trust, 2003-C9 A3 | | 4.61 | | | 12/15/35 | | | 3,535,827 |
| | 6,099,000 | | Wachovia Bank Commercial Mortgage Trust, 2004-C12 A2 | | 5.00 | | | 07/15/41 | | | 6,069,355 |
| | 3,905,000 | | Wachovia Bank Commercial Mortgage Trust, 2004-C12 A3 | | 5.23 | | | 07/15/41 | | | 3,917,688 |
| | 17,926,000 | | Wachovia Bank Commercial Mortgage Trust, 2005-C20 A5 | | 5.09 | | | 07/15/42 | | | 17,862,640 |
| | | | | | | | | | | |
| | | TOTAL COMMERCIAL MORTGAGE-BACKED SECURITIES
(Cost $65,218,292) | | | 64,921,792 |
| | | | | | | | | | | |
See Notes to Financial Statements.
24
Excelsior Funds, Inc.
Portfolio of Investments — March 31, 2007
Core Bond Fund — (continued)
| | | | | | | | | | | |
Principal
Amount | | | | Rate | | | Maturity
Date | | Value |
| | | | | | | | | | | |
| | CORPORATE BONDS — 17.21% |
| $ | 2,665,000 | | Alcan, Inc. | | 5.00 | % | | 06/01/15 | | $ | 2,556,172 |
| | 2,615,000 | | America Movil S.A. de C.V. | | 5.50 | | | 03/01/14 | | | 2,586,792 |
| | 955,000 | | America Movil S.A. de C.V. | | 6.38 | | | 03/01/35 | | | 940,731 |
| | 5,700,000 | | Bank One Corp. | | 7.88 | | | 08/01/10 | | | 6,168,494 |
| | 4,000,000 | | Barlcays Bank plc(a)(b) | | 5.93 | | | 12/31/49 | | | 4,004,312 |
| | 3,245,000 | | Bear Stearns Co., Inc. | | 5.70 | | | 11/15/14 | | | 3,273,712 |
| | 5,520,000 | | Bottling Group LLC | | 5.50 | | | 04/01/16 | | | 5,551,072 |
| | 2,300,000 | | British Telecommunications plc | | 8.88 | | | 12/15/30 | | | 3,157,930 |
| | 2,000,000 | | Caterpillar, Inc. | | 5.70 | | | 08/15/16 | | | 2,040,552 |
| | 2,000,000 | | Citigroup, Inc. | | 4.25 | | | 07/29/09 | | | 1,967,694 |
| | 1,441,000 | | Comcast Cable Communications | | 6.88 | | | 06/15/09 | | | 1,491,932 |
| | 1,441,000 | | DaimlerChrysler N.A. Holding Corp. | | 7.20 | | | 09/01/09 | | | 1,504,165 |
| | 2,000,000 | | Deutsche Telekom International Finance | | 5.38 | | | 03/23/11 | | | 2,011,018 |
| | 1,310,000 | | Deutsche Telekom International Finance, Multi-Coupon Bond | | 8.00 | | | 06/15/10 | | | 1,420,061 |
| | 1,500,000 | | Deutsche Telekom International Finance, Multi-Coupon Bond | | 8.25 | | | 06/15/30 | | | 1,857,987 |
| | 1,700,000 | | Ford Motor Credit Co. | | 8.63 | | | 11/01/10 | | | 1,734,886 |
| | 2,000,000 | | General Electric Capital Corp. MTN | | 6.00 | | | 06/15/12 | | | 2,078,068 |
| | 1,400,000 | | General Electric Captial Corp. | | 5.00 | | | 11/15/11 | | | 1,395,871 |
| | 5,834,000 | | Household Finance Corp. | | 8.00 | | | 07/15/10 | | | 6,323,892 |
| | 1,388,000 | | JP Morgan Chase & Co. | | 5.75 | | | 01/02/13 | | | 1,423,488 |
| | 2,000,000 | | Lehman Brothers Holdings, Inc. | | 5.75 | | | 01/03/17 | | | 2,004,138 |
| | 885,000 | | Metlife, Inc. | | 5.00 | | | 11/24/13 | | | 876,299 |
| | 2,000,000 | | Morgan Stanley | | 6.75 | | | 04/15/11 | | | 2,115,350 |
| | 685,000 | | Nisource Finance Corp. | | 5.25 | | | 09/15/17 | | | 646,955 |
| | 3,825,000 | | Oracle Corp. | | 5.25 | | | 01/15/16 | | | 3,771,844 |
| | 1,441,000 | | Prudential Financial, Inc. | | 5.10 | | | 09/20/14 | | | 1,414,409 |
| | 4,500,000 | | RBS Capital Trust III(b)(c) | | 5.51 | | | 09/30/14 | | | 4,427,483 |
| | 1,670,000 | | Sprint Capital Corp.(d) | | 8.75 | | | 03/15/32 | | | 1,969,797 |
| | 4,100,000 | | Target Corp. | | 5.88 | | | 07/15/16 | | | 4,219,195 |
| | 2,600,000 | | TCI Communications, Inc. | | 9.80 | | | 02/01/12 | | | 3,078,156 |
| | | | | | | | | | | |
Principal
Amount | | | | Rate | | | Maturity
Date | | Value |
| | | | | | | | | | | |
| | CORPORATE BONDS — (continued) |
| $ | 2,183,000 | | Time Warner Cos., Inc. | | 7.25 | % | | 10/15/17 | | $ | 2,409,853 |
| | 2,000,000 | | UBS Preferred Funding Trust I | | 8.62 | | | 10/29/49 | | | 2,210,662 |
| | 2,441,000 | | Wal-Mart Stores, Inc. | | 4.13 | | | 02/15/11 | | | 2,365,151 |
| | 1,735,000 | | Wal-Mart Stores, Inc. | | 5.00 | | | 04/05/12 | | | 1,728,492 |
| | 5,350,000 | | Wells Fargo & Co. | | 5.00 | | | 11/15/14 | | | 5,196,273 |
| | 950,000 | | Xerox Corp. | | 6.40 | | | 03/15/16 | | | 977,099 |
| | 2,000,000 | | YUM! Brands, Inc. | | 6.25 | | | 04/15/16 | | | 2,055,456 |
| | | | | | | | | | | |
| | | TOTAL CORPORATE BONDS
(Cost $93,910,972) | | | 94,955,441 |
| | | | | | | | | | | |
| | TAX-EXEMPT SECURITIES — 0.32% |
| | 1,590,000 | | Massachusetts Bay Transition Authority, Massachusetts Sales Tax, Revenue Bonds, Series A | | 5.00 | | | 07/01/31 | | | 1,761,561 |
| | | | | | | | | | | |
| | | TOTAL TAX-EXEMPT SECURITIES (Cost $1,753,931) | | | 1,761,561 |
| | | | | | | | | | | |
| | U.S. GOVERNMENT AGENCY BONDS & NOTES — 2.38% |
| | | FANNIE MAE — 1.43% | | | |
| | 7,500,000 | | MTN | | 6.25 | | | 02/01/11 | | | 7,867,613 |
| | | | | | | | | | | |
| | | FREDDIE MAC — 0.50% | | | |
| | 2,440,000 | | | | 6.25 | | | 07/15/32 | | | 2,779,167 |
| | | | | | | | | | | |
| | | RESOLUTION FUNDING
CORPORATION — 0.45% |
| | 4,851,000 | | Principal Only STRIPS(e) | | 0.00 | | | 07/15/20 | | | 2,475,984 |
| | | | | | | | | | | |
| | | TOTAL U.S. GOVERNMENT AGENCY BONDS & NOTES
(Cost $12,830,645) | | | 13,122,764 |
| | | | | | | | | | | |
| U.S. GOVERNMENT AGENCY MORTGAGE PASS THROUGH
SECURITIES — 39.55% |
| | | FEDERAL HOME LOAN MORTGAGE
CORPORATION — 10.62% |
| | 6,330,169 | | Pool # 1G1898 ARM(b) | | 5.92 | | | 06/01/36 | | | 6,371,234 |
| | 2,546,198 | | Pool # A20105 | | 5.00 | | | 04/01/34 | | | 2,465,415 |
| | 9,347,243 | | Pool # A47411 | | 4.50 | | | 10/01/35 | | | 8,790,449 |
| | 2,294,453 | | Pool # A48132 | | 7.00 | | | 12/01/35 | | | 2,367,650 |
| | 5,494,792 | | Pool # B19861 | | 4.50 | | | 08/01/20 | | | 5,320,510 |
| | 2,721,826 | | Pool # C01811 | | 5.00 | | | 04/01/34 | | | 2,635,471 |
| | 130,854 | | Pool # C71221 | | 5.00 | | | 09/01/32 | | | 126,844 |
| | 20,702 | | Pool # C74339 | | 5.00 | | | 12/01/32 | | | 20,068 |
| | 162,308 | | Pool # C74469 | | 5.00 | | | 12/01/32 | | | 157,334 |
| | 32,310 | | Pool # C74676 | | 5.00 | | | 12/01/32 | | | 31,319 |
| | 2,320,547 | | Pool # E96460 | | 5.00 | | | 05/01/18 | | | 2,294,384 |
| | 4,527,416 | | Pool # G01842 | | 4.50 | | | 06/01/35 | | | 4,257,728 |
| | 18,109,227 | | Pool # G18105 | | 5.00 | | | 03/01/21 | | | 17,859,820 |
| | 2,496,422 | | Pool # J01383 | | 5.50 | | | 03/01/21 | | | 2,501,698 |
| | 3,518,057 | | Pool # J02497 | | 4.50 | | | 09/01/20 | | | 3,406,473 |
| | | | | | | | | | | |
| | | | | | | | | | | 58,606,397 |
| | | | | | | | | | | |
See Notes to Financial Statements.
25
Excelsior Funds, Inc.
Portfolio of Investments — March 31, 2007
Core Bond Fund — (continued)
| | | | | | | | | | | |
Principal
Amount | | | | Rate | | | Maturity
Date | | Value |
| | | | | | | | | | | |
| U.S. GOVERNMENT AGENCY MORTGAGE PASS THROUGH
SECURITIES — (continued) |
| | | FEDERAL NATIONAL MORTGAGE ASSOCIATION — 26.85% |
| $ | 203,140 | | Pool # 251502 | | 6.50 | % | | 02/01/13 | | $ | 208,079 |
| | 84,901 | | Pool # 252806 | | 7.50 | | | 10/01/29 | | | 88,996 |
| | 1,197,709 | | Pool # 255896 | | 6.50 | | | 08/01/35 | | | 1,222,557 |
| | 5,032,302 | | Pool # 256269 | | 5.50 | | | 06/01/36 | | | 4,979,818 |
| | 10,462,685 | | Pool # 357824 | | 5.50 | | | 06/01/35 | | | 10,363,931 |
| | 1,232,108 | | Pool # 387203 | | 4.80 | | | 01/01/12 | | | 1,220,457 |
| | 1,052,084 | | Pool # 387204 | | 4.80 | | | 01/01/12 | | | 1,042,136 |
| | 220,898 | | Pool # 443194 | | 5.50 | | | 10/01/28 | | | 219,820 |
| | 3,905 | | Pool # 450846 | | 5.50 | | | 12/01/28 | | | 3,886 |
| | 342,368 | | Pool # 452035 | | 5.50 | | | 11/01/28 | | | 340,697 |
| | 2,306 | | Pool # 454758 | | 5.50 | | | 12/01/28 | | | 2,295 |
| | 580,710 | | Pool # 561435 | | 5.50 | | | 11/01/29 | | | 577,876 |
| | 303,582 | | Pool # 578543 | | 5.50 | | | 04/01/31 | | | 301,098 |
| | 112,425 | | Pool # 627259 | | 5.50 | | | 02/01/32 | | | 111,518 |
| | 963,020 | | Pool # 632551 | | 5.50 | | | 02/01/32 | | | 955,252 |
| | 527,269 | | Pool # 632576 | | 5.50 | | | 02/01/32 | | | 522,955 |
| | 224,747 | | Pool # 694655 | | 5.50 | | | 04/01/33 | | | 222,905 |
| | 1,585,620 | | Pool # 702861 | | 5.00 | | | 04/01/18 | | | 1,567,896 |
| | 1,446,560 | | Pool # 704440 | | 5.00 | | | 05/01/18 | | | 1,430,391 |
| | 63,525 | | Pool # 710585 | | 5.50 | | | 05/01/33 | | | 63,004 |
| | 374,864 | | Pool # 735224 | | 5.50 | | | 02/01/35 | | | 371,792 |
| | 5,754,009 | | Pool # 745275 | | 5.00 | | | 02/01/36 | | | 5,564,857 |
| | 23,425,967 | | Pool # 745432 | | 5.50 | | | 04/01/36 | | | 23,204,855 |
| | 1,038,365 | | Pool # 781859 | | 4.50 | | | 12/01/34 | | | 977,121 |
| | 1,430,339 | | Pool # 786423 ARM(b) | | 4.59 | | | 07/01/34 | | | 1,430,408 |
| | 453,699 | | Pool # 797680 | | 4.50 | | | 10/01/35 | | | 426,940 |
| | 653,931 | | Pool # 805373 | | 4.50 | | | 01/01/35 | | | 615,362 |
| | 6,888,911 | | Pool # 805386 ARM(b) | | 4.86 | | | 01/01/35 | | | 6,887,599 |
| | 753,922 | | Pool # 812268 | | 5.50 | | | 05/01/35 | | | 746,806 |
| | 2,384,829 | | Pool # 815479 | | 4.50 | | | 03/01/35 | | | 2,242,304 |
| | 1,311,382 | | Pool # 819361 | | 4.50 | | | 04/01/35 | | | 1,232,440 |
| | 539,362 | | Pool # 820492 | | 5.50 | | | 05/01/35 | | | 534,271 |
| | 789,575 | | Pool # 820989 | | 5.50 | | | 04/01/35 | | | 782,123 |
| | 743,939 | | Pool # 821567 | | 5.50 | | | 06/01/35 | | | 736,917 |
| | 1,825,542 | | Pool # 822799 | | 4.50 | | | 04/01/35 | | | 1,716,442 |
| | 6,286,038 | | Pool # 829321 | | 4.50 | | | 09/01/35 | | | 5,910,363 |
| | 568,677 | | Pool # 835359 | | 4.50 | | | 09/01/35 | | | 534,691 |
| | 10,562,691 | | Pool # 835751 | | 4.50 | | | 08/01/35 | | | 9,931,429 |
| | 1,876,908 | | Pool # 835760 | | 4.50 | | | 09/01/35 | | | 1,764,738 |
| | 1,946,275 | | Pool # 836512 | | 4.50 | | | 10/01/20 | | | 1,884,356 |
| | 4,297,768 | | Pool # 839240 | | 4.50 | | | 09/01/35 | | | 4,040,919 |
| | 6,727,655 | | Pool # 840687 | | 5.00 | | | 09/01/35 | | | 6,506,496 |
| | 2,818,014 | | Pool # 843510 | | 4.50 | | | 11/01/20 | | | 2,728,362 |
| | 2,389,000 | | Pool # 844085 | | 5.00 | | | 11/01/35 | | | 2,310,466 |
| | 1,856,381 | | Pool # 844797 | | 4.50 | | | 10/01/35 | | | 1,745,438 |
| | 1,895,300 | | Pool # 844901 | | 4.50 | | | 10/01/20 | | | 1,835,003 |
| | 5,733,376 | | Pool # 867438 | | 4.50 | | | 05/01/36 | | | 5,388,279 |
| | 5,280,419 | | Pool # 880084 | | 6.00 | | | 03/01/36 | | | 5,319,669 |
| | 6,234,661 | | Pool # 883084 | | 6.50 | | | 07/01/36 | | | 6,360,137 |
| | 721,630 | | Pool # 893426 | | 6.00 | | | 09/01/36 | | | 726,994 |
| | 3,087,754 | | Pool # 895271 | | 6.50 | | | 09/01/36 | | | 3,149,897 |
| | 15,651,495 | | Pool #745515 | | 5.00 | | | 05/01/36 | | | 15,136,980 |
| | | | | | | | | | | |
| | | | | | | | | | | 148,190,021 |
| | | | | | | | | | | |
| | | | | | | | | | | |
Principal
Amount | | | | Rate | | | Maturity
Date | | Value |
| | | | | | | | | | | |
| U.S. GOVERNMENT AGENCY MORTGAGE PASS THROUGH
SECURITIES — (continued) |
| | | GOVERNMENT NATIONAL MORTGAGE ASSOCIATION — 2.08% |
| $ | 317,132 | | Pool # 2562 | | 6.00 | % | | 03/20/28 | | $ | 322,114 |
| | 427,574 | | Pool # 267812 | | 8.50 | | | 06/15/17 | | | 457,649 |
| | 1,826,845 | | Pool # 3413 | | 4.50 | | | 07/20/33 | | | 1,723,974 |
| | 1,692,191 | | Pool # 3442 | | 5.00 | | | 09/20/33 | | | 1,643,012 |
| | 3,126 | | Pool # 356873 | | 6.50 | | | 05/15/23 | | | 3,212 |
| | 29,602 | | Pool # 434772 | | 9.00 | | | 06/15/30 | | | 32,159 |
| | 62,379 | | Pool # 471660 | | 7.50 | | | 03/15/28 | | | 65,169 |
| | 138,881 | | Pool # 472028 | | 6.50 | | | 05/15/28 | | | 143,024 |
| | 59,613 | | Pool # 475847 | | 6.50 | | | 06/15/28 | | | 61,392 |
| | 20,827 | | Pool # 479087 | | 8.00 | | | 01/15/30 | | | 22,100 |
| | 301,056 | | Pool # 479088 | | 8.00 | | | 01/15/30 | | | 319,463 |
| | 117,882 | | Pool # 503711 | | 7.00 | | | 05/15/29 | | | 123,326 |
| | 41,810 | | Pool # 525556 | | 8.00 | | | 01/15/30 | | | 44,367 |
| | 10,943 | | Pool # 525945 | | 9.00 | | | 07/15/30 | | | 11,888 |
| | 11,128 | | Pool # 532751 | | 9.00 | | | 08/15/30 | | | 12,090 |
| | 107,703 | | Pool # 568670 | | 6.50 | | | 04/15/32 | | | 110,712 |
| | 200,931 | | Pool # 575441 | | 6.50 | | | 12/15/31 | | | 206,730 |
| | 648,104 | | Pool # 598127 | | 5.50 | | | 03/15/18 | | | 652,006 |
| | 1,382,950 | | Pool # 607668 | | 5.50 | | | 02/15/18 | | | 1,391,277 |
| | 804,063 | | Pool # 615639 | | 4.50 | | | 09/15/33 | | | 762,300 |
| | 159,755 | | Pool # 780086 | | 8.50 | | | 11/15/17 | | | 169,766 |
| | 730,469 | | Pool # 780548 | | 8.50 | | | 12/15/17 | | | 776,244 |
| | 558,792 | | Pool # 780865 | | 9.50 | | | 11/15/17 | | | 606,479 |
| | 184,481 | | Pool # 781036 | | 8.00 | | | 10/15/17 | | | 194,274 |
| | 690,973 | | Pool # 781084 | | 9.00 | | | 12/15/17 | | | 739,239 |
| | 178,286 | | Pool # 80185 ARM(b) | | 5.38 | | | 04/20/28 | | | 180,114 |
| | 205,478 | | Pool # 80205 ARM(b) | | 5.38 | | | 06/20/28 | | | 207,590 |
| | 487,576 | | Pool # 80311 ARM(b) | | 5.50 | | | 08/20/29 | | | 492,754 |
| | | | | | | | | | | |
| | | | | | | | | | | 11,474,424 |
| | | | | | | | | | | |
| | | TOTAL U.S. GOVERNMENT AGENCY MORTGAGE PASS THROUGH SECURITIES
(Cost $217,605,864) | | | 218,270,842 |
| | | | | | | | | | | |
| | U.S. GOVERNMENT SECURITIES — 12.34% |
| | | U.S. TREASURY INFLATION PROTECTED
BONDS — 0.86% |
| | 300,000 | | | | 4.25 | | | 01/15/10 | | | 383,812 |
| | 445,000 | | | | 3.50 | | | 01/15/11 | | | 546,429 |
| | 1,050,000 | | | | 2.00 | | | 01/15/14 | | | 1,139,021 |
| | 2,500,000 | | | | 2.38 | | | 01/15/25 | | | 2,702,006 |
| | | | | | | | | | | |
| | | | | | | | | | | 4,771,268 |
| | | | | | | | | | | |
| | | U.S. TREASURY NOTES — 11.48% |
| | 520,000 | | (f) | | 4.63 | | | 09/30/08 | | | 519,147 |
| | 3,970,000 | | | | 3.63 | | | 01/15/10 | | | 3,874,629 |
| | 26,285,000 | | | | 4.50 | | | 11/15/10 | | | 26,264,498 |
| | 24,450,000 | | | | 7.63 | | | 11/15/22 | | | 31,643,654 |
| | 885,000 | | | | 4.50 | | | 02/15/36 | | | 834,389 |
| | 200,000 | | | | 4.75 | | | 02/15/37 | | | 196,875 |
| | | | | | | | | | | |
| | | | | | | | | | | 63,333,192 |
| | | | | | | | | | | |
| | | TOTAL U.S. GOVERNMENT SECURITIES
(Cost $68,307,564) | | | 68,104,460 |
| | | | | | | | | | | |
See Notes to Financial Statements.
26
Excelsior Funds, Inc.
Portfolio of Investments — March 31, 2007
Core Bond Fund — (continued)
| | | | | | | | | |
| Contracts | | | | | | | | Value |
| CALL OPTION PURCHASED — 0.00% |
| 10 | | Euro Dollar Future, Expires 12/17/07 strike price 95.75 | | $ | 1,813 |
| | | | | | | | | |
| | TOTAL CALL OPTION PURCHASED (Cost $3,025) | | | 1,813 |
| | | | | | | | | |
| Shares | | | | | | | | |
| REGISTERED INVESTMENT COMPANIES — 7.67% |
| 21,150,173 | | Dreyfus Government Cash Management Fund | | | 21,150,173 |
| 21,150,172 | | Fidelity U.S. Treasury II Fund | | | 21,150,172 |
| | | | | | | | | |
| | TOTAL REGISTERED INVESTMENT COMPANIES
(Cost $42,300,345) | | | 42,300,345 |
| | | | | | | | | |
| | | | | | | | | | |
TOTAL INVESTMENTS
(Cost $549,299,881) | | 99.75 | % | | | | | | $ | 550,355,840 |
OTHER ASSETS IN EXCESS OF LIABILITIES | | 0.25 | | | | | | | | 1,363,933 |
| | | | | | | | | | |
NET ASSETS | | 100.00 | % | | | | | | $ | 551,719,773 |
| | | | | | | | | | |
| (a) | Security exempt from registration under Rule 144A of the Securities Act of 1933. This security may be resold in transactions exempt from registration, normally to qualified institutional buyers. At March 31, 2007, these securities amounted to $9,251,764 or 1.68% of net assets. |
| (b) | Variable Rate Security—The rate disclosed is as of March 31, 2007. |
| (c) | Perpetual Security—Stated maturity is first par call date. |
| (d) | All or part of the security is segregated by the Fund’s custodian to cover future purchase commitments. |
| (f) | All or part of the security serves as collateral for futures contracts. |
ARM—Adjustable Rate Mortgage
LLC—Limited Liability Company
MTN—Medium Term Note
Multi-Coupon Bond—Coupon rate may increase or decrease in response to a change in the quality rating by an independent rating agency.
plc—Public Limited Company
STRIPS—Separately Traded Registered Interest and Principal Securities
| | | | | | | | | | | |
| Contracts | | | | | Value | | | Unrealized
Appreciation/
Depreciation | |
| FUTURES CONTRACTS | |
| Long — | | | | | | | | | | | |
| 85 | | | U.S. 2 Year Treasury Note, expiring June 29, 2007 (notional amount $17,435,838) | | $ | 17,415,703 | | | $ | (20,135 | ) |
| Short — | | | | | | | | | | | |
| (30 | ) | | U.S. Long-Term Treasury Bond, expiring June 20, 2007 (notional amount $(3,398,363)) | | | (3,337,500 | ) | | | 60,863 | |
| | | | | | | | | | | |
| | | TOTAL FUTURES CONTRACTS (Total notional amount $14,037,475) | | $ | 14,078,203 | | | $ | 40,728 | |
| | | | | | | | | | | |
The summary of the Fund’s investments as of March 31, 2007 is as follows: (Unaudited)
| | | | | | |
Portfolio Diversification | | % of
Net
Assets | | | Value |
U.S. Government & Agency Securities | | 54.27 | % | | $ | 299,498,066 |
Corporate Bonds | | 17.21 | | | | 94,955,441 |
Commercial Mortgage-Backed Securities | | 11.77 | | | | 64,921,792 |
Collateralized Mortgage Obligations | | 7.74 | | | | 42,696,276 |
Registered Investment Companies | | 7.67 | | | | 42,300,345 |
Asset Backed Securities | | 0.77 | | | | 4,220,546 |
Tax-Exempt Securities | | 0.32 | | | | 1,761,561 |
Call Option | | 0.00 | | | | 1,813 |
| | | | | | |
Total Investments | | 99.75 | % | | $ | 550,355,840 |
Other Assets in Excess of Liabilities | | 0.25 | | | | 1,363,933 |
| | | | | | |
Net Assets | | 100.00 | % | | $ | 551,719,773 |
| | | | | | |
See Notes to Financial Statements.
27
Excelsior Funds Trust
Portfolio of Investments — March 31, 2007
Equity Income Fund
| | | | | |
| Shares | | | | Value |
| | | | | |
| COMMON STOCKS — 91.59% | | |
| | CONSUMER DISCRETIONARY — 9.21% |
| 110,000 | | CBS Corp., Class B | | $ | 3,364,900 |
| 100,000 | | Circuit City Stores, Inc. | | | 1,853,000 |
| 90,000 | | Home Depot, Inc. | | | 3,306,600 |
| 8,000 | | Idearc, Inc. | | | 280,800 |
| 140,000 | | Leggett & Platt, Inc. | | | 3,173,800 |
| 225,000 | | Newell Rubbermaid, Inc. | | | 6,995,250 |
| 135,000 | | Time Warner, Inc. | | | 2,662,200 |
| 5,000 | | Time Warner Cable, Inc.,
Class A(a) | | | 187,350 |
| | | | | |
| | | | | 21,823,900 |
| | | | | |
| | CONSUMER STAPLES — 5.53% | | | |
| 78,000 | | Altria Group, Inc. | | | 6,849,180 |
| 160,000 | | SUPERVALU, Inc. | | | 6,251,200 |
| | | | | |
| | | | | 13,100,380 |
| | | | | |
| | ENERGY — 9.69% | | | |
| 70,000 | | BP plc ADR | | | 4,532,500 |
| 112,000 | | Chevron Corp. | | | 8,283,520 |
| 195,000 | | Halliburton Co. | | | 6,189,300 |
| 135,000 | | Penn West Energy Trust | | | 3,966,300 |
| | | | | |
| | | | | 22,971,620 |
| | | | | |
| | FINANCIAL — 18.96% | | | |
| 300,000 | | Arthur J. Gallagher & Co. | | | 8,499,000 |
| 113,000 | | Citigroup, Inc. | | | 5,801,420 |
| 105,000 | | Freddie Mac | | | 6,246,450 |
| 185,000 | | Mellon Financial Corp. | | | 7,980,900 |
| 80,000 | | Morgan Stanley | | | 6,300,800 |
| 95,000 | | RenaissanceRe Holdings Ltd. | | | 4,763,300 |
| 153,000 | | U.S. BanCorp. | | | 5,350,410 |
| | | | | |
| | | | | 44,942,280 |
| | | | | |
| | HEALTH CARE — 6.59% | | | |
| 75,000 | | Medtronic, Inc. | | | 3,679,500 |
| 105,000 | | Novartis AG ADR | | | 5,736,150 |
| 80,000 | | Pharmaceutical Holders Trust Index Fund | | | 6,213,600 |
| | | | | |
| | | | | 15,629,250 |
| | | | | |
| | INDUSTRIALS — 10.73% | | | |
| 160,000 | | Dover Corp. | | | 7,809,600 |
| 195,000 | | General Electric Co. | | | 6,895,200 |
| 170,000 | | Honeywell International, Inc. | | | 7,830,200 |
| 60,000 | | Hubbell, Inc., Class B | | | 2,894,400 |
| | | | | |
| | | | | 25,429,400 |
| | | | | |
| | | | | |
| Shares | | | | Value |
| | | | | |
| COMMON STOCKS — (continued) | | |
| | INFORMATION TECHNOLOGY — 12.33% |
| 225,000 | | Electronic Data Systems Corp. | | $ | 6,228,000 |
| 145,000 | | Linear Technology Corp. | | | 4,580,550 |
| 210,000 | | Microsoft Corp. | | | 5,852,700 |
| 290,000 | | Nokia Oyj ADR | | | 6,646,800 |
| 230,000 | | Xilinx, Inc. | | | 5,917,900 |
| | | | | |
| | | | | 29,225,950 |
| | | | | |
| | MATERIALS — 13.54% | | | |
| 284,310 | | Domtar Corp.(a) | | | 2,646,926 |
| 67,000 | | Eastman Chemical Co. | | | 4,243,110 |
| 235,000 | | Packaging Corp. of America | | | 5,734,000 |
| 56,047 | | Pope Resources Ltd. | | | 2,248,606 |
| 32,000 | | Rayonier, Inc. | | | 1,376,000 |
| 395,000 | | RPM, Inc. | | | 9,124,500 |
| 90,000 | | Weyerhaeuser Co. | | | 6,726,600 |
| | | | | |
| | | | | 32,099,742 |
| | | | | |
| | TELECOMMUNICATION SERVICES — 5.01% |
| 147,000 | | AT&T, Inc. | | | 5,796,210 |
| 160,000 | | Verizon Communications, Inc. | | | 6,067,200 |
| | | | | |
| | | | | 11,863,410 |
| | | | | |
| | TOTAL COMMON STOCKS
(Cost $178,895,931) | | | 217,085,932 |
| | | | | |
| FOREIGN COMMON STOCKS — 3.39% | | |
| | UNITED KINGDOM — 3.39% | | | |
| 466,720 | | Pearson plc | | | 8,028,863 |
| | | | | |
| | TOTAL FOREIGN
COMMON STOCKS
(Cost $5,553,970) | | | 8,028,863 |
| | | | | |
| CONVERTIBLE PREFERRED STOCKS — 2.69% | | |
| | CONSUMER DISCRETIONARY — 2.42% |
| 76,000 | | Ford Motor Co. Capital Trust II, Preferred Exchange, 6.50% | | | 2,717,760 |
| 133,000 | | General Motors Corp., Series C, Preferred Exchange, 6.25% | | | 3,019,100 |
| | | | | |
| | | | | 5,736,860 |
| | | | | |
| | ENERGY — 0.27% | | | |
| 16,000 | | EL Paso Energy Capital Trust I, Preferred Exchange, 4.75% | | | 640,000 |
| | | | | |
| | TOTAL CONVERTIBLE PREFERRED STOCKS
(Cost $5,311,099) | | | 6,376,860 |
| | | | | |
See Notes to Financial Statements.
28
Excelsior Funds Trust
Portfolio of Investments — March 31, 2007
Equity Income Fund — (continued)
| | | | | | |
| Contracts | | | | Value |
| | | | | | |
| CALL OPTIONS PURCHASED — 1.42% | | |
| | 500 | | Circuit City Stores, Inc. Expires 01/17/09 strike price 17.50 | | $ | 210,000 |
| | 915 | | Circuit City Stores, Inc. Expires 01/17/09 strike price 20 | | | 274,500 |
| | 1,100 | | Home Depot, Inc. Expires 01/18/08 strike price 35 | | | 473,000 |
| | 200 | | Home Depot, Inc. Expires 01/17/09 strike price 30 | | | 182,000 |
| | 2,300 | | Time Warner, Inc. Expires 01/18/08 strike price 15(b) | | | 1,311,000 |
| | 300 | | Time Warner, Inc. Expires 01/17/09 strike price 15 | | | 177,000 |
| | 500 | | Xilinx, Inc. Expires
01/18/08 strike price 20 | | | 340,000 |
| | 500 | | Xilinx, Inc. Expires
01/17/09 strike price 20 | | | 395,000 |
| | | | | | |
| | | TOTAL CALL OPTIONS PURCHASED (Cost $3,717,864) | | | 3,362,500 |
| | | | | | |
| | |
Principal
Amount | | | | |
| REPURCHASE AGREEMENT — 0.53% | | |
| $ | 1,248,000 | | JP Morgan Chase Securities, Inc., 5.06%, dated 3/30/07, to be repurchased 4/02/07, repurchase price $1,248,526 (collateralized by U.S. Government Obligation, par value $1,270,000, 4.88%, 01/27/20; total market value $1,258,834) | | | 1,248,000 |
| | | | | | |
| | | TOTAL REPURCHASE AGREEMENT
(Cost $1,248,000) | | $ | 1,248,000 |
| | | | | | |
| | | | | | |
TOTAL INVESTMENTS
(Cost $194,726,864) | | 99.62 | % | | $ | 236,102,155 |
OTHER ASSETS IN EXCESS OF LIABILITIES | | 0.38 | | | | 901,563 |
| | | | | | |
NET ASSETS | | 100.00 | % | | $ | 237,003,718 |
| | | | | | |
| (a) | Non-income producing security. |
| (b) | Fair valued as of March 31, 2007. |
ADR—American Depositary Receipt
Ltd.—Limited
plc—Public limited company
When-issued—Security that is conditionally traded on an exchange prior to the date the security in issued.
At March 31, 2007, the prices of certain foreign securities held by the fund aggregating $8,028,863 were adjusted from their closing market prices following the guidelines adopted by the fund’s board of trustees.
See Notes to Financial Statements.
29
Excelsior Funds Trust
Portfolio of Investments — March 31, 2007
Equity Income Fund — (continued)
The summary of the Fund’s investments as of March 31, 2007 is as follows: (Unaudited)
| | | | | | |
Sector Diversification | | % of
Net
Assets | | | Value |
Financial | | 18.96 | % | | $ | 44,942,280 |
Consumer Discretionary | | 15.02 | | | | 35,589,623 |
Materials | | 13.54 | | | | 32,099,742 |
Information Technology | | 12.33 | | | | 29,225,950 |
Industrials | | 10.73 | | | | 25,429,400 |
Energy | | 9.96 | | | | 23,611,620 |
Health Care | | 6.59 | | | | 15,629,250 |
Consumer Staples | | 5.53 | | | | 13,100,380 |
Telecommunication | | 5.01 | | | | 11,863,410 |
Call Options Purchased | | 1.42 | | | | 3,362,500 |
Repurchase Agreement | | 0.53 | | | | 1,248,000 |
| | | | | | |
Total Investment | | 99.62 | % | | $ | 236,102,155 |
Other Assets in Excess of Liabilities | | 0.38 | | | | 901,563 |
| | | | | | |
Net Assets | | 100.00 | % | | $ | 237,003,718 |
| | | | | | |
See Notes to Financial Statements.
30
Excelsior Funds, Inc.
Portfolio of Investments — March 31, 2007
Large Cap Growth Fund
| | | | | |
| Shares | | | | Value |
| | | | | |
| COMMON STOCKS — 99.05% | | |
| | CONSUMER DISCRETIONARY — 18.33% |
| 422,700 | | Best Buy Co., Inc. | | $ | 20,593,944 |
| 476,700 | | Coach, Inc.(a) | | | 23,858,835 |
| 756,000 | | eBay(a) | | | 25,061,400 |
| 253,200 | | Las Vegas Sands Corp.(a) | | | 21,929,652 |
| 663,300 | | Lowes Companies, Inc. | | | 20,887,317 |
| 709,700 | | Starbucks Corp.(a) | | | 22,256,192 |
| | | | | |
| | | | | 134,587,340 |
| | | | | |
| | FINANCIAL — 8.80% | | | |
| 50,800 | | Chicago Mercantile Exchange | | | 27,048,968 |
| 294,100 | | Lehman Brothers Holding, Inc. | | | 20,607,587 |
| 414,600 | | SLM Corp. | | | 16,957,140 |
| | | | | |
| | | | | 64,613,695 |
| | | | | |
| | HEALTH CARE — 26.89% | | | |
| 195,155 | | Alcon, Inc. | | | 25,725,332 |
| 241,800 | | Allergan, Inc. | | | 26,796,276 |
| 354,800 | | Amgen, Inc.(a) | | | 19,826,224 |
| 564,900 | | Celgene Corp.(a) | | | 29,634,654 |
| 287,300 | | Genentech, Inc.(a) | | | 23,593,076 |
| 390,758 | | Gilead Sciences, Inc.(a) | | | 29,892,987 |
| 200,300 | | Intuitive Surgical, Inc.(a) | | | 24,350,471 |
| 207,112 | | Zimmer Holdings, Inc.(a) | | | 17,689,436 |
| | | | | |
| | | | | 197,508,456 |
| | | | | |
| | INDUSTRIALS — 6.60% | | | |
| 361,131 | | Corporate Executive Board Co. | | | 27,431,511 |
| 510,000 | | Expeditors International of Washington, Inc. | | | 21,073,200 |
| | | | | |
| | | | | 48,504,711 |
| | | | | |
| | INFORMATION TECHNOLOGY — 34.17% |
| 572,500 | | Adobe Systems, Inc.(a) | | | 23,873,250 |
| 591,700 | | Akamai Technologies, Inc.(a) | | | 29,537,664 |
| 317,100 | | Apple Computer, Inc.(a) | | | 29,461,761 |
| 729,487 | | Broadcom Corp., Class A(a) | | | 23,394,648 |
| 1,083,500 | | Corning, Inc.(a) | | | 24,638,790 |
| 431,815 | | Electronic Arts, Inc.(a) | | | 21,746,203 |
| 60,873 | | Google, Inc., Class A(a) | | | 27,889,574 |
| 368,406 | | Infosys Technologies Ltd. ADR | | | 18,512,402 |
| 716,100 | | Qualcomm, Inc. | | | 30,548,825 |
| 155,900 | | Research In Motion Ltd.(a) | | | 21,278,791 |
| | | | | |
| | | | | 250,881,908 |
| | | | | |
| | | | | | |
| Shares | | | | Value |
| | | | | | |
| COMMON STOCKS — (continued) | | |
| | | TELECOMMUNICATION SERVICES — 4.26% |
| | 655,200 | | America Movil S.A. de C.V.,
Series L ADR | | $ | 31,312,008 |
| | | | | | |
| | | TOTAL COMMON STOCKS
(Cost $603,454,025) | | | 727,408,118 |
| | | | | | |
Principal
Amount | | | | |
| REPURCHASE AGREEMENT — 0.93% | | |
| $ | 6,859,000 | | JP Morgan Chase Securities, Inc., 5.06%, dated 3/30/07, to be repurchased 4/02/07, repurchase price $6,861,892 (collateralized by U.S. Government Obligation, par value $6,820,000, 3.63%, 06/20/07; total market value $6,927,670) | | | 6,859,000 |
| | | | | | |
| | | TOTAL REPURCHASE AGREEMENT
(Cost $6,859,000) | | $ | 6,859,000 |
| | | | | | |
| | | | | | |
TOTAL INVESTMENTS
(Cost $610,313,025) | | 99.98 | % | | $ | 734,267,118 |
OTHER ASSETS IN EXCESS OF LIABILITIES | | 0.02 | | | | 169,005 |
| | | | | | |
NET ASSETS | | 100.00 | % | | $ | 734,436,123 |
| | | | | | |
| (a) | Non-income producing security |
ADR—American Depositary Receipt
Ltd.—Limited
See Notes to Financial Statements.
31
Excelsior Funds, Inc.
Portfolio of Investments — March 31, 2007
Large Cap Growth Fund — (continued)
The summary of the Fund’s investments as of March 31, 2007 is as follows: (Unaudited)
| | | | | | |
Sector Diversification | | % of
Net
Assets | | | Value |
Information Technology | | 34.17 | % | | $ | 250,881,908 |
Health Care | | 26.89 | | | | 197,508,456 |
Consumer Discretionary | | 18.33 | | | | 134,587,340 |
Financial | | 8.80 | | | | 64,613,695 |
Industrials | | 6.60 | | | | 48,504,711 |
Telecommunication | | 4.26 | | | | 31,312,008 |
Repurchase Agreement | | 0.93 | | | | 6,859,000 |
| | | | | | |
Total Investment | | 99.98 | % | | $ | 734,267,118 |
Other Assets in Excess of Liabilities | | 0.02 | | | | 169,005 |
| | | | | | |
Net Assets | | 100.00 | % | | $ | 734,436,123 |
| | | | | | |
See Notes to Financial Statements.
32
Excelsior Funds Trust
Portfolio of Investments — March 31, 2007
Mid Cap Value and Restructuring Fund
| | | | | |
| Shares | | | | Value |
| | | | | |
| COMMON STOCKS — 95.77% | | |
| | CONSUMER DISCRETIONARY — 23.84% |
| 71,900 | | Autozone, Inc.(a) | | $ | 9,213,266 |
| 105,000 | | Black & Decker Corp. | | | 8,570,100 |
| 112,900 | | Centex Corp. | | | 4,716,962 |
| 330,000 | | Constellation Brands, Inc.(a) | | | 6,989,400 |
| 190,600 | | EchoStar Communications, Inc.(a) | | | 8,277,758 |
| 135,800 | | Limited Brands | | | 3,538,948 |
| 323,200 | | Onex Corp. | | | 8,977,526 |
| 167,700 | | Sherwin-Williams Co. | | | 11,074,909 |
| 348,200 | | Tempur-Pedic International, Inc. | | | 9,049,718 |
| 280,000 | | TJX Cos., Inc. | | | 7,548,800 |
| | | | | |
| | | | | 77,957,387 |
| | | | | |
| | CONSUMER STAPLES — 2.57% |
| 180,000 | | Dean Foods Co.(a) | | | 8,413,200 |
| | | | | |
| | ENERGY — 10.95% | | | |
| 121,800 | | Cimarex Energy Co. | | | 4,509,036 |
| 133,300 | | Devon Energy Corp. | | | 9,227,026 |
| 349,800 | | EL Paso Corp. | | | 5,061,606 |
| 130,000 | | Noble Corp. | | | 10,228,400 |
| 137,800 | | Occidental Petroleum Corp. | | | 6,794,918 |
| | | | | |
| | | | | 35,820,986 |
| | | | | |
| | FINANCIAL — 19.78% | | | |
| 95,000 | | Ace Ltd. | | | 5,420,700 |
| 167,700 | | CIT Group, Inc. | | | 8,874,684 |
| 340,000 | | E*TRADE Group, Inc.(a) | | | 7,214,800 |
| 8,000 | | Employers Holdings, Inc.(a) | | | 160,160 |
| 157,000 | | First Marblehead Corp. | | | 7,047,730 |
| 116,600 | | Lehman Brothers Holding, Inc. | | | 8,170,162 |
| 140,000 | | Leucadia National Corp. | | | 4,118,800 |
| 61,400 | | Mastercard, Inc., Class A | | | 6,523,136 |
| 170,000 | | Progressive Corp. | | | 3,709,400 |
| 90,000 | | RenaissanceRe Holdings Ltd. | | | 4,512,600 |
| 270,000 | | W.R. Berkley Corp. | | | 8,942,400 |
| | | | | |
| | | | | 64,694,572 |
| | | | | |
| | HEALTH CARE — 4.44% | | | |
| 331,300 | | Health Management Associates, Inc., Class A | | | 3,601,231 |
| 176,700 | | Shire Pharmaceuticals plc ADR | | | 10,937,730 |
| | | | | |
| | | | | 14,538,961 |
| | | | | |
| | | | | |
| Shares | | | | Value |
| | | | | |
| COMMON STOCKS — (continued) | | |
| | INDUSTRIALS — 20.38% | | | |
| 130,000 | | Autoliv, Inc. | | $ | 7,424,300 |
| 187,700 | | Brink’s Co. | | | 11,909,565 |
| 247,000 | | Empresa Brasileira de Aeronautica S.A. ADR | | | 11,327,420 |
| 150,000 | | Kennametal, Inc. | | | 10,141,500 |
| 36,000 | | Lincoln Electric Holdings, Inc. | | | 2,144,160 |
| 172,700 | | Mueller Industries, Inc. | | | 5,198,270 |
| 175,000 | | Oshkosh Truck Corp. | | | 9,275,000 |
| 335,300 | | United Rentals, Inc.(a) | | | 9,220,750 |
| | | | | |
| | | | | 66,640,965 |
| | | | | |
| | INFORMATION TECHNOLOGY — 4.78% |
| 140,000 | | Electronic Data Systems Corp. | | | 3,875,200 |
| 230,900 | | Harris Corp. | | | 11,764,355 |
| | | | | |
| | | | | 15,639,555 |
| | | | | |
| | MATERIALS — 4.63% | | | |
| 205,700 | | Aracruz Cellulose S.A. ADR | | | 10,793,079 |
| 129,700 | | Cabot Microelectronics Corp.(a) | | | 4,346,247 |
| | | | | |
| | | | | 15,139,326 |
| | | | | |
| | REAL ESTATE — 1.66% | | | |
| 103,800 | | St. Joe Co. | | | 5,429,778 |
| | | | | |
| | UTILITIES — 2.74% | | | |
| 315,000 | | Williams Cos., Inc. | | | 8,964,900 |
| | | | | |
| | TOTAL COMMON STOCKS
(Cost $202,502,426) | | | 313,239,630 |
| | | | | |
| FOREIGN COMMON STOCKS — 2.14% | | |
| | NETHERLANDS — 2.14% | | | |
| 79,500 | | Hunter Douglas NV | | | 7,013,633 |
| | | | | |
| | TOTAL FOREIGN COMMON STOCKS
(Cost $2,926,238) | | | 7,013,633 |
| | | | | |
| CONVERTIBLE PREFERRED STOCKS — 0.18% | | |
| | CONSUMER DISCRETIONARY — 0.18% |
| 400 | | Blockbuster, Inc., Preferred Exchange | | | 597,600 |
| | | | | |
| | TOTAL CONVERTIBLE PREFERRED STOCKS
(Cost $400,000) | | | 597,600 |
| | | | | |
See Notes to Financial Statements.
33
Excelsior Funds Trust
Portfolio of Investments — March 31, 2007
Mid Cap Value and Restructuring Fund — (continued)
| | | | | | |
Principal
Amount | | | | Value |
| | | | | | |
| REPURCHASE AGREEMENT — 1.85% | | |
| $ | 6,066,000 | | JP Morgan Chase Securities, Inc., 5.06%, dated 03/30/07, to be repurchased 04/02/07, repurchase price $6,068,558 (collateralized by U.S. Government Obligation,
par value $5,876,000, 6.25%, 05/16/16; total market value $6,202,699) | | $ | 6,066,000 |
| | | | | | |
| | | TOTAL REPURCHASE AGREEMENT
(Cost $6,066,000) | | | 6,066,000 |
| | | | | | |
| | | | | | |
TOTAL INVESTMENTS
(Cost $211,894,664) | | 99.94 | % | | $ | 326,916,863 |
OTHER ASSETS IN EXCESS OF LIABILITIES | | 0.06 | | | | 199,906 |
| | | | | | |
NET ASSETS | | 100.00 | % | | $ | 327,116,769 |
| | | | | | |
| (a) | Non-income producing security. |
ADR—American Depositary Receipt
Ltd.—Limited
plc—Public Limited Company
At March 31, 2007, the prices of certain foreign securities held by the fund aggregating $7,013,633 were adjusted from their closing market prices following the guidelines adopted by the fund’s board of trustee.
The summary of the Fund’s investments as of March 31, 2007 is as follows: (Unaudited)
| | | | | | |
Sector Diversification | | % of
Net
Assets | | | Market Value |
Consumer Discretionary | | 26.16 | | | $ | 85,568,620 |
Industrials | | 20.38 | | | | 66,640,965 |
Financial | | 19.78 | | | | 64,694,572 |
Energy | | 10.95 | | | | 35,820,986 |
Information Technology | | 4.78 | | | | 15,639,555 |
Materials | | 4.63 | | | | 15,139,326 |
Health Care | | 4.44 | | | | 14,538,961 |
Utilities | | 2.74 | | | | 8,964,900 |
Consumer Staples | | 2.57 | | | | 8,413,200 |
Repurchase Agreement. | | 1.85 | | | | 6,066,000 |
Real Estate | | 1.66 | | | | 5,429,778 |
| | | | | | |
Total Investment | | 99.94 | % | | $ | 326,916,863 |
Other Assets in Excess of Liabilities | | 0.06 | | | | 199,906 |
| | | | | | |
Net Assets | | 100.00 | % | | $ | 327,116,769 |
| | | | | | |
See Notes to Financial Statements.
34
Excelsior Funds, Inc.
Portfolio of Investments — March 31, 2007
Small Cap Fund
| | | | | |
| Shares | | | | Value |
| | | | | |
| COMMON STOCKS — 98.79% | | |
| | CONSUMER DISCRETIONARY —18.92% |
| 860,000 | | Cabelas, Inc.(a) | | $ | 21,336,600 |
| 220,000 | | Columbia Sportswear Co. | | | 13,708,200 |
| 500,000 | | Leapfrog Enterprises, Inc.(a) | | | 5,350,000 |
| 1,200,000 | | Nautilus, Inc. | | | 18,516,000 |
| 600,000 | | Oakley, Inc. | | | 12,084,000 |
| 540,000 | | Sotheby’s Holdings, Inc.,
Class A | | | 24,019,200 |
| 700,000 | | Talbots, Inc. | | | 16,534,000 |
| 380,000 | | Thor Industries, Inc. | | | 14,968,200 |
| 200,000 | | Urban Outfitters, Inc.(a) | | | 5,302,000 |
| | | | | |
| | | | | 131,818,200 |
| | | | | |
| | CONSUMER SERVICES — 2.04% |
| 340,000 | | P.F. Chang’s China Bistro, Inc.(a) | | | 14,239,200 |
| | | | | |
| | ENERGY — 4.52% | | | |
| 540,000 | | Helix Energy Solutions Group, Inc.(a) | | | 20,136,600 |
| 460,000 | | TETRA Technologies, Inc.(a) | | | 11,366,600 |
| | | | | |
| | | | | 31,503,200 |
| | | | | |
| | FINANCIAL — 12.11% | | | |
| 380,000 | | GFI Group, Inc.(a) | | | 25,828,600 |
| 200,000 | | Greenhill & Co., Inc. | | | 12,278,000 |
| 360,000 | | Jefferies Group, Inc. | | | 10,422,000 |
| 540,000 | | Nara Bancorp, Inc. | | | 9,455,400 |
| 600,000 | | Philadelphia Consolidated Holdings Corp.(a) | | | 26,394,000 |
| | | | | |
| | | | | 84,378,000 |
| | | | | |
| | HEALTH CARE — 6.29% | | | |
| 460,000 | | Arrow International, Inc. | | | 14,793,600 |
| 520,000 | | Kensey Nash Corp.(a) | | | 15,860,000 |
| 300,000 | | Molina Healthcare, Inc.(a) | | | 9,177,000 |
| 1,000,000 | | Orthovita, Inc.(a) | | | 2,920,000 |
| 40,000 | | Pharmanet Development Group, Inc.(a) | | | 1,040,000 |
| | | | | |
| | | | | 43,790,600 |
| | | | | |
| | INDUSTRIALS — 29.75% | | | |
| 660,000 | | FLIR Systems, Inc.(a) | | | 23,542,200 |
| 740,000 | | FTI Consulting, Inc.(a) | | | 24,856,600 |
| | | | | |
| Shares | | | | Value |
| | | | | |
| COMMON STOCKS — (continued) | | |
| | INDUSTRIALS — (continued) | | | |
| 700,000 | | Hewitt Associates, Inc.,
Class A(a) | | $ | 20,461,000 |
| 930,000 | | Innovative Solutions & Support, Inc.(a) | | | 23,547,600 |
| 660,000 | | Kansas City Southern(a) | | | 23,482,800 |
| 1,200,000 | | MPS Group, Inc.(a) | | | 16,980,000 |
| 1,000,000 | | Quanta Services, Inc.(a) | | | 25,220,000 |
| 520,000 | | Shaw Group, Inc.(a) | | | 16,260,400 |
| 600,000 | | Simpson Manufacturing Co., Inc. | | | 18,504,000 |
| 260,000 | | Triumph Group, Inc. | | | 14,388,400 |
| | | | | |
| | | | | 207,243,000 |
| | | | | |
| | INFORMATION TECHNOLOGY — 19.69% |
| 500,000 | | CommScope, Inc.(a) | | | 21,450,000 |
| 660,000 | | Forrester Research, Inc.(a) | | | 18,717,600 |
| 1,100,000 | | Kulicke & Soffa Industries, Inc.(a) | | | 10,175,000 |
| 880,000 | | Manhattan Associates, Inc.(a) | | | 24,138,400 |
| 700,000 | | Plantronics, Inc. | | | 16,534,000 |
| 400,000 | | Power Integrations(a) | | | 9,060,000 |
| 600,000 | | Technitrol, Inc. | | | 15,714,000 |
| 400,000 | | Varian Semiconductor Equipment Associates, Inc.(a) | | | 21,352,000 |
| | | | | |
| | | | | 137,141,000 |
| | | | | |
| | MATERIALS — 1.92% | | | |
| 400,000 | | Cabot Microelectronics Corp.(a) | | | 13,404,000 |
| | | | | |
| | TELECOMMUNICATION SERVICES — 2.13% |
| 1,400,000 | | Andrew Corp.(a) | | | 14,826,000 |
| | | | | |
| | UTILITIES — 1.42% | | | |
| 440,000 | | Aqua America, Inc. | | | 9,878,000 |
| | | | | |
| | TOTAL COMMON STOCKS
(Cost $479,327,610) | | | 688,221,200 |
| | | | | |
See Notes to Financial Statements.
35
Excelsior Funds, Inc.
Portfolio of Investments — March 31, 2007
Small Cap Fund — (continued)
| | | | | | |
Principal
Amount | | | | Value |
| | | | | | |
| REPURCHASE AGREEMENT — 1.53% | | |
| $ | 10,628,000 | | JP Morgan Chase Securities, Inc., 5.06%, dated 3/30/07, to be repurchased 4/02/07, repurchase price $10,632,482
(collateralized by U.S. Government Obligation,
par value $10,507,000,
6.13%, 12/01/17; total market value $10,840,729) | | $ | 10,628,000 |
| | | | | | |
| | | TOTAL REPURCHASE AGREEMENT
(Cost $10,628,000) | | | 10,628,000 |
| | | | | | |
| | | | | | | |
TOTAL INVESTMENTS
(Cost $489,955,610) | | 100.32 | % | | $ | 698,849,200 | |
LIABILITIES IN EXCESS OF OTHER ASSETS | | (0.32 | ) | | | (2,256,893 | ) |
| | | | | | | |
NET ASSETS | | 100.00 | % | | $ | 696,592,307 | |
| | | | | | | |
| (a) | Non-income producing security |
The summary of the Fund’s investments as of March 31, 2007 is as follows: (Unaudited)
| | | | | | | |
Sector Diversification | | % of
Net
Assets | | | Value | |
Industrials | | 29.75 | % | | $ | 207,243,000 | |
Information Technology | | 19.69 | | | | 137,141,000 | |
Consumer Discretionary | | 18.92 | | | | 131,818,200 | |
Financial | | 12.11 | | | | 84,378,000 | |
Health Care | | 6.29 | | | | 43,790,600 | |
Energy | | 4.52 | | | | 31,503,200 | |
Telecommunication Services | | 2.13 | | | | 14,826,000 | |
Consumer Services | | 2.04 | | | | 14,239,200 | |
Materials | | 1.92 | | | | 13,404,000 | |
Repurchase Agreement | | 1.53 | | | | 10,628,000 | |
Utilities | | 1.42 | | | | 9,878,000 | |
| | | | | | | |
Total Investment | | 100.32 | % | | $ | 698,849,200 | |
Liabilities in Excess of Other Assets | | (0.32 | ) | | | (2,256,893 | ) |
| | | | | | | |
Net Assets | | 100.00 | % | | $ | 696,592,307 | |
| | | | | | | |
See Notes to Financial Statements.
36
Excelsior Funds, Inc.
Portfolio of Investments — March 31, 2007
Value and Restructuring Fund
| | | | | |
| Shares | | | | Value |
| | | | | |
| COMMON STOCKS — 95.33% | | |
| | CONSUMER DISCRETIONARY — 11.92% |
| 2,600,000 | | Black & Decker Corp. | | $ | 212,212,000 |
| 2,600,000 | | CBS Corp., Class B | | | 79,534,000 |
| 3,250,000 | | Centex Corp. | | | 135,785,000 |
| 1,800,000 | | EchoStar Communications, Inc.(a)(b) | | | 78,174,000 |
| 850,000 | | Harman International Industries, Inc.(b) | | | 81,668,000 |
| 3,000,000 | | Leggett & Platt, Inc. | | | 68,010,000 |
| 2,700,000 | | Newell Rubbermaid, Inc. | | | 83,943,000 |
| 3,200,000 | | TJX Cos., Inc. | | | 86,272,000 |
| 5,800,000 | | XM Satellite Radio Holdings, Inc., Class A(a) | | | 74,936,000 |
| 2,650,000 | | Zale Corp.(a) | | | 69,907,000 |
| | | | | |
| | | | | 970,441,000 |
| | | | | |
| | CONSUMER STAPLES — 4.87% |
| 2,200,000 | | Avon Products, Inc. | | | 81,972,000 |
| 1,700,000 | | ConAgra Foods, Inc. | | | 42,347,000 |
| 2,500,000 | | Dean Foods Co.(a) | | | 116,850,000 |
| 2,050,000 | | Loews Corp. — Carolina Group | | | 155,000,500 |
| | | | | |
| | | | | 396,169,500 |
| | | | | |
| | ENERGY — 15.68% | | | |
| 1,900,000 | | Anadarko Petroleum Corp. | | | 81,662,000 |
| 2,800,000 | | ConocoPhillips | | | 191,380,000 |
| 2,450,000 | | Devon Energy Corp. | | | 169,589,000 |
| 8,791 | | Dynegy, Inc., Class A(a) | | | 81,405 |
| 5,800,000 | | EL Paso Corp. | | | 83,926,000 |
| 1,450,000 | | Murphy Oil Corp. | | | 77,430,000 |
| 2,150,000 | | Noble Energy, Inc. | | | 128,247,500 |
| 1,975,000 | | Petrobras ADR | | | 196,532,250 |
| 4,200,000 | | Petrohawk Energy Corp.(a) | | | 55,314,000 |
| 944,900 | | Pinnacle Gas Resources, Inc.(a)(c)(d)(e) | | | 10,393,900 |
| 2,750,000 | | Rossetta Resources, Inc.(a) | | | 56,485,000 |
| 2,000,000 | | Spectra Energy Corp. | | | 52,540,000 |
| 2,500,000 | | Todco, Class A(a) | | | 100,825,000 |
| 2,500,000 | | W&T Offshore, Inc. | | | 72,325,000 |
| | | | | |
| | | | | 1,276,731,055 |
| | | | | |
| | FINANCIAL — 22.15% | | | |
| 2,650,000 | | Ace Ltd. | | | 151,209,000 |
| 1,950,000 | | AerCap Holdings NV ADR(a) | | | 56,764,500 |
| | | | | |
| Shares | | | | Value |
| | | | | |
| COMMON STOCKS — (continued) | | |
| | FINANCIAL — (continued) | | | |
| 3,850,000 | | Amvescap plc ADR | | $ | 85,085,000 |
| 2,800,000 | | Apollo Investment Corp.(f) | | | 59,920,000 |
| 1,200,000 | | Capital One Financial Corp. | | | 90,552,000 |
| 2,403,260 | | CastlePoint Holdings Ltd.(a) | | | 39,293,301 |
| 1,900,000 | | CIT Group, Inc. | | | 100,548,000 |
| 2,450,000 | | Citigroup, Inc. | | | 125,783,000 |
| 1,650,000 | | Freddie Mac | | | 98,158,500 |
| 1,000,000 | | Genworth Financial, Inc. | | | 34,940,000 |
| 2,000,000 | | JP Morgan Chase & Co. | | | 96,760,000 |
| 1,750,000 | | Lehman Brothers Holding, Inc. | | | 122,622,500 |
| 2,700,000 | | Loews Corp. | | | 122,661,000 |
| 700,000 | | Marsh & McLennan Cos., Inc. | | | 20,503,000 |
| 400,000 | | Mastercard, Inc., Class A(b) | | | 42,496,000 |
| 3,500,000 | | MCG Capital Corp. | | | 65,660,000 |
| 1,850,000 | | Metlife, Inc. | | | 116,827,500 |
| 2,100,000 | | Morgan Stanley | | | 165,396,000 |
| 1,250,000 | | PNC Financial Services Group, Inc. | | | 89,962,500 |
| 3,000,000 | | Primus Guaranty Ltd.(a) | | | 36,900,000 |
| 2,000,000 | | Washington Mutual, Inc. | | | 80,760,000 |
| | | | | |
| | | | | 1,802,801,801 |
| | | | | |
| | HEALTH CARE — 3.30% | | | |
| 1,850,000 | | AmerisourceBergen Corp. | | | 97,587,500 |
| 2,200,000 | | Baxter International, Inc. | | | 115,874,000 |
| 2,000,000 | | Bristol-Myers Squibb Co. | | | 55,520,000 |
| | | | | |
| | | | | 268,981,500 |
| | | | | |
| | INDUSTRIALS — 14.05% | | | |
| 2,900,000 | | AGCO Corp.(a) | | | 107,213,000 |
| 1,100,000 | | Aries Maritime Transport Ltd. | | | 9,031,000 |
| 1,050,181 | | Arlington Tankers | | | 25,057,319 |
| 2,100,000 | | Copa Holdings S.A., Class A | | | 108,129,000 |
| 2,583,500 | | Empresa Brasileira de Aeronautica S.A. ADR | | | 118,479,310 |
| 3,500,000 | | Gol Linhas Aereas Inteligentes S.A. ADR | | | 106,505,000 |
| 1,000,000 | | Omega Navigation Enterprises, Inc., Class A ADR | | | 15,630,000 |
| 1,100,000 | | Rockwell Automation, Inc. | | | 65,857,000 |
| 1,900,000 | | Ryder Systems, Inc. | | | 93,746,000 |
| 3,100,000 | | Tyco International Ltd. | | | 97,805,000 |
| 1,700,000 | | Union Pacific Corp. | | | 172,635,000 |
See Notes to Financial Statements.
37
Excelsior Funds, Inc.
Portfolio of Investments — March 31, 2007
Value and Restructuring Fund — (continued)
| | | | | |
| Shares | | | | Value |
| | | | | |
| COMMON STOCKS — (continued) | | |
| | INDUSTRIALS — (continued) | | | |
| 4,250,000 | | United Rentals, Inc.(a) | | $ | 116,875,000 |
| 1,650,000 | | United Technologies Corp. | | | 107,250,000 |
| | | | | |
| | | | | 1,144,212,629 |
| | | | | |
| | INFORMATION TECHNOLOGY — 5.26% |
| 4,200,000 | | Harris Corp. | | | 213,990,000 |
| 900,000 | | International Business Machines Corp. | | | 84,834,000 |
| 3,850,000 | | Nokia Oyj ADR | | | 88,242,000 |
| 1,750,000 | | Plantronics, Inc. | | | 41,335,000 |
| | | | | |
| | | | | 428,401,000 |
| | | | | |
| | MATERIALS — 11.07% | | | |
| 3,300,000 | | Alpha Natural Resources, Inc.(a) | | | 51,579,000 |
| 4,000,000 | | Celanese Corp., Class A | | | 123,360,000 |
| 4,550,000 | | CONSOL Energy, Inc. | | | 178,041,500 |
| 1,100,000 | | Eagle Materials, Inc. | | | 49,093,000 |
| 1,500,000 | | Foundation Coal Holdings, Inc. | | | 51,510,000 |
| 750,000 | | Freeport-McMoRan Copper & Gold, Inc. | | | 49,642,500 |
| 4,600,000 | | International Coal Group, Inc.(a) | | | 24,150,000 |
| 1,400,000 | | PPG Industries, Inc. | | | 98,434,000 |
| 1,700,000 | | Schnitzer Steel Industries, Inc. | | | 68,289,000 |
| 4,000,000 | | Smurfit-Stone Container Corp.(a) | | | 45,040,000 |
| 1,800,000 | | Southern Copper Corp. | | | 128,988,000 |
| 2,300,000 | | Tronox, Inc. | | | 33,120,000 |
| | | | | |
| | | | | 901,247,000 |
| | | | | |
| | REAL ESTATE — 2.44% |
| 3,820,000 | | Diamondrock Hospitality Co. | | | 72,580,000 |
| 1,000,000 | | FBR Capital Markets Corp.(a)(d)(e) | | | 15,250,000 |
| 2,050,000 | | Host Marriott Corp. | | | 53,935,500 |
| 3,000,000 | | Peoples Choice Financial Corp.(a)(d)(e) | | | 4,500,000 |
| 900,000 | | Ventas, Inc. | | | 37,917,000 |
| 2,140,500 | | Vintage Wine Trust, Inc.(d)(e) | | | 14,448,375 |
| | | | | |
| | | | | 198,630,875 |
| | | | | |
| | | | | |
| Shares | | | | Value |
| | | | | |
| COMMON STOCKS — (continued) | | |
| | TELECOMMUNICATION SERVICES — 4.59% |
| 5,500,000 | | America Movil S.A. de C.V., Series L ADR(b) | | $ | 262,845,000 |
| 1,842,000 | | Datapath, Inc.(a)(d)(e) | | | 17,499,000 |
| 2,600,000 | | Sprint Nextel Corp. | | | 49,296,000 |
| 3,000,000 | | Windstream Corp. | | | 44,070,000 |
| | | | | |
| | | | | 373,710,000 |
| | | | | |
| | TOTAL COMMON STOCKS
(Cost $5,086,518,227) | | | 7,761,326,360 |
| | | | | |
| FOREIGN COMMON STOCKS — 3.07% | | |
| | GERMANY — 0.96% | | | |
| 1,500,000 | | Lanxess AG(a) | | | 77,534,540 |
| | | | | |
| | ITALY — 0.66% | | | |
| 5,000,000 | | Enel S.p.A | | | 53,541,373 |
| | | | | |
| | MEXICO — 0.62% | | | |
| 11,000,000 | | Grupo Mexico S.A.B. de C.V., Series B | | | 50,835,939 |
| | | | | |
| | SWITZERLAND — 0.83% | | | |
| 950,000 | | Petroplus Holdings AG(a) | | | 67,644,880 |
| | | | | |
| | TOTAL FOREIGN COMMON STOCKS (Cost $177,913,078) | | | 249,556,732 |
| | | | | |
| CONVERTIBLE PREFERRED STOCKS — 1.28% |
| | CONSUMER DISCRETIONARY — 1.03% |
| 2,350,000 | | Ford Motor Co. Capital Trust II, Preferred Exchange, 6.50% | | | 84,036,000 |
| | | | | |
| | MATERIALS — 0.25% | | | |
| 500,000 | | Celanese Corp., Preferred Exchange, 4.25% | | | 20,437,500 |
| | | | | |
| | TOTAL CONVERTIBLE PREFERRED STOCKS
(Cost $98,271,130) | | | 104,473,500 |
| | | | | |
See Notes to Financial Statements.
38
Excelsior Funds, Inc.
Portfolio of Investments — March 31, 2007
Value and Restructuring Fund — (continued)
| | | | | | |
Principal
Amount | | | | Value |
| | | | | | |
| REPURCHASE AGREEMENT — 0.24% | | |
| $ | 19,528,000 | | JP Morgan Chase Securities, Inc., 5.06%, dated 3/30/07, to be repurchased 4/02/07, repurchase price $19,536,234 (collateralized by U.S. Government Obligations, ranging in par value $3,775,000-$5,340,000, 4.13%-6.25%, 07/17/09-03/02/21; total market value $19,629,004) | | $ | 19,528,000 |
| | | | | | |
| | | TOTAL REPURCHASE AGREEMENT
(Cost $19,528,000) | | | 19,528,000 |
| | | | | | |
| | | | | | |
TOTAL INVESTMENTS
(Cost $5,382,230,435) | | 99.92 | % | | $ | 8,134,884,592 |
OTHER ASSETS IN EXCESS OF LIABILITIES | | 0.08 | | | | 6,272,224 |
| | | | | | |
NET ASSETS | | 100.00 | % | | $ | 8,141,156,816 |
| | | | | | |
| (a) | Non-income producing security. |
| (b) | All or part of the security is segregated by the Fund’s custodian to cover future purchase commitments. |
| (c) | Fair valued as of March 31, 2007. |
| (d) | Security exempt from registration under Rule 144A of the Securities Act of 1933. This security may be resold in transactions exempt from registration, normally to qualified institutional buyers. At March 31, 2007 these securities amounted to $62,091,275 or 0.76% of net assets. |
| (e) | Represents an illiquid security as of March 31, 2007. |
| (f) | Closed-end Management Investment Company. |
ADR—American Depositary Receipt
Ltd.—Limited
plc—Public Limited Company
At March 31, 2007, the prices of certain foreign securities held by the fund aggregating $249,556,732 were adjusted from their closing market prices following the guidelines adopted by the fund’s board of trustees.
| | | | | | |
Contracts | | | | Value | |
| CALL OPTIONS WRITTEN: | | | |
| (10,000) | | America Movil S.A. de C.V., Expires 05/18/07 strike price 50 | | $ | (1,400,000 | ) |
| (5,000) | | EchoStar Communications, Inc., Expires 06/15/07 strike price 45 | | | (875,000 | ) |
| (4,000) | | Harmon International Industries, Inc., Expires 04/20/07
strike price 105 | | | (40,000 | ) |
| (4,000) | | Mastercard, Inc., Expires 04/20/07 strike price 04/20/07 | | | (1,520,000 | ) |
| | | | | | |
| | TOTAL CALL OPTIONS WRITTEN
(Premiums received $6,678,258) | | $ | (3,835,000 | ) |
| | | | | | |
See Notes to Financial Statements.
39
Excelsior Funds, Inc.
Portfolio of Investments — March 31, 2007
Value and Restructuring Fund — (continued)
The summary of the Fund’s investments as of March 31, 2007 is as follows: (Unaudited)
| | | | | | |
Sector Diversification | | % of
Net
Assets | | | Value |
Financial | | 22.15 | % | | $ | 1,802,801,801 |
Energy | | 16.51 | | | | 1,344,375,935 |
Industrials | | 15.01 | | | | 1,221,747,169 |
Consumer Discretionary | | 12.95 | | | | 1,054,477,000 |
Materials | | 11.94 | | | | 972,520,439 |
Consumer Staples | | 5.53 | | | | 449,710,873 |
Information Technology | | 5.26 | | | | 428,401,000 |
Telecommunication Services | | 4.59 | | | | 373,710,000 |
Health Care | | 3.30 | | | | 268,981,500 |
Real Estate | | 2.44 | | | | 198,630,875 |
Repurchase Agreement | | 0.24 | | | | 19,528,000 |
| | | | | | |
Total Investment | | 99.92 | % | | $ | 8,134,884,592 |
Other Assets in Excess of Liabilities | | 0.08 | | | | 6,272,224 |
| | | | | | |
Net Assets | | 100.00 | % | | $ | 8,141,156,816 |
| | | | | | |
See Notes to Financial Statements.
40
[THIS PAGE INTENTIONALLY LEFT BLANK]
Excelsior Funds
Statements of Assets and Liabilities
March 31, 2007
| | | | | | | | |
| | | Core
Bond Fund | | | Equity
Income
Fund | |
ASSETS: | | | | | | | | |
Investments, at cost — see accompanying portfolios | | $ | 549,299,881 | | | $ | 194,726,864 | |
| | | | | | | | |
Investments, at value (including Repurchase Agreements) (Note 1) | | $ | 550,355,840 | | | $ | 236,102,155 | |
Cash | | | 172,942 | | | | 315 | |
Foreign currency (cost $0, $0, $0, $0, $0 and $531 respectively) | | | — | | | | — | |
Dividends and interest receivable | | | 4,413,659 | | | | 632,927 | |
Receivable for investments sold | | | 333,651 | | | | — | |
Receivable for fund shares sold | | | 506,201 | | | | 625,896 | |
Receivable for forward foreign currency contracts | | | — | | | | — | |
Net receivable for variation margin on futures contracts | | | 5,391 | | | | — | |
Reclaims receivable | | | — | | | | — | |
Prepaid expenses | | | 9,532 | | | | 3,106 | |
| | | | | | | | |
Total Assets | | | 555,797,216 | | | | 237,364,399 | |
| | | | | | | | |
LIABILITIES: | | | | | | | | |
Payable for dividends declared | | | 1,360,741 | | | | — | |
Payable for investments purchased | | | 1,742,048 | | | | — | |
Options written, at value (Premiums received: Value and Restructuring Fund — $6,678,258) | | | — | | | | — | |
Cash overdraft | | | — | | | | — | |
Payable for fund shares redeemed | | | 450,371 | | | | 87,922 | |
Payable for forward foreign currency contracts | | | — | | | | — | |
Investment advisory fees payable (Note 2) | | | 170,085 | | | | 122,556 | |
Administration fees payable (Note 2) | | | 71,583 | | | | 30,684 | |
Distribution and shareholder servicing fees payable (Note 2) | | | 67,066 | | | | 59,303 | |
Directors’/Trustees’ fees and expenses payable (Note 2) | | | — | | | | — | |
Accrued expenses and other payables | | | 215,549 | | | | 60,216 | |
| | | | | | | | |
Total Liabilities | | | 4,077,443 | | | | 360,681 | |
| | | | | | | | |
NET ASSETS | | $ | 551,719,773 | | | $ | 237,003,718 | |
| | | | | | | | |
NET ASSETS consist of: | | | | | | | | |
Undistributed (distributions in excess of) net investment income | | $ | 23,250 | | | $ | 1,016,788 | |
Accumulated net realized gain (loss) on investments, foreign currency transactions and written options | | | (1,867,299 | ) | | | 431,735 | |
Unrealized appreciation of investments, foreign currency translations and written options | | | 1,096,687 | | | | 41,375,425 | |
Par value (Note 5) | | | 61,436 | | | | 249 | |
Paid in capital in excess of par value | | | 552,405,699 | | | | 194,179,521 | |
| | | | | | | | |
Net Assets | | $ | 551,719,773 | | | $ | 237,003,718 | |
| | | | | | | | |
Net Assets: | | | | | | | | |
Retirement Shares | | $ | 1,071 | | | $ | 1,149 | |
Shares | | | 313,966,821 | | | | 237,002,569 | |
Institutional Shares | | | 237,751,881 | | | | — | |
Shares outstanding (Note 5): | | | | | | | | |
Retirement Shares | | | 119 | | | | 120 | |
Shares | | | 34,965,727 | | | | 24,928,172 | |
Institutional Shares | | | 26,469,879 | | | | — | |
NET ASSET VALUE PER SHARE (net assets ÷ shares outstanding): | | | | | | | | |
Retirement Shares | | | $8.98 | (a) | | | $9.54 | (a) |
| | | | | | | | |
Shares | | | $8.98 | | | | $9.51 | |
| | | | | | | | |
Institutional Shares | | | $8.98 | | | | — | |
| | | | | | | | |
| (a) | | Due to rounding net assets divided by shares outstanding does not equal the net asset value per share. |
See Notes to Financial Statements.
42
| | | | | | | | | | | | |
Large Cap
Growth Fund | | | Mid Cap Value
and Restructuring
Fund | | Small Cap Fund | | Value and
Restructuring
Fund | |
| $ | 610,313,025 | | | $ | 211,894,664 | | $ | 489,955,610 | | $ | 5,382,230,435 | |
| | | | | | | | | | | | | |
| $ | 734,267,118 | | | $ | 326,916,863 | | $ | 698,849,200 | | $ | 8,134,884,592 | |
| | 219 | | | | 810 | | | 138 | | | 14,546 | |
| | — | | | | — | | | — | | | 589 | |
| | 1,928 | | | | 209,475 | | | 44,438 | | | 11,412,758 | |
| | — | | | | — | | | 635,754 | | | 13,711,725 | |
| | 1,146,238 | | | | 2,101,242 | | | 1,073,553 | | | 20,321,987 | |
| | — | | | | — | | | — | | | — | |
| | — | | | | — | | | — | | | — | |
| | — | | | | — | | | — | | | — | |
| | 23,315 | | | | 3,946 | | | 9,077 | | | 120,997 | |
| | | | | | | | | | | | | |
| | 735,438,818 | | | | 329,232,336 | | | 700,612,160 | | | 8,180,467,194 | |
| | | | | | | | | | | | | |
| | — | | | | — | | | — | | | — | |
| | — | | | | — | | | 2,700,153 | | | 16,781,959 | |
| | — | | | | — | | | — | | | 3,835,000 | |
| | — | | | | — | | | — | | | — | |
| | 220,101 | | | | 1,737,971 | | | 541,128 | | | 10,778,197 | |
| | — | | | | — | | | — | | | 6,774 | |
| | 455,534 | | | | 175,356 | | | 430,849 | | | 4,057,059 | |
| | 94,995 | | | | 41,710 | | | 87,859 | | | 1,036,177 | |
| | 155,789 | | | | 61,976 | | | 140,440 | | | 1,777,666 | |
| | — | | | | — | | | — | | | 6,591 | |
| | 76,276 | | | | 98,554 | | | 119,424 | | | 1,030,955 | |
| | | | | | | | | | | | | |
| | 1,002,695 | | | | 2,115,567 | | | 4,019,853 | | | 39,310,378 | |
| | | | | | | | | | | | | |
| $ | 734,436,123 | | | $ | 327,116,769 | | $ | 696,592,307 | | $ | 8,141,156,816 | |
| | | | | | | | | | | | | |
| $ | — | | | $ | 3,066,218 | | $ | — | | $ | 16,648,966 | |
| | (124,103,097 | ) | | | 6,611,985 | | | 7,530,919 | | | (49,675,559 | ) |
|
123,954,093 |
| | | 115,022,199 | | | 208,893,590 | | | 2,755,490,696 | |
| | 69,260 | | | | 151 | | | 36,269 | | | 149,837 | |
| | 734,515,867 | | | | 202,416,216 | | | 480,131,529 | | | 5,418,542,876 | |
| | | | | | | | | | | | | |
| $ | 734,436,123 | | | $ | 327,116,769 | | $ | 696,592,307 | | $ | 8,141,156,816 | |
| | | | | | | | | | | | | |
| $ | 3,069 | | | $ | 1,097,323 | | $ | 1,827,227 | | $ | 2,925,813 | |
| | 718,424,273 | | | | 294,451,533 | | | 694,765,080 | | | 7,767,712,682 | |
| | 16,008,781 | | | | 31,567,913 | | | — | | | 370,518,321 | |
| | 294 | | | | 51,093 | | | 96,286 | | | 53,880 | |
| | 67,751,307 | | | | 13,624,483 | | | 36,172,462 | | | 142,964,239 | |
| | 1,508,238 | | | | 1,454,320 | | | — | | | 6,818,985 | |
| | $10.45 | (a) | | | $21.48 | | | $18.98 | | | $54.30 | |
| | | | | | | | | | | | | |
| | $10.60 | | | | $21.61 | | | $19.21 | | | $54.33 | |
| | | | | | | | | | | | | |
| | $10.61 | | | | $21.71 | | | — | | | $54.34 | |
| | | | | | | | | | | | | |
See Notes to Financial Statements.
43
Excelsior Funds
Statements of Operations
For the Year Ended March 31, 2007
| | | | | | | | |
| | |
| | | Core Bond Fund | | | Equity
Income
Fund | |
INVESTMENT INCOME: | | | | | | | | |
Dividend income | | $ | 999,150 | | | $ | 6,252,714 | |
Interest income | | | 21,099,384 | | | | 52,535 | |
Less: Foreign taxes withheld | | | — | | | | (36,689 | ) |
| | | | | | | | |
Total Income | | | 22,098,534 | | | | 6,268,560 | |
EXPENSES: | | | | | | | | |
Investment advisory fees (Note 2) | | | 2,873,544 | | | | 1,622,085 | |
Distribution and shareholder servicing fees — Retirement Shares (Note 2) | | | 7 | | | | 9 | |
Shareholder servicing fees — Shares (Note 2) | | | 738,959 | | | | 540,692 | |
Shareholder servicing fees — Institutional Shares (Note 2) | | | — | | | | — | |
Administration fees (Note 2) | | | 633,088 | | | | 326,390 | |
Transfer agent fees | | | 165,543 | | | | 21,161 | |
Legal and audit fees | | | 61,650 | | | | 31,262 | |
Custodian fees | | | 43,655 | | | | 23,306 | |
Directors’/Trustees’ fees and expenses (Note 2) | | | 17,725 | | | | 11,440 | |
Miscellaneous expenses | | | 149,636 | | | | 42,818 | |
| | | | | | | | |
Total Expenses | | | 4,683,807 | | | | 2,619,163 | |
Fees waived and reimbursed by: | | | | | | | | |
Investment Adviser (Note 2) | | | (1,217,980 | ) | | | (240,094 | ) |
Administrator (Note 2) | | | (4,685 | ) | | | (8,005 | ) |
Custody earning credits | | | (8,001 | ) | | | (584 | ) |
| | | | | | | | |
Net Expenses | | | 3,453,141 | | | | 2,370,480 | |
| | | | | | | | |
NET INVESTMENT INCOME (LOSS) | | | 18,645,393 | | | | 3,898,080 | |
| | | | | | | | |
REALIZED AND UNREALIZED GAIN (LOSS) ON INVESTMENTS (NOTE 1): | | | | | | | | |
Net realized gain (loss) on: | | | | | | | | |
Security transactions | | | (67,050 | ) | | | 6,646,316 | |
Net realized gains from redemptions in-kind | | | — | | | | — | |
Foreign currency transactions | | | — | | | | 5,938 | |
Written options | | | — | | | | 70,586 | |
| | | | | | | | |
Total net realized gain (loss) | | | (67,050 | ) | | | 6,722,840 | |
Change in unrealized appreciation (depreciation) of investments, foreign currency translations and written options during the period | | | 5,359,028 | | | | 16,574,010 | |
| | | | | | | | |
Net realized and unrealized gain (loss) on investments, foreign currency transactions and written options | | | 5,291,978 | | | | 23,296,850 | |
| | | | | | | | |
| | |
Net increase (decrease) in net assets resulting from operations | | $ | 23,937,371 | | | $ | 27,194,930 | |
| | | | | | | | |
See Notes to Financial Statements.
44
| | | | | | | | | | | | | | |
| | | |
Large Cap
Growth
Fund | | | Mid Cap Value
and Restructuring
Fund | | | Small Cap
Fund | | | Value and
Restructuring
Fund | |
| | | | | | | | | | | | | | |
| $ | 2,458,581 | | | $ | 6,244,366 | | | $ | 3,234,961 | | | $ | 139,630,565 | |
| | 841,708 | | | | 139,982 | | | | 184,934 | | | | 3,266,334 | |
| | (76,949 | ) | | | (50,757 | ) | | | — | | | | (892,911 | ) |
| | | | | | | | | | | | | | | |
| | 3,223,340 | | | | 6,333,591 | | | | 3,419,895 | | | | 142,003,988 | |
| | | | | | | | | | | | | | |
| | 4,689,122 | | | | 1,889,491 | | | | 4,604,755 | | | | 43,686,889 | |
| | 12 | | | | 720 | | | | 2,276 | | | | 10,250 | |
| | 1,550,709 | | | | 618,540 | | | | 1,534,149 | | | | 16,702,594 | |
| | — | | | | — | | | | — | | | | 96,083 | |
| | 943,523 | | | | 438,688 | | | | 926,552 | | | | 10,988,075 | |
| | 99,116 | | | | 92,953 | | | | 188,887 | | | | 2,073,728 | |
| | 77,595 | | | | 33,086 | | | | 37,683 | | | | 334,628 | |
| | 35,120 | | | | 19,910 | | | | 46,257 | | | | 471,097 | |
| | 21,322 | | | | 13,487 | | | | 21,848 | | | | 190,517 | |
| | 103,152 | | | | 83,107 | | | | 114,086 | | | | 1,139,363 | |
| | | | | | | | | | | | | | | |
| | 7,519,671 | | | | 3,189,982 | | | | 7,476,493 | | | | 75,693,224 | |
| | | | | | | | | | | | | | |
| | (30,328 | ) | | | (3,989 | ) | | | — | | | | — | |
| | (6,217 | ) | | | (10,966 | ) | | | (5,981 | ) | | | (69,676 | ) |
| | (3,856 | ) | | | (1,830 | ) | | | (6,785 | ) | | | (54,238 | ) |
| | | | | | | | | | | | | | | |
| | 7,479,270 | | | | 3,173,197 | | | | 7,463,727 | | | | 75,569,310 | |
| | | | | | | | | | | | | | | |
| | (4,255,930 | ) | | | 3,160,394 | | | | (4,043,832 | ) | | | 66,434,678 | |
| | | | | | | | | | | | | | | |
| | | | | | | | | | | | | | |
| | | | | | | | | | | | | | |
| | 11,805,044 | | | | 8,600,856 | | | | 32,537,688 | | | | 95,436,544 | |
| | — | | | | 23,046,664 | | | | — | | | | — | |
| | — | | | | 1,444 | | | | — | | | | (12,160 | ) |
| | — | | | | — | | | | — | | | | 1,331,652 | |
| | | | | | | | | | | | | | | |
| | 11,805,044 | | | | 31,648,964 | | | | 32,537,688 | | | | 96,756,036 | |
|
37,708,433 |
| | | (10,315,446 | ) | | | 18,105,369 | | | | 645,371,791 | |
| | | | | | | | | | | | | | | |
|
49,513,477 |
| | | 21,333,518 | | | | 50,643,057 | | | | 742,127,827 | |
| | | | | | | | | | | | | | | |
| | | |
| $ | 45,257,547 | | | $ | 24,493,912 | | | $ | 46,599,225 | | | $ | 808,562,505 | |
| | | | | | | | | | | | | | | |
See Notes to Financial Statements.
45
Excelsior Funds
Statements of Changes in Net Assets
| | | | | | | | | | | | | | | | |
| | |
| | |
Core Bond Fund | | | Equity Income Fund | |
| | | Year Ended March 31, | | | Year Ended March 31, | |
| | | 2007 | | | 2006 | | | 2007 | | | 2006 | |
Net investment income (loss) | | $ | 18,645,393 | | | $ | 10,061,835 | | | $ | 3,898,080 | | | $ | 5,148,119 | |
Net realized gain (loss) on investments and foreign currency transactions | | | (67,050 | ) | | | 1,284,930 | | | | 6,652,254 | | | | (5,658,097 | ) |
Net realized gains from redemptions in-kind | | | — | | | | — | | | | — | | | | — | |
Net realized gain (loss) on written options | | | — | | | | — | | | | 70,586 | | | | (17,851 | ) |
Change in unrealized appreciation (depreciation) of investments, foreign currency translations and written options during the period | | | 5,359,028 | | | | (7,274,735 | ) | | | 16,574,010 | | | | 10,334,632 | |
| | | | | | | | | | | | | | | | |
Net increase in net assets resulting from operations | | | 23,937,371 | | | | 4,072,030 | | | | 27,194,930 | | | | 9,806,803 | |
| | | | | | | | | | | | | | | | |
Distributions to shareholders: | | | | | | | | | | | | | | | | |
From net investment income | | | | | | | | | | | | | | | | |
Retirement Shares | | | (40 | ) | | | (38 | ) | | | (15 | ) | | | (18 | ) |
Shares | | | (12,851,594 | ) | | | (10,218,978 | ) | | | (4,109,886 | ) | | | (4,741,203 | ) |
Institutional Shares | | | (5,693,159 | ) | | | (6,254 | ) | | | — | | | | — | |
From net realized gain on investments | | | | | | | | | | | | | | | | |
Retirement Shares | | | — | | | | (13 | ) | | | — | | | | (3 | ) |
Shares | | | — | | | | (3,571,500 | ) | | | — | | | | (591,743 | ) |
Institutional Shares | | | — | | | | (13 | ) | | | — | | | | — | |
| | | | | | | | | | | | | | | | |
Total distributions | | | (18,544,793 | ) | | | (13,796,796 | ) | | | (4,109,901 | ) | | | (5,332,967 | ) |
| | | | | | | | | | | | | | | | |
Increase (decrease) in net assets from fund share transactions (Note 5) | | | 263,311,270 | | | | 80,807,705 | | | | 8,064,710 | | | | 5,710,595 | |
| | | | | | | | | | | | | | | | |
Net increase (decrease) in net assets | | | 268,703,848 | | | | 71,082,939 | | | | 31,149,739 | | | | 10,184,431 | |
| | | | | | | | | | | | | | | | |
NET ASSETS: | | | | | | | | | | | | | | | | |
Beginning of period | | | 283,015,925 | | | | 211,932,986 | | | | 205,853,979 | | | | 195,669,548 | |
| | | | | | | | | | | | | | | | |
End of period(1) | | $ | 551,719,773 | | | $ | 283,015,925 | | | $ | 237,003,718 | | | $ | 205,853,979 | |
| | | | | | | | | | | | | | | | |
(1) Including undistributed (distributions in excess of) net investment income | | $ | 23,250 | | | $ | 2,407 | | | $ | 1,016,788 | | | $ | 1,253,478 | |
| | | | | | | | | | | | | | | | |
See Notes to Financial Statements.
46
| | | | | | | | | | | | | | | | | | | | | | | | | | | | | | |
| | | |
| Large Cap Growth Fund | | | Mid Cap Value
and Restructuring Fund | | | Small Cap Fund | | | Value and Restructuring Fund | |
| Year Ended March 31, | | | Year Ended March 31, | | | Year Ended March 31, | | | Year Ended March 31, | |
| 2007 | | | 2006 | | | 2007 | | | 2006 | | | 2007 | | | 2006 | | | 2007 | | | 2006 | |
| $ | (4,255,930 | ) | | $ | (1,492,015 | ) | | $ | 3,160,394 | | | $ | 286,682 | | | $ | (4,043,832 | ) | | $ | (3,315,401 | ) | | $ | 66,434,678 | | | $ | 62,768,364 | |
| | 11,805,044 | | | | 3,004,935 | | | | 8,602,300 | | | | (1,834,247 | ) | | | 32,537,688 | | | | 29,148,540 | | | | 95,424,384 | | | | 25,898,526 | |
| | — | | | | — | | | | 23,046,664 | | | | — | | | | — | | | | — | | | | — | | | | — | |
| | — | | | | — | | | | — | | | | — | | | | — | | | | — | | | | 1,331,652 | | | | (7,456,185 | ) |
| | 37,708,433 | | | | 59,460,912 | | | | (10,315,446 | ) | | | 51,686,678 | | | | 18,105,369 | | | | 96,294,626 | | | | 645,371,791 | | | | 892,712,062 | |
| | | | | | | | | | | | | | | | | | | | | | | | | | | | | | | |
| | 45,257,547 | | | | 60,973,832 | | | | 24,493,912 | | | | 50,139,113 | | | | 46,599,225 | | | | 122,127,765 | | | | 808,562,505 | | | | 973,922,767 | |
| | | | | | | | | | | | | | | | | | | | | | | | | | | | | | | |
| | | | | | | | | | | | | | | | | | | | | | | | | | | | | | |
| | | | | | | | | | | | | | | | | | | | | | | | | | | | | | |
| | — | | | | — | | | | — | | | | — | | | | — | | | | — | | | | (4,928 | ) | | | (1,311 | ) |
| | — | | | | — | | | | (69,200 | ) | | | (377,856 | ) | | | — | | | | — | | | | (64,324,804 | ) | | | (50,184,813 | ) |
| | — | | | | — | | | | (28,083 | ) | | | (320,565 | ) | | | — | | | | — | | | | (3,526,597 | ) | | | (2,339,479 | ) |
| | | | | | | | | | | | | | | | | | | | | | | | | | | | | | |
| | — | | | | — | | | | — | | | | — | | | | (3,801 | ) | | | (53 | ) | | | — | | | | — | |
| | — | | | | — | | | | (6,735 | ) | | | — | | | | (43,578,479 | ) | | | (26,879,094 | ) | | | — | | | | — | |
| | — | | | | — | | | | (812 | ) | | | — | | | | — | | | | — | | | | — | | | | — | |
| | | | | | | | | | | | | | | | | | | | | | | | | | | | | | | |
| | — | | | | — | | | | (104,830 | ) | | | (698,421 | ) | | | (43,582,280 | ) | | | (26,879,147 | ) | | | (67,856,329 | ) | | | (52,525,603 | ) |
| | | | | | | | | | | | | | | | | | | | | | | | | | | | | | | |
| | 136,983,006 | | | | 281,160,848 | | | | (36,769,439 | ) | | | (6,359,254 | ) | | | 94,185,168 | | | | 15,919,054 | | | | 918,433,748 | | | | 930,527,802 | |
| | | | | | | | | | | | | | | | | | | | | | | | | | | | | | | |
| | 182,240,553 | | | | 342,134,680 | | | | (12,380,357 | ) | | | 43,081,438 | | | | 97,202,113 | | | | 111,167,672 | | | | 1,659,139,924 | | | | 1,851,924,966 | |
| | | | | | | | | | | | | | | | | | | | | | | | | | | | | | | |
| | | | | | | | | | | | | | | | | | | | | | | | | | | | | | |
| | 552,195,570 | | | | 210,060,890 | | | | 339,497,126 | | | | 296,415,688 | | | | 599,390,194 | | | | 488,222,522 | | | | 6,482,016,892 | | | | 4,630,091,926 | |
| | | | | | | | | | | | | | | | | | | | | | | | | | | | | | | |
| $ | 734,436,123 | | | $ | 552,195,570 | | | $ | 327,116,769 | | | $ | 339,497,126 | | | $ | 696,592,307 | | | $ | 599,390,194 | | | $ | 8,141,156,816 | | | $ | 6,482,016,892 | |
| | | | | | | | | | | | | | | | | | | | | | | | | | | | | | | |
| $ | — | | | $ | — | | | $ | 3,066,218 | | | $ | — | | | $ | — | | | $ | — | | | $ | 16,648,966 | | | $ | 19,146,231 | |
| | | | | | | | | | | | | | | | | | | | | | | | | | | | | | | |
See Notes to Financial Statements.
47
Excelsior Funds
Financial Highlights—Selected Per Share Data and Ratios
| | | | | | | | | | | | | | | | | | | | | | | |
| | | | | | |
| | | Net Asset Value,
Beginning of
Year | | Net
Investment
Income (Loss) | | | Net Realized and
Unrealized
Gain (Loss) of
Investments and
Options | | | Total From
Investment
Operations | | | Dividends
From Net
Investment
Income | | | Distributions
From Net
Realized
Gain on
Investments
and Options | |
CORE BOND FUND — (12/31/04*) | | | | | | | | | | | | | | | | | |
Retirement Shares: | | | | | | | | | | | | | | | | | | | | |
Year Ended March 31, | | | | | | | | | | | | | | | | | | | | |
2007 | | $ | 8.85 | | $ | 0.34 | (2) | | $ | 0.13 | (2) | | $ | 0.47 | | | $ | (0.34 | ) | | | — | |
2006 | | | 9.16 | | | 0.33 | (2) | | | (0.19 | )(2) | | | 0.14 | | | | (0.33 | ) | | $ | (0.12 | ) |
Period Ended March 31, 2005 | | | 9.27 | | | 0.07 | (2) | | | (0.06 | )(2) | | | 0.01 | | | | (0.12 | ) | | | — | |
EQUITY INCOME FUND — (12/31/04*) | | | | | | | | | | | | | | | | | |
Retirement Shares: | | | | | | | | | | | | | | | | | | | | |
Year Ended March 31, | | | | | | | | | | | | | | | | | | | | |
2007 | | $ | 8.59 | | $ | 0.12 | (2) | | $ | 0.96 | (2) | | $ | 1.08 | | | $ | (0.13 | ) | | | — | |
2006 | | | 8.43 | | | 0.15 | (2) | | | 0.18 | (2) | | | 0.33 | | | | (0.15 | ) | | $ | (0.02 | ) |
Period Ended March 31, 2005 | | | 8.50 | | | — | (2)(3) | | | (0.07 | )(2) | | | (0.07 | ) | | | — | | | | — | |
LARGE CAP GROWTH FUND — (12/31/04*) | | | | | | | | | | | | | | | | | |
Retirement Shares: | | | | | | | | | | | | | | | | | | | | |
Year Ended March 31, | | | | | | | | | | | | | | | | | | | | |
2007 | | $ | 9.82 | | $ | (0.12 | )(2) | | $ | 0.75 | (2) | | $ | 0.63 | | | | — | | | | — | |
2006 | | | 8.02 | | | (0.11 | )(2) | | | 1.91 | (2) | | | 1.80 | | | | — | | | | — | |
Period Ended March 31, 2005 | | | 8.49 | | | (0.03 | )(2) | | | (0.44 | )(2) | | | (0.47 | ) | | | — | | | | — | |
MID CAP VALUE AND RESTRUCTURING FUND — (12/31/04*) | | | | | | | | | | | | | |
Retirement Shares: | | | | | | | | | | | | | | | | | | | | |
Year Ended March 31, | | | | | | | | | | | | | | | | | | | | |
2007 | | $ | 19.62 | | $ | 0.70 | (2) | | $ | 1.16 | (2) | | $ | 1.86 | | | | — | | | | — | (3) |
2006 | | | 16.78 | | | (0.06 | )(2) | | | 2.90 | (2) | | | 2.84 | | | | — | | | | — | |
Period Ended March 31, 2005 | | | 17.26 | | | (0.01 | )(2) | | | (0.47 | )(2) | | | (0.48 | ) | | | — | | | | — | |
SMALL CAP FUND — (12/31/04*) | | | | | | | | | | | | | | | | | |
Retirement Shares: | | | | | | | | | | | | | | | | | | | | |
Year Ended March 31, | | | | | | | | | | | | | | | | | | | | |
2007 | | $ | 19.12 | | $ | (0.22 | )(2) | | $ | 1.34 | (2) | | $ | 1.12 | | | | — | | | $ | (1.26 | ) |
2006 | | | 16.12 | | | (0.19 | )(2) | | | 4.08 | (2) | | | 3.89 | | | | — | | | | (0.89 | ) |
Period Ended March 31, 2005 | | | 17.00 | | | (0.04 | )(2) | | | (0.84 | )(2) | | | (0.88 | ) | | | — | | | | — | |
VALUE AND RESTRUCTURING FUND — (12/31/04*) | | | | | | | | | | | | | | | | | |
Retirement Shares: | | | | | | | | | | | | | | | | | | | | |
Year Ended March 31, | | | | | | | | | | | | | | | | | | | | |
2007 | | $ | 49.35 | | $ | 0.22 | (2) | | $ | 4.98 | (2) | | $ | 5.20 | | | $ | (0.25 | ) | | | — | |
2006 | | | 41.49 | | | 0.42 | (2) | | | 7.81 | (2) | | | 8.23 | | | | (0.37 | ) | | | — | |
Period Ended March 31, 2005 | | | 42.43 | | | (0.04 | )(2) | | | (0.90 | )(2) | | | (0.94 | ) | | | — | | | | — | |
| * | Commencement of Operations |
| (1) | Expense ratios before waiver of fees and reimbursement of expenses (if any) by adviser and administrator. |
| (2) | For comparative purposes per share amounts are based on average shares outstanding. |
| (3) | Amount represents less than $0.01 per share. |
| (6) | The ratio of net operating expenses would have been 1.60%, if custody credits had not been included. |
See Notes to Financial Statements.
48
| | | | | | | | | | | | | | | | | | | | | | | |
| | | | | | | |
Total
Distributions | | | Net Asset
Value,
End of
Year | | Total
Return | | | Net Assets,
End of
Year (000) | |
Ratio of Net
Operating
Expenses
to Average
Net Assets | | | Ratio of Gross
Operating
Expenses to
Average
Net Assets (1) | | | Ratio of Net
Investment
Income (Loss)
to Average
Net Assets | | | Portfolio
Turnover
Rate | |
| | | | | | | | | | | | | | | | | | | | | | | |
| | | | | | | | | | | | | | | | | | | | | | | |
| | | | | | | | | | | | | | | | | | | | | | | |
| $ | (0.34 | ) | | $ | 8.98 | | 5.47 | % | | $ | 1 | | 1.40 | % | | 1.70 | % | | 3.86 | % | | 49 | % |
| | (0.45 | ) | | | 8.85 | | 1.48 | % | | | 1 | | 1.40 | % | | 1.78 | % | | 3.57 | % | | 95 | % |
| | (0.12 | ) | | | 9.16 | | 0.10 | %(4) | | | 1 | | 1.40 | %(5) | | 1.77 | %(5) | | 3.60 | %(5) | | 90 | %(4) |
| | | | | | | | | | | | | | | | | | | | | | | |
| | | | | | | | | | | | | | | | | | | | | | | |
| | | | | | | | | | | | | | | | | | | | | | | |
| $ | (0.13 | ) | | $ | 9.54 | | 12.68 | % | | $ | 1 | | 1.59 | %(6) | | 1.71 | % | | 1.29 | % | | 27 | % |
| | (0.17 | ) | | | 8.59 | | 4.04 | % | | | 1 | | 1.60 | % | | 1.84 | % | | 1.78 | % | | 46 | % |
| | — | | | | 8.43 | | (1.52 | )%(4) | | | 1 | | 1.55 | %(5) | | 1.76 | %(5) | | 0.02 | %(5) | | 19 | %(4) |
| | | | | | | | | | | | | | | | | | | | | | | |
| | | | | | | | | | | | | | | | | | | | | | | |
| | | | | | | | | | | | | | | | | | | | | | | |
| $ | — | | | $ | 10.45 | | 6.42 | % | | $ | 3 | | 1.69 | % | | 1.70 | % | | (1.18 | )% | | 33 | % |
| | — | | | | 9.82 | | 22.44 | % | | | 3 | | 1.70 | % | | 1.99 | % | | (1.20 | )% | | 24 | % |
| | — | | | | 8.02 | | (5.54 | )%(4) | | | 1 | | 1.55 | %(5) | | 1.78 | %(5) | | (1.45 | )%(5) | | 25 | %(4) |
| | | | | | | | | | | | | | | | | | | | | | | |
| | | | | | | | | | | | | | | | | | | | | | | |
| | | | | | | | | | | | | | | | | | | | | | | |
| $ | — | (3) | | $ | 21.48 | | 9.48 | % | | $ | 1,097 | | 1.61 | % | | 1.64 | % | | 3.38 | % | | 25 | % |
| | — | | | | 19.62 | | 16.92 | % | | | 1 | | 1.46 | % | | 1.46 | % | | (0.34 | )% | | 23 | % |
| | — | | | | 16.78 | | (3.01 | )%(4) | | | 1 | | 1.56 | %(5) | | 1.66 | %(5) | | (0.13 | )%(5) | | 28 | %(4) |
| | | | | | | | | | | | | | | | | | | | | | | |
| | | | | | | | | | | | | | | | | | | | | | | |
| | | | | | | | | | | | | | | | | | | | | | | |
| $ | (1.26 | ) | | $ | 18.98 | | 6.23 | % | | $ | 1,827 | | 1.74 | % | | 1.74 | % | | (1.21 | )% | | 52 | % |
| | (0.89 | ) | | | 19.12 | | 24.83 | % | | | 1 | | 1.56 | % | | 1.56 | % | | (1.13 | )% | | 65 | % |
| | — | | | | 16.12 | | (5.23 | )%(4) | | | 1 | | 1.55 | %(5) | | 1.58 | %(5) | | (1.28 | )%(5) | | 61 | %(4) |
| | | | | | | | | | | | | | | | | | | | | | | |
| | | | | | | | | | | | | | | | | | | | | | | |
| | | | | | | | | | | | | | | | | | | | | | | |
| $ | (0.25 | ) | | $ | 54.30 | | 10.58 | % | | $ | 2,926 | | 1.55 | % | | 1.55 | % | | 0.43 | % | | 13 | % |
| | (0.37 | ) | | | 49.35 | | 19.95 | % | | | 896 | | 1.56 | % | | 1.56 | % | | 0.90 | % | | 12 | % |
| | — | | | | 41.49 | | (2.58 | )%(4) | | | 1 | | 1.57 | %(5) | | 1.59 | %(5) | | (0.35 | )%(5) | | 8 | %(4) |
See Notes to Financial Statements.
49
EXCELSIOR FUNDS
NOTES TO FINANCIAL STATEMENTS
| 1. | Significant Accounting Policies: |
Excelsior Funds, Inc. (“Excelsior Fund”) was incorporated under the laws of the State of Maryland on August 2, 1984. Excelsior Funds Trust (the “Trust”) is a statutory trust organized under the laws of the State of Delaware on April 27, 1994. Excelsior Fund and the Trust are registered under the Investment Company Act of 1940, as amended (the “1940 Act”), as open-ended diversified management investment companies.
Excelsior Fund and the Trust currently offer shares in fifteen and five managed investment portfolios, respectively, each having its own investment objectives and policies. The following is a summary of significant accounting policies for Core Bond Fund, Large Cap Growth Fund, Small Cap Fund and Value and Restructuring Fund, portfolios of Excelsior Fund, Equity Income Fund and Mid Cap Value and Restructuring Fund, portfolios of the Trust (each a “Fund”, collectively the “Funds”). Such policies are in conformity with accounting principles generally accepted in the United States of America and are consistently followed by Excelsior Fund and the Trust in the preparation of their financial statements. The preparation of financial statements requires management to make estimates and assumptions that affect the reported amounts and disclosures in the financial statements. Actual results could differ from these estimates.
The Equity Income Fund and Small Cap Fund offer two classes of shares: Retirement Shares and Shares. The Core Bond Fund, Large Cap Growth Fund, Mid Cap Value and Restructuring Fund and Value and Restructuring Fund offer three classes of shares: Retirement Shares, Shares and Institutional Shares. The Financial Highlights of the Shares and Institutional Shares as well as the financial statements for the remaining portfolios of Excelsior Fund and the Trust are presented separately.
Under a plan of reorganization adopted by the Trust, all of the assets and liabilities of the Income Fund and Total Return Bond Fund were transferred to the Institutional Shares of the Core Bond Fund. The reorganization, which qualified as a tax-free exchange for federal income tax purposes, was completed at the close of business on September 27, 2006. The following is a summary of shares outstanding, net assets, net asset value per share issued and unrealized appreciation/depreciation immediately before and after the reorganization.
| | | | | | | | | | | | |
| | | Before Reorganization | | After
Reorganization |
| | | Income Fund | | Total Return
Bond Fund | | Core Bond
Fund | | Core Bond
Fund |
Shares: | | | | | | | | | | | | |
Shares | | | — | | | — | | | 32,810,661 | | | 32,810,661 |
Institutional Shares | | | 13,965,104 | | | 18,165,949 | | | 1,824,521 | | | 26,973,187 |
Retirement Shares | | | — | | | — | | | 117 | | | 117 |
Net Assets: | | | | | | | | | | | | |
Shares | | | — | | | — | | $ | 294,116,361 | | $ | 294,116,361 |
Institutional Shares | | $ | 96,434,781 | | $ | 129,070,075 | | $ | 16,360,288 | | $ | 241,865,144 |
Retirement Shares | | | — | | | — | | $ | 1,046 | | $ | 1,046 |
50
| | | | | | | | | | | | | |
| | | Before Reorganization | | After
Reorganization |
| | | Income Fund | | | Total Return
Bond Fund | | Core Bond
Fund | | Core Bond
Fund |
Net Asset Value: | | | | | | | | | | | | | |
Shares | | | — | | | | — | | $ | 8.96 | | $ | 8.96 |
Institutional Shares | | $ | 6.91 | | | $ | 7.11 | | $ | 8.97 | | $ | 8.97 |
Retirement Shares | | | — | | | | — | | $ | 8.97 | | $ | 8.97 |
| | | | |
Net unrealized appreciation/(depreciation) | | $ | (248,669 | ) | | $ | 617,540 | | $ | 740,329 | | $ | 1,109,200 |
(a) Portfolio valuation:
Investments in securities that are traded on a recognized domestic and foreign stock exchange are valued at the last sale price on the exchange on which such securities are primarily traded or at the last quoted sale price on a national securities market. Securities traded over-the-counter are valued each business day on the basis of closing over-the-counter sale prices. Equity securities that are traded on the NASDAQ National Market System for which quotations are readily available are valued at the official closing price. Securities for which there were no transactions are valued at the last quoted sales price for the most recent day such prices were available. Securities for which market quotations or valuation by pricing agent are not readily available are valued in good faith at fair value pursuant to procedures adopted by the Board of Directors with regard to Excelsior Fund and the Board of Trustees with regard to the Trust. The Funds have engaged a third party fair value service provider to systematically recommend the adjustment of closing market prices of securities traded principally in foreign markets.
Short-term debt instruments that mature in 60 days or less are valued at amortized cost, which approximates market value. If available, debt securities are priced based upon valuations provided by independent, third-party pricing agents. The third party pricing agents value debt securities at an evaluated price by employing methodologies that utilize actual market transactions, broker-supplied valuations, or other methodologies designed to identify the market value for such securities.
Investment valuations and other assets and liabilities initially expressed in foreign currencies are converted each business day into U.S. dollars based upon current exchange rates. Purchases and sales of foreign investments and income and expenses are converted into U.S. dollars based upon currency exchange rates prevailing on the respective dates of such transactions. The Funds do not isolate the portion of gains and losses on investment securities that is due to changes in the foreign exchange rates from that which is due to changes in market prices of such securities. The Funds report gains and losses on foreign currency related transactions as realized and unrealized gains and losses for financial reporting purposes, whereas such components are treated as ordinary income or loss for federal income tax purposes.
Mutual funds are valued at their respective net asset values as determined by those funds in accordance with the 1940 Act.
51
(b) Forward foreign currency exchange contracts:
The Funds’ participation in forward currency exchange contracts will be limited to hedging involving either specific transactions or portfolio positions. Transaction hedging involves the purchase or sale of foreign currency with respect to specific receivables or payables of a Fund generally arising in connection with the purchase or sale of its portfolio securities. Risk may arise upon entering into these contracts from the potential inability of counterparties to meet the terms of their contracts and is generally limited to the amount of unrealized gain on the contracts, if any, at the date of default. Risk may also arise from unanticipated movements in the value of foreign currency relative to the U.S. dollar. Contracts are marked to market daily and the change in market value is recorded as unrealized appreciation or depreciation. Realized gains or losses arising from such transactions are included in net realized gains or losses from foreign currency transactions.
The Value and Restructuring Fund had the following forward foreign currency contracts outstanding as of March 31, 2007:
| | | | | | | | | |
| Settlement Dates | | Currency to
Receive | | In Exchange
For | | Unrealized
Appreciation | |
Foreign Currency Purchases: | | | | | | | | | |
04/04/07 | | CHF 4,345,557 | | $ | 3,584,260 | | $ | (6,774 | ) |
Currency Legend:
CHF Swiss Franc
(c) Covered call options written:
Certain Funds may engage in writing covered call options. By writing a covered call option, a Fund forgoes the opportunity to profit from an increase in the market price of the underlying security above the exercise price, except insofar as the premium represents such a profit.
When a Fund writes an option, an amount equal to the net premium (the premium less the commission) received by that Fund is included in the liability section of that Fund’s statement of assets and liabilities as a deferred credit. The amount of the deferred credit will be subsequently marked to market to reflect the current value of the option written. The current value of the traded option is the last sale price or, in the absence of a sale, the last quoted sale price for the most recent day such price was available. If an option expires on the stipulated expiration date, or if the Fund involved enters into a closing purchase transaction, the Fund will realize a gain (or loss if the cost of a closing purchase transaction exceeds the net premium received when the option is sold), and the deferred credit related to such option will be eliminated. If an option is exercised, the Fund involved may deliver the underlying security from its portfolio or purchase the underlying security in the open market. In either event, the proceeds of the sale will be increased by the net premium originally received, and the Fund involved will realize a gain or loss. Premiums from expired call options written by the Fund and net gains from closing purchase transactions are treated as short-term capital gains for Federal income tax purposes, and losses on closing purchase transactions are short-term capital losses.
52
There is no assurance that a liquid secondary market on an exchange will exist for any particular option. A covered option writer, unable to effect a closing purchase transaction, will not be able to sell the underlying security until the option expires or is delivered upon exercise. As a result, the writer in such circumstances will be subject to the risk of market decline in the underlying security during such period and to the risk that market values increase beyond the option exercise price, in each case to the extent not offset by the net premium. A Fund will write an option on a particular security only if the Adviser believes that a liquid secondary market will exist on an exchange for options of the same series, which will permit the Fund to make a closing purchase transaction in order to close out its position.
During the year ended March 31, 2007, the Equity Income Fund had the following written option transactions:
| | | | | | | |
| Written Option Transactions | | Number of
Contracts | | | Premiums | |
Outstanding, beginning of year | | — | | | $ | — | |
Options written | | (1,000 | ) | | | (151,152 | ) |
Options expired | | — | | | | — | |
Options exercised | | — | | | | — | |
Options terminated in closing purchase transactions | | 1,000 | | | | 151,152 | |
| | | | | | | |
Outstanding, end of year | | — | | | $ | — | |
| | | | | | | |
During the year ended March 31, 2007, the Value and Restructuring Fund had the following written option transactions:
| | | | | | | |
| Written Option Transactions | | Number of Contracts | | | Premiums | |
Outstanding, beginning of year | | (4,468 | ) | | $ | (1,760,972 | ) |
Options written | | (28,000 | ) | | | (7,314,498 | ) |
Options expired | | 4,468 | | | | 1,760,972 | |
Options exercised | | — | | | | — | |
Options terminated in closing purchase transactions | | 5,000 | | | | 636,240 | |
| | | | | | | |
Outstanding, end of year | | (23,000 | ) | | $ | (6,678,258 | ) |
| | | | | | | |
(d) Security transactions and investment income:
Security transactions are recorded on a trade date basis. Realized gains and losses on investments sold are recorded on the basis of identified cost. Interest income, adjusted for amortization of premiums and discounts on investments, is earned from settlement date and is recorded on the accrual basis. Dividend income is recorded on the ex-dividend date, except for certain dividends from foreign securities, which are recorded as soon as the Funds are informed of the dividend.
(e) Redemption In-kind:
In certain circumstances, the Funds may distribute portfolio securities rather than cash as payment for a redemption of a Funds shares (redemption in-kind). For financial reporting
53
purposes, the Funds recognize a gain on the in-kind redemptions to the extent the value of the distributed securities on the date of redemption exceeds the cost of those securities; the Funds recognize a loss if cost exceeds value. Gains and losses realized on the redemptions in-kind are not recognized for tax purposes, and are reclassified from undistributed realized gain (losses) to paid-in capital. During the year ended March 31, 2007, the Mid Cap Value and Restructuring Fund realized $23,046,664 of net gains on $66,339,150 of redemptions in-kind.
(f) Repurchase agreements:
The Funds may enter into agreements with financial institutions deemed to be creditworthy by the investment adviser subject to the seller’s agreement to repurchase and the Funds’ agreement to resell such securities at mutually agreed upon prices. The repurchase agreements are collateralized by U.S. Government obligations. The value of the collateral underlying the repurchase agreements will always be at least equal to the repurchase price, including any accrued interest earned on the repurchase agreement. If the counter-party defaults, and the fair value of the collateral declines, realization of the collateral by the Funds may be delayed or limited.
Default or bankruptcy of the seller may, however, expose the applicable Fund to possible delay in connection with the disposition of the securities or loss to the extent that proceeds from a sale of the underlying securities were less than the repurchase price under the agreement.
(g) Futures Contracts:
Certain Funds may enter into futures contracts. Upon entering into a futures contract, the Funds deposit and maintain as cash collateral such initial margin as may be required by the exchanges on which the transaction is affected. Pursuant to the contracts, the Funds agree to receive from or pay to the broker an amount of cash equal to the daily fluctuation in the value of the contract. Such receipts or payments are known as “variation margin” and are recorded by the Funds as variation margin receivable or payable on futures contracts. During the period the futures contracts are open, changes in the value of the contracts are recognized on a daily basis to reflect the market value for the contracts at the end of each day’s trading and are recorded as unrealized gains or losses. When the contract is closed, the Funds record a realized gain or loss equal to the difference between the value of the contract at the time it was opened and the value at the time it was closed.
(h) TBA purchase commitments:
Certain Funds may enter into “TBA” (To Be Announced) purchase commitments to purchase securities for a fixed price at a future date, typically not exceeding 45 days. TBA purchase commitments may be considered securities in themselves, and involve risk of loss if the value of the security to be purchased declines prior to settlement date. The Fund must maintain liquid securities having a value not less than the purchase price (including accrued interest) for such purchase commitments. Unsettled TBA purchase commitments are valued at the current market value of the underlying securities, according to the procedures described under “Portfolio Valuation” above.
(i) Distributions to shareholders:
Dividends equal to all or substantially all of each Fund’s net investment income will be declared and paid as follows: for Equity Income Fund, Large Cap Growth Fund, Mid Cap Value and
54
Restructuring Fund, Small Cap Fund and Value and Restructuring Fund, dividends will be declared and paid quarterly; for the Core Bond Fund, dividends from net investment income are declared daily and paid monthly. Net realized capital gains, unless offset by any available capital loss carryforward, are distributed at least annually. Dividends and distributions are recorded on the ex-dividend date.
(j) Expense allocation:
Expenses directly attributable to a Fund are charged to that Fund. Other expenses are allocated to the respective Fund based on average daily net assets. Expenses attributable to a specific class of shares, such as shareholder servicing and distribution fees, are charged directly to that class.
(k) Borrowing:
The funds may obtain temporary bank loans from banks and custodians to use for meeting shareholder redemptions or for temporary or emergency purposes. The board of trustees approved an agreement between Excelsior Fund and the Trust and their custodian, JPMorgan Chase Bank, N.A., under which the funds may participate in an uncommitted line of credit in the aggregate principal amount of $150 million. The funds pay interest on the amounts they borrow at negotiated rates based on the terms of the agreement. There was no borrowing from the line of credit for any funds during the year ended March 31, 2007.
(l) Custody Credits:
Each Fund has an arrangement with its custodian bank under which the Fund receives a credit for its uninvested cash balance to offset its custody fees. The credit amounts (if any) are disclosed in the statement of operations as a reduction to the Fund’s operating expenses.
(m) New Accounting Standards:
In September 2006, the Financial Accounting Standards Board (FASB) issued Statement of Financial Accounting Standards No. 157, “Fair Value Measurements” (SFAS No. 157). SFAS No. 157 defines fair value, establishes a framework for measuring fair value in accordance with generally accepted accounting principles and expands disclosure about fair value measurements. SFAS No. 157 is effective for fiscal years beginning after November 15, 2007. Management is currently evaluating the impact the adoption of SFAS No. 157 will have on the Fund’s financial statements.
In July 2006, the FASB released FASB Interpretation No. 48 “Accounting for Uncertainty in Income Taxes” (“FIN 48”). FIN 48 provides guidance for how uncertain tax positions should be recognized, measured, presented and disclosed in the financial statements. FIN 48 requires the evaluation of tax positions taken or expected to be taken in the course of preparing the Fund’s tax return to determine whether the tax positions are “more-likely-than-not” of being sustained by the applicable tax authority. Tax positions not deemed to meet the more-likely-than-not threshold would be recorded as a tax benefit or expense in the period of determination. Adoption of FIN 48 is required no later than the last business day of the first financial statement reporting period for fiscal years beginning after December 15, 2006. A fund with a fiscal year ending March 31 will implement FIN 48 no later than September 28, 2007, and it is to be applied to all open tax years as of the effective date. Management is currently evaluating the impact of the adoption of FIN 48 to the financial statements.
55
| 2. | Investment Advisory Fee, Administration Fee, Shareholder Servicing Fees and Related Party Transactions: |
The Funds are advised by U.S. Trust New York Asset Management Division (“NYAMD”), a separate identifiable division of United States Trust Company, National Association (“USTNA”), or UST Advisers, Inc. (“USTA” and together with NYAMD, the “Advisers”). USTA is a wholly-owned subsidiary of USTNA. USTNA is a wholly-owned subsidiary of U.S. Trust Corporation, a registered bank holding company, which, in turn, is a wholly-owned subsidiary of The Charles Schwab Corporation. For the services provided pursuant to the Investment Advisory Agreements, each Adviser receives a fee, computed daily and paid monthly, as follows:
| | | |
Core Bond Fund | | 0.65% | * |
Equity Income Fund | | 0.75% | |
Large Cap Growth Fund | | 0.75% | |
Mid Cap Value and Restructuring Fund | | 0.65% | |
Small Cap Fund | | 0.75% | |
Value and Restructuring Fund | | 0.60% | |
| * | On September 28, 2006, the Core Bond Fund changed its Investment Advisory fee to 0.65% from 0.75%. |
On November 20, 2006, The Charles Schwab Corporation (“Schwab”) announced an agreement to sell the U.S. Trust Corporation (“U.S. Trust”) a wholly-owned subsidiary of Schwab, to the Bank of America Corporation (the “Sale”). The Sale includes all of U.S. Trust’s subsidiaries, including USTA and USTNA. The completion of the Sale may result in the assignment of the current investment advisory agreements and termination in accordance with their terms. Therefore, the Board of Trustees/Directors approved the new investment advisory agreements at the same advisory fee rates disclosed above in January 2007 and Shareholders of each Fund approved the new agreements during meetings held in March and April 2007. It is anticipated that the sale will close early in the third quarter of 2007.
USTA and BISYS Fund Services Ohio, Inc. (collectively, the “Administrators”) provide administrative services to the Funds. For the services provided to the Funds, the Administrators are entitled jointly to annual fees, computed daily and paid monthly, based on the combined aggregate average daily net assets of Excelsior Fund, Excelsior Tax-Exempt Funds, Inc. (“Excelsior Tax-Exempt Fund”) and the Trust (excluding the international equity portfolios of Excelsior Fund and the Trust), all of which are affiliated investment companies, as follows: 0.200% of the first $200 million, 0.175% of the next $200 million and 0.150% over $400 million. The Administrators are entitled jointly to annual fees, computed daily and paid monthly, at the annual rate of 0.20% of the average daily net assets of the Emerging Markets Fund, International Equity Fund, International Fund and Pacific/Asia Fund. Administration fees payable by each Fund of the Excelsior Fund, the Trust and Excelsior Tax-Exempt Fund are determined in proportion to the relative average daily net assets of the respective Fund for the period paid. For the year ended March 31, 2007, administration fees paid to USTA were as follows:
| | | |
| | | Administration Fees paid to UST
Advisers, Inc. |
Core Bond Fund | | $ | 571,558 |
Equity Income Fund | | | 294,433 |
Large Cap Growth Fund | | | 851,157 |
Mid Cap Value and Restructuring Fund | | | 395,738 |
Small Cap Fund | | | 835,832 |
Value and Restructuring Fund | | | 9,912,241 |
56
BISYS Fund Services Ohio, Inc., waived Administration fees as presented on the Statements of Operations.
From time to time, in its sole discretion, each Adviser may undertake to waive a portion or all of the fees payable to it and may also reimburse the Funds for a portion of other expenses. For the year ended March 31, 2007, the Advisers have contractually agreed to waive investment advisory fees through, at least, July 31, 2007, and to reimburse other operating expenses to the extent necessary to keep total operating expenses from exceeding the following annual percentages of each Fund’s average daily net assets:
| | | |
Core Bond Fund — Retirement Shares | | 1.40 | % |
Equity Income Fund — Retirement Shares | | 1.60 | % |
Large Cap Growth Fund — Retirement Shares | | 1.70 | % |
Mid Cap Value and Restructuring Fund — Retirement Shares | | 1.64 | % |
Small Cap Fund — Retirement Shares | | 1.75 | % |
Value and Restructuring Fund — Retirement Shares | | 1.64 | % |
Core Bond Fund — Shares | | 0.90 | % |
Equity Income Fund — Shares | | 1.10 | % |
Large Cap Growth Fund — Shares | | 1.20 | % |
Mid Cap Value and Restructuring Fund — Shares | | 1.14 | % |
Small Cap Fund — Shares | | 1.25 | % |
Value and Restructuring Fund — Shares | | 1.14 | % |
Core Bond Fund — Institutional Shares | | 0.65 | % |
Mid Cap Value and Restructuring Fund — Institutional Shares | | 0.89 | % |
Value and Restructuring Fund — Institutional Shares | | 0.89 | % |
For the year ended March 31, 2007, pursuant to the above, investment advisory fees waived by the Advisers were as follows:
| | | |
Core Bond Fund | | $ | 1,217,980 |
Equity Income Fund | | | 240,094 |
Large Cap Growth Fund | | | 30,328 |
Mid Cap Value and Restructuring Fund | | | 3,989 |
Small Cap Fund | | | — |
Value and Restructuring Fund | | | — |
The Funds have entered into shareholder servicing agreements with various service organizations, which include Charles Schwab & Co. Inc. (“CS & Co.”) and USTA. Services included in the servicing agreements include assistance in processing purchase, exchange and redemption requests; transmitting and receiving funds in connection with customer orders to purchase, exchange or redeem shares; and providing periodic statements. Shareholder servicing fees are incurred on a Fund or class level (where applicable). In consideration for these services, each service organization receives a fee from the Funds, computed daily and paid monthly, at an annual rate up to 0.25% of the average daily net assets of the Fund’s shares held by each service organization’s customers. The Advisers, out of their own resources, may additionally compensate certain organizations for providing these and other services.
57
For the year ended March 31, 2007, shareholder servicing fees paid to CS & Co. and USTA were as follows:
| | | |
Core Bond Fund | | $ | 496,810 |
Equity Income Fund | | | 526,446 |
Large Cap Growth Fund | | | 1,426,385 |
Mid Cap Value and Restructuring Fund | | | 530,044 |
Small Cap Fund | | | 1,357,921 |
Value and Restructuring Fund | | | 9,637,460 |
BISYS Fund Services Limited Partnership (the “Distributor”) serves as the Distributor of the Funds. Shares of each Fund are sold without a sales charge on a continuous basis by the Distributor.
Certain Funds have adopted a Distribution Plan pursuant to Rule 12b-1 under the 1940 Act, under which the Core Bond Fund, Equity Income Fund, Large Cap Growth Fund, Mid Cap Value and Restructuring Fund, Small Cap Fund and Value and Restructuring Fund may compensate the Distributor monthly for its services which are intended to result in the sale of Retirement Shares, in an amount not to exceed the annual rate of 0.50%, of the average daily net asset value of such Fund’s Retirement Shares. For the year ended March 31, 2007, fees paid for Retirement Shares of the Core Bond Fund, Equity Income Fund, Large Cap Growth Fund, Mid Cap Value and Restructuring Fund, Small Cap Fund and Value and Restructuring Fund were $4, $5, $8, $480, $1,538 and $6,926, respectively.
The board of trustees/directors may include people who are officers and/or trustees of other fund families affiliated to the investment adviser. Federal securities law limits the percentage of the “interested persons” who may serve on a trust’s board, and the Funds are in compliance with these limitations. The funds did not pay any of the interested persons for their service as trustees/directors, but did pay non-interested persons (independent trustees), as noted in each fund’s Statement of Operations.
| 3. | Purchases, Sales and Maturities of Securities: |
For the year ended March 31, 2007, purchases, sales and maturities of securities for the Funds, excluding short-term investments and written options transactions, aggregated:
| | | | | | |
| | | Purchases | | Sales and
Maturities |
Core Bond Fund | | | | | | |
U.S. Government | | $ | 143,164,160 | | $ | 130,390,053 |
Other | | | 56,826,501 | | | 58,962,109 |
Equity Income Fund | | | 64,891,652 | | | 59,073,738 |
Large Cap Growth Fund | | | 346,922,787 | | | 198,866,947 |
Mid Cap Value and Restructuring Fund | | | 74,873,791 | | | 113,235,162 |
Small Cap Fund | | | 362,658,964 | | | 318,273,911 |
Value and Restructuring Fund | | | 1,940,746,100 | | | 930,382,978 |
58
It is the policy of Excelsior Fund and the Trust that each Fund continue to qualify as a regulated investment company, by complying with the requirements of the Internal Revenue Code applicable to regulated investment companies, and by distributing substantially all of its taxable earnings to its shareholders.
In order to avoid a federal excise tax, each Fund is required to distribute certain minimum amounts of net realized capital gain and net investment income for the respective twelve-month periods ending October 31 and December 31 each calendar year.
Net realized gains of the Funds derived in certain countries are subject to certain foreign taxation.
Dividends and distributions are determined in accordance with federal income tax regulations and may differ from accounting principles generally accepted in the United States of America. These differences are primarily due to differing treatments for net operating losses, foreign currency transactions, passive foreign investment companies, partnership income, deferral of losses on wash sales and net capital losses and net currency losses incurred after October 31 through the end of the fiscal year (“Post-October losses”). To the extent these differences are permanent in nature, such amounts are reclassified within the composition of net assets based on their federal tax-basis treatment; temporary differences do not require reclassification.
Accordingly, the following reclassifications, as of March 31, 2007, were made to/from the following accounts:
| | | | | | | | | | | | |
| | | Undistributed
Net Investment
Income | | | Accumulated
Net Realized
Gain (Loss) | | | Paid-In-Capital | |
Core Bond Fund | | $ | (79,757 | ) | | $ | 79,739 | | | $ | 18 | |
Equity Income Fund | | | (24,869 | ) | | | 24,869 | | | | — | |
Large Cap Growth Fund | | | 4,255,930 | | | | — | | | | (4,255,930 | ) |
Mid Cap Value and Restructuring Fund | | | 3,107 | | | | (23,048,108 | ) | | | 23,045,001 | |
Small Cap Fund | | | 4,043,832 | | | | — | | | | (4,043,832 | ) |
Value and Restructuring Fund | | | (1,075,614 | ) | | | 1,078,111 | | | | (2,497 | ) |
59
The tax character of dividends and distributions declared during the years ended March 31, 2007 and March 31, 2006 were as follows:
| | | | | | | | | | | | |
| | | Ordinary
Income | | Long-Term
Capital Gain | | Return of
Capital | | Total* |
Core Bond Fund | | | | | | | | | | | | |
Year ended March 31, 2007 | | $ | 17,474,254 | | $ | — | | $ | — | | $ | 17,474,254 |
Year ended March 31, 2006 | | | 11,105,896 | | | 2,085,376 | | | — | | | 13,191,272 |
Equity Income Fund | | | | | | | | | | | | |
Year ended March 31, 2007 | | | 4,109,901 | | | — | | | — | | | 4,109,901 |
Year ended March 31, 2006 | | | 5,332,967 | | | — | | | — | | | 5,332,967 |
Large Cap Growth Fund | | | | | | | | | | | | |
Year ended March 31, 2007 | | | — | | | — | | | — | | | — |
Year ended March 31, 2006 | | | — | | | — | | | — | | | — |
Mid Cap Value and Restructuring Fund | | | | | | | | | | | | |
Year ended March 31, 2007 | | | 97,283 | | | 7,547 | | | — | | | 104,830 |
Year ended March 31, 2006 | | | 675,482 | | | — | | | 22,939 | | | 698,421 |
Small Cap Fund | | | | | | | | | | | | |
Year ended March 31, 2007 | | | 2,271,022 | | | 41,311,258 | | | — | | | 43,582,280 |
Year ended March 31, 2006 | | | — | | | 26,879,147 | | | — | | | 26,879,147 |
Value and Restructuring Fund | | | | | | | | | | | | |
Year ended March 31, 2007 | | | 67,856,329 | | | — | | | — | | | 67,856,329 |
Year ended March 31, 2006 | | | 52,525,603 | | | — | | | — | | | 52,525,603 |
| * | | The total distributions paid may differ from the Statement of Changes in Net Assets because for tax purposes, dividends are recognized when actually paid. |
As of March 31, 2007, the components of distributable earnings (accumulated losses) on a tax basis were as follows:
| | | | | | | | | | | | | | | | | | | | | |
| | | Undistributed
Ordinary
Income | | Undistributed
Long-Term
Capital Gain | | Distributions
Payable* | | | Accumulated
Capital and
Other Losses | | | Unrealized
Appreciation
(Depreciation) | | Total
Accumulated
Earnings/
(Deficit) | |
Core Bond Fund | | $ | 2,127,629 | | $ | — | | $ | (2,104,382 | ) | | $ | (1,634,009 | ) | | $ | 863,400 | | $ | (733,365 | ) |
Equity Income Fund | | | 1,088,747 | | | 884,717 | | | — | | | | — | | | | 40,922,443 | | | 42,895,907 | |
Large Cap Growth Fund | | | — | | | — | | | — | | | | (124,103,097 | ) | | | 123,954,093 | | | (149,004 | ) |
Mid Cap Value and Restructuring Fund | | | 3,066,218 | | | 6,619,753 | | | — | | | | — | | | | 115,014,431 | | | 124,700,402 | |
Small Cap Fund | | | — | | | 8,347,130 | | | — | | | | — | | | | 208,077,379 | | | 216,424,509 | |
Value and Restructuring Fund | | | 19,173,059 | | | — | | | — | | | | (48,831,557 | ) | | | 2,754,129,333 | | | 2,724,470,835 | |
| * | | The total distributions payable may differ from the statement of Assets and Liabilities because for tax purposes, dividends are recognized when actually paid. |
Post-October losses are deemed to arise on the first business day of a Fund’s next taxable year. As of March 31, 2007, the Value and Restructuring Fund deferred, on a tax basis, post-October losses of $1,537,981.
60
For federal income tax purposes, capital loss carryforwards may be carried forward and applied against future capital gains. To the extent that such carryforwards are utilized, capital gains distributions will be reduced. At March 31, 2007, the following Funds had capital loss carryforwards available to offset future net capital gains through the indicated expiration dates:
| | | | | | | | | | | | | | | | | | | | | |
| | | Expires |
| | 2010 | | 2011 | | 2012 | | 2013 | | 2014 | | 2015 | | Total |
Core Bond Fund | | $ | — | | $ | — | | $ | — | | $ | — | | $ | 1,303,908 | | $ | 330,101 | | $ | 1,634,009 |
Large Cap Growth Fund | | | 18,217,588 | | | 83,374,895 | | | 22,030,449 | | | 480,165 | | | — | | | — | | | 124,103,097 |
Value and Restructuring
Fund | | | — | | | 19,930,042 | | | 27,363,534 | | | — | | | — | | | — | | | 47,293,576 |
At March 31, 2007, aggregate gross unrealized appreciation for all securities for which there was an excess of value over estimated tax cost and aggregate gross unrealized depreciation for all securities for which there was an excess of estimated tax cost over value is as follows:
| | | | | | | | | | | | | |
| | | Federal Tax
Cost | | Tax Basis
Unrealized
Appreciation | | Tax Basis
Unrealized
(Depreciation) | | | Net
Unrealized
Appreciation |
Core Bond Fund | | $ | 549,492,440 | | $ | 4,344,919 | | $ | (3,481,519 | ) | | $ | 863,400 |
Equity Income Fund | | | 195,179,846 | | | 42,742,397 | | | (1,820,088 | ) | | | 40,922,309 |
Large Cap Growth Fund | | | 610,313,025 | | | 150,431,767 | | | (26,477,674 | ) | | | 123,954,093 |
Mid Cap Value and Restructuring Fund | | | 211,902,432 | | | 123,240,542 | | | (8,226,111 | ) | | | 115,014,431 |
Small Cap Fund | | | 490,771,821 | | | 213,733,622 | | | (5,656,243 | ) | | | 208,077,379 |
Value and Restructuring Fund | | | 5,383,591,798 | | | 2,919,161,157 | | | (167,868,357 | ) | | | 2,751,292,794 |
Excelsior Fund has authorized capital of 35 billion shares of Common Stock, 29.3756 billion of which is currently classified to represent interests in certain classes of shares. Authorized capital currently offered for each Fund is as follows: 1.5 billion shares of the Value and Restructuring Fund; 1 billion shares each of the Large Cap Growth Fund, Small Cap Fund; and 750 million shares of the Core Bond Fund. Each share has a par value of $0.001 and represents an equal proportionate interest in the particular Fund with other shares of the same Fund and is entitled to such dividends and distributions of taxable earnings on the assets belonging to such Fund as are declared at the discretion of Excelsior Fund’s Board of Directors.
The Trust has authorized an unlimited number of shares of beneficial interest of each class of each Fund. Each share has a par value of $0.00001 and represents an equal proportionate interest in the particular Fund with other shares of the same Fund, and is entitled to such dividends and distributions of taxable earnings on the assets belonging to such Fund as are declared at the discretion of the Trust’s Board of Trustees.
On shares purchased on or after October 16, 2006, a redemption fee of 2% of the value of the shares redeemed or exchanged was imposed on shares of the Equity Income Fund, Large Cap Growth Fund, Mid Cap Value and Restructuring Fund, Small Cap Fund and Value and Restructuring Fund redeemed or exchanged 30 days or less after their date of purchase. The redemption fee is intended to limit short-term trading in the Fund.
61
| Capital | Share Transactions |
| | | | | | | | | | | | | | |
| | | Core Bond Fund | |
| | | Year Ended 03/31/07 | | | Year Ended 03/31/06 | |
| | | Shares | | | Amount | | | Shares | | | Amount | |
Sold: | | | | | | | | | | | | | | |
Retirement Shares | | — | | | | — | | | — | | | | — | |
Shares | | 9,986,679 | | | $ | 88,776,364 | | | 13,774,392 | | | $ | 125,488,152 | |
Institutional Shares | | 2,772,888 | | | | 24,623,459 | | | 141,024 | | | | 1,262,505 | |
Issued in connection with merger(a) | | 25,148,666 | | | | 225,504,856 | | | — | | | | — | |
Issued as reinvestment of dividends: | | | | | | | | | | | | | | |
Retirement Shares | | 4 | | | | 40 | | | 5 | | | | 50 | |
Shares | | 673,001 | | | | 5,989,211 | | | 681,642 | | | | 6,160,386 | |
Institutional Shares | | 113,170 | | | | 1,016,339 | | | 189 | | | | 1,685 | |
Redeemed: | | | | | | | | | | | | | | |
Retirement Shares | | — | | | | — | | | (16 | ) | | | (151 | ) |
Shares | | (7,567,445 | ) | | | (67,312,972 | ) | | (5,733,515 | ) | | | (52,104,922 | ) |
Institutional Shares | | (1,706,058 | ) | | | (15,286,027 | ) | | — | | | | — | |
| | | | | | | | | | | | | | |
Net Increase (Decrease) | | 29,420,905 | | | $ | 263,311,270 | | | 8,863,721 | | | $ | 80,807,705 | |
| | | | | | | | | | | | | | |
| | | | | | | | | | | | | | |
| | | Equity Income Fund | |
| | Year Ended 03/31/07 | | | Year Ended 03/31/06 | |
| | | Shares | | | Amount | | | Shares | | | Amount | |
Sold: | | | | | | | | | | | | | | |
Retirement Shares | | — | | | | — | | | — | | | | — | |
Shares | | 4,666,621 | | | $ | 41,851,327 | | | 8,070,602 | | | $ | 67,137,307 | |
Subscription-in-kind | | 526,198 | | | | 4,483,204 | | | — | | | | — | |
Issued as reinvestment of dividends: | | | | | | | | | | | | | | |
Retirement Shares | | 1 | | | | 15 | | | 3 | | | | 21 | |
Shares | | 77,298 | | | | 675,808 | | | 115,326 | | | | 946,155 | |
Redeemed: | | | | | | | | | | | | | | |
Retirement Shares | | — | | | | — | | | (20 | ) | | | (159 | ) |
Shares | | (4,395,745 | ) | | | (38,945,714 | ) | | (7,466,868 | ) | | | (62,372,729 | ) |
Redemption Fee | | — | | | | 70 | | | — | | | | — | |
| | | | | | | | | | | | | | |
Net Increase (Decrease) | | 874,373 | | | $ | 8,064,710 | | | 719,043 | | | $ | 5,710,595 | |
| | | | | | | | | | | | | | |
| (a) | Effective at the close of business on September 27, 2006, the Core Bond Fund (Institutional Share Class) acquired all of the net assets of the Income Fund and Total Return Bond Fund. |
62
| | | | | | | | | | | | | | |
| | | Large Cap Growth Fund | |
| | | Year Ended 03/31/07 | | | Year Ended 03/31/06 | |
| | | Shares | | | Amount | | | Shares | | | Amount | |
Sold: | | | | | | | | | | | | | | |
Retirement Shares | | 172 | | | $ | 1,807 | | | — | | | | — | |
Shares | | 26,983,018 | | | | 268,887,660 | | | 33,887,361 | | | $ | 319,718,556 | |
Institutional Shares | | 1,518,333 | | | | 15,997,075 | | | | | | | | |
Issued as reinvestment of dividends: | | | | | | | | | | | | | | |
Retirement Shares | | — | | | | — | | | — | | | | — | |
Shares | | — | | | | — | | | — | | | | — | |
Institutional Shares | | — | | | | — | | | | | | | | |
Redeemed: | | | | | | | | | | | | | | |
Retirement Shares | | — | | | | — | | | (20 | ) | | | (161 | ) |
Shares | | (14,969,954 | ) | | | (147,806,621 | ) | | (4,286,908 | ) | | | (38,557,547 | ) |
Institutional Shares | | (10,095 | ) | | | (106,750 | ) | | | | | | | |
Redemption Fee | | — | | | | 9,835 | | | — | | | | — | |
| | | | | | | | | | | | | | |
Net Increase (Decrease) | | 13,521,474 | | | $ | 136,983,006 | | | 29,600,433 | | | $ | 281,160,848 | |
| | | | | | | | | | | | | | |
| | | | | | | | | | | | | | |
| | | Mid Cap Value and Restructuring Fund | |
| | | Year Ended 03/31/07 | | | Year Ended 03/31/06 | |
| | | Shares | | | Amount | | | Shares | | | Amount | |
Sold: | | | | | | | | | | | | | | |
Retirement Shares | | 51,153 | | | $ | 1,086,065 | | | — | | | | — | |
Shares | | 3,915,673 | | | | 81,532,520 | | | 2,206,027 | | | $ | 39,222,163 | |
Institutional Shares | | 174,817 | | | | 3,499,002 | | | 1,449,107 | | | | 26,024,928 | |
Issued as reinvestment of dividends: | | | | | | | | | | | | | | |
Retirement Shares | | — | | | | — | | | — | | | | — | |
Shares | | 1,544 | | | | 28,679 | | | 8,110 | | | | 140,000 | |
Institutional Shares | | 211 | | | | 3,893 | | | 12,203 | | | | 211,487 | |
Redeemed: | | | | | | | | | | | | | | |
Retirement Shares | | (118 | ) | | | (2,475 | ) | | (10 | ) | | | (162 | ) |
Shares | | (2,387,520 | ) | | | (47,782,321 | ) | | (2,927,490 | ) | | | (51,792,912 | ) |
Institutional Shares | | (435,896 | ) | | | (8,797,430 | ) | | (1,134,926 | ) | | | (20,164,758 | ) |
Redemption-in-kind | | (3,464,185 | ) | | | (66,339,150 | ) | | — | | | | — | |
Redemption Fee | | — | | | | 1,778 | | | — | | | | — | |
| | | | | | | | | | | | | | |
Net Increase (Decrease) | | (2,144,321 | ) | | $ | (36,769,439 | ) | | (386,979 | ) | | $ | (6,359,254 | ) |
| | | | | | | | | | | | | | |
63
| | | | | | | | | | | | | | |
| | | Small Cap Fund | |
| | | Year Ended 03/31/07 | | | Year Ended
03/31/06 | |
| | | Shares | | | Amount | | | Shares | | | Amount | |
Sold: | | | | | | | | | | | | | | |
Retirement Shares | | 100,714 | | | $ | 1,845,960 | | | — | | | | — | |
Shares | | 11,007,156 | | | | 202,519,992 | | | 7,764,353 | | | $ | 131,311,856 | |
Issued as reinvestment of dividends: | | | | | | | | | | | | | | |
Retirement Shares | | 211 | | | | 3,801 | | | 3 | | | | 53 | |
Shares | | 873,688 | | | | 15,909,286 | | | 431,637 | | | | 7,363,728 | |
Redeemed: | | | | | | | | | | | | | | |
Retirement Shares | | (4,702 | ) | | | (85,527 | ) | | (10 | ) | | | (153 | ) |
Shares | | (6,873,489 | ) | | | (126,011,173 | ) | | (7,277,592 | ) | | | (122,756,430 | ) |
Redemption Fee | | — | | | | 2,829 | | | — | | | | — | |
| | | | | | | | | | | | | | |
Net Increase (Decrease) | | 5,103,578 | | | $ | 94,185,168 | | | 918,391 | | | $ | 15,919,054 | |
| | | | | | | | | | | | | | |
| | | | | | | | | | | | | | |
| | | Value and Restructuring Fund | |
| | | Year Ended 03/31/07 | | | Year Ended 03/31/06 | |
| | | Shares | | | Amount | | | Shares | | | Amount | |
Sold: | | | | | | | | | | | | | | |
Retirement Shares | | 62,302 | | | $ | 3,214,887 | | | 18,213 | | | $ | 867,236 | |
Shares | | 40,342,962 | | | | 2,018,418,152 | | | 42,481,646 | | | | 1,944,842,088 | |
Institutional Shares | | 2,608,744 | | | | 127,478,205 | | | 1,588,442 | | | | 71,855,109 | |
Issued as reinvestment of dividends: | | | | | | | | | | | | | | |
Retirement Shares | | 99 | | | | 4,928 | | | 26 | | | | 1,182 | |
Shares | | 1,056,240 | | | | 51,956,233 | | | 922,183 | | | | 40,504,847 | |
Institutional Shares | | 59,732 | | | | 2,938,434 | | | 45,241 | | | | 1,988,952 | |
Redeemed: | | | | | | | | | | | | | | |
Retirement Shares | | (26,673 | ) | | | (1,242,118 | ) | | (115 | ) | | | (5,554 | ) |
Shares | | (24,661,734 | ) | | | (1,238,518,628 | ) | | (25,114,636 | ) | | | (1,109,338,591 | ) |
Institutional Shares | | (921,391 | ) | | | (45,845,721 | ) | | (450,627 | ) | | | (20,187,467 | ) |
Redemption Fee | | — | | | | 29,376 | | | — | | | | — | |
| | | | | | | | | | | | | | |
Net Increase (Decrease) | | 18,520,281 | | | $ | 918,433,748 | | | 19,490,373 | | | $ | 930,527,802 | |
| | | | | | | | | | | | | | |
In the normal course of business, the Funds enter into contracts that provide general indemnifications. The Funds’ maximum exposure under these arrangements is dependent on future claims that may be made against the Funds and, therefore, cannot be established; however, based on experience, the risk of loss from such claims is considered remote.
64
United States Trust Company of New York and U.S. Trust Company, N.A. (formerly, co-investment advisers to the Funds, together referred to herein as “U.S. Trust”), Excelsior Funds, Excelsior Tax-Exempt Funds, and Trust (the “Companies”), U.S. Trust, Schwab and several individuals and third parties were named in four fund shareholder class actions and two derivative actions which alleged that U.S. Trust, the Companies, and others allowed certain parties to engage in illegal and improper mutual fund trading practices, which allegedly caused financial injury to the shareholders of certain of the Funds advised by U.S. Trust. Each seeks unspecified monetary damages and related equitable relief.
The class and derivative actions described above were transferred to the United States District Court for the District of Maryland for coordinated and consolidated pre-trial proceedings. In November 2005, the Maryland court dismissed many of the plaintiffs’ claims in both the class and derivative actions. The court entered implementing orders on February 24, 2006. All claims against the Companies have been dismissed. Plaintiffs’ claims against U.S. Trust and certain individuals under Sections 10(b) and 20(a) of the Securities Exchange Act and Sections 36(b) and 48(a) of the Investment Company Act, however, have not been dismissed. Plaintiffs’ Section 48(a) claims against parent entities U.S. Trust and Schwab also remain.
While the ultimate outcome of these matters cannot be predicted with any certainty at this time, based on currently available information, U.S. Trust believes that the likelihood is remote that the pending litigation will have a material adverse financial impact on the Companies, or materially affect U.S. Trust’s ability to provide investment management services to the Companies.
65
REPORT OF INDEPENDENT REGISTERED PUBLIC ACCOUNTING FIRM
To the Board of Directors/Trustees and Shareholders of
Excelsior Funds, Inc. and Excelsior Funds Trust
In our opinion, the accompanying statements of assets and liabilities, including the portfolios of investments, and the related statements of operations and of changes in net assets and the financial highlights present fairly, in all material respects, the financial position of the Core Bond Fund Fund, Equity Income Fund, Large Cap Growth Fund, Mid Cap Value and Restructuring Fund, Small Cap Fund and Value and Restructuring Fund (four portfolios of Excelsior Funds, Inc. and two portfolios of Excelsior Funds Trust, hereafter referred to as the “Funds”) at March 31, 2007, and the results of each of their operations, the changes in each of their net assets and the financial highlights for the year then ended, in conformity with accounting principles generally accepted in the United States of America. These financial statements and financial highlights (hereafter referred to as “financial statements”) are the responsibility of the Funds’ management; our responsibility is to express an opinion on these financial statements based on our audit. We conducted our audit of these financial statements in accordance with the standards of the Public Company Accounting Oversight Board (United States). Those standards require that we plan and perform the audit to obtain reasonable assurance about whether the financial statements are free of material misstatement. An audit includes examining, on a test basis, evidence supporting the amounts and disclosures in the financial statements, assessing the accounting principles used and significant estimates made by management, and evaluating the overall financial statement presentation. We believe that our audit, which included confirmation of securities at March 31, 2007 by correspondence with the custodian and brokers, provides a reasonable basis for our opinion. The statements of changes in net assets and financial highlights of the Funds for each of the years in the period ended March 31, 2006 were audited by other auditors whose report dated May 22, 2006 expressed an unqualified opinion on those statements.
PRICEWATERHOUSECOOPERS LLP
San Francisco, California
May 18, 2007
66
PROXY VOTING RESULTS (Unaudited)
On November 20, 2006, Schwab announced an agreement to sell U.S. Trust, a wholly-owned subsidiary of Schwab, to the Bank of America (the “Sale”). The Sale includes all of U.S. Trust’s subsidiaries, including USTA and USTNA.
Under Section 15 of the 1940 Act, the change in ownership of U.S. Trust may result in the assignment, and automatic termination, of the Funds’ current investment advisory agreements with USTA and USTNA (the “Current Advisory Agreements”). Consequently, the Funds will need to enter into new investment advisory agreements with USTA and USTNA upon the closing of the Sale (the “New Advisory Agreements”), which requires the approval of both the Board of Directors and the shareholders of the Funds. At a meeting held on January 8, 2007, the Board approved New Advisory Agreements under which, subject to approval by the Funds’ shareholders, USTA and USTNA will continue to serve as investment advisers to the Funds after the Sale is completed. At the same meeting, the Board directed that the New Advisory Agreements be submitted to the shareholders of each Fund for approval.
A Special Meeting of Shareholders of Excelsior Funds, Excelsior Tax-Exempt Funds and Trust and each of their Funds was held on March 30, 2007, for the purpose of seeking shareholder approval of the following proposal: to approve new investment advisory agreements by and among USTA, USTNA and the Companies, on behalf of the Funds. The Special Meeting for Excelsior Funds with respect to the Value and Restructuring Fund, Energy and Natural Resources and Treasury Money Funds was adjourned for the purpose of soliciting additional proxies, and subsequently held on April 30, 2007. The number of votes necessary to conduct the Special Meetings and approve the proposal was obtained. The results of the votes of shareholders are listed below:
EXCELSIOR FUNDS, INC.
| | | | | | |
Fund | | For | | Against | | Abstain |
Blended Equity Fund | | 6,164,047.545 | | 67,952.751 | | 73,977.210 |
Core Bond Fund | | 42,419,131.502 | | 102,811.034 | | 103,300.208 |
Emerging Markets Fund | | 40,519,375.591 | | 385,533.770 | | 2,387,530.558 |
Energy and Natural Resources Fund | | 10,149,963.059 | | 261,710.922 | | 349,760.892 |
Government Money Fund | | 172,737,336.070 | | 747,772.190 | | 420,358.000 |
Intermediate-Term Bond Fund | | 44,858,545.970 | | 241,685.152 | | 66,016.000 |
International Fund | | 21,282,762.400 | | 54,899.414 | | 128,924.192 |
Large Cap Growth Fund | | 42,848,198.375 | | 89,295.014 | | 404,672.705 |
Money Fund | | 674,980,999.600 | | 1,166,673.210 | | 410,474.540 |
Pacific/Asia Fund | | 12,624,395.052 | | 35,293.746 | | 146,970.828 |
Real Estate Fund | | 6,828,766.866 | | 23,944.228 | | 74,532.837 |
Short-Term Government Securities Fund | | 19,900,726.363 | | 26,705.441 | | 160,992.698 |
Small Cap Fund | | 20,778,531.495 | | 77,734.183 | | 230,771.291 |
Treasury Money Fund | | 147,661,994.420 | | 8,327.040 | | 953,491.100 |
Value and Restructuring Fund | | 71,659,202.229 | | 1,308,059.398 | | 2,313,244.343 |
67
PROXY VOTING RESULTS (Continued)
EXCELSIOR TAX-EXEMPT FUNDS, INC.
| | | | | | |
Fund | | For | | Against | | Abstain |
California Short-Intermediate Term Tax-Exempt Income Fund | | 5,620,954.755 | | 30,312.000 | | 19,754.000 |
Intermediate-Term Tax-Exempt Fund | | 25,090,015.155 | | 30,070.577 | | 76,826.198 |
Long-Term Tax-Exempt Fund | | 3,628,610.926 | | 33,702.423 | | 40,804.648 |
New York Intermediate-Term Tax-Exempt Fund | | 9,319,329.057 | | 13,806.000 | | 36,899.000 |
New York Tax-Exempt Money Fund | | 275,209,603.310 | | 4,686,548.000 | | 63,196.000 |
Short-Term Tax-Exempt Securities Fund | | 8,452,657.301 | | 72,849.000 | | 359,587.000 |
Tax-Exempt Money Fund | | 1,356,339,634.110 | | 11,586,764.280 | | 2,023,751.550 |
EXCELSIOR FUNDS TRUST
| | | | | | |
Fund | | For | | Against | | Abstain |
Equity Income Fund | | 15,004,710.199 | | 69,167.666 | | 28,045.000 |
Equity Opportunities Fund | | 15,890,842.151 | | 16,544.962 | | 771.000 |
High Yield Fund | | 15,794,959.655 | | 30,927.324 | | 249,577.222 |
International Equity Fund | | 5,138,808.000 | | .000 | | .000 |
Mid Cap Value and Restructuring Fund | | 7,879,533.211 | | 19,517.123 | | 87,756.460 |
68
ADDITIONAL FEDERAL TAX INFORMATION
| Other | Federal Tax Information (Unaudited): |
For corporate shareholders, the following percentage of the total ordinary income distributions paid during the fiscal year ended March 31, 2007, qualify for the corporate dividends received deduction for the following Funds:
| | | |
Fund | | Percentage | |
Equity Income Fund | | 100.00 | % |
Mid Cap Value and Restructuring Fund | | 100.00 | % |
Small Cap | | 98.82 | % |
Value and Restructuring Fund | | 100.00 | % |
For the year ended March 31, 2007, the following Funds paid qualified dividend income for purposes of reduced individual federal income tax rates of:
| | | |
Fund | | Percentage | |
Equity Income Fund | | 100.00 | % |
Mid Cap Value and Restructuring Fund | | 100.00 | % |
Small Cap | | 98.63 | % |
Value and Restructuring Fund | | 100.00 | % |
The following Funds paid out the amounts of Long Term Capital Gains for the year ended March 31, 2007:
| | | |
| | | Long Term
Capital Gains |
Mid Cap Value and Restructuring Fund | | $ | 7,547 |
Small Cap Fund | | | 41,311,258 |
69
APPROVALS OF INVESTMENT ADVISORY AGREEMENTS (Unaudited)
In November 2006, representatives of Schwab, U.S. Trust, and the Funds’ investment advisers, USTA and USTNA (together, USTA and USTNA are referred to as the “Advisers) informed the Board that Schwab had entered into a stock purchase agreement with the Bank of America under which Schwab would sell U.S. Trust to Bank of America (the “Sale”). Representatives of Schwab, U.S. Trust, and the Advisers also informed the Board that, because the Sale includes all of U.S. Trust’s subsidiaries, such as USTA and USTNA, the completion of the Sale may be deemed to be an “assignment” (as defined in the 1940 Act) of the Funds’ current investment advisory agreements (the “Current Advisory Agreements”) resulting in the termination of the Current Advisory Agreements in accordance with their terms. To provide continuity in investment advisory services, representatives of U.S. Trust, the Advisers, and Bank of America proposed that the Board approve new investment advisory agreements (the “New Advisory Agreements”) under which, subject to shareholder approval, USTA and USTNA would continue to serve as investment advisers to the Funds after the completion of the Sale.
In advance of its December 6-7, 2006 meeting, the Board of Directors/Trustees requested and received from Bank of America, U.S. Trust, and the Advisers, various materials providing information regarding the Sale and its impact on (i) the Funds and their shareholders, (ii) the investment advisory services provided to the Funds by the USTA and USTNA and (iii) the administration services provided to the Funds by USTA. After receiving and reviewing these materials, the Board discussed at their December 6-7, 2006 meeting, the proposal to approve the New Advisory Agreements. Representatives from Bank of America, U.S. Trust, the Advisers, and Schwab attended the meeting and presented additional oral and written information to the Board to assist the Board in its considerations. These representatives assured the Board that Bank of America did not anticipate that there will be any reduction in the scope of or material adverse change in the nature or quality of, the investment advisory services to the Funds under the New Advisory Agreements. These representatives noted that a plan would be put into place designed to provide for the continuity of the investment advisory services under the New Advisory Agreements.
Additionally, representatives from Bank of America discussed the extensive experience and resources dedicated to Bank of America’s large mutual fund business, assuring the Board that Bank of America would seek to provide the Funds with the same or better quality of services with respect to the administration services currently provided by USTA. Representatives from Bank of America noted that: (i) the size and scale of Bank of America’s mutual fund business could produce potential savings for the Funds’ shareholders through reduced administrative costs and (ii) there was the potential for significant negotiating power in any future vendor discussions resulting from the Funds being part of the larger Bank of America fund complex.
The Board then discussed the written materials that the Board received before the meeting and the oral presentations and all other information that the Board received or discussed at the December 6-7, 2006 meeting. At the conclusion of the meeting, the Board decided to schedule another in-person Board meeting on January 8, 2007 to allow the Board to further consider the proposal to approve the New Advisory Agreements.
In anticipation of the January 8, 2007 Board meeting, legal counsel for the Directors/Trustees who are not interested persons (as defined in the 1940 Act) (“Independent Directors”) sent an information
70
APPROVALS OF INVESTMENT ADVISORY AGREEMENTS (Continued)
request letter to U.S. Trust and Schwab to solicit further information that the Board deemed to be relevant to their consideration of the New Advisory Agreements, including a discussion of, among other matters, (a) a detailed timeline and plan for the orderly transition of the administration and oversight of the Funds; (b) the extent to which key personnel of the Advisers who manage day-to-day investment operations of the Funds are expected to continue to be employed by the Advisers after the Sale; (c) the experience and qualifications of new key administrative personnel that Bank of America proposes to involve in Fund matters; (d) any enhanced compliance policies and procedures adopted by Bank of America in response to mutual fund regulatory and compliance issues; (e) any anticipated financial benefits of the Sale to Fund shareholders; (f) any anticipated changes in the Funds’ fees and operating expenses; (g) any anticipated structural changes to the Excelsior Funds complex; (h) any conflicts of interest between the other business interests of Bank of America and its affiliates and the operations of the Funds; and (i) any limitations on the Funds’ investment operations that would arise as a result of the Funds’ being affiliated with Bank of America. The responses by Bank of America, U.S. Trust, the Advisers and Schwab were provided to the Board for their review prior to the January 8, 2007 Board meeting, and the Board was provided with the opportunity to request any additional materials.
At the Board’s meeting on January 8, 2007, Bank of America, U.S. Trust, the Advisers, and Schwab provided additional written and oral information on the Sale and the impact of the Sale on the Advisers and the Funds and their shareholders. During the meeting, representatives from Bank of America and the Advisers, who were present at the meeting, assured the Board that Bank of America does not anticipate that there will be any reduction in the scope of, or material adverse change in the nature or quality of, the investment advisory services to the Funds under the New Advisory Agreements. Additionally, representatives from Bank of America, and the Advisers represented to the Board that Bank of America personnel would seek to provide the same or better quality of services with respect to the administration services currently provided by USTA. It was noted that a plan for the orderly transition of the administration and oversight of the Funds had been developed to ensure that there would be no disruption of Fund operations or other adverse consequences to the Funds and their shareholders. In addition, Bank of America provided, and the Board discussed, information regarding the potential applicability of certain regulatory orders relating to the Columbia Funds and the legacy Nations Funds.
The Board then deliberated on the approval of the New Advisory Agreements in light of all the information it had received. The Independent Directors, assisted by their independent legal counsel, met in executive session to discuss the New Advisory Agreements. After deliberating in executive session, the entire Board reconvened to discuss the approval of the New Advisory Agreements.
At the conclusion of the January 8, 2007 Board meeting, the Board, including all of the Independent Directors, unanimously concluded (a) that the approval of the New Advisory Agreements would be in the best interests of the shareholders and the Funds and (b) to recommend the approval of the New Advisory Agreements to shareholders. In concluding to approve the New Advisory Agreements and to recommend their approval to shareholders, the Board considered, with the assistance of independent legal counsel, the information and materials provided to the Board and a variety of specific factors discussed at the meetings, including, as discussed below, the Board’s prior conclusions when determining whether to approve the continuation of the Current Advisory Agreements.
71
APPROVALS OF INVESTMENT ADVISORY AGREEMENTS (Continued)
At the January 8, 2007 Board meeting, the Board concluded it was reasonable to take into account the conclusions the Board made when considering and evaluating the renewal of the Current Advisory Agreements (the “Annual Review”), which occurred at the September 29, 2006 in-person Board meeting, as part of its considerations to approve the New Advisory Agreements. The Board’s conclusion in this regard was based on (i) the fact that the New Advisory Agreements are identical to the Current Advisory Agreements in all material respects, including the investment advisory fees payable by the Funds to the Advisers and (ii) assurances by Bank of America and the Advisers that there would be no reduction or material adverse change in the nature or quality of the investment advisory services to the Funds under the New Advisory Agreements.
In addition to the conclusions formed with respect to the Annual Review, the Board considered specific information at the January 8, 2007 Board meeting concerning the Sale and its impact on the Advisers and the Funds and their shareholders, as they considered appropriate, including but not limited to the following:
| | • | | a detailed timeline and plan for the orderly transition of the administration and oversight of the Funds; |
| | • | | assurances by Bank of America and the Advisers that Bank of America does not anticipate that there will be any reduction in the scope of, or material adverse change in the nature or quality of, the investment advisory services to the Funds under the New Advisory Agreements; |
| | • | | an explanation of the extent to which key personnel of the Advisers who manage the day-to-day investment operations of the Funds are expected to continue to be employed by the Advisers after the Sale; |
| | • | | the experience and qualifications of new key administrative, financial, compliance and legal personnel that Bank of America proposes to involve in Fund matters; |
| | • | | the enhanced compliance policies and procedures adopted by Bank of America in response to mutual fund regulatory and compliance issues; |
| | • | | the anticipated financial benefits of the Sale to Fund shareholders including (i) access for the Funds to a large distribution network both on the retail, institutional and retirement platforms, as well as to Bank of America’s Private Bank and Wealth Management areas; (ii) the potential for a positive impact on Fund operating expenses resulting from an increase in assets; and (iii) the potential for significant negotiating power in any future vendor discussions resulting from the Funds being part of the larger Bank of America fund complex; |
| | • | | a representation from the Advisers and Bank of America that neither the Companies nor their shareholders would bear any costs of the Meeting or the costs of any solicitation in connection with the Meeting; |
| | • | | a representation from Bank of America that Bank of America would extend the Advisers’ commitments under the Expense Limitation Agreements currently in place with the Funds for a period of two years following the closing of the Sale, subject to the Board’s prior approval of any changes to those Expense Limitation Agreements; |
72
APPROVALS OF INVESTMENT ADVISORY AGREEMENTS (Continued)
| | • | | a discussion of the anticipated structural changes to the Excelsior Funds complex and a representation from Bank of America that the class structure of the Excelsior Funds was currently being evaluated by its product teams and that the results of that analysis would be presented to the Board for consideration at a future meeting; |
| | • | | the policies and procedures adopted by Bank of America that are intended to identify, monitor and mitigate any conflicts of interest between the other business interests of Bank of America and its affiliates and the operations of the Funds; and |
| | • | | a representation from U.S. Trust and Schwab that no material adverse impact on the Funds’ investment operations is expected as a result of the Funds being affiliated with Bank of America. |
The Board concluded, within the context of its full deliberations, that each of the representations, assurances and informational items provided by the Advisers, U.S. Trust, Bank of America and Schwab set forth above supported the approval of the New Advisory Agreements.
In the course of their deliberations, the Board did not identify any particular information or factor that was all-important or controlling. Based on its evaluation of the information and the conclusions with respect thereto at its meetings on September 29, 2006, December 6-7, 2006 and January 8, 2007, the Board, including all of the Independent Directors, unanimously: (a) concluded that the terms of the New Advisory Agreements are fair and reasonable; (b) concluded that the Advisers’ fees are reasonable in light of the services to be provided by the Advisers to the Companies; (c) concluded that the approval of the New Advisory Agreements would be in the best interests of the shareholders and the Funds; and (d) concluded to recommend the approval of the New Advisory Agreements to shareholders.
73
Directors/Trustees and Officers (Unaudited)
The tables below provide information pertaining to the Directors/Trustees and Officers of the Companies. The mailing address for each Director/Trustee is Excelsior Funds, 101 Montgomery Street, San Francisco, CA 94104.
| | | | | | | | | | |
Name and
Year of Birth | | Position(s) Held
with the
Company(1) | | Term of
Office(2) and
Length of Time
Served | | Principal Occupation(s)
During Past Five Years | | Number of
Funds in the
Fund Complex
Overseen by
Board Member | | Other
Directorships
Held by Board Member(6) |
| INDEPENDENT DIRECTORS/TRUSTEES | | | | | | |
Rodman L. Drake
Year of Birth: 1943 | | Director/Trustee; Chairman, Full Board | | Trustee of Excelsior Funds Trust since 1994; Director of Excelsior Funds, Inc. and Excelsior Tax Exempt Funds Inc. since 1996 | | Co-Founder of Baringo Capital LLC (since 2002); President, Continuation Investments Group, Inc. (1997 to 2001). | | 38(3) | | BOARD 1—Director and Chairman, Hyperion Total Return Fund, Inc. and Hyperion Strategic Mortgage Fund Inc. (since 1991). BOARD 2—Director, Jackson Hewitt Tax Service Inc. (since June 2004). BOARD 3—Director, Student Loan Corporation (since May 2005). BOARD 4—Celgene Corporation (since April 2006). |
| | | | | |
Morrill Melton Hall, Jr.
Year of Birth: 1944 | | Director/Trustee; Chairman, Investment Oversight Committee | | Director/Trustee of each Company since 2000 | | Chairman (since 1984) and Chief Executive Officer (since 1991), Comprehensive Health Services, Inc. (health care management and administration). | | 38(3) | | None |
| | | | | |
Jonathan Piel
Year of Birth: 1938 | | Director/Trustee | | Trustee of Excelsior Funds Trust since 1994; Director of Excelsior Funds, Inc. and Excelsior Tax Exempt Funds Inc. since 1996 | | Cable television producer and website designer; Editor, Scientific American (1984-1986), and Vice President, Scientific American Inc., (1986-1994); Director, National Institute of Social Sciences; Member Advisory Board, The Stone Age Institute, Bloomington, Indiana. | | 38(3) | | None |
| | | | | |
John D. Collins
Year of Birth: 1938 | | Director/Trustee; Chairman, Audit and Compliance Committee | | Director/Trustee of each Company since 2005 | | Retired. Consultant, KPMG, LLP (July 1999 to June 2000); Partner, KPMG, LLP (March 1962 to June 1999). | | 38(3) | | BOARD 1—Director, Mrs. Fields Famous Brands LLC (consumer products) (since December 2004). |
74
| | | | | | | | | | |
Name and
Year of Birth | | Position(s) Held
with the
Company(1) | | Term of
Office(2) and
Length of Time
Served | | Principal Occupation(s)
During Past Five Years | | Number of
Funds in the
Fund Complex
Overseen by
Board Member | | Other
Directorships
Held by Board Member(6) |
Mariann Byerwalter
Year of Birth: 1960 | | Director/Trustee; Chairman, Marketing, Distribution and Shareholder Services Committee | | Director/Trustee of each Company since 2006 | | Chairman of JDN Corporate Advisory LLC (1996 to 2001); Vice President for Business Affairs and Chief Financial Officer of Stanford University (1996-2001); Special Adviser to the President of Stanford University (2001). | | 95(4) | | BOARD 1—Director, Redwood Trust, Inc. (mortgage finance). BOARD 2—Director, PMI Group, Inc. (mortgage insurance). |
| | | | | |
Nils H. Hakansson
Year of Birth: 1937 | | Director/Trustee | | Director/Trustee of each Company since 2006 | | Sylvan C. Coleman Professor of Finance and Accounting, Emeritus, Haas School of Business University of California, Berkeley (since 2003); Sylvan C. Coleman Professor of Finance and Accounting, Haas School of Business, University of California, Berkeley (July 1977 to January 2003). | | 38(3) | | None |
| | | | | |
William A. Hasler
Year of Birth: 1941 | | Director/Trustee; Chairman, Governance Committee | | Director/Trustee of each Company since 2006 | | Retired. Dean Emeritus of the Haas School of Business at the University of California, Berkeley; until February 2004, Co-Chief Executive Officer, Aphton Corporation (bio-pharmaceuticals). | | 95(4) | | BOARD 1— Director, Aphton Corporation BOARD 2—Director, Mission West Properties (commercial real estate). BOARD 3—Director, TOUSA (home building). BOARD 4—Director, Harris Stratex Networks (a network equipment corporation). BOARD 5—Director, Genitope Corp. (bio-pharmaceuticals). BOARD 6—Director, Solectron Corporation where he is also Non-Executive Chairman (manufacturing). BOARD 7—Director, Ditech Communications Corporation (voice communications technology). |
75
| | | | | | | | | | |
Name and
Year of Birth | | Position(s) Held
with the
Company(1) | | Term of
Office(2) and
Length of Time
Served | | Principal Occupation(s)
During Past Five Years | | Number of
Funds in the
Fund Complex
Overseen by
Board Member | | Other
Directorships
Held by Board Member(6) |
| INTERESTED DIRECTORS/TRUSTEES | | | | | | |
| | | | | |
Randall W. Merk(5)
Year of Birth: 1954 | | Director/Trustee | | Director/Trustee of each Company since 2006 | | Executive Vice President, Charles Schwab & Co., Inc. (2002-present); President, Schwab Financial Product, Charles Schwab & Co., Inc. (2002-present); Director, Charles Schwab Asset Management (Ireland) Limited; Charles Schwab Worldwide Funds PLC; Director, Charles Schwab Bank N.A. (since 2006). Prior to September 2002, President and Chief Investment Officer, American Century Investment Management, and Director, American Century Companies, Inc.; Until June 2001, Chief Investment Officer — Fixed Income, American Century Companies, Inc. | | 95(4) | | None |
76
| | | | | | |
Name, Address and Year of Birth | | Position(s) Held
with the
Company(1) | | Term of
Office(2) and
Length of Time
Served | | Principal Occupation(s)
During Past Five Years |
| OFFICERS | | | | | | |
Evelyn Dilsaver
101 Montgomery St.
San Francisco, CA 94104
Year of Birth: 1955 | | President | | Since
February
2006 | | President and Chief Executive Officer, Laudus Variable Insurance Trust, Laudus Trust, The Charles Schwab Family of Funds, Schwab Investments, Schwab Annuity Portfolios and Schwab Capital Trust; President, Chief Executive Officer, and Director, Charles Schwab Investment Management, Inc. President, UST Advisers, Inc.’s Mutual Fund Division since March 2006.From June 2003 to July 2004, Senior Vice President, Asset Management Products and Services Enterprise, Charles Schwab & Co., Inc. Prior to June 2003, Executive Vice President, Chief Financial Officer, and Chief Administrative Officer, U.S. Trust, a subsidiary of The Charles Schwab Corporation. |
| | | |
Leo Grohowski
114 West 47th Street
New York, NY 10036
Year of Birth: 1958 | | Vice President | | Since
February
2006 | | Executive Vice President and Chief Investment Officer, U.S. Trust (October 2005 to present); Chief Investment Officer, Deutsche Asset Management Americas and Scudder Investments (2002-2005); and Chief Investment Officer, Deutsche Bank Private Banking (1999-2002). |
| | | |
Mary Martinez
114 West 47th Street
New York, NY 10036
Year of Birth: 1960 | | Vice President | | Since
February
2006 | | Managing Director of United States Trust Company, National Association (since 2003) and Chief Operating Officer of Asset Management (since December 2005) and Chief Executive Officer of National Private Banking (October 2004 to December 2005); Managing Director and Director of Relationship Management Service, Marketing, Information and Technology at Bessemer Trust (1998 to 2003). |
| | | |
Catherine MacGregor
101 Montgomery St.
San Francisco, CA 94104
Year of Birth: 1964 | | Vice President | | Since
September
2006 | | Vice President, Charles Schwab & Co., Inc. and Charles Schwab Investment Management, Inc. (since July 2005); Chief Counsel, Laudus Variable Insurance Trust and Laudus Trust (since September 2006); Chief Legal Officer, Vice President, Laudus Variable Insurance Trust and Laudus Trust (since March 2007); Vice President, The Charles Schwab Family of Funds, Schwab Investments, Schwab Capital Trust and Schwab Annuity Portfolios; Senior Associate, Paul Hastings Janofsky & Walker LLP (1999 to July 2005). |
| | | |
Joseph Trainor, CFA
114 West 47th Street
New York, NY 10036
Year of Birth: 1961 | | Vice President | | Since
February
2004 | | Managing Director of United States Trust Company, National Association (since 2003) and President, U.S. Trust Institutional; President of MFS Institutional Advisors (1998 to 2002). |
| | | |
George Pereira
101 Montgomery St.
San Francisco, CA 94104
Year of Birth: 1964 | | Treasurer/Chief Financial and Chief Accounting Officer | | Since
December
2005 | | Chief Financial Officer, Laudus Variable Insurance Trust, Laudus Trust, The Charles Schwab Family of Funds, Schwab Investments, Schwab Annuity Portfolios and Schwab Capital Trust; Senior Vice President and Chief Financial Officer, Charles Schwab Investment Management, Inc.; Director, Charles Schwab Asset Management (Ireland) Limited; Sr. Vice President, Financial Reporting, Charles Schwab & Co., Inc. (December 1999 to November 2004); Chief Financial Officer, UST Advisers, Inc.’s Mutual Fund Division (since March 2006). |
| | | |
Randall Fillmore
101 Montgomery St.
San Francisco, CA 94104
Year of Birth: 1960 | | Chief Compliance Officer | | Since
June
2006 | | Senior Vice President, Institutional Compliance and Chief Compliance Officer, Charles Schwab Investment Management, Inc. Chief Compliance Officer, The Charles Schwab Family of Funds, Schwab Investments, Schwab Capital Trust and Schwab Annuity Portfolios, Laudus Trust and Laudus Variable Insurance Trust; Vice President, Charles Schwab & Co., Inc., and Charles Schwab Investment Management, Inc. (2002-2003); Vice President, Internal Audit, Charles Schwab and Co., Inc. (2000-2002). |
77
| | | | | | |
Name, Address and Year of Birth | | Position(s) Held
with the
Company(1) | | Term of
Office(2) and
Length of Time
Served | | Principal Occupation(s)
During Past Five Years |
Wyndham Clark
225 High Ridge Road
Stamford, CT 06905
Year of Birth: 1958 | | Anti-Money Laundering Officer | | Since
May
2004 | | Vice President and AML Officer, UST Advisers, Inc. (since 2003); Vice President and Deputy Director Risk Management, IBJ Whitehall (banking) (2001 to 2002); Vice President and Chief Risk Officer, EMAC, LLC (commercial lender, asset backed security issuer) (1999 to 2001). |
| | | |
Koji E. Felton
101 Montgomery St.
San Francisco, CA 94104
Year of Birth: 1961 | | Secretary and Chief Legal Officer | | Since
June
2006 | | Secretary and Chief Legal Officer, The Charles Schwab Family of Funds, Schwab Investments, Schwab Capital Trust and Schwab Annuity Portfolios; Senior Vice President, Chief Counsel and Corporate Secretary, Charles Schwab Investment Management, Inc.; Senior Vice President and Deputy General Counsel, Charles Schwab & Co., Inc. Prior to June 1998, Branch Chief in Enforcement at U.S. Securities and Exchange Commission in San Francisco. |
| (1) | Each Director/Trustee serves in the same capacity as described above for each registered investment company included in the Excelsior Funds family (Excelsior Funds Inc., Excelsior Tax-Exempt Funds, Inc. and Excelsior Funds Trust) (together, the “Excelsior Funds Family”) and the Laudus Funds family (Laudus Trust and Laudus Variable Insurance Trust) (together, the “Laudus Funds Family”). Each officer serves in the same capacity as described above for each registered investment company included in the Excelsior Funds Family. |
(2) | Each Director/Trustee shall hold office until the election and qualification of his or her successor, or until he or she dies, resigns or is removed. The Excelsior Funds retirement policy requires that Independent Directors/Trustees retire no later than December 31st of the year during which he or she reaches 72 years of age. The officers of each Company hold office for a one-year term and until their respective successors are chosen and qualified, or, in each case, until he or she sooner dies, resigns, is removed, or becomes disqualified in accordance with the Company’s by-laws. |
| (3) | This number includes all registered investment companies included in the Excelsior Funds Family and the Laudus Funds Family, each of which is part of the Schwab Mutual Fund Family (as defined below). As of March 31, 2007, the Excelsior Funds Famliy and the Laudus Funds Family, in the aggregate, consisted of 38 funds. As of March 31, 2007, the Excelsior Funds Family consisted of 27 funds. |
| (4) | This number includes all registered investment companies included in the Schwab Mutual Fund family (Excelsior Funds, Inc., Excelsior Tax-Exempt Funds Inc., Excelsior Funds Trust, Laudus Trust, Laudus Variable Insurance Trust, The Charles Schwab Family of Funds, Schwab Investments, Schwab Annuity Portfolios and Schwab Capital Trust) (together, the “Schwab Mutual Fund Family”). As of March 31, 2007, the Schwab Mutual Fund Family consisted of 95 funds. |
| (5) | Mr. Merk is considered an “interested person” of the Companies (as defined in the 1940 Act) because of his affiliation with the Companies’ Advisers. |
| (6) | This column includes only directorships of companies required to report to the SEC under the Securities Exchange Act of 1934 (i.e., public companies) or other investment companies registered under the 1940 Act that are not part of the Schwab Mutual Fund Family. |
78
DISCLOSURE OF FUND EXPENSES (Unaudited)
We believe it is important for you to understand the impact of fees regarding your investment. As a shareholder of the fund, you incur ongoing, or operating costs, which include costs for portfolio management, administrative services, and shareholder reports (like this one), among others. Operating expenses, which are deducted from a fund’s gross income, directly reduce the investment return of the fund. A fund’s expenses are expressed as a percentage of its average net assets. This figure is known as the expense ratio. The following examples are intended to help you understand the ongoing costs (in dollars) of investing in your fund and to compare these costs with those of other mutual funds. The examples are based on an investment of $1,000 made at the beginning of the period shown and held for the entire period.
The table on the following page illustrates your fund’s costs in two ways.
| | • | | Actual expenses. This section provides information about actual account values and actual expenses based on the Funds’ actual return for the period. This section is designed to help you to estimate the actual expenses after fee waivers that you paid over the period. The “Ending Account Value” shown is derived from the fund’s actual return, and the fourth column shows the dollar amount that would have been paid by an investor who started with $1,000 in the fund. You may use the information here, together with the amount you invested, to estimate the expenses that you paid over the period. |
To do so, simply divide your account value by $1,000 (for example, an $8,600 account value divided by $1,000 = 8.6), then multiply the result by the number given for your fund under the heading “Expenses Paid During Period”.
| | • | | Hypothetical expenses. This section provides information about hypothetical account values and hypothetical expenses that would have been incurred by an investor in the Fund based on an assumed rate of return of 5% per year before expenses. This section is designed to help you compare your fund’s costs with those of other mutual funds. It assumes that the fund had a return of 5% before expenses during the year, but that the expense ratio is unchanged. In this case, because the return used is not the fund’s actual return, the results cannot be used to estimate the actual ending account balance or expenses you paid for the period. You may use this information to compare the ongoing costs of investing in your Fund and other funds. To do so, compare this 5% hypothetical example with the 5% hypothetical examples that appear in shareholder reports of other funds. |
79
DISCLOSURE OF FUND EXPENSES (Continued)
Please note that the expenses shown in the table are meant to highlight and help you compare ongoing costs only, which are described in the Prospectus. Therefore, the hypothetical example is useful in comparing ongoing costs only, and will not help you determine the relative total costs of owning different funds.
| | | | | | | | | | | | |
| | | Beginning
Account
Value
10/01/2006 | | Ending
Account
Value
03/31/2007 | | Annualized
Expense
Ratios* | | | Expenses
Paid
During
Period** |
Actual Fund Return | | | | | | | | | | | | |
Core Bond Fund — Retirement Shares | | $ | 1,000.00 | | $ | 1,023.10 | | 1.40 | % | | $ | 7.06 |
Equity Income Fund — Retirement Shares | | | 1,000.00 | | | 1,082.80 | | 1.49 | | | | 7.74 |
Large Cap Growth Fund — Retirement Shares | | | 1,000.00 | | | 1,072.90 | | 1.56 | | | | 8.06 |
Mid Cap Value and Restructuring Fund — Retirement Shares | | | 1,000.00 | | | 1,093.20 | | 1.61 | | | | 8.40 |
Small Cap Fund — Retirement Shares | | | 1,000.00 | | | 1,117.30 | | 1.74 | | | | 9.19 |
Value and Restructuring Fund — Retirement Shares | | | 1,000.00 | | | 1,118.40 | | 1.55 | | | | 8.19 |
| | | | |
Hypothetical 5% Return | | | | | | | | | | | | |
Core Bond Fund — Retirement Shares | | | 1,000.00 | | | 1,017.95 | | 1.40 | | | | 7.04 |
Equity Income Fund — Retirement Shares | | | 1,000.00 | | | 1,017.50 | | 1.49 | | | | 7.49 |
Large Cap Growth Fund — Retirement Shares | | | 1,000.00 | | | 1,017.15 | | 1.56 | | | | 7.85 |
Mid Cap Value and Restructuring Fund — Retirement Shares | | | 1,000.00 | | | 1,016.90 | | 1.61 | | | | 8.10 |
Small Cap Fund — Retirement Shares | | | 1,000.00 | | | 1,016.26 | | 1.74 | | | | 8.75 |
Value and Restructuring Fund — Retirement Shares | | | 1,000.00 | | | 1,017.20 | | 1.55 | | | | 7.80 |
| * | Annualized expense ratios of certain funds are after fee waivers and expense reimbursements by the investment adviser. Absent such waivers and reimbursements, expenses paid during the period would have been greater. |
| ** | Expenses are equal to the Fund’s annualized expense ratio multiplied by the average account value over the period, multiplied by the number of days in the most recent fiscal half-year (182) then divided by 365. |
80
AR-RETIRE-0307
The registrant has adopted a code of ethics that applies to the registrant’s principal executive officer, principal financial officer, principal accounting officer or controller, or persons performing similar functions. This code of ethics is included as an Exhibit.
During the period covered by the report, with respect to the registrant’s code of ethics that applies to its principal executive officer, principal financial officer, principal accounting officer or controller, or persons performing similar functions; there have been no amendments to, nor any waivers granted from, a provision that relates to any element of the code of ethics definition enumerated in paragraph (b) of this Item 2.
| Item 3. | Audit Committee Financial Expert. |
| 3(a)(1) | The registrant’s board of directors has determined that the registrant has at least one audit committee financial expert serving on its audit committee. |
| 3(a)(2) | The audit committee financial experts are Rodman L. Drake and John Collins, who are “independent” for purposes of this Item 3 of Form N-CSR. |
| Item 4. | Principal Accountant Fees and Services. |
For the fiscal years ended March 31, 2007 and March 31, 2006, the aggregate fees billed by PricewaterhouseCoopers LLP and Deloitte & Touche LLP for professional services rendered for the audits of the financial statements, or services that are normally provided in connection with statutory and regulatory filings or engagements for the fiscal year for the Registrant are shown in the table below.
| | | | |
| | | 2007 |
| | | All fees and services to the
Registrant that were pre-approved | | All fees and services to services
Affiliates that were pre-approved |
(a) Audit Fees (1) | | $397,000 | | N/A |
(b) Audit-Related Fees (2) | | $0 | | $0 |
(c) Tax Fees (3) | | $90,300 | | $0 |
(d) All Other Fees (4) | | $0 | | $0 |
| |
| | | 2006 |
| | | All fees and services to the
Registrant that were pre-approved | | All fees and services to services
Affiliates that were pre-approved |
(a) Audit Fees (1) | | $487,444 | | N/A |
(b) Audit-Related Fees (2) | | $0 | | $0 |
(c) Tax Fees (3) | | $101,000 | | $0 |
(d) All Other Fees (4) | | $0 | | $0 |
| (1) | Audit fees include amounts related to the audit of the Registrant’s annual financial statements and services normally provided by the accountant in connection with statutory and regulatory filings. |
| (2) | For the fiscal year ended March 31, 2007, there were no fees for assurance and related services by PricewaterhouseCoopers LLP reasonably related to the performance of the audit of the Registrant’s financial statements that were not reported under (a) of this item. For the fiscal year ended March 31, 2006, there were no fees for assurance and related services by Deloitte & Touche LLP reasonably related to the performance of the audit of the Registrant’s financial statements that were not reported under (a) of this item. |
| (3) | For the fiscal year ended March 31, 2007, the aggregate tax fees billed for professional services rendered by PricewaterhouseCoopers LLP for tax compliance, tax advice, and tax planning were $90,300. Such tax services included the review of income and excise tax returns for the Registrant. For the fiscal year ended March 31, 2006, the aggregate tax fees billed for professional services rendered by Deloitte & Touche LLP for tax compliance, tax advice, and tax planning were $101,000. Such tax services included the review of income and excise tax returns for the Registrant. |
| (4) | For the fiscal years ended March 31, 2007 and March 31, 2006, there were no fees billed for professional services rendered by PricewaterhouseCoopers LLP or Deloitte & Touche LLP, respectively, to the Registrant, other than the services reported in (a) through (c) of this Item. |
| (e) (1) | The audit committee has adopted policies and procedures that require pre-approval of audit and non-audit services for the Funds and certain other services provided to the Fund’s affiliates in accordance with Rule 2-01 (c) (7) of Regulation S-X. The pre-approval requirement for non-audit services for the Funds, the Funds’ investment adviser and the adviser’s control affiliates may be waived if: (i) the aggregate amount of all services provided constitutes not more than 5% of the total amount of revenues paid to the Funds’ independent accountant by the Funds and the Funds’ investment adviser and its control |
| | affiliates that provide ongoing services to the Funds during the fiscal year in which the services are provided that would have to be pre-approved by the Funds’ Audit Committee; (ii) such services were not recognized at the time of the engagement to be non-audit services; and (iii) such services are promptly brought to the attention of the Audit Committee and approved prior to the completion of the audit by the Audit Committee or by its designated Audit Committee member (s). |
| (e) (2) | Percentage of fees billed applicable to non-audit services pursuant to waiver of pre-approval requirement were as follows: |
| | | | |
| | | 2007 | | 2006 |
Audit-Related Fees | | N/A | | N/A |
Tax Fees | | N/A | | N/A |
All Other Fees | | N/A | | N/A |
| (g) | For the fiscal years ended March 31, 2007 and March 31, 2006, the aggregate non-audit fees billed by PricewaterhouseCoopers LLP and Deloitte & Touche LLP for services rendered to the Registrant and the Advisers and any entity controlling, controlled by, or under common control with the Advisers that provided ongoing services to the Registrant were $4,221,564 and $1,187,420, respectively. |
| (h) | The Registrant’s Audit Committee has considered whether its principal accountant’s provision of non-audit services that were rendered to the Registrant’s investment adviser, and any control persons of the investment adviser that provides ongoing services to the Registrant, that were not pre-approved pursuant to paragraph (c) (7)(ii) of Rule 2-01 of Regulation S-X, is compatible with maintaining the principal accountant’s independence. |
| Item 5. | Audit Committee of Listed Registrants. |
Not applicable.
| Item 6. | Schedule of Investments. |
Complete schedule of investments is included in Item 1.
| Item 7. | Disclosure of Proxy Voting Policies and Procedures for Closed-End Management Investment Companies. |
Not applicable.
| Item 8. | Portfolio Managers of Closed-End Management Investment Companies. |
Not applicable.
| Item 9. | Purchases of Equity Securities by Closed-End Management Investment Company and Affiliated Purchasers. |
Not applicable.
| Item 10. | Submission of Matters to a Vote of Security Holders. |
There have been no material changes to the procedures by which shareholders may recommend nominees to the Registrant’s board of directors after Registrant last provided disclosure in response to the requirement of Item 7(d) (2) (ii) (G) of Schedule 14A, or this Item 10.
| Item 11. | Controls and Procedures. |
The registrant’s principal executive officer and principal financial officer have concluded, based on their evaluation of the registrant’s disclosure controls and procedures as conducted within 90 days of the filing date of this report, that these disclosure controls and procedures are adequately designed and are operating effectively to ensure that information required to be disclosed by the registrant on Form N-CSR is recorded, processed, summarized and reported within the time periods specified in the Securities and Exchange Commission’s rules and forms.
There were no changes in the registrant’s internal control over financial reporting that occurred during the second fiscal quarter of the period covered by this report that have materially affected or are reasonably likely to materially affect, the registrant’s internal control over financial reporting.
| (a)(1) | The code of ethics that is the subject of the disclosure required by Item 2 is attached hereto. |
| (a)(2) | A separate certification for the principal executive officer and the principal financial officer of the registrant as required by Rule 30a-2 (a) under the Investment Company Act of 1940, as amended (17 CFR 270.30a-2(a)), are filed herewith. |
| (b) | Officer certifications as required by Rule 30a-2 (b) under the Investment Company Act of 1940, as amended (17 CFR 270.30a-2(b)) also accompany this filing as an Exhibit. |
SIGNATURES
Pursuant to the requirements of the Securities Exchange Act of 1934 and the Investment Company Act of 1940, the registrant has duly caused this report to be signed on its behalf by the undersigned, thereunto duly authorized.
| | |
| (Registrant) Excelsior Funds, Inc |
| | |
| |
| By (Signature and Title)* | | /s/ Evelyn Dilsaver |
| | Evelyn Dilsaver President |
Date May 21, 2007
Pursuant to the requirements of the Securities Exchange Act of 1934 and the Investment Company Act of 1940, this report has been signed below by the following persons on behalf of the registrant and in the capacities and on the dates indicated.
| | |
| |
| By (Signature and Title)* | | /s/ Evelyn Dilsaver |
| | Evelyn Dilsaver President |
Date May 21, 2007
| | |
| |
| By (Signature and Title)* | | /s/ George Pereira |
| | George Pereira Treasurer |
Date May 21, 2007
| * | Print the name and title of each signing officer under his or her signature. |