| | |
OMB APPROVAL |
OMB Number: | | 3235-0570 |
Expires: | | September 30, 2007 |
Estimated average burden |
hours per response: | | 19.4 |
UNITED STATES
SECURITIES AND EXCHANGE COMMISSION
Washington, D.C. 20549
FORM N-CSR
CERTIFIED SHAREHOLDER REPORT OF REGISTERED
MANAGEMENT INVESTMENT COMPANIES
Investment Company Act file number 811-04088
Excelsior Funds, Inc.
(Exact name of registrant as specified in charter)
United States Trust Company of New York
114 West 47th Street
New York, New York 10036
(Address of principal executive offices) (Zip code)
BISYS Fund Services
3435 Stelzer Road
Columbus, Ohio 43219
(Name and address of agent for service)
Registrant’s telephone number, including area code: 1-212-852-1000
Date of fiscal year end: March 31, 2006
Date of reporting period: March 31, 2006
| Item 1. | Reports to Stockholders. |

EQUITY FUNDS
ANNUAL REPORT
March 31, 2006
TABLE OF CONTENTS
For shareholder account information, current price and yield quotations, or to make an initial purchase or obtain a prospectus, call 1-800-446-1012, from overseas, call 617-483-7297.
| · | | Internet Address: http://www.excelsiorfunds.com |
This report must be preceded or accompanied by a current prospectus.
A description of the policies and procedures that Excelsior Funds use to determine how to vote proxies relating to portfolio securities, as well as information relating to how a Fund voted proxies relating to portfolio securities during the most recent 12-month period ended June 30, is available (i) without charge, upon request, by calling 1-800-446-1012, or (ii) by accessing the Excelsior Funds’ internet address and (iii) on the Commission’s website at http://www.sec.gov.
Excelsior Funds file their June 30 and December 31 schedule of portfolio holdings with the Securities and Exchange Commission, on Form N-Q, within sixty days after the applicable reporting period. Excelsior Funds Form N-Q is available on the Commission’s website at http://www.sec.gov, and may be reviewed and copied at the Commission’s Public Reference Room in Washington, DC. Information on the operation of the Public Reference Room may be obtained by calling 1-800-SEC-0330.
A schedule of each Fund’s portfolio holdings, as of the end of the prior month, is also available on the Funds’ website. This schedule is updated monthly, typically by the 15th calendar day, after the end of each month. The Funds may terminate or modify this policy at anytime.
You should consider the Funds’ investment objectives, risks and expenses carefully before you invest. Information about these and other important subjects is in the Funds’ prospectus, which you should read carefully before investing.
Excelsior Funds, Inc. and Excelsior Funds Trust are distributed by BISYS Fund Services Limited Partnership.
You may write to Excelsior Funds, Inc. and Excelsior Funds Trust at the following address:
Excelsior Funds
P.O. Box 8529
Boston, MA 02266-8529
SHARES IN THE FUNDS ARE NOT DEPOSITS OR OBLIGATIONS OF, OR GUARANTEED OR ENDORSED BY, UNITED STATES TRUST COMPANY OF NEW YORK, U.S. TRUST COMPANY, N.A. THEIR PARENT OR AFFILIATES AND SHARES ARE NOT INSURED BY THE FEDERAL DEPOSIT INSURANCE CORPORATION, THE FEDERAL RESERVE BOARD, OR ANY OTHER AGENCY. INVESTMENTS IN THE FUNDS INVOLVE INVESTMENT RISKS, INCLUDING POSSIBLE LOSS OF PRINCIPAL. FUND SHARES ARE NOT INSURED OR GUARANTEED BY THE U.S. GOVERNMENT.
LETTER TO SHAREHOLDERS
March 31, 2006
Dear Valued Excelsior Fund Shareholder,
I am pleased to bring you the annual report for the year ended March 31, 2006 for the Excelsior Funds. The funds in this report are part of the Excelsior Fund family which had over $18 billion in assets as of the end of the report period and includes a wide array of asset classes and investment strategies designed to meet the individual investor’s needs for performance and tax sensitivity.
By now, you would have received information about changes to the administrative and non-advisory services provided to the Excelsior Funds. As a result, the Excelsior Funds and the Laudus Funds, an affiliated fund family, now share certain complex-wide administrative, compliance, marketing and other functions.
We are pleased with the transition, and remain optimistic that shareholders will approve the board of directors’ recommendation to elect members to jointly oversee the two fund families. It is anticipated that the new unified board will strengthen the oversight provided on behalf of fund shareholders and may result in certain long-term cost and operating efficiencies. All votes are important, so I encourage you to vote your shares as soon as possible if you haven’t already done so.
Given these changes, I want to assure you that the most important aspects of the Excelsior Funds will remain the same. Specifically, the fund management and investment process provided by U.S. Trust, as advisor to the Funds, as well as the funds’ emphasis on enduring performance, will not change.
In closing, we at Excelsior Funds remain committed to helping you reach your long-term investment goals. Thank you for investing with us.
Sincerely,

Evelyn Dilsaver
President
1
We had expected that the financial markets would come into alignment with the financial environment being shaped by the Fed, and that finally came to pass as the fiscal year ending March 31, 2006 drew to a close. The markets improved as uncertainties about the Fed’s intentions, energy costs and Iraq were resolved to a degree—though the latter name was replaced by Iran as a geopolitical issue. Importantly, inflation is contained while growth has moderated to what we believe to be sustainable levels. We think the Fed’s economic shock effect has been temperate on growth overall. While GDP dipped in the fourth quarter of 2005, in response to hurricane after effects, it recovered to a 4.8% rate for the first quarter of 2006. Meanwhile, corporate profits, as reported for the first quarter, were strong indeed. Our confidence that a self-reinforcing expansion is underway continues firm.
Major equity indexes and averages posted new multi-year highs as the fiscal year came to an end. The financial markets reacted well to the Fed’s fifteenth sequential rate increase, to a federal funds rate target of 4.75%. Investors saw moderate economic growth ahead, with the potential for earnings growth, all within a context of well-contained inflation. Stocks, as measured by the Standard & Poor’s 500 Index, began to rally in the middle of the 2005 fourth-quarter, and that rally continued into the first quarter of 2006, making new five-year highs.
We think many of the equity investment themes that worked over the fiscal year should continue to prove successful. Overall, our themes are: (1) pricing power, (2) globalization, (3) secular reflation, (4) M&A, and (5) business versus the domestic consumer. In equities, we favor large-cap stocks over small caps, since small caps have had a long run that we believe is nearing an end. Our preference is for growth over value, when it comes to investment style—since we expect investors will target stable earnings growth, along with companies able to raise dividends and/or buyback shares. In sectors, we see housing slowing, and we continue to think the old economy, meaning industrials and commodity raw materials, especially metals, should outpace consumer sectors. We strongly favor global equities, and particularly those of emerging market nations aiming at developed world status, including China, India and Mexico, along with Russia and Australia as important sources of raw materials.
The Treasury yield curve inverted in the final months of 2005 and into January of 2006, with short-term rates higher than long-term interest rates. Recession fears were sparked, but were countered by no less than new Fed chairman, Ben Bernanke, who emphasized that yield curve inversion, rather than sending a signal of incipient recession, was, instead, a reflection of the global savings glut. We too believe that the yield-curve indicator will fail to reflect a downturn this time, and we are looking for GDP growth of at least 2.5% for full-year 2006. Nevertheless, the beginning of a slower U.S. consumer spending growth trend seems to be in place, and normally, the direct and indirect effects of a percentage point drop in real consumption growth would translate into an almost equal-size drop in GDP growth. But we don’t expect that because business and government spending is accelerating, and the global economy is picking up steam even as U.S. consumers moderate their spending habits.
2
EXCELSIOR FUNDS, INC. | BLENDED EQUITY FUND |
Annual Fiscal Year Review
Concerns over the economic backdrop were raised by the Fed continuing to tighten over the entire fiscal year, leaving the fed funds target rate at 4.75%. Tighter money was seen in clear signs of a slowing domestic housing market. This in turn is generating a strong headwind for the U.S. consumer. But business spending is beginning to ramp up, and strong overseas growth are providing offset, which should result in earnings growth for those companies with market share and pricing power. With the Fed presumably near the end of its monetary tightening cycle, we remain optimistic overall.
Performance Attribution
The Fund modestly under performed the benchmark. The Materials sector was the best-performing sector, benefiting from continued strong demand and pricing. Strong auction house results helped one of our holdings turn in a strong gain, while a number of our consumer stocks rebounded nicely from last year’s weakness. Our Canadian energy holding showed particular strength. We also had good performance among our technology, industrial and financial stocks. The portfolio’s holdings in power transmission underperformed. We initiated purchases in the rail transport sector, emphasizing leading companies that stress efficiency and optimization of rail networks. We also added in steel, emphasizing low-cost producers. Following the recent wave of industry consolidation, industry fundamentals and profitability are currently very strong. We also added in sports and fitness centers, which we expect to benefit from U.S. demographics. We also purchased in financial services, targeting a capital provider to middle market companies. We sold in electronic connectors and in food service distributors.
Outlook
We will continue to emphasize thorough portfolio diversification and those companies that possess favorable corporate cultures and effective employee incentives. We see continued moderate growth in the economy and corporate profits. Growth in the consumer sector should moderate while business spending and net exports strengthen. We believe the portfolio’s mix of stocks should benefit as the economic expansion matures and as growth makes progress over the next few years. We expect to continue our underweight exposure to technology as well as our overweights in materials and in the utility sector, where restructuring should support good returns.
3
EXCELSIOR FUNDS, INC. | BLENDED EQUITY FUND |
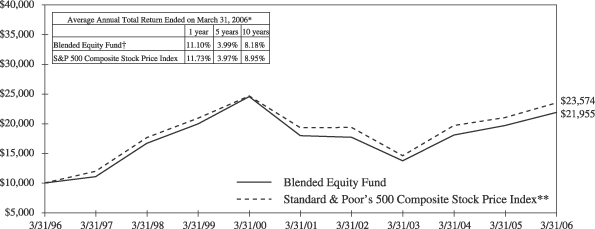
Past performance is not predictive of future performance. Investment returns and principal values will vary and shares may be worth more or less at redemption than their original cost.
The above illustration compares a $10,000 investment made in the Fund and a broad-based index over the past ten fiscal years. The chart assumes all dividends and capital gain distributions are reinvested. The Fund’s performance takes into account fees and expenses. The index does not take into account charges, fees and other expenses. Further information relating to Fund performance is contained in the Financial Highlights section of the Prospectus and elsewhere in this report.
| * | | Total return represents the change during the period in a hypothetical account with dividends reinvested. |
| ** | | Source: Standard & Poor’s Corporation—Reflects the reinvestment of income dividends and, where applicable, capital gain distributions. The Standard & Poor’s 500 Composite Stock Price Index is a widely accepted unmanaged index of U.S. stock market performance. |
| † | | Currently certain fees are waived. Had certain fees not been waived, returns would have been lower. Returns do not reflect the deduction of taxes that a shareholder would pay on Fund distributions or the redemption of shares. |
4
EXCELSIOR FUNDS, INC. | ENERGY AND NATURAL RESOURCES FUND |
Fiscal Year Annual Review
Over the twelve-month reporting period, oil, gas and metal prices moved higher. In the short-run, political pressure on supplies from Iraq, Iran, Nigeria and Venezuela helped lift prices. Hurricanes Katrina and Rita reduced the source of U.S. oil and gas by 20% and 10% respectively, at the end of the reporting period, also drove price spikes. And a cyclical increase in global demand, from China and India in particular, also contributed to prices reaching $70 per barrel by the end of the period. The only factor working to reduce demand was unseasonably warm winter weather in the U.S. Prices moved higher as we entered the new fiscal year.
Performance Attribution
The Fund more than doubled the return of the Standard & Poor’s 500 Index in the first quarter of 2006. The top performers were concentrated in the oil service sector and natural resource sectors. Oil services benefited from higher remediation activity in the Gulf of Mexico following hurricanes Rita and Katrina. On the resource side, higher pulp prices benefited our suppliers to paper producers. We have over-weighted the oil service sector, which is enjoying strong pricing leverage due to capacity constraints and rising drilling expenditures by the producers. Secondly, we have doubled our exposure to the independent refiners. We believe that refining margins should remain strong well into the second half of 2006, a function of a shrinking gasoline pool, as MTBE (a gasoline additive which accounts for 7% of supply), is withdrawn from gasoline under a federal mandate. On the resources side we added in steel, silver and coal. Coal demand is rising as utilities re-stock depleted inventories.
Outlook
The energy sector macro-drivers remain in place. Tight supply/demand fundamentals for North American natural gas and crude oil (with OPEC spare production capacity at a historic low of 1%-2% of global demand) continue. Strong prices for base metals such as copper are supported by ongoing industrialization in China. Barring a global recession, our resource sectors could remain structurally tight through the end of this decade.
5
EXCELSIOR FUNDS, INC. | ENERGY AND NATURAL RESOURCES FUND |
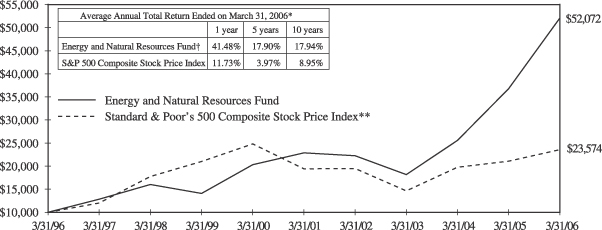
Past performance is not predictive of future performance. Investment returns and principal values will vary and shares may be worth more or less at redemption than their original cost. Concentration in one economic sector may subject an investor to greater volatility.
The above illustration compares a $10,000 investment made in the Fund and a broad-based index over the past ten fiscal years. The chart assumes all dividends and capital gain distributions are reinvested. The Fund’s performance takes into account fees and expenses. The index does not take into account charges, fees and other expenses. Further information relating to Fund performance is contained in the Financial Highlights section of the Prospectus and elsewhere in this report.
| * | | Total return represents the change during the period in a hypothetical account with dividends reinvested. |
| ** | | Source: Standard & Poor’s Corporation—Reflects the reinvestment of income dividends and, where applicable, capital gain distributions. The Standard & Poor’s 500 Composite Stock Price Index is a widely accepted unmanaged index of U.S. stock market performance. |
| † | | Currently certain fees are waived. Had certain fees not been waived, returns would have been lower. Returns do not reflect the deduction of taxes that a shareholder would pay on Fund distributions or the redemption of shares. One year returns presented in the table differs from the return presented in the Financial Highlights. This is a result of the calculation of the Financial Highlights return adhering to GAAP presentation. |
6
EXCELSIOR FUNDS TRUST | EQUITY CORE FUND |
Fiscal Year Annual Review
The economic backdrop during the fiscal year reflected strong global economic activity. Tightening interest rates in the U.S. clearly slowed the pace of growth, but not, we believe, to levels that will impact earnings growth for select companies with solid market share and pricing power. Both short and long-term interest rates continue to rise, but the Fed presumably is near the end of its monetary tightening cycle. We see clear signs of a slowing domestic housing market, which should lead to a strong headwind for the U.S. consumer. The stock market posted a solid return, with a rally in the last-calendar quarter, which accelerated through the first quarter of 2006, and our portfolio exhibited strong relative performance, which we expect to continue.
Performance Attribution
The Fund’s strong performance was spread across several market sectors. Materials was the best-performing sector, led by steel, pulp for paper, and construction materials. These companies benefited from continued strong demand and pricing in their respective markets. Our consumer holdings, saw gains from strong art auction results, as well as from increased spending on home furnishings, as the boomers continue to improve their retirement homes. We also recorded gains in our energy holdings, in selected technology stocks, financial services and in pharmaceuticals. We experienced moderate negative returns in land and medical devices. We initiated purchases in the rail transport sector, emphasizing leading companies that stress efficiency and optimization of rail networks. We also added in steel, emphasizing low-cost producers. We sold in electronic connectors and in food service distributors.
Outlook
We think the Fed is nearing the end of its monetary tightening cycle, and we still see continued moderate growth in the economy and corporate profits. Growth in the consumer sector should moderate while business spending and net exports strengthen. We believe the portfolio’s mix of stocks should benefit as the economic expansion matures and as growth makes progress over the next few years. We expect to continue our limited exposure to technology as well as our overweights in materials and in the utility sector, where restructuring should support good returns. We will continue to emphasize thorough portfolio diversification and those companies that possess favorable corporate cultures and effective employee incentives.
7
EXCELSIOR FUNDS TRUST | EQUITY CORE FUND |
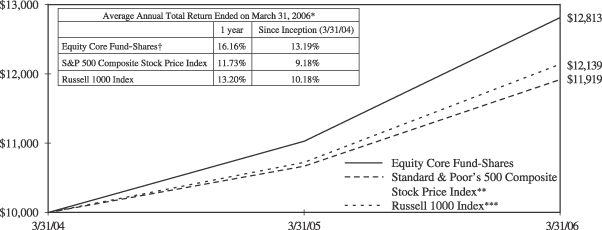
Past performance is not predictive of future performance. Investment returns and principal values will vary and shares may be worth more or less at redemption than their original cost.
The above illustration compares a $10,000 investment made in the Fund and a broad-based index since 3/31/04 (inception date). The chart assumes all dividends and capital gain distributions are reinvested. The Fund’s performance takes into account fees and expenses. The index does not take into account charges, fees and other expenses. Further information relating to Fund performance is contained in the Financial Highlights section of the Prospectus and elsewhere in this report.
| * | | Total return represents the change during the period in a hypothetical account with dividends reinvested. |
| ** | | Source: Standard & Poor’s Corporation—Reflects the reinvestment of income dividends and, where applicable, capital gain distributions. The Standard & Poor’s 500 Composite Stock Price Index is a widely accepted unmanaged index of U.S. stock market performance. |
| *** | | Source: Frank Russell Company—The Russell 1000 Index measures the performance of the 1,000 largest companies in the Russell 3000 Index, which represents approximately 92% of the total market capitalization of the Russell 3000 Index. The Index includes dividends reinvested. |
| † | | Currently certain fees are waived. Had such fees not been waived, returns would have been lower. Returns do not reflect the deduction of taxes that a shareholder would pay on Fund distributions or the redemption of shares. |
8
EXCELSIOR FUNDS TRUST | EQUITY INCOME FUND |
Fiscal Year Annual Review
The Equity Income Fund concentrates on investing in stocks that either pay above-average dividends or have the potential to grow their dividends. We are pleased that the trend of new first-time dividend initiation remains strong. Our efforts to grow our income stream by purchasing stocks with above-average dividend payouts from companies with progressive dividend growth policies continued to bear fruit over the fiscal year, ending March 31, 2006. Responding to a perceived need to improve shareholder return, corporate management is intiating new dividends, increasing dividends, and extending long histories of dividend payment.
Performance Attribution
During the reporting period, our performance was governed by a strong sell disciple, which enabled us to take profits as our price targets were attained. Our exposure to infrastructure-orientated industrials provided strong contributions. Furthermore, our decision to maintain positions in the telecommunications sector, while eliminating our exposure to power utilities, proved to be very rewarding. Improving sentiment toward telecommunication stocks has been the catalyst for their out-performance while higher interest rates have resulted in negative returns for utilities. Our holding in medical technology contributed only modest under performance. But our heavy underweight in energy and commodities resulted in under performance versus the benchmark. We added a number of new positions over the course of the fiscal year, emphasizing technology, pharmaceuticals and insurers. We targeted what we believe is an exceptional analog semiconductor company, with higher margins and returns on capital than their competitors. We also added a global pharmaceutical firm, with what we see as an attractive new drug pipeline and a drug portfolio that is not heavily exposed to off-patent runoffs. In insurance, we swapped from one re-insurer to another, to capitalize on a distinct valuation advantage. On the sale side, we trimmed in consumer electronics.
Outlook
We remain enthusiastic as many of the companies in our portfolio are growing their business values and increasing their dividends; however, in many cases this progress is not yet fully reflected in their share prices. By our way of thinking, these companies are more attractive today than at this time last year, and we believe we will be rewarded for our patience. Finally, payout ratios and dividend rates continue to rise, underscoring the dynamics that we are acutely focused on. While the Federal Reserves continues to implement tighter monetary policy, we see a soft landing for the economy, which should preserve corporate profit growth.
9
EXCELSIOR FUNDS TRUST | EQUITY INCOME FUND |
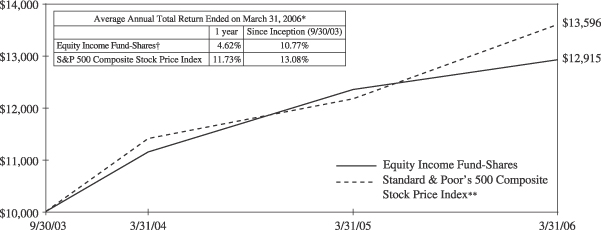
Past performance is not predictive of future performance. Investment returns and principal values will vary and shares may be worth more or less at redemption than their original cost.
The above illustration compares a $10,000 investment made in the Fund and a broad-based index since 9/30/03 (inception date). The chart assumes all dividends and capital gain distributions are reinvested. The Fund’s performance takes into account fees and expenses. The index does not take into account charges, fees and other expenses. Further information relating to Fund performance is contained in the Financial Highlights section of the Prospectus and elsewhere in this report.
| * | | Total return represents the change during the period in a hypothetical account with dividends reinvested. |
| ** | | Source: Standard & Poor’s Corporation—Reflects the reinvestment of income dividends and, where applicable, capital gain distributions. The Standard & Poor’s 500 Composite Stock Price Index is a widely accepted unmanaged index of U.S. stock market performance. |
| † | | Currently certain fees are waived. Had such fees not been waived, returns would have been lower. Returns do not reflect the deduction of taxes that a shareholder would pay on Fund distributions or the redemption of shares. |
10
EXCELSIOR FUNDS, INC. | LARGE CAP GROWTH FUND |
Annual Fiscal Year Review
The market built on a strong 2005 post Thanksgiving rally, with one of the strongest first quarters since 1999, which saw the Standard & Poor’s 500 Index for the first quarter of 2006 better its full-year 2005 price gain. This solid performance in spite of continued Fed tightening, a long-awaited slow-down in housing activity, continued global geo-political angst, and higher oil and gas prices, suggests that consumers and investors remain optimistic. The U.S. economy continues to grow at a moderate pace while inflation remains a tame worry. Growth stocks appear relatively attractive on a price earnings basis versus Treasuries and real estate.
Performance Attribution
The Excelsior Large-Cap Growth Fund outpaced our large-cap growth benchmark over the reporting period. This outperformance can be attributed to successful stock selection, particularly within the telecom, financial, technology and consumer discretionary sectors. We favored what we saw as the beginning of a shift back to growth, from the prevailing value orientation of the markets. This strategy helped us capitalize with holdings in the Financial and Internet Industries, that were strong performers year-long. Our health care overweighting injured our relative performance as did our underweight in the energy and materials sectors. Normally, growth stocks would have outperformed value stocks at this stage of the business cycle. However, equity investors took their cues from the bond market and preferred to hold on to interest-rate-sensitive and low-multiple stocks until clear signs of a sustained rebound emerged.
Outlook
Our outlook remains optimistic, as we continue to find evidence that investors are returning to the growth style. Since profits grew at more than double the rate of stocks last year, we may have some more catching up to do. The comparative profit gap between the growth and value styles is beginning to expand in favor of growth. In summary, the earnings, valuation, and sentiment data support our view that the return of growth stock investing is just beginning. We expect the Federal Reserve to end its tightening process in the new fiscal year, and we look for a slow down in commodity and energy price gains. Significant post-hurricane rebuilding should also provide stimulus, and the Congressional elections should have positive impact. Overall, profit growth is likely to sustain the equity markets.
11
EXCELSIOR FUNDS, INC. | LARGE CAP GROWTH FUND |

Past performance is not predictive of future performance. Investment returns and principal values will vary and shares may be worth more or less at redemption than their original cost.
The above illustration compares a $10,000 investment made in the Fund and a broad-based index since 10/1/97 (inception date). The chart assumes all dividends and capital gain distributions are reinvested. The Fund’s performance takes into account fees and expenses. The index does not take into account charges, fees and other expenses. Further information relating to Fund performance is contained in the Financial Highlights section of the Prospectus and elsewhere in this report.
| * | | Total return represents the change during the period in a hypothetical account with dividends reinvested. |
| ** | | Source: Frank Russell Company—The Russell 1000 Growth Index is an unmanaged index composed of those Russell 1000 Index companies with higher price-to-book ratios and higher forecasted growth values. The Russell 1000 Index is composed of the 1000 largest companies in The Russell 3000 Index which is composed of 3,000 of the largest U.S. companies by market capitalization. The Index includes dividends reinvested. |
| † | | Currently certain fees are waived. Had certain fees not been waived, returns would have been lower. Returns do not reflect the deduction of taxes that a shareholder would pay on Fund distributions or the redemption of shares. |
12
EXCELSIOR FUNDS TRUST | MID CAP VALUE AND RESTRUCTURING FUND |
Fiscal Year Annual Review
The Federal Reserve will eventually conclude its interest rate hikes and at sixteen times earnings, we believe stocks have room to advance. Over the course of the fiscal year, superb growth in corporate earnings and continued low inflation pushed stocks higher. We expect additional gains going forward despite the presence of several shorter-term negatives, including, high oil prices and rising short term interest rates. To our way of thinking, a moderate economic slow down should prove a sustainable source of earnings growth, especially for mid-cap companies poised to challenge their larger rivals.
Performance Attribution
We continue to target highly selective additions to the Fund. We added in consumer products, particularly in home furnishing, where we established a position with a leader in the specialty mattress category. As utilities restock, coal demand is increasing, and we added in this raw materials sector. We expect operating performance in this area to improve as capital expenditures are undertaken. We also opportunistically added to an existing position, which suffered a setback that we saw as temporary. Proceeds for these purchases came from selling in housewares and utilities. Merger and acquisition activity provided benefits, a trend we expect to continue. Mid-cap stocks were outperformers, with mid-cap indexes rising almost double what broad market measures returned. Our energy holdings continued to do well all year long, but non-energy related stocks also shone. Some of our star performers in prior years struggled, but these holdings continue to represent excellent long-term value in our estimation.
Outlook
Operating results of companies owned in the Fund were strong this year, marked by above average profitability and earnings growth. Continued merger and acquisition activity suggests a continuation of the favorable environment for our investment preference for restructuring companies. A few of the Fund’s troubled children, meaning its poor performing stocks, have recently shown signs of improved management. On the whole, the Fund’s investments sell at attractive discounts to market benchmarks on an earnings, cash flow and book value basis. While our expectations are therefore positive, we continue to keep the Fund well diversified, to mitigate risks, and remain true to our mission of purchasing stocks with improving fundamentals and low valuations.
13
EXCELSIOR FUNDS, INC. | MID CAP VALUE AND RESTRUCTURING FUND |
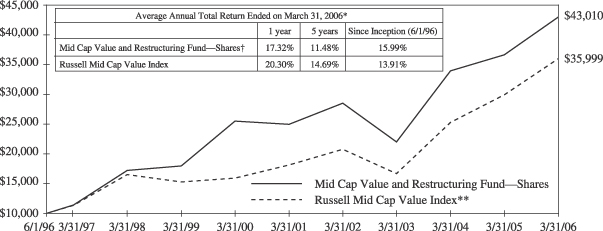
Past performance is not predictive of future performance. Investment returns and principal values will vary and shares may be worth more or less at redemption than their original cost.
The above illustration compares a $10,000 investment made in the Fund and a broad-based index since 6/1/96 (inception date). The chart assumes all dividends and capital gain distributions are reinvested. The Fund’s performance takes into account fees and expenses. The index does not take into account charges, fees and other expenses. Further information relating to Fund performance is contained in the Financial Highlights section of the Prospectus and elsewhere in this report.
| * | | Total return represents the change during the period in a hypothetical account with dividends reinvested. |
| ** | | Source: Frank Russell Company—The Russell Mid Cap Value Index measures the performance of medium-sized value-oriented securities. |
| † | | Currently certain fees are waived. Had certain fees not been waived, returns would have been lower. Returns do not reflect the deduction of taxes that a shareholder would pay on Fund distributions or the redemption of shares. |
14
EXCELSIOR FUNDS, INC. | REAL ESTATE FUND |
Fiscal Year Annual Review
Three major themes were reflected in the Fund throughout the twelve-month reporting period: industry consolidation, index inclusion and healthy dividend growth. There were several acquisitions which saw larger REITs expand through acquisition; additionally, private buyers, intent on filling out real estate allocations and searching for income streams, also acquired individual REITs. Most of this capital flowed back into the sector during first quarter 2006; we think that these cash-recycled effects have now been absorbed into the market. By the end of the reporting period, the number of REITs in the Standard & Poor’s 500 Index stood at 12, for an annual increase in number greater than 25%. When it comes to dividends, of approximately 150 equity REITs, more than 50 increased their dividend rate in the reporting period, and we continue to think the overall economic picture will support continued REIT dividend growth.
Performance Attribution
Over the reporting period, the performance of REIT securities significantly exceeded that of most market indices. With the continued growth in the economy, investors are more confident of higher occupancy rates and future rental rates in the commercial sector. Among the major property sectors, the office sector was the best performer during the year. The health care properties and regional malls were the worst performers of the group. We initiated positions in two specialized mid-cap companies where we expect that the growth in cash flow and dividends should outpace that of their larger brethren over time. In addition, in sectors where fundamentals currently appear compelling, we initiated positions in a large-cap name in the apartment sector, a small-cap company in the lodging industry and a small-cap stock in the health care sector.
Outlook
In the first quarter of 2006, the last of the annual fiscal reporting period, we saw a flurry of merger and acquisitions transactions, specifically, with private buyers conducting multiple REIT acquisitions. With these major transactions now behind us, we expect a slowdown in M&A activity going forward. On the other hand, we have seen some of the major REITs paring back on their properties for very attractive returns, and we expect this trend to continue. Still, with the Fed increasing interest rates overall, negative pressure on equities, and REITs in particular, is increasing. Other income plays may become more attractive to investors as real estate financing becomes more expensive.
15
EXCELSIOR FUNDS, INC. | REAL ESTATE FUND |
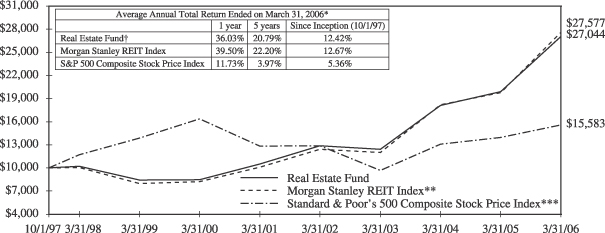
Past performance is not predictive of future performance. Investment returns and principal values will vary and shares may be worth more or less at redemption than their original cost. Concentration in one economic sector may subject an investor to greater volatility.
The above illustration compares a $10,000 investment made in the Fund and broad-based indices since 10/1/97 (inception date). The chart assumes all dividends and capital gain distributions are reinvested. The Fund’s performance takes into account fees and expenses. The indices do not take into account charges, fees and other expenses. Further information relating to Fund performance is contained in the Financial Highlights section of the Prospectus and elsewhere in this report.
| * | | Total return represents the change during the period in a hypothetical account with dividends reinvested. |
| ** | | Source: Morgan Stanley & Co., Incorporated—Reflects the reinvestment of income dividends and, where applicable, capital gain distributions. The Morgan Stanley REIT Index is an unmanaged capitalization-weighted index composed of the largest and most actively traded REITs designed to provide a broad measure of real estate equity performance. |
| *** | | Source: Standard & Poor’s Corporation—Reflects the reinvestment of income dividends and, where applicable, capital gain distributions. The Standard & Poor’s 500 Composite Stock Price Index is a widely accepted unmanaged index of U.S. stock market performance. |
| † | | Currently certain fees are waived. Had certain fees not been waived, returns would have been lower. Returns do not reflect the deduction of taxes that a shareholder would pay on Fund distributions or the redemption of shares. |
16
EXCELSIOR FUNDS, INC. | SMALL CAP FUND |
Annual Fiscal Year Review
The small cap trend seems to have confounded many experts who had concluded that the asset class was due for a bout of underperformance, given the strong multi-year run for small-caps in previous years. The simple fact is, in addition to still many very reasonable valuations, a vast liquidity shift in favor of hedge funds has occurred. These managers may find small and mid-cap issues far more appealing for rapid appreciation. It is very difficult for a hedge fund manager to influence the likes of large-cap industry leaders, but their ownership impact can be significant further down the food chain. Throughout the reporting period, an otherwise attractive environment for small-cap stocks, including positive macroeconomic trends and strong corporate fundamentals, the markets were overshadowed by the triple threat of rising market interest rates, surging oil prices, hurricane devastation and ongoing violence in the Middle East.
Performance Attribution
The portfolio’s positive return in the quarter was driven by several factors. Our long-term investors recall that our disciplines lead us to issues that have heretofore underperformed and carry low valuations relative to their own history. Technology has been a favored area for us. Very noticeably, for the first time in a long time, this sector has begun to contribute to performance. After almost six years of a tech bear market, we are seeing the confluence of many factors, which have led us to add new positions in this sector, and to increase existing holdings. The tech companies that survived the downturn have dramatically improved their balance sheets, utilization rates, and margin structure. At the same time, many firms are shrinking their share base through share repurchase programs. Hence, our activity focus continues on highly selective technology additions to the Fund’s portfolio.
Outlook
If we are correct in our assessment of hedge fund capital inflows as a prime motivator of small cap stock prices, we would look for a continuance of the current trend. Moreover, given our commitment to the technology sector, as capital spending by business ramps higher, we see expanded revenues leading to improved margins and with a smaller share count—a perfect formula for earnings leverage. We think technology is the likely beneficiary of a greater need for productivity, particular as global competition continues.
17
EXCELSIOR FUNDS, INC. | SMALL CAP FUND |
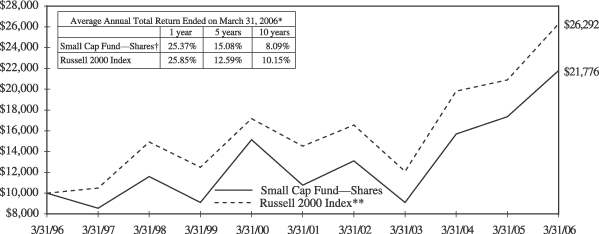
Past performance is not predictive of future performance. Investment returns and principal values will vary and shares may be worth more or less at redemption than their original cost. There is greater volatility associated with an investment in the Small Cap Market.
The above illustration compares a $10,000 investment made in the Fund and a broad-based index over the past ten fiscal years. The chart assumes all dividends and capital gain distributions are reinvested. The Fund’s performance takes into account fees and expenses. The index does not take into account charges, fees and other expenses. Further information relating to Fund performance is contained in the Financial Highlights section of the Prospectus and elsewhere in this report.
| * | | Total return represents the change during the period in a hypothetical account with dividends reinvested. |
| ** | | Source: Frank Russell Company—The Russell 2000 Index is an unmanaged index and is composed of the 2,000 smallest companies in the Russell 3000 Index. The Russell 3000 Index is composed of 3,000 of the largest U.S. companies by market capitalization. The index includes dividends reinvested. |
| † | | Currently certain fees are waived. Had certain fees not been waived, returns would have been lower. Returns do not reflect the deduction of taxes that a shareholder would pay on Fund distributions or the redemption of shares. |
18
EXCELSIOR FUNDS, INC. | VALUE AND RESTRUCTURING FUND |
Annual Fiscal Year Review
Long-term equity fundamentals pointed toward higher stock prices in our estimation at the start of the twelve-month period ending March 31. Superb growth in corporate earnings and continued low inflation pushed stocks higher. Stocks mounted a major rally in the last quarter of 2005 and continued to make new five-year highs in the first quarter of 2006. The Federal Reserve will eventually conclude its interest rate hikes while stocks still have room, at sixteen times earnings, to advance.
Performance Attribution
The apparent abatement of corporate defensiveness and increased emphasis on improving businesses favored our type of investing throughout the year, and the fund saw two of its holdings acquired at a premium. Energy holdings continued to do well over the reporting period, and our holdings reflected higher oil and gas prices reflecting increased global demand and shortages from Hurricanes Rita and Katrina. Our non-energy related stocks also fared well, as commercial construction picked up for the first time since 2000 and rental equipment rates soared, boosting our holdings in the sector. Negative impact was recorded in real estate and mortgages; sectors that declined on rising interest rate concerns, as the Fed boosted the fed funds target rate to 4.75% by the end of the reporting period. But we think our holdings in this sector continue to represent excellent long-term value.
Outlook
On the whole, the Fund’s investments sell at an attractive discount to market benchmarks on an earnings, cash flow, and book value basis. Continued merger and acquisition activity suggests a continuation of the favorable environment for our investment preference for restructuring companies. While our expectations are therefore positive, we continue to keep the Fund well diversified to mitigate potential risks, and remain true to our mission of purchasing stocks with improving fundamentals and low valuations. We continue to look for improvement in the energy and commodity sectors, given global demand trends, and health care may prove an important source of positive performance in the coming year. Solid business growth should counteract the Fed’s tightening and higher energy costs, allowing for earnings acceleration for carefully selected stocks.
19
EXCELSIOR FUNDS, INC. | VALUE AND RESTRUCTURING FUND |
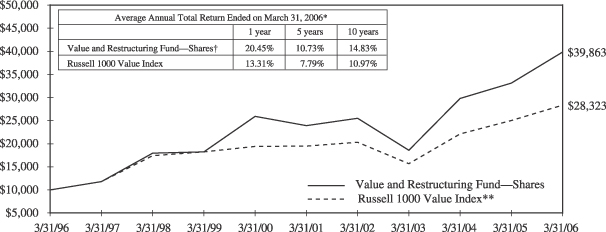
Past performance is not predictive of future performance. Investment returns and principal values will vary and shares may be worth more or less at redemption than their original cost.
The above illustration compares a $10,000 investment made in the Fund and a broad-based index over the past ten fiscal years. The chart assumes all dividends and capital gain distributions are reinvested. The Fund’s performance takes into account fees and expenses. The index does not take into account charges, fees and other expenses. Further information relating to Fund performance is contained in the Financial Highlights section of the Prospectus and elsewhere in this report.
| * | | Total return represents the change during the period in a hypothetical account with dividends reinvested. |
| ** | | Source: Frank Russell Company—The Russell 1000 Value Index is an unmanaged index composed of those Russell 1000 Index companies with lower price-to-book ratios and lower forecasted growth values. The Russell 1000 Index is composed of the 1000 largest companies in The Russell 3000 Index which is composed of 3,000 of the largest U.S. companies by market capitalization. The Index includes dividends reinvested. |
| † | | Currently certain fees are waived. Had certain fees not been waived, returns would have been lower. Returns do not reflect the deduction of taxes that a shareholder would pay on Fund distributions or the redemption of shares. |
20
EXCELSIOR FUNDS, INC. | EMERGING MARKETS FUND |
Fiscal Year Annual Review
Emerging markets chalked up positive returns for the Fund’s fiscal year, continuing their longest streak of out performance since 1998. Larger-cap equities that are index constituents tended to lead the way. The BRIC countries (Brazil, Russia, India, and China) are becoming a focal point for emerging market investors. These four countries generated some of the best returns for the asset class, with Russia leading the way, followed by India, Brazil, and China in that order.
Performance Attribution
Strategically, from a sector perspective, the Fund has long believed that some of the best stock opportunities are in domestic related companies, as opposed to export oriented companies. We expressed this view by over weighting sectors like telecommunications, consumer stocks, and banks. Telecommunications has long been the largest sector over weight in the Fund. We hold cellular companies listed in Mexico, which are continuing to gain market share throughout Latin America. We also hold Russian long distance providers, where we see continued opportunity. On the consumer side, we targeted household equipment in Turkey and Mexico, where consumers are getting a boost from continued economic growth and moderating inflation. We also remain focused on banking stocks in Latin America, where reduced interest rates and declining inflation are benefiting banks and adding strong loan growth. From a pure country perspective, BRIC exposure also helped the Emerging Markets Fund. The Fund had over weights in Brazil, Russia, and China. We believe that country assessment is critical to the investment process, which led us to over weight these countries some time ago. Our relative under performance against the benchmark reflects greater caution in our investments in Latin America.
Outlook
Going forward, we continue to believe that domestic oriented stocks, as opposed to export driven stocks, will perform best in emerging markets. Many emerging market countries are benefiting from financial strength that is allowing them to withstand upward pressure on interest rates. This development could make for a very robust environment for domestic oriented emerging market stocks. Given these strong financial conditions and promising growth prospects, especially for the BRIC countries, we believe emerging markets can close the valuation gap with developed world equities. And we expect investors will come to terms with higher valuation levels for emerging market equities, and if the growth impetus for emerging markets shifts to domestic drivers, the valuation gap could be narrowed further.
21
EXCELSIOR FUNDS, INC. | EMERGING MARKETS FUND |
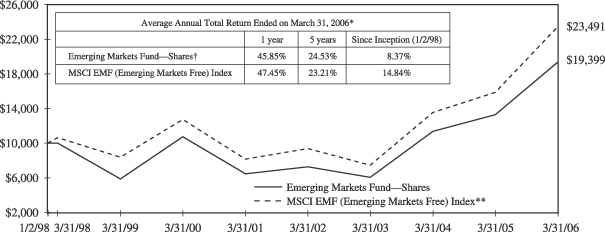
Past performance is not predictive of future performance. Investment returns and principal values will vary and shares may be worth more or less at redemption than their original cost. International investing is subject to special risks such as currency fluctuations and differences in accounting and taxation standards.
The above illustration compares a $10,000 investment made in the Fund and a broad-based index since 1/2/98 (inception date). For comparative purposes, the value of the index on 12/31/97 is used as the beginning value on 1/2/98. The chart assumes all dividends and capital gain distributions are reinvested. The Fund’s performance takes into account fees and expenses. The index does not take into account charges, fees and other expenses. Further information relating to Fund performance is contained in the Financial Highlights section of the Prospectus and elsewhere in this report.
| * | | Total return represents the change during the period in a hypothetical account with dividends reinvested. |
| ** | | Source: Morgan Stanley & Co., Incorporated—Morgan Stanley Capital International EMF (Emerging Markets Free) Index is a widely-accepted, unmanaged index composed of a sample of companies representative of the market structure of 26 global emerging market countries. The Index includes dividends reinvested. |
| † | | Currently certain fees are waived. Had such fees not been waived, returns would have been lower. Returns do not reflect the deduction of taxes that a shareholder would pay on Fund distributions or the redemption of shares. Returns do not reflect the 2% fee imposed on shares redeemed 30 days or less after their date of purchase. |
22
EXCELSIOR FUNDS, INC. | INTERNATIONAL FUND |
Annual Fiscal Year Review
International markets continued to strongly outperform the U.S. market for the twelve-month reporting period ending March 31, 2006. The performance differential was impressive with the global indexes approximately doubling the return for U.S. equities. Investors perceived overseas growth and relatively cheaper valuation as reasons for buying foreign stocks while the U.S. Federal Reserve continued to tighten monetary policy, raising the federal funds target rate to 4.75% by the end of the reporting period. The Fed’s action helped support the dollar, and exchange rate fluctuations added only marginally to the return of international equities during the quarter. Finally, the long-awaited turnaround of the Japanese economy has finally arrived, also contributing to strength for international equities.
Performance Attribution
The main contributor to the strong performance of the international equity benchmarks was the exceptional regional performance of the Continental European markets. Emerging markets continued to outperform the developed markets of the world based on strong investment flows. The BRIC markets (Brazil, Russia, India and China) continued to drive overall emerging markets performance, which is consistent with recent performance patterns. Strong earnings growth, attractive valuations and strongly improved quality characteristics of the emerging markets asset class are attracting heavy fund flows. Our sector weights, specifically, our underweight position in financials, continued to be detrimental to overall performance as the sector benefited from increased merger and acquisition (M&A) activity in Europe. The portfolio remains overweight in the information technology and health care sectors. This is largely offset by an underweight position in financial services. In Asia, consistent with our pursuit of eliminating internal portfolio inefficiencies, we eliminated smaller positions in consumer products and services.
Outlook
Our continued positive stance toward international investing is based on attractive relative valuations compared to U.S. equities. The U.S. profit cycle appears to be near a peak, whereas profits in most international markets have ample room to expand. We continue to favor the Japanese equity market, since stock valuations are not remotely reflecting the surprising strength of the Japanese economic recovery. Solid earnings growth acceleration and continued M&A activity continue to make Europe an attractive investment destination. Our exposure to Emerging Markets is approaching a benchmark-neutral position. Our expectations relative to domestic positions remain considerably higher.
23
EXCELSIOR FUNDS, INC. | INTERNATIONAL FUND |
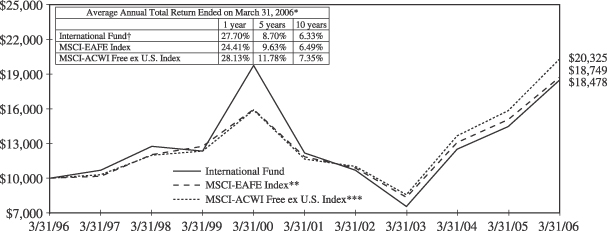
Past performance is not predictive of future performance. Investment returns and principal values will vary and shares may be worth more or less at redemption than their original cost. International investing is subject to special risks such as currency fluctuations and differences in accounting and taxation standards.
The above illustration compares a $10,000 investment made in the Fund and broad-based indices over the past ten fiscal years. The chart assumes all dividends and capital gain distributions are reinvested. The Fund’s performance takes into account fees and expenses. The indices do not take into account charges, fees and other expenses. Further information relating to Fund performance is contained in the Financial Highlights section of the Prospectus and elsewhere in this report.
| * | | Total return represents the change during the period in a hypothetical account with dividends reinvested. |
| ** | | Source: Morgan Stanley & Co., Incorporated—Morgan Stanley Capital International EAFE (Europe, Australia, Asia, Far East) Index is a widely accepted, unmanaged index composed of a sample of companies from 21 countries representing the developed stock markets outside North America. |
| *** | | Source: Morgan Stanley & Co., Incorporated—Morgan Stanley Capital International All Country World Index Free ex U.S. is a widely accepted, unmanaged index of global stock market performance comprising 47 countries with developed and emerging markets excluding the United States. |
| † | | Currently certain fees are waived. Had such fees not been waived returns would have been lower. Returns do not reflect the deduction of taxes that a shareholder would pay on Fund distributions or the redemption of shares. Returns do not reflect the 2% fee imposed on shares redeemed 30 days or less after their date of purchase. |
24
EXCELSIOR FUNDS, INC. | PACIFIC/ASIA FUND |
Fiscal Year Annual Review
The evidence continues to mount that the Japanese economy is indeed in a turnaround mode. This was the major change in the financial environment throughout the twelve-month reporting period, ending March 31. Discussions by the Bank of Japan regarding the end to their Quantitative Easing program of lower interest rates lend strong support to this viewpoint. Even oil prices, which were up thirty percent in the period, failed to hold back the emerging Japanese economic transformation. Currency has had little effect on the Fund’s performance in the first quarter. The Yen was essentially flat with only the Korean Won having any measurable effect. We expect further strengthening of Asian currencies as the year progresses, and relative to the U.S. dollar, so the Yen could add to the Fund’s performance.
Performance Attribution
Overall, looking back twelve-months, performance was quite disparate on a country basis. Japan, as noted, provided positive impetus for the Fund. Elsewhere around the region, much stronger performance was to be had from Indonesia, India and Thailand. These markets have been strong on the back of domestic strong consumption trends. Sector performance saw gains in food and chemicals. Negative performance came from Thai-based financials. The Fund continues to raise its exposure to the Japanese market, in particular in the area of financials and consumer products and services. Although we sold one Japanese position, we added four others in: financials (several), real estate and ceramics for technology. We sold our positions in a number of stocks that had produced strong returns for the Fund and had reached valuation targets, particularly in the energy sector.
Outlook
We expect that the primary drivers of performance for the year ahead will be economic growth in China and Japan. China must continue on a single-digit, managed path of economic development, to avoid inflation problems. The infrastructure build-out for the 2008 Olympics in China should continue to fuel Beijing’s needs for global commodities. Japan, must not derail the growth that the economy has exhibited for the past year, and it must continue to lead its economy out of a deflationary episode of many years duration. But we see strong growth engines in the Fund’s region continuing to contribute to future performance.
25
EXCELSIOR FUNDS, INC. | PACIFIC/ASIA FUND |
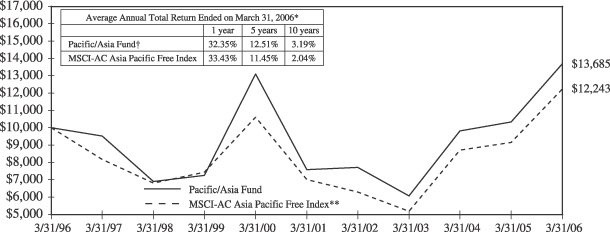
Past performance is not predictive of future performance. Investment returns and principal values will vary and shares may be worth more or less at redemption than their original cost. International investing is subject to special risks such as currency fluctuations and differences in accounting and taxation standards.
The above illustration compares a $10,000 investment made in the Fund and a broad-based index over the past ten fiscal years. The chart assumes all dividends and capital gain distributions are reinvested. The Fund’s performance takes into account fees and expenses. The index does not take into account charges, fees and other expenses. Further information relating to Fund performance is contained in the Financial Highlights section of the Prospectus and elsewhere in this report.
| * | | Total return represents the change during the period in a hypothetical account with dividends reinvested. |
| ** | | Source: Morgan Stanley & Co., Incorporated—The Morgan Stanley Capital International All Country Asia Pacific Free Index is a widely-accepted, unmanaged index composed of a sample of companies representative of the market structure of 10 developed and emerging market countries: China Free, Hong Kong, Japan, Indonesia, Korea, Malaysia, Philippines, Singapore, Taiwan and Thailand. The Index aims to capture 85% of the free float adjusted market capitalization in each industry group, in each country, for those securities not subject to foreign ownership restrictions. The Index includes dividends reinvested. |
| † | | Currently certain fees are waived. Had such fees not been waived, returns would have been lower. Returns do not reflect the deduction of taxes that a shareholder would pay on Fund distributions or the redemption of shares. Returns do not reflect the 2% fee imposed on shares redeemed 30 days or less after their date of purchase. |
26
Excelsior Funds, Inc.
Portfolio of Investments — March 31, 2006
Blended Equity Fund
| | | | | |
Shares
| | | | Value
|
| COMMON STOCKS — 97.09% |
| | | CONSUMER DISCRETIONARY — 13.58% |
| 57,093 | | Autozone, Inc.(a) | | $ | 5,691,601 |
| 89,443 | | Coach, Inc.(a) | | | 3,092,939 |
| 38,124 | | Dillards, Inc., Class A | | | 992,749 |
| 195,565 | | Eastman Kodak Co. | | | 5,561,869 |
| 98,800 | | eBay(a) | | | 3,859,128 |
| 304,540 | | Furniture Brands International, Inc. | | | 7,464,275 |
| 1,155 | | Interpublic Group of Companies, Inc.(a) | | | 11,042 |
| 255,940 | | John Wiley & Sons, Class A | | | 9,687,329 |
| 126,466 | | Life Time Fitness, Inc.(a) | | | 5,924,932 |
| 189,096 | | Sotheby’s Holdings, Inc., Class A(a) | | | 5,491,348 |
| 176,400 | | Target Corp. | | | 9,174,564 |
| 163,030 | | Timberland Co., Class A(a) | | | 5,580,517 |
| | | | |
|
|
| | | | | | 62,532,293 |
| | | | |
|
|
| | | CONSUMER STAPLES — 6.50% |
| 88,200 | | Altria Group, Inc. | | | 6,249,852 |
| 158,542 | | Anheuser Busch Cos., Inc. | | | 6,780,841 |
| 51,200 | | Kellogg Co. | | | 2,254,848 |
| 156,100 | | Wal-Mart Stores, Inc. | | | 7,374,164 |
| 50,000 | | Walgreen Co. | | | 2,156,500 |
| 79,899 | | Wm. Wrigley Jr. Co. | | | 5,113,536 |
| | | | |
|
|
| | | | | | 29,929,741 |
| | | | |
|
|
| | | ENERGY — 8.51% |
| 129,044 | | Apache Corp. | | | 8,453,672 |
| 37,100 | | Chevron Corp. | | | 2,150,687 |
| 258,697 | | Exxon Mobil Corp. | | | 15,744,300 |
| 13,200 | | Royal Dutch Shell plc ADR | | | 821,832 |
| 155,608 | | Suncor Energy, Inc. | | | 11,984,928 |
| | | | |
|
|
| | | | | | 39,155,419 |
| | | | |
|
|
| | | FINANCIAL — 17.63% |
| 154,000 | | American Capital Strategies Ltd. | | | 5,414,640 |
| 92,600 | | American Express Co. | | | 4,866,130 |
| 56,591 | | American International Group, Inc. | | | 3,740,099 |
| 18,520 | | Ameriprise Financial, Inc. | | | 834,511 |
| 168,520 | | Bank of America Corp. | | | 7,674,401 |
| 74 | | Berkshire Hathaway, Inc., Class A(a) | | | 6,685,900 |
| 48,387 | | Goldman Sachs Group, Inc. | | | 7,594,824 |
| 23,350 | | HSBC Holdings plc ADR | | | 1,956,263 |
| | | | | |
Shares
| | | | Value
|
| COMMON STOCKS — (continued) |
| | | FINANCIAL — (continued) |
| 177,321 | | Leucadia National Corp. | | $ | 10,578,971 |
| 49,088 | | Mellon Financial Corp. | | | 1,747,533 |
| 55,600 | | Merrill Lynch & Co., Inc. | | | 4,379,056 |
| 119,588 | | RenaissanceRe Holdings Ltd. | | | 5,216,429 |
| 213,100 | | State Street Corp. | | | 12,877,633 |
| 177,300 | | Washington Mutual, Inc. | | | 7,556,526 |
| | | | |
|
|
| | | | | | 81,122,916 |
| | | | |
|
|
| | | HEALTH CARE — 11.11% | | | |
| 180,800 | | Abbott Laboratories | | | 7,678,576 |
| 22,100 | | Genzyme Corp.- General Division(a) | | | 1,485,562 |
| 28,000 | | HCA, Inc. | | | 1,282,120 |
| 18,100 | | Hospira, Inc.(a) | | | 714,226 |
| 235,270 | | Johnson & Johnson | | | 13,932,690 |
| 107,195 | | Medtronic, Inc. | | | 5,440,146 |
| 107,252 | | Novo-Nordisk A/S ADR | | | 6,659,277 |
| 301,300 | | Pfizer, Inc. | | | 7,508,396 |
| 59,100 | | Schering Plough Corp. | | | 1,122,309 |
| 68,715 | | WellPoint, Inc.(a) | | | 5,320,602 |
| | | | |
|
|
| | | | | | 51,143,904 |
| | | | |
|
|
| | | INDUSTRIALS — 10.36% | | | |
| 3,000,000 | | Bombardier, Inc., Class B(a) | | | 8,736,000 |
| 115,826 | | Canadian National Railway Co. | | | 5,244,601 |
| 52,100 | | Dover Corp. | | | 2,529,976 |
| 631,184 | | General Electric Co. | | | 21,952,579 |
| 46,850 | | Illinois Tool Works, Inc. | | | 4,512,124 |
| 63,291 | | Quanta Services, Inc.(a) | | | 1,013,922 |
| 35,000 | | Tyco International Ltd. | | | 940,800 |
| 78,500 | | Waste Management, Inc. | | | 2,771,050 |
| | | | |
|
|
| | | | | | 47,701,052 |
| | | | |
|
|
| | | INFORMATION TECHNOLOGY — 11.48% |
| 694,444 | | 3com Corp.(a) | | | 3,555,553 |
| 152,352 | | Analog Devices, Inc. | | | 5,833,558 |
| 21,000 | | Broadcom Corp., Class A(a) | | | 906,360 |
| 432,065 | | Cisco Systems, Inc.(a) | | | 9,362,849 |
| 65,239 | | International Business Machines Corp. | | | 5,380,260 |
| 316,700 | | Microsoft Corp. | | | 8,617,407 |
| 234,468 | | National Instruments Corp. | | | 7,648,346 |
| 141,200 | | NCR Corp.(a) | | | 5,900,748 |
| 26,000 | | Nvidia Corp.(a) | | | 1,488,760 |
| 75,022 | | SAP AG ADR | | | 4,075,195 |
See Notes to Financial Statements.
27
Excelsior Funds, Inc.
Portfolio of Investments — March 31, 2006
Blended Equity Fund — (continued)
| | | | | |
Shares
| | | | Value
|
| COMMON STOCKS — (continued) |
| | | INFORMATION TECHNOLOGY — (continued) |
| 6,220 | | Symbol Technologies, Inc. | | $ | 65,808 |
| | | | |
|
|
| | | | | | 52,834,844 |
| | | | |
|
|
| | | RAW/INTERMEDIATE MATERIALS — 7.98% |
| 255,093 | | Aracruz Cellulose S.A. ADR | | | 13,504,623 |
| 128,846 | | E.I. Du Pont de Nemours & Co. | | | 5,438,590 |
| 100,147 | | Nucor Corp. | | | 10,494,404 |
| 84,424 | | Vulcan Materials Co. | | | 7,315,340 |
| | | | |
|
|
| | | | | | 36,752,957 |
| | | | |
|
|
| | | REAL ESTATE — 2.39% | | | |
| 175,018 | | St. Joe Co. | | | 10,998,131 |
| | | | |
|
|
| | | UTILITIES — 7.55% | | | |
| 384,715 | | AES Corp.(a) | | | 6,563,238 |
| 482,621 | | Centerpoint Energy, Inc. | | | 5,757,669 |
| 597,681 | | EL Paso Corp. | | | 7,202,056 |
| 301,471 | | Sierra Pacific Resources(a) | | | 4,163,315 |
| 247,000 | | TXU Corp. | | | 11,055,719 |
| | | | |
|
|
| | | | | | 34,741,997 |
| | | | |
|
|
| | | TOTAL COMMON STOCKS
(Cost $256,592,210) | | | 446,913,254 |
| FOREIGN COMMON STOCKS — 1.91% |
| | | GERMANY — 1.91% | | | |
| 160,000 | | Bayerische Motoren Werke AG | | | 8,811,879 |
| | | | |
|
|
| | | TOTAL FOREIGN COMMON STOCKS
(Cost $6,879,108) | | | 8,811,879 |
| | | | |
|
|
| | | | | |
Principal
Amount
| | | | Value
|
| REPURCHASE AGREEMENT — 2.62% |
| $12,058,000 | | JP Morgan Chase Securities, Inc., 3.40%, dated 03/31/06, to be repurchased 04/03/06, repurchase price $12,061,416 (collateralized by U.S. Treasury Note, par value $9,032,000, 8.125%, maturing 08/15/21; total market value $12,147,188) | | $ | 12,058,000 |
| | | | |
|
|
| | | TOTAL REPURCHASE AGREEMENT
(Cost $12,058,000) | | | 12,058,000 |
| | | | |
|
|
| | | | | | | |
TOTAL INVESTMENTS
(Cost $275,529,318)(b) | | 101.62 | % | | $ | 467,783,133 | |
LIABILITIES IN EXCESS OF
OTHER ASSETS | | (1.62 | ) | | | (7,473,923 | ) |
| | |
|
| |
|
|
|
NET ASSETS | | 100.00 | % | | $ | 460,309,210 | |
| | |
|
| |
|
|
|
| (a) | Non-income producing security. |
| (b) | Unrealized appreciation (depreciation) of securities: |
| | | | |
Unrealized
Appreciation
| | Unrealized
(Depreciation)
| | Net Unrealized
Appreciation/
(Depreciation)
|
| $194,361,643 | | $(2,107,828) | | $192,253,815 |
ADR—American Depository Receipt
Ltd.—Limited
plc—Public Limited Company
See Notes to Financial Statements.
28
Excelsior Funds, Inc.
Portfolio of Investments — March 31, 2006
Blended Equity Fund — (continued)
The summary of the Fund’s investments as of March 31, 2006 is as follows: (Unaudited)
| | | | | | | |
Sector Diversification
| | % of
Net
Assets
| | | Value
| |
Financial | | 17.63 | % | | $ | 81,122,916 | |
Consumer Discretionary | | 15.49 | | | | 71,344,172 | |
Information Technology | | 11.48 | | | | 52,834,844 | |
Health Care | | 11.11 | | | | 51,143,904 | |
Industrials | | 10.36 | | | | 47,701,052 | |
Energy | | 8.51 | | | | 39,155,419 | |
Raw/Intermediate Materials | | 7.98 | | | | 36,752,957 | |
Utilities | | 7.55 | | | | 34,741,997 | |
Consumer Staples | | 6.50 | | | | 29,929,741 | |
Repurchase Agreement | | 2.62 | | | | 12,058,000 | |
Real Estate | | 2.39 | | | | 10,998,131 | |
| | |
|
| |
|
|
|
Total Investments | | 101.62 | % | | $ | 467,783,133 | |
Liabilities in Excess of Other Assets | | (1.62 | ) | | | (7,473,923 | ) |
| | |
|
| |
|
|
|
Net Assets | | 100.00 | % | | $ | 460,309,210 | |
| | |
|
| |
|
|
|
See Notes to Financial Statements.
29
Excelsior Funds, Inc.
Portfolio of Investments — March 31, 2006
Energy and Natural Resources Fund
| | | | | |
Shares
| | | | Value
|
| COMMON STOCKS — 98.31% | | |
| | | ENERGY — 73.78% | | | |
| 570,400 | | Allis-Chalmers Energy, Inc.(a) | | $ | 7,774,552 |
| 100,000 | | Anadarko Petroleum Corp. | | | 10,101,000 |
| 138,000 | | Apache Corp. | | | 9,040,380 |
| 100,000 | | Arena Resources, Inc.(a) | | | 3,490,000 |
| 115,000 | | Atwood Oceanics, Inc.(a) | | | 11,616,150 |
| 400,000 | | Bill Barrett Corp. (a) | | | 13,036,000 |
| 180,600 | | BJ Services Co. | | | 6,248,760 |
| 62,740 | | BP plc ADR | | | 4,325,296 |
| 200,000 | | Bronco Drilling Co., Inc.(a) | | | 5,260,000 |
| 225,000 | | Cheniere Energy, Inc.(a) | | | 9,128,250 |
| 144,500 | | Chesapeake Energy Corp. | | | 4,538,745 |
| 106,388 | | Devon Energy Corp. | | | 6,507,754 |
| 63,000 | | Diamond Offshore Drilling | | | 5,638,500 |
| 1,038,000 | | Endeavor International Corp.(a) | | | 3,020,580 |
| 250,000 | | ENSCO International, Inc. | | | 12,862,500 |
| 1,100,000 | | Gasco Energy, Inc.(a) | | | 6,160,000 |
| 210,000 | | GlobalSantaFe Corp. | | | 12,757,500 |
| 250,000 | | GMX Resources, Inc.(a) | | | 9,362,500 |
| 250,000 | | Grant Prideco, Inc.(a) | | | 10,710,000 |
| 500,000 | | Hanover Compressor Co.(a) | | | 9,310,000 |
| 2,500,000 | | Kodiak Oil & Gas Corp.(a) | | | 6,037,500 |
| 92,300 | | Nabors Industries Ltd.(a) | | | 6,606,834 |
| 210,000 | | National-Oilwell, Inc.(a) | | | 13,465,200 |
| 221,600 | | Newfield Exploration Co.(a) | | | 9,285,040 |
| 147,800 | | Noble Corp. | | | 11,986,580 |
| 700,000 | | Parallel Petroleum Corp.(a) | | | 12,915,000 |
| 200,000 | | Patterson-UTI Energy, Inc. | | | 6,392,000 |
| 500,000 | | Petrohawk Energy Corp.(a) | | | 6,850,000 |
| 640,000 | | Petroquest Energy, Inc.(a) | | | 6,457,600 |
| 334,500 | | Range Resources Corp. | | | 9,135,195 |
| 115,500 | | Schlumberger Ltd. | | | 14,618,835 |
| 177,600 | | Southwestern Energy Co.(a) | | | 5,716,944 |
| 147,800 | | Suncor Energy, Inc. | | | 11,383,556 |
| 200,000 | | Talisman Energy, Inc. | | | 10,636,000 |
| 150,000 | | Tesoro Corp. | | | 10,251,000 |
| 181,200 | | TETRA Technologies, Inc.(a) | | | 8,523,648 |
| 400,000 | | Todco, Class A | | | 15,764,000 |
| 152,400 | | Transocean Sedco Forex, Inc.(a) | | | 12,237,720 |
| 113,400 | | Ultra Petroleum Corp.(a) | | | 7,065,954 |
| 350,000 | | Valero Energy | | | 20,922,999 |
| 544,500 | | Willbros Group, Inc.(a) | | | 11,075,130 |
| 166,666 | | XTO Energy, Inc. | | | 7,261,638 |
| | | | |
|
|
| | | | | | 385,476,840 |
| | | | |
|
|
| | | | | |
Shares
| | | | Value
|
| COMMON STOCKS — (continued) | | |
| | | RAW/INTERMEDIATE MATERIALS — 23.17% |
| 150,000 | | 3M Co. | | $ | 11,353,500 |
| 97,500 | | Aracruz Cellulose S.A. ADR | | | 5,161,650 |
| 160,000 | | Arch Coal, Inc. | | | 12,150,400 |
| 200,000 | | Canadian Natural Resources Ltd. | | | 11,078,000 |
| 202,100 | | Freeport-McMoRan Copper & Gold, Inc., Class B | | | 12,079,517 |
| 1,500,000 | | Hecla Mining Co.(a) | | | 9,915,000 |
| 175,000 | | Holly Corp. | | | 12,971,000 |
| 700,000 | | Kinross Gold Corp.(a) | | | 7,651,000 |
| 75,000 | | Newmont Mining Corp. | | | 3,891,750 |
| 196,000 | | Peabody Energy Corp. | | | 9,880,360 |
| 158,800 | | Phelps Dodge Corp. | | | 12,788,164 |
| 200,000 | | United States Steel Corp. | | | 12,136,000 |
| | | | |
|
|
| | | | | | 121,056,341 |
| | | | |
|
|
| | | UTILITIES — 1.36% | | |
| 332,000 | | Williams Cos., Inc. | | | 7,101,480 |
| | | | |
|
|
| | | TOTAL COMMON STOCKS
(Cost $455,466,737) | | | 513,634,661 |
| | | | |
|
|
| | |
Principal
Amount
| | | | |
| REPURCHASE AGREEMENT — 4.08% | | |
| $21,335,000 | | JP Morgan Chase Securities, Inc., 3.40%, dated 03/31/06, to be repurchased 04/03/06, repurchase price $21,341,045 (collateralized by U.S. Treasury Note, par value $15,981,000, 8.125%, maturing 08/15/21; total market value $21,492,778) | | | 21,335,000 |
| | | | |
|
|
| | | TOTAL REPURCHASE AGREEMENT
(Cost $21,335,000) | | | 21,335,000 |
| | | | |
|
|
| | | | | | | |
TOTAL INVESTMENTS
(Cost $476,801,737)(b) | | 102.39 | % | | $ | 534,969,661 | |
LIABILITIES IN EXCESS OF
OTHER ASSETS | | (2.39 | ) | | | (12,463,721 | ) |
| | |
|
| |
|
|
|
NET ASSETS | | 100.00 | % | | $ | 522,505,940 | |
| | |
|
| |
|
|
|
See Notes to Financial Statements.
30
Excelsior Funds, Inc.
Portfolio of Investments — March 31, 2006
Energy and Natural Resources Fund — (continued)
| (a) | Non-income producing security. |
| (b) | Unrealized appreciation (depreciation) of securities: |
| | | | |
Unrealized
Appreciation
| | Unrealized
(Depreciation)
| | Net Unrealized
Appreciation/
(Depreciation)
|
| $63,953,948 | | $(5,786,024) | | $58,167,924 |
ADR—American Depository Receipt
Ltd.—Limited
plc—public limited company
The summary of the Fund’s investments as of March 31, 2006 is as follows: (Unaudited)
| | | | | | | |
Sector Diversification
| | % of
Net
Assets
| | | Value
| |
Energy | | 73.78 | % | | $ | 385,476,840 | |
Raw/Intermediate Materials | | 23.17 | | | | 121,056,341 | |
Repurchase Agreement | | 4.08 | | | | 21,335,000 | |
Utilities | | 1.36 | | | | 7,101,480 | |
| | |
|
| |
|
|
|
Total Investments | | 102.39 | % | | $ | 534,969,661 | |
Liabilities in Excess of Other Assets | | (2.39 | ) | | | (12,463,721 | ) |
| | |
|
| |
|
|
|
Net Assets | | 100.00 | % | | $ | 522,505,940 | |
| | |
|
| |
|
|
|
See Notes to Financial Statements.
31
Excelsior Funds, Inc.
Portfolio of Investments — March 31, 2006
Equity Core Fund
| | | | | |
| | | | | | |
Shares
| | | | Value
|
| COMMON STOCKS — 92.23% | | |
| | | CONSUMER DISCRETIONARY — 16.87% |
| 41,105 | | Autozone, Inc.(a) | | $ | 4,097,758 |
| 132,499 | | Dillards, Inc., Class A | | | 3,450,274 |
| 132,143 | | Eastman Kodak Co. | | | 3,758,147 |
| 162,500 | | Furniture Brands International, Inc. | | | 3,982,875 |
| 104,164 | | John Wiley & Sons, Class A | | | 3,942,607 |
| 80,000 | | Life Time Fitness, Inc.(a) | | | 3,748,000 |
| 166,000 | | Sotheby’s Holdings, Inc., Class A(a) | | | 4,820,641 |
| 108,770 | | Timberland Co., Class A(a) | | | 3,723,197 |
| | | | |
|
|
| | | | | | 31,523,499 |
| | | | |
|
|
| | | CONSUMER STAPLES — 4.31% |
| 93,806 | | Anheuser Busch Cos., Inc. | | | 4,012,083 |
| 63,278 | | Wm. Wrigley Jr. Co. | | | 4,049,792 |
| | | | |
|
|
| | | | | | 8,061,875 |
| | | | |
|
|
| | | ENERGY — 7.41% |
| 57,100 | | Apache Corp. | | | 3,740,621 |
| 72,294 | | Exxon Mobil Corp. | | | 4,399,813 |
| 74,032 | | Suncor Energy, Inc. | | | 5,701,944 |
| | | | |
|
|
| | | | | | 13,842,378 |
| | | | |
|
|
| | | FINANCIAL — 13.10% |
| 117,427 | | American Capital Strategies Ltd. | | | 4,128,733 |
| 48 | | Berkshire Hathaway, Inc., Class A(a) | | | 4,336,800 |
| 26,184 | | Lehman Brothers Holding, Inc. | | | 3,784,374 |
| 84,659 | | Leucadia National Corp. | | | 5,050,756 |
| 110,713 | | North Fork Bancorporation, Inc. | | | 3,191,856 |
| 91,354 | | RenaissanceRe Holdings Ltd. | | | 3,984,861 |
| | | | |
|
|
| | | | | | 24,477,380 |
| | | | |
|
|
| | | HEALTH CARE — 9.33% |
| 68,353 | | Johnson & Johnson | | | 4,047,865 |
| 75,331 | | Medtronic, Inc. | | | 3,823,048 |
| 77,325 | | Novo-Nordisk A/S ADR | | | 4,801,109 |
| 64,099 | | Roche Holdings Ltd. ADR | | | 4,760,152 |
| | | | |
|
|
| | | | | | 17,432,174 |
| | | | |
|
|
| | | | | |
| | | | | | |
Shares
| | | | Value
|
| COMMON STOCKS — (continued) | | |
| | | INDUSTRIALS — 9.83% |
| 1,930,962 | | Bombardier, Inc., Class B(a) | | $ | 5,622,961 |
| 82,500 | | Canadian National Railway Co. | | | 3,735,600 |
| 115,682 | | General Electric Co. | | | 4,023,420 |
| 310,700 | | Quanta Services, Inc.(a) | | | 4,977,414 |
| | | | |
|
|
| | | | | | 18,359,395 |
| | | | |
|
|
| | | INFORMATION TECHNOLOGY — 7.51% |
| 933,293 | | 3com Corp.(a) | | | 4,778,460 |
| 112,577 | | Analog Devices, Inc. | | | 4,310,573 |
| 151,407 | | National Instruments Corp. | | | 4,938,897 |
| | | | |
|
|
| | | | | | 14,027,930 |
| | | | |
|
|
| | | RAW/INTERMEDIATE MATERIALS — 13.22% |
| 97,537 | | Aracruz Cellulose S.A. ADR | | | 5,163,609 |
| 94,404 | | E.I. Du Pont de Nemours & Co. | | | 3,984,793 |
| 55,801 | | Monsanto Co. | | | 4,729,135 |
| 52,850 | | Nucor Corp. | | | 5,538,151 |
| 61,000 | | Vulcan Materials Co. | | | 5,285,650 |
| | | | |
|
|
| | | | | | 24,701,338 |
| | | | |
|
|
| | | REAL ESTATE — 2.27% |
| 67,592 | | St. Joe Co. | | | 4,247,481 |
| | | | |
|
|
| | | UTILITIES — 8.38% |
| 274,996 | | AES Corp.(a) | | | 4,691,432 |
| 224,593 | | Centerpoint Energy, Inc. | | | 2,679,394 |
| 395,821 | | EL Paso Corp. | | | 4,769,643 |
| 255,200 | | Sierra Pacific Resources(a) | | | 3,524,312 |
| | | | |
|
|
| | | | | | 15,664,781 |
| | | | |
|
|
| | | TOTAL COMMON STOCKS
(Cost $148,821,548) | | | 172,338,231 |
| | | | |
|
|
| FOREIGN COMMON STOCKS — 2.43% | | |
| | | GERMANY — 2.43% | | | |
| 82,507 | | Bayerische Motoren Werke AG | | | 4,544,011 |
| | | | |
|
|
| | | TOTAL FOREIGN COMMON STOCKS
(Cost $3,702,066) | | | 4,544,011 |
| | | | |
|
|
See Notes to Financial Statements.
32
Excelsior Funds, Inc.
Portfolio of Investments — March 31, 2006
Equity Core Fund — (continued)
| | | | | |
Principal Amount
| | | | Value
|
| REPURCHASE AGREEMENT — 5.79% | | |
| $10,818,000 | | JP Morgan Chase Securities, Inc., 3.40%, dated 03/31/06, to be repurchased 04/03/06, repurchase price $10,821,065 (collateralized by U.S. Treasury Note, par value $8,103,000, 8.125%, maturing 08/15/21; total market value $10,898,014) | | $ | 10,818,000 |
| | | | |
|
|
| | | TOTAL REPURCHASE AGREEMENT
(Cost $10,818,000) | | | 10,818,000 |
| | | | |
|
|
| | | | | | | |
TOTAL INVESTMENTS (Cost $163,341,614)(b) | | 100.45 | % | | $ | 187,700,242 | |
LIABILITIES IN EXCESS OF OTHER ASSETS | | (0.45 | ) | | | (845,844 | ) |
| | |
|
| |
|
|
|
NET ASSETS | | 100.00 | % | | $ | 186,854,398 | |
| | |
|
| |
|
|
|
| (a) | Non-income producing security. |
| (b) | Unrealized appreciation (depreciation) of securities: |
| | | | |
Unrealized
Appreciation
| | Unrealized
(Depreciation)
| | Net Unrealized
Appreciation/ (Depreciation)
|
| $26,252,304 | | $(1,893,676) | | $24,358,628 |
ADR—American Depository Receipt
Ltd.—Limited
The summary of the Fund’s investments as of March 31, 2006 is as follows: (Unaudited)
| | | | | | | |
Sector Diversification
| | % of
Net
Assets
| | | Value
| |
Consumer Discretionary | | 19.30 | % | | $ | 36,067,510 | |
Raw/Intermediate Materials | | 13.22 | | | | 24,701,338 | |
Financial | | 13.10 | | | | 24,477,380 | |
Industrials | | 9.83 | | | | 18,359,395 | |
Health Care | | 9.33 | | | | 17,432,174 | |
Utilities | | 8.38 | | | | 15,664,781 | |
Information Technology | | 7.51 | | | | 14,027,930 | |
Energy | | 7.41 | | | | 13,842,378 | |
Repurchase Agreement | | 5.79 | | | | 10,818,000 | |
Consumer Staples | | 4.31 | | | | 8,061,875 | |
Real Estate | | 2.27 | | | | 4,247,481 | |
| | |
|
| |
|
|
|
Total Investments | | 100.45 | % | | $ | 187,700,242 | |
Liabilities in Excess of Other Assets | | (0.45 | ) | | | (845,844 | ) |
| | |
|
| |
|
|
|
Net Assets | | 100.00 | % | | $ | 186,854,398 | |
| | |
|
| |
|
|
|
See Notes to Financial Statements.
33
Excelsior Funds, Inc.
Portfolio of Investments — March 31, 2006
Equity Income Fund
| | | | | |
| | | | | | |
| | | | | | |
Shares
| | | | Value
|
| COMMON STOCKS — 92.49% | | |
| | | CONSUMER DISCRETIONARY — 14.17% |
| 106,000 | | CBS Corp., Class B | | $ | 2,541,880 |
| 221,000 | | Circuit City Stores, Inc. | | | 5,410,080 |
| 120,000 | | Lear Corp. | | | 2,127,600 |
| 214,000 | | Leggett & Platt, Inc. | | | 5,215,180 |
| 184,800 | | Newell Rubbermaid, Inc. | | | 4,655,112 |
| 118,000 | | Snap-On, Inc. | | | 4,498,160 |
| 123,400 | | Time Warner, Inc. | | | 2,071,886 |
| 68,500 | | Viacom, Inc., Class B(a) | | | 2,657,800 |
| | | | |
|
|
| | | | | | 29,177,698 |
| | | | |
|
|
| | | CONSUMER STAPLES — 2.67% | | | |
| 77,500 | | Altria Group, Inc. | | | 5,491,650 |
| | | | |
|
|
| | | ENERGY — 8.69% | | | |
| 100,000 | | BP plc ADR | | | 6,894,000 |
| 114,000 | | Chevron Corp. | | | 6,608,580 |
| 60,100 | | Halliburton Co. | | | 4,388,502 |
| | | | |
|
|
| | | | | | 17,891,082 |
| | | | |
|
|
| | | FINANCIAL — 20.45% | | | |
| 105,000 | | Arthur J. Gallagher & Co. | | | 2,920,050 |
| 43,316 | | Bank of America Corp. | | | 1,972,611 |
| 131,000 | | Citigroup, Inc. | | | 6,188,440 |
| 100,000 | | Freddie Mac | | | 6,100,000 |
| 195,000 | | Mellon Financial Corp. | | | 6,942,000 |
| 100,000 | | Morgan Stanley | | | 6,282,000 |
| 93,000 | | RenaissanceRe Holdings Ltd. | | | 4,056,660 |
| 149,000 | | U.S. BanCorp. | | | 4,544,500 |
| 147,500 | | W. P. Stewart & Co. Ltd. | | | 3,109,300 |
| | | | |
|
|
| | | | | | 42,115,561 |
| | | | |
|
|
| | | HEALTH CARE — 6.32% | | | |
| 92,000 | | Eli Lilly & Co. | | | 5,087,600 |
| 101,300 | | Medtronic, Inc. | | | 5,140,975 |
| 50,000 | | Novartis AG ADR | | | 2,772,000 |
| | | | |
|
|
| | | | | | 13,000,575 |
| | | | |
|
|
| | | INDUSTRIALS — 12.05% | | | |
| 112,000 | | Dover Corp. | | | 5,438,720 |
| 177,533 | | General Electric Co. | | | 6,174,598 |
| 163,000 | | Honeywell International, Inc. | | | 6,971,509 |
| 66,275 | | Hubbell, Inc., Class B | | | 3,397,257 |
| 86,000 | | RR Donnelley & Sons Co. | | | 2,813,920 |
| | | | |
|
|
| | | | | | 24,796,004 |
| | | | |
|
|
| | | | | |
| | | | | | |
| | | | | | |
Shares
| | | | Value
|
| COMMON STOCKS — (continued) | | |
| | | INFORMATION TECHNOLOGY — 11.44% |
| 243,000 | | Electronic Data Systems Corp. | | $ | 6,519,690 |
| 138,000 | | Linear Technology Corp. | | | 4,841,040 |
| 200,000 | | Microsoft Corp. | | | 5,442,000 |
| 325,500 | | Nokia Oyj ADR | | | 6,744,360 |
| | | | |
|
|
| | | | | | 23,547,090 |
| | | | |
|
|
| | | RAW/INTERMEDIATE MATERIALS — 11.17% |
| 103,000 | | Eastman Chemical Co. | | | 5,271,540 |
| 201,700 | | Packaging Corp. of America | | | 4,526,148 |
| 15,000 | | Pope Resources Ltd. | | | 498,750 |
| 74,000 | | Rayonier, Inc. | | | 3,373,660 |
| 237,000 | | RPM, Inc. | | | 4,251,780 |
| 70,000 | | Weyerhaeuser Co. | | | 5,070,100 |
| | | | |
|
|
| | | | | | 22,991,978 |
| | | | |
|
|
| | | TELECOMMUNICATION — 5.53% |
| 180,000 | | AT&T, Inc. | | | 4,867,200 |
| 191,500 | | Verizon Communications, Inc. | | | 6,522,490 |
| | | | |
|
|
| | | | | | 11,389,690 |
| | | | |
|
|
| | | TOTAL COMMON STOCKS
(Cost $166,480,153) | | | 190,401,328 |
| | | | |
|
|
| FOREIGN COMMON STOCKS — 3.11% | | |
| | | UNITED KINGDOM — 3.11% | | | |
| 463,400 | | Pearson plc | | | 6,403,518 |
| | | | |
|
|
| | | TOTAL FOREIGN COMMON STOCKS
(Cost $5,497,014) | | | 6,403,518 |
| | | | |
|
|
| CONVERTIBLE PREFERRED STOCKS — 3.73% |
| | | CONSUMER DISCRETIONARY — 2.16% |
| 71,900 | | Ford Motor Co. Capital Trust II, Preferred Exchange, 6.50% | | | 2,160,595 |
| 132,400 | | General Motors Corp., Series C, Preferred Exchange, 6.25% | | | 2,297,140 |
| | | | |
|
|
| | | | | | 4,457,735 |
| | | | |
|
|
| | | ENERGY — 1.57% | | | |
| 89,500 | | EL Paso Energy Capital Trust I, Preferred Exchange, 4.75% | | | 3,222,000 |
| | | | |
|
|
| | | TOTAL CONVERTIBLE PREFERRED STOCKS
(Cost $7,510,071) | | | 7,679,735 |
| | | | |
|
|
See Notes to Financial Statements.
34
Excelsior Funds, Inc.
Portfolio of Investments — March 31, 2006
Equity Income Fund — (continued)
| | | | | |
| | | | | | |
Contracts
| | | | Value
|
| CALL OPTION PURCHASED — 0.34% | | |
| 2,000 | | Time Warner, Inc. Expires 01/19/08 strike price 15 | | $ | 700,000 |
| | | | |
|
|
| | | TOTAL CALL OPTION PURCHASED
(Cost $895,999) | | | 700,000 |
| | | | |
|
|
| | | | | | |
TOTAL INVESTMENTS
(Cost $180,383,237)(b) | | 99.67 | % | | $ | 205,184,581 |
OTHER ASSETS IN EXCESS OF LIABILITIES | | 0.33 | | | | 669,398 |
| | |
|
| |
|
|
NET ASSETS | | 100.00 | % | | $ | 205,853,979 |
| | |
|
| |
|
|
| (a) | Non-income producing security |
| (b) | Unrealized appreciation (depreciation) of securities: |
| | | | |
Unrealized Appreciation
| | Unrealized (Depreciation)
| | Net
Unrealized Appreciation/
(Depreciation)
|
| $26,765,350 | | $(1,964,006) | | $24,801,344 |
ADR—American Depository Receipt
Ltd.—Limited
plc—Public limited company
The summary of the Fund’s investments as of March 31, 2006 is as follows: (Unaudited)
| | | | | | |
Sector Diversification
| | % of
Net
Assets
| | | Value
|
Financial | | 20.45 | % | | $ | 42,115,561 |
Consumer Discretionary | | 19.78 | | | | 40,738,951 |
Industrials | | 12.05 | | | | 24,796,004 |
Information Technology | | 11.44 | | | | 23,547,090 |
Raw/Intermediate Materials | | 11.17 | | | | 22,991,978 |
Energy | | 10.26 | | | | 21,113,082 |
Health Care | | 6.32 | | | | 13,000,575 |
Telecommunication | | 5.53 | | | | 11,389,690 |
Consumer Staples | | 2.67 | | | | 5,491,650 |
| | |
|
| |
|
|
Total Investments | | 99.67 | % | | $ | 205,184,581 |
Other Assets in Excess of Liabilities | | 0.33 | | | | 669,398 |
| | |
|
| |
|
|
Net Assets | | 100.00 | % | | $ | 205,853,979 |
| | |
|
| |
|
|
See Notes to Financial Statements.
35
Excelsior Funds, Inc.
Portfolio of Investments — March 31, 2006
Large Cap Growth Fund
| | | | | |
| | | | | | |
Shares
| | | | Value
|
| COMMON STOCKS — 95.96% | | |
| | | CONSUMER DISCRETIONARY — 17.76% |
| 326,100 | | Carnival Corp., Class A | | $ | 15,447,357 |
| 478,700 | | Coach, Inc.(a) | | | 16,553,446 |
| 563,300 | | eBay(a) | | | 22,002,498 |
| 238,100 | | Lowes Companies, Inc. | | | 15,343,164 |
| 456,000 | | Petsmart, Inc. | | | 12,831,840 |
| 422,900 | | Starbucks Corp.(a) | | | 15,917,956 |
| | | | |
|
|
| | | | | | 98,096,261 |
| | | | |
|
|
| | | FINANCIAL — 7.63% |
| 34,800 | | Chicago Mercantile Exchange | | | 15,573,000 |
| 74,600 | | Lehman Brothers Holding, Inc. | | | 10,781,938 |
| 303,975 | | SLM Corp. | | | 15,788,462 |
| | | | |
|
|
| | | | | | 42,143,400 |
| | | | |
|
|
| | | HEALTH CARE — 34.91% |
| 171,655 | | Alcon, Inc. | | | 17,896,750 |
| 214,685 | | Amgen, Inc.(a) | | | 15,618,334 |
| 431,688 | | Caremark Rx, Inc.(a) | | | 21,230,416 |
| 519,600 | | Celgene Corp.(a) | | | 22,976,712 |
| 183,400 | | Genentech, Inc.(a) | | | 15,499,134 |
| 210,300 | | Gilead Sciences, Inc.(a) | | | 13,084,866 |
| 289,840 | | Medtronic, Inc. | | | 14,709,380 |
| 595,631 | | Patterson Cos., Inc.(a) | | | 20,966,211 |
| 388,100 | | Teva Pharmaceutical Industries Ltd. ADR | | | 15,981,958 |
| 202,876 | | WellPoint, Inc.(a) | | | 15,708,689 |
| 281,482 | | Zimmer Holdings, Inc.(a) | | | 19,028,183 |
| | | | |
|
|
| | | | | | 192,700,633 |
| | | | |
|
|
| | | INDUSTRIALS — 2.94% | | | |
| 188,200 | | Expeditors International of Washington, Inc. | | | 16,258,598 |
| | | | |
|
|
| | | INFORMATION TECHNOLOGY — 28.92% |
| 351,600 | | Apple Computer, Inc.(a) | | | 22,052,352 |
| 361,500 | | Broadcom Corp., Class A(a) | | | 15,602,340 |
| 312,259 | | Dell, Inc.(a) | | | 9,292,828 |
| 284,415 | | Electronic Arts, Inc.(a) | | | 15,563,189 |
| 60,873 | | Google, Inc., Class A(a) | | | 23,740,469 |
| 184,203 | | Infosys Technologies Ltd. ADR | | | 14,342,046 |
| 395,990 | | Qualcomm, Inc. | | | 20,041,054 |
| 165,100 | | Research In Motion Ltd.(a) | | | 14,013,688 |
| 144,700 | | SAP AG ADR | | | 7,860,104 |
| 531,500 | | Yahoo!, Inc.(a) | | | 17,146,190 |
| | | | |
|
|
| | | | | | 159,654,260 |
| | | | |
|
|
| | | | | |
| | | | | | |
Shares
| | | | Value
|
| COMMON STOCKS — (continued) | | |
| | | TELECOMMUNICATION — 3.80% |
| 612,700 | | America Movil S.A. de C.V., Series L ADR | | $ | 20,991,102 |
| | | | |
|
|
| | | TOTAL COMMON STOCKS
(Cost $443,598,594) | | | 529,844,254 |
| | | | |
|
|
| | |
Principal
Amount
| | | | |
| REPURCHASE AGREEMENT — 6.69% | | |
| $36,968,000 | | JP Morgan Chase Securities, Inc., 3.40%, dated 03/31/06, to be repurchased 04/03/06, repurchase price $36,978,474 (collateralized by U.S. Treasury Note, par value $27,691,000, 8.125%, maturing 08/15/21; total market value $37,241,507) | | | 36,968,000 |
| | | | |
|
|
| | | TOTAL REPURCHASE AGREEMENT
(Cost $36,968,000) | | | 36,968,000 |
| | | | |
|
|
| | | | | | | |
TOTAL INVESTMENTS
(Cost $480,566,594)(b) | | 102.65 | % | | $ | 566,812,254 | |
LIABILITIES IN EXCESS OF OTHER ASSETS | | (2.65 | ) | | | (14,616,684 | ) |
| | |
|
| |
|
|
|
NET ASSETS | | 100.00 | % | | $ | 552,195,570 | |
| | |
|
| |
|
|
|
| (a) | Non-income producing security |
| (b) | Unrealized appreciation (depreciation) of securities: |
| | | | | | | |
Unrealized
Appreciation
| | Unrealized
(Depreciation)
| | | Net Unrealized
Appreciation/
(Depreciation)
|
| $90,470,304 | | $ | (4,224,644 | ) | | $ | 86,245,660 |
ADR—American Depository Receipt
Ltd.—Limited
See Notes to Financial Statements.
36
Excelsior Funds, Inc.
Portfolio of Investments — March 31, 2006
Large Cap Growth Fund — (continued)
The summary of the Fund’s investments as of March 31, 2006 is as follows: (Unaudited)
| | | | | | | |
Sector Diversification
| | % of
Net
Assets
| | | Value
| |
Health Care | | 34.91 | % | | $ | 192,700,633 | |
Information Technology | | 28.92 | | | | 159,654,260 | |
Consumer Discretionary | | 17.76 | | | | 98,096,261 | |
Financial | | 7.63 | | | | 42,143,400 | |
Repurchase Agreement | | 6.69 | | | | 36,968,000 | |
Telecommunication | | 3.80 | | | | 20,991,102 | |
Industrials | | 2.94 | | | | 16,258,598 | |
| | |
|
| |
|
|
|
Total Investments | | 102.65 | % | | $ | 566,812,254 | |
Liabilities in Excess of Other Assets | | (2.65 | ) | | | (14,616,684 | ) |
| | |
|
| |
|
|
|
Net Assets | | 100.00 | % | | $ | 552,195,570 | |
| | |
|
| |
|
|
|
See Notes to Financial Statements.
37
Excelsior Funds, Inc.
Portfolio of Investments — March 31, 2006
Mid Cap Value and Restructuring Fund
| | | | | |
| | | | | | |
Shares
| | | | Value
|
| COMMON STOCKS — 97.44% | | |
| | | CONSUMER DISCRETIONARY — 26.05% |
| 90,000 | | Autozone, Inc.(a) | | $ | 8,972,100 |
| 126,600 | | Black & Decker Corp. | | | 11,000,274 |
| 745,000 | | Blockbuster, Inc. | | | 2,667,100 |
| 229,661 | | Callaway Golf Co. | | | 3,950,169 |
| 95,000 | | Centex Corp. | | | 5,889,050 |
| 325,000 | | Constellation Brands, Inc.(a) | | | 8,141,250 |
| 270,000 | | EchoStar Communications, Inc.(a) | | | 8,064,900 |
| 170,000 | | Limited Brands | | | 4,158,200 |
| 42,000 | | Morgans Hotel Group(a) | | | 741,720 |
| 379,700 | | Onex Corp. | | | 6,998,251 |
| 210,000 | | Sherwin-Williams Co. | | | 10,382,400 |
| 294,700 | | Tempur-Pedic International, Inc.(a) | | | 4,170,005 |
| 300,000 | | TJX Cos., Inc. | | | 7,446,000 |
| 208,000 | | Zale Corp.(a) | | | 5,830,240 |
| | | | |
|
|
| | | | | | 88,411,659 |
| | | | |
|
|
| | | CONSUMER STAPLES — 2.34% |
| 205,000 | | Dean Foods Co.(a) | | | 7,960,150 |
| | | | |
|
|
| | | ENERGY — 12.45% | | | |
| 130,000 | | Cimarex Energy Co. | | | 5,623,800 |
| 217,000 | | Devon Energy Corp. | | | 13,273,890 |
| 153,700 | | Noble Corp. | | | 12,465,070 |
| 117,600 | | Occidental Petroleum Corp. | | | 10,895,640 |
| | | | |
|
|
| | | | | | 42,258,400 |
| | | | |
|
|
| | | FINANCIAL — 15.21% |
| 167,300 | | Ace Ltd. | | | 8,701,273 |
| 200,000 | | CIT Group, Inc. | | | 10,704,000 |
| 250,000 | | Doral Financial Corp. | | | 2,887,500 |
| 50,000 | | First Marblehead Corp. | | | 2,162,500 |
| 73,000 | | Lehman Brothers Holding, Inc. | | | 10,550,690 |
| 125,000 | | Leucadia National Corp. | | | 7,457,500 |
| 75,000 | | RenaissanceRe Holdings Ltd. | | | 3,271,500 |
| 270,000 | | Sovereign Bancorp, Inc. | | | 5,915,700 |
| | | | |
|
|
| | | | | | 51,650,663 |
| | | | |
|
|
| | | HEALTH CARE — 5.58% | | | |
| 415,000 | | Health Management Associates, Inc., Class A | | | 8,951,550 |
| 215,000 | | Shire Pharmaceuticals plc ADR | | | 9,995,350 |
| | | | |
|
|
| | | | | | 18,946,900 |
| | | | |
|
|
| | | | | |
| | | | | | |
Shares
| | | | Value
|
| COMMON STOCKS — (continued) | | |
| | | INDUSTRIALS — 15.69% |
| 51,500 | | Autoliv, Inc. | | $ | 2,913,870 |
| 235,000 | | Brink’s Co. | | | 11,928,600 |
| 265,000 | | Empresa Brasileira de Aeronautica S.A. ADR | | | 9,765,250 |
| 123,700 | | Lincoln Electric Holdings, Inc. | | | 6,678,563 |
| 210,000 | | Mueller Industries, Inc. | | | 7,494,900 |
| 420,000 | | United Rentals, Inc.(a) | | | 14,490,000 |
| | | | |
|
|
| | | | | | 53,271,183 |
| | | | |
|
|
| | | INFORMATION TECHNOLOGY — 7.21% |
| 190,000 | | Electronic Data Systems Corp. | | | 5,097,700 |
| 280,400 | | Harris Corp. | | | 13,260,116 |
| 580,000 | | Symbol Technologies, Inc. | | | 6,136,400 |
| | | | |
|
|
| | | | | | 24,494,216 |
| | | | |
|
|
| | | RAW/INTERMEDIATE MATERIALS — 7.11% |
| 233,800 | | Aracruz Cellulose S.A. ADR | | | 12,377,372 |
| 225,000 | | Cabot Microelectronics Corp.(a) | | | 8,347,500 |
| 350,000 | | International Coal Group, Inc.(a) | | | 3,409,000 |
| | | | |
|
|
| | | | | | 24,133,872 |
| | | | |
|
|
| | | REAL ESTATE — 2.34% |
| 126,600 | | St. Joe Co. | | | 7,955,544 |
| | | | |
|
|
| | | UTILITIES — 3.46% | | | |
| 406,800 | | EL Paso Corp. | | | 4,901,940 |
| 320,000 | | Williams Cos., Inc. | | | 6,844,800 |
| | | | |
|
|
| | | | | | 11,746,740 |
| | | | |
|
|
| | | TOTAL COMMON STOCKS
(Cost $208,393,057) | | | 330,829,327 |
| | | | |
|
|
| FOREIGN COMMON STOCKS — 1.94% | | |
| | | NETHERLANDS — 1.94% |
| 99,500 | | Hunter Douglas NV | | | 6,598,774 |
| | | | |
|
|
| | | TOTAL FOREIGN COMMON STOCKS
(Cost $3,662,399) | | | 6,598,774 |
| | | | |
|
|
| CONVERTIBLE PREFERRED STOCKS — 0.14% |
| | | CONSUMER DISCRETIONARY — 0.14% |
| 500 | | Blockbuster, Inc., Preferred Exchange, 7.50%(b) | | | 465,000 |
| | | | |
|
|
| | | TOTAL CONVERTIBLE PREFERRED STOCKS
(Cost $500,000) | | | 465,000 |
| | | | |
|
|
See Notes to Financial Statements.
38
Excelsior Funds, Inc.
Portfolio of Investments — March 31, 2006
Mid Cap Value and Restructuring Fund — (continued)
| | | | | |
| | | | | | |
Principal Amount
| | | | Value
|
| REPURCHASE AGREEMENT — 0.44% | | |
| $1,484,000 | | JP Morgan Chase Securities, Inc., 3.40%, dated 03/31/06, to be repurchased 04/03/06, repurchase price $1,484,420 (collateralized by U.S. Treasury Note, par value $1,112,000, 8.125%, maturing 08/15/21; total market value $1,494,979) | | $ | 1,484,000 |
| | | | |
|
|
| | | TOTAL REPURCHASE AGREEMENT
(Cost $1,484,000) | | | 1,484,000 |
| | | | |
|
|
| | | | | | |
TOTAL INVESTMENTS
(Cost $214,039,456)(c) | | 99.96 | % | | $ | 339,377,101 |
OTHER ASSETS IN EXCESS OF LIABILITIES | | 0.04 | | | | 120,025 |
| | |
|
| |
|
|
NET ASSETS | | 100.00 | % | | $ | 339,497,126 |
| | |
|
| |
|
|
| (a) | Non-income producing security. |
| (b) | Security exempt from registration under Rule 144A of the Securities Act of 1933. This security may be resold in transactions exempt from registration, normally to qualified institutional buyers. At March 31, 2006, these securities amounted to $465,000 or 0.14% of net assets. |
| (c) | Unrealized appreciation (depreciation) of securities: |
| | | | | | | |
Unrealized
Appreciation
| | Unrealized
(Depreciation)
| | | Net Unrealized
Appreciation/
(Depreciation)
|
| $130,550,617 | | $ | (5,212,972 | ) | | $ | 125,337,645 |
ADR—American Depository Receipt
Ltd.—Limited
plc—public limited company
The summary of the Fund’s investments as of March 31, 2006 is as follows: (Unaudited)
| | | | | | |
Sector Diversification
| | % of
Net
Assets
| | | Value
|
Consumer Discretionary | | 28.13 | % | | $ | 95,475,433 |
Industrials | | 15.69 | | | | 53,271,183 |
Financial | | 15.21 | | | | 51,650,663 |
Energy | | 12.45 | | | | 42,258,400 |
Information Technology | | 7.21 | | | | 24,494,216 |
Raw/Intermediate Materials | | 7.11 | | | | 24,133,872 |
Health Care | | 5.58 | | | | 18,946,900 |
Utilities | | 3.46 | | | | 11,746,740 |
Consumer Staples | | 2.34 | | | | 7,960,150 |
Real Estate | | 2.34 | | | | 7,955,544 |
Repurchase Agreement | | 0.44 | | | | 1,484,000 |
| | |
|
| |
|
|
Total Investments | | 99.96 | % | | $ | 339,377,101 |
Other Assets in Excess of Liabilities | | 0.04 | | | | 120,025 |
| | |
|
| |
|
|
Net Assets | | 100.00 | % | | $ | 339,497,126 |
| | |
|
| |
|
|
See Notes to Financial Statements.
39
Excelsior Funds, Inc.
Portfolio of Investments — March 31, 2006
Real Estate Fund
| | | | | |
| | | | | | |
Shares
| | | | Value
|
| COMMON STOCKS — 99.67% | | |
| | | CONSUMER DISCRETIONARY — 2.65% |
| 50,000 | | Starwood Hotels & Resorts Worldwide, Inc. | | $ | 3,386,500 |
| | | | |
|
|
| | | FINANCIAL — 0.30% |
| 10,000 | | iStar Financial, Inc. | | | 382,800 |
| | | | |
|
|
| �� | | REAL ESTATE — 95.20% |
| 75,000 | | AMB Property Corp. | | | 4,070,250 |
| 29,500 | | Apartment Investment & Management Co., Class A | | | 1,383,550 |
| 40,000 | | Archstone-Smith Trust | | | 1,950,800 |
| 39,784 | | AvalonBay Communities, Inc. | | | 4,340,434 |
| 75,000 | | BioMed Realty Trust, Inc. | | | 2,223,000 |
| 60,000 | | Boston Properties, Inc. | | | 5,595,000 |
| 34,542 | | Brandywine Realty Trust | | | 1,097,054 |
| 48,800 | | Camden Property Trust | | | 3,516,040 |
| 135,100 | | Cedar Shopping Centers, Inc. | | | 2,139,984 |
| 95,000 | | Cousins Properties, Inc. | | | 3,175,850 |
| 85,000 | | Duke Realty Corp. | | | 3,225,750 |
| 70,000 | | Equity Inns, Inc. | | | 1,134,000 |
| 100,320 | | Equity Office Properties Trust | | | 3,368,746 |
| 116,820 | | Equity Residential | | | 5,466,008 |
| 51,400 | | Federal Realty Investment Trust | | | 3,865,280 |
| 68,600 | | Forest City Enterprises, Inc., Class A | | | 3,234,490 |
| 72,600 | | General Growth Properties, Inc. | | | 3,547,962 |
| 30,000 | | Global Signal, Inc. | | | 1,476,000 |
| 102,500 | | GMH Communities Trust | | | 1,193,100 |
| 77,200 | | Healthcare Realty Trust, Inc. | | | 2,885,736 |
| 55,700 | | Heritage Property Investment Trust | | | 2,205,163 |
| 35,300 | | Home Properties of New York, Inc. | | | 1,803,830 |
| 143,300 | | Host Marriott Corp. | | | 3,066,620 |
| 107,400 | | Kimco Realty Corp. | | | 4,364,736 |
| 73,000 | | Liberty Property Trust | | | 3,442,680 |
| 40,700 | | Macerich Co. | | | 3,009,765 |
| 75,000 | | Maguire Properties, Inc. | | | 2,737,500 |
| 45,000 | | Pan Pacific Retail Properties, Inc. | | | 3,190,500 |
| 30,000 | | Parkway Properties, Inc. | | | 1,310,400 |
| 69,200 | | Post Properties, Inc. | | | 3,079,400 |
| 113,124 | | Prologis | | | 6,052,134 |
| 50,100 | | Public Storage, Inc. | | | 4,069,623 |
| | | | | |
| | | | | | |
Shares
| | | | Value
|
| COMMON STOCKS — (continued) | | |
| | | REAL ESTATE — (continued) |
| 100,000 | | Republic Property Trust | | $ | 1,177,000 |
| 25,000 | | Senior Housing Properties Trust | | | 452,500 |
| 75,000 | | Simon Property Group, Inc. | | | 6,310,501 |
| 10,600 | | SL Green Realty Corp. | | | 1,075,900 |
| 27,300 | | St. Joe Co. | | | 1,715,532 |
| 4,186 | | Trizec Canada, Inc. | | | 101,460 |
| 129,513 | | Trizec Properties, Inc. | | | 3,332,369 |
| 110,300 | | U-Store-It Trust | | | 2,222,545 |
| 46,500 | | Vornado Realty Trust | | | 4,464,000 |
| 84,175 | | Weingarten Realty Investors | | | 3,430,131 |
| | | | |
|
|
| | | | | | 121,503,323 |
| | | | |
|
|
| | | TRANSPORTATION — 1.52% |
| 40,700 | | Alexander & Baldwin, Inc. | | | 1,940,576 |
| | | | |
|
|
| | | TOTAL COMMON STOCKS
(Cost $77,488,217) | | | 127,213,199 |
| | | | |
|
|
| | |
Principal
Amount
| | | | |
| REPURCHASE AGREEMENT — 0.56% | | |
| $710,000 | | JP Morgan Chase Securities, Inc., 3.40%, dated 03/31/06, to be repurchased 04/03/06, repurchase price $710,201 (collateralized by U.S. Treasury Note, par value $532,000, 8.125%, maturing 08/15/21; total market value $715,256) | | | 710,000 |
| | | | |
|
|
| | | TOTAL REPURCHASE AGREEMENT
(Cost $710,000) | | | 710,000 |
| | | | |
|
|
| | | | | | | |
TOTAL INVESTMENTS
(Cost $78,198,217)(a) | | 100.23 | % | | $ | 127,923,199 | |
LIABILITIES IN EXCESS OF OTHER ASSETS | | (0.23 | ) | | | (294,791 | ) |
| | |
|
| |
|
|
|
NET ASSETS | | 100.00 | % | | $ | 127,628,408 | |
| | |
|
| |
|
|
|
| (a) | Unrealized appreciation (depreciation) of securities: |
| | | | | | | |
Unrealized
Appreciation
| | Unrealized
(Depreciation)
| | | Net Unrealized Appreciation/
(Depreciation)
|
| $49,916,948 | | $ | (191,966 | ) | | $ | 49,724,982 |
See Notes to Financial Statements.
40
Excelsior Funds, Inc.
Portfolio of Investments — March 31, 2006
Real Estate Fund — (continued)
The summary of the Fund’s investments as of March 31, 2006 is as follows: (Unaudited)
| | | | | | | |
Sector Diversification
| | % of
Net
Assets
| | | Value
| |
Real Estate | | 95.20 | % | | $ | 121,503,323 | |
Consumer Discretionary | | 2.65 | | | | 3,386,500 | |
Transportation | | 1.52 | | | | 1,940,576 | |
Repurchase Agreement | | 0.56 | | | | 710,000 | |
Financial | | 0.30 | | | | 382,800 | |
| | |
|
| |
|
|
|
Total Investments | | 100.23 | % | | $ | 127,923,199 | |
Liabilities in Excess of Other Assets | | (0.23 | ) | | | (294,791 | ) |
| | |
|
| |
|
|
|
Net Assets | | 100.00 | % | | $ | 127,628,408 | |
| | |
|
| |
|
|
|
See Notes to Financial Statements.
41
Excelsior Funds, Inc.
Portfolio of Investments — March 31, 2006
Small Cap Fund
| | | | | |
| | | | | | |
Shares
| | | | Value
|
| COMMON STOCKS — 98.97% | | |
| | | CONSUMER DISCRETIONARY — 14.35% |
| 400,000 | | Cabelas, Inc.(a) | | $ | 8,208,000 |
| 60,000 | | Columbia Sportswear Co.(a) | | | 3,199,800 |
| 320,000 | | Ethan Allen Interiors, Inc. | | | 13,446,400 |
| 800,000 | | Oakley, Inc. | | | 13,616,000 |
| 880,000 | | Sotheby’s Holdings, Inc., Class A(a) | | | 25,555,200 |
| 320,000 | | Thor Industries, Inc. | | | 17,075,200 |
| 200,000 | | Urban Outfitters, Inc.(a) | | | 4,908,000 |
| | | | |
|
|
| | | | | | 86,008,600 |
| | | | |
|
|
| | | CONSUMER STAPLES — 1.98% | | | |
| 380,000 | | Performance Food Group Co.(a) | | | 11,852,200 |
| | | | |
|
|
| | | ENERGY — 5.54% | | | |
| 380,000 | | Helix Energy Solutions Group, Inc.(a) | | | 14,402,000 |
| 400,000 | | TETRA Technologies, Inc.(a) | | | 18,816,000 |
| | | | |
|
|
| | | | | | 33,218,000 |
| | | | |
|
|
| | | FINANCIAL — 10.38% | | | |
| 200,000 | | Greenhill & Co., Inc. | | | 13,222,000 |
| 260,000 | | Jefferies Group, Inc. | | | 15,210,000 |
| 125,000 | | Park National Corp. | | | 13,312,500 |
| 600,000 | | Philadelphia Consolidated Holdings Corp.(a) | | | 20,484,000 |
| | | | |
|
|
| | | | | | 62,228,500 |
| | | | |
|
|
| | | HEALTH CARE — 6.83% | | | |
| 460,000 | | Arrow International, Inc. | | | 15,028,200 |
| 440,000 | | Kensey Nash Corp.(a) | | | 12,584,000 |
| 300,000 | | Molina Healthcare, Inc.(a) | | | 10,041,000 |
| 800,000 | | Orthovita, Inc.(a) | | | 3,312,000 |
| | | | |
|
|
| | | | | | 40,965,200 |
| | | | |
|
|
| | | INDUSTRIALS — 20.65% | | | |
| 220,000 | | Barnes Group, Inc. | | | 8,910,000 |
| 600,000 | | FTI Consulting, Inc.(a) | | | 17,118,000 |
| 660,000 | | Kansas City Southern(a) | | | 16,302,000 |
| 1,200,000 | | MPS Group, Inc.(a) | | | 18,360,000 |
| 1,260,000 | | Quanta Services, Inc.(a) | | | 20,185,200 |
| 520,000 | | Shaw Group, Inc.(a) | | | 15,808,000 |
| 440,000 | | Simpson Manufacturing Co., Inc. | | | 19,052,000 |
| 180,000 | | Triumph Group, Inc.(a) | | | 7,966,800 |
| | | | |
|
|
| | | | | | 123,702,000 |
| | | | |
|
|
| | | | | |
| | | | | | |
Shares
| | | | Value
|
| COMMON STOCKS — (continued) | | |
| | | INFORMATION TECHNOLOGY — 16.05% |
| 280,000 | | CACI International, Inc., Class A(a) | | $ | 18,410,000 |
| 660,000 | | Dendrite International, Inc.(a) | | | 9,009,000 |
| 700,000 | | Forrester Research, Inc.(a) | | | 15,624,000 |
| 1,400,000 | | Keane, Inc.(a) | | | 22,050,000 |
| 760,000 | | Manhattan Associates, Inc.(a) | | | 16,720,000 |
| 400,000 | | MAXIMUS, Inc. | | | 14,392,000 |
| | | | |
|
|
| | | | | | 96,205,000 |
| | | | |
|
|
| | | RAW/INTERMEDIATE MATERIALS — 3.09% |
| 500,000 | | Cabot Microelectronics Corp.(a) | | | 18,550,000 |
| | | | |
|
|
| | | TECHNOLOGY — 18.48% |
| 700,000 | | CommScope, Inc.(a) | | | 19,985,000 |
| 800,000 | | Fairchild Semiconductor International, Inc.(a) | | | 15,256,000 |
| 1,500,000 | | Kulicke & Soffa Industries, Inc.(a) | | | 14,310,000 |
| 600,000 | | Lattice Semiconductor Corp.(a) | | | 3,996,000 |
| 700,000 | | Palm, Inc.(a) | | | 16,212,000 |
| 600,000 | | Power Integrations(a) | | | 14,868,000 |
| 620,000 | | Technitrol, Inc. | | | 14,867,600 |
| 400,000 | | Varian Semiconductor Equipment Associates, Inc.(a) | | | 11,232,000 |
| | | | |
|
|
| | | | | | 110,726,600 |
| | | | |
|
|
| | | UTILITIES — 1.62% |
| 350,000 | | Aqua America, Inc. | | | 9,737,000 |
| | | | |
|
|
| | | TOTAL COMMON STOCKS (Cost $402,404,879) | | | 593,193,100 |
| | | | |
|
|
See Notes to Financial Statements.
42
Excelsior Funds, Inc.
Portfolio of Investments — March 31, 2006
Small Cap Fund — (continued)
| | | | | |
| | | | | | |
Principal
Amount
| | | | Value
|
| REPURCHASE AGREEMENT — 0.96% | | |
| $5,752,000 | | JP Morgan Chase Securities, Inc., 3.40%, dated 03/31/06, to be repurchased 04/03/06, repurchase price $5,753,630 (collateralized by U.S. Treasury Note, par value $4,309,000, 8.125%, maturing 08/15/21; total market value $5,794,552) | | $ | 5,752,000 |
| | | | |
|
|
| | | TOTAL REPURCHASE AGREEMENT
(Cost $5,752,000) | | | 5,752,000 |
| | | | |
|
|
| | | | | | |
TOTAL INVESTMENTS (Cost $408,156,879)(b) | | 99.93 | % | | $ | 598,945,100 |
OTHER ASSETS IN EXCESS OF LIABILITIES | | 0.07 | | | | 445,094 |
| | |
|
| |
|
|
NET ASSETS | | 100.00 | % | | $ | 599,390,194 |
| | |
|
| |
|
|
| (a) | Non-income producing security |
| (b) | Unrealized appreciation (depreciation) of securities: |
| | | | | | | |
Unrealized Appreciation
| | Unrealized (Depreciation)
| | | Net Unrealized Appreciation/
(Depreciation)
|
| $191,568,402 | | $ | (780,181 | ) | | $ | 190,788,221 |
The summary of the Fund’s investments as of March 31, 2006 is as follows: (Unaudited)
| | | | | | |
Sector Diversification
| | % of
Net
Assets
| | | Value
|
Industrials | | 20.65 | % | | $ | 123,702,000 |
Technology | | 18.48 | | | | 110,726,600 |
Information Technology | | 16.05 | | | | 96,205,000 |
Consumer Discretionary | | 14.35 | | | | 86,008,600 |
Financial | | 10.38 | | | | 62,228,500 |
Health Care | | 6.83 | | | | 40,965,200 |
Energy | | 5.54 | | | | 33,218,000 |
Raw/Intermediate Materials | | 3.09 | | | | 18,550,000 |
Consumer Staples | | 1.98 | | | | 11,852,200 |
Utilities | | 1.62 | | | | 9,737,000 |
Repurchase Agreement | | 0.96 | | | | 5,752,000 |
| | |
|
| |
|
|
Total Investments | | 99.93 | % | | $ | 598,945,100 |
Other Assets in Excess of Liabilities | | 0.07 | | | | 445,094 |
| | |
|
| |
|
|
Net Assets | | 100.00 | % | | $ | 599,390,194 |
| | |
|
| |
|
|
See Notes to Financial Statements.
43
Excelsior Funds, Inc.
Portfolio of Investments — March 31, 2006
Value and Restructuring Fund
| | | | | |
| | | | | | |
Shares
| | | | Value
|
| COMMON STOCKS — 95.72% | | |
| | | CONSUMER DISCRETIONARY — 16.31% |
| 1,700,000 | | Avon Products, Inc. | | $ | 52,989,000 |
| 2,150,000 | | Black & Decker Corp. | | | 186,813,500 |
| 2,400,000 | | CBS Corp., Class B | | | 57,552,000 |
| 2,750,000 | | Centex Corp. | | | 170,472,500 |
| 1,800,000 | | EchoStar Communications, Inc.(a) | | | 53,766,000 |
| 1,000,000 | | Harman International Industries, Inc. | | | 111,130,000 |
| 2,000,000 | | Interpublic Group of Companies, Inc.(a)(b) | | | 19,120,000 |
| 2,100,000 | | Leggett & Platt, Inc. | | | 51,177,000 |
| 2,000,000 | | Liberty Media Corp., Class A(a) | | | 16,420,000 |
| 714,340 | | Morgans Hotel Group(a) | | | 12,615,244 |
| 2,600,000 | | Newell Rubbermaid, Inc. | | | 65,494,000 |
| 2,750,000 | | TJX Cos., Inc. | | | 68,255,000 |
| 5,750,000 | | XM Satellite Radio Holdings, Inc., Class A(a) | | | 128,052,500 |
| 2,250,000 | | Zale Corp.(a) | | | 63,067,500 |
| | | | |
|
|
| | | | | | 1,056,924,244 |
| | | | |
|
|
| | | CONSUMER STAPLES — 4.00% | | |
| 1,750,000 | | ConAgra Foods, Inc. | | | 37,555,000 |
| 2,475,000 | | Dean Foods Co.(a) | | | 96,104,250 |
| 1,000,000 | | Kraft Foods, Inc., Class A | | | 30,310,000 |
| 2,010,000 | | Loews Corp. - Carolina Group | | | 95,012,700 |
| | | | |
|
|
| | | | | | 258,981,950 |
| | | | |
|
|
| | | ENERGY — 13.35% | | |
| 1,650,000 | | Burlington Resources, Inc. | | | 151,651,500 |
| 1,450,000 | | ConocoPhillips | | | 91,567,500 |
| 2,250,000 | | Devon Energy Corp.(b) | | | 137,632,500 |
| 1,500,000 | | Mariner Energy, Inc.(a) | | | 30,765,000 |
| 2,000,000 | | Noble Energy, Inc. | | | 87,840,000 |
| 1,775,000 | | Petrobras ADR | | | 153,839,250 |
| 2,000,000 | | Petrohawk Energy Corp.(a) | | | 27,400,000 |
| 2,900,000 | | Rossetta Resources, Inc.(a) | | | 52,084,000 |
| 1,900,000 | | Todco, Class A | | | 74,879,000 |
| 1,425,000 | | W&T Offshore, Inc. | | | 57,441,750 |
| | | | |
|
|
| | | | | | 865,100,500 |
| | | | |
|
|
| | | FINANCIAL — 18.00% | | |
| 2,000,000 | | Ace Ltd. | | | 104,020,000 |
| 2,800,000 | | Amvescap plc ADR | | | 52,808,000 |
| 2,250,000 | | Apollo Investment Corp.(c) | | | 40,072,500 |
| | | | | |
| | | | | | |
Shares
| | | | Value
|
| COMMON STOCKS — (continued) | | |
| | | FINANCIAL — (continued) | | |
| 1,889,800 | | Castlepoint Holdings Ltd. ADR(a)(d) | | $ | 18,898,000 |
| 900,000 | | CIT Group, Inc. | | | 48,168,000 |
| 2,125,000 | | Citigroup, Inc. | | | 100,385,000 |
| 2,500,000 | | Doral Financial Corp. | | | 28,875,000 |
| 1,350,000 | | Freddie Mac | | | 82,350,000 |
| 1,850,000 | | JP Morgan Chase & Co. | | | 77,034,000 |
| 675,000 | | Lehman Brothers Holding, Inc. | | | 97,557,750 |
| 750,000 | | Loews Corp. | | | 75,900,000 |
| 2,250,000 | | Marsh & McLennan Cos., Inc. | | | 66,060,000 |
| 3,000,000 | | MCG Capital Corp. | | | 42,330,000 |
| 1,675,000 | | Metlife, Inc. | | | 81,019,750 |
| 1,800,000 | | Morgan Stanley | | | 113,076,001 |
| 900,000 | | PNC Financial Services Group, Inc. | | | 60,579,000 |
| 2,650,000 | | Primus Guaranty Ltd.(a) | | | 29,547,500 |
| 1,150,000 | | Washington Mutual, Inc. | | | 49,013,000 |
| | | | |
|
|
| | | | | | 1,167,693,501 |
| | | | |
|
|
| | | HEALTH CARE — 4.68% | | |
| 1,800,000 | | AmerisourceBergen Corp. | | | 86,886,000 |
| 2,225,000 | | Baxter International, Inc. | | | 86,352,250 |
| 1,350,000 | | Bristol-Myers Squibb Co. | | | 33,223,500 |
| 1,350,000 | | HCA, Inc. | | | 61,816,500 |
| 725,000 | | Wyeth | | | 35,177,000 |
| | | | |
|
|
| | | | | | 303,455,250 |
| | | | |
|
|
| | | INDUSTRIALS — 12.60% | | |
| 2,725,000 | | AGCO Corp.(a) | | | 56,516,500 |
| 900,000 | | Aries Maritime Transport Ltd. | | | 12,573,000 |
| 925,000 | | Arlington Tankers | | | 21,275,000 |
| 3,500,000 | | Cendant Corp. | | | 60,725,000 |
| 1,000,000 | | Copa Holdings S.A., Class A(a) | | | 22,850,000 |
| 1,350,000 | | Deluxe Corp. | | | 35,329,500 |
| 2,050,000 | | Empresa Brasileira de Aeronautica S.A. ADR | | | 75,542,500 |
| 3,000,000 | | Gol Linhas Aereas Inteligentes S.A. ADR | | | 80,400,000 |
| 1,550,000 | | Ryder Systems, Inc. | | | 69,409,000 |
| 2,600,000 | | Tyco International Ltd. | | | 69,888,000 |
| 1,200,000 | | Union Pacific Corp. | | | 112,020,000 |
| 3,500,000 | | United Rentals, Inc.(a) | | | 120,750,000 |
| 1,375,000 | | United Technologies Corp. | | | 79,708,750 |
| | | | |
|
|
| | | | | | 816,987,250 |
| | | | |
|
|
See Notes to Financial Statements.
44
Excelsior Funds, Inc.
Portfolio of Investments — March 31, 2006
Value and Restructuring Fund — (continued)
| | | | | |
| | | | | | |
Shares
| | | | Value
|
| COMMON STOCKS — (continued) | | |
| | | INFORMATION TECHNOLOGY — 5.38% |
| 3,600,000 | | Harris Corp. | | $ | 170,244,000 |
| 725,000 | | International Business Machines Corp. | | | 59,790,750 |
| 3,000,000 | | Nokia Oyj ADR | | | 62,160,000 |
| 1,600,000 | | Plantronics, Inc. | | | 56,688,000 |
| | | | |
|
|
| | | | | | 348,882,750 |
| | | | |
|
|
| | | RAW/INTERMEDIATE MATERIALS — 11.95% |
| 2,000,000 | | Alpha Natural Resources, Inc.(a) | | | 46,280,000 |
| 2,950,000 | | Celanese Corp., Class A | | | 61,861,500 |
| 2,200,000 | | CF Industries Holdings, Inc. | | | 37,378,000 |
| 1,075,000 | | CNX Gas Corp.(a) | | | 27,950,000 |
| 2,175,000 | | Consol Energy, Inc. | | | 161,298,000 |
| 825,000 | | Eagle Materials, Inc., Class B | | | 52,626,750 |
| 1,450,000 | | Foundation Coal Holdings, Inc. | | | 59,653,000 |
| 3,100,000 | | International Coal Group, Inc.(a) | | | 30,194,000 |
| 1,182,694 | | Lafarge Corp. | | | 99,346,296 |
| 944,900 | | Pinnacle Gas Resources, Inc.(a)(d) | | | 10,393,900 |
| 1,275,000 | | PPG Industries, Inc. | | | 80,771,250 |
| 850,000 | | Southern Copper Corp. | | | 71,808,000 |
| 2,050,000 | | Tronox, Inc. | | | 34,768,000 |
| | | | |
|
|
| | | | | | 774,328,696 |
| | | | |
|
|
| | | REAL ESTATE — 2.83% | | |
| 3,275,715 | | Diamondrock Hospitality Co. | | | 45,237,624 |
| 1,200,000 | | Fieldstone Investment Corp. | | | 14,160,000 |
| 2,900,000 | | Friedman Billings Ramsey Group, Inc., Class A | | | 27,202,000 |
| 1,700,000 | | Host Marriott Corp. | | | 36,380,000 |
| 2,000,000 | | Peoples Choice Financial Corp.(a)(d) | | | 11,000,000 |
| 600,000 | | Taberna Realty Finance Trust(d) | | | 7,950,000 |
| 850,000 | | Ventas, Inc. | | | 28,203,000 |
| 1,500,000 | | Vintage Wine Trust, Inc.(d) | | | 13,500,000 |
| | | | |
|
|
| | | | | | 183,632,624 |
| | | | |
|
|
| | | TELECOMMUNICATION — 4.21% |
| 5,225,000 | | America Movil S.A. de C.V., Series L ADR | | | 179,008,500 |
| 2,408,254 | | Sprint Nextel Corp. | | | 62,229,283 |
| | | | | |
| | | | | | |
Shares
| | | | Value
|
| COMMON STOCKS — (continued) | | |
| | | TELECOMMUNICATION — (continued) |
| 2,400,000 | | Valor Communications, Inc. | | $ | 31,584,000 |
| | | | |
|
|
| | | | | | 272,821,783 |
| | | | |
|
|
| | | UTILITIES — 2.41% | | |
| 1,300,000 | | Centerpoint Energy, Inc. | | | 15,509,000 |
| 1,325,000 | | Duke Energy Corp. | | | 38,623,750 |
| 5,000,000 | | EL Paso Corp. | | | 60,250,000 |
| 649,275 | | Public Service Enterprise Group, Inc. | | | 41,579,571 |
| | | | |
|
|
| | | | | | 155,962,321 |
| | | | |
|
|
| | | TOTAL COMMON STOCKS (Cost $4,103,263,208) | | | 6,204,770,869 |
| | | | |
|
|
| FOREIGN COMMON STOCKS — 1.47% | | |
| | | GERMANY — 0.82% | | |
| 1,400,000 | | Lanxess AG(a) | | | 52,774,176 |
| | | | |
|
|
| | | ITALY — 0.65% | | |
| 5,000,000 | | Enel S.p.A | | | 42,254,747 |
| | | | |
|
|
| | | TOTAL FOREIGN COMMON STOCKS
(Cost $75,072,487) | | | 95,028,923 |
| | | | |
|
|
| CONVERTIBLE PREFERRED STOCKS — 1.02% |
| | | CONSUMER DISCRETIONARY — 0.79% |
| 1,700,000 | | Ford Motor Co. Capital Trust II, Preferred Exchange, 6.50% | | | 51,085,000 |
| | | | |
|
|
| | | RAW/INTERMEDIATE MATERIALS — 0.23% |
| 500,000 | | Celanese Corp., Preferred Exchange, 4.25% | | | 15,125,000 |
| | | | |
|
|
| | | TOTAL CONVERTIBLE PREFERRED STOCKS
(Cost $79,293,818) | | | 66,210,000 |
| | | | |
|
|
See Notes to Financial Statements.
45
Excelsior Funds, Inc.
Portfolio of Investments — March 31, 2006
Value and Restructuring Fund — (continued)
| | | | | |
| | | | | | |
Principal
Amount
| | | | Value
|
| REPURCHASE AGREEMENT — 2.48% | | |
| $160,785,000 | | JP Morgan Chase Securities, Inc., 3.40%, dated 03/31/06, to be repurchased 04/03/06, repurchase price $160,830,556 (collateralized by U.S. Treasury Note, par value $120,438,000, 8.125%, maturing 08/15/21; total market value $161,974,138) | | $ | 160,785,000 |
| | | | |
|
|
| | | TOTAL REPURCHASE AGREEMENT
(Cost $160,785,000) | | | 160,785,000 |
| | | | |
|
|
| | | | | | | |
TOTAL INVESTMENTS
(Cost $4,418,414,513)(e) | | 100.69 | % | | $ | 6,526,794,792 | |
LIABILITIES IN EXCESS OF OTHER ASSETS | | (0.69 | ) | | | (44,777,900 | ) |
| | |
|
| |
|
|
|
NET ASSETS | | 100.00 | % | | $ | 6,482,016,892 | |
| | |
|
| |
|
|
|
| (a) | Non-income producing security. |
| (b) | All or part of the security is segregated by the Fund’s custodian to cover future purchase commitments. |
| (c) | Registered Investment Company |
| (d) | Security exempt from registration under Rule 144A of the Securities Act of 1933. This security may be resold in transactions exempt from registration, normally to qualified institutional buyers. At March 31, 2006, these securities amounted to $61,741,900 or 0.95% of net assets. |
| (e) | Unrealized appreciation (depreciation) of securities: |
| | | | |
Unrealized
Appreciation
| | Unrealized
(Depreciation)
| | Net
Unrealized
Appreciation/
(Depreciation)
|
| $2,228,495,581 | | $(120,115,302) | | $2,108,380,279 |
ADR—American Depository Receipt
Ltd.—Limited
plc—public limited company
| | | | | |
Contracts
| | | | Value
| |
| CALL OPTIONS WRITTEN — 0.00% | |
| (4,468) | | Devon Energy, Expires 04/25/06, strike price 70
(Premiums received $1,760,972) | | $ (22,340 | ) |
| | | | |
|
|
See Notes to Financial Statements.
46
Excelsior Funds, Inc.
Portfolio of Investments — March 31, 2006
Value and Restructuring Fund — (continued)
The summary of the Fund’s investments as of March 31, 2006 is as follows: (Unaudited)
| | | | | | | |
Sector Diversification
| | % of
Net
Assets
| | | Value
| |
Financial | | 18.00 | % | | $ | 1,167,693,501 | |
Consumer Discretionary | | 17.10 | | | | 1,108,009,244 | |
Industrials | | 13.42 | | | | 869,761,426 | |
Energy | | 13.35 | | | | 865,100,500 | |
Raw/Intermediate Materials | | 12.18 | | | | 789,453,696 | |
Information Technology | | 5.38 | | | | 348,882,750 | |
Health Care | | 4.68 | | | | 303,455,250 | |
Telecommunication | | 4.21 | | | | 272,821,783 | |
Consumer Staples | | 4.00 | | | | 258,981,950 | |
Utilities | | 3.06 | | | | 198,217,068 | |
Real Estate | | 2.83 | | | | 183,632,624 | |
Repurchase Agreement | | 2.48 | | | | 160,785,000 | |
| | |
|
| |
|
|
|
Total Investments | | 100.69 | % | | $ | 6,526,794,792 | |
Liabilities in Excess of Other Assets | | (0.69 | ) | | | (44,777,900 | ) |
| | |
|
| |
|
|
|
Net Assets | | 100.00 | % | | $ | 6,482,016,892 | |
| | |
|
| |
|
|
|
See Notes to Financial Statements.
47
Excelsior Funds, Inc.
Portfolio of Investments — March 31, 2006
Emerging Markets Fund
| | | | | |
| | | | | | |
Shares
| | | | Value
|
| COMMON STOCKS — 86.32% | | |
| | | ARGENTINA — 1.23% | | | |
| 931,800 | | Telecom Argentina S.A. ADR(a) | | $ | 12,616,572 |
| | | | |
|
|
| | | BRAZIL — 6.56% | | | |
| 841,674 | | Arcelor Brazil S.A. | | | 13,094,004 |
| 215,700 | | Companhia Vale do Rio Doce S.A. | | | 10,490,818 |
| 272,500 | | Diagnosticos da America S.A.(a) | | | 7,017,221 |
| 334,800 | | Gol Linhas Aereas Inteligentes S.A. ADR | | | 8,972,640 |
| 441,700 | | Telemar Norte Leste S.A.(a) | | | 11,507,071 |
| 215,400 | | Uniao de Bancos Brasileiros S.A. | | | 15,920,215 |
| | | | |
|
|
| | | | | | 67,001,969 |
| | | | |
|
|
| | | CHINA — 11.85% | | | |
| 23,275,000 | | Bank of Communications Ltd., Class H (Hong Kong)(a) | | | 14,596,964 |
| 27,271,300 | | Chaoda Mordern Agriculture Holdings Ltd. (Hong Kong) | | | 21,413,143 |
| 42,614,000 | | China Construction Bank, Class H (Hong Kong)(a) | | | 19,847,373 |
| 584,297 | | China Mobile Ltd. ADR (Hong Kong) | | | 15,507,242 |
| 19,128,000 | | China Petroleum & Chemical Corp., Class H (Hong Kong) | | | 11,164,240 |
| 17,823,252 | | Far East Consortium Int’L Ltd. (Hong Kong) | | | 8,236,881 |
| 13,868,400 | | People’s Food Holdings Ltd. | | | 11,066,073 |
| 122,400 | | PetroChina Co. Ltd. ADR | | | 12,845,880 |
| 8,447,000 | | Texwinca Holdings Ltd. (Hong Kong) | | | 6,477,677 |
| | | | |
|
|
| | | | | | 121,155,473 |
| | | | |
|
|
| | | COLUMBIA — 0.99% | | | |
| 288,800 | | Bancolombia S.A. ADR | | | 10,079,120 |
| | | | |
|
|
| | | CZECH REPUBLIC — 0.90% | | | |
| 430,467 | | Cesky Telecom A.S.(a) | | | 9,184,999 |
| | | | |
|
|
| | | HUNGARY — 1.10% | | | |
| 997,100 | | BorsodChem Rt. | | | 11,200,435 |
| | | | |
|
|
| | | | | |
| | | | | | |
Shares
| | | | Value
|
| COMMON STOCKS — (continued) | | |
| | | INDIA — 4.79% | | | |
| 296,950 | | ICICI Bank Ltd. ADR | | $ | 8,219,576 |
| 213,700 | | India Fund, Inc.(b) | | | 10,791,850 |
| 201,900 | | State Bank of India GDR(c) | | | 10,721,489 |
| 655,700 | | Suzlon Energy Ltd. | | | 19,229,560 |
| | | | |
|
|
| | | | | | 48,962,475 |
| | | | |
|
|
| | | INDONESIA — 2.82% | | | |
| 25,845,200 | | PT Indocement Tunggal Prakarsa Tbk(a) | | | 12,852,458 |
| 20,973,200 | | PT Telekomunikasi Indonesia Tbk | | | 15,946,536 |
| | | | |
|
|
| | | | | | 28,798,994 |
| | | | |
|
|
| | | MALAYSIA — 2.92% | | | |
| 1,623,600 | | Genting Berhad | | | 10,488,171 |
| 5,717,150 | | Public Bank Berhad | | | 10,014,833 |
| 3,701,900 | | Telekom Malaysia Berhad | | | 9,392,557 |
| | | | |
|
|
| | | | | | 29,895,561 |
| | | | |
|
|
| | | MEXICO — 8.01% | | | |
| 428,100 | | America Movil S.A. de C.V., Series L ADR | | | 14,666,706 |
| 197,039 | | Cemex S.A. de C.V. ADR | | | 12,862,706 |
| 183,300 | | Grupo Aeroportuario del Pacifico S.A. de C.V. ADR(a) | | | 5,856,435 |
| 801,355 | | Grupo Elektra S.A. | | | 8,065,108 |
| 2,124,100 | | Grupo Televisa S.A. | | | 8,443,688 |
| 363,380 | | Telefonos de Mexico S.A. de C.V., Series L ADR | | | 8,168,782 |
| 1,986,343 | | Urbi Desarrollos Urbanos S.A. de C.V.(a) | | | 15,047,279 |
| 3,288,996 | | Wal-Mart de Mexico S.A. de C.V.(a) | | | 8,811,970 |
| | | | |
|
|
| | | | | | 81,922,674 |
| | | | |
|
|
| | | POLAND — 2.25% | | | |
| 497,000 | | KGHM Polska Miedz S.A. | | | 12,697,857 |
| 967,373 | | Powszechna Kasa Oszczednoski Polski Bank S.A. | | | 10,346,279 |
| | | | |
|
|
| | | | | | 23,044,136 |
| | | | |
|
|
| | | RUSSIA — 7.61% | | | |
| 210,200 | | Lukoil Co. ADR | | | 17,488,639 |
| 103,200 | | MMC Norilsk Nickel ADR | | | 9,731,760 |
See Notes to Financial Statements.
48
Excelsior Funds, Inc.
Portfolio of Investments — March 31, 2006
Emerging Markets Fund — (continued)
| | | | | |
| | | | | | |
Shares
| | | | Value
|
| COMMON STOCKS — (continued) | | |
| | | RUSSIA — (continued) | | | |
| 368,100 | | Mobile TeleSystems ADR | | $ | 12,184,110 |
| 183,900 | | OAO Gazprom ADR | | | 16,845,240 |
| 103,200 | | Polyus Gold ADR(a) | | | 2,051,616 |
| 301,000 | | RBC Information Systems ADR(a) | | | 9,270,800 |
| 530,100 | | Rostelecom ADR | | | 10,204,425 |
| | | | |
|
|
| | | | | | 77,776,590 |
| | | | |
|
|
| | | SOUTH AFRICA — 6.66% | | | |
| 2,911,042 | | African Bank Investments Ltd. | | | 14,215,304 |
| 436,200 | | Gold Fields Ltd. ADR | | | 9,587,676 |
| 1,522,224 | | MTN Group Ltd. | | | 15,152,377 |
| 650,402 | | Nedcor Ltd. | | | 13,556,259 |
| 596,116 | | Telekom South Africa Ltd. | | | 15,514,934 |
| | | | |
|
|
| | | | | | 68,026,550 |
| | | | |
|
|
| | | SOUTH KOREA — 15.01% | | | |
| 33,857 | | Amorepacific Corp. | | | 13,247,343 |
| 315,502 | | Hana Financial Group, Inc. | | | 14,941,930 |
| 603,638 | | KT Corp. ADR | | | 12,857,489 |
| 388,180 | | LG Cable Ltd. | | | 14,396,625 |
| 104,862 | | LG Home Shopping, Inc. | | | 9,912,030 |
| 11,840 | | Lotte Chilsung Beverage Co. Ltd. | | | 13,142,853 |
| 113,410 | | NCSoft Corp.(a) | | | 8,315,482 |
| 82,470 | | Samsung Electronic Co. Ltd. | | | 53,264,102 |
| 566,985 | | SK Telecom Co. Ltd. ADR | | | 13,375,176 |
| | | | |
|
|
| | | | | | 153,453,030 |
| | | | |
|
|
| | | SPAIN — 1.02% | | | |
| 366,058 | | Repsol YPF S.A. | | | 10,394,829 |
| | | | |
|
|
| | | TAIWAN — 7.07% | | | |
| 265,029 | | AU Optronics Corp. ADR | | | 3,951,582 |
| 2,417,393 | | Hon Hai Precision, Inc. | | | 14,930,744 |
| 891,700 | | iShares MSCI Taiwan Index Fund(b) | | | 11,315,673 |
| 5,613,453 | | President Chain Store Corp. | | | 11,892,682 |
| 4,851,000 | | Quanta Computer, Inc. | | | 7,957,621 |
| 8,963,443 | | Synnex Technology International Corp. | | | 9,967,369 |
| 226,900 | | Taiwan Semiconductor Manufacturing Co. Ltd. | | | 445,499 |
| 1,176,967 | | Taiwan Semiconductor Manufacturing Co. Ltd. ADR | | | 11,840,288 |
| | | | |
|
|
| | | | | | 72,301,458 |
| | | | |
|
|
| | | | | |
| | | | | | |
Shares
| | | | Value
|
| COMMON STOCKS — (continued) | | |
| | | THAILAND — 1.35% | | | |
| 5,867,900 | | Advanced Info Service Public Co. Ltd. (Foreign Shares) | | $ | 13,813,647 |
| | | | |
|
|
| | | TURKEY — 2.64% | | | |
| 713,640 | | Akbank T.A.S. ADR(c) | | | 11,986,798 |
| 1,112,582 | | Arcelik A.S. | | | 9,148,916 |
| 1,065,000 | | Turkiye Vakiflar Bankasi T.A.O., Class D(a) | | | 5,830,726 |
| | | | |
|
|
| | | | | | 26,966,440 |
| | | | |
|
|
| | | UNITED KINGDOM — 0.95% | | | |
| 126,268 | | Old Mutual plc | | | 439,953 |
| 2,652,994 | | Old Mutual plc (South Africa shares) | | | 9,224,836 |
| | | | |
|
|
| | | | | | 9,664,789 |
| | | | |
|
|
| | | VENEZUELA — 0.59% | | | |
| 284,599 | | Compania Anonima Nacional Telefonos de Venezuela ADR | | | 6,027,807 |
| | | | |
|
|
| | | TOTAL COMMON STOCKS
(Cost $614,144,750) | | | 882,287,548 |
| | | | |
|
|
| PREFERRED STOCKS — 5.74% | | |
| | | BRAZIL — 4.50% | | | |
| 376,535 | | Banco Bradesco S.A. | | | 13,526,015 |
| 315,754,000 | | Companhia Energetica de Minas Gerais | | | 14,400,893 |
| 906,800 | | Petroleo Brasileiro S.A. | | | 18,026,999 |
| | | | |
|
|
| | | | | | 45,953,907 |
| | | | |
|
|
| | | SOUTH KOREA — 1.24% | | | |
| 230,000 | | Hyundai Motor Co. Ltd.(c) | | | 12,696,794 |
| | | | |
|
|
| | | TOTAL PREFERRED STOCKS
(Cost $26,997,910) | | | 58,650,701 |
| | | | |
|
|
See Notes to Financial Statements.
49
Excelsior Funds, Inc.
Portfolio of Investments — March 31, 2006
Emerging Markets Fund — (continued)
| | | | | |
| | | | | | |
Principal
Amount
| | | | Value
|
| REPURCHASE AGREEMENT — 6.11% | | |
| $62,458,000 | | JP Morgan Chase Securities, Inc., 3.40%, dated 03/31/06, to be repurchased 04/03/06, repurchase price $62,475,696 (collateralized by U.S. Treasury Note, par value $46,785,000, 8.125%, maturing 08/15/21; total market value $62,920,009) | | $ | 62,458,000 |
| | | | |
|
|
| | | TOTAL REPURCHASE AGREEMENT
(Cost $62,458,000) | | | 62,458,000 |
| | | | |
|
|
| | | | | | |
TOTAL INVESTMENTS
(Cost $703,600,660)(d) | | 98.17 | % | | $ | 1,003,396,249 |
OTHER ASSETS IN EXCESS OF LIABILITIES | | 1.83 | | | | 18,726,151 |
| | |
|
| |
|
|
NET ASSETS | | 100.00 | % | | $ | 1,022,122,400 |
| | |
|
| |
|
|
| (a) | Non-income producing security |
| (b) | Registered Investment Company |
| (c) | Security exempt from registration under Rule 144A of the Securities Act of 1933. This security may be resold in transactions exempt from registration, normally to qualified institutional buyers. At March 31, 2006, these securities amounted to $35,405,081 or 3.46% of net assets. |
| (d) | Unrealized appreciation (depreciation) of securities: |
| | | | |
Unrealized Appreciation
| | Unrealized
(Depreciation)
| | Net Unrealized
Appreciation/
(Depreciation)
|
| $307,839,128 | | $(8,043,539) | | $299,795,589 |
ADR—American Depository Receipt
GDR—Global Depository Receipt
Ltd.—Limited
plc—Public Limited Company
The summary of the Fund’s investments as of March 31, 2006 is as follows: (Unaudited)
| | | | | | |
Sector Diversification
| | % of
Net
Assets
| | | Value
|
Financial | | 18.76 | % | | $ | 191,704,549 |
Telecommunication | | 18.00 | | | | 183,936,321 |
Industrials | | 15.80 | | | | 161,482,152 |
Energy | | 10.13 | | | | 103,551,041 |
Consumer Discretionary | | 9.20 | | | | 94,016,541 |
Raw/Intermediate Materials | | 6.71 | | | | 68,622,869 |
Repurchase Agreement | | 6.11 | | | | 62,458,000 |
Consumer Staples | | 5.76 | | | | 58,869,413 |
Technology | | 2.39 | | | | 24,469,897 |
Investment Companies | | 2.16 | | | | 22,107,523 |
Utilities | | 1.65 | | | | 16,845,240 |
Information Technology | | 0.81 | | | | 8,315,482 |
Health Care | | 0.69 | | | | 7,017,221 |
| | |
|
| |
|
|
Total Investments | | 98.17 | % | | $ | 1,003,396,249 |
Other Assets in Excess of Liabilities | | 1.83 | | | | 18,726,151 |
| | |
|
| |
|
|
Net Assets | | 100.00 | % | | $ | 1,022,122,400 |
| | |
|
| |
|
|
See Notes to Financial Statements.
50
Excelsior Funds, Inc.
Portfolio of Investments — March 31, 2006
International Fund
| | | | | |
| | | | | | |
Shares
| | | | Value
|
| COMMON STOCKS — 96.51% | | |
| | | AUSTRALIA — 1.14% | | | |
| 105,547 | | Rio Tinto Ltd. | | $ | 5,952,967 |
| | | | |
|
|
| | | BELGIUM — 1.23% | | | |
| 46,300 | | Umicore | | | 6,405,270 |
| | | | |
|
|
| | | CANADA — 2.13% | | | |
| 268,200 | | Rona, Inc.(a) | | | 5,120,057 |
| 78,058 | | Suncor Energy, Inc. | | | 5,992,067 |
| | | | |
|
|
| | | | | | 11,112,124 |
| | | | |
|
|
| | | CHINA — 2.09% | | | |
| 55,000 | | PetroChina Co. Ltd. ADR | | | 5,772,250 |
| 505,000 | | Sun Hung Kai Properties Ltd. (Hong Kong) | | | 5,122,069 |
| | | | |
|
|
| | | | | | 10,894,319 |
| | | | |
|
|
| | | FINLAND — 1.23% | | | |
| 254,300 | | Fortum Oyj | | | 6,403,679 |
| | | | |
|
|
| | | FRANCE — 8.73% | | | |
| 193,728 | | AXA S.A. | | | 6,775,181 |
| 83,900 | | BNP Paribas S.A. | | | 7,763,685 |
| 7,550 | | BNP Paribas S.A. (New-Line)(a) | | | 677,432 |
| 141,456 | | Carrefour S.A. | | | 7,500,392 |
| 63,834 | | Compagnie Generale de Geophysique S.A. (CGG)(a) | | | 9,273,362 |
| 74,526 | | Sanofi-Aventis S.A. | | | 7,066,248 |
| 24,789 | | TotalFinaElf S.A. | | | 6,534,370 |
| | | | |
|
|
| | | | | | 45,590,670 |
| | | | |
|
|
| | | GERMANY — 8.80% | | | |
| 32,200 | | Adidas-Salomon AG | | | 6,365,279 |
| 113,000 | | Altana AG | | | 7,002,471 |
| 140,400 | | Bayerische Motoren Werke AG | | | 7,732,423 |
| 322,300 | | Deutsche Telecom AG | | | 5,424,994 |
| 86,200 | | MAN AG | | | 5,990,595 |
| 160,300 | | Rhoen-Klinikum AG | | | 6,838,610 |
| 361,400 | | SGL Carbon AG(a) | | | 6,585,463 |
| | | | |
|
|
| | | | | | 45,939,835 |
| | | | |
|
|
| | | INDIA — 1.05% | | | |
| 103,300 | | State Bank of India GDR(b) | | | 5,485,536 |
| | | | |
|
|
| | | INDONESIA — 1.37% | | | |
| 9,431,000 | | PT Telekomunikasi Indonesia Tbk | | | 7,170,665 |
| | | | |
|
|
| | | | | |
| | | | | | |
Shares
| | | | Value
|
| COMMON STOCKS — (continued) | | |
| | | IRELAND — 2.37% | | | |
| 402,126 | | Anglo Irish Bank Corp. | | $ | 6,620,678 |
| 324,700 | | Depfa Bank plc | | | 5,780,979 |
| | | | |
|
|
| | | | | | 12,401,657 |
| | | | |
|
|
| | | ITALY — 2.23% | | | |
| 231,590 | | ENI S.p.A. | | | 6,593,685 |
| 279,050 | | Permasteelisa S.p.A. | | | 5,039,187 |
| | | | |
|
|
| | | | | | 11,632,872 |
| | | | |
|
|
| | | JAPAN — 23.46% | | | |
| 126,100 | | Canon, Inc. | | | 8,323,331 |
| 428,700 | | Casio Computer Co. Ltd. | | | 7,626,335 |
| 353,963 | | Chiyoda Corp. | | | 8,252,336 |
| 102,600 | | Don Quijote Co. Ltd. | | | 7,763,344 |
| 206,000 | | FamilyMart Co. Ltd. | | | 6,467,085 |
| 96,400 | | FANUC Co. Ltd. | | | 9,267,377 |
| 219,100 | | Hoya Corp. | | | 8,824,113 |
| 30,280 | | Keyence Corp. | | | 7,862,739 |
| 94,700 | | Kyocera Corp. | | | 8,348,887 |
| 420 | | Millea Holdings, Inc. | | | 8,287,747 |
| 352 | | Mitsubishi Tokyo Financial Group, Inc. | | | 5,354,008 |
| 482,000 | | Nikon Corp. | | | 8,634,097 |
| 1,016,000 | | Sumitomo Trust & Banking Co. Ltd. | | | 11,756,351 |
| 186,700 | | Takeda Pharmaceutical Co. Ltd. | | | 10,622,186 |
| 612,000 | | The Bank of Fukuoka Ltd. | | | 5,165,675 |
| | | | |
|
|
| | | | | | 122,555,611 |
| | | | |
|
|
| | | MEXICO — 2.79% | | | |
| 218,100 | | America Movil S.A. de C.V., Series L ADR | | | 7,472,106 |
| 108,391 | | Cemex S.A. de C.V. ADR | | | 7,075,764 |
| | | | |
|
|
| | | | | | 14,547,870 |
| | | | |
|
|
| | | NETHERLANDS — 2.53% | | | |
| 203,500 | | ABN Amro Holding NV | | | 6,080,059 |
| 482,000 | | Qiagen NV(a) | | | 7,116,475 |
| | | | |
|
|
| | | | | | 13,196,534 |
| | | | |
|
|
| | | NORWAY — 2.67% | | | |
| 707,000 | | Tandberg ASA | | | 6,373,444 |
| 706,400 | | Telenor ASA | | | 7,591,317 |
| | | | |
|
|
| | | | | | 13,964,761 |
| | | | |
|
|
See Notes to Financial Statements.
51
Excelsior Funds, Inc.
Portfolio of Investments — March 31, 2006
International Fund — (continued)
| | | | | |
| | | | | | |
Shares
| | | | Value
|
| COMMON STOCKS — (continued) | | |
| | | SINGAPORE — 1.41% | | | |
| 731,000 | | DBS Group Holdings Ltd. | | $ | 7,369,862 |
| | | | |
|
|
| | | SOUTH KOREA — 1.32% | | | |
| 10,700 | | Samsung Electronic Co. Ltd. | | | 6,910,706 |
| | | | |
|
|
| | | SPAIN — 3.84% | | | |
| 505,600 | | Banco Santander Central Hispano S.A. | | | 7,372,585 |
| 240,200 | | Repsol YPF S.A. | | | 6,820,881 |
| 375,046 | | Telefonica S.A. | | | 5,872,774 |
| | | | |
|
|
| | | | | | 20,066,240 |
| | | | |
|
|
| | | SWEDEN — 1.57% | | | |
| 56,394 | | Modern Times Group (MTG) AB, Class B(a) | | | 2,647,655 |
| 126,700 | | Svenska Cellulosa AB | | | 5,563,267 |
| | | | |
|
|
| | | | | | 8,210,922 |
| | | | |
|
|
| | | SWITZERLAND — 3.33% | | | |
| 161,800 | | Micronas Semiconductor AG(a) | | | 5,161,108 |
| 39,910 | | Roche Holdings AG | | | 5,932,756 |
| 57,400 | | UBS AG, Registered Shares | | | 6,309,869 |
| | | | |
|
|
| | | | | | 17,403,733 |
| | | | |
|
|
| | | TAIWAN — 3.26% | | | |
| 1,426,701 | | Hon Hai Precision, Inc. | | | 8,811,851 |
| 816,618 | | Taiwan Semiconductor Manufacturing Co. Ltd. ADR | | | 8,215,177 |
| | | | |
|
|
| | | | | | 17,027,028 |
| | | | |
|
|
| | | TURKEY — 1.30% | | | |
| 824,000 | | Arcelik A.S. | | | 6,775,866 |
| | | | |
|
|
| | | UNITED KINGDOM — 16.66% | | | |
| 572,500 | | BG Group | | | 7,149,486 |
| 741,700 | | Cadbury Schweppes plc | | | 7,350,420 |
| 436,800 | | EMAP plc | | | 6,663,917 |
| 231,040 | | GlaxoSmithKline plc | | | 6,039,382 |
| 464,300 | | HSBC Holdings plc | | | 7,770,163 |
| 502,300 | | Paragon Group plc | | | 6,422,074 |
| 165,277 | | Reckitt Benckiser plc | | | 5,800,394 |
| 238,142 | | Royal Bank of Scotland Group plc | | | 7,742,287 |
| 1,514,400 | | Sage Group plc (The) | | | 7,223,641 |
| 1,199,942 | | Serco Group plc | | | 6,551,614 |
| 509,400 | | Shire plc | | | 7,819,303 |
| | | | | |
| | | | | | |
Shares
| | | | Value
|
| COMMON STOCKS — (continued) | | |
| | | UNITED KINGDOM — (continued) |
| 1,894,690 | | Vodafone Group plc | | $ | 3,952,294 |
| 1,983,576 | | William Morrison Supermarkets plc | | | 6,526,804 |
| | | | |
|
|
| | | | | | 87,011,779 |
| | | | |
|
|
| | | TOTAL COMMON STOCKS
(Cost $403,682,536) | | | 504,030,506 |
| | | | |
|
|
| PREFERRED STOCKS — 1.34% |
| | | SOUTH KOREA — 1.34% | | | |
| 127,135 | | Hyundai Motor Co. Ltd.(b) | | | 7,018,291 |
| | | | |
|
|
| | | TOTAL PREFERRED STOCKS (Cost $4,599,012) | | | 7,018,291 |
| | | | |
|
|
| | |
Principal
Amount
| | | | |
| REPURCHASE AGREEMENT — 2.51% |
| $13,135,000 | | JP Morgan Chase Securities, Inc., 3.40%, dated 03/31/06, to be repurchased 04/03/06, repurchase price $13,138,722 (collateralized by U.S. Treasury Note, par value $9,839,000, 8.125%, maturing 08/15/21; total market value $13,232,134) | | | 13,135,000 |
| | | | |
|
|
| | | TOTAL REPURCHASE AGREEMENT
(Cost $13,135,000) | | | 13,135,000 |
| | | | |
|
|
| | | | | | | |
| | | | | | | |
TOTAL INVESTMENTS
(Cost $421,416,548)(c) | | 100.36 | % | | $ | 524,183,797 | |
LIABILITIES IN EXCESS OF
OTHER ASSETS | | (0.36 | ) | | | (1,899,360 | ) |
| | |
|
| |
|
|
|
NET ASSETS | | 100.00 | % | | $ | 522,284,437 | |
| | |
|
| |
|
|
|
| (a) | Non-income producing security. |
| (b) | Security exempt from registration under Rule 144A of the Securities Act of 1933. This security may be resold in transactions exempt from registration, normally to qualified institutional buyers. At March 31, 2006, these securities amounted to $12,503,827 or 2.39% of net assets. |
See Notes to Financial Statements.
52
Excelsior Funds, Inc.
Portfolio of Investments — March 31, 2006
International Fund — (continued)
| (c) | Unrealized appreciation (depreciation) of securities: |
| | | | |
Unrealized Appreciation
| | Unrealized
(Depreciation)
| | Net Unrealized
Appreciation/
(Depreciation)
|
| $106,038,189 | | $(3,270,940) | | $102,767,249 |
ADR—American Depository Receipt
GDR—Global Depository Receipt
Ltd.—Limited
plc—public limited company
The summary of the Fund’s investments as of March 31, 2006 is as follows: (Unaudited)
| | | | | | | |
Sector Diversification
| | % of
Net
Assets
| | | Value
| |
Financial | | 22.56 | % | | $ | 117,856,238 | |
Information Technology | | 11.84 | | | | 61,818,814 | |
Health Care | | 11.19 | | | | 58,437,431 | |
Industrials | | 11.14 | | | | 58,183,408 | |
Consumer Discretionary | | 10.84 | | | | 56,612,518 | |
Telecommunication | | 9.67 | | | | 50,521,510 | |
Energy | | 9.22 | | | | 48,136,102 | |
Consumer Staples | | 6.44 | | | | 33,645,095 | |
Raw/Intermediate Materials | | 3.72 | | | | 19,434,002 | |
Repurchase Agreement | | 2.51 | | | | 13,135,000 | |
Utilities | | 1.23 | | | | 6,403,679 | |
| | |
|
| |
|
|
|
Total Investments | | 100.36 | % | | $ | 524,183,797 | |
Liabilities in Excess of Other Assets | | (0.36 | ) | | | (1,899,360 | ) |
| | |
|
| |
|
|
|
Net Assets | | 100.00 | % | | $ | 522,284,437 | |
| | |
|
| |
|
|
|
See Notes to Financial Statements.
53
Excelsior Funds, Inc.
Portfolio of Investments — March 31, 2006
Pacific/Asia Fund
| | | | | |
| | | | | | |
Shares
| | | | Value
|
| COMMON STOCKS — 95.83% |
| | | AUSTRALIA — 2.97% | | | |
| 320,000 | | Energy Resources of Australia Ltd. | | $ | 3,325,524 |
| 69,586 | | Rio Tinto Ltd. | | | 3,924,727 |
| | | | |
|
|
| | | | | | 7,250,251 |
| | | | |
|
|
| | | CHINA — 14.84% | | | |
| 759,500 | | ASM Pacific Technology Ltd. (Hong Kong) | | | 4,525,653 |
| 1,159,800 | | Cafe de Coral Holdings Ltd. (Hong Kong) | | | 1,688,115 |
| 2,565,000 | | China Fishery Group Ltd.(a) | | | 4,207,521 |
| 2,811,400 | | FU JI Food & Catering Services Ltd. (Hong Kong) | | | 5,793,160 |
| 1,322,900 | | Hongkong Land Holdings Ltd. | | | 4,917,545 |
| 32,000 | | PetroChina Co. Ltd. ADR | | | 3,358,400 |
| 122,700 | | Suntech Power Holdings Co. Ltd. ADR(a) | | | 4,538,673 |
| 5,400 | | Xinhua Finance Ltd.(a) | | | 3,541,942 |
| 6,551,100 | | Xiwang Sugar Holdings Co. Ltd. (Hong Kong)(a) | | | 3,630,635 |
| | | | |
|
|
| | | | | | 36,201,644 |
| | | | |
|
|
| | | INDIA — 3.24% | | | |
| 412,500 | | Bharti Tele-Ventures Ltd.(a) | | | 3,819,921 |
| 139,100 | | Suzlon Energy Ltd. | | | 4,079,353 |
| | | | |
|
|
| | | | | | 7,899,274 |
| | | | |
|
|
| | | INDONESIA — 1.76% | | | |
| 5,634,300 | | PT Telekomunikasi Indonesia Tbk | | | 4,283,923 |
| | | | |
|
|
| | | JAPAN — 61.59% | | | |
| 43,900 | | Canon, Inc. | | | 2,897,655 |
| 380,200 | | Casio Computer Co. Ltd. | | | 6,763,547 |
| 312,745 | | Chiyoda Corp. | | | 7,291,375 |
| 160,300 | | Diamond City Co. Ltd. | | | 7,446,133 |
| 98,400 | | Don Quijote Co. Ltd. | | | 7,445,547 |
| 54,500 | | FamilyMart Co. Ltd. | | | 1,710,952 |
| 86,100 | | FANUC Co. Ltd. | | | 8,277,191 |
| 1,838 | | Gourmet Navigator, Inc.(a) | | | 5,159,642 |
| 180,000 | | Hoya Corp. | | | 7,249,385 |
| 377 | | INPEX Corp.(b) | | | 3,176,372 |
| 248,100 | | JS Group Corp. | | | 5,338,446 |
| 25,850 | | Keyence Corp. | | | 6,712,411 |
| 252,900 | | Koyo Seiko Co. Ltd | | | 5,044,450 |
| 58,300 | | Kyocera Corp. | | | 5,139,811 |
| | | | | |
| | | | | | |
Shares
| | | | Value
|
| COMMON STOCKS — (continued) |
| | | JAPAN — (continued) | | | |
| 290 | | Millea Holdings, Inc. | | $ | 5,722,492 |
| 235 | | Mitsubishi Tokyo Financial Group, Inc. | | | 3,574,409 |
| 222,000 | | NEOMAX Co. Ltd. | | | 6,727,115 |
| 269,000 | | Ngk Spark Plug Co. Ltd. | | | 6,269,132 |
| 52,300 | | Nidec Corp. | | | 4,279,618 |
| 299,000 | | Nikon Corp. | | | 5,356,006 |
| 185,100 | | Sato Corp. | | | 4,447,366 |
| 599,000 | | Sekisui Chemical Co. Ltd. | | | 5,069,388 |
| 765,200 | | Sumitomo Trust & Banking Co. Ltd. | | | 8,854,291 |
| 99,000 | | Takeda Pharmaceutical Co. Ltd. | | | 5,632,546 |
| 671,000 | | The Bank of Fukuoka Ltd. | | | 5,663,673 |
| 77,700 | | Yamada Denki Co. Ltd. | | | 8,989,303 |
| | | | |
|
|
| | | | | | 150,238,256 |
| | | | |
|
|
| | | SINGAPORE — 2.69% | | | |
| 250,000 | | DBS Group Holdings Ltd. | | | 2,520,473 |
| 2,292,000 | | Sembcorp Marine Ltd. | | | 4,036,839 |
| | | | |
|
|
| | | | | | 6,557,312 |
| | | | |
|
|
| | | SOUTH KOREA — 2.02% | | | |
| 7,648 | | Samsung Electronic Co. Ltd. | | | 4,939,540 |
| | | | |
|
|
| | | TAIWAN — 4.49% | | | |
| 1,047,495 | | Hon Hai Precision, Inc. | | | 6,469,730 |
| 446,749 | | Taiwan Semiconductor Manufacturing Co. Ltd. ADR | | | 4,494,295 |
| | | | |
|
|
| | | | | | 10,964,025 |
| | | | |
|
|
| | | THAILAND — 2.23% | | | |
| 11,484,400 | | Home Product Center Public Co. Ltd. (Foreign Shares) | | | 2,954,947 |
| 3,237,600 | | Thai Union Frozen Products Public Co. Ltd. (Foreign Shares) | | | 2,490,199 |
| | | | |
|
|
| | | | | | 5,445,146 |
| | | | |
|
|
| | | TOTAL COMMON STOCKS (Cost $187,024,662) | | | 233,779,371 |
| | | | |
|
|
| PREFERRED STOCKS — 1.53% |
| | | SOUTH KOREA — 1.53% | | | |
| 67,700 | | Hyundai Motor Co. Ltd.(c) | | | 3,737,274 |
| | | | |
|
|
| | | TOTAL PREFERRED STOCKS (Cost $1,774,744) | | | 3,737,274 |
| | | | |
|
|
See Notes to Financial Statements.
54
Excelsior Funds, Inc.
Portfolio of Investments — March 31, 2006
Pacific/Asia Fund — (continued)
| | | | | |
| | | | | | |
Principal
Amount
| | | | Value
|
| REPURCHASE AGREEMENT — 1.33% |
| $3,245,000 | | JP Morgan Chase Securities, Inc., 3.40%, dated 03/31/06, to be repurchased 04/03/06, repurchase price $3,245,919 (collateralized by U.S.Treasury Note, par value $2,431,000, 8.125%, maturing 08/15/21; total market value $2,455,008) | | $ | 3,245,000 |
| | | | |
|
|
| | | TOTAL REPURCHASE AGREEMENT
(Cost $3,245,000) | | | 3,245,000 |
| | | | |
|
|
| | | | | | |
TOTAL INVESTMENTS
(Cost $192,044,406)(d) | | 98.69 | % | | $ | 240,761,645 |
OTHER ASSETS IN EXCESS OF LIABILITIES | | 1.31 | | | | 3,202,582 |
| | |
|
| |
|
|
NET ASSETS | | 100.00 | % | | $ | 243,964,227 |
| | |
|
| |
|
|
| (a) | Non-income producing security |
| (b) | Fair valued security as of March 31, 2006. |
| (c) | Security exempt from registration under Rule 144A of the Securities Act of 1933. This security may be resold in transactions exempt from registration, normally to qualified institutional buyers. At March 31, 2006, these securities amounted to $3,737,274 or 1.53% of net assets. |
| (d) | Unrealized appreciation (depreciation) of securities: |
| | | | |
Unrealized
Appreciation
| | Unrealized
(Depreciation)
| | Net Unrealized
Appreciation/
(Depreciation)
|
| $50,438,363 | | $(1,721,124) | | $48,717,239 |
ADR—American Depository Receipt
Ltd.—Limited
The summary of the Fund’s investments as of March 31, 2006 is as follows: (Unaudited)
| | | | | | |
Sector Diversification
| | % of
Net
Assets
| | | Value
|
Consumer Discretionary | | 19.40 | % | | $ | 47,329,938 |
Industrials | | 19.00 | | | | 46,361,275 |
Financial | | 14.26 | | | | 34,794,825 |
Information Technology | | 12.78 | | | | 31,190,415 |
Consumer Staples | | 9.51 | | | | 23,191,138 |
Raw/Intermediate Materials | | 9.08 | | | | 22,146,674 |
Energy | | 4.35 | | | | 10,614,125 |
Real Estate | | 3.05 | | | | 7,446,133 |
Health Care | | 2.31 | | | | 5,632,546 |
Technology | | 1.86 | | | | 4,525,653 |
Telecommunication | | 1.76 | | | | 4,283,923 |
Repurchase Agreement | | 1.33 | | | | 3,245,000 |
| | |
|
| |
|
|
Total Investments | | 98.69 | % | | $ | 240,761,645 |
Other Assets in Excess of Liabilities | | 1.31 | | | | 3,202,582 |
| | |
|
| |
|
|
Net Assets | | 100.00 | % | | $ | 243,964,227 |
| | |
|
| |
|
|
See Notes to Financial Statements.
55
Excelsior Funds
Statements of Assets and Liabilities
March 31, 2006
| | | | | | |
| | |
| | |
Blended Equity Fund
| | Energy and Natural Resources Fund
|
ASSETS: | | | | | | |
Investments, at cost — see accompanying portfolios | | $ | 275,529,318 | | $ | 476,801,737 |
| | |
|
| |
|
|
Investments, at value (including Repurchase Agreements) (Note 1) | | $ | 467,783,133 | | $ | 534,969,661 |
Cash | | | 41,264 | | | 147 |
Dividends and interest receivable | | | 660,553 | | | 210,974 |
Receivable for investments sold | | | — | | | 19,740,008 |
Receivable for fund shares sold | | | 162,175 | | | 4,495,219 |
Receivable for forward foreign currency contracts | | | — | | | — |
Reclaims receivable | | | — | | | — |
Prepaid expenses and other assets | | | 20,883 | | | 7,450 |
| | |
|
| |
|
|
Total Assets | | | 468,668,008 | | | 559,423,459 |
LIABILITIES: | | | | | | |
Payable for investments purchased | | | 7,455,869 | | | 35,815,624 |
Cash overdraft | | | — | | | — |
Payable for fund shares redeemed | | | 271,245 | | | 472,786 |
Investment advisory fees payable (Note 2) | | | 252,376 | | | 252,569 |
Administration fees payable (Note 2) | | | 58,000 | | | 63,666 |
Shareholder servicing fees payable (Note 2) | | | 154,572 | | | 144,148 |
Directors’/Trustees’ fees and expenses payable (Note 2) | | | 349 | | | 387 |
Accrued expenses and other payables | | | 166,387 | | | 168,339 |
| | |
|
| |
|
|
Total Liabilities | | | 8,358,798 | | | 36,917,519 |
| | |
|
| |
|
|
NET ASSETS | | $ | 460,309,210 | | $ | 522,505,940 |
| | |
|
| |
|
|
NET ASSETS consist of: | | | | | | |
Undistributed (distributions in excess of) net investment income | | $ | 510,112 | | $ | — |
Accumulated net realized gain (loss) on investments, foreign currency transactions and written options | | | 42,349,382 | | | 76,704,405 |
Unrealized appreciation of investments, foreign currency translations and written options | | | 192,253,815 | | | 58,167,924 |
Par value (Note 5) | | | 12,352 | | | 20,101 |
Paid in capital in excess of par value | | | 225,183,549 | | | 387,613,510 |
| | |
|
| |
|
|
Net Assets | | $ | 460,309,210 | | $ | 522,505,940 |
| | |
|
| |
|
|
Net Assets: | | | | | | |
Shares | | $ | 460,309,210 | | $ | 522,505,940 |
Institutional Shares | | | — | | | — |
Retirement Shares | | | — | | | — |
Shares outstanding (Note 5): | | | | | | |
Shares | | | 12,351,726 | | | 20,100,544 |
Institutional Shares | | | — | | | — |
Retirement Shares | | | — | | | — |
NET ASSET VALUE PER SHARE (net assets ÷ shares outstanding): | | | | | | |
Shares | | | $37.27 | | | $25.99 |
| | |
|
| |
|
|
Institutional Shares | | | — | | | — |
| | |
|
| |
|
|
Retirement Shares | | | — | | | — |
| | |
|
| |
|
|
| (a) | | Due to rounding net assets divided by shares outstanding does not equal the net asset value per share. |
See Notes to Financial Statements.
56
| | | | | | | | | | | | | | |
| | | |
Equity Core Fund
| | | Equity Income Fund
| | | Large Cap Growth Fund
| | | Mid Cap Value and Restructuring Fund
| |
| | | | | | | | | | | | | | | |
| $ | 163,341,614 | | | $ | 180,383,237 | | | $ | 480,566,594 | | | $ | 214,039,456 | |
|
|
| |
|
|
| |
|
|
| |
|
|
|
| $ | 187,700,242 | | | $ | 205,184,581 | | | $ | 566,812,254 | | | $ | 339,377,101 | |
| | 29,228 | | | | — | | | | — | | | | 16,220 | |
| | 236,040 | | | | 574,018 | | | | 3,491 | | | | 255,748 | |
| | — | | | | 1,931,868 | | | | — | | | | 530,468 | |
| | 1,130,840 | | | | 318,086 | | | | 7,395,467 | | | | 222,171 | |
| | — | | | | 70 | | | | — | | | | — | |
| | 11,214 | | | | 8,406 | | | | — | | | | — | |
| | 795 | | | | 6,313 | | | | 6,785 | | | | 12,840 | |
|
|
| |
|
|
| |
|
|
| |
|
|
|
| | 189,108,359 | | | | 208,023,342 | | | | 574,217,997 | | | | 340,414,548 | |
| | | | | | | | | | | | | | | |
| | 2,076,067 | | | | 112,270 | | | | 7,942,955 | | | | 346,880 | |
| | — | | | | 1,540,026 | | | | 13,423,985 | | | | — | |
| | 324 | | | | 254,910 | | | | 63,109 | | | | 147,398 | |
| | 71,244 | | | | 111,630 | | | | 311,985 | | | | 184,075 | |
| | 22,466 | | | | 26,922 | | | | 65,988 | | | | 42,839 | |
| | 35,710 | | | | 47,598 | | | | 104,777 | | | | 72,002 | |
| | 110 | | | | 99 | | | | 332 | | | | 250 | |
| | 48,040 | | | | 75,908 | | | | 109,296 | | | | 123,978 | |
|
|
| |
|
|
| |
|
|
| |
|
|
|
| | 2,253,961 | | | | 2,169,363 | | | | 22,022,427 | | | | 917,422 | |
|
|
| |
|
|
| |
|
|
| |
|
|
|
| $ | 186,854,398 | | | $ | 205,853,979 | | | $ | 552,195,570 | | | $ | 339,497,126 | |
|
|
| |
|
|
| |
|
|
| |
|
|
|
| | | | | | | | | | | | | | | |
| $ | 362,846 | | | $ | 1,253,478 | | | $ | — | | | $ | — | |
| | (2,550,421 | ) | | | (6,315,974 | ) | | | (135,908,141 | ) | | | (1,981,324 | ) |
| | 24,358,518 | | | | 24,801,415 | | | | 86,245,660 | | | | 125,337,645 | |
| | 14,706 | | | | 24,054 | | | | 55,738 | | | | 173 | |
| | 164,668,749 | | | | 186,091,006 | | | | 601,802,313 | | | | 216,140,632 | |
|
|
| |
|
|
| |
|
|
| |
|
|
|
| $ | 186,854,398 | | | $ | 205,853,979 | | | $ | 552,195,570 | | | $ | 339,497,126 | |
|
|
| |
|
|
| |
|
|
| |
|
|
|
| | | | | | | | | | | | | | | |
| $ | 132,405,835 | | | $ | 205,852,960 | | | $ | 552,194,371 | | | $ | 237,531,224 | |
| | 54,448,563 | | | | — | | | | — | | | | 101,964,771 | |
| | — | | | | 1,019 | | | | 1,199 | | | | 1,131 | |
| | | | | | | | | | | | | | | |
| | 10,424,514 | | | | 24,053,800 | | | | 55,738,243 | | | | 12,094,786 | |
| | 4,281,567 | | | | — | | | | — | | | | 5,179,373 | |
| | — | | | | 119 | | | | 122 | | | | 58 | |
| | | | | | | | | | | | | | | |
| | $12.70 | | | | $8.56 | | | | $9.91 | | | | $19.64 | |
|
|
| |
|
|
| |
|
|
| |
|
|
|
| | $12.72 | | | | — | | | | — | | | | $19.69 | |
|
|
| |
|
|
| |
|
|
| |
|
|
|
| | — | | | | $8.59 | (a) | | | $9.82 | (a) | | | $ 19.62 | (a) |
|
|
| |
|
|
| |
|
|
| |
|
|
|
See Notes to Financial Statements.
57
Excelsior Funds
Statements of Assets and Liabilities
March 31, 2006
| | | | | | | |
| | |
| | | Real Estate Fund
| | Small Cap Fund
| |
ASSETS: | | | | | | | |
Investments, at cost — see accompanying portfolios | | $ | 78,198,217 | | $ | 408,156,879 | |
| | |
|
| |
|
|
|
Investments, at value (including Repurchase Agreements) (Note 1) | | $ | 127,923,199 | | $ | 598,945,100 | |
Cash | | | 170,281 | | | 212 | |
Foreign currency (cost $0, $0, $479, $13,229,304, $16,498, $29,605 respectively) | | | — | | | — | |
Dividends and interest receivable | | | 237,476 | | | 22,943 | |
Receivable for investments sold | | | 66,561 | | | — | |
Receivable for fund shares sold | | | 56,962 | | | 3,510,602 | |
Receivable for forward foreign currency contracts | | | — | | | — | |
Reclaims receivable | | | — | | | — | |
Receivable from Adviser for investment trades | | | — | | | — | |
Prepaid expenses and other assets | | | 5,000 | | | 19,360 | |
| | |
|
| |
|
|
|
Total Assets | | | 128,459,479 | | | 602,498,217 | |
LIABILITIES: | | | | | | | |
Payable for investments purchased | | | — | | | 2,210,059 | |
Options written, at value (Premiums received: Value and Restructuring Fund — $1,760,972) | | | — | | | — | |
Payable for fund shares redeemed | | | 647,832 | | | 204,301 | |
Payable for forward foreign currency contracts | | | — | | | — | |
Investment advisory fees payable (Note 2) | | | 75,724 | | | 361,263 | |
Administration fees payable (Note 2) | | | 16,473 | | | 72,588 | |
Shareholder servicing fees payable (Note 2) | | | 29,838 | | | 113,419 | |
Directors’/Trustees’ fees and expenses payable (Note 2) | | | 90 | | | 411 | |
Accrued expenses and other payables | | | 61,114 | | | 145,982 | |
| | |
|
| |
|
|
|
Total Liabilities | | | 831,071 | | | 3,108,023 | |
| | |
|
| |
|
|
|
NET ASSETS | | $ | 127,628,408 | | $ | 599,390,194 | |
| | |
|
| |
|
|
|
NET ASSETS consist of: | | | | | | | |
Undistributed (distributions in excess of) net investment income | | $ | 137,934 | | $ | — | |
Accumulated net realized gain (loss) on investments, foreign currency transactions and written options | | | 5,864,866 | | | 18,575,511 | |
Unrealized appreciation of investments, foreign currency translations and written options | | | 49,724,982 | | | 190,788,221 | |
Par value (Note 5) | | | 11,135 | | | 31,165 | |
Paid in capital in excess of par value | | | 71,889,491 | | | 389,995,297 | |
| | |
|
| |
|
|
|
Net Assets | | $ | 127,628,408 | | $ | 599,390,194 | |
| | |
|
| |
|
|
|
Net Assets: | | | | | | | |
Shares | | $ | 127,628,408 | | $ | 599,388,990 | |
Institutional Shares | | | — | | | — | |
Retirement Shares | | | — | | | 1,204 | |
Shares outstanding (Note 5): | | | | | | | |
Shares | | | 11,135,489 | | | 31,165,107 | |
Institutional Shares | | | — | | | — | |
Retirement Shares | | | — | | | 63 | |
NET ASSET VALUE PER SHARE (net assets ÷ shares outstanding): | | | | | | | |
Shares | | | $11.46 | | | $19.23 | |
| | |
|
| |
|
|
|
Institutional Shares | | | — | | | — | |
| | |
|
| |
|
|
|
Retirement Shares | | | — | | | $19.12 | (a) |
| | |
|
| |
|
|
|
| (a) | | Due to rounding net assets divided by shares outstanding does not equal the net asset value per share. |
See Notes to Financial Statements.
58
| | | | | | | | | | | | | |
| | | |
Value and Restructuring Fund
| | | Emerging Markets Fund
| | International Fund
| | | Pacific/ Asia
Fund
| |
| | | | | | | | | | | | | | |
| $ | 4,418,414,513 | | | $ | 703,600,660 | | $ | 421,416,548 | | | $ | 192,044,406 | |
|
|
| |
|
| |
|
|
| |
|
|
|
| $ | 6,526,794,792 | | | $ | 1,003,396,249 | | $ | 524,183,797 | | | $ | 240,761,645 | |
| | 44,798 | | | | 403 | | | 595,243 | | | | 731 | |
| | 474 | | | | 13,019,575 | | | 16,484 | | | | 30,569 | |
| | 10,435,336 | | | | 4,332,801 | | | 1,326,918 | | | | 927,385 | |
| | 13,806,049 | | | | — | | | 5,151,962 | | | | 14,682,659 | |
| | 26,327,086 | | | | 4,003,189 | | | 2,107,937 | | | | 2,758,504 | |
| | — | | | | — | | | 760 | | | | 225 | |
| | — | | | | 2,735 | | | 170,588 | | | | — | |
| | — | | | | — | | | 35,006 | | | | — | |
| | 176,070 | | | | 11,643 | | | 7,386 | | | | 4,629 | |
|
|
| |
|
| |
|
|
| |
|
|
|
| | 6,577,584,605 | | | | 1,024,766,595 | | | 533,596,081 | | | | 259,166,347 | |
| | | | | | | | | | | | | | |
| | 80,374,040 | | | | — | | | 10,350,685 | | | | 14,679,762 | |
| | | | | | | | | | | | | | |
| | 22,340 | | | | — | | | — | | | | — | |
| | 6,892,296 | | | | 605,195 | | | 203,326 | | | | 83,183 | |
| | — | | | | — | | | 1,979 | | | | 24,054 | |
| | 3,196,180 | | | | 963,588 | | | 386,713 | | | | 194,194 | |
| | 804,492 | | | | 166,299 | | | 83,397 | | | | 38,785 | |
| | 2,907,743 | | | | 361,716 | | | 101,611 | | | | 47,880 | |
| | 4,582 | | | | 674 | | | 332 | | | | 175 | |
| | 1,366,040 | | | | 546,723 | | | 183,601 | | | | 134,087 | |
|
|
| |
|
| |
|
|
| |
|
|
|
| | 95,567,713 | | | | 2,644,195 | | | 11,311,644 | | | | 15,202,120 | |
|
|
| |
|
| |
|
|
| |
|
|
|
| $ | 6,482,016,892 | | | $ | 1,022,122,400 | | $ | 522,284,437 | | | $ | 243,964,227 | |
|
|
| |
|
| |
|
|
| |
|
|
|
| | | | | | | | | | | | | | |
| $ | 19,146,231 | | | $ | 1,061,119 | | $ | 90,545 | | | $ | (477,107 | ) |
| | (147,509,706 | ) | | | 6,968,458 | | | (83,033,063 | ) | | | (2,759,390 | ) |
| | 2,110,118,905 | | | | 300,030,575 | | | 102,768,366 | | | | 48,684,056 | |
| | 126,227 | | | | 79,108 | | | 31,634 | | | | 21,011 | |
| | 4,500,135,235 | | | | 713,983,140 | | | 502,426,955 | | | | 198,495,657 | |
|
|
| |
|
| |
|
|
| |
|
|
|
| $ | 6,482,016,892 | | | $ | 1,022,122,400 | | $ | 522,284,437 | | | $ | 243,964,227 | |
|
|
| |
|
| |
|
|
| |
|
|
|
| | | | | | | | | | | | | | |
| $ | 6,230,753,829 | | | $ | 996,665,851 | | $ | 522,284,437 | | | $ | 243,964,227 | |
| | 250,367,196 | | | | 25,456,549 | | | — | | | | — | |
| | 895,867 | | | | — | | | — | | | | — | |
| | | | | | | | | | | | | | |
| | 126,226,771 | | | | 79,108,061 | | | 31,634,373 | | | | 21,011,478 | |
| | 5,071,900 | | | | 2,016,921 | | | — | | | | — | |
| | 18,152 | | | | — | | | — | | | | — | |
| | | | | | | | | | | | | | |
| | $49.36 | | | | $12.60 | | | $16.51 | | | | $11.61 | |
|
|
| |
|
| |
|
|
| |
|
|
|
| | $49.36 | | | | $12.62 | | | — | | | | — | |
|
|
| |
|
| |
|
|
| |
|
|
|
| | $49.35 | | | | — | | | — | | | | — | |
|
|
| |
|
| |
|
|
| |
|
|
|
See Notes to Financial Statements.
59
Excelsior Funds
Statements of Operations
For the Year Ended March 31, 2006
| | | | | | | | |
| | |
| | | Blended
Equity
Fund
| | | Energy and
Natural
Resources
Fund
| |
INVESTMENT INCOME: | | | | | | | | |
Dividend income | | $ | 7,416,706 | | | $ | 3,843,077 | |
Interest income | | | 160,350 | | | | 755,974 | |
Less: Foreign taxes withheld | | | (50,353 | ) | | | (7,660 | ) |
| | |
|
|
| |
|
|
|
Total Income | | | 7,526,703 | | | | 4,591,391 | |
| | |
|
|
| |
|
|
|
EXPENSES: | | | | | | | | |
Investment advisory fees (Note 2) | | | 3,502,922 | | | | 2,456,665 | |
Shareholder servicing fees — Shares (Note 2) | | | 1,121,312 | | | | 981,926 | |
Shareholder servicing fees — Institutional Shares (Note 2) | | | — | | | | — | |
Distribution and shareholder servicing fees — Retirement Shares (Note 2) | | | — | | | | — | |
Administration fees (Note 2) | | | 705,351 | | | | 618,312 | |
Transfer agent fees | | | 110,666 | | | | 307,584 | |
Legal and audit fees | | | 50,437 | | | | 49,957 | |
Custodian fees | | | 30,329 | | | | 35,523 | |
Directors’/Trustees’ fees and expenses (Note 2) | | | 19,996 | | | | 15,648 | |
Miscellaneous expenses | | | 88,704 | | | | 159,752 | |
| | |
|
|
| |
|
|
|
Total Expenses | | | 5,629,717 | | | | 4,625,367 | |
Fees waived and reimbursed by: | | | | | | | | |
Investment Adviser (Note 2) | | | (570,103 | ) | | | (12,243 | ) |
| | |
|
|
| |
|
|
|
Net Expenses | | | 5,059,614 | | | | 4,613,124 | |
| | |
|
|
| |
|
|
|
NET INVESTMENT INCOME (LOSS) | | | 2,467,089 | | | | (21,733 | ) |
| | |
|
|
| |
|
|
|
REALIZED AND UNREALIZED GAIN (LOSS) ON INVESTMENTS (NOTE 1): | | | | | | | | |
Net realized gain (loss) on: | | | | | | | | |
Security transactions | | | 49,682,093 | | | | 137,515,027 | |
Foreign currency transactions | | | (7,684 | ) | | | — | |
Written options | | | — | | | | — | |
| | |
|
|
| |
|
|
|
Total net realized gain (loss) | | | 49,674,409 | | | | 137,515,027 | |
Change in unrealized appreciation (depreciation) of investments, foreign currency translations and written options during the year | | | (3,482,518 | ) | | | (1,094,592 | ) |
| | |
|
|
| |
|
|
|
Net realized and unrealized gain (loss) on investments, foreign currency transactions and written options | | | 46,191,891 | | | | 136,420,435 | |
| | |
|
|
| |
|
|
|
Net increase in net assets resulting from operations | | $ | 48,658,980 | | | $ | 136,398,702 | |
| | |
|
|
| |
|
|
|
See Notes to Financial Statements.
60
| | | | | | | | | | | | | | |
| | | |
Equity
Core Fund
| | | Equity
Income
Fund
| | | Large Cap
Growth
Fund
| | | Mid Cap
Value and
Restructuring
Fund
| |
| | | | | | | | | | | | | | | |
| $ | 1,874,977 | | | $ | 7,388,134 | | | $ | 1,423,153 | | | $ | 3,495,855 | |
| | 225,723 | | | | 107,923 | | | | 582,033 | | | | 95,298 | |
| | (40,230 | ) | | | (79,987 | ) | | | (36,685 | ) | | | (41,289 | ) |
|
|
| |
|
|
| |
|
|
| |
|
|
|
| | 2,060,470 | | | | 7,416,070 | | | | 1,968,501 | | | | 3,549,864 | |
|
|
| |
|
|
| |
|
|
| |
|
|
|
| | | | | | | | | | | | | | | |
| | 964,274 | | | | 1,602,621 | | | | 2,350,713 | | | | 2,000,968 | |
| | 193,064 | | | | 534,204 | | | | 775,681 | | | | 551,305 | |
| | — | | | | — | | | | — | | | | 502 | |
| | — | | | | 8 | | | | 9 | | | | 8 | |
| | 194,157 | | | | 322,704 | | | | 473,303 | | | | 464,898 | |
| | 34,429 | | | | 22,944 | | | | 76,636 | | | | 80,649 | |
| | 31,911 | | | | 43,474 | | | | 37,580 | | | | 46,582 | |
| | 17,504 | | | | 12,353 | | | | 22,461 | | | | 29,585 | |
| | 4,776 | | | | 9,042 | | | | 10,901 | | | | 13,040 | |
| | 105,725 | | | | 63,034 | | | | 96,442 | | | | 87,414 | |
|
|
| |
|
|
| |
|
|
| |
|
|
|
| | 1,545,840 | | | | 2,610,384 | | | | 3,843,726 | | | | 3,274,951 | |
| | | | | | | | | | | | | | | |
| | (324,216 | ) | | | (342,433 | ) | | | (383,210 | ) | | | (11,769 | ) |
|
|
| |
|
|
| |
|
|
| |
|
|
|
| | 1,221,624 | | | | 2,267,951 | | | | 3,460,516 | | | | 3,263,182 | |
|
|
| |
|
|
| |
|
|
| |
|
|
|
| | 838,846 | | | | 5,148,119 | | | | (1,492,015 | ) | | | 286,682 | |
|
|
| |
|
|
| |
|
|
| |
|
|
|
| | | | | | | | | | | | | | | |
| | | | | | | | | | | | | | | |
| | (2,550,421 | ) | | | (5,659,467 | ) | | | 3,004,935 | | | | (1,834,984 | ) |
| | (6,635 | ) | | | 1,370 | | | | — | | | | 737 | |
| | — | | | | (17,851 | ) | | | — | | | | — | |
|
|
| |
|
|
| |
|
|
| |
|
|
|
| | (2,557,056 | ) | | | (5,675,948 | ) | | | 3,004,935 | | | | (1,834,247 | ) |
| | 23,862,728 | | | | 10,334,632 | | | | 59,460,912 | | | | 51,686,678 | |
|
|
| |
|
|
| |
|
|
| |
|
|
|
| | 21,305,672 | | | | 4,658,684 | | | | 62,465,847 | | | | 49,852,431 | |
|
|
| |
|
|
| |
|
|
| |
|
|
|
| $ | 22,144,518 | | | $ | 9,806,803 | | | $ | 60,973,832 | | | $ | 50,139,113 | |
|
|
| |
|
|
| |
|
|
| |
|
|
|
See Notes to Financial Statements.
61
Excelsior Funds
Statements of Operations
For the Year Ended March 31, 2006
| | | | | | | | |
| | |
| | | Real Estate Fund
| | | Small Cap Fund
| |
INVESTMENT INCOME: | | | | | | | | |
Dividend income | | $ | 2,381,857 | | | $ | 2,249,188 | |
Interest income | | | 50,814 | | | | 87,180 | |
Less: Foreign taxes withheld | | | (502 | ) | | | — | |
| | |
|
|
| |
|
|
|
Total Income | | | 2,432,169 | | | | 2,336,368 | |
| | |
|
|
| |
|
|
|
EXPENSES: | | | | | | | | |
Investment advisory fees (Note 2) | | | 1,214,373 | | | | 3,314,855 | |
Shareholder servicing fees — Shares (Note 2) | | | 303,499 | | | | 1,295,704 | |
Shareholder servicing fees — Institutional Shares (Note 2) | | | — | | | | — | |
Distribution and shareholder servicing fees — Retirement Shares (Note 2) | | | — | | | | 8 | |
Administration fees (Note 2) | | | 183,394 | | | | 782,944 | |
Transfer agent fees | | | 54,138 | | | | 93,465 | |
Legal and audit fees | | | 30,340 | | | | 69,298 | |
Custodian fees | | | 7,589 | | | | 42,512 | |
Directors’/Trustees’ fees and expenses (Note 2) | | | 5,186 | | | | 21,989 | |
Miscellaneous expenses | | | 50,215 | | | | 126,940 | |
| | |
|
|
| |
|
|
|
Total Expenses | | | 1,848,734 | | | | 5,747,715 | |
Fees waived and reimbursed by: | | | | | | | | |
Investment Adviser (Note 2) | | | (351,013 | ) | | | (95,946 | ) |
| | |
|
|
| |
|
|
|
Net Expenses | | | 1,497,721 | | | | 5,651,769 | |
| | |
|
|
| |
|
|
|
NET INVESTMENT INCOME (LOSS) | | | 934,448 | | | | (3,315,401 | ) |
| | |
|
|
| |
|
|
|
REALIZED AND UNREALIZED GAIN (LOSS) ON INVESTMENTS (NOTE 1): | | | | | | | | |
Net realized gain (loss) on: | | | | | | | | |
Security transactions | | | 13,523,778 | | | | 29,148,540 | |
Foreign currency transactions | | | — | | | | — | |
Written options | | | — | | | | — | |
| | |
|
|
| |
|
|
|
Total net realized gain (loss) | | | 13,523,778 | | | | 29,148,540 | |
Change in unrealized appreciation (depreciation) of investments, foreign currency translations and written options during the year | | | 22,502,084 | | | | 96,294,626 | |
| | |
|
|
| |
|
|
|
Net realized and unrealized gain (loss) on investments, foreign currency transactions and written options | | | 36,025,862 | | | | 125,443,166 | |
| | |
|
|
| |
|
|
|
Net increase in net assets resulting from operations | | $ | 36,960,310 | | | $ | 122,127,765 | |
| | |
|
|
| |
|
|
|
See Notes to Financial Statements.
62
| | | | | | | | | | | | | | |
| | | |
Value and
Restructuring
Fund
| | | Emerging
Markets Fund
| | | International
Fund
| | | Pacific/
Asia Fund
| |
| | | | | | | | | | | | | | | |
| $ | 115,976,766 | | | $ | 18,722,500 | | | $ | 6,966,090 | | | $ | 3,207,771 | |
| | 2,934,780 | | | | 813,711 | | | | 353,626 | | | | 105,750 | |
| | (898,879 | ) | | | (1,564,939 | ) | | | (675,308 | ) | | | (220,898 | ) |
|
|
| |
|
|
| |
|
|
| |
|
|
|
| | 118,012,667 | | | | 17,971,272 | | | | 6,644,408 | | | | 3,092,623 | |
|
|
| |
|
|
| |
|
|
| |
|
|
|
| | | | | | | | | | | | | | | |
| | 31,707,572 | | | | 7,995,679 | | | | 3,291,544 | | | | 1,712,159 | |
| | 12,044,609 | | | | 1,551,989 | | | | 822,487 | | | | 427,880 | |
| | 59,719 | | | | — | | | | — | | | | — | |
| | 1,294 | | | | — | | | | — | | | | — | |
| | 7,980,571 | | | | 1,279,319 | | | | 658,314 | | | | 342,434 | |
| | 1,377,590 | | | | 213,574 | | | | 81,410 | | | | 34,156 | |
| | 339,880 | | | | 73,692 | | | | 53,093 | | | | 44,717 | |
| | 296,791 | | | | 865,872 | | | | 171,388 | | | | 133,246 | |
| | 214,586 | | | | 23,569 | | | | 11,823 | | | | 6,626 | |
| | 1,221,691 | | | | 262,291 | | | | 123,727 | | | | 76,438 | |
|
|
| |
|
|
| |
|
|
| |
|
|
|
| | 55,244,303 | | | | 12,265,985 | | | | 5,213,786 | | | | 2,777,656 | |
| | | | | | | | | | | | | | | |
| | — | | | | (712,659 | ) | | | (276,476 | ) | | | (62,520 | ) |
|
|
| |
|
|
| |
|
|
| |
|
|
|
| | 55,244,303 | | | | 11,553,326 | | | | 4,937,310 | | | | 2,715,136 | |
|
|
| |
|
|
| |
|
|
| |
|
|
|
| | 62,768,364 | | | | 6,417,946 | | | | 1,707,098 | | | | 377,487 | |
|
|
| |
|
|
| |
|
|
| |
|
|
|
| | | | | | | | | | | | | | | |
| | | | | | | | | | | | | | | |
| | 25,954,026 | | | | 9,700,177 | | | | 17,223,548 | | | | 17,592,739 | |
| | (55,500 | ) | | | (39,141 | ) | | | (106,731 | ) | | | (212,202 | ) |
| | (7,456,185 | ) | | | — | | | | — | | | | — | |
|
|
| |
|
|
| |
|
|
| |
|
|
|
| | 18,442,341 | | | | 9,661,036 | | | | 17,116,817 | | | | 17,380,537 | |
| | 892,712,062 | | | | 233,002,829 | | | | 66,475,218 | | | | 33,439,543 | |
|
|
| |
|
|
| |
|
|
| |
|
|
|
| | 911,154,403 | | | | 242,663,865 | | | | 83,592,035 | | | | 50,820,080 | |
|
|
| |
|
|
| |
|
|
| |
|
|
|
| $ | 973,922,767 | | | $ | 249,081,811 | | | $ | 85,299,133 | | | $ | 51,197,567 | |
|
|
| |
|
|
| |
|
|
| |
|
|
|
See Notes to Financial Statements.
63
Excelsior Funds
Statements of Changes in Net Assets
| | | | | | | | | | | | | | | | |
| | |
| | | Blended Equity Fund
| | | Energy and Natural
Resources Fund
| |
| | | Year Ended March 31,
| | | Year Ended March 31,
| |
| | | 2006
| | | 2005
| | | 2006
| | | 2005
| |
Net investment income (loss) | | $ | 2,467,089 | | | $ | 4,656,019 | | | $ | (21,733 | ) | | $ | 228,642 | |
Net realized gain (loss) on investments and foreign currency transactions | | | 49,674,409 | | | | 61,371,061 | | | | 137,515,027 | | | | 43,589,108 | |
Net realized gain (loss) on written options | | | — | | | | — | | | | — | | | | — | |
Change in unrealized appreciation (depreciation) of investments, foreign currency translations and written options during the year | | | (3,482,518 | ) | | | (19,164,776 | ) | | | (1,094,592 | ) | | | 27,931,944 | |
| | |
|
|
| |
|
|
| |
|
|
| |
|
|
|
Net increase in net assets resulting from operations | | | 48,658,980 | | | | 46,862,304 | | | | 136,398,702 | | | | 71,749,694 | |
| | |
|
|
| |
|
|
| |
|
|
| |
|
|
|
Distributions to shareholders: | | | | | | | | | | | | | | | | |
From net investment income | | | | | | | | | | | | | | | | |
Shares | | | (2,711,511 | ) | | | (4,368,038 | ) | | | — | | | | (465,778 | ) |
Institutional Shares | | | — | | | | — | | | | — | | | | — | |
Retirement Shares | | | — | | | | — | | | | — | | | | — | |
From net realized gain on investments | | | | | | | | | | | | | | | | |
Shares | | | (31,936,512 | ) | | | (3,153,196 | ) | | | (86,145,231 | ) | | | (10,741,372 | ) |
Retirement shares | | | — | | | | — | | | | — | | | | — | |
| | |
|
|
| |
|
|
| |
|
|
| |
|
|
|
Total distributions | | | (34,648,023 | ) | | | (7,521,234 | ) | | | (86,145,231 | ) | | | (11,207,150 | ) |
| | |
|
|
| |
|
|
| |
|
|
| |
|
|
|
Increase (decrease) in net assets from fund share transactions (Note 5) | | | (20,604,889 | ) | | | (145,679,465 | ) | | | 179,919,764 | | | | 81,754,770 | |
| | |
|
|
| |
|
|
| |
|
|
| |
|
|
|
Net increase (decrease) in net assets | | | (6,593,932 | ) | | | (106,338,395 | ) | | | 230,173,235 | | | | 142,297,314 | |
| | |
|
|
| |
|
|
| |
|
|
| |
|
|
|
NET ASSETS: | | | | | | | | | | | | | | | | |
Beginning of year | | | 466,903,142 | | | | 573,241,537 | | | | 292,332,705 | | | | 150,035,391 | |
| | |
|
|
| |
|
|
| |
|
|
| |
|
|
|
End of year(1) | | $ | 460,309,210 | | | $ | 466,903,142 | | | $ | 522,505,940 | | | $ | 292,332,705 | |
| | |
|
|
| |
|
|
| |
|
|
| |
|
|
|
(1) Including undistributed (distributions in excess of) net investment income | | $ | 510,112 | | | $ | 762,218 | | | $ | — | | | $ | — | |
| | |
|
|
| |
|
|
| |
|
|
| |
|
|
|
See Notes to Financial Statements.
64
| | | | | | | | | | | | | | | | | | | | | | | | | | | | | | |
| | | |
Equity Core Fund
| | | Equity Income Fund
| | | Large Cap Growth Fund
| | | Mid Cap Value and Restructuring Fund
| |
Year Ended March 31,
| | | Year Ended March 31,
| | | Year Ended March 31,
| | | Year Ended March 31,
| |
2006
| | | 2005
| | | 2006
| | | 2005
| | | 2006
| | | 2005
| | | 2006
| | | 2005
| |
| $ | 838,846 | | | $ | 156,080 | | | $ | 5,148,119 | | | $ | 3,412,422 | | | $ | (1,492,015 | ) | | $ | (953,709 | ) | | $ | 286,682 | | | $ | 4,522,387 | |
| | (2,557,056 | ) | | | 17,682 | | | | (5,658,097 | ) | | | (44,381 | ) | | | 3,004,935 | | | | (480,165 | ) | | | (1,834,247 | ) | | | 12,485,605 | |
| | — | | | | — | | | | (17,851 | ) | | | — | | | | — | | | | — | | | | — | | | | — | |
| 23,862,728 | | | | 495,790 | | | | 10,334,632 | | | | 11,960,531 | | | | 59,460,912 | | | | 7,803,728 | | | | 51,686,678 | | | | 10,433,850 | |
|
|
| |
|
|
| |
|
|
| |
|
|
| |
|
|
| |
|
|
| |
|
|
| |
|
|
|
| | 22,144,518 | | | | 669,552 | | | | 9,806,803 | | | | 15,328,572 | | | | 60,973,832 | | | | 6,369,854 | | | | 50,139,113 | | | | 27,441,842 | |
|
|
| |
|
|
| |
|
|
| |
|
|
| |
|
|
| |
|
|
| |
|
|
| |
|
|
|
| | | | | | | | | | | | | | | | | | | | | | | | | | | | | | | |
| | | | | | | | | | | | | | | | | | | | | | | | | | | | | | | |
| | (261,632 | ) | | | (56,745 | ) | | | (4,741,203 | ) | | | (3,002,218 | ) | | | — | | | | — | | | | (377,856 | ) | | | (2,985,864 | ) |
| | (312,869 | ) | | | — | | | | — | | | | — | | | | — | | | | — | | | | (320,565 | ) | | | (1,745,081 | ) |
| | — | | | | — | | | | (18 | ) | | | — | | | | — | | | | — | | | | — | | | | — | |
| | | | | | | | | | | | | | | | | | | | | | | | | | | | | | | |
| | — | | | | (12,320 | ) | | | (591,743 | ) | | | (358,338 | ) | | | — | | | | — | | | | — | | | | — | |
| | — | | | | — | | | | (3 | ) | | | — | | | | — | | | | — | | | | — | | | | — | |
|
|
| |
|
|
| |
|
|
| |
|
|
| |
|
|
| |
|
|
| |
|
|
| |
|
|
|
| | (574,501 | ) | | | (69,065 | ) | | | (5,332,967 | ) | | | (3,360,556 | ) | | | — | | | | — | | | | (698,421 | ) | | | (4,730,945 | ) |
|
|
| |
|
|
| |
|
|
| |
|
|
| |
|
|
| |
|
|
| |
|
|
| |
|
|
|
| | 67,878,748 | | | | 96,805,046 | | | | 5,710,595 | | | | 83,677,181 | | | | 281,160,848 | | | | 76,460,299 | | | | (6,359,254 | ) | | | (13,744,291 | ) |
|
|
| |
|
|
| |
|
|
| |
|
|
| |
|
|
| |
|
|
| |
|
|
| |
|
|
|
| | 89,448,765 | | | | 97,405,533 | | | | 10,184,431 | | | | 95,645,197 | | | | 342,134,680 | | | | 82,830,153 | | | | 43,081,438 | | | | 8,966,606 | |
|
|
| |
|
|
| |
|
|
| |
|
|
| |
|
|
| |
|
|
| |
|
|
| |
|
|
|
| | | | | | | | | | | | | | | | | | | | | | | | | | | | | | | |
| | 97,405,633 | | | | 100 | | | | 195,669,548 | | | | 100,024,351 | | | | 210,060,890 | | | | 127,230,737 | | | | 296,415,688 | | | | 287,449,082 | |
|
|
| |
|
|
| |
|
|
| |
|
|
| |
|
|
| |
|
|
| |
|
|
| |
|
|
|
| $ | 186,854,398 | | | $ | 97,405,633 | | | $ | 205,853,979 | | | $ | 195,669,548 | | | $ | 552,195,570 | | | $ | 210,060,890 | | | $ | 339,497,126 | | | $ | 296,415,688 | |
|
|
| |
|
|
| |
|
|
| |
|
|
| |
|
|
| |
|
|
| |
|
|
| |
|
|
|
| | | | | | | |
| $ | 362,846 | | | $ | 96,881 | | | $ | 1,253,478 | | | $ | 844,970 | | | $ | — | | | $ | — | | | $ | — | | | $ | 388,063 | |
|
|
| |
|
|
| |
|
|
| |
|
|
| |
|
|
| |
|
|
| |
|
|
| |
|
|
|
65
Excelsior Funds
Statements of Changes in Net Assets
| | | | | | | | | | | | | | | | |
| | |
| | |
Real Estate Fund
| | | Small Cap Fund
| |
| | | Year Ended March 31,
| | | Year Ended March 31,
| |
| | | 2006
| | | 2005
| | | 2006
| | | 2005
| |
Net investment income (loss) | | $ | 934,448 | | | $ | 2,205,990 | | | $ | (3,315,401 | ) | | $ | (2,842,605 | ) |
Net realized gain (loss) on investments and foreign currency transactions | | | 13,523,778 | | | | 11,012,821 | | | | 29,148,540 | | | | 31,179,377 | |
Net realized gain (loss) on written options | | | — | | | | — | | | | — | | | | — | |
Change in unrealized appreciation (depreciation) of investments, foreign currency translations and written options during the year | | | 22,502,084 | | | | (2,363,716 | ) | | | 96,294,626 | | | | 15,666,672 | |
| | |
|
|
| |
|
|
| |
|
|
| |
|
|
|
Net increase in net assets resulting from operations | | | 36,960,310 | | | | 10,855,095 | | | | 122,127,765 | | | | 44,003,444 | |
| | |
|
|
| |
|
|
| |
|
|
| |
|
|
|
Distributions to shareholders: | | | | | | | | | | | | | | | | |
From net investment income | | | | | | | | | | | | | | | | |
Shares | | | (2,183,412 | ) | | | (2,975,084 | ) | | | — | | | | — | |
Institutional Shares | | | — | | | | — | | | | — | | | | — | |
Retirement Shares | | | — | | | | — | | | | — | | | | — | |
From net realized gain on investments | | | | | | | | | | | | | | | | |
Shares | | | (9,669,590 | ) | | | (6,547,304 | ) | | | (26,879,094 | ) | | | — | |
Retirement shares | | | — | | | | — | | | | (53 | ) | | | — | |
| | |
|
|
| |
|
|
| |
|
|
| |
|
|
|
Total distributions | | | (11,853,002 | ) | | | (9,522,388 | ) | | | (26,879,147 | ) | | | — | |
| | |
|
|
| |
|
|
| |
|
|
| |
|
|
|
Increase (decrease) in net assets from fund share transactions (Note 5) | | | (10,368,268 | ) | | | (11,317,823 | ) | | | 15,919,054 | | | | 91,762,562 | |
| | |
|
|
| |
|
|
| |
|
|
| |
|
|
|
Net increase (decrease) in net assets | | | 14,739,040 | | | | (9,985,116 | ) | | | 111,167,672 | | | | 135,766,006 | |
| | |
|
|
| |
|
|
| |
|
|
| |
|
|
|
NET ASSETS: | | | | | | | | | | | | | | | | |
Beginning of year | | | 112,889,368 | | | | 122,874,484 | | | | 488,222,522 | | | | 352,456,516 | |
| | |
|
|
| |
|
|
| |
|
|
| |
|
|
|
End of year(1) | | $ | 127,628,408 | | | $ | 112,889,368 | | | $ | 599,390,194 | | | $ | 488,222,522 | |
| | |
|
|
| |
|
|
| |
|
|
| |
|
|
|
(1) Including undistributed (distributions in excess of) net investment income | | $ | 137,934 | | | $ | (761,948 | ) | | $ | — | | | $ | — | |
| | |
|
|
| |
|
|
| |
|
|
| |
|
|
|
See Notes to Financial Statements.
66
| | | | | | | | | | | | | | | | | | | | | | | | | | | | | | |
| | | |
Value and Restructuring Fund
| | | Emerging Markets Fund
| | | International Fund
| | | Pacific/Asia Fund
| |
Year Ended March 31,
| | | Year Ended March 31,
| | | Year Ended March 31,
| | | Year Ended March 31,
| |
2006
| | | 2005
| | | 2006
| | | 2005
| | | 2006
| | | 2005
| | | 2006
| | | 2005
| |
| $ | 62,768,364 | | | $ | 33,469,906 | | | $ | 6,417,946 | | | $ | 3,691,895 | | | $ | 1,707,098 | | | $ | 943,847 | | | $ | 377,487 | | | $ | 428,010 | |
|
25,898,526 |
| | | 25,789,954 | | | | 9,661,036 | | | | 8,130,513 | | | | 17,116,817 | | | | 21,583,474 | | | | 17,380,537 | | | | 9,813,123 | |
| | (7,456,185 | ) | | | 2,015,708 | | | | — | | | | — | | | | — | | | | — | | | | — | | | | — | |
|
892,712,062 |
| | | 348,650,183 | | | | 233,002,829 | | | | 23,888,849 | | | | 66,475,218 | | | | 7,900,777 | | | | 33,439,543 | | | | (3,876,768 | ) |
|
|
| |
|
|
| |
|
|
| |
|
|
| |
|
|
| |
|
|
| |
|
|
| |
|
|
|
| | 973,922,767 | | | | 409,925,751 | | | | 249,081,811 | | | | 35,711,257 | | | | 85,299,133 | | | | 30,428,098 | | | | 51,197,567 | | | | 6,364,365 | |
|
|
| |
|
|
| |
|
|
| |
|
|
| |
|
|
| |
|
|
| |
|
|
| |
|
|
|
| | | | | | | | | | | | | | | | | | | | | | | | | | | | | | | |
| | | | | | | | | | | | | | | | | | | | | | | | | | | | | | | |
| | (50,184,813 | ) | | | (31,399,379 | ) | | | (5,703,935 | ) | | | (3,087,200 | ) | | | (2,396,031 | ) | | | (29,357 | ) | | | (1,686,498 | ) | | | (112,049 | ) |
| | (2,339,479 | ) | | | (542,162 | ) | | | (210,171 | ) | | | — | | | | — | | | | — | | | | — | | | | — | |
| | (1,311 | ) | | | — | | | | — | | | | — | | | | — | | | | — | | | | — | | | | — | |
| | | | | | | | | | | | | | | | | | | | | | | | | | | | | | | |
| | — | | | | — | | | | — | | | | (5,580,183 | ) | | | — | | | | — | | | | — | | | | — | |
| | — | | | | — | | | | — | | | | — | | | | — | | | | — | | | | — | | | | — | |
|
|
| |
|
|
| |
|
|
| |
|
|
| |
|
|
| |
|
|
| |
|
|
| |
|
|
|
| | (52,525,603 | ) | | | (31,941,541 | ) | | | (5,914,106 | ) | | | (8,667,383 | ) | | | (2,396,031 | ) | | | (29,357 | ) | | | (1,686,498 | ) | | | (112,049 | ) |
|
|
| |
|
|
| |
|
|
| |
|
|
| |
|
|
| |
|
|
| |
|
|
| |
|
|
|
| | 930,527,802 | | | | 969,013,914 | | | | 345,786,429 | | | | 196,963,205 | | | | 199,059,569 | | | | 79,780,442 | | | | 59,874,379 | | | | 13,496,301 | |
|
|
| |
|
|
| |
|
|
| |
|
|
| |
|
|
| |
|
|
| |
|
|
| |
|
|
|
| | 1,851,924,966 | | | | 1,346,998,124 | | | | 588,954,134 | | | | 224,007,079 | | | | 281,962,671 | | | | 110,179,183 | | | | 109,385,448 | | | | 19,748,617 | |
|
|
| |
|
|
| |
|
|
| |
|
|
| |
|
|
| |
|
|
| |
|
|
| |
|
|
|
| | | | | | | | | | | | | | | | | | | | | | | | | | | | | | | |
| | 4,630,091,926 | | | | 3,283,093,802 | | | | 433,168,266 | | | | 209,161,187 | | | | 240,321,766 | | | | 130,142,583 | | | | 134,578,779 | | | | 114,830,162 | |
|
|
| |
|
|
| |
|
|
| |
|
|
| |
|
|
| |
|
|
| |
|
|
| |
|
|
|
| $ | 6,482,016,892 | | | $ | 4,630,091,926 | | | $ | 1,022,122,400 | | | $ | 433,168,266 | | | $ | 522,284,437 | | | $ | 240,321,766 | | | $ | 243,964,227 | | | $ | 134,578,779 | |
|
|
| |
|
|
| |
|
|
| |
|
|
| |
|
|
| |
|
|
| |
|
|
| |
|
|
|
| | | | | | | |
| $ | 19,146,231 | | | $ | 8,690,692 | | | $ | 1,061,119 | | | $ | 596,420 | | | $ | 90,545 | | | $ | 886,210 | | | $ | (477,107 | ) | | $ | 416,681 | |
|
|
| |
|
|
| |
|
|
| |
|
|
| |
|
|
| |
|
|
| |
|
|
| |
|
|
|
See Notes to Financial Statements.
67
Excelsior Funds
Financial Highlights — Selected Per Share Data and Ratios
| | | | | | | | | | | | | | | | | | | | | | | |
| | | | | | |
| | | Net Asset Value,
Beginning of
Year
| | Net
Investment
Income (Loss)
| | | Net Realized and
Unrealized
Gain (Loss) of
Investments and Options
| | | Total From
Investment
Operations
| | | Dividends
From Net
Investment
Income
| | | Distributions From
Net Realized Gain
on Investments
and Options
| |
BLENDED EQUITY FUND | | | | | | | | | | | | | | | | | | | | |
Shares — (04/25/85*) | | | | | | | | | | | | | | | | | | | | | | | |
Year Ended March 31, | | | | | | | | | | | | | | | | | | | | | | | |
2006 | | $ | 36.12 | | $ | 0.19 | (2) | | $ | 3.67 | (2) | | $ | 3.86 | | | $ | (0.21 | ) | | $ | (2.50 | ) |
2005 | | | 33.64 | | | 0.30 | (2) | | | 2.66 | (2) | | | 2.96 | | | | (0.28 | ) | | | (0.20 | ) |
2004 | | | 25.67 | | | 0.14 | | | | 7.99 | | | | 8.13 | | | | (0.16 | ) | | | — | |
2003 | | | 35.17 | | | 0.17 | | | | (7.97 | ) | | | (7.80 | ) | | | (0.15 | ) | | | (1.55 | ) |
2002 | | | 35.99 | | | 0.10 | | | | (0.67 | ) | | | (0.57 | ) | | | (0.08 | ) | | | (0.17 | ) |
ENERGY AND NATURAL RESOURCES FUND | | | | | | | | | | | | | | | | | |
Shares — (12/31/92*) | | | | | | | | | | | | | | | | | | | | | | | |
Year Ended March 31, | | | | | | | | | | | | | | | | | | | | | | | |
2006 | | $ | 22.34 | | | — | (2)(3) | | $ | 9.04 | (2) | | $ | 9.04 | | | | — | | | $ | (5.39 | ) |
2005 | | | 16.45 | | $ | 0.02 | (2) | | | 6.99 | (2) | | | 7.01 | | | $ | (0.05 | ) | | | (1.07 | ) |
2004 | | | 11.72 | | | 0.06 | | | | 4.71 | | | | 4.77 | | | | (0.04 | ) | | | — | |
2003 | | | 14.40 | | | 0.04 | | | | (2.67 | ) | | | (2.63 | ) | | | (0.05 | ) | | | — | |
2002 | | | 15.41 | | | 0.10 | | | | (0.58 | ) | | | (0.48 | ) | | | (0.10 | ) | | | (0.43 | ) |
EQUITY CORE FUND | | | | | | | | | | | | | | | | | | | | |
Shares — (03/31/04*) | | | | | | | | | | | | | | | | | | | | | | | |
Year Ended March 31, | | | | | | | | | | | | | | | | | | | | | | | |
2006 | | $ | 10.98 | | $ | 0.07 | (2) | | $ | 1.70 | (2) | | $ | 1.77 | | | $ | (0.05 | ) | | | — | |
2005 | | | 10.00 | | | 0.08 | (2) | | | 0.95 | (2) | | | 1.03 | | | | (0.04 | ) | | $ | (0.01 | ) |
EQUITY INCOME FUND | | | | | | | | | | | | | | | | | | | | |
Shares — (09/30/03*) | | | | | | | | | | | | | | | | | | | | | | | |
Year Ended March 31, | | | | | | | | | | | | | | | | | | | | | | | |
2006 | | $ | 8.39 | | $ | 0.20 | (2) | | $ | 0.17 | (2) | | $ | 0.37 | | | $ | (0.18 | ) | | $ | (0.02 | ) |
2005 | | | 7.76 | | | 0.19 | (2) | | | 0.63 | (2) | | | 0.82 | | | | (0.17 | ) | | | (0.02 | ) |
Period Ended March 31, 2004 | | | 7.00 | | | 0.07 | | | | 0.73 | | | | 0.80 | | | | (0.04 | ) | | | — | |
LARGE CAP GROWTH FUND | | | | | | | | | | | | | | | | | | | | |
Shares — (10/01/97*) | | | | | | | | | | | | | | | | | | | | | | | |
Year Ended March 31, | | | | | | | | | | | | | | | | | | | | | | | |
2006 | | $ | 8.04 | | $ | (0.04 | )(2) | | $ | 1.91 | (2) | | $ | 1.87 | | | | — | | | | — | |
2005 | | | 7.71 | | | (0.05 | )(2) | | | 0.38 | (2) | | | 0.33 | | | | — | | | | — | |
2004 | | | 5.79 | | | (0.05 | )(2) | | | 1.97 | (2) | | | 1.92 | | | | — | | | | — | |
2003 | | | 8.83 | | | (0.01 | )(2) | | | (3.03 | )(2) | | | (3.04 | ) | | | — | | | | — | |
2002 | | | 10.06 | | | (0.06 | ) | | | (1.17 | ) | | | (1.23 | ) | | | — | | | | — | |
MID CAP VALUE AND RESTRUCTURING FUND | | | | | | | | | | | | | | | | | |
Shares — (06/01/96*) | | | | | | | | | | | | | | | | | | | | | | | |
Year Ended March 31, | | | | | | | | | | | | | | | | | | | | | | | |
2006 | | $ | 16.77 | | | — | (2)(3) | | $ | 2.90 | (2) | | $ | 2.90 | | | $ | (0.03 | ) | | | — | |
2005 | | | 15.75 | | $ | 0.23 | (2) | | | 1.02 | (2) | | | 1.25 | | | | (0.23 | ) | | | — | |
2004 | | | 10.24 | | | 0.03 | (2) | | | 5.51 | (2) | | | 5.54 | | | | (0.03 | ) | | | — | |
2003 | | | 13.29 | | | 0.02 | (2) | | | (3.05 | )(2) | | | (3.03 | ) | | | (0.02 | ) | | | — | |
2002 | | | 11.99 | | | 0.27 | (2) | | | 1.41 | (2) | | | 1.68 | | | | (0.02 | ) | | $ | (0.36 | ) |
REAL ESTATE FUND | | | | | | | | | | | | | | | | | | | | |
Shares — (10/01/97*) | | | | | | | | | | | | | | | | | | | | | | | |
Year Ended March 31, | | | | | | | | | | | | | | | | | | | | | | | |
2006 | | $ | 9.30 | | $ | 0.08 | (2) | | $ | 3.10 | (2) | | $ | 3.18 | | | $ | (0.19 | ) | | $ | (0.83 | ) |
2005 | | | 9.17 | | | 0.17 | (2) | | | 0.68 | (2) | | | 0.85 | | | | (0.22 | ) | | | (0.50 | ) |
2004 | | | 6.61 | | | 0.29 | (2) | | | 2.64 | (2) | | | 2.93 | | | | (0.31 | ) | | | (0.06 | ) |
2003 | | | 7.10 | | | 0.28 | (2) | | | (0.52 | )(2) | | | (0.24 | ) | | | (0.25 | ) | | | — | |
2002 | | | 6.09 | | | 0.31 | | | | 1.01 | | | | 1.32 | | | | (0.31 | )(6) | | | — | |
| * | Commencement of Operations. |
| (1) | Expense ratios before waiver of fees and reimbursement of expenses (if any) by adviser and administrator. |
| (2) | For comparative purposes per share amounts are based on average shares outstanding. |
| (3) | Amount represents less than $0.01 per share. |
| (6) | Includes a tax return of capital of $(0.02). |
See Notes to Financial Statements.
68
| | | | | | | | | | | | | | | | | | | | | | | |
| | | | | | | |
Total
Distributions
| | | Net Asset
Value,
End of
Year
| | Total
Return
| | | Net Assets,
End of
Year
(000’s)
| | Ratio of Net
Operating
Expenses
to Average
Net Assets
| | | Ratio of Gross
Operating
Expenses to Average Net Assets (1)
| | | Ratio of Net
Investment
Income (Loss)
to Average
Net Assets
| | | Portfolio
Turnover
Rate
| |
| | | | | | | | | | | | | | | | | | | | | | | | |
| | | | | | | | | | | | | | | | | | | | | | | | |
| | | | | | | | | | | | | | | | | | | | | | | | |
| $ | (2.71 | ) | | $ | 37.27 | | 11.10 | % | | $ | 460,309 | | 1.08 | % | | 1.21 | % | | 0.53 | % | | 22 | % |
| | (0.48 | ) | | | 36.12 | | 8.85 | % | | | 466,903 | | 1.05 | % | | 1.24 | % | | 0.86 | % | | 19 | % |
| | (0.16 | ) | | | 33.64 | | 31.75 | % | | | 573,242 | | 0.99 | % | | 1.10 | % | | 0.45 | % | | 24 | % |
| | (1.70 | ) | | | 25.67 | | (22.45 | )% | | | 469,013 | | 0.96 | % | | 1.11 | % | | 0.59 | % | | 36 | % |
| | (0.25 | ) | | | 35.17 | | (1.58 | )% | | | 683,100 | | 0.97 | % | | 1.08 | % | | 0.59 | % | | 43 | % |
| | | | | | | | | | | | | | | | | | | | | | | | |
| | | | | | | | | | | | | | | | | | | | | | | | |
| | | | | | | | | | | | | | | | | | | | | | | | |
| $ | (5.39 | ) | | $ | 25.99 | | 41.42 | % | | $ | 522,506 | | 1.13 | % | | 1.13 | % | | (0.01 | )% | | 234 | % |
| | (1.12 | ) | | | 22.34 | | 43.97 | % | | | 292,333 | | 1.10 | % | | 1.15 | % | | 0.12 | % | | 111 | % |
| | (0.04 | ) | | | 16.45 | | 40.84 | % | | | 150,035 | | 0.99 | % | | 1.13 | % | | 0.45 | % | | 91 | % |
| | (0.05 | ) | | | 11.72 | | (18.30 | )% | | | 92,440 | | 1.01 | % | | 1.19 | % | | 0.35 | % | | 78 | % |
| | (0.53 | ) | | | 14.40 | | (2.82 | )% | | | 129,169 | | 0.98 | % | | 1.12 | % | | 0.77 | % | | 73 | % |
| | | | | | | | | | | | | | | | | | | | | | | | |
| | | | | | | | | | | | | | | | | | | | | | | | |
| | | | | | | | | | | | | | | | | | | | | | | | |
| $ | (0.05 | ) | | $ | 12.70 | | 16.16 | % | | $ | 132,406 | | 1.05 | % | | 1.31 | % | | 0.57 | % | | 17 | % |
| | (0.05 | ) | | | 10.98 | | 10.30 | % | | | 43,579 | | 1.05 | % | | 1.59 | % | | 0.74 | % | | 13 | % |
| | | | | | | | | | | | | | | | | | | | | | | | |
| | | | | | | | | | | | | | | | | | | | | | | | |
| | | | | | | | | | | | | | | | | | | | | | | | |
| $ | (0.20 | ) | | $ | 8.56 | | 4.62 | % | | $ | 205,853 | | 1.06 | % | | 1.22 | % | | 2.41 | % | | 46 | % |
| | (0.19 | ) | | | 8.39 | | 10.73 | % | | | 195,668 | | 1.05 | % | | 1.26 | % | | 2.35 | % | | 19 | % |
| | (0.04 | ) | | | 7.76 | | 11.48 | %(4) | | | 100,024 | | 1.05 | %(5) | | 1.17 | %(5) | | 2.44 | %(5) | | 6 | % |
| | | | | | | | | | | | | | | | | | | | | | | | |
| | | | | | | | | | | | | | | | | | | | | | | | |
| | | | | | | | | | | | | | | | | | | | | | | | |
| | — | | | $ | 9.91 | | 23.26 | % | | $ | 552,194 | | 1.10 | % | | 1.23 | % | | (0.48 | )% | | 24 | % |
| | — | | | | 8.04 | | 4.28 | % | | | 210,060 | | 1.05 | % | | 1.28 | % | | (0.59 | )% | | 25 | % |
| | — | | | | 7.71 | | 33.16 | % | | | 127,231 | | 1.05 | % | | 1.18 | % | | (0.74 | )% | | 79 | % |
| | — | | | | 5.79 | | (34.43 | )% | | | 73,894 | | 1.04 | % | | 1.21 | % | | (0.21 | )% | | 56 | % |
| | — | | | | 8.83 | | (12.23 | )% | | | 189,247 | | 1.00 | % | | 1.10 | % | | (0.50 | )% | | 10 | % |
| | | | | | | | | | | | | | | | | | | | | | | | |
| | | | | | | | | | | | | | | | | | | | | | | | |
| | | | | | | | | | | | | | | | | | | | | | | | �� |
| $ | (0.03 | ) | | $ | 19.64 | | 17.32 | % | | $ | 237,531 | | 1.13 | % | | 1.13 | % | | 0.02 | % | | 23 | % |
| | (0.23 | ) | | | 16.77 | | 7.93 | % | | | 214,844 | | 1.06 | % | | 1.16 | % | | 1.42 | % | | 28 | % |
| | (0.03 | ) | | | 15.75 | | 54.21 | % | | | 186,720 | | 0.99 | % | | 1.23 | % | | 0.24 | % | | 13 | % |
| | (0.02 | ) | | | 10.24 | | (22.81 | )% | | | 81,146 | | 1.01 | % | | 1.15 | % | | 0.20 | % | | 28 | % |
| | (0.38 | ) | | | 13.29 | | 14.23 | % | | | 50,477 | | 1.05 | % | | 1.16 | % | | 0.59 | % | | 24 | % |
| | | | | | | | | | | | | | | | | | | | | | | | |
| | | | | | | | | | | | | | | | | | | | | | | | |
| | | | | | | | | | | | | | | | | | | | | | | | |
| $ | (1.02 | ) | | $ | 11.46 | | 36.03 | % | | $ | 127,628 | | 1.23 | % | | 1.52 | % | | 0.77 | % | | 14 | % |
| | (0.72 | ) | | | 9.30 | | 9.90 | % | | | 112,889 | | 1.20 | % | | 1.56 | % | | 1.89 | % | | 17 | % |
| | (0.37 | ) | | | 9.17 | | 45.65 | % | | | 122,874 | | 1.20 | % | | 1.35 | % | | 3.67 | % | | 38 | % |
| | (0.25 | ) | | | 6.61 | | (3.49 | )% | | | 79,374 | | 1.17 | % | | 1.23 | % | | 4.09 | % | | 23 | % |
| | (0.31 | ) | | | 7.10 | | 22.37 | % | | | 91,308 | | 1.20 | % | | 1.33 | % | | 4.53 | % | | 25 | % |
See Notes to Financial Statements.
69
Excelsior Funds
Financial Highlights — Selected Per Share Data and Ratios
| | | | | | | | | | | | | | | | | | | | | | | |
| | | | | | |
| | | Net Asset Value,
Beginning of
Year
| | Net
Investment
Income (Loss)
| | | Net Realized and
Unrealized
Gain (Loss) of
Investments
and Options
| | | Total From
Investment
Operations
| | | Dividends
From Net
Investment
Income
| | | Distributions
From Net
Realized
Gain on
Investments
and Options
| |
SMALL CAP FUND | | | | | | | | | | | | | | | | | | | | |
Shares — (12/31/92*) | | | | | | | | | | | | | | | | | | | | | | | |
Year Ended March 31, | | | | | | | | | | | | | | | | | | | | | | | |
2006 | | $ | 16.14 | | $ | (0.11 | )(2) | | $ | 4.09 | (2) | | $ | 3.98 | | | | — | | | $ | (0.89 | ) |
2005 | | | 14.59 | | | (0.10 | )(2) | | | 1.65 | (2) | | | 1.55 | | | | — | | | | — | |
2004 | | | 8.47 | | | (0.02 | )(2) | | | 6.14 | (2) | | | 6.12 | | | | — | | | | — | |
2003 | | | 12.19 | | | (0.03 | )(2) | | | (3.69 | )(2) | | | (3.72 | ) | | | — | | | | — | |
2002 | | | 10.06 | | | 0.03 | | | | 2.14 | | | | 2.17 | | | $ | (0.04 | )(4) | | | — | |
VALUE AND RESTRUCTURING FUND | | | | | | | | | | | | | | | | | |
Shares — (12/31/92*) | | | | | | | | | | | | | | | | | | | | | | | |
Year Ended March 31, | | | | | | | | | | | | | | | | | | | | | | | |
2006 | | $ | 41.40 | | $ | 0.53 | (2) | | $ | 7.88 | (2) | | $ | 8.41 | | | $ | (0.45 | ) | | | — | |
2005 | | | 37.57 | | | 0.34 | (2) | | | 3.83 | (2) | | | 4.17 | | | | (0.34 | ) | | | — | |
2004 | | | 23.66 | | | 0.24 | | | | 13.90 | | | | 14.14 | | | | (0.23 | ) | | | — | |
2003 | | | 32.63 | | | 0.17 | | | | (9.01 | ) | | | (8.84 | ) | | | (0.13 | ) | | | — | |
2002 | | | 30.69 | | | 0.08 | | | | 1.94 | | | | 2.02 | | | | (0.08 | ) | | | — | |
EMERGING MARKETS FUND | | | | | | | | | | | | | | | | | | | | |
Shares — (01/02/98*) | | | | | | | | | | | | | | | | | | | | | | | |
Year Ended March 31, | | | | | | | | | | | | | | | | | | | | | | | |
2006 | | $ | 8.73 | | $ | 0.10 | (2) | | $ | 3.87 | (2) | | $ | 3.97 | | | $ | (0.10 | ) | | | — | |
2005 | | | 7.67 | | | 0.12 | (2) | | | 1.18 | (2) | | | 1.30 | | | | (0.08 | ) | | $ | (0.16 | ) |
2004 | | | 4.12 | | | 0.05 | | | | 3.55 | | | | 3.60 | | | | (0.05 | ) | | | — | |
2003 | | | 4.95 | | | 0.02 | | | | (0.84 | ) | | | (0.82 | ) | | | (0.01 | ) | | | — | |
2002 | | | 4.43 | | | 0.01 | | | | 0.53 | | | | 0.54 | | | | (0.02 | ) | | | — | |
INTERNATIONAL FUND | | | | | | | | | | | | | | | | | | | | |
Shares — (07/21/87*) | | | | | | | | | | | | | | | | | | | | | | | |
Year Ended March 31, | | | | | | | | | | | | | | | | | | | | | | | |
2006 | | $ | 13.05 | | $ | 0.07 | (2) | | $ | 3.51 | (2) | | $ | 3.58 | | | $ | (0.12 | ) | | | — | |
2005 | | | 11.28 | | | 0.06 | (2) | | | 1.71 | (2) | | | 1.77 | | | | — | (3) | | | — | |
2004 | | | 6.83 | | | 0.09 | | | | 4.44 | | | | 4.53 | | | | (0.08 | ) | | | — | |
2003 | | | 9.75 | | | 0.10 | | | | (2.99 | ) | | | (2.89 | ) | | | (0.03 | ) | | | — | |
2002 | | | 11.75 | | | 0.03 | | | | (1.43 | ) | | | (1.40 | ) | | | (0.08 | ) | | $ | (0.52 | ) |
PACIFIC/ASIA FUND | | | | | | | | | | | | | | | | | | | | |
Shares — (12/31/92*) | | | | | | | | | | | | | | | | | | | | | | | |
Year Ended March 31, | | | | | | | | | | | | | | | | | | | | | | | |
2006 | | $ | 8.88 | | $ | 0.02 | (2) | | $ | 2.82 | (2) | | $ | 2.84 | | | $ | (0.11 | ) | | | — | |
2005 | | | 8.44 | | | 0.03 | (2) | | | 0.42 | (2) | | | 0.45 | | | | (0.01 | ) | | | — | |
2004 | | | 5.21 | | | 0.01 | | | | 3.22 | | | | 3.23 | | | | — | | | | — | |
2003 | | | 6.68 | | | 0.01 | | | | (1.43 | ) | | | (1.42 | ) | | | (0.05 | ) | | | — | |
2002 | | | 6.59 | | | 0.02 | | | | 0.09 | | | | 0.11 | | | | (0.02 | ) | | | — | |
| * | Commencement of Operations. |
| (1) | Expense ratios before waiver of fees and reimbursement of expenses (if any) by adviser and administrator. |
| (2) | For comparative purposes per share amounts are based on average shares outstanding. |
| (3) | Amount represents less than $0.01 per share. |
| (4) | Includes a tax return of capital of $(0.01). |
See Notes to Financial Statements.
70
| | | | | | | | | | | | | | | | | | | | | | | |
| | | | | | | |
Total
Distributions
| | | Net Asset
Value,
End of
Year
| | Total
Return
| | | Net Assets,
End of
Year
(000’s)
| | Ratio of
Net Operating
Expenses to
Average Net
Assets
| | | Ratio of Gross
Operating
Expenses to
Average Net
Assets (1)
| | | Ratio of
Net Investment
Income (Loss)
to Average
Net Assets
| | | Portfolio
Turnover
Rate
| |
| | | | | | | | | | | | | | | | | | | | | | | | |
| | | | | | | | | | | | | | | | | | | | | | | | |
| | | | | | | | | | | | | | | | | | | | | | | | |
| $ | (0.89 | ) | | $ | 19.23 | | 25.37 | % | | $ | 599,389 | | 1.09 | % | | 1.11 | % | | (0.64 | )% | | 65 | % |
| | — | | | | 16.14 | | 10.62 | % | | | 488,221 | | 1.05 | % | | 1.08 | % | | (0.64 | )% | | 61 | % |
| | — | | | | 14.59 | | 72.26 | % | | | 352,457 | | 0.83 | % | | 0.98 | % | | (0.20 | )% | | 82 | % |
| | — | | | | 8.47 | | (30.52 | )% | | | 156,324 | | 0.83 | % | | 1.05 | % | | (0.31 | )% | | 105 | % |
| | (0.04 | ) | | | 12.19 | | 21.61 | % | | | 171,601 | | 0.84 | % | | 0.98 | % | | 0.19 | % | | 144 | % |
| | | | | | | | | | | | | | | | | | | | | | | | |
| | | | | | | | | | | | | | | | | | | | | | | | |
| | | | | | | | | | | | | | | | | | | | | | | | |
| $ | (0.45 | ) | | $ | 49.36 | | 20.45 | % | | $ | 6,230,754 | | 1.05 | % | | 1.05 | % | | 1.18 | % | | 12 | % |
| | (0.34 | ) | | | 41.40 | | 11.16 | % | | | 4,469,075 | | 1.07 | % | | 1.09 | % | | 0.87 | % | | 8 | % |
| | (0.23 | ) | | | 37.57 | | 60.06 | % | | | 3,244,851 | | 0.99 | % | | 1.14 | % | | 0.78 | % | | 4 | % |
| | (0.13 | ) | | | 23.66 | | (27.13 | )% | | | 1,558,721 | | 0.99 | % | | 1.12 | % | | 0.65 | % | | 16 | % |
| | (0.08 | ) | | | 32.63 | | 6.60 | % | | | 2,408,053 | | 0.94 | % | | 1.02 | % | | 0.27 | % | | 8 | % |
| | | | | | | | | | | | | | | | | | | | | | | | |
| | | | | | | | | | | | | | | | | | | | | | | | |
| | | | | | | | | | | | | | | | | | | | | | | | |
| $ | (0.10 | ) | | $ | 12.60 | | 45.85 | % | | $ | 996,666 | | 1.81 | % | | 1.92 | % | | 1.00 | % | | 7 | % |
| | (0.24 | ) | | | 8.73 | | 17.07 | % | | | 433,168 | | 1.70 | % | | 1.90 | % | | 1.44 | % | | 21 | % |
| | (0.05 | ) | | | 7.67 | | 87.57 | % | | | 209,161 | | 1.65 | % | | 1.92 | % | | 0.81 | % | | 14 | % |
| | (0.01 | ) | | | 4.12 | | (16.62 | )% | | | 30,049 | | 1.61 | % | | 1.84 | % | | 0.51 | % | | 43 | % |
| | (0.02 | ) | | | 4.95 | | 12.16 | % | | | 22,847 | | 1.59 | % | | 1.93 | % | | 0.78 | % | | 31 | % |
| | | | | | | | | | | | | | | | | | | | | | | | |
| | | | | | | | | | | | | | | | | | | | | | | | |
| | | | | | | | | | | | | | | | | | | | | | | | |
| $ | (0.12 | ) | | $ | 16.51 | | 27.70 | % | | $ | 522,284 | | 1.50 | % | | 1.58 | % | | 0.52 | % | | 26 | % |
| | — | | | | 13.05 | | 15.71 | % | | | 240,322 | | 1.50 | % | | 1.61 | % | | 0.52 | % | | 66 | % |
| | (0.08 | ) | | | 11.28 | | 66.51 | % | | | 130,143 | | 1.38 | % | | 1.49 | % | | 0.92 | % | | 58 | % |
| | (0.03 | ) | | | 6.83 | | (29.72 | )% | | | 89,679 | | 1.40 | % | | 1.57 | % | | 0.55 | % | | 73 | % |
| | (0.60 | ) | | | 9.75 | | (12.25 | )% | | | 167,280 | | 1.23 | % | | 1.53 | % | | 0.44 | % | | 50 | % |
| | | | | | | | | | | | | | | | | | | | | | | | |
| | | | | | | | | | | | | | | | | | | | | | | | |
| | | | | | | | | | | | | | | | | | | | | | | | |
| $ | (0.11 | ) | | $ | 11.61 | | 32.35 | % | | $ | 243,964 | | 1.59 | % | | 1.62 | % | | 0.22 | % | | 68 | % |
| | (0.01 | ) | | | 8.88 | | 5.32 | % | | | 134,579 | | 1.50 | % | | 1.64 | % | | 0.35 | % | | 90 | % |
| | — | | | | 8.44 | | 62.00 | % | | | 114,830 | | 1.45 | % | | 1.58 | % | | 0.20 | % | | 58 | % |
| | (0.05 | ) | | | 5.21 | | (21.44 | )% | | | 27,330 | | 1.51 | % | | 1.66 | % | | 0.15 | % | | 73 | % |
| | (0.02 | ) | | | 6.68 | | 1.62 | % | | | 23,541 | | 1.43 | % | | 1.74 | % | | 0.35 | % | | 94 | % |
See Notes to Financial Statements.
71
EXCELSIOR FUNDS
NOTES TO FINANCIAL STATEMENTS
1. Significant Accounting Policies:
Excelsior Funds, Inc. (“Excelsior Fund”) was incorporated under the laws of the State of Maryland on August 2, 1984. Excelsior Funds Trust (the “Trust”) is a statutory trust organized under the laws of the State of Delaware on April 27, 1994. Excelsior Fund and the Trust are registered under the Investment Company Act of 1940, as amended (the “1940 Act”), as open-ended diversified management investment companies with the exception of Energy and Natural Resources Fund and Real Estate Fund, each of which are non-diversified.
Excelsior Fund and the Trust currently offer shares in fifteen and seven managed investment portfolios, respectively, each having its own investment objectives and policies. The following is a summary of significant accounting policies for Blended Equity Fund, Energy and Natural Resources Fund, Large Cap Growth Fund, Real Estate Fund, Small Cap Fund, Value and Restructuring Fund, Emerging Markets Fund, International Fund and Pacific/Asia Fund, portfolios of Excelsior Fund, and Equity Core Fund, Equity Income Fund and Mid Cap Value and Restructuring Fund (formerly the Mid Cap Value Fund), portfolios of the Trust. Such policies are in conformity with accounting principles generally accepted in the United States of America and are consistently followed by Excelsior Fund and the Trust (each a “Fund”, collectively the “Funds”) in the preparation of their financial statements. The preparation of financial statements requires management to make estimates and assumptions that affect the reported amounts and disclosures in the financial statements. Actual results could differ from these estimates.
The Blended Equity Fund, Energy and Natural Resources Fund, Real Estate Fund and International Fund offer one class of shares: Shares. The Equity Core Fund and Emerging Markets Fund offer two classes of shares: Shares and Institutional Shares. The Equity Income Fund, Large Cap Growth Fund and Small Cap Fund offer two classes of shares: Shares and Retirement Shares. The Mid Cap Value and Restructuring Fund and the Value and Restructuring Fund offer three classes of shares: Shares, Institutional Shares and Retirement Shares. The Financial Highlights of the Institutional Shares and Retirement Shares as well as the financial statements for the remaining portfolios of Excelsior Fund and the Trust are presented separately.
(a) Portfolio valuation:
Investments in securities that are traded on a recognized domestic and foreign stock exchanges are valued at the last sale price on the exchange on which such securities are primarily traded or at the last quoted sale price on a national securities market. Securities traded over-the-counter are valued each business day on the basis of closing over-the-counter sale prices. Equity securities that are traded on the NASDAQ National Market System for which quotations are readily available are valued at the official closing price. Securities for which there were no transactions are valued at the last quoted sales price for the most recent day such prices were available. Securities for which market quotations are not readily available are valued in good faith at fair value pursuant to procedures adopted by the Board of Directors with regard to Excelsior Fund and the Board of Trustees with regard to the Trust. The Funds have engaged a third party fair value service provider
72
to systematically recommend the adjustment of closing market prices of securities traded principally in certain foreign markets. Short-term debt instruments that mature in 60 days or less are valued at amortized cost, which approximates market value.
Investment valuations, other assets and liabilities initially expressed in foreign currencies are converted each business day into U.S. dollars based upon current exchange rates. Purchases and sales of foreign investments and income and expenses are converted into U.S. dollars based upon currency exchange rates prevailing on the respective dates of such transactions. The Funds do not isolate the portion of gains and losses on investment securities that is due to changes in foreign exchange rates from that which is due to changes in market prices of such securities. The Funds report gains and losses on foreign currency related transactions as realized and unrealized gains and losses for financial reporting purposes, whereas such components are treated as ordinary income or loss for federal income tax purposes.
(b) Forward foreign currency exchange contracts:
The Funds’ participation in forward currency exchange contracts will be limited to hedging involving either specific transactions or portfolio positions. Transaction hedging involves the purchase or sale of foreign currency with respect to specific receivables or payables of a Fund generally arising in connection with the purchase or sale of its portfolio securities. Risk may arise upon entering into these contracts from the potential inability of counterparties to meet the terms of their contracts and is generally limited to the amount of unrealized gain on the contracts, if any, at the date of default. Risk may also arise from unanticipated movements in the value of foreign currency relative to the U.S. dollar. Contracts are marked to market daily and the change in market value is recorded as unrealized appreciation or depreciation. Realized gains or losses arising from such transactions are included in net realized gains or losses from foreign currency transactions.
The Equity Income Fund had the following forward foreign currency contracts outstanding as of March 31, 2006:
| | | | | | | | |
Settlement Dates
| | Currency to
Receive
| | In
Exchange
For
| | Unrealized
Appreciation
|
Foreign Currency Purchases: | | | | | | | | |
04/05/06 | | GBP (79,291) | | $ | (137,816) | | $ | 70 |
The International Fund had the following forward foreign currency contracts outstanding as of March 31, 2006:
| | | | | | | | | | | | |
Settlement Dates
| | Currency to Receive
| | | In
Exchange
For
| | | Unrealized
Appreciation
(Depreciation)
| |
Foreign Currency Purchases: | | | | | | | | | | | | |
04/04/06 | | EUR | 74,287 | | | $ | 90,199 | | | $ | (186 | ) |
04/05/06 | | GBP | 869,757 | | | | 1,511,725 | | | | (772 | ) |
04/05/06 | | JPY | 633,544,975 | | | | 5,385,455 | | | | (1,021 | ) |
04/05/06 | | SEK | (26,985,220 | ) | | | (3,467,379 | ) | | | 760 | |
73
The Pacific/Asia Fund had the following forward foreign currency contracts outstanding as of March 31, 2006:
| | | | | | | | | | | | |
Settlement Dates
| | Currency to
Receive
| | | In
Exchange
For
| | | Unrealized
Appreciation
(Depreciation)
| |
Foreign Currency Purchases: | | | | | | | | | | | | |
04/03/06 | | JPY | 133,552,681 | | | $ | 1,140,635 | | | $ | (5,755 | ) |
04/03/06 | | JPY | 178,456,200 | | | | 1,524,142 | | | | (7,689 | ) |
04/03/06 | | JPY | 230,406,966 | | | | 1,967,839 | | | | (9,928 | ) |
04/05/06 | | JPY | (139,430,689 | ) | | | (1,185,232 | ) | | | 225 | |
04/05/06 | | JPY | 422,963,265 | | | | 3,595,403 | | | | (682 | ) |
Currency Legend:
(c) Covered call options written:
Certain Funds may engage in writing covered call options. By writing a covered call option, a Fund forgoes the opportunity to profit from an increase in the market price of the underlying security above the exercise price, except insofar as the premium represents such a profit.
When a Fund writes an option, an amount equal to the net premium (the premium less the commission) received by that Fund is included in the liability section of that Fund’s statement of assets and liabilities as a deferred credit. The amount of the deferred credit will be subsequently marked to market to reflect the current value of the option written. The current value of the traded option is the last sale price or, in the absence of a sale, the last quoted sale price for the most recent day such price was available. If an option expires on the stipulated expiration date, or if the Fund involved enters into a closing purchase transaction, the Fund will realize a gain (or loss if the cost of a closing purchase transaction exceeds the net premium received when the option is sold), and the deferred credit related to such option will be eliminated. If an option is exercised, the Fund involved may deliver the underlying security from its portfolio or purchase the underlying security in the open market. In either event, the proceeds of the sale will be increased by the net premium originally received, and the Fund involved will realize a gain or loss. Premiums from expired call options written by the Fund and net gains from closing purchase transactions are treated as short-term capital gains for Federal income tax purposes, and losses on closing purchase transactions are short-term capital losses.
There is no assurance that a liquid secondary market on an exchange will exist for any particular option. A covered option writer, unable to effect a closing purchase transaction, will not be able to sell the underlying security until the option expires or is delivered upon exercise. As a result, the writer in such circumstances will be subject to the risk of market decline in the underlying security during such period and to the risk that market values increase beyond the option exercise price, in each case to the extent not offset by the net premium. A Fund will write an
74
option on a particular security only if the Adviser believes that a liquid secondary market will exist on an exchange for options of the same series, which will permit the Fund to make a closing purchase transaction in order to close out its position.
During the year ended March 31, 2006, the Value and Restructuring Fund had the following written option transactions:
| | | | | | | |
Written Option Transactions
| | Number of
Contracts
| | | Premiums
| |
Outstanding, beginning of year | | (20,000 | ) | | $ | (2,633,972 | ) |
Options written | | (32,827 | ) | | | (12,444,685 | ) |
Options expired | | — | | | | — | |
Options exercised | | 11,932 | | | | 3,090,507 | |
Options terminated in closing purchase transactions | | 36,427 | | | | 10,227,178 | |
| | |
|
| |
|
|
|
Outstanding, end of year | | (4,468 | ) | | $ | (1,760,972 | ) |
| | |
|
| |
|
|
|
(d) Concentration of risks:
The Emerging Markets Fund, International Fund and Pacific/Asia Fund invest primarily in securities of companies that are located in or conduct a substantial amount of their business in foreign countries, including emerging market countries. Prices of securities in foreign markets generally, and emerging markets in particular, have historically been more volatile than prices in U.S. markets. Some countries in which the Funds may invest require government approval for the repatriation of investment income, capital or the proceeds of sales of securities by foreign investors. In addition, if there is deterioration in a country’s balance of payments or for other reasons, a country may impose temporary restrictions on foreign capital remittances abroad.
(e) Security transactions and investment income:
Security transactions are recorded on a trade date basis. Realized gains and losses on investments sold are recorded on the basis of identified cost. Interest income, adjusted for amortization of premiums and, when appropriate, discounts on investments, is earned from settlement date and is recorded on the accrual basis. Dividend income is recorded on the ex-dividend date, except for certain dividends from foreign securities, which are recorded as soon as the Funds are informed of the dividend.
(f) Repurchase agreements:
The Funds may purchase portfolio securities from financial institutions deemed to be creditworthy by the investment adviser subject to the seller’s agreement to repurchase and the Funds’ agreement to resell such securities at mutually agreed upon prices. Securities purchased subject to such repurchase agreements are deposited with the Funds’ custodian or sub-custodian or are maintained in the Federal Reserve/Treasury book-entry system and must have, at all times, an aggregate market value not less than the repurchase price (including accrued interest).
Default or bankruptcy of the seller may, however, expose the applicable Fund to possible delay in connection with the disposition of the securities or loss to the extent that proceeds from a sale of the underlying securities were less than the repurchase price under the agreement.
75
(g) TBA purchase commitments:
Certain Funds may enter into “TBA” (To Be Announced) purchase commitments to purchase securities for a fixed price at a future date, typically not exceeding 45 days. TBA purchase commitments may be considered securities in themselves, and involve risk of loss if the value of the security to be purchased declines prior to settlement date. The Funds must maintain liquid securities having a value not less than the purchase price (including accrued interest) for such purchase commitments. Unsettled TBA purchase commitments are valued at the current market value of the underlying securities, according to the procedures described under “Portfolio Valuation” above.
(h) Distributions to shareholders:
Dividends equal to all or substantially all of each Fund’s net investment income will be declared and paid as follows: for the Blended Equity Fund, Energy and Natural Resources Fund, Equity Core Fund, Equity Income Fund, Large Cap Growth Fund, Mid Cap Value and Restructuring Fund, Real Estate Fund, Small Cap Fund and Value and Restructuring Fund, dividends will be declared and paid at least quarterly; and for the Emerging Markets Fund, International Fund and Pacific/Asia Fund, dividends will be declared and paid semiannually. Net realized capital gains, unless offset by any available capital loss carryforward, are distributed at least annually. Dividends and distributions are recorded on the ex-dividend date.
(i) Expense allocation:
Expenses directly attributable to a Fund are charged to that Fund. Other expenses are allocated to the respective Fund based on average daily net assets. Expenses attributable to a specific class of shares, such as shareholder servicing fees, are charged directly to that class.
2. Investment Advisory Fee, Administration Fee, Shareholder Servicing Fees and Related Party
Transactions:
Prior to December 16, 2005, the Funds were advised jointly by United States Trust Company of New York and U.S. Trust Company, N.A., through their respective separate identifiable divisions. Effective December 16, 2005, U.S. Trust Company, N.A.’s separately identifiable division was reorganized into a separate corporate entity named UST Advisers, Inc., a Delaware corporation that is a wholly-owned subsidiary of U.S. Trust Company, N.A. and the Funds were advised by either UST Advisers, Inc. or U.S. Trust New York Asset Management Division (“NYAMD”), the separately identifiable division of United States Trust Company of New York.
Effective March 31, 2006, United States Trust Company of New York converted to a national charter and changed its name to United States Trust Company, National Association (“USTC-NA”) and merged with U.S. Trust Company, N.A., with USTC-NA as the surviving entity. As of March 31, 2006, the Funds are advised by NYAMD, a separate identifiable division of USTC-NA, or UST Advisers, Inc. (together with NYAMD, the “Advisers”), a wholly-owned subsidiary of USTC-NA. USTC-NA is a wholly-owned subsidiary of US Trust Corporation, a registered bank holding company, which, in turn, is a wholly-owned subsidiary of The Charles Schwab Corporation. For the services provided pursuant to the Investment Advisory Agreements, each Adviser receives a fee, computed daily and paid monthly, as follows:
76
| | | |
Blended Equity Fund | | 0.75 | % |
Energy and Natural Resources Fund | | 0.60 | % |
Equity Core Fund | | 0.75 | % |
Equity Income Fund | | 0.75 | % |
Large Cap Growth Fund | | 0.75 | % |
Mid Cap Value and Restructuring Fund | | 0.65 | % |
Real Estate Fund | | 1.00 | % |
Small Cap Fund | | 0.75 | %* |
Value and Restructuring Fund | | 0.60 | % |
Emerging Markets Fund | | 1.25 | % |
International Fund | | 1.00 | % |
Pacific/Asia Fund | | 1.00 | % |
| * | Effective January 1, 2006, Small Cap Fund changed its advisory fee from 0.60% to 0.75%. |
UST Advisers, Inc. and BISYS Fund Services, Ohio, Inc. (collectively, the “Administrators”) provide administrative services to the Funds. For the services provided to the Funds, the Administrators are entitled jointly to annual fees, computed daily and paid monthly, based on the combined aggregate average daily net assets of Excelsior Fund, Excelsior Tax-Exempt Funds, Inc. (“Excelsior Tax-Exempt Fund”) and the Trust (excluding the international equity portfolios of Excelsior Fund and the Trust), all of which are affiliated investment companies, as follows: 0.200% of the first $200 million, 0.175% of the next $200 million and 0.150% over $400 million. The Administrators are entitled jointly to annual fees, computed daily and paid monthly, at the annual rate of 0.20% of the average daily net assets of the Emerging Markets Funds, International Equity Fund, International Fund and Pacific/Asia Fund. Administration fees payable by each Fund of the Excelsior Fund, the Trust and Excelsior Tax-Exempt Fund are determined in proportion to the relative average daily net assets of the respective Fund for the period paid. For the year ended March 31, 2006, administration fees charged to the Funds were as follows:
| | | |
| | | Administration
Fees
|
Blended Equity Fund | | $ | 705,351 |
Energy and Natural Resources Fund | | | 618,312 |
Equity Core Fund | | | 194,157 |
Equity Income Fund | | | 322,704 |
Large Cap Growth Fund | | | 473,303 |
Mid Cap Value and Restructuring Fund | | | 464,898 |
Real Estate Fund | | | 183,394 |
Small Cap Fund | | | 782,944 |
Value and Restructuring Fund | | | 7,980,571 |
Emerging Markets Fund | | | 1,279,319 |
International Fund | | | 658,314 |
Pacific/Asia Fund | | | 342,434 |
77
From time to time, in its sole discretion, each Adviser may undertake to waive a portion or all of the fees payable to it and may also reimburse the Funds for a portion of other expenses. For the four months ended July 31, 2005 (excluding Equity Income Fund, Large Cap Growth Fund and Small Cap Fund), and the eight months ended March 31, 2006 (excluding Equity Income Fund, Large Cap Growth Fund and Small Cap Fund), the Advisers have contractually agreed to waive investment advisory fees and to reimburse other ordinary operating expenses to the extent necessary to keep total operating expenses from exceeding the following annual percentages of each Fund’s average daily net assets:
| | | | | | |
| | | Four Months
Ended
July 31, 2005
| | | Eight Months
Ended
March 31,
2006
| |
Blended Equity Fund — Shares | | 1.05 | % | | 1.10 | % |
Energy and Natural Resources Fund — Shares | | 1.25 | % | | 1.25 | % |
Equity Core Fund — Shares | | 1.05 | % | | 1.05 | % |
Equity Income Fund — Shares | | 1.05 | %* | | 1.10 | %** |
Large Cap Growth Fund — Shares | | 1.05 | %* | | 1.20 | %** |
Mid Cap Value and Restructuring Fund — Shares | | 1.14 | % | | 1.14 | % |
Real Estate Fund — Shares | | 1.20 | % | | 1.25 | % |
Small Cap Fund — Shares | | 1.05 | %* | | 1.25 | %** |
Value and Restructuring Fund — Shares | | 1.14 | % | | 1.14 | % |
Emerging Markets Fund — Shares | | 1.70 | % | | 1.85 | % |
International Fund — Shares | | 1.50 | % | | 1.50 | % |
Pacific/Asia Fund — Shares | | 1.50 | % | | 1.65 | % |
Equity Core Fund — Institutional Shares | | 0.80 | % | | 0.80 | % |
Mid Cap Value and Restructuring Fund — Institutional Shares | | 0.89 | % | | 0.89 | % |
Value and Restructuring Fund — Institutional Shares | | 0.89 | % | | 0.89 | % |
Emerging Markets Fund — Institutional Shares | | 1.45 | % | | 1.60 | % |
Equity Income Fund — Retirement Shares | | 1.55 | %* | | 1.60 | %** |
Large Cap Growth Fund — Retirement Shares | | 1.55 | %* | | 1.70 | %** |
Mid Cap Value and Restructuring Fund — Retirement Shares | | 1.64 | % | | 1.64 | % |
Small Cap Fund — Retirement Shares | | 1.55 | %* | | 1.75 | %** |
Value and Restructuring Fund — Retirement Shares | | 1.64 | % | | 1.64 | % |
| * | The annual percentages listed above are for the nine months ended December 31, 2005. |
| ** | The annual percentages listed above are for the three months ended March 31, 2006. |
78
For the year ended March 31, 2006, pursuant to the above, investment advisory fees waived by the Advisers were as follows:
| | | | |
Blended Equity Fund | | $ | (570,103 | ) |
Energy and Natural Resources Fund | | | (12,243 | ) |
Equity Core Fund | | | (324,216 | ) |
Equity Income Fund | | | (342,433 | ) |
Large Cap Growth Fund | | | (383,210 | ) |
Mid Cap Value and Restructuring Fund | | | (11,769 | ) |
Real Estate Fund | | | (351,013 | ) |
Small Cap Fund | | | (95,946 | ) |
Value and Restructuring Fund | | | — | |
Emerging Markets Fund | | | (712,659 | ) |
International Fund | | | (276,476 | ) |
Pacific/Asia Fund | | | (62,520 | ) |
The Funds have entered into shareholder servicing agreements with various service organizations, which include Charles Schwab & Co. Inc. (“CS & Co.”) and UST Advisers, Inc. Services included in the servicing agreements are assisting in processing purchase, exchange and redemption requests; transmitting and receiving funds in connection with customer orders to purchase, exchange or redeem shares; and providing periodic statements. Shareholder servicing fees are incurred on a Fund or class level (where applicable). In consideration for these services, each service organization receives a fee from the Funds, computed daily and paid monthly, at an annual rate up to 0.25% of the average daily net assets of the Fund’s shares held by each service organization’s customers. The Advisers, out of their own resources, may additionally compensate certain organizations for providing these and other services.
For the year ended March 31, 2006, shareholder servicing fees paid to CS & Co. and the Advisers were as follows:
| | | |
Blended Equity Fund | | $ | 1,138,625 |
Energy and Natural Resources Fund | | | 534,534 |
Equity Core Fund | | | 189,976 |
Equity Income Fund | | | 566,460 |
Large Cap Growth Fund | | | 780,934 |
Mid Cap Value and Restructuring Fund | | | 516,587 |
Real Estate Fund | | | 262,376 |
Small Cap Fund | | | 1,307,062 |
Value and Restructuring Fund | | | 6,206,822 |
Emerging Markets Fund | | | 947,315 |
International Fund | | | 741,853 |
Pacific/Asia Fund | | | 408,979 |
BISYS Fund Services Limited Partnership (the “Distributor”), serves as the Distributor of the Funds. Shares of each Fund are sold without a sales charge on a continuous basis by the Distributor.
Certain Funds have adopted a Distribution Plan pursuant to Rule 12b-1 under the 1940 Act, under which they may compensate the Distributor monthly for its services that are intended to result in the sale
79
of Fund Shares (in the case of Mid Cap Value and Restructuring Fund) or Retirement Shares (in the case of Equity Income Fund, Large Cap Growth Fund, Mid Cap Value and Restructuring Fund, Small Cap Fund and Value and Restructuring Fund), in an amount not to exceed the annual rate of 0.25% or 0.50%, respectively, of the average daily net asset value of such Fund’s Shares or Retirement Shares. For the year ended March 31, 2006, fees charged for Retirement Shares of the Equity Income Fund, Large Cap Growth Fund, Mid Cap Value and Restructuring Fund, Small Cap Fund and Value and Restructuring Fund were $4, $6, $4, $5 and $874, respectively. There were no charges for the year ended March 31, 2006 for the Fund Shares of the Mid Cap Value and Restructuring Fund.
Each Independent Director/Trustee of the Funds receives a total annual fee of $100,000 paid by the Funds and other affiliated registered investment companies managed by the Advisers. The Chairman of the Board receives an additional $30,000, the Chairman of the Audit Committee receives an additional $15,000, and the Chairman of the Nominating Committee receives an additional $5,000 for serving in those capacities. In addition, Directors and Trustees are reimbursed by Excelsior Fund and the Trust, respectively, for reasonable expenses incurred when acting in their capacity as Directors and Trustees.
3. Purchases, Sales and Maturities of Securities:
For the year ended March 31, 2006, purchases, sales and maturities of securities, excluding short-term investments and written options transactions, for the Funds aggregated:
| | | | | | |
| | | Purchases*
| | Sales and
Maturities*
|
Blended Equity Fund | | $ | 99,991,285 | | $ | 153,572,554 |
Energy and Natural Resources Fund | | | 1,003,100,136 | | | 906,397,364 |
Equity Core Fund | | | 82,796,115 | | | 20,207,291 |
Equity Income Fund | | | 108,605,648 | | | 95,065,360 |
Large Cap Growth Fund | | | 339,168,170 | | | 73,745,338 |
Mid Cap Value and Restructuring Fund | | | 70,799,348 | | | 78,148,689 |
Real Estate Fund | | | 17,258,457 | | | 34,660,214 |
Small Cap Fund | | | 335,812,355 | | | 354,073,150 |
Value and Restructuring Fund | | | 1,502,162,032 | | | 628,388,980 |
Emerging Markets Fund | | | 332,627,110 | | | 41,938,488 |
International Fund | | | 282,471,774 | | | 83,262,367 |
Pacific/Asia Fund | | | 169,471,496 | | | 115,023,886 |
| * | There were no purchases or sales of U.S. government securities during the year ended March 31, 2006. |
4. Federal Taxes:
It is the policy of Excelsior Fund and the Trust that each Fund qualify or continue to qualify as a regulated investment company, by complying with the requirements of the Internal Revenue Code applicable to regulated investment companies, and by distributing substantially all of its taxable earnings to its shareholders.
In order to avoid a federal excise tax, each Fund is required to distribute certain minimum amounts of net realized capital gain and net investment income for the respective twelve-month periods ending October 31 and December 31 each calendar year.
80
Net realized gains of the Funds derived in certain countries are subject to certain foreign taxation.
Dividends and distributions are determined in accordance with federal income tax regulations and may differ from accounting principles generally accepted in the United States of America. These differences are primarily due to differing treatments for net operating losses, foreign currency transactions, passive foreign investment companies, partnership income, deferral of losses on wash sales, dividends received from real estate investment trusts, and net capital losses and net currency losses incurred after October 31 through the end of the fiscal year (“Post-October losses”). To the extent these differences are permanent, adjustments are made to the appropriate equity accounts in the period that these differences arise. Accordingly, the following reclassifications, as of March 31, 2006, were made to/from the following accounts:
| | | | | | | | | | | | |
| | | Undistributed
Net Investment
Income
| | | Accumulated Net Realized Gain (Loss)
| | | Paid-In-Capital
| |
Blended Equity Fund | | $ | (7,684 | ) | | $ | 7,684 | | | | — | |
Energy and Natural Resources Fund | | | 21,733 | | | | (21,733 | ) | | | — | |
Equity Core Fund | | | 1,620 | | | | (1,620 | ) | | | — | |
Equity Income Fund | | | 1,610 | | | | (1,610 | ) | | | — | |
Large Cap Growth Fund | | | 1,492,015 | | | | — | | | $ | (1,492,015 | ) |
Mid Cap Value and Restructuring Fund | | | 23,676 | | | | (737 | ) | | | (22,939 | ) |
Real Estate Fund* | | | 2,148,846 | | | | (5,199,665 | ) | | | 3,050,819 | |
Small Cap Fund | | | 3,315,401 | | | | (3,315,401 | ) | | | — | |
Value and Restructuring Fund | | | 212,778 | | | | (212,779 | ) | | | 1 | |
Emerging Markets Fund | | | (39,141 | ) | | | 434,956 | | | | (395,815 | ) |
International Fund | | | (106,732 | ) | | | 106,732 | | | | — | |
Pacific / Asia Fund | | | 415,223 | | | | (284,502 | ) | | | (130,721 | ) |
| * | The Real Estate Fund has a tax year end of June 30. |
The tax character of dividends and distributions declared during the years ended March 31, 2006 and March 31, 2005 were as follows:
| | | | | | | | | | | | |
| | | Ordinary Income
| | Long-Term
Capital Gain
| | Return
of Capital
| | Total
|
Blended Equity Fund | | | | | | | | | | | | |
Year ended March 31, 2006 | | $ | 6,255,308 | | $ | 28,392,715 | | $ | — | | $ | 34,648,023 |
Year ended March 31, 2005 | | | 4,368,038 | | | 3,153,196 | | | — | | | 7,521,234 |
Energy and Natural Resources Fund | | | | | | | | | | | | |
Year ended March 31, 2006 | | | 44,558,560 | | | 41,586,671 | | | — | | | 86,145,231 |
Year ended March 31, 2005 | | | 465,778 | | | 10,741,372 | | | — | | | 11,207,150 |
Equity Core Fund | | | | | | | | | | | | |
Year ended March 31, 2006 | | | 574,501 | | | — | | | — | | | 574,501 |
Year ended March 31, 2005 | | | 69,065 | | | — | | | — | | | 69,065 |
Equity Income Fund | | | | | | | | | | | | |
Year ended March 31, 2006 | | | 5,332,967 | | | — | | | — | | | 5,332,967 |
Year ended March 31, 2005 | | | 3,360,556 | | | — | | | — | | | 3,360,556 |
81
| | | | | | | | | | | | |
| | | Ordinary Income
| | Long-Term
Capital Gain
| | Return
of Capital
| | Total
|
Large Cap Growth Fund | | | | | | | | | | | | |
Year ended March 31, 2006 | | | — | | | — | | | — | | | — |
Year ended March 31, 2005 | | | — | | | — | | | — | | | — |
Mid Cap Value and Restructuring Fund | | | | | | | | | | | | |
Year ended March 31, 2006 | | $ | 675,482 | | | — | | $ | 22,939 | | $ | 698,421 |
Year ended March 31, 2005 | | | 4,730,945 | | | — | | | — | | | 4,730,945 |
Real Estate Fund | | | | | | | | | | | | |
Year ended March 31, 2006 | | | 1,544,111 | | $ | 9,654,009 | | | 654,882 | | | 11,853,002 |
Year ended March 31, 2005 | | | 3,121,363 | | | 6,178,686 | | | 222,339 | | | 9,522,388 |
Small Cap Fund | | | | | | | | | | | | |
Year ended March 31, 2006 | | | — | | | 26,879,147 | | | — | | | 26,879,147 |
Year ended March 31, 2005 | | | — | | | — | | | — | | | — |
Value and Restructuring Fund | | | | | | | | | | | | |
Year ended March 31, 2006 | | | 52,525,603 | | | — | | | — | | | 52,525,603 |
Year ended March 31, 2005 | | | 31,941,541 | | | — | | | — | | | 31,941,541 |
Emerging Markets Fund | | | | | | | | | | | | |
Year ended March 31, 2006 | | | 5,914,106 | | | — | | | — | | | 5,914,106 |
Year ended March 31, 2005 | | | 3,090,328 | | | 5,577,055 | | | — | | | 8,667,383 |
International Fund | | | | | | | | | | | | |
Year ended March 31, 2006 | | | 2,396,031 | | | — | | | — | | | 2,396,031 |
Year ended March 31, 2005 | | | 29,357 | | | — | | | — | | | 29,357 |
Pacific/Asia Fund | | | | | | | | | | | | |
Year ended March 31, 2006 | | | 1,686,498 | | | — | | | — | | | 1,686,498 |
Year ended March 31, 2005 | | | 112,049 | | | — | | | — | | | 112,049 |
As of March 31, 2006 (except for Real Estate Fund which is as of June 30, 2005), the components of distributable earnings (accumulated losses) on a tax basis were as follows:
| | | | | | | | | | | | | | | | | | | | | |
| | | Undistributed Ordinary Income
| | Undistributed Long-Term Capital Gain
| | Accumulated Capital and Other Losses
| | | Post-
October Losses
| | | Unrealized Appreciation (Depreciation)
| | Total Accumulated Earnings/ (Deficit)
| |
Blended Equity Fund | | $ | 517,913 | | $ | 42,523,788 | | | — | | | $ | (7,684 | ) | | $ | 192,079,292 | | $ | 235,113,309 | |
Energy and Natural Resources Fund | | | 38,422,470 | | | 40,103,169 | | | — | | | | — | | | | 56,346,690 | | | 134,872,329 | |
Equity Core Fund | | | 412,417 | | | — | | $ | (880,333 | ) | | | (1,597,268 | ) | | | 24,280,618 | | | 22,215,434 | |
Equity Income Fund | | | 1,216,345 | | | — | | | (1,951,842 | ) | | | (4,044,151 | ) | | | 24,501,867 | | | 19,722,219 | |
Large Cap Growth Fund | | | — | | | — | | | (135,908,141 | ) | | | — | | | | 86,245,660 | | | (49,662,481 | ) |
Mid Cap Value and Restructuring Fund | | | — | | | — | | | (1,074,502 | ) | | | (894,861 | ) | | | 125,325,684 | | | 123,356,321 | |
Real Estate Fund(1) | | | 434,004 | | | 5,583,041 | | | — | | | | — | | | | 49,710,737 | | | 55,727,782 | |
Small Cap Fund | | | 2,271,022 | | | 17,828,320 | | | — | | | | — | | | | 189,264,390 | | | 209,363,732 | |
Value and Restructuring Fund | | | 21,152,963 | | | — | | | (146,597,297 | ) | | | — | | | | 2,109,206,496 | | | 1,983,762,162 | |
Emerging Markets Fund | | | 1,061,119 | | | 8,501,909 | | | (1,533,451 | ) | | | — | | | | 300,030,575 | | | 308,060,152 | |
International Fund | | | 129,843 | | | — | | | (82,575,691 | ) | | | (40,517 | ) | | | 102,312,213 | | | 19,825,848 | |
Pacific / Asia Fund | | | — | | | — | | | (2,693,463 | ) | | | (63,671 | ) | | | 48,204,693 | | | 45,447,559 | |
| (1) | The components of distributable earnings for the Real Estate Fund are estimated at March 31, 2006. The actual amounts to be distributed will not be determined until June 30, 2006, when the portfolio completes its tax year end. |
82
Post-October losses are deemed to arise on the first business day of a Fund’s next taxable year.
For federal income tax purposes, capital loss carryforwards may be carried forward and applied against future capital gains. To the extent that such carryforwards are utilized, capital gains distributions will be reduced. At March 31, 2006, the following Funds had capital loss carryforwards available to offset future net capital gains through the indicated expiration dates:
| | | | | | | | | | | | | | | | | | | | | |
| | | Expires
| | |
| | | 2008
| | 2010
| | 2011
| | 2012
| | 2013
| | 2014
| | Total
|
Equity Core Fund | | | — | | | — | | | — | | | — | | | — | | $ | 880,333 | | $ | 880,333 |
Equity Income Fund | | | — | | | — | | | — | | | — | | | — | | | 1,951,842 | | | 1,951,842 |
Large Cap Growth Fund | | $ | 5,368,992 | | $ | 24,653,640 | | $ | 83,374,895 | | $ | 22,030,449 | | $ | 480,165 | | | — | | | 135,908,141 |
Mid Cap Value and Restructuring Fund | | | — | | | — | | | 121,536 | | | — | | | — | | | 952,966 | | | 1,074,502 |
Value and Restructuring Fund | | | — | | | — | | | 119,233,763 | | | 27,363,534 | | | — | | | — | | | 146,597,297 |
Emerging Markets Fund | | | — | | | — | | | — | | | 1,496,712 | | | — | | | 36,739 | | | 1,533,451 |
International Fund | | | — | | | — | | | 67,434,508 | | | 15,141,183 | | | — | | | — | | | 82,575,691 |
Pacific/Asia Fund | | | — | | | — | | | 2,693,463 | | | — | | | — | | | — | | | 2,693,463 |
At March 31, 2006, aggregate gross unrealized appreciation for all securities and call options written for which there was an excess of value over estimated tax cost and aggregate gross unrealized depreciation for all securities for which there was an excess of estimated tax cost over value is as follows:
| | | | | | | | | | | | | |
| | | Federal Tax Cost
| | Tax Basis Unrealized Appreciation
| | Tax Basis Unrealized (Depreciation)
| | | Net Unrealized Appreciation
|
Blended Equity Fund | | $ | 275,703,841 | | $ | 194,187,120 | | $ | (2,107,828 | ) | | $ | 192,079,292 |
Energy and Natural Resources Fund | | | 478,622,971 | | | 62,132,714 | | | (5,786,024 | ) | | | 56,346,690 |
Equity Core Fund | | | 163,419,514 | | | 27,349,605 | | | (3,068,877 | ) | | | 24,280,728 |
Equity Income Fund | | | 180,682,714 | | | 26,465,873 | | | (1,964,006 | ) | | | 24,501,867 |
Large Cap Growth Fund | | | 480,566,594 | | | 90,470,304 | | | (4,224,644 | ) | | | 86,245,660 |
Mid Cap Value and Restructuring Fund | | | 214,051,417 | | | 130,538,656 | | | (5,212,972 | ) | | | 125,325,684 |
Real Estate Fund | | | 78,212,462 | | | 49,902,703 | | | (191,966 | ) | | | 49,710,737 |
Small Cap Fund | | | 409,680,710 | | | 190,044,571 | | | (780,181 | ) | | | 189,264,390 |
Value and Restructuring Fund | | | 4,419,326,922 | | | 2,229,321,803 | | | (120,115,302 | ) | | | 2,109,206,501 |
Emerging Markets Fund | | | 703,600,660 | | | 307,839,128 | | | (8,043,539 | ) | | | 299,795,589 |
International Fund | | | 421,873,920 | | | 105,580,817 | | | (3,270,940 | ) | | | 102,309,877 |
Pacific / Asia Fund | | | 192,547,598 | | | 49,935,171 | | | (1,721,124 | ) | | | 48,214,047 |
83
5. Capital Transactions:
Excelsior Fund has authorized capital of 35 billion shares of Common Stock, 29.3756 billion of which is currently classified to represent interests in certain classes of shares. Authorized capital currently offered for each Fund is as follows: 2.25 billion shares of the Blended Equity Fund; 1.5 billion shares of the Value and Restructuring Fund; 1 billion shares each of the Energy and Natural Resources Fund, Large Cap Growth Fund, Small Cap Fund and Pacific/Asia Fund; 875 million shares of the International Fund; and 500 million shares each of Real Estate Fund and Emerging Markets Fund. Each share has a par value of $0.001 and represents an equal proportionate interest in the particular Fund with other shares of the same Fund, and is entitled to such dividends and distributions of taxable earnings on the assets belonging to such Fund as are declared at the discretion of Excelsior Fund’s Board of Directors.
The Trust has authorized an unlimited number of shares of beneficial interest of each class of each Fund. Each share has a par value of $0.00001 and represents an equal proportionate interest in the particular Fund with other shares of the same Fund, and is entitled to such dividends and distributions of taxable earnings on the assets belonging to such Fund as are declared at the discretion of the Trust’s Board of Trustees.
A redemption fee of 2% of the value of the shares redeemed or exchanged is imposed on shares of the Emerging Markets Fund, International Fund and Pacific/Asia Fund redeemed or exchanged 30 days or less after their date of purchase. The redemption fee is intended to limit short-term trading in the Fund.
Capital Share Transactions
| | | | | | | | | | | | | | |
| | | Blended Equity Fund
| |
| | | Year Ended
03/31/06
| | | Year Ended
03/31/05
| |
| | | Shares
| | | Amount
| | | Shares
| | | Amount
| |
Sold: | | | | | | | | | | | | | | |
Shares | | 1,870,587 | | | $ | 68,518,652 | | | 1,453,644 | | | $ | 50,182,768 | |
Issued as reinvestment of dividends: | | | | | | | | | | | | | | |
Shares | | 347,955 | | | | 12,334,603 | | | 54,781 | | | | 1,919,788 | |
Redeemed: | | | | | | | | | | | | | | |
Shares | | (2,792,336 | ) | | | (101,458,144 | ) | | (3,867,630 | ) | | | (133,154,580 | ) |
Redemption in-kind | | — | | | | — | | | (1,753,322 | ) | | | (64,627,441 | ) |
| | |
|
| |
|
|
| |
|
| |
|
|
|
Net Increase (Decrease) | | (573,794 | ) | | $ | (20,604,889 | ) | | (4,112,527 | ) | | $ | (145,679,465 | ) |
| | |
|
| |
|
|
| |
|
| |
|
|
|
84
| | | | | | | | | | | | | | |
| | | Energy and Natural Resources Fund
| |
| | | Year Ended
03/31/06
| | | Year Ended
03/31/05
| |
| | | Shares
| | | Amount
| | | Shares
| | | Amount
| |
Sold: | | | | | | | | | | | | | | |
Shares | | 11,735,419 | | | $ | 298,534,628 | | | 6,720,085 | | | $ | 134,647,171 | |
Issued as reinvestment of dividends: | | | | | | | | | | | | | | |
Shares | | 2,467,953 | | | | 61,748,177 | | | 370,420 | | | | 6,947,444 | |
Redeemed: | | | | | | | | | | | | | | |
Shares | | (7,186,594 | ) | | | (180,363,041 | ) | | (2,879,496 | ) | | | (54,059,904 | ) |
Redemption in-kind | | — | | | | — | | | (249,566 | ) | | | (5,779,941 | ) |
| | |
|
| |
|
|
| |
|
| |
|
|
|
Net Increase (Decrease) | | 7,016,778 | | | $ | 179,919,764 | | | 3,961,443 | | | $ | 81,754,770 | |
| | |
|
| |
|
|
| |
|
| |
|
|
|
| |
| | | Equity Core Fund
| |
| | | Year Ended
03/31/06
| | | Year Ended
03/31/05
| |
| | | Shares
| | | Amount
| | | Shares
| | | Amount
| |
Sold: | | | | | | | | | | | | | | |
Shares | | 7,067,834 | | | $ | 81,801,143 | | | 4,146,420 | | | $ | 43,209,200 | |
Institutional Shares | | 682,540 | | | | 8,048,568 | | | 4,994,257 | | | | 56,502,175 | |
Issued as reinvestment of dividends: | | | | | | | | | | | | | | |
Shares | | 5,937 | | | | 66,688 | | | 2,246 | | | | 23,331 | |
Institutional Shares | | 4,259 | | | | 47,760 | | | — | | | | — | |
Redeemed: | | | | | | | | | | | | | | |
Shares | | (618,831 | ) | | | (7,153,110 | ) | | (179,102 | ) | | | (1,884,818 | ) |
Institutional Shares | | (1,305,561 | ) | | | (14,932,301 | ) | | (93,928 | ) | | | (1,044,842 | ) |
| | |
|
| |
|
|
| |
|
| |
|
|
|
Net Increase (Decrease) | | 5,836,178 | | | $ | 67,878,748 | | | 8,869,893 | | | $ | 96,805,046 | |
| | |
|
| |
|
|
| |
|
| |
|
|
|
| |
| | | Equity Income Fund
| |
| | | Year Ended
03/31/06
| | | Year Ended
03/31/05
| |
| | | Shares
| | | Amount
| | | Shares
| | | Amount
| |
Sold: | | | | | | | | | | | | | | |
Shares | | 8,070,602 | | | $ | 67,137,307 | | | 12,455,777 | | | $ | 99,825,944 | |
Retirement Shares | | — | | | | — | | | 136 | | | | 1,150 | |
Issued as reinvestment of dividends: | | | | | | | | | | | | | | |
Shares | | 115,326 | | | | 946,155 | | | 77,738 | | | | 622,458 | |
Retirement Shares | | 3 | | | | 21 | | | — | | | | — | |
Redeemed: | | | | | | | | | | | | | | |
Shares | | (7,466,868 | ) | | | (62,372,729 | ) | | (2,085,368 | ) | | | (16,772,371 | ) |
Retirement Shares | | (20 | ) | | | (159 | ) | | — | | | | — | |
| | |
|
| |
|
|
| |
|
| |
|
|
|
Net Increase (Decrease) | | 719,043 | | | $ | 5,710,595 | | | 10,448,283 | | | $ | 83,677,181 | |
| | |
|
| |
|
|
| |
|
| |
|
|
|
85
| | | | | | | | | | | | | | |
| | | Large Cap Growth Fund
| |
| | | Year Ended
03/31/06
| | | Year Ended
03/31/05
| |
| | | Shares
| | | Amount
| | | Shares
| | | Amount
| |
Sold: | | | | | | | | | | | | | | |
Shares | | 33,887,361 | | | $ | 319,718,556 | | | 14,085,811 | | | $ | 111,219,637 | |
Retirement Shares | | — | | | | — | | | 142 | | | | 1,150 | |
Issued as reinvestment of dividends: | | | | | | | | | | | | | | |
Shares | | — | | | | — | | | — | | | | — | |
Retirement Shares | | — | | | | — | | | — | | | | — | |
Redeemed: | | | | | | | | | | | | | | |
Shares | | (4,286,908 | ) | | | (38,557,547 | ) | | (4,443,816 | ) | | | (34,760,488 | ) |
Retirement Shares | | (20 | ) | | | (161 | ) | | — | | | | — | |
| | |
|
| |
|
|
| |
|
| |
|
|
|
Net Increase (Decrease) | | 29,600,433 | | | $ | 281,160,848 | | | 9,642,137 | | | $ | 76,460,299 | |
| | |
|
| |
|
|
| |
|
| |
|
|
|
| |
| | | Mid Cap Value and Restructuring Fund
| |
| | | Year Ended
03/31/06
| | | Year Ended
03/31/05
| |
| | | Shares
| | | Amount
| | | Shares
| | | Amount
| |
Sold: | | | | | | | | | | | | | | |
Shares | | 2,206,027 | | | $ | 39,222,163 | | | 4,506,275 | | | $ | 71,247,527 | |
Institutional Shares | | 1,449,107 | | | | 26,024,928 | | | 1,440,444 | | | | 23,328,088 | |
Retirement Shares | | — | | | | — | | | 68 | | | | 1,150 | |
Issued as reinvestment of dividends: | | | | | | | | | | | | | | |
Shares | | 8,110 | | | | 140,000 | | | 65,005 | | | | 1,086,350 | |
Institutional Shares | | 12,203 | | | | 211,487 | | | 40,959 | | | | 681,342 | |
Retirement Shares | | — | | | | — | | | — | | | | — | |
Redeemed: | | | | | | | | | | | | | | |
Shares | | (2,927,490 | ) | | | (51,792,912 | ) | | (3,620,972 | ) | | | (58,289,434 | ) |
Institutional Shares | | (1,134,926 | ) | | | (20,164,758 | ) | | (1,119,376 | ) | | | (18,369,260 | ) |
Retirement Shares | | (10 | ) | | | (162 | ) | | — | | | | — | |
Redemption in-kind | | — | | | | — | | | (1,892,982 | ) | | | (33,430,054 | ) |
| | |
|
| |
|
|
| |
|
| |
|
|
|
Net Increase (Decrease) | | (386,979 | ) | | $ | (6,359,254 | ) | | (580,579 | ) | | $ | (13,744,291 | ) |
| | |
|
| |
|
|
| |
|
| |
|
|
|
| |
| | | Real Estate Fund
| |
| | | Year Ended
03/31/06
| | | Year Ended
03/31/05
| |
| | | Shares
| | | Amount
| | | Shares
| | | Amount
| |
Sold: | | | | | | | | | | | | | | |
Shares | | 2,543,667 | | | $ | 26,383,102 | | | 4,646,651 | | | $ | 42,090,605 | |
Issued as reinvestment of dividends: | | | | | | | | | | | | | | |
Shares | | 503,603 | | | | 5,093,280 | | | 327,236 | | | | 2,958,693 | |
Redeemed: | | | | | | | | | | | | | | |
Shares | | (4,046,632 | ) | | | (41,844,650 | ) | | (5,186,990 | ) | | | (46,102,897 | ) |
Redemption in-kind | | — | | | | — | | | (1,048,440 | ) | | | (10,264,224 | ) |
| | |
|
| |
|
|
| |
|
| |
|
|
|
Net Increase (Decrease) | | (999,362 | ) | | $ | (10,368,268 | ) | | (1,261,543 | ) | | $ | (11,317,823 | ) |
| | |
|
| |
|
|
| |
|
| |
|
|
|
86
| | | | | | | | | | | | | | |
| | | Small Cap Fund
| |
| | | Year Ended
03/31/06
| | | Year Ended
03/31/05
| |
| | | Shares
| | | Amount
| | | Shares
| | | Amount
| |
Sold: | | | | | | | | | | | | | | |
Shares | | 7,764,353 | | | $ | 131,311,856 | | | 15,104,853 | | | $ | 235,106,641 | |
Retirement Shares | | — | | | | — | | | 70 | | | | 1,150 | |
Issued as reinvestment of dividends: | | | | | | | | | | | | | | |
Shares | | 431,637 | | | | 7,363,728 | | | — | | | | — | |
Retirement Shares | | 3 | | | | 53 | | | — | | | | — | |
Redeemed: | | | | | | | | | | | | | | |
Shares | | (7,277,592 | ) | | | (122,756,430 | ) | | (7,918,805 | ) | | | (124,749,437 | ) |
Retirement Shares | | (10 | ) | | | (153 | ) | | — | | | | — | |
Redemption in-kind | | — | | | | — | | | (1,099,692 | ) | | | (18,595,792 | ) |
| | |
|
| |
|
|
| |
|
| |
|
|
|
Net Increase (Decrease) | | 918,391 | | | $ | 15,919,054 | | | 6,086,426 | | | $ | 91,762,562 | |
| | |
|
| |
|
|
| |
|
| |
|
|
|
| |
| | | Value and Restructuring Fund
| |
| | | Year Ended
03/31/06
| | | Year Ended
03/31/05
| |
| | | Shares
| | | Amount
| | | Shares
| | | Amount
| |
Sold: | | | | | | | | | | | | | | |
Shares | | 42,481,646 | | | $ | 1,944,842,088 | | | 39,449,835 | | | $ | 1,550,480,361 | |
Institutional Shares | | 1,588,442 | | | | 71,855,109 | | | 3,740,751 | | | | 154,963,204 | |
Retirement Shares | | 18,213 | | | | 867,236 | | | 103 | | | | 4,238 | |
Issued as reinvestment of dividends: | | | | | | | | | | | | | | |
Shares | | 922,183 | | | | 40,504,847 | | | 647,698 | | | | 24,887,348 | |
Institutional Shares | | 45,241 | | | | 1,988,952 | | | 3,356 | | | | 131,791 | |
Retirement Shares | | 26 | | | | 1,182 | | | — | | | | — | |
Redeemed: | | | | | | | | | | | | | | |
Shares | | (25,114,636 | ) | | | (1,109,338,591 | ) | | (18,527,714 | ) | | | (724,974,993 | ) |
Institutional Shares | | (450,627 | ) | | | (20,187,467 | ) | | (873,380 | ) | | | (36,474,886 | ) |
Retirement Shares | | (115 | ) | | | (5,554 | ) | | (75 | ) | | | (3,149 | ) |
| | |
|
| |
|
|
| |
|
| |
|
|
|
Net Increase (Decrease) | | 19,490,373 | | | $ | 930,527,802 | | | 24,440,574 | | | $ | 969,013,914 | |
| | |
|
| |
|
|
| |
|
| |
|
|
|
87
| | | | | | | | | | | | | | |
| | | Emerging Markets Fund
| |
| | | Year Ended
03/31/06
| | | Year Ended
03/31/05
| |
| | | Shares
| | | Amount
| | | Shares
| | | Amount
| |
Sold: | | | | | | | | | | | | | | |
Shares | | 42,050,024 | | | $ | 456,622,978 | | | 37,020,633 | | | $ | 308,671,668 | |
Institutional Shares | | 2,017,803 | | | | 17,803,340 | | | 57 | | | | 500 | |
Issued as reinvestment of dividends: | | | | | | | | | | | | | | |
Shares | | 386,361 | | | | 3,758,608 | | | 627,999 | | | | 5,340,759 | |
Institutional Shares | | 232 | | | | 2,572 | | | — | | | | — | |
Redeemed: | | | | | | | | | | | | | | |
Shares | | (12,959,098 | ) | | | (132,393,423 | ) | | (15,283,468 | ) | | | (117,126,423 | ) |
Institutional Shares | | (1,171 | ) | | | (11,586 | ) | | — | | | | — | |
Redemption fee | | — | | | | 3,940 | | | — | | | | 76,701 | |
| | |
|
| |
|
|
| |
|
| |
|
|
|
Net Increase (Decrease) | | 31,494,151 | | | $ | 345,786,429 | | | 22,365,221 | | | $ | 196,963,205 | |
| | |
|
| |
|
|
| |
|
| |
|
|
|
| |
| | | International Fund
| |
| | | Year Ended
03/31/06
| | | Year Ended
03/31/05
| |
| | | Shares
| | | Amount
| | | Shares
| | | Amount
| |
Sold: | | | | | | | | | | | | | | |
Shares | | 18,984,322 | | | $ | 280,689,209 | | | 11,128,396 | | | $ | 135,738,549 | |
Issued as reinvestment of dividends: | | | | | | | | | | | | | | |
Shares | | 55,479 | | | | 722,890 | | | 540 | | | | 5,983 | |
Issued in connection with merger | | — | | | | — | | | 2,194,980 | | | | 22,740,352 | |
Redeemed: | | | | | | | | | | | | | | |
Shares | | (5,816,678 | ) | | | (82,366,546 | ) | | (6,452,142 | ) | | | (78,715,450 | ) |
Redemption fee | | — | | | | 14,016 | | | — | | | | 11,008 | |
| | |
|
| |
|
|
| |
|
| |
|
|
|
Net Increase (Decrease) | | 13,223,123 | | | $ | 199,059,569 | | | 6,871,774 | | | $ | 79,780,442 | |
| | |
|
| |
|
|
| |
|
| |
|
|
|
| |
| | | Pacific/Asia Fund
| |
| | | Year Ended
03/31/06
| | | Year Ended
03/31/05
| |
| | | Shares
| | | Amount
| | | Shares
| | | Amount
| |
Sold: | | | | | | | | | | | | | | |
Shares | | 9,073,692 | | | $ | 91,473,426 | | | 6,880,415 | | | $ | 57,331,130 | |
Issued as reinvestment of dividends: | | | | | | | | | | | | | | |
Shares | | 64,603 | | | | 565,926 | | | 3,310 | | | | 26,777 | |
Redeemed: | | | | | | | | | | | | | | |
Shares | | (3,276,867 | ) | | | (32,167,866 | ) | | (5,346,261 | ) | | | (43,870,251 | ) |
Redemption fee | | — | | | | 2,893 | | | — | | | | 8,645 | |
| | |
|
| |
|
|
| |
|
| |
|
|
|
Net Increase (Decrease) | | 5,861,428 | | | $ | 59,874,379 | | | 1,537,464 | | | $ | 13,496,301 | |
| | |
|
| |
|
|
| |
|
| |
|
|
|
6. Guarantees:
In the normal course of business, the Funds enter into contracts that provide general indemnifications. The Funds’ maximum exposure under these arrangements is dependent on future
88
claims that may be made against the Funds and, therefore, cannot be established; however, based on experience, the risk of loss from such claims is considered remote.
7. Legal Proceedings:
The Adviser and Excelsior Funds, Inc., Excelsior Tax-Exempt Funds, Inc., and Excelsior Funds Trust (the “Companies”) were contacted in September, 2003 by the Office of the New York State Attorney General (the “NYAG”), and the Adviser was contacted by the Securities and Exchange Commission (the “SEC”) and later by the Attorney General of the State of West Virginia, in connection with their investigations of practices in the mutual fund industry identified as “market timing” and “late trading” of mutual fund shares (the “Investigations”). The Adviser and the Companies have provided full cooperation with respect to these Investigations and continue to review the facts and circumstances relevant to the Investigations. As disclosed previously by the Adviser and its affiliates, with respect to the Adviser, these investigations have been focusing on circumstances in which a small number of parties were permitted to engage in short-term trading of shares of certain of the Excelsior Funds. The short-term trading activities permitted under these arrangements have been terminated and the Adviser has strengthened its policies and procedures to deter frequent trading of shares of the Excelsior Funds.
The Adviser, certain of its affiliates, the Companies and others have also been named in several class action and derivative lawsuits which allege that the Adviser, certain of its affiliates, the Companies and others allowed certain parties to engage in illegal and improper mutual fund trading practices, which allegedly caused financial injury to the shareholders of certain of the Excelsior Funds managed by the Adviser. Each seeks unspecified monetary damages and related equitable relief.
The class and derivative actions described above have been transferred to the United States District Court for the District of Maryland for coordinated and consolidated pre-trial proceedings. In November 2005, the Maryland court dismissed many of the plaintiffs’ claims in both the investor class action and the derivative lawsuits. Plaintiffs’ claims under Sections 10(b) and 20(a) of the Securities Exchange Act and under Section 36(b) and 48(a) of the Investment Company Act, however, have not been dismissed. Discovery has commenced with respect to plaintiffs’ remaining claims.
While the ultimate outcome of these matters cannot be predicted with any certainty at this time, based on currently available information and consultation with counsel, the Adviser believes that the resolution of the pending Investigations and private lawsuits will not have a material adverse financial impact on the Companies, and further believes that the pending Investigations and private lawsuits are not likely to materially affect the Adviser’s ability to provide investment management services to the Companies.
8. Other Federal Tax Information (Unaudited):
For corporate shareholders, the following percentage of the total ordinary income distributions paid during the fiscal year ended March 31, 2006, qualify for the corporate dividends received deduction for the following Funds:
| | | |
Fund
| | Percentage
| |
Blended Equity Fund | | 100.00 | % |
Energy and Natural Resources Fund | | 8.57 | % |
Equity Core Fund | | 70.87 | % |
Equity Income Fund | | 100.00 | % |
Mid Cap Value and Restructuring Fund | | 96.25 | % |
Value and Restructuring Fund | | 100.00 | % |
Pacific/Asia Fund | | 0.49 | % |
89
For the year ended March 31, 2006, the following Funds paid qualified dividend income for purposes of reduced individual federal income tax rates of:
| | | |
Fund
| | Percentage
| |
Blended Equity Fund | | 100.00 | % |
Energy and Natural Resources Fund | | 8.24 | % |
Equity Core Fund | | 100.00 | % |
Equity Income Fund | | 100.00 | % |
Mid Cap Value and Restructuring Fund | | 96.20 | % |
Value and Restructuring Fund | | 100.00 | % |
Emerging Markets Fund | | 100.00 | % |
International Fund | | 100.00 | % |
Pacific/Asia Fund | | 46.36 | % |
9. Special Meeting of Shareholders (Unaudited)
A special meeting of the shareholders of the Excelsior Small Cap Fund was held on November 17, 2005. At the meeting shareholders voted and approved the following proposals:
Proposal 1: To approve an amendment to the Investment Advisory Agreement to increase the Advisory Fee payable by the Fund.
| | | | | | | | |
| | | # of Shares
| | % of Outstanding Shares
| | | % of Shares Voted
| |
Affirmative | | 18,091,185.598 | | 59.300 | % | | 94.032 | % |
Against | | 977,482.820 | | 3.204 | % | | 5.081 | % |
Abstain | | 170,690.817 | | 0.559 | % | | 0.887 | % |
| | |
| |
|
| |
|
|
Total | | 19,239,359.235 | | 63.063 | % | | 100.000 | % |
| | |
| |
|
| |
|
|
Proposal 2: To approve a change in the investment objective of the Fund.
| | | | | | | | |
| | | # of Shares
| | % of Outstanding Shares
| | | % of Shares Voted
| |
Affirmative | | 18,465,354.384 | | 60.526 | % | | 95.977 | % |
Against | | 582,211.624 | | 1.909 | % | | 3.026 | % |
Abstain | | 191,793.227 | | 0.628 | % | | 0.997 | % |
| | |
| |
|
| |
|
|
Total | | 19,239,359.235 | | 63.063 | % | | 100.000 | % |
| | |
| |
|
| |
|
|
90
REPORT OF INDEPENDENT REGISTERED PUBLIC ACCOUNTING FIRM
To the Board of Directors/Trustees and Shareholders of
Excelsior Funds, Inc. and Excelsior Funds Trust
We have audited the accompanying statements of assets and liabilities, including the portfolios of investments, of the Blended Equity Fund, Large Cap Growth Fund, Small Cap Fund, Value and Restructuring Fund, Mid Cap Value and Restructuring Fund (formerly, Mid Cap Value Fund), Energy and Natural Resources Fund, Real Estate Fund, Equity Core Fund, Equity Income Fund, International Fund, Pacific/Asia Fund, and Emerging Markets Fund (nine of the portfolios constituting the Excelsior Funds, Inc. and three of the portfolios constituting the Excelsior Funds Trust) (collectively, the “Funds”) as of March 31, 2006, and the related statements of operations for the year then ended, the statements of changes in net assets for each of the two years in the period then ended, and the financial highlights (Shares) for each of the three years in the period then ended. These financial statements and financial highlights are the responsibility of the Funds’ management. Our responsibility is to express an opinion on these financial statements and financial highlights based on our audits. The financial highlights for each of the years in the two year period ended March 31, 2003 were audited by other auditors whose reports dated May 16, 2003, expressed an unqualified opinion on those financial highlights.
We conducted our audits in accordance with the standards of the Public Company Accounting Oversight Board (United States). Those standards require that we plan and perform the audit to obtain reasonable assurance about whether the financial statements and financial highlights are free of material misstatement. The Funds are not required to have, nor were we engaged to perform, an audit of their internal control over financial reporting. Our audits included consideration of internal control over financial reporting as a basis for designing audit procedures that are appropriate in the circumstances, but not for the purpose of expressing an opinion on the effectiveness of the Funds’ internal control over financial reporting. Accordingly, we express no such opinion. An audit also includes examining, on a test basis, evidence supporting the amounts and disclosures in the financial statements, assessing the accounting principles used and significant estimates made by management, as well as evaluating the overall financial statement presentation. Our procedures included confirmation of securities owned as of March 31, 2006, by correspondence with the custodian and brokers; where replies were not received from brokers, we performed other auditing procedures. We believe that our audits provide a reasonable basis for our opinion.
In our opinion, the financial statements and financial highlights referred to above present fairly, in all material respects, the financial position of Blended Equity Fund, Large Cap Growth Fund, Small Cap Fund, Value and Restructuring Fund, Mid Cap Value and Restructuring Fund, Energy and Natural Resources Fund, Real Estate Fund, Equity Core Fund, Equity Income Fund, International Fund, Pacific/Asia Fund, and Emerging Markets Fund as of March 31, 2006, the results of their operations for the year then ended, the changes in their net assets for each of the two years in the period then ended, and the financial highlights for each of the three years in the period then ended, in conformity with accounting principles generally accepted in the United States of America.
DELOITTE & TOUCHE LLP
New York, New York
May 22, 2006
91
Directors/Trustees and Officers of the Excelsior Funds Complex (Unaudited)
Information pertaining to the Directors/Trustees and Officers of Excelsior Fund, Excelsior Tax-Exempt Fund and Excelsior Funds Trust (each a “Company” and collectively, the “Excelsior Funds Complex”) is set forth below. Directors/Trustees who are not deemed to be “interested persons” of the Excelsior Funds Complex as defined in the 1940 Act are referred to as “Independent Board Members.” Directors/Trustees who are deemed to be “interested persons” of the Excelsior Funds Complex are referred to as “Interested Board Members”. The following information is as of May 20, 2006.
On February 24, 2006, the Boards of Directors/Trustees (the “Boards”) of the Companies approved an increase in the size of the Boards to ten (10) directors/trustees (together, the “Directors”) and approved the nomination of Mariann Byerwalter, Nils Hakansson, William A. Hasler and Randall W. Merk (the “Candidates”) as Directors of the Companies, subject to shareholder approval at an upcoming Special Meeting of Shareholders of the Companies (the “Meeting”). Each of the Candidates is currently a director/trustee of the Laudus Funds, the Laudus Variable Insurance Trust (together, the “Laudus”) and of other funds included in the Schwab mutual fund complex for which Charles Schwab Investment Management acts as investment adviser (together, the “Fund Complex”). The Companies are in the same Fund Complex as the Laudus Funds. If approved by Shareholders at the Meeting, Ms. Byerwalter and Messrs. Hakansson and Hasler would become disinterested persons of the Companies under the Investment Company Act of 1940, as amended. Mr. Merk would become an interested person of the Companies.
The Boards also approved the nominations of six existing Directors to be submitted to shareholder for approval at the Meeting: Messrs. Bailey, Collins, Drake, Hall, Lynch and Piel (the “Existing Directors” and, together with the Candidates, the “Nominees”). Frederick S. Wonham, a current Director of the Companies and Chairman of the Board of each company, has notified the Boards, that he intends to resign from the Boards, consistent with the Companies’ retirement age policy, effective as of the date of the Meeting. The Boards have elected Rodman Drake, currently a Director of the Companies and Chairman of their Joint Audit Committee, as the Chairman of the Boards of the Companies effective upon Mr. Wonham’s resignation.
The Boards have proposed to increase the size of each Board from seven to ten so that a single group of Directors (i.e., a unitary board) can oversee each of the Companies and the Laudus Funds. At a meeting held on March 16, 2006, the Laudus Funds’ Boards approved the nominations of the Existing Directors for election to the Laudus Funds’ Boards, subject to approval by shareholders of each of the Laudus Funds. Each of the Candidates has notified the Boards that, even if approved by the Companies’ shareholders at the Meeting, the Candidates will not serve as members of the Boards unless the shareholders of each of the Companies and the Laudus Funds approve the election of each of the other Nominees. Similarly, each of the existing Directors has informed the Laudus Funds Boards that, even if approved by shareholders of the Laudus Funds at their shareholders meeting, the Existing Directors will not serve as members of the Laudus Funds Boards unless the shareholders of each of the Companies and the Laudus Funds approve the election of each of the other Nominees.
92
| | | | | | |
Name and Address(1) Age Time Served with the Excelsior Funds Complex
| | Principal Occupation
During the Past Five Years
| | Number of
Portfolios in Fund Complex Overseen by Director/Trustee(3)
| | Other Directorships Held by Director/Trustee(4)
|
DIRECTORS/TRUSTEES(2) INDEPENDENT BOARD MEMBERS | | | | |
Frederick S. Wonham
Age: 75
Since 1997 | | Retired. Chairman of the Boards and Director (since 1997) and President and Treasurer (from 1995 to February 2002) of Excelsior Funds, Inc. and Excelsior Tax-Exempt Funds, Inc.; Chairman of the Board and Trustee (since 1997) and President and Treasurer (from 1995 to February 2002) of Excelsior Funds Trust. | | 29 | | None. |
| | | |
Rodman L. Drake
Age: 63
Since 1994 | | Director and Chairman of Audit Committee of Excelsior Funds, Inc. and Excelsior Tax-Exempt Funds, Inc. (since 1996); Trustee of Excelsior Funds Trust (since 1994); Co-Founder of Baringo Capital LLC (since 2002); President, Continuation Investments Group, Inc. (from 1997 to 2001). | | 29 | | Director and Chairman, Hyperion Total Return Fund, Inc., and Hyperion Strategic Mortgage Fund Inc. (since 1991); Director, Jackson Hewitt Tax Services, Inc. (since June 2004); Director, Student Loan Corporation (since May 2005). |
| | | |
Morrill Melton ("Mel") Hall, Jr.
Age: 61
Since 2000 | | Director of Excelsior Funds, Inc. and Excelsior Tax-Exempt Funds, Inc. (since 2000); Trustee of Excelsior Funds Trust (since 2000); Chairman (since 1984) and Chief Executive Officer (since 1991), Comprehensive Health Services, Inc. (health care management and administration). | | 29 | | None. |
| | | |
Roger M. Lynch
Age: 64
Since 2001 | | Retired. Director of Excelsior Funds, Inc. and Excelsior Tax- Exempt Funds, Inc. and Trustee of Excelsior Funds Trust (since 2001); President, Corporate Asset Funding Co., Inc. (asset securitization) (from 1987 to 1999); Limited Partner (from 1986 to 1999), Goldman Sachs & Co. | | 29 | | None. |
| | | |
Jonathan Piel
Age: 67
Since 1994 | | Director and Chairman of Nominating Committee Excelsior Funds, Inc. and Excelsior Tax-Exempt Funds, Inc. (since 1996); Trustee, Excelsior Funds Trust (since 1994); Cable Television producer and website designer. The Editor Scientific American (from 1984 to 1986), and Vice President, Scientific American, Inc. (from 1986 to 1994); Director, National Institute of Social Sciences; member, Advisory Board, The Stone Age Institute. Bloomington Indiana. | | 29 | | None. |
93
| | | | | | |
Name and Address(1) Age Time Served with the Excelsior Funds Complex
| | Principal Occupation
During the Past Five Years
| | Number of
Portfolios in Fund Complex Overseen by Director/Trustee(3)
| | Other Directorships Held by Director/Trustee(4)
|
John. D. Collins
Age: 67
Since 2005 | | Retired. Director, Excelsior Funds, Inc. and Excelsior Tax-Exempt Funds, Inc. (since 2005); Trustee, Excelsior Funds Trust (since 2005). Consultant, KPMG, LLP (from July 1999 to June 2000); Partner, KPMG, LLP (from March 1962 to June 1999). | | 29 | | Director, Mrs. Fields’ Famous Brands LLC (consumer products) (since December 2004). |
| INTERESTED BOARD MEMBER(5) | | | | |
James L. Bailey
114 West 47th Street
New York, NY 10036
Age: 60
Since 2004 | | Chief Operating Officer of U.S. Trust Corporation (since December 2004) and Executive Vice President of U.S. Trust Corporation and United States Trust Company of New York (since 2003); President, Excelsior Funds, Inc., Excelsior Tax-Exempt Funds, Inc. and Excelsior Funds Trust (from 2003 to July 2004); Consultant in the financial services industry (from August 2000 to January 2003); Executive Vice President of Citicorp (from 1992 to August 2000). | | 29 | | None. |
| OFFICERS | | | | | | |
Joseph Trainer; CFA
Age: 44
114 West 47th Street New York, NY 10036 | | Managing Director of United States Trust Company of New York (since 2003) and President, U.S. Trust Institutional; President of MFS Institutional Advisors (from 1998 to 2002). | | N/A | | N/A |
| | | |
George Pereira
Age: 42
101 Montgomery St.
San Francisco, CA 94104 | | Senior Vice President and Chief Financial Officer, Charles Schwab Investment Management, Inc.; Director, Charles Schwab Asset Management (Ireland) Limited. From December 1999 to November 2004, Sr. Vice President, Financial Reporting, Charles Schwab & Co., Inc. From September 1999 to December 1999, Chief Financial Officer, Commerzbank Capital Markets. Prior to September 1999, Managing Director at the New York Stock Exchange. | | N/A | | N/A |
| | | |
Stefanie A. Firtell
Age: 32
114 West 47th Street
New York, NY 10036 | | Vice President, United States Trust Company of New York (since April 2005); Compliance Officer and Head of Regulatory Responses, Assistant Vice President, Deutsche Asset Management (from 2003 to 2005); Assistant Corporate Secretary, Triare Companies, Inc. (from 2002 to 2003); Attorney, Paul, Weiss, Rifkind, Wharton & Garrison (from 2001 to 2002); and Attorney, Cadwalder Wickersham & Taft (from 2000 to 2001). | | N/A | | N/A |
94
| | | | | | |
Name and Address(1) Age Time Served with the Excelsior Funds Complex
| | Principal Occupation
During the Past Five Years
| | Number of
Portfolios in Fund Complex Overseen by Director/Trustee(3)
| | Other Directorships Held by Director/Trustee(4)
|
Wyndham Clark
Age: 47
225 High Ridge Road
Stamford, CT 06905 | | Vice President and AML officer, U.S. Trust Company, N.A. (since 2003); Vice President and Deputy Director Risk Management. IBJ Whitehall (banking) (from 2001 to 2002); and Vice President and Chief Risk Officer, EMAC, LLC (commercial leader, asset backed security issuer) (from 1999 to 2001). | | N/A | | N/A |
| | | |
Petros (Peter) L. Tsirigotis
Age: 37
114 West 47th Street
New York, NY 10036 | | Senior Vice President and Assistant General Counsel, U.S. Trust (since September 2005); Vice President and Corporate Counsel, Prudential Financial (September 2004 to September 2005); Associate, Schulte Roth and Zabel LLP (November 2002 to September 2004) and Dechert LLP (August 2000 to November 2002). Prior to August 2000, Mr. Tsirigotis was an Attorney/Advisor (Division of Investment Management) and Financial Economist (Office of Economic Analysis) with the Securities and Exchange Commission in Washington, D.C. | | N/A | | N/A |
| (1) | Each independent director/trustee may be contacted by writing to Excelsior Funds, 225 High Ridge Road, Stamford, CT 06905. |
| (2) | Each director/trustee shall hold office until the election and qualification of his or her successor, or until he or she sooner dies, resigns or is removed. The officers of each Company shall hold office for a one year term and until their respective successors are chosen and qualified, or in each case until he or she sooner dies, resigns, is removed, or becomes disqualified in accordance with each Company’s by-laws. |
| (3) | The Excelsior Funds Complex consists of all registered investment companies (Excelsior Funds Inc., Excelsior Tax-Exempt Funds, Inc. and Excelsior Funds Trust) for which U.S. Trust serves as investment adviser. As of May 20, 2006, the Excelsior Funds Complex consisted of 29 Funds. |
| (4) | Directorships of companies required to report to the Securities and Exchange Commission under the Securities Exchange Act of 1934 (i.e., “public companies”) or other investment companies registered under the 1940 Act. |
| (5) | “Interested person” of the Company is defined in the 1940 Act. Mr. Bailey is considered an “interested person” because of his affiliation with the Adviser. |
For more information regarding the Directors/Trustees and Officers, please refer to the Statement of Additional Information, which is available upon request by calling 1-800-446-1012.
95
DISCLOSURE OF FUND EXPENSES (Unaudited)
We believe it is important for you to understand the impact of fees regarding your investment. As a shareholder of the fund, you incur ongoing, or operating costs, which include costs for portfolio management, administrative services, and shareholder reports (like this one), among others. Operating expenses, which are deducted from a fund’s gross income, directly reduce the investment return of the fund. A fund’s expenses are expressed as a percentage of its average net assets. This figure is known as the expense ratio. The following examples are intended to help you understand the ongoing costs (in dollars) of investing in your fund and to compare these costs with those of other mutual funds. The examples are based on an investment of $1,000 made at the beginning of the period shown and held for the entire period.
The table on the following page illustrates your fund’s costs in two ways.
| | · | Actual expenses. This section provides information about actual account values and actual expenses based on the Funds’ actual return for the period. This section is designed to help you to estimate the actual expenses after fee waivers that you paid over the period. The “Ending Account Value” shown is derived from the fund’s actual return, and the fourth column shows the dollar amount that would have been paid by an investor who started with $1,000 in the fund. You may use the information here, together with the amount you invested, to estimate the expenses that you paid over the period. |
To do so, simply divide your account value by $1,000 (for example, an $8,600 account value divided by $1,000 = $8.6), then multiply the result by the number given for your fund under the heading “Expenses Paid During Period”.
| | · | Hypothetical expenses. This section provides information about hypothetical account values and hypothetical expenses that would have been incurred by an investor in the Fund based on an assumed rate of return of 5% per year before expenses. This section is designed to help you compare your fund’s costs with those of other mutual funds. It assumes that the fund had a return of 5% before expenses during the year, but that the expense ratio is unchanged. In this case, because the return used is not the fund’s actual return, the results cannot be used to estimate the actual ending account balance or expenses you paid for the period. You may use this information to compare the ongoing costs of investing in your Fund and other funds. To do so, compare this 5% hypothetical example with the 5% hypothetical examples that appear in shareholder reports of other funds. |
96
DISCLOSURE OF FUND EXPENSES (Unaudited) (Continued)
Please note that the expenses shown in the table are meant to highlight and help you compare ongoing costs only, which are described in the Prospectus. Therefore, the hypothetical example is useful in comparing ongoing costs only, and will not help you determine the relative total costs of owning different funds.
| | | | | | | | | | | | |
| | | Beginning
Account
Value
10/01/2005
| | Ending
Account
Value
03/31/2006
| | Annualized
Expense
Ratios*
| | | Expenses
Paid
During
Period**
|
Actual Fund Return | | | | | | | | | | | | |
Blended Equity Fund — Shares | | $ | 1,000.00 | | $ | 1,075.50 | | 1.10 | % | | $ | 5.69 |
Energy and Natural Resources Fund — Shares | | | 1,000.00 | | | 1,070.70 | | 1.14 | | | | 5.89 |
Equity Core Fund — Shares | | | 1,000.00 | | | 1,107.50 | | 1.05 | | | | 5.52 |
Equity Income Fund — Shares | | | 1,000.00 | | | 1,045.40 | | 1.07 | | | | 5.46 |
Large Cap Growth Fund — Shares | | | 1,000.00 | | | 1,102.30 | | 1.14 | | | | 5.98 |
Mid Cap Value and Restructuring Fund — Shares | | | 1,000.00 | | | 1,103.50 | | 1.12 | | | | 5.87 |
Real Estate Fund — Shares | | | 1,000.00 | | | 1,156.90 | | 1.25 | | | | 6.72 |
Small Cap Fund — Shares | | | 1,000.00 | | | 1,160.90 | | 1.13 | | | | 6.09 |
Value and Restructuring Fund — Shares | | | 1,000.00 | | | 1,074.10 | | 1.05 | | | | 5.43 |
Emerging Markets Fund — Shares | | | 1,000.00 | | | 1,211.20 | | 1.85 | | | | 10.20 |
International Fund — Shares | | | 1,000.00 | | | 1,143.40 | | 1.50 | | | | 8.02 |
Pacific / Asia Fund — Shares | | | 1,000.00 | | | 1,179.90 | | 1.62 | | | | 8.80 |
| | | | |
Hypothetical 5% Return | | | | | | | | | | | | |
Blended Equity Fund — Shares | | | 1,000.00 | | | 1,019.45 | | 1.10 | | | | 5.54 |
Energy and Natural Resources Fund — Shares | | | 1,000.00 | | | 1,019.25 | | 1.14 | | | | 5.74 |
Equity Core Fund — Shares | | | 1,000.00 | | | 1,019.70 | | 1.05 | | | | 5.29 |
Equity Income Fund — Shares | | | 1,000.00 | | | 1,019.60 | | 1.07 | | | | 5.39 |
Large Cap Growth Fund — Shares | | | 1,000.00 | | | 1,019.25 | | 1.14 | | | | 5.74 |
Mid Cap Value and Restructuring Fund — Shares | | | 1,000.00 | | | 1,019.35 | | 1.12 | | | | 5.64 |
Real Estate Fund — Shares | | | 1,000.00 | | | 1,018.70 | | 1.25 | | | | 6.29 |
Small Cap Fund — Shares | | | 1,000.00 | | | 1,019.30 | | 1.13 | | | | 5.69 |
Value and Restructuring Fund — Shares | | | 1,000.00 | | | 1,019.70 | | 1.05 | | | | 5.29 |
Emerging Markets Fund — Shares | | | 1,000.00 | | | 1,015.71 | | 1.85 | | | | 9.30 |
International Fund — Shares | | | 1,000.00 | | | 1,017.45 | | 1.50 | | | | 7.54 |
Pacific / Asia Fund — Shares | | | 1,000.00 | | | 1,016.85 | | 1.62 | | | | 8.15 |
| * | Annualized expense ratios of certain funds are after fee waivers and expense reimbursements by the investment adviser. Absent such waivers and reimbursements, expenses paid during the period would have been greater. |
| ** | Expenses are equal to the Fund’s annualized expense ratio multiplied by the average account value over the period, multiplied by the number of days in the most recent fiscal half-year (182) then divided by 365. |
97
AR-EQUITIES-0306

FIXED INCOMEFUNDS
ANNUAL REPORT
March 31, 2006
TABLE OF CONTENTS
For shareholder account information, current price and yield quotations, or to make an initial purchase or obtain a prospectus, call 1-800-446-1012, from overseas, call 617-483-7297.
| · | Internet Address: http://www.excelsiorfunds.com |
This report must be preceded or accompanied by a current prospectus.
A description of the policies and procedures that Excelsior Funds use to determine how to vote proxies relating to portfolio securities, as well as information relating to how a Fund voted proxies relating to portfolio securities during the most recent 12-month period ended June 30, is available (i) without charge, upon request, by calling 1-800-446-1012, or (ii) by accessing the Excelsior Funds’ internet address and (iii) on the Commission’s website at http://www.sec.gov.
Excelsior Funds file their June 30 and December 31 schedule of portfolio holdings with the Securities and Exchange Commission, on Form N-Q, within sixty days after the applicable reporting period. Excelsior Funds Form N-Q is available on the Commission’s website at http://www.sec.gov, and may be reviewed and copied at the Commission’s Public Reference Room in Washington, DC. Information on the operation of the Public Reference Room may be obtained by calling 1-800-SEC-0330.
A schedule of each Fund’s portfolio holdings, as of the end of the prior month, is also available on the Funds’ website. This schedule is updated monthly, typically by the 15th calendar day, after the end of each month. The Funds may terminate or modify this policy at anytime.
You should consider the Funds’ investment objectives, risks and expenses carefully before you invest. Information about these and other important subjects is in the Funds’ prospectus, which you should read carefully before investing.
Excelsior Funds, Inc., Excelsior Funds Trust and Excelsior Tax-Exempt Funds, Inc. are distributed by BISYS Fund Services Limited Partnership.
You may write to Excelsior Funds, Inc., Excelsior Funds Trust and Excelsior Tax-Exempt Funds, Inc. at the following address:
Excelsior Funds
P.O. Box 8529
Boston, MA 02266-8529
SHARES IN THE FUNDS ARE NOT DEPOSITS OR OBLIGATIONS OF, OR GUARANTEED OR ENDORSED BY, UNITED STATES TRUST COMPANY OF NEW YORK, U.S. TRUST COMPANY, N.A., THEIR PARENT AND AFFILIATES AND SHARES ARE NOT INSURED BY THE FEDERAL DEPOSIT INSURANCE CORPORATION, THE FEDERAL RESERVE BOARD, OR ANY OTHER AGENCY. INVESTMENTS IN THE FUNDS INVOLVE INVESTMENT RISKS, INCLUDING POSSIBLE LOSS OF PRINCIPAL. FUND SHARES ARE NOT INSURED OR GUARANTEED BY THE U.S. GOVERNMENT.
LETTER TO SHAREHOLDERS
March 31, 2006
Dear Valued Excelsior Fund Shareholder,
I am pleased to bring you the annual report for the year ended March 31, 2006 for the Excelsior Funds. The funds in this report are part of the Excelsior Fund family which had over $18 billion in assets as of the end of the report period and includes a wide array of asset classes and investment strategies designed to meet the individual investor’s needs for performance and tax sensitivity.
By now, you would have received information about changes to the administrative and non-advisory services provided to the Excelsior Funds. As a result, the Excelsior Funds and the Laudus Funds, an affiliated fund family, now share certain complex-wide administrative, compliance, marketing and other functions.
We are pleased with the transition, and remain optimistic that shareholders will approve the board of directors’ recommendation to elect members to jointly oversee the two fund families. It is anticipated that the new unified board will strengthen the oversight provided on behalf of fund shareholders and may result in certain long-term cost and operating efficiencies. All votes are important, so I encourage you to vote your shares as soon as possible if you haven’t already done so.
Given these changes, I want to assure you that the most important aspects of the Excelsior Funds will remain the same. Specifically, the fund management and investment process provided by U.S. Trust, as advisor to the Funds, as well as the funds’ emphasis on enduring performance, will not change.
In closing, we at Excelsior Funds remain committed to helping you reach your long-term investment goals. Thank you for investing with us.
Sincerely,

Evelyn Dilsaver
President
1
FIXED INCOME MARKET REVIEW
The fixed income markets experienced three key trends over the course of the fiscal year ending March 31, 2006. Dominating the market was the Federal Reserve’s continuous monetary tightening, which culminated in its fifteenth federal funds target rate hike, to 4.75%, as the reporting period ended. The result was a shift to higher bond yields across the maturity spectrum.
The second critical aspect of the fixed-income market was the continued flattening of the yield curve, as we expected. The yield curve inverted, with shorter rates higher than longer rates, for a period from the end of 2005 into early 2006. An inverted curve has signaled future recessions in the past, but our thinking concurs with the Fed’s, which identifies a global liquidity surplus as the cause of the inversion. The last critical factor for the markets was limited to municipal bonds, with the first quarter of 2006 experiencing a drop in issuance as higher rates cut off refunding issues. Tighter muni supply is expected to continue over the new fiscal year.
Agency bonds modestly outperformed Treasuries for the past 12 months. Demand was strong from domestic investors who sought a high-quality reserve against future opportunities in other sectors. Foreign buying was very heavy. Inflation indexed bonds (TIPS) signaled an increase in inflation expectations as breakeven yields for 5-year and 10-year issues rose over the reporting period, in particular with short maturity issues. Commercial mortgage backed securities modestly outperformed due to healthy demand as investors moved some funds out of the corporate sector into this sector. Interest rate volatility, a key determinant of value in the mortgage-backed securities market, has continued to decline favoring the prospects for out-performance in this sector. Municipals outperformed Treasuries, as yields on the latter rose more on both an actual and a relative basis. This was caused by a well documented increase in demand on the part of non-traditional municipal investors, in addition to a reduction in new-issue supply. The result was much richer municipal/Treasury yield ratios. This has been especially true for maturities of 10+ years, although all comparative municipal/Treasury bond yield ratios fell to 5-year lows in the quarter.
The 10-year Treasury yield is nearing the high end of the expected range for 2006. Yields should begin to decline later in the year driven by an expected slowdown in economic activity, specifically with respect to housing and the consumer. The Fed’s new Chairman, Ben Bernanke, has stated that going forward, Fed policy will be more data dependent, which could see more tightening than expected, but we believe the Fed is aware of the potential for excessive tightening. Opportunity to profit from the yield curve returning to its more traditional steeper shape is now evident. From a duration standpoint, we are positioned slightly shorter to fixed-income benchmarks, looking for an easing to economic growth rates. We will look to position portfolios longer relative to the benchmarks after the Fed concludes its rate increases. We think a significant yield advantage exists in select mortgage-backed and asset-backed investments and continues to dictate an overweight position in the sector.
2
EXCELSIOR TAX-EXEMPT FUNDS, INC. | CALIFORNIA SHORT-INTERMEDIATE TERM |
TAX-EXEMPT INCOME FUND
Fiscal Year Annual Review
California, the world’s seventh-largest economy, continues to display expansive economic growth, and a new governmental emphasis on reining in deficits has earned the state and its counties, cities and fiscal authorities high marks from bond rating agencies. Our Fund invests primarily in California municipal bonds, including state-guaranteed issuance, where at least 80% of the assets held will be both federally tax-exempt and exempt from California state and local income taxes. Over the preceding twelve months, investors witnessed a rise in interest rates across the maturity spectrum, with the Fed going as far as its fifteenth 0.25% increase to the federal funds rate target, bringing it to 4.75% on March 31, at the end of the Fund’s fiscal year. The tax-exempt market outperformed its taxable counterpart, as long-term municipal yields fell while intermediate and long-term governments and corporates rose.
Performance Attribution
Our investment process is driven by the independent examination of individual securities rather than by an overarching economic view, and we believe the Fund’s high-quality, well-diversified fixed-income portfolio is an outcome of this process. Our portfolio tracks the Merrill Lynch 3-7 Year Muni Index, which we not only use as a benchmark, but also as a comparative quality standard. Underperformance relative to this benchmark reflected our commitment to higher quality issues with a higher basis. The “spread” or yield difference between national and California rates widened to a more normal 15-20 basis points. New issue supply was strong, but demand continued to exceed supply, owing to the presence of new institutional buyers. Average maturity in the portfolio was extended as the manager continued to implement a laddered strategy of distributing fund assets across its maturity range in line with its benchmark.
Outlook
The Fund is beginning to be repositioned to benefit from the end of Fed tightening and a trend towards easing that we expect to develop later this year. The yield curve orientation continues to favor flattening, though to a lesser extent than in past quarters. Our biggest concern is reduced issuance, as higher interest rates have dropped refinancings by 25% since the start of the year. However, California was the number one state issuer for the first quarter of 2006, as it was for all of 2005, and supply remains healthy in both the primary and secondary markets. Our research amply demonstrates the importance of tax-savings on fixed-income returns, and we continue with this emphasis for the benefit of our investors.
3
EXCELSIOR TAX-EXEMPT FUNDS, INC. | CALIFORNIA SHORT-INTERMEDIATE TERM TAX-EXEMPT INCOME FUND |
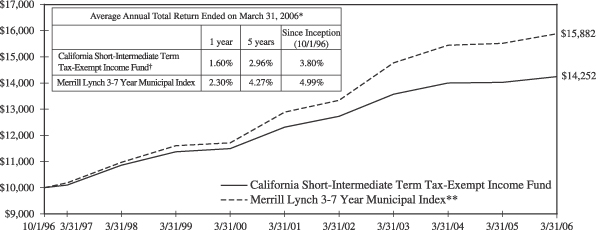
Past performance is not predictive of future performance. Investment returns and principal values will vary and shares may be worth more or less at redemption than their original cost. A portion of the Fund’s income may be subject to the Alternative Minimum Tax.
The above illustration compares a $10,000 investment made in the Fund and a broad-based index since 10/1/96 (inception date). The chart assumes all dividends and capital gain distributions are reinvested. The Fund’s performance takes into account fees and expenses. The index does not take into account charges, fees and other expenses. Further information relating to Fund performance is contained in the Financial Highlights section of the Prospectus and elsewhere in this report.
| * | | Total return represents the change during the period in a hypothetical account with dividends reinvested. |
| ** | | Source: Merrill Lynch—the Merrill Lynch 3-7 Year Municipal Index is a widely-accepted unmanaged market-weighted index comprised of fixed-rate, coupon-bearing bonds issued within five years of the most recent month-end with greater than $50 million principal amount having a Moody’s investment grade rating and maturities of three to seven years. |
| † | | Currently certain fees are waived. Had such fees not been waived, returns would have been lower. Returns do not reflect the deduction of taxes that a shareholder would pay on Fund distributions or the redemption of shares. |
4
EXCELSIOR FUNDS, INC. | CORE BOND FUND |
Fiscal Year Annual Review
The Fed’s FOMC increased the target short-term federal funds rate progressively over the past twelve months, culminating in the 15th rate hike since June 2004, to 4.75%. Treasury yields rose from the 3-month T-Bill to the 30-year bond, and the yield curve flattened and then inverted for more than a month. The Fed has said that further hikes under new Chairman Ben Bernanke will be data-dependent, signaling an end to tightening unless inflation numbers gap higher.
Performance Attribution
The Excelsior Core Bond Fund generated strong relative performance that was largely the result of the portfolio’s barbell position and shorter duration, which benefited as yields rose and the Treasury yield curve flattened. The Fund’s defensive posture to rising rates was additive to returns as yields rose. While our moderate underweight allocation in corporate bonds was a slight detractor from returns, our selective holdings in high yield debt aided relative performance. Allocations to asset-backed and commercial mortgage backed securities helped performance as well. Furthermore, the allocation to municipal bonds added value as the current refinancing supply has been light and demand has increased due to higher yields. Our average quality rating remains at AAA. The allocation to BBB rated securities remains minimal, with the portfolio emphasizing higher quality issues. There were no major changes to our sector allocations although some credit positions were selectively reduced while we added to our mortgage position. The moderate corporate underweight allocation was maintained. We have added to our position in hybrid ARMs (adjustable rate mortgages) with interest rates that are fixed for a set period and then float.
Outlook
We believe a significant yield advantage exists in select mortgage-backed and asset-backed investments, which continues to dictate an overweight position in these securities for the Fund. Interest rate volatility, a key determinant of value in the mortgage-backed securities market, has continued to decline, favoring the prospects for out-performance in this sector. Once the Fed ends the tightening phase, we see little change in the fed funds’ target rate for a considerable period thereafter. We continue to favor investments in high-quality commercial mortgages (CMBS), for their attractive yield levels, low event risk, and high quality.
5
EXCELSIOR FUNDS, INC. | CORE BOND FUND |
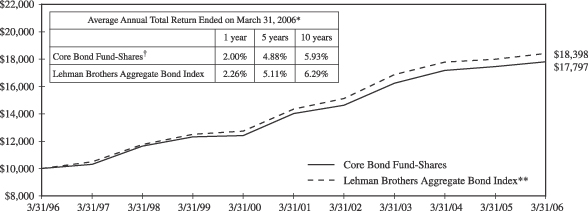
Past performance is not predictive of future performance. Investment returns and principal values will vary and shares may be worth more or less at redemption than their original cost.
The above illustration compares a $10,000 investment made in the Fund and a broad-based index over the past ten fiscal years. The chart assumes all dividends and capital gain distributions are reinvested. The Fund’s performance takes into account fees and expenses. The index does not take into account charges, fees and other expenses. Further information relating to Fund performance is contained in the Financial Highlights section of the Prospectus and elsewhere in this report.
| | * | Total return represents the change during the period in a hypothetical account with dividends reinvested. |
| | ** | Source: Lehman Brothers—the Lehman Brothers Aggregate Bond Index is an unmanaged, fixed income, market value-weighted index that includes treasury issues, agency issues, corporate bond issues and mortgage-backed securities. |
| | † | Currently certain fees are waived. Had such fees not been waived, returns would have been lower. Returns do not reflect the deduction of taxes that a shareholder would pay on Fund distributions or the redemption of shares. |
6
EXCELSIOR FUNDS, INC. | HIGH YIELD FUND |
Fiscal Year Annual Review
The fiscal year ending March 31 witnessed a rise in interest rates across the maturity spectrum, with the Fed going as far as its fifteenth 0.25% increase to the federal funds rate target, raising it to 4.75%. The high yield market extended its positive momentum from late last year through most of the first quarter of 2006. Solid economic growth and strong equity markets fueled enthusiasm for the high yield asset class. In addition, readily available bank credit allowed a number of high yield issuers to redeem outstanding subordinated debt thereby reducing the supply of fixed-coupon issues. Most importantly, default rates in the sector remained stable and at levels well below the long term average.
Performance Attribution
The key drivers of high yield market performance were the ongoing improvement in default rates and the increase in U.S. interest rates. Relative to the Merrill High Yield Index, we had overweight positions in paper/packaging, chemicals, and metals/mining (to benefit from strong economic growth) and in gaming (to reduce portfolio volatility). We positioned the portfolio for moderate volatility in an environment of solid economic growth and stable or moderately rising interest rates, holding issues with high coupons trading near their call prices. As a result, the Fund did not fully participate in the strong performance of the high yield sector. The Fund’s relative underperformance was almost entirely due to underweight exposure to high-volatility, lower-tier securities. Over the year, the CCC-rated sub sector significantly outperformed the B and particularly BB sub sectors. However, our underweighting of lower-tier credits reflected concerns surrounding possible principal risk from rising interest rates and uncertainty surrounding national and international political events. The best performing industry groups included metals/mining, telecom, automotive, and paper/packaging. The weakest performing groups include financials, food and beverage, gaming and broadcasting.
Outlook
The High Yield Fund has been migrating in the direction of greater diversification and higher overall quality. As a result, the Fund at the start of the year was underweight high-beta CCC and B-rated groups, which were the best performing sub sectors. Currently, the Fund has higher than average exposure to gaming and cyclical/commodity sectors such as metals/mining, and chemicals. Below-market weightings include finance, homebuilding, transportation, and autos/suppliers.
7
EXCELSIOR FUNDS, INC. | HIGH YIELD FUND |
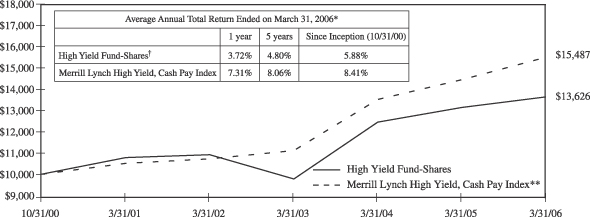
Past performance is not predictive of future performance. Investment returns and principal values will vary and shares may be worth more or less at redemption than their original cost. Securities rated below investment grade generally entail greater market, credit, and liquidity risks than investment grade securities.
The above illustration compares a $10,000 investment made in the Fund and a broad-based index since 10/31/00 (inception date). The chart assumes all dividends and capital gain distributions are reinvested. The Fund’s performance takes into account fees and expenses. The index does not take into account charges, fees and other expenses. Further information relating to Fund performance is contained in the Financial Highlights section of the Prospectus and elsewhere in this report.
| * | | Total return represents the change during the period in a hypothetical account with dividends reinvested. |
| ** | | Source: Merrill Lynch—The Merrill Lynch High Yield, Cash Pay Index is an unmanaged index comprised of publicly placed, non-convertible, coupon bearing domestic debt. Issues in the index are less than investment grade as rated by Standard & Poor’s Ratings Group or Moody’s Investors Service, Inc., and must not be in default. Issues have a term to maturity of at least one year. |
| † | | Currently certain fees are waived. Had such fees not been waived, returns would have been lower. Returns do not reflect the deduction of taxes that a shareholder would pay on Fund distributions or the redemption of shares. |
8
EXCELSIOR FUNDS, INC. | INTERMEDIATE-TERM BOND FUND |
Fiscal Year Annual Review
Over the preceding twelve months, investors witnessed a rise in interest rates across the maturity spectrum, with the Fed going as far as its fifteenth 0.25% increase to the federal funds rate target, bringing it to 4.75% on March 31. The move to higher interest rates has been in place since June 2003, and we believe this Fed tightening cycle is nearing its end. At that point, we anticipate greater opportunity, and will adjust our defensive strategy to take advantage of the new financial environment.
Performance Attribution
Positive contributors to performance during the fiscal year were holdings in mortgage-backed securities and commercial-mortgage backed securities (CMBS). Both sectors were over weighted and had strong performance relative to Treasury issues. An underweight in corporate securities was a drag on results. Securities with call features, such as, mortgages and callable agencies, were overweighted based on valuation levels, and the shorter duration of the overall portfolio aided relative returns. Mortgages and CMBS continue to be overweight for their added yield and high quality. Should the credit cycle turn more cautious, these sectors are expected to have better relative returns. Corporate bonds are under weight and the BBB-rated portion is particularly light at half the index weight. The yield advantage in corporate bonds compared to Treasury bonds is very narrow compared to historic levels.
Outlook
The Fund is beginning to be repositioned to benefit from the end of Fed tightening and a trend towards easing that we expect to develop later this year. The yield curve orientation continues to favor flattening, though to a lesser extent than in past quarters. At quarter end, the Fund had an average credit rating of AAA, a yield-to-worst of 5.38% and a duration of 3.7 years, in line with the benchmark and slightly long versus the Lipper category. We expect the Fund to perform well in the slower economic environment that we foresee.
9
EXCELSIOR FUNDS, INC. | INTERMEDIATE-TERM BOND FUND |
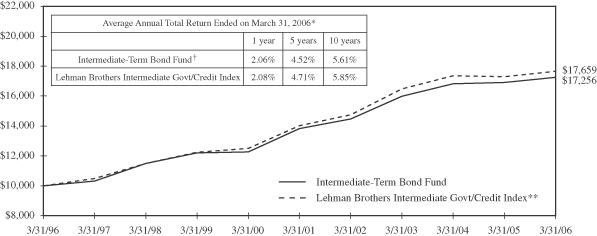
Past performance is not predictive of future performance. Investment returns and principal values will vary and shares may be worth more or less at redemption than their original cost.
The above illustration compares a $10,000 investment made in the Fund and a broad-based index over the past ten fiscal years. The chart assumes all dividends and capital gain distributions are reinvested. The Fund’s performance takes into account fees and expenses. The index does not take into account charges, fees and other expenses. Further information relating to Fund performance is contained in the Financial Highlights section of the Prospectus and elsewhere in this report.
| * | | Total return represents the change during the period in a hypothetical account with dividends reinvested. |
| ** | | Source: Lehman Brothers—The Lehman Brothers Intermediate Govt/Credit Index is an unmanaged total return performance benchmark composed of U.S. Government agencies and U.S. Treasury securities and investment grade corporate debt, selected as representative of the market with maturities of one to ten years. |
| † | | Currently certain fees are waived. Had such fees not been waived, returns would have been lower. Returns do not reflect the deduction of taxes that a shareholder would pay on Fund distributions or the redemption of shares. |
10
EXCELSIOR TAX-EXEMPT FUNDS, INC. | INTERMEDIATE-TERM TAX-EXEMPT FUND |
Fiscal Year Annual Review
The Fund invests primarily in municipal bonds, where at least 80% of the assets held in the Fund will be federally tax-exempt and have an average maturity of five to ten years. Over the fiscal year, we focused on extending the Fund’s average maturity, but we kept duration roughly the same. We sold several bonds with near call dates, and moved out toward bonds with longer (10-year) call provisions. Over the preceding twelve months, investors witnessed a rise in interest rates across the maturity spectrum, with the Fed going as far as its fifteenth 0.25% increase to the federal funds rate target, bringing it to 4.75% on March 31 at the end of the Fund’s fiscal year.
Performance Attribution
Relative underperformance with our benchmark reflects higher quality securities purchased with a higher basis. The Excelsior Intermediate-Term Tax-Exempt Fund ended the first quarter of 2006 almost fully invested, with 5% percent of assets in cash. Average maturity in the portfolio was extended to nearly 9.5 years, as the manager continued to implement a laddered strategy of distributing fund assets across a maturity range in line with our benchmark. Over the long term, this strategy should serve to deliver more stable returns. As the yield curve flattened, and particularly when the yield curve for 5- and 10- year issues leveled, our performance gained. Our investment process is driven by the independent examination of individual securities rather than by an overarching economic view, and we believe the Fund’s high-quality, well-diversified tax-exempt portfolio is an outcome of this process.
Outlook
The Fund is beginning to be repositioned to benefit from the end of Fed tightening and a trend towards easing that we expect to develop later this year. The yield curve orientation continues to favor flattening, though to a lesser extent than in past quarters. Our biggest concern is reduced issuance, as higher interest rates have dropped refinancings by 25% since the start of the year. Still, we expect to find high-quality opportunities in the municipal market.
11
EXCELSIOR TAX-EXEMPT FUNDS, INC. | INTERMEDIATE-TERM TAX-EXEMPT FUND |
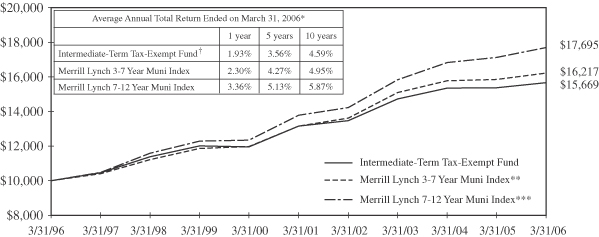
Past performance is not predictive of future performance. Investment returns and principal values will vary and shares may be worth more or less at redemption than their original cost. A portion of the Fund’s income may be subject to the Alternative Minimum Tax and some investors may be subject to certain state and local taxes.
The above illustration compares a $10,000 investment made in the Fund and broad-based indices over the past ten fiscal years. The chart assumes all dividends and capital gain distributions are reinvested. The Fund’s performance takes into account fees and expenses. The indices do not take into account charges, fees and other expenses. Further information relating to Fund performance is contained in the Financial Highlights section of the Prospectus and elsewhere in this report.
| * | | Total return represents the change during the period in a hypothetical account with dividends reinvested. |
| ** | | Source: Merrill Lynch—the Merrill Lynch 3-7 Year Muni Index is a widely-accepted unmanaged market-weighted index comprised of fixed-rate, coupon-bearing bonds issued within five years of the most recent month-end with greater than $50 million principal amount having a Moody’s investment grade rating and maturities of three to seven years. |
| *** | | Source: Merrill Lynch—the Merrill Lynch 7-12 Year Muni Index is a widely-accepted unmanaged market-weighted index comprised of fixed-rate, coupon-bearing bonds issued within five years of the most recent month-end with greater than $50 million principal amount having a Moody’s investment grade rating and maturities of seven to twelve years. |
| † | | Currently certain fees are waived. Had such fees not been waived, returns would have been lower. Returns do not reflect the deduction of taxes that a shareholder would pay on Fund distributions or the redemption of shares. |
12
EXCELSIOR FUNDS, INC. | LONG-TERM TAX-EXEMPT FUND |
Fiscal Year Annual Review
Over the preceding twelve months, investors witnessed a rise in interest rates across the maturity spectrum, with the Fed going as far as its fifteenth 0.25% increase to the federal funds rate target, bringing it to 4.75% on March 31. The tax-exempt market outperformed its taxable counterpart, as long-term municipal yields fell while yields on long-term governments and corporates rose. The Fund invested primarily in municipal bonds as a minimum of 80% of the assets held in the Fund must be exempt from Federal income taxes. Demand kept prices of long-maturity municipals strong during the quarter. More attractive long-term tax-exempt yields created unusual demand from foreign and other non-traditional muni investors, as well as insurance companies and other financial institutions, making our bonds more attractive than their taxable equivalents.
Performance Attribution
In the course of the fiscal year, we focused on extending the Fund’s average maturity, but we kept duration roughly the same. Average maturity rose to nearly 14 years. Transactions during the fiscal year included tax swaps that served to reduce volatility, increase yield, improve quality and achieve diversification objectives. We sold several bonds with near call dates, and moved out toward bonds with longer call provisions. As the yield curve flattened, our performance gained. The Excelsior Long-Term Tax-Exempt Fund ended the annual reporting period almost fully invested with less than ten percent cash. We succeeded in our goal of implementing a laddered strategy of distributing fund assets across a maturity range in line with our benchmark. Relative underperformance with our benchmark reflects higher quality securities purchased with a higher basis.
Outlook
Municipal bond issuance set a record in 2005, at $408 billion, fueled by the refunding of older outstanding issues. The unexpected drop in long-term rates during the year and the lower absolute level of rates allowed more issuers to save on their cost of debt outstanding, driving volume higher. The pace of municipal issuance in 2006 is expected to decline to the $350 billion level, as higher interest rates, and the previous large-scale refunding reduce offerings. Reduced supply should add support, and we are confident in the portfolio’s structure. Finally, we expect the Fund to perform well in the slower economic environment that we foresee.
13
EXCELSIOR TAX-EXEMPT FUNDS, INC. | LONG-TERM TAX-EXEMPT FUND |
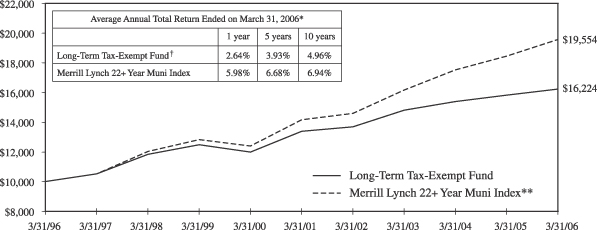
Past performance is not predictive of future performance. Investment returns and principal values will vary and shares may be worth more or less at redemption than their original cost. A portion of the Fund’s income may be subject to the Alternative Minimum Tax and some investors may be subject to certain state and local taxes.
The above illustration compares a $10,000 investment made in the Fund and a broad-based index over the past ten fiscal years. The chart assumes all dividends and capital gain distributions are reinvested. The Fund’s performance takes into account fees and expenses. The index does not take into account charges, fees and other expenses. Further, information relating to Fund performance is contained in the Financial Highlights section of the Prospectus and elsewhere in this report.
| * | | Total return represents the change during the period in a hypothetical account with dividends reinvested. |
| ** | | Source: Merrill Lynch—the Merrill Lynch 22+ Year Muni Index consists of bonds with an outstanding par which is greater than or equal to 25 million and a maturity range greater than or equal to 22 years. |
| † | | Currently certain fees are waived. Had such fees not been waived, returns would have been lower. Returns do not reflect the deduction of taxes that a shareholder would pay on Fund distributions or the redemption of shares. |
14
EXCELSIOR TAX-EXEMPT FUNDS, INC. | NEW YORK INTERMEDIATE-TERM TAX-EXEMPT FUND |
Fiscal Year Annual Review
Over the preceding twelve months, investors witnessed a rise in interest rates across the maturity spectrum, with the Fed going as far as its fifteenth 0.25% increase to the federal funds rate target, bringing it to 4.75% on March 31 at the close of the Fund’s fiscal year. The tax-exempt market outperformed its taxable counterpart, as long-term municipal yields fell while intermediate and long-term governments and corporates rose. The Fund invested primarily in municipal bonds issued by the state, counties, municipalities and other state agencies of New York, per our mandate. A minimum of 80% of the assets held in the Fund must be both federally tax-exempt and exempt from state and local income taxes.
Performance Attribution
The New York tax-exempt market was supported by strong new issue supply, but demand continued to exceed supply. The market outperformed the national market during the fiscal year, as prices rose and spreads tightened to a point well below their historical averages. New issue supply was strong, but demand continued to exceed supply, owing to the presence of new institutional buyers. The Excelsior New York Intermediate Tax-Exempt Fund ended the annual reporting period almost fully invested with less than 10 percent cash. Average maturity in the portfolio was extended as the manager continued to implement a laddered strategy of distributing fund assets across its maturity range in line with its benchmark. During the fiscal year, the Fund moved to increase yield while reducing volatility by investing in bonds with longer maturities but shorter call dates. Underperformance relative to this benchmark reflected our commitment to higher quality issues with a higher basis.
Outlook
The Fund is beginning to be repositioned to benefit from the end of Fed tightening and a trend towards easing that we expect to develop later this year. The yield curve orientation continues to favor flattening, though to a lesser extent than in past quarters. Our biggest concern is reduced issuance, as higher interest rates have dropped refinancings by 25% since the start of the year. While this has provided price support, we think short supply is problematic. We believe the outlook for New York State issuers is positive, as the National Conference of State Legislators confirms, and revenues are either meeting or exceeding budgeted levels. And we expect the Fund to perform well in the slower economic environment that we foresee.
15
EXCELSIOR TAX-EXEMPT FUNDS, INC. | NEW YORK INTERMEDIATE-TERM TAX-EXEMPT FUND |
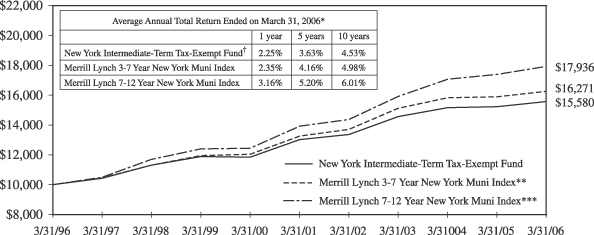
Past performance is not predictive of future performance. Investment returns and principal values will vary and shares may be worth more or less at redemption than their original cost. A portion of the Fund’s income may be subject to the Alternative Minimum Tax.
The above illustration compares a $10,000 investment made in the Fund and broad-based indices over the past ten fiscal years. The chart assumes all dividends and capital gain distributions are reinvested. The Fund’s performance takes into account fees and expenses. The indices do not take into account charges, fees and other expenses. Further information relating to Fund performance is contained in the Financial Highlights section of the Prospectus and elsewhere in this report.
| | * | Total return represents the change during the period in a hypothetical account with dividends reinvested. |
| | ** | Source: Merrill Lynch—the Merrill Lynch 3-7 Year New York Muni Index is a widely-accepted unmanaged market-weighted index comprised of fixed-rate, coupon-bearing bonds of New York Municipalities issued within five years of the most recent month-end with greater than $50 million principal amount having a Moody’s investment grade rating and maturities of three to seven years. |
| | *** | Source: Merrill Lynch—the Merrill Lynch 7-12 Year New York Muni Index is a widely-accepted unmanaged market-weighted index comprised of fixed-rate, coupon-bearing bonds of New York Municipalities issued within five years of the most recent month-end with greater than $50 million principal amount having a Moody’s investment grade rating and maturities of seven to twelve years. |
| | † | Currently certain fees are waived. Had such fees not been waived, returns would have been lower. Returns do not reflect the deduction of taxes that a shareholder would pay on Fund distributions or the redemption of shares. |
16
EXCELSIOR FUNDS, INC. | SHORT-TERM GOVERNMENT SECURITIES FUND |
Fiscal Year Annual Review
Inflation fears have risen over the fiscal year, with indicators, watched by the Fed, close to the upper end of acceptable ranges. Energy costs have climbed significantly, and inflation watchers are looking for pass through. Clearly, prospects of an end to Fed tightening will be dictated by the reported levels of consumer inflation going forward. Yields have increased across the maturity spectrum as the Federal Reserve Board has continued to raise the target rate for Fed funds, bringing it to 4.75% by March 31.
Performance Attribution
Volatility has been driven lower as market participants have begun to price in the prospect that the Federal Reserve is nearing the end of its tightening regimen and will leave the Fed Funds’ target rate unchanged for a considerable period thereafter. Mortgage-backed prices have an inverse relationship to the market level of volatility, and we have benefited with a strategy that focuses on this relationship. The Fund’s duration, or sensitivity to changes in interest rates, was 1.72 years at the end of the quarter, approximately neutral to the benchmark. We think a significant yield advantage exists in both mortgage-backed and asset-backed investments and continues to dictate an overweight position in the Fund. The combined percentage held of both sectors at the end of the period amounted to 62%. Interest rate volatility, a key determinant of value in the mortgage-backed securities market, has continued to decline favoring the prospects for outperformance in the mortgage-backed sector.
Outlook
The shape of the Treasury yield curve has become extremely flat. This situation may persist throughout the near term. An opportunity to profit from the yield curve returning to its more traditional steeper shape may present itself during the new fiscal year, but that possibility is not predicted. The flat yield curve shape eliminates the prospects of adding performance through security “rolldown.” Yield spread, we believe, is presently the best opportunity for excess returns.
17
EXCELSIOR FUNDS, INC. | SHORT-TERM GOVERNMENT SECURITIES FUND |
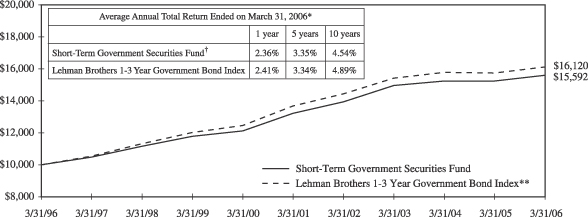
Past performance is not predictive of future performance. Investment returns and principal values will vary and shares may be worth more or less at redemption than their original cost.
The above illustration compares a $10,000 investment made in the Fund and a broad-based index over the past ten fiscal years. The chart assumes all dividends and capital gain distributions are reinvested. The Fund’s performance takes into account fees and expenses. The index does not take into account charges, fees and other expenses. Further information relating to Fund performance is contained in the Financial Highlights section of the Prospectus and elsewhere in this report.
| * | | Total return represents the change during the period in a hypothetical account with dividends reinvested. |
| ** | | Source: Lehman Brothers—The Lehman Brothers 1-3 Year Government Bond Index is an unmanaged total return performance benchmark composed of U.S. Government agencies and U.S. Treasury securities with maturities of one to three years. |
| † | | Currently certain fees are waived. Had such fees not been waived, returns would have been lower. Returns do not reflect the deduction of taxes that a shareholder would pay on Fund distributions or the redemption of shares. |
18
EXCELSIOR TAX-EXEMPT FUNDS, INC. | SHORT-TERM TAX-EXEMPT SECURITIES FUND |
Fiscal Year Annual Review
The Fund invests primarily in municipal bonds, with at least 80% of its assets qualifying for Federal tax-exempt status, and with an average maturity of one to three years. Over the course of the fiscal year, cash inflows to the Fund remained strong, but it was challenging to put cash to work. As the spread between the very short end of the yield curve and the one- to two-year segment was flat, we saw no incentive to relocate. But as rates rose, we extended the Fund’s average maturity, which contributed positively to performance. However, underperformance relative to this benchmark reflected our commitment to higher quality issues with a higher basis. Over the preceding twelve months, investors witnessed a rise in interest rates across the maturity spectrum, with the Fed going as far as its fifteenth 0.25% increase to the federal funds rate target, bringing it to 4.75% on March 31 at the end of the Fund’s fiscal year.
Performance Attribution
By adjusting its cash position during the quarter, the Excelsior Short-Term Tax-Exempt Securities Fund reinvested in the areas of its maturity range that experienced the biggest back-up in rates in response to Federal Reserve rate increases and supply/demand issues in the short-term tax-exempt markets. In anticipation that tax-related money market liquidations would put upward pressure on short-term yields as April 15 approached, the Fund invested 30% in cash equivalents and shortened average maturity to 2.3 years. Over the reporting period, the tax-exempt market outperformed its taxable counterpart, as long-term municipal yields fell while intermediate and long-term governments and corporates rose. The Excelsior Short-Term Tax-Exempt Securities Fund ended the quarter almost fully invested, with 5% percent of assets in cash.
Outlook
The Fund is beginning to be repositioned to benefit from the end of Fed tightening and a trend towards easing that we expect to develop later this year. The yield curve orientation continues to favor flattening, though to a lesser extent than in past quarters. Our biggest concern is reduced issuance, as higher interest rates have dropped refinancings by 25% since the start of the year. Still, we expect to find high-quality opportunities in the municipal market. During 2005, municipal interest rates rose by more than 1% at the short end, with the 2-year maturity rising from 2.20% to 3.20%. While the municipal yield curve did not invert at any time during the year (and is not expected to in 2006), by the end of December, rates across the first two years of the curve were almost identical at about 3.20%. Looking ahead, we’ll maintain the current barbell structure, until we get a better picture on exactly when Fed interest rate hikes are over, at which time we expect to deploy cash at the long-end of our maturity spectrum.
19
EXCELSIOR TAX-EXEMPT FUNDS, INC. | SHORT-TERM TAX-EXEMPT SECURITIES FUND |
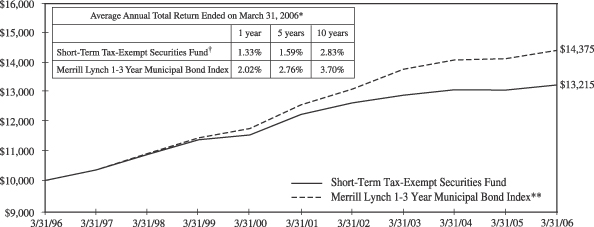
Past performance is not predictive of future performance. Investment returns and principal values will vary and shares may be worth more or less at redemption than their original cost. A portion of the Fund’s income may be subject to the Alternative Minimum Tax and some investors may be subject to certain state and local taxes.
The above illustration compares a $10,000 investment made in the Fund and a broad-based index over the past ten fiscal years. The chart assumes all dividends and capital gain distributions are reinvested. The Fund’s performance takes into account fees and expenses. The index does not take into account charges, fees and other expenses. Further information relating to Fund performance is contained in the Financial Highlights section of the Prospectus and elsewhere in this report.
| * | | Total return represents the change during the period in a hypothetical account with dividends reinvested. |
| ** | | Source: Merrill Lynch—the Merrill Lynch 1-3 Year Municipal Bond Index is a widely-accepted unmanaged market-weighted index comprised of fixed-rate, coupon-bearing bonds issued within five years of the most recent month-end with greater than $50 million principal amount having a Moody’s investment grade rating and maturities of one to three years. |
| † | | Currently certain fees are waived. Had such fees not been waived, returns would have been lower. Returns do not reflect the deduction of taxes that a shareholder would pay on Fund distributions or the redemption of shares. |
20
Excelsior Tax-Exempt Funds, Inc.
Portfolio of Investments — March 31, 2006
California Short-Intermediate Term Tax-Exempt Income Fund
| | | | | | | | | | | |
Principal Amount
| | | | Rate
| | | Maturity
Date
| | Value
|
| | | | | | | | | | | | |
| TAX-EXEMPT CASH EQUIVALENT SECURITIES —
BACKED BY LETTERS OF CREDIT (2.03%): | | | |
| $ | 800,000 | | California State General Obligation Bonds, Kindergarten-University, Series B-3, (Citibank N.A.-37%/ State Street Bank & Trust-37%/ National Australia Bank-25%)(a) | | 3.06 | % | | 05/01/34 | | $ | 800,000 |
| | 550,000 | | Orange County, California, Sanitation Districts, Certificate of Participation, (AMBAC) (Societe Generale)(a) | | 3.10 | | | 08/01/16 | | | 550,000 |
| | | | | | | | | | |
|
|
| | | | TOTAL TAX-EXEMPT CASH EQUIVALENT SECURITIES — BACKED BY LETTERS OF CREDIT
(Cost $1,350,000) | | | 1,350,000 |
| | | | | | | | | | |
|
|
| | TAX-EXEMPT SECURITIES (84.25%): | | | |
| | 1,500,000 | | Anaheim, California, Public Financing Authority Revenue Bonds, Distribution Systems, (AMBC) | | 5.00 | | | 10/01/13 | | | 1,615,350 |
| | 1,000,000 | | California State Department of Transportation Revenue Bonds, Federal Highway Grant Anticipation Bonds, Series A, (FGIC) | | 4.50 | | | 02/01/13 | | | 1,042,280 |
| | 1,000,000 | | California State Department of Water Resources Central Valley Project Revenue Bonds, Series Y | | 5.00 | | | 12/01/10 | | | 1,061,230 |
| | 3,000,000 | | California State Department of Water Resources Revenue Bonds, Series W, (AMBAC) | | 5.50 | | | 12/01/09 | | | 3,201,930 |
| | 1,000,000 | | California State Economic Recovery, Special Sales Tax Revenue Bonds, Series A, (FGIC) | | 5.25 | | | 07/01/14 | | | 1,089,870 |
| | 3,000,000 | | California State Economic Recovery, Special Sales Tax Revenue Bonds, Series B | | 5.00 | | | 07/01/23 | | | 3,052,830 |
| | 750,000 | | California State General Obligation Bonds | | 6.25 | | | 04/01/08 | | | 787,373 |
| | | | | | | | | | | |
Principal Amount
| | | | Rate
| | | Maturity
Date
| | Value
|
| | | | | | | | | | | | |
| | TAX-EXEMPT SECURITIES — (continued) | | | |
| $ | 3,000,000 | | California State General Obligation Bonds | | 5.00 | % | | 02/01/11 | | $ | 3,158,460 |
| | 750,000 | | California State General Obligation Bonds, (MBIA) | | 7.50 | | | 10/01/07 | | | 793,260 |
| | 1,000,000 | | California State University Systemwide Revenue Bonds, Series A, (AMBAC) | | 5.00 | | | 11/01/12 | | | 1,074,000 |
| | 1,000,000 | | California Statewide Communities Development Authority Revenue Bonds, California Endowment | | 5.00 | | | 07/01/13 | | | 1,072,650 |
| | 1,000,000 | | Central Valley, California, School District Financing Authority Revenue Bonds, Series A, (MBIA) | | 6.15 | | | 08/01/09 | | | 1,078,460 |
| | 1,000,000 | | Contra Costa, California, Transportation Authority Sales Tax Revenue Bonds, Series A, (FGIC) | | 6.00 | | | 03/01/08 | | | 1,046,220 |
| | 750,000 | | East Bay, California, Regional Park District Authority General Obligation Bonds | | 5.00 | | | 09/01/07 | | | 765,690 |
| | 975,000 | | Foothill- De Anza, California, Community College District General Obligation Bonds, (FGIC) | | 5.00 | | | 08/01/14 | | | 1,035,655 |
| | 1,000,000 | | Golden State Tobacco Securitization Corporation, California, Tobacco Settlement Revenue Bonds, Enhanced-Asset Backed, Series A | | 5.00 | | | 06/01/15 | | | 1,002,130 |
| | 3,500,000 | | Los Angeles County, California, Metropolitan Transportation Authority Sales Tax Revenue Bonds, Series A, (FSA) | | 5.25 | | | 07/01/10 | | | 3,709,369 |
| | 1,000,000 | | Los Angeles, California, Department of Water & Power Revenue Bonds, Power System, Series A, Sub-Series A-1, (MBIA) | | 5.00 | | | 07/01/14 | | | 1,070,040 |
See Notes to Financial Statements.
21
Excelsior Tax-Exempt Funds, Inc.
Portfolio of Investments — March 31, 2006
California Short-Intermediate Term Tax-Exempt Income Fund — (continued)
| | | | | | | | | | | |
Principal Amount
| | | | Rate
| | | Maturity
Date
| | Value
|
| | | | | | | | | | | | |
| | TAX-EXEMPT SECURITIES — (continued) | | | |
| $ | 1,000,000 | | Los Angeles, California, General Obligation Bonds, Series A, (MBIA) | | 4.00 | % | | 09/01/13 | | $ | 1,013,420 |
| | 1,000,000 | | Los Angeles, California, Sanitation Equipment Charge Revenue Bonds, (FGIC) | | 5.00 | | | 02/01/13 | | | 1,072,090 |
| | 1,000,000 | | Los Angeles, California, Sanitation Equipment Charge Revenue Bonds, Series A, (FSA) | | 5.00 | | | 02/01/10 | | | 1,051,720 |
| | 3,000,000 | | Los Angeles, California, Waste Water System Revenue Bonds, Series B, (MBIA) | | 5.00 | | | 06/01/10 | | | 3,167,730 |
| | 1,000,000 | | Metropolitan Water District of Southern California, General Obligation Bonds, Series A | | 3.00 | | | 03/01/08 | | | 987,190 |
| | 960,000 | | Metropolitan Water District of Southern California, Revenue Bonds | | 5.75 | | | 07/01/09 | | | 1,023,110 |
| | 975,000 | | Modesto, California, Irrigation District Financing Authority Revenue Bonds, Series A, (MBIA) | | 5.45 | | | 10/01/07 | | | 1,004,026 |
| | 1,000,000 | | Moulton-Niguel, California, Water District General Obligation Bonds, (AMBAC) | | 4.00 | | | 09/01/10 | | | 1,017,770 |
| | 1,000,000 | | Napa County, California, Flood Protection & Watershed Improvement Authority, General Obligation Bonds, (AMBAC) | | 4.50 | | | 06/15/12 | | | 1,043,880 |
| | 1,100,000 | | Orange County, California, Local Transportation Authority Sales Tax Revenue Bonds, 1st Senior, (AMBAC) | | 6.00 | | | 02/15/08 | | | 1,149,687 |
| | 1,000,000 | | Orange County, California, Local Transportation Authority Sales Tax Revenue Bonds, 2nd Senior, (FGIC) | | 6.00 | | | 02/15/07 | | | 1,021,750 |
| | | | | | | | | | | |
Principal Amount
| | | | Rate
| | | Maturity
Date
| | Value
|
| | | | | | | | | | | | |
| | TAX-EXEMPT SECURITIES — (continued) | | | |
| $ | 1,000,000 | | Oxnard, California, Wastewater District Financing Authority Revenue Bonds, (FGIC) | | 3.50 | % | | 06/01/09 | | $ | 999,670 |
| | 1,000,000 | | Rancho, California, Water District Financing Authority Revenue Bonds, Series A, (FSA) | | 5.50 | | | 08/01/10 | | | 1,077,030 |
| | 1,000,000 | | San Diego County, California, Certificates of Participation, (AMBAC) | | 5.00 | | | 11/01/11 | | | 1,066,970 |
| | 1,000,000 | | San Diego, California, Public Facilities Financing Authority Sewer Revenue Bonds, (FGIC) | | 5.20 | | | 05/15/13 | | | 1,012,110 |
| | 1,000,000 | | San Diego, California, Public Facilities Financing Authority Water Revenue Bonds, (MBIA) | | 5.00 | | | 08/01/11 | | | 1,066,710 |
| | 1,000,000 | | San Francisco, California, City & County General Obligation Bonds, (FSA) | | 5.00 | | | 06/15/08 | | | 1,031,800 |
| | 1,000,000 | | San Francisco, California, City & County Public Utilities Communication Clean Water Revenue Bond, (MBIA) | | 5.00 | | | 10/01/13 | | | 1,070,510 |
| | 3,000,000 | | San Francisco, California, State Building Authority Lease Revenue Bonds, California State & San Francisco Civic Center, Series A | | 5.00 | | | 12/01/12 | | | 3,173,640 |
| | 1,000,000 | | San Mateo, Foster City, California, School Facilities Financing Authority Revenue Bond, (FSA) | | 4.00 | | | 08/15/12 | | | 1,015,690 |
| | 1,075,000 | | Santa Clara County, California, Financing Authority Lease Revenue Bonds, Multiple Facilities Project, Series A, (AMBAC) | | 4.50 | | | 05/15/12 | | | 1,098,919 |
See Notes to Financial Statements.
22
Excelsior Tax-Exempt Funds, Inc.
Portfolio of Investments — March 31, 2006
California Short-Intermediate Term Tax-Exempt Income Fund — (continued)
| | | | | | | | | | | |
Principal Amount
| | | | Rate
| | | Maturity
Date
| | Value
|
| | | | | | | | | | | | |
| | TAX-EXEMPT SECURITIES — (continued) | | | |
| $ | 1,000,000 | | Southern California Public Power Authority Revenue Bonds, Transmission Project, Series A, (MBIA) | | 5.25 | % | | 07/01/09 | | $ | 1,045,910 |
| | 1,000,000 | | Southern California Public Power Authority Revenue Bonds, Transmission Project, Series B, (FSA) | | 4.25 | | | 07/01/11 | | | 1,030,250 |
| | | | | | | | | | |
|
|
| | | | TOTAL TAX-EXEMPT SECURITIES
(Cost $56,177,671) | | | 55,898,379 |
| | | | | | | | | | |
|
|
| TAX-EXEMPT SECURITIES — ESCROWED IN U.S.
GOVERNMENTS — 9.58% | | | |
| | 2,000,000 | | Riverside, California, Water Revenue Bonds, (FGIC) (Prerefunded 10/01/11 @ 101) | | 5.00 | | | 10/01/26 | | | 2,147,520 |
| | 1,000,000 | | Sacramento, California, City Financing Authority Revenue Bonds, City Hall, Series A, (FSA) (Prerefunded 12/01/12 @ 100) | | 5.25 | | | 12/01/17 | | | 1,087,580 |
| | 3,000,000 | | San Diego County, California, Water Authority Certificates of Participation, Series A, (FGIC) (Prerefunded 05/01/08 @ 101) | | 5.00 | | | 05/01/14 | | | 3,118,860 |
| | | | | | | | | | |
|
|
| | | | TOTAL TAX-EXEMPT SECURITIES — ESCROWED IN U.S. GOVERNMENTS (Cost $6,426,929) | | | 6,353,960 |
| | | | | | | | | | |
|
|
Shares
| | | | | | | | | |
| | REGISTERED INVESTMENT COMPANIES — 3.11% | | | |
| | 1,175,133 | | BlackRock California Money Fund | | $ | 1,175,133 |
| | 891,058 | | Federated California Money Fund | | | 891,058 |
| | | | | | | | | | |
|
|
| | | | TOTAL REGISTERED INVESTMENT COMPANIES
(Cost $2,066,191) | | | 2,066,191 |
| | | | | | | | | | |
|
|
| | | | | | |
| | | | | |
Value
|
TOTAL INVESTMENTS
(Cost $66,020,791)(b) | | 98.97 | % | | $ | 65,668,530 |
OTHER ASSETS IN EXCESS OF LIABILITIES | | 1.03 | | | | 686,633 |
| | |
|
| |
|
|
NET ASSETS | | 100.00 | % | | $ | 66,355,163 |
| | |
|
| |
|
|
| (a) | Variable Rate Security—The rate disclosed is as of March 31, 2006. |
| (b) | Unrealized appreciation (depreciation) of securities: |
| | | | |
Unrealized
Appreciation
| | Unrealized
(Depreciation)
| | Net Unrealized
Appreciation/
(Depreciation)
|
| $192,808 | | $(545,069) | | $(352,261) |
AMBAC—American Municipal Bond Assurance Corp.
FGIC—Financial Guaranty Insurance Corp.
FSA—Financial Security Assurance
MBIA—Municipal Bond Insurance Association
Notes (The following notes have not been audited by Deloitte & Touche LLP):
These municipal securities meet the three highest ratings assigned by Moody’s Investors Services, Inc. or Standard and Poor’s Corporation or, where not rated, are determined by the Advisor, under the supervision of the Board of Directors, to be of comparable quality at the time of purchase to rated instruments that may be acquired by the Fund.
At March 31, 2006, approximately 12% of the net assets are invested in municipal securities that have letter of credit enhancement features or escrows in U.S. Government securities backing them, on which the Fund relies. Without such features, the securities may or may not meet the quality standards of securities purchased by the Fund.
At March 31, 2006, approximately, 96% of the net assets are invested in California municipal securities. Economic changes affecting the state and certain of its public bodies and municipalities may affect the ability of issuers to pay the required principal and interest payments of the municipal securities.
See Notes to Financial Statements.
23
Excelsior Tax-Exempt Funds, Inc.
Portfolio of Investments — March 31, 2006
California Short-Intermediate Term Tax-Exempt Income Fund — (continued)
The summary of the Fund’s investments as of March 31, 2006 is as follows: (Unaudited)
| | | | | | |
Portfolio Diversification
| | % of
Net
Assets
| | | Value
|
Revenue Bonds | | 60.50 | % | | $ | 40,141,812 |
General Obligation Bonds | | 22.14 | | | | 14,689,597 |
Prerefunded . | | 9.58 | | | | 6,353,960 |
Registered Investment Companies | | 3.11 | | | | 2,066,191 |
Backed by Letter of Credit | | 2.03 | | | | 1,350,000 |
Certificates of Participation | | 1.61 | | | | 1,066,970 |
| | |
|
| |
|
|
Total Investments | | 98.97 | % | | $ | 65,668,530 |
Other Assets in Excess of Liabilities | | 1.03 | | | | 686,633 |
| | |
|
| |
|
|
Net Assets | | 100.00 | % | | $ | 66,355,163 |
| | |
|
| |
|
|
See Notes to Financial Statements.
24
Excelsior Funds, Inc.
Portfolio of Investments — March 31, 2006
Core Bond Fund
| | | | | | | | | | |
Principal Amount
| | | | Rate
| | | Maturity
Date
| | Value
|
ASSET BACKED SECURITIES — 0.10% | | | | | | |
| $ 294,473 | | CIT RV Trust,
1999-A A4 | | 6.16 | % | | 06/15/13 | | $ | 294,413 |
| | | | | | | | | |
|
|
| | | TOTAL ASSET BACKED SECURITIES
(Cost $288,434) | | | 294,413 |
| | | | | | | | | |
|
|
COLLATERALIZED MORTGAGE OBLIGATIONS — 13.02% |
| | | NON-GOVERNMENTAL AGENCY COLLATERALIZED MORTGAGE OBLIGATIONS — 8.61% |
| 2,295,956 | | Citigroup Mortgage Loan Trust, 2004-HYB4 WA(a) | | 4.46 | | | 12/25/34 | | | 2,243,580 |
| 2,192,522 | | Countrywide Alternative Loan Trust, 2004-16CB 1A2 | | 5.50 | | | 07/25/34 | | | 2,152,184 |
| 1,409,477 | | Countrywide Alternative Loan Trust, 2004-22CB 1A1 | | 6.00 | | | 10/25/34 | | | 1,395,569 |
| 7,158,083 | | Indymac Index Mortgage Loan Trust, 2004-AR4 3A(a) | | 4.80 | | | 08/25/34 | | | 7,005,424 |
| 9,127,959 | | JP Morgan Mortgage Trust, 2005-A6 1A1(a) | | 5.15 | | | 09/25/35 | | | 9,008,474 |
| 2,657,887 | | Wells Fargo Mortgage Backed Securities Trust, 2004-EE 3A1 | | 3.99 | | | 12/25/34 | | | 2,578,087 |
| | | | | | | | | |
|
|
| | | | | | | | | | | 24,383,318 |
| | | | | | | | | |
|
|
| | | FEDERAL HOME LOAN MORTGAGE CORPORATION — 3.03% |
| 5,208,627 | | 1602 PH | | 6.00 | | | 04/15/23 | | | 5,220,472 |
| 3,296,147 | | 2333 UZ | | 6.50 | | | 07/15/31 | | | 3,347,404 |
| | | | | | | | | |
|
|
| | | | | | | | | | | 8,567,876 |
| | | | | | | | | |
|
|
| | | FEDERAL NATIONAL MORTGAGE
ASSOCIATION— 0.50% |
| 1,430,000 | | 2003-17 QT | | 5.00 | | | 08/25/27 | | | 1,404,289 |
| | | | | | | | | |
|
|
| | | GOVERNMENT NATIONAL MORTGAGE ASSOCIATION — 0.88% |
| 2,450,621 | | 2005-25 B | | 6.21 | | | 03/16/21 | | | 2,486,037 |
| | | | | | | | | |
|
|
| | | TOTAL COLLATERALIZED MORTGAGE OBLIGATIONS
(Cost $37,574,710) | | | 36,841,520 |
| | | | | | | | | |
|
|
| | | | | | | | | | |
Principal Amount
| | | | Rate
| | | Maturity
Date
| | Value
|
COMMERCIAL MORTGAGE-BACKED SECURITIES — 14.54% |
| $ 1,477,000 | | Bank of America Commercial Mortgage, Inc., 2004-1 A4 | | 4.76 | % | | 11/10/39 | | $ | 1,400,650 |
| 3,705,581 | | Chase Commercial Mortgage Securities Corp., 1997-2 D | | 6.60 | | | 12/19/29 | | | 3,771,967 |
| 1,000,000 | | Credit Suisse First Boston Mortgage Securities Corp., 2002-CKS4 G(a)(b) | | 6.01 | | | 11/15/36 | | | 1,016,760 |
| 1,689,000 | | Greenwich Capital Commercial Funding Corp., 2004-GG1 A1 | | 5.32 | | | 06/10/36 | | | 1,659,529 |
| 2,000,000 | | Morgan Stanley Capital I, 1997-C1F(b) | | 6.85 | | | 02/15/20 | | | 2,010,911 |
| 3,601,000 | | Morgan Stanley Capital I, 1999-WF1 B | | 6.32 | | | 11/15/31 | | | 3,675,836 |
| 3,150,000 | | Morgan Stanley Dean Witter Capital I, 2000-LIF2 C | | 7.50 | | | 10/15/33 | | | 3,384,305 |
| 1,969,034 | | Mortgage Capital Funding, Inc., 1996-MC1 G | | 7.15 | | | 06/15/06 | | | 1,965,698 |
| 773,095 | | Mortgage Capital Funding, Inc., 1996-MC2 D | | 7.26 | | | 12/21/26 | | | 776,091 |
| 3,061,000 | | Mortgage Capital Funding, Inc., 1998-MC1 C | | 6.95 | | | 03/18/30 | | | 3,137,019 |
| 2,521,000 | | Nomura Asset Securities Corp., 1998-D6 A4(a) | | 6.92 | | | 03/15/30 | | | 2,828,507 |
| 3,601,000 | | Wachovia Bank Commercial Mortgage Trust, 2003-C9 A3 | | 4.61 | | | 12/15/35 | | | 3,463,240 |
| 2,305,000 | | Wachovia Bank Commercial Mortgage Trust, 2004-C12 A3 | | 5.23 | | | 07/15/41 | | | 2,282,884 |
| 10,000,000 | | Wachovia Bank Commercial Mortgage Trust, 2005-C20 A5(a)(c) | | 5.09 | | | 07/15/42 | | | 9,775,846 |
| | | | | | | | | |
|
|
| | | TOTAL COMMERCIAL MORTGAGE-BACKED SECURITIES
(Cost $41,540,424) | | | 41,149,243 |
| | | | | | | | | |
|
|
See Notes to Financial Statements.
25
Excelsior Funds, Inc.
Portfolio of Investments — March 31, 2006
Core Bond Fund — (continued)
| | | | | | | | | | |
Principal Amount
| | | | Rate
| | | Maturity
Date
| | Value
|
CORPORATE BONDS — 15.06% |
| $ 1,115,000 | | America Movil S.A. de C.V. | | 5.50 | % | | 03/01/14 | | $ | 1,068,607 |
| 2,000,000 | | Bank One Corp. | | 7.88 | | | 08/01/10 | | | 2,180,832 |
| 3,005,000 | | Bottling Group llc | | 5.50 | | | 04/01/16 | | | 2,966,407 |
| 700,000 | | British Telecommunications plc | | 8.88 | | | 12/15/30 | | | 895,497 |
| 2,800,000 | | Cisco Systems, Inc. | | 5.50 | | | 02/22/16 | | | 2,757,941 |
| 1,081,000 | | CIT Group, Inc. | | 5.88 | | | 10/15/08 | | | 1,093,756 |
| 2,000,000 | | Citigroup, INC. | | 4.25 | | | 07/29/09 | | | 1,937,164 |
| 1,441,000 | | Comcast Cable Communications | | 6.88 | | | 06/15/09 | | | 1,490,246 |
| 2,000,000 | | Comcast Cable Communications | | 6.75 | | | 01/30/11 | | | 2,079,016 |
| 1,441,000 | | DaimlerChrysler N.A. Holding Corp. | | 7.20 | | | 09/01/09 | | | 1,504,655 |
| 600,000 | | Entergy Gulf States | | 5.70 | | | 06/01/15 | | | 575,122 |
| 1,000,000 | | Ford Motor Credit Co. | | 8.63 | | | 11/01/10 | | | 958,056 |
| 2,773,000 | | Household Finance Corp. | | 8.00 | | | 07/15/10 | | | 3,025,750 |
| 1,437,000 | | International Lease Finance Corp. | | 4.50 | | | 05/01/08 | | | 1,412,935 |
| 250,000 | | Iron Mountain, Inc. | | 8.63 | | | 04/01/13 | | | 260,000 |
| 2,881,000 | | Merrill Lynch & Co. MTN | | 5.00 | | | 02/03/14 | | | 2,762,940 |
| 2,800,000 | | Morgan Stanley | | 4.75 | | | 04/01/14 | | | 2,612,380 |
| 2,000,000 | | Morgan Stanley Dean Witter | | 6.75 | | | 04/15/11 | | | 2,105,300 |
| 1,690,000 | | Oracle Corp./ Ozark Holdings(b) | | 5.25 | | | 01/15/16 | | | 1,621,205 |
| 1,441,000 | | Prudential Financial, Inc. | | 5.10 | | | 09/20/14 | | | 1,389,778 |
| 627,000 | | PSEG Energy Holdings, Inc. | | 8.63 | | | 02/15/08 | | | 653,648 |
| 2,000,000 | | RBS Capital Trust III(a) | | 5.51 | | | 09/29/49 | | | 1,929,116 |
| 1,596,000 | | Sprint Capital Corp. | | 8.38 | | | 03/15/12 | | | 1,803,320 |
| 1,153,000 | | Time Warner Cos., Inc. | | 7.25 | | | 10/15/17 | | | 1,233,772 |
| 1,441,000 | | Wal-Mart Stores | | 4.13 | | | 02/15/11 | | | 1,364,284 |
| 950,000 | | Xerox Corp. | | 6.40 | | | 03/15/16 | | | 942,875 |
| | | | | | | | | |
|
|
| | | TOTAL CORPORATE BONDS
(Cost $42,975,196) | | | 42,624,602 |
| | | | | | | | | |
|
|
TAX-EXEMPT SECURITIES — 1.31% |
| 3,600,000 | | University of Texas Revenue Bonds, Series B | | 5.00 | | | 08/15/33 | | | 3,702,456 |
| | | | | | | | | |
|
|
| | | TOTAL TAX-EXEMPT SECURITIES
(Cost $3,691,406) | | | 3,702,456 |
| | | | | | | | | |
|
|
| | | | | | | | | | |
Principal Amount
| | | | Rate
| | | Maturity
Date
| | Value
|
U.S. GOVERNMENT AGENCY BONDS & NOTES — 1.83% |
| | | FANNIE MAE (1.83%): |
| $ 5,000,000 | | MTN | | 6.25 | % | | 02/01/11 | | $ | 5,185,515 |
| | | | | | | | | |
|
|
| | | TOTAL U.S. GOVERNMENT AGENCY BONDS & NOTES
(Cost $5,341,117) | | | 5,185,515 |
| | | | | | | | | |
|
|
U.S. GOVERNMENT AGENCY MORTGAGE PASS THROUGH SECURITIES — 32.03% |
| | | FEDERAL HOME LOAN MORTGAGE CORPORATION — 17.14% |
| 10,000,000 | | TBA | | 4.50 | | | 04/01/21 | | | 9,543,751 |
| 2,888,445 | | Pool # A20105 | | 5.00 | | | 04/01/34 | | | 2,753,346 |
| 9,843,702 | | Pool # A47411 | | 4.50 | | | 10/01/35 | | | 9,080,373 |
| 4,901,581 | | Pool # A48132 | | 7.00 | | | 12/01/35 | | | 5,045,327 |
| 2,999,380 | | Pool # C01811 | | 5.00 | | | 04/01/34 | | | 2,859,092 |
| 133,535 | | Pool # C71221 | | 5.00 | | | 09/01/32 | | | 127,467 |
| 4,887,002 | | Pool # G01842 | | 4.50 | | | 06/01/35 | | | 4,508,040 |
| 15,004,026 | | Pool # G18105 | | 5.00 | | | 03/01/21 | | | 14,624,096 |
| | | | | | | | | |
|
|
| | | | | | | | | | | 48,541,492 |
| | | | | | | | | |
|
|
| | | FEDERAL NATIONAL MORTGAGE
ASSOCIATION — 12.51% |
| 11,809,993 | | Pool # 357824 | | 5.50 | | | 06/01/35 | | | 11,531,302 |
| 1,257,935 | | Pool # 387203 | | 4.80 | | | 01/01/12 | | | 1,227,747 |
| 1,074,138 | | Pool # 387204 | | 4.80 | | | 01/01/12 | | | 1,048,361 |
| 3,780,015 | | Pool # 618322 | | 6.00 | | | 12/01/31 | | | 3,785,055 |
| 4,974,463 | | Pool # 805386 ARM(a) | | 4.90 | | | 01/01/35 | | | 4,920,909 |
| 764,261 | | Pool # 812268 | | 5.50 | | | 05/01/35 | | | 746,227 |
| 911,766 | | Pool # 820989 | | 5.50 | | | 04/01/35 | | | 890,251 |
| 909,179 | | Pool # 821567 | | 5.50 | | | 06/01/35 | | | 887,724 |
| 11,234,831 | | Pool # 829321 | | 4.50 | | | 09/01/35 | | | 10,367,019 |
| | | | | | | | | |
|
|
| | | | | | | | | | | 35,404,595 |
| | | | | | | | | |
|
|
| | | GOVERNMENT NATIONAL MORTGAGE ASSOCIATION — 2.38% |
| 389,975 | | Pool # 2562 | | 6.00 | | | 03/20/28 | | | 394,022 |
| 596,534 | | Pool # 267812 | | 8.50 | | | 06/15/17 | | | 640,097 |
| 2,164,434 | | Pool # 3413 | | 4.50 | | | 07/20/33 | | | 2,018,927 |
| 1,983,052 | | Pool # 3442 | | 5.00 | | | 09/20/33 | | | 1,916,383 |
| 36,385 | | Pool # 532751 | | 9.00 | | | 08/15/30 | | | 39,616 |
| 109,246 | | Pool # 568670 | | 6.50 | | | 04/15/32 | | | 113,284 |
| 300,160 | | Pool # 780548 | | 8.50 | | | 12/15/17 | | | 321,070 |
| 291,452 | | Pool # 780865 | | 9.50 | | | 11/15/17 | | | 318,467 |
| 538,300 | | Pool # 781084 | | 9.00 | | | 12/15/17 | | | 577,178 |
| 390,606 | | Pool # 80311 ARM(a) | | 4.50 | | | 08/20/29 | | | 390,282 |
| | | | | | | | | |
|
|
| | | | | | | | | | | 6,729,326 |
| | | | | | | | | |
|
|
| | | TOTAL U.S. GOVERNMENT AGENCY MORTGAGE PASS THROUGH SECURITIES
(Cost $91,989,929) | | | 90,675,413 |
| | | | | | | | | |
|
|
See Notes to Financial Statements.
26
Excelsior Funds, Inc.
Portfolio of Investments — March 31, 2006
Core Bond Fund — (continued)
| | | | | | | | | | |
Principal Amount
| | | | Rate
| | | Maturity
Date
| | Value
|
U.S. GOVERNMENT SECURITIES — 17.81% |
| | | U.S. TREASURY STRIPS — 4.46% |
| $ 22,600,000 | | | | 0.00 | % | | 11/15/17 | | $ | 12,633,174 |
| | | | | | | | | |
|
|
| | | U.S. TREASURY INFLATION PROTECTED
BONDS — 0.83% |
| 300,000 | | | | 4.25 | | | 01/15/10 | | | 379,904 |
| 2,000,000 | | | | 0.88 | | | 04/15/10 | | | 1,982,919 |
| | | | | | | | | |
|
|
| | | | | | | | | | | 2,362,823 |
| | | | | | | | | |
|
|
| | | U.S. TREASURY NOTES — 12.52% |
| 7,700,000 | | | | 3.63 | | | 01/15/10 | | | 7,381,774 |
| 12,000,000 | | | | 4.50 | | | 11/15/10 | | | 11,838,720 |
| 11,955,000 | | (c) | | 7.63 | | | 11/15/22 | | | 15,346,299 |
| 885,000 | | | | 4.50 | | | 02/15/36 | | | 830,379 |
| | | | | | | | | |
|
|
| | | | | | | | | | | 35,397,172 |
| | | | | | | | | |
|
|
| | | TOTAL U.S. GOVERNMENT SECURITIES
(Cost $52,096,327) | | | 50,393,169 |
| | | | | | | | | |
|
|
| | | | |
Shares
| | | | | | | | | |
REGISTERED INVESTMENT COMPANIES — 2.16% |
| 3,052,268 | | Dreyfus Government Cash Management Fund | | | 3,052,268 |
| 3,052,268 | | Fidelity U.S. Treasury II Fund | | | 3,052,267 |
| | | | | | | | | |
|
|
| | | TOTAL REGISTERED INVESTMENT COMPANIES
(Cost $6,104,535) | | | 6,104,535 |
| | | | | | | | | |
|
|
| | | | | | |
| | |
| | | | | | Value
|
TOTAL INVESTMENTS
(Cost $281,602,078)(d) | | 97.86 | % | | $ | 276,970,866 |
OTHER ASSETS IN EXCESS OF LIABILITIES | | 2.14 | | | | 6,045,059 |
| | |
|
| |
|
|
NET ASSETS | | 100.00 | % | | $ | 283,015,925 |
| | |
|
| |
|
|
| (a) | Variable Rate Security—The rate disclosed is as of March 31, 2006. |
| (b) | Security exempt from registration under Rule 144A of the Securities Act of 1933. This security may be resold in transactions exempt from registration, normally to qualified institutional buyers. At March 31, 2006, these securities amounted to $4,648,876 or 1.64% of net assets. |
| (c) | All or part of the security is segregated by the Fund’s custodian to cover future purchase commitments. |
| (d) | Unrealized appreciation (depreciation) of securities: |
| | | | | | | | | |
Unrealized
Appreciation
| | Unrealized
(Depreciation)
| | | Net Unrealized
Appreciation/
(Depreciation)
| |
| $ | 760,868 | | $ | (5,392,080 | ) | | $ | (4,631,212 | ) |
ARM—Adjustable Rate Mortgage
llc—limited liability company
MTN—Medium Term Note
plc—public limited company
STRIPS—Separately Traded Registered Interest and Principal Securities
The summary of the Fund’s investments as of March 31, 2006 is as follows: (Unaudited)
| | | | | | |
Portfolio Diversification
| | % of
Net
Assets
| | | Value
|
U.S. Government & Agency Securities | | 51.67 | % | | $ | 146,254,097 |
Corporate Bonds | | 15.06 | | | | 42,624,602 |
Commercial Mortgage-Backed Securities | | 14.54 | | | | 41,149,243 |
Collateralized Mortgage Obligations | | 13.02 | | | | 36,841,520 |
Registered Investment Companies | | 2.16 | | | | 6,104,535 |
Tax-Exempt Securities | | 1.31 | | | | 3,702,456 |
Asset Backed Securities | | 0.10 | | | | 294,413 |
| | |
|
| |
|
|
Total Investments | | 97.86 | % | | $ | 276,970,866 |
Other Assets in Excess of Liabilities | | 2.14 | | | | 6,045,059 |
| | |
|
| |
|
|
Net Assets | | 100.00 | % | | $ | 283,015,925 |
| | |
|
| |
|
|
See Notes to Financial Statements.
27
Excelsior Funds Trust
Portfolio of Investments — March 31, 2006
High Yield Fund
| | | | | | | | | | |
Principal
Amount
| | | | Rate
| | | Maturity
Date
| | Value
|
CORPORATE BONDS — 88.98% |
| | | ADVERTISING PERIODICALS — 2.16% |
| $2,000,000 | | Dex Media Finance/West | | 8.50 | % | | 08/15/10 | | $ | 2,115,000 |
| 1,000,000 | | RH Donnelley Finance Corp.(a) | | 10.88 | | | 12/15/12 | | | 1,108,750 |
| | | | | | | | | |
|
|
| | | | | | | | | | | 3,223,750 |
| | | | | | | | | |
|
|
| | | AGRICULTURAL CHEMICALS — 0.96% |
| 1,298,000 | | Terra Capital, Inc. | | 11.50 | | | 06/01/10 | | | 1,434,290 |
| | | | | | | | | |
|
|
| | | AUTO – TRUCK PARTS & EQUIPMENT — 0.67% |
| 1,000,000 | | Tenneco Automotive, Inc. | | 8.63 | | | 11/15/14 | | | 1,000,000 |
| | | | | | | | | |
|
|
| | | CABLE TV — 1.32% |
| 1,000,000 | | Charter Communications Holdings II | | 10.25 | | | 09/15/10 | | | 982,500 |
| 1,000,000 | | Echostar DBS Corp.(a) | | 7.13 | | | 02/01/16 | | | 983,750 |
| | | | | | | | | |
|
|
| | | | | | | | | | | 1,966,250 |
| | | | | | | | | |
|
|
| | | CASINO HOTELS — 10.25% |
| 1,000,000 | | Aztar Corp. | | 7.88 | | | 06/15/14 | | | 1,082,500 |
| 1,000,000 | | Boyd Gaming Corp. | | 8.75 | | | 04/15/12 | | | 1,067,500 |
| 2,000,000 | | Caesars Entertainment, Inc. | | 8.88 | | | 09/15/08 | | | 2,140,000 |
| 2,000,000 | | Kerzner International | | 6.75 | | | 10/01/15 | | | 2,105,000 |
| 2,000,000 | | MGM Mirage, Inc. | | 8.50 | | | 09/15/10 | | | 2,139,999 |
| 2,000,000 | | Poster Financial Group | | 8.75 | | | 12/01/11 | | | 2,105,000 |
| 1,000,000 | | Resorts International Hotel and Casino, Inc. | | 11.50 | | | 03/15/09 | | | 1,097,500 |
| 1,000,000 | | River Rock Entertainment | | 9.75 | | | 11/01/11 | | | 1,080,000 |
| 1,000,000 | | Station Casinos | | 6.50 | | | 02/01/14 | | | 988,750 |
| 1,500,000 | | Trump Entertainment Resorts | | 8.50 | | | 06/01/15 | | | 1,458,750 |
| | | | | | | | | |
|
|
| | | | | | | | | | | 15,264,999 |
| | | | | | | | | |
|
|
| | | CELLULAR TELECOM — 2.86% |
| 2,000,000 | | American Cellular Corp. | | 10.00 | | | 08/01/11 | | | 2,170,000 |
| 1,000,000 | | Centennial Cellular Operating Co./Centennial Communications Corp. | | 10.13 | | | 06/15/13 | | | 1,092,500 |
| 1,000,000 | | Dobson Communications Corp. | | 8.88 | | | 10/01/13 | | | 1,005,000 |
| | | | | | | | | |
|
|
| | | | | | | | | | | 4,267,500 |
| | | | | | | | | |
|
|
| | | | | | | | | | |
Principal
Amount
| | | | Rate
| | | Maturity
Date
| | Value
|
CORPORATE BONDS — (continued) |
| | | CHEMICALS – DIVERSIFIED — 3.54% |
| $2,000,000 | | Equistar Chemicals L.P./ Equistar Funding Corp. | | 10.63 | % | | 05/01/11 | | $ | 2,165,000 |
| 500,000 | | Lyondell Chemical Co. | | 9.50 | | | 12/15/08 | | | 520,000 |
| 1,000,000 | | Lyondell Chemical Co. | | 10.50 | | | 06/01/13 | | | 1,107,500 |
| 1,500,000 | | Nell AF Sarl(a) | | 8.38 | | | 08/15/15 | | | 1,488,750 |
| | | | | | | | | |
|
|
| | | | | | | | | | | 5,281,250 |
| | | | | | | | | |
|
|
| | | CHEMICALS – PLASTICS — 0.69% |
| 1,000,000 | | PolyOne Corp. | | 8.88 | | | 05/01/12 | | | 1,025,000 |
| | | | | | | | | |
|
|
| | | CHEMICALS – SPECIALTY — 1.39% |
| 1,000,000 | | Johnsondiversey, Inc., Series B | | 9.63 | | | 05/15/12 | | | 1,026,250 |
| 1,000,000 | | Tronox Worldwide(a) | | 9.50 | | | 12/01/12 | | | 1,050,000 |
| | | | | | | | | |
|
|
| | | | | | | | | | | 2,076,250 |
| | | | | | | | | |
|
|
| | | COAL — 0.33% |
| 500,000 | | Massey Energy Co.(a) | | 6.88 | | | 12/15/13 | | | 490,000 |
| | | | | | | | | |
|
|
| | | COMMERCIAL SERVICES — 2.07% |
| 2,000,000 | | Iron Mountain, Inc. | | 8.63 | | | 04/01/13 | | | 2,080,000 |
| 1,000,000 | | Iron Mountain, Inc. | | 7.75 | | | 01/15/15 | | | 1,007,500 |
| | | | | | | | | |
|
|
| | | | | | | | | | | 3,087,500 |
| | | | | | | | | |
|
|
| | | CONTAINERS – METAL/GLASS — 2.05% |
| 1,000,000 | | Crown Americas llc/Crown Americas Capital Corp.(a). | | 7.75 | | | 11/15/15 | | | 1,037,500 |
| 2,000,000 | | Owens-Illinois, Inc. | | 7.50 | | | 05/15/10 | | | 2,025,000 |
| | | | | | | | | |
|
|
| | | | | | | | | | | 3,062,500 |
| | | | | | | | | |
|
|
| | | CONTAINERS – PAPER/PLASTIC — 2.76% |
| 1,000,000 | | Graham Packaging Co. | | 8.50 | | | 10/15/12 | | | 1,010,000 |
| 1,000,000 | | Pregis Corp.(a) | | 12.38 | | | 10/15/13 | | | 1,050,000 |
| 2,000,000 | | Stone Container Corp. | | 9.75 | | | 02/01/11 | | | 2,055,000 |
| | | | | | | | | |
|
|
| | | | | | | | | | | 4,115,000 |
| | | | | | | | | |
|
|
| | | COSMETICS & TOILETRIES — 0.54% |
| 1,000,000 | | Del Laboratories, Inc. | | 8.00 | | | 02/01/12 | | | 810,000 |
| | | | | | | | | |
|
|
| | | DISTRIBUTION/WHOLESALE — 1.23% |
| 2,000,000 | | Nebraska Book Co. | | 8.63 | | | 03/15/12 | | | 1,840,000 |
| | | | | | | | | |
|
|
| | | ELECTRIC – GENERATION — 1.08% |
| 1,500,000 | | AES Corp. | | 9.50 | | | 06/01/09 | | | 1,616,250 |
| | | | | | | | | |
|
|
See Notes to Financial Statements.
28
Excelsior Funds Trust
Portfolio of Investments — March 31, 2006
High Yield Fund — (continued)
| | | | | | | | | | |
Principal
Amount
| | | | Rate
| | | Maturity
Date
| | Value
|
CORPORATE BONDS — (continued) |
| | | FINANCE – AUTO LOANS — 3.98% |
| $2,000,000 | | Ford Motor Credit Co. | | 6.50 | % | | 01/25/07 | | $ | 1,992,344 |
| 2,000,000 | | General Motors Acceptance Corp. | | 6.13 | | | 02/01/07 | | | 1,969,126 |
| 2,000,000 | | General Motors Acceptance Corp. | | 7.75 | | | 01/19/10 | | | 1,950,022 |
| | | | | | | | | |
|
|
| | | | | | | | | | | 5,911,492 |
| | | | | | | | | |
|
|
| | | FOOD – MISCELLANEOUS AND DIVERSIFIED — 0.71% |
| 1,000,000 | | Del Monte Corp. | | 8.63 | | | 12/15/12 | | | 1,056,250 |
| | | | | | | | | |
|
|
| | | FORESTRY — 0.61% | | | | | | |
| 1,500,000 | | Tembec Industries, Inc. | | 8.63 | | | 06/30/09 | | | 903,750 |
| | | | | | | | | |
|
|
| | | FUNERAL SERVICES & RELATED ITEMS — 1.02% |
| 1,500,000 | | Service Corp. International(a) | | 7.50 | | | 06/15/17 | | | 1,526,250 |
| | | | | | | | | |
|
|
| | | GAS – DISTRIBUTION — 1.39% |
| 2,000,000 | | SEMCO Energy, Inc. | | 7.75 | | | 05/15/13 | | | 2,072,824 |
| | | | | | | | | |
|
|
| | | HEAVY CONSTRUCTION EQUIPMENT
RENTAL — 0.35% |
| 500,000 | | Ahern Rentals, Inc.(b) | | 9.25 | | | 08/15/13 | | | 521,250 |
| | | | | | | | | |
|
|
| | | HOME FURNISHINGS — 2.70% |
| 2,000,000 | | Sealy Mattress Co. | | 8.25 | | | 06/15/14 | | | 2,090,000 |
| 2,000,000 | | Simmons Co. | | 7.88 | | | 01/15/14 | | | 1,935,000 |
| | | | | | | | | |
|
|
| | | | | | | | | | | 4,025,000 |
| | | | | | | | | |
|
|
| | | INDEPENDENT POWER PRODUCER — 0.68% |
| 1,000,000 | | NRG Energy, Inc. | | 7.25 | | | 02/01/14 | | | 1,016,250 |
| | | | | | | | | |
|
|
| | | LIFE/HEALTH INSURANCE — 1.35% |
| 2,000,000 | | Americo Life, Inc.(a) | | 7.88 | | | 05/01/13 | | | 2,015,928 |
| | | | | | | | | |
|
|
| | | MACHINERY – FARM — 0.33% |
| 500,000 | | Case New Holland, Inc.(a) | | 7.13 | | | 03/01/14 | | | 493,750 |
| | | | | | | | | |
|
|
| | | MACHINERY – GENERAL INDUSTRIAL — 0.68% |
| 1,000,000 | | The Manitowoc Co., Inc. | | 7.13 | | | 11/01/13 | | | 1,020,000 |
| | | | | | | | | |
|
|
| | | MEDICAL – HOSPITALS — 1.40% |
| 1,000,000 | | HCA, Inc. | | 8.75 | | | 09/01/10 | | | 1,084,663 |
| 1,000,000 | | IASIS Healthcare llc/ IASIS Capital Corp. | | 8.75 | | | 06/15/14 | | | 1,000,000 |
| | | | | | | | | |
|
|
| | | | | | | | | | | 2,084,663 |
| | | | | | | | | |
|
|
| | | MEDICAL – OUTPATIENT/HOME MEDICAL
CARE — 0.61% |
| 1,000,000 | | Select Medical Corp. | | 7.63 | | | 02/01/15 | | | 902,500 |
| | | | | | | | | |
|
|
| | | | | | | | | | |
Principal
Amount
| | | | Rate
| | | Maturity
Date
| | Value
|
CORPORATE BONDS — (continued) |
| | | MEDICAL PRODUCTS — 0.68% |
| $1,000,000 | | Encore Medical IHC, Inc. | | 9.75 | % | | 10/01/12 | | $ | 1,010,000 |
| | | | | | | | | |
|
|
| | | MISCELLANEOUS MANUFACTURING — 0.66% |
| 1,000,000 | | Intertape Polymer US, Inc. | | 8.50 | | | 08/01/14 | | | 985,000 |
| | | | | | | | | |
|
|
| | | MULTI-LINE INSURANCE — 1.44% |
| 2,128,000 | | Hanover Insurance Group | | 7.63 | | | 10/15/25 | | | 2,150,170 |
| | | | | | | | | |
|
|
| | | MULTIMEDIA — 1.30% |
| 2,000,000 | | Emmis Operating Co. | | 6.88 | | | 05/15/12 | | | 1,930,000 |
| | | | | | | | | |
|
|
| | | MUSIC — 1.06% |
| 1,600,000 | | Warner Music Group | | 7.38 | | | 04/15/14 | | | 1,584,000 |
| | | | | | | | | |
|
|
| | | NON-HAZARDOUS WASTE DISPOSAL — 1.41% |
| 2,000,000 | | Allied Waste North America | | 8.88 | | | 04/01/08 | | | 2,100,000 |
| | | | | | | | | |
|
|
| | | OFFICE AUTOMATION & EQUIPMENT — 2.45% |
| 1,000,000 | | Ikon Office Solutions | | 7.75 | | | 09/15/15 | | | 1,032,500 |
| 1,000,000 | | Xerox Capital Trust I | | 8.00 | | | 02/01/27 | | | 1,035,000 |
| 1,500,000 | | Xerox Corp. | | 7.63 | | | 06/15/13 | | | 1,578,750 |
| | | | | | | | | |
|
|
| | | | | | | | | | | 3,646,250 |
| | | | | | | | | |
|
|
| | | OIL COMPANY – EXPLORATION &
PRODUCTION — 1.35% |
| 1,000,000 | | Chesapeake Energy Corp. | | 6.50 | | | 08/15/17 | | | 987,500 |
| 1,000,000 | | Kerr-McGee Corp. | | 6.95 | | | 07/01/24 | | | 1,017,288 |
| | | | | | | | | |
|
|
| | | | | | | | | | | 2,004,788 |
| | | | | | | | | |
|
|
| | | OIL-FIELD SERVICES — 0.33% |
| 500,000 | | Allis-Chalmers Energy, Inc.(a) | | 9.00 | | | 01/15/14 | | | 492,500 |
| | | | | | | | | |
|
|
| | | PAPER & RELATED PRODUCTS — 1.20% |
| 1,000,000 | | Mercer International, Inc. | | 9.25 | | | 02/15/13 | | | 890,000 |
| 890,000 | | Norske Skog Canada, Series D | | 8.63 | | | 06/15/11 | | | 894,450 |
| | | | | | | | | |
|
|
| | | | | | | | | | | 1,784,450 |
| | | | | | | | | |
|
|
| | | PHYSICIANS PRACTICE MANAGEMENT — 2.44% |
| 2,000,000 | | Ameripath, Inc. | | 10.50 | | | 04/01/13 | | | 2,110,000 |
| 500,000 | | US Oncology Holdings, Inc. | | 9.00 | | | 08/15/12 | | | 517,500 |
| 1,000,000 | | US Oncology Holdings, Inc.(a)(c) | | 9.26 | | | 03/15/15 | | | 1,002,500 |
| | | | | | | | | |
|
|
| | | | | | | | | | | 3,630,000 |
| | | | | | | | | |
|
|
See Notes to Financial Statements.
29
Excelsior Funds Trust
Portfolio of Investments — March 31, 2006
High Yield Fund — (continued)
| | | | | | | | | | |
Principal
Amount
| | | | Rate
| | | Maturity
Date
| | Value
|
CORPORATE BONDS — (continued) |
| | | PIPELINES — 0.67% |
| $ 500,000 | | Semgroup L.P.(a) | | 8.75 | % | | 11/15/15 | | $ | 510,000 |
| 500,000 | | Williams Cos.(a) | | 6.38 | | | 10/01/10 | | | 495,000 |
| | | | | | | | | |
|
|
| | | | | | | | | | | 1,005,000 |
| | | | | | | | | |
|
|
| | | PRIVATE CORRECTIONS — 0.17% |
| 250,000 | | Corrections Corp. of America | | 6.75 | | | 01/31/14 | | | 252,813 |
| | | | | | | | | |
|
|
| | | RENTAL AUTO/EQUIPMENT — 2.41% |
| 1,000,000 | | Neff Rental/ Neff Finance(a) | | 11.25 | | | 06/15/12 | | | 1,085,000 |
| 2,500,000 | | United Rentals, Inc. | | 7.75 | | | 11/15/13 | | | 2,500,000 |
| | | | | | | | | |
|
|
| | | | | | | | | | | 3,585,000 |
| | | | | | | | | |
|
|
| | | RESORTS/THEME PARKS — 1.70% |
| 1,500,000 | | Six Flags, Inc. | | 9.63 | | | 06/01/14 | | | 1,511,250 |
| 1,000,000 | | Universal City Florida Holdings(c) | | 9.43 | | | 05/01/10 | | | 1,015,000 |
| | | | | | | | | |
|
|
| | | | | | | | | | | 2,526,250 |
| | | | | | | | | |
|
|
| | | RETAIL – DRUG STORE — 1.59% |
| 1,000,000 | | Jean Coutu Group, Inc. | | 8.50 | | | 08/01/14 | | | 917,500 |
| 1,500,000 | | Rite Aid Corp.(a) | | 6.13 | | | 12/15/08 | | | 1,458,750 |
| | | | | | | | | |
|
|
| | | | | | | | | | | 2,376,250 |
| | | | | | | | | |
|
|
| | | RETAIL – MAJOR DEPARTMENT STORE — 2.53% |
| 1,500,000 | | JC Penney Co., Inc. | | 8.00 | | | 03/01/10 | | | 1,614,870 |
| 1,000,000 | | Neiman Marcus Group, Inc.(a) | | 9.00 | | | 10/15/15 | | | 1,057,500 |
| 1,000,000 | | Saks, Inc. | | 9.88 | | | 10/01/11 | | | 1,105,000 |
| | | | | | | | | |
|
|
| | | | | | | | | | | 3,777,370 |
| | | | | | | | | |
|
|
| | | RETAIL – VIDEO RENTAL — 1.17% |
| 2,000,000 | | Blockbuster, Inc.(a) (c) | | 10.00 | | | 09/01/12 | | | 1,750,000 |
| | | | | | | | | |
|
|
| | | SATELLITE TELECOM — 1.14% |
| 650,000 | | Inmarsat Finance plc | | 7.63 | | | 06/30/12 | | | 666,250 |
| 1,000,000 | | Intelsat Ltd. | | 8.63 | | | 01/15/15 | | | 1,032,500 |
| | | | | | | | | |
|
|
| | | | | | | | | | | 1,698,750 |
| | | | | | | | | |
|
|
| | | SCHOOLS — 0.96% |
| 1,500,000 | | Knowledge Learning Center(a) | | 7.75 | | | 02/01/15 | | | 1,428,750 |
| | | | | | | | | |
|
|
| | | STEEL – PRODUCERS — 2.32% |
| 2,000,000 | | AK Steel Corp. | | 7.75 | | | 06/15/12 | | | 2,022,500 |
| 1,298,000 | | United States Steel, Inc. | | 10.75 | | | 08/01/08 | | | 1,427,800 |
| | | | | | | | | |
|
|
| | | | | | | | | | | 3,450,300 |
| | | | | | | | | |
|
|
| | | | | | | | | | |
Principal
Amount
| | | | Rate
| | | Maturity
Date
| | Value
|
CORPORATE BONDS — (continued) |
| | | TELEPHONE – INTERGRATED — 8.31% |
| $2,000,000 | | Cincinnati Bell, Inc. | | 8.38 | % | | 01/15/14 | | $ | 2,032,500 |
| 2,000,000 | | Citizens Communications | | 9.25 | | | 05/15/11 | | | 2,195,000 |
| 649,000 | | Consolidated Communications Holding | | 9.75 | | | 04/01/12 | | | 687,940 |
| 1,000,000 | | Eircom Funding | | 8.25 | | | 08/15/13 | | | 1,076,250 |
| 2,500,000 | | Hawaiian Telcom Communication(a) | | 12.50 | | | 05/01/15 | | | 2,475,000 |
| 777,000 | | Madison River Capital llc/ Madison River Financial Corp. | | 13.25 | | | 03/01/10 | | | 815,850 |
| 1,000,000 | | Qwest Capital Funding | | 7.75 | | | 02/15/31 | | | 1,017,500 |
| 1,000,000 | | Qwest Corp. | | 7.50 | | | 06/15/23 | | | 1,016,250 |
| 1,000,000 | | Valor Telecom Enterprise | | 7.75 | | | 02/15/15 | | | 1,047,500 |
| | | | | | | | | |
|
|
| | | | | | | | | | | 12,363,790 |
| | | | | | | | | |
|
|
| | | TRANSPORTATION – MARINE — 0.73% |
| 1,000,000 | | Overseas Shipholding Group | | 8.75 | | | 12/01/13 | | | 1,095,000 |
| | | | | | | | | |
|
|
| | | TRANSPORTATION – RAIL — 1.25% |
| 1,750,000 | | Kansas City Southern | | 9.50 | | | 10/01/08 | | | 1,868,125 |
| | | | | | | | | |
|
|
| | | TOTAL CORPORATE BONDS
(Cost $131,097,810) | | | 132,605,002 |
| | | | | | | | | |
|
|
BANK LOANS — 1.64% |
| | | CASINO HOTELS — 0.96% |
| 1,443,172 | | Resorts International Holdings llc(c) | | 12.47 | | | 04/26/13 | | | 1,435,956 |
| | | | | | | | | |
|
|
| | | MISCELLANEOUS MANUFACTURING — 0.68% |
| 1,000,000 | | IPC Acquistion Corp.(c) | | 12.09 | | | 08/05/12 | | | 1,015,000 |
| | | | | | | | | |
|
|
| | | TOTAL BANK LOANS
(Cost $2,451,766) | | | 2,450,956 |
| | | | | | | | | |
|
|
| | | | |
Shares
| | | | | | | | | |
COMMON STOCK — 2.82% |
| | | METAL – ALUMINUM — 2.82% |
| 28,047 | | Ormet Corp. (a) | | | 4,207,050 |
| | | | | | | | | |
|
|
| | | TOTAL COMMON STOCK
(Cost $7,704,681) | | | 4,207,050 |
| | | | | | | | | |
|
|
See Notes to Financial Statements.
30
Excelsior Funds Trust
Portfolio of Investments — March 31, 2006
High Yield Fund — (continued)
| | | | | | | | | | |
Principal
Amount
| | | | Rate
| | | Maturity
Date
| | Value
|
U.S. GOVERNMENT AGENCY BONDS & NOTES — 5.37% |
| | | FEDERAL HOME LOAN BANK — 5.37% |
| $8,000,000 | | Discount Note | | 4.60 | % | | 04/03/06 | | $ | 7,997,956 |
| | | | | | | | | |
|
|
| | | TOTAL U.S. GOVERNMENT
AGENCY BONDS & NOTES
(Cost $7,997,956) | | | 7,997,956 |
| | | | | | | | | |
|
|
| | | | | | |
TOTAL INVESTMENTS
(Cost $149,252,213) (d) | | 98.81 | % | | $ | 147,260,964 |
OTHER ASSETS IN EXCESS OF LIABILITIES | | 1.19 | | | | 1,774,875 |
| | |
|
| |
|
|
NET ASSETS | | 100.00 | % | | $ | 149,035,839 |
| | |
|
| |
|
|
| (a) | Security exempt from registration under Rule 144A of the Securities Act of 1933. This security may be resold in transactions exempt from registration, normally to qualified institutional buyers. At March 31, 2006, these securities amounted to $27,206,728 or 18.26% of net assets. |
| (b) | All or part of the security is segregated by the Fund’s custodian to cover future purchase commitments. |
| (c) | Variable Rate Security—The rate disclosed is as of March 31, 2006. |
| (d) | Unrealized appreciation (depreciation) of securities: |
| | | | |
Unrealized
Appreciation
| | Unrealized
(Depreciation)
| | Net Unrealized
Appreciation/
(Depreciation)
|
| $2,922,653 | | $(4,913,902) | | $(1,991,249) |
Discount Note—The rate reported on the Portfolio of Investments is the discount rate at the time of purchase.
llc—Limited Liability Company
L.P.—Limited Partnership
Ltd.—Limited
plc—public limited company
The summary of the Fund’s investments as of March 31, 2006 is as follows: (Unaudited)
| | | | | | |
Sector Diversification
| | % of
Net
Assets
| | | Value
|
Consumer Discretionary | | 37.97 | % | | $ | 56,588,193 |
Raw/Intermediate Materials | | 19.42 | | | | 28,936,090 |
Telecommunication | | 11.85 | | | | 17,663,790 |
Health Care | | 6.14 | | | | 9,153,413 |
Industrials | | 5.97 | | | | 8,901,563 |
U.S. Government & Agency Obligations | | 5.37 | | | | 7,997,956 |
Financials | | 2.79 | | | | 4,166,097 |
Energy | | 2.69 | | | | 4,003,538 |
Utilities | | 2.48 | | | | 3,689,074 |
Technology | | 2.20 | | | | 3,280,000 |
Consumer Staples | | 1.25 | | | | 1,866,250 |
Information Technology | | 0.68 | | | | 1,015,000 |
| | |
|
| |
|
|
Total Investments | | 98.81 | % | | $ | 147,260,964 |
Other Assets in Excess of Liabilities | | 1.19 | | | | 1,774,875 |
| | |
|
| |
|
|
Net Assets | | 100.00 | % | | $ | 149,035,839 |
| | |
|
| |
|
|
See Notes to Financial Statements.
31
Excelsior Funds, Inc.
Portfolio of Investments — March 31, 2006
Intermediate-Term Bond Fund
| | | | | | | | | | | |
Principal
Amount
| | | | Rate
| | | Maturity
Date
| | Value
|
| | ASSET BACKED SECURITIES — 3.48% |
| $ | 2,000,000 | | Capital One Master Trust, 2001-6 C(a) | | 6.70 | % | | 06/15/11 | | $ | 2,054,376 |
| | 346,368 | | Chase Funding Mortgage Loan Asset Backed Certificates, 2003-3 2A2(b) | | 5.09 | | | 04/25/33 | | | 347,062 |
| | 8,725,000 | | Citibank Credit Card Issuance Trust, 2003-A4, A4(b) | | 5.00 | | | 03/20/09 | | | 8,728,719 |
| | 4,092,323 | | JP Morgan Mortgage Acquisition Corp., 2006-HE1 A2(b) | | 4.65 | | | 05/25/28 | | | 4,092,292 |
| | | | | | | | | | |
|
|
| | | | TOTAL ASSET BACKED SECURITIES (Cost $15,330,187) | | | 15,222,449 |
| | | | | | | | | | |
|
|
| | COLLATERALIZED MORTGAGE OBLIGATIONS — 9.89% |
| | | | NON-GOVERNMENTAL AGENCY COLLATERALIZED MORTGAGE OBLIGATIONS — 4.26% |
| | 1,513,379 | | Bank of America Mortgage Securities, 2003-A 2A1 | | 3.98 | | | 02/25/33 | | | 1,490,737 |
| | 3,277,663 | | Bear Stearns ARM, 2004-1 11A3(b) | | 3.41 | | | 04/25/34 | | | 3,255,865 |
| | 4,062,793 | | Countrywide Alternative Loan Trust, 2004-22CB 1A1 | | 6.00 | | | 10/25/34 | | | 4,022,703 |
| | 462,597 | | Indymac Index Mortgage Loan Trust, 2004-AR4 3A(b) | | 4.80 | | | 08/25/34 | | | 452,731 |
| | 3,322,000 | | Washington Mutual, 2005-AR5 A3(b) | | 4.68 | | | 05/25/35 | | | 3,261,078 |
| | 2,537,841 | | Wells Fargo Mortgage Backed Securities Trust,
2004-EE 3A1(b) | | 3.99 | | | 12/25/34 | | | 2,461,645 |
| | 3,724,427 | | Wells Fargo Mortgage Backed Securities Trust,
2005-AR1 1A1(b) | | 4.55 | | | 02/25/35 | | | 3,632,429 |
| | | | | | | | | | |
|
|
| | | | | | | | | | | | 18,577,188 |
| | | | | | | | | | |
|
|
| | | | FEDERAL HOME LOAN MORTGAGE
CORPORATION — 1.01% |
| | 389,488 | | 2386 QH | | 6.50 | | | 10/15/30 | | | 389,402 |
| | 4,152,050 | | R001 AE | | 4.38 | | | 04/15/15 | | | 4,039,482 |
| | | | | | | | | | |
|
|
| | | | | | | | | | | | 4,428,884 |
| | | | | | | | | | |
|
|
| | | | | | | | | | | |
Principal
Amount
| | | | Rate
| | | Maturity
Date
| | Value
|
| | COLLATERALIZED MORTGAGE OBLIGATIONS — (continued) |
| | | | FEDERAL NATIONAL MORTGAGE
ASSOCIATION — 2.80% |
| $ | 9,000,000 | | 1997-M5 C | | 6.74 | % | | 08/25/07 | | $ | 9,115,044 |
| | 3,200,000 | | 2003-17 QT | | 5.00 | | | 08/25/27 | | | 3,142,465 |
| | | | | | | | | | |
|
|
| | | | | | | | | | | | 12,257,509 |
| | | | | | | | | | |
|
|
| | | | GOVERNMENT NATIONAL MORTGAGE ASSOCIATION — 1.82% |
| | 2,800,000 | | 2005-10 MW | | 4.67 | | | 09/16/25 | | | 2,685,214 |
| | 2,925,000 | | 2005-14 B | | 4.48 | | | 08/16/32 | | | 2,792,633 |
| | 2,555,000 | | 2006-8 A(b) | | 3.94 | | | 08/16/25 | | | 2,467,785 |
| | | | | | | | | | |
|
|
| | | | | | | | | | | | 7,945,632 |
| | | | | | | | | | |
|
|
| | | | TOTAL COLLATERALIZED MORTGAGE OBLIGATIONS
(Cost $44,084,637) | | | 43,209,213 |
| | | | | | | | | | |
|
|
| | COMMERCIAL MORTGAGE-BACKED SECURITIES — 15.70% |
| | 2,000,000 | | Commercial Mortgage Asset Trust, 1999-C1 B | | 7.23 | | | 01/17/32 | | | 2,208,046 |
| | 3,556,000 | | Commercial Mortgage Asset Trust, 1999-C2 C | | 7.80 | | | 11/17/32 | | | 4,072,543 |
| | 3,325,000 | | Credit Suisse First Boston Mortgage Securities Corp., 2002-CP5 G(a)(b) | | 5.88 | | | 12/15/35 | | | 3,338,801 |
| | 3,137,747 | | DLJ Mortgage Acceptance Corp., 1997-CF2 A1B(a) | | 6.82 | | | 10/15/30 | | | 3,180,216 |
| | 3,900,000 | | GMAC Commercial Mortgage Securities, Inc., 1999-C1 C | | 6.59 | | | 05/15/33 | | | 4,018,171 |
| | 7,197,000 | | JP Morgan Chase Commercial Mortgage Securities Corp.,
2005-CB12 AJ(b) | | 4.99 | | | 09/12/37 | | | 6,834,332 |
| | 4,500,000 | | JP Morgan Chase Commercial Mortgage Securities Corp., 2005-LDP2 A4 | | 4.74 | | | 07/15/42 | | | 4,225,403 |
| | 5,430,000 | | JP Morgan Chase Commercial Mortgage Securities Corp., 2005-LDP5 AJ(b) | | 5.30 | | | 12/15/44 | | | 5,314,536 |
| | 1,466,011 | | LB-UBS Commercial Mortgage Trust, 2001-C2 A1 | | 6.27 | | | 06/15/20 | | | 1,493,903 |
| | 3,085,000 | | Morgan Stanley Dean Witter Capital I, 2003-TOP9 A2 | | 4.74 | | | 11/13/36 | | | 2,956,066 |
See Notes to Financial Statements.
32
Excelsior Funds, Inc.
Portfolio of Investments — March 31, 2006
Intermediate-Term Bond Fund — (continued)
| | | | | | | | | | | |
Principal
Amount
| | | | Rate
| | | Maturity
Date
| | Value
|
| | COMMERCIAL MORTGAGE-BACKED SECURITIES — (continued) |
| $ | 3,104,000 | | Morgan Stanley Dean Witter Capital I, 2005-HQ5 A4 | | 5.17 | % | | 01/14/42 | | $ | 3,015,273 |
| | 1,476,776 | | Mortgage Capital Funding, Inc., 1996-MC1 G | | 7.15 | | | 06/15/06 | | | 1,474,274 |
| | 3,410,000 | | Nomura Asset Securities Corp., 1998-D6 A1B | | 6.59 | | | 03/15/30 | | | 3,489,008 |
| | 4,025,000 | | Nomura Asset Securities Corp., 1998-D6 A4(b) | | 6.92 | | | 03/15/30 | | | 4,515,962 |
| | 1,435,000 | | Wachovia Bank Commercial Mortgage Trust, 2002-C1 A4 | | 6.29 | | | 04/15/34 | | | 1,497,217 |
| | 6,525,000 | | Wachovia Bank Commercial Mortgage Trust, 2003-C9 A3 | | 4.61 | | | 12/15/35 | | | 6,275,380 |
| | 4,775,000 | | Wachovia Bank Commercial Mortgage Trust, 2004-C12 A3 | | 5.23 | | | 07/15/41 | | | 4,729,185 |
| | 6,150,000 | | Wachovia Bank Commercial Mortgage Trust, 2005-C20 A6A(b) | | 5.11 | | | 07/15/42 | | | 6,000,581 |
| | | | | | | | | | |
|
|
| | | | TOTAL COMMERCIAL MORTGAGE-BACKED SECURITIES (Cost $70,568,316) | | | 68,638,897 |
| | | | | | | | | | |
|
|
| | CORPORATE BONDS — 24.26% |
| | 2,300,000 | | Allstate Corp. | | 5.00 | | | 08/15/14 | | | 2,214,454 |
| | 1,720,000 | | America Movil S.A. de C.V. | | 5.50 | | | 03/01/14 | | | 1,648,434 |
| | 5,270,000 | | Bottling Group llc | | 5.50 | | | 04/01/16 | | | 5,202,317 |
| | 4,155,000 | | Caterpillar Financial Services Corp. MTN | | 2.35 | | | 09/15/06 | | | 4,103,237 |
| | 500,000 | | Cincinnati Bell, Inc. | | 8.38 | | | 01/15/14 | | | 508,125 |
| | 3,845,000 | | Cisco Systems, Inc. | | 5.50 | | | 02/22/16 | | | 3,787,244 |
| | 2,570,000 | | Cit Group, Inc. | | 5.00 | | | 02/01/15 | | | 2,427,992 |
| | 1,670,000 | | Comcast Cable Communications | | 6.75 | | | 01/30/11 | | | 1,735,978 |
| | 1,835,000 | | Credit Suisse First Boston (USA), Inc. | | 3.88 | | | 01/15/09 | | | 1,766,142 |
| | 2,991,353 | | CVS Lease Pass Through Trust(a) | | 5.88 | | | 01/10/28 | | | 2,892,997 |
| | 2,040,000 | | DaimlerChrysler NA Holding Corp. | | 4.05 | | | 06/04/08 | | | 1,976,764 |
| | 4,000,000 | | Diageo Capital plc | | 4.38 | | | 05/03/10 | | | 3,840,012 |
| | 3,000,000 | | Dominion Resources, Inc., Series B(b) | | 4.82 | | | 09/28/07 | | | 3,002,571 |
| | | | | | | | | | | |
Principal
Amount
| | | | Rate
| | | Maturity
Date
| | Value
|
| | CORPORATE BONDS — (continued) |
| $ | 1,170,000 | | Entergy Gulf States | | 5.70 | % | | 06/01/15 | | $ | 1,121,487 |
| | 1,400,000 | | Ford Motor Credit Co. | | 5.80 | | | 01/12/09 | | | 1,278,560 |
| | 2,635,821 | | Hainan Airways(b) | | 4.91 | | | 12/15/07 | | | 2,635,821 |
| | 5,645,000 | | Household Finance Corp. | | 8.00 | | | 07/15/10 | | | 6,159,525 |
| | 5,500,000 | | International Lease Finance Corp. | | 4.75 | | | 01/13/12 | | | 5,249,371 |
| | 500,000 | | Iron Mountain, Inc. | | 8.63 | | | 04/01/13 | | | 520,000 |
| | 5,000,000 | | JP Morgan Chase & Co. | | 5.15 | | | 10/01/15 | | | 4,784,650 |
| | 3,435,000 | | Legg Mason, Inc. | | 6.75 | | | 07/02/08 | | | 3,533,437 |
| | 5,000,000 | | Lehman Brothers Holdings, Inc. | | 4.25 | | | 01/27/10 | | | 4,788,065 |
| | 1,555,000 | | Limited Brands, Inc. | | 5.25 | | | 11/01/14 | | | 1,448,039 |
| | 3,150,000 | | Morgan Stanley | | 4.75 | | | 04/01/14 | | | 2,938,928 |
| | 2,000,000 | | Nationwide Life Global Funding, Inc.(a) | | 5.35 | | | 02/15/07 | | | 2,000,328 |
| | 1,955,000 | | Nisource Finance Corp. | | 7.88 | | | 11/15/10 | | | 2,120,600 |
| | 2,275,000 | | Oracle Corp./Ozark Holdings(a) | | 5.25 | | | 01/15/16 | | | 2,182,392 |
| | 3,000,000 | | RBS Capital Trust III(b)(c) | | 5.51 | | | 09/29/49 | | | 2,893,674 |
| | 1,425,000 | | Sprint Capital Corp. | | 8.38 | | | 03/15/12 | | | 1,610,108 |
| | 1,750,000 | | Susquehanna Bancshares, Inc. | | 6.05 | | | 11/01/12 | | | 1,767,750 |
| | 2,260,000 | | TCI Communications, Inc. | | 9.80 | | | 02/01/12 | | | 2,663,225 |
| | 1,915,000 | | Telefonos de Mexico S.A. | | 4.50 | | | 11/19/08 | | | 1,862,087 |
| | 4,185,000 | | Textron Financial Corp. MTN(b) | | 5.87 | | | 04/24/06 | | | 4,187,942 |
| | 2,415,000 | | Time Warner, Inc. | | 9.15 | | | 02/01/23 | | | 2,903,738 |
| | 2,660,000 | | Virginia Electric Power(d) | | 5.40 | | | 01/15/16 | | | 2,559,694 |
| | 5,075,000 | | Wachovia Corp. | | 3.50 | | | 08/15/08 | | | 4,885,392 |
| | 1,555,000 | | Wachovia Corp. | | 5.25 | | | 08/01/14 | | | 1,509,008 |
| | 1,000,000 | | Xerox Corp. | | 6.40 | | | 03/15/16 | | | 992,500 |
| | 2,400,000 | | Zions Bancorp | | 5.50 | | | 11/16/15 | | | 2,341,471 |
| | | | | | | | | | |
|
|
| | | | TOTAL CORPORATE BONDS (Cost $108,134,809) | | | 106,044,059 |
| | | | | | | | | | |
|
|
| | U.S. GOVERNMENT AGENCY BONDS & NOTES — 12.16% |
| | | | FANNIE MAE — 2.78% | | | | | | |
| | 11,330,000 | | | | 7.25 | | | 01/15/10 | | | 12,139,596 |
| | | | | | | | | | |
|
|
| | | | FEDERAL HOME LOAN BANK — 6.04% | | | |
| | 12,850,000 | | (e) | | 0.00 | | | 04/26/06 | | | 12,810,118 |
| | 5,000,000 | | | | 4.57 | | | 10/17/08 | | | 4,942,435 |
| | 8,700,000 | | | | 5.19 | | | 02/22/10 | | | 8,646,834 |
| | | | | | | | | | |
|
|
| | | | | | | | | | | | 26,399,387 |
| | | | | | | | | | |
|
|
| | | | FREDDIE MAC — 3.34% | | | | | | |
| | 5,845,000 | | | | 3.00 | | | 09/29/06 | | | 5,783,177 |
| | 3,355,000 | | | | 5.13 | | | 07/15/12 | | | 3,344,422 |
See Notes to Financial Statements.
33
Excelsior Funds, Inc.
Portfolio of Investments — March 31, 2006
Intermediate-Term Bond Fund — (continued)
| | | | | | | | | | |
Principal
Amount
| | | | Rate
| | | Maturity
Date
| | Value
|
U.S. GOVERNMENT AGENCY BONDS & NOTES — (continued) |
| | | FREDDIE MAC — (continued) | | | |
| $ 5,700,000 | | | | 5.30 | % | | 05/12/20 | | $ | 5,411,711 |
| 50,000 | | MTN | | 2.85 | | | 01/05/07 | | | 49,160 |
| | | | | | | | | |
|
|
| | | | | | | | | | | 14,588,470 |
| | | | | | | | | |
|
|
| | | TOTAL U.S. GOVERNMENT AGENCY BONDS & NOTES (Cost $53,909,369) | | | 53,127,453 |
| | | | | | | | | |
|
|
U.S. GOVERNMENT AGENCY MORTGAGE PASS THROUGH SECURITIES — 12.50% | | | |
| | | FEDERAL HOME LOAN MORTGAGE CORPORATION — 4.24% | | | |
| 19,500,000 | | TBA | | 5.00 | | | 04/15/21 | | | 18,549,375 |
| | | | | | | | | |
|
|
| | | FEDERAL NATIONAL MORTGAGE
ASSOCIATION — 5.86% | | | |
| 2,630,000 | | Pool # 385538 | | 4.79 | | | 11/01/12 | | | 2,536,617 |
| 808,426 | | Pool # 545290 | | 7.50 | | | 10/01/16 | | | 845,832 |
| 235,267 | | Pool # 577218 | | 6.00 | | | 04/01/31 | | | 235,581 |
| 3,321 | | Pool # 578823 | | 5.50 | | | 04/01/31 | | | 3,252 |
| 1,574,378 | | Pool # 624250 | | 6.00 | | | 01/01/17 | | | 1,596,405 |
| 202,548 | | Pool # 625797 | | 6.00 | | | 01/01/17 | | | 205,381 |
| 3,191,218 | | Pool # 704372 ARM(b) | | 4.51 | | | 05/01/33 | | | 3,130,086 |
| 883,265 | | Pool # 709693 | | 5.50 | | | 06/01/28 | | | 865,811 |
| 597,168 | | Pool # 709698 | | 5.50 | | | 06/01/33 | | | 584,072 |
| 6,320,112 | | Pool # 805386 ARM(b) | | 4.90 | | | 01/01/35 | | | 6,252,071 |
| 2,960,846 | | Pool # 811528 | | 5.00 | | | 11/01/20 | | | 2,887,826 |
| 6,652,910 | | Pool # 831192 | | 5.00 | | | 11/01/20 | | | 6,486,528 |
| | | | | | | | | |
|
|
| | | | | | | | | | | 25,629,462 |
| | | | | | | | | |
|
|
| | | GOVERNMENT NATIONAL MORTGAGE ASSOCIATION — 2.40% | | | |
| 20,310 | | Pool # 195801 | | 8.50 | | | 01/15/17 | | | 21,793 |
| 9,270 | | Pool # 195833 | | 8.50 | | | 04/15/17 | | | 9,947 |
| 2,951,242 | | Pool # 3319 | | 5.00 | | | 12/20/32 | | | 2,852,197 |
| 2,146 | | Pool # 334299 | | 8.00 | | | 05/15/23 | | | 2,296 |
| 3,595,149 | | Pool # 3442 | | 5.00 | | | 09/20/33 | | | 3,474,282 |
| 339,769 | | Pool # 367412 | | 6.00 | | | 11/15/23 | | | 344,204 |
| 1,515,495 | | Pool # 604726 | | 4.50 | | | 10/15/33 | | | 1,427,815 |
| 2,481,009 | | Pool # 608288 | | 4.50 | | | 09/15/33 | | | 2,337,469 |
| | | | | | | | | |
|
|
| | | | | | | | | | | 10,470,003 |
| | | | | | | | | |
|
|
| | | TOTAL U.S. GOVERNMENT AGENCY MORTGAGE PASS THROUGH SECURITIES (Cost $55,677,548) | | | 54,648,840 |
| | | | | | | | | |
|
|
U.S. GOVERNMENT SECURITIES — 18.57% | | | |
| | | U.S. TREASURY BILL — 4.11% | | | |
| 18,000,000 | | (e) | | 0.00 | | | 04/13/06 | | | 17,971,530 |
| | | | | | | | | |
|
|
| | | U.S. TREASURY STRIPS — 0.73% |
| 4,890,000 | | | | 0.00 | | | 11/15/14 | | | 3,203,292 |
| | | | | | | | | |
|
|
| | | U.S. TREASURY INFLATION PROTECTED BONDS — 2.11% | | | |
| 9,000,000 | | | | 2.00 | | | 07/15/14 | | | 9,233,973 |
| | | | | | | | | |
|
|
| | | | | | | | | | |
Principal
Amount
| | | | Rate
| | | Maturity
Date
| | Value
|
U.S. GOVERNMENT SECURITIES — (continued) |
| | | U.S. TREASURY NOTES — 11.62% | | | |
| $ 5,800,000 | | | | 3.00 | % | | 02/15/08 | | $ | 5,610,369 |
| 7,130,000 | | | | 3.13 | | | 04/15/09 | | | 6,791,325 |
| 28,200,000 | | (d) | | 5.00 | | | 02/15/11 | | | 28,428,985 |
| 9,720,000 | | | | 4.25 | | | 11/15/14 | | | 9,290,191 |
| 670,000 | | | | 4.25 | | | 08/15/15 | | | 638,255 |
| | | | | | | | | |
|
|
| | | | | | | | | | | 50,759,125 |
| | | | | | | | | |
|
|
| | | TOTAL U.S. GOVERNMENT SECURITIES
(Cost $82,519,080) | | | 81,167,920 |
| | | | | | | | | |
|
|
Shares
| | | | | | | | | |
REGISTERED INVESTMENT COMPANIES — 7.38% |
| 16,121,745 | | Dreyfus Government Cash Management Fund | | | 16,121,745 |
| 16,121,745 | | Fidelity U.S. Treasury II Fund | | | 16,121,744 |
| | | | | | | | | |
|
|
| | | TOTAL REGISTERED INVESTMENT COMPANIES
(Cost $32,243,489) | | | 32,243,489 |
| | | | | | | | | |
|
|
| | | | | | | |
TOTAL INVESTMENTS
(Cost $462,467,435) (f) | | 103.94 | % | | $ | 454,302,320 | |
LIABILITIES IN EXCESS OF OTHER ASSETS | | (3.94 | ) | | | (17,229,614 | ) |
| | |
|
| |
|
|
|
NET ASSETS | | 100.00 | % | | $ | 437,072,706 | |
| | |
|
| |
|
|
|
| (a) | Security exempt from registration under Rule 144A of the Securities Act of 1933. This security may be resold in transactions exempt from registration, normally to qualified institutional buyers. At March 31, 2006, these securities amounted to $15,649,110 or 3.58% of net assets. |
| (b) | Variable Rate Security—The rate disclosed is as of March 31, 2006. |
| (c) | Perpetual Security—Stated maturity is first par call date. |
| (d) | All or part of the security is segregated by the Fund’s custodian to cover future purchase commitments. |
| (f) | Unrealized appreciation (depreciation) of securities: |
| | | | |
Unrealized
Appreciation
| | Unrealized
(Depreciation)
| | Net Unrealized
Appreciation/
(Depreciation)
|
| $848,180 | | $(9,013,295) | | $(8,165,115) |
ARM—Adjustable Rate Mortgage
MTN—Medium Term Note
plc—Public Limited Company
llc—Limited Liability Company
STRIPS—Separately Traded Registered Interest and Principal Securities
See Notes to Financial Statements.
34
Excelsior Funds, Inc.
Portfolio of Investments — March 31, 2006
Intermediate-Term Bond Fund — (continued)
The summary of the Fund’s investments as of March 31, 2006 is as follows: (Unaudited)
| | | | | | | |
Portfolio Diversification
| | % of
Net
Assets
| | | Value
| |
U.S. Government & Agency Securities | | 43.23 | % | | $ | 188,944,213 | |
Corporate Bonds | | 24.26 | | | | 106,044,059 | |
Commercial Mortgage-Backed Securities | | 15.70 | | | | 68,638,897 | |
Collateralized Mortgage Obligations | | 9.89 | | | | 43,209,213 | |
Registered Investment Companies | | 7.38 | | | | 32,243,489 | |
Asset Backed Securities | | 3.48 | | | | 15,222,449 | |
| | |
|
| |
|
|
|
Total Investments. | | 103.94 | % | | $ | 454,302,320 | |
Liabilities in Excess of Other Assets | | (3.94 | ) | | | (17,229,614 | ) |
| | |
|
| |
|
|
|
Net Assets | | 100.00 | % | | $ | 437,072,706 | |
| | |
|
| |
|
|
|
See Notes to Financial Statements.
35
Excelsior Funds, Inc.
Portfolio of Investments — March 31, 2006
Intermediate-Term Tax-Exempt Fund
| | | | | | | | | | | |
Principal
Amount
| | | | Rate
| | | Maturity
Date
| | Value
|
| | TAX-EXEMPT CASH EQUIVALENT SECURITIES — 3.61% |
| $ | 6,300,000 | | Tulsa County, Oklahoma, Industrial Authority Health Care Revenue Bonds, St. Francis Health System, Series B(a) | | 3.33 | % | | 12/15/27 | | $ | 6,300,000 |
| | 6,425,000 | | West Virginia State Hospital Finance Authority Revenue Bonds, Series B, (AMBAC)(a) | | 3.30 | | | 09/01/32 | | | 6,425,000 |
| | | | | | | | | | |
|
|
| | | | TOTAL TAX-EXEMPT CASH EQUIVALENT SECURITIES (Cost $12,725,000) | | | 12,725,000 |
| | | | | | | | | | |
|
|
| | TAX-EXEMPT SECURITIES — 86.91% |
| | 4,740,000 | | California State, General Obligation Bonds | | 5.00 | | | 06/01/08 | | | 4,873,241 |
| | 10,000,000 | | California State, General Obligation Bonds, | | 5.00 | | | 05/01/13 | | | 10,623,100 |
| | 5,000,000 | | California State, General Obligation Bonds | | 5.00 | | | 08/01/21 | | | 5,223,200 |
| | 10,000,000 | | Colorado Springs, Colorado, Utilities Revenue Bonds, Series A | | 5.25 | | | 11/15/10 | | | 10,659,900 |
| | 5,000,000 | | Cook County, Illinois, General Obligation Bonds, Series A, (AMBAC) | | 5.00 | | | 11/15/23 | | | 5,246,650 |
| | 10,000,000 | | Dallas, Texas, Water Works & Sewer System Revenue Bonds, (FSA) | | 5.38 | | | 10/01/12 | | | 10,880,200 |
| | 2,820,000 | | Detroit, Michigan, Sewage Disposal Revenue Bonds, Senior Lien, Series A, (FSA)(b) | | 5.00 | | | 07/01/14 | | | 3,001,157 |
| | 6,200,000 | | Fairfax County, Virginia, Refunding & Public Improvements General Obligation Bonds, Series A | | 5.25 | | | 04/01/08 | | | 6,404,290 |
| | | | | | | | | | |
Principal
Amount
| | | | Rate
| | | Maturity
Date
| | Value
|
TAX-EXEMPT SECURITIES — (continued) |
| $10,000,000 | | Florida State Division Board Finance Department, General Services Revenue Bonds, Department of Environmental Protection—Preservation 2000, Series A, (FSA)(b) | | 6.00 | % | | 07/01/13 | | $ | 11,292,500 |
| 12,400,000 | | Fresno, California, Sewer Revenue Bonds, Series A-1, (AMBAC)(b) | | 5.25 | | | 09/01/19 | | | 13,649,796 |
| 5,535,000 | | Garland, Texas, Independent School District General Obligation Bonds, Series A, (PSF-GTD) | | 5.00 | | | 02/15/24 | | | 5,738,522 |
| 10,000,000 | | Hawaii State General Obligation Bonds, Series CY, (FSA) | | 5.50 | | | 02/01/12 | | | 10,836,400 |
| 10,000,000 | | Illinois State Sales Tax Revenue Bonds, First Series, (FSA) | | 5.25 | | | 06/15/13 | | | 10,793,600 |
| 10,000,000 | | Jefferson County, Colorado, School District General Obligation Bonds, (MBIA)(b) | | 6.50 | | | 12/15/11 | | | 11,397,600 |
| 10,000,000 | | Los Angeles, California, Department of Water & Power Revenue Bonds, Series B, (MBIA) | | 5.00 | | | 07/01/13 | | | 10,746,100 |
| 6,070,000 | | Los Angeles, California, Unified School District General Obligation Bonds, Election of 2004, Series F, (FGIC) | | 5.00 | | | 07/01/18 | | | 6,491,197 |
| 10,000,000 | | Michigan State Building Authority Revenue Bonds, Facilities Program, Series I, (FSA) | | 5.25 | | | 10/15/14 | | | 10,785,300 |
| 5,720,000 | | Nassau County, New York, Interim Finance Authority Revenue Bonds, Sales Tax Revenue, Series B | | 5.00 | | | 11/15/14 | | | 6,095,747 |
See Notes to Financial Statements.
36
Excelsior Funds, Inc.
Portfolio of Investments — March 31, 2006
Intermediate-Term Tax-Exempt Fund — (continued)
| | | | | | | | | | |
Principal
Amount
| | | | Rate
| | | Maturity
Date
| | Value
|
TAX-EXEMPT SECURITIES — (continued) |
| $10,000,000 | | New Jersey State General Obligation Bonds, Series D | | 6.00 | % | | 02/15/11 | | $ | 10,986,200 |
| 10,000,000 | | New Jersey State Transportation Corporation Certificate Participation, Federal Transportation Administration Grants, Series A, (FGIC) | | 5.00 | | | 09/15/19 | | | 10,483,000 |
| 12,000,000 | | New York City, New York, General Obligation Bonds, Series G | | 5.00 | | | 12/01/21 | | | 12,477,840 |
| 10,000,000 | | New York City, New York, Municipal Water Finance Authority, Water & Sewer System Revenue Bonds, Series A, (FSA) | | 5.38 | | | 06/15/16 | | | 10,769,900 |
| 10,000,000 | | New York State Dormitory Authority Revenue Bonds, State University Educational Facilities, Series B, (FSA) | | 5.25 | | | 05/15/11 | | | 10,705,800 |
| 3,000,000 | | New York State Thruway Authority Revenue Bonds, Highway & Bridge Trust Fund, Series B, (FSA) | | 5.00 | | | 04/01/15 | | | 3,212,940 |
| 9,735,000 | | Oklahoma State Capitol Improvement Authority Revenue Bonds, State Facilities, Higher Education Projects, Series F, (AMBAC) | | 5.00 | | | 07/01/22 | | | 10,287,461 |
| 10,000,000 | | Oklahoma State Capitol Improvement Authority Revenue Bonds, State Facilities, Higher Education Projects, Series F, (AMBAC) | | 5.00 | | | 07/01/23 | | | 10,544,000 |
| | | | | | | | | | |
Principal
Amount
| | | | Rate
| | | Maturity
Date
| | Value
|
TAX-EXEMPT SECURITIES — (continued) | | | |
| $10,000,000 | | Phoenix, Arizona, Civic Improvement Corporation Revenue Bonds, Water Systems, Junior Lien, (MBIA) | | 5.00 | % | | 07/01/20 | | $ | 10,567,500 |
| 7,500,000 | | Port Authority of New York & New Jersey, Construction Revenue Bonds, One Hundred Forty-Second Street Project | | 5.00 | | | 07/15/16 | | | 7,995,225 |
| 8,000,000 | | San Antonio, Texas, Electric & Gas Revenue Bonds, Series A | | 5.25 | | | 02/01/16 | | | 8,370,400 |
| 5,000,000 | | South Carolina State Highway General Obligation Bonds, Series B | | 5.00 | | | 04/01/16 | | | 5,279,050 |
| 10,000,000 | | South Carolina State Public Services Authority Revenue Bonds, Series A, (FSA) | | 5.50 | | | 01/01/11 | | | 10,761,700 |
| 7,050,000 | | South Carolina Transportation Infrastructure Revenue Bonds, Series A, (AMBAC) | | 5.00 | | | 10/01/15 | | | 7,602,086 |
| 4,815,000 | | Texas State Public Finance Authority General Obligation Bonds, Series A | | 5.00 | | | 10/01/23 | | | 5,019,445 |
| 6,000,000 | | Triborough Bridge & Tunnel Authority, New York, Highway Revenue Bonds, Series B | | 5.00 | | | 11/15/20 | | | 6,284,880 |
| 10,000,000 | | Washington State Various Purposes General Obligation Bonds, Series R-03-A, (MBIA) | | 5.00 | | | 01/01/18 | | | 10,460,700 |
| | | | | | | | | |
|
|
| | | TOTAL TAX-EXEMPT SECURITIES (Cost $305,614,852) | | | 306,546,627 |
| | | | | | | | | |
|
|
See Notes to Financial Statements.
37
Excelsior Funds, Inc.
Portfolio of Investments — March 31, 2006
Intermediate-Term Tax-Exempt Fund — (continued)
| | | | | | | | | | |
Principal
Amount
| | | | Rate
| | | Maturity
Date
| | Value
|
TAX-EXEMPT SECURITIES — ESCROWED IN
U.S. GOVERNMENTS — 5.73% |
| $12,000,000 | | Chicago, Illinois, Public Improvements General Obligation Bonds, (Prerefunded 01/01/8 @ 102) | | 5.25 | % | | 01/01/27 | | $ | 12,561,960 |
| 7,180,000 | | Detroit, Michigan, Sewage Disposal Revenue Bonds, Senior Lien, Series A, (Prerefunded 07/01/13 @ 100) | | 5.00 | | | 07/01/14 | | | 7,659,552 |
| | | | | | | | | |
|
|
| | | TOTAL TAX-EXEMPT SECURITIES — ESCROWED IN U.S. GOVERNMENTS (Cost $20,361,255) | | | 20,221,512 |
| | | | | | | | | |
|
|
| | | | |
Shares
| | | | | | | | | |
REGISTERED INVESTMENT COMPANIES — 0.24% |
| 0 | | BlackRock Muni Fund(c) | | | 0 |
| 838,204 | | Dreyfus Tax Exempt Cash Fund | | | 838,204 |
| | | | | | | | | |
|
|
| | | TOTAL REGISTERED INVESTMENT COMPANIES
(Cost $838,204) | | | 838,204 |
| | | | | | | | | |
|
|
| | | | | | |
TOTAL INVESTMENTS (Cost $339,539,311)(d) | | 96.49 | % | | $ | 340,331,343 |
OTHER ASSETS IN EXCESS OF LIABILITIES | | 3.51 | | | | 12,364,413 |
| | |
|
| |
|
|
NET ASSETS | | 100.00 | % | | $ | 352,695,756 |
| | |
|
| |
|
|
| (a) | Variable Rate Security—The rate disclosed is as of March 31, 2006. |
| (b) | All or part of the security is segregated by the Fund’s custodian to cover future purchase commitments. |
| (c) | Fractional shares—Amount less than one. |
| (d) | Unrealized appreciation (depreciation) of securities: |
| | | | | | | | |
Unrealized
Appreciation
| | Unrealized
(Depreciation)
| | | Net Unrealized
Appreciation/
(Depreciation)
|
| $ | 3,443,657 | | $ | (2,651,625 | ) | | $ | 792,032 |
AMBAC—American Municipal Bond Assurance Corp.
FGIC—Financial Guaranty Insurance Corp.
FSA—Financial Security Assurance
MBIA—Municipal Bond Insurance Association
PSF-GTD—Public School Fund—Guaranteed
SPA—Standby Purchase Agreement
Notes (The following notes have not been audited by Deloitte & Touche LLP):
These municipal securities meet the three highest ratings assigned by Moody’s Investors Services, Inc. or Standard and Poor’s Corporation or, where not rated, are determined by the Advisor, under the supervision of the Board of Directors, to be of comparable quality at the time of purchase to rated instruments that may be acquired by the Fund.
At March 31, 2006, approximately 6% of the net assets are invested in municipal securities that have letter of credit enhancement features or escrows in U.S. Government securities backing them, on which the Fund relies. Without such features, the securities may or may not meet the quality standards of securities purchased by the Fund.
See Notes to Financial Statements.
38
Excelsior Funds, Inc.
Portfolio of Investments — March 31, 2006
Intermediate-Term Tax-Exempt Fund — (continued)
The summary of the Fund’s investments as of March 31, 2006 is as follows: (Unaudited)
| | | | | | |
State Diversification
| | % of
Net
Assets
| | | Value
|
New York | | 16.31 | % | | $ | 57,542,332 |
California | | 14.63 | | | | 51,606,635 |
Texas | | 8.51 | | | | 30,008,567 |
Illinois | | 8.11 | | | | 28,602,210 |
Oklahoma | | 7.69 | | | | 27,131,461 |
South Carolina | | 6.70 | | | | 23,642,835 |
Colorado | | 6.25 | | | | 22,057,500 |
New Jersey | | 6.09 | | | | 21,469,200 |
Michigan | | 6.08 | | | | 21,446,009 |
Florida | | 3.20 | | | | 11,292,500 |
Hawaii | | 3.07 | | | | 10,836,400 |
Arizona | | 3.00 | | | | 10,567,500 |
Washington | | 2.97 | | | | 10,460,700 |
West Virginia | | 1.82 | | | | 6,425,000 |
Virginia | | 1.82 | | | | 6,404,290 |
Registered Investment Companies | | 0.24 | | | | 838,204 |
| | |
|
| |
|
|
Total Investments | | 96.49 | % | | $ | 340,331,343 |
Other Assets in Excess of Liabilities | | 3.51 | | | | 12,364,413 |
| | |
|
| |
|
|
Net Assets | | 100.00 | % | | $ | 352,695,756 |
| | |
|
| |
|
|
See Notes to Financial Statements.
39
Excelsior Tax-Exempt Funds, Inc.
Portfolio of Investments — March 31, 2006
Long-Term Tax-Exempt Fund
| | | | | | | | | | | |
Principal
Amount
| | | | Rate
| | | Maturity
Date
| | Value
|
| | TAX-EXEMPT CASH EQUIVALENT SECURITIES — 13.39% |
| $ | 500,000 | | Clackamas County, Oregon, Hospital Facilities Authority Revenue Bonds, Providence Health System, Series E(a) | | 3.33 | % | | 10/01/33 | | $ | 500,000 |
| | 1,500,000 | | Colorado Springs, Colorado, Utilities Revenue Bonds, Sub Lien, Series A, (SPA: Dexia Credit Local)(a) | | 3.17 | | | 11/01/23 | | | 1,500,000 |
| | 2,500,000 | | Illinois Health Facilities Authority, Health Care Revenue Bonds, (FSA)(a) | | 3.33 | | | 05/15/29 | | | 2,500,000 |
| | 1,500,000 | | Moffat County, Colorado, Pollution Control Revenue Bonds, Pacificorp Projects, (AMBAC)(a) | | 3.14 | | | 05/01/13 | | | 1,500,000 |
| | 2,200,000 | | Ohio State Higher Educational Facilities Revenue Bonds, Case Western Reserve University, (SPA: Landesbank Hessen-Thueringen)(a) | | 3.13 | | | 10/01/31 | | | 2,200,000 |
| | | | | | | | | | |
|
|
| | | | TOTAL TAX-EXEMPT CASH
EQUIVALENT SECURITIES
(Cost $8,200,000) | | | 8,200,000 |
| | | | | | | | | | |
|
|
| | TAX-EXEMPT SECURITIES — 63.98% | | | | | | |
| | 2,490,000 | | Burke County, Georgia, Development Authority Pollution Control Revenue Bonds, Georgia Power Company Plant, 1st Series, (FGIC) | | 4.75 | | | 05/01/34 | | | 2,494,482 |
| | 2,065,000 | | California State, General Obligation Bonds | | 5.00 | | | 08/01/21 | | | 2,157,182 |
| | 2,500,000 | | Chicago, Illinois, O’Hare International Airport Revenue Bonds, General Airport, Third Lien, Series A, (FGIC) | | 5.00 | | | 01/01/33 | | | 2,581,575 |
| | 3,000,000 | | Clark County, Nevada, School District General Obligation Bonds, Series A, (FSA)(b) | | 5.00 | | | 06/15/15 | | | 3,186,150 |
| | | | | | | | | | |
Principal
Amount
| | | | Rate
| | | Maturity
Date
| | Value
|
TAX-EXEMPT SECURITIES — (continued) |
| $2,500,000 | | Detroit, Michigan, City School District General Obligation Bonds, School Building & Improvement, Series A, (FSA) | | 5.00 | % | | 05/01/17 | | $ | 2,649,500 |
| 2,500,000 | | Indiana Health & Educational Facility Financing Authority Hospital Revenue Bonds, Clarian Health Obligation, Series A | | 5.00 | | | 02/15/39 | | | 2,479,900 |
| 2,500,000 | | Jea, Florida, Johns River Power Systems Revenue Bonds, Issue 2, Series 21, (MBIA) | | 5.00 | | | 10/01/20 | | | 2,636,950 |
| 2,000,000 | | Johnson City, Tennessee, Health & Educational Facilities Board Hospital Revenue Bonds, Mountain States Health Alliance, Series A | | 5.50 | | | 07/01/36 | | | 2,084,100 |
| 2,000,000 | | Massachusetts State Water Resource Authority Revenue Bonds, Series A, (MBIA) | | 5.00 | | | 08/01/23 | | | 2,120,660 |
| 2,000,000 | | New York City, New York General Obligation Bonds, Series M | | 5.00 | | | 04/01/22 | | | 2,077,740 |
| 2,000,000 | | New York State Environmental Facilities Revenue Bonds, Clean Water & Drinking Revolving Foods, 2nd Resolution | | 5.00 | | | 06/15/26 | | | 2,095,700 |
| 2,500,000 | | New York, Sales Tax Asset Receivable Revenue Bonds, Series A, (AMBAC) | | 5.00 | | | 10/15/29 | | | 2,614,725 |
| 2,500,000 | | Palm Beach County, Florida, Public Improvement Revenue Bonds, Biomedical Research Park Project, Series A, (AMBAC) | | 5.00 | | | 06/01/23 | | | 2,611,900 |
| 2,500,000 | | Port Authority of New York & New Jersey, Construction Revenue Bonds, One Hundred Forty-Second Street Project | | 5.00 | | | 07/15/16 | | | 2,665,075 |
See Notes to Financial Statements.
40
Excelsior Tax-Exempt Funds, Inc.
Portfolio of Investments — March 31, 2006
Long-Term Tax-Exempt Fund — (continued)
| | | | | | | | | | |
Principal
Amount
| | | | Rate
| | | Maturity
Date
| | Value
|
TAX-EXEMPT SECURITIES — (continued) |
| $2,500,000 | | Sherman, Texas, Independent School District General Obligation Bonds, Series A, (PSF-GTD) | | 5.00 | % | | 02/15/26 | | $ | 2,599,650 |
| 2,000,000 | | Washington State Economic Development Authority Revenue Bonds, Biomedical Research Properties II | | 5.25 | | | 06/01/24 | | | 2,138,940 |
| | | | | | | | | |
|
|
| | | TOTAL TAX-EXEMPT SECURITIES (Cost $39,282,950) | | | 39,194,229 |
| | | | | | | | | |
|
|
TAX-EXEMPT SECURITIES — ESCROWED IN
U.S. GOVERNMENTS — 20.37% |
| 3,000,000 | | Houston, Texas, Water & Sewer System Revenue Bonds, Series A, (FSA) (Prerefunded 12/01/12 @ 100) | | 5.00 | | | 12/01/30 | | | 3,182,640 |
| 2,500,000 | | Long Island Power Authority, New York Electric System Revenue Bonds, Series A, (FSA) (Escrowed to Maturity) | | 5.25 | | | 12/01/14 | | | 2,730,425 |
| 3,000,000 | | New Jersey State Transportation Trust Fund Authority Revenue Bonds, Transportation Systems, Series C, (Prerefunded 06/15/13 @ 100)(b) | | 5.50 | | | 06/15/23 | | | 3,292,500 |
| 3,000,000 | | Pennsylvania State General Obligation Bonds, 2nd Series, (FSA) (Prerefunded 05/01/12 @ 100) | | 5.50 | | | 05/01/16 | | | 3,272,460 |
| | | | | | | | | |
|
|
| | | TOTAL TAX-EXEMPT SECURITIES — ESCROWED IN U.S. GOVERNMENTS (Cost $12,349,082) | | | 12,478,025 |
| | | | | | | | | |
|
|
| | | | | | | | | |
Shares
| | | | Rate
| | Maturity
Date
| | Value
|
| REGISTERED INVESTMENT COMPANIES — 0.83% |
| 1 | | BlackRock Muni Fund | | $ | 1 |
| 506,636 | | Dreyfus Tax Exempt Cash Fund | | | 506,636 |
| | | | |
| |
| |
|
|
| | | TOTAL REGISTERED INVESTMENT COMPANIES
(Cost $506,637) | | | 506,637 |
| | | | | | | | |
|
|
| | | | | | |
TOTAL INVESTMENTS (Cost $60,338,669) (c) | | 98.57 | % | | $ | 60,378,891 |
OTHER ASSETS IN EXCESS OF LIABILITIES | | 1.43 | | | | 878,353 |
| | |
|
| |
|
|
NET ASSETS | | 100.00 | % | | $ | 61,257,244 |
| | |
|
| |
|
|
| (a) | Variable Rate Security—The rate disclosed is as of March 31, 2006. |
| (b) | All or part of the security is segregated by the Fund’s custodian to cover future purchase commitments. |
| (c) | Unrealized appreciation (depreciation) of securities: |
| | | | | | | | |
Unrealized
Appreciation
| | Unrealized
(Depreciation)
| | | Net Unrealized
Appreciation/
(Depreciation)
|
| $ | 375,723 | | $ | (335,501 | ) | | $ | 40,222 |
AMBAC—American Municipal Bond Assurance Corporation
FGIC—Financial Guaranty Insurance Corporation
FSA—Financial Security Assurance
MBIA—Municipal Bond Insurance Association
PSF-GTD—Public School Fund—Guaranteed
SPA—Standby Purchase Agreement
Notes (The following notes have not been audited by Deloitte & Touche LLP):
These municipal securities meet the three highest ratings assigned by Moody’s Investors Services, Inc. or Standard and Poor’s Corporation or, where not rated, are determined by the Advisor, under the supervision of the Board of Directors, to be of comparable quality at the time of purchase to rated instruments that may be acquired by the Fund.
At March 31, 2006, approximately 20% of the net assets are invested in municipal securities that have letter of credit enhancement features or escrows in U.S. Government securities backing them, on which the Fund relies. Without such features, the securities may or may not meet the quality standards of securities purchased by the Fund.
See Notes to Financial Statements.
41
Excelsior Tax-Exempt Funds, Inc.
Portfolio of Investments — March 31, 2006
Long-Term Tax-Exempt Fund — (continued)
The summary of the Fund’s investments as of March 31, 2006 is as follows: (Unaudited)
| | | | | | |
State Diversification
| | % of
Net
Assets
| | | Value
|
New York | | 19.89 | % | | $ | 12,183,665 |
Texas | | 9.44 | | | | 5,782,290 |
Florida | | 8.57 | | | | 5,248,850 |
Illinois | | 8.30 | | | | 5,081,575 |
New Jersey | | 5.37 | | | | 3,292,500 |
Pennsylvania | | 5.34 | | | | 3,272,460 |
Nevada | | 5.20 | | | | 3,186,150 |
Colorado | | 4.90 | | | | 3,000,000 |
Michigan | | 4.33 | | | | 2,649,500 |
Georgia | | 4.07 | | | | 2,494,482 |
Indiana | | 4.05 | | | | 2,479,900 |
Ohio | | 3.59 | | | | 2,200,000 |
California | | 3.52 | | | | 2,157,182 |
Washington | | 3.49 | | | | 2,138,940 |
Massachusetts | | 3.46 | | | | 2,120,660 |
Tennessee | | 3.40 | | | | 2,084,100 |
Registered Investment Companies | | 0.83 | | | | 506,637 |
Oregon | | 0.82 | | | | 500,000 |
| | |
|
| |
|
|
Total Investments | | 98.57 | % | | $ | 60,378,891 |
Other Assets in Excess of Liabilities | | 1.43 | | | | 878,353 |
| | |
|
| |
|
|
Net Assets | | 100.00 | % | | $ | 61,257,244 |
| | |
|
| |
|
|
See Notes to Financial Statements.
42
Excelsior Tax-Exempt Fund, Inc.
Portfolio of Investments — March 31, 2006
New York Intermediate-Term Tax-Exempt Fund
| | | | | | | | | | | |
Principal
Amount
| | | | Rate
| | | Maturity
Date
| | Value
|
| | TAX-EXEMPT CASH EQUIVALENT SECURITIES — 8.40% |
| $ | 5,000,000 | | New York State Triborough Bridge & Tunnel Authority Revenue Bonds, Series F, (SPA: ABN AMRO Bank N.V.)(a) | | 3.16 | % | | 11/01/32 | | $ | 5,000,000 |
| | 6,000,000 | | Port Authority of New York & New Jersey, Special Obligation Revenue Bonds, Versatile Structure Obligation, Series 3, (SPA: JP Morgan Chase & Co.)(a) | | 3.17 | | | 06/01/20 | | | 6,000,000 |
| | | | | | | | | | |
|
|
| | | | TOTAL TAX-EXEMPT CASH EQUIVALENT SECURITIES (Cost $11,000,000) | | | | | | 11,000,000 |
| | | | | | | | | | |
|
|
| TAX-EXEMPT CASH EQUIVALENT SECURITIES —
BACKED BY LETTERS OF CREDIT — 4.04% | | | |
| | 5,300,000 | | New York City, New York, General Obligation Bonds, Sub-Series C5, (Bank of New York)(a) | | 3.15 | | | 08/01/20 | | | 5,300,000 |
| | | | | | | | | | |
|
|
| | | | TOTAL TAX-EXEMPT CASH EQUIVALENT SECURITIES — BACKED BY LETTERS OF CREDIT (Cost $5,300,000) | | | | | | 5,300,000 |
| | | | | | | | | | |
|
|
| | TAX-EXEMPT SECURITIES — 72.93% | | | | | | |
| | 2,565,000 | | Babylon, New York, General Obligation Bonds, (AMBAC) | | 5.00 | | | 01/01/13 | | | 2,730,648 |
| | 7,000,000 | | Long Island Power Authority, New York Electric System Revenue Bonds, Series A, (FGIC) | | 5.00 | | | 12/01/23 | | | 7,369,950 |
| | 8,500,000 | | Nassau County, New York, Interim Finance Authority, Sales Tax Revenue Bonds, Series H, (AMBAC)(b) | | 5.25 | | | 11/15/15 | | | 9,234,909 |
| | 5,000,000 | | New York City, New York, Municipal Water Finance Authority, Water & Sewer System Revenue Bonds, Series A, (FSA) | | 5.38 | | | 06/15/16 | | | 5,384,950 |
| | | | | | | | | | | |
Principal
Amount
| | | | Rate
| | | Maturity
Date
| | Value
|
| | TAX-EXEMPT SECURITIES — (continued) | | | |
| $ | 4,000,000 | | New York City, New York, Municipal Water Finance Authority, Water & Sewer System Revenue Bonds, Series D | | 5.13 | % | | 06/15/19 | | $ | 4,243,440 |
| | 3,000,000 | | New York City, New York, Transitional Finance Authority Revenue Bonds, Series A-1 | | 5.00 | | | 11/01/19 | | | 3,170,130 |
| | 5,000,000 | | New York State Dormitory Authority, New York University Revenue Bonds, Series A, (AMBAC) | | 5.75 | | | 07/01/12 | | | 5,539,650 |
| | 1,015,000 | | New York State Dormitory Authority, State University Facilities Revenue Bonds, Series A, (FSA) | | 5.25 | | | 05/15/21 | | | 1,112,907 |
| | 6,000,000 | | New York State Environmental Facilities Revenue Bonds, Municipal Water, Project K | | 5.00 | | | 06/15/12 | | | 6,407,400 |
| | 5,000,000 | | New York State Local Government Assistance Corporation Revenue Bonds, Series A-1, (FSA) | | 5.00 | | | 04/01/12 | | | 5,315,900 |
| | 6,500,000 | | New York State Sales Tax Asset Receivable Corporation Revenue Bonds, Series A, (MBIA) | | 5.00 | | | 10/15/22 | | | 6,874,205 |
| | 5,000,000 | | New York State Thruway Authority, Highway & Bridge Trust Fund Revenue Bonds, Series B, (AMBAC) | | 5.00 | | | 04/01/19 | | | 5,310,350 |
| | 6,000,000 | | New York State Thruway Authority, State Personal Income Tax Revenue Bonds, Series A, (AMBAC) | | 5.00 | | | 03/15/16 | | | 6,386,400 |
| | 2,155,000 | | New York State Urban Development Corporation Revenue Bonds, (FSA)(b) | | 5.00 | | | 01/01/16 | | | 2,309,643 |
See Notes to Financial Statements.
43
Excelsior Tax-Exempt Fund, Inc.
Portfolio of Investments — March 31, 2006
New York Intermediate-Term Tax-Exempt Fund — (continued)
| | | | | | | | | | | |
Principal
Amount
| | | | Rate
| | | Maturity
Date
| | Value
|
| | TAX-EXEMPT SECURITIES — (continued) | | | |
| $ | 5,035,000 | | New York State Urban Development Corporation Revenue Bonds, (FSA) | | 5.00 | % | | 01/01/17 | | $ | 5,368,317 |
| | 670,000 | | Onondaga County, New York, Water Authority Revenue Bonds, Series A, (AMBAC) | | 5.00 | | | 09/15/16 | | | 718,441 |
| | 700,000 | | Onondaga County, New York, Water Authority Revenue Bonds, Series A, (AMBAC) | | 5.00 | | | 09/15/17 | | | 747,208 |
| | 700,000 | | Onondaga County, New York, Water Authority Revenue Bonds, Series A, (AMBAC) | | 5.00 | | | 09/15/19 | | | 744,394 |
| | 810,000 | | Onondaga County, New York, Water Authority Revenue Bonds, Series A, (AMBAC) | | 5.00 | | | 09/15/20 | | | 859,426 |
| | 850,000 | | Onondaga County, New York, Water Authority Revenue Bonds, Series A, (AMBAC) | | 5.00 | | | 09/15/21 | | | 899,827 |
| | 895,000 | | Onondaga County, New York, Water Authority Revenue Bonds, Series A, (AMBAC) | | 5.00 | | | 09/15/22 | | | 943,894 |
| | 940,000 | | Onondaga County, New York, Water Authority Revenue Bonds, Series A, (AMBAC) | | 5.00 | | | 09/15/23 | | | 992,104 |
| | 2,000,000 | | Puerto Rico Convention Center District Authority, Hotel Occupancy Tax Revenue Bonds, Series A, (AMBAC) | | 5.00 | | | 07/01/19 | | | 2,135,340 |
| | 5,000,000 | | Puerto Rico Electric Power Authority Revenue Bonds, Series BB, (MBIA) | | 6.00 | | | 07/01/11 | | | 5,525,250 |
| | 2,425,000 | | Yonkers, New York, General Obligation Bonds, Series B, (MBIA) | | 5.00 | | | 08/01/21 | | | 2,554,107 |
| | 2,545,000 | | Yonkers, New York, General Obligation Bonds, Series B, (MBIA) | | 5.00 | | | 08/01/22 | | | 2,674,490 |
| | | | | | | | | | |
|
|
| | | | TOTAL TAX-EXEMPT SECURITIES
(Cost $95,693,018) | | | 95,553,280 |
| | | | | | | | | | |
|
|
| | | | | | | | | | | |
Principal
Amount
| | | | Rate
| | | Maturity
Date
| | Value
|
| TAX-EXEMPT SECURITIES — ESCROWED IN
U.S. GOVERNMENTS — 13.34% | | | |
| $ | 10,000,000 | | Long Island Power Authority, New York Electric System Revenue Bonds, Series A, (FSA) (Escrowed to Maturity) | | 5.25 | % | | 12/01/14 | | $ | 10,921,700 |
| | 6,000,000 | | New York State Metropolitan Transportation Authority Revenue Bonds, Service Contract, Series 8, (FSA) (Prerefunded 07/01/13 @ 100) | | 5.38 | | | 07/01/21 | | | 6,561,000 |
| | | | | | | | | | |
|
|
| | | | TOTAL TAX-EXEMPT SECURITIES — ESCROWED IN U.S. GOVERNMENTS (Cost $17,879,583) | | | 17,482,700 |
| | | | | | | | | | |
|
|
Shares
| | | | | | | | | |
| | REGISTERED INVESTMENT COMPANIES — 0.14% | | | |
| | 1 | | Dreyfus New York Tax Exempt Cash Fund | | | 1 |
| | 177,293 | | Provident Institutional New York Money Market Fund | | | 177,293 |
| | | | | | | | | | |
|
|
| | | | TOTAL REGISTERED INVESTMENT COMPANIES
(Cost $177,294) | | | 177,294 |
| | | | | | | | | | |
|
|
| | | | | | |
TOTAL INVESTMENTS (Cost $130,049,895)(c) | | 98.85 | % | | | 129,513,274 |
OTHER ASSETS IN EXCESS OF LIABILITIES | | 1.15 | | | | 1,512,727 |
| | |
|
| |
|
|
NET ASSETS | | 100.00 | % | | $ | 131,026,001 |
| | |
|
| |
|
|
| (a) | Variable Rate Security—The rate disclosed is as of March 31, 2006. |
| (b) | All or part of the security is segregated by the Fund’s custodian to cover future purchase commitments. |
| (c) | Unrealized appreciation (depreciation) of securities: |
| | | | | | | | | |
Unrealized
Appreciation
| | Unrealized
(Depreciation)
| | | Net Unrealized
Appreciation/
(Depreciation)
| |
| $ | 428,503 | | $ | (965,124 | ) | | $ | (536,621 | ) |
AMBAC—American Municipal Bond Assurance Corp.
FGIC—Financial Guaranty Insurance Corp.
FSA—Financial Security Assurance
MBIA—Municipal Bond Insurance Association
SPA—Standby Purchase Agreement
See Notes to Financial Statements.
44
Excelsior Tax-Exempt Fund, Inc.
Portfolio of Investments — March 31, 2006
New York Intermediate-Term Tax-Exempt Fund — (continued)
Notes (The following notes have not been audited by Deloitte & Touche LLP):
These municipal securities meet the three highest ratings assigned by Moody’s Investors Services, Inc. or Standard and Poor’s Corporation or, where not rated, are determined by the Advisor, under the supervision of the Board of Directors, to be of comparable quality at the time of purchase to rated instruments that may be acquired by the Fund.
At March 31, 2006, approximately 17% of the net assets are invested in municipal securities that have letter of credit enhancement features or escrows in U.S. Government securities backing them, on which the Fund relies. Without such features, the securities may or may not meet the quality standards of securities purchased by the Fund.
At March 31, 2006, approximately 93% of the net assets are invested in New York municipal securities. Economic changes affecting the state and certain of its public bodies and municipalities may affect the ability of issuers to pay the required principal and interest payments of the municipal securities.
The summary of the Fund’s investments as of March 31, 2006 is as follows: (Unaudited)
| | | | | | |
Portfolio Diversification
| | % of
Net
Assets
| | | Value
|
Revenue Bonds | | 75.25 | % | | $ | 98,594,035 |
Escrowed to Maturity | | 8.34 | | | | 10,921,700 |
General Obligation Bonds | | 6.07 | | | | 7,959,245 |
Prerefunded | | 5.01 | | | | 6,561,000 |
Backed by Letters of Credit. | | 4.04 | | | | 5,300,000 |
Registered Investment Companies | | 0.14 | | | | 177,294 |
| | |
|
| |
|
|
Total Investments | | 98.85 | % | | $ | 129,513,274 |
Other Assets in Excess of Liabilities | | 1.15 | | | | 1,512,727 |
| | |
|
| |
|
|
Net Assets | | 100.00 | % | | $ | 131,026,001 |
| | |
|
| |
|
|
See Notes to Financial Statements.
45
Excelsior Funds, Inc.
Portfolio of Investments — March 31, 2006
Short-Term Government Securities Fund
| | | | | | | | | | | |
Principal
Amount
| | | | Rate
| | | Maturity
Date
| | Value
|
| | ASSET BACKED SECURITIES — 5.62% | | | | | | |
| $ | 4,000,000 | | Citibank Credit Card Issuance Trust, 2005-A10 A10(a) | | 4.76 | % | | 12/15/10 | | $ | 4,000,471 |
| | 1,100,000 | | Countrywide Asset Backed Certificates, 2005-13 AF2(a) | | 5.29 | | | 04/25/36 | | | 1,094,143 |
| | 5,000,000 | | Countrywide Asset Backed Certificates, 2005-4 AF3(a)(b) | | 4.46 | | | 10/25/35 | | | 4,889,487 |
| | 3,115,250 | | Countrywide Home Equity Loan Trust, 2005-G 2A(a) | | 4.98 | | | 12/15/35 | | | 3,118,988 |
| | 6,000,000 | | Residential Asset Mortgage Products, Inc., 2004-RS6 AI3 | | 4.54 | | | 08/25/28 | | | 5,967,711 |
| | | | | | | | | | |
|
|
| | | | TOTAL ASSET BACKED SECURITIES (Cost $19,288,354) | | | 19,070,800 |
| | | | | | | | | | |
|
|
| | COLLATERALIZED MORTGAGE OBLIGATIONS — 20.24% |
| | | | NON-GOVERNMENTAL AGENCY COLLATERALIZED MORTGAGE OBLIGATIONS — 8.08% | | | |
| | 5,895,480 | | Bank of America Mortgage Securities, 2004-B 2A2(a) | | 4.11 | | | 03/25/34 | | | 5,716,477 |
| | 3,331,963 | | Bank of America Mortgage Securities, 2005-J 2A3(a) | | 5.10 | | | 11/25/35 | | | 3,294,863 |
| | 3,786,134 | | Bear Stearns ARM, 2004-1 11A3(a) | | 3.41 | | | 04/25/34 | | | 3,760,954 |
| | 2,978,622 | | Bear Stearns ARM, 2004-9 3A1(a) | | 5.22 | | | 09/25/34 | | | 2,951,955 |
| | 3,835,315 | | Countrywide Alternative Loan Trust, 2004-16CB 1A2 | | 5.50 | | | 07/25/34 | | | 3,764,754 |
| | 500,036 | | Countrywide Alternative Loan Trust, 2004-22CB 1A1 | | 6.00 | | | 10/25/34 | | | 495,102 |
| | 2,881,121 | | IMPAC CMB Trust, 2005-5 A4(a) | | 5.20 | | | 08/25/35 | | | 2,862,681 |
| | 2,622,749 | | Indymac Index Mortgage Loan Trust, 2004-AR4 3A(a) | | 4.80 | | | 08/25/34 | | | 2,566,815 |
| | 2,000,000 | | Washington Mutual Mortgage Securities Corp., 2005-AR5 A2(a) | | 4.68 | | | 05/25/35 | | | 1,985,620 |
| | | | | | | | | | |
|
|
| | | | | | | | | | | | 27,399,221 |
| | | | | | | | | | |
|
|
| | | | | | | | | | |
Principal
Amount
| | | | Rate
| | | Maturity
Date
| | Value
|
COLLATERALIZED MORTGAGE OBLIGATIONS — (continued) |
| | | FEDERAL HOME LOAN MORTGAGE CORPORATION — 6.86% | | | |
| $ 2,842,393 | | 2608 GK | | 4.50 | % | | 03/15/17 | | $ | 2,777,544 |
| 3,010,824 | | 2743 HA | | 4.50 | | | 11/15/09 | | | 2,999,529 |
| 3,910,573 | | 2772 YA | | 3.50 | | | 12/15/11 | | | 3,891,126 |
| 4,839,941 | | 2807 NL | | 3.50 | | | 01/15/15 | | | 4,805,112 |
| 2,501,972 | | 2808 PA | | 4.00 | | | 09/15/12 | | | 2,494,323 |
| 6,321,540 | | 2836 TA | | 5.00 | | | 10/15/27 | | | 6,308,279 |
| | | | | | | | | |
|
|
| | | | | | | | | | | 23,275,913 |
| | | | | | | | | |
|
|
| | | FEDERAL NATIONAL MORTGAGE ASSOCIATION — 5.07% | | | |
| 7,869,000 | | 1997-M5 C | | 6.74 | | | 08/25/07 | | | 7,969,587 |
| 3,861,012 | | 2002-89 CA | | 5.00 | | | 04/25/16 | | | 3,825,824 |
| 3,565,700 | | 2004-1 HA | | 3.50 | | | 03/25/11 | | | 3,540,646 |
| 1,883,458 | | 2004-W4 A1 | | 2.75 | | | 06/25/34 | | | 1,867,073 |
| | | | | | | | | |
|
|
| | | | | | | | | | | 17,203,130 |
| | | | | | | | | |
|
|
| | | GOVERNMENT NATIONAL MORTGAGE ASSOCIATION — 0.23% | | | |
| 804,830 | | 2005-34 A(a) | | 3.96 | | | 09/16/21 | | | 782,113 |
| | | | | | | | | |
|
|
| | | TOTAL COLLATERALIZED MORTGAGE OBLIGATIONS (Cost $70,115,844) | | | 68,660,377 |
| | | | | | | | | |
|
|
COMMERCIAL MORTGAGE-BACKED SECURITIES — 4.90% |
| 6,990,000 | | Chase Commercial Mortgage Securities Corp., 1996-2 C | | 6.90 | | | 11/19/28 | | | 7,021,363 |
| 5,245,254 | | Greenwich Capital Commercial Funding Corp., 2004-GG1 A2 | | 3.84 | | | 06/10/36 | | | 5,127,315 |
| 1,795,512 | | JP Morgan Chase Commercial Mortgage Securities Corp., 2005-LDP2 A1(a) | | 4.33 | | | 07/15/42 | | | 1,758,774 |
| 2,758,563 | | Mortgage Capital Funding, Inc., 2005-HQ5 A1 | | 4.52 | | | 01/14/42 | | | 2,710,513 |
| | | | | | | | | |
|
|
| | | TOTAL COMMERCIAL MORTGAGE-BACKED SECURITIES (Cost $17,447,525) | | | 16,617,965 |
| | | | | | | | | |
|
|
U.S. GOVERNMENT AGENCY BONDS & NOTES — 13.82% |
| | | FEDERAL HOME LOAN BANK — 9.13% | | | |
| 11,500,000 | | (b) | | 3.38 | | | 09/14/07 | | | 11,229,071 |
| 9,425,000 | | (b) | | 4.63 | | | 02/08/08 | | | 9,349,270 |
| 2,500,000 | | | | 3.88 | | | 02/15/08 | | | 2,446,883 |
| 2,480,000 | | | | 5.19 | | | 02/22/10 | | | 2,464,845 |
| 1,000,000 | | Discount Note | | 4.60 | | | 04/03/06 | | | 999,744 |
| 4,470,000 | | Discount Note | | 4.51 | | | 04/05/06 | | | 4,467,203 |
| | | | | | | | | |
|
|
| | | | | | | | | | | 30,957,016 |
| | | | | | | | | |
|
|
See Notes to Financial Statements.
46
Excelsior Funds, Inc.
Portfolio of Investments — March 31, 2006
Short-Term Government Securities Fund — (continued)
| | | | | | | | | | |
Principal
Amount
| | | | Rate
| | | Maturity
Date
| | Value
|
U.S. GOVERNMENT AGENCY BONDS & NOTES — (continued) |
| | | FEDERAL NATIONAL MORTGAGE ASSOCIATION — 4.69% | | | |
| $10,000,000 | | | | 3.00 | % | | 11/22/06 | | $ | 9,867,361 |
| 2,100,000 | | | | 3.55 | | | 01/17/08 | | | 2,045,385 |
| 4,000,000 | | Discount Note | | 4.60 | | | 04/05/06 | | | 3,997,444 |
| | | | | | | | | |
|
|
| | | | | | | | | | | 15,910,190 |
| | | | | | | | | |
|
|
| | | TOTAL U.S. GOVERNMENT AGENCY BONDS & NOTES
(Cost $47,406,872) | | | 46,867,206 |
| | | | | | | | | |
|
|
U.S. GOVERNMENT AGENCY MORTGAGE PASS THROUGH SECURITIES — 31.49% |
| | | FEDERAL HOME LOAN MORTGAGE
CORPORATION — 13.42% |
| 1,105,543 | | Pool # 1B2846 ARM(a) | | 4.95 | | | 04/01/35 | | | 1,095,114 |
| 4,184,974 | | Pool # 1G0688(a) | | 5.82 | | | 01/01/36 | | | 4,214,817 |
| 9,977,785 | | Pool # 782645 ARM(a) | | 5.45 | | | 02/01/36 | | | 9,983,794 |
| 4,869,250 | | Pool # 847248 ARM(a) | | 3.69 | | | 03/01/34 | | | 4,844,495 |
| 560,353 | | Pool # C68593 | | 7.00 | | | 11/01/28 | | | 578,438 |
| 9,960,578 | | Pool # J00617 | | 5.50 | | | 12/01/20 | | | 9,895,117 |
| 15,000,000 | | TBA | | 5.50 | | | 04/01/21 | | | 14,896,875 |
| | | | | | | | | |
|
|
| | | | | | | | | | | 45,508,650 |
| | | | | | | | | |
|
|
| | | FEDERAL NATIONAL MORTGAGE
ASSOCIATION — 17.41% |
| 1,184,819 | | Pool # 253509 | | 7.50 | | | 11/01/15 | | | 1,239,641 |
| 963,456 | | Pool # 323572 | | 7.50 | | | 01/01/29 | | | 1,007,166 |
| 2,737,817 | | Pool # 375575 | | 6.60 | | | 12/01/07 | | | 2,767,424 |
| 472,330 | | Pool # 516210 | | 8.00 | | | 08/01/14 | | | 499,910 |
| 21,836 | | Pool # 517390 | | 8.00 | | | 11/01/11 | | | 22,731 |
| 468,372 | | Pool # 535377 | | 8.00 | | | 06/01/15 | | | 497,148 |
| 363,748 | | Pool # 535981 | | 8.00 | | | 01/01/16 | | | 386,096 |
| 204,824 | | Pool # 545362 ARM(a) | | 6.01 | | | 12/01/31 | | | 206,186 |
| 2,144,220 | | Pool # 634195 | | 7.50 | | | 10/01/28 | | | 2,241,500 |
| 3,986,493 | | Pool # 693018 ARM(a) | | 4.40 | | | 06/01/33 | | | 3,928,866 |
| 3,266,250 | | Pool # 766684 ARM(a) | | 4.41 | | | 03/01/34 | | | 3,207,839 |
| 4,331,018 | | Pool # 770870 ARM(a) | | 4.31 | | | 04/01/34 | | | 4,250,902 |
| 2,928,835 | | Pool # 780840 | | 4.50 | | | 06/01/34 | | | 2,874,664 |
| 4,281,811 | | Pool # 784134 ARM(a) | | 5.44 | | | 10/01/35 | | | 4,243,359 |
| 5,025,582 | | Pool # 786076 ARM(a) | | 4.78 | | | 07/01/34 | | | 4,977,509 |
| 7,620,692 | | Pool # 786423 ARM(a) | | 4.62 | | | 07/01/34 | | | 7,519,428 |
| 3,948,321 | | Pool # 805386 ARM(a) | | 4.90 | | | 01/01/35 | | | 3,905,814 |
| 6,208,597 | | Pool # 826528 | | 5.00 | | | 08/01/20 | | | 6,055,480 |
| 5,474,502 | | Pool # 840579 | | 5.00 | | | 10/01/20 | | | 5,339,489 |
| 3,954,053 | | Pool # 848816 | | 5.00 | | | 01/01/21 | | | 3,856,538 |
| | | | | | | | | |
|
|
| | | | | | | | | | | 59,027,690 |
| | | | | | | | | |
|
|
| | | | | | | | | | |
Principal
Amount
| | | | Rate
| | | Maturity
Date
| | Value
|
U.S. GOVERNMENT AGENCY MORTGAGE PASS THROUGH SECURITIES — (continued) |
| | | GOVERNMENT NATIONAL MORTGAGE ASSOCIATION — 0.66% |
| $ 346,712 | | Pool # 780240 | | 8.50 | % | | 09/15/09 | | $ | 350,917 |
| 71,736 | | Pool # 780752 | | 8.50 | | | 04/15/10 | | | 71,796 |
| 574,607 | | Pool # 781036 | | 8.00 | | | 10/15/17 | | | 608,215 |
| 545,485 | | Pool # 781181 | | 9.00 | | | 12/15/09 | | | 561,698 |
| 165,670 | | Pool # 80385(a) | | 4.25 | | | 03/20/30 | | | 166,498 |
| 477,354 | | Pool # 8378(a) | | 4.75 | | | 07/20/18 | | | 479,940 |
| | | | | | | | | |
|
|
| | | | | | | | | | | 2,239,064 |
| | | | | | | | | |
|
|
| | | TOTAL U.S. GOVERNMENT AGENCY MORTGAGE PASS THROUGH SECURITIES
(Cost $108,201,263) | | | 106,775,404 |
| | | | | | | | | |
|
|
U.S. GOVERNMENT SECURITIES — 25.74% |
| | | U.S. TREASURY NOTES — 25.74% | | | |
| 4,950,000 | | | | 4.38 | | | 05/15/07 | | | 4,923,315 |
| 35,000,000 | | | | 3.88 | | | 07/31/07 | | | 34,555,674 |
| 25,000,000 | | | | 4.00 | | | 09/30/07 | | | 24,693,350 |
| 11,500,000 | | (b) | | 4.25 | | | 10/31/07 | | | 11,394,879 |
| 2,800,000 | | | | 4.25 | | | 11/30/07 | | | 2,773,204 |
| 9,000,000 | | | | 4.63 | | | 03/31/08 | | | 8,966,250 |
| | | | | | | | | |
|
|
| | | | | | | | | | | 87,306,672 |
| | | | | | | | | |
|
|
| | | TOTAL U.S. GOVERNMENT SECURITIES (Cost $88,123,384) | | | 87,306,672 |
| | | | | | | | | |
|
|
| | | | |
Shares
| | | | | | | | | |
REGISTERED INVESTMENT COMPANIES — 0.30% |
| 514,226 | | Dreyfus Government Cash Management Fund | | | 514,226 |
| 514,228 | | Fidelity U.S. Treasury II Fund | | | 514,228 |
| | | | | | | | | |
|
|
| | | TOTAL REGISTERED INVESTMENT COMPANIES
(Cost $1,028,454) | | | 1,028,454 |
| | | | | | | | | |
|
|
| | | | | | | |
TOTAL INVESTMENTS
(Cost $351,611,696)(c) | | 102.11 | % | | $ | 346,326,878 | |
LIABILITIES IN EXCESS OF OTHER ASSETS | | (2.11 | ) | | | (7,160,064 | ) |
| | |
|
| |
|
|
|
NET ASSETS | | 100.00 | % | | $ | 339,166,814 | |
| | |
|
| |
|
|
|
| (a) | Variable Rate Security—The rate disclosed is as of March 31, 2006. |
| (b) | All or part of the security is segregated by the Fund’s custodian to cover future purchase commitments. |
| (c) | Unrealized appreciation (depreciation) of securities: |
| | | | | | | | | |
Unrealized
Appreciation
| | Unrealized
(Depreciation)
| | | Net Unrealized
Appreciation/
(Depreciation)
| |
| $ | 38,103 | | $ | (5,322,921 | ) | | $ | (5,284,818 | ) |
See Notes to Financial Statements.
47
Excelsior Funds, Inc.
Portfolio of Investments — March 31, 2006
Short-Term Government Securities Fund — (continued)
ARM—Adjustable Rate Mortgage
Discount Note—The rate reported is the discount rate at the time of purchase.
See Notes to Financial Statements.
48
The summary of the Fund’s investments as of March 31, 2006 is as follows: (Unaudited)
| | | | | | | |
Portfolio Diversification
| | % of
Net
Assets
| | | Value
| |
U.S. Government & Agency Securities | | 71.05 | % | | $ | 240,949,282 | |
Collateralized Mortgage Obligations | | 20.24 | | | | 68,660,377 | |
Commercial Mortgage-Backed Securities | | 4.90 | | | | 16,617,965 | |
Asset Backed Securities | | 5.62 | | | | 19,070,800 | |
Registered Investment Companies | | 0.30 | | | | 1,028,454 | |
| | |
|
| |
|
|
|
Total Investments. | | 102.11 | % | | $ | 346,326,878 | |
Liabilities in Excess of Other Assets | | (2.11 | ) | | | (7,160,064 | ) |
| | |
|
| |
|
|
|
Net Assets | | 100.00 | % | | $ | 339,166,814 | |
| | |
|
| |
|
|
|
Excelsior Tax-Exempt Funds, Inc.
Portfolio of Investments — March 31, 2006
Short-Term Tax-Exempt Securities Fund
| | | | | | | | | | | |
Principal
Amount
| | | | Rate
| | | Maturity
Date
| | Value
|
| | TAX-EXEMPT CASH EQUIVALENT SECURITIES — 30.66% |
| $ | 6,000,000 | | Clackamas County, Oregon, Hospital Facilities Authority Revenue Bonds, Providence Health System, Series E(a) | | 3.33 | % | | 10/01/33 | | $ | 6,000,000 |
| | 4,695,000 | | Denver, Colorado, City & County Certificates of Participation, Series C1, (AMBAC) (SPA: JP Morgan Chase Bank)(a) | | 3.17 | | | 12/01/29 | | | 4,695,000 |
| | 2,650,000 | | Fairfax County, Virginia, Economic Development Authority, Smithsonian Institution Revenue Bonds, Series A, (SPA: Bank of America N.A.)(a) | | 3.16 | | | 12/01/33 | | | 2,650,000 |
| | 6,000,000 | | Illinois Health Facilities Authority, Health Care Revenue Bonds, (FSA)(a) | | 3.33 | | | 05/15/29 | | | 6,000,000 |
| | 5,000,000 | | Jackson County, Mississippi, Pollution Control Revenue Bonds, Chevron (USA), Inc. Project(a) | | 3.15 | | | 06/01/23 | | | 5,000,000 |
| | 6,000,000 | | Kansas State Department of Transportation, Highway Revenue Bonds, Series C2, (SPA: Westdeutche Landesbank AG-Dexia Credit Local)(a) | | 3.12 | | | 09/01/19 | | | 6,000,000 |
| | 6,000,000 | | New York City, New York, Municipal Water Finance Authority, Water & Sewer System Revenue Bonds, Series G, (FGIC) (SPA: FGIC-SPI)(a) | | 3.13 | | | 06/15/24 | | | 6,000,000 |
| | 4,500,000 | | Ohio State General Obligation Bonds, Series B(a) | | 3.09 | | | 03/15/25 | | | 4,500,000 |
| | | | | | | | | | |
|
|
| | | | TOTAL TAX-EXEMPT CASH EQUIVALENT SECURITIES
(Cost $40,845,000) | | | 40,845,000 |
| | | | | | | | | | |
|
|
| | | | | | | | | | | |
Principal
Amount
| | | | Rate
| | | Maturity
Date
| | Value
|
| | TAX-EXEMPT SECURITIES — 57.34% |
| $ | 6,000,000 | | California State, General Obligation Bonds | | 5.00 | % | | 06/01/08 | | $ | 6,168,660 |
| | 5,000,000 | | Fairfax County, Virginia, Refunding & Public Improvements General Obligation Bonds, Series A | | 5.25 | | | 04/01/08 | | | 5,164,750 |
| | 3,850,000 | | Jacksonville, Florida, Electric Authority Revenue Bonds, Series 18 | | 5.00 | | | 10/01/08 | | | 3,969,812 |
| | 3,000,000 | | Jacksonville, Florida, Electric Authority Revenue Bonds, Series 21, (MBIA) | | 5.00 | | | 10/01/11 | | | 3,172,260 |
| | 5,000,000 | | Maryland State & Local Facilities General Obligation Bonds, Series B(b) | | 5.25 | | | 02/15/11 | | | 5,353,150 |
| | 5,035,000 | | Memphis, Tennessee, General Obligation Bonds, Series B, (MBIA) | | 5.00 | | | 11/01/08 | | | 5,209,060 |
| | 5,330,000 | | Multnomah County, Oregon, General Obligation Bonds, (AMBAC) | | 5.00 | | | 08/01/10 | | | 5,604,175 |
| | 7,405,000 | | New Jersey Economic Development Authority Revenue Bonds, Series F | | 5.00 | | | 06/15/07 | | | 7,519,556 |
| | 1,030,000 | | New York City, New York, General Obligation Bonds, Series C | | 5.25 | | | 08/01/09 | | | 1,076,144 |
| | 6,000,000 | | New York State Metropolitan Transportation Authority Revenue Bonds, Series H | | 5.25 | | | 11/15/10 | | | 6,348,960 |
| | 5,000,000 | | New York State Triborough Bridge & Tunnel Authority Revenue Bonds, (MBIA-IBC-BNY) | | 6.00 | | | 01/01/11 | | | 5,502,200 |
| | 5,000,000 | | New York State Urban Development Corporation, Correctional & Youth Facilities Revenue Bonds, Series A | | 5.25 | | | 01/01/21 | | | 5,183,950 |
See Notes to Financial Statements.
49
Excelsior Tax-Exempt Funds, Inc.
Portfolio of Investments — March 31, 2006
Short-Term Tax-Exempt Securities Fund — (continued)
| | | | | | | | | | |
Principal
Amount
| | | | Rate
| | | Maturity
Date
| | Value
|
TAX-EXEMPT SECURITIES — (continued) |
| $1,250,000 | | Puerto Rico Convention Center District Authority, Hotel Occupancy Tax Revenue Bonds, Series A | | 5.00 | % | | 07/01/11 | | $ | 1,307,875 |
| 3,000,000 | | Reedy Creek, Florida, Improvement District Utilities Revenue Bonds, Series 2, (MBIA) | | 5.25 | | | 10/01/10 | | | 3,190,680 |
| 3,995,000 | | South Carolina Transportation Infrastructure, Bank Revenue Bonds, Series A, (AMBAC)(b) | | 5.00 | | | 10/01/09 | | | 4,168,822 |
| 7,000,000 | | Southeastern Virginia Public Services Authority Revenue Bonds, Series A, (MBIA) | | 5.25 | | | 07/01/10 | | | 7,435,750 |
| | | | | | | | | |
|
|
| | | TOTAL TAX-EXEMPT SECURITIES
(Cost $76,898,451) | | | 76,375,804 |
| | | | | | | | | |
|
|
TAX-EXEMPT SECURITIES — ESCROWED IN U.S.
GOVERNMENTS — 10.55% |
| 4,565,000 | | Chicago, Illinois, Sales Tax Revenue Bonds, (FGIC) (Prerefunded 01/01/09 @ 101) | | 5.38 | | | 01/01/30 | | | 4,812,012 |
| 595,000 | | New Jersey Economic Development Authority Revenue Bonds, Series F (Escrowed to Maturity) | | 5.00 | | | 06/15/07 | | | 604,621 |
| 4,000,000 | | Oklahoma State Industrials Authority Revenue Bonds, Series A, (MBIA) (Prerefunded 08/15/09 @ 101) | | 5.75 | | | 08/15/29 | | | 4,285,520 |
| 4,000,000 | | University of Washington, Student Facilities Revenue Bonds, (FSA) (Prerefunded 06/01/10 @ 101) | | 5.75 | | | 06/01/25 | | | 4,352,160 |
| | | | | | | | | |
|
|
| | | TOTAL TAX-EXEMPT SECURITIES — ESCROWED IN U.S. GOVERNMENTS
(Cost $14,195,290) | | | 14,054,313 |
| | | | | | | | | |
|
|
| | | | | | | | | |
Shares
| | | |
| |
| | Value
|
| REGISTERED INVESTMENT COMPANIES — 0.37% |
| 1 | | BlackRock Muni Fund | | $ | 1 |
| 493,725 | | Dreyfus Tax Exempt Cash Fund | | | 493,725 |
| | | | | | | | |
|
|
| | | TOTAL REGISTERED INVESTMENT COMPANIES
(Cost $493,726) | | | 493,726 |
| | | | | | | | |
|
|
| | | | | | |
TOTAL INVESTMENTS
(Cost $132,432,467)(c) | | 98.92 | % | | $ | 131,768,843 |
OTHER ASSETS IN EXCESS OF LIABILITIES | | 1.08 | | | | 1,442,636 |
| | |
|
| |
|
|
NET ASSETS | | 100.00 | % | | $ | 133,211,479 |
| | |
|
| |
|
|
| (a) | Variable Rate Security—The rate disclosed is as of March 31, 2006. |
| (b) | All or part of the security is segregated by the Fund’s custodian to cover future purchase commitments. |
| (c) | Unrealized appreciation (depreciation) of securities: |
| | | | | | | | | |
Unrealized
Appreciation
| | Unrealized
(Depreciation)
| | | Net Unrealized
Appreciation/
(Depreciation)
| |
| $ | — | | $ | (663,624 | ) | | $ | (663,624 | ) |
AMBAC—American Municipal Bond Assurance Corp.
FGIC—Financial Guaranty Insurance Corp.
FGIC-SPI—Financial Guaranty Insurance Corp. Securities Purchase, Inc.
FSA—Financial Security Assurance
MBIA—Municipal Bond Insurance Association
SPA—Standby Purchase Agreement
See Notes to Financial Statements.
50
Excelsior Tax-Exempt Funds, Inc.
Portfolio of Investments — March 31, 2006
Short-Term Tax-Exempt Securities Fund — (continued)
Notes (The following notes have not been audited by Deloitte & Touche LLP):
These municipal securities meet the three highest ratings assigned by Moody’s Investors Services, Inc. or Standard and Poor’s Corporation or, where not rated, are determined by the Advisor, under the supervision of the Board of Directors, to be of comparable quality at the time of purchase to rated instruments that may be acquired by the Fund.
At March 31,2006, approximately 11% of the net assets are invested in municipal securities that have letter of credit enhancement features or escrows in U.S. Government securities backing them, on which the Fund relies. Without such features, the securities may or may not meet the quality standards of securities purchased by the Fund.
The summary of the Fund’s investments as of March 31, 2006 is as follows: (Unaudited)
| | | | | | |
State Diversification
| | % of
Net
Assets
| | | Value
|
New York | | 18.10 | % | | $ | 24,111,254 |
Virginia | | 11.45 | | | | 15,250,500 |
Oregon | | 8.71 | | | | 11,604,175 |
Illinois | | 8.12 | | | | 10,812,012 |
Florida | | 7.76 | | | | 10,332,752 |
New Jersey | | 6.10 | | | | 8,124,177 |
California | | 4.63 | | | | 6,168,660 |
Kansas | | 4.50 | | | | 6,000,000 |
Maryland | | 4.02 | | | | 5,353,150 |
Tennessee | | 3.91 | | | | 5,209,060 |
Mississippi | | 3.75 | | | | 5,000,000 |
Colorado | | 3.52 | | | | 4,695,000 |
Ohio | | 3.38 | | | | 4,500,000 |
Washington | | 3.27 | | | | 4,352,160 |
Oklahoma | | 3.22 | | | | 4,285,520 |
South Carolina | | 3.13 | | | | 4,168,822 |
Puerto Rico | | 0.98 | | | | 1,307,875 |
Registered Investment Companies | | 0.37 | | | | 493,726 |
| | |
|
| |
|
|
Total Investments | | 98.92 | % | | $ | 131,768,843 |
Other Assets in Excess of Liabilities | | 1.08 | | | | 1,442,636 |
| | |
|
| |
|
|
Net Assets | | 100.00 | % | | $ | 133,211,479 |
| | |
|
| |
|
|
See Notes to Financial Statements.
51
Excelsior Funds
Statements of Assets and Liabilities
March 31, 2006
| | | | | | | | | | | | | | | | |
| | | | |
| | | California
Short-Intermediate
Term Tax-Exempt
Income Fund
| | | Core Bond
Fund
| | | High Yield
Fund
| | | Intermediate-
Term Bond
Fund
| |
ASSETS: | | | | | | | | | | | | | | | | |
Investments, at cost — see accompanying portfolios | | $ | 66,020,791 | | | $ | 281,602,078 | | | $ | 149,252,213 | | | $ | 462,467,435 | |
| | |
|
|
| |
|
|
| |
|
|
| |
|
|
|
Investments, at value (Note 1) | | $ | 65,668,530 | | | $ | 276,970,866 | | | $ | 147,260,964 | | | $ | 454,302,320 | |
Cash | | | — | | | | 55,120 | | | | 67,667 | | | | 33,814 | |
Interest receivable | | | 876,561 | | | | 2,035,637 | | | | 3,099,231 | | | | 2,983,348 | |
Receivable for investments sold | | | — | | | | 23,572,035 | | | | 516,729 | | | | — | |
Receivable for fund shares sold | | | 60,929 | | | | 1,379,977 | | | | 269,603 | | | | 1,303,042 | |
Prepaid expenses and other assets | | | 2,369 | | | | 10,629 | | | | 7,499 | | | | 15,058 | |
| | |
|
|
| |
|
|
| |
|
|
| |
|
|
|
Total Assets | | | 66,608,389 | | | | 304,024,264 | | | | 151,221,693 | | | | 458,637,582 | |
LIABILITIES: | | | | | | | | | | | | | | | | |
Payable for dividends declared | | | 175,455 | | | | 1,033,843 | | | | 884,504 | | | | 1,597,063 | |
Payable for investments purchased | | | — | | | | 19,196,094 | | | | 1,012,500 | | | | 19,349,492 | |
Payable for fund shares redeemed | | | 21,094 | | | | 514,125 | | | | 91,496 | | | | 247,953 | |
Investment advisory fees payable (Note 2) | | | — | | | | 40,687 | | | | 72,065 | | | | 109,191 | |
Administration fees payable (Note 2) | | | 7,389 | | | | 36,260 | | | | 19,448 | | | | 56,080 | |
Distribution and shareholder servicing fees payable (Note 2) | | | 13,184 | | | | 87,672 | | | | 33,176 | | | | 78,041 | |
Directors’/Trustees’ fees and expenses payable (Note 2) | | | 60 | | | | 213 | | | | 127 | | | | 341 | |
Accrued expenses and other payables | | | 36,044 | | | | 99,445 | | | | 72,538 | | | | 126,715 | |
| | |
|
|
| |
|
|
| |
|
|
| |
|
|
|
Total Liabilities | | | 253,226 | | | | 21,008,339 | | | | 2,185,854 | | | | 21,564,876 | |
| | |
|
|
| |
|
|
| |
|
|
| |
|
|
|
NET ASSETS | | $ | 66,355,163 | | | $ | 283,015,925 | | | $ | 149,035,839 | | | $ | 437,072,706 | |
| | |
|
|
| |
|
|
| |
|
|
| |
|
|
|
NET ASSETS consist of: | | | | | | | | | | | | | | | | |
Undistributed (distributions in excess of) net investment income | | $ | 492 | | | $ | 2,407 | | | $ | (691,493 | ) | | $ | (10,852 | ) |
Accumulated net realized gain (loss) on investments | | | 214,251 | | | | (529,099 | ) | | | (65,200,572 | ) | | | (2,171,014 | ) |
Unrealized appreciation (depreciation) of investments | | | (352,261 | ) | | | (4,631,212 | ) | | | (1,991,249 | ) | | | (8,165,115 | ) |
Par value (Note 5) | | | 9,273 | | | | 32,015 | | | | 330 | | | | 62,340 | |
Paid in capital in excess of par value | | | 66,483,408 | | | | 288,141,814 | | | | 216,918,823 | | | | 447,357,347 | |
| | |
|
|
| |
|
|
| |
|
|
| |
|
|
|
Net Assets | | $ | 66,355,163 | | | $ | 283,015,925 | | | $ | 149,035,839 | | | $ | 437,072,706 | |
| | |
|
|
| |
|
|
| |
|
|
| |
|
|
|
Net Assets: | | | | | | | | | | | | | | | | |
Shares | | $ | 66,355,163 | | | $ | 281,766,940 | | | $ | 136,990,531 | | | $ | 437,072,706 | |
Institutional Shares | | | — | | | | 1,247,970 | | | | 12,045,308 | | | | — | |
Retirement Shares | | | — | | | | 1,015 | | | | — | | | | — | |
Shares Outstanding (Note 5): | | | | | | | | | | | | | | | | |
Shares | | | 9,272,624 | | | | 31,873,492 | | | | 30,260,155 | | | | 62,340,103 | |
Institutional Shares | | | — | | | | 141,213 | | | | 2,662,208 | | | | — | |
Retirement Shares | | | — | | | | 115 | | | | — | | | | — | |
NET ASSET VALUE PER SHARE (net assets ÷ shares outstanding) | | | | | | | | | | | | | | | | |
Shares | | | $7.16 | | | | $8.84 | | | | $4.53 | | | | $7.01 | |
| | |
|
|
| |
|
|
| |
|
|
| |
|
|
|
Institutional Shares | | | — | | | | $8.84 | | | | $4.52 | | | | — | |
| | |
|
|
| |
|
|
| |
|
|
| |
|
|
|
Retirement Shares | | | — | | | | $8.85 | (a) | | | — | | | | — | |
| | |
|
|
| |
|
|
| |
|
|
| |
|
|
|
See Notes to Financial Statements.
52
| | | | | | | | | | | | | | | | |
| | | | |
Intermediate-
Term
Tax-Exempt
Fund
| | Long-Term
Tax-Exempt
Fund
| | New York
Intermediate-
Term Tax-Exempt
Fund
| | | Short-Term
Government
Securities
Fund
| | | Short-Term
Tax-Exempt
Securities
Fund
| |
| | | | |
| $ | 339,539,311 | | $ | 60,338,669 | | $ | 130,049,895 | | | $ | 351,611,696 | | | $ | 132,432,467 | |
|
| |
|
| |
|
|
| |
|
|
| |
|
|
|
| $ | 340,331,343 | | $ | 60,378,891 | | $ | 129,513,274 | | | $ | 346,326,878 | | | $ | 131,768,843 | |
| | — | | | — | | | — | | | | 1 | | | | — | |
| | 4,653,572 | | | 812,796 | | | 1,549,914 | | | | 1,725,250 | | | | 1,385,315 | |
| | 7,000,767 | | | — | | | — | | | | 14,992,603 | | | | — | |
| | 2,017,361 | | | 316,867 | | | 425,293 | | | | 683,733 | | | | 539,952 | |
| | 13,306 | | | 2,428 | | | 5,524 | | | | 16,079 | | | | 9,907 | |
|
| |
|
| |
|
|
| |
|
|
| |
|
|
|
| | 354,016,349 | | | 61,510,982 | | | 131,494,005 | | | | 363,744,544 | | | | 133,704,017 | |
| | | | |
| | 1,001,757 | | | 176,517 | | | 335,677 | | | | 1,178,443 | | | | 299,445 | |
| | — | | | — | | | — | | | | 21,832,087 | | | | — | |
| | 35,774 | | | 5,322 | | | 1,673 | | | | 1,208,369 | | | | 89,611 | |
| | 63,595 | | | 12,118 | | | 37,810 | | | | 63,706 | | | | 16,411 | |
| | 45,275 | | | 7,919 | | | 16,820 | | | | 44,028 | | | | 17,362 | |
|
77,920 | | | 17,926 | | | 26,043 | | | | 113,470 | | | | 8,529 | |
| | | | |
| | 269 | | | 45 | | | 97 | | | | 274 | | | | 113 | |
| | 96,003 | | | 33,891 | | | 49,884 | | | | 137,353 | | | | 61,067 | |
|
| |
|
| |
|
|
| |
|
|
| |
|
|
|
| | 1,320,593 | | | 253,738 | | | 468,004 | | | | 24,577,730 | | | | 492,538 | |
|
| |
|
| |
|
|
| |
|
|
| |
|
|
|
| $ | 352,695,756 | | $ | 61,257,244 | | $ | 131,026,001 | | | $ | 339,166,814 | | | $ | 133,211,479 | |
|
| |
|
| |
|
|
| |
|
|
| |
|
|
|
| | | | |
| $ | 215 | | $ | 1,401 | | $ | 121 | | | $ | (29,336 | ) | | $ | — | |
| | | | |
| | 730,630 | | | 392,494 | | | (524,525 | ) | | | (12,499,867 | ) | | | (2,641,880 | ) |
| | | | |
| | 792,032 | | | 40,222 | | | (536,621 | ) | | | (5,284,818 | ) | | | (663,624 | ) |
| | 37,985 | | | 6,105 | | | 15,332 | | | | 49,032 | | | | 18,812 | |
| | 351,134,894 | | | 60,817,022 | | | 132,071,694 | | | | 356,931,803 | | | | 136,498,171 | |
|
| |
|
| |
|
|
| |
|
|
| |
|
|
|
| $ | 352,695,756 | | $ | 61,257,244 | | $ | 131,026,001 | | | $ | 339,166,814 | | | $ | 133,211,479 | |
|
| |
|
| |
|
|
| |
|
|
| |
|
|
|
| | | | |
| $ | 352,695,756 | | $ | 61,257,244 | | $ | 131,026,001 | | | $ | 339,166,814 | | | $ | 133,211,479 | |
| | — | | | — | | | — | | | | — | | | | — | |
| | — | | | — | | | — | | | | — | | | | — | |
| | | | |
| | 37,985,164 | | | 6,105,217 | | | 15,331,918 | | | | 49,032,451 | | | | 18,812,380 | |
| | — | | | — | | | — | | | | — | | | | — | |
| | — | | | — | | | — | | | | — | | | | — | |
| | | | |
| | $9.29 | | | $10.03 | | | $8.55 | | | | $6.92 | | | | $7.08 | |
|
| |
|
| |
|
|
| |
|
|
| |
|
|
|
| | — | | | — | | | — | | | | — | | | | — | |
|
| |
|
| |
|
|
| |
|
|
| |
|
|
|
| | — | | | — | | | — | | | | — | | | | — | |
|
| |
|
| |
|
|
| |
|
|
| |
|
|
|
| (a) | Due to rounding net assets divided by shares outstanding does not equal the net asset value per share. |
See Notes to Financial Statements.
53
Excelsior Funds
Statements of Operations
Year Ended March 31, 2006
| | | | | | | | | | | | | | | | |
| | | | |
| | | California
Short-Intermediate
Term Tax-Exempt
Income Fund
| | | Core Bond
Fund
| | | High Yield
Fund
| | | Intermediate-
Term Bond
Fund
| |
INVESTMENT INCOME: | | | | | | | | | | | | | | | | |
Interest income | | $ | 2,323,264 | | | $ | 11,931,800 | | | $ | 12,974,846 | | | $ | 18,730,659 | |
Dividend income | | | 68,100 | | | | 363,045 | | | | — | | | | 741,872 | |
| | |
|
|
| |
|
|
| |
|
|
| |
|
|
|
Total Income | | | 2,391,364 | | | | 12,294,845 | | | | 12,974,846 | | | | 19,472,531 | |
| | |
|
|
| |
|
|
| |
|
|
| |
|
|
|
EXPENSES: | | | | | | | | | | | | | | | | |
Investment advisory fees (Note 2) | | | 331,058 | | | | 1,861,068 | | | | 1,315,469 | | | | 1,527,786 | |
Administration fees (Note 2) | | | 99,992 | | | | 374,736 | | | | 248,330 | | | | 659,217 | |
Shareholder servicing fees — Shares (Note 2) | | | 165,477 | | | | 619,871 | | | | 373,757 | | | | 1,090,940 | |
Distribution and shareholder servicing fees — Retirement Shares (Note 2) | | | — | | | | 8 | | | | — | | | | — | |
Legal and audit fees | | | 26,238 | | | | 21,339 | | | | 33,451 | | | | 65,104 | |
Custodian fees | | | 6,955 | | | | 31,771 | | | | 8,896 | | | | 25,083 | |
Transfer agent fees | | | 12,196 | | | | 115,087 | | | | 29,777 | | | | 25,335 | |
Directors’/Trustees’ fees and expenses (Note 2) | | | 2,736 | | | | 10,076 | | | | 7,319 | | | | 18,499 | |
Miscellaneous expenses | | | 38,943 | | | | 186,792 | | | | 71,429 | | | | 104,480 | |
| | |
|
|
| |
|
|
| |
|
|
| |
|
|
|
Total Expenses | | | 683,595 | | | | 3,220,748 | | | | 2,088,428 | | | | 3,516,444 | |
Fees waived and reimbursed by: | | | | | | | | | | | | | | | | |
Investment adviser (Note 2) | | | (331,058 | ) | | | (987,738 | ) | | | (399,394 | ) | | | (384,019 | ) |
Administrator (Note 2) | | | (21,478 | ) | | | — | | | | — | | | | — | |
| | |
|
|
| |
|
|
| |
|
|
| |
|
|
|
Net Expenses | | | 331,059 | | | | 2,233,010 | | | | 1,689,034 | | | | 3,132,425 | |
| | |
|
|
| |
|
|
| |
|
|
| |
|
|
|
NET INVESTMENT INCOME | | | 2,060,305 | | | | 10,061,835 | | | | 11,285,812 | | | | 16,340,106 | |
| | |
|
|
| |
|
|
| |
|
|
| |
|
|
|
REALIZED AND UNREALIZED GAIN (LOSS) ON INVESTMENTS (Note 1): | | | | | | | | | | | | | | | | |
Net realized gain (loss) on security transactions | | | 215,226 | | | | 1,284,930 | | | | (4,085,478 | ) | | | (1,475,445 | ) |
Change in unrealized appreciation (depreciation) of investments during the year | | | (1,292,978 | ) | | | (7,274,735 | ) | | | (1,518,767 | ) | | | (6,389,324 | ) |
| | |
|
|
| |
|
|
| |
|
|
| |
|
|
|
Net realized and unrealized gain (loss) on investments | | | (1,077,752 | ) | | | (5,989,805 | ) | | | (5,604,245 | ) | | | (7,864,769 | ) |
| | |
|
|
| |
|
|
| |
|
|
| |
|
|
|
Net increase in net assets resulting from operations | | $ | 982,553 | | | $ | 4,072,030 | | | $ | 5,681,567 | | | $ | 8,475,337 | |
| | |
|
|
| |
|
|
| |
|
|
| |
|
|
|
See Notes to Financial Statements.
54
| | | | | | | | | | | | | | | | | | |
| | | | |
Intermediate-
Term
Tax-Exempt
Fund
| | | Long-Term
Tax-Exempt
Fund
| | | New York
Intermediate-
Term Tax-Exempt
Fund
| | | Short-Term
Government
Securities
Fund
| | | Short-Term
Tax-Exempt
Securities
Fund
| |
| | | | | | | | | | | | | | | | | | | |
| $ | 13,143,900 | | | $ | 2,308,647 | | | $ | 4,733,836 | | | $ | 12,821,448 | | | $ | 4,434,469 | |
| | 99,093 | | | | 34,532 | | | | 52,315 | | | | 241,725 | | | | 72,928 | |
|
|
| |
|
|
| |
|
|
| |
|
|
| |
|
|
|
| | 13,242,993 | | | | 2,343,179 | | | | 4,786,151 | | | | 13,063,173 | | | | 4,507,397 | |
|
|
| |
|
|
| |
|
|
| |
|
|
| |
|
|
|
| | | | | | | | | | | | | | | | | | | |
| | 1,239,032 | | | | 307,592 | | | | 682,344 | | | | 1,126,517 | | | | 526,290 | |
| | 534,627 | | | | 92,906 | | | | 206,097 | | | | 567,094 | | | | 264,945 | |
| | 884,881 | | | | 142,536 | | | | 341,058 | | | | 938,760 | | | | 438,376 | |
| | | | |
| | — | | | | — | | | | — | | | | — | | | | — | |
| | 48,762 | | | | 21,469 | | | | 32,446 | | | | 52,630 | | | | 34,917 | |
| | 17,757 | | | | 5,553 | | | | 9,426 | | | | 22,215 | | | | 9,035 | |
| | 18,704 | | | | 20,590 | | | | 13,991 | | | | 91,998 | | | | 14,016 | |
| | 14,944 | | | | 2,522 | | | | 5,845 | | | | 16,531 | | | | 8,573 | |
| | 73,079 | | | | 32,347 | | | | 39,538 | | | | 92,072 | | | | 48,442 | |
|
|
| |
|
|
| |
|
|
| |
|
|
| |
|
|
|
| | 2,831,786 | | | | 625,515 | | | | 1,330,745 | | | | 2,907,817 | | | | 1,344,594 | |
| | | | | | | | | | | | | | | | | | | |
| | (530,735 | ) | | | (133,366 | ) | | | (238,995 | ) | | | (474,679 | ) | | | (292,016 | ) |
| | — | | | | — | | | | — | | | | — | | | | — | |
|
|
| |
|
|
| |
|
|
| |
|
|
| |
|
|
|
| | 2,301,051 | | | | 492,149 | | | | 1,091,750 | | | | 2,433,138 | | | | 1,052,578 | |
|
|
| |
|
|
| |
|
|
| |
|
|
| |
|
|
|
| | 10,941,942 | | | | 1,851,030 | | | | 3,694,401 | | | | 10,630,035 | | | | 3,454,819 | |
|
|
| |
|
|
| |
|
|
| |
|
|
| |
|
|
|
| | | | |
| | | | | | | | | | | | | | | | | | | |
| | 730,630 | | | | 654,816 | | | | (524,525 | ) | | | (2,723,414 | ) | | | (2,252,492 | ) |
| | | | |
| | (5,288,523 | ) | | | (820,799 | ) | | | (227,681 | ) | | | 503,856 | | | | 1,341,352 | |
|
|
| |
|
|
| |
|
|
| |
|
|
| |
|
|
|
| | | | |
| | (4,557,893 | ) | | | (165,983 | ) | | | (752,206 | ) | | | (2,219,558 | ) | | | (911,140 | ) |
|
|
| |
|
|
| |
|
|
| |
|
|
| |
|
|
|
| | | | |
| $ | 6,384,049 | | | $ | 1,685,047 | | | $ | 2,942,195 | | | $ | 8,410,477 | | | $ | 2,543,679 | |
|
|
| |
|
|
| |
|
|
| |
|
|
| |
|
|
|
See Notes to Financial Statements.
55
Excelsior Funds
Statements of Changes in Net Assets
| | | | | | | | | | | | | | | | |
| | |
| | | California Short-
Intermediate Term Tax-
Exempt Income Fund
| | | Core Bond Fund
| |
| | | Year Ended March 31,
| | | Year Ended March 31,
| |
| | | 2006
| | | 2005
| | | 2006
| | | 2005
| |
Net investment income | | $ | 2,060,305 | | | $ | 2,022,209 | | | $ | 10,061,835 | | | $ | 10,538,687 | |
Net realized gain (loss) on security transactions | | | 215,226 | | | | (311 | ) | | | 1,284,930 | | | | 3,809,789 | |
Change in unrealized appreciation (depreciation) of investments during the year | | | (1,292,978 | ) | | | (1,976,428 | ) | | | (7,274,735 | ) | | | (9,984,664 | ) |
| | |
|
|
| |
|
|
| |
|
|
| |
|
|
|
Net increase in net assets resulting from operations | | | 982,553 | | | | 45,470 | | | | 4,072,030 | | | | 4,363,812 | |
| | |
|
|
| |
|
|
| |
|
|
| |
|
|
|
Distributions to shareholders: | | | | | | | | | | | | | | | | |
From net investment income | | | | | | | | | | | | | | | | |
Shares | | | (2,061,472 | ) | | | (2,021,815 | ) | | | (10,218,978 | ) | | | (10,706,658 | ) |
Institutional Shares | | | — | | | | — | | | | (6,254 | ) | | | — | |
Retirement Shares | | | — | | | | — | | | | (38 | ) | | | (4 | ) |
From net realized gain on investments | | | | | | | | | | | | | | | | |
Shares | | | — | | | | — | | | | (3,571,500 | ) | | | (1,392,832 | ) |
Institutional Shares | | | — | | | | — | | | | (13 | ) | | | — | |
Retirement Shares | | | — | | | | — | | | | (13 | ) | | | — | |
From tax return of capital | | | | | | | | | | | | | | | | |
Shares | | | — | | | | — | | | | — | | | | — | |
Institutional Shares | | | — | | | | — | | | | — | | | | — | |
| | |
|
|
| |
|
|
| |
|
|
| |
|
|
|
Total distributions | | | (2,061,472 | ) | | | (2,021,815 | ) | | | (13,796,796 | ) | | | (12,099,494 | ) |
| | |
|
|
| |
|
|
| |
|
|
| |
|
|
|
Increase (decrease) in net assets from fund share transactions (Note 5) | | | 4,484,991 | | | | (1,968,940 | ) | | | 80,807,705 | | | | (49,358,178 | ) |
| | |
|
|
| |
|
|
| |
|
|
| |
|
|
|
Net increase (decrease) in net assets | | | 3,406,072 | | | | (3,945,285 | ) | | | 71,082,939 | | | | (57,093,860 | ) |
| | |
|
|
| |
|
|
| |
|
|
| |
|
|
|
NET ASSETS: | | | | | | | | | | | | | | | | |
Beginning of year | | | 62,949,091 | | | | 66,894,376 | | | | 211,932,986 | | | | 269,026,846 | |
| | |
|
|
| |
|
|
| |
|
|
| |
|
|
|
End of year (1) | | $ | 66,355,163 | | | $ | 62,949,091 | | | $ | 283,015,925 | | | $ | 211,932,986 | |
| | |
|
|
| |
|
|
| |
|
|
| |
|
|
|
(1) Including undistributed (distributions in excess of) net investment income | | $ | 492 | | | $ | 1,659 | | | $ | 2,407 | | | $ | 9,744 | |
| | |
|
|
| |
|
|
| |
|
|
| |
|
|
|
See Notes to Financial Statements.
56
| | | | | | | | | | | | | | | | | | | | | | |
| | |
High Yield Fund
| | | Intermediate-Term Bond Fund
| | | Intermediate-Term
Tax-Exempt Fund
| |
Year Ended March 31,
| | | Year Ended March 31,
| | | Year Ended March 31,
| |
2006
| | | 2005
| | | 2006
| | | 2005
| | | 2006
| | | 2005
| |
| $ | 11,285,812 | | | $ | 12,382,052 | | | $ | 16,340,106 | | | $ | 13,952,666 | | | $ | 10,941,942 | | | $ | 9,734,186 | |
| | (4,085,478 | ) | | | 1,684,436 | | | | (1,475,445 | ) | | | 1,414,970 | | | | 730,630 | | | | 374,010 | |
| | | | | |
| | (1,518,767 | ) | | | (3,437,364 | ) | | | (6,389,324 | ) | | | (14,217,960 | ) | | | (5,288,523 | ) | | | (10,001,492 | ) |
|
|
| |
|
|
| |
|
|
| |
|
|
| |
|
|
| |
|
|
|
| | 5,681,567 | | | | 10,629,124 | | | | 8,475,337 | | | | 1,149,676 | | | | 6,384,049 | | | | 106,704 | |
|
|
| |
|
|
| |
|
|
| |
|
|
| |
|
|
| |
|
|
|
| | | | | | | | | | | | | | | | | | | | | | | |
| | | | | | | | | | | | | | | | | | | | | | | |
| | (9,681,268 | ) | | | (10,208,446 | ) | | | (17,107,462 | ) | | | (14,239,514 | ) | | | (10,946,366 | ) | | | (9,735,305 | ) |
| | (1,002,532 | ) | | | (1,404,626 | ) | | | — | | | | — | | | | — | | | | — | |
| | — | | | | — | | | | — | | | | — | | | | — | | | | — | |
| | | | | | | | | | | | | | | | | | | | | | | |
| | — | | | | — | | | | (1,062,921 | ) | | | (572,247 | ) | | | (367,682 | ) | | | (1,550,278 | ) |
| | — | | | | — | | | | — | | | | — | | | | — | | | | — | |
| | — | | | | — | | | | — | | | | — | | | | — | | | | — | |
| | | | | | | | | | | | | | | | | | | | | | | |
| | (325,252 | ) | | | — | | | | — | | | | — | | | | — | | | | — | |
| | (28,599 | ) | | | — | | | | — | | | | — | | | | — | | | | — | |
|
|
| |
|
|
| |
|
|
| |
|
|
| |
|
|
| |
|
|
|
| | (11,037,651 | ) | | | (11,613,072 | ) | | | (18,170,383 | ) | | | (14,811,761 | ) | | | (11,314,048 | ) | | | (11,285,583 | ) |
|
|
| |
|
|
| |
|
|
| |
|
|
| |
|
|
| |
|
|
|
| | | | | |
| | (15,055,145 | ) | | | (3,685,731 | ) | | | 36,375,391 | | | | 10,787,119 | | | | 8,085,957 | | | | (26,905,099 | ) |
|
|
| |
|
|
| |
|
|
| |
|
|
| |
|
|
| |
|
|
|
| | (20,411,229 | ) | | | (4,669,679 | ) | | | 26,680,345 | | | | (2,874,966 | ) | | | 3,155,958 | | | | (38,083,978 | ) |
|
|
| |
|
|
| |
|
|
| |
|
|
| |
|
|
| |
|
|
|
| | | | | | | | | | | | | | | | | | | | | | | |
| | 169,447,068 | | | | 174,116,747 | | | | 410,392,361 | | | | 413,267,327 | | | | 349,539,798 | | | | 387,623,776 | |
|
|
| |
|
|
| |
|
|
| |
|
|
| |
|
|
| |
|
|
|
| $ | 149,035,839 | | | $ | 169,447,068 | | | $ | 437,072,706 | | | $ | 410,392,361 | | | $ | 352,695,756 | | | $ | 349,539,798 | |
|
|
| |
|
|
| |
|
|
| |
|
|
| |
|
|
| |
|
|
|
| | | | | |
| $ | (691,493 | ) | | $ | (1,124,014 | ) | | $ | (10,852 | ) | | $ | 108,371 | | | $ | 215 | | | $ | 4,425 | |
|
|
| |
|
|
| |
|
|
| |
|
|
| |
|
|
| |
|
|
|
See Notes to Financial Statements.
57
Excelsior Funds
Statements of Changes in Net Assets
| | | | | | | | | | | | | | | | |
| | |
| | | Long-Term Tax-
Exempt Fund
| | | New York Intermediate-Term
Tax-Exempt Fund
| |
| | | Year Ended March 31,
| | | Year Ended March 31,
| |
| | | 2006
| | | 2005
| | | 2006
| | | 2005
| |
Net investment income | | $ | 1,851,030 | | | $ | 1,807,013 | | | $ | 3,694,401 | | | $ | 3,795,659 | |
Net realized gain (loss) on security transactions | | | 654,816 | | | | 285,872 | | | | (524,525 | ) | | | 2,398,438 | |
Change in unrealized appreciation (depreciation) of investments during the year | | | (820,799 | ) | | | (549,586 | ) | | | (227,681 | ) | | | (5,684,669 | ) |
| | |
|
|
| |
|
|
| |
|
|
| |
|
|
|
Net increase (decrease) in net assets resulting from operations | | | 1,685,047 | | | | 1,543,299 | | | | 2,942,195 | | | | 509,428 | |
| | |
|
|
| |
|
|
| |
|
|
| |
|
|
|
Distributions to shareholders: | | | | | | | | | | | | | | | | |
From net investment income | | | | | | | | | | | | | | | | |
Shares | | | (1,851,155 | ) | | | (1,805,611 | ) | | | (3,697,161 | ) | | | (3,794,893 | ) |
From net realized gain on investments | | | | | | | | | | | | | | | | |
Shares | | | — | | | | — | | | | (1,825,117 | ) | | | (1,466,615 | ) |
| | |
|
|
| |
|
|
| |
|
|
| |
|
|
|
Total distributions | | | (1,851,155 | ) | | | (1,805,611 | ) | | | (5,522,278 | ) | | | (5,261,508 | ) |
| | |
|
|
| |
|
|
| |
|
|
| |
|
|
|
Increase (decrease) in net assets from fund share transactions (Note 5) | | | (1,393,785 | ) | | | (9,703,641 | ) | | | (4,646,822 | ) | | | (35,102,085 | ) |
| | |
|
|
| |
|
|
| |
|
|
| |
|
|
|
Net increase (decrease) in net assets | | | (1,559,893 | ) | | | (9,965,953 | ) | | | (7,226,905 | ) | | | (39,854,165 | ) |
| | |
|
|
| |
|
|
| |
|
|
| |
|
|
|
NET ASSETS: | | | | | | | | | | | | | | | | |
Beginning of year | | | 62,817,137 | | | | 72,783,090 | | | | 138,252,906 | | | | 178,107,071 | |
| | |
|
|
| |
|
|
| |
|
|
| |
|
|
|
End of year (1) | | $ | 61,257,244 | | | $ | 62,817,137 | | | $ | 131,026,001 | | | $ | 138,252,906 | |
| | |
|
|
| |
|
|
| |
|
|
| |
|
|
|
(1) Including undistributed (distributions in excess of) net investment income | | $ | 1,401 | | | $ | 1,526 | | | $ | 121 | | | $ | 2,760 | |
| | |
|
|
| |
|
|
| |
|
|
| |
|
|
|
See Notes to Financial Statements.
58
| | | | | | | | | | | | | | |
| |
Short-Term Government
Securities Fund
| | | Short-Term Tax-Exempt
Securities Fund
| |
Year Ended March 31,
| | | Year Ended March 31,
| |
2006
| | | 2005
| | | 2006
| | | 2005
| |
| $ | 10,630,035 | | | $ | 11,334,520 | | | $ | 3,454,819 | | | $ | 3,403,244 | |
| | (2,723,414 | ) | | | (3,590,260 | ) | | | (2,252,492 | ) | | | (389,388 | ) |
| | | |
| | 503,856 | | | | (7,603,787 | ) | | | 1,341,352 | | | | (3,435,518 | ) |
|
|
| |
|
|
| |
|
|
| |
|
|
|
| | | |
| | 8,410,477 | | | | 140,473 | | | | 2,543,679 | | | | (421,662 | ) |
|
|
| |
|
|
| |
|
|
| |
|
|
|
| | | | | | | | | | | | | | | |
| | | | | | | | | | | | | | | |
| | (13,063,721 | ) | | | (13,634,235 | ) | | | (3,460,145 | ) | | | (3,408,178 | ) |
| | | | | | | | | | | | | | | |
| | — | | | | — | | | | — | | | | (50,253 | ) |
|
|
| |
|
|
| |
|
|
| |
|
|
|
| | (13,063,721 | ) | | | (13,634,235 | ) | | | (3,460,145 | ) | | | (3,458,431 | ) |
|
|
| |
|
|
| |
|
|
| |
|
|
|
| | | |
| | (58,697,749 | ) | | | (53,206,126 | ) | | | (104,932,090 | ) | | | (117,663,509 | ) |
|
|
| |
|
|
| |
|
|
| |
|
|
|
| | (63,350,993 | ) | | | (66,699,888 | ) | | | (105,848,556 | ) | | | (121,543,602 | ) |
|
|
| |
|
|
| |
|
|
| |
|
|
|
| | | | | | | | | | | | | | | |
| | 402,517,807 | | | | 469,217,695 | | | | 239,060,035 | | | | 360,603,637 | |
|
|
| |
|
|
| |
|
|
| |
|
|
|
| $ | 339,166,814 | | | $ | 402,517,807 | | | $ | 133,211,479 | | | $ | 239,060,035 | |
|
|
| |
|
|
| |
|
|
| |
|
|
|
| | | |
| $ | (29,336 | ) | | $ | 35,416 | | | $ | — | | | $ | 5,326 | |
|
|
| |
|
|
| |
|
|
| |
|
|
|
See Notes to Financial Statements.
59
Excelsior Funds
Financial Highlights — Selected Per Share Data and Ratios
| | | | | | | | | | | | | | | | | | | | | | | | | | | |
| | | | | | | |
| | | Net Asset Value
Beginning of
Year
| | Net
Investment
Income
| | | Net Realized and
Unrealized Gain
(Loss) on
Investments
| | | Total From
Investment
Operations
| | | Distributions
From Net
Investment
Income
| | | Distributions
From Net
Realized
Gain on
Investments
| | | Total
Distributions
| |
CALIFORNIA TAX-EXEMPT INCOME FUND | | | | | | | | | | | | | | | | | |
Shares — (10/01/96*) | | | | | | | | | | | | | | | | | | | | | | | | |
Year Ended March 31, | | | | | | | | | | | | | | | | | | | | | | | | |
2006 | | $ | 7.27 | | $ | 0.23 | (2) | | $ | (0.11 | )(2) | | $ | 0.12 | | | $ | (0.23 | ) | | | — | | | $ | (0.23 | ) |
2005 | | | 7.49 | | | 0.23 | (2) | | | (0.22 | )(2) | | | 0.01 | | | | (0.23 | ) | | | — | | | | (0.23 | ) |
2004 | | | 7.49 | | | 0.24 | | | | — | | | | 0.24 | | | | (0.24 | ) | | | — | | | | (0.24 | ) |
2003 | | | 7.27 | | | 0.25 | | | | 0.22 | | | | 0.47 | | | | (0.25 | ) | | | — | (3) | | | (0.25 | ) |
2002 | | | 7.30 | | | 0.26 | | | | (0.02 | ) | | | 0.24 | | | | (0.26 | ) | | $ | (0.01 | ) | | | (0.27 | ) |
CORE BOND FUND | | | | | | | | | | | | | | | | | | | | | |
Shares — (01/09/86*) | | | | | | | | | | | | | | | | | | | | | | | | |
Year Ended March 31, | | | | | | | | | | | | | | | | | | | | | | | | |
2006 | | $ | 9.15 | | $ | 0.37 | (2) | | $ | (0.18 | )(2) | | $ | 0.19 | | | $ | (0.38 | ) | | $ | (0.12 | ) | | $ | (0.50 | ) |
2005 | | | 9.43 | | | 0.37 | (2) | | | (0.23 | )(2) | | | 0.14 | | | | (0.37 | ) | | | (0.05 | ) | | | (0.42 | ) |
2004 | | | 9.43 | | | 0.38 | | | | 0.14 | | | | 0.52 | | | | (0.38 | ) | | | (0.14 | ) | | | (0.52 | ) |
2003 | | | 8.95 | | | 0.47 | | | | 0.50 | | | | 0.97 | | | | (0.48 | ) | | | (0.01 | ) | | | (0.49 | ) |
2002 | | | 9.11 | | | 0.49 | | | | (0.10 | ) | | | 0.39 | | | | (0.50 | ) | | | (0.05 | ) | | | (0.55 | ) |
HIGH YIELD FUND | | | | | | | | | | | | | | | | | | | | | |
Shares — (10/31/00*) | | | | | | | | | | | | | | | | | | | | | | | | |
Year Ended March 31, | | | | | | | | | | | | | | | | | | | | | | | | |
2006 | | $ | 4.67 | | $ | 0.31 | (2) | | $ | (0.14 | )(2) | | $ | 0.17 | | | $ | (0.31 | )(4) | | | — | | | $ | (0.31 | ) |
2005 | | | 4.71 | | | 0.34 | (2) | | | (0.08 | )(2) | | | 0.26 | | | | (0.30 | ) | | | — | | | | (0.30 | ) |
2004 | | | 3.99 | | | 0.35 | (2) | | | 0.71 | (2) | | | 1.06 | | | | (0.34 | )(5) | | | — | | | | (0.34 | ) |
2003 | | | 6.20 | | | 0.88 | (2) | | | (1.54 | )(2) | | | (0.66 | ) | | | (1.55 | )(6) | | | — | | | | (1.55 | ) |
2002 | | | 7.26 | | | 1.08 | | | | (1.01 | ) | | | 0.07 | | | | (1.09 | ) | | $ | (0.04 | ) | | | (1.13 | ) |
INTERMEDIATE-TERM BOND FUND | | | | | | | | | | | | | | | | | | | | | |
Shares — (12/31/92*) | | | | | | | | | | | | | | | | | | | | | | | | |
Year Ended March 31, | | | | | | | | | | | | | | | | | | | | | | | | |
2006 | | $ | 7.16 | | $ | 0.27 | (2) | | $ | (0.12 | )(2) | | $ | 0.15 | | | $ | (0.28 | ) | | $ | (0.02 | ) | | $ | (0.30 | ) |
2005 | | | 7.40 | | | 0.26 | (2) | | | (0.22 | )(2) | | | 0.03 | | | | (0.26 | ) | | | (0.01 | ) | | | (0.27 | ) |
2004 | | | 7.39 | | | 0.26 | | | | 0.11 | | | | 0.37 | | | | (0.26 | ) | | | (0.10 | ) | | | (0.36 | ) |
2003 | | | 7.10 | | | 0.37 | | | | 0.36 | | | | 0.73 | | | | (0.40 | ) | | | (0.04 | ) | | | (0.44 | ) |
2002 | | | 7.18 | | | 0.39 | | | | (0.06 | ) | | | 0.33 | | | | (0.39 | ) | | | (0.02 | ) | | | (0.41 | ) |
INTERMEDIATE-TERM TAX-EXEMPT FUND | | | | | | | | | | | | | | | | | |
Shares — (12/03/85*) | | | | | | | | | | | | | | | | | | | | | | | | |
Year Ended March 31, | | | | | | | | | | | | | | | | | | | | | | | | |
2006 | | $ | 9.41 | | $ | 0.29 | (2) | | $ | (0.11 | )(2) | | $ | 0.18 | | | $ | (0.29 | ) | | $ | (0.01 | ) | | $ | (0.30 | ) |
2005 | | | 9.69 | | | 0.26 | (2) | | | (0.24 | )(2) | | | 0.02 | | | | (0.26 | ) | | | (0.04 | ) | | | (0.30 | ) |
2004 | | | 9.88 | | | 0.26 | | | | 0.15 | | | | 0.41 | | | | (0.26 | ) | | | (0.34 | ) | | | (0.60 | ) |
2003 | | | 9.39 | | | 0.31 | | | | 0.55 | | | | 0.86 | | | | (0.31 | ) | | | (0.06 | ) | | | (0.37 | ) |
2002 | | | 9.57 | | | 0.35 | | | | (0.12 | ) | | | 0.23 | | | | (0.35 | ) | | | (0.06 | ) | | | (0.41 | ) |
| * | Commencement of operations. |
| (1) | Expense ratios before waiver of fees and reimbursement of expenses (if any) by adviser and administrator. |
| (2) | For comparative purposes, per share amounts are based on average shares outstanding. |
| (3) | Amount represents less than $0.01 per share. |
| (4) | Includes a tax return of capital of $(0.01). |
| (5) | Includes a tax return of capital of $(0.08). |
| (6) | Includes a tax return of capital of $(0.51). |
See Notes to Financial Statements.
60
| | | | | | | | | | | | | | | | | | | |
| | | | | | |
Net Asset
Value,
End of
Year
| | Total
Return
| | | Net Assets,
End of
Year
(000’s)
| | Ratio of Net
Operating
Expenses to
Average Net
Assets
| | | Ratio of Gross
Operating
Expenses to
Average Net
Assets (1)
| | | Ratio of Net
Investment
Income to
Average Net
Assets
| | | Portfolio
Turnover
Rate
| |
| | | | | | | | | | | | | | | | | | | | |
| | | | | | | | | | | | | | | | | | | | |
| | | | | | | | | | | | | | | | | | | | |
| $ | 7.16 | | 1.60 | % | | $ | 66,355 | | 0.50 | % | | 1.03 | % | | 3.11 | % | | 48 | % |
| | 7.27 | | 0.20 | % | | | 62,949 | | 0.50 | % | | 1.05 | % | | 3.18 | % | | 10 | % |
| | 7.49 | | 3.19 | % | | | 66,894 | | 0.50 | % | | 0.90 | % | | 3.14 | % | | 15 | % |
| | 7.49 | | 6.59 | % | | | 66,194 | | 0.46 | % | | 0.50 | % | | 3.36 | % | | 9 | % |
| | 7.27 | | 3.32 | % | | | 58,230 | | 0.50 | % | | 0.87 | % | | 3.55 | % | | 4 | % |
| | | | | | | | | | | | | | | | | | | | |
| | | | | | | | | | | | | | | | | | | | |
| | | | | | | | | | | | | | | | | | | | |
| $ | 8.84 | | 2.00 | % | | $ | 281,767 | | 0.90 | % | | 1.30 | % | | 4.05 | % | | 95 | % |
| | 9.15 | | 1.55 | % | | | 211,932 | | 0.90 | % | | 1.27 | % | | 3.99 | % | | 90 | % |
| | 9.43 | | 5.74 | % | | | 269,027 | | 0.87 | % | | 1.11 | % | | 4.06 | % | | 84 | % |
| | 9.43 | | 11.07 | % | | | 293,182 | | 0.84 | % | | 0.95 | % | | 5.10 | % | | 120 | % |
| | 8.95 | | 4.34 | % | | | 247,804 | | 0.87 | % | | 1.04 | % | | 5.39 | % | | 129 | % |
| | | | | | | | | | | | | | | | | | | | |
| | | | | | | | | | | | | | | | | | | | |
| | | | | | | | | | | | | | | | | | | | |
| $ | 4.53 | | 3.72 | % | | $ | 136,991 | | 1.05 | % | | 1.29 | % | | 6.84 | % | | 62 | % |
| | 4.67 | | 5.54 | % | | | 156,139 | | 1.04 | % | | 1.30 | % | | 6.50 | % | | 70 | % |
| | 4.71 | | 27.45 | % | | | 151,476 | | 1.05 | % | | 1.36 | % | | 7.79 | % | | 170 | % |
| | 3.99 | | (10.49 | %) | | | 131,342 | | 1.08 | % | | 1.35 | % | | 18.06 | % | | 153 | % |
| | 6.20 | | 1.27 | % | | | 172,890 | | 1.03 | % | | 1.35 | % | | 17.56 | % | | 310 | % |
| | | | | | | | | | | | | | | | | | | | |
| | | | | | | | | | | | | | | | | | | | |
| | | | | | | | | | | | | | | | | | | | |
| $ | 7.01 | | 2.06 | % | | $ | 437,073 | | 0.72 | % | | 0.81 | % | | 3.74 | % | | 75 | % |
| | 7.16 | | 0.45 | % | | | 410,392 | | 0.60 | % | | 0.81 | % | | 3.53 | % | | 59 | % |
| | 7.40 | | 5.25 | % | | | 413,267 | | 0.56 | % | | 0.69 | % | | 3.56 | % | | 85 | % |
| | 7.39 | | 10.50 | % | | | 404,627 | | 0.53 | % | | 0.69 | % | | 4.56 | % | | 98 | % |
| | 7.10 | | 4.60 | % | | | 273,267 | | 0.52 | % | | 0.69 | % | | 5.47 | % | | 117 | % |
| | | | | | | | | | | | | | | | | | | | |
| | | | | | | | | | | | | | | | | | | | |
| | | | | | | | | | | | | | | | | | | | |
| $ | 9.29 | | 1.93 | % | | $ | 352,696 | | 0.65 | % | | 0.80 | % | | 3.09 | % | | 69 | % |
| | 9.41 | | 0.20 | % | | | 349,540 | | 0.65 | % | | 0.81 | % | | 2.69 | % | | 0 | % |
| | 9.69 | | 4.19 | % | | | 387,624 | | 0.56 | % | | 0.63 | % | | 2.60 | % | | 31 | % |
| | 9.88 | | 9.31 | % | | | 407,102 | | 0.51 | % | | 0.59 | % | | 3.15 | % | | 48 | % |
| | 9.39 | | 2.41 | % | | | 370,018 | | 0.52 | % | | 0.64 | % | | 3.67 | % | | 67 | % |
See Notes to Financial Statements.
61
Excelsior Funds
Financial Highlights — Selected Per Share Data and Ratios
| | | | | | | | | | | | | | | | | | | | | | | | | | |
| | | | | | | |
| | | Net Asset Value
Beginning of
Year
| | Net
Investment
Income
| | | Net Realized and
Unrealized Gain
(Loss) on
Investments
| | | Total From
Investment
Operations
| | Dividends
From Net
Investment
Income
| | | Distributions
From Net
Realized
Gain on
Investments
| | | Total
Distributions
| |
LONG-TERM TAX-EXEMPT FUND | | | | | | | | | | | | | | | | | | | | |
Shares — (02/05/86*) | | | | | | | | | | | | | | | | | | | | | | | |
Year Ended March 31, | | | | | | | | | | | | | | | | | | | | | | | |
2006 | | $ | 10.07 | | $ | 0.31 | (2) | | $ | (0.04 | )(2) | | $ | 0.27 | | $ | (0.31 | ) | | $ | — | | | $ | (0.31 | ) |
2005 | | | 10.08 | | | 0.27 | (2) | | | (0.01 | )(2) | | | 0.27 | | | (0.28 | ) | | | — | | | | (0.28 | ) |
2004 | | | 9.95 | | | 0.26 | | | | 0.13 | | | | 0.39 | | | (0.26 | ) | | | — | | | | (0.26 | ) |
2003 | | | 9.48 | | | 0.29 | | | | 0.47 | | | | 0.76 | | | (0.29 | ) | | | — | | | | (0.29 | ) |
2002 | | | 9.62 | | | 0.36 | | | | (0.14 | ) | | | 0.22 | | | (0.36 | ) | | | — | | | | (0.36 | ) |
NEW YORK INTERMEDIATE-TERM TAX-EXEMPT FUND | | | | | | | | | | | | | | | | |
Shares — (05/31/90*) | | | | | | | | | | | | | | | | | | | | | | | |
Year Ended March 31, | | | | | | | | | | | | | | | | | | | | | | | |
2006 | | $ | 8.71 | | $ | 0.24 | (2) | | $ | (0.04 | )(2) | | $ | 0.20 | | $ | (0.24 | ) | | $ | (0.12 | ) | | $ | (0.36 | ) |
2005 | | | 8.97 | | | 0.22 | (2) | | | (0.17 | )(2) | | | 0.05 | | | (0.22 | ) | | | (0.09 | ) | | | (0.31 | ) |
2004 | | | 9.12 | | | 0.22 | | | | 0.14 | | | | 0.36 | | | (0.22 | ) | | | (0.29 | ) | | | (0.51 | ) |
2003 | | | 8.74 | | | 0.27 | | | | 0.51 | | | | 0.78 | | | (0.27 | ) | | | (0.13 | ) | | | (0.40 | ) |
2002 | | | 8.83 | | | 0.31 | | | | (0.09 | ) | | | 0.22 | | | (0.31 | ) | | | — | | | | (0.31 | ) |
SHORT-TERM GOVERNMENT SECURITIES FUND | | | | | | | | | | | | | | | | |
Shares — (12/31/92*) | | | | | | | | | | | | | | | | | | | | | | | |
Year Ended March 31, | | | | | | | | | | | | | | | | | | | | | | | |
2006 | | $ | 7.00 | | $ | 0.20 | (2) | | $ | (0.04 | )(2) | | $ | 0.16 | | $ | (0.24 | ) | | $ | — | | | $ | (0.24 | ) |
2005 | | | 7.22 | | | 0.18 | (2) | | | 0.18 | (2) | | | — | | | (0.22 | ) | | | — | | | | (0.22 | ) |
2004 | | | 7.31 | | | 0.16 | | | | (0.03 | ) | | | 0.13 | | | (0.20 | ) | | | (0.02 | ) | | | (0.22 | ) |
2003 | | | 7.11 | | | 0.26 | | | | 0.25 | | | | 0.51 | | | (0.26 | ) | | | (0.05 | ) | | | (0.31 | ) |
2002 | | | 7.09 | | | 0.33 | | | | 0.05 | | | | 0.38 | | | (0.34 | ) | | | (0.02 | ) | | | (0.36 | ) |
SHORT-TERM TAX-EXEMPT SECURITIES FUND | | | | | | | | | | | | | | | | |
Shares — (12/31/92*) | | | | | | | | | | | | | | | | | | | | | | | |
Year Ended March 31, | | | | | | | | | | | | | | | | | | | | | | | |
2006 | | $ | 7.13 | | $ | 0.14 | (2) | | $ | (0.05 | )(2) | | $ | 0.09 | | $ | (0.14 | ) | | $ | — | | | $ | (0.14 | ) |
2005 | | | 7.22 | | | 0.09 | (2) | | | (0.09 | )(2) | | | — | | | (0.09 | ) | | | — | (3) | | | (0.09 | ) |
2004 | | | 7.20 | | | 0.08 | | | | 0.02 | | | | 0.10 | | | (0.08 | ) | | | — | | | | (0.08 | ) |
2003 | | | 7.17 | | | 0.12 | | | | 0.03 | | | | 0.15 | | | (0.12 | ) | | | — | | | | (0.12 | ) |
2002 | | | 7.15 | | | 0.20 | | | | 0.03 | | | | 0.23 | | | (0.20 | ) | | | (0.01 | ) | | | (0.21 | ) |
| * | Commencement of operations. |
| (1) | Expense ratios before waiver of fees and reimbursement of expenses (if any) by adviser and administrator. |
| (2) | For comparative purposes, per share amounts are based on average shares outstanding. |
| (3) | Amount represents less than $0.01 per share. |
See Notes to Financial Statements.
62
| | | | | | | | | | | | | | | | | | | |
| | | | | | |
Net Asset
Value,
End of
Year
| | Total
Return
| | | Net Assets,
End of
Year
(000’s)
| | Ratio of Net
Operating
Expenses to
Average Net
Assets
| | | Ratio of Gross
Operating
Expenses to
Average Net
Assets (1)
| | | Ratio of Net
Investement
Income to
Average Net
Assets
| | | Portfolio
Turnover
Rate
| |
| | | | | | | | | | | | | | | | | | | | |
| | | | | | | | | | | | | | | | | | | | |
| | | | | | | | | | | | | | | | | | | | |
| $ | 10.03 | | 2.64 | % | | $ | 61,257 | | 0.80 | % | | 1.02 | % | | 3.01 | % | | 88 | % |
| | 10.07 | | 2.68 | % | | | 62,817 | | 0.80 | % | | 1.05 | % | | 2.74 | % | | 87 | % |
| | 10.08 | | 4.01 | % | | | 72,783 | | 0.73 | % | | 0.80 | % | | 2.64 | % | | 111 | % |
| | 9.95 | | 8.12 | % | | | 94,965 | | 0.70 | % | | 0.77 | % | | 2.99 | % | | 51 | % |
| | 9.48 | | 2.29 | % | | | 115,178 | | 0.72 | % | | 0.82 | % | | 3.66 | % | | 35 | % |
| | | | | | | | | | | | | | | | | | | | |
| | | | | | | | | | | | | | | | | | | | |
| | | | | | | | | | | | | | | | | | | | |
| $ | 8.55 | | 2.25 | % | | $ | 131,026 | | 0.80 | % | | 0.98 | % | | 2.71 | % | | 83 | % |
| | 8.71 | | 0.52 | % | | | 138,253 | | 0.80 | % | | 0.98 | % | | 2.46 | % | | 15 | % |
| | 8.97 | | 4.06 | % | | | 178,107 | | 0.68 | % | | 0.73 | % | | 2.41 | % | | 42 | % |
| | 9.12 | | 8.96 | % | | | 187,400 | | 0.67 | % | | 0.72 | % | | 2.96 | % | | 43 | % |
| | 8.74 | | 2.54 | % | | | 178,608 | | 0.67 | % | | 0.72 | % | | 3.53 | % | | 45 | % |
| | | | | | | | | | | | | | | | | | | | |
| | | | | | | | | | | | | | | | | | | | |
| | | | | | | | | | | | | | | | | | | | |
| $ | 6.92 | | 2.36 | % | | $ | 339,167 | | 0.65 | % | | 0.77 | % | | 2.83 | % | | 118 | % |
| | 7.00 | | 0.01 | % | | | 402,518 | | 0.60 | % | | 0.79 | % | | 2.57 | % | | 106 | % |
| | 7.22 | | 1.90 | % | | | 469,218 | | 0.53 | % | | 0.67 | % | | 2.26 | % | | 231 | % |
| | 7.31 | | 7.27 | % | | | 499,519 | | 0.49 | % | | 0.64 | % | | 3.22 | % | | 170 | % |
| | 7.11 | | 5.35 | % | | | 193,780 | | 0.51 | % | | 0.61 | % | | 4.33 | % | | 75 | % |
| | | | | | | | | | | | | | | | | | | | |
| | | | | | | | | | | | | | | | | | | | |
| | | | | | | | | | | | | | | | | | | | |
| $ | 7.08 | | 1.33 | % | | $ | 133,211 | | 0.60 | % | | 0.77 | % | | 1.97 | % | | 111 | % |
| | 7.13 | | (0.01 | )% | | | 239,060 | | 0.60 | % | | 0.76 | % | | 1.21 | % | | 10 | % |
| | 7.22 | | 1.40 | % | | | 360,604 | | 0.47 | % | | 0.59 | % | | 1.12 | % | | 99 | % |
| | 7.20 | | 2.04 | % | | | 291,282 | | 0.46 | % | | 0.58 | % | | 1.57 | % | | 31 | % |
| | 7.17 | | 3.20 | % | | | 165,690 | | 0.48 | % | | 0.55 | % | | 2.60 | % | | 111 | % |
See Notes to Financial Statements.
63
EXCELSIOR FUNDS
NOTES TO FINANCIAL STATEMENTS
1. Significant Accounting Policies:
Excelsior Funds, Inc. (“Excelsior Fund”) was incorporated under the laws of the State of Maryland on August 2, 1984. Excelsior Tax-Exempt Funds, Inc. (“Excelsior Tax-Exempt Fund”) was incorporated under the laws of the State of Maryland on August 8, 1984. Excelsior Funds Trust (the “Trust”) is a statutory trust organized under the laws of the State of Delaware on April 27, 1994. Excelsior Fund, Excelsior Tax-Exempt Fund and the Trust are registered under the Investment Company Act of 1940, as amended (the “1940 Act”), as open-ended diversified management investment companies with the exception of California Short-Intermediate Term Tax-Exempt Income Fund (formerly California Tax-Exempt Income Fund), New York Intermediate-Term Tax-Exempt Fund, New York Tax-Exempt Money Fund, Energy and Natural Resources Fund and Real Estate Fund, each of which are non-diversified.
Excelsior Fund, Excelsior Tax-Exempt Fund and the Trust currently offer shares in fifteen, seven and seven managed investment portfolios, respectively, each having its own investment objectives and policies. The following is a summary of significant accounting policies for Core Bond Fund (formerly Managed Income Fund), Intermediate-Term Bond Fund (formerly Intermediate-Term Managed Income Fund) and Short-Term Government Securities Fund, portfolios of Excelsior Fund, California Short-Intermediate Term Tax-Exempt Income Fund, Intermediate-Term Tax-Exempt Fund, Long-Term Tax-Exempt Fund, New York Intermediate-Term Tax-Exempt Fund and Short-Term Tax-Exempt Securities Fund, portfolios of Excelsior Tax-Exempt Fund, and High Yield Fund, a portfolio of the Trust (each a “Fund”, collectively, the “Funds”). Such policies are in conformity with accounting principles generally accepted in the United States of America and are consistently followed by Excelsior Fund, Excelsior Tax-Exempt Fund and the Trust in the preparation of their financial statements. The preparation of financial statements requires management to make estimates and assumptions that affect the reported amounts and disclosures in the financial statements. Actual results could differ from these estimates.
The California Short-Intermediate Term Tax-Exempt Income Fund, Intermediate-Term Bond Fund, Intermediate-Term Tax-Exempt Fund, Long-Term Tax-Exempt Fund, New York Intermediate-Term Tax-Exempt Fund, Short-Term Government Securities Fund and Short-Term Tax-Exempt Securities Fund offer one class of shares: Shares. The Core Bond Fund offers three classes of shares: Shares, Institutional Shares and Retirement Shares. The High Yield Fund offers two classes of shares: Shares and Institutional Shares. The Financial Highlights of the Institutional shares and Retirement Shares as well as the financial statements for the remaining portfolios of Excelsior Fund, Excelsior Tax-Exempt Fund and the Trust are presented separately.
(a) Portfolio valuation:
Investments in securities that are traded on recognized domestic and foreign stock exchanges are valued at the last sale price on the exchange on which such securities are primarily traded or at the last quoted sale price on a national securities market. Securities traded over-the-counter are valued each business day on the basis of closing over-the-counter sale prices. Equity securities that are traded on the NASDAQ National Market System for which quotations are readily available are valued at the official closing price. Securities for which there were no transactions are valued at the last quoted sales price for
64
the most recent day such prices were available. Securities for which market quotations are not readily available are valued in good faith at fair value pursuant to procedures adopted by the Board of Directors with regard to Excelsior Fund and the Board of Trustees with regard to the Trust.
Short-term debt instruments that mature in 60 days or less are valued at amortized cost, which approximates market value. If available, debt securities are priced based upon valuations provided by independent, third-party pricing agents. The third-party pricing agents value debt securities at an evaluated price by employing methodologies that utilize actual market transactions, broker-supplied valuations, or other methodologies designed to identify the market value for such securities.
(b) Concentration of risks:
The High Yield Fund is subject to special risks associated with investments in high yield bonds, which involve greater risk of default or downgrade and are more volatile than investment grade securities due to actual or perceived changes in an issuer’s creditworthiness. In addition, issuers of high yield bonds may be more susceptible than other issuers to economic downturns. High yield bonds are subject to the risk that the issuer may not be able to pay interest or dividends and ultimately repay principal upon maturity. Discontinuation of these payments could adversely affect the market value of the security.
At March 31, 2006, approximately, 96% of the net assets of the California Short-Intermediate Term Tax-Exempt Income Fund is invested in California municipal securities and 93% of the net assets of the New York Intermediate-Term Tax-Exempt Fund is invested in New York municipal securities. Economic changes affecting the states and certain of its public bodies and municipalities may affect the ability of issuers to pay the required principal and interest payments of the municipal securities.
(c) Security transactions and investment income:
Security transactions are recorded on a trade date basis. Realized gains and losses on investments sold are recorded on the basis of identified cost. Interest income, adjusted for amortization of premiums and, when appropriate, discounts on investments, is earned from settlement date and is recorded on the accrual basis. Dividend income is recorded on the ex-dividend date, except for certain dividends from foreign securities, which are recorded as soon as the Funds are informed of the dividend.
(d) Repurchase agreements:
The Funds may purchase portfolio securities from financial institutions deemed to be creditworthy by the investment adviser subject to the seller’s agreement to repurchase and the Funds’ agreement to resell such securities at mutually agreed upon prices. Securities purchased subject to such repurchase agreements are deposited with the Funds’ custodian or sub-custodian or are maintained in the Federal Reserve/Treasury book-entry system and must have, at all times, an aggregate market value not less than the repurchase price (including accrued interest).
Default or bankruptcy of the seller may, however, expose the applicable Fund to possible delay in connection with the disposition of the securities or loss to the extent that proceeds from a sale of the underlying securities were less than the repurchase price under the agreement.
65
(e) TBA purchase commitments:
Certain Funds may enter into “TBA” (To Be Announced) purchase commitments to purchase securities for a fixed price at a future date, typically not exceeding 45 days. TBA purchase commitments may be considered securities in themselves, and involve risk of loss if the value of the security to be purchased declines prior to settlement date. The Funds must maintain liquid securities having a value not less than the purchase price (including accrued interest) for such purchase commitments. Unsettled TBA purchase commitments are valued at the current market value of the underlying securities, according to the procedures described under “Portfolio Valuation” above.
(f) Mortgage dollar rolls:
Certain Funds may enter into mortgage dollar rolls (principally in securities referred to as TBA, (see note 1(e)) in which the Funds sell mortgage securities for delivery in the current month and simultaneously contract to repurchase similar, but not identical, securities at an agreed upon price on a fixed date. The Funds account for such dollar rolls as purchases and sales and receive compensation in consideration for entering into the commitment to repurchase. The Funds must maintain liquid securities having a value not less that the repurchase price (including accrued interest) for such dollar rolls. The market value of the securities that the Funds are required to repurchase may decline below the agreed upon repurchase price of those securities.
(g) Distributions to shareholders:
Dividends from net investment income are declared daily and paid monthly. Net realized capital gains, unless offset by any available capital loss carryforward, are distributed at least annually. Dividends and distributions are recorded on the ex-dividend date.
(h) Expense allocation:
Expenses directly attributable to a Fund are charged to that Fund. Other expenses are allocated to the respective Fund based on average daily net assets. Expenses attributable to a specific class of shares, such as shareholder servicing fees, are charged directly to that class.
2. Investment Advisory Fee, Administration Fee, Shareholder Servicing Fees and Related Party Transactions:
Prior to December 16, 2005, the Funds were advised jointly by United States Trust Company of New York and U.S. Trust Company, N.A., through their respective separate identifiable divisions. Effective December 16, 2005, U.S. Trust Company, N.A.’s separately identifiable division was reorganized into a separate corporate entity named UST Advisers, Inc., a Delaware corporation that is a wholly-owned subsidiary of U.S. Trust Company, N.A. and the Funds were advised by either UST Advisers, Inc. or U.S. Trust New York Asset Management Division (“NYAMD”), the separately identifiable division of United States Trust Company of New York.
Effective March 31, 2006, United States Trust Company of New York converted to a national charter and changed its name to United States Trust Company, National Association (“USTC-NA”) and merged with U.S. Trust Company, N.A., with USTC-NA as the surviving entity. As of March 31, 2006, the Funds
66
are advised by NYAMD, a separate identifiable division of USTC-NA, or UST Advisers, Inc. (together with NYAMD, the “Advisers”), a wholly-owned subsidiary of USTC-NA. USTC-NA is a wholly-owned subsidiary of US Trust Corporation, a registered bank holding company, which, in turn, is a wholly-owned subsidiary of The Charles Schwab Corporation. For the services provided pursuant to the Investment Advisory Agreements, each Adviser receives a fee, computed daily and paid monthly, as follows:
| | | |
California Short-Intermediate Term Tax-Exempt Income Fund | | 0.50 | % |
Core Bond Fund | | 0.75 | % |
High Yield Fund | | 0.80 | % |
Intermediate-Term Bond Fund | | 0.35 | % |
Intermediate-Term Tax-Exempt Fund | | 0.35 | % |
Long-Term Tax-Exempt Fund | | 0.50 | % |
New York Intermediate-Term Tax-Exempt Fund | | 0.50 | % |
Short-Term Government Securities Fund | | 0.30 | % |
Short-Term Tax-Exempt Securities Fund | | 0.30 | % |
UST Advisers, Inc. and BISYS Fund Services Ohio, Inc. (collectively, the “Administrators”) provide administrative services to the Funds. For the services provided to the Funds, the Administrators are entitled jointly to annual fees, computed daily and paid monthly, based on the combined aggregate average daily net assets of Excelsior Fund, Excelsior Tax-Exempt Fund and the Trust (excluding the international equity portfolios of Excelsior Fund and the Trust), all of which are affiliated investment companies, as follows: 0.200% of the first $200 million, 0.175% of the next $200 million and 0.150% over $400 million. The Administrators are entitled jointly to annual fees, computed daily and paid monthly, at the annual rate of 0.20% of the average daily net assets of the Emerging Markets Fund, International Equity Fund, International Fund and Pacific/Asia Fund. Administration fees payable by each Fund of the Excelsior Fund, Excelsior Tax-Exempt Fund and the Trust are determined in proportion to the relative average daily net assets of the respective Funds for the period paid. For the year ended March 31, 2006, administration fees charged to the Funds were as follows:
| | | | | | | | | | |
| | | Administration
Fees
| | Waiver
Administration
Fees
| | | Net
Administration
Fees
|
California Short-Intermediate Term Tax-Exempt Income Fund | | $ | 99,992 | | $ | (21,478 | ) | | $ | 78,514 |
Core Bond Fund | | | 374,736 | | | — | | | | 374,736 |
High Yield Fund | | | 248,330 | | | — | | | | 248,330 |
Intermediate-Term Bond Fund | | | 659,217 | | | — | | | | 659,217 |
Intermediate-Term Tax-Exempt Fund | | | 534,627 | | | — | | | | 534,627 |
Long-Term Tax-Exempt Fund | | | 92,906 | | | — | | | | 92,906 |
New York Intermediate-Term Tax-Exempt Fund | | | 206,097 | | | — | | | | 206,097 |
Short-Term Government Securities Fund | | | 567,094 | | | — | | | | 567,094 |
Short-Term Tax-Exempt Securities Fund | | | 264,945 | | | — | | | | 264,945 |
From time to time, in its sole discretion, each Adviser may undertake to waive a portion or all of the fees payable to it and may also reimburse the Funds for a portion of other expenses. For the four months ended July 31, 2005 and the eight months ended March 31, 2006, the Advisers have contractually agreed
67
to waive investment advisory fees and to reimburse other ordinary operating expenses to the extent necessary to keep total operating expenses from exceeding the following annual percentages of each Fund’s average daily net assets:
| | | | | | |
| | | Four Months
Ended
July 31,
2005
| | | Eight Months
Ended
March 31,
2006
| |
California Short-Intermediate Term Tax-Exempt Income Fund —Shares | | 0.50 | % | | 0.50 | % |
Core Bond Fund — Shares | | 0.90 | % | | 0.90 | % |
High Yield Fund — Shares | | 1.05 | % | | 1.05 | % |
Intermediate-Term Bond Fund — Shares | | 0.65 | % | | 0.75 | % |
Intermediate-Term Tax-Exempt Fund — Shares | | 0.65 | % | | 0.65 | % |
Long-Term Tax-Exempt Fund — Shares | | 0.80 | % | | 0.80 | % |
New York Intermediate-Term Tax-Exempt
Fund — Shares | | 0.80 | % | | 0.80 | % |
Short-Term Government Securities Fund — Shares* | | 0.60 | % | | 0.75 | % |
Short-Term Tax-Exempt Securities Fund — Shares | | 0.60 | % | | 0.60 | % |
Core Bond Fund — Institutional Shares** | | N/A | | | 0.65 | % |
High Yield Fund — Institutional Shares | | 0.80 | % | | 0.80 | % |
Core Bond Fund — Retirement Shares | | 1.40 | % | | 1.40 | % |
| * | From August 1, 2005 through November 30, 2005, the Advisers voluntarily capped the Short-Term Government Securities Fund at 0.65%, from December 1, 2005 through March 31, 2006, the Fund was voluntarily capped at 0.70%. Effective April 1, 2006, the Adviser has capped the Fund at 0.75%. |
| ** | Institutional Shares commenced operations on November 29, 2005. |
For the year ended March 31, 2006, pursuant to the above, investment advisory fees waived by the Advisers were as follows:
| | | | |
California Short-Intermediate Term Tax-Exempt Income Fund | | $ | (331,058 | ) |
Core Bond Fund | | | (987,738 | ) |
High Yield Fund | | | (399,394 | ) |
Intermediate-Term Bond Fund | | | (384,019 | ) |
Intermediate-Term Tax-Exempt Fund | | | (530,735 | ) |
Long-Term Tax-Exempt Fund | | | (133,366 | ) |
New York Intermediate-Term Tax-Exempt Fund | | | (238,995 | ) |
Short-Term Government Securities Fund | | | (474,679 | ) |
Short-Term Tax-Exempt Securities Fund | | | (292,016 | ) |
The Funds have entered into shareholder servicing agreements with various service organizations, which include Charles Schwab & Co. Inc. (“CS & Co.”) and UST Advisers, Inc. Services included in the servicing agreements are assisting in processing purchase, exchange and redemption requests; transmitting and receiving funds in connection with customer orders to purchase, exchange or redeem shares; and providing periodic statements. Shareholder servicing fees are incurred on a Fund or class level (where applicable). In consideration for these services, each service organization receives a fee
68
from the Funds, computed daily and paid monthly, at an annual rate up to 0.25% of the average daily net assets of the Funds’ shares held by each service organization’s customers. The Advisers, out of their own resources, may additionally compensate certain organizations for providing these and other services.
For the year ended March 31, 2006, shareholder servicing fees paid to CS & Co. and the Advisers were as follows:
| | | |
California Short-Intermediate Term Tax-Exempt Income Fund | | $ | 168,155 |
Core Bond Fund | | | 473,281 |
High Yield Fund | | | 377,405 |
Intermediate-Term Bond Fund | | | 1,143,128 |
Intermediate-Term Tax-Exempt Fund | | | 933,129 |
Long-Term Tax-Exempt Fund | | | 146,527 |
New York Intermediate-Term Tax-Exempt Fund | | | 356,046 |
Short-Term Government Securities Fund | | | 857,188 |
Short-Term Tax-Exempt Securities Fund | | | 476,448 |
BISYS Fund Services Limited Partnership (the “Distributor”) serves as the Distributor of the Funds. Shares of each Fund are sold without a sales charge on a continuous basis by the Distributor.
Certain Funds have adopted a Distribution Plan pursuant to Rule 12b-1 under the 1940 Act, under which they may compensate the Distributor monthly for its services that are intended to result in the sale of Fund Shares (in the case of High Yield Fund) or Retirement Shares (in the case of Core Bond Fund), in an amount not to exceed the annual rate of 0.25% or 0.50%, respectively, of the average daily net asset value of such Fund’s Shares or Retirement Shares. For the year ended March 31, 2006, fees charged for Retirement Shares of Core Bond Fund were $4.
Each Independent Director/Trustee of the Funds receives a total annual fee of $100,000 paid by the Funds and other affiliated registered investment companies managed by the Advisers. The Chairman of the Board receives an additional $30,000, the Chairman of the Audit Committee receives an additional $15,000, and the Chairman of the Nominating Committee receives an additional $5,000 for serving in those capacities. In addition, Directors and Trustees are reimbursed by Excelsior Fund, Excelsior Tax-Exempt Fund and the Trust, respectively, for reasonable expenses incurred when acting in their capacity as Directors and Trustees.
69
3. Purchases, Sales and Maturities of Securities:
For the year ended March 31, 2006, purchases, sales and maturities of securities, excluding short-term investments, for the Funds aggregated:
| | | | | | |
| | | Purchases
| | Sales and
Maturities
|
California Short-Intermediate Term Tax-Exempt Income Fund | | $ | 34,414,300 | | $ | 29,746,597 |
Core Bond Fund | | | | | | |
U.S. Government | | | 234,143,975 | | | 174,000,688 |
Other | | | 72,340,542 | | | 48,360,840 |
High Yield Fund | | | 94,851,386 | | | 111,074,059 |
Intermediate-Term Bond Fund | | | | | | |
U.S. Government | | | 209,556,658 | | | 182,867,647 |
Other | | | 110,467,593 | | | 113,301,103 |
Intermediate-Term Tax-Exempt Fund | | | 277,935,725 | | | 204,958,140 |
Long-Term Tax-Exempt Fund | | | 51,188,308 | | | 39,937,890 |
New York Intermediate-Term Tax-Exempt Fund | | | 102,284,925 | | | 88,816,328 |
Short-Term Government Securities Fund | | | | | | |
U.S. Government | | | 397,078,888 | | | 450,351,865 |
Other | | | 35,417,247 | | | 33,202,159 |
Short-Term Tax-Exempt Securities Fund | | | 128,189,243 | | | 168,786,516 |
4. Federal Taxes:
It is the policy of Excelsior Fund, Excelsior Tax-Exempt Fund and the Trust that each Fund qualify or continue to qualify as a regulated investment company, by complying with the requirements of the Internal Revenue Code applicable to regulated investment companies, and by distributing substantially all of its taxable earnings to its shareholders.
In order to avoid a federal excise tax, each Fund is required to distribute certain minimum amounts of net realized capital gain and net investment income for the respective twelve-month periods ending October 31 and December 31 each calendar year.
Net realized gains of the Funds derived in certain countries are subject to certain foreign taxation.
70
Dividends and distributions are determined in accordance with federal income tax regulations and may differ from accounting principles generally accepted in the United States of America. These differences are primarily due to differing treatments for deferral of losses on wash sales and net capital losses incurred after October 31 and within the taxable year (“Post-October losses”). To the extent these differences are permanent, adjustments are made to the appropriate equity accounts in the period that these differences arise. Accordingly, the following reclassifications have been made to/from the following accounts:
| | | | | | | | | | | |
| | | Undistributed Net Investment Income
| | Accumulated Net Realized Gain (Loss)
| | | Paid-In-Capital
| |
California Short-Intermediate Term Tax-Exempt Income Fund | | $ | — | | $ | — | | | $ | — | |
Core Bond Fund | | | 156,098 | | | (156,098 | ) | | | — | |
High Yield Fund | | | 184,360 | | | 169,492 | | | | (353,852 | ) |
Intermediate-Term Bond Fund | | | 648,133 | | | (648,133 | ) | | | — | |
Intermediate-Term Tax-Exempt Fund | | | 214 | | | (214 | ) | | | — | |
Long-Term Tax-Exempt Fund | | | — | | | — | | | | — | |
New York Intermediate-Term Tax-Exempt Fund | | | 121 | | | (121 | ) | | | — | |
Short-Term Government Securities Fund | | | 2,368,934 | | | (2,368,934 | ) | | | — | |
Short-Term Tax-Exempt Securities Fund | | | — | | | — | | | | — | |
71
The tax character of dividends and distributions declared during the years ended March 31, 2006 and March 31, 2005 were as follows:
| | | | | | | | | | | | | | | |
| | | Ordinary
Income
| | Tax-Exempt
Income
| | Long-Term
Capital Gain
| | Return of
Capital
| | Total
|
California Short-Intermediate Term Tax-Exempt Income Fund | | | | | | | | | | | | | | | |
Year ended March 31, 2006 | | $ | — | | $ | 2,014,082 | | $ | — | | $ | — | | $ | 2,014,082 |
Year ended March 31, 2005 | | | — | | | 2,063,597 | | | — | | | — | | | 2,063,597 |
Core Bond Fund | | | | | | | | | | | | | | | |
Year ended March 31, 2006 | | | 11,105,896 | | | — | | | 2,085,376 | | | — | | | 13,191,272 |
Year ended March 31, 2005 | | | 11,633,310 | | | — | | | 1,031,057 | | | — | | | 12,664,367 |
High Yield Fund | | | | | | | | | | | | | | | |
Year ended March 31, 2006 | | | 10,553,157 | | | — | | | — | | | 353,851 | | | 10,907,008 |
Year ended March 31, 2005 | | | 11,801,334 | | | — | | | — | | | — | | | 11,801,334 |
Intermediate-Term Bond Fund | | | | | | | | | | | | | | | |
Year ended March 31, 2006 | | | 16,649,941 | | | — | | | 1,063,363 | | | — | | | 17,713,304 |
Year ended March 31, 2005 | | | 14,305,244 | | | — | | | 572,247 | | | — | | | 14,877,491 |
Intermediate-Term Tax-Exempt Fund | | | | | | | | | | | | | | | |
Year ended March 31, 2006 | | | — | | | 10,697,181 | | | 367,896 | | | — | | | 11,065,077 |
Year ended March 31, 2005 | | | 256,062 | | | 9,828,278 | | | 1,294,216 | | | — | | | 11,378,556 |
Long-Term Tax-Exempt Fund | | | | | | | | | | | | | | | |
Year ended March 31, 2006 | | | — | | | 1,794,756 | | | — | | | — | | | 1,794,756 |
Year ended March 31, 2005 | | | — | | | 1,833,293 | | | — | | | — | | | 1,833,293 |
New York Intermediate-Term Tax-Exempt Fund | | | | | | | | | | | | | | | |
Year ended March 31, 2006 | | | — | | | 3,604,795 | | | 1,825,238 | | | — | | | 5,430,033 |
Year ended March 31, 2005 | | | — | | | 3,894,510 | | | 1,466,615 | | | — | | | 5,361,125 |
Short-Term Government Securities Fund | | | | | | | | | | | | | | | |
Year ended March 31, 2006 | | | 12,770,972 | | | — | | | — | | | — | | | 12,770,972 |
Year ended March 31, 2005 | | | 13,966,986 | | | — | | | — | | | — | | | 13,966,986 |
Short-Term Tax-Exempt Securities Fund | | | | | | | | | | | | | | | |
Year ended March 31, 2006 | | | — | | | 3,428,764 | | | — | | | — | | | 3,428,764 |
Year ended March 31, 2005 | | | 24,949 | | | 3,424,866 | | | 22,878 | | | — | | | 3,472,693 |
72
As of March 31, 2006, the components of distributable earnings (accumulated losses) on a tax basis were as follows:
| | | | | | | | | | | | | | | | | | | | | | | | | | | | | |
| | | Undistributed
Ordinary
Income
| | Undistributed
Tax-Exempt
Income
| | Undistributed
Long-Term
Capital Gains
| | Distributions
Payable
| | | Accumulated
Capital and
Other
Losses
| | | Post-
October
Losses
| | | Unrealized
Appreciation
(Depreciation)
| | | Total
Accumulated
Earnings/
(Deficit)
| |
California Short-Intermediate Term Tax-Exempt Income
Fund | | $ | — | | $ | 175,454 | | $ | 214,251 | | $ | (175,455 | ) | | $ | — | | | $ | — | | | $ | (351,768 | ) | | $ | (137,518 | ) |
Core Bond Fund | | | 1,036,250 | | | — | | | — | | | (1,033,843 | ) | | | — | | | | (529,099 | ) | | | (4,631,212 | ) | | | (5,157,904 | ) |
High Yield Fund | | | — | | | — | | | — | | | (884,504 | ) | | | (67,220,796 | ) | | | (1,126,388 | ) | | | 1,348,374 | | | | (67,883,314 | ) |
Intermediate-Term Bond Fund | | | 1,586,211 | | | — | | | — | | | (1,597,063 | ) | | | (481,322 | ) | | | (1,596,591 | ) | | | (8,258,216 | ) | | | (10,346,981 | ) |
Intermediate-Term Tax-Exempt Fund | | | — | | | 1,001,972 | | | 730,630 | | | (1,001,757 | ) | | | — | | | | — | | | | 792,032 | | | | 1,522,877 | |
Long-Term Tax-Exempt Fund | | | — | | | 176,516 | | | 392,494 | | | (176,517 | ) | | | — | | | | — | | | | 41,624 | | | | 434,117 | |
New York Intermediate-Term Tax-Exempt Fund | | | — | | | 335,798 | | | — | | | (335,677 | ) | | | (165,776 | ) | | | (358,749 | ) | | | (536,621 | ) | | | (1,061,025 | ) |
Short-Term Government Securities Fund | | | 1,149,107 | | | — | | | — | | | (1,178,443 | ) | | | (10,712,075 | ) | | | (1,785,815 | ) | | | (5,286,795 | ) | | | (17,814,021 | ) |
Short-Term Tax-Exempt Securities Fund | | | — | | | 299,445 | | | — | | | (299,445 | ) | | | (805,304 | ) | | | (1,836,576 | ) | | | (663,624 | ) | | | (3,305,504 | ) |
Post-October losses are deemed to arise on the first business day of a Fund’s next taxable year.
73
For federal income tax purposes, capital loss carryforwards may be carried forward and applied against future capital gains. To the extent that such carryforwards are utilized, capital gains distributions will be reduced. At March 31, 2006, the following Funds had capital loss carryforwards available to offset future net capital gains through the indicated expiration dates.
| | | | | | | | | | | | | | | | | | |
| | | Expires
| | Total
|
| | | 2010
| | 2011
| | 2012
| | 2013
| | 2014
| |
High Yield Fund | | $ | 2,181,571 | | $ | 17,456,849 | | $ | 40,103,941 | | $ | 1,461,417 | | $ | 6,017,018 | | $ | 67,220,796 |
Intermediate-Term Bond Fund | | | — | | | — | | | — | | | — | | | 481,322 | | | 481,322 |
New York Intermediate-Term
Tax-Exempt Fund | | | — | | | — | | | — | | | — | | | 165,776 | | | 165,776 |
Short-Term Government Securities Fund | | | — | | | — | | | 1,481,228 | | | 4,260,524 | | | 4,970,323 | | | 10,712,075 |
Short-Term Tax-Exempt Securities Fund | | | — | | | — | | | — | | | 287,228 | | | 518,076 | | | 805,304 |
At March 31, 2006, aggregate gross unrealized appreciation for all securities and call options written for which there was an excess of value over estimated tax cost and aggregate gross unrealized depreciation for all securities for which there was an excess of estimated tax cost over value is as follows:
| | | | | | | | | | | | | | |
| | | Federal
Tax
Cost
| | Tax Basis
Unrealized
Appreciation
| | Tax Basis
Unrealized
(Depreciation)
| | | Net
Unrealized
Appreciation
(Depreciation)
| |
California Short-Intermediate Term Tax-Exempt Income Fund | | $ | 66,020,298 | | $ | 192,810 | | $ | (544,578 | ) | | $ | (351,768 | ) |
Core Bond Fund | | | 281,602,078 | | | 761,879 | | | (5,393,091 | ) | | | (4,631,212 | ) |
High Yield Fund | | | 145,912,590 | | | 6,262,276 | | | (4,913,902 | ) | | | 1,348,374 | |
Intermediate-Term Bond Fund | | | 462,560,536 | | | 755,079 | | | (9,013,295 | ) | | | (8,258,216 | ) |
Intermediate-Term Tax-Exempt Fund | | | 339,539,311 | | | 3,443,657 | | | (2,651,625 | ) | | | 792,032 | |
Long-Term Tax-Exempt Fund | | | 60,337,267 | | | 377,125 | | | (335,501 | ) | | | 41,624 | |
New York Intermediate-Term Tax-Exempt Fund | | | 130,049,895 | | | 428,503 | | | (965,124 | ) | | | (536,621 | ) |
Short-Term Government Securities Fund | | | 351,613,673 | | | 36,126 | | | (5,322,921 | ) | | | (5,286,795 | ) |
Short-Term Tax-Exempt Securities Fund | | | 132,432,467 | | | — | | | (663,624 | ) | | | (663,624 | ) |
5. Capital Transactions:
Excelsior Fund has authorized capital of 35 billion shares of Common Stock, 29.3756 billion of which is currently classified to represent interests in certain classes of shares. Authorized capital currently offered for each Fund is as follows: 750 million shares of the Core Bond Fund; 1.5 billion shares of the Intermediate-Term Bond Fund; and 1 billion shares of the Short-Term Government Securities Fund. Each share has a par value of $0.001 and represents an equal proportionate interest in the particular Fund with other shares of the same Fund, and is entitled to such dividends and distributions of taxable earnings on the assets belonging to such Fund as are declared at the discretion of Excelsior Fund’s Board of Directors.
74
Excelsior Tax-Exempt Fund has authorized capital of 24 billion shares of Common Stock, 15 billion of which is currently classified to represent interests in certain classes of shares. Authorized capital currently offered for each Fund is as follows: 1.5 billion shares each of California Short-Intermediate Term Tax-Exempt Income Fund, Intermediate-Term Tax-Exempt Fund, Long-Term Tax-Exempt Fund, New York Intermediate-Term Tax-Exempt Fund and Short-Term Tax-Exempt Securities Fund. Each share has a par value of $0.001 and represents an equal proportionate interest in the particular Fund with other shares of the same Fund, and is entitled to such dividends and distributions of taxable and tax-exempt earnings on the assets belonging to such Fund as are declared at the discretion of Excelsior Tax-Exempt Fund’s Board of Directors.
The Trust has authorized an unlimited number of shares of beneficial interest of each class of each Fund. Each share has a par value of $0.00001 and represents an equal proportionate interest in the particular Fund with other shares of the same Fund, and is entitled to such dividends and distributions of taxable earnings on the assets belonging to such Fund as are declared at the discretion of the Trust’s Board of Trustees.
Capital Share Transactions
| | | | | | | | | | | | | | |
| | | California Short-Intermediate Term Tax-Exempt Income Fund
| |
| | | Year Ended March 31,
| |
| | | 2006
| | | 2005
| |
| | | Shares
| | | Amount
| | | Shares
| | | Amount
| |
Sold | | 3,993,301 | | | $ | 28,933,240 | | | 3,278,532 | | | $ | 24,146,853 | |
Issued as reinvestment of dividends | | 87,807 | | | | 635,525 | | | 42,748 | | | | 314,174 | |
Redeemed | | (3,467,123 | ) | | | (25,083,774 | ) | | (3,595,284 | ) | | | (26,429,967 | ) |
| | |
|
| |
|
|
| |
|
| |
|
|
|
Net Increase (Decrease) | | 613,985 | | | $ | 4,484,991 | | | (274,004 | ) | | $ | (1,968,940 | ) |
| | |
|
| |
|
|
| |
|
| |
|
|
|
| |
| | | Core Bond Fund*
| |
| | | Year Ended March 31,
| |
| | | 2006
| | | 2005
| |
| | | Shares
| | | Amount
| | | Shares
| | | Amount
| |
Sold: | | | | | | | | | | | | | | |
Shares | | 13,774,392 | | | $ | 125,488,152 | | | 7,544,152 | | | $ | 69,875,602 | |
Institutional Shares | | 141,024 | | | | 1,262,505 | | | — | | | | — | |
Retirement Shares | | — | | | | — | | | 126 | | | | 1,050 | |
Issued as reinvestment of dividends: | | | | | | | | | | | | | | |
Shares | | 681,642 | | | | 6,160,386 | | | 331,579 | | | | 3,062,096 | |
Institutional Shares | | 189 | | | | 1,685 | | | — | | | | — | |
Retirement Shares | | 5 | | | | 50 | | | — | | | | 4 | |
Redeemed: | | | | | | | | | | | | | | |
Shares | | (5,733,515 | ) | | | (52,104,922 | ) | | (4,431,412 | ) | | | (40,768,322 | ) |
Retirement Shares | | (16 | ) | | | (151 | ) | | — | | | | — | |
Redemption in-kind | | — | | | | — | | | (8,833,002 | ) | | | (81,528,608 | ) |
| | |
|
| |
|
|
| |
|
| |
|
|
|
Net Increase (Decrease) | | 8,863,721 | | | $ | 80,807,705 | | | (5,388,557 | ) | | $ | (49,358,178 | ) |
| | |
|
| |
|
|
| |
|
| |
|
|
|
75
| | | | | | | | | | | | | | |
| | | High Yield Fund
| |
| | | Year Ended March 31,
| |
| | | 2006
| | | 2005
| |
| | | Shares
| | | Amount
| | | Shares
| | | Amount
| |
Sold: | | | | | | | | | | | | | | |
Shares | | 13,700,176 | | | $ | 62,544,844 | | | 21,515,855 | | | $ | 101,230,357 | |
Institutional Shares | | 853,862 | | | | 3,892,678 | | | 1,316,771 | | | | 6,247,385 | |
Issued as reinvestment of dividends: | | | | | | | | | | | | | | |
Shares | | 304,113 | | | | 1,384,476 | | | 414,836 | | | | 1,961,707 | |
Institutional Shares | | 107,579 | | | | 488,209 | | | 8,493 | | | | 40,222 | |
Redeemed: | | | | | | | | | | | | | | |
Shares | | (17,199,458 | ) | | | (78,172,561 | ) | | (20,658,816 | ) | | | (97,478,269 | ) |
Institutional Shares | | (1,152,309 | ) | | | (5,192,791 | ) | | (3,282,976 | ) | | | (15,687,133 | ) |
| | |
|
| |
|
|
| |
|
| |
|
|
|
Net Increase (Decrease) | | (3,386,037 | ) | | $ | (15,055,145 | ) | | (685,837 | ) | | $ | (3,685,731 | ) |
| | |
|
| |
|
|
| |
|
| |
|
|
|
| |
| | | Intermediate-Term Bond Fund
| |
| | | Year Ended March 31,
| |
| | | 2006
| | | 2005
| |
| | | Shares
| | | Amount
| | | Shares
| | | Amount
| |
Sold | | 22,398,525 | | | $ | 160,313,146 | | | 15,055,086 | | | $ | 109,213,526 | |
Contribution in-kind | | — | | | | — | | | 1,044,029 | | | | 7,590,091 | |
Issued as reinvestment of dividends | | 315,931 | | | | 2,254,952 | | | 158,208 | | | | 1,145,388 | |
Redeemed | | (17,689,147 | ) | | | (126,192,707 | ) | | (14,791,878 | ) | | | (107,161,886 | ) |
| | |
|
| |
|
|
| |
|
| |
|
|
|
Net Increase (Decrease) | | 5,025,309 | | | $ | 36,375,391 | | | 1,465,445 | | | $ | 10,787,119 | |
| | |
|
| |
|
|
| |
|
| |
|
|
|
| |
| | | Intermediate-Term Tax-Exempt Fund
| |
| | | Year Ended March 31,
| |
| | | 2006
| | | 2005
| |
| | | Shares
| | | Amount
| | | Shares
| | | Amount
| |
Sold | | 11,552,408 | | | $ | 108,911,261 | | | 7,418,489 | | | $ | 70,630,402 | |
Issued as reinvestment of dividends | | 109,248 | | | | 1,029,354 | | | 107,050 | | | | 1,019,228 | |
Redeemed | | (10,822,740 | ) | | | (101,854,658 | ) | | (10,361,672 | ) | | | (98,554,729 | ) |
| | |
|
| |
|
|
| |
|
| |
|
|
|
Net Increase (Decrease) | | 838,916 | | | $ | 8,085,957 | | | (2,836,133 | ) | | $ | (26,905,099 | ) |
| | |
|
| |
|
|
| |
|
| |
|
|
|
| |
| | | Long-Term Tax-Exempt Fund
| |
| | | Year Ended March 31,
| |
| | | 2006
| | | 2005
| |
| | | Shares
| | | Amount
| | | Shares
| | | Amount
| |
Sold | | 706,825 | | | $ | 7,162,254 | | | 1,003,168 | | | $ | 9,987,153 | |
Issued as reinvestment of dividends | | 35,734 | | | | 362,312 | | | 31,144 | | | | 312,137 | |
Redeemed | | (878,007 | ) | | | (8,918,351 | ) | | (2,011,361 | ) | | | (20,002,931 | ) |
| | |
|
| |
|
|
| |
|
| |
|
|
|
Net Increase (Decrease) | | (135,448 | ) | | $ | (1,393,785 | ) | | (977,049 | ) | | $ | (9,703,641 | ) |
| | |
|
| |
|
|
| |
|
| |
|
|
|
76
| | | | | | | | | | | | | | |
| | | New York Intermediate-Term Tax-Exempt Fund
| |
| | | Year Ended March 31,
| |
| | | 2006
| | | 2005
| |
| | | Shares
| | | Amount
| | | Shares
| | | Amount
| |
Sold | | 4,652,138 | | | $ | 40,444,981 | | | 2,053,754 | | | $ | 18,150,200 | |
Issued as reinvestment of dividends | | 78,342 | | | | 678,293 | | | 67,207 | | | | 593,357 | |
Redeemed | | (5,273,634 | ) | | | (45,770,096 | ) | | (6,111,053 | ) | | | (53,845,642 | ) |
| | |
|
| |
|
|
| |
|
| |
|
|
|
Net Increase (Decrease) | | (543,154 | ) | | $ | (4,646,822 | ) | | (3,990,092 | ) | | $ | (35,102,085 | ) |
| | |
|
| |
|
|
| |
|
| |
|
|
|
| |
| | | Short-Term Government Securities Fund
| |
| | | Year Ended March 31,
| |
| | | 2006
| | | 2005
| |
| | | Shares
| | | Amount
| | | Shares
| | | Amount
| |
Sold | | 14,063,143 | | | $ | 98,248,597 | | | 28,457,660 | | | $ | 201,824,477 | |
Issued as reinvestment of dividends | | 448,563 | | | | 3,127,286 | | | 289,189 | | | | 2,044,988 | |
Redeemed | | (22,948,344 | ) | | | (160,073,632 | ) | | (36,290,718 | ) | | | (257,075,591 | ) |
| | |
|
| |
|
|
| |
|
| |
|
|
|
Net Increase (Decrease) | | (8,436,638 | ) | | $ | (58,697,749 | ) | | (7,543,869 | ) | | $ | (53,206,126 | ) |
| | |
|
| |
|
|
| |
|
| |
|
|
|
| |
| | | Short-Term Tax-Exempt Securities Fund
| |
| | | Year Ended March 31,
| |
| | | 2006
| | | 2005
| |
| | | Shares
| | | Amount
| | | Shares
| | | Amount
| |
Sold | | 4,626,627 | | | $ | 32,965,430 | | | 13,545,164 | | | $ | 97,050,761 | |
Issued as reinvestment of dividends | | 27,420 | | | | 195,121 | | | 23,592 | | | | 168,982 | |
Redeemed | | (19,386,165 | ) | | | (138,092,641 | ) | | (29,996,244 | ) | | | (214,883,252 | ) |
| | |
|
| |
|
|
| |
|
| |
|
|
|
Net Increase (Decrease) | | (14,732,118 | ) | | $ | (104,932,090 | ) | | (16,427,488 | ) | | $ | (117,663,509 | ) |
| | |
|
| |
|
|
| |
|
| |
|
|
|
| * | Institutional Shares commenced operations on November 29, 2005. |
6. Guarantees:
In the normal course of business, the Funds enter into contracts that provide general indemnifications. The Funds’ maximum exposure under these arrangements is dependent on future claims that may be made against the Funds and, therefore, cannot be established; however, based on experience, the risk of loss from such claims is considered remote.
7. Legal Proceedings:
The Adviser and Excelsior Funds, Inc., Excelsior Tax-Exempt Funds, Inc., and Excelsior Funds Trust (the “Companies”) were contacted in September, 2003 by the Office of the New York State Attorney General (the “NYAG”), and the Adviser was contacted by the Securities and Exchange Commission (the “SEC”) and later by the Attorney General of the State of West Virginia, in connection with their investigations of practices in the mutual fund industry identified as “market timing” and “late trading” of mutual fund shares (the “Investigations”). The Adviser and the Companies have provided full
77
cooperation with respect to these Investigations and continue to review the facts and circumstances relevant to the Investigations. As disclosed previously by the Adviser and its affiliates, with respect to the Adviser, these investigations have been focusing on circumstances in which a small number of parties were permitted to engage in short-term trading of shares of certain of the Excelsior Funds. The short-term trading activities permitted under these arrangements have been terminated and the Adviser has strengthened its policies and procedures to deter frequent trading of shares of the Excelsior Funds.
The Adviser, certain of its affiliates, the Companies and others have also been named in several class action and derivative lawsuits which allege that the Adviser, certain of its affiliates, the Companies and others allowed certain parties to engage in illegal and improper mutual fund trading practices, which allegedly caused financial injury to the shareholders of certain of the Excelsior Funds managed by the Adviser. Each seeks unspecified monetary damages and related equitable relief.
The class and derivative actions described above have been transferred to the United States District Court for the District of Maryland for coordinated and consolidated pre-trial proceedings. In November 2005, the Maryland court dismissed many of the plaintiffs’ claims in both the investor class action and the derivative lawsuits. Plaintiffs’ claims under Sections 10(b) and 20(a) of the Securities Exchange Act and under Section 36(b) and 48(a) of the Investment Company Act, however, have not been dismissed. Discovery has commenced with respect to plaintiffs’ remaining claims.
While the ultimate outcome of these matters cannot be predicted with any certainty at this time, based on currently available information and consultation with counsel, the Adviser believes that the resolution of the pending Investigations and private lawsuits will not have a material adverse financial impact on the Companies, and further believes that the pending Investigations and private lawsuits are not likely to materially affect the Adviser’s ability to provide investment management services to the Companies.
78
REPORT OF INDEPENDENT REGISTERED PUBLIC ACCOUNTING FIRM
To the Board of Directors/Trustees and Shareholders of
Excelsior Funds, Inc., Excelsior Funds Trust, and Excelsior Tax-Exempt Funds, Inc.
We have audited the accompanying statements of assets and liabilities, including the portfolios of investments, of the Core Bond Fund (formerly, Managed Income Fund), Intermediate-Term Bond Fund (formerly, Intermediate-Term Managed Income Fund), Short-Term Government Securities Fund, High Yield Fund, Long-Term Tax-Exempt Fund, Intermediate-Term Tax-Exempt Fund, Short-Term Tax-Exempt Securities Fund, New York Intermediate-Term Tax-Exempt Fund, and California Short-Intermediate Term Tax-Exempt Income Fund (formerly, California Tax-Exempt Income Fund) (three of the portfolios constituting the Excelsior Funds, Inc., one of the portfolios constituting the Excelsior Funds Trust, and five of the portfolios constituting the Excelsior Tax-Exempt Funds, Inc.) (collectively, the “Funds”) as of March 31, 2006, and the related statements of operations for the year then ended, the statements of changes in net assets for each of the two years in the period then ended, and the financial highlights (Shares) for each of the three years in the period then ended. These financial statements and financial highlights are the responsibility of the Funds’ management. Our responsibility is to express an opinion on these financial statements and financial highlights based on our audits. The financial highlights for each of the years in the two year period ended March 31, 2003 were audited by other auditors whose reports dated May 16, 2003, expressed an unqualified opinion on those financial highlights.
We conducted our audits in accordance with the standards of the Public Company Accounting Oversight Board (United States). Those standards require that we plan and perform the audit to obtain reasonable assurance about whether the financial statements and financial highlights are free of material misstatement. The funds are not required to have, nor were we engaged to perform, an audit of their internal control over financial reporting. Our audits included consideration of internal control over financial reporting as a basis for designing audit procedures that are appropriate in the circumstances, but not for the purpose of expressing an opinion on the effectiveness of the Funds’ internal control over financial reporting. Accordingly, we express no such opinion. An audit also includes examining, on a test basis, evidence supporting the amounts and disclosures in the financial statements, assessing the accounting principles used and significant estimates made by management, as well as evaluating the overall financial statement presentation. Our procedures included confirmation of securities owned as of March 31, 2006, by correspondence with the custodian and brokers; where replies were not received from brokers, we performed other auditing procedures. We believe that our audits provide a reasonable basis for our opinion.
In our opinion, the financial statements and financial highlights referred to above present fairly, in all material respects, the financial position of Core Bond Fund, Intermediate-Term Bond Fund, Short-Term Government Securities Fund, High Yield Fund, Long-Term Tax-Exempt Fund, Intermediate-Term Tax-Exempt Fund, Short-Term Tax-Exempt Securities Fund, New York Intermediate-Term Tax-Exempt Fund, and California Short-Intermediate Tax-Exempt Income Fund as of March 31, 2006, the results of their operations for the year then ended, the changes in their net assets for each of the two years in the period then ended, and the financial highlights for each of the three years in the period then ended, in conformity with accounting principles generally accepted in the United States of America.
DELOITTE & TOUCHE LLP
New York, New York
May 22, 2006
79
Directors/Trustees and Officers of the Excelsior Funds Complex (Unaudited)
Information pertaining to the Directors/Trustees and Officers of Excelsior Fund, Excelsior Tax-Exempt Fund and Excelsior Funds Trust (each a “Company” and collectively, the “Excelsior Funds Complex”) is set forth below. Directors/Trustees who are not deemed to be “interested persons” of the Excelsior Funds Complex as defined in the 1940 Act are referred to as “Independent Board Members.” Directors/Trustees who are deemed to be “interested persons” of the Excelsior Funds Complex are referred to as “Interested Board Members”. The following information is as of May 20, 2006.
On February 24, 2006, the Boards of Directors/Trustees (the “Boards”) of the Companies approved an increase in the size of the Boards to ten (10) directors/trustees (together, the “Directors”) and approved the nomination of Mariann Byerwalter, Nils Hakansson, William A. Hasler and Randall W. Merk (the “Candidates”) as Directors of the Companies, subject to shareholder approval at an upcoming Special Meeting of Shareholders of the Companies (the “Meeting”). Each of the Candidates is currently a director/trustee of the Laudus Funds, the Laudus Variable Insurance Trust (together, the “Laudus Funds”) and of other funds included in the Schwab mutual fund complex for which Charles Schwab Investment Management acts as investment adviser (together, the “Fund Complex”). The Companies are in the same Fund Complex as the Laudus Funds. If approved by Shareholders at the Meeting, Ms. Byerwalter and Messrs. Hakansson and Hasler would become disinterested persons of the Companies under the Investment Company Act of 1940, as amended. Mr. Merk would become an interested person of the Companies.
The Boards also approved the nominations of six existing Directors to be submitted to shareholders for approval at the Meeting: Messrs. Bailey, Collins, Drake, Hall, Lynch and Piel (the “Existing Directors” and, together with the Candidates, the “Nominees”). Frederick S. Wonham, a current Director of the Companies and Chairman of the Board of each Company, has notified the Boards that he intends to resign from the Boards, consistent with the Companies’ retirement age policy, effective as of the date of the Meeting. The Boards have elected Rodman Drake, currently a Director of the Companies and Chairman of their Joint Audit Committee, as the Chairman of the Boards of the Companies effective upon Mr. Wonham’s resignation.
The Boards have proposed to increase the size of each Board from seven to ten so that a single group of Directors (i.e., a unitary board) can oversee each of the Companies and the Laudus Funds. At a meeting held on March 16, 2006, the Laudus Funds’ Boards approved the nominations of the Existing Directors for election to the Laudus Funds’ Boards, subject to approval by shareholders of each of the Laudus Funds. Each of the Candidates has notified the Boards that, even if approved by the Companies’ shareholders at the Meeting, the Candidates will not serve as members of the Boards unless the shareholders of each of the Companies and the Laudus Funds approve the election of each of the other Nominees. Similarly, each of the existing Directors has informed the Laudus Funds Boards that, even if approved by shareholders of the Laudus Funds at their shareholders meeting, the Existing Directors will not serve as members of the Laudus Funds Boards unless the shareholders of each of the Companies and the Laudus Funds approve the election of each of the other Nominees.
80
| | | | | | |
Name and Address(1) Age Time Served with the Excelsior Funds Complex
| | Principal Occupation
During the Past Five Years
| | Number of
Portfolios in Fund Complex Overseen by Director/Trustee(3)
| | Other Directorships Held by Director/Trustee(4)
|
DIRECTORS/TRUSTEES(2) INDEPENDENT BOARD MEMBERS | | | | |
Frederick S. Wonham
Age: 75
Since 1997 | | Retired. Chairman of the Boards and Director (since 1997) and President and Treasurer (from 1995 to February 2002) of Excelsior Funds, Inc. and Excelsior Tax-Exempt Funds, Inc.; Chairman of the Board and Trustee (since 1997) and President and Treasurer (from 1995 to February 2002) of Excelsior Funds Trust. | | 29 | | None. |
| | | |
Rodman L. Drake
Age: 63
Since 1994 | | Director and Chairman of Audit Committee of Excelsior Funds, Inc. and Excelsior Tax-Exempt Funds, Inc. (since 1996); Trustee of Excelsior Funds Trust (since 1994); Co-Founder of Baringo Capital LLC (since 2002); President, Continuation Investments Group, Inc. (from 1997 to 2001). | | 29 | | Director and Chairman, Hyperion Total Return Fund, Inc., and Hyperion Strategic Mortgage Fund Inc. (since 1991); Director, Jackson Hewitt Tax Services, Inc. (since June 2004); Director, Student Loan Corporation (since May 2005). |
| | | |
Morrill Melton ("Mel") Hall, Jr.
Age: 61
Since 2000 | | Director of Excelsior Funds, Inc. and Excelsior Tax-Exempt Funds, Inc. (since 2000); Trustee of Excelsior Funds Trust (since 2000); Chairman (since 1984) and Chief Executive Officer (since 1991), Comprehensive Health Services, Inc. (health care management and administration). | | 29 | | None. |
| | | |
Roger M. Lynch
Age: 64
Since 2001 | | Retired. Director of Excelsior Funds, Inc. and Excelsior Tax- Exempt Funds, Inc. and Trustee of Excelsior Funds Trust (since 2001); President, Corporate Asset Funding Co., Inc. (asset securitization) (from 1987 to 1999); Limited Partner (from 1986 to 1999), Goldman Sachs & Co. | | 29 | | None. |
| | | |
Jonathan Piel
Age: 67
Since 1994 | | Director and Chairman of Nominating Committee, Excelsior Funds, Inc. and Excelsior Tax-Exempt Funds, Inc. (since 1996); Trustee, Excelsior Funds Trust (since 1994); Cable Television producer and website designer. The Editor Scientific American (from 1984 to 1986), and Vice President, Scientific American, Inc. (from 1986 to 1994); Director, National Institute of Social Sciences; member, Advisory Board. The Stone Age Institute, Bloomington Indiana. | | 29 | | None. |
81
| | | | | | |
Name and Address(1) Age Time Served with the Excelsior Funds Complex
| | Principal Occupation
During the Past Five Years
| | Number of
Portfolios in Fund Complex Overseen by Director/Trustee(3)
| | Other Directorships Held by Director/Trustee(4)
|
John. D. Collins
Age: 67
Since 2005 | | Retired. Director, Excelsior Funds, Inc. and Excelsior Tax-Exempt Funds, Inc. (since 2005); Trustee, Excelsior Funds Trust (since 2005). Consultant, KPMG, LLP (from July 1999 to June 2000); Partner, KPMG, LLP (from March 1962 to June 1999). | | 29 | | Director, Mrs. Fields’ Famous Brands LLC (consumer products) (since December 2004). |
| INTERESTED BOARD MEMBER(5) | | | | |
James L. Bailey
114 West 47th Street
New York, NY 10036
Age: 60
Since 2004 | | Chief Operating Officer of U.S. Trust Corporation (since December 2004) and Executive Vice President of U.S. Trust Corporation and United States Trust Company of New York (since 2003); President, Excelsior Funds, Inc., Excelsior Tax-Exempt Funds, Inc. and Excelsior Funds Trust (from 2003 to July 2004); Consultant in the financial services industry (from August 2000 to January 2003); Executive Vice President of Citicorp (from 1992 to August 2000). | | 29 | | None. |
| OFFICERS | | | | | | |
Joseph Trainor, CFA
Age: 44
114 West 47th Street
New York, NY 10036 | | Managing Director of United States Trust Company of New York (since 2003) and President, U.S. Trust Institutional; President of MFS Institutional Advisors (from 1998 to 2002). | | N/A | | N/A |
| | | |
George Pereira
Age: 42
101 Montgomery St.
San Francisco, CA 94104 | | Senior Vice President and Chief Financial Officer, Charles Schwab Investment Management, Inc.; Director, Charles Schwab Asset Management (Ireland) Limited. From December 1999 to November 2004, Sr. Vice President, Financial Reporting. Charles Schwab & Co., Inc. From September 1999 to December 1999, Chief Financial Officer, Commerzbank Capital Markets. Prior to September 1999, Managing Director at the New York Stock Exchange. | | N/A | | N/A |
| | | |
Stefanie A. Firtell
Age: 32
114 West 47th Street
New York, NY 10036 | | Vice President, United States Trust Company of New York (since April 2005); Compliance Officer and Head of Regulatory Responses, Assistant Vice President, Deutsche Asset Management (from 2003 to 2005); Assistant Corporate Secretary, Triare Companies, Inc. (from 2002 to 2003); Attorney, Paul, Weiss, Rifkind, Wharton & Garrison (from 2001 to 2002); and Attorney, Cadwalder Wickersham & Taft (from 2000 to 2001). | | N/A | | N/A |
82
| | | | | | |
Name and Address(1) Age Time Served with the Excelsior Funds Complex
| | Principal Occupation
During the Past Five Years
| | Number of
Portfolios in Fund Complex Overseen by Director/Trustee(3)
| | Other Directorships Held by Director/Trustee(4)
|
Wyndham Clark
Age: 47
225 High Ridge Road
Stamford, CT 06905 | | Vice President and AML Officer, U.S. Trust Company, N.A. (since 2003); Vice President and Deputy Director Risk Management. IBJ Whitehall (banking) (from 2001 to 2002); and Vice President and Chief Risk Officer, EMAC, LLC (commercial lender, asset backed security issuer) (from 1999 to 2001). | | N/A | | N/A |
| | | |
Petros (Peter) L. Tsirigotis
Age: 37
114 West 47th Street
New York, NY 10036 | | Senior Vice President and Assistant General Counsel, U.S. Trust (since September 2005); Vice President and Corporate Counsel, Prudential Financial (September 2004 to September 2005); Associate, Schulte Roth and Zabel LLP (November 2002 to September 2004) and Dechert LLP (August 2000 to November 2002). Prior to August 2000, Mr. Tsirigotis was an Attorney/Advisor (Division of Investment Management) and Financial Economist (Office of Economic Analysis) with the Securities and Exchange Commission in Washington, D.C. | | N/A | | N/A |
| (1) | Each independent director/trustee may be contacted by writing to Excelsior Funds, 225 High Ridge Road, Stamford, CT 06905. |
| (2) | Each director/trustee shall hold office until the election and qualification of his or her successor, or until he or she sooner dies, resigns or is removed. The officers of each Company shall hold office for a one year term and until their respective successors are chosen and qualified, or in each case until he or she sooner dies, resigns, is removed, or becomes disqualified in accordance with each Company’s by-laws. |
| (3) | The Excelsior Funds Complex consists of all registered investment companies (Excelsior Funds Inc., Excelsior Tax-Exempt Funds, Inc. and Excelsior Funds Trust) for which U.S. Trust serves as investment adviser. As of May 20, 2006, the Excelsior Funds Complex consisted of 29 Funds. |
| (4) | Directorships of companies required to report to the Securities and Exchange Commission under the Securities Exchange Act of 1934 (i.e., “public companies”) or other investment companies registered under the 1940 Act. |
| (5) | “Interested person” of the Company is defined in the 1940 Act. Mr. Bailey is considered an “interested person” because of his affiliation with the Adviser. |
For more information regarding the Directors/Trustees and Officers, please refer to the Statement of Additional Information, which is available upon request by calling 1-800-446-1012.
83
DISCLOSURE OF FUND EXPENSES (Unaudited)
We believe it is important for you to understand the impact of fees regarding your investment. As a shareholder of the fund, you incur ongoing, or operating costs, which include costs for portfolio management, administrative services, and shareholder reports (like this one), among others. Operating expenses, which are deducted from a fund’s gross income, directly reduce the investment return of the fund. A fund’s expenses are expressed as a percentage of its average net assets. This figure is known as the expense ratio. The following examples are intended to help you understand the ongoing costs (in dollars) of investing in your fund and to compare these costs with those of other mutual funds. The examples are based on an investment of $1,000 made at the beginning of the period shown and held for the entire period.
The table on the following page illustrates your fund’s costs in two ways.
| | • | | Actual expenses. This section provides information about actual account values and actual expenses based on the Funds’ actual return for the period. This section is designed to help you to estimate the actual expenses after fee waivers that you paid over the period. The “Ending Account Value” shown is derived from the fund’s actual return, and the fourth column shows the dollar amount that would have been paid by an investor who started with $1,000 in the fund. You may use the information here, together with the amount you invested, to estimate the expenses that you paid over the period. |
To do so, simply divide your account value by $1,000 (for example, an $8,600 account value divided by $1,000 = $8.6), then multiply the result by the number given for your fund under the heading “Expenses Paid During Period”.
| | • | | Hypothetical expenses. This section provides information about hypothetical account values and hypothetical expenses that would have been incurred by an investor in the Fund based on an assumed rate of return of 5% per year before expenses. This section is designed to help you compare your fund’s costs with those of other mutual funds. It assumes that the fund had a return of 5% before expenses during the year, but that the expense ratio is unchanged. In this case, because the return used is not the fund’s actual return, the results cannot be used to estimate the actual ending account balance or expenses you paid for the period. You may use this information to compare the ongoing costs of investing in your Fund and other funds. To do so, compare this 5% hypothetical example with the 5% hypothetical examples that appear in shareholder reports of other funds. |
84
DISCLOSURE OF FUND EXPENSES (Unaudited) (Continued)
Please note that the expenses shown in the table are meant to highlight and help you compare ongoing costs only, which are described in the Prospectus. Therefore, the hypothetical example is useful in comparing ongoing costs only, and will not help you determine the relative total costs of owning different funds.
| | | | | | | | | | | | |
| | | Beginning
Account
Value
10/01/2005
| | Ending
Account
Value
03/31/2006
| | Annualized
Expense
Ratios*
| | | Expenses
Paid
During
Period**
|
Actual Fund Return | | | | | | | | | | | | |
California Short-Intermediate Term Tax-Exempt Income Fund — Shares | | $ | 1,000.00 | | $ | 1,001.70 | | 0.50 | % | | $ | 2.50 |
Core Bond Fund — Shares | | | 1,000.00 | | | 998.40 | | 0.90 | | | | 4.48 |
High Yield Fund — Shares | | | 1,000.00 | | | 1,030.00 | | 1.05 | | | | 5.31 |
Intermediate-Term Bond Fund — Shares | | | 1,000.00 | | | 1,001.20 | | 0.75 | | | | 3.74 |
Intermediate-Term Tax-Exempt Fund — Shares | | | 1,000.00 | | | 1,002.40 | | 0.65 | | | | 3.24 |
Long-Term Tax-Exempt Fund — Shares | | | 1,000.00 | | | 1,006.90 | | 0.80 | | | | 4.00 |
New York Intermediate-Term Tax-Exempt Fund — Shares | | | 1,000.00 | | | 1,005.10 | | 0.80 | | | | 4.00 |
Short-Term Government Securities Fund — Shares | | | 1,000.00 | | | 1,010.60 | | 0.68 | | | | 3.41 |
Short-Term Tax-Exempt Securities Fund — Shares | | | 1,000.00 | | | 1,004.50 | | 0.60 | | | | 3.00 |
| | | | |
Hypothetical 5% Return | | | | | | | | | | | | |
California Short-Intermediate Term Tax-Exempt Income Fund — Shares | | | 1,000.00 | | | 1,022.44 | | 0.50 | | | | 2.52 |
Core Bond Fund — Shares | | | 1,000.00 | | | 1,020.44 | | 0.90 | | | | 4.53 |
High Yield Fund — Shares | | | 1,000.00 | | | 1,019.70 | | 1.05 | | | | 5.29 |
Intermediate-Term Bond Fund — Shares | | | 1,000.00 | | | 1,021.19 | | 0.75 | | | | 3.78 |
Intermediate-Term Tax-Exempt Fund — Shares | | | 1,000.00 | | | 1,021.69 | | 0.65 | | | | 3.28 |
Long-Term Tax-Exempt Fund — Shares | | | 1,000.00 | | | 1,020.94 | | 0.80 | | | | 4.03 |
New York Intermediate-Term Tax-Exempt Fund — Shares | | | 1,000.00 | | | 1,020.94 | | 0.80 | | | | 4.03 |
Short-Term Government Securities Fund — Shares | | | 1,000.00 | | | 1,021.54 | | 0.68 | | | | 3.43 |
Short-Term Tax-Exempt Securities Fund — Shares | | | 1,000.00 | | | 1,021.94 | | 0.60 | | | | 3.02 |
| * | Annualized expense ratios of certain funds are after fee waivers and expense reimbursements by the investment adviser. Absent such waivers and reimbursements, expenses paid during the period would have been greater. |
| ** | Expenses are equal to the Fund’s annualized expense ratio multiplied by the average account value over the period, multiplied by the number of days in the most recent fiscal half-year (182) then divided by 365. |
85
AR-FIXEDINC-0306

MONEY MARKET
FUNDS
ANNUAL REPORT
March 31, 2006
TABLE OF CONTENTS
For shareholder account information, current price and yield quotations, or to make an initial purchase or obtain a prospectus, call 1-800-446-1012, from overseas, call 617-483-7297.
| · | | Internet Address: http://www.excelsiorfunds.com |
This report must be preceded or accompanied by a current prospectus.
A description of the policies and procedures that Excelsior Funds use to determine how to vote proxies relating to portfolio securities, as well as information relating to how a Fund voted proxies relating to portfolio securities during the most recent 12-month period ended June 30, is available (i) without charge, upon request, by calling 1-800-446-1012, or (ii) by accessing the Excelsior Funds’ internet address and (iii) on the Commission’s website at http://www.sec.gov.
Excelsior Funds file their June 30 and December 31 schedule of portfolio holdings with the Securities and Exchange Commission, on Form N-Q, within sixty days after the applicable reporting period. Excelsior Funds Form N-Q is available on the Commission’s website at http://www.sec.gov, and may be reviewed and copied at the Commission’s Public Reference Room in Washington, DC. Information on the operation of the Public Reference Room may be obtained by calling 1-800-SEC-0330.
A schedule of each Fund’s portfolio holdings, as of the end of the prior month, is also available on the Funds’ website. This schedule is updated monthly, typically by the 15th calendar day, after the end of each month. The Funds may terminate or modify this policy at anytime.
You should consider the Funds’ investment objectives, risks and expenses carefully before you invest. Information about these and other important subjects is in the Funds’ prospectus, which you should read carefully before investing.
Excelsior Funds, Inc. and Excelsior Tax-Exempt Funds, Inc. are distributed by BISYS Fund Services Limited Partnership.
You may write to Excelsior Funds, Inc. and Excelsior Tax-Exempt Funds, Inc. at the following address:
Excelsior Funds
P.O. Box 8529
Boston, MA 02266-8529
SHARES IN THE FUNDS ARE NOT DEPOSITS OR OBLIGATIONS OF, OR GUARANTEED OR ENDORSED BY, UNITED STATES TRUST COMPANY OF NEW YORK, U.S. TRUST COMPANY, N.A., THEIR PARENT AND AFFILIATES AND SHARES ARE NOT INSURED BY THE FEDERAL DEPOSIT INSURANCE CORPORATION, THE FEDERAL RESERVE BOARD, OR ANY OTHER AGENCY. FUND SHARES ARE NOT INSURED OR GUARANTEED BY THE U.S. GOVERNMENT. ALTHOUGH THE FUNDS SEEK TO PRESERVE THE VALUE OF YOUR INVESTMENT AT $1.00 PER SHARE, IT IS POSSIBLE TO LOSE MONEY BY INVESTING IN THE FUNDS.
LETTER TO SHAREHOLDERS
March 31, 2006
Dear Valued Excelsior Fund Shareholder,
I am pleased to bring you the annual report for the year ended March 31, 2006 for the Excelsior Funds. The funds in this report are part of the Excelsior Fund family which had over $18 billion in assets as of the end of the report period and includes a wide array of asset classes and investment strategies designed to meet the individual investor’s needs for performance and tax sensitivity.
By now, you would have received information about changes to the administrative and non-advisory services provided to the Excelsior Funds. As a result, the Excelsior Funds and the Laudus Funds, an affiliated fund family, now share certain complex-wide administrative, compliance, marketing and other functions.
We are pleased with the transition, and remain optimistic that shareholders will approve the board of directors’ recommendation to elect members to jointly oversee the two fund families. It is anticipated that the new unified board will strengthen the oversight provided on behalf of fund shareholders and may result in certain long-term cost and operating efficiencies. All votes are important, so I encourage you to vote your shares as soon as possible if you haven’t already done so.
Given these changes, I want to assure you that the most important aspects of the Excelsior Funds will remain the same. Specifically, the fund management and investment process provided by U.S. Trust, as advisor to the Funds, as well as the funds’ emphasis on enduring performance, will not change.
In closing, we at Excelsior Funds remain committed to helping you reach your long-term investment goals. Thank you for investing with us.
Sincerely,

Evelyn Dilsaver
President
1
Excelsior Funds, Inc.
Portfolio of Investments — March 31, 2006
Government Money Fund
| | | | | |
Principal Amount
| | Security
Description
| | Value
|
| | | | | | |
| U.S. GOVERNMENT & AGENCY OBLIGATIONS — 96.48% |
| $ 96,400,000 | | Federal Home Loan Bank, Discount Note, 2.13%, 04/03/06 | | $ | 96,375,254 |
| 50,000,000 | | Federal Home Loan Bank, Discount Note, 4.52%, 04/05/06 | | | 49,974,889 |
| 150,000,000 | | Federal Home Loan Bank, Discount Note, 4.67%, 04/26/06 | | | 149,513,541 |
| 100,000,000 | | Tennessee Valley Authority, Discount Note, 4.67%, 04/06/06 | | | 99,935,139 |
| | | | |
|
|
| | | TOTAL U.S. GOVERNMENT & AGENCY OBLIGATIONS
(Cost $395,798,823) | | | 395,798,823 |
| | | | |
|
|
Shares
| | | | |
| REGISTERED INVESTMENT COMPANY — 0.30% |
| 1,224,917 | | Dreyfus Treasury Prime Cash Management Fund | | | 1,224,917 |
| | | | |
|
|
| | | TOTAL REGISTERED INVESTMENT COMPANY
(Cost $1,224,917) | | | 1,224,917 |
| | | | |
|
|
| | | | | |
Principal Amount
| | Security
Description
| | Value
|
| | | | | | |
| REPURCHASE AGREEMENT — 3.66% |
| $ 15,000,000 | | Morgan Stanley, 4.80%, dated 03/31/06, due 04/03/06, to be repurchased at $15,006,000 (collateralized by U.S. Government obligations, ranging in par value $725,000-$9,685,000, 0.00%-5.15%, 07/24/06-03/08/12; total market value $15,335,814) | | $ | 15,000,000 |
| | | | |
|
|
| | | TOTAL REPURCHASE AGREEMENT
(Cost $15,000,000) | | | 15,000,000 |
| | | | |
|
|
| | | | | | | |
TOTAL INVESTMENTS
(Cost $412,023,740) | | 100.44 | % | | $ | 412,023,740 | |
LIABILITIES IN EXCESS OF OTHER ASSETS | | (0.44 | ) | | | (1,795,785 | ) |
| | |
|
| |
|
|
|
NET ASSETS | | 100.00 | % | | $ | 410,227,955 | |
| | |
|
| |
|
|
|
Discount Note—The rate reported is the discount rate at the time of purchase.
The summary of the Fund’s investments as of March 31, 2006 is as follows: (Unaudited)
| | | | | | | |
Portfolio Diversification
| | % of
Net
Assets
| | | Value
| |
U.S. Government & Agency Obligations | | 96.48 | % | | $ | 395,798,823 | |
Repurchase Agreement | | 3.66 | | | | 15,000,000 | |
Registered Investment Company | | 0.30 | | | | 1,224,917 | |
| | |
|
| |
|
|
|
Total Investments | | 100.44 | % | | $ | 412,023,740 | |
Liabilities in Excess of Other Assets | | (0.44 | ) | | | (1,795,785 | ) |
| | |
|
| |
|
|
|
Net Assets | | 100.00 | % | | $ | 410,227,955 | |
| | |
|
| |
|
|
|
See Notes to Financial Statements.
2
Excelsior Funds, Inc.
Portfolio of Investments — March 31, 2006
Money Fund
| | | | | |
Principal Amount
| | Security
Description
| | Value
|
| | | | | | |
| CERTIFICATES OF DEPOSIT — 12.86% |
| $75,000,000 | | First Tennessee Bank, 4.78%, 04/28/06 | | $ | 75,000,000 |
| 75,000,000 | | Washington Mutual Corp., 4.80%, 05/11/06 | | | 75,000,000 |
| 50,000,000 | | Wells Fargo Co., 4.76%, 04/10/06 | | | 50,000,000 |
| | | | |
|
|
| | | TOTAL CERTIFICATES OF DEPOSIT
(Cost $200,000,000) | | | 200,000,000 |
| | | | |
|
|
| COMMERCIAL PAPER — 84.78% |
| 75,000,000 | | American Express Credit Corp., Discount Note, 4.54%, 04/03/06 | | | 74,981,082 |
| 50,000,000 | | Bank of America Corp., Discount Note,
4.53%, 04/03/06 | | | 49,987,417 |
| 75,000,000 | | CIT Group, Inc., Discount Note,
4.55%, 04/03/06 | | | 74,981,042 |
| 75,000,000 | | Citigroup Funding, Inc., Discount Note,
4.54%, 04/03/06 | | | 74,981,082 |
| 50,000,000 | | Dexia Delaware, Discount Note,
4.54%, 04/03/06 | | | 49,987,389 |
| 70,000,000 | | Gannett Co., Discount Note,
4.54%, 04/04/06(a) | | | 69,973,517 |
| 70,000,000 | | General Electric Capital Corp., Discount Note,
4.53%, 04/03/06 | | | 69,982,383 |
| 75,000,000 | | Goldman Sachs Group, Inc., Discount Note,
4.77%, 04/05/06 | | | 74,960,250 |
| 75,000,000 | | HSBC, Discount Note,
4.55%, 04/03/06 | | | 74,981,042 |
| 50,000,000 | | International Lease Finance Corp., Discount Note,
4.53%, 04/04/06 | | | 49,981,125 |
| 75,000,000 | | Merrill Lynch & Co., Inc., Discount Note,
4.68%, 04/03/06 | | | 74,980,500 |
| 50,000,000 | | Preferred Receivables Funding Corp., Discount Note,
4.75%, 04/03/06(a) | | | 49,986,806 |
| | | | | |
Principal Amount
| | Security
Description
| | Value
|
| | | | | | |
| COMMERCIAL PAPER — (continued) |
| $75,000,000 | | Prudential Funding Corp., Discount Note,
4.55%, 04/03/06 | | $ | 74,981,042 |
| 73,925,000 | | Ranger Funding Co. llc, Discount Note,
4.56%, 04/03/06(a) | | | 73,906,272 |
| 50,000,000 | | Royal Bank of Scotland plc, Discount Note, 4.55%, 04/03/06 | | | 49,987,361 |
| 75,000,000 | | Societe Generale, Discount Note,
4.55%, 04/03/06 | | | 74,981,021 |
| 75,000,000 | | Three Pillars Funding, Discount Note,
4.58%, 04/03/06(a) | | | 74,980,917 |
| 70,000,000 | | UBS Finance Corp., Discount
Note, 4.55%, 04/03/06 | | | 69,982,325 |
| 60,000,000 | | Windmill Funding Corp., Discount Note,
4.55%, 04/03/06(a) | | | 59,984,833 |
| 50,000,000 | | Yorktown Capital, Discount Note,
4.61%, 04/05/06(a) | | | 49,974,389 |
| | | | |
|
|
| | | TOTAL COMMERCIAL PAPER
(Cost $1,318,541,795) | | | 1,318,541,795 |
| | | | |
|
|
Shares
| | | | |
| REGISTERED INVESTMENT COMPANY — 0.08% |
| 1,178,553 | | Dreyfus Government Cash Management Fund | | | 1,178,553 |
| | | | |
|
|
| | | TOTAL REGISTERED INVESTMENT COMPANY
(Cost $1,178,553) | | | 1,178,553 |
| | | | |
|
|
See Notes to Financial Statements.
3
Excelsior Funds, Inc.
Portfolio of Investments — March 31, 2006
Money Fund — (continued)
| | | | | |
Principal Amount
| | Security
Description
| | Value
|
| | | | | | |
| REPURCHASE AGREEMENT — 2.64% | | |
| $41,000,000 | | Morgan Stanley, 4.80%, dated 03/31/06, due 04/03/06, to be repurchased at $41,016,400 (collateralized by U.S. Government obligations ranging in par value $15,000-$20,000,000, 2.75%-4.725%, 06/30/06-03/30/07; total market value $41,832,384) | | $ | 41,000,000 |
| | | | |
|
|
| | | TOTAL REPURCHASE AGREEMENT
(Cost $41,000,000) | | | 41,000,000 |
| | | | |
|
|
| | | | | | | |
TOTAL INVESTMENTS
(Cost $1,560,720,348) | | 100.36 | % | | $ | 1,560,720,348 | |
LIABILITIES IN EXCESS OF OTHER ASSETS | | (0.36 | ) | | | (5,584,676 | ) |
| | |
|
| |
|
|
|
NET ASSETS | | 100.00 | % | | $ | 1,555,135,672 | |
| | |
|
| |
|
|
|
| (a) | Security exempt from registration under Rule 144A of the Securities Act of 1933. This security may be resold in transactions exempt from registration, normally to qualified institutional buyers. At March 31, 2006, these securities amounted to $378,806,734 or 24.36% of net assets. |
Discount Note—The rate reported is the discount rate at the time of purchase.
llc—Limited Liability Company
plc—Public Limited Company
The summary of the Fund’s investments as of March 31, 2006 is as follows: (Unaudited)
| | | | | | | |
Portfolio Diversification
| | % of
Net
Assets
| | | Value
| |
Commercial Paper | | 84.78 | % | | $ | 1,318,541,795 | |
Certificates of Deposit | | 12.86 | | | | 200,000,000 | |
Repurchase Agreement | | 2.64 | | | | 41,000,000 | |
Registered Investment Company | | 0.08 | | | | 1,178,553 | |
| | |
|
| |
|
|
|
Total Investments | | 100.36 | % | | $ | 1,560,720,348 | |
Liabilities in Excess of Other Assets | | (0.36 | ) | | | (5,584,676 | ) |
| | |
|
| |
|
|
|
Net Assets | | 100.00 | % | | $ | 1,555,135,672 | |
| | |
|
| |
|
|
|
See Notes to Financial Statements.
4
Excelsior Tax-Exempt Funds, Inc.
Portfolio of Investments — March 31, 2006
New York Tax-Exempt Money Fund
| | | | | |
Principal Amount
| | Security Description
| | Value
|
| | | | | | |
| TAX-EXEMPT CASH EQUIVALENT SECURITIES — 67.31% |
| $9,500,000 | | Carmel, New York, Central School District General Obligation Bonds, Bond Anticipation Notes,
4.50%, 07/21/06 | | $ | 9,535,565 |
| 2,500,000 | | Corning, New York, City School District General Obligation Bonds, Bond Anticipation Notes, 3.75%, 07/12/06 | | | 2,501,083 |
| 15,710,000 | | Erie County, New York, Industrial Development Agency Revenue Bonds, School Facilities, TOCS, Series J, (FSA),
3.20%, 05/01/12(a)(b) | | | 15,710,000 |
| 5,800,000 | | Long Island Power Authority, New York, Electric Systems Revenue Bonds, Series 7B, (MBIA),
3.14%, 04/01/25(a) | | | 5,800,000 |
| 9,955,000 | | New York City, New York, Municipal Water Finance Authority Revenue Bonds, PUTTER, Series 622, (AMBAC),
3.21%, 06/15/12(a)(b) | | | 9,955,000 |
| 8,995,000 | | New York City, New York, Municipal Water Finance Authority Revenue Bonds, Water & Sewer Systems Floating Rate Trust Certificates, Series 726X, (MBIA),
3.19%, 06/15/27(a)(b) | | | 8,995,000 |
| 2,700,000 | | New York City, New York, Municipal Water Finance Authority, Water & Sewer Systems Revenue Bonds,
Series F-1,
3.18%, 06/15/33(a) | | | 2,700,000 |
| 10,870,000 | | New York City, New York, Transitional Finance Authority Revenue Bonds,
EAGLE, Class A,
3.20%, 02/01/31(a)(b) | | | 10,870,000 |
| | | | | |
Principal Amount
| | Security Description
| | Value
|
| | | | | | |
TAX-EXEMPT CASH EQUIVALENT
SECURITIES — (continued) |
| $9,000,000 | | New York City, New York, Transitional Finance Authority Revenue Bonds, Floating Rate Certificates, Series 283,
3.19%, 11/15/18(a)(b) | | $ | 9,000,000 |
| 10,000,000 | | New York City, New York, Transitional Finance Authority Revenue Bonds, Floating Rate Certificates, Series 536, (MBIA),
3.19%, 05/01/15(a)(b) | | | 10,000,000 |
| 4,995,000 | | New York City, New York, Transitional Finance Authority Revenue Bonds, PUTTER, Series 307, (AMBAC),
3.21%, 08/01/19(a)(b) | | | 4,995,000 |
| 5,485,000 | | New York City, New York, Transitional Finance Authority Revenue Bonds, PUTTER, Series 471, (FGIC),
3.21%, 02/01/11(a)(b) | | | 5,485,000 |
| 8,000,000 | | New York State, Dormitory Authority Commercial Paper,
3.30%, 05/10/06 | | | 8,000,000 |
| 9,830,000 | | New York State, Dormitory Authority Commercial Paper, Columbia University,
3.14%, 04/11/06 | | | 9,830,000 |
| 10,420,000 | | New York State, Dormitory Authority Commercial Paper, Cornell University,
3.16%, 04/10/06 | | | 10,420,000 |
| 8,295,000 | | New York State, Housing
Finance Agency Revenue
Bonds, 10 Barclay Street,
Series A, (Fannie Mae),
3.16%, 11/15/37(a) | | | 8,295,000 |
| 2,300,000 | | New York State, Housing Finance Agency, State Personal Income Tax Revenue Bonds, Series C, (FGIC),
3.16%, 03/15/33(a) | | | 2,300,000 |
See Notes to Financial Statements.
5
Excelsior Tax-Exempt Funds, Inc.
Portfolio of Investments — March 31, 2006
New York Tax-Exempt Money Fund — (continued)
| | | | | |
Principal Amount
| | Security Description
| | Value
|
| | | | | | |
TAX-EXEMPT CASH EQUIVALENT
SECURITIES — (continued) |
| $ 4,740,000 | | New York State, Mortgage Agency Revenue Bonds, Floating Rate Certificates, Series 1199,
3.19%, 10/01/27(a)(b) | | $ | 4,740,000 |
| 10,000,000 | | New York State, Munitops Certificates Trust, Revenue Bonds, (FSA),
3.20%, 12/15/12(a)(b) | | | 10,000,000 |
| 15,000,000 | | New York State, Munitops Certificates Trust, Revenue Bonds, (FSA),
3.20%, 08/01/13(a)(b) | | | 15,000,000 |
| 9,000,000 | | New York State, Power Authority Commercial Paper,
3.23%, 05/04/06 | | | 9,000,000 |
| 9,250,000 | | New York State, Power Authority General Obligation Bonds,
3.35%, 03/01/16(a) | | | 9,250,000 |
| 8,265,000 | | New York State, Sales Tax Asset Receivable Corporation Revenue Bonds, PUTTER, Series 564, (MBIA),
3.21%, 10/15/12(a)(b) | | | 8,265,000 |
| 23,225,000 | | New York State, Thruway Authority Revenue Bonds, EAGLE, Class A, (AMBAC),
3.20%, 01/01/30(a)(b) | | | 23,224,999 |
| 3,100,000 | | New York State, Thruway Authority Revenue Bonds, Highway & Bridge Trust Fund, PUTTER, Series 1047, (AMBAC),
3.21%, 04/01/13(a)(b) | | | 3,100,000 |
| 6,100,000 | | New York State, Thruway Authority Revenue Bonds, Highway & Bridge Trust Fund, TOCS, Series JJ, (FGIC),
3.20%, 10/10/13(a)(b) | | | 6,100,000 |
| 16,000,000 | | New York State, Triborough Bridge & Tunnel Authority Revenue Bonds, EAGLE, Class A, (MBIA),
3.20%, 01/01/32(a)(b) | | | 16,000,000 |
| | | | | |
Principal Amount
| | Security Description
| | Value
|
| | | | | | |
TAX-EXEMPT CASH EQUIVALENT
SECURITIES — (continued) |
| $ 2,760,000 | | New York State, Triborough Bridge & Tunnel Authority Revenue Bonds, Series B,
3.17%, 01/01/33(a) | | $ | 2,760,000 |
| 10,000,000 | | Newburgh, New York, City School District General Obligation Bonds, Bond Anticipation Notes,
4.00%, 09/28/06 | | | 10,036,711 |
| 5,000,000 | | Niagara Falls, New York, Bridge Commission Toll Authority Revenue Bonds, Series A, (FGIC),
3.13%, 10/01/19(a) | | | 5,000,000 |
| 10,000,000 | | Suffolk County, New York, General Obligation Bonds, Tax Anticipation Notes,
4.00%, 08/16/06 | | | 10,029,908 |
| 12,600,000 | | Suffolk County, New York, Water Authority Revenue Bonds, Bond Anticipation Notes,
3.12%, 01/01/08(a) | | | 12,600,000 |
| 9,420,000 | | Sullivan County, New York, General Obligation Bond Anticipation Notes,
3.75%, 07/20/06 | | | 9,425,969 |
| 12,500,000 | | Syosset, New York, Central School District General Obligation Bonds, Tax Anticipation Notes,
3.75%, 06/29/06 | | | 12,515,618 |
| | | | |
|
|
| | | TOTAL TAX-EXEMPT CASH EQUIVALENT SECURITIES (Cost $301,439,853) | | | 301,439,853 |
| | | | |
|
|
TAX-EXEMPT CASH EQUIVALENT SECURITIES —
BACKED BY LETTERS OF CREDIT — 25.90% |
| 2,500,000 | | Allegany County, New York, General Obligation Bonds, Bond Anticipation Notes, (JP MORGAN CHASE & CO.),
4.25%, 09/27/06 | | | 2,511,944 |
See Notes to Financial Statements.
6
Excelsior Tax-Exempt Funds, Inc.
Portfolio of Investments — March 31, 2006
New York Tax-Exempt Money Fund — (continued)
| | | | | |
Principal Amount
| | Security Description
| | Value
|
| | | | | | |
TAX-EXEMPT CASH EQUIVALENT
SECURITIES — (continued) |
| $ 6,400,000 | | Long Island Power Authority, New York, Electric Systems Revenue Bonds, Series 1A, (BAYERISCHE LANDESBANK-80%/LANDESBANK BADEN-WUERTTEMBERG-20%),
3.16%, 05/01/33(a) | | $ | 6,400,000 |
| 4,660,000 | | Monroe County, New York, Industrial Development Agency Revenue Bonds, Civic Facilities, Greater Rochester YMCA Project, (MANUFACTURERS & TRADERS),
3.22%, 04/01/31(a) | | | 4,660,000 |
| 9,630,000 | | New York City, New York, General Obligation Bonds, Sub-Series B8, (BAYERISCHE LANDESBANK),
3.15%, 08/15/24(a) | | | 9,630,000 |
| 8,800,000 | | New York City, New York, Industrial Development Agency Revenue Bonds, Civic Facilities, Jewish Community Center Project, (MANUFACTURERS & TRADERS),
3.23%, 03/01/30(a) | | | 8,800,000 |
| 15,320,000 | | New York City, New York, Industrial Development Agency Revenue Bonds, Special Facilities, New York Stock Exchange Project, Series B, (BANK OF AMERICA N.A.),
3.15%, 05/01/33(a) | | | 15,320,000 |
| 10,000,000 | | New York City, New York, Trust For Cultural Restoration Revenue Bonds, WNYC Radio, Inc., (WACHOVIA BANK N.A.),
3.14%, 04/01/26(a) | | | 10,000,000 |
| 10,000,000 | | New York City, New York, Water & Sewage Authority Commercial Paper, Series 1, (DEXIA CREDIT LOCAL-50%/JP MORGAN CHASE & CO.-50%),
3.11%, 04/13/06 | | | 10,000,000 |
| | | | | |
Principal Amount
| | Security Description
| | Value
|
| | | | | | |
TAX-EXEMPT CASH EQUIVALENT
SECURITIES — (continued) |
| $ 1,200,000 | | New York State, Commercial Paper, (BAYERISCHE LANDESBANK-33%/JP MORGAN CHASE & CO.-33%/LANDESBANK HESSEN-THURINGEN-33%),
3.24%, 06/07/06 | | $ | 1,200,000 |
| 3,100,000 | | New York State, Dormitory Authority Commercial Paper, Mt. Sinai, (JP MORGAN CHASE & CO.),
3.30%, 05/10/06 | | | 3,100,000 |
| 300,000 | | New York State, Dormitory Authority Revenue Bonds, Oxford University Press Inc., (LANDESBANK HESSEN-THURINGEN),
3.10%, 07/01/25(a) | | | 300,000 |
| 3,000,000 | | New York State, Energy Research & Development Authority Facilities Revenue Bonds,
Sub-series A-1,
(WACHOVIA BANK N.A.),
3.15%, 05/01/39(a) | | | 3,000,000 |
| 7,500,000 | | New York State, Housing Finance Agency Revenue Bonds, Service Contracts, Series E, (BNP PARIBAS),
3.15%, 03/15/27(a) | | | 7,500,000 |
| 13,500,000 | | New York State, Housing Finance Agency Revenue Bonds, Service Contracts, Series I, (LANDESBANK HESSEN-THURINGEN),
3.16%, 03/15/31(a) | | | 13,500,000 |
| 20,000,000 | | Puerto Rico Commonwealth Revenue Bonds, Tax & Revenue Anticipation Notes (BANK OF NOVA SCOTIA-23%/CITIBANK-17%/BNP PARIBAS-17%/DEXIA CREDIT LOCAL-17%/FORTIS BANK-12%/RBC-8%/STATE STREET BANK & TRUST-6%),
4.50%, 07/28/06 | | | 20,080,866 |
| | | | |
|
|
| | | TOTAL TAX-EXEMPT CASH EQUIVALENT SECURITIES —BACKED BY LETTERS OF CREDIT
(Cost $116,002,810) | | | 116,002,810 |
| | | | |
|
|
See Notes to Financial Statements.
7
Excelsior Tax-Exempt Funds, Inc.
Portfolio of Investments — March 31, 2006
New York Tax-Exempt Money Fund — (continued)
| | | | | |
Shares
| | Security Description
| | Value
|
| | | | | | |
| REGISTERED INVESTMENT COMPANIES — 0.09% |
| 394,900 | | BlackRock Institutional New York
Money Market Fund | | $ | 394,900 |
| 1 | | Dreyfus New York Tax Exempt Fund | | | 1 |
| | | | |
|
|
| | | TOTAL REGISTERED INVESTMENT COMPANIES
(Cost $394,901) | | | 394,901 |
| | | | |
|
|
| | | | | | |
TOTAL INVESTMENTS
(Cost $417,837,564) | | 93.30 | % | | $ | 417,837,564 |
OTHER ASSETS IN EXCESS
OF LIABILITIES | | 6.70 | | | | 30,027,545 |
| | |
|
| |
|
|
NET ASSETS | | 100.00 | % | | $ | 447,865,109 |
| | |
|
| |
|
|
| (a) | Variable Rate Security—The rate disclosed is as of March 31, 2006. |
| (b) | Security exempt from registration under Rule 144A of the Securities Act of 1933. This security may be resold in transactions exempt from registration, normally to qualified institutional buyers. At March 31, 2006, these securities amounted to $161,439,999 or 36.05% of net assets. |
AMBAC—American Municipal Bond Assurance Corp.
Fannie Mae—Federal National Mortgage Association
FGIC—Financial Guaranty Insurance Corp.
FSA—Financial Security Assurance
MBIA—Municipal Bond Insurance Association
Notes (The following notes have not been audited by Deloitte & Touche LLP):
These municipal securities meet the three highest ratings assigned by Moody’s Investors Services, Inc. or Standard and Poor’s Corporation or, where not rated, are determined by the Advisor, under the supervision of the Board of Directors, to be of comparable quality at the time of purchase to rated instruments that may be acquired by the Fund.
At March 31, 2006, approximately 26% of the net assets are invested in municipal securities that have letter of credit enhancement features or escrows in U.S. Government securities backing them, on which the Fund relies. Without such features, the securities may or may not meet the quality standards of securities purchased by the Fund.
At March 31, 2006, approximately 89% of the net assets are invested in New York municipal securities. Economic changes affecting the state and certain of its public bodies and municipalities may affect the ability of the issuers to pay the required principal and interest payments of the municipal securities.
The summary of the Fund’s investments as of March 31, 2006 is as follows: (Unaudited)
| | | | | | |
Portfolio Diversification
| | % of Net Assets
| | | Value
|
Revenue Bonds | | 61.63 | % | | $ | 276,016,431 |
General Obligation Bonds | | 20.07 | | | | 89,876,232 |
Commercial Paper | | 11.51 | | | | 51,550,000 |
Registered Investment Companies | | 0.09 | | | | 394,901 |
| | |
|
| |
|
|
Total Investments | | 93.30 | % | | $ | 417,837,564 |
Other Assets in Excess of Liabilities | | 6.70 | | | | 30,027,545 |
| | |
|
| |
|
|
Net Assets | | 100.00 | % | | $ | 447,865,109 |
| | |
|
| |
|
|
See Notes to Financial Statements.
8
Excelsior Tax-Exempt Funds, Inc.
Portfolio of Investments — March 31, 2006
Tax-Exempt Money Fund
| | | | | |
Principal Amount
| | Security Description
| | Value
|
| | | | | | |
| TAX-EXEMPT CASH EQUIVALENT SECURITIES — 89.00% |
| $ 17,620,000 | | Alaska State, Housing Finance Authority Revenue Bonds, State Capital Project, Series C, (MBIA),
3.17%, 07/01/22(a) | | $ | 17,620,000 |
| 12,500,000 | | Anne Arundel County, Maryland, Commercial Paper,
3.15%, 04/06/06 | | | 12,500,000 |
| 21,000,000 | | Arizona State, Salt River Project Commercial Paper,
3.25%, 05/03/06 | | | 21,000,000 |
| 17,900,000 | | Arizona State, Salt River Project Commercial Paper,
3.20%, 08/04/06 | | | 17,900,000 |
| 51,660,000 | | Austin, Texas, Water & Wastewater System Revenue Bonds, (FSA),
3.22%, 05/15/24(a) | | | 51,660,000 |
| 25,900,000 | | Baltimore County, Maryland, Commercial Paper,
3.50%, 08/18/06 | | | 25,900,000 |
| 15,640,000 | | Bastrop, Texas, Munitops Certificates Trust, Independent School District General Obligation Bonds, Series 2003-23,
3.22%, 02/15/11(a)(b) | | | 15,640,000 |
| 6,000,000 | | Bristol, Connecticut, General Obligation Bonds, Bond Anticipation Notes,
4.00%, 12/06/06 | | | 6,022,640 |
| 14,065,000 | | Bryan, Texas, Munitops Certificates Trust, Independent School District General Obligation Bonds, Series 2005-16,
3.22%, 02/15/13(a)(b) | | | 14,065,000 |
| 45,000,000 | | Burke County, Georgia, Olgethorpe Power Authority, Commercial Paper, Series 98-A, (AMBAC),
3.27%, 04/07/06 | | | 45,000,000 |
| | | | | |
Principal Amount
| | Security Description
| | Value
|
| | | | | | |
TAX-EXEMPT CASH EQUIVALENT
SECURITIES — (continued) |
| $ 43,395,000 | | California State, General Obligation Bonds, TOCS, Series HH, (FSA),
3.20%, 07/03/13(a)(b) | | $ | 43,395,000 |
| 15,835,000 | | Cedar Hill, Texas, Munitops Certificates Trust, Independent School District General Obligation Bonds, Series 2005-19,
3.22%, 07/01/13(a)(b) | | | 15,835,000 |
| 44,430,000 | | Charlotte, North Carolina, Water & Sewer System Revenue Bonds, Series B,
3.18%, 07/01/27(a) | | | 44,430,000 |
| 55,575,000 | | Chicago, Illinois, Capital Improvement General Obligation Bonds, Metropolitan Water Reclamation District Project, Series A,
3.18%, 12/01/31(a) | | | 55,575,000 |
| 28,100,000 | | Chicago, Illinois, General Obligation Bonds, PUTTERS, Series 1277, (FSA),
3.21%, 01/01/14(a)(b) | | | 28,100,000 |
| 29,895,000 | | Chicago, Illinois, General Obligation Bonds, Series B, (FGIC),
3.19%, 01/01/37(a) | | | 29,895,000 |
| 40,000,000 | | Chicago, Illinois, General Obligation Bonds, Series D (FSA),
3.17%, 01/01/40(a) | | | 40,000,000 |
| 66,300,000 | | Chicago, Illinois, Water Revenue Bonds, Second Lien, (MBIA),
3.17%, 11/01/31(a) | | | 66,300,000 |
| 14,700,000 | | Colorado Springs, Colorado, School Disctrict No. 11 Facilities Corp. Certificate Participation, (FSA),
3.19%, 12/01/17(a) | | | 14,700,000 |
See Notes to Financial Statements.
9
Excelsior Tax-Exempt Funds, Inc.
Portfolio of Investments — March 31, 2006
Tax-Exempt Money Fund — (continued)
| | | | | |
Principal Amount
| | Security Description
| | Value
|
| | | | | | |
TAX-EXEMPT CASH EQUIVALENT
SECURITIES — (continued) |
| $ 6,520,000 | | Connecticut State, Special Tax Obligation Revenue Bonds, Floating Rate Certificates, Series 735, (AMBAC),
3.19%, 12/01/19(a)(b) | | $ | 6,520,000 |
| 10,755,000 | | Cook County, Illinois, General Obligation Bonds, PUTTERS, Series 766, (AMBAC),
3.46%, 05/15/12(a)(b) | | | 10,755,000 |
| 6,000,000 | | Curators of the University of Missouri, Systems Facility Revenue Bonds, Series B,
3.13%, 11/01/35(a) | | | 6,000,000 |
| 25,995,000 | | Cypress Fairbanks, Texas, Munitops Certificates Trust, Independent School District General Obligation Bonds, Series 2003-22,
3.22%, 02/15/11(a)(b) | | | 25,995,000 |
| 16,685,000 | | Dallas, Texas, Munitops Certificates Trust, General Obligation Bonds,
Series 2004-6,
3.22%, 02/15/12(a)(b) | | | 16,685,000 |
| 29,630,000 | | Dallas, Texas, Munitops Certificates Trust, Independent School District General Obligation Bonds, Series 2005-1,
3.22%, 08/15/12(a)(b) | | | 29,630,000 |
| 17,446,000 | | Dallas, Texas, Water & Sewer Commercial Paper, Series B,
3.30%, 05/11/06 | | | 17,446,000 |
| 12,935,000 | | Denton, Texas, Munitops Certificates Trust, General Obligation Bonds,
Series 2004-21,
3.22%, 08/15/12(a)(b) | | | 12,935,000 |
| 14,635,000 | | Detroit, Michigan, Munitops Certificates Trust, City School District General Obligation Bonds, Series 2004-39, (FGIC),
3.20%, 05/01/11(a)(b) | | | 14,635,000 |
| | | | | |
Principal Amount
| | Security Description
| | Value
|
| | | | | | |
TAX-EXEMPT CASH EQUIVALENT
SECURITIES — (continued) |
| $51,660,000 | | Detroit, Michigan, Sewage Disposal, Revenue Bonds, Series C-2, (FGIC),
3.17%, 07/01/29(a) | | $ | 51,660,000 |
| 23,635,000 | | District of Columbia, General Obligation Bonds, Series D, (FGIC),
3.19%, 06/01/29(a) | | | 23,635,000 |
| 13,475,000 | | District of Columbia, Revenue Bonds, George Washington University, Series C, (MBIA),
3.17%, 09/15/29(a) | | | 13,475,000 |
| 6,145,000 | | Duval County, Florida, School Board Certificates of Participation, Floating Rate Certificates, Series 1246, (FGIC),
3.20%, 07/01/25(a)(b) | | | 6,145,000 |
| 6,500,000 | | East Hampton, New York, Union Free School District General Obligation Bonds, Tax Anticipation Notes,
4.00%, 06/29/06 | | | 6,512,349 |
| 3,500,000 | | Fort Bend, Texas, Munitops Certificates Trust, Independent School District General Obligation Bonds, Series 1999-6,
3.20%, 03/07/07(a)(b) | | | 3,500,000 |
| 9,265,000 | | Frisco, Texas, Munitops Certificates Trust, General Obligation Bonds,
3.22%, 08/15/11(a)(b) | | | 9,265,000 |
| 17,280,000 | | Fulton County, Georgia, Water & Sewage Revenue Bonds, Floating Rate Certificates, Series 1120, (FGIC),
3.43%, 01/01/30(a)(b) | | | 17,280,000 |
| 8,500,000 | | Garden State Preservation Trust, New Jersey, Open Space & Farmland Revenue Bonds, Floating Rate Certificates, Series 860, (FSA),
3.19%, 11/01/17(a)(b) | | | 8,500,000 |
See Notes to Financial Statements.
10
Excelsior Tax-Exempt Funds, Inc.
Portfolio of Investments — March 31, 2006
Tax-Exempt Money Fund — (continued)
| | | | | |
Principal Amount
| | Security Description
| | Value
|
| | | | | | |
TAX-EXEMPT CASH EQUIVALENT
SECURITIES — (continued) |
| $ 8,745,000 | | Georgia State, General Obligation Bonds, Floating Rate Certificates, Series 647,
3.20%, 05/01/22(a)(b) | | $ | 8,745,000 |
| 9,995,000 | | Harlandale, Texas, Munitops Certificates Trust, General Obligation Bonds,
Series 2005-22,
3.22%, 08/15/13(a)(b) | | | 9,995,000 |
| 10,420,000 | | Hawaii State, Munitops Certificates Trust, General Obligation Bonds (FSA),
3.20%, 07/01/10(a)(b) | | | 10,420,000 |
| 10,000,000 | | Hockley County, Texas, Industrial Development Corporation, Pollution Control Revenue Bonds, Amoco Project — Standard Oil Co.,
3.20%, 03/01/14(a) | | | 9,986,700 |
| 19,300,000 | | Hockley County, Texas, Industrial Development Corporation, Pollution Control Revenue Bonds, Amoco Project — Standard Oil Co.,
2.98%, 11/01/19(a) | | | 19,300,000 |
| 9,995,000 | | Houston, Texas, Munitops Certificates Trust, Independent School District General Obligation Bonds, Series 2005-35, (PSF-GTD),
3.22%, 02/15/13(a)(b) | | | 9,995,000 |
| 12,600,000 | | Houston, Texas, Utility System Revenue Bonds, TOCS, Series A, (FSA),
3.21%, 05/15/12(a)(b) | | | 12,600,000 |
| 40,000,000 | | Illinois State, General Obligation Notes,
4.50%, 04/28/06 | | | 40,039,967 |
| | | | | |
Principal Amount
| | Security Description
| | Value
|
| | | | | | |
TAX-EXEMPT CASH EQUIVALENT
SECURITIES — (continued) |
| $13,800,000 | | Intermountain Power Agency, Utah, Commercial Paper, Series 85-F, (AMBAC),
3.25%, 04/03/06 | | $ | 13,800,000 |
| 25,000,000 | | Intermountain Power Agency, Utah, Commercial Paper, Series B,
3.30%, 05/17/06 | | | 25,000,000 |
| 12,330,000 | | Intermountain Power Agency, Utah, Power Supply Revenue Bonds, Series E, (AMBAC),
3.20%, 06/01/06(a) | | | 12,330,000 |
| 25,000,000 | | Intermountain Power Agency, Utah, Power Supply Revenue Bonds, Series E, (AMBAC),
3.45%, 07/01/14(a) | | | 25,000,000 |
| 10,750,000 | | Intermountain Power Agency, Utah, Power Supply Revenue Bonds, Series F, (AMBAC),
3.45%, 07/01/15(a) | | | 10,750,000 |
| 5,700,000 | | Jackson County, Mississippi, Port Facilities Revenue Bonds, Chevron Corp.,
3.18%, 06/01/23(a) | | | 5,700,000 |
| 12,340,000 | | Jackson County, Mississippi, Water Systems General Obligation Bonds,
Chervon Corp.,
3.20%, 11/01/24(a) | | | 12,340,000 |
| 8,505,000 | | Jacksonville, Florida, Electric Authority Revenue Bonds, Floating Rate Certificates, Series N-8,
3.28%, 10/01/23(a)(b) | | | 8,505,000 |
| 30,000,000 | | Jacksonville, Florida, Electrical System Commercial Paper, Series 2000-A,
3.18%, 07/20/06 | | | 30,000,000 |
| 35,000,000 | | Jacksonville, Florida, Electrical System Commercial Paper, Series 2000-F,
3.18%, 07/19/06 | | | 35,000,000 |
See Notes to Financial Statements.
11
Excelsior Tax-Exempt Funds, Inc.
Portfolio of Investments — March 31, 2006
Tax-Exempt Money Fund — (continued)
| | | | | |
Principal Amount
| | Security Description
| | Value
|
| | | | | | |
TAX-EXEMPT CASH EQUIVALENT
SECURITIES — (continued) |
| $ 8,955,000 | | Judson, Texas, Munitops Certificates Trust, General Obligation Bonds, Series 2003-36,
3.22%, 02/01/11(a)(b) | | $ | 8,955,000 |
| 8,800,000 | | Massachusetts Bay, Transportation Authority, Sales Tax Revenue Bonds, EAGLE, Series 2006-37, Class A,
3.21%, 07/01/34(a)(b) | | | 8,800,000 |
| 22,500,000 | | Massachusetts State, General Obligation Bonds, Series A,
3.14%, 09/01/16(a) | | | 22,500,000 |
| 10,000,000 | | Metropolitan Government Nashville & Davidson County, Tennessee, Commercial Paper, Vanderbilt University,
3.30%, 05/04/06 | | | 10,000,000 |
| 15,000,000 | | Metropolitan Government Nashville & Davidson County, Tennessee, Commercial Paper, Vanderbilt University,
3.30%, 05/15/06 | | | 15,000,000 |
| 10,750,000 | | Michigan State University, College & University Revenue Bonds,
3.14%, 02/15/34 (a) | | | 10,750,000 |
| 7,510,000 | | Michigan State, Building Authority Revenue Bonds, Floating Rate Certificates, Series 886, (MBIA),
3.20%, 10/15/17(a)(b) | | | 7,510,000 |
| 5,210,000 | | Michigan State, Municipal Bond Authority Revenue Bonds, PUTTER, Series 453,
3.21%, 05/01/12(a)(b) | | | 5,210,000 |
| 11,097,000 | | Milford, Connecticut, General Obligation Bond Anticipation Notes, Lot B,
3.75%, 05/04/06 | | | 11,105,558 |
| | | | | |
Principal Amount
| | Security Description
| | Value
|
| | | | | | |
| | | | | | |
TAX-EXEMPT CASH EQUIVALENT
SECURITIES — (continued) |
| $14,100,000 | | New Hampshire State, Health & Education Factilities, Dartmouth College Issue Revenue Bonds,
3.17%, 06/01/32(a) | | $ | 14,100,000 |
| 8,760,000 | | New York City, New York, Transitional Finance Authority Revenue Bonds, PUTTER, Series 468, (MBIA),
3.21%, 02/01/11(a)(b) | | | 8,760,000 |
| 22,300,000 | | New York State, Housing Finance Agency Revenue Bonds, 10 Barclay Street, Series A, (Fannie Mae),
3.16%, 11/15/37(a) | | | 22,300,000 |
| 11,345,000 | | New York State, Metropolitan Transit Authority Revenue Bonds, Floating Rate Certificates, Series 848-D, (FGIC),
3.19%, 11/15/21(a)(b) | | | 11,345,000 |
| 11,050,000 | | New York State, Power Authority General Obligation Bonds,
3.35%, 03/01/20(a) | | | 11,050,000 |
| 34,800,000 | | New York State, Triborough Bridge & Tunnel Authority Revenue Bonds,
Sub-Series B2,
3.16%, 01/01/32(a) | | | 34,800,000 |
| 11,000,000 | | New York State, Triborough Bridge & Tunnel Authority Revenue Bonds,
Sub-Series B3,
3.15%, 01/01/32(a) | | | 11,000,000 |
| 12,195,000 | | North Carolina State, General Obligation Bonds, PUTTER, Series 465,
3.21%, 05/01/11(a)(b) | | | 12,195,000 |
| 10,275,000 | | North Carolina State, General Obligation Bonds, PUTTER, Series 466,
3.21%, 03/01/12(a)(b) | | | 10,275,000 |
See Notes to Financial Statements.
12
Excelsior Tax-Exempt Funds, Inc.
Portfolio of Investments — March 31, 2006
Tax-Exempt Money Fund — (continued)
| | | | | |
Principal Amount
| | Security Description
| | Value
|
| | | | | | |
TAX-EXEMPT CASH EQUIVALENT
SECURITIES — (continued) |
| $31,085,000 | | Ohio State, Infrastructure Improvement General Obligations Bonds, Series D,
3.18%, 02/01/19(a) | | $ | 31,085,000 |
| 5,770,000 | | Oklahoma State, Water Resource Board Revenue Bonds, Loan Program,
3.35%, 09/01/26(a) | | | 5,770,000 |
| 26,490,000 | | Oklahoma State, Water Resource Board Revenue Bonds, Loan Program,
3.38%, 09/01/32(a) | | | 26,490,000 |
| 45,700,000 | | Omaha, Nebraska, Public Power Distribution Commercial Paper,
3.32%, 05/05/06 | | | 45,700,000 |
| 64,800,000 | | Orlando, Florida, Utilities Commission Water & Electric Revenue Bonds, Series A,
3.15%, 10/01/17(a) | | | 64,800,000 |
| 9,995,000 | | Pennsylvania State, Munitops Certificates Trust, Independent School District General Obligation Bonds, Series 2003-8, (FGIC),
3.19%, 03/15/11(a)(b) | | | 9,995,000 |
| 36,000,000 | | Pennsylvania State, Turnpike Commission Revenue Bonds, Series A-2,
3.22%, 12/01/30(a) | | | 36,000,000 |
| 16,700,000 | | Pennsylvania State, University Revenue Bonds, Series A,
3.18%, 04/01/31(a) | | | 16,700,000 |
| 9,460,000 | | Pflugerville, Texas, Munitops Certificates Trust, Independent School District General Obligation Bonds, Series 2005-17,
3.22%, 02/15/13(a)(b) | | | 9,460,000 |
| 3,905,000 | | Phoenix, Arizona, Civic Improvement Corp., Excise Tax Revenue Bonds, EAGLE, Class A,
3.21%, 07/01/17(a)(b) | | | 3,905,000 |
| | | | | |
Principal Amount
| | Security Description
| | Value
|
| | | | | | |
TAX-EXEMPT CASH EQUIVALENT
SECURITIES — (continued) |
| $36,800,000 | | Private Colleges & Universities, Georgia, Revenue Bonds, Emory University, Series B-2,
3.15%, 09/01/35(a) | | $ | 36,800,000 |
| 7,330,000 | | Puerto Rico Commonwealth, Infrastructure Financing Authority Revenue Bonds, Floating Rate Certificates, Series 139, (AMBAC),
3.18%, 07/01/28(a)(b) | | | 7,330,000 |
| 14,500,000 | | San Antonio, Texas, Water Revenue Bonds, EAGLE, Class A, (MBIA),
3.21%, 05/15/40(a)(b) | | | 14,500,000 |
| 14,600,000 | | San Antonio, Texas, Water Systems Commercial Paper, Series A,
3.35%, 05/10/06 | | | 14,600,000 |
| 13,235,000 | | South Carolina State, Public Services Authority Revenue Bonds, PUTTER, Series 1198, (MBIA),
3.45%, 07/01/13(a)(b) | | | 13,235,000 |
| 44,000,000 | | St. James Parish, Louisiana, Pollution Control Commercial Paper, Texaco Project, Series B,
3.32%, 05/11/06 | | | 44,000,000 |
| 12,000,000 | | Tennessee State, School Building Authority Commercial Paper,
3.20%, 06/08/06 | | | 12,000,000 |
| 11,945,000 | | Texas State, General Obligation Bonds, PUTTERS, Series 935,
3.45%, 04/01/13(a)(b) | | | 11,945,000 |
| 12,000,000 | | Texas State, Public Finance Authority Commercial Paper, Series 2003,
3.15%, 05/05/06 | | | 12,000,000 |
| 22,760,000 | | Texas State, Tax & Revenue Authority, General Obligation Bond Anticipation Notes,
4.50%, 08/31/06 | | | 22,868,018 |
See Notes to Financial Statements.
13
Excelsior Tax-Exempt Funds, Inc.
Portfolio of Investments — March 31, 2006
Tax-Exempt Money Fund — (continued)
| | | | | |
Principal Amount
| | Security Description
| | Value
|
| | | | | | |
TAX-EXEMPT CASH EQUIVALENT
SECURITIES — (continued) |
| $15,000,000 | | Texas State, Water Development Board Revenue Bonds, State Revolving Fund,
3.13%, 07/15/26(a) | | $ | 15,000,000 |
| 5,535,000 | | University of Texas, University Revenue Bonds, PUTTER, Series 592,
3.21%, 08/15/12(a)(b) | | | 5,535,000 |
| 3,300,000 | | University of Virginia, University Revenue Bonds, EAGLE, Series A,
3.21%, 06/01/33(a)(b) | | | 3,300,000 |
| 8,400,000 | | Virginia Commonwealth, Transportation Board, Revenue Bonds, Floating Rate Certificates, Series 727,
3.20%, 05/15/19(a)(b) | | | 8,400,000 |
| 9,745,000 | | Washoe County, Nevada, General Obligation Bonds, Floating Rate Certificates, Series 1241, (MBIA),
3.20%, 01/01/35(a)(b) | | | 9,745,000 |
| 13,000,000 | | Wilmington, North Carolina, General Obligation Bonds,
3.19%, 06/01/15(a) | | | 13,000,000 |
| 35,428,000 | | Wisconsin State, Transportation Revenue Commercial Paper,
Series 1997-A,
3.15%, 04/05/06 | | | 35,428,000 |
| 5,265,000 | | Yoakum County, Texas, Industrial Development Corporation, Pollution Control Revenue Bonds, Amoco Project,
2.98%, 11/01/19(a) | | | 5,265,000 |
| 8,140,000 | | York County, South Carolina, School District 4 General Obligation Bonds, Fort Mill, TOCS, Series F,
3.21%, 03/09/12(a)(b) | | | 8,140,000 |
| | | | |
|
|
| | | TOTAL TAX-EXEMPT CASH EQUIVALENT SECURITIES
(Cost $1,924,269,232) | | | 1,924,269,232 |
| | | | |
|
|
| | | | | |
Principal Amount
| | Security Description
| | Value
|
| | | | | | |
TAX-EXEMPT CASH EQUIVALENT SECURITIES —
BACKED BY LETTERS OF CREDIT — 8.19% |
| $14,200,000 | | Austin, Texas, Utilities Commercial Paper, Series A, (JP MORGAN CHASE BANK-40.8%/STATE STREET BANK & TRUST-33.5%/BAYERISCHE LANDESBANK-25.7%),
3.18%, 04/07/06 | | $ | 14,200,000 |
| 29,900,000 | | Baltimore, Maryland, Port Facilities Authority Revenue Bonds, (BNP PARIBAS),
3.25%, 10/14/11(a) | | | 29,900,000 |
| 20,000,000 | | Colorado State, Regional Transportation District Commercial Paper, Series A, (WESTDEUTSCHE LANDESBANK),
3.20%, 04/06/06 | | | 20,000,000 |
| 17,100,000 | | Des Moines, Iowa, Hospital Facilities Authority Revenue Bonds, Methodist Medical Center Project, (BANK OF AMERICA N.A.),
3.19%, 08/01/15(a) | | | 17,100,000 |
| 13,300,000 | | District of Columbia, Phillips College Issue Revenue Bonds, (BANK OF AMERICA N.A.),
3.18%, 08/01/33(a) | | | 13,300,000 |
| 31,900,000 | | Illinois State, Development Finance Authority Revenue Bonds, Chicago Symphony Orchestra, (NORTHERN TRUST COMPANY),
3.17%, 12/01/28(a) | | | 31,900,000 |
| 20,000,000 | | Indiana State, Municipal Power Agency, Power Supply System Revenue Bonds, Series A, (DEXIA CREDIT LOCAL),
3.18%, 01/01/18(a) | | | 20,000,000 |
| 12,000,000 | | Indiana State, Museum of Art Revenue Bonds, (JP MORGAN CHASE BANK),
3.22%, 02/01/39(a) | | | 12,000,000 |
See Notes to Financial Statements.
14
Excelsior Tax-Exempt Funds, Inc.
Portfolio of Investments — March 31, 2006
Tax-Exempt Money Fund — (continued)
| | | | | |
Principal Amount
| | Security Description
| | Value
|
TAX-EXEMPT CASH EQUIVALENT SECURITIES —
BACKED BY LETTERS OF CREDIT — (continued) |
| $ 7,000,000 | | Kenton County, Kentucky, Industrial Building Authority Revenue Bonds, Redken Labs, Inc. Project, (JP MORGAN CHASE BANK),
3.25%, 12/01/14(a) | | $ | 7,000,000 |
| 11,500,000 | | New York State, Commercial Paper, (BAYERISCHE LANDESBANK-33.3%/JP MORGAN CHASE BANK-33.3%/LANDESBANK HESSEN-33.3%),
3.23%, 04/05/06 | | | 11,500,000 |
| 155,000 | | Richmond, Virginia, Individual Development Authority, Educational Facilities, Church Schools, Revenue Bonds, (SUNTRUST BANK),
3.17%, 05/01/35(a) | | | 155,000 |
| | | | |
|
|
| | | TOTAL TAX-EXEMPT
CASH EQUIVALENT SECURITIES — BACKED BY LETTERS OF CREDIT
(Cost $177,055,000) | | | 177,055,000 |
| | | | |
|
|
Shares
| | | | |
| REGISTERED INVESTMENT COMPANIES — 0.03% |
| 1 | | BlackRock Muni Fund | | | 1 |
| 732,168 | | Dreyfus Tax Exempt Cash Fund | | | 732,168 |
| | | | |
|
|
| | | TOTAL REGISTERED INVESTMENT COMPANIES
(Cost $732,169) | | | 732,169 |
| | | | |
|
|
| | | | | | |
TOTAL INVESTMENTS
(Cost $2,102,056,401) | | 97.22 | % | | $ | 2,102,056,401 |
OTHER ASSETS IN EXCESS
OF LIABILITIES | | 2.78 | | | | 60,116,934 |
| | |
|
| |
|
|
NET ASSETS | | 100.00 | % | | $ | 2,162,173,335 |
| | |
|
| |
|
|
| (a) | Variable Rate Security—The rate disclosed is as of March 31, 2006. |
| (b) | Security exempt from registration under Rule 144A of the Securities Act of 1933. This security may be resold in transactions exempt from registration, normally to qualified institutional buyers. At March 31, 2006, these securities amounted to $517,680,000 or 23.94% of net assets. |
AMBAC—American Municipal Bond Assurance Corp.
FGIC—Financial Guaranty Insurance Corp.
FSA—Financial Security Assurance
MBIA—Municipal Bond Insurance Association
PSF-GTD—Permanent School Fund – Guaranteed
Notes (The following notes have not been audited by Deloitte & Touche LLP):
These municipal securities meet the three highest ratings assigned by Moody’s Investors Services, Inc. or Standard and Poor’s Corporation or, where not rated, are determined by the Advisor, under the supervision of the Board of Directors, to be of comparable quality at the time of purchase to rated instruments that may be acquired by the Fund.
At March 31, 2006, approximately 8% of the net assets are invested in municipal securities that have letter of credit enhancement features or escrows in U.S. Government securities backing them, on which the Fund relies. Without such features, the securities may or may not meet the quality standards of securities purchased by the Fund.
See Notes to Financial Statements.
15
Excelsior Tax-Exempt Funds, Inc.
Portfolio of Investments — March 31, 2006
Tax-Exempt Money Fund — (continued)
The summary of the Fund’s investments as of March 31, 2006 is as follows: (Unaudited)
| | | | | | |
State Diversification
| | % of Net Assets
| | | Value
|
Texas | | 18.76 | % | | $ | 405,360,718 |
Illinois | | 13.67 | | | | 295,309,967 |
Florida | | 6.68 | | | | 144,450,000 |
New York | | 5.42 | | | | 117,267,349 |
Georgia | | 4.99 | | | | 107,825,000 |
Utah | | 4.02 | | | | 86,880,000 |
North Carolina | | 3.70 | | | | 79,900,000 |
Michigan | | 3.65 | | | | 79,015,000 |
Maryland | | 3.16 | | | | 68,300,000 |
Pennsylvania | | 2.90 | | | | 62,695,000 |
District of Columbia | | 2.83 | | | | 61,165,000 |
Nebraska | | 2.11 | | | | 45,700,000 |
Louisiana | | 2.03 | | | | 44,000,000 |
California | | 2.01 | | | | 43,395,000 |
Arizona | | 1.98 | | | | 42,805,000 |
Tennessee | | 1.71 | | | | 37,000,000 |
Wisconsin | | 1.64 | | | | 35,428,000 |
Colorado | | 1.60 | | | | 34,700,000 |
Oklahoma | | 1.49 | | | | 32,260,000 |
Indiana | | 1.48 | | | | 32,000,000 |
Massachusetts | | 1.45 | | | | 31,300,000 |
Ohio | | 1.44 | | | | 31,085,000 |
New Hampshire | | 1.15 | | | | 24,850,000 |
Connecticut | | 1.09 | | | | 23,648,198 |
South Carolina | | 0.99 | | | | 21,375,000 |
Mississippi | | 0.83 | | | | 18,040,000 |
Arkansas | | 0.81 | | | | 17,620,000 |
Iowa | | 0.79 | | | | 17,100,000 |
Virginia | | 0.55 | | | | 11,855,000 |
Hawaii | | 0.48 | | | | 10,420,000 |
Nevada | | 0.45 | | | | 9,745,000 |
New Jersey | | 0.39 | | | | 8,500,000 |
Puerto Rico | | 0.34 | | | | 7,330,000 |
Kentucky | | 0.32 | | | | 7,000,000 |
Missouri | | 0.28 | | | | 6,000,000 |
Registered Investment Companies | | 0.03 | | | | 732,169 |
| | |
|
| |
|
|
Total Investments | | 97.22 | % | | $ | 2,102,056,401 |
Other Assets in Excess of Liabilities | | 2.78 | | | | 60,116,934 |
| | |
|
| |
|
|
Net Assets | | 100.00 | % | | $ | 2,162,173,335 |
| | |
|
| |
|
|
See Notes to Financial Statements.
16
Excelsior Funds, Inc.
Portfolio of Investments — March 31, 2006
Treasury Money Fund
| | | | | |
Principal Amount
| | Security
Description
| | Value
|
| | | | | | |
| U.S. GOVERNMENT & AGENCY OBLIGATIONS — 17.77% |
| $ 65,000,000 | | Federal Home Loan Bank, Discount Note, 4.63%, 04/03/06 | | $ | 64,983,281 |
| | | | |
|
|
| | | TOTAL U.S. GOVERNMENT & AGENCY OBLIGATIONS
(Cost $64,983,281) | | | 64,983,281 |
| | | | |
|
|
| U.S. TREASURY OBLIGATIONS — 81.99% |
| 300,000,000 | | 4.37%, 04/06/06(a) | | | 299,818,333 |
| | | | |
|
|
| | | TOTAL U.S. TREASURY OBLIGATIONS
(Cost $299,818,333) | | | 299,818,333 |
| | | | |
|
|
| | | | | |
Shares
| | Security
Description
| | Value
|
| | | | | | |
| REGISTERED INVESTMENT COMPANY — 0.57% |
| 2,089,320 | | Dreyfus Treasury Prime Cash Management Fund | | $ | 2,089,320 |
| | | | |
|
|
| | | TOTAL REGISTERED INVESTMENT COMPANY
(Cost $2,089,320) | | | 2,089,320 |
| | | | |
|
|
| | | | | | | |
TOTAL INVESTMENTS
(Cost $366,890,934) | | 100.33 | % | | $ | 366,890,934 | |
LIABILITIES IN EXCESS OF OTHER ASSETS | | (0.33 | ) | | | (1,203,123 | ) |
| | |
|
| |
|
|
|
NET ASSETS | | 100.00 | % | | $ | 365,687,811 | |
| | |
|
| |
|
|
|
| (a) | The rate shown is the effective yield at the time of purchase. |
Discount Note—The rate reported is the discount rate at the time of purchase.
The summary of the Fund’s investments as of March 31, 2006 is as follows: (Unaudited)
| | | | | | | |
Portfolio Diversification
| | % of
Net
Assets
| | | Value
| |
U.S. Treasury Obligations | | 81.99 | % | | $ | 299,818,333 | |
U.S. Government & Agency Obligations | | 17.77 | | | | 64,983,281 | |
Registered Investment Company | | 0.57 | | | | 2,089,320 | |
| | |
|
| |
|
|
|
Total Investments | | 100.33 | % | | $ | 366,890,934 | |
Liabilities in Excess of Other Assets | | (0.33 | ) | | | (1,203,123 | ) |
| | |
|
| |
|
|
|
Net Assets | | 100.00 | % | | $ | 365,687,811 | |
| | |
|
| |
|
|
|
See Notes to Financial Statements.
17
Excelsior Funds
Statements of Assets and Liabilities
March 31, 2006
| | | | | | | | | | | | | | | | | | |
| | | | | |
| | | Government
Money Fund
| | | Money Fund
| | | New York
Tax-Exempt
Money Fund
| | Tax-Exempt
Money Fund
| | | Treasury
Money Fund
|
ASSETS: | | | | | | | | | | | | | | | | | | |
Investments, at cost — see accompanying portfolios | | $ | 412,023,740 | | | $ | 1,560,720,348 | | | $ | 417,837,564 | | $ | 2,102,056,401 | | | $ | 366,890,934 |
| | |
|
|
| |
|
|
| |
|
| |
|
|
| |
|
|
Investments, at value (including Repurchase Agreements) (Note 1) | | $ | 412,023,740 | | | $ | 1,560,720,348 | | | $ | 417,837,564 | | $ | 2,102,056,401 | | | $ | 366,890,934 |
Cash | | | — | | | | 1 | | | | 30,826 | | | — | | | | — |
Dividends and interest receivable | | | 5,031 | | | | 119,649 | | | | 3,603,502 | | | 11,011,268 | | | | 9,648 |
Receivable for investments sold | | | — | | | | — | | | | 27,517,568 | | | 55,110,000 | | | | — |
Receivable for fund shares sold | | | 57,982 | | | | 1,219,952 | | | | 155,718 | | | 239,960 | | | | 207,122 |
Prepaid expenses and other assets | | | 19,085 | | | | 58,578 | | | | 15,317 | | | 81,029 | | | | 15,795 |
| | |
|
|
| |
|
|
| |
|
| |
|
|
| |
|
|
Total Assets | | | 412,105,838 | | | | 1,562,118,528 | | | | 449,160,495 | | | 2,168,498,658 | | | | 367,123,499 |
LIABILITIES: | | | | | | | | | | | | | | | | | | |
Payable for dividends declared | | | 1,552,616 | | | | 5,955,217 | | | | 975,168 | | | 4,894,160 | | | | 1,141,474 |
Investment advisory fees payable (Note 2) | | | 35,173 | | | | 151,152 | | | | 60,329 | | | 243,262 | | | | 44,721 |
Administration fees payable (Note2) | | | 58,155 | | | | 215,260 | | | | 58,341 | | | 283,957 | | | | 44,733 |
Shareholder servicing fees payable (Note2) | | | 101,926 | | | | 256,357 | | | | 116,167 | | | 471,885 | | | | 102,729 |
Directors’ fees and expense payable (Note 2) | | | 365 | | | | 1,256 | | | | 356 | | | 1,768 | | | | 263 |
Accrued expenses and other payables | | | 129,648 | | | | 403,614 | | | | 85,025 | | | 430,291 | | | | 101,768 |
| | |
|
|
| |
|
|
| |
|
| |
|
|
| |
|
|
Total Liabilities | | | 1,877,883 | | | | 6,982,856 | | | | 1,295,386 | | | 6,325,323 | | | | 1,435,688 |
| | |
|
|
| |
|
|
| |
|
| |
|
|
| |
|
|
NET ASSETS | | $ | 410,227,955 | | | $ | 1,555,135,672 | | | $ | 447,865,109 | | $ | 2,162,173,335 | | | $ | 365,687,811 |
| | |
|
|
| |
|
|
| |
|
| |
|
|
| |
|
|
NET ASSETS consist of: | | | | | | | | | | | | | | | | | | |
Undistributed (distributions in excess of) net investment income | | $ | — | | | $ | — | | | $ | 4,841 | | $ | (9,820 | ) | | $ | 558 |
Accumulated net realized gain (loss) on investments | | | (27,980 | ) | | | (40,526 | ) | | | — | | | 94,049 | | | | — |
Par value (Note 4) | | | 410,328 | | | | 1,555,381 | | | | 447,861 | | | 2,162,339 | | | | 365,697 |
Paid in capital in excess of par value | | | 409,845,607 | | | | 1,553,620,817 | | | | 447,412,407 | | | 2,159,926,767 | | | | 365,321,556 |
| | |
|
|
| |
|
|
| |
|
| |
|
|
| |
|
|
Net Assets | | $ | 410,227,955 | | | $ | 1,555,135,672 | | | $ | 447,865,109 | | $ | 2,162,173,335 | | | $ | 365,687,811 |
| | |
|
|
| |
|
|
| |
|
| |
|
|
| |
|
|
Net Assets: | | | | | | | | | | | | | | | | | | |
Shares | | $ | 410,227,955 | | | $ | 1,032,384,476 | | | $ | 447,865,109 | | $ | 2,162,173,335 | | | $ | 365,687,811 |
Institutional Shares | | | — | | | | 522,751,196 | | | | — | | | — | | | | — |
Shares outstanding (Note 4): | | | | | | | | | | | | | | | | | | |
Shares | | | 410,327,672 | | | | 1,032,627,312 | | | | 447,861,178 | | | 2,162,338,958 | | | | 365,697,380 |
Institutional Shares | | | — | | | | 522,753,455 | | | | — | | | — | | | | — |
NET ASSET VALUE PER SHARE
(net assets ÷ shares outstanding): | | | | | | | | | | | | | | | | | | |
Shares | | | $1.00 | | | | $1.00 | | | | $1.00 | | | $1.00 | | | | $1.00 |
| | |
|
|
| |
|
|
| |
|
| |
|
|
| |
|
|
Institutional Shares | | | — | | | | $1.00 | | | | — | | | — | | | | — |
| | |
|
|
| |
|
|
| |
|
| |
|
|
| |
|
|
See Notes to Financial Statements.
18
Excelsior Funds
Statements of Operations
Year Ended March 31, 2006
| | | | | | | | | | | | | | | | | | | | |
| | | Government
Money
Fund
| | | Money
Fund
| | | New York
Tax-Exempt
Money
Fund
| | | Tax-Exempt
Money
Fund
| | | Treasury
Money
Fund
| |
INVESTMENT INCOME: | | | | | | | | | | | | | | | | | | | | |
Interest income | | $ | 16,742,928 | | | $ | 59,433,288 | | | $ | 11,621,075 | | | $ | 58,878,211 | | | $ | 12,704,515 | |
| | |
|
|
| |
|
|
| |
|
|
| |
|
|
| |
|
|
|
EXPENSES: | | | | | | | | | | | | | | | | | | | | |
Investment advisory fees (Note 2) | | | 1,136,338 | | | | 3,938,657 | | | | 2,113,247 | | | | 5,328,046 | | | | 1,108,784 | |
Administration fees (Note 2) | | | 686,450 | | | | 2,379,752 | | | | 638,281 | | | | 3,218,552 | | | | 558,168 | |
Shareholder servicing fees — Shares
(Note 2) | | | 1,136,237 | | | | 2,539,555 | | | | 1,056,626 | | | | 5,327,870 | | | | 923,967 | |
Transfer agent fees | | | 18,900 | | | | 77,271 | | | | 19,199 | | | | 22,294 | | | | 19,013 | |
Legal and audit fees | | | 59,746 | | | | 186,695 | | | | 63,443 | | | | 213,438 | | | | 53,857 | |
Custodian fees | | | 22,864 | | | | 78,967 | | | | 23,043 | | | | 107,033 | | | | 11,749 | |
Directors’ fees and expenses (Note 2) | | | 19,120 | | | | 67,918 | | | | 17,283 | | | | 88,669 | | | | 16,080 | |
Miscellaneous expenses | | | 61,593 | | | | 229,616 | | | | 59,623 | | | | 211,046 | | | | 55,180 | |
| | |
|
|
| |
|
|
| |
|
|
| |
|
|
| |
|
|
|
Total Expenses | | | 3,141,248 | | | | 9,498,431 | | | | 3,990,745 | | | | 14,516,948 | | | | 2,746,798 | |
Fees waived and reimbursed by:
Investment Adviser (Note 2) | | | (724,624 | ) | | | (2,481,701 | ) | | | (1,454,850 | ) | | | (3,143,406 | ) | | | (595,431 | ) |
| | |
|
|
| |
|
|
| |
|
|
| |
|
|
| |
|
|
|
Net Expenses | | | 2,416,624 | | | | 7,016,730 | | | | 2,535,895 | | | | 11,373,542 | | | | 2,151,367 | |
| | |
|
|
| |
|
|
| |
|
|
| |
|
|
| |
|
|
|
NET INVESTMENT INCOME | | | 14,326,304 | | | | 52,416,558 | | | | 9,085,180 | | | | 47,504,669 | | | | 10,553,148 | |
| | |
|
|
| |
|
|
| |
|
|
| |
|
|
| |
|
|
|
REALIZED GAIN (LOSS) ON INVESTMENTS (Note 1): | | | | | | | | | | | | | | | | | | | | |
Net realized gain (loss) on security transactions | | | (224 | ) | | | (4,889 | ) | | | 7,841 | | | | 177,930 | | | | 19,089 | |
| | |
|
|
| |
|
|
| |
|
|
| |
|
|
| |
|
|
|
Net increase in net assets resulting from operations | | $ | 14,326,080 | | | $ | 52,411,669 | | | $ | 9,093,021 | | | $ | 47,682,599 | | | $ | 10,572,237 | |
| | |
|
|
| |
|
|
| |
|
|
| |
|
|
| |
|
|
|
See Notes to Financial Statements.
19
Excelsior Funds
Statements of Changes in Net Assets
| | | | | | | | | | | | | | | | |
| | |
| | | Government Money Fund
| | |
Money Fund
| |
| | | Year Ended March 31,
| | | Year Ended March 31,
| |
| | | 2006
| | | 2005
| | | 2006
| | | 2005
| |
Net investment income | | $ | 14,326,304 | | | $ | 6,447,253 | | | $ | 52,416,558 | | | $ | 21,599,947 | |
Net realized gain (loss) on security transactions | | | (224 | ) | | | 2,167 | | | | (4,889 | ) | | | 6,919 | |
| | |
|
|
| |
|
|
| |
|
|
| |
|
|
|
Net increase in net assets resulting from operations | | | 14,326,080 | | | | 6,449,420 | | | | 52,411,669 | | | | 21,606,866 | |
| | |
|
|
| |
|
|
| |
|
|
| |
|
|
|
Distributions to shareholders: | | | | | | | | | | | | | | | | |
From net investment income | | | | | | | | | | | | | | | | |
Shares | | | (14,326,304 | ) | | | (6,447,253 | ) | | | (32,581,762 | ) | | | (14,621,112 | ) |
Institutional Shares | | | — | | | | — | | | | (19,834,796 | ) | | | (6,978,835 | ) |
From net realized gain on investment | | | | | | | | | | | | | | | | |
Shares | | | — | | | | — | | | | — | | | | — | |
| | |
|
|
| |
|
|
| |
|
|
| |
|
|
|
Total distributions | | | (14,326,304 | ) | | | (6,447,253 | ) | | | (52,416,558 | ) | | | (21,599,947 | ) |
| | |
|
|
| |
|
|
| |
|
|
| |
|
|
|
Increase (decrease) in net assets from fund share transactions (Note 4) | | | (85,798,349 | ) | | | (48,696,954 | ) | | | (175,199,854 | ) | | | 118,582,301 | |
| | |
|
|
| |
|
|
| |
|
|
| |
|
|
|
Net increase (decrease) in net assets | | | (85,798,573 | ) | | | (48,694,787 | ) | | | (175,204,743 | ) | | | 118,589,220 | |
| | |
|
|
| |
|
|
| |
|
|
| |
|
|
|
NET ASSETS: | | | | | | | | | | | | | | | | |
Beginning of year | | | 496,026,528 | | | | 544,721,315 | | | | 1,730,340,415 | | | | 1,611,751,195 | |
| | |
|
|
| |
|
|
| |
|
|
| |
|
|
|
End of year(1) | | $ | 410,227,955 | | | $ | 496,026,528 | | | $ | 1,555,135,672 | | | $ | 1,730,340,415 | |
| | |
|
|
| |
|
|
| |
|
|
| |
|
|
|
| | | | | | | | | | | | | | | | |
(1) Including undistributed (distributions in excess of) net investment income | | $ | — | | | $ | — | | | $ | — | | | $ | — | |
| | |
|
|
| |
|
|
| |
|
|
| |
|
|
|
See Notes to Financial Statements.
20
| | | | | | | | | | | | | | | | | | | | | | |
| | |
New York Tax-Exempt Money Fund
| | | Tax-Exempt Money Fund
| | | Treasury Money Fund
| |
Year Ended March 31,
| | | Year Ended March 31,
| | | Year Ended March 31,
| |
2006
| | | 2005
| | | 2006
| | | 2005
| | | 2006
| | | 2005
| |
| $ | 9,085,180 | | | $ | 3,553,633 | | | $ | 47,504,669 | | | $ | 20,230,126 | | | $ | 10,553,148 | | | $ | 4,239,423 | |
| | 7,841 | | | | 1,894 | | | | 177,930 | | | | 38,044 | | | | 19,089 | | | | 6,094 | |
|
|
| |
|
|
| |
|
|
| |
|
|
| |
|
|
| |
|
|
|
| | 9,093,021 | | | | 3,555,527 | | | | 47,682,599 | | | | 20,268,170 | | | | 10,572,237 | | | | 4,245,517 | |
|
|
| |
|
|
| |
|
|
| |
|
|
| |
|
|
| |
|
|
|
| | | | | | | | | | | | | | | | | | | | | | | |
| | | | | | | | | | | | | | | | | | | | | | | |
| | (9,089,166 | ) | | | (3,553,633 | ) | | | (47,540,889 | ) | | | (20,240,002 | ) | | | (10,559,242 | ) | | | (4,245,864 | ) |
| | — | | | | — | | | | — | | | | — | | | | — | | | | — | |
|
— |
| | | — | | | | (83,881 | ) | | | — | | | | (14,837 | ) | | | — | |
|
|
| |
|
|
| |
|
|
| |
|
|
| |
|
|
| |
|
|
|
| | (9,089,166 | ) | | | (3,553,633 | ) | | | (47,624,770 | ) | | | (20,240,002 | ) | | | (10,574,079 | ) | | | (4,245,864 | ) |
|
|
| |
|
|
| |
|
|
| |
|
|
| |
|
|
| |
|
|
|
|
38,609,252 |
| | | (80,848,665 | ) | | | 124,313,013 | | | | (6,902,094 | ) | | | (62,318,509 | ) | | | (91,713,040 | ) |
|
|
| |
|
|
| |
|
|
| |
|
|
| |
|
|
| |
|
|
|
| | 38,613,107 | | | | (80,846,771 | ) | | | 124,370,842 | | | | (6,873,926 | ) | | | (62,320,351 | ) | | | (91,713,387 | ) |
|
|
| |
|
|
| |
|
|
| |
|
|
| |
|
|
| |
|
|
|
| | | | | | | | | | | | | | | | | | | | | | | |
| | 409,252,002 | | | | 490,098,773 | | | | 2,037,802,493 | | | | 2,044,676,419 | | | | 428,008,162 | | | | 519,721,549 | |
|
|
| |
|
|
| |
|
|
| |
|
|
| |
|
|
| |
|
|
|
| $ | 447,865,109 | | | $ | 409,252,002 | | | $ | 2,162,173,335 | | | $ | 2,037,802,493 | | | $ | 365,687,811 | | | $ | 428,008,162 | |
|
|
| |
|
|
| |
|
|
| |
|
|
| |
|
|
| |
|
|
|
| | | | | |
| $ | 4,841 | | | $ | 986 | | | $ | (9,820 | ) | | $ | 26,400 | | | $ | 558 | | | $ | 2,400 | |
|
|
| |
|
|
| |
|
|
| |
|
|
| |
|
|
| |
|
|
|
See Notes to Financial Statements.
21
Excelsior Funds
Financial Highlights — Selected Per Share Data and Ratios
| | | | | | | | | | | | | | | | | | | | | | |
| | | Net Asset Value,
Beginning of
Year
| | Net
Investment
Income
| | | Net Realized Gain (Loss) on
Investments
| | | Total From
Investment
Operations
| | Dividends
From Net
Investment
Income
| | | Distributions
From Net
Realized
Gain on
Investments
| |
GOVERNMENT MONEY FUND — (5/8/85*) | | | | | | | | | | | | | | | | | | | |
Shares: | | | | | | | | | | | | | | | | | | | | | | |
Year Ended March 31, | | | | | | | | | | | | | | | | | | | | | | |
2006 | | $ | 1.00 | | $ | 0.03152 | (2) | | $ | 0.00024 | (2) | | $ | 0.03176 | | $ | (0.03176 | ) | | $ | — | |
2005 | | | 1.00 | | | 0.01250 | (2) | | | 0.00003 | | | | 0.01253 | | | (0.01253 | ) | | | — | |
2004 | | | 1.00 | | | 0.00625 | | | | — | | | | 0.00625 | | | (0.00625 | ) | | | — | |
2003 | | | 1.00 | | | 0.01199 | | | | (0.00039 | ) | | | 0.01160 | | | (0.01160 | ) | | | — | |
2002 | | | 1.00 | | | 0.02585 | | | | 0.00038 | | | | 0.02623 | | | (0.02623 | ) | | | — | |
MONEY FUND — (5/3/85*) | | | | | | | | | | | | | | | | | | | | | | |
Shares: | | | | | | | | | | | | | | | | | | | | | | |
Year Ended March 31, | | | | | | | | | | | | | | | | | | | | | | |
2006 | | $ | 1.00 | | $ | 0.03207 | (2) | | $ | 0.00015 | (2) | | $ | 0.03222 | | $ | (0.03222 | ) | | $ | — | |
2005 | | | 1.00 | | | 0.01275 | (2) | | | 0.00010 | | | | 0.01285 | | | (0.01285 | ) | | | — | |
2004 | | | 1.00 | | | 0.00662 | | | | — | | | | 0.00662 | | | (0.00662 | ) | | | — | |
2003 | | | 1.00 | | | 0.01255 | | | | (0.00010 | ) | | | 0.01245 | | | (0.01245 | ) | | | — | |
2002 | | | 1.00 | | | 0.02741 | | | | 0.00010 | | | | 0.02751 | | | (0.02751 | ) | | | — | |
NEW YORK TAX-EXEMPT MONEY FUND — (8/3/98*) | | | | | | | | | | | | | | | | |
Shares: | | | | | | | | | | | | | | | | | | | | | | |
Year Ended March 31, | | | | | | | | | | | | | | | | | | | | | | |
2006 | | $ | 1.00 | | $ | 0.02150 | (2) | | $ | (0.00012 | )(2) | | $ | 0.02138 | | $ | (0.02138 | ) | | $ | — | |
2005 | | | 1.00 | | | 0.00822 | (2) | | | 0.00023 | | | | 0.00845 | | | (0.00845 | ) | | | — | |
2004 | | | 1.00 | | | 0.00491 | | | | 0.00006 | | | | 0.00497 | | | (0.00490 | ) | | | (0.00007 | ) |
2003 | | | 1.00 | | | 0.00884 | | | | (0.00007 | ) | | | 0.00877 | | | (0.00873 | ) | | | (0.00004 | ) |
2002 | | | 1.00 | | | 0.01758 | | | | 0.00011 | | | | 0.01769 | | | (0.01769 | ) | | | — | |
TAX-EXEMPT MONEY FUND — (5/24/85*) | | | | | | | | | | | | | | | | | | | |
Shares: | | | | | | | | | | | | | | | | | | | | | | |
Year Ended March 31, | | | | | | | | | | | | | | | | | | | | | | |
2006 | | $ | 1.00 | | $ | 0.02229 | (2) | | $ | — | (2) | | $ | 0.02229 | | $ | (0.02225 | ) | | $ | (0.00004 | ) |
2005 | | | 1.00 | | | 0.00966 | (2) | | | — | | | | 0.00966 | | | (0.00966 | ) | | | — | |
2004 | | | 1.00 | | | 0.00546 | | | | 0.00029 | | | | 0.00575 | | | (0.00560 | ) | | | (0.00015 | ) |
2003 | | | 1.00 | | | 0.00967 | | | | (0.00002 | ) | | | 0.00965 | | | (0.00964 | ) | | | (0.00001 | ) |
2002 | | | 1.00 | | | 0.01862 | | | | 0.00013 | | | | 0.01875 | | | (0.01865 | ) | | | (0.00010 | ) |
TREASURY MONEY FUND — (2/13/91*) | | | | | | | | | | | | | | | | | | | |
Shares: | | | | | | | | | | | | | | | | | | | | | | |
Year Ended March 31, | | | | | | | | | | | | | | | | | | | | | | |
2006 | | $ | 1.00 | | $ | 0.02855 | (2) | | $ | 0.00036 | (2) | | $ | 0.02891 | | $ | (0.02887 | ) | | $ | (0.00004 | ) |
2005 | | | 1.00 | | | 0.00988 | (2) | | | 0.00031 | | | | 0.01019 | | | (0.01019 | ) | | | — | |
2004 | | | 1.00 | | | 0.00484 | | | | 0.00002 | | | | 0.00486 | | | (0.00485 | ) | | | (0.00001 | ) |
2003 | | | 1.00 | | | 0.01085 | | | | 0.00004 | | | | 0.01089 | | | (0.01089 | ) | | | — | |
2002 | | | 1.00 | | | 0.02451 | | | | (0.00002 | ) | | | 0.02449 | | | (0.02449 | ) | | | — | |
| * | Commencement of Operations. |
| (1) | Expense ratios before waiver of fees and reimbursement of expenses (if any) by adviser and administrator. |
| (2) | For comparative purposes per share amounts are based on average shares outstanding. |
See Notes to Financial Statements.
22
| | | | | | | | | | | | | | | | | | | | |
Total
Distributions
| | | Net Asset
Value,
End of
Year
| | Total
Return
| | | Net Assets,
End of
Year
(000’s)
| | Ratio of Net
Operating
Expenses to Average Net Assets
| | | Ratio of Gross
Operating
Expenses to
Average Net Assets (1)
| | | Ratio of Net
Investment
Income to Average
Net Assets
| |
| | | | | | | | | | | | | | | | | | | | | |
| | | | | | | | | | | | | | | | | | | | | |
| | | | | | | | | | | | | | | | | | | | | |
| $ | (0.03176 | ) | | $ | 1.00 | | 3.22 | % | | $ | 410,228 | | 0.53 | % | | 0.69 | % | | 3.15 | % |
| | (0.01253 | ) | | | 1.00 | | 1.26 | % | | | 496,027 | | 0.46 | % | | 0.71 | % | | 1.25 | % |
| | (0.00625 | ) | | | 1.00 | | 0.63 | % | | | 544,721 | | 0.45 | % | | 0.54 | % | | 0.62 | % |
| | (0.01160 | ) | | | 1.00 | | 1.17 | % | | | 594,496 | | 0.39 | % | | 0.47 | % | | 1.21 | % |
| | (0.02623 | ) | | | 1.00 | | 2.65 | % | | | 795,287 | | 0.43 | % | | 0.49 | % | | 2.72 | % |
| | | | | | | | | | | | | | | | | | | | | |
| | | | | | | | | | | | | | | | | | | | | |
| | | | | | | | | | | | | | | | | | | | | |
| $ | (0.03222 | ) | | $ | 1.00 | | 3.27 | % | | $ | 1,032,384 | | 0.53 | % | | 0.69 | % | | 3.21 | % |
| | (0.01285 | ) | | | 1.00 | | 1.29 | % | | | 1,105,053 | | 0.46 | % | | 0.70 | % | | 1.28 | % |
| | (0.00662 | ) | | | 1.00 | | 0.66 | % | | | 1,141,562 | | 0.45 | % | | 0.73 | % | | 0.67 | % |
| | (0.01245 | ) | | | 1.00 | | 1.25 | % | | | 1,787,852 | | 0.39 | % | | 0.43 | % | | 1.25 | % |
| | (0.02751 | ) | | | 1.00 | | 2.79 | % | | | 1,802,136 | | 0.44 | % | | 0.74 | % | | 2.76 | % |
| | | | | | | | | | | | | | | | | | | | | |
| | | | | | | | | | | | | | | | | | | | | |
| | | | | | | | | | | | | | | | | | | | | |
| $ | (0.02138 | ) | | $ | 1.00 | | 2.16 | % | | $ | 447,865 | | 0.60 | % | | 0.94 | % | | 2.15 | % |
| | (0.00845 | ) | | | 1.00 | | 0.85 | % | | | 409,252 | | 0.55 | % | | 0.97 | % | | 0.82 | % |
| | (0.00497 | ) | | | 1.00 | | 0.50 | % | | | 490,099 | | 0.50 | % | | 0.75 | % | | 0.49 | % |
| | (0.00877 | ) | | | 1.00 | | 0.88 | % | | | 548,574 | | 0.44 | % | | 0.49 | % | | 0.89 | % |
| | (0.01769 | ) | | | 1.00 | | 1.78 | % | | | 696,093 | | 0.48 | % | | 0.71 | % | | 1.76 | % |
| | | | | | | | | | | | | | | | | | | | | |
| | | | | | | | | | | | | | | | | | | | | |
| | | | | | | | | | | | | | | | | | | | | |
| $ | (0.02229 | ) | | $ | 1.00 | | 2.25 | % | | $ | 2,162,173 | | 0.53 | % | | 0.68 | % | | 2.23 | % |
| | (0.00966 | ) | | | 1.00 | | 0.97 | % | | | 2,037,802 | | 0.46 | % | | 0.69 | % | | 0.97 | % |
| | (0.00575 | ) | | | 1.00 | | 0.58 | % | | | 2,044,676 | | 0.44 | % | | 0.58 | % | | 0.56 | % |
| | (0.00965 | ) | | | 1.00 | | 0.97 | % | | | 2,281,263 | | 0.39 | % | | 0.54 | % | | 0.97 | % |
| | (0.01875 | ) | | | 1.00 | | 1.89 | % | | | 2,522,455 | | 0.44 | % | | 0.58 | % | | 1.85 | % |
| | | | | | | | | | | | | | | | | | | | | |
| | | | | | | | | | | | | | | | | | | | | |
| | | | | | | | | | | | | | | | | | | | | |
| $ | (0.02891 | ) | | $ | 1.00 | | 2.93 | % | | $ | 365,688 | | 0.58 | % | | 0.74 | % | | 2.86 | % |
| | (0.01019 | ) | | | 1.00 | | 1.02 | % | | | 428,008 | | 0.55 | % | | 0.75 | % | | 0.99 | % |
| | (0.00486 | ) | | | 1.00 | | 0.49 | % | | | 519,722 | | 0.50 | % | | 0.57 | % | | 0.49 | % |
| | (0.01089 | ) | | | 1.00 | | 1.09 | % | | | 571,998 | | 0.45 | % | | 0.53 | % | | 1.08 | % |
| | (0.02449 | ) | | | 1.00 | | 2.48 | % | | | 604,281 | | 0.48 | % | | 0.54 | % | | 2.42 | % |
See Notes to Financial Statements.
23
EXCELSIOR FUNDS
NOTES TO FINANCIAL STATEMENTS
1. Significant Accounting Policies:
Excelsior Funds, Inc. (“Excelsior Fund”) and Excelsior Tax-Exempt Funds, Inc. (“Excelsior Tax-Exempt Fund”) were incorporated under the laws of the State of Maryland on August 2, 1984 and August 8, 1984, respectively, and are registered under the Investment Company Act of 1940, as amended (the “1940 Act”), as open-ended diversified management investment companies with the exception of Energy and Natural Resources Fund, Real Estate Fund, California Short-Intermediate Term Tax-Exempt Income Fund (formerly California Tax-Exempt Income Fund), New York Intermediate-Term Tax-Exempt Fund and New York Tax-Exempt Money Fund, each of which are non-diversified.
Excelsior Fund and Excelsior Tax-Exempt Fund currently offer shares in fifteen and seven managed investment portfolios, respectively, each having its own investment objectives and policies. The following is a summary of significant accounting policies for Government Money Fund, Money Fund and Treasury Money Fund, portfolios of Excelsior Fund, and for New York Tax-Exempt Money Fund and Tax-Exempt Money Fund, portfolios of Excelsior Tax-Exempt Fund (each a “Fund”, collectively, the “Funds”). Such policies are in conformity with accounting principles generally accepted in the United States of America and are consistently followed by the Funds in the preparation of their financial statements. The preparation of financial statements requires management to make estimates and assumptions that affect the reported amounts and disclosures in the financial statements. Actual results could differ from these estimates.
All Funds except for Money Fund offer one class of shares: Shares. The Money Fund offers two classes of shares: Shares and Institutional Shares. The financial highlights of the Institutional Shares as well as the financial statements for the remaining portfolios of Excelsior Fund and Excelsior Tax-Exempt Fund are presented separately.
It is each Fund’s policy, to the extent possible, to maintain a continuous net asset value per share of $1.00. Each Fund has adopted certain investment portfolio valuation and dividend distribution policies to enable it to do so. However, there can be no assurance that the net asset value per share of the Fund will not vary.
(a) Portfolio valuation:
Securities are valued at amortized cost, which has been determined by each Fund’s Board of Directors to represent the fair value of the Funds’ investments. Amortized cost valuation involves valuing an instrument at its cost initially and, thereafter, assuming a constant amortization to maturity of any discount or premium.
(b) Security transactions and investment income:
Security transactions are recorded on a trade date basis. Realized gains and losses on investments sold are recorded on the basis of identified cost. Interest income, adjusted for amortization of premiums and, when appropriate, discounts on investments, is earned from settlement date and is recorded on the accrual basis.
24
(c) Repurchase agreements:
The Funds may purchase portfolio securities from financial institutions deemed to be creditworthy by the investment adviser subject to the seller’s agreement to repurchase and the Funds’ agreement to resell such securities at mutually agreed upon prices. Securities purchased subject to such repurchase agreements are deposited with the Funds’ custodian or sub-custodian or are maintained in the Federal Reserve/Treasury book-entry system and must have, at all times, an aggregate market value not less than the repurchase price (including accrued interest).
Default or bankruptcy of the seller may, however, expose the applicable Fund to possible delay in connection with the disposition of the underlying securities or loss to the extent that proceeds from a sale of the underlying securities were less than the repurchase price under the agreement.
(d) Distributions to shareholders:
Dividends from net investment income are declared daily and paid monthly. Net realized capital gains, unless offset by any available capital loss carryforward, are distributed to shareholders annually or more frequently to maintain a net asset value of $1.00 per share.
(e) Expense allocation:
Expenses directly attributable to a Fund are charged to that Fund. Other expenses are allocated to the respective Funds based on average daily net assets. Expenses attributable to a specific class of shares, such as shareholder servicing fees, are charged directly to that class.
2. Investment Advisory Fee, Administration Fee, Shareholder Servicing Fees and Related Party
Transactions:
Prior to December 16, 2005, the Funds were advised jointly by United States Trust Company of New York and U.S. Trust Company, N.A., through their respective separate identifiable divisions. Effective December 16, 2005, U.S. Trust Company, N.A.’s separately identifiable division was reorganized into a separate corporate entity named UST Advisers, Inc., a Delaware corporation that is a wholly-owned subsidiary of U.S. Trust Company, N.A. and the Funds were advised by either UST Advisers, Inc. or U.S. Trust New York Asset Management Division (“NYAMD”), the separately identifiable division of United States Trust Company of New York.
Effective March 31, 2006, United States Trust Company of New York converted to a national charter and changed its name to United States Trust Company, National Association (“USTC-NA”) and merged with U.S. Trust Company, N.A., with USTC-NA as the surviving entity. As of March 31, 2006, the Funds are advised by NYAMD, a separate identifiable division of USTC-NA, or UST Advisers, Inc. (together with NYAMD, the “Advisers”), a wholly-owned subsidiary of USTC-NA. USTC-NA is a wholly-owned subsidiary of US Trust Corporation, a registered bank holding company, which, in turn, is a wholly-owned subsidiary of The Charles Schwab Corporation. For the services provided pursuant to the Investment Advisory Agreements, each Adviser receives a fee, computed daily and paid monthly, as follows:
| | | |
Government Money Fund | | 0.25 | % |
Money Fund | | 0.25 | % |
New York Tax-Exempt Money Fund | | 0.50 | % |
Tax-Exempt Money Fund | | 0.25 | % |
Treasury Money Fund | | 0.30 | % |
25
UST Advisers, Inc. and BISYS Fund Services Ohio, Inc. (collectively, the “Administrators”) provide administrative services to the Funds. For the services provided to the Funds, the Administrators are entitled jointly to annual fees, computed daily and paid monthly, based on the combined aggregate average daily net assets of Excelsior Fund, Excelsior Tax-Exempt Fund and Excelsior Funds Trust (excluding the international equity portfolios of Excelsior Fund and Excelsior Funds Trust), all of which are affiliated investment companies, as follows: 0.200% of the first $200 million, 0.175% of the next $200 million and 0.150% over $400 million. The Administrators are entitled jointly to annual fees, computed daily and paid monthly, at the annual rate of 0.20% of the average daily net assets of the Emerging Markets Fund, International Equity Fund, International Fund and Pacific/Asia Fund. Administration fees payable by each Fund of the Excelsior Fund, Excelsior Tax-Exempt Fund and Excelsior Funds Trust are determined in proportion to the relative average daily net assets of the respective Funds for the period paid. For the year ended March 31, 2006, administration fees charged to the Funds were as follows:
| | | |
| | | Administration
Fees
|
Government Money Fund | | $ | 686,450 |
Money Fund | | | 2,379,752 |
New York Tax-Exempt Money Fund | | | 638,281 |
Tax-Exempt Money Fund | | | 3,218,552 |
Treasury Money Fund | | | 558,168 |
From time to time, in its sole discretion, each Adviser may undertake to waive a portion or all of the fees payable to it and may also reimburse the Funds for a portion of other expenses. For the four months ended July 31, 2005 and the eight months ended March 31, 2006, the Advisers have contractually agreed to waive investment advisory fees and to reimburse other ordinary operating expenses to the extent necessary to keep total operating expenses from exceeding the following annual percentages of each Fund’s average daily net assets:
| | | | | | |
| | | Four Months
Ended
July 31, 2005
| | | Eight Months
Ended
March 31,
2006
| |
Government Money Fund | | 0.50 | % | | 0.55 | % |
Money Fund | | 0.50 | % | | 0.55 | % |
New York Tax-Exempt Money Fund | | 0.60 | % | | 0.60 | % |
Tax-Exempt Money Fund | | 0.50 | % | | 0.55 | % |
Treasury Money Fund | | 0.55 | % | | 0.60 | % |
Money Fund-Institutional Shares | | 0.25 | % | | 0.30 | % |
For the year ended March 31, 2006, pursuant to the above, investment advisory fees waived by the Advisers were as follows:
| | | | |
Government Money Fund | | $ | (724,624 | ) |
Money Fund | | | (2,481,701 | ) |
New York Tax-Exempt Money Fund | | | (1,454,850 | ) |
Tax-Exempt Money Fund | | | (3,143,406 | ) |
Treasury Money Fund | | | (595,431 | ) |
26
The Funds have entered into shareholder servicing agreements with various service organizations, which include Charles Schwab & Co. Inc. (“CS & Co.”) and UST Advisers, Inc. Services included in the servicing agreements are assisting in processing purchase, exchange and redemption requests; transmitting and receiving funds in connection with customer orders to purchase, exchange or redeem shares; and providing periodic statements. Shareholder servicing fees are incurred on a Fund or class level (where applicable). In consideration for these services, each service organization receives a fee from the Funds, computed daily and paid monthly, at an annual rate up to 0.25% of the average daily net assets of the Funds’ shares held by each service organization’s customers, with the exception of the Institutional Shares of the Money Fund, which pays a fee of up to 0.15% of the average daily net assets of its shares. The Advisers, out of their own resources, may additionally compensate certain organizations for providing these and other services.
For the year ended March 31, 2006, shareholder servicing fees paid to CS & Co. and the Advisers were as follows:
| | | |
Government Money Fund | | $ | 1,232,461 |
Money Fund | | | 2,736,566 |
New York Tax-Exempt Money Fund | | | 1,107,384 |
Tax-Exempt Money Fund | | | 5,747,190 |
Treasury Money Fund | | | 986,793 |
BISYS Fund Services Limited Partnership (the “Distributor”) serves as the Distributor of the Funds. Shares of each Fund are sold without a sales charge on a continuous basis by the Distributor.
Each Independent Director of the Funds receives a total annual fee of $100,000 paid by the Funds and other affiliated registered investment companies managed by the Advisers. The Chairman of the Board receives an additional $30,000, the Chairman of the Audit Committee receives an additional $15,000, and the Chairman of the Nominating Committee receives an additional $5,000 for serving in those capacities. In addition, Directors are reimbursed by the Excelsior Fund and Excelsior Tax-Exempt Fund for reasonable expenses incurred when acting in their capacity as Directors.
3. Federal Taxes:
It is the policy of the Excelsior Fund and Excelsior Tax-Exempt Fund that each Fund qualify or continue to qualify as a regulated investment company, by complying with the requirements of the Internal Revenue Code applicable to regulated investment companies and by distributing substantially all of its taxable earnings to its shareholders.
In order to avoid a federal excise tax, each Fund is required to distribute certain minimum amounts of net realized capital gain and net investment income for the respective twelve-month periods ending October 31 and December 31 each calendar year.
Dividends and distributions are determined in accordance with federal income tax regulations and may differ from accounting principles generally accepted in the United States of America. These differences are primarily due to differing treatments for deferral of losses on wash sales and net capital losses incurred after October 31 and within the taxable year (“Post-October losses”). To the extent these
27
differences are permanent, adjustments are made to the appropriate equity accounts in the period that these differences arise. Accordingly, the following reclassifications have been made to/from the following accounts:
| | | | | | | | | | | |
| | | Undistributed
Net Investment
Income
| | Accumulated
Net Realized
Gain (Loss)
| | | Paid-In-Capital
| |
Government Money Fund | | | — | | $ | 4,692 | | | $ | (4,692 | ) |
Money Fund | | | — | | | — | | | | — | |
New York Tax-Exempt Money Fund | | $ | 7,841 | | | (7,841 | ) | | | — | |
Tax-Exempt Money Fund | | | — | | | — | | | | — | |
Treasury Money Fund | | | 4,252 | | | (4,252 | ) | | | — | |
The tax character of dividends and distributions declared during the years ended March 31, 2006 and March 31, 2005 were as follows:
| | | | | | | | | | | | |
| | | Ordinary
Income
| | Tax-Exempt
Income
| | Long-Term
Capital Gain
| | Total
|
Government Money Fund | | | | | | | | | | | | |
Year ended March 31, 2006 | | $ | 13,620,350 | | | — | | | — | | $ | 13,620,350 |
Year ended March 31, 2005 | | | 5,884,680 | | | — | | | — | | | 5,884,680 |
Money Fund | | | | | | | | | | | | |
Year ended March 31, 2006 | | | 49,048,464 | | | — | | | — | | | 49,048,464 |
Year ended March 31, 2005 | | | 19,959,001 | | | — | | | — | | | 19,959,001 |
New York Tax-Exempt Money Fund | | | | | | | | | | | | |
Year ended March 31, 2006 | | | 3,001 | | $ | 8,506,753 | | $ | 4,840 | | | 8,514,594 |
Year ended March 31, 2005 | | | 988 | | | 3,352,703 | | | — | | | 3,353,691 |
Tax-Exempt Money Fund | | | | | | | | | | | | |
Year ended March 31, 2006 | | | 84,887 | | | 45,217,987 | | | 20,970 | | | 45,323,844 |
Year ended March 31, 2005 | | | 28,575 | | | 18,660,028 | | | 7,646 | | | 18,696,249 |
Treasury Money Fund | | | | | | | | | | | | |
Year ended March 31, 2006 | | | 9,920,151 | | | — | | | — | | | 9,920,151 |
Year ended March 31, 2005 | | | 3,943,362 | | | — | | | — | | | 3,943,362 |
28
As of March 31, 2006, the components of distributable earnings (accumulated losses) on a tax basis were as follows:
| | | | | | | | | | | | | | | | | | | | | | | | |
| | | Undistributed
Ordinary
Income
| | Undistributed
Long-Term
Capital Gain
| | Undistributed
Tax-Exempt
Income
| | Accumulated
Earnings
| | Distributions
Payable
| | | Accumulated
Capital and
Other Losses
| | | Total
Accumulated
Earnings/
(Deficit)
| |
Government Money Fund | | $ | 1,552,616 | | | — | | | — | | $ | 1,552,616 | | $ | (1,552,616 | ) | | $ | (27,980 | ) | | $ | (27,980 | ) |
Money Fund | | | 5,955,217 | | | — | | | — | | | 5,955,217 | | | (5,955,217 | ) | | | (40,526 | ) | | | (40,526 | ) |
New York Tax-Exempt Money Fund | | | — | | | — | | $ | 980,009 | | | 980,009 | | | (975,168 | ) | | | — | | | | 4,841 | |
Tax-Exempt Money Fund | | | 63,655 | | $ | 30,394 | | | 4,884,340 | | | 4,978,389 | | | (4,894,160 | ) | | | — | | | | 84,229 | |
Treasury Money Fund | | | 1,142,032 | | | — | | | — | | | 1,142,032 | | | (1,141,474 | ) | | | — | | | | 558 | |
Post-October losses are deemed to arise on the first business day of a Fund’s next taxable year.
For federal income tax purposes, capital loss carryforwards may be carried forward and applied against future capital gains. To the extent that such carryforwards are utilized, capital gains distributions will be reduced. At March 31, 2006, the following Funds had capital loss carryforwards available to offset future net capital gains through the indicated expiration dates.
| | | | | | | | | | | | | | | | | | |
| | | Expires
|
| | | 2007
| | 2008
| | 2011
| | 2012
| | 2014
| | Total
|
Government Money Fund | | $ | 3,297 | | $ | 18,903 | | | — | | $ | 5,556 | | $ | 224 | | $ | 27,980 |
Money Fund | | | — | | | — | | $ | 11,662 | | | 23,975 | | | 4,889 | | | 40,526 |
4. Capital Transactions:
Excelsior Fund has authorized capital of 35 billion shares of Common Stock, 29.3756 billion of which is currently classified to represent interests in certain classes of shares. Excelsior Tax-Exempt Fund has authorized capital of 24 billion shares of Common Stock, 15 billion of which is currently classified to represent interests in certain classes of shares. Authorized capital currently classified for each Fund is as follows: 4 billion shares each of the Government Money Fund and Money Fund, 2.5 billion shares of Treasury Money Fund, 2 billion shares of New York Tax-Exempt Money Fund and 5.5 billion shares for Tax-Exempt Money Fund.
Each share has a par value of $0.001 and represents an equal proportionate interest in the particular Fund with other shares of the same Fund, and is entitled to such dividends and distributions of taxable earnings on the assets belonging to such Fund as are declared at the discretion of each Fund’s Board of Directors. Since the Funds have sold, reinvested and redeemed shares only at a constant net asset value of $1.00 per share, the number of shares represented by such sales, reinvestments and redemptions is the same as the amounts shown below for such transactions.
29
| | | | | | | | |
| | | Government Money Fund
| |
| | | Year Ended March 31,
| |
| | | 2006
| | | 2005
| |
Sold | | $ | 2,577,232,059 | | | $ | 2,736,097,238 | |
Issued as reinvestment of dividends | | | 735,293 | | | | 377,287 | |
Redeemed | | | (2,663,765,701 | ) | | | (2,785,171,479 | ) |
| | |
|
|
| |
|
|
|
Net Increase (Decrease) | | $ | (85,798,349 | ) | | $ | (48,696,954 | ) |
| | |
|
|
| |
|
|
|
| | | | | | | | | | | | | | |
| |
| | | Money Fund
| |
| | | Year Ended March 31,
| |
| | | 2006
| | | 2005
| |
| | | Shares
| | | Amount
| | | Shares
| | | Amount
| |
Sold: | | | | | | | | | | | | | | |
Shares | | 3,427,610,450 | | | $ | 3,427,610,450 | | | 3,782,584,603 | | | $ | 3,782,584,603 | |
Institutional Shares | | 4,731,250,373 | | | | 4,731,250,373 | | | 4,191,107,467 | | | | 4,191,107,467 | |
Issued as reinvestment of dividends: | | | | | | | | | | | | | | |
Shares | | 2,259,420 | | | | 2,259,420 | | | 1,188,525 | | | | 1,188,499 | |
Institutional Shares | | 7,428,066 | | | | 7,428,066 | | | 2,099,572 | | | | 2,099,573 | |
Redeemed: | | | | | | | | | | | | | | |
Shares | | (3,502,534,923 | ) | | | (3,502,534,923 | ) | | (3,820,288,035 | ) | | | (3,820,288,036 | ) |
Institutional Shares | | (4,841,213,240 | ) | | | (4,841,213,240 | ) | | (4,038,109,800 | ) | | | (4,038,109,805 | ) |
| | |
|
| |
|
|
| |
|
| |
|
|
|
Net Increase (Decrease) | | (175,199,854 | ) | | $ | (175,199,854 | ) | | 118,582,332 | | | $ | 118,582,301 | |
| | |
|
| |
|
|
| |
|
| |
|
|
|
| | | | | | | | |
| |
| | | New York Tax-Exempt Money Fund
| |
| | | Year Ended March 31,
| |
| | | 2006
| | | 2005
| |
Sold | | $ | 2,399,705,970 | | | $ | 1,870,092,958 | |
Issued as reinvestment of dividends | | | 1,554,586 | | | | 460,208 | |
Redeemed | | | (2,362,651,304 | ) | | | (1,951,401,831 | ) |
| | |
|
|
| |
|
|
|
Net Increase (Decrease) | | $ | 38,609,252 | | | $ | (80,848,665 | ) |
| | |
|
|
| |
|
|
|
| |
| | | Tax-Exempt Money Fund
| |
| | | Year Ended March 31,
| |
| | | 2006
| | | 2005
| |
Sold | | $ | 10,547,799,881 | | | $ | 8,993,982,009 | |
Issued as reinvestment of dividends | | | 2,207,894 | | | | 573,372 | |
Redeemed | | | (10,425,694,762 | ) | | | (9,001,457,475 | ) |
| | |
|
|
| |
|
|
|
Net Increase (Decrease) | | $ | 124,313,013 | | | $ | (6,902,094 | ) |
| | |
|
|
| |
|
|
|
| |
| | | Treasury Money Fund
| |
| | | Year Ended March 31,
| |
| | | 2006
| | | 2005
| |
Sold | | $ | 3,260,733,468 | | | $ | 3,255,632,599 | |
Issued as reinvestment of dividends | | | 2,191,117 | | | | 968,644 | |
Redeemed | | | (3,325,243,094 | ) | | | (3,348,314,283 | ) |
| | |
|
|
| |
|
|
|
Net Increase (Decrease) | | $ | (62,318,509 | ) | | $ | (91,713,040 | ) |
| | |
|
|
| |
|
|
|
30
5. Guarantees:
In the normal course of business, the Funds enter into contracts that provide general indemnifications. The Funds’ maximum exposure under these arrangements is dependent on future claims that may be made against the Funds and, therefore, cannot be established; however, based on experience, the risk of loss from such claims is considered remote.
6. Legal Proceedings:
The Adviser and Excelsior Funds, Inc., Excelsior Tax-Exempt Funds, Inc., and Excelsior Funds Trust (the “Companies”) were contacted in September, 2003 by the Office of the New York State Attorney General (the “NYAG”), and the Adviser was contacted by the Securities and Exchange Commission (the “SEC”) and later by the Attorney General of the State of West Virginia, in connection with their investigations of practices in the mutual fund industry identified as “market timing” and “late trading” of mutual fund shares (the “Investigations”). The Adviser and the Companies have provided full cooperation with respect to these Investigations and continue to review the facts and circumstances relevant to the Investigations. As disclosed previously by the Adviser and its affiliates, with respect to the Adviser, these investigations have been focusing on circumstances in which a small number of parties were permitted to engage in short-term trading of shares of certain of the Excelsior Funds. The short-term trading activities permitted under these arrangements have been terminated and the Adviser has strengthened its policies and procedures to deter frequent trading of shares of the Excelsior Funds.
The Adviser, certain of its affiliates, the Companies and others have also been named in several class action and derivative lawsuits which allege that the Adviser, certain of its affiliates, the Companies and others allowed certain parties to engage in illegal and improper mutual fund trading practices, which allegedly caused financial injury to the shareholders of certain of the Excelsior Funds managed by the Adviser. Each seeks unspecified monetary damages and related equitable relief.
The class and derivative actions described above have been transferred to the United States District Court for the District of Maryland for coordinated and consolidated pre-trial proceedings. In November 2005, the Maryland court dismissed many of the plaintiffs’ claims in both the investor class action and the derivative lawsuits. Plaintiffs’ claims under Sections 10(b) and 20(a) of the Securities Exchange Act and under Section 36(b) and 48(a) of the Investment Company Act, however, have not been dismissed. Discovery has commenced with respect to plaintiffs’ remaining claims.
While the ultimate outcome of these matters cannot be predicted with any certainty at this time, based on currently available information and consultation with counsel, the Adviser believes that the resolution of the pending Investigations and private lawsuits will not have a material adverse financial impact on the Companies, and further believes that the pending Investigations and private lawsuits are not likely to materially affect the Adviser’s ability to provide investment management services to the Companies.
31
REPORT OF INDEPENDENT REGISTERED PUBLIC ACCOUNTING FIRM
To the Board of Directors and Shareholders of
Excelsior Funds, Inc. and Excelsior Tax-Exempt Funds, Inc.
We have audited the accompanying statements of assets and liabilities, including the portfolios of investments, of the Money Fund, Government Money Fund, Treasury Money Fund, Tax-Exempt Money Fund, and New York Tax-Exempt Money Fund (three of the portfolios constituting the Excelsior Funds, Inc. and two of the portfolios constituting the Excelsior Tax-Exempt Funds, Inc.) (collectively, the “Funds”) as of March 31, 2006, and the related statements of operations for the year then ended, the statements of changes in net assets for each of the two years in the period then ended, and the financial highlights (Shares) for each of the three years in the period then ended. These financial statements and financial highlights are the responsibility of the Funds’ management. Our responsibility is to express an opinion on these financial statements and financial highlights based on our audits. The financial highlights for each of the years in the two year period ended March 31, 2003 were audited by other auditors whose reports dated May 16, 2003, expressed an unqualified opinion on those financial highlights.
We conducted our audits in accordance with the standards of the Public Company Accounting Oversight Board (United States). Those standards require that we plan and perform the audit to obtain reasonable assurance about whether the financial statements and financial highlights are free of material misstatement. The Funds are not required to have, nor were we engaged to perform, an audit of their internal control over financial reporting. Our audits included consideration of internal control over financial reporting as a basis for designing audit procedures that are appropriate in the circumstances, but not for the purpose of expressing an opinion on the effectiveness of the Funds’ internal control over financial reporting. Accordingly, we express no such opinion. An audit also includes examining, on a test basis, evidence supporting the amounts and disclosures in the financial statements, assessing the accounting principles used and significant estimates made by management, as well as evaluating the overall financial statement presentation. Our procedures included confirmation of securities owned as of March 31, 2006, by correspondence with the custodian and brokers; where replies were not received from brokers, we performed other auditing procedures. We believe that our audits provide a reasonable basis for our opinion.
In our opinion, the financial statements and financial highlights referred to above present fairly, in all material respects, the financial position of Money Fund, Government Money Fund, Treasury Money Fund, Tax-Exempt Money Fund, and New York Tax-Exempt Money Fund as of March 31, 2006, the results of their operations for the year then ended, the changes in their net assets for each of the two years in the period then ended, and the financial highlights for each of the three years in the period then ended, in conformity with accounting principles generally accepted in the United States of America.
DELOITTE & TOUCHE LLP
New York, New York
May 22, 2006
32
Directors/Trustees and Officers of the Excelsior Funds Complex (Unaudited)
Information pertaining to the Directors/Trustees and Officers of Excelsior Fund, Excelsior Tax-Exempt Fund and Excelsior Funds Trust (each a “Company” and collectively, the “Excelsior Funds Complex”) is set forth below. Directors/Trustees who are not deemed to be “interested persons” of the Excelsior Funds Complex as defined in the 1940 Act are referred to as “Independent Board Members.” Directors/Trustees who are deemed to be “interested persons” of the Excelsior Funds Complex are referred to as “Interested Board Members”. The following information is as of May 20, 2006.
On February 24, 2006, the Boards of Directors/Trustees (the “Boards”) of the Companies approved an increase in the size of the Boards to ten (10) directors/trustees (together, the “Directors”) and approved the nomination of Mariann Byerwalter, Nils Hakansson, William A. Hasler and Randall W. Merk (the “Candidates”) as Directors of the Companies, subject to shareholder approval at an upcoming Special Meeting of Shareholders of the Companies (the “Meeting”). Each of the Candidates is currently a director/trustee of the Laudus Funds, the Laudus Variable Insurance Trust (together, the “Laudus Funds”) and of other funds included in the Schwab mutual fund complex for which Charles Schwab Investment Management acts as investment adviser (together, the “Fund Complex”). The Companies are in the same Fund Complex as the Laudus Funds. If approved by Shareholders at the Meeting, Ms. Byerwalter and Messrs. Hakansson and Hasler would become disinterested persons of the Companies under the Investment Company Act of 1940, as amended. Mr. Merk would become an interested person of the Companies.
The Boards also approved the nominations of six existing Directors to be submitted to shareholders for approval at the Meeting: Messrs. Bailey, Collins, Drake, Hall, Lynch and Piel (the “Existing Directors” and, together with the Candidates, the “Nominees”). Frederick S. Wonham, a current Director of the Companies and Chairman of the Board of each Company, has notified the Boards that he intends to resign from the Boards, consistent with the Companies’ retirement age policy, effective as of the date of the Meeting. The Boards have elected Rodman Drake, currently a Director of the Companies and Chairman of their Joint Audit Committee, as the Chairman of the Boards of the Companies effective upon Mr. Wonham’s resignation.
The Boards have proposed to increase the size of each Board from seven to ten so that a single group of Directors (i.e., a unitary board) can oversee each of the Companies and the Laudus Funds. At a meeting held on March 16, 2006, the Laudus Funds’ Boards approved the nominations of the Existing Directors for election to the Laudus Funds’ Boards, subject to approval by shareholders of each of the Laudus Funds. Each of the Candidates has notified the Boards that, even if approved by the Companies’ shareholders at the Meeting, the Candidates will not serve as members of the Boards unless the shareholders of each of the Companies and the Laudus Funds approve the election of each of the other Nominees. Similarly, each of the existing Directors has informed the Laudus Funds Boards that, even if approved by shareholders of the Laudus Funds at their shareholders meeting, the Existing Directors will not serve as members of the Laudus Funds Boards unless the shareholders of each of the Companies and the Laudus Funds approve the election of each of the other Nominees.
33
| | | | | | |
Name and Address(1) Age Time Served with the Excelsior Funds Complex
| | Principal Occupation
During the Past Five Years
| | Number of
Portfolios in Fund Complex Overseen by Director/Trustee(3)
| | Other Directorships Held by Director/Trustee(4)
|
DIRECTORS/TRUSTEES(2) INDEPENDENT BOARD MEMBERS | | | | |
Frederick S. Wonham
Age: 75
Since 1997 | | Retired. Chairman of the Boards and Director (since 1997) and President and Treasurer (from 1995 to February 2002) of Excelsior Funds, Inc. and Excelsior Tax-Exempt Funds, Inc.; Chairman of the Board and Trustee (since 1997) and President and Treasurer (from 1995 to February 2002) of Excelsior Funds Trust. | | 29 | | None. |
| | | |
Rodman L. Drake
Age: 63
Since 1994 | | Director and Chairman of Audit Committee of Excelsior Funds, Inc. and Excelsior Tax-Exempt Funds, Inc. (since 1996); Trustee of Excelsior Funds Trust (since 1994); Co-Founder of Baringo Capital LLC (since 2002); President, Continuation Investments Group, Inc. (from 1997 to 2001). | | 29 | | Director and Chairman, Hyperion Total Return Fund, Inc., and Hyperion Strategic Mortgage Fund Inc. (since 1991); Director, Jackson Hewitt Tax Services, Inc. (since June 2004); Director, Student Loan Corporation (since May 2005). |
| | | |
Morrill Melton ("Mel") Hall, Jr.
Age: 61
Since 2000 | | Director of Excelsior Funds, Inc. and Excelsior Tax-Exempt Funds, Inc. (since 2000); Trustee of Excelsior Funds Trust (since 2000); Chairman (since 1984) and Chief Executive Officer (since 1991), Comprehensive Health Services, Inc. (health care management and administration). | | 29 | | None. |
| | | |
Roger M. Lynch
Age: 64
Since 2001 | | Retired. Director of Excelsior Funds, Inc. and Excelsior Tax- Exempt Funds, Inc. and Trustee of Excelsior Funds Trust (since 2001); President, Corporate Asset Funding Co., Inc. (asset securitization) (from 1987 to 1999); Limited Partner (from 1986 to 1999), Goldman Sachs & Co. | | 29 | | None. |
| | | |
Jonathan Piel
Age: 67
Since 1994 | | Director and Chairman of Nominating Committee Excelsior Funds, Inc. and Excelsior Tax-Exempt Funds, Inc. (since 1996); Trustee, Excelsior Funds Trust (since 1994); Cable Television producer and website designer. The Editor Scientific American (from 1984 to 1986), and Vice President, Scientific American, Inc. (from 1986 to 1994); Director, National Institute of Social Sciences; member, Advisory Board, The Stone Age Institute, Bloomington Indiana. | | 29 | | None. |
34
| | | | | | |
Name and Address(1) Age Time Served with the Excelsior Funds Complex
| | Principal Occupation
During the Past Five Years
| | Number of
Portfolios in Fund Complex Overseen by Director/Trustee(3)
| | Other Directorships Held by Director/Trustee(4)
|
John. D. Collins
Age: 67
Since 2005 | | Retired. Director, Excelsior Funds, Inc. and Excelsior Tax-Exempt Funds, Inc. (since 2005); Trustee, Excelsior Funds Trust (since 2005). Consultant, KPMG, LLP (from July 1999 to June 2000); Partner, KPMG, LLP (from March 1962 to June 1999). | | 29 | | Director, Mrs. Fields’ Famous Brands LLC (consumer products) (since December 2004). |
| INTERESTED BOARD MEMBER(5) | | | | |
James L. Bailey
114 West 47th Street
New York, NY 10036
Age: 60
Since 2004 | | Chief Operating Officer of U.S. Trust Corporation (since December 2004) and Executive Vice President of U.S. Trust Corporation and United States Trust Company of New York (since 2003); President, Excelsior Funds, Inc., Excelsior Tax-Exempt Funds, Inc. and Excelsior Funds Trust (from 2003 to July 2004); Consultant in the financial services industry (from August 2000 to January 2003); Executive Vice President of Citicorp (from 1992 to August 2000). | | 29 | | None. |
| OFFICERS | | | | | | |
Joseph Trainor, CFA
Age: 44
114 West 47th Street
New York, NY 10036 | | Managing Director of United States Trust Company of New York (since 2003) and President, U.S. Trust Institutional; President of MFS Institutional Advisors (from 1998 to 2002). | | N/A | | N/A |
| | | |
George Pereira
Age: 42
101 Montgomery St.
San Francisco, CA 94104 | | Senior Vice President and Chief Financial Officer, Charles Schwab Investment Management, Inc.; Director, Charles Schwab Asset Management (Ireland) Limited. From December 1999 to November 2004, Sr. Vice President, Financial Reporting. Charles Schwab & Co., Inc. From September 1999 to December 1999, Chief Financial Officer, Commerzbank Capital Markets. Prior to September 1999, Managing Director at the New York Stock Exchange. | | N/A | | N/A |
| | | |
Stefanie A. Firtell
Age: 32
114 West 47th Street
New York, NY 10036 | | Vice President, United States Trust Company of New York (since April 2005); Compliance Officer and Head of Regulatory Responses, Assistant Vice President, Deutsche Asset Management (from 2003 to 2005); Assistant Corporate Secretary, Triare Companies, Inc. (from 2002 to 2003); Attorney, Paul, Weiss, Rifkind, Wharton & Garrison (from 2001 to 2002); and Attorney, Cadwalder Wickersham & Taft (from 2000 to 2001). | | N/A | | N/A |
35
| | | | | | |
Name and Address(1) Age Time Served with the Excelsior Funds Complex
| | Principal Occupation
During the Past Five Years
| | Number of
Portfolios in Fund Complex Overseen by Director/Trustee(3)
| | Other Directorships Held by Director/Trustee(4)
|
Wyndham Clark
Age: 47
225 High Ridge Road
Stamford, CT 06905 | | Vice President and AML Officer, U.S. Trust Company, N.A. (since 2003); Vice President and Deputy Director Risk Management. IBJ Whitehall (banking) (from 2001 to 2002); and Vice President and Chief Risk Officer, EMAC, LLC (commercial lender, asset backed security issuer) (from 1999 to 2001). | | N/A | | N/A |
| | | |
Petros (Peter) L. Tsirigotis
Age: 37
114 West 47th Street
New York, NY 10036 | | Senior Vice President and Assistant General Counsel, U.S. Trust (since September 2005); Vice President and Corporate Counsel, Prudential Financial (September 2004 to September 2005); Associate, Schulte Roth and Zabel LLP (November 2002 to September 2004) and Dechert LLP (August 2000 to November 2002). Prior to August 2000, Mr. Tsirigotis was an Attorney/Advisor (Division of Investment Management) and Financial Economist (Office of Economic Analysis) with the Securities and Exchange Commission in Washington, D.C. | | N/A | | N/A |
| (1) | Each independent director/trustee may be contacted by writing to Excelsior Funds, 225 High Ridge Road, Stamford, CT 06905. |
| (2) | Each director/trustee shall hold office until the election and qualification of his or her successor, or until he or she sooner dies, resigns or is removed. The officers of each Company shall hold office for a one year term and until their respective successors are chosen and qualified, or in each case until he or she sooner dies, resigns, is removed, or becomes disqualified in accordance with each Company’s by-laws. |
| (3) | The Excelsior Funds Complex consists of all registered investment companies (Excelsior Funds Inc., Excelsior Tax-Exempt Funds, Inc. and Excelsior Funds Trust) for which U.S. Trust serves as investment adviser. As of May 20, 2006, the Excelsior Funds Complex consisted of 29 Funds. |
| (4) | Directorships of companies required to report to the Securities and Exchange Commission under the Securities Exchange Act of 1934 (i.e., “public companies”) or other investment companies registered under the 1940 Act. |
| (5) | “Interested person” of the Company is defined in the 1940 Act. Mr. Bailey is considered an “interested person” because of his affiliation with the Adviser. |
For more information regarding the Directors/Trustees and Officers, please refer to the Statement of Additional Information, which is available upon request by calling 1-800-446-1012.
36
DISCLOSURE OF FUND EXPENSES (Unaudited)
We believe it is important for you to understand the impact of fees regarding your investment. As a shareholder of the fund, you incur ongoing, or operating costs, which include costs for portfolio management, administrative services, and shareholder reports (like this one), among others. Operating expenses, which are deducted from a fund’s gross income, directly reduce the investment return of the fund. A fund’s expenses are expressed as a percentage of its average net assets. This figure is known as the expense ratio. The following examples are intended to help you understand the ongoing costs (in dollars) of investing in your fund and to compare these costs with those of other mutual funds. The examples are based on an investment of $1,000 made at the beginning of the period shown and held for the entire period.
The table on the following page illustrates your fund’s costs in two ways.
| | • | | Actual expenses. This section provides information about actual account values and actual expenses based on the Funds’ actual return for the period. This section is designed to help you to estimate the actual expenses after fee waivers that you paid over the period. The “Ending Account Value” shown is derived from the fund’s actual return, and the fourth column shows the dollar amount that would have been paid by an investor who started with $1,000 in the fund. You may use the information here, together with the amount you invested, to estimate the expenses that you paid over the period. |
To do so, simply divide your account value by $1,000 (for example, an $8,600 account value divided by $1,000=$8.6), then multiply the result by the number given for your fund under the heading “Expenses Paid During Period”.
| | • | | Hypothetical expenses. This section provides information about hypothetical account values and hypothetical expenses that would have been incurred by an investor in the Fund based on an assumed rate of return of 5% per year before expenses. This section is designed to help you compare your fund’s costs with those of other mutual funds. It assumes that the fund had a return of 5% before expenses during the year, but that the expense ratio is unchanged. In this case, because the return used is not the fund’s actual return, the results cannot be used to estimate the actual ending account balance or expenses you paid for the period. You may use this information to compare the ongoing costs of investing in your Fund and other funds. To do so, compare this 5% hypothetical example with the 5% hypothetical examples that appear in shareholder reports of other funds. |
37
DISCLOSURE OF FUND EXPENSES (Unaudited) (Continued)
Please note that the expenses shown in the table are meant to highlight and help you compare ongoing costs only, which are described in the Prospectus. Therefore, the hypothetical example is useful in comparing ongoing costs only, and will not help you determine the relative total costs of owning different funds.
| | | | | | | | | | | | |
| | | Beginning
Account
Value
10/01/2005
| | Ending
Account
Value
03/31/2006
| | Annualized
Expense
Ratios*
| | | Expenses
Paid
During
Period**
|
Actual Fund Return | | | | | | | | | | | | |
Government Money Fund — Shares | | $ | 1,000.00 | | $ | 1,018.40 | | 0.55 | % | | $ | 2.77 |
Money Fund — Shares | | | 1,000.00 | | | 1,018.70 | | 0.55 | | | | 2.77 |
New York Tax-Exempt Money Fund — Shares | | | 1,000.00 | | | 1,011.90 | | 0.60 | | | | 3.01 |
Tax-Exempt Money Fund — Shares | | | 1,000.00 | | | 1,012.30 | | 0.55 | | | | 2.76 |
Treasury Money Fund — Shares | | | 1,000.00 | | | 1,016.90 | | 0.60 | | | | 3.02 |
| | | | |
Hypothetical 5% Return | | | | | | | | | | | | |
Government Money Fund — Shares | | | 1,000.00 | | | 1,022.19 | | 0.55 | | | | 2.77 |
Money Fund — Shares | | | 1,000.00 | | | 1,022.19 | | 0.55 | | | | 2.77 |
New York Tax-Exempt Money Fund — Shares | | | 1,000.00 | | | 1,021.94 | | 0.60 | | | | 3.02 |
Tax-Exempt Money Fund — Shares | | | 1,000.00 | | | 1,022.19 | | 0.55 | | | | 2.77 |
Treasury Money Fund — Shares | | | 1,000.00 | | | 1,021.94 | | 0.60 | | | | 3.02 |
| * | | Annualized expense ratios of certain funds are after fee waivers and expense reimbursements by the investment adviser. Absent such waivers and reimbursements, expenses paid during the period would have been greater. |
| **Expenses | | are equal to the Fund’s annualized expense ratio multiplied by the average account value over the period, multiplied by the number of days in the most recent fiscal half-year (182) then divided by 365. |
38
AR-MM-0306

Institutional Shares
MONEY FUND
CORE BOND FUND
HIGH YIELD FUND
INCOME FUND
TOTAL RETURN BOND FUND
EQUITY CORE FUND
MID CAP VALUEAND RESTRUCTURING FUND
VALUEAND RESTRUCTURING FUND
EMERGING MARKETS FUND
INTERNATIONAL EQUITY FUND
ANNUAL REPORT
March 31, 2006
TABLE OF CONTENTS
This report must be preceded or accompanied by a current prospectus.
A description of the policies and procedures that Excelsior Funds use to determine how to vote proxies relating to portfolio securities, as well as information relating to how a Fund voted proxies relating to portfolio securities during the most recent 12-month period ended June 30, is available (i) without charge, upon request, by calling (800) 881-9358, and (ii) on the Commission’s website at http://www.sec.gov.
Excelsior Funds file their June 30 and December 31 schedule of portfolio holdings with the Securities and Exchange Commission, on Form N-Q, within sixty days after the applicable reporting period. Excelsior Funds Form N-Q is available on the Commission’s website at http://www.sec.gov, and may be reviewed and copied at the Commission’s Public Reference Room in Washington, DC. Information on the operation of the Public Reference Room may be obtained by calling 1-800-SEC-0330.
You should consider the Funds’ investment objectives, risks and expenses carefully before you invest. Information about these and other important subjects is in the Funds’ prospectus, which you should read carefully before investing.
Excelsior Funds Trust and Excelsior Funds, Inc. are distributed by BISYS Fund Services Limited Partnership.
A schedule of each Fund’s portfolio holdings, as of the end of the prior month, is also available on the Funds’ website. This schedule is updated monthly, typically by the 15th calendar day, after the end of each month. The Funds may terminate or modify this policy at anytime.
SHARES OF THE FUNDS ARE NOT DEPOSITS OR OBLIGATIONS OF, OR GUARANTEED OR ENDORSED BY, ANY BANK, AND THE SHARES ARE NOT FEDERALLY INSURED BY THE FEDERAL DEPOSIT INSURANCE CORPORATION, BANK INSURANCE FUND, FEDERAL RESERVE BOARD, OR ANY OTHER GOVERNMENTAL AGENCY. AN INVESTMENT IN A FUND IS SUBJECT TO RISK OF PRINCIPAL.
LETTER TO SHAREHOLDERS
March 31, 2006
Dear Valued Excelsior Fund Shareholder,
I am pleased to bring you the annual report for the year ended March 31, 2006 for the Excelsior Funds. The funds in this report are part of the Excelsior Fund family which had over $18 billion in assets as of the end of the report period and includes a wide array of asset classes and investment strategies designed to meet the individual investor’s needs for performance and tax sensitivity.
By now, you would have received information about changes to the administrative and non-advisory services provided to the Excelsior Funds. As a result, the Excelsior Funds and the Laudus Funds, an affiliated fund family, now share certain complex-wide administrative, compliance, marketing and other functions.
We are pleased with the transition, and remain optimistic that shareholders will approve the board of directors’ recommendation to elect members to jointly oversee the two fund families. It is anticipated that the new unified board will strengthen the oversight provided on behalf of fund shareholders and may result in certain long-term cost and operating efficiencies. All votes are important, so I encourage you to vote your shares as soon as possible if you haven’t already done so.
Given these changes, I want to assure you that the most important aspects of the Excelsior Funds will remain the same. Specifically, the fund management and investment process provided by U.S. Trust, as advisor to the Funds, as well as the funds’ emphasis on enduring performance, will not change.
In closing, we at Excelsior Funds remain committed to helping you reach your long-term investment goals. Thank you for investing with us.
Sincerely,

Evelyn Dilsaver
President
1
We had expected that the financial markets would come into alignment with the financial environment being shaped by the Fed, and that finally came to pass as the fiscal year ending March 31, 2006 drew to a close. The markets improved as uncertainties about the Fed’s intentions, energy costs and Iraq were resolved to a degree—though the latter name was replaced by Iran as a geopolitical issue. Importantly, inflation is contained while growth has moderated to what we believe to be sustainable levels. We think the Fed’s economic shock effect has been temperate on growth overall. While GDP dipped in the fourth quarter of 2005, in response to hurricane after effects, it recovered to a 4.8% rate for the first quarter of 2006. Meanwhile, corporate profits, as reported for the first quarter, were strong indeed. Our confidence that a self-reinforcing expansion is underway continues firm.
Major equity indexes and averages posted new multi-year highs as the fiscal year came to an end. The financial markets reacted well to the Fed’s fifteenth sequential rate increase, to a federal funds rate target of 4.75%. Investors saw moderate economic growth ahead, with the potential for earnings growth, all within a context of well-contained inflation. Stocks, as measured by the Standard & Poor’s 500 Index, began to rally in the middle of the 2005 fourth-quarter, and that rally continued into the first quarter of 2006, making new five-year highs.
We think many of the equity investment themes that worked over the fiscal year should continue to prove successful. Overall, our themes are: (1) pricing power, (2) globalization, (3) secular reflation, (4) M&A, and (5) business versus the domestic consumer. In equities, we favor large-cap stocks over small caps, since small caps have had a long run that we believe is nearing an end. Our preference is for growth over value, when it comes to investment style—since we expect investors will target stable earnings growth, along with companies able to raise dividends and/or buyback shares. In sectors, we see housing slowing, and we continue to think the old economy, meaning industrials and commodity raw materials, especially metals, should outpace consumer sectors. We strongly favor global equities, and particularly those of emerging market nations aiming at developed world status, including China, India and Mexico, along with Russia and Australia as important sources of raw materials.
The Treasury yield curve inverted in the final months of 2005 and into January of 2006, with short-term rates higher than long-term interest rates. Recession fears were sparked, but were countered by no less than new Fed chairman, Ben Bernanke, who emphasized that yield curve inversion, rather than sending a signal of incipient recession, was, instead, a reflection of the global savings glut. We too believe that the yield-curve indicator will fail to reflect a downturn this time, and we are looking for GDP growth of at least 2.5% for full-year 2006. Nevertheless, the beginning of a slower U.S. consumer spending growth trend seems to be in place, and normally, the direct and indirect effects of a percentage point drop in real consumption growth would translate into an almost equal-size drop in GDP growth. But we don’t expect that because business and government spending is accelerating, and the global economy is picking up steam even as U.S. consumers moderate their spending habits.
2
| | FIXED INCOME MARKET REVIEW |
The fixed income markets experienced three key trends over the course of the fiscal year ending March 31, 2006. Dominating the market was the Federal Reserve’s continuous monetary tightening, which culminated in its fifteenth federal funds target rate hike, to 4.75%, as the reporting period ended. The result was a shift to higher bond yields across the maturity spectrum.
The second critical aspect of the fixed-income market was the continued flattening of the yield curve, as we expected. The yield curve inverted, with shorter rates higher than longer rates, for a period from the end of 2005 into early 2006. An inverted curve has signaled future recessions in the past, but our thinking concurs with the Fed’s, which identifies a global liquidity surplus as the cause of the inversion. The last critical factor for the markets was limited to municipal bonds, with the first quarter of 2006 experiencing a drop in issuance as higher rates cut off refunding issues. Tighter muni supply is expected to continue over the new fiscal year.
Agency bonds modestly outperformed Treasuries for the past 12 months. Demand was strong from domestic investors who sought a high-quality reserve against future opportunities in other sectors. Foreign buying was very heavy. Inflation indexed bonds (TIPS) signaled an increase in inflation expectations as breakeven yields for 5-year and 10-year issues rose over the reporting period, in particular with short maturity issues. Commercial mortgage backed securities modestly outperformed due to healthy demand as investors moved some funds out of the corporate sector into this sector. Interest rate volatility, a key determinant of value in the mortgage-backed securities market, has continued to decline favoring the prospects for out-performance in this sector. Municipals outperformed Treasuries, as yields on the latter rose more on both an actual and a relative basis. This was caused by a well documented increase in demand on the part of non-traditional municipal investors, in addition to a reduction in new-issue supply. The result was much richer municipal/Treasury yield ratios. This has been especially true for maturities of 10+ years, although all comparative municipal/Treasury bond yield ratios fell to 5-year lows in the quarter.
The 10-year Treasury yield is nearing the high end of the expected range for 2006. Yields should begin to decline later in the year driven by an expected slowdown in economic activity, specifically with respect to housing and the consumer. The Fed’s new Chairman, Ben Bernanke, has stated that going forward, Fed policy will be more data dependent, which could see more tightening than expected, but we believe the Fed is aware of the potential for excessive tightening. Opportunity to profit from the yield curve returning to its more traditional steeper shape is now evident. From a duration standpoint, we are positioned slightly shorter to fixed-income benchmarks, looking for an easing to economic growth rates. We will look to position portfolios longer relative to the benchmarks after the Fed concludes its rate increases. We think a significant yield advantage exists in select mortgage-backed and asset-backed investments and continues to dictate an overweight position in the sector.
3
EXCELSIOR FUNDS, INC. | CORE BOND FUND |
Fiscal Year Annual Review
The Fed’s FOMC increased the target short-term federal funds rate progressively over the past twelve months, culminating in the 15th rate hike since June 2004, to 4.75%. Treasury yields rose from the 3-month T-Bill to the 30-year bond, and the yield curve flattened and then inverted for more than a month. The Fed has said that further hikes under new Chairman Ben Bernanke will be data-dependent, signaling an end to tightening unless inflation numbers gap higher.
Performance Attribution
The Excelsior Core Bond Fund generated strong relative performance that was largely the result of the portfolio’s barbell position and shorter duration, which benefited as yields rose and the Treasury yield curve flattened. The Fund’s defensive posture to rising rates was additive to returns as yields rose. While our moderate underweight allocation in corporate bonds was a slight detractor from returns, our selective holdings in high yield debt aided relative performance. Allocations to asset-backed and commercial mortgage backed securities helped performance as well. Furthermore, the allocation to municipal bonds added value as the current refinancing supply has been light and demand has increased due to higher yields. Our average quality rating remains at AAA. The allocation to BBB rated securities remains minimal, with the portfolio emphasizing higher quality issues. There were no major changes to our sector allocations although some credit positions were selectively reduced while we added to our mortgage position. The moderate corporate underweight allocation was maintained. We have added to our position in hybrid ARMs (adjustable rate mortgages) with interest rates that are fixed for a set period and then float.
Outlook
We believe a significant yield advantage exists in select mortgage-backed and asset-backed investments, which continues to dictate an overweight position in these securities for the Fund. Interest rate volatility, a key determinant of value in the mortgage-backed securities market, has continued to decline, favoring the prospects for out-performance in this sector. Once the Fed ends the tightening phase, we see little change in the fed funds’ target rate for a considerable period thereafter. We continue to favor investments in high-quality commercial mortgages (CMBS), for their attractive yield levels, low event risk, and high quality.
4
EXCELSIOR FUNDS TRUST | HIGH YIELD FUND |
Fiscal Year Annual Review
The fiscal year ending March 31 witnessed a rise in interest rates across the maturity spectrum, with the Fed going as far as its fifteenth 0.25% increase to the federal funds rate target, raising it to 4.75%. The high yield market extended its positive momentum from late last year through most of the first quarter of 2006. Solid economic growth and strong equity markets fueled enthusiasm for the high yield asset class. In addition, readily available bank credit allowed a number of high yield issuers to redeem outstanding subordinated debt thereby reducing the supply of fixed-coupon issues. Most importantly, default rates in the sector remained stable and at levels well below the long term average.
Performance Attribution
The key drivers of high yield market performance were the ongoing improvement in default rates and the increase in U.S. interest rates. Relative to the Merrill High Yield Index, we had overweight positions in paper/packaging, chemicals, and metals/mining (to benefit from strong economic growth) and in gaming (to reduce portfolio volatility). We positioned the portfolio for moderate volatility in an environment of solid economic growth and stable or moderately rising interest rates, holding issues with high coupons trading near their call prices. As a result, the Fund did not fully participate in the strong performance of the high yield sector. The Fund’s relative underperformance was almost entirely due to underweight exposure to high-volatility, lower-tier securities. Over the year, the CCC-rated sub sector significantly outperformed the B and particularly BB sub sectors. However, our underweighting of lower-tier credits reflected concerns surrounding possible principal risk from rising interest rates and uncertainty surrounding national and international political events. The best performing industry groups included metals/mining, telecom, automotive, and paper/packaging. The weakest performing groups include financials, food and beverage, gaming and broadcasting.
Outlook
The High Yield Fund has been migrating in the direction of greater diversification and higher overall quality. As a result, the Fund at the start of the year was underweight high-beta CCC and B-rated groups, which were the best performing sub sectors. Currently, the Fund has higher than average exposure to gaming and cyclical/commodity sectors such as metals/mining, and chemicals. Below-market weightings include finance, homebuilding, transportation, and autos/suppliers.
5
EXCELSIOR FUNDS TRUST | HIGH YIELD FUND |
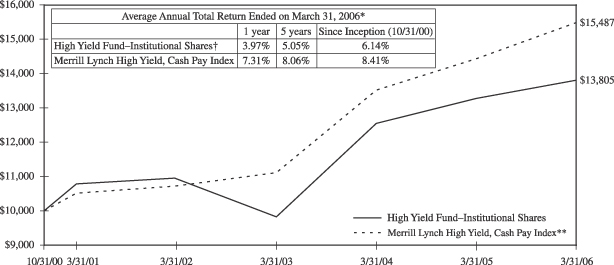
Past performance is not predictive of future performance. Investment returns and principal values will vary and shares may be worth more or less at redemption than their original cost. Securities rated below investment grade generally entail greater market, credit, and liquidity risks than investment grade securities.
The above illustration compares a $10,000 investment made in the Fund and a broad-based index since 10/31/00 (inception date). The chart assumes all dividends and capital gain distributions are reinvested. The Fund’s performance takes into account fees and expenses. The index does not take into account charges, fees and other expenses. Further information relating to Fund performance is contained in the Financial Highlights section of the Prospectus and elsewhere in this report.
| * | | Total return represents the change during the period in a hypothetical account with dividends reinvested. |
| ** | | Source: Merrill Lynch—The Merrill Lynch High Yield, Cash Pay Index is an unmanaged index comprised of publicly placed, non-convertible, coupon bearing domestic debt. Issues in the index are less than investment grade as rated by Standard & Poor’s Ratings Group or Moody’s Investors Service, Inc., and must not be in default. Issues have a term to maturity of at least one year. |
| † | | Currently certain fees are waived. Had such fees not been waived, returns would have been lower. Returns do not reflect the deduction of taxes that a shareholder would pay on Fund distributions or the redemption of shares. One year returns presented in the table differs from the return presented in the Financial Highlights. This is a result of the calculation of the Financial Highlights return adhering to GAAP presentation. |
6
EXCELSIOR FUNDS TRUST | INCOME FUND |
Fiscal Year Annual Review
Treasury yields rose across a full spectrum, from the 3-month T-bill to the 30-year bond and the yield curve flattened further, finally inverting altogether in the last quarter of the fiscal year reporting period. The combination of aggressive Fed policy and low inflation expectations continues at work. The Fed’s FOMC increased the federal funds target rate to 4.75%, culminating in the 15th rate hike since June 2004. Fear that the new Fed Chairman might push rates up aggressively, drove the bellwether 10-year Treasury note yield to 4.9%, over the course of the fiscal year, and subsequently over 5% after March 31.
Performance Attribution
Allocations to asset-backed and commercial mortgage-backed securities helped performance. Furthermore, our allocation to municipal bonds added value as the current refinancing supply has been light and demand has increased due to higher yields. Mortgages rallied over the quarter as the sector outperformed curve adjusted Treasuries by 44 basis points. The sector had cheapened in the prior quarter, when investors feared that a housing slowdown would lead to slower prepayments, extending the bonds’ durations. Our moderate underweight allocation in corporate bonds was a slight detractor from returns. Agency bonds modestly outperformed Treasuries over the fiscal year. Demand remains strong from domestic investors who are looking for a high-quality reserve against future opportunities in other sectors.
Outlook
As the reporting period ended, our portfolio’s duration, or sensitivity to changes in interest rates, was 4.6 years, which is a slight underweight versus the benchmark. The average quality rating remains at AAA, and the portfolio’s yield of 5.5% is above the benchmark. There are no major changes to our sector allocations, although some credit positions were selectively reduced while we added to our mortgage position. The moderate corporate underweight allocation was maintained. The allocation to BBB-rated securities remains minimal. We expect economic growth to continue in 2006, but at a moderately slower pace than in 2005. The 10-year Treasury note yield is nearing the high end of the expected range for 2006. Yield should begin to decline later in the year, driven by an expected slowdown in economic activity, specifically with respect to housing and the consumer. We will look to position portfolios longer relative the benchmark after the Fed concludes its rate increases.
7
EXCELSIOR FUNDS TRUST | INCOME FUND |
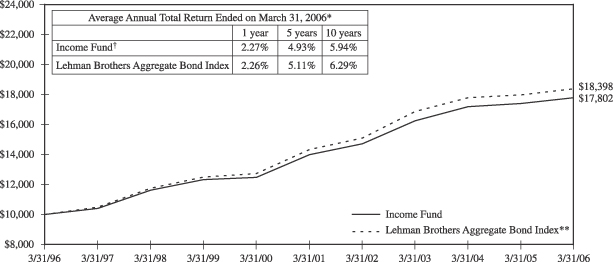
Past performance is not predictive of future performance. Investment returns and principal values will vary and shares may be worth more or less at redemption than their original cost.
The above illustration compares a $10,000 investment made in the Fund and a broad-based index over the past ten fiscal years. The chart assumes all dividends and capital gain distributions are reinvested. The Fund’s performance takes into account fees and expenses. The index does not take into account charges, fees and other expenses. Further information relating to Fund performance is contained in the Financial Highlights section of the Prospectus and elsewhere in this report.
| * | | Total return represents the change during the period in a hypothetical account with dividends reinvested. |
| ** | | Source: Lehman Brothers—The Lehman Brothers Aggregate Bond Index is an unmanaged, fixed income, market value- weighted index that includes treasury issues, agency issues, corporate bond issues and mortgage-backed securities. |
| † | | Currently certain fees are waived. Had such fees not been waived, returns would have been lower. Returns do not reflect the deduction of taxes that a shareholder would pay on fund distributions or the redemption of shares. |
8
EXCELSIOR FUNDS TRUST | TOTAL RETURN BOND FUND |
Fiscal Year Annual Review
The combination of aggressive Fed policy and low inflation expectations continued at work in the bond market. The Fed’s FOMC increased the target federal funds rate to 4.75%, over the fiscal year, culminating in the 15th rate hike since June 2004. The Fund maintained its defensive positioning to rising interest rates and our bias to a continued flattening of the yield curve. This strategy was a positive contributor to returns along with the portfolio’s allocation to residential mortgages and commercial mortgage backed securities. Our allocation to high yield securities again added value over the quarter and throughout the year as below investment grade corporate spreads continued to tighten throughout this period.
Performance Attribution
At quarter end, the fund’s duration, or sensitivity to changes in interest rates was 4.5 years, which is a slight underweight against the benchmark. The average quality rating remains at AAA, and the fund’s yield of 5.5% is above the benchmark. There were no major changes to our sector allocations although some credit positions were selectively reduced while we added to our mortgage position. The moderate corporate underweight allocation was maintained. The allocation to BBB rated securities remains minimal. The Fund’s defensive posture to rising rates was a contributor to returns as yields rose over the period. The moderate underweight allocation in corporate bonds was a slight detractor from returns. However, allocations to securitized sectors, specifically in the asset-backed and commercial mortgage backed securities helped performance.
Outlook
The 10-year Treasury yield is nearing the high end of the expected range for 2006. Yields should begin to decline later in the year driven by an expected slowdown in economic activity, specifically with respect to housing and the consumer. From a duration standpoint, we are positioned slightly short to the benchmark looking for an easing to economic growth rates. We will look to position portfolios longer relative the benchmark after the Fed concludes its rate increases. An opportunity to profit from the yield curve returning to its more traditional steeper shape may present itself during 2006.
9
EXCELSIOR FUNDS TRUST | TOTAL RETURN BOND FUND |
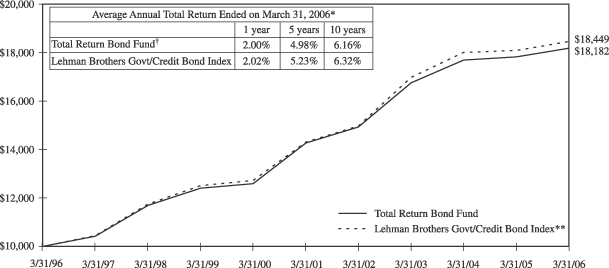
Past performance is not predictive of future performance. Investment returns and principal values will vary and shares may be worth more or less at redemption than their original cost.
The above illustration compares a $10,000 investment made in the Fund and a broad-based index over the past ten fiscal years. The chart assumes all dividends and capital gain distributions are reinvested. The Fund’s performance takes into account fees and expenses. The index does not take into account charges, fees and other expenses. Further information relating to Fund performance is contained in the Financial Highlights section of the Prospectus and elsewhere in this report.
| * | | Total return represents the change during the period in a hypothetical account with dividends reinvested. |
| ** | | Source: Lehman Brothers—The Lehman Brothers Govt/Credit Bond Index is an unmanaged total return performance benchmark comprised of U.S. Government agencies and U.S. Treasury securities and investment grade corporate debt, selected as representative of the market. |
| † | | Currently certain fees are waived. Had such fees not been waived, returns would have been lower. Returns do not reflect the deduction of taxes that a shareholder would pay on fund distributions or the redemption of shares. |
10
EXCELSIOR FUNDS TRUST | EQUITY CORE FUND |
Fiscal Year Annual Review
The economic backdrop during the fiscal year reflected strong global economic activity. Tightening interest rates in the U.S. clearly slowed the pace of growth, but not, we believe, to levels that will impact earnings growth for select companies with solid market share and pricing power. Both short and long-term interest rates continue to rise, but the Fed presumably is near the end of its monetary tightening cycle. We see clear signs of a slowing domestic housing market, which should lead to a strong headwind for the U.S. consumer. The stock market posted a solid return, with a rally in the last-calendar quarter, which accelerated through the first quarter of 2006, and our portfolio exhibited strong relative performance, which we expect to continue.
Performance Attribution
The Fund’s strong performance was spread across several market sectors. Materials was the best-performing sector, led by steel, pulp for paper, and construction materials. These companies benefited from continued strong demand and pricing in their respective markets. Our consumer holdings, saw gains from strong art auction results, as well as from increased spending on home furnishings, as the boomers continue to improve their retirement homes. We also recorded gains in our energy holdings, in selected technology stocks, financial services and in pharmaceuticals. We experienced moderate negative returns in land and medical devices. We initiated purchases in the rail transport sector, emphasizing leading companies that stress efficiency and optimization of rail networks. We also added in steel, emphasizing low-cost producers. We sold in electronic connectors and in food service distributors.
Outlook
In our opinion the Fed is nearing the end of its monetary tightening cycle, and we still see continued moderate growth in the economy and corporate profits. Growth in the consumer sector should moderate while business spending and net exports strengthen. We believe the portfolio’s mix of stocks should benefit as the economic expansion matures and as growth makes progress over the next few years. We expect to continue our limited exposure to technology as well as our overweights in materials and in the utility sector, where restructuring should support good returns. We will continue to emphasize thorough portfolio diversification and those companies that possess favorable corporate cultures and effective employee incentives.
11
EXCELSIOR FUNDS TRUST | EQUITY CORE FUND |
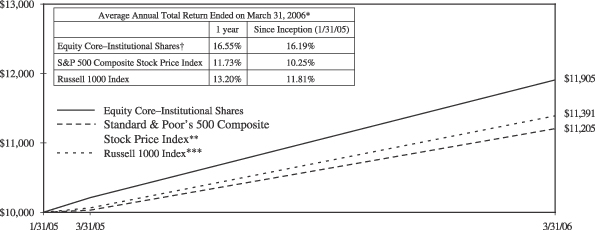
Past performance is not predictive of future performance. Investment returns and principal values will vary and shares may be worth more or less at redemption than their original cost.
The above illustration compares a $10,000 investment made in the Fund and a broad-based index since 1/31/05 (inception date). The chart assumes all dividends and capital gain distributions are reinvested. The Fund’s performance takes into account fees and expenses. The index does not take into account charges, fees and other expenses. Further information relating to Fund performance is contained in the Financial Highlights section of the Prospectus and elsewhere in this report.
| * | | Total return represents the change during the period in a hypothetical account with dividends reinvested. |
| ** | | Source: Standard & Poor’s Corporation—Reflects the reinvestment of income dividends and, where applicable, capital gain distributions. The Standard & Poor’s 500 Composite Stock Price Index is a widely accepted unmanaged index of U.S. stock market performance. |
| *** | | Source: Frank Russell Company—The Russell 1000 Index measures the performance of the 1,000 largest companies in the Russell 3000 Index, which represents approximately 92% of the total market capitalization of the Russell 3000 Index. The Index includes dividends reinvested. |
| † | | Currently certain fees are waived. Had such fees not been waived, returns would have been lower. Returns do not reflect the deduction of taxes that a shareholder would pay on Fund distributions or the redemption of shares. |
12
EXCELSIOR FUNDS TRUST | MID CAP VALUE AND RESTRUCTURING FUND |
Fiscal Year Annual Review
The Federal Reserve will eventually conclude its interest rate hikes and at sixteen times earnings, we believe stocks have room to advance. Over the course of the fiscal year, superb growth in corporate earnings and continued low inflation pushed stocks higher. We expect additional gains going forward despite the presence of several shorter-term negatives, including, high oil prices and rising short term interest rates. To our way of thinking, a moderate economic slow down should prove a sustainable source of earnings growth, especially for mid-cap companies poised to challenge their larger rivals.
Performance Attribution
We continue to target highly selective additions to the Fund. We added in consumer products, particularly in home furnishing, where we established a position with a leader in the specialty mattress category. As utilities restock, coal demand is increasing, and we added in this raw materials sector. We expect operating performance in this area to improve as capital expenditures are undertaken. We also opportunistically added to an existing position, which suffered a setback that we saw as temporary. Proceeds for these purchases came from selling in housewares and utilities. Merger and acquisition activity provided benefits, a trend we expect to continue. Mid-cap stocks were outperformers, with mid-cap indexes rising almost double what broad market measures returned. Our energy holdings continued to do well all year long, but non-energy related stocks also shone. Some of our star performers in prior years struggled, but these holdings continue to represent excellent long-term value in our estimation.
Outlook
Operating results of companies owned in the Fund were strong this year, marked by above average profitability and earnings growth. Continued merger and acquisition activity suggests a continuation of the favorable environment for our investment preference for restructuring companies. A few of the Fund’s troubled children, meaning its poor performing stocks, have recently shown signs of improved management. On the whole, the Fund’s investments sell at attractive discounts to market benchmarks on an earnings, cash flow and book value basis. While our expectations are therefore positive, we continue to keep the Fund well diversified, to mitigate risks, and remain true to our mission of purchasing stocks with improving fundamentals and low valuations.
13
EXCELSIOR FUNDS TRUST | MID CAP VALUE AND RESTRUCTURING FUND |
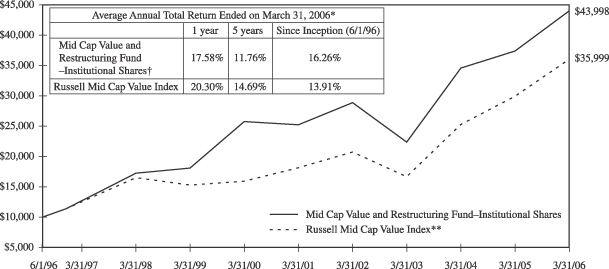
Past performance is not predictive of future performance. Investment returns and principal values will vary and shares may be worth more or less at redemption than their original cost.
The above illustration compares a $10,000 investment made in the Fund and a broad-based index since 6/1/96 (inception date). The chart assumes all dividends and capital gain distributions are reinvested. The Fund’s performance takes into account fees and expenses. The index does not take into account charges, fees and other expenses. Further information relating to Fund performance is contained in the Financial Highlights section of the Prospectus and elsewhere in this report.
| * | | Total return represents the change during the period in a hypothetical account with dividends reinvested. |
| ** | | Source: Frank Russell Company—The Russell Mid Cap Value Index measures the performance of medium-sized value-oriented securities. |
| † | | Currently certain fees are waived. Had such fees not been waived, returns would have been lower. Returns do not reflect the deduction of taxes that a shareholder would pay on Fund distributions or the redemption of shares. |
14
EXCELSIOR FUNDS, INC. | VALUE AND RESTRUCTURING FUND |
Annual Fiscal Year Review
Long-term equity fundamentals pointed toward higher stock prices in our estimation at the start of the twelve-month period ending March 31. Superb growth in corporate earnings and continued low inflation pushed stocks higher. Stocks mounted a major rally in the last quarter of 2005 and continued to make new five-year highs in the first quarter of 2006. The Federal Reserve will eventually conclude its interest rate hikes while stocks still have room, at sixteen times earnings, to advance.
Performance Attribution
The apparent abatement of corporate defensiveness and increased emphasis on improving businesses favored our type of investing throughout the year. The Fund also saw two of its holdings acquired at a premium during the period. Energy holdings continued to do well over the reporting period, and our holdings reflected higher oil and gas prices reflecting increased global demand and shortages from Hurricanes Rita and Katrina. Our non-energy related stocks also fared well, as commercial construction picked up for the first time since 2000 and rental equipment rates soared, boosting our holdings in the sector. Negative impact was recorded in the real estate and mortgage sectors; sectors that declined on rising interest rate concerns, as the Fed boosted the fed funds target rate to 4.75% by the end of the reporting period. But we think our holdings in this sector continue to represent excellent long-term value.
Outlook
On the whole, the Fund’s investments sell at an attractive discount to market benchmarks on an earnings, cash flow, and book value basis. Continued merger and acquisition activity suggests a continuation of the favorable environment for our investment preference for restructuring companies. While our expectations are therefore positive, we continue to keep the Fund well diversified to mitigate potential risks, and remain true to our mission of purchasing stocks with improving fundamentals and low valuations. We continue to look for improvement in the energy and commodity sectors, given global demand trends, and health care may prove an important source of positive performance in the coming year. Solid business growth should counteract the Fed’s tightening and higher energy costs, allowing for earnings acceleration for carefully selected stocks.
15
EXCELSIOR FUNDS, INC. | VALUE AND RESTRUCTURING FUND |
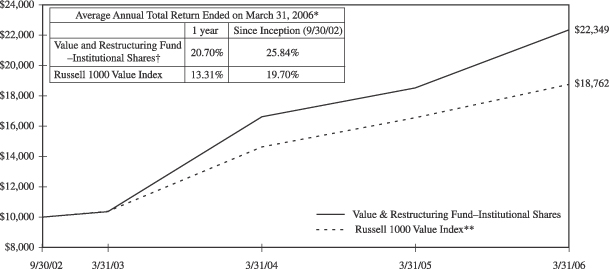
Past performance is not predictive of future performance. Investment returns and principal values will vary and shares may be worth more or less at redemption than their original cost.
The above illustration compares a $10,000 investment made in the Fund and a broad-based index since 9/30/02 (inception date). The chart assumes all dividends and capital gain distributions are reinvested. The Fund’s performance takes into account fees and expenses. The index does do not take into account charges, fees and other expenses. Further information relating to Fund performance is contained in the Financial Highlights section of the Prospectus and elsewhere in this report.
| * | | Total return represents the change during the period in a hypothetical account with dividends reinvested. |
| ** | | Source: Frank Russell Company—The Russell 1000 Value Index is an unmanaged index composed of those Russell 1000 Index companies with lower price-to-book ratios and lower forecasted growth values. The Russell 1000 Index is composed of the 1000 largest companies in The Russell 3000 Index which is composed of 3,000 of the largest U.S. companies by market capitalization. The Index includes dividends reinvested. |
| † | | Currently certain fees are waived. Had such fees not been waived, returns would have been lower. Returns do not reflect the deduction of taxes that a shareholder would pay on fund distributions or the redemption of shares. |
16
EXCELSIOR FUNDS, INC. | EMERGING MARKETS FUND |
Fiscal Year Annual Review
Emerging markets chalked up positive returns for the Fund’s fiscal year, continuing their longest streak of out performance since 1998. Larger-cap equities that are index constituents tended to lead the way. The BRIC countries (Brazil, Russia, India, and China) are becoming a focal point for emerging market investors. These four countries generated some of the best returns for the asset class, with Russia leading the way, followed by India, Brazil, and China in that order.
Performance Attribution
Strategically, from a sector perspective, the Fund has long believed that some of the best stock opportunities are in domestic related companies, as opposed to export oriented companies. We expressed this view by over weighting sectors like telecommunications, consumer stocks, and banks. Telecommunications has long been the largest sector over weight in the Fund. We hold cellular companies listed in Mexico, which are continuing to gain market share throughout Latin America. We also hold Russian long distance providers, where we see continued opportunity. On the consumer side, we targeted household equipment in Turkey and Mexico, where consumers are getting a boost from continued economic growth and moderating inflation. We also remain focused on banking stocks in Latin America, where reduced interest rates and declining inflation are benefiting banks and adding strong loan growth. From a pure country perspective, BRIC exposure also helped the Emerging Markets Fund. The Fund had over weights in Brazil, Russia, and China. We believe that country assessment is critical to the investment process, which led us to over weight these countries some time ago. Our relative underperformance against the benchmark reflects greater caution in our investments in Latin America.
Outlook
Going forward, we continue to believe that domestic oriented stocks, as opposed to export driven stocks, will perform best in emerging markets. Many emerging market countries are benefiting from financial strength that is allowing them to withstand upward pressure on interest rates. This development could make for a very robust environment for domestic oriented emerging market stocks. Given these strong financial conditions and promising growth prospects, especially for the BRIC countries, we believe emerging markets can close the valuation gap with developed world equities. And we expect investors will come to terms with higher valuation levels for emerging market equities, and if the growth impetus for emerging markets shifts to domestic drivers, the valuation gap could be narrowed further.
17
EXCELSIOR FUNDS, INC. | EMERGING MARKETS FUND |
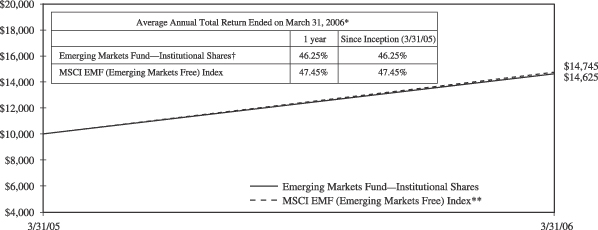
Past performance is not predictive of future performance. Investment returns and principal values will vary and shares may be worth more or less at redemption than their original cost. International investing is subject to special risks such as currency fluctuations and differences in accounting and taxation standards.
The above illustration compares a $10,000 investment made in the Fund and a broad-based index since 3/31/05 (inception date). The chart assumes all dividends and capital gain distributions are reinvested. The Fund’s performance takes into account fees and expenses. The index does not take into account charges, fees and other expenses. Further information relating to Fund performance is contained in the Financial Highlights section of the Prospectus and elsewhere in this report.
| * | | Total return represents the change during the period in a hypothetical account with dividends reinvested. |
| ** | | Source: Morgan Stanley & Co., Incorporated—Morgan Stanley Capital International EMF (Emerging Markets Free) Index is a widely-accepted, unmanaged index composed of a sample of companies representative of the market structure of 26 global emerging market countries. The Index includes dividends reinvested. |
| † | | Currently certain fees are waived. Had such fees not been waived, returns would have been lower. Returns do not reflect the deduction of taxes that a shareholder would pay on Fund distributions or the redemption of shares. Returns do not reflect the 2% fee imposed on shares redeemed 30 days or less after their date of purchase. |
18
EXCELSIOR FUNDS TRUST | INTERNATIONAL EQUITY FUND |
Annual Fiscal Year Review
International markets continued to strongly outperform the U.S. market for the twelve-month reporting period ending March 31, 2006. The performance differential was impressive with the global indexes approximately doubling the return for U.S. equities. Investors perceived overseas growth and relatively cheaper valuation as reasons for buying foreign stocks while the U.S. Federal Reserve continued to tighten monetary policy, raising the federal funds target rate to 4.75% by the end of the reporting period. The Fed’s action helped support the dollar, and exchange rate fluctuations added only marginally to the return of international equities during the quarter. Finally, the long-awaited turnaround of the Japanese economy has finally arrived, also contributing to strength for international equities.
Performance Attribution
The main contributor to the strong performance of the international equity benchmarks was the exceptional regional performance of the Continental European markets. Emerging markets continued to outperform the developed markets of the world based on strong investment flows. The BRIC markets (Brazil, Russia, India and China) continued to drive overall emerging markets performance, which is consistent with recent performance patterns. Strong earnings growth, attractive valuations and strongly improved quality characteristics of the emerging markets asset class are attracting heavy fund flows. Our sector weights, specifically, our underweight position in financials, continued to be detrimental to overall performance as the sector benefited from increased merger and acquisition (M&A) activity in Europe. The portfolio remains overweight in the information technology and health care sectors. This is largely offset by an underweight position in financial services. In Asia, consistent with our pursuit of eliminating internal portfolio inefficiencies, we eliminated smaller positions in consumer products and services.
Outlook
Our continued positive stance toward international investing is based on attractive relative valuations compared to U.S. equities. The U.S. profit cycle appears to be near a peak, whereas profits in most international markets have ample room to expand. We continue to favor the Japanese equity market, since stock valuations are not remotely reflecting the surprising strength of the Japanese economic recovery. Solid earnings growth acceleration and continued M&A activity continue to make Europe an attractive investment destination. Our exposure to Emerging Markets is approaching a benchmark-neutral position. Our expectations relative to domestic positions remain considerably higher.
19
EXCELSIOR FUNDS TRUST | INTERNATIONAL EQUITY FUND |
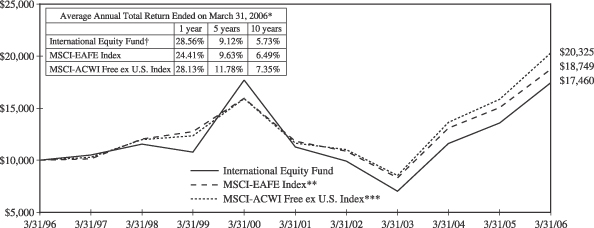
Past performance is not predictive of future performance. Investment returns and principal values will vary and shares may be worth more or less at redemption than their original cost. International investing is subject to special risks such as currency fluctuations, political risks, and differences in accounting and taxation standards.
The above illustration compares a $10,000 investment made in the Fund and broad-based indices over the past ten fiscal years. The chart assumes all dividends and capital gain distributions are reinvested. The Fund’s performance takes into account fees and expenses. The indices do not take into account charges, fees and other expenses. Further information relating to Fund performance is contained in the Financial Highlights section of the Prospectus and elsewhere in this report.
| * | | Total return represents the change during the period in a hypothetical account with dividends reinvested. |
| ** | | Source: Morgan Stanley & Co., Incorporated—The Morgan Stanley Capital International EAFE (Europe, Australia, Asia, Far East) Index is a widely accepted, unmanaged index composed of a sample of companies from 21 countries representing the developed stock markets outside North America. |
| *** | | Source: Morgan Stanley & Co., Incorporated—The Morgan Stanley Capital International All Country World Index Free ex U.S. Index is a widely accepted, unmanaged index of global stock market performance comprising 47 countries with developed and emerging markets excluding the United States. |
| † | | Currently certain fees are waived. Had such fees not been waived, returns would have been lower. Returns do not reflect the deduction of taxes that a shareholder would pay on Fund distributions or the redemption of shares. Returns do not reflect the 2% fee imposed on shares redeemed 30 days or less after their date of purchase. One year returns presented in the table differs from the return presented in the Financial Highlights. This is a result of the calculation of the Financial Highlights return adhering to GAAP presentation. |
20
Excelsior Funds, Inc.
Portfolio of Investments — March 31, 2006
Money Fund
| | | | | |
Principal
Amount
| | Security Description
| | Value
|
| | | | | | |
| CERTIFICATES OF DEPOSIT — 12.86% | | |
| $75,000,000 | | First Tennessee Bank,
4.78%, 04/28/06 | | $ | 75,000,000 |
| 75,000,000 | | Washington Mutual Corp., 4.80%, 05/11/06 | | | 75,000,000 |
| 50,000,000 | | Wells Fargo Co.,
4.76%, 04/10/06 | | | 50,000,000 |
| | | | |
|
|
| | | TOTAL CERTIFICATES
OF DEPOSIT (Cost $200,000,000) | | | 200,000,000 |
| | | | |
|
|
| COMMERCIAL PAPER — 84.78% | | |
| 75,000,000 | | American Express Credit Corp., Discount Note,
4.54%, 04/03/06 | | | 74,981,082 |
| 50,000,000 | | Bank of America Corp., Discount Note,
4.53%, 04/03/06 | | | 49,987,417 |
| 75,000,000 | | CIT Group, Inc., Discount Note, 4.55%, 04/03/06 | | | 74,981,042 |
| 75,000,000 | | Citigroup Funding, Inc., Discount Note,
4.54%, 04/03/06 | | | 74,981,082 |
| 50,000,000 | | Dexia Delaware, Discount Note, 4.54%, 04/03/06 | | | 49,987,389 |
| 70,000,000 | | Gannett Co., Discount Note, 4.54%, 04/04/06(a) | | | 69,973,517 |
| 70,000,000 | | General Electric Capital Corp., Discount Note,
4.53%, 04/03/06 | | | 69,982,383 |
| 75,000,000 | | Goldman Sachs Group, Inc., Discount Note,
4.77%, 04/05/06 | | | 74,960,250 |
| 75,000,000 | | HSBC, Discount Note,
4.55%, 04/03/06 | | | 74,981,042 |
| 50,000,000 | | International Lease Finance Corp., Discount Note,
4.53%, 04/04/06 | | | 49,981,125 |
| 75,000,000 | | Merrill Lynch & Co., Inc., Discount Note,
4.68%, 04/03/06 | | | 74,980,500 |
| | | | | |
Principal
Amount
| | Security Description
| | Value
|
| | | | | | |
| COMMERCIAL PAPER — (continued) | | |
| $50,000,000 | | Preferred Receivables Funding Corp., Discount Note,
4.75%, 04/03/06(a) | | $ | 49,986,806 |
| 75,000,000 | | Prudential Funding Corp., Discount Note,
4.55%, 04/03/06 | | | 74,981,042 |
| 73,925,000 | | Ranger Funding Co. llc, Discount Note,
4.56%, 04/03/06(a) | | | 73,906,272 |
| 50,000,000 | | Royal Bank of Scotland plc, Discount Note,
4.55%, 04/03/06 | | | 49,987,361 |
| 75,000,000 | | Societe Generale,
Discount Note,
4.55%, 04/03/06 | | | 74,981,021 |
| 75,000,000 | | Three Pillars Funding,
Discount Note,
4.58%, 04/03/06(a) | | | 74,980,917 |
| 70,000,000 | | UBS Finance Corp.,
Discount Note,
4.55%, 04/03/06 | | | 69,982,325 |
| 60,000,000 | | Windmill Funding Corp., Discount Note,
4.55%, 04/03/06(a) | | | 59,984,833 |
| 50,000,000 | | Yorktown Capital,
Discount Note,
4.61%, 04/05/06(a) | | | 49,974,389 |
| | | | |
|
|
| | | TOTAL COMMERCIAL PAPER
(Cost $1,318,541,795) | | | 1,318,541,795 |
| | | | |
|
|
Shares
| | | | |
| REGISTERED INVESTMENT COMPANY — 0.08% |
| 1,178,553 | | Dreyfus Government Cash Management Fund | | | 1,178,553 |
| | | | |
|
|
| | | TOTAL REGISTERED INVESTMENT COMPANY (Cost $1,178,553) | | | 1,178,553 |
| | | | |
|
|
See Notes to Financial Statements.
21
Excelsior Funds, Inc.
Portfolio of Investments — March 31, 2006
Money Fund — (continued)
| | | | | |
Principal
Amount
| | Security Description
| | Value
|
| | | | | | |
| REPURCHASE AGREEMENT — 2.64% |
| $41,000,000 | | Morgan Stanley, 4.80%, dated 03/31/06, due 04/03/06, to be repurchased at $41,016,400 (collateralized by U.S. Government obligations ranging in par value $15,000-$20,000,000, 2.75% -4.725%, 06/30/06-03/30/07; total market value $41,832,384) | | $ | 41,000,000 |
| | | | |
|
|
| | | TOTAL REPURCHASE AGREEMENT (Cost $41,000,000) | | | 41,000,000 |
| | | | |
|
|
| | | | | | | |
TOTAL INVESTMENTS
(Cost $1,560,720,348) | | 100.36 | % | | $ | 1,560,720,348 | |
LIABILITIES IN EXCESS OF OTHER ASSETS | | (0.36 | ) | | | (5,584,676 | ) |
| | |
|
| |
|
|
|
NET ASSETS | | 100.00 | % | | $ | 1,555,135,672 | |
| | |
|
| |
|
|
|
| (a) | Security exempt from registration under Rule 144A of the Securities Act of 1933. This security may be resold in transactions exempt from registration, normally to qualified institutional buyers. At March 31, 2006, these securities amounted to $378,806,734 or 24.36% of net assets. |
Discount Note—The rate reported is the discount rate at the time of purchase.
llc—Limited Liability Company
plc—Public Limited Company
The summary of the Fund’s investments as of March 31, 2006 is as follows: (Unaudited)
| | | | | | | |
Portfolio Diversification
| | % of
Net
Assets
| | | Value
| |
Commercial Paper | | 84.78 | % | | $ | 1,318,541,795 | |
Certificates of Deposit | | 12.86 | | | | 200,000,000 | |
Repurchase Agreement | | 2.64 | | | | 41,000,000 | |
Registered Investment Company | | 0.08 | | | | 1,178,553 | |
| | |
|
| |
|
|
|
Total Investments | | 100.36 | % | | $ | 1,560,720,348 | |
Liabilities in Excess of Other Assets | | (0.36 | ) | | | (5,584,676 | ) |
| | |
|
| |
|
|
|
Net Assets | | 100.00 | % | | $ | 1,555,135,672 | |
| | |
|
| |
|
|
|
See Notes to Financial Statements.
22
Excelsior Funds, Inc.
Portfolio of Investments — March 31, 2006
Core Bond Fund
| | | | | | | | | | |
Principal
Amount
| | | | Rate
| | | Maturity
Date
| | Value
|
| | | | | | | | | | | |
ASSET BACKED SECURITIES — 0.10% |
| $ 294,473 | | CIT RV Trust,
1999-A A4 | | 6.16 | % | | 06/15/13 | | $ | 294,413 |
| | | | | | | | | |
|
|
| | | TOTAL ASSET BACKED SECURITIES
(Cost $288,434) | | | 294,413 |
| | | | | | | | | |
|
|
COLLATERALIZED MORTGAGE OBLIGATIONS — 13.02% |
| | | NON-GOVERNMENTAL AGENCY COLLATERALIZED MORTGAGE OBLIGATIONS —8.61% |
| 2,295,956 | | Citigroup Mortgage Loan Trust, 2004-HYB4 WA(a) | | 4.46 | | | 12/25/34 | | | 2,243,580 |
| 2,192,522 | | Countrywide Alternative Loan Trust,
2004-16CB 1A2 | | 5.50 | | | 07/25/34 | | | 2,152,184 |
| 1,409,477 | | Countrywide Alternative Loan Trust,
2004-22CB 1A1 | | 6.00 | | | 10/25/34 | | | 1,395,569 |
| 7,158,083 | | Indymac Index Mortgage Loan Trust,
2004-AR4 3A(a) | | 4.80 | | | 08/25/34 | | | 7,005,424 |
| 9,127,959 | | JP Morgan Mortgage Trust,
2005-A6 1A1(a) | | 5.15 | | | 09/25/35 | | | 9,008,474 |
| 2,657,887 | | Wells Fargo Mortgage Backed Securities Trust,
2004-EE 3A1 | | 3.99 | | | 12/25/34 | | | 2,578,087 |
| | | | | | | | | |
|
|
| | | | | | | | | | | 24,383,318 |
| | | | | | | | | |
|
|
| | | FEDERAL HOME LOAN MORTGAGE CORPORATION — 3.03% |
| 5,208,627 | | 1602 PH | | 6.00 | | | 04/15/23 | | | 5,220,472 |
| 3,296,147 | | 2333 UZ | | 6.50 | | | 07/15/31 | | | 3,347,404 |
| | | | | | | | | |
|
|
| | | | | | | | | | | 8,567,876 |
| | | | | | | | | |
|
|
| | | FEDERAL NATIONAL MORTGAGE
ASSOCIATION — 0.50% |
| 1,430,000 | | 2003-17 QT | | 5.00 | | | 08/25/27 | | | 1,404,289 |
| | | | | | | | | |
|
|
| | | GOVERNMENT NATIONAL MORTGAGE ASSOCIATION — 0.88% |
| 2,450,621 | | 2005-25 B | | 6.21 | | | 03/16/21 | | | 2,486,037 |
| | | | | | | | | |
|
|
| | | TOTAL COLLATERALIZED MORTGAGE OBLIGATIONS
(Cost $37,574,710) | | | 36,841,520 |
| | | | | | | | | |
|
|
| | | | | | | | | | |
Principal
Amount
| | | | Rate
| | | Maturity
Date
| | Value
|
| | | | | | | | | | | |
COMMERCIAL MORTGAGE-BACKED SECURITIES — 14.54% |
| $ 1,477,000 | | Bank of America Commercial Mortgage, Inc.,
2004-1 A4 | | 4.76 | % | | 11/10/39 | | $ | 1,400,650 |
| 3,705,581 | | Chase Commercial Mortgage Securities Corp., 1997-2 D | | 6.60 | | | 12/19/29 | | | 3,771,967 |
| 1,000,000 | | Credit Suisse First Boston Mortgage Securities Corp., 2002-CKS4 G(a)(b) | | 6.01 | | | 11/15/36 | | | 1,016,760 |
| 1,689,000 | | Greenwich Capital Commercial Funding Corp., 2004-GG1 A1 | | 5.32 | | | 06/10/36 | | | 1,659,529 |
| 2,000,000 | | Morgan Stanley Capital I, 1997-C1F(b) | | 6.85 | | | 02/15/20 | | | 2,010,911 |
| 3,601,000 | | Morgan Stanley Capital I, 1999-WF1 B | | 6.32 | | | 11/15/31 | | | 3,675,836 |
| 3,150,000 | | Morgan Stanley Dean Witter Capital I, 2000-LIF2 C | | 7.50 | | | 10/15/33 | | | 3,384,305 |
| 1,969,034 | | Mortgage Capital Funding, Inc.,
1996-MC1 G | | 7.15 | | | 06/15/06 | | | 1,965,698 |
| 773,095 | | Mortgage Capital Funding, Inc.,
1996-MC2 D | | 7.26 | | | 12/21/26 | | | 776,091 |
| 3,061,000 | | Mortgage Capital Funding, Inc.,
1998-MC1 C | | 6.95 | | | 03/18/30 | | | 3,137,019 |
| 2,521,000 | | Nomura Asset Securities Corp., 1998-D6 A4(a) | | 6.92 | | | 03/15/30 | | | 2,828,507 |
| 3,601,000 | | Wachovia Bank Commercial Mortgage Trust, 2003-C9 A3 | | 4.61 | | | 12/15/35 | | | 3,463,240 |
| 2,305,000 | | Wachovia Bank Commercial Mortgage Trust,
2004-C12 A3 | | 5.23 | | | 07/15/41 | | | 2,282,884 |
| 10,000,000 | | Wachovia Bank Commercial Mortgage Trust,
2005-C20 A5(a)(c) | | 5.09 | | | 07/15/42 | | | 9,775,846 |
| | | | | | | | | |
|
|
| | | TOTAL COMMERCIAL MORTGAGE-BACKED SECURITIES (Cost $41,540,424) | | | 41,149,243 |
| | | | | | | | | |
|
|
See Notes to Financial Statements.
23
Excelsior Funds, Inc.
Portfolio of Investments — March 31, 2006
Core Bond Fund — (continued)
| | | | | | | | | | |
Principal
Amount
| | | | Rate
| | | Maturity
Date
| | Value
|
| | | | | | | | | | | |
CORPORATE BONDS — 15.06% |
| $ 1,115,000 | | America Movil S.A. de C.V. | | 5.50 | % | | 03/01/14 | | $ | 1,068,607 |
| 2,000,000 | | Bank One Corp. | | 7.88 | | | 08/01/10 | | | 2,180,832 |
| 3,005,000 | | Bottling Group llc | | 5.50 | | | 04/01/16 | | | 2,966,407 |
| 700,000 | | British Telecommunications plc | | 8.88 | | | 12/15/30 | | | 895,497 |
| 2,800,000 | | Cisco Systems, Inc. | | 5.50 | | | 02/22/16 | | | 2,757,941 |
| 1,081,000 | | CIT Group, Inc. | | 5.88 | | | 10/15/08 | | | 1,093,756 |
| 2,000,000 | | Citigroup, INC. | | 4.25 | | | 07/29/09 | | | 1,937,164 |
| 1,441,000 | | Comcast Cable Communications | | 6.88 | | | 06/15/09 | | | 1,490,246 |
| 2,000,000 | | Comcast Cable Communications | | 6.75 | | | 01/30/11 | | | 2,079,016 |
| 1,441,000 | | DaimlerChrysler N.A. Holding Corp. | | 7.20 | | | 09/01/09 | | | 1,504,655 |
| 600,000 | | Entergy Gulf States | | 5.70 | | | 06/01/15 | | | 575,122 |
| 1,000,000 | | Ford Motor Credit Co. | | 8.63 | | | 11/01/10 | | | 958,056 |
| 2,773,000 | | Household Finance Corp. | | 8.00 | | | 07/15/10 | | | 3,025,750 |
| 1,437,000 | | International Lease Finance Corp. | | 4.50 | | | 05/01/08 | | | 1,412,935 |
| 250,000 | | Iron Mountain, Inc. | | 8.63 | | | 04/01/13 | | | 260,000 |
| 2,881,000 | | Merrill Lynch & Co. MTN | | 5.00 | | | 02/03/14 | | | 2,762,940 |
| 2,800,000 | | Morgan Stanley | | 4.75 | | | 04/01/14 | | | 2,612,380 |
| 2,000,000 | | Morgan Stanley Dean Witter | | 6.75 | | | 04/15/11 | | | 2,105,300 |
| 1,690,000 | | Oracle Corp./Ozark Holdings(b) | | 5.25 | | | 01/15/16 | | | 1,621,205 |
| 1,441,000 | | Prudential Financial, Inc. | | 5.10 | | | 09/20/14 | | | 1,389,778 |
| 627,000 | | PSEG Energy Holdings, Inc. | | 8.63 | | | 02/15/08 | | | 653,648 |
| 2,000,000 | | RBS Capital Trust III(a) | | 5.51 | | | 09/29/49 | | | 1,929,116 |
| 1,596,000 | | Sprint Capital Corp. | | 8.38 | | | 03/15/12 | | | 1,803,320 |
| 1,153,000 | | Time Warner Cos., Inc. | | 7.25 | | | 10/15/17 | | | 1,233,772 |
| 1,441,000 | | Wal-Mart Stores | | 4.13 | | | 02/15/11 | | | 1,364,284 |
| 950,000 | | Xerox Corp. | | 6.40 | | | 03/15/16 | | | 942,875 |
| | | | | | | | | |
|
|
| | | TOTAL CORPORATE BONDS (Cost $42,975,196) | | | 42,624,602 |
| | | | | | | | | |
|
|
TAX-EXEMPT SECURITIES — 1.31% |
| 3,600,000 | | University of Texas Revenue Bonds, Series B | | 5.00 | | | 08/15/33 | | | 3,702,456 |
| | | | | | | | | |
|
|
| | | TOTAL TAX-EXEMPT SECURITIES
(Cost $3,691,406) | | | 3,702,456 |
| | | | | | | | | |
|
|
U.S. GOVERNMENT AGENCY BONDS & NOTES — 1.83% |
| | | FANNIE MAE — 1.83% |
| 5,000,000 | | MTN | | 6.25 | % | | 02/01/11 | | | 5,185,515 |
| | | | | | | | | |
|
|
| | | TOTAL U.S. GOVERNMENT AGENCY BONDS & NOTES
(Cost $5,341,117) | | | 5,185,515 |
| | | | | | | | | |
|
|
| | | | | | | | | | |
Principal
Amount
| | | | Rate
| | | Maturity
Date
| | Value
|
| | | | | | | | | | | |
U.S. GOVERNMENT AGENCY MORTGAGE PASS THROUGH SECURITIES — 32.03% |
| | | FEDERAL HOME LOAN MORTGAGE CORPORATION — 17.14% |
| $10,000,000 | | TBA | | 4.50 | % | | 04/01/21 | | $ | 9,543,751 |
| 2,888,445 | | Pool # A20105 | | 5.00 | | | 04/01/34 | | | 2,753,346 |
| 9,843,702 | | Pool # A47411 | | 4.50 | | | 10/01/35 | | | 9,080,373 |
| 4,901,581 | | Pool # A48132 | | 7.00 | | | 12/01/35 | | | 5,045,327 |
| 2,999,380 | | Pool # C01811 | | 5.00 | | | 04/01/34 | | | 2,859,092 |
| 133,535 | | Pool # C71221 | | 5.00 | | | 09/01/32 | | | 127,467 |
| 4,887,002 | | Pool # G01842 | | 4.50 | | | 06/01/35 | | | 4,508,040 |
| 15,004,026 | | Pool # G18105 | | 5.00 | | | 03/01/21 | | | 14,624,096 |
| | | | | | | | | |
|
|
| | | | | | | | | | | 48,541,492 |
| | | | | | | | | |
|
|
| | | FEDERAL NATIONAL MORTGAGE
ASSOCIATION — 12.51% |
| 11,809,993 | | Pool # 357824 | | 5.50 | | | 06/01/35 | | | 11,531,302 |
| 1,257,935 | | Pool # 387203 | | 4.80 | | | 01/01/12 | | | 1,227,747 |
| 1,074,138 | | Pool # 387204 | | 4.80 | | | 01/01/12 | | | 1,048,361 |
| 3,780,015 | | Pool # 618322 | | 6.00 | | | 12/01/31 | | | 3,785,055 |
| 4,974,463 | | Pool # 805386 ARM(a) | | 4.90 | | | 01/01/35 | | | 4,920,909 |
| 764,261 | | Pool # 812268 | | 5.50 | | | 05/01/35 | | | 746,227 |
| 911,766 | | Pool # 820989 | | 5.50 | | | 04/01/35 | | | 890,251 |
| 909,179 | | Pool # 821567 | | 5.50 | | | 06/01/35 | | | 887,724 |
| 11,234,831 | | Pool # 829321 | | 4.50 | | | 09/01/35 | | | 10,367,019 |
| | | | | | | | | |
|
|
| | | | | | | | | | | 35,404,595 |
| | | | | | | | | |
|
|
| | | GOVERNMENT NATIONAL MORTGAGE
ASSOCIATION — 2.38% |
| 389,975 | | Pool # 2562 | | 6.00 | | | 03/20/28 | | | 394,022 |
| 596,534 | | Pool # 267812 | | 8.50 | | | 06/15/17 | | | 640,097 |
| 2,164,434 | | Pool # 3413 | | 4.50 | | | 07/20/33 | | | 2,018,927 |
| 1,983,052 | | Pool # 3442 | | 5.00 | | | 09/20/33 | | | 1,916,383 |
| 36,385 | | Pool # 532751 | | 9.00 | | | 08/15/30 | | | 39,616 |
| 109,246 | | Pool # 568670 | | 6.50 | | | 04/15/32 | | | 113,284 |
| 300,160 | | Pool # 780548 | | 8.50 | | | 12/15/17 | | | 321,070 |
| 291,452 | | Pool # 780865 | | 9.50 | | | 11/15/17 | | | 318,467 |
| 538,300 | | Pool # 781084 | | 9.00 | | | 12/15/17 | | | 577,178 |
| 390,606 | | Pool # 80311 ARM(a) | | 4.50 | | | 08/20/29 | | | 390,282 |
| | | | | | | | | |
|
|
| | | | | | | | | | | 6,729,326 |
| | | | | | | | | |
|
|
| | | TOTAL U.S. GOVERNMENT AGENCY MORTGAGE PASS THROUGH SECURITIES
(Cost $91,989,929) | | | 90,675,413 |
| | | | | | | | | |
|
|
U.S. GOVERNMENT SECURITIES — 17.81% |
| | | U.S. TREASURY STRIPS — 4.46% |
| 22,600,000 | | | | 0.00 | | | 11/15/17 | | | 12,633,174 |
| | | | | | | | | |
|
|
| | | U.S. TREASURY INFLATION PROTECTED
BONDS — 0.83% |
| 300,000 | | | | 4.25 | | | 01/15/10 | | | 379,904 |
| 2,000,000 | | | | 0.88 | | | 04/15/10 | | | 1,982,919 |
| | | | | | | | | |
|
|
| | | | | | | | | | | 2,362,823 |
| | | | | | | | | |
|
|
See Notes to Financial Statements.
24
Excelsior Funds, Inc.
Portfolio of Investments — March 31, 2006
Core Bond Fund — (continued)
| | | | | | | | | | |
Principal
Amount
| | | | Rate
| | | Maturity
Date
| | Value
|
| | | | | | | | | | | |
U.S. GOVERNMENT SECURITIES — (continued) |
| | | U.S. TREASURY NOTES —12.52% |
| $ 7,700,000 | | | | 3.63 | % | | 01/15/10 | | $ | 7,381,774 |
| 12,000,000 | | | | 4.50 | | | 11/15/10 | | | 11,838,720 |
| 11,955,000 | | (c) | | 7.63 | | | 11/15/22 | | | 15,346,299 |
| 885,000 | | | | 4.50 | | | 02/15/36 | | | 830,379 |
| | | | | | | | | |
|
|
| | | | | | | | | | | 35,397,172 |
| | | | | | | | | |
|
|
| | | TOTAL U.S. GOVERNMENT SECURITIES
(Cost $52,096,327) | | | 50,393,169 |
| | | | | | | | | |
|
|
| | | | |
Shares
| | | | | | | | | |
REGISTERED INVESTMENT COMPANIES — 2.16% |
| 3,052,268 | | Dreyfus Government Cash Management Fund | | | 3,052,268 |
| 3,052,268 | | Fidelity U.S. Treasury II Fund | | | 3,052,267 |
| | | | | | | | | |
|
|
| | | TOTAL REGISTERED INVESTMENT COMPANIES
(Cost $6,104,535) | | | 6,104,535 |
| | | | | | | | | |
|
|
| | | | | | |
TOTAL INVESTMENTS (Cost $281,602,078)(d) | | 97.86 | % | | $ | 276,970,866 |
OTHER ASSETS IN EXCESS OF LIABILITIES | | 2.14 | | | | 6,045,059 |
| | |
|
| |
|
|
NET ASSETS | | 100.00 | % | | $ | 283,015,925 |
| | |
|
| |
|
|
| (a) | Variable Rate Security—The rate disclosed is as of March 31, 2006. |
| (b) | Security exempt from registration under Rule 144A of the Securities Act of 1933. This security may be resold in transactions exempt from registration, normally to qualified institutional buyers. At March 31, 2006, these securities amounted to $4,648,876 or 1.64% of net assets. |
| (c) | All or part of the security is segregated by the Fund’s custodian to cover future purchase commitments. |
| (d) | Unrealized appreciation (depreciation) of securities: |
| | | | | | | | | |
Unrealized
Appreciation
| | Unrealized
(Depreciation)
| | | Net Unrealized
Appreciation/(Depreciation)
| |
| $ | 760,868 | | $ | (5,392,080 | ) | | $ | (4,631,212 | ) |
ARM—Adjustable Rate Mortgage
llc—limited liability company
MTN—Medium Term Note
plc—public limited company
STRIPS—Separately Traded Registered Interest and Principal Securities
The summary of the Fund’s investments as of March 31, 2006 is as follows: (Unaudited)
| | | | | | |
Portfolio Diversification
| | % of
Net
Assets
| | | Value
|
U.S. Government & Agency Securities | | 51.67 | % | | $ | 146,254,097 |
Corporate Bonds | | 15.06 | | | | 42,624,602 |
Commercial Mortgage-Backed Securities | | 14.54 | | | | 41,149,243 |
Collateralized Mortgage Obligations | | 13.02 | | | | 36,841,520 |
Registered Investment Companies | | 2.16 | | | | 6,104,535 |
Tax-Exempt Securities | | 1.31 | | | | 3,702,456 |
Asset Backed Securities | | 0.10 | | | | 294,413 |
| | |
|
| |
|
|
Total Investments | | 97.86 | % | | $ | 276,970,866 |
Other Assets in Excess of Liabilities | | 2.14 | | | | 6,045,059 |
| | |
|
| |
|
|
Net Assets | | 100.00 | % | | $ | 283,015,925 |
| | |
|
| |
|
|
See Notes to Financial Statements.
25
Excelsior Funds Trust
Portfolio of Investments — March 31, 2006
High Yield Fund
| | | | | | | | | | | |
| | | | | | | | | | | | |
Principal
Amount
| | | | Rate
| | | Maturity
Date
| | Value
|
| | CORPORATE BONDS — 88.98% |
| | | | ADVERTISING PERIODICALS — 2.16% |
| $ | 2,000,000 | | Dex Media Finance/West | | 8.50 | % | | 08/15/10 | | $ | 2,115,000 |
| | 1,000,000 | | RH Donnelley Finance Corp.(a) | | 10.88 | | | 12/15/12 | | | 1,108,750 |
| | | | | | | | | | |
|
|
| | | | | | | | | | | | 3,223,750 |
| | | | | | | | | | |
|
|
| | | | AGRICULTURAL CHEMICALS — 0.96% |
| | 1,298,000 | | Terra Capital, Inc. | | 11.50 | | | 06/01/10 | | | 1,434,290 |
| | | | | | | | | | |
|
|
| | | | AUTO-TRUCK PARTS & EQUIPMENT — 0.67% |
| | 1,000,000 | | Tenneco Automotive, Inc. | | 8.63 | | | 11/15/14 | | | 1,000,000 |
| | | | | | | | | | |
|
|
| | | | CABLE TV — 1.32% | | | | | | |
| | 1,000,000 | | Charter Communications Holdings II | | 10.25 | | | 09/15/10 | | | 982,500 |
| | 1,000,000 | | Echostar DBS Corp.(a) | | 7.13 | | | 02/01/16 | | | 983,750 |
| | | | | | | | | | |
|
|
| | | | | | | | | | | | 1,966,250 |
| | | | | | | | | | |
|
|
| | | | CASINO HOTELS — 10.25% |
| | 1,000,000 | | Aztar Corp. | | 7.88 | | | 06/15/14 | | | 1,082,500 |
| | 1,000,000 | | Boyd Gaming Corp. | | 8.75 | | | 04/15/12 | | | 1,067,500 |
| | 2,000,000 | | Caesars Entertainment, Inc. | | 8.88 | | | 09/15/08 | | | 2,140,000 |
| | 2,000,000 | | Kerzner International | | 6.75 | | | 10/01/15 | | | 2,105,000 |
| | 2,000,000 | | MGM Mirage, Inc. | | 8.50 | | | 09/15/10 | | | 2,139,999 |
| | 2,000,000 | | Poster Financial Group | | 8.75 | | | 12/01/11 | | | 2,105,000 |
| | 1,000,000 | | Resorts International Hotel and Casino, Inc. | | 11.50 | | | 03/15/09 | | | 1,097,500 |
| | 1,000,000 | | River Rock Entertainment | | 9.75 | | | 11/01/11 | | | 1,080,000 |
| | 1,000,000 | | Station Casinos | | 6.50 | | | 02/01/14 | | | 988,750 |
| | 1,500,000 | | Trump Entertainment Resorts | | 8.50 | | | 06/01/15 | | | 1,458,750 |
| | | | | | | | | | |
|
|
| | | | | | | | | | | | 15,264,999 |
| | | | | | | | | | |
|
|
| | | | CELLULAR TELECOM — 2.86% |
| | 2,000,000 | | American Cellular Corp | | 10.00 | | | 08/01/11 | | | 2,170,000 |
| | 1,000,000 | | Centennial Cellular Operating Co./ Centennial Communications Corp. | | 10.13 | | | 06/15/13 | | | 1,092,500 |
| | 1,000,000 | | Dobson Communications Corp. | | 8.88 | | | 10/01/13 | | | 1,005,000 |
| | | | | | | | | | |
|
|
| | | | | | | | | | | | 4,267,500 |
| | | | | | | | | | |
|
|
| | | | | | | | | | | |
| | | | | | | | | | | | |
Principal
Amount
| | | | Rate
| | | Maturity
Date
| | Value
|
| | CORPORATE BONDS — (continued) |
| | | | CHEMICALS - DIVERSIFIED — 3.54% |
| $ | 2,000,000 | | Equistar Chemicals L.P./Equistar Funding Corp. | | 10.63 | % | | 05/01/11 | | $ | 2,165,000 |
| | 500,000 | | Lyondell Chemical Co. | | 9.50 | | | 12/15/08 | | | 520,000 |
| | 1,000,000 | | Lyondell Chemical Co. | | 10.50 | | | 06/01/13 | | | 1,107,500 |
| | 1,500,000 | | Nell AF Sarl(a) | | 8.3 | | | 08/15/15 | | | 1,488,750 |
| | | | | | | | | | |
|
|
| | | | | | | | | | | | 5,281,250 |
| | | | | | | | | | |
|
|
| | | | CHEMICALS - PLASTICS — 0.69% |
| | 1,000,000 | | PolyOne Corp. | | 8.88 | | | 05/01/12 | | | 1,025,000 |
| | | | | | | | | | |
|
|
| | | | CHEMICALS - SPECIALTY — 1.39% |
| | 1,000,000 | | Johnsondiversey, Inc., Series B | | 9.63 | | | 05/15/12 | | | 1,026,250 |
| | 1,000,000 | | Tronox Worldwide(a) | | 9.50 | | | 12/01/12 | | | 1,050,000 |
| | | | | | | | | | |
|
|
| | | | | | | | | | | | 2,076,250 |
| | | | | | | | �� | | |
|
|
| | | | COAL — 0.33% | | | | | | |
| | 500,000 | | Massey Energy Co.(a) | | 6.88 | | | 12/15/13 | | | 490,000 |
| | | | | | | | | | |
|
|
| | | | COMMERCIAL SERVICES — 2.07% |
| | 2,000,000 | | Iron Mountain, Inc. | | 8.63 | | | 04/01/13 | | | 2,080,000 |
| | 1,000,000 | | Iron Mountain, Inc. | | 7.75 | | | 01/15/15 | | | 1,007,500 |
| | | | | | | | | | |
|
|
| | | | | | | | | | | | 3,087,500 |
| | | | | | | | | | |
|
|
| | | | CONTAINERS - METAL/GLASS — 2.05% |
| | 1,000,000 | | Crown Americas llc/Crown Americas Capital Corp.(a) | | 7.75 | | | 11/15/15 | | | 1,037,500 |
| | 2,000,000 | | Owens-Illinois, Inc. | | 7.50 | | | 05/15/10 | | | 2,025,000 |
| | | | | | | | | | |
|
|
| | | | | | | | | | | | 3,062,500 |
| | | | | | | | | | |
|
|
| | | | CONTAINERS - PAPER/PLASTIC — 2.76% |
| | 1,000,000 | | Graham Packaging Co. | | 8.50 | | | 10/15/12 | | | 1,010,000 |
| | 1,000,000 | | Pregis Corp.(a) | | 12.38 | | | 10/15/13 | | | 1,050,000 |
| | 2,000,000 | | Stone Container Corp. | | 9.75 | | | 02/01/11 | | | 2,055,000 |
| | | | | | | | | | |
|
|
| | | | | | | | | | | | 4,115,000 |
| | | | | | | | | | |
|
|
| | | | COSMETICS & TOILETRIES — 0.54% |
| | 1,000,000 | | Del Laboratories, Inc. | | 8.00 | | | 02/01/12 | | | 810,000 |
| | | | | | | | | | |
|
|
| | | | DISTRIBUTION/WHOLESALE — 1.23% |
| | 2,000,000 | | Nebraska Book Co. | | 8.63 | | | 03/15/12 | | | 1,840,000 |
| | | | | | | | | | |
|
|
| | | | ELECTRIC - GENERATION — 1.08% |
| | 1,500,000 | | AES Corp. | | 9.50 | | | 06/01/09 | | | 1,616,250 |
| | | | | | | | | | |
|
|
See Notes to Financial Statements.
26
Excelsior Funds Trust
Portfolio of Investments — March 31, 2006
High Yield Fund — (continued)
| | | | | | | | | | | |
| | | | | | | | | | | | |
Principal
Amount
| | | | Rate
| | | Maturity
Date
| | Value
|
| | CORPORATE BONDS — (continued) | | | |
| | | | FINANCE - AUTO LOANS — 3.98% |
| $ | 2,000,000 | | Ford Motor Credit Co. | | 6.50 | % | | 01/25/07 | | $ | 1,992,344 |
| | 2,000,000 | | General Motors Acceptance Corp. | | 6.13 | | | 02/01/07 | | | 1,969,126 |
| | 2,000,000 | | General Motors Acceptance Corp. | | 7.75 | | | 01/19/10 | | | 1,950,022 |
| | | | | | | | | | |
|
|
| | | | | | | | | | | | 5,911,492 |
| | | | | | | | | | |
|
|
| | | | FOOD - MISCELLANEOUS AND
DIVERSIFIED — 0.71% |
| | 1,000,000 | | Del Monte Corp. | | 8.63 | | | 12/15/12 | | | 1,056,250 |
| | | | | | | | | | |
|
|
| | | | FORESTRY — 0.61% | | | | | | | | |
| | 1,500,000 | | Tembec Industries, Inc. | | 8.63 | | | 06/30/09 | | | 903,750 |
| | | | | | | | | | |
|
|
| | | | FUNERAL SERVICES & RELATED ITEMS — 1.02% |
| | 1,500,000 | | Service Corp. International(a) | | 7.50 | | | 06/15/17 | | | 1,526,250 |
| | | | | | | | | | |
|
|
| | | | GAS - DISTRIBUTION — 1.39% | | | |
| | 2,000,000 | | SEMCO Energy, Inc. | | 7.75 | | | 05/15/13 | | | 2,072,824 |
| | | | | | | | | | |
|
|
| | | | HEAVY CONSTRUCTION EQUIPMENT
RENTAL —0.35% |
| | 500,000 | | Ahern Rentals, Inc.(b) | | 9.25 | | | 08/15/13 | | | 521,250 |
| | | | | | | | | | |
|
|
| | | | HOME FURNISHINGS — 2.70% |
| | 2,000,000 | | Sealy Mattress Co. | | 8.25 | | | 06/15/14 | | | 2,090,000 |
| | 2,000,000 | | Simmons Co. | | 7.88 | | | 01/15/14 | | | 1,935,000 |
| | | | | | | | | | |
|
|
| | | | | | | | | | | | 4,025,000 |
| | | | | | | | | | |
|
|
| | | | INDEPENDENT POWER PRODUCER — 0.68% |
| | 1,000,000 | | NRG Energy, Inc. | | 7.25 | | | 02/01/14 | | | 1,016,250 |
| | | | | | | | | | |
|
|
| | | | LIFE/HEALTH INSURANCE — 1.35% |
| | 2,000,000 | | Americo Life, Inc.(a) | | 7.88 | | | 05/01/13 | | | 2,015,928 |
| | | | | | | | | | |
|
|
| | | | MACHINERY - FARM — 0.33% |
| | 500,000 | | Case New Holland, Inc.(a) | | 7.13 | | | 03/01/14 | | | 493,750 |
| | | | | | | | | | |
|
|
| | | | MACHINERY - GENERAL INDUSTRIAL — 0.68% |
| | 1,000,000 | | The Manitowoc Co., Inc. | | 7.13 | | | 11/01/13 | | | 1,020,000 |
| | | | | | | | | | |
|
|
| | | | MEDICAL - HOSPITALS — 1.40% |
| | 1,000,000 | | HCA, Inc. | | 8.75 | | | 09/01/10 | | | 1,084,663 |
| | 1,000,000 | | IASIS Healthcare llc/ IASIS Capital Corp. | | 8.75 | | | 06/15/14 | | | 1,000,000 |
| | | | | | | | | | |
|
|
| | | | | | | | | | | | 2,084,663 |
| | | | | | | | | | |
|
|
| | | | MEDICAL - OUTPATIENT/HOME MEDICAL
CARE — 0.61% |
| | 1,000,000 | | Select Medical Corp. | | 7.63 | | | 02/01/15 | | | 902,500 |
| | | | | | | | | | |
|
|
| | | | | | | | | | | |
| | | | | | | | | | | | |
Principal
Amount
| | | | Rate
| | | Maturity
Date
| | Value
|
| | CORPORATE BONDS — (continued) | | | |
| | | | MEDICAL PRODUCTS — 0.68% |
| $ | 1,000,000 | | Encore Medical IHC, Inc. | | 9.75 | % | | 10/01/12 | | $ | 1,010,000 |
| | | | | | | | | | |
|
|
| | | | MISCELLANEOUS MANUFACTURING — 0.66% |
| | 1,000,000 | | Intertape Polymer US, Inc. | | 8.50 | | | 08/01/14 | | | 985,000 |
| | | | | | | | | | |
|
|
| | | | MULTI-LINE INSURANCE — 1.44% |
| | 2,128,000 | | Hanover Insurance Group | | 7.63 | | | 10/15/25 | | | 2,150,170 |
| | | | | | | | | | |
|
|
| | | | MULTIMEDIA — 1.30% |
| | 2,000,000 | | Emmis Operating Co. | | 6.88 | | | 05/15/12 | | | 1,930,000 |
| | | | | | | | | | |
|
|
| | | | MUSIC — 1.06% |
| | 1,600,000 | | Warner Music Group | | 7.38 | | | 04/15/14 | | | 1,584,000 |
| | | | | | | | | | |
|
|
| | | | NON-HAZARDOUS WASTE DISPOSAL — 1.41% |
| | 2,000,000 | | Allied Waste North America | | 8.88 | | | 04/01/08 | | | 2,100,000 |
| | | | | | | | | | |
|
|
| | | | OFFICE AUTOMATION & EQUIPMENT — 2.45% |
| | 1,000,000 | | Ikon Office Solutions | | 7.75 | | | 09/15/15 | | | 1,032,500 |
| | 1,000,000 | | Xerox Capital Trust I | | 8.00 | | | 02/01/27 | | | 1,035,000 |
| | 1,500,000 | | Xerox Corp. | | 7.63 | | | 06/15/13 | | | 1,578,750 |
| | | | | | | | | | |
|
|
| | | | | | | | | | | | 3,646,250 |
| | | | | | | | | | |
|
|
| | | | OIL COMPANY - EXPLORATION &
PRODUCTION — 1.35% |
| | 1,000,000 | | Chesapeake Energy Corp. | | 6.50 | | | 08/15/17 | | | 987,500 |
| | 1,000,000 | | Kerr-McGee Corp. | | 6.95 | | | 07/01/24 | | | 1,017,288 |
| | | | | | | | | | |
|
|
| | | | | | | | | | | | 2,004,788 |
| | | | | | | | | | |
|
|
| | | | OIL-FIELD SERVICES — 0.33% |
| | 500,000 | | Allis-Chalmers Energy, Inc.(a) | | 9.00 | | | 01/15/14 | | | 492,500 |
| | | | | | | | | | |
|
|
| | | | PAPER & RELATED PRODUCTS — 1.20% |
| | 1,000,000 | | Mercer International, Inc. | | 9.25 | | | 02/15/13 | | | 890,000 |
| | 890,000 | | Norske Skog Canada, Series D | | 8.63 | | | 06/15/11 | | | 894,450 |
| | | | | | | | | | |
|
|
| | | | | | | | | | | | 1,784,450 |
| | | | | | | | | | |
|
|
| | | | PHYSICIANS PRACTICE MANAGEMENT — 2.44% |
| | 2,000,000 | | Ameripath, Inc. | | 10.50 | | | 04/01/13 | | | 2,110,000 |
| | 500,000 | | US Oncology Holdings, Inc. | | 9.00 | | | 08/15/12 | | | 517,500 |
| | 1,000,000 | | US Oncology Holdings, Inc.(a)(c) | | 9.26 | | | 03/15/15 | | | 1,002,500 |
| | | | | | | | | | |
|
|
| | | | | | | | | | | | 3,630,000 |
| | | | | | | | | | |
|
|
See Notes to Financial Statements.
27
Excelsior Funds Trust
Portfolio of Investments — March 31, 2006
High Yield Fund — (continued)
| | | | | | | | | | | |
| | | | | | | | | | | | |
Principal
Amount
| | | | Rate
| | | Maturity
Date
| | Value
|
| | CORPORATE BONDS — (continued) | | | |
| | | | PIPELINES — 0.67% |
| $ | 500,000 | | Semgroup L.P.(a) | | 8.75 | % | | 11/15/15 | | $ | 510,000 |
| | 500,000 | | Williams Cos.(a) | | 6.38 | | | 10/01/10 | | | 495,000 |
| | | | | | | | | | |
|
|
| | | | | | | | | | | | 1,005,000 |
| | | | | | | | | | |
|
|
| | | | PRIVATE CORRECTIONS — 0.17% |
| | 250,000 | | Corrections Corp. of America | | 6.75 | | | 01/31/14 | | | 252,813 |
| | | | | | | | | | |
|
|
| | | | RENTAL AUTO/EQUIPMENT — 2.41% |
| | 1,000,000 | | Neff Rental/Neff Finance(a) | | 11.25 | | | 06/15/12 | | | 1,085,000 |
| | 2,500,000 | | United Rentals, Inc. | | 7.75 | | | 11/15/13 | | | 2,500,000 |
| | | | | | | | | | |
|
|
| | | | | | | | | | | | 3,585,000 |
| | | | | | | | | | |
|
|
| | | | RESORTS/THEME PARKS — 1.70% |
| | 1,500,000 | | Six Flags, Inc. | | 9.63 | | | 06/01/14 | | | 1,511,250 |
| | 1,000,000 | | Universal City Florida Holdings(c) | | 9.43 | | | 05/01/10 | | | 1,015,000 |
| | | | | | | | | | |
|
|
| | | | | | | | | | | | 2,526,250 |
| | | | | | | | | | |
|
|
| | | | RETAIL - DRUG STORE — 1.59% |
| | 1,000,000 | | Jean Coutu Group, Inc. | | 8.50 | | | 08/01/14 | | | 917,500 |
| | 1,500,000 | | Rite Aid Corp.(a) | | 6.13 | | | 12/15/08 | | | 1,458,750 |
| | | | | | | | | | |
|
|
| | | | | | | | | | | | 2,376,250 |
| | | | | | | | | | |
|
|
| | | | RETAIL - MAJOR DEPARTMENT STORE — 2.53% |
| | 1,500,000 | | JC Penney Co., Inc. | | 8.00 | | | 03/01/10 | | | 1,614,870 |
| | 1,000,000 | | Neiman Marcus Group, Inc.(a) | | 9.00 | | | 10/15/15 | | | 1,057,500 |
| | 1,000,000 | | Saks, Inc. | | 9.88 | | | 10/01/11 | | | 1,105,000 |
| | | | | | | | | | |
|
|
| | | | | | | | | | | | 3,777,370 |
| | | | | | | | | | |
|
|
| | | | RETAIL - VIDEO RENTAL — 1.17% |
| | 2,000,000 | | Blockbuster, Inc.(a)(c) | | 10.00 | | | 09/01/12 | | | 1,750,000 |
| | | | | | | | | | |
|
|
| | | | SATELLITE TELECOM — 1.14% |
| | 650,000 | | Inmarsat Finance plc | | 7.63 | | | 06/30/12 | | | 666,250 |
| | 1,000,000 | | Intelsat Ltd. | | 8.63 | | | 01/15/15 | | | 1,032,500 |
| | | | | | | | | | |
|
|
| | | | | | | | | | | | 1,698,750 |
| | | | | | | | | | |
|
|
| | | | SCHOOLS — 0.96% |
| | 1,500,000 | | Knowledge Learning Center(a) | | 7.75 | | | 02/01/15 | | | 1,428,750 |
| | | | | | | | | | |
|
|
| | | | STEEL - PRODUCERS — 2.32% |
| | 2,000,000 | | AK Steel Corp. | | 7.75 | | | 06/15/12 | | | 2,022,500 |
| | 1,298,000 | | United States Steel, Inc. | | 10.75 | | | 08/01/08 | | | 1,427,800 |
| | | | | | | | | | |
|
|
| | | | | | | | | | | | 3,450,300 |
| | | | | | | | | | |
|
|
| | | | TELEPHONE - INTERGRATED — 8.31% |
| | 2,000,000 | | Cincinnati Bell, Inc. | | 8.38 | | | 01/15/14 | | | 2,032,500 |
| | 2,000,000 | | Citizens Communications | | 9.25 | | | 05/15/11 | | | 2,195,000 |
| | | | | | | | | | | |
| | | | | | | | | | | | |
Principal
Amount
| | | | Rate
| | | Maturity
Date
| | Value
|
| | CORPORATE BONDS — (continued) | | | |
| | | | TELEPHONE - INTERGRATED — (continued) |
| $ | 649,000 | | Consolidated Communications Holding | | 9.75 | % | | 04/01/12 | | $ | 687,940 |
| | 1,000,000 | | Eircom Funding | | 8.25 | | | 08/15/13 | | | 1,076,250 |
| | 2,500,000 | | Hawaiian Telcom Communication(a) | | 12.50 | | | 05/01/15 | | | 2,475,000 |
| | 777,000 | | Madison River Capital llc/ Madison River Financial Corp. | | 13.25 | | | 03/01/10 | | | 815,850 |
| | 1,000,000 | | Qwest Capital Funding | | 7.75 | | | 02/15/31 | | | 1,017,500 |
| | 1,000,000 | | Qwest Corp. | | 7.50 | | | 06/15/23 | | | 1,016,250 |
| | 1,000,000 | | Valor Telecom Enterprise | | 7.75 | | | 02/15/15 | | | 1,047,500 |
| | | | | | | | | | |
|
|
| | | | | | | | | | | | 12,363,790 |
| | | | | | | | | | |
|
|
| | | | TRANSPORTATION - MARINE — 0.73% |
| | 1,000,000 | | Overseas Shipholding Group | | 8.75 | | | 12/01/13 | | | 1,095,000 |
| | | | | | | | | | |
|
|
| | | | TRANSPORTATION - RAIL — 1.25% |
| | 1,750,000 | | Kansas City Southern | | 9.50 | | | 10/01/08 | | | 1,868,125 |
| | | | | | | | | | |
|
|
| | | | TOTAL CORPORATE BONDS
(Cost $131,097,810) | | | 132,605,002 |
| | | | | | | | | | |
|
|
| | BANK LOANS — 1.64% | | | | | | | | |
| | | | CASINO HOTELS — 0.96% |
| | 1,443,172 | | Resorts International Holdings llc(c) | | 12.47 | | | 04/26/13 | | | 1,435,956 |
| | | | | | | | | | |
|
|
| | | | MISCELLANEOUS MANUFACTURING — 0.68% |
| | 1,000,000 | | IPC Acquistion Corp.(c) | | 12.09 | | | 08/05/12 | | | 1,015,000 |
| | | | | | | | | | |
|
|
| | | | TOTAL BANK LOANS
(Cost $2,451,766) | | | 2,450,956 |
| | | | | | | | | | |
|
|
| | | | |
Shares
| | | | | | | | | |
| | COMMON STOCK — 2.82% | | | | | | | | |
| | | | METAL - ALUMINUM — 2.82% | | | |
| | 28,047 | | Ormet Corp.(a) | | | 4,207,050 |
| | | | | | | | | | |
|
|
| | | | TOTAL COMMON STOCK (Cost $7,704,681) | | | 4,207,050 |
| | | | | | | | | | |
|
|
| | | | |
Principal
Amount
| | | | | | | | | |
| | U.S. GOVERNMENT AGENCY BONDS & NOTES — 5.37% |
| | | | FEDERAL HOME LOAN BANK — 5.37% |
| $ | 8,000,000 | | Discount Note | | 4.60 | | | 04/03/06 | | | 7,997,956 |
| | | | | | | | | | |
|
|
| | | | TOTAL U.S. GOVERNMENT AGENCY BONDS & NOTES
(Cost $7,997,956) | | | 7,997,956 |
| | | | | | | | | | |
|
|
See Notes to Financial Statements.
28
Excelsior Funds Trust
Portfolio of Investments — March 31, 2006
High Yield Fund — (continued)
| | | | | | |
| | | | | | Value
|
TOTAL INVESTMENTS
(Cost $149,252,213)(d) | | 98.81 | % | | $ | 147,260,964 |
OTHER ASSETS IN EXCESS OF LIABILITIES | | 1.19 | | | | 1,774,875 |
| | |
|
| |
|
|
NET ASSETS | | 100.00 | % | | $ | 149,035,839 |
| | |
|
| |
|
|
| (a) | Security exempt from registration under Rule 144A of the Securities Act of 1933. This security may be resold in transactions exempt from registration, normally to qualified institutional buyers. At March 31, 2006, these securities amounted to $27,206,728 or 18.26% of net assets. |
| (b) | All or part of the security is segregated by the Fund’s custodian to cover future purchase commitments. |
| (c) | Variable Rate Security—The rate disclosed is as of March 31, 2006. |
| (d) | Unrealized appreciation (depreciation) of securities: |
| | | | | | | | |
Unrealized
Appreciation
| | Unrealized
(Depreciation)
| | | Net Unrealized
Appreciation/(Depreciation)
| |
$2,922,653 | | $ | (4,913,902 | ) | | $ | (1,991,249 | ) |
Discount Note—The rate reported on the Portfolio of Investments is the discount rate at the time of purchase.
llc—Limited Liability Company
L.P.—Limited Partnership
Ltd.—Limited
plc—Public Limited Company
See Notes to Financial Statements.
29
The summary of the Fund’s investments as of March 31, 2006 is as follows: (Unaudited)
| | | | | | |
Sector Diversification
| | % of
Net
Assets
| | | Value
|
Consumer Discretionary | | 37.97 | % | | $ | 56,588,193 |
Raw/Intermediate Materials | | 19.42 | | | | 28,936,090 |
Telecommunication | | 11.85 | | | | 17,663,790 |
Health Care | | 6.14 | | | | 9,153,413 |
Industrials | | 5.97 | | | | 8,901,563 |
U.S. Government & Agency Obligations | | 5.37 | | | | 7,997,956 |
Financials | | 2.79 | | | | 4,166,097 |
Energy | | 2.69 | | | | 4,003,538 |
Utilities | | 2.48 | | | | 3,689,074 |
Technology | | 2.20 | | | | 3,280,000 |
Consumer Staples | | 1.25 | | | | 1,866,250 |
Information Technology | | 0.68 | | | | 1,015,000 |
| | |
|
| |
|
|
Total Investments | | 98.81 | % | | $ | 147,260,964 |
Other Assets in Excess of Liabilities | | 1.19 | | | | 1,774,875 |
| | |
|
| |
|
|
Net Assets | | 100.00 | % | | $ | 149,035,839 |
| | |
|
| |
|
|
Excelsior Funds, Inc.
Portfolio of Investments — March 31, 2006
Income Fund
| | | | | | | | | | |
Principal
Amount
| | | | Rate
| | | Maturity
Date
| | Value
|
| | | | | | | | | | | |
COLLATERALIZED MORTGAGE OBLIGATIONS — 7.19% |
| | | NON-GOVERNMENTAL AGENCY COLLATERALIZED MORTGAGE OBLIGATIONS — 7.19% | | | |
| $ 937,568 | | Countrywide Alternative Loan Trust, 2004-22CB 1A1 | | 6.00 | % | | 10/25/34 | | $ | 928,316 |
| 686,417 | | Indymac Index Mortgage Loan Trust, 2004-AR4 3A(a) | | 4.80 | | | 08/25/34 | | | 671,778 |
| 4,361,914 | | Wells Fargo Mortgage Backed Securities Trust, 2004-EE 3A1(a) | | 3.99 | | | 12/25/34 | | | 4,230,953 |
| 1,365,623 | | Wells Fargo Mortgage Backed Securities Trust, 2005-AR1 1A1(a) | | 4.55 | | | 02/25/35 | | | 1,331,891 |
| | | | | | | | | |
|
|
| | | | | | | | | | | 7,162,938 |
| | | | | | | | | |
|
|
| | | TOTAL COLLATERALIZED MORTGAGE OBLIGATIONS
(Cost $7,361,717) | | | 7,162,938 |
| | | | | | | | | |
|
|
COMMERCIAL MORTGAGE-BACKED SECURITIES — 8.28% |
| 589,958 | | Asset Securitization Corp., 1997-D4 A4(a) | | 7.00 | | | 04/14/29 | | | 629,914 |
| 793,901 | | Bear Stearns Adjustable Rate Mortgage Trust, 2004-10, 15A1(a) | | 4.58 | | | 01/25/35 | | | 780,654 |
| 436,163 | | DLJ Commercial Mortgage Corp., 2000-CF1 A1A | | 7.45 | | | 06/10/33 | | | 437,755 |
| 1,781,000 | | GMAC Commercial Mortgage Securities, 1999-C1(a) | | 6.84 | | | 05/15/33 | | | 1,851,091 |
| 173,845 | | Morgan Stanley Dean Witter Capital I, 2003-TOP9 A2 | | 4.74 | | | 11/13/36 | | | 166,579 |
| 621,376 | | Mortgage Capital Funding, Inc., 1998-MC1 C | | 6.95 | | | 03/18/30 | | | 636,808 |
| 425,887 | | Nomura Asset Securities Corp., 1998-D6 A4(a) | | 6.92 | | | 03/15/30 | | | 477,836 |
| 2,232,811 | | Salomon Brothers Mortgage Securities VII, 2001-C2 A2 | | 6.17 | | | 02/13/10 | | | 2,259,267 |
| 964,217 | | Wachovia Bank Commercial Mortgage Trust, 2002-C1 A4 | | 6.29 | | | 04/15/34 | | | 1,006,022 |
| | | | | | | | | |
|
|
| | | TOTAL COMMERCIAL MORTGAGE-BACKED SECURITIES (Cost $8,638,062) | | | 8,245,926 |
| | | | | | | | | |
|
|
| | | | | | | | | | |
Principal
Amount
| | | | Rate
| | | Maturity
Date
| | Value
|
| | | | | | | | | | | |
CORPORATE BONDS — 18.10% | | | | | | | | |
| $ 516,650 | | Bank One Corp. | | 7.88 | % | | 08/01/10 | | $ | 563,363 |
| 1,110,000 | | Bear Stearns Co., Inc. | | 5.70 | | | 11/15/14 | | | 1,105,905 |
| 1,060,000 | | Bottling Group llc | | 5.50 | | | 04/01/16 | | | 1,046,386 |
| 600,000 | | British Telecommunications plc | | 8.88 | | | 12/15/30 | | | 767,569 |
| 600,000 | | Caterpillar Financial Service Corp. MTN | | 3.00 | | | 02/15/07 | | | 588,946 |
| 965,000 | | CIT Group, Inc. | | 5.88 | | | 10/15/08 | | | 976,387 |
| 1,170,000 | | Citigroup, Inc. | | 6.63 | | | 06/15/32 | | | 1,252,896 |
| 308,593 | | Deutsche Telekom International Finance, Multi-Coupon Bond | | 8.50 | | | 06/15/10 | | | 336,069 |
| 600,000 | | Devon Financing Corp. | | 6.88 | | | 09/30/11 | | | 636,137 |
| 1,344,792 | | General Electric Capital Corp. MTN | | 6.00 | | | 06/15/12 | | | 1,381,092 |
| 1,221,000 | | Goldman Sachs Group, Inc. | | 6.13 | | | 02/15/33 | | | 1,213,912 |
| 1,000,078 | | Household Finance Corp. | | 8.00 | | | 07/15/10 | | | 1,091,232 |
| 380,000 | | International Lease Finance Corp. | | 4.50 | | | 05/01/08 | | | 373,636 |
| 1,388,000 | | JP Morgan Chase & Co. | | 5.75 | | | 01/02/13 | | | 1,397,284 |
| 1,500,000 | | Merrill Lynch & Co. MTN | | 5.00 | | | 02/03/14 | | | 1,438,532 |
| 1,700,000 | | Metlife, Inc. | | 5.00 | | | 11/24/13 | | | 1,631,669 |
| 1,700,000 | | Morgan Stanley | | 4.75 | | | 04/01/14 | | | 1,586,088 |
| 665,000 | | Oracle Corp./Ozark Holdings(b) | | 5.25 | | | 01/15/16 | | | 637,930 |
| | | | | | | | | |
|
|
| | | TOTAL CORPORATE BONDS (Cost $18,575,227) | | | 18,025,033 |
| | | | | | | | | |
|
|
TAX-EXEMPT SECURITIES — 1.55% |
| 530,000 | | California State Economic Recovery, Special Sales Tax Revenue Bonds, Series A, (FGIC) | | 5.25 | | | 07/01/14 | | | 577,631 |
| 900,000 | | Massachusetts Bay Transition Authority, Massachusetts Sales Tax, Revenue Bonds, Series A | | 5.00 | | | 07/01/31 | | | 970,254 |
| | | | | | | | | |
|
|
| | | TOTAL TAX-EXEMPT SECURITIES (Cost $1,565,284) | | | 1,547,885 |
| | | | | | | | | |
|
|
U.S. GOVERNMENT AGENCY BONDS & NOTES — 6.75% |
| | | FANNIE MAE — 2.61% | | | |
| 2,500,000 | | MTN | | 6.25 | | | 02/01/11 | | | 2,592,757 |
| | | | | | | | | |
|
|
| | | FREDDIE MAC — 1.83% | | | |
| 1,615,799 | | | | 6.25 | | | 07/15/32 | | | 1,824,551 |
| | | | | | | | | |
|
|
See Notes to Financial Statements.
30
Excelsior Funds, Inc.
Portfolio of Investments — March 31, 2006
Income Fund — (continued)
| | | | | | | | | | |
Principal
Amount
| | | | Rate
| | | Maturity
Date
| | Value
|
| | | | | | | | | | | |
U.S. GOVERNMENT AGENCY BONDS & NOTES — (continued) |
| | | RESOLUTION FUNDING CORPORATION —2.31% |
| $4,851,000 | | Principal Only STRIPS | | 0.00 | % | | 07/15/20 | | $ | 2,299,044 |
| | | | | | | | | |
|
|
| | | TOTAL U.S. GOVERNMENT AGENCY BONDS & NOTES
(Cost $6,536,011) | | | 6,716,352 |
| | | | | | | | | |
|
|
U.S. GOVERNMENT AGENCY MORTGAGE PASS THROUGH SECURITIES — 43.83% |
| | | FEDERAL HOME LOAN MORTGAGE CORPORATION — 13.44% | | | |
| 21,055 | | Pool # C74339 | | 5.00 | | | 12/01/32 | | | 20,098 |
| 165,564 | | Pool # C74469 | | 5.00 | | | 12/01/32 | | | 158,040 |
| 37,007 | | Pool # C74676 | | 5.00 | | | 12/01/32 | | | 35,325 |
| 2,736,460 | | Pool # E96460 | | 5.00 | | | 05/01/18 | | | 2,672,057 |
| 5,000,000 | | Pool # G18105 | | 5.00 | | | 03/01/21 | | | 4,873,391 |
| 598,875 | | Pool # M80779 | | 5.00 | | | 11/01/09 | | | 593,770 |
| 2,340,762 | | Pool # M80812 | | 4.50 | | | 04/01/10 | | | 2,298,541 |
| 2,750,000 | | TBA | | 5.50 | | | 04/01/21 | | | 2,731,094 |
| | | | | | | | | |
|
|
| | | | | | | | | | | 13,382,316 |
| | | | | | | | | |
|
|
| | | FEDERAL NATIONAL MORTGAGE ASSOCIATION — 23.63% | | | |
| 12,012 | | Pool # 190319 | | 6.50 | | | 02/01/32 | | | 12,289 |
| 267,842 | | Pool # 251502 | | 6.50 | | | 02/01/13 | | | 274,109 |
| 12,008 | | Pool # 252212 | | 6.50 | | | 01/01/29 | | | 12,312 |
| 109,090 | | Pool # 252806 | | 7.50 | | | 10/01/29 | | | 114,103 |
| 9,171 | | Pool # 254406 | | 6.50 | | | 08/01/32 | | | 9,376 |
| 238,620 | | Pool # 443194 | | 5.50 | | | 10/01/28 | | | 233,905 |
| 5,788 | | Pool # 450846 | | 5.50 | | | 12/01/28 | | | 5,674 |
| 425,885 | | Pool # 452035 | | 5.50 | | | 11/01/28 | | | 417,469 |
| 2,811 | | Pool # 454758 | | 5.50 | | | 12/01/28 | | | 2,755 |
| 5,154 | | Pool # 485994 | | 5.50 | | | 01/01/29 | | | 5,053 |
| 5,439 | | Pool # 502922 | | 6.50 | | | 07/01/29 | | | 5,576 |
| 1,656 | | Pool # 509676 | | 6.50 | | | 08/01/29 | | | 1,698 |
| 6,004 | | Pool # 535506 | | 6.50 | | | 08/01/30 | | | 6,155 |
| 3,964 | | Pool # 535911 | | 6.50 | | | 05/01/31 | | | 4,056 |
| 17,197 | | Pool # 535923 | | 6.50 | | | 05/01/31 | | | 17,594 |
| 7,082 | | Pool # 535933 | | 6.50 | | | 05/01/31 | | | 7,246 |
| 4,020 | | Pool # 545264 | | 6.50 | | | 09/01/31 | | | 4,113 |
| 20,255 | | Pool # 545759 | | 6.50 | | | 07/01/32 | | | 20,709 |
| 1,625 | | Pool # 547757 | | 6.50 | | | 11/01/30 | | | 1,663 |
| 2,864 | | Pool # 556702 | | 6.50 | | | 11/01/30 | | | 2,930 |
| 20,217 | | Pool # 559894 | | 6.50 | | | 04/01/31 | | | 20,684 |
| 644,716 | | Pool # 561435 | | 5.50 | | | 11/01/29 | | | 631,976 |
| 3,443 | | Pool # 562567 | | 6.50 | | | 02/01/31 | | | 3,522 |
| 311,144 | | Pool # 578543 | | 5.50 | | | 04/01/31 | | | 304,645 |
| 3,853 | | Pool # 583053 | | 6.50 | | | 05/01/31 | | | 3,942 |
| 114,412 | | Pool # 627259 | | 5.50 | | | 02/01/32 | | | 111,950 |
| 1,210,088 | | Pool # 632551 | | 5.50 | | | 02/01/32 | | | 1,184,055 |
| 567,481 | | Pool # 632576 | | 5.50 | | | 02/01/32 | | | 555,627 |
| 429,482 | | Pool # 645136 | | 6.50 | | | 06/01/32 | | | 439,106 |
| 5,650 | | Pool # 662505 | | 6.50 | | | 10/01/32 | | | 5,777 |
| 266,101 | | Pool # 694655 | | 5.50 | | | 04/01/33 | | | 260,265 |
| 1,751,999 | | Pool # 704440 | | 5.00 | | | 05/01/18 | | | 1,711,537 |
| 73,243 | | Pool # 710585 | | 5.50 | | | 05/01/33 | | | 71,637 |
| | | | | | | | | | |
Principal
Amount
| | | | Rate
| | | Maturity
Date
| | Value
|
| | | | | | | | | | | |
U.S. GOVERNMENT AGENCY MORTGAGE PASS THROUGH SECURITIES — (continued) |
| | | FEDERAL NATIONAL MORTGAGE ASSOCIATION — (continued) | | | |
| $ 370,636 | | Pool # 735224 | | 5.50 | % | | 02/01/35 | | $ | 362,508 |
| 2,033,158 | | Pool # 777206 | | 4.00 | | | 05/01/19 | | | 1,903,763 |
| 1,746,409 | | Pool # 786423 ARM(a) | | 4.62 | | | 07/01/34 | | | 1,723,203 |
| 496,550 | | Pool # 797680 | | 4.50 | | | 10/01/35 | | | 459,339 |
| 584,334 | | Pool # 805373 | | 4.50 | | | 01/01/35 | | | 540,545 |
| 2,518,716 | | Pool # 805386 ARM(a) | | 4.90 | | | 01/01/35 | | | 2,491,599 |
| 1,928,673 | | Pool # 822799 | | 4.50 | | | 04/01/35 | | | 1,779,697 |
| 6,471,852 | | Pool # 829321 | | 4.50 | | | 09/01/35 | | | 5,971,946 |
| 1,974,642 | | Pool # 844797 | | 4.50 | | | 10/01/35 | | | 1,822,115 |
| | | | | | | | | |
|
|
| | | | | | | | | | | 23,518,223 |
| | | | | | | | | |
|
|
| | | GOVERNMENT NATIONAL MORTGAGE ASSOCIATION — 6.76% | | | |
| 49,464 | | Pool # 434772 | | 9.00 | | | 06/15/30 | | | 53,856 |
| 63,609 | | Pool # 471660 | | 7.50 | | | 03/15/28 | | | 66,797 |
| 151,962 | | Pool # 472028 | | 6.50 | | | 05/15/28 | | | 157,731 |
| 92,507 | | Pool # 475847 | | 6.50 | | | 06/15/28 | | | 96,019 |
| 2,950 | | Pool # 479087 | | 8.00 | | | 01/15/30 | | | 3,155 |
| 50,176 | | Pool # 479088 | | 8.00 | | | 01/15/30 | | | 53,657 |
| 137,474 | | Pool # 503711 | | 7.00 | | | 05/15/29 | | | 143,397 |
| 42,435 | | Pool # 525556 | | 8.00 | | | 01/15/30 | | | 45,379 |
| 11,403 | | Pool # 525945 | | 9.00 | | | 07/15/30 | | | 12,416 |
| 306,312 | | Pool # 575441 | | 6.50 | | | 12/15/31 | | | 317,668 |
| 892,151 | | Pool # 598127 | | 5.50 | | | 03/15/18 | | | 892,696 |
| 1,697,729 | | Pool # 607668 | | 5.50 | | | 02/15/18 | | | 1,698,764 |
| 906,516 | | Pool # 615639 | | 4.50 | | | 09/15/33 | | | 854,069 |
| 198,674 | | Pool # 780086 | | 8.50 | | | 11/15/17 | | | 212,515 |
| 598,101 | | Pool # 780548 | | 8.50 | | | 12/15/17 | | | 639,766 |
| 472,875 | | Pool # 780865 | | 9.50 | | | 11/15/17 | | | 516,707 |
| 231,920 | | Pool # 781036 | | 8.00 | | | 10/15/17 | | | 245,486 |
| 356,097 | | Pool # 781084 | | 9.00 | | | 12/15/17 | | | 381,816 |
| 36,156 | | Pool # 80185 ARM(a) | | 4.38 | | | 04/20/28 | | | 36,204 |
| 173,108 | | Pool # 80205 ARM(a) | | 4.38 | | | 06/20/28 | | | 173,352 |
| 134,399 | | Pool # 80311 ARM(a) | | 4.50 | | | 08/20/29 | | | 134,288 |
| | | | | | | | | |
|
|
| | | | | | | | | | | 6,735,738 |
| | | | | | | | | |
|
|
| | | TOTAL U.S. GOVERNMENT AGENCY MORTGAGE PASS THROUGH SECURITIES
(Cost $44,346,908) | | | 43,636,277 |
| | | | | | | | | |
|
|
U.S. GOVERNMENT SECURITIES — 8.29% |
| | | U.S. TREASURY PRINCIPAL ONLY STRIPS — 0.79% | | | |
| 1,400,000 | | | | 0.00 | | | 11/15/17 | | | 782,586 |
| 118 | | | | 0.00 | | | 02/15/20 | | | 59 |
| | | | | | | | | |
|
|
| | | | | | | | | | | 782,645 |
| | | | | | | | | |
|
|
See Notes to Financial Statements.
31
Excelsior Funds, Inc.
Portfolio of Investments — March 31, 2006
Income Fund — (continued)
| | | | | | | | | | |
Principal
Amount
| | | | Rate
| | | Maturity
Date
| | Value
|
| | | | | | | | | | | |
U.S. GOVERNMENT SECURITIES — (continued) |
| | | U.S. TREASURY INFLATION PROTECTED BONDS — 2.69% | | | |
| $ 445,000 | | | | 3.50 | % | | 01/15/11 | | $ | 535,951 |
| 2,050,000 | | | | 2.00 | | | 01/15/14 | | | 2,147,208 |
| | | | | | | | | |
|
|
| | | | | | | | | | | 2,683,159 |
| | | | | | | | | |
|
|
| | | U.S. TREASURY NOTES — 4.81% | | | |
| $5,000,000 | | (c) | | 3.63 | | | 01/15/10 | | | 4,793,359 |
| | | | | | | | | |
|
|
| | | TOTAL U.S. GOVERNMENT SECURITIES (Cost $8,519,807) | | | 8,259,163 |
| | | | | | | | | |
|
|
Shares
| | | | | | | | | |
REGISTERED INVESTMENT COMPANIES — 5.91% |
| 2,942,667 | | Dreyfus Government Cash Management Fund | | | 2,942,667 |
| 2,942,667 | | Fidelity U.S. Treasury II Fund | | | 2,942,667 |
| | | | | | | | | |
|
|
| | | TOTAL REGISTERED INVESTMENT COMPANIES
(Cost $5,885,334) | | | 5,885,334 |
| | | | | | | | | |
|
|
| | | | | | |
TOTAL INVESTMENTS (Cost $101,428,350)(d) | | 99.90 | % | | $ | 99,478,908 |
OTHER ASSETS IN EXCESS OF LIABILITIES | | 0.10 | | | | 95,173 |
| | |
|
| |
|
|
NET ASSETS | | 100.00 | % | | $ | 99,574,081 |
| | |
|
| |
|
|
| (a) | Variable Rate Security—The rate disclosed is as of March 31, 2006. |
| (b) | Security exempt from registration under Rule 144a of the Securities Act of 1933. This security may be resold in transactions exempt from registration, normally to qualified institutional buyers. At March 31, 2006, these securities amounted to $637,930 or 0.64% of net assets. |
| (c) | All or part of the security is segregated by the Fund’s custodian to cover future purchase commitments. |
| (d) | Unrealized appreciation (depreciation) of securities: |
| | | | | | | | |
Unrealized
Appreciation
| | Unrealized
(Depreciation)
| | | Net Unrealized
Appreciation/(Depreciation)
| |
$419,150 | | $ | (2,368,592 | ) | | $ | (1,949,442 | ) |
ARM—Adjustable Rate Mortgage
FGIC—Financial Guaranty Insurance Corp.
llc—Limited Liability Company
MTN—Medium Term Note
Multi-Coupon Bond—Coupon rate may increase or decrease in response to a change in the quality rating by an independent rating agency.
plc—Public Limited Company
STRIPS—Separately Traded Registered Interest and Principal Securities
The summary of the Fund’s investments as of March 31, 2006 is as follows: (Unaudited)
| | | | | | |
Portfolio Diversification
| | % of
Net
Assets
| | | Value
|
U.S. Government & Agency Securities | | 58.87 | % | | $ | 58,611,792 |
Corporate Bonds | | 18.10 | | | | 18,025,033 |
Commercial Mortgage-Backed Securities | | 8.28 | | | | 8,245,926 |
Collateralized Mortgage Obligations | | 7.19 | | | | 7,162,938 |
Registered Investment Companies | | 5.91 | | | | 5,885,334 |
Tax-Exempt Securities | | 1.55 | | | | 1,547,885 |
| | |
|
| |
|
|
Total Investments | | 99.90 | % | | $ | 99,478,908 |
Other Assets in Excess of Liabilities | | 0.10 | | | | 95,173 |
| | |
|
| |
|
|
Net Assets | | 100.00 | % | | $ | 99,574,081 |
| | |
|
| |
|
|
See Notes to Financial Statements.
32
Excelsior Funds Trust
Portfolio of Investments — March 31, 2006
Total Return Bond Fund
| | | | | | | | | | | |
Principal
Amount
| | | | Rate
| | | Maturity
Date
| | Value
|
| | | | | | | | | | | | |
| | COLLATERALIZED MORTGAGE OBLIGATIONS — 13.12% |
| | | | NON-GOVERNMENTAL AGENCY COLLATERALIZED MORTGAGE OBLIGATIONS — 8.16% |
| $ | 1,847,344 | | Countrywide Alternative Loan Trust,
2004-16CB 1A2 | | 5.50 | % | | 07/25/34 | | $ | 1,813,357 |
| | 2,283,035 | | Indymac Index Mortgage Loan Trust, 2004-AR4 3A(a) | | 4.80 | | | 08/25/34 | | | 2,234,345 |
| | 5,493,027 | | Wells Fargo Mortgage Backed Securities Trust,
2004-EE 3A1 | | 3.99 | | | 12/25/34 | | | 5,328,105 |
| | 1,903,596 | | Wells Fargo Mortgage Backed Securities Trust,
2005-AR1 1A1(a) | | 4.55 | | | 02/25/35 | | | 1,856,575 |
| | | | | | | | | | |
|
|
| | | | | | | | | | | | 11,232,382 |
| | | | | | | | | | |
|
|
| | | | FEDERAL HOME LOAN MORTGAGE
CORPORATION — 1.58% |
| | 2,163,687 | | 1602 PH | | 6.00 | | | 04/15/23 | | | 2,168,608 |
| | | | | | | | | | |
|
|
| | | | FEDERAL NATIONAL MORTGAGE
ASSOCIATION — 3.38% |
| | 3,000,000 | | 1997-M5 C | | 6.74 | | | 08/25/07 | | | 3,038,348 |
| | 1,650,000 | | 2003-17 QT | | 5.00 | | | 08/25/27 | | | 1,620,333 |
| | | | | | | | | | |
|
|
| | | | | | | | | | | | 4,658,681 |
| | | | | | | | | | |
|
|
| | | | TOTAL COLLATERALIZED MORTGAGE OBLIGATIONS
(Cost $18,436,431) | | | 18,059,671 |
| | | | | | | | | | |
|
|
| | COMMERCIAL MORTGAGE-BACKED SECURITIES — 19.61% |
| | 3,635,042 | | Asset Securitization Corp.,
1997-D4 A4(a) | | 7.00 | | | 04/14/29 | | | 3,881,234 |
| | 1,020,000 | | Bank of America Commercial Mortgage, Inc.,
2004-1 A4 | | 4.76 | | | 11/10/39 | | | 967,273 |
| | 831,626 | | DLJ Commercial Mortgage Corp.,
2000-CF1 A1A | | 7.45 | | | 06/10/33 | | | 834,663 |
| | 1,760,000 | | Greenwich Capital Commercial Funding Corp.,
2004-GG1 A1 | | 5.32 | | | 06/10/36 | | | 1,729,290 |
| | 1,030 | | LB Commercial Conduit Mortgage Trust, 1999-C1 A1 | | 6.41 | | | 06/15/31 | | | 1,030 |
| | 1,071,155 | | Morgan Stanley Dean Witter Capital I,
2003-TOP9 A2 | | 4.74 | | | 11/13/36 | | | 1,026,387 |
| | | | | | | | | | | |
Principal
Amount
| | | | Rate
| | | Maturity
Date
| | Value
|
| | | | | | | | | | | | |
| | COMMERCIAL MORTGAGE-BACKED SECURITIES — (continued) |
| $ | 1,476,776 | | Mortgage Capital Funding, Inc.,
1996-MC1 G | | 7.15 | % | | 06/15/06 | | $ | 1,474,274 |
| | 3,828,624 | | Mortgage Capital Funding, Inc.,
1998-MC1 C | | 6.95 | | | 03/18/30 | | | 3,923,706 |
| | 2,624,113 | | Nomura Asset Securities Corp.,
1998-D6 A4(a) | | 6.92 | | | 03/15/30 | | | 2,944,197 |
| | 5,162,189 | | Salomon Brothers Mortgage Securities VII, 2001-C2 A2 | | 6.17 | | | 02/13/10 | | | 5,223,354 |
| | 3,260,783 | | Wachovia Bank Commercial Mortgage Trust,
2002-C1 A4 | | 6.29 | | | 04/15/34 | | | 3,402,160 |
| | 1,600,000 | | Wachovia Bank Commercial Mortgage Trust,
2004-C12 A3 | | 5.23 | | | 07/15/41 | | | 1,584,648 |
| | | | | | | | | | |
|
|
| | | | TOTAL COMMERCIAL MORTGAGE-BACKED SECURITIES
(Cost $26,812,933) | | | 26,992,216 |
| | | | | | | | | | |
|
|
| | CORPORATE BONDS — 34.56% | | | | | | | | |
| | 1,500,000 | | America Movil S.A. de C.V. | | 5.50 | | | 03/01/14 | | | 1,437,588 |
| | 1,200,000 | | America Movil S.A. de C.V. | | 6.38 | | | 03/01/35 | | | 1,128,280 |
| | 3,743,000 | | American Express Co. | | 5.50 | | | 09/12/06 | | | 3,750,819 |
| | 3,183,350 | | Bank One Corp. | | 7.88 | | | 08/01/10 | | | 3,471,176 |
| | 2,135,000 | | Bear Stearns Co., Inc. | | 5.70 | | | 11/15/14 | | | 2,127,124 |
| | 1,455,000 | | Bottling Group llc | | 5.50 | | | 04/01/16 | | | 1,436,313 |
| | 1,000,000 | | British Telecommunications plc | | 8.88 | | | 12/15/30 | | | 1,279,281 |
| | 1,375,000 | | CIT Group, Inc. | | 5.88 | | | 10/15/08 | | | 1,391,225 |
| | 800,000 | | Citigroup, Inc. | | 6.63 | | | 06/15/32 | | | 856,681 |
| | 1,296,000 | | DaimlerChrysler NA Holding Corp. | | 6.40 | | | 05/15/06 | | | 1,297,600 |
| | 1,500,000 | | DaimlerChrysler NA Holding Corp. | | 4.05 | | | 06/04/08 | | | 1,453,503 |
| | 1,001,407 | | Deutsche Telekom International Finance, Multi-Coupon Bond | | 8.50 | | | 06/15/10 | | | 1,090,567 |
| | 1,500,000 | | Deutsche Telekom International Finance, Multi-Coupon Bond | | 8.25 | | | 06/15/30 | | | 1,794,347 |
| | 800,000 | | Devon Financing Corp. | | 6.88 | | | 09/30/11 | | | 848,182 |
| | 700,000 | | Ford Motor Credit Co. | | 5.80 | | | 01/12/09 | | | 639,280 |
See Notes to Financial Statements.
33
Excelsior Funds Trust
Portfolio of Investments — March 31, 2006
Total Return Bond Fund — (continued)
| | | | | | | | | | | |
Principal
Amount
| | | | Rate
| | | Maturity
Date
| | Value
|
| | | | | | | | | | | | |
| | CORPORATE BONDS — (continued) |
| $ | 5,205,208 | | General Electric Capital Corp. MTN | | 6.00 | % | | 06/15/12 | | $ | 5,345,713 |
| | 2,060,922 | | Household Finance Corp. | | 8.00 | | | 07/15/10 | | | 2,248,769 |
| | 2,300,000 | | International Lease Finance Corp. | | 4.50 | | | 05/01/08 | | | 2,261,482 |
| | 3,277,000 | | Lehman Brothers Holdings | | 4.00 | | | 01/22/08 | | | 3,204,532 |
| | 1,000,000 | | Merrill Lynch & Co. MTN | | 5.00 | | | 02/03/14 | | | 959,021 |
| | 885,000 | | Metlife, Inc. | | 5.00 | | | 11/24/13 | | | 849,427 |
| | 885,000 | | Morgan Stanley | | 4.75 | | | 04/01/14 | | | 825,699 |
| | 1,500,000 | | Nisource Finance Corp. | | 7.88 | | | 11/15/10 | | | 1,627,059 |
| | 1,470,000 | | Oracle Corp./Ozark Holdings(b) | | 5.25 | | | 01/15/16 | | | 1,410,161 |
| | 1,430,000 | | Sprint Capital Corp. | | 8.38 | | | 03/15/12 | | | 1,615,757 |
| | 1,000,000 | | TCI Communications, Inc. | | 9.80 | | | 02/01/12 | | | 1,178,418 |
| | 1,030,000 | | Time Warner Cos., Inc. | | 7.25 | | | 10/15/17 | | | 1,102,156 |
| | 1,000,000 | | Wal-Mart Stores | | 4.13 | | | 02/15/11 | | | 946,762 |
| | | | | | | | | | |
|
|
| | | | TOTAL CORPORATE BONDS
(Cost $47,960,139) | | | 47,576,922 |
| | | | | | | | | | |
|
|
| | TAX-EXEMPT SECURITIES — 3.49% |
| | 2,000,000 | | Arizona State, Water Infrastructure Finance Authority, Revenue Bonds, Series A | | 5.00 | | | 10/01/16 | | | 2,125,000 |
| | 1,800,000 | | California State, Infrastructure & Economic Development Bank, Revenue Bonds, Bay Area Toll Bridges Project, Series A | | 5.25 | | | 07/01/16 | | | 1,942,434 |
| | 690,000 | | Massachusetts Bay Transition Authority, Massachusetts Sales Tax, Revenue Bonds, Series A | | 5.00 | | | 07/01/31 | | | 743,861 |
| | | | | | | | | | |
|
|
| | | | TOTAL TAX-EXEMPT SECURITIES
(Cost $4,943,196) | | | 4,811,295 |
| | | | | | | | | | |
|
|
| | U.S. GOVERNMENT AGENCY BONDS & NOTES — 2.32% |
| | | | FREDDIE MAC — 2.32% | | | | | | |
| | 2,824,201 | | | | 6.25 | | | 07/15/32 | | | 3,189,071 |
| | | | | | | | | | |
|
|
| | | | TOTAL U.S. GOVERNMENT AGENCY BONDS & NOTES
(Cost $3,175,132) | | | 3,189,071 |
| | | | | | | | | | |
|
|
| | | | | | | | | | | |
Principal
Amount
| | | | Rate
| | | Maturity
Date
| | Value
|
| | | | | | | | | | | | |
| U.S. GOVERNMENT AGENCY MORTGAGE PASS THROUGH
SECURITIES — 9.21% |
| | | | FEDERAL NATIONAL MORTGAGE
ASSOCIATION — 8.51% |
| $ | 74,009 | | Pool # 190319 | | 6.50 | % | | 02/01/32 | | $ | 75,720 |
| | 73,989 | | Pool # 252212 | | 6.50 | | | 01/01/29 | | | 75,862 |
| | 56,507 | | Pool # 254406 | | 6.50 | | | 08/01/32 | | | 57,773 |
| | 33,512 | | Pool # 502922 | | 6.50 | | | 07/01/29 | | | 34,357 |
| | 10,204 | | Pool # 509676 | | 6.50 | | | 08/01/29 | | | 10,461 |
| | 36,994 | | Pool # 535506 | | 6.50 | | | 08/01/30 | | | 37,926 |
| | 24,426 | | Pool # 535911 | | 6.50 | | | 05/01/31 | | | 24,989 |
| | 105,957 | | Pool # 535923 | | 6.50 | | | 05/01/31 | | | 108,406 |
| | 43,635 | | Pool # 535933 | | 6.50 | | | 05/01/31 | | | 44,644 |
| | 24,768 | | Pool # 545264 | | 6.50 | | | 09/01/31 | | | 25,341 |
| | 11,710 | | Pool # 545697 | | 6.50 | | | 06/01/32 | | | 11,973 |
| | 17,967 | | Pool # 545699 | | 6.50 | | | 06/01/32 | | | 18,370 |
| | 124,807 | | Pool # 545759 | | 6.50 | | | 07/01/32 | | | 127,604 |
| | 10,014 | | Pool # 547757 | | 6.50 | | | 11/01/30 | | | 10,245 |
| | 17,647 | | Pool # 556702 | | 6.50 | | | 11/01/30 | | | 18,054 |
| | 124,566 | | Pool # 559894 | | 6.50 | | | 04/01/31 | | | 127,445 |
| | 21,214 | | Pool # 562567 | | 6.50 | | | 02/01/31 | | | 21,704 |
| | 3,810 | | Pool # 581332 | | 6.50 | | | 05/01/31 | | | 3,898 |
| | 23,739 | | Pool # 583053 | | 6.50 | | | 05/01/31 | | | 24,288 |
| | 5,533 | | Pool # 591237 | | 6.50 | | | 08/01/31 | | | 5,661 |
| | 2,231,714 | | Pool # 618322 | | 6.00 | | | 12/01/31 | | | 2,234,688 |
| | 34,815 | | Pool # 662505 | | 6.50 | | | 10/01/32 | | | 35,596 |
| | 1,965,054 | | Pool # 702861 | | 5.00 | | | 04/01/18 | | | 1,919,671 |
| | 66,235 | | Pool # 735224 | | 5.50 | | | 02/01/35 | | | 64,782 |
| | 1,056,045 | | Pool # 781859 | | 4.50 | | | 12/01/34 | | | 976,907 |
| | 123,917 | | Pool # 805373 | | 4.50 | | | 01/01/35 | | | 114,630 |
| | 1,208,051 | | Pool # 805386 ARM(a) | | 4.90 | | | 01/01/35 | | | 1,195,045 |
| | 2,667,646 | | Pool # 815479 | | 4.50 | | | 03/01/35 | | | 2,461,588 |
| | 1,380,769 | | Pool # 819361 | | 4.50 | | | 04/01/35 | | | 1,273,616 |
| | 589,044 | | Pool # 820492 | | 5.50 | | | 05/01/35 | | | 575,144 |
| | | | | | | | | | |
|
|
| | | | | | | | | | | | 11,716,388 |
| | | | | | | | | | |
|
|
| | | | GOVERNMENT NATIONAL MORTGAGE ASSOCIATION — 0.70% |
| | 3,811 | | Pool # 356873 | | 6.50 | | | 05/15/23 | | | 3,942 |
| | 18,179 | | Pool # 479087 | | 8.00 | | | 01/15/30 | | | 19,440 |
| | 309,162 | | Pool # 479088 | | 8.00 | | | 01/15/30 | | | 330,607 |
| | 222,776 | | Pool # 80185 ARM(a) | | 4.38 | | | 04/20/28 | | | 223,070 |
| | 130,230 | | Pool # 80205 ARM(a) | | 4.38 | | | 06/20/28 | | | 130,414 |
| | 256,207 | | Pool # 80311 ARM(a) | | 4.50 | | | 08/20/29 | | | 255,995 |
| | | | | | | | | | |
|
|
| | | | | | | | | | | | 963,468 |
| | | | | | | | | | |
|
|
| | | | TOTAL U.S. GOVERNMENT AGENCY MORTGAGE PASS THROUGH SECURITIES
(Cost $13,025,164) | | | 12,679,856 |
| | | | | | | | | | |
|
|
See Notes to Financial Statements.
34
Excelsior Funds Trust
Portfolio of Investments — March 31, 2006
Total Return Bond Fund — (continued)
| | | | | | | | | | |
Principal
Amount
| | | | Rate
| | Maturity
Date
| | Value
|
| | | | | | | | | | | |
| | U.S. GOVERNMENT SECURITIES — 10.85% |
| | | | U.S. TREASURY PRINCIPAL ONLY STRIPS — 3.91% |
| $ | 3,500,000 | | | | 0.00% | | 11/15/17 | | $ | 1,956,465 |
| | 6,893,882 | | | | 0.00 | | 02/15/20 | | | 3,419,848 |
| | | | | | | | | |
|
|
| | | | | | | | | | | 5,376,313 |
| | | | | | | | | |
|
|
| | | | U.S. TREASURY INFLATION PROTECTED
BONDS — 1.66% |
| | 1,800,000 | | | | 3.88 | | 01/15/09 | | | 2,278,662 |
| | | | | | | | | |
|
|
| | | | U.S. TREASURY NOTES — 5.28% |
| | 6,000,000 | | | | 3.63 | | 01/15/10 | | | 5,752,032 |
| | 1,635,000 | | | | 4.50 | | 02/15/36 | | | 1,534,089 |
| | | | | | | | | |
|
|
| | | | | | | | | | | 7,286,121 |
| | | | | | | | | |
|
|
| | | | TOTAL U.S. GOVERNMENT SECURITIES
(Cost $15,507,845) | | | 14,941,096 |
| | | | | | | | | |
|
|
| | | | |
Shares
| | | | | | | | |
| | REGISTERED INVESTMENT COMPANIES — 6.47% |
| | 4,454,619 | | Dreyfus Government Cash Management Fund | | | 4,454,619 |
| | 4,454,619 | | Fidelity U.S. Treasury II Fund | | | 4,454,619 |
| | | | | | | | | |
|
|
| | | | TOTAL REGISTERED INVESTMENT COMPANIES
(Cost $8,909,238) | | | 8,909,238 |
| | | | | | | | | |
|
|
| | | | | | |
TOTAL INVESTMENTS
(Cost $138,770,078)(c) | | 99.63 | % | | $ | 137,159,365 |
OTHER ASSETS IN EXCESS OF LIABILITIES | | 0.37 | | | | 513,602 |
| | |
|
| |
|
|
NET ASSETS | | 100.00 | % | | $ | 137,672,967 |
| | |
|
| |
|
|
| (a) | Variable Rate Security—The rate disclosed is as of March 31, 2006. |
| (b) | Security exempt from registration under Rule 144a of the Securities Act of 1933. This security may be resold in transactions exempt from registration, normally to qualified institutional buyers. At March 31, 2006, these securities amounted to $1,410,161 or 1.02% of net assets. |
| (c) | Unrealized appreciation (depreciation) of securities: |
| | | | |
Unrealized
Appreciation
| | Unrealized
(Depreciation)
| | Net Unrealized Appreciation/
(Depreciation)
|
$1,356,626 | | $(2,967,339) | | $(1,610,713) |
ARM—Adjustable Rate Mortgage
llc—Limited Liability Company
MTN—Medium Term Note
Multi-Coupon Bond—Coupon rate may increase or decrease in response to a change in the quality rating by an independent rating agency.
plc—Public Limited Company
STRIPS—Separately Traded Registered Interest and Principal Securities
The summary of the Fund’s investments as of March 31, 2006 is as follows: (Unaudited)
| | | | | | |
Portfolio Diversification
| | % of
Net
Assets
| | | Value
|
Corporate Bonds | | 34.56 | % | | $ | 47,576,922 |
U.S. Government & Agency Securities | | 22.38 | | | | 30,810,023 |
Commercial Mortgage-Backed Securities | | 19.61 | | | | 26,992,216 |
Collateralized Mortgage Obligations | | 13.12 | | | | 18,059,671 |
Registered Investment Companies | | 6.47 | | | | 8,909,238 |
Tax-Exempt Securities | | 3.49 | | | | 4,811,295 |
| | |
|
| |
|
|
Total Investments | | 99.63 | % | | $ | 137,159,365 |
Other Assets in Excess of Liabilities | | 0.37 | | | | 513,602 |
| | |
|
| |
|
|
Net Assets | | 100.00 | % | | $ | 137,672,967 |
| | |
|
| |
|
|
See Notes to Financial Statements.
35
Excelsior Funds, Inc.
Portfolio of Investments — March 31, 2006
Equity Core Fund
| | | | | |
Shares
| | | | Value
|
| COMMON STOCKS — 92.23% | | |
| | | CONSUMER DISCRETIONARY — 16.87% |
| 41,105 | | Autozone, Inc.(a) | | $ | 4,097,758 |
| 132,499 | | Dillards, Inc., Class A | | | 3,450,274 |
| 132,143 | | Eastman Kodak Co. | | | 3,758,147 |
| 162,500 | | Furniture Brands International, Inc. | | | 3,982,875 |
| 104,164 | | John Wiley & Sons, Class A | | | 3,942,607 |
| 80,000 | | Life Time Fitness, Inc.(a) | | | 3,748,000 |
| 166,000 | | Sotheby’s Holdings, Inc.,
Class A(a) | | | 4,820,641 |
| 108,770 | | Timberland Co., Class A(a) | | | 3,723,197 |
| | | | |
|
|
| | | | | | 31,523,499 |
| | | | |
|
|
| | | CONSUMER STAPLES — 4.31% |
| 93,806 | | Anheuser Busch Cos., Inc. | | | 4,012,083 |
| 63,278 | | Wm. Wrigley Jr. Co. | | | 4,049,792 |
| | | | |
|
|
| | | | | | 8,061,875 |
| | | | |
|
|
| | | ENERGY — 7.41% |
| 57,100 | | Apache Corp. | | | 3,740,621 |
| 72,294 | | Exxon Mobil Corp. | | | 4,399,813 |
| 74,032 | | Suncor Energy, Inc. | | | 5,701,944 |
| | | | |
|
|
| | | | | | 13,842,378 |
| | | | |
|
|
| | | FINANCIAL — 13.10% |
| 117,427 | | American Capital Strategies Ltd. | | | 4,128,733 |
| 48 | | Berkshire Hathaway, Inc.,
Class A(a) | | | 4,336,800 |
| 26,184 | | Lehman Brothers Holding, Inc. | | | 3,784,374 |
| 84,659 | | Leucadia National Corp. | | | 5,050,756 |
| 110,713 | | North Fork Bancorporation, Inc. | | | 3,191,856 |
| 91,354 | | RenaissanceRe Holdings Ltd. | | | 3,984,861 |
| | | | |
|
|
| | | | | | 24,477,380 |
| | | | |
|
|
| | | HEALTH CARE — 9.33% |
| 68,353 | | Johnson & Johnson | | | 4,047,865 |
| 75,331 | | Medtronic, Inc. | | | 3,823,048 |
| 77,325 | | Novo-Nordisk A/S ADR | | | 4,801,109 |
| 64,099 | | Roche Holdings Ltd. ADR | | | 4,760,152 |
| | | | |
|
|
| | | | | | 17,432,174 |
| | | | |
|
|
| | | | | |
Shares
| | | | Value
|
| COMMON STOCKS — (continued) | | |
| | | INDUSTRIALS — 9.83% |
| 1,930,962 | | Bombardier, Inc., Class B(a) | | $ | 5,622,961 |
| 82,500 | | Canadian National Railway Co. | | | 3,735,600 |
| 115,682 | | General Electric Co. | | | 4,023,420 |
| 310,700 | | Quanta Services, Inc.(a) | | | 4,977,414 |
| | | | |
|
|
| | | | | | 18,359,395 |
| | | | |
|
|
| | | INFORMATION TECHNOLOGY — 7.51% |
| 933,293 | | 3com Corp.(a) | | | 4,778,460 |
| 112,577 | | Analog Devices, Inc. | | | 4,310,573 |
| 151,407 | | National Instruments Corp. | | | 4,938,897 |
| | | | |
|
|
| | | | | | 14,027,930 |
| | | | |
|
|
| | | RAW/INTERMEDIATE MATERIALS — 13.22% |
| 97,537 | | Aracruz Cellulose S.A. ADR | | | 5,163,609 |
| 94,404 | | E.I. Du Pont de Nemours & Co. | | | 3,984,793 |
| 55,801 | | Monsanto Co. | | | 4,729,135 |
| 52,850 | | Nucor Corp. | | | 5,538,151 |
| 61,000 | | Vulcan Materials Co. | | | 5,285,650 |
| | | | |
|
|
| | | | | | 24,701,338 |
| | | | |
|
|
| | | REAL ESTATE — 2.27% |
| 67,592 | | St. Joe Co. | | | 4,247,481 |
| | | | |
|
|
| | | UTILITIES — 8.38% |
| 274,996 | | AES Corp.(a) | | | 4,691,432 |
| 224,593 | | Centerpoint Energy, Inc. | | | 2,679,394 |
| 395,821 | | EL Paso Corp. | | | 4,769,643 |
| 255,200 | | Sierra Pacific Resources(a) | | | 3,524,312 |
| | | | |
|
|
| | | | | | 15,664,781 |
| | | | |
|
|
| | | TOTAL COMMON STOCKS
(Cost $148,821,548) | | | 172,338,231 |
| | | | |
|
|
| FOREIGN COMMON STOCKS — 2.43% | | | |
| | | GERMANY — 2.43% |
| 82,507 | | Bayerische Motoren Werke AG | | | 4,544,011 |
| | | | |
|
|
| | | TOTAL FOREIGN
COMMON STOCKS
(Cost $3,702,066) | | | 4,544,011 |
| | | | |
|
|
See Notes to Financial Statements.
36
Excelsior Funds, Inc.
Portfolio of Investments — March 31, 2006
Equity Core Fund — (continued)
| | | | | |
Principal
Amount
| | | | Value
|
| REPURCHASE AGREEMENT — 5.79% | | |
| $10,818,000 | | JP Morgan Chase Securities, Inc., 3.40%, dated 03/31/06, to be repurchased 04/03/06, repurchase price $10,821,065 (collateralized by U.S. Treasury Note, par value $8,103,000, 8.125%, maturing 08/15/21; total market value $10,898,014) | | $ | 10,818,000 |
| | | | |
|
|
| | | TOTAL REPURCHASE AGREEMENT
(Cost $10,818,000) | | | 10,818,000 |
| | | | |
|
|
| | | | | | | |
TOTAL INVESTMENTS (Cost $163,341,614)(b) | | 100.45 | % | | $ | 187,700,242 | |
LIABILITIES IN EXCESS OF
OTHER ASSETS | | (0.45 | ) | | | (845,844 | ) |
| | |
|
| |
|
|
|
NET ASSETS | | 100.00 | % | | $ | 186,854,398 | |
| | |
|
| |
|
|
|
| (a) | Non-income producing security. |
| (b) | Unrealized appreciation (depreciation) of securities: |
| | | | | | | |
Unrealized
Appreciation
| | Unrealized
(Depreciation)
| | | Net Unrealized
Appreciation/(Depreciation)
|
$26,252,304 | | $ | (1,893,676 | ) | | $ | 24,358,628 |
ADR—American Depository Receipt
Ltd.—Limited
The summary of the Fund’s investments as of March 31, 2006 is as follows: (Unaudited)
| | | | | | | |
Sector Diversification
| | % of
Net
Assets
| | | Value
| |
Consumer Discretionary | | 19.30 | % | | $ | 36,067,510 | |
Raw/Intermediate Materials | | 13.22 | | | | 24,701,338 | |
Financial | | 13.10 | | | | 24,477,380 | |
Industrials | | 9.83 | | | | 18,359,395 | |
Health Care | | 9.33 | | | | 17,432,174 | |
Utilities | | 8.38 | | | | 15,664,781 | |
Information Technology | | 7.51 | | | | 14,027,930 | |
Energy | | 7.41 | | | | 13,842,378 | |
Repurchase Agreement | | 5.79 | | | | 10,818,000 | |
Consumer Staples | | 4.31 | | | | 8,061,875 | |
Real Estate | | 2.27 | | | | 4,247,481 | |
| | |
|
| |
|
|
|
Total Investments | | 100.45 | % | | $ | 187,700,242 | |
Liabilities in Excess of Other Assets | | (0.45 | ) | | | (845,844 | ) |
| | |
|
| |
|
|
|
Net Assets | | 100.00 | % | | $ | 186,854,398 | |
| | |
|
| |
|
|
|
See Notes to Financial Statements.
37
Excelsior Funds Trust
Portfolio of Investments — March 31, 2006
Mid Cap Value and Restructuring Fund
| | | | | |
Shares
| | | | Value
|
| | | | | | |
| COMMON STOCKS — 97.44% | | |
| | | CONSUMER DISCRETIONARY — 26.05% |
| 90,000 | | Autozone, Inc.(a) | | $ | 8,972,100 |
| 126,600 | | Black & Decker Corp. | | | 11,000,274 |
| 745,000 | | Blockbuster, Inc. | | | 2,667,100 |
| 229,661 | | Callaway Golf Co. | | | 3,950,169 |
| 95,000 | | Centex Corp. | | | 5,889,050 |
| 325,000 | | Constellation Brands, Inc.(a) | | | 8,141,250 |
| 270,000 | | EchoStar Communications, Inc.(a) | | | 8,064,900 |
| 170,000 | | Limited Brands | | | 4,158,200 |
| 42,000 | | Morgans Hotel Group(a) | | | 741,720 |
| 379,700 | | Onex Corp. | | | 6,998,251 |
| 210,000 | | Sherwin-Williams Co. | | | 10,382,400 |
| 294,700 | | Tempur-Pedic International, Inc.(a) | | | 4,170,005 |
| 300,000 | | TJX Cos., Inc. | | | 7,446,000 |
| 208,000 | | Zale Corp.(a) | | | 5,830,240 |
| | | | |
|
|
| | | | | | 88,411,659 |
| | | | |
|
|
| | | CONSUMER STAPLES — 2.34% |
| 205,000 | | Dean Foods Co.(a) | | | 7,960,150 |
| | | | |
|
|
| | | ENERGY — 12.45% |
| 130,000 | | Cimarex Energy Co. | | | 5,623,800 |
| 217,000 | | Devon Energy Corp. | | | 13,273,890 |
| 153,700 | | Noble Corp. | | | 12,465,070 |
| 117,600 | | Occidental Petroleum Corp. | | | 10,895,640 |
| | | | |
|
|
| | | | | | 42,258,400 |
| | | | |
|
|
| | | FINANCIAL — 15.21% |
| 167,300 | | Ace Ltd. | | | 8,701,273 |
| 200,000 | | CIT Group, Inc. | | | 10,704,000 |
| 250,000 | | Doral Financial Corp. | | | 2,887,500 |
| 50,000 | | First Marblehead Corp. | | | 2,162,500 |
| 73,000 | | Lehman Brothers Holding, Inc. | | | 10,550,690 |
| 125,000 | | Leucadia National Corp. | | | 7,457,500 |
| 75,000 | | RenaissanceRe Holdings Ltd. | | | 3,271,500 |
| 270,000 | | Sovereign Bancorp, Inc. | | | 5,915,700 |
| | | | |
|
|
| | | | | | 51,650,663 |
| | | | |
|
|
| | | HEALTH CARE — 5.58% |
| 415,000 | | Health Management Associates, Inc., Class A | | | 8,951,550 |
| 215,000 | | Shire Pharmaceuticals plc ADR | | | 9,995,350 |
| | | | |
|
|
| | | | | | 18,946,900 |
| | | | |
|
|
| | | | | |
Shares
| | | | Value
|
| COMMON STOCKS — (continued) | | |
| | | INDUSTRIALS — 15.69% |
| 51,500 | | Autoliv, Inc. | | $ | 2,913,870 |
| 235,000 | | Brink’s Co. | | | 11,928,600 |
| 265,000 | | Empresa Brasileira de Aeronautica | | | 9,765,250 |
| | | S.A. ADR | | | |
| 123,700 | | Lincoln Electric Holdings, Inc. | | | 6,678,563 |
| 210,000 | | Mueller Industries, Inc. | | | 7,494,900 |
| 420,000 | | United Rentals, Inc.(a) | | | 14,490,000 |
| | | | |
|
|
| | | | | | 53,271,183 |
| | | | |
|
|
| | | INFORMATION TECHNOLOGY — 7.21% |
| 190,000 | | Electronic Data Systems Corp. | | | 5,097,700 |
| 280,400 | | Harris Corp. | | | 13,260,116 |
| 580,000 | | Symbol Technologies, Inc. | | | 6,136,400 |
| | | | |
|
|
| | | | | | 24,494,216 |
| | | | |
|
|
| | | RAW/INTERMEDIATE MATERIALS — 7.11% |
| 233,800 | | Aracruz Cellulose S.A. ADR | | | 12,377,372 |
| 225,000 | | Cabot Microelectronics
Corp.(a) | | | 8,347,500 |
| 350,000 | | International Coal Group, Inc.(a) | | | 3,409,000 |
| | | | |
|
|
| | | | | | 24,133,872 |
| | | | |
|
|
| | | REAL ESTATE — 2.34% |
| 126,600 | | St. Joe Co. | | | 7,955,544 |
| | | | |
|
|
| | | UTILITIES — 3.46% | | | |
| 406,800 | | EL Paso Corp. | | | 4,901,940 |
| 320,000 | | Williams Cos., Inc. | | | 6,844,800 |
| | | | |
|
|
| | | | | | 11,746,740 |
| | | | |
|
|
| | | TOTAL COMMON STOCKS
(Cost $208,393,057) | | | 330,829,327 |
| | | | |
|
|
| FOREIGN COMMON STOCKS — 1.94% | | |
| | | NETHERLANDS — 1.94% |
| 99,500 | | Hunter Douglas NV | | | 6,598,774 |
| | | | |
|
|
| | | TOTAL FOREIGN
COMMON STOCKS
(Cost $3,662,399) | | | 6,598,774 |
| | | | |
|
|
| CONVERTIBLE PREFERRED STOCKS — 0.14% |
| | | CONSUMER DISCRETIONARY — 0.14% |
| 500 | | Blockbuster, Inc., Preferred Exchange, 7.50%(b) | | | 465,000 |
| | | | |
|
|
| | | TOTAL CONVERTIBLE PREFERRED STOCKS
(Cost $500,000) | | | 465,000 |
| | | | |
|
|
See Notes to Financial Statements.
38
Excelsior Funds Trust
Portfolio of Investments — March 31, 2006
Mid Cap Value and Restructuring Fund — (continued)
| | | | | |
Principal
Amount
| | | | Value
|
| REPURCHASE AGREEMENT — 0.44% | | |
| $1,484,000 | | JP Morgan Chase Securities, Inc., 3.40%, dated 03/31/06, to be repurchased 04/03/06, repurchase price $1,484,420 (collateralized by U.S. Treasury Note, par value $1,112,000, 8.125%, maturing 08/15/21; total market value $1,494,979) | | $ | 1,484,000 |
| | | | |
|
|
| | | TOTAL REPURCHASE AGREEMENT
(Cost $1,484,000) | | | 1,484,000 |
| | | | |
|
|
| | | | | | | | |
TOTAL INVESTMENTS
(Cost $214,039,456)(c) | | 99.96 | % | | | | $ | 339,377,101 |
OTHER ASSETS IN EXCESS OF LIABILITIES | | 0.04 | | | | | | 120,025 |
| | |
|
| |
| |
|
|
NET ASSETS | | 100.00 | % | | | | $ | 339,497,126 |
| | |
|
| |
| |
|
|
| (a) | Non-income producing security. |
| (b) | Security exempt from registration under Rule 144A of the Securities Act of 1933. This security may be resold in transactions exempt from registration, normally to qualified institutional buyers. At March 31, 2006, these securities amounted to $465,000 or 0.14% of net assets. |
| (c) | Unrealized appreciation (depreciation) of securities: |
| | | | |
Unrealized
Appreciation
| | Unrealized
(Depreciation)
| | Net Unrealized
Appreciation/
(Depreciation)
|
$130,550,617 | | $(5,212,972) | | $125,337,645 |
ADR—American Depository Receipt
Ltd.—Limited
plc—public limited company
The summary of the Fund’s investments as of March 31, 2006 is as follows: (Unaudited)
| | | | | | |
Sector Diversification
| | % of
Net
Assets
| | | Value
|
Consumer Discretionary | | 28.13 | % | | $ | 95,475,433 |
Industrials | | 15.69 | | | | 53,271,183 |
Financial | | 15.21 | | | | 51,650,663 |
Energy | | 12.45 | | | | 42,258,400 |
Information Technology | | 7.21 | | | | 24,494,216 |
Raw/Intermediate Materials | | 7.11 | | | | 24,133,872 |
Health Care | | 5.58 | | | | 18,946,900 |
Utilities | | 3.46 | | | | 11,746,740 |
Consumer Staples | | 2.34 | | | | 7,960,150 |
Real Estate | | 2.34 | | | | 7,955,544 |
Repurchase Agreement | | 0.44 | | | | 1,484,000 |
| | |
|
| |
|
|
Total Investments | | 99.96 | % | | $ | 339,377,101 |
Other Assets in Excess of Liabilities | | 0.04 | | | | 120,025 |
| | |
|
| |
|
|
Net Assets | | 100.00 | % | | $ | 339,497,126 |
| | |
|
| |
|
|
See Notes to Financial Statements.
39
Excelsior Funds, Inc.
Portfolio of Investments — March 31, 2006
Value and Restructuring Fund
| | | | | |
Shares
| | | | Value
|
| COMMON STOCKS — 95.72% | | |
| | | CONSUMER DISCRETIONARY — 16.31% |
| 1,700,000 | | Avon Products, Inc. | | $ | 52,989,000 |
| 2,150,000 | | Black & Decker Corp. | | | 186,813,500 |
| 2,400,000 | | CBS Corp., Class B | | | 57,552,000 |
| 2,750,000 | | Centex Corp. | | | 170,472,500 |
| 1,800,000 | | EchoStar Communications, Inc.(a) | | | 53,766,000 |
| 1,000,000 | | Harman International Industries, Inc. | | | 111,130,000 |
| 2,000,000 | | Interpublic Group of Companies, Inc.(a)(b) | | | 19,120,000 |
| 2,100,000 | | Leggett & Platt, Inc. | | | 51,177,000 |
| 2,000,000 | | Liberty Media Corp., Class A(a) | | | 16,420,000 |
| 714,340 | | Morgans Hotel Group(a) | | | 12,615,244 |
| 2,600,000 | | Newell Rubbermaid, Inc. | | | 65,494,000 |
| 2,750,000 | | TJX Cos., Inc. | | | 68,255,000 |
| 5,750,000 | | XM Satellite Radio Holdings, Inc., Class A(a) | | | 128,052,500 |
| 2,250,000 | | Zale Corp.(a) | | | 63,067,500 |
| | | | |
|
|
| | | | | | 1,056,924,244 |
| | | | |
|
|
| | | CONSUMER STAPLES — 4.00% | | | |
| 1,750,000 | | ConAgra Foods, Inc. | | | 37,555,000 |
| 2,475,000 | | Dean Foods Co.(a) | | | 96,104,250 |
| 1,000,000 | | Kraft Foods, Inc., Class A | | | 30,310,000 |
| 2,010,000 | | Loews Corp. - Carolina Group | | | 95,012,700 |
| | | | |
|
|
| | | | | | 258,981,950 |
| | | | |
|
|
| | | ENERGY — 13.35% | | | |
| 1,650,000 | | Burlington Resources, Inc. | | | 151,651,500 |
| 1,450,000 | | ConocoPhillips | | | 91,567,500 |
| 2,250,000 | | Devon Energy Corp.(b) | | | 137,632,500 |
| 1,500,000 | | Mariner Energy, Inc.(a) | | | 30,765,000 |
| 2,000,000 | | Noble Energy, Inc. | | | 87,840,000 |
| 1,775,000 | | Petrobras ADR | | | 153,839,250 |
| 2,000,000 | | Petrohawk Energy Corp.(a) | | | 27,400,000 |
| 2,900,000 | | Rossetta Resources, Inc.(a) | | | 52,084,000 |
| 1,900,000 | | Todco, Class A | | | 74,879,000 |
| 1,425,000 | | W&T Offshore, Inc. | | | 57,441,750 |
| | | | |
|
|
| | | | | | 865,100,500 |
| | | | |
|
|
| | | FINANCIAL — 18.00% | | | |
| 2,000,000 | | Ace Ltd. | | | 104,020,000 |
| 2,800,000 | | Amvescap plc ADR | | | 52,808,000 |
| 2,250,000 | | Apollo Investment Corp.(c) | | | 40,072,500 |
| | | | | |
Shares
| | | | Value
|
| COMMON STOCKS — (continued) | | |
| | | FINANCIAL — (continued) | | | |
| 1,889,800 | | Castlepoint Holdings Ltd. ADR(a)(d) | | $ | 18,898,000 |
| 900,000 | | CIT Group, Inc. | | | 48,168,000 |
| 2,125,000 | | Citigroup, Inc. | | | 100,385,000 |
| 2,500,000 | | Doral Financial Corp. | | | 28,875,000 |
| 1,350,000 | | Freddie Mac | | | 82,350,000 |
| 1,850,000 | | JP Morgan Chase & Co. | | | 77,034,000 |
| 675,000 | | Lehman Brothers Holding, Inc. | | | 97,557,750 |
| 750,000 | | Loews Corp. | | | 75,900,000 |
| 2,250,000 | | Marsh & McLennan Cos., Inc. | | | 66,060,000 |
| 3,000,000 | | MCG Capital Corp. | | | 42,330,000 |
| 1,675,000 | | Metlife, Inc. | | | 81,019,750 |
| 1,800,000 | | Morgan Stanley | | | 113,076,001 |
| 900,000 | | PNC Financial Services Group, Inc. | | | 60,579,000 |
| 2,650,000 | | Primus Guaranty Ltd.(a) | | | 29,547,500 |
| 1,150,000 | | Washington Mutual, Inc. | | | 49,013,000 |
| | | | |
|
|
| | | | | | 1,167,693,501 |
| | | | |
|
|
| | | HEALTH CARE — 4.68% | | | |
| 1,800,000 | | AmerisourceBergen Corp. | | | 86,886,000 |
| 2,225,000 | | Baxter International, Inc. | | | 86,352,250 |
| 1,350,000 | | Bristol-Myers Squibb Co. | | | 33,223,500 |
| 1,350,000 | | HCA, Inc. | | | 61,816,500 |
| 725,000 | | Wyeth | | | 35,177,000 |
| | | | |
|
|
| | | | | | 303,455,250 |
| | | | |
|
|
| | | INDUSTRIALS — 12.60% | | | |
| 2,725,000 | | AGCO Corp.(a) | | | 56,516,500 |
| 900,000 | | Aries Maritime Transport Ltd. | | | 12,573,000 |
| 925,000 | | Arlington Tankers | | | 21,275,000 |
| 3,500,000 | | Cendant Corp. | | | 60,725,000 |
| 1,000,000 | | Copa Holdings S.A., Class A(a) | | | 22,850,000 |
| 1,350,000 | | Deluxe Corp. | | | 35,329,500 |
| 2,050,000 | | Empresa Brasileira de Aeronautica S.A. ADR | | | 75,542,500 |
| 3,000,000 | | Gol Linhas Aereas Inteligentes S.A. ADR | | | 80,400,000 |
| 1,550,000 | | Ryder Systems, Inc. | | | 69,409,000 |
| 2,600,000 | | Tyco International Ltd. | | | 69,888,000 |
| 1,200,000 | | Union Pacific Corp. | | | 112,020,000 |
| 3,500,000 | | United Rentals, Inc.(a) | | | 120,750,000 |
| 1,375,000 | | United Technologies Corp. | | | 79,708,750 |
| | | | |
|
|
| | | | | | 816,987,250 |
| | | | |
|
|
See Notes to Financial Statements.
40
Excelsior Funds, Inc.
Portfolio of Investments — March 31, 2006
Value and Restructuring Fund — (continued)
| | | | | |
Shares
| | | | Value
|
| COMMON STOCKS — (continued) | | |
| | | INFORMATION TECHNOLOGY — 5.38% |
| 3,600,000 | | Harris Corp. | | $ | 170,244,000 |
| 725,000 | | International Business Machines Corp. | | | 59,790,750 |
| 3,000,000 | | Nokia Oyj ADR | | | 62,160,000 |
| 1,600,000 | | Plantronics, Inc. | | | 56,688,000 |
| | | | |
|
|
| | | | | | 348,882,750 |
| | | | |
|
|
| | | RAW/INTERMEDIATE MATERIALS — 11.95% |
| 2,000,000 | | Alpha Natural Resources, Inc.(a) | | | 46,280,000 |
| 2,950,000 | | Celanese Corp., Class A | | | 61,861,500 |
| 2,200,000 | | CF Industries Holdings, Inc. | | | 37,378,000 |
| 1,075,000 | | CNX Gas Corp.(a) | | | 27,950,000 |
| 2,175,000 | | Consol Energy, Inc. | | | 161,298,000 |
| 825,000 | | Eagle Materials, Inc., Class B | | | 52,626,750 |
| 1,450,000 | | Foundation Coal Holdings, Inc. | | | 59,653,000 |
| 3,100,000 | | International Coal Group, Inc.(a) | | | 30,194,000 |
| 1,182,694 | | Lafarge Corp. | | | 99,346,296 |
| 944,900 | | Pinnacle Gas Resources, Inc.(a)(d) | | | 10,393,900 |
| 1,275,000 | | PPG Industries, Inc. | | | 80,771,250 |
| 850,000 | | Southern Copper Corp. | | | 71,808,000 |
| 2,050,000 | | Tronox, Inc. | | | 34,768,000 |
| | | | |
|
|
| | | | | | 774,328,696 |
| | | | |
|
|
| | | REAL ESTATE — 2.83% | | | |
| 3,275,715 | | Diamondrock Hospitality Co. | | | 45,237,624 |
| 1,200,000 | | Fieldstone Investment Corp. | | | 14,160,000 |
| 2,900,000 | | Friedman Billings Ramsey Group, Inc., Class A | | | 27,202,000 |
| 1,700,000 | | Host Marriott Corp. | | | 36,380,000 |
| 2,000,000 | | Peoples Choice Financial Corp.(a)(d) | | | 11,000,000 |
| 600,000 | | Taberna Realty Finance Trust(d) | | | 7,950,000 |
| 850,000 | | Ventas, Inc. | | | 28,203,000 |
| 1,500,000 | | Vintage Wine Trust, Inc.(d) | | | 13,500,000 |
| | | | |
|
|
| | | | | | 183,632,624 |
| | | | |
|
|
| | | | | |
Shares
| | | | Value
|
| COMMON STOCKS — (continued) | | |
| | | TELECOMMUNICATION — 4.21% |
| 5,225,000 | | America Movil S.A. de C.V., Series L ADR | | $ | 179,008,500 |
| 2,408,254 | | Sprint Nextel Corp. | | | 62,229,283 |
| 2,400,000 | | Valor Communications, Inc. | | | 31,584,000 |
| | | | |
|
|
| | | | | | 272,821,783 |
| | | | |
|
|
| | | UTILITIES — 2.41% | | | |
| 1,300,000 | | Centerpoint Energy, Inc. | | | 15,509,000 |
| 1,325,000 | | Duke Energy Corp. | | | 38,623,750 |
| 5,000,000 | | EL Paso Corp. | | | 60,250,000 |
| 649,275 | | Public Service Enterprise Group, Inc. | | | 41,579,571 |
| | | | |
|
|
| | | | | | 155,962,321 |
| | | | |
|
|
| | | TOTAL COMMON STOCKS (Cost $4,103,263,208) | | | 6,204,770,869 |
| | | | |
|
|
| FOREIGN COMMON STOCKS — 1.47% | | |
| | | GERMANY — 0.82% | | | |
| 1,400,000 | | Lanxess AG(a) | | | 52,774,176 |
| | | | |
|
|
| | | ITALY — 0.65% | | | |
| 5,000,000 | | Enel S.p.A | | | 42,254,747 |
| | | | |
|
|
| | | TOTAL FOREIGN
COMMON STOCKS (Cost $75,072,487) | | | 95,028,923 |
| | | | |
|
|
| CONVERTIBLE PREFERRED STOCKS — 1.02% |
| | | CONSUMER DISCRETIONARY — 0.79% |
| 1,700,000 | | Ford Motor Co. Capital Trust II, Preferred Exchange, 6.50% | | | 51,085,000 |
| | | | |
|
|
| | | RAW/INTERMEDIATE MATERIALS — 0.23% |
| 500,000 | | Celanese Corp., Preferred Exchange, 4.25% | | | 15,125,000 |
| | | | |
|
|
| | | TOTAL CONVERTIBLE PREFERRED STOCKS (Cost $79,293,818) | | | 66,210,000 |
| | | | |
|
|
See Notes to Financial Statements.
41
Excelsior Funds, Inc.
Portfolio of Investments — March 31, 2006
Value and Restructuring Fund — (continued)
| | | | | |
Principal
Amount
| | | | Value
|
| REPURCHASE AGREEMENT — 2.48% | | |
| $160,785,000 | | JP Morgan Chase Securities, Inc., 3.40%, dated 03/31/06, to be repurchased 04/03/06, repurchase price $160,830,556 (collateralized by U.S. Treasury Note, par value $120,438,000, 8.125%, maturing 08/15/21; total market value $161,974,138) | | $ | 160,785,000 |
| | | | |
|
|
| | | TOTAL REPURCHASE AGREEMENT (Cost $160,785,000) | | | 160,785,000 |
| | | | |
|
|
| | | | | | | |
TOTAL INVESTMENTS (Cost $4,418,414,513)(e) | | 100.69 | % | | $ | 6,526,794,792 | |
LIABILITIES IN EXCESS OF OTHER ASSETS | | (0.69 | ) | | | (44,777,900 | ) |
| | |
|
| |
|
|
|
NET ASSETS | | 100.00 | % | | $ | 6,482,016,892 | |
| | |
|
| |
|
|
|
| (a) | Non-income producing security. |
| (b) | All or part of the security is segregated by the Fund’s custodian to cover future purchase commitments. |
| (c) | Registered Investment Company |
| (d) | Security exempt from registration under Rule 144A of the Securities Act of 1933. This security may be resold in transactions exempt from registration, normally to qualified institutional buyers. At March 31, 2006, these securities amounted to $61,741,900 or 0.95% of net assets. |
| (e) | Unrealized appreciation (depreciation) of securities: |
| | | | |
Unrealized
Appreciation
| | Unrealized
(Depreciation)
| | Net Unrealized
Appreciation/
(Depreciation)
|
$2,228,495,581 | | $(120,115,302) | | $2,108,380,279 |
ADR—American Depository Receipt
Ltd.—Limited
plc—public limited company
| | | | | | |
Contracts
| | | | Value
| |
| CALL OPTIONS WRITTEN (0.00%): | | | |
(4,468)
| | Devon Energy, Expires
04/25/06, strike price 70 (Premiums received $1,760,972) | | $ | (22,340 | ) |
| | | | |
|
|
|
The summary of the Fund’s investments as of March 31, 2006 is as follows: (Unaudited)
| | | | | | | |
Sector Diversification
| | % of
Net
Assets
| | | Value
| |
Financial | | 18.00 | % | | $ | 1,167,693,501 | |
Consumer Discretionary | | 17.10 | | | | 1,108,009,244 | |
Industrials | | 13.42 | | | | 869,761,426 | |
Energy | | 13.35 | | | | 865,100,500 | |
Raw/Intermediate Materials | | 12.18 | | | | 789,453,696 | |
Information Technology | | 5.38 | | | | 348,882,750 | |
Health Care | | 4.68 | | | | 303,455,250 | |
Telecommunication | | 4.21 | | | | 272,821,783 | |
Consumer Staples | | 4.00 | | | | 258,981,950 | |
Utilities | | 3.06 | | | | 198,217,068 | |
Real Estate | | 2.83 | | | | 183,632,624 | |
Repurchase Agreement | | 2.48 | | | | 160,785,000 | |
| | |
|
| |
|
|
|
Total Investments | | 100.69 | % | | $ | 6,526,794,792 | |
Liabilities in Excess of Other Assets | | (0.69 | ) | | | (44,777,900 | ) |
| | |
|
| |
|
|
|
Net Assets | | 100.00 | % | | $ | 6,482,016,892 | |
| | |
|
| |
|
|
|
See Notes to Financial Statements.
42
Excelsior Funds, Inc.
Portfolio of Investments — March 31, 2006
Emerging Markets Fund
| | | | | |
Shares
| | | | Value
|
| COMMON STOCKS — 86.32% | | |
| | | ARGENTINA — 1.23% | | | |
| 931,800 | | Telecom Argentina S.A.
ADR(a) | | $ | 12,616,572 |
| | | | |
|
|
| | | BRAZIL — 6.56% | | | |
| 841,674 | | Arcelor Brazil S.A. | | | 13,094,004 |
| 215,700 | | Companhia Vale do Rio Doce S.A. | | | 10,490,818 |
| 272,500 | | Diagnosticos da America
S.A.(a) | | | 7,017,221 |
| 334,800 | | Gol Linhas Aereas Inteligentes S.A. ADR | | | 8,972,640 |
| 441,700 | | Telemar Norte Leste S.A.(a) | | | 11,507,071 |
| 215,400 | | Uniao de Bancos Brasileiros S.A. | | | 15,920,215 |
| | | | |
|
|
| | | | | | 67,001,969 |
| | | | |
|
|
| | | CHINA — 11.85% | | | |
| 23,275,000 | | Bank of Communications Ltd., Class H (Hong Kong)(a) | | | 14,596,964 |
| 27,271,300 | | Chaoda Mordern Agriculture Holdings Ltd. (Hong Kong) | | | 21,413,143 |
| 42,614,000 | | China Construction Bank,
Class H (Hong Kong)(a) | | | 19,847,373 |
| 584,297 | | China Mobile Ltd. ADR (Hong Kong) | | | 15,507,242 |
| 19,128,000 | | China Petroleum & Chemical Corp., Class H (Hong Kong) | | | 11,164,240 |
| 17,823,252 | | Far East Consortium Int’L Ltd. (Hong Kong) | | | 8,236,881 |
| 13,868,400 | | People’s Food Holdings Ltd. | | | 11,066,073 |
| 122,400 | | PetroChina Co. Ltd. ADR | | | 12,845,880 |
| 8,447,000 | | Texwinca Holdings Ltd. (Hong Kong) | | | 6,477,677 |
| | | | |
|
|
| | | | | | 121,155,473 |
| | | | |
|
|
| | | COLUMBIA — 0.99% | | | |
| 288,800 | | Bancolombia S.A. ADR | | | 10,079,120 |
| | | | |
|
|
| | | CZECH REPUBLIC — 0.90% | | | |
| 430,467 | | Cesky Telecom A.S.(a) | | | 9,184,999 |
| | | | |
|
|
| | | HUNGARY — 1.10% | | | |
| 997,100 | | BorsodChem Rt. | | | 11,200,435 |
| | | | |
|
|
| | | | | |
Shares
| | | | Value
|
| COMMON STOCKS — (continued) | | |
| | | INDIA — 4.79% | | | |
| 296,950 | | ICICI Bank Ltd. ADR | | $ | 8,219,576 |
| 213,700 | | India Fund, Inc.(b) | | | 10,791,850 |
| 201,900 | | State Bank of India GDR(c) | | | 10,721,489 |
| 655,700 | | Suzlon Energy Ltd. | | | 19,229,560 |
| | | | |
|
|
| | | | | | 48,962,475 |
| | | | |
|
|
| | | INDONESIA — 2.82% | | | |
| 25,845,200 | | PT Indocement Tunggal Prakarsa Tbk(a) | | | 12,852,458 |
| 20,973,200 | | PT Telekomunikasi Indonesia Tbk | | | 15,946,536 |
| | | | |
|
|
| | | | | | 28,798,994 |
| | | | |
|
|
| | | MALAYSIA — 2.92% | | | |
| 1,623,600 | | Genting Berhad | | | 10,488,171 |
| 5,717,150 | | Public Bank Berhad | | | 10,014,833 |
| 3,701,900 | | Telekom Malaysia Berhad | | | 9,392,557 |
| | | | |
|
|
| | | | | | 29,895,561 |
| | | | |
|
|
| | | MEXICO — 8.01% | | | |
| 428,100 | | America Movil S.A. de C.V., Series L ADR | | | 14,666,706 |
| 197,039 | | Cemex S.A. de C.V. ADR | | | 12,862,706 |
| 183,300 | | Grupo Aeroportuario del Pacifico S.A. de C.V.
ADR(a) | | | 5,856,435 |
| 801,355 | | Grupo Elektra S.A. | | | 8,065,108 |
| 2,124,100 | | Grupo Televisa S.A. | | | 8,443,688 |
| 363,380 | | Telefonos de Mexico S.A. de C.V., Series L ADR | | | 8,168,782 |
| 1,986,343 | | Urbi Desarrollos Urbanos S.A. de C.V.(a) | | | 15,047,279 |
| 3,288,996 | | Wal-Mart de Mexico S.A. de C.V.(a) | | | 8,811,970 |
| | | | |
|
|
| | | | | | 81,922,674 |
| | | | |
|
|
| | | POLAND — 2.25% | | | |
| 497,000 | | KGHM Polska Miedz S.A. | | | 12,697,857 |
| 967,373 | | Powszechna Kasa Oszczednoski Polski Bank S.A. | | | 10,346,279 |
| | | | |
|
|
| | | | | | 23,044,136 |
| | | | |
|
|
See Notes to Financial Statements.
43
Excelsior Funds, Inc.
Portfolio of Investments — March 31, 2006
Emerging Markets Fund — (continued)
| | | | | |
Shares
| | | | Value
|
| | | | | | |
| COMMON STOCKS — (continued) | | |
| | | RUSSIA — 7.61% | | | |
| 210,200 | | Lukoil Co. ADR | | $ | 17,488,639 |
| 103,200 | | MMC Norilsk Nickel ADR | | | 9,731,760 |
| 368,100 | | Mobile TeleSystems ADR | | | 12,184,110 |
| 183,900 | | OAO Gazprom ADR | | | 16,845,240 |
| 103,200 | | Polyus Gold ADR(a) | | | 2,051,616 |
| 301,000 | | RBC Information Systems
ADR(a) | | | 9,270,800 |
| 530,100 | | Rostelecom ADR | | | 10,204,425 |
| | | | |
|
|
| | | | | | 77,776,590 |
| | | | |
|
|
| | | SOUTH AFRICA — 6.66% | | | |
| 2,911,042 | | African Bank Investments Ltd. | | | 14,215,304 |
| 436,200 | | Gold Fields Ltd. ADR | | | 9,587,676 |
| 1,522,224 | | MTN Group Ltd. | | | 15,152,377 |
| 650,402 | | Nedcor Ltd. | | | 13,556,259 |
| 596,116 | | Telekom South Africa Ltd. | | | 15,514,934 |
| | | | |
|
|
| | | | | | 68,026,550 |
| | | | |
|
|
| | | SOUTH KOREA — 15.01% | | | |
| 33,857 | | Amorepacific Corp. | | | 13,247,343 |
| 315,502 | | Hana Financial Group, Inc. | | | 14,941,930 |
| 603,638 | | KT Corp. ADR | | | 12,857,489 |
| 388,180 | | LG Cable Ltd. | | | 14,396,625 |
| 104,862 | | LG Home Shopping, Inc. | | | 9,912,030 |
| 11,840 | | Lotte Chilsung Beverage Co. Ltd. | | | 13,142,853 |
| 113,410 | | NCSoft Corp.(a) | | | 8,315,482 |
| 82,470 | | Samsung Electronic Co. Ltd. | | | 53,264,102 |
| 566,985 | | SK Telecom Co. Ltd. ADR | | | 13,375,176 |
| | | | |
|
|
| | | | | | 153,453,030 |
| | | | |
|
|
| | | SPAIN — 1.02% | | | |
| 366,058 | | Repsol YPF S.A. | | | 10,394,829 |
| | | | |
|
|
| | | TAIWAN — 7.07% | | | |
| 265,029 | | AU Optronics Corp. ADR | | | 3,951,582 |
| 2,417,393 | | Hon Hai Precision, Inc. | | | 14,930,744 |
| 891,700 | | iShares MSCI Taiwan Index
Fund(b) | | | 11,315,673 |
| 5,613,453 | | President Chain Store Corp. | | | 11,892,682 |
| 4,851,000 | | Quanta Computer, Inc. | | | 7,957,621 |
| 8,963,443 | | Synnex Technology International Corp. | | | 9,967,369 |
| | | | | |
Shares
| | | | Value
|
| | | | | | |
| COMMON STOCKS — (continued) | | |
| | | TAIWAN — (continued) | | | |
| 226,900 | | Taiwan Semiconductor Manufacturing Co. Ltd. | | $ | 445,499 |
| 1,176,967 | | Taiwan Semiconductor Manufacturing Co. Ltd. ADR | | | 11,840,288 |
| | | | |
|
|
| | | | | | 72,301,458 |
| | | | |
|
|
| | | THAILAND — 1.35% | | | |
| 5,867,900 | | Advanced Info Service Public Co. Ltd. (Foreign Shares) | | | 13,813,647 |
| | | | |
|
|
| | | TURKEY — 2.64% | | | |
| 713,640 | | Akbank T.A.S. ADR(c) | | | 11,986,798 |
| 1,112,582 | | Arcelik A.S. | | | 9,148,916 |
| 1,065,000 | | Turkiye Vakiflar Bankasi T.A.O., Class D(a) | | | 5,830,726 |
| | | | |
|
|
| | | | | | 26,966,440 |
| | | | |
|
|
| | | UNITED KINGDOM — 0.95% | | | |
| 126,268 | | Old Mutual plc | | | 439,953 |
| 2,652,994 | | Old Mutual plc (South Africa shares) | | | 9,224,836 |
| | | | |
|
|
| | | | | | 9,664,789 |
| | | | |
|
|
| | | VENEZUELA — 0.59% | | | |
| 284,599 | | Compania Anonima Nacional Telefonos de Venezuela ADR | | | 6,027,807 |
| | | | |
|
|
| | | TOTAL COMMON STOCKS (Cost $614,144,750) | | | 882,287,548 |
| | | | |
|
|
| PREFERRED STOCKS — 5.74% | | |
| | | BRAZIL — 4.50% | | | |
| 376,535 | | Banco Bradesco S.A. | | | 13,526,015 |
| 315,754,000 | | Companhia Energetica de Minas Gerais | | | 14,400,893 |
| 906,800 | | Petroleo Brasileiro S.A. | | | 18,026,999 |
| | | | |
|
|
| | | | | | 45,953,907 |
| | | | |
|
|
| | | SOUTH KOREA — 1.24% | | | |
| 230,000 | | Hyundai Motor Co. Ltd.(c) | | | 12,696,794 |
| | | | |
|
|
| | | TOTAL PREFERRED STOCKS (Cost $26,997,910) | | | 58,650,701 |
| | | | |
|
|
See Notes to Financial Statements.
44
Excelsior Funds, Inc.
Portfolio of Investments — March 31, 2006
Emerging Markets Fund — (continued)
| | | | | |
Principal
Amount
| | | | Value
|
| REPURCHASE AGREEMENT — 6.11% |
| $62,458,000 | | JP Morgan Chase Securities, Inc., 3.40%, dated 03/31/06, to be repurchased 04/03/06, repurchase price $62,475,696 (collateralized by U.S. Treasury Note, par value $46,785,000, 8.125%, maturing 08/15/21; total market value $62,920,009) | | $ | 62,458,000 |
| | | | |
|
|
| | | TOTAL REPURCHASE AGREEMENT (Cost $62,458,000) | | | 62,458,000 |
| | | | |
|
|
| | | | | | |
TOTAL INVESTMENTS (Cost $703,600,660)(d) | | 98.17 | % | | $ | 1,003,396,249 |
OTHER ASSETS IN EXCESS OF LIABILITIES | | 1.83 | | | | 18,726,151 |
| | |
|
| |
|
|
NET ASSETS | | 100.00 | % | | $ | 1,022,122,400 |
| | |
|
| |
|
|
| (a) | Non-income producing security |
| (b) | Registered Investment Company |
| (c) | Security exempt from registration under Rule 144A of the Securities Act of 1933. This security may be resold in transactions exempt from registration, normally to qualified institutional buyers. At March 31, 2006, these securities amounted to $35,405,081 or 3.46% of net assets. |
| (d) | Unrealized appreciation (depreciation) of securities: |
| | | | | | | |
Unrealized
Appreciation
| | Unrealized
(Depreciation)
| | | Net Unrealized
Appreciation/(Depreciation)
|
$307,839,128 | | $ | (8,043,539 | ) | | $ | 299,795,589 |
ADR—American Depository Receipt
GDR—Global Depository Receipt
Ltd.—Limited
plc—Public Limited Company
The summary of the Fund’s investments as of March 31, 2006 is as follows: (Unaudited)
| | | | | | |
Sector Diversification
| | % of
Net
Assets
| | | Value
|
Financial | | 18.76 | % | | $ | 191,704,549 |
Telecommunication | | 18.00 | | | | 183,936,321 |
Industrials | | 15.80 | | | | 161,482,152 |
Energy | | 10.13 | | | | 103,551,041 |
Consumer Discretionary | | 9.20 | | | | 94,016,541 |
Raw/Intermediate Materials | | 6.71 | | | | 68,622,869 |
Repurchase Agreement | | 6.11 | | | | 62,458,000 |
Consumer Staples | | 5.76 | | | | 58,869,413 |
Technology | | 2.39 | | | | 24,469,897 |
Investment Companies | | 2.16 | | | | 22,107,523 |
Utilities | | 1.65 | | | | 16,845,240 |
Information Technology | | 0.81 | | | | 8,315,482 |
Health Care | | 0.69 | | | | 7,017,221 |
| | |
|
| |
|
|
Total Investments | | 98.17 | % | | $ | 1,003,396,249 |
Other Assets in Excess of Liabilities | | 1.83 | | | | 18,726,151 |
| | |
|
| |
|
|
Net Assets | | 100.00 | % | | $ | 1,022,122,400 |
| | |
|
| |
|
|
See Notes to Financial Statements.
45
Excelsior Funds, Inc.
Portfolio of Investments — March 31, 2006
International Equity Fund
| | | | | |
Shares
| | | | Value
|
| COMMON STOCKS — 96.50% |
| | | AUSTRALIA — 1.10% | | | |
| 11,775 | | Rio Tinto Ltd. | | $ | 664,123 |
| | | | |
|
|
| | | BELGIUM — 1.22% | | | |
| 5,300 | | Umicore | | | 733,217 |
| | | | |
|
|
| | | CANADA — 2.16% | | | |
| 29,500 | | Rona, Inc.(a) | | | 563,168 |
| 9,587 | | Suncor Energy, Inc. | | | 735,939 |
| | | | |
|
|
| | | | | | 1,299,107 |
| | | | |
|
|
| | | CHINA — 2.11% | | | |
| 6,400 | | PetroChina Co. Ltd. ADR | | | 671,680 |
| 59,000 | | Sun Hung Kai Properties Ltd. (Hong Kong) | | | 598,420 |
| | | | |
|
|
| | | | | | 1,270,100 |
| | | | |
|
|
| | | FINLAND — 1.21% | | | |
| 29,000 | | Fortum Oyj | | | 730,266 |
| | | | |
|
|
| | | FRANCE — 8.73% | | | |
| 21,200 | | AXA S.A. | | | 741,420 |
| 9,900 | | BNP Paribas S.A. | | | 916,096 |
| 920 | | BNP Paribas S.A. (New-Line)(a) | | | 82,548 |
| 17,100 | | Carrefour S.A. | | | 906,690 |
| 7,404 | | Compagnie Generale de Geophysique S.A. (CGG)(a) | | | 1,075,602 |
| 8,458 | | Sanofi-Aventis S.A. | | | 801,953 |
| 2,779 | | TotalFinaElf S.A. | | | 732,543 |
| | | | |
|
|
| | | | | | 5,256,852 |
| | | | |
|
|
| | | GERMANY — 8.91% | | | |
| 3,800 | | Adidas-Salomon AG | | | 751,182 |
| 12,900 | | Altana AG | | | 799,397 |
| 16,400 | | Bayerische Motoren Werke AG | | | 903,217 |
| 36,600 | | Deutsche Telecom AG | | | 616,056 |
| 10,000 | | MAN AG | | | 694,965 |
| 18,800 | | Rhoen-Klinikum AG | | | 802,033 |
| 44,050 | | SGL Carbon AG(a) | | | 802,683 |
| | | | |
|
|
| | | | | | 5,369,533 |
| | | | |
|
|
| | | INDIA — 1.15% | | | |
| 13,000 | | State Bank of India GDR(b) | | | 690,339 |
| | | | |
|
|
| | | INDONESIA — 1.30% | | | |
| 1,033,300 | | PT Telekomunikasi Indonesia Tbk | | | 785,648 |
| | | | |
|
|
| | | | | |
Shares
| | | | Value
|
| COMMON STOCKS — (continued) |
| | | IRELAND — 2.41% | | | |
| 45,902 | | Anglo Irish Bank Corp. | | $ | 755,739 |
| 39,100 | | Depfa Bank plc | | | 696,139 |
| | | | |
|
|
| | | | | | 1,451,878 |
| | | | |
|
|
| | | ITALY — 2.18% | | | |
| 26,850 | | ENI S.p.A. | | | 764,457 |
| 30,450 | | Permasteelisa S.p.A. | | | 549,877 |
| | | | |
|
|
| | | | | | 1,314,334 |
| | | | |
|
|
| | | JAPAN — 23.71% | | | |
| 14,400 | | Canon, Inc. | | | 950,484 |
| 50,600 | | Casio Computer Co. Ltd. | | | 900,146 |
| 43,946 | | Chiyoda Corp. | | | 1,024,562 |
| 11,500 | | Don Quijote Co. Ltd. | | | 870,160 |
| 23,600 | | FamilyMart Co. Ltd. | | | 740,889 |
| 11,500 | | FANUC Co. Ltd. | | | 1,105,548 |
| 24,400 | | Hoya Corp. | | | 982,694 |
| 3,590 | | Keyence Corp. | | | 932,207 |
| 11,000 | | Kyocera Corp. | | | 969,776 |
| 47 | | Millea Holdings, Inc. | | | 927,438 |
| 41 | | Mitsubishi Tokyo Financial Group, Inc. | | | 623,620 |
| 57,000 | | Nikon Corp. | | | 1,021,045 |
| 120,000 | | Sumitomo Trust & Banking Co. Ltd. | | | 1,388,545 |
| 22,000 | | Takeda Pharmaceutical Co. Ltd. | | | 1,251,677 |
| 71,000 | | The Bank of Fukuoka Ltd. | | | 599,286 |
| | | | |
|
|
| | | | | | 14,288,077 |
| | | | |
|
|
| | | MEXICO — 2.64% | | | |
| 23,800 | | America Movil S.A. de C.V., Series L ADR | | | 815,388 |
| 11,860 | | Cemex S.A. de C.V. ADR | | | 774,221 |
| | | | |
|
|
| | | | | | 1,589,609 |
| | | | |
|
|
| | | NETHERLANDS — 2.47% | | | |
| 23,400 | | ABN Amro Holding NV | | | 699,132 |
| 53,400 | | Qiagen NV(a) | | | 788,423 |
| | | | |
|
|
| | | | | | 1,487,555 |
| | | | |
|
|
| | | NORWAY — 2.60% | | | |
| 79,000 | | Tandberg ASA | | | 712,167 |
| 79,400 | | Telenor ASA | | | 853,271 |
| | | | |
|
|
| | | | | | 1,565,438 |
| | | | |
|
|
| | | SINGAPORE — 1.47% | | | |
| 88,000 | | DBS Group Holdings Ltd. | | | 887,206 |
| | | | |
|
|
See Notes to Financial Statements.
46
Excelsior Funds, Inc.
Portfolio of Investments — March 31, 2006
International Equity Fund — (continued)
| | | | | |
Shares
| | | | Value
|
| COMMON STOCKS — (continued) |
| | | SOUTH KOREA — 1.28% | | | |
| 1,190 | | Samsung Electronic Co. Ltd. | | $ | 768,574 |
| | | | |
|
|
| | | SPAIN — 3.85% | | | |
| 61,500 | | Banco Santander Central Hispano S.A. | | | 896,784 |
| 26,700 | | Repsol YPF S.A. | | | 758,191 |
| 42,308 | | Telefonica S.A. | | | 662,493 |
| | | | |
|
|
| | | | | | 2,317,468 |
| | | | |
|
|
| | | SWEDEN — 1.50% | | | |
| 6,080 | | Modern Times Group (MTG) AB, Class B(a) | | | 285,451 |
| 14,100 | | Svenska Cellulosa AB | | | 619,117 |
| | | | |
|
|
| | | | | | 904,568 |
| | | | |
|
|
| | | SWITZERLAND — 3.30% | | | |
| 17,900 | | Micronas Semiconductor AG(a) | | | 570,975 |
| 4,800 | | Roche Holdings AG | | | 713,537 |
| 6,400 | | UBS AG, Registered Shares | | | 703,539 |
| | | | |
|
|
| | | | | | 1,988,051 |
| | | | |
|
|
| | | TAIWAN — 3.14% | | | |
| 161,841 | | Hon Hai Precision, Inc. | | | 999,592 |
| 88,954 | | Taiwan Semiconductor Manufacturing Co. Ltd. ADR | | | 894,877 |
| | | | |
|
|
| | | | | | 1,894,469 |
| | | | |
|
|
| | | TURKEY — 1.32% | | | |
| 96,400 | | Arcelik A.S. | | | 792,711 |
| | | | |
|
|
| | | UNITED KINGDOM — 16.74% | | | |
| 63,100 | | BG Group | | | 788,005 |
| 83,500 | | Cadbury Schweppes plc | | | 827,505 |
| 48,500 | | EMAP plc | | | 739,927 |
| 26,502 | | GlaxoSmithKline plc | | | 692,762 |
| 51,500 | | HSBC Holdings plc | | | 861,864 |
| 56,500 | | Paragon Group plc | | | 722,372 |
| 19,570 | | Reckitt Benckiser plc | | | 686,809 |
| 27,688 | | Royal Bank of Scotland Group plc | | | 900,170 |
| 187,200 | | Sage Group plc (The) | | | 892,937 |
| 141,149 | | Serco Group plc | | | 770,665 |
| 58,400 | | Shire plc | | | 896,441 |
| 275,941 | | Vodafone Group plc | | | 575,609 |
| 220,954 | | William Morrison Supermarkets plc | | | 727,032 |
| | | | |
|
|
| | | | | | 10,082,098 |
| | | | |
|
|
| | | TOTAL COMMON STOCKS (Cost $42,623,905) | | | 58,131,221 |
| | | | |
|
|
| | | | | |
Shares
| | | | Value
|
| PREFERRED STOCKS — 1.26% | | |
| | | SOUTH KOREA — 1.26% | | | |
| 13,800 | | Hyundai Motor Co. Ltd.(b) | | $ | 761,808 |
| | | | |
|
|
| | | TOTAL PREFERRED STOCKS (Cost $273,384) | | | 761,808 |
| | | | |
|
|
Principal
Amount
| | | | |
| REPURCHASE AGREEMENT — 5.35% |
| $3,221,000 | | JP Morgan Chase Securities, Inc., 3.40%, dated 03/31/06, to be repurchased 04/03/06, repurchase price $3,221,913 (collateralized by U.S. Treasury Note, par value $2,413,000, 8.125%, maturing 08/15/21; total market value $3,244,823) | | $ | 3,221,000 |
| | | | |
|
|
| | | TOTAL REPURCHASE AGREEMENT (Cost $3,221,000) | | | 3,221,000 |
| | | | |
|
|
| | | | | | | |
TOTAL INVESTMENTS (Cost $46,118,289)(c) | | 103.11 | % | | $ | 62,114,029 | |
LIABILITIES IN EXCESS OF OTHER ASSETS | | (3.11 | ) | | | (1,871,859 | ) |
| | |
|
| |
|
|
|
NET ASSETS | | 100.00 | % | | $ | 60,242,170 | |
| | |
|
| |
|
|
|
| (a) | Non-income producing security. |
| (b) | Security exempt from registration under Rule 144A of the Securities Act of 1933. This security may be resold in transactions exempt from registration, normally to qualified institutional buyers. At March 31, 2006, these securities amounted to $1,452,146 or 2.41% of net assets. |
| (c) | Unrealized appreciation (depreciation) of securities: |
| | | | | | | |
Unrealized
Appreciation
| | Unrealized
(Depreciation)
| | | Net Unrealized
Appreciation/(Depreciation)
|
$16,487,853 | | $ | (492,113 | ) | | $ | 15,995,740 |
ADR—American Depository Receipt
GDR—Global Depository Receipt
Ltd.—Limited
plc—public limited company
See Notes to Financial Statements.
47
Excelsior Funds, Inc.
Portfolio of Investments — March 31, 2006
International Equity Fund — (continued)
The summary of the Fund’s investments as of March 31, 2006 is as follows: (Unaudited)
| | | | | | | |
Sector Diversification
| | % of
Net
Assets
| | | Value
| |
Financial | | 22.73 | % | | $ | 13,690,659 | |
Information Technology | | 11.67 | | | | 7,029,910 | |
Industrials | | 11.46 | | | | 6,901,552 | |
Health Care | | 11.20 | | | | 6,746,222 | |
Consumer Discretionary | | 10.70 | | | | 6,446,960 | |
Telecommunication | | 9.56 | | | | 5,760,558 | |
Energy | | 9.17 | | | | 5,526,417 | |
Consumer Staples | | 6.46 | | | | 3,888,925 | |
Repurchase Agreement | | 5.35 | | | | 3,221,000 | |
Raw/Intermediate Materials | | 3.60 | | | | 2,171,560 | |
Utilities | | 1.21 | | | | 730,266 | |
| | |
|
| |
|
|
|
Total Investments | | 103.11 | % | | $ | 62,114,029 | |
Liabilities in Excess of Other Assets | | (3.11 | ) | | | (1,871,859 | ) |
| | |
|
| |
|
|
|
Net Assets | | 100.00 | % | | $ | 60,242,170 | |
| | |
|
| |
|
|
|
See Notes to Financial Statements.
48
[THIS PAGE INTENTIONALLY LEFT BLANK]
Excelsior Funds
Statements of Assets and Liabilities
March 31, 2006
| | | | | | | | | | | | | | | | |
| | | | |
| | | Money Fund
| | | Core Bond Fund
| | | High Yield Fund
| | | Income Fund
| |
ASSETS: | | | | | | | | | | | | | | | | |
Investments, at cost — see accompanying portfolios | | $ | 1,560,720,348 | | | $ | 281,602,078 | | | $ | 149,252,213 | | | $ | 101,428,350 | |
| | |
|
|
| |
|
|
| |
|
|
| |
|
|
|
Investments, at value (including Repurchase Agreements) (Note 1) | | $ | 1,560,720,348 | | | $ | 276,970,866 | | | $ | 147,260,964 | | | $ | 99,478,908 | |
Cash | | | 1 | | | | 55,120 | | | | 67,667 | | | | 1 | |
Foreign currency (cost $0, $0, $0, $0, $0, $0, $0, $479, $13,229,304, $163,515 respectively) | | | — | | | | — | | | | — | | | | — | |
Dividends and interest receivable | | | 119,649 | | | | 2,035,637 | | | | 3,099,231 | | | | 672,275 | |
Receivable for investments sold | | | — | | | | 23,572,035 | | | | 516,729 | | | | 2,693,907 | |
Receivable for fund shares sold | | | 1,219,952 | | | | 1,379,977 | | | | 269,603 | | | | 93,425 | |
Receivable for forward foreign currency contracts | | | — | | | | — | | | | — | | | | — | |
Reclaims receivable | | | — | | | | — | | | | — | | | | — | |
Receivable from Adviser for investment trades | | | — | | | | — | | | | — | | | | — | |
Prepaid expenses and other assets | | | 58,578 | | | | 10,629 | | | | 7,499 | | | | 4,182 | |
| | |
|
|
| |
|
|
| |
|
|
| |
|
|
|
Total Assets | | | 1,562,118,528 | | | | 304,024,264 | | | | 151,221,693 | | | | 102,942,698 | |
LIABILITIES: | | | | | | | | | | | | | | | | |
Payable for dividends declared | | | 5,955,217 | | | | 1,033,843 | | | | 884,504 | | | | 383,222 | |
Payable for investments purchased | | | — | | | | 19,196,094 | | | | 1,012,500 | | | | 2,743,125 | |
Cash overdraft | | | — | | | | — | | | | — | | | | — | |
Options written, at value (Premiums received: Value and Restructuring Fund — $1,760,972) | | | — | | | | — | | | | — | | | | — | |
Payable for fund shares redeemed | | | — | | | | 514,125 | | | | 91,496 | | | | 154,000 | |
Payable for forward foreign currency contracts | | | — | | | | — | | | | — | | | | — | |
Investment advisory fees payable (Note 2) | | | 151,152 | | | | 40,687 | | | | 72,065 | | | | 31,756 | |
Administration fees payable (Note 2) | | | 215,260 | | | | 36,260 | | | | 19,448 | | | | 12,904 | |
Shareholder servicing fees payable (Note 2) | | | 256,357 | | | | 87,672 | | | | 33,176 | | | | — | |
Directors’/Trustees’ fees and expenses payable (Note 2) | | | 1,256 | | | | 213 | | | | 127 | | | | 82 | |
Accrued expenses and other payables | | | 403,614 | | | | 99,445 | | | | 72,538 | | | | 43,528 | |
| | |
|
|
| |
|
|
| |
|
|
| |
|
|
|
Total Liabilities | | | 6,982,856 | | | | 21,008,339 | | | | 2,185,854 | | | | 3,368,617 | |
| | |
|
|
| |
|
|
| |
|
|
| |
|
|
|
NET ASSETS | | $ | 1,555,135,672 | | | $ | 283,015,925 | | | $ | 149,035,839 | | | $ | 99,574,081 | |
| | |
|
|
| |
|
|
| |
|
|
| |
|
|
|
NET ASSETS consist of: | | | | | | | | | | | | | | | | |
Undistributed (distributions in excess of) net investment income | | $ | — | | | $ | 2,407 | | | $ | (691,493 | ) | | $ | (1,059 | ) |
Accumulated net realized gain (loss) on investments, foreign currency transactions and written options | | | (40,526 | ) | | | (529,099 | ) | | | (65,200,572 | ) | | | (169,056 | ) |
Unrealized appreciation (depreciation) of investments, foreign currency translations and written options | | | — | | | | (4,631,212 | ) | | | (1,991,249 | ) | | | (1,949,442 | ) |
Par value (Note 5) | | | 1,555,381 | | | | 32,015 | | | | 330 | | | | 146 | |
Paid in capital in excess of par value | | | 1,553,620,817 | | | | 288,141,814 | | | | 216,918,823 | | | | 101,693,492 | |
| | |
|
|
| |
|
|
| |
|
|
| |
|
|
|
Net Assets | | $ | 1,555,135,672 | | | $ | 283,015,925 | | | $ | 149,035,839 | | | $ | 99,574,081 | |
| | |
|
|
| |
|
|
| |
|
|
| |
|
|
|
Net Assets: | | | | | | | | | | | | | | | | |
Institutional Shares | | $ | 522,751,196 | | | $ | 1,247,970 | | | $ | 12,045,308 | | | $ | 99,574,081 | |
Shares | | | 1,032,384,476 | | | | 281,766,940 | | | | 136,990,531 | | | | — | |
Retirement Shares | | | — | | | | 1,015 | | | | — | | | | — | |
Shares outstanding (Note 5): | | | | | | | | | | | | | | | | |
Institutional Shares | | | 522,753,455 | | | | 141,213 | | | | 2,662,208 | | | | 14,615,813 | |
Shares | | | 1,032,627,312 | | | | 31,873,492 | | | | 30,260,155 | | | | — | |
Retirement Shares | | | — | | | | 115 | | | | — | | | | — | |
NET ASSET VALUE PER SHARE (net assets / shares outstanding): | | | | | | | | | | | | | | | | |
Institutional Shares | | | $1.00 | | | | $8.84 | | | | $4.52 | | | | $6.81 | |
| | |
|
|
| |
|
|
| |
|
|
| |
|
|
|
Shares | | | $1.00 | | | | $8.84 | | | | $4.53 | | | | — | |
| | |
|
|
| |
|
|
| |
|
|
| |
|
|
|
Retirement Shares | | | — | | | | $8.85 | (a) | | | — | | | | — | |
| | |
|
|
| |
|
|
| |
|
|
| |
|
|
|
| (a) | | Due to rounding net assets divided by shares outstanding does not equal the net asset value per share. |
See Notes to Financial Statements.
50
| | | | | | | | | | | | | | | | | | | | | |
| | | | | |
Total Return
Bond Fund
| | | Equity Core Fund
| | | Mid Cap Value and
Restructuring Fund
| | | Value and
Restructuring
Fund
| | | Emerging Markets Fund
| | International
Equity Fund
| |
| | | | | | | | | | | | | | | | | | | | | | |
| $ | 138,770,078 | | | $ | 163,341,614 | | | $ | 214,039,456 | | | $ | 4,418,414,513 | | | $ | 703,600,660 | | $ | 46,118,289 | |
|
|
| |
|
|
| |
|
|
| |
|
|
| |
|
| |
|
|
|
| $ | 137,159,365 | | | $ | 187,700,242 | | | $ | 339,377,101 | | | $ | 6,526,794,792 | | | $ | 1,003,396,249 | | $ | 62,114,029 | |
| | — | | | | 29,228 | | | | 16,220 | | | | 44,798 | | | | 403 | | | 73,743 | |
|
— |
| | | — | | | | — | | | | 474 | | | | 13,019,575 | | | 157,491 | |
| | 1,142,004 | | | | 236,040 | | | | 255,748 | | | | 10,435,336 | | | | 4,332,801 | | | 161,659 | |
| | — | | | | — | | | | 530,468 | | | | 13,806,049 | | | | — | | | 913,201 | |
| | 41,767 | | | | 1,130,840 | | | | 222,171 | | | | 26,327,086 | | | | 4,003,189 | | | 1,791 | |
| | — | | | | — | | | | — | | | | — | | | | — | | | 3,721 | |
| | — | | | | 11,214 | | | | — | | | | — | | | | 2,735 | | | 27,533 | |
| | — | | | | — | | | | — | | | | — | | | | — | | | 2,214 | |
| | 5,767 | | | | 795 | | | | 12,840 | | | | 176,070 | | | | 11,643 | | | 1,485 | |
|
|
| |
|
|
| |
|
|
| |
|
|
| |
|
| |
|
|
|
| | 138,348,903 | | | | 189,108,359 | | | | 340,414,548 | | | | 6,577,584,605 | | | | 1,024,766,595 | | | 63,456,867 | |
| | | | | | | | | | | | | | | | | | | | | | |
| | 534,001 | | | | — | | | | — | | | | — | | | | — | | | — | |
| | — | | | | 2,076,067 | | | | 346,880 | | | | 80,374,040 | | | | — | | | 3,129,256 | |
| | 4 | | | | — | | | | — | | | | — | | | | — | | | — | |
| | — | | | | — | | | | — | | | | 22,340 | | | | — | | | — | |
| | 12,809 | | | | 324 | | | | 147,398 | | | | 6,892,296 | | | | 605,195 | | | — | |
| | — | | | | — | | | | — | | | | — | | | | — | | | 1,278 | |
| | 46,886 | | | | 71,244 | | | | 184,075 | | | | 3,196,180 | | | | 963,588 | | | 31,587 | |
| | 17,813 | | | | 22,466 | | | | 42,839 | | | | 804,492 | | | | 166,299 | | | 9,544 | |
| | 10,711 | | | | 35,710 | | | | 72,002 | | | | 2,907,743 | | | | 361,716 | | | — | |
| | 118 | | | | 110 | | | | 250 | | | | 4,582 | | | | 674 | | | 33 | |
| | 53,594 | | | | 48,040 | | | | 123,978 | | | | 1,366,040 | | | | 546,723 | | | 42,999 | |
|
|
| |
|
|
| |
|
|
| |
|
|
| |
|
| |
|
|
|
| | 675,936 | | | | 2,253,961 | | | | 917,422 | | | | 95,567,713 | | | | 2,644,195 | | | 3,214,697 | |
|
|
| |
|
|
| |
|
|
| |
|
|
| |
|
| |
|
|
|
| $ | 137,672,967 | | | $ | 186,854,398 | | | $ | 339,497,126 | | | $ | 6,482,016,892 | | | $ | 1,022,122,400 | | $ | 60,242,170 | |
|
|
| |
|
|
| |
|
|
| |
|
|
| |
|
| |
|
|
|
| | | | | | | | | | | | | | | | | | | | | | |
| $ | 831 | | | $ | 362,846 | | | $ | — | | | $ | 19,146,231 | | | $ | 1,061,119 | | $ | 125,060 | |
| | (440,694 | ) | | | (2,550,421 | ) | | | (1,981,324 | ) | | | (147,509,706 | ) | | | 6,968,458 | | | (15,282,642 | ) |
| | (1,610,713 | ) | | | 24,358,518 | | | | 125,337,645 | | | | 2,110,118,905 | | | | 300,030,575 | | | 15,990,567 | |
| | 197 | | | | 14,706 | | | | 173 | | | | 126,227 | | | | 79,108 | | | 61 | |
| | 139,723,346 | | | | 164,668,749 | | | | 216,140,632 | | | | 4,500,135,235 | | | | 713,983,140 | | | 59,409,124 | |
|
|
| |
|
|
| |
|
|
| |
|
|
| |
|
| |
|
|
|
| $ | 137,672,967 | | | $ | 186,854,398 | | | $ | 339,497,126 | | | $ | 6,482,016,892 | | | $ | 1,022,122,400 | | $ | 60,242,170 | |
|
|
| |
|
|
| |
|
|
| |
|
|
| |
|
| |
|
|
|
| | | | | | | | | | | | | | | | | | | | | | |
| $ | 137,672,967 | | | $ | 54,448,563 | | | $ | 101,964,771 | | | $ | 250,367,196 | | | $ | 25,456,549 | | $ | 60,242,170 | |
| | — | | | | 132,405,835 | | | | 237,531,224 | | | | 6,230,753,829 | | | | 996,665,851 | | | — | |
| | — | | | | — | | | | 1,131 | | | | 895,867 | | | | — | | | — | |
| | | | | | | | | | | | | | | | | | | | | | |
| | 19,686,867 | | | | 4,281,567 | | | | 5,179,373 | | | | 5,071,900 | | | | 2,016,921 | | | 6,103,546 | |
| | — | | | | 10,424,514 | | | | 12,094,786 | | | | 126,226,771 | | | | 79,108,061 | | | — | |
| | — | | | | — | | | | 58 | | | | 18,152 | | | | — | | | — | |
| | | | | | | | | | | | | | | | | | | | | | |
| | $6.99 | | | | $12.72 | | | | $19.69 | | | | $49.36 | | | | $12.62 | | | $9.87 | |
|
|
| |
|
|
| |
|
|
| |
|
|
| |
|
| |
|
|
|
| | — | | | | $12.70 | | | | $19.64 | | | | $49.36 | | | | $12.60 | | | — | |
|
|
| |
|
|
| |
|
|
| |
|
|
| |
|
| |
|
|
|
| | — | | | | — | | | | $19.62 | (a) | | | $49.35 | | | | — | | | — | |
|
|
| |
|
|
| |
|
|
| |
|
|
| |
|
| |
|
|
|
See Notes to Financial Statements.
51
Excelsior Funds
Statements of Operations
For the Year Ended March 31, 2006
| | | | | | | | | | | | | | | | |
| | | | |
| | | Money Fund
| | | Core Bond Fund
| | | High Yield Fund
| | | Income Fund
| |
INVESTMENT INCOME: | | | | | | | | | | | | | | | | |
Dividend income | | $ | — | | | $ | 363,045 | | | $ | — | | | $ | 233,508 | |
Interest income | | | 59,433,288 | | | | 11,931,800 | | | | 12,974,846 | | | | 4,566,395 | |
Less: Foreign taxes withheld | | | — | | | | — | | | | — | | | | — | |
| | |
|
|
| |
|
|
| |
|
|
| |
|
|
|
Total Income | | | 59,433,288 | | | | 12,294,845 | | | | 12,974,846 | | | | 4,799,903 | |
| | |
|
|
| |
|
|
| |
|
|
| |
|
|
|
EXPENSES: | | | | | | | | | | | | | | | | |
Investment advisory fees (Note 2) | | | 3,938,657 | | | | 1,861,068 | | | | 1,315,469 | | | | 686,077 | |
Administration fees (Note 2) | | | 2,379,752 | | | | 374,736 | | | | 248,330 | | | | 159,404 | |
Shareholder servicing fees — Institutional Shares (Note 2) | | | — | | | | — | | | | — | | | | 4 | |
Shareholder servicing fees — Shares (Note 2) | | | 2,539,555 | | | | 619,871 | | | | 373,757 | | | | — | |
Distribution and shareholder servicing fees — Retirement Shares (Note 2) | | | — | | | | 8 | | | | — | | | | — | |
Transfer agent fees | | | 77,271 | | | | 115,087 | | | | 29,777 | | | | 10,528 | |
Legal and audit fees | | | 186,695 | | | | 21,339 | | | | 33,451 | | | | 29,876 | |
Custodian fees | | | 78,967 | | | | 31,771 | | | | 8,896 | | | | 11,017 | |
Directors’/Trustees’ fees and expenses (Note 2) | | | 67,918 | | | | 10,076 | | | | 7,319 | | | | 4,488 | |
Miscellaneous expenses | | | 229,616 | | | | 186,792 | | | | 71,429 | | | | 42,559 | |
| | |
|
|
| |
|
|
| |
|
|
| |
|
|
|
Total Expenses | | | 9,498,431 | | | | 3,220,748 | | | | 2,088,428 | | | | 943,953 | |
Fees waived and reimbursed by: | | | | | | | | | | | | | | | | |
Investment Adviser (Note 2) | | | (2,481,701 | ) | | | (987,738 | ) | | | (399,394 | ) | | | (312,768 | ) |
| | |
|
|
| |
|
|
| |
|
|
| |
|
|
|
Net Expenses | | | 7,016,730 | | | | 2,233,010 | | | | 1,689,034 | | | | 631,185 | |
| | |
|
|
| |
|
|
| |
|
|
| |
|
|
|
NET INVESTMENT INCOME | | | 52,416,558 | | | | 10,061,835 | | | | 11,285,812 | | | | 4,168,718 | |
| | |
|
|
| |
|
|
| |
|
|
| |
|
|
|
REALIZED AND UNREALIZED GAIN (LOSS) ON INVESTMENTS (Note 1): | | | | | | | | | | | | | | | | |
Net realized gain (loss) on: | | | | | | | | | | | | | | | | |
Security transactions | | | (4,889 | ) | | | 1,284,930 | | | | (4,085,478 | ) | | | 322,159 | |
Foreign currency transactions | | | — | | | | — | | | | — | | | | — | |
Written options | | | — | | | | — | | | | — | | | | — | |
| | |
|
|
| |
|
|
| |
|
|
| |
|
|
|
Total net realized gain (loss) | | | (4,889 | ) | | | 1,284,930 | | | | (4,085,478 | ) | | | 322,159 | |
Change in unrealized appreciation (depreciation) of investments, foreign currency translations and written options during the year | | | — | | | | (7,274,735 | ) | | | (1,518,767 | ) | | | (2,076,924 | ) |
| | |
|
|
| |
|
|
| |
|
|
| |
|
|
|
Net realized and unrealized gain (loss) on investments, foreign currency transactions and written options | | | (4,889 | ) | | | (5,989,805 | ) | | | (5,604,245 | ) | | | (1,754,765 | ) |
| | |
|
|
| |
|
|
| |
|
|
| |
|
|
|
Net increase in net assets resulting from operations | | $ | 52,411,669 | | | $ | 4,072,030 | | | $ | 5,681,567 | | | $ | 2,413,953 | |
| | |
|
|
| |
|
|
| |
|
|
| |
|
|
|
See Notes to Financial Statements.
52
| | | | | | | | | | | | | | | | | | | | | | |
| | | | | |
Total Return
Bond Fund
| | | Equity Core Fund
| | | Mid Cap Value
and Restructuring
Fund
| | | Value and
Restructuring
Fund
| | | Emerging
Markets Fund
| | | International
Equity Fund
| |
| | | | | | | | | | | | | | | | | | | | | | | |
| $ | 179,366 | | | $ | 1,874,977 | | | $ | 3,495,855 | | | $ | 115,976,766 | | | $ | 18,722,500 | | | $ | 1,059,047 | |
| | 7,256,601 | | | | 225,723 | | | | 95,298 | | | | 2,934,780 | | | | 813,711 | | | | 13,265 | |
| | — | | | | (40,230 | ) | | | (41,289 | ) | | | (898,879 | ) | | | (1,564,939 | ) | | | (109,109 | ) |
|
|
| |
|
|
| |
|
|
| |
|
|
| |
|
|
| |
|
|
|
| | 7,435,967 | | | | 2,060,470 | | | | 3,549,864 | | | | 118,012,667 | | | | 17,971,272 | | | | 963,203 | |
|
|
| |
|
|
| |
|
|
| |
|
|
| |
|
|
| |
|
|
|
| | | | | | | | | | | | | | | | | | | | | | | |
| | 958,901 | | | | 964,274 | | | | 2,000,968 | | | | 31,707,572 | | | | 7,995,679 | | | | 478,078 | |
| | 222,791 | | | | 194,157 | | | | 464,898 | | | | 7,980,571 | | | | 1,279,319 | | | | 95,616 | |
| | 14,754 | | | | — | | | | 502 | | | | 59,719 | | | | — | | | | 84 | |
| | — | | | | 193,064 | | | | 551,305 | | | | 12,044,609 | | | | 1,551,989 | | | | — | |
| | — | | | | — | | | | 8 | | | | 1,294 | | | | — | | | | — | |
| | 10,412 | | | | 34,429 | | | | 80,649 | | | | 1,377,590 | | | | 213,574 | | | | 10,757 | |
| | 34,163 | | | | 31,911 | | | | 46,582 | | | | 339,880 | | | | 73,692 | | | | 29,379 | |
| | 13,000 | | | | 17,504 | | | | 29,585 | | | | 296,791 | | | | 865,872 | | | | 40,607 | |
| | 6,104 | | | | 4,776 | | | | 13,040 | | | | 214,586 | | | | 23,569 | | | | 1,798 | |
| | 43,944 | | | | 105,725 | | | | 87,414 | | | | 1,221,691 | | | | 262,291 | | | | 41,252 | |
|
|
| |
|
|
| |
|
|
| |
|
|
| |
|
|
| |
|
|
|
| | 1,304,069 | | | | 1,545,840 | | | | 3,274,951 | | | | 55,244,303 | | | | 12,265,985 | | | | 697,571 | |
| | | | | | | | | | | | | | | | | | | | | | | |
| | (420,513 | ) | | | (324,216 | ) | | | (11,769 | ) | | | — | | | | (712,659 | ) | | | (200,154 | ) |
|
|
| |
|
|
| |
|
|
| |
|
|
| |
|
|
| |
|
|
|
| | 883,556 | | | | 1,221,624 | | | | 3,263,182 | | | | 55,244,303 | | | | 11,553,326 | | | | 497,417 | |
|
|
| |
|
|
| |
|
|
| |
|
|
| |
|
|
| |
|
|
|
| | 6,552,411 | | | | 838,846 | | | | 286,682 | | | | 62,768,364 | | | | 6,417,946 | | | | 465,786 | |
|
|
| |
|
|
| |
|
|
| |
|
|
| |
|
|
| |
|
|
|
| | | | | | | | | | | | | | | | | | | | | | | |
| | | | | | | | | | | | | | | | | | | | | | | |
| | 1,546,347 | | | | (2,550,421 | ) | | | (1,834,984 | ) | | | 25,954,026 | | | | 9,700,177 | | | | 4,365,074 | |
| | — | | | | (6,635 | ) | | | 737 | | | | (55,500 | ) | | | (39,141 | ) | | | (24,394 | ) |
| | — | | | | — | | | | — | | | | (7,456,185 | ) | | | — | | | | — | |
|
|
| |
|
|
| |
|
|
| |
|
|
| |
|
|
| |
|
|
|
| | 1,546,347 | | | | (2,557,056 | ) | | | (1,834,247 | ) | | | 18,442,341 | | | | 9,661,036 | | | | 4,340,680 | |
| | (4,919,871 | ) | | | 23,862,728 | | | | 51,686,678 | | | | 892,712,062 | | | | 233,002,829 | | | | 7,679,711 | |
|
|
| |
|
|
| |
|
|
| |
|
|
| |
|
|
| |
|
|
|
| | (3,373,524 | ) | | | 21,305,672 | | | | 49,852,431 | | | | 911,154,403 | | | | 242,663,865 | | | | 12,020,391 | |
|
|
| |
|
|
| |
|
|
| |
|
|
| |
|
|
| |
|
|
|
| $ | 3,178,887 | | | $ | 22,144,518 | | | $ | 50,139,113 | | | $ | 973,922,767 | | | $ | 249,081,811 | | | $ | 12,486,177 | |
|
|
| |
|
|
| |
|
|
| |
|
|
| |
|
|
| |
|
|
|
See Notes to Financial Statements.
53
Excelsior Funds
Statements of Changes in Net Assets
| | | | | | | | | | | | | | | | |
| | |
| | | Money Fund
| | | Core Bond Fund
| |
| | | Year Ended March 31,
| | | Year Ended March 31,
| |
| | | 2006
| | | 2005
| | | 2006
| | | 2005
| |
Net investment income | | $ | 52,416,558 | | | $ | 21,599,947 | | | $ | 10,061,835 | | | $ | 10,538,687 | |
Net realized gain (loss) on investments and foreign currency transactions | | | (4,889 | ) | | | 6,919 | | | | 1,284,930 | | | | 3,809,789 | |
Change in unrealized appreciation (depreciation) of investments and foreign currency translations during the year | | | — | | | | — | | | | (7,274,735 | ) | | | (9,984,664 | ) |
| | |
|
|
| |
|
|
| |
|
|
| |
|
|
|
Net increase in net assets resulting from operations | | | 52,411,669 | | | | 21,606,866 | | | | 4,072,030 | | | | 4,363,812 | |
| | |
|
|
| |
|
|
| |
|
|
| |
|
|
|
Distributions to shareholders: | | | | | | | | | | | | | | | | |
From net investment income | | | | | | | | | | | | | | | | |
Institutional Shares | | | (19,834,796 | ) | | | (6,978,835 | ) | | | (6,254 | ) | | | — | |
Shares | | | (32,581,762 | ) | | | (14,621,112 | ) | | | (10,218,978 | ) | | | (10,706,658 | ) |
Retirement Shares | | | — | | | | — | | | | (38 | ) | | | (4 | ) |
From net realized gain on investments | | | | | | | | | | | | | | | | |
Institutional Shares | | | — | | | | — | | | | (13 | ) | | | — | |
Shares | | | — | | | | — | | | | (3,571,500 | ) | | | (1,392,832 | ) |
Retirement Shares | | | — | | | | — | | | | (13 | ) | | | — | |
From tax return of capital | | | | | | | | | | | | | | | | |
Institutional Shares | | | — | | | | — | | | | — | | | | — | |
Shares | | | — | | | | — | | | | — | | | | — | |
| | |
|
|
| |
|
|
| |
|
|
| |
|
|
|
Total distributions | | | (52,416,558 | ) | | | (21,599,947 | ) | | | (13,796,796 | ) | | | (12,099,494 | ) |
| | |
|
|
| |
|
|
| |
|
|
| |
|
|
|
Increase (decrease) in net assets from fund share transactions (Note 5) | | | (175,199,854 | ) | | | 118,582,301 | | | | 80,807,705 | | | | (49,358,178 | ) |
| | |
|
|
| |
|
|
| |
|
|
| |
|
|
|
Net increase (decrease) in net assets | | | (175,204,743 | ) | | | 118,589,220 | | | | 71,082,939 | | | | (57,093,860 | ) |
| | |
|
|
| |
|
|
| |
|
|
| |
|
|
|
NET ASSETS: | | | | | | | | | | | | | | | | |
Beginning of year | | | 1,730,340,415 | | | | 1,611,751,195 | | | | 211,932,986 | | | | 269,026,846 | |
| | |
|
|
| |
|
|
| |
|
|
| |
|
|
|
End of year (1) | | $ | 1,555,135,672 | | | $ | 1,730,340,415 | | | $ | 283,015,925 | | | $ | 211,932,986 | |
| | |
|
|
| |
|
|
| |
|
|
| |
|
|
|
(1) Including undistributed (distributions in excess of) net investment income | | $ | — | | | $ | — | | | $ | 2,407 | | | $ | 9,744 | |
| | |
|
|
| |
|
|
| |
|
|
| |
|
|
|
See Notes to Financial Statements.
54
| | | | | | | | | | | | | | | | | | | | | | |
| | |
High Yield Fund
| | | Income Fund
| | | Total Return Bond Fund
| |
Year Ended March 31,
| | | Year Ended March 31,
| | | Year Ended March 31,
| |
2006
| | | 2005
| | | 2006
| | | 2005
| | | 2006
| | | 2005
| |
| $ | 11,285,812 | | | $ | 12,382,052 | | | $ | 4,168,718 | | | $ | 4,618,953 | | | $ | 6,552,411 | | | $ | 6,744,014 | |
| | | | | | | | | | | | | | | | | | | | | | | |
| | (4,085,478 | ) | | | 1,684,436 | | | | 322,159 | | | | 467,060 | | | | 1,546,347 | | | | 606,338 | |
| | | | | | | | | | | | | | | | | | | | | | | |
| | | | | | | | | | | | | | | | | | | | | | | |
| | (1,518,767 | ) | | | (3,437,364 | ) | | | (2,076,924 | ) | | | (3,580,154 | ) | | | (4,919,871 | ) | | | (6,549,134 | ) |
|
|
| |
|
|
| |
|
|
| |
|
|
| |
|
|
| |
|
|
|
| | 5,681,567 | | | | 10,629,124 | | | | 2,413,953 | | | | 1,505,859 | | | | 3,178,887 | | | | 801,218 | |
|
|
| |
|
|
| |
|
|
| |
|
|
| |
|
|
| |
|
|
|
| | | | | | | | | | | | | | | | | | | | | | | |
| | | | | | | | | | | | | | | | | | | | | | | |
| | (1,002,532 | ) | | | (1,404,626 | ) | | | (4,503,920 | ) | | | (5,047,776 | ) | | | (6,642,823 | ) | | | (6,757,222 | ) |
| | (9,681,268 | ) | | | (10,208,446 | ) | | | — | | | | — | | | | — | | | | — | |
| | — | | | | — | | | | — | | | | — | | | | — | | | | — | |
| | | | | | | | | | | | | | | | | | | | | | | |
| | — | | | | — | | | | (161,180 | ) | | | (287,292 | ) | | | (2,462,797 | ) | | | (1,954,501 | ) |
| | — | | | | — | | | | — | | | | — | | | | — | | | | — | |
| | — | | | | — | | | | — | | | | — | | | | — | | | | — | |
| | | | | | | | | | | | | | | | | | | | | | | |
| | (28,599 | ) | | | — | | | | — | | | | — | | | | — | | | | — | |
| | (325,252 | ) | | | — | | | | — | | | | — | | | | — | | | | — | |
|
|
| |
|
|
| |
|
|
| |
|
|
| |
|
|
| |
|
|
|
| | (11,037,651 | ) | | | (11,613,072 | ) | | | (4,665,100 | ) | | | (5,335,068 | ) | | | (9,105,620 | ) | | | (8,711,723 | ) |
|
|
| |
|
|
| |
|
|
| |
|
|
| |
|
|
| |
|
|
|
| | | | | | | | | | | | | | | | | | | | | | | |
| | (15,055,145 | ) | | | (3,685,731 | ) | | | (2,485,754 | ) | | | (7,902,918 | ) | | | (5,482,933 | ) | | | (3,699,026 | ) |
|
|
| |
|
|
| |
|
|
| |
|
|
| |
|
|
| |
|
|
|
| | (20,411,229 | ) | | | (4,669,679 | ) | | | (4,736,901 | ) | | | (11,732,127 | ) | | | (11,409,666 | ) | | | (11,609,531 | ) |
|
|
| |
|
|
| |
|
|
| |
|
|
| |
|
|
| |
|
|
|
| | | | | | | | | | | | | | | | | | | | | | | |
| | 169,447,068 | | | | 174,116,747 | | | | 104,310,982 | | | | 116,043,109 | | | | 149,082,633 | | | | 160,692,164 | |
|
|
| |
|
|
| |
|
|
| |
|
|
| |
|
|
| |
|
|
|
| $ | 149,035,839 | | | $ | 169,447,068 | | | $ | 99,574,081 | | | $ | 104,310,982 | | | $ | 137,672,967 | | | $ | 149,082,633 | |
|
|
| |
|
|
| |
|
|
| |
|
|
| |
|
|
| |
|
|
|
| | | | | |
| $ | (691,493 | ) | | $ | (1,124,014 | ) | | $ | (1,059 | ) | | $ | (1,454 | ) | | $ | 831 | | | $ | 3,298 | |
|
|
| |
|
|
| |
|
|
| |
|
|
| |
|
|
| |
|
|
|
See Notes to Financial Statements.
55
Excelsior Funds
Statements of Changes in Net Assets
| | | | | | | | | | | | | | | | |
| | |
| | | Equity Core Fund
| | | Mid Cap Value and
Restructuring Fund
| |
| | | Year Ended March 31,
| | | Year Ended March 31,
| |
| | | 2006
| | | 2005
| | | 2006
| | | 2005
| |
Net investment income | | $ | 838,846 | | | $ | 156,080 | | | $ | 286,682 | | | $ | 4,522,387 | |
Net realized gain (loss) on investments and foreign currency transactions | | | (2,557,056 | ) | | | 17,682 | | | | (1,834,247 | ) | | | 12,485,605 | |
Net realized gain (loss) on written options | | | — | | | | — | | | | — | | | | — | |
Change in unrealized appreciation (depreciation) of investments, foreign currency translations and written options during the year | | | 23,862,728 | | | | 495,790 | | | | 51,686,678 | | | | 10,433,850 | |
| | |
|
|
| |
|
|
| |
|
|
| |
|
|
|
Net increase in net assets resulting from operations | | | 22,144,518 | | | | 669,552 | | | | 50,139,113 | | | | 27,441,842 | |
| | |
|
|
| |
|
|
| |
|
|
| |
|
|
|
Distributions to shareholders: | | | | | | | | | | | | | | | | |
From net investment income | | | | | | | | | | | | | | | | |
Institutional Shares | | | (312,869 | ) | | | — | | | | (320,565 | ) | | | (1,745,081 | ) |
Shares | | | (261,632 | ) | | | (56,745 | ) | | | (377,856 | ) | | | (2,985,864 | ) |
Retirement Shares | | | — | | | | — | | | | — | | | | — | |
From net realized gain on investments | | | | | | | | | | | | | | | | |
Institutional Shares | | | — | | | | — | | | | — | | | | — | |
Shares | | | — | | | | (12,320 | ) | | | — | | | | — | |
Retirement Shares | | | — | | | | — | | | | — | | | | — | |
| | |
|
|
| |
|
|
| |
|
|
| |
|
|
|
Total distributions | | | (574,501 | ) | | | (69,065 | ) | | | (698,421 | ) | | | (4,730,945 | ) |
| | |
|
|
| |
|
|
| |
|
|
| |
|
|
|
Increase (decrease) in net assets from fund share transactions (Note 5) | | | 67,878,748 | | | | 96,805,046 | | | | (6,359,254 | ) | | | (13,744,291 | ) |
| | |
|
|
| |
|
|
| |
|
|
| |
|
|
|
Net increase in net assets | | | 89,448,765 | | | | 97,405,533 | | | | 43,081,438 | | | | 8,966,606 | |
| | |
|
|
| |
|
|
| |
|
|
| |
|
|
|
NET ASSETS: | | | | | | | | | | | | | | | | |
Beginning of year | | | 97,405,633 | | | | 100 | | | | 296,415,688 | | | | 287,449,082 | |
| | |
|
|
| |
|
|
| |
|
|
| |
|
|
|
End of year (1) | | $ | 186,854,398 | | | $ | 97,405,633 | | | $ | 339,497,126 | | | $ | 296,415,688 | |
| | |
|
|
| |
|
|
| |
|
|
| |
|
|
|
(1) Including undistributed (distributions in excess of) net investment income | | $ | 362,846 | | | $ | 96,881 | | | $ | — | | | $ | 388,063 | |
| | |
|
|
| |
|
|
| |
|
|
| |
|
|
|
See Notes to Financial Statements.
56
| | | | | | | | | | | | | | | | | | | | | | |
| | |
Value and Restructuring
Fund
| | | Emerging Markets
Fund
| | | International Equity
Fund
| |
Year Ended March 31,
| | | Year Ended March 31,
| | | Year Ended March 31,
| |
2006
| | | 2005
| | | 2006
| | | 2005
| | | 2006
| | | 2005
| |
| $ | 62,768,364 | | | $ | 33,469,906 | | | $ | 6,417,946 | | | $ | 3,691,895 | | | $ | 465,786 | | | $ | 430,538 | |
| | 25,898,526 | | | | 25,789,954 | | | | 9,661,036 | | | | 8,130,513 | | | | 4,340,680 | | | | 4,311,853 | |
| | (7,456,185 | ) | | | 2,015,708 | | | | — | | | | — | | | | — | | | | — | |
| 892,712,062 | | | | 348,650,183 | | | | 233,002,829 | | | | 23,888,849 | | | | 7,679,711 | | | | 940,094 | |
|
|
| |
|
|
| |
|
|
| |
|
|
| |
|
|
| |
|
|
|
| | 973,922,767 | | | | 409,925,751 | | | | 249,081,811 | | | | 35,711,257 | | | | 12,486,177 | | | | 5,682,485 | |
|
|
| |
|
|
| |
|
|
| |
|
|
| |
|
|
| |
|
|
|
| | | | | | | | | | | | | | | | | | | | | | | |
| | | | | | | | | | | | | | | | | | | | | | | |
| | (2,339,479 | ) | | | (542,162 | ) | | | (210,171 | ) | | | — | | | | (738,048 | ) | | | (65,782 | ) |
| | (50,184,813 | ) | | | (31,399,379 | ) | | | (5,703,935 | ) | | | (3,087,200 | ) | | | — | | | | — | |
| | (1,311 | ) | | | — | | | | — | | | | — | | | | — | | | | — | |
| | | | | | | | | | | | | | | | | | | | | | | |
| | — | | | | — | | | | — | | | | — | | | | — | | | | — | |
| | — | | | | — | | | | — | | | | (5,580,183 | ) | | | — | | | | — | |
| | — | | | | — | | | | — | | | | — | | | | — | | | | — | |
|
|
| |
|
|
| |
|
|
| |
|
|
| |
|
|
| |
|
|
|
| | (52,525,603 | ) | | | (31,941,541 | ) | | | (5,914,106 | ) | | | (8,667,383 | ) | | | (738,048 | ) | | | (65,782 | ) |
|
|
| |
|
|
| |
|
|
| |
|
|
| |
|
|
| |
|
|
|
| | 930,527,802 | | | | 969,013,914 | | | | 345,786,429 | | | | 196,963,205 | | | | 5,054,635 | | | | 2,224,548 | |
|
|
| |
|
|
| |
|
|
| |
|
|
| |
|
|
| |
|
|
|
| | 1,851,924,966 | | | | 1,346,998,124 | | | | 588,954,134 | | | | 224,007,079 | | | | 16,802,764 | | | | 7,841,251 | |
|
|
| |
|
|
| |
|
|
| |
|
|
| |
|
|
| |
|
|
|
| | | | | | | | | | | | | | | | | | | | | | | |
| | 4,630,091,926 | | | | 3,283,093,802 | | | | 433,168,266 | | | | 209,161,187 | | | | 43,439,406 | | | | 35,598,155 | |
|
|
| |
|
|
| |
|
|
| |
|
|
| |
|
|
| |
|
|
|
| $ | 6,482,016,892 | | | $ | 4,630,091,926 | | | $ | 1,022,122,400 | | | $ | 433,168,266 | | | $ | 60,242,170 | | | $ | 43,439,406 | |
|
|
| |
|
|
| |
|
|
| |
|
|
| |
|
|
| |
|
|
|
| | | | | |
| $ | 19,146,231 | | | $ | 8,690,692 | | | $ | 1,061,119 | | | $ | 596,420 | | | $ | 125,060 | | | $ | 421,803 | |
|
|
| |
|
|
| |
|
|
| |
|
|
| |
|
|
| |
|
|
|
See Notes to Financial Statements.
57
Excelsior Funds
Financial Highlights — Selected Per Share Data and Ratios
| | | | | | | | | | | | | | | | | | | | | | | |
| | | Net Asset Value,
Beginning of
Year
| | Net
Investment
Income
| | | Net Realized and
Unrealized
Gain (Loss) of
Investments
and Options
| | | Total From
Investment
Operations
| | | Distributions
From Net
Investment
Income
| | | Distributions
From Net
Realized
Gain on
Investments
and Options
| |
MONEY FUND — (12/16/99*) | | | | | | | | | | | | | | | | | | | | |
Institutional Shares: | | | | | | | | | | | | | | | | | | | | | | | |
Year Ended March 31, | | | | | | | | | | | | | | | | | | | | | | | |
2006 | | $ | 1.00 | | $ | 0.04 | (2) | | $ | (0.01 | )(2) | | $ | 0.03 | | | $ | (0.03 | ) | | $ | — | |
2005 | | | 1.00 | | | 0.02 | (2) | | | (0.01 | )(2) | | | 0.01 | | | | (0.01 | ) | | | — | |
2004 | | | 1.00 | | | 0.01 | | | | — | | | | 0.01 | | | | (0.01 | ) | | | — | |
2003 | | | 1.00 | | | 0.01 | | | | — | (3) | | | 0.01 | | | | (0.01 | ) | | | — | |
2002 | | | 1.00 | | | 0.03 | | | | — | (3) | | | 0.03 | | | | (0.03 | ) | | | — | |
CORE BOND FUND — (11/30/05*) | | | | | | | | | | | | | | | | | | | | |
Institutional Shares: | | | | | | | | | | | | | | | | | | | | | | | |
Period Ended March 31, 2006 | | $ | 9.07 | | $ | 0.13 | (2) | | $ | (0.11 | )(2) | | $ | 0.02 | | | $ | (0.13 | ) | | $ | (0.12 | ) |
HIGH YIELD FUND — (10/31/00*) | | | | | | | | | | | | | | | | | | | | |
Institutional Shares: | | | | | | | | | | | | | | | | | | | | | | | |
Year Ended March 31, | | | | | | | | | | | | | | | | | | | | | | | |
2006 | | $ | 4.66 | | $ | 0.32 | (2) | | $ | (0.14 | )(2) | | $ | 0.18 | | | $ | (0.32 | )(6) | | $ | — | |
2005 | | | 4.71 | | | 0.32 | (2) | | | (0.06 | )(2) | | | 0.26 | | | | (0.31 | ) | | | — | |
2004 | | | 3.99 | | | 0.35 | (2) | | | 0.72 | (2) | | | 1.07 | | | | (0.35 | )(7) | | | — | |
2003 | | | 6.20 | | | 0.93 | (2) | | | (1.58 | )(2) | | | (0.65 | ) | | | (1.56 | )(8) | | | — | |
2002 | | | 7.26 | | | 1.09 | | | | (1.01 | ) | | | 0.08 | | | | (1.10 | ) | | | (0.04 | ) |
INCOME FUND — (01/16/95*) | | | | | | | | | | | | | | | | | | | | |
Institutional Shares: | | | | | | | | | | | | | | | | | | | | | | | |
Year Ended March 31, | | | | | | | | | | | | | | | | | | | | | | | |
2006 | | $ | 6.96 | | $ | 0.28 | (2) | | $ | (0.12 | )(2) | | $ | 0.16 | | | $ | (0.30 | ) | | $ | (0.01 | ) |
2005 | | | 7.21 | | | 0.29 | (2) | | | (0.20 | )(2) | | | 0.09 | | | | (0.32 | ) | | | (0.02 | ) |
2004 | | | 7.21 | | | 0.34 | | | | 0.07 | | | | 0.41 | | | | (0.34 | ) | | | (0.07 | ) |
2003 | | | 6.93 | | | 0.39 | | | | 0.31 | | | | 0.70 | | | | (0.39 | ) | | | (0.03 | ) |
2002 | | | 7.01 | | | 0.40 | | | | (0.04 | ) | | | 0.36 | | | | (0.40 | ) | | | (0.04 | ) |
TOTAL RETURN BOND FUND — (01/19/95*) | | | | | | | | | | | | | | | | | |
Institutional Shares: | | | | | | | | | | | | | | | | | | | | | | | |
Year Ended March 31, | | | | | | | | | | | | | | | | | | | | | | | |
2006 | | $ | 7.29 | | $ | 0.32 | (2) | | $ | (0.17 | )(2) | | $ | 0.15 | | | $ | (0.33 | ) | | $ | (0.12 | ) |
2005 | | | 7.66 | | | 0.33 | (2) | | | (0.27 | )(2) | | | 0.06 | | | | (0.33 | ) | | | (0.10 | ) |
2004 | | | 7.78 | | | 0.34 | | | | 0.08 | | | | 0.42 | | | | (0.34 | ) | | | (0.20 | ) |
2003 | | | 7.37 | | | 0.40 | | | | 0.48 | | | | 0.88 | | | | (0.40 | ) | | | (0.07 | ) |
2002 | | | 7.46 | | | 0.43 | | | | (0.09 | ) | | | 0.34 | | | | (0.43 | ) | | | — | |
| * | Commencement of Operations. |
| (1) | Expense ratios before waiver of fees and reimbursement of expenses (if any) by adviser and administrator. |
| (2) | For comparative purposes per share amounts are based on average shares outstanding. |
| (3) | Amount represents less than $0.01 per share. |
| (6) | Includes a tax return of capital of $(0.01). |
| (7) | Includes a tax return of capital of $(0.08). |
| (8) | Includes a tax return of capital of $(0.51). |
See Notes to Financial Statements.
58
| | | | | | | | | | | | | | | | | | | | | | | |
| | | | | | | |
Total
Distributions
| | | Net Asset
Value,
End of
Year
| | Total
Return
| | | Net Assets,
End of
Year
(000’s)
| | Ratio of Net
Operating
Expenses
to Average
Net Assets
| | | Ratio of Gross
Operating
Expenses to
Average
Net Assets (1)
| | | Ratio of Net
Investment
Income
to Average
Net Assets
| | | Portfolio
Turnover
Rate
| |
| | | | | | | | | | | | | | | | | | | | | | | | |
| | | | | | | | | | | | | | | | | | | | | | | | |
| | | | | | | | | | | | | | | | | | | | | | | | |
| $ | (0.03 | ) | | $ | 1.00 | | 3.53 | % | | $ | 522,751 | | 0.29 | % | | 0.44 | % | | 3.54 | % | | — | |
| | (0.01 | ) | | | 1.00 | | 1.55 | % | | | 625,287 | | 0.21 | % | | 0.46 | % | | 1.52 | % | | — | |
| | (0.01 | ) | | | 1.00 | | 0.87 | % | | | 470,189 | | 0.25 | % | | 0.53 | % | | 0.86 | % | | — | |
| | (0.01 | ) | | | 1.00 | | 1.41 | % | | | 548,126 | | 0.24 | % | | 0.49 | % | | 1.41 | % | | — | |
| | (0.03 | ) | | | 1.00 | | 2.98 | % | | | 309,829 | | 0.25 | % | | 0.54 | % | | 2.83 | % | | — | |
| | | | | | | | | | | | | | | | | | | | | | | | |
| | | | | | | | | | | | | | | | | | | | | | | | |
| | | | | | | | | | | | | | | | | | | | | | | | |
| $ | (0.25 | ) | | $ | 8.84 | | 0.20 | %(4) | | $ | 1,248 | | 0.66 | %(5) | | 1.22 | %(5) | | 4.56 | %(5) | | 95 | % |
| | | | | | | | | | | | | | | | | | | | | | | | |
| | | | | | | | | | | | | | | | | | | | | | | | |
| | | | | | | | | | | | | | | | | | | | | | | | |
| $ | (0.32 | ) | | $ | 4.52 | | 4.19 | % | | $ | 12,045 | | 0.80 | % | | 1.04 | % | | 7.09 | % | | 62 | % |
| | (0.31 | ) | | | 4.66 | | 5.80 | % | | | 13,308 | | 0.80 | % | | 1.07 | % | | 6.71 | % | | 70 | % |
| | (0.35 | ) | | | 4.71 | | 27.76 | % | | | 22,641 | | 0.80 | % | | 1.11 | % | | 7.91 | % | | 170 | % |
| | (1.56 | ) | | | 3.99 | | (10.30 | )% | | | 37,250 | | 0.83 | % | | 1.10 | % | | 19.14 | % | | 153 | % |
| | (1.14 | ) | | | 6.20 | | 1.53 | % | | | 48,241 | | 0.78 | % | | 1.10 | % | | 17.81 | % | | 311 | % |
| | | | | | | | | | | | | | | | | | | | | | | | |
| | | | | | | | | | | | | | | | | | | | | | | | |
| | | | | | | | | | | | | | | | | | | | | | | | |
| $ | (0.31 | ) | | $ | 6.81 | | 2.27 | % | | $ | 99,574 | | 0.60 | % | | 0.89 | % | | 3.95 | % | | 49 | % |
| | (0.34 | ) | | | 6.96 | | 1.24 | % | | | 104,311 | | 0.50 | % | | 0.92 | % | | 4.13 | % | | 40 | % |
| | (0.41 | ) | | | 7.21 | | 5.81 | % | | | 116,043 | | 0.50 | % | | 0.89 | % | | 4.47 | % | | 57 | % |
| | (0.42 | ) | | | 7.21 | | 10.36 | % | | | 105,215 | | 0.50 | % | | 0.81 | % | | 5.38 | % | | 59 | % |
| | (0.44 | ) | | | 6.93 | | 5.18 | % | | | 111,309 | | 0.50 | % | | 0.87 | % | | 5.54 | % | | 88 | % |
| | | | | | | | | | | | | | | | | | | | | | | | |
| | | | | | | | | | | | | | | | | | | | | | | | |
| | | | | | | | | | | | | | | | | | | | | | | | |
| $ | (0.45 | ) | | $ | 6.99 | | 2.00 | % | | $ | 137,673 | | 0.60 | % | | 0.88 | % | | 4.44 | % | | 51 | % |
| | (0.43 | ) | | | 7.29 | | 0.75 | % | | | 149,083 | | 0.50 | % | | 0.91 | % | | 4.42 | % | | 48 | % |
| | (0.54 | ) | | | 7.66 | | 5.61 | % | | | 160,692 | | 0.50 | % | | 0.89 | % | | 4.32 | % | | 43 | % |
| | (0.47 | ) | | | 7.78 | | 12.27 | % | | | 271,535 | | 0.50 | % | | 0.82 | % | | 5.15 | % | | 106 | % |
| | (0.43 | ) | | | 7.37 | | 4.65 | % | | | 285,551 | | 0.50 | % | | 0.87 | % | | 5.70 | % | | 113 | % |
See Notes to Financial Statements.
59
Excelsior Funds
Financial Highlights — Selected Per Share Data and Ratios
| | | | | | | | | | | | | | | | | | | | | | | |
| | | Net Asset Value,
Beginning of
Year
| | Net
Investment
Income
| | | Net Realized and
Unrealized
Gain (Loss) of
Investments
and Options
| | | Total From
Investment
Operations
| | | Dividends
From Net
Investment
Income
| | | Distributions
From Net
Realized
Gain on
Investments
and Options
| |
EQUITY CORE FUND — (01/31/05*) | | | | | | | | | | | | | | | | | | | | |
Institutional Shares: | | | | | | | | | | | | | | | | | | | | | | | |
Year Ended March 31, | | | | | | | | | | | | | | | | | | | | | | | |
2006 | | $ | 10.98 | | $ | 0.09 | (2) | | $ | 1.72 | (2) | | $ | 1.81 | | | $ | (0.07 | ) | | $ | — | |
Period Ended March 31, | | | | | | | | | | | | | | | | | | | | | | | |
2005 | | | 10.84 | | | 0.02 | (2) | | | 0.12 | (2) | | | 0.14 | | | | — | | | | — | |
MID CAP VALUE AND RESTRUCTURING FUND — (06/01/96*) | | | | | | | | | | | | | | | | | |
Institutional Shares: | | | | | | | | | | | | | | | | | | | | |
Year Ended March 31, | | | | | | | | | | | | | | | | | | | | | | | |
2006 | | $ | 16.81 | | $ | 0.05 | (2) | | $ | 2.90 | (2) | | $ | 2.95 | | | $ | (0.07 | ) | | $ | — | |
2005 | | | 15.78 | | | 0.25 | (2) | | | 1.04 | (2) | | | 1.29 | | | | (0.26 | ) | | | — | |
2004 | | | 10.25 | | | 0.07 | (2) | | | 5.51 | (2) | | | 5.58 | | | | (0.05 | ) | | | — | |
2003 | | | 13.28 | | | 0.05 | (2) | | | (3.04 | )(2) | | | (2.99 | ) | | | (0.04 | ) | | | — | |
2002 | | | 11.97 | | | 0.04 | (2) | | | 1.67 | (2) | | | 1.71 | | | | (0.04 | ) | | | (0.36 | ) |
VALUE AND RESTRUCTURING FUND — (09/30/02*) | | | | | | | | | | | | | | | | | |
Institutional Shares: | | | | | | | | | | | | | | | | | | | | |
Year Ended March 31, | | | | | | | | | | | | | | | | | | | | | | | |
2006 | | $ | 41.40 | | $ | 0.63 | (2) | | $ | 7.87 | (2) | | $ | 8.50 | | | $ | (0.54 | ) | | $ | — | |
2005 | | | 37.56 | | | 0.42 | (2) | | | 3.84 | (2) | | | 4.26 | | | | (0.42 | ) | | | — | |
2004 | | | 23.65 | | | 0.32 | (2) | | | 13.89 | (2) | | | 14.21 | | | | (0.30 | ) | | | — | |
Period Ended March 31, | | | | | | | | | | | | | | | | | | | | | | | |
2003 | | | 22.92 | | | 0.22 | | | | 0.59 | | | | 0.81 | | | | (0.08 | ) | | | — | |
EMERGING MARKETS FUND — (04/01/05*) | | | | | | | | | | | | | | | | | | | | |
Institutional Shares: | | | | | | | | | | | | | | | | | | | | |
Period Ended March 31, | | | | | | | | | | | | | | | | | | | | | | | |
2006 | | $ | 8.81 | | $ | 0.13 | (2) | | $ | 3.79 | (2) | | $ | 3.92 | | | $ | (0.11 | ) | | $ | — | |
INTERNATIONAL EQUITY FUND — (01/24/95*) | | | | | | | | | | | | | | | | | |
Institutional Shares: | | | | | | | | | | | | | | | | | | | | |
Year Ended March 31, | | | | | | | | | | | | | | | | | | | | | | | |
2006 | | $ | 7.80 | | $ | 0.08 | (2) | | $ | 2.12 | (2) | | $ | 2.20 | | | $ | (0.13 | ) | | $ | — | |
2005 | | | 6.69 | | | 0.08 | (2) | | | 1.04 | (2) | | | 1.12 | | | | (0.01 | ) | | | — | |
2004 | | | 4.09 | | | 0.08 | | | | 2.59 | | | | 2.67 | | | | (0.07 | ) | | | — | |
2003 | | | 5.85 | | | 0.07 | | | | (1.77 | ) | | | (1.70 | ) | | | (0.06 | ) | | | — | |
2002 | | | 6.93 | | | 0.04 | | | | (0.86 | ) | | | (0.82 | ) | | | (0.06 | ) | | | (0.20 | ) |
| * | Commencement of Operations. |
| (1) | Expense ratios before waiver of fees and reimbursement of expenses (if any) by adviser and administrator. |
| (2) | For comparative purposes per share amounts are based on average shares outstanding. |
| (5) | Amount represents less than $1,000. |
| (6) | The information presented reflects the impact of the low level of assets at the beginning of the period and throughout the period ended March 31, 2003. Percentage amounts to less than 0.005%. |
See Notes to Financial Statements.
60
| | | | | | | | | | | | | | | | | | | | | | | | |
| | | | | | | |
Total
Distributions
| | | Net Asset
Value,
End of
Year
| | Total
Return
| | | Net Assets,
End of
Year
(000’s)
| | | Ratio of Net
Operating
Expenses
to Average
Net Assets
| | | Ratio of Gross
Operating
Expenses to
Average
Net Assets (1)
| | | Ratio of Net
Investment
Income
to Average
Net Assets
| | | Portfolio
Turnover
Rate
| |
| | | | | | | | | | | | | | | | | | | | | | | | | |
| | | | | | | | | | | | | | | | | | | | | | | | | |
| | | | | | | | | | | | | | | | | | | | | | | | | |
| $ | (0.07 | ) | | $ | 12.72 | | 16.55 | % | | $ | 54,449 | | | 0.80 | % | | 1.05 | % | | 0.78 | % | | 17 | % |
| | | | | | | | | | | | | | | | | | | | | | | | | |
| | — | | | | 10.98 | | 2.14 | %(3) | | | 53,826 | | | 0.80 | %(4) | | 1.21 | %(4) | | 0.87 | %(4) | | 13 | % |
| | | | | | | | | | | | | | | | | | | | | | | | | |
| | | | | | | |
| | | | | | | | | | | | | | | | | | | | | | | | | |
| | | | | | | | | | | | | | | | | | | | | | | | | |
| $ | (0.07 | ) | | $ | 19.69 | | 17.58 | % | | $ | 101,965 | | | 0.88 | % | | 0.88 | % | | 0.27 | % | | 23 | % |
| | (0.26 | ) | | | 16.81 | | 8.18 | % | | | 81,570 | | | 0.89 | % | | 0.99 | % | | 1.59 | % | | 28 | % |
| | (0.05 | ) | | | 15.78 | | 54.60 | % | | | 100,729 | | | 0.74 | % | | 0.98 | % | | 0.49 | % | | 13 | % |
| | (0.04 | ) | | | 10.25 | | (22.58 | )% | | | 45,017 | | | 0.76 | % | | 0.91 | % | | 0.44 | % | | 28 | % |
| | (0.40 | ) | | | 13.28 | | 14.53 | % | | | 53,900 | | | 0.80 | % | | 0.95 | % | | 0.33 | % | | 24 | % |
| | | | | | | | | | | | | | | | | | | | | | | | | |
| | | | | | | | | | | | | | | | | | | | | | | | | |
| | | | | | | | | | | | | | | | | | | | | | | | | |
| $ | (0.54 | ) | | $ | 49.36 | | 20.70 | % | | $ | 250,367 | | | 0.85 | % | | 0.85 | % | | 1.39 | % | | 12 | % |
| | (0.42 | ) | | | 41.40 | | 11.44 | % | | | 161,016 | | | 0.83 | % | | 0.84 | % | | 1.05 | % | | 8 | % |
| | (0.30 | ) | | | 37.56 | | 60.46 | % | | | 38,243 | | | 0.74 | % | | 0.89 | % | | 1.00 | % | | 4 | % |
| | | | | | | | | | | | | | | | | | | | | | | | | |
| | (0.08 | ) | | | 23.65 | | 3.54 | %(3) | | | — | (5) | | 0.00 | %(4)(6) | | 0.00 | %(4)(6) | | 1.90 | %(4) | | 16 | % |
| | | | | | | | | | | | | | | | | | | | | | | | | |
| | | | | | | | | | | | | | | | | | | | | | | | | |
| | | | | | | | | | | | | | | | | | | | | | | | | |
| $ | (0.11 | ) | | $ | 12.62 | | 46.25 | %(3) | | $ | 25,457 | | | 1.56 | %(4) | | 1.68 | %(4) | | 1.23 | %(4) | | 7 | % |
| | | | | | | | | | | | | | | | | | | | | | | | | |
| | | | | | | | | | | | | | | | | | | | | | | | | |
| | | | | | | | | | | | | | | | | | | | | | | | | |
| $ | (0.13 | ) | | $ | 9.87 | | 28.72 | % | | $ | 60,242 | | | 1.04 | % | | 1.46 | % | | 0.97 | % | | 34 | % |
| | (0.01 | ) | | | 7.80 | | 16.98 | % | | | 43,439 | | | 0.90 | % | | 1.48 | % | | 1.18 | % | | 59 | % |
| | (0.07 | ) | | | 6.69 | | 65.55 | % | | | 35,598 | | | 0.90 | % | | 1.44 | % | | 1.32 | % | | 59 | % |
| | (0.06 | ) | | | 4.09 | | (29.26 | )% | | | 29,024 | | | 0.87 | % | | 1.29 | % | | 1.07 | % | | 71 | % |
| | (0.26 | ) | | | 5.85 | | (12.16 | )% | | | 52,405 | | | 0.90 | % | | 1.38 | % | | 0.75 | % | | 52 | % |
See Notes to Financial Statements.
61
EXCELSIOR FUNDS
NOTES TO FINANCIAL STATEMENTS
1. Significant Accounting Policies:
Excelsior Funds, Inc. (“Excelsior Fund”) was incorporated under the laws of the State of Maryland on August 2, 1984. Excelsior Funds Trust (the “Trust”) is a statutory trust organized under the laws of the State of Delaware on April 27, 1994. Excelsior Fund and the Trust are registered under the Investment Company Act of 1940, as amended (the “1940 Act”), as open-ended diversified management investment companies, with the exception of Energy and Natural Resources Fund and Real Estate Fund, each of which are non-diversified.
Excelsior Fund and the Trust currently offer shares in fifteen and seven managed investment portfolios, respectively, each having its own investment objectives and policies. The following is a summary of significant accounting policies for Money Fund, Core Bond Fund (formerly Managed Income Fund), Value and Restructuring Fund and Emerging Markets Fund, portfolios of Excelsior Fund and for High Yield Fund, Income Fund, Total Return Bond Fund, Equity Core Fund, Mid Cap Value and Restructuring Fund (formerly Mid Cap Value Fund) and International Equity Fund, portfolios of the Trust (each a “Fund”, collectively the “Funds”). Such policies are in conformity with accounting principles generally accepted in the United States of America and are consistently followed by Excelsior Fund and the Trust in the preparation of their financial statements. The preparation of financial statements requires management to make estimates and assumptions that affect the reported amounts and disclosures in the financial statements. Actual results could differ from these estimates.
The Income Fund, Total Return Bond Fund and International Equity Fund offer one class of shares: Shares. The Money Fund, High Yield Fund, Equity Core Fund and Emerging Markets Fund offer two classes of shares: Institutional Shares and Shares. The Core Bond Fund, Mid Cap Value and Restructuring Fund and Value and Restructuring Fund offer three classes of shares: Institutional Shares, Shares and Retirement Shares. The Financial Highlights of the Shares and Retirement Shares as well as the financial statements for the remaining portfolios of Excelsior Fund and the Trust are presented separately.
(a) Portfolio valuation:
Investments in securities that are traded on recognized domestic and foreign stock exchanges are valued at the last sale price on the exchange on which such securities are primarily traded or at the last quoted sale price on a national securities market. Securities traded over-the-counter are valued each business day on the basis of closing over-the-counter sale prices. Equity securities that are traded on the NASDAQ National Market System for which quotations are readily available are valued at the official closing price. Securities for which there were no transactions are valued at the last quoted sales price for the most recent day such prices were available. Securities for which market quotations are not readily available are valued in good faith at fair value pursuant to procedures adopted by the Board of Directors with regard to Excelsior Fund and the Board of Trustees with regard to the Trust. The Funds have engaged a third party fair value service provider to systematically recommend the adjustment of closing market prices of securities traded principally in foreign markets.
Short-term debt instruments that mature in 60 days or less and all securities in the Money Fund are valued at amortized cost, which approximates market value. If available, debt securities are
62
priced based upon valuations provided by independent, third-party pricing agents. The third-party pricing agents value debt securities at an evaluated price by employing methodologies that utilize actual market transactions, broker-supplied valuations, or other methodologies designed to identify the market value for such securities.
Investment valuation, other assets and liabilities initially expressed in foreign currencies are converted each business day into U.S. dollars based upon current exchange rates. Purchases and sales of foreign investments and income and expenses are converted into U.S. dollars based upon currency exchange rates prevailing on the respective dates of such transactions. The Funds do not isolate that portion of gains and losses on investment securities that is due to changes in the foreign exchange rates from that which is due to changes in market prices of such securities. The Funds report gains and losses on foreign currency related transactions as realized and unrealized gains or losses for financial reporting purposes, whereas such components are treated as ordinary income or loss for federal income tax purposes.
(b) Forward foreign currency exchange contracts:
The Funds’ participation in forward currency exchange contracts will be limited to hedging involving either specific transactions or portfolio positions. Transaction hedging involves the purchase or sale of foreign currency with respect to specific receivables or payables of a Fund generally arising in connection with the purchase or sale of its portfolio securities. Risk may arise upon entering into these contracts from the potential inability of counterparties to meet the terms of their contracts and is generally limited to the amount of unrealized gain on the contracts, if any, at the date of default. Risk may also arise from unanticipated movements in the value of foreign currency relative to the U.S. dollar. Contracts are marked to market daily and the change in market value is recorded as unrealized appreciation or depreciation. Realized gains or losses arising from such transactions are included in net realized gains or losses from foreign currency transactions.
63
The International Equity Fund had the following forward foreign currency contracts outstanding as of March 31, 2006:
| | | | | | | | | | |
Settlement Dates
| | Currency to
Receive
| | In
Exchange
For
| | | Unrealized
Appreciation
(Depreciation)
| |
Foreign Currency Purchases: | | | | | | | | | | |
04/03/06 | | CHF 97,275 | | $ | 74,244 | | | $ | 393 | |
04/03/06 | | EUR 51,859 | | | 62,293 | | | | 544 | |
04/03/06 | | EUR 77,395 | | | 92,967 | | | | 811 | |
04/03/06 | | EUR 57,990 | | | 69,657 | | | | 609 | |
04/03/06 | | GBP 36,179 | | | 62,735 | | | | 116 | |
04/03/06 | | JPY 11,731,416 | | | 99,469 | | | | 220 | |
04/03/06 | | JPY 6,811,596 | | | 57,755 | | | | 128 | |
04/03/06 | | JPY 6,529,032 | | | 55,359 | | | | 122 | |
04/03/06 | | JPY 7,975,920 | | | 67,627 | | | | 149 | |
04/03/06 | | JPY 11,675,303 | | | 98,994 | | | | 219 | |
04/03/06 | | JPY 11,618,189 | | | 98,509 | | | | 218 | |
04/04/06 | | EUR 18,246 | | | 22,154 | | | | (46 | ) |
04/04/06 | | EUR 85,628 | | | 103,969 | | | | (214 | ) |
04/04/06 | | GBP 32,970 | | | 57,543 | | | | (267 | ) |
04/04/06 | | GBP 64,422 | | | 112,436 | | | | (523 | ) |
04/04/06 | | SGD 114,556 | | | 70,801 | | | | 110 | |
04/05/06 | | GBP 123,437 | | | 214,546 | | | | (109 | ) |
04/05/06 | | JPY 73,793,591 | | | 627,283 | | | | (119 | ) |
04/05/06 | | SEK (2,909,728) | | | (373,876 | ) | | | 82 | |
Currency Legend:
CHF Swiss Franc
EUR Euro
GBP British Pound
JPY Japanese Yen
SEK Swedish Krona
SGD Singapore Dollar
(c) Covered call options written:
Certain Funds (excludes Money Fund) may engage in writing covered call options. By writing a covered call option, a Fund forgoes the opportunity to profit from an increase in the market price of the underlying security above the exercise price, except insofar as the premium represents such a profit.
When a Fund writes an option, an amount equal to the net premium (the premium less the commission) received by that Fund is included in the liability section of that Fund’s statement of assets and liabilities as a deferred credit. The amount of the deferred credit will be subsequently marked to market to reflect the current value of the option written. The current value of the traded option is the last sale price or, in the absence of a sale, the last quoted sale price for the most recent day such price was available. If an option expires on the stipulated expiration date, or if the Fund
64
involved enters into a closing purchase transaction, the Fund will realize a gain (or loss if the cost of a closing purchase transaction exceeds the net premium received when the option is sold), and the deferred credit related to such option will be eliminated. If an option is exercised, the Fund involved may deliver the underlying security from its portfolio or purchase the underlying security in the open market. In either event, the proceeds of the sale will be increased by the net premium originally received, and the Fund involved will realize a gain or loss. Premiums from expired call options written by the Fund and net gains from closing purchase transactions are treated as short-term capital gains for Federal income tax purposes, and losses on closing purchase transactions are short-term capital losses.
There is no assurance that a liquid secondary market on an exchange will exist for any particular option. A covered option writer, unable to effect a closing purchase transaction, will not be able to sell the underlying security until the option expires or is delivered upon exercise. As a result, the writer in such circumstances will be subject to the risk of market decline in the underlying security during such period and to the risk that market values increase beyond the option exercise price, in each case to the extent not offset by the net premium. A Fund will write an option on a particular security only if the Adviser believes that a liquid secondary market will exist on an exchange for options of the same series, which will permit the Fund to make a closing purchase transaction in order to close out its position.
During the year ended March 31, 2006, the Value and Restructuring Fund had the following written option transactions:
| | | | | | | |
| Written Option Transactions | | Number of
Contracts
| | | Premiums
| |
Outstanding, beginning of year | | (20,000 | ) | | $ | (2,633,972 | ) |
Option written | | (32,827 | ) | | | (12,444,685 | ) |
Options expired | | — | | | | — | |
Options exercised | | 11,932 | | | | 3,090,507 | |
Options terminated in closing purchase transactions | | 36,427 | | | | 10,227,178 | |
| | |
|
| |
|
|
|
Outstanding, end of year | | (4,468 | ) | | $ | (1,760,972 | ) |
| | |
|
| |
|
|
|
(d) Security transactions and investment income:
Security transactions are recorded on a trade date basis. Realized gains and losses on investments sold are recorded on the basis of identified cost. Interest income, adjusted for amortization of premiums and, when appropriate, discounts on investments, is earned from settlement date and is recorded on the accrual basis. Dividend income is recorded on the ex-dividend date, except for certain dividends from foreign securities, which are recorded as soon as the Funds are informed of the dividend.
(e) Concentration of risks:
The Emerging Markets Fund and International Equity Fund invest primarily in securities of companies that are located in or conduct a substantial amount of their business in foreign countries, including emerging market countries. Prices of securities in foreign markets generally, and emerging markets in particular, have historically been more volatile than prices in U.S. markets. Some countries in which the Funds may invest require government approval for the
65
repatriation of investment income, capital or the proceeds of sales of securities by foreign investors. In addition, if there is deterioration in a country’s balance of payments or for other reasons, a country may impose temporary restrictions on foreign capital remittances abroad.
The High Yield Fund is subject to special risks associated with investments in high yield bonds, which involve greater risk of default or downgrade and are more volatile than investment grade securities due to actual or perceived changes in an issuer’s creditworthiness. In addition, issuers of high yield bonds may be more susceptible than other issuers to economic downturns. High yield bonds are subject to the risk that the issuer may not be able to pay interest or dividends and ultimately repay principal upon maturity. Discontinuation of these payments could adversely affect the market value of the security.
(f) Repurchase agreements:
The Funds may purchase portfolio securities from financial institutions deemed to be creditworthy by the investment adviser subject to the seller’s agreement to repurchase and the Funds’ agreement to resell such securities at mutually agreed upon prices. Securities purchased subject to such repurchase agreements are deposited with the Funds’ custodian or sub-custodian or are maintained in the Federal Reserve/Treasury book-entry system and must have, at all times, an aggregate market value not less than the repurchase price (including accrued interest).
Default or bankruptcy of the seller may, however, expose the applicable Fund to possible delay in connection with the disposition of the securities or loss to the extent that proceeds from a sale of the underlying securities were less than the repurchase price under the agreement.
(g) TBA purchase commitments:
Certain Funds may enter into “TBA” (To Be Announced) purchase commitments to purchase securities for a fixed price at a future date, typically not exceeding 45 days. TBA purchase commitments may be considered securities in themselves, and involve a risk of loss if the value of the security to be purchased declines prior to settlement date. The Funds must maintain liquid securities having a value not less than the purchase price (including accrued interest) for such purchase commitments. Unsettled TBA purchase commitments are valued at the current market value of the underlying securities, according to the procedures described under “Portfolio Valuation” above.
(h) Distributions to shareholders:
Dividends equal to all or substantially all of each Fund’s net investment income will be declared and paid as follows: for the Money Fund, Core Bond Fund, High Yield Fund, Income Fund and Total Return Bond Fund, dividends will be declared daily and paid monthly; for the Equity Core Fund, Mid Cap Value and Restructuring Fund and Value and Restructuring Fund, dividends will be declared and paid quarterly; and for the Emerging Markets Fund and International Equity Fund, dividends will be declared and paid semiannually. Net realized capital gains, unless offset by any available capital loss carryforward, are distributed at least annually. Dividends and distributions are recorded on the ex-dividend date.
66
(i) Expense allocation:
Expenses directly attributable to a Fund are charged to that Fund. Other expenses are allocated to the respective Fund based on average daily net assets. Expenses attributable to a specific class of shares, such as shareholder servicing fees, are charged directly to that class.
2. Investment Advisory Fee, Administration Fee, Shareholder Servicing Fees and Related Party Transactions:
Prior to December 16, 2005, the Funds were advised jointly by United States Trust Company of New York and U.S. Trust Company, N.A., through their respective separate identifiable divisions. Effective December 16, 2005, U.S. Trust Company, N.A.’s separately identifiable division was reorganized into a separate corporate entity named UST Advisers, Inc., a Delaware corporation that is a wholly-owned subsidiary of U.S. Trust Company, N.A. and the Funds were advised by either UST Advisers, Inc. or U.S. Trust New York Asset Management Division (“NYAMD”), the separately identifiable division of United States Trust Company of New York.
Effective March 31, 2006, United States Trust Company of New York converted to a national charter and changed its name to United States Trust Company, National Association (“USTC-NA”) and merged with U.S. Trust Company, N.A., with USTC-NA as the surviving entity.As of March 31, 2006, the Funds are advised by NYAMD, a separate identifiable division of USTC-NA, or UST Advisers, Inc. (together with NYAMD, the “Advisers”), a wholly-owned subsidiary of USTC-NA.USTC-NA is a wholly-owned subsidiary of US Trust Corporation, a registered bank holding company, which, in turn, is a wholly-owned subsidiary of The Charles Schwab Corporation. For the services provided pursuant to the Investment Advisory Agreements, each Adviser receives a fee, computed daily and paid monthly, as follows:
| | | |
Money Fund | | 0.25 | % |
Core Bond Fund | | 0.75 | % |
High Yield Fund | | 0.80 | % |
Income Fund | | 0.65 | % |
Total Return Bond Fund | | 0.65 | % |
Equity Core | | 0.75 | % |
Mid Cap Value and Restructuring Fund | | 0.65 | % |
Value and Restructuring Fund | | 0.60 | % |
Emerging Markets Fund | | 1.25 | % |
International Equity Fund | | 1.00 | % |
UST Advisers, Inc. and BISYS Fund Services Ohio, Inc. (collectively, the “Administrators”) provide administrative services to the Funds. For the services provided to the Funds, the Administrators are entitled jointly to annual fees, computed daily and paid monthly, based on the combined aggregate average daily net assets of Excelsior Fund, Excelsior Tax-Exempt Funds, Inc. (“Excelsior Tax-Exempt Fund”) and the Trust (excluding the international equity portfolios of Excelsior Fund and the Trust), all of which are affiliated investment companies, as follows: 0.200% of the first $200 million, 0.175% of the next $200 million and 0.150% over $400 million. The Administrators are entitled jointly to annual fees, computed daily and paid monthly, at the annual rate of 0.20% of the average daily net assets of the Emerging Markets Fund, International Equity Fund, International Fund and Pacific/Asia Fund. Administration fees payable by each Fund of the three investment companies are determined in
67
proportion to the relative average daily net assets of the respective Fund for the period paid. For the year ended March 31, 2006, administration fees charged to the Funds were as follows:
| | | |
| | | Administration
Fees
|
Money Fund | | $ | 2,379,752 |
Core Bond Fund | | | 374,736 |
High Yield Fund | | | 248,330 |
Income Fund | | | 159,404 |
Total Return Bond Fund | | | 222,791 |
Equity Core Fund | | | 194,157 |
Mid Cap Value and Restructuring Fund | | | 464,898 |
Value and Restructuring Fund | | | 7,980,571 |
Emerging Markets Fund | | | 1,279,319 |
International Equity Fund | | | 95,616 |
From time to time, in its sole discretion, each Adviser may undertake to waive a portion or all of the fees payable to it and may also reimburse the Funds for a portion of other expenses. For the four months ended July 31, 2005 and the eight months ended March 31, 2006, the Advisers have contractually agreed to waive investment advisory fees and to reimburse other ordinary operating expenses, to the extent necessary to keep total operating expenses from exceeding the following annual percentages of each Fund’s average daily net assets:
| | | | | | |
| | | Four Months
Ended
July 31, 2005
| | | Eight Months
Ended
March 31,
2006
| |
Money Fund-Institutional Shares | | 0.25 | % | | 0.30 | % |
Core Bond Fund-Institutional Shares* | | N/A | | | 0.65 | % |
High Yield Fund-Institutional Shares | | 0.80 | % | | 0.80 | % |
Income Fund-Institutional Shares | | 0.50 | % | | 0.65 | % |
Total Return Bond Fund-Institutional Shares | | 0.50 | % | | 0.65 | % |
Equity Core Fund-Institutional Shares | | 0.80 | % | | 0.80 | % |
Mid Cap Value and Restructuring Fund-Institutional Shares | | 0.89 | % | | 0.89 | % |
Value and Restructuring Fund-Institutional Shares | | 0.89 | % | | 0.89 | % |
Emerging Markets Fund-Institutional Shares | | 1.45 | % | | 1.60 | % |
International Equity Fund-Institutional Shares | | 0.90 | % | | 1.10 | % |
Money Fund-Shares | | 0.50 | % | | 0.55 | % |
Core Bond Fund-Shares | | 0.90 | % | | 0.90 | % |
High Yield Fund-Shares | | 1.05 | % | | 1.05 | % |
Equity Core Fund- Shares | | 1.05 | % | | 1.05 | % |
Mid Cap Value and Restructuring Fund-Shares | | 1.14 | % | | 1.14 | % |
Value and Restructuring Fund-Shares | | 1.14 | % | | 1.14 | % |
Emerging Markets Fund-Shares | | 1.70 | % | | 1.85 | % |
Core Bond Fund-Retirement Shares | | 1.40 | % | | 1.40 | % |
Mid Cap Value and Restructuring Fund-Retirement Shares | | 1.64 | % | | 1.64 | % |
Value and Restructuring Fund-Retirement Shares | | 1.64 | % | | 1.64 | % |
| * | Institutional Shares commenced operations November 29, 2005. |
68
For the year ended March 31, 2006, pursuant to the above, investment advisory fees waived by the Advisers were as follows:
| | | | |
Money Fund | | $ | (2,481,701 | ) |
Core Bond Fund | | | (987,738 | ) |
High Yield Fund | | | (399,394 | ) |
Income Fund | | | (312,768 | ) |
Total Return Bond Fund | | | (420,513 | ) |
Equity Core Fund | | | (324,216 | ) |
Mid Cap Value and Restructuring Fund | | | (11,769 | ) |
Value and Restructuring Fund | | | — | |
Emerging Markets Fund | | | (712,659 | ) |
International Equity Fund | | | (200,154 | ) |
The Funds have entered into shareholder servicing agreements with various service organizations, which include Charles Schwab & Co. Inc. (“CS & Co.”) and UST Advisers, Inc. Services included in the servicing agreements are assisting in processing purchase, exchange and redemption requests; transmitting and receiving funds in connection with customer orders to purchase, exchange or redeem shares; and providing periodic statements. Shareholder servicing fees are incurred on a Fund or class level (where applicable). In consideration for these services, each service organization receives a fee from the Funds, computed daily and paid monthly, at an annual rate up to 0.25% of the average daily net assets of the Funds’ shares held by each service organization’s customers (excluding the Institutional Shares of the Money Fund which pays a fee of up to 0.15% of the average daily net assets of it shares). The Advisers, out of their own resources, may additionally compensate certain organizations for providing these and other services.
For the year ended March 31, 2006, shareholder servicing fees paid to CS & Co. and the Advisers were as follows:
| | | |
Money Fund | | $ | 2,736,566 |
Core Bond Fund | | | 473,281 |
High Yield Fund | | | 377,405 |
Income Fund | | | 89 |
Total Return Bond Fund | | | 11,722 |
Equity Core Fund | | | 189,976 |
Mid Cap Value and Restructuring Fund | | | 516,587 |
Value and Restructuring Fund | | | 6,206,822 |
Emerging Markets Fund | | | 947,315 |
International Equity Fund | | | 167 |
BISYS Fund Services Limited Partnership (the “Distributor”) serves as the Distributor of the Funds.Shares of each Fund are sold without a sales charge on a continuous basis by the Distributor.
Certain Funds have adopted a Distribution Plan pursuant to Rule 12b-1 under the 1940 Act, under which they may compensate the Distributor monthly for its services that are intended to result in the sale of Fund Shares (in the case of High Yield Fund and Mid Cap Value and Restructuring Fund) or
69
Retirement Shares (in the case of Mid Cap Value and Restructuring Fund and Value and Restructuring Fund), in an amount not to exceed the annual rate of 0.25% or 0.50%, respectively, of the average daily net asset value of such Fund’s Shares or Retirement Shares. For the year ended March 31, 2006, fees charged for Retirement Shares of the Core Bond Fund, Mid Cap Value and Restructuring Fund and Value and Restructuring Fund were $4, $4 and $874, respectively. There were no charges for the year ended March 31, 2006 for the Fund Shares of the Mid Cap Value and Restructuring Fund.
Each Independent Director/Trustee of the Funds receives a total annual fee of $100,000 paid by the Funds and other affiliated registered investment companies managed by the Advisers. The Chairman of the Board receives an additional $30,000, the Chairman of the Audit Committee receives an additional $15,000, and the Chairman of the Nominating Committee receives an additional $5,000 for serving in those capacities. In addition, Directors and Trustees are reimbursed by Excelsior Fund and the Trust, respectively, for reasonable expenses incurred when acting in their capacity as Directors and Trustees.
3. Purchases, Sales and Maturities of Securities:
For the year ended March 31, 2006, purchases, sales and maturities of securities, excluding short-term investments and written options transactions, for the Funds aggregated:
| | | | | | |
| | | Purchases
| | Sales and
Maturities
|
Core Bond Fund | | | | | | |
U.S. Government | | $ | 234,143,975 | | $ | 174,000,688 |
Other | | | 72,340,542 | | | 48,360,840 |
High Yield Fund | | | 94,851,386 | | | 111,074,059 |
Income Fund | | | | | | |
U.S. Government | | | 40,538,517 | | | 31,999,287 |
Other | | | 6,943,673 | | | 15,625,818 |
Total Return Bond Fund | | | | | | |
U.S. Government | | | 40,519,764 | | | 52,898,957 |
Other | | | 29,976,429 | | | 22,142,513 |
Equity Core Fund | | | 82,796,115 | | | 20,207,291 |
Mid Cap Value and Restructuring Fund | | | 70,799,348 | | | 78,148,689 |
Value and Restructuring Fund | | | 1,502,162,032 | | | 628,388,980 |
Emerging Markets Fund | | | 332,627,110 | | | 41,938,488 |
International Equity Fund | | | 20,194,465 | | | 16,311,014 |
4. Federal Taxes:
It is the policy of Excelsior Fund and the Trust that each Fund qualify or continue to qualify as a regulated investment company, by complying with the requirements of the Internal Revenue Code applicable to regulated investment companies, and by distributing substantially all of its taxable earnings to its shareholders.
In order to avoid a federal excise tax, each Fund is required to distribute certain minimum amounts of net realized capital gain and net investment income for the respective twelve-month periods ending October 31 and December 31 each year.
Net realized gains of the Funds derived in certain countries are subject to certain foreign taxation.
70
Dividends and distributions are determined in accordance with federal income tax regulations and may differ from accounting principles generally accepted in the United States of America. These differences are primarily due to differing treatments for net operating losses, foreign currency transactions, passive foreign investment companies, deferral of losses on wash sales and net capital losses and net currency losses incurred after October 31 through the end of the fiscal year (“Post-October losses”). To the extent these differences are permanent, adjustments are made to the appropriate equity accounts in the period that these differences arise. Accordingly, the following reclassifications, as of March 31, 2006, were made to/from the following accounts:
| | | | | | | | | | | | |
| | | Undistributed Net Investment Income
| | | Accumulated Net Realized Gain (Loss)
| | | Pain-In-Capital
| |
Money Fund | | | — | | | | — | | | | — | |
Core Bond Fund | | $ | 156,098 | | | $ | (156,098 | ) | | | — | |
High Yield Fund | | | 184,360 | | | | 169,492 | | | $ | (353,852 | ) |
Income Fund | | | 335,597 | | | | (335,596 | ) | | | (1 | ) |
Total Return Bond Fund | | | 87,945 | | | | (87,945 | ) | | | — | |
Equity Core Fund | | | 1,620 | | | | (1,620 | ) | | | — | |
Mid Cap Value and Restructuring Fund | | | 23,676 | | | | (737 | ) | | | (22,939 | ) |
Value and Restructuring Fund | | | 212,778 | | | | (212,779 | ) | | | 1 | |
Emerging Markets Fund | | | (39,141 | ) | | | 434,956 | | | | (395,815 | ) |
International Equity Fund | | | (24,481 | ) | | | 24,394 | | | | 87 | |
The tax character of dividends and distributions declared during the years ended March 31, 2006 and March 31, 2005 were as follows:
| | | | | | | | | | | | |
| | | Ordinary Income
| | Long-Term
Capital Gain
| | Return
of Capital
| | Total
|
Money Fund | | | | | | | | | | | | |
Year ended March 31, 2006 | | $ | 49,048,464 | | | — | | | — | | $ | 49,048,464 |
Year ended March 31, 2005 | | | 19,959,001 | | | — | | | — | | | 19,959,001 |
Core Bond Fund | | | | | | | | | | | | |
Year ended March 31, 2006 | | | 11,105,896 | | $ | 2,085,376 | | | — | | | 13,191,272 |
Year ended March 31, 2005 | | | 11,633,310 | | | 1,031,057 | | | — | | | 12,664,367 |
High Yield Fund | | | | | | | | | | | | |
Year ended March 31, 2006 | | | 10,553,157 | | | — | | $ | 353,851 | | | 10,907,008 |
Year ended March 31, 2005 | | | 11,801,334 | | | — | | | — | | | 11,801,334 |
Income Fund | | | | | | | | | | | | |
Year ended March 31, 2006 | | | 4,475,855 | | | 86,709 | | | — | | | 4,562,564 |
Year ended March 31, 2005 | | | 5,222,484 | | | 276,425 | | | — | | | 5,498,909 |
Total Return Bond Fund | | | | | | | | | | | | |
Year ended March 31, 2006 | | | 6,894,515 | | | 2,195,396 | | | — | | | 9,089,911 |
Year ended March 31, 2005 | | | 7,193,606 | | | 1,617,447 | | | — | | | 8,811,053 |
Equity Core Fund | | | | | | | | | | | | |
Year ended March 31, 2006 | | | 574,501 | | | — | | | — | | | 574,501 |
Year ended March 31, 2005 | | | 69,065 | | | — | | | — | | | 69,065 |
Mid Cap Value and Restructuring Fund | | | | | | | | | | | | |
Year ended March 31, 2006 | | | 675,482 | | | — | | | 22,939 | | | 698,421 |
Year ended March 31, 2005 | | | 4,730,945 | | | — | | | — | | | 4,730,945 |
71
| | | | | | | | |
| | | Ordinary Income
| | Long-Term
Capital
Gain
| | Return
of Capital
| | Total
|
Value and Restructuring Fund | | | | | | | | |
Year ended March 31, 2006 | | 52,525,603 | | — | | — | | 52,525,603 |
Year ended March 31, 2005 | | 31,941,541 | | — | | — | | 31,941,541 |
Emerging Markets Fund | | | | | | | | |
Year ended March 31, 2006 | | 5,914,106 | | — | | — | | 5,914,106 |
Year ended March 31, 2005 | | 3,090,328 | | 5,577,055 | | — | | 8,667,383 |
International Equity Fund | | | | | | | | |
Year ended March 31, 2006 | | 738,048 | | — | | — | | 738,048 |
Year ended March 31, 2005 | | 65,782 | | — | | — | | 65,782 |
As of March 31, 2006, the components of distributable earnings (accumulated losses) on a tax basis were as follows:
| | | | | | | | | | | | | | | | | | | | | | | | | | |
| | | Undistributed Ordinary Income
| | Undistributed Long-Term Capital Gain
| | Distributions Payable
| | | Accumulated Capital and Other Losses
| | | Post-October Losses
| | | Unrealized Appreciation (Depreciation)
| | | Total Accumulated Earnings/ (Deficit)
| |
Money Fund | | $ | 5,955,217 | | | — | | $ | (5,955,217 | ) | | $ | (40,526 | ) | | | — | | | | — | | | $ | (40,526 | ) |
Core Bond Fund | | | 1,036,250 | | | — | | | (1,033,843 | ) | | | (529,099 | ) | | | — | | | $ | (4,631,212 | ) | | | (5,157,904 | ) |
High Yield Fund | | | — | | | — | | | (884,504 | ) | | | (67,220,796 | ) | | $ | (1,126,388 | ) | | | 1,348,374 | | | | (67,883,314 | ) |
Income Fund | | | 382,163 | | | — | | | (383,222 | ) | | | — | | | | (169,056 | ) | | | (1,949,442 | ) | | | (2,119,557 | ) |
Total Return Bond Fund | | | 534,832 | | | — | | | (534,001 | ) | | | — | | | | (412,791 | ) | | | (1,638,616 | ) | | | (2,050,576 | ) |
Equity Core Fund | | | 412,417 | | | — | | | — | | | | (880,333 | ) | | | (1,597,268 | ) | | | 24,280,618 | | | | 22,215,434 | |
Mid Cap Value and Restructuring Fund | | | — | | | — | | | — | | | | (1,074,502 | ) | | | (894,861 | ) | | | 125,325,684 | | | | 123,356,321 | |
Value and Restructuring Fund | | | 21,152,963 | | | — | | | — | | | | (146,597,297 | ) | | | — | | | | 2,109,206,496 | | | | 1,983,762,162 | |
Emerging Markets Fund | | | 1,061,119 | | $ | 8,501,909 | | | — | | | | (1,533,451 | ) | | | — | | | | 300,030,575 | | | | 308,060,152 | |
International Equity Fund | | | 137,273 | | | — | | | — | | | | (15,182,045 | ) | | | (9,879 | ) | | | 15,887,636 | | | | 832,985 | |
Post-October losses are deemed to arise on the first business day of a Fund’s next taxable year.
For federal income tax purposes, capital loss carryforwards may be carried forward and applied against future capital gains. To the extent that such carryforwards are utilized, capital gains distributions will be reduced. At March 31, 2006, the following Funds had capital loss carryforwards available to offset future net capital gains through the indicated expiration dates:
| | | | | | | | | | | | | | | | | | |
| | | Expires
|
| | | 2010
| | 2011
| | 2012
| | 2013
| | 2014
| | Total
|
Money Fund | | | — | | $ | 11,662 | | $ | 23,975 | | | — | | $ | 4,889 | | $ | 40,526 |
High Yield Fund | | $ | 2,181,571 | | | 17,456,849 | | | 40,103,941 | | $ | 1,461,417 | | | 6,017,018 | | | 67,220,796 |
Equity Core Fund | | | — | | | — | | | — | | | — | | | 880,333 | | | 880,333 |
Mid Cap Value and Restructuring Fund | | | — | | | 121,536 | | | — | | | — | | | 952,966 | | | 1,074,502 |
Value and Restructuring Fund | | | — | | | 119,233,763 | | | 27,363,534 | | | — | | | — | | | 146,597,297 |
Emerging Markets Fund | | | — | | | — | | | 1,496,712 | | | — | | | 36,739 | | | 1,533,451 |
International Equity Fund | | | — | | | 13,509,913 | | | 1,672,132 | | | — | | | — | | | 15,182,045 |
72
At March 31, 2006, aggregate gross unrealized appreciation for all securities and call options written for which there was an excess of value over estimated tax cost and aggregate gross unrealized depreciation for all securities for which there was an excess of estimated tax cost over value is as follows:
| | | | | | | | | | | | | | |
| | | Federal
Tax
Cost
| | Tax Basis
Unrealized
Appreciation
| | Tax Basis
Unrealized
(Depreciation)
| | | Net
Unrealized
Appreciation
(Depreciation)
| |
Core Bond Fund | | $ | 281,602,078 | | $ | 761,879 | | $ | (5,393,091 | ) | | $ | (4,631,212 | ) |
High Yield Fund | | | 145,912,590 | | | 6,262,276 | | | (4,913,902 | ) | | | 1,348,374 | |
Income Fund | | | 101,428,350 | | | 419,150 | | | (2,368,592 | ) | | | (1,949,442 | ) |
Total Return Bond Fund | | | 138,797,981 | | | 1,328,723 | | | (2,967,339 | ) | | | (1,638,616 | ) |
Equity Core Fund | | | 163,419,514 | | | 27,349,605 | | | (3,068,877 | ) | | | 24,280,728 | |
Mid Cap Value and Restructuring Fund | | | 214,051,417 | | | 130,538,656 | | | (5,212,972 | ) | | | 125,325,684 | |
Value and Restructuring Fund | | | 4,419,326,922 | | | 2,229,321,803 | | | (120,115,302 | ) | | | 2,109,206,501 | |
Emerging Markets Fund | | | 703,600,660 | | | 307,839,128 | | | (8,043,539 | ) | | | 299,795,589 | |
International Equity Fund | | | 46,218,886 | | | 16,496,667 | | | (601,524 | ) | | | 15,895,143 | |
5. Capital Transactions:
Excelsior Fund has authorized capital of 35 billion shares of Common Stock, 29.3756 billion of which is currently classified to represent interests in certain classes of shares. Authorized capital currently offered for each Fund is as follows: 4 billion shares of the Money Fund; 750 million shares of the Core Bond Fund; 1.5 billion shares of the Value and Restructuring Fund; and 500 million shares of the Emerging Markets Fund. Each share has a par value of $0.001 and represents an equal proportionate interest in the particular Fund with other shares of the same Fund, and is entitled to such dividends and distributions of taxable earnings on the assets belonging to such Fund as are declared at the discretion of Excelsior Fund’s Board of Directors.
The Trust has authorized an unlimited number of shares of beneficial interest of each class of each Fund. Each share has a par value of $0.00001 and represents an equal proportionate interest in the particular Fund with other shares of the same Fund, and is entitled to such dividends and distributions of taxable earnings on the assets belonging to such Fund as are declared at the discretion of the Trust’s Board of Trustees.
A redemption fee of 2% of the value of the shares redeemed or exchanged is imposed on shares of the Emerging Markets Fund and International Equity Fund redeemed or exchanged 30 days or less after their date of purchase. The redemption fee is intended to limit short-term trading in the Fund.
73
Capital Share Transactions
| | | | | | | | | | | | | | |
| | | Money Fund
| |
| | | Year Ended March 31,
| |
| | | 2006
| | | 2005
| |
| | | Shares
| | | Amount
| | | Shares
| | | Amount
| |
Sold: | | | | | | | | | | | | | | |
Institutional Shares | | 4,731,250,373 | | | $ | 4,731,250,373 | | | 4,191,107,467 | | | $ | 4,191,107,467 | |
Shares | | 3,427,610,450 | | | | 3,427,610,450 | | | 3,782,584,603 | | | | 3,782,584,603 | |
Issued as reinvestment of dividends: | | | | | | | | | | | | | | |
Institutional Shares | | 7,428,066 | | | | 7,428,066 | | | 2,099,572 | | | | 2,099,573 | |
Shares | | 2,259,420 | | | | 2,259,420 | | | 1,188,525 | | | | 1,188,499 | |
Redeemed: | | | | | | | | | | | | | | |
Institutional Shares | | (4,841,213,240 | ) | | | (4,841,213,240 | ) | | (4,038,109,800 | ) | | | (4,038,109,805 | ) |
Shares | | (3,502,534,923 | ) | | | (3,502,534,923 | ) | | (3,820,288,035 | ) | | | (3,820,288,036 | ) |
| | |
|
| |
|
|
| |
|
| |
|
|
|
Net Increase (Decrease) | | (175,199,854 | ) | | $ | (175,199,854 | ) | | 118,582,332 | | | $ | 118,582,301 | |
| | |
|
| |
|
|
| |
|
| |
|
|
|
| |
| | | Core Bond Fund*
| |
| | | Year Ended March 31,
| |
| | | 2006
| | | 2005
| |
| | | Shares
| | | Amount
| | | Shares
| | | Amount
| |
Sold: | | | | | | | | | | | | | | |
Institutional Shares | | 141,024 | | | $ | 1,262,505 | | | — | | | $ | — | |
Shares | | 13,774,392 | | | | 125,488,152 | | | 7,544,152 | | | | 69,875,602 | |
Retirement Shares | | — | | | | — | | | 126 | | | | 1,050 | |
Issued as reinvestment of dividends: | | | | | | | | | | | | | | |
Institutional Shares | | 189 | | | | 1,685 | | | — | | | | — | |
Shares | | 681,642 | | | | 6,160,386 | | | 331,579 | | | | 3,062,096 | |
Retirement Shares | | 5 | | | | 50 | | | — | | | | 4 | |
Redeemed: | | | | | | | | | | | | | | |
Shares | | (5,733,515 | ) | | | (52,104,922 | ) | | (4,431,412 | ) | | | (40,768,322 | ) |
Retirement Shares | | (16 | ) | | | (151 | ) | | — | | | | — | |
Redemption in-kind | | — | | | | — | | | (8,833,002 | ) | | | (81,528,608 | ) |
| | |
|
| |
|
|
| |
|
| |
|
|
|
Net Increase (Decrease) | | 8,863,721 | | | $ | 80,807,705 | | | (5,388,557 | ) | | $ | (49,358,178 | ) |
| | |
|
| |
|
|
| |
|
| |
|
|
|
74
| | | | | | | | | | | | | | |
| | | High Yield Fund
| |
| | | Year Ended March 31,
| |
| | | 2006
| | | 2005
| |
| | | Shares
| | | Amount
| | | Shares
| | | Amount
| |
Sold: | | | | | | | | | | | | | | |
Institutional Shares | | 853,862 | | | $ | 3,892,678 | | | 1,316,771 | | | $ | 6,247,385 | |
Shares | | 13,700,176 | | | | 62,544,844 | | | 21,515,855 | | | | 101,230,357 | |
Issued as reinvestment of dividends: | | | | | | | | | | | | | | |
Institutional Shares | | 107,579 | | | | 488,209 | | | 8,493 | | | | 40,222 | |
Shares | | 304,113 | | | | 1,384,476 | | | 414,836 | | | | 1,961,707 | |
Redeemed: | | | | | | | | | | | | | | |
Institutional Shares | | (1,152,309 | ) | | | (5,192,791 | ) | | (3,282,976 | ) | | | (15,687,133 | ) |
Shares | | (17,199,458 | ) | | | (78,172,561 | ) | | (20,658,816 | ) | | | (97,478,269 | ) |
| | |
|
| |
|
|
| |
|
| |
|
|
|
Net Increase (Decrease) | | (3,386,037 | ) | | $ | (15,055,145 | ) | | (685,837 | ) | | $ | (3,685,731 | ) |
| | |
|
| |
|
|
| |
|
| |
|
|
|
| |
| | | Income Fund
| |
| | | Year Ended March 31,
| |
| | | 2006
| | | 2005
| |
| | | Shares
| | | Amount
| | | Shares
| | | Amount
| |
Sold: | | | | | | | | | | | | | | |
Institutional Shares | | 1,353,083 | | | $ | 9,461,562 | | | 2,254,174 | | | $ | 15,861,795 | |
Issued as reinvestment of dividends: | | | | | | | | | | | | | | |
Institutional Shares | | 162,887 | | | | 1,134,491 | | | 182,097 | | | | 1,278,324 | |
Redeemed: | | | | | | | | | | | | | | |
Institutional Shares | | (1,880,559 | ) | | | (13,081,807 | ) | | (3,555,711 | ) | | | (25,043,037 | ) |
| | |
|
| |
|
|
| |
|
| |
|
|
|
Net Increase (Decrease) | | (364,589 | ) | | $ | (2,485,754 | ) | | (1,119,440 | ) | | $ | (7,902,918 | ) |
| | |
|
| |
|
|
| |
|
| |
|
|
|
| |
| | | Total Return Bond Fund
| |
| | | Year Ended March 31,
| |
| | | 2006
| | | 2005
| |
| | | Shares
| | | Amount
| | | Shares
| | | Amount
| |
Sold: | | | | | | | | | | | | | | |
Institutional Shares | | 1,786,323 | | | $ | 12,932,449 | | | 2,849,885 | | | $ | 21,160,938 | |
Issued as reinvestment of dividends: | | | | | | | | | | | | | | |
Institutional Shares | | 84,528 | | | | 607,253 | | | 40,672 | | | | 301,257 | |
Redeemed: | | | | | | | | | | | | | | |
Institutional Shares | | (2,639,935 | ) | | | (19,022,635 | ) | | (3,400,416 | ) | | | (25,161,221 | ) |
| | |
|
| |
|
|
| |
|
| |
|
|
|
Net Increase (Decrease) | | (769,084 | ) | | $ | (5,482,933 | ) | | (509,859 | ) | | $ | (3,699,026 | ) |
| | |
|
| |
|
|
| |
|
| |
|
|
|
75
| | | | | | | | | | | | | | |
| | | Equity Core Fund
| |
| | | Year Ended March 31,
| |
| | | 2006
| | | 2005
| |
| | | Shares
| | | Amount
| | | Shares
| | | Amount
| |
Sold: | | | | | | | | | | | | | | |
Institutional Shares | | 682,540 | | | $ | 8,048,568 | | | 4,994,257 | | | $ | 56,502,175 | |
Shares | | 7,067,834 | | | | 81,801,143 | | | 4,146,420 | | | | 43,209,200 | |
Issued as reinvestment of dividends: | | | | | | | | | | | | | | |
Institutional Shares | | 4,259 | | | | 47,760 | | | — | | | | — | |
Shares | | 5,937 | | | | 66,688 | | | 2,246 | | | | 23,331 | |
Redeemed: | | | | | | | | | | | | | | |
Institutional Shares | | (1,305,561 | ) | | | (14,932,301 | ) | | (93,928 | ) | | | (1,044,842 | ) |
Shares | | (618,831 | ) | | | (7,153,110 | ) | | (179,102 | ) | | | (1,884,818 | ) |
| | |
|
| |
|
|
| |
|
| |
|
|
|
Net Increase (Decrease) | | 5,836,178 | | | $ | 67,878,748 | | | 8,869,893 | | | $ | 96,805,046 | |
| | |
|
| |
|
|
| |
|
| |
|
|
|
| |
| | | Mid Cap Value and Restructuring Fund
| |
| | | Year Ended March 31,
| |
| | | 2006
| | | 2005
| |
| | | Shares
| | | Amount
| | | Shares
| | | Amount
| |
Sold: | | | | | | | | | | | | | | |
Institutional Shares | | 1,449,107 | | | $ | 26,024,928 | | | 1,440,444 | | | $ | 23,328,088 | |
Shares | | 2,206,027 | | | | 39,222,163 | | | 4,506,275 | | | | 71,247,527 | |
Retirement Shares | | — | | | | — | | | 68 | | | | 1,150 | |
Issued as reinvestment of dividends: | | | | | | | | | | | | | | |
Institutional Shares | | 12,203 | | | | 211,487 | | | 40,959 | | | | 681,342 | |
Shares | | 8,110 | | | | 140,000 | | | 65,005 | | | | 1,086,350 | |
Retirement Shares | | — | | | | — | | | — | | | | — | |
Redeemed: | | | | | | | | | | | | | | |
Institutional Shares | | (1,134,926 | ) | | | (20,164,758 | ) | | (1,119,376 | ) | | | (18,369,260 | ) |
Shares | | (2,927,490 | ) | | | (51,792,912 | ) | | (3,620,972 | ) | | | (58,289,434 | ) |
Retirement Shares | | (10 | ) | | | (162 | ) | | — | | | | — | |
Redemption in-kind | | — | | | | — | | | (1,892,982 | ) | | | (33,430,054 | ) |
| | |
|
| |
|
|
| |
|
| |
|
|
|
Net Increase (Decrease) | | (386,979 | ) | | $ | (6,359,254 | ) | | (580,579 | ) | | $ | (13,744,291 | ) |
| | |
|
| |
|
|
| |
|
| |
|
|
|
76
| | | | | | | | | | | | | | |
| | | Value and Restructuring Fund
| |
| | | Year Ended March 31,
| |
| | | 2006
| | | 2005
| |
| | | Shares
| | | Amount
| | | Shares
| | | Amount
| |
Sold: | | | | | | | | | | | | | | |
Institutional Shares | | 1,588,442 | | | $ | 71,855,109 | | | 3,740,751 | | | $ | 154,963,204 | |
Shares | | 42,481,646 | | | | 1,944,842,088 | | | 39,449,835 | | | | 1,550,480,361 | |
Retirement Shares | | 18,213 | | | | 867,236 | | | 103 | | | | 4,238 | |
Issued as reinvestment of dividends: | | | | | | | | | | | | | | |
Institutional Shares | | 45,241 | | | | 1,988,952 | | | 3,356 | | | | 131,791 | |
Shares | | 922,183 | | | | 40,504,847 | | | 647,698 | | | | 24,887,348 | |
Retirement Shares | | 26 | | | | 1,182 | | | — | | | | — | |
Redeemed: | | | | | | | | | | | | | | |
Institutional Shares | | (450,627 | ) | | | (20,187,467 | ) | | (873,380 | ) | | | (36,474,886 | ) |
Shares | | (25,114,636 | ) | | | (1,109,338,591 | ) | | (18,527,714 | ) | | | (724,974,993 | ) |
Retirement Shares | | (115 | ) | | | (5,554 | ) | | (75 | ) | | | (3,149 | ) |
| | |
|
| |
|
|
| |
|
| |
|
|
|
Net Increase (Decrease) | | 19,490,373 | | | $ | 930,527,802 | | | 24,440,574 | | | $ | 969,013,914 | |
| | |
|
| |
|
|
| |
|
| |
|
|
|
| | | | | | | | | | | | | | |
| | | Emerging Markets Fund
| |
| | | Year Ended March 31,
| |
| | | 2006
| | | 2005
| |
| | | Shares
| | | Amount
| | | Shares
| | | Amount
| |
Sold: | | | | | | | | | | | | | | |
Institutional Shares | | 2,017,803 | | | $ | 17,803,340 | | | 57 | | | $ | 500 | |
Shares | | 42,050,024 | | | | 456,622,978 | | | 37,020,633 | | | | 308,671,668 | |
Issued as reinvestment of dividends: | | | | | | | | | | | | | | |
Institutional Shares | | 232 | | | | 2,572 | | | — | | | | — | |
Shares | | 386,361 | | | | 3,758,608 | | | 627,999 | | | | 5,340,759 | |
Redeemed: | | | | | | | | | | | | | | |
Institutional Shares | | (1,171 | ) | | | (11,586 | ) | | — | | | | — | |
Shares | | (12,959,098 | ) | | | (132,389,483 | ) | | (15,283,468 | ) | | | (117,126,423 | ) |
Redemption fee | | — | | | | — | | | — | | | | 76,701 | |
| | |
|
| |
|
|
| |
|
| |
|
|
|
Net Increase (Decrease) | | 31,494,151 | | | $ | 345,786,429 | | | 22,365,221 | | | $ | 196,963,205 | |
| | |
|
| |
|
|
| |
|
| |
|
|
|
77
| | | | | | | | | | | | | | |
| | | International Equity Fund
| |
| | | Year Ended March 31,
| |
| | | 2006
| | | 2005
| |
| | | Shares
| | | Amount
| | | Shares
| | | Amount
| |
Sold: | | | | | | | | | | | | | | |
Institutional Shares | | 1,232,938 | | | $ | 10,856,010 | | | 1,059,280 | | | $ | 7,974,143 | |
Issued as reinvestment of dividends: | | | | | | | | | | | | | | |
Institutional Shares | | 15,369 | | | | 118,649 | | | 40 | | | | 259 | |
Redeemed: | | | | | | | | | | | | | | |
Institutional Shares | | (710,520 | ) | | | (5,920,024 | ) | | (815,524 | ) | | | (5,749,854 | ) |
Redemption fee | | — | | | | — | | | — | | | | — | |
| | |
|
| |
|
|
| |
|
| |
|
|
|
Net Increase (Decrease) | | 537,787 | | | $ | 5,054,635 | | | 243,796 | | | $ | 2,224,548 | |
| | |
|
| |
|
|
| |
|
| |
|
|
|
| * | Institutional Shares commenced operations on November 29, 2005. |
6. Guarantees:
In the normal course of business, the Funds enter into contracts that provide general indemnifications. The Funds’ maximum exposure under these arrangements is dependent on future claims that may be made against the Funds and, therefore, cannot be established; however, based on experience, the risk of loss from such claims is considered remote.
7. Legal Proceedings:
The Adviser and Excelsior Funds, Inc., Excelsior Tax-Exempt Funds, Inc., and Excelsior Funds Trust (the “Companies”) were contacted in September, 2003 by the Office of the New York State Attorney General (the “NYAG”), and the Adviser was contacted by the Securities and Exchange Commission (the “SEC”) and later by the Attorney General of the State of West Virginia, in connection with their investigations of practices in the mutual fund industry identified as “market timing” and “late trading” of mutual fund shares (the “Investigations”). The Adviser and the Companies have provided full cooperation with respect to these Investigations and continue to review the facts and circumstances relevant to the Investigations. As disclosed previously by the Adviser and its affiliates, with respect to the Adviser, these investigations have been focusing on circumstances in which a small number of parties were permitted to engage in short-term trading of shares of certain of the Excelsior Funds. The short-term trading activities permitted under these arrangements have been terminated and the Adviser has strengthened its policies and procedures to deter frequent trading of shares of the Excelsior Funds.
The Adviser, certain of its affiliates, the Companies and others have also been named in several class action and derivative lawsuits which allege that the Adviser, certain of its affiliates, the Companies and others allowed certain parties to engage in illegal and improper mutual fund trading practices, which allegedly caused financial injury to the shareholders of certain of the Excelsior Funds managed by the Adviser. Each seeks unspecified monetary damages and related equitable relief.
The class and derivative actions described above have been transferred to the United States District Court for the District of Maryland for coordinated and consolidated pre-trial proceedings. In November
78
2005, the Maryland court dismissed many of the plaintiffs’ claims in both the investor class action and the derivative lawsuits suits. Plaintiffs’ claims under Sections 10(b) and 20(a) of the Securities Exchange Act and under Section 36(b) and 48(a) of the Investment Company Act, however, have not been dismissed. Discovery has commenced with respect to plaintiffs’ remaining claims.
While the ultimate outcome of these matters cannot be predicted with any certainty at this time, based on currently available information and consultation with counsel, the Adviser believes that the resolution of the pending Investigations and private lawsuits will not have a material adverse financial impact on the Companies, and further believes that the pending Investigations and private lawsuits are not likely to materially affect the Adviser’s ability to provide investment management services to the Companies.
8. Other Federal Tax Information (Unaudited):
For corporate shareholders, the following percentage of the total ordinary income distributions paid during the fiscal year ended March 31, 2006, qualify for the corporate dividends received deduction for the following Funds:
| | | |
Fund
| | Percentage
| |
Equity Core Fund | | 100.00 | % |
Mid Cap Value and Restructuring Fund | | 96.25 | % |
Value and Restructuring Fund | | 100.00 | % |
For the year ended March 31, 2006, the following Funds paid qualified dividend income for purposes of reduced individual federal income tax rates of:
| | | |
Fund
| | Percentage
| |
Equity Core Fund | | 100.00 | % |
Mid Cap Value and Restructuring Fund | | 96.20 | % |
Value and Restructuring Fund | | 100.00 | % |
Emerging Markets Fund | | 100.00 | % |
International Equity Fund | | 100.00 | % |
79
REPORT OF INDEPENDENT REGISTERED PUBLIC ACCOUNTING FIRM
To the Board of Trustees and Shareholders of
Excelsior Funds Trust and Excelsior Funds, Inc.
We have audited the accompanying statements of assets and liabilities, including the portfolios of investments, of the Money Fund, Value and Restructuring Fund, Mid Cap Value and Restructuring Fund (formerly, Mid Cap Value Fund), Income Fund, Total Return Bond Fund, International Equity Fund, Equity Core Fund, Core Bond Fund (formerly, Managed Income Fund), Emerging Markets Fund and High Yield Fund (six of the portfolios constituting the Excelsior Funds Trust and three of the portfolios constituting the Excelsior Funds, Inc.) (collectively, the “Funds”) as of March 31, 2006, and the related statements of operations for the year then ended, the statement of changes in net assets for each of the two years in the period then ended, and the financial highlights (Institutional) for each of the three years in the period then ended. These financial statements and financial highlights are the responsibility of the Funds’ management. Our responsibility is to express an opinion on these financial statements and financial highlights based on our audits. The financial highlights for each of the years in the two year period ended March 31, 2003 were audited by other auditors whose reports dated May 16, 2003, expressed an unqualified opinion on those financial highlights.
We conducted our audits in accordance with the standards of the Public Company Accounting Oversight Board (United States). Those standards require that we plan and perform the audit to obtain reasonable assurance about whether the financial statements and financial highlights are free of material misstatement. The Funds are not required to have, nor were we engaged to perform, an audit of their internal control over financial reporting. Our audits included consideration of internal control over financial reporting as a basis for designing audit procedures that are appropriate in the circumstances, but not for the purpose of expressing an opinion on the effectiveness of the Funds’ internal control over financial reporting. Accordingly, we express no such opinion. An audit also includes examining, on a test basis, evidence supporting the amounts and disclosures in the financial statements, assessing the accounting principles used and significant estimates made by management, as well as evaluating the overall financial statement presentation. Our procedures included confirmation of securities owned as of March 31, 2006, by correspondence with the custodian and brokers; where replies were not received from brokers, we performed other auditing procedures. We believe that our audits provide a reasonable basis for our opinion.
In our opinion, the financial statements and financial highlights referred to above present fairly, in all material respects, the financial position of Money Fund, Value and Restructuring Fund, Mid Cap Value and Restructuring Fund, Income Fund, Total Return Bond Fund, International Equity Fund, Equity Core Fund, Core Bond Fund, Emerging Markets Fund and High Yield Fund as of March 31, 2006, the results of their operations for the year then ended, the changes in their net assets for each of the two years in the period then ended, and the financial highlights for each of the three years in the period then ended, in conformity with accounting principles generally accepted in the United States of America.
DELOITTE & TOUCHE LLP
New York, New York
May 22, 2006
80
Directors/Trustees and Officers of the Excelsior Funds Complex (Unaudited)
Information pertaining to the Directors/Trustees and Officers of Excelsior Fund, Excelsior Tax-Exempt Fund and Excelsior Funds Trust (each a “Company” and collectively, the “Excelsior Funds Complex”) is set forth below. Directors/Trustees who are not deemed to be “interested persons” of the Excelsior Funds Complex as defined in the 1940 Act are referred to as “Independent Board Members.” Directors/Trustees who are deemed to be “interested persons” of the Excelsior Funds Complex are referred to as “Interested Board Members”. The following information is as of May 20, 2006.
On February 24, 2006, the Boards of Directors/Trustees (the “Boards”) of the Companies approved an increase in the size of the Boards to ten (10) directors/trustees (together, the “Directors”) and approved the nomination of Mariann Byerwalter, Nils Hakansson, William A. Hasler and Randall W. Merk (the “Candidates”) as Directors of the Companies, subject to shareholder approval at an upcoming Special Meeting of Shareholders of the Companies (the “Meeting”). Each of the Candidates is currently a director/trustee of the Laudus Funds, the Laudus Variable Insurance Trust (together, the “Laudus Funds”) and of other funds included in the Schwab mutual fund complex for which Charles Schwab Investment Management acts as investment adviser (together, the “Fund Complex”). The Companies are in the same Fund Complex as the Laudus Funds. If approved by Shareholders at the Meeting, Ms. Byerwalter and Messrs. Hakansson and Hasler would become disinterested persons of the Companies under the Investment Company Act of 1940, as amended. Mr. Merk would become an interested person of the Companies.
The Boards also approved the nominations of six existing Directors to be submitted to shareholders for approval at the Meeting: Messrs. Bailey, Collins, Drake, Hall, Lynch and Piel (the “Existing Directors” and, together with the Candidates, the “Nominees”). Frederick S. Wonham, a current Director of the Companies and Chairman of the Board of each Company, has notified the Boards that he intends to resign from the Boards, consistent with the Companies’ retirement age policy, effective as of the date of the Meeting. The Boards have elected Rodman Drake, currently a Director of the Companies and Chairman of their Joint Audit Committee, as the Chairman of the Boards of the Companies effective upon Mr. Wonham’s resignation.
The Boards have proposed to increase the size of each Board from seven to ten so that a single group of Directors (i.e., a unitary board) can oversee each of the Companies and the Laudus Funds. At a meeting held on March 16, 2006, the Laudus Funds’ Boards approved the nominations of the Existing Directors for election to the Laudus Funds’ Boards, subject to approval by shareholders of each of the Laudus Funds. Each of the Candidates has notified the Boards that, even if approved by the Companies’ shareholders at the Meeting, the Candidates will not serve as members of the Boards unless the shareholders of each of the Companies and the Laudus Funds approve the election of each of the other Nominees. Similarly, each of the existing Directors has informed the Laudus Funds Boards that, even if approved by shareholders of the Laudus Funds at their shareholders meeting, the Existing Directors will not serve as members of the Laudus Funds Boards unless the shareholders of each of the Companies and the Laudus Funds approve the election of each of the other Nominees.
81
| | | | | | |
Name and Address(1) Age Time Served with the Excelsior Funds Complex
| | Principal Occupation
During the Past Five Years
| | Number of
Portfolios in Fund
Complex Overseen by Director/
Trustee(3)
| | Other Directorships Held by Director/Trustee(4)
|
DIRECTORS/TRUSTEES(2) INDEPENDENT BOARD MEMBERS | | | | |
Frederick S. Wonham
Age: 75
Since 1997 | | Retired. Chairman of the Boards and Director (since 1997) and President and Treasurer (from 1995 to February 2002) of Excelsior Funds, Inc. and Excelsior Tax-Exempt Funds, Inc.; Chairman of the Board and Trustee (since 1997) and President and Treasurer (from 1995 to February 2002) of Excelsior Funds Trust. | | 29 | | None. |
| | | |
Rodman L. Drake
Age: 63
Since 1994 | | Director and Chairman of Audit Committee of Excelsior Funds, Inc. and Excelsior Tax-Exempt Funds, Inc. (since 1996); Trustee of Excelsior Funds Trust (since 1994); Co-Founder of Baringo Capital LLC (since 2002); President, Continuation Investments Group, Inc. (from 1997 to 2001). | | 29 | | Director and Chairman, Hyperion Total Return Fund, Inc., and Hyperion Strategic Mortgage Fund Inc. (since 1991); Director, Jackson Hewitt Tax Services, Inc. (since June 2004); Director, Student Loan Corporation (since May 2005). |
| | | |
Morrill Melton ("Mel") Hall, Jr.
Age: 61
Since 2000 | | Director of Excelsior Funds, Inc. and Excelsior Tax-Exempt Funds, Inc. (since 2000); Trustee of Excelsior Funds Trust (since 2000); Chairman (since 1984) and Chief Executive Officer (since 1991), Comprehensive Health Services, Inc. (health care management and administration). | | 29 | | None. |
| | | |
Roger M. Lynch
Age: 64
Since 2001 | | Retired. Director of Excelsior Funds, Inc. and Excelsior Tax- Exempt Funds, Inc. and Trustee of Excelsior Funds Trust (since 2001); President, Corporate Asset Funding Co., Inc. (asset securitization) (from 1987 to 1999); Limited Partner (from 1986 to 1999), Goldman Sachs & Co. | | 29 | | None. |
| | | |
Jonathan Piel
Age: 67
Since 1994 | | Director and Chairman of Nominating Committee, Excelsior Funds, Inc. and Excelsior Tax-Exempt Funds, Inc. (since 1996); Trustee, Excelsior Funds Trust (since 1994); Cable Television producer and website designer. The Editor Scientific American (from 1984 to 1986), and Vice President, Scientific American, Inc. (from 1986 to 1994); Director, National Institute of Social Sciences; member, Advisory Board. The Stone Age Institute, Bloomington Indiana. | | 29 | | None. |
82
| | | | | | |
Name and Address(1) Age Time Served with the Excelsior Funds Complex
| | Principal Occupation
During the Past Five Years
| | Number of
Portfolios in Fund
Complex Overseen by Director/
Trustee(3)
| | Other Directorships Held by Director/Trustee(4)
|
John. D. Collins
Age: 67
Since 2005 | | Retired. Director, Excelsior Funds, Inc. and Excelsior Tax-Exempt Funds, Inc. (since 2005); Trustee, Excelsior Funds Trust (since 2005). Consultant, KPMG, LLP (from July 1999 to June 2000); Partner, KPMG, LLP (from March 1962 to June 1999). | | 29 | | Director, Mrs. Fields’ Famous Brands LLC (consumer products) (since December 2004). |
| INTERESTED BOARD MEMBER(5) | | | | |
James L. Bailey
114 West 47th Street
New York, NY 10036
Age: 60
Since 2004 | | Chief Operating Officer of U.S. Trust Corporation (since December 2004) and Executive Vice President of U.S. Trust Corporation and United States Trust Company of New York (since 2003); President, Excelsior Funds, Inc., Excelsior Tax-Exempt Funds, Inc. and Excelsior Funds Trust (from 2003 to July 2004); Consultant in the financial services industry (from August 2000 to January 2003); Executive Vice President of Citicorp (from 1992 to August 2000). | | 29 | | None. |
| OFFICERS | | | | | | |
Joseph Trainor, CFA
Age: 44
114 West 47th Street
New York, NY 10036 | | Managing Director of United States Trust Company of New York (since 2003) and President, U.S. Trust Institutional; President of MFS Institutional Advisors (from 1998 to 2002). | | N/A | | N/A |
| | | |
George Pereira
Age: 42
101 Montgomery St.
San Francisco, CA 94104 | | Senior Vice President and Chief Financial Officer, Charles Schwab Investment Management, Inc.; Director, Charles Schwab Asset Management (Ireland) Limited. From December 1999 to November 2004, Sr. Vice President, Financial Reporting. Charles Schwab & Co., Inc. From September 1999 to December 1999, Chief Financial Officer, Commerzbank Capital Markets. Prior to September 1999, Managing Director at the New York Stock Exchange. | | N/A | | N/A |
83
| | | | | | |
Name and Address(1) Age Time Served with the Excelsior Funds Complex
| | Principal Occupation
During the Past Five Years
| | Number of
Portfolios in Fund
Complex Overseen by Director/
Trustee(3)
| | Other Directorships Held by Director/Trustee(4)
|
Stefanie A. Firtell
Age: 32
114 West 47th Street
New York, NY 10036 | | Vice President, United States Trust Company of New York (since April 2005); Compliance Officer and Head of Regulatory Responses, Assistant Vice President, Deutsche Asset Management (from 2003 to 2005); Assistant Corporate Secretary, Triare Companies, Inc. (from 2002 to 2003); Attorney, Paul, Weiss, Rifkind, Wharton & Garrison (from 2001 to 2002); and Attorney, Cadwalder Wickersham & Taft (from 2000 to 2001). | | N/A | | N/A |
| | | |
Wyndham Clark
Age: 47
225 High Ridge Road
Stamford, CT 06905 | | Vice President and AML Officer, U.S. Trust Company, N.A. (since 2003); Vice President and Deputy Director Risk Management, IBJ Whitchall (banking) (from 2001 to 2002); and Vice President and Chief Risk Officer, EMAC, LLC (commercial leader, asset backed security issuer) (from 1999 to 2001). | | N/A | | N/A |
| | | |
Petros (Peter) L. Tsirigotis
Age: 37
114 West 47th Street
New York, NY 10036 | | Senior Vice President and Assistant General Counsel, U.S. Trust (since September 2005); Vice President and Corporate Counsel, Prudential Financial (September 2004 to September 2005); Associate, Schulte Roth and Zabel LLP (November 2002 to September 2004) and Dechert LLP (August 2000 to November 2002). Prior to August 2000, Mr. Tsirigotis was an Attorney/Advisor (Division of Investment Management) and Financial Economist (Office of Economic Analysis) with the Securities and Exchange Commission in Washington, D.C. | | N/A | | N/A |
| (1) | Each independent director/trustee may be contacted by writing to Excelsior Funds, 225 High Ridge Road, Stamford, CT 06905. |
| (2) | Each director/trustee shall hold office until the election and qualification of his or her successor, or until he or she sooner dies, resigns or is removed. The officers of each Company shall hold office for a one year term and until their respective successors are chosen and qualified, or in each case until he or she sooner dies, resigns, is removed, or becomes disqualified in accordance with each Company’s by-laws. |
| (3) | The Excelsior Funds Complex consists of all registered investment companies (Excelsior Funds Inc., Excelsior Tax-Exempt Funds, Inc. and Excelsior Funds Trust) for which U.S. Trust serves as investment adviser. As of May 20, 2006, the Excelsior Funds Complex consisted of 29 Funds. |
| (4) | Directorships of companies required to report to the Securities and Exchange Commission under the Securities Exchange Act of 1934 (i.e., “public companies”) or other investment companies registered under the 1940 Act. |
| (5) | “Interested person” of the Company is defined in the 1940 Act. Mr. Bailey is considered an “interested person” because of his affiliation with the Adviser. |
For more information regarding the Directors/Trustees and Officers, please refer to the Statement of Additional Information, which is available upon request by calling 1-800-446-1012.
84
DISCLOSURE OF FUND EXPENSES (Unaudited)
We believe it is important for you to understand the impact of fees regarding your investment. As a shareholder of the fund, you incur ongoing, or operating costs, which include costs for portfolio management, administrative services, and shareholder reports (like this one), among others. Operating expenses, which are deducted from a fund’s gross income, directly reduce the investment return of the fund. A fund’s expenses are expressed as a percentage of its average net assets. This figure is known as the expense ratio. The following examples are intended to help you understand the ongoing costs (in dollars) of investing in your fund and to compare these costs with those of other mutual funds. The examples are based on an investment of $1,000 made at the beginning of the period shown and held for the entire period.
The table on the following page illustrates your fund’s costs in two ways.
| | · | Actual expenses. This section provides information about actual account values and actual expenses based on the Funds’ actual return for the period. This section is designed to help you to estimate the actual expenses after fee waivers that you paid over the period. The “Ending Account Value” shown is derived from the fund’s actual return, and the fourth column shows the dollar amount that would have been paid by an investor who started with $1,000 in the fund. You may use the information here, together with the amount you invested, to estimate the expenses that you paid over the period. |
To do so, simply divide your account value by $1,000 (for example, an $8,600 account value divided by $1,000=$8.6), then multiply the result by the number given for your fund under the heading “Expenses Paid During Period”.
| | · | Hypothetical expenses. This section provides information about hypothetical account values and hypothetical expenses that would have been incurred by an investor in the Fund based on an assumed rate of return of 5% per year before expenses. This section is designed to help you compare your fund’s costs with those of other mutual funds. It assumes that the fund had a return of 5% before expenses during the year, but that the expense ratio is unchanged. In this case, because the return used is not the fund’s actual return, the results cannot be used to estimate the actual ending account balance or expenses you paid for the period. You may use this information to compare the ongoing costs of investing in your Fund and other funds. To do so, compare this 5% hypothetical example with the 5% hypothetical examples that appear in shareholder reports of other funds. |
85
DISCLOSURE OF FUND EXPENSES (Unaudited) (Continued)
Please note that the expenses shown in the table are meant to highlight and help you compare ongoing costs only, which are described in the Prospectus. Therefore, the hypothetical example is useful in comparing ongoing costs only, and will not help you determine the relative total costs of owning different funds.
| | | | | | | | | | | | |
| | | Beginning
Account
Value
10/01/2005
| | Ending
Account
Value
03/31/2006
| | Annualized
Expense
Ratios*
| | | Expenses
Paid
During
Period**
|
Actual Fund Return | | | | | | | | | | | | |
Money Fund — Institutional Shares | | $ | 1,000.00 | | $ | 1,020.00 | | 0.30 | % | | $ | 1.51 |
Core Bond Fund — Institutional Shares*** | | | 1,000.00 | | | 1,002.00 | | 0.66 | | | | 2.21 |
High Yield Fund — Institutional Shares | | | 1,000.00 | | | 1,033.50 | | 0.80 | | | | 4.06 |
Income Fund — Institutional Shares | | | 1,000.00 | | | 999.90 | | 0.65 | | | | 3.24 |
Total Return Bond Fund — Institutional Shares | | | 1,000.00 | | | 996.00 | | 0.65 | | | | 3.23 |
Equity Core Fund — Institutional Shares | | | 1,000.00 | | | 1,109.50 | | 0.80 | | | | 4.21 |
Mid Cap Value and Restructuring Fund — Institutional Shares | | | 1,000.00 | | | 1,105.20 | | 0.87 | | | | 4.57 |
Value and Restructuring Fund — Institutional Shares | | | 1,000.00 | | | 1,075.40 | | 0.84 | | | | 4.35 |
Emerging Markets Fund — Institutional Shares | | | 1,000.00 | | | 1,212.60 | | 1.60 | | | | 8.83 |
International Equity Fund — Institutional Shares | | | 1,000.00 | | | 1,149.00 | | 1.10 | | | | 5.89 |
| | | | |
Hypothetical 5% Return | | | | | | | | | | | | |
Money Fund-Institutional Shares | | | 1,000.00 | | | 1,023.44 | | 0.30 | | | | 1.51 |
Core Bond Fund — Institutional Shares**** | | | 1,000.00 | | | 1,021.64 | | 0.66 | | | | 2.23 |
High Yield Fund — Institutional Shares | | | 1,000.00 | | | 1,020.94 | | 0.80 | | | | 4.03 |
Income Fund — Institutional Shares | | | 1,000.00 | | | 1,021.69 | | 0.65 | | | | 3.28 |
Total Return Bond Fund — Institutional Shares | | | 1,000.00 | | | 1,021.69 | | 0.65 | | | | 3.28 |
Equity Core Fund — Institutional Shares | | | 1,000.00 | | | 1,020.94 | | 0.80 | | | | 4.03 |
Mid Cap Value and Restructuring Fund — Institutional Shares | | | 1,000.00 | | | 1,020.59 | | 0.87 | | | | 4.38 |
Value and Restructuring Fund — Institutional Shares | | | 1,000.00 | | | 1,020.74 | | 0.84 | | | | 4.23 |
Emerging Markets Fund — Institutional Shares | | | 1,000.00 | | | 1,016.95 | | 1.60 | | | | 8.05 |
International Equity Fund — Institutional Shares | | | 1,000.00 | | | 1,019.45 | | 1.10 | | | | 5.54 |
| * | Annualized expense ratios of certain funds are after fee waivers and expense reimbursements by the investment adviser. Absent such waivers and reimbursements, expenses paid during the period would have been greater. |
| ** | Expenses are equal to the Fund’s annualized expense ratio multiplied by the average account value over the period, multiplied by the number of days in the most recent fiscal half-year (182) then divided by 365. |
| *** | Information shown reflects values for the period from November 29, 2005 (date of commencement of operations) to March 31, 2006 and has been calculated using expense ratios and rates of return for the same time period. |
| **** | Information shown reflects values using the expense ratios for the period from November 29, 2005 (date of commencement of operations) to March 31, 2006 and has been annualized to reflect values for the period from September 30, 2005 to March 31, 2006 |
86
AR-INST-0306

RETIREMENT SHARES
CORE BOND FUND
EQUITY INCOME FUND
LARGE CAP GROWTH FUND
MID CAP VALUEAND RESTRUCTURING FUND
SMALL CAP FUND
VALUEAND RESTRUCTURING FUND
ANNUAL REPORT
March 31, 2006
TABLE OF CONTENTS
This report must be preceded or accompanied by a current prospectus.
A description of the policies and procedures that Excelsior Funds use to determine how to vote proxies relating to portfolio securities, as well as information relating to how a Fund voted proxies relating to portfolio securities during the most recent 12-month period ended June 30, is available (i) without charge, upon request, by calling (800) 881-9358, and (ii) on the Commission’s website at http://www.sec.gov.
Excelsior Funds file their June 30 and December 31 schedule of portfolio holdings with the Securities and Exchange Commission, on Form N-Q, within sixty days after the applicable reporting period. Excelsior Funds Form N-Q is available on the Commission’s website at http://www.sec.gov, and may be reviewed and copied at the Commission’s Public Reference Room in Washington, DC. Information on the operation of the Public Reference Room may be obtained by calling 1-800-SEC-0330.
You should consider the Funds’ investment objectives, risks and expenses carefully before you invest. Information about these and other important subjects is in the Funds’ prospectus, which you should read carefully before investing.
Excelsior Funds Trust and Excelsior Funds, Inc. are distributed by BISYS Fund Services Limited Partnership.
A schedule of each Fund’s portfolio holdings, as of the end of the prior month, is also available on the Funds’ website. This schedule is updated monthly, typically by the 15th calendar day, after the end of each month. The Funds may terminate or modify this policy at anytime.
SHARES OF THE FUNDS ARE NOT DEPOSITS OR OBLIGATIONS OF, OR GUARANTEED OR ENDORSED BY, ANY BANK, AND THE SHARES ARE NOT FEDERALLY INSURED BY THE FEDERAL DEPOSIT INSURANCE CORPORATION, BANK INSURANCE FUND, FEDERAL RESERVE BOARD, OR ANY OTHER GOVERNMENTAL AGENCY. AN INVESTMENT IN A FUND IS SUBJECT TO RISK OF PRINCIPAL.
LETTER TO SHAREHOLDERS
March 31, 2006
Dear Valued Excelsior Fund Shareholder,
I am pleased to bring you the annual report for the year ended March 31, 2006 for the Excelsior Funds. The funds in this report are part of the Excelsior Fund family which had over $18 billion in assets as of the end of the report period and includes a wide array of asset classes and investment strategies designed to meet the individual investor’s needs for performance and tax sensitivity.
By now, you would have received information about changes to the administrative and non-advisory services provided to the Excelsior Funds. As a result, the Excelsior Funds and the Laudus Funds, an affiliated fund family, now share certain complex-wide administrative, compliance, marketing and other functions.
We are pleased with the transition, and remain optimistic that shareholders will approve the board of directors’ recommendation to elect members to jointly oversee the two fund families. It is anticipated that the new unified board will strengthen the oversight provided on behalf of fund shareholders and may result in certain long-term cost and operating efficiencies. All votes are important, so I encourage you to vote your shares as soon as possible if you haven’t already done so.
Given these changes, I want to assure you that the most important aspects of the Excelsior Funds will remain the same. Specifically, the fund management and investment process provided by U.S. Trust, as advisor to the Funds, as well as the funds’ emphasis on enduring performance, will not change.
In closing, we at Excelsior Funds remain committed to helping you reach your long-term investment goals. Thank you for investing with us.
Sincerely,

Evelyn Dilsaver
President
1
We had expected that the financial markets would come into alignment with the financial environment being shaped by the Fed, and that finally came to pass as the fiscal year ending March 31, 2006 drew to a close. The markets improved as uncertainties about the Fed’s intentions, energy costs and Iraq were resolved to a degree—though the latter name was replaced by Iran as a geopolitical issue. Importantly, inflation is contained while growth has moderated to what we believe to be sustainable levels. We think the Fed’s economic shock effect has been temperate on growth overall. While GDP dipped in the fourth quarter of 2005, in response to hurricane after effects, it recovered to a 4.8% rate for the first quarter of 2006. Meanwhile, corporate profits, as reported for the first quarter, were strong indeed. Our confidence that a self-reinforcing expansion is underway continues firm.
Major equity indexes and averages posted new multi-year highs as the fiscal year came to an end. The financial markets reacted well to the Fed’s fifteenth sequential rate increase, to a federal funds rate target of 4.75%. Investors saw moderate economic growth ahead, with the potential for earnings growth, all within a context of well-contained inflation. Stocks, as measured by the Standard & Poor’s 500 Index, began to rally in the middle of the 2005 fourth-quarter, and that rally continued into the first quarter of 2006, making new five-year highs.
We think many of the equity investment themes that worked over the fiscal year should continue to prove successful. Overall, our themes are: (1) pricing power, (2) globalization, (3) secular reflation, (4) M&A, and (5) business versus the domestic consumer. In equities, we favor large-cap stocks over small caps, since small caps have had a long run that we believe is nearing an end. Our preference is for growth over value, when it comes to investment style--since we expect investors will target stable earnings growth, along with companies able to raise dividends and/or buyback shares. In sectors, we see housing slowing, and we continue to think the old economy, meaning industrials and commodity raw materials, especially metals, should outpace consumer sectors. We strongly favor global equities, and particularly those of emerging market nations aiming at developed world status, including China, India and Mexico, along with Russia and Australia as important sources of raw materials.
The Treasury yield curve inverted in the final months of 2005 and into January of 2006, with short-term rates higher than long-term interest rates. Recession fears were sparked, but were countered by no less than new Fed chairman, Ben Bernanke, who emphasized that yield curve inversion, rather than sending a signal of incipient recession, was, instead, a reflection of the global savings glut. We too believe that the yield-curve indicator will fail to reflect a downturn this time, and we are looking for GDP growth of at least 2.5% for full-year 2006. Nevertheless, the beginning of a slower U.S. consumer spending growth trend seems to be in place, and normally, the direct and indirect effects of a percentage point drop in real consumption growth would translate into an almost equal-size drop in GDP growth. But we don’t expect that because business and government spending is accelerating, and the global economy is picking up steam even as U.S. consumers moderate their spending habits.
2
| | FIXED INCOME MARKET REVIEW |
The fixed income markets experienced three key trends over the course of the fiscal year ending March 31, 2006. Dominating the market was the Federal Reserve’s continuous monetary tightening, which culminated in its fifteenth federal funds target rate hike, to 4.75%, as the reporting period ended. The result was a shift to higher bond yields across the maturity spectrum.
The second critical aspect of the fixed-income market was the continued flattening of the yield curve, as we expected. The yield curve inverted, with shorter rates higher than longer rates, for a period from the end of 2005 into early 2006. An inverted curve has signaled future recessions in the past, but our thinking concurs with the Fed’s, which identifies a global liquidity surplus as the cause of the inversion. The last critical factor for the markets was limited to municipal bonds, with the first quarter of 2006 experiencing a drop in issuance as higher rates cut off refunding issues. Tighter muni supply is expected to continue over the new fiscal year.
Agency bonds modestly outperformed Treasuries for the past 12 months. Demand was strong from domestic investors who sought a high-quality reserve against future opportunities in other sectors. Foreign buying was very heavy. Inflation indexed bonds (TIPS) signaled an increase in inflation expectations as breakeven yields for 5-year and 10-year issues rose over the reporting period, in particular with short maturity issues. Commercial mortgage backed securities modestly outperformed due to healthy demand as investors moved some funds out of the corporate sector into this sector. Interest rate volatility, a key determinant of value in the mortgage-backed securities market, has continued to decline favoring the prospects for out-performance in this sector. Municipals outperformed Treasuries, as yields on the latter rose more on both an actual and a relative basis. This was caused by a well documented increase in demand on the part of non-traditional municipal investors, in addition to a reduction in new-issue supply. The result was much richer municipal/Treasury yield ratios. This has been especially true for maturities of 10+ years, although all comparative municipal/Treasury bond yield ratios fell to 5-year lows in the quarter.
The 10-year Treasury yield is nearing the high end of the expected range for 2006. Yields should begin to decline later in the year driven by an expected slowdown in economic activity, specifically with respect to housing and the consumer. The Fed’s new Chairman, Ben Bernanke, has stated that going forward, Fed policy will be more data dependent, which could see more tightening than expected, but we believe the Fed is aware of the potential for excessive tightening. Opportunity to profit from the yield curve returning to its more traditional steeper shape is now evident. From a duration standpoint, we are positioned slightly shorter to fixed-income benchmarks, looking for an easing to economic growth rates. We will look to position portfolios longer relative to the benchmarks after the Fed concludes its rate increases. We think a significant yield advantage exists in select mortgage-backed and asset-backed investments and continues to dictate an overweight position in the sector.
3
EXCELSIOR FUNDS, INC. | CORE BOND FUND |
Fiscal Year Annual Review
The Fed’s FOMC increased the target short-term federal funds rate progressively over the past twelve months, culminating in the 15th rate hike since June 2004, to 4.75%. Treasury yields rose from the 3-month T-Bill to the 30-year bond, and the yield curve flattened and then inverted for more than a month. The Fed has said that further hikes under new Chairman Ben Bernanke will be data-dependent, signaling an end to tightening unless inflation numbers gap higher.
Performance Attribution
The Excelsior Core Bond Fund generated strong relative performance that was largely the result of the portfolio’s barbell position and shorter duration, which benefited as yields rose and the Treasury yield curve flattened. The Fund’s defensive posture to rising rates was additive to returns as yields rose. While our moderate underweight allocation in corporate bonds was a slight detractor from returns, our selective holdings in high yield debt aided relative performance. Allocations to asset-backed and commercial mortgage backed securities helped performance as well. Furthermore, the allocation to municipal bonds added value as the current refinancing supply has been light and demand has increased due to higher yields. Our average quality rating remains at AAA. The allocation to BBB rated securities remains minimal, with the portfolio emphasizing higher quality issues. There were no major changes to our sector allocations although some credit positions were selectively reduced while we added to our mortgage position. The moderate corporate underweight allocation was maintained. We have added to our position in hybrid ARMs (adjustable rate mortgages) with interest rates that are fixed for a set period and then float.
Outlook
We believe a significant yield advantage exists in select mortgage-backed and asset-backed investments, which continues to dictate an overweight position in these securities for the Fund. Interest rate volatility, a key determinant of value in the mortgage-backed securities market, has continued to decline, favoring the prospects for out-performance in this sector. Once the Fed ends the tightening phase, we see little change in the fed funds’ target rate for a considerable period thereafter. We continue to favor investments in high-quality commercial mortgages (CMBS), for their attractive yield levels, low event risk, and high quality.
4
EXCELSIOR FUNDS, INC. | CORE BOND FUND |
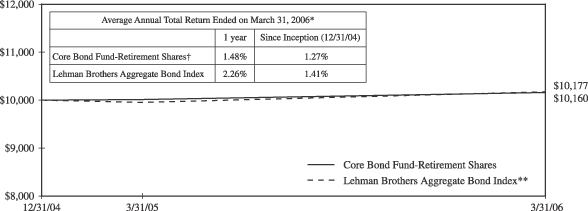
Past performance is not predictive of future performance. Investment returns and principal values will vary and shares may be worth more or less at redemption than their original cost.
The above illustration compares a $10,000 investment made in the Fund and a broad-based index since 12/31/04 (inception date). The chart assumes all dividends and capital gain distributions are reinvested. The Fund’s performance takes into account fees and expenses. The index does not take into account charges, fees and other expenses. Further information relating to Fund performance is contained in the Financial Highlights section of the Prospectus and elsewhere in this report.
| * | | Total return represents the change during the period in a hypothetical account with dividends reinvested. |
| ** | | Source: Lehman Brothers—the Lehman Brothers Aggregate Bond Index is an unmanaged, fixed income, market value-weighted index that includes treasury issues, agency issues, corporate bond issues and mortgage-backed securities. |
| † | | Currently certain fees are waived. Had such fees not been waived, returns would have been lower. Returns do not reflect the deduction of taxes that a shareholder would pay on Fund distributions or the redemption of shares. |
5
EXCELSIOR FUNDS TRUST | EQUITY INCOME FUND |
Fiscal Year Annual Review
The Equity Income Fund concentrates on investing in stocks that either pay above-average dividends or have the potential to grow their dividends. We are pleased that the trend of new first-time dividend initiation remains strong. Our efforts to grow our income stream by purchasing stocks with above-average dividend payouts from companies with progressive dividend growth policies continued to bear fruit over the fiscal year, ending March 31, 2006. Responding to a perceived need to improve shareholder return, corporate management is intiating new dividends, increasing dividends, and extending long histories of dividend payment.
Performance Attribution
During the reporting period, our performance was governed by a strong sell disciple, which enabled us to take profits as our price targets were attained. Our exposure to infrastructure-orientated industrials provided strong contributions. Furthermore, our decision to maintain positions in the telecommunications sector, while eliminating our exposure to power utilities, proved to be very rewarding. Improving sentiment toward telecommunication stocks has been the catalyst for their out-performance while higher interest rates have resulted in negative returns for utilities. Our holding in medical technology contributed only modest under performance. But our heavy underweight in energy and commodities resulted in underperformance versus the benchmark. We added a number of new positions over the course of the fiscal year, emphasizing technology, pharmaceuticals and insurers. We targeted what we believe is an exceptional analog semiconductor company, with higher margins and returns on capital than their competitors. We also added a global pharmaceutical firm, with what we see as an attractive new drug pipeline and a drug portfolio that is not heavily exposed to off-patent runoffs. In insurance, we swapped from one re-insurer to another, to capitalize on a distinct valuation advantage. On the sale side, we trimmed in consumer electronics.
Outlook
We remain enthusiastic as many of the companies in our portfolio are growing their business values and increasing their dividends; however, in many cases this progress is not yet fully reflected in their share prices. By our way of thinking, these companies are more attractive today than at this time last year, and we believe we will be rewarded for our patience. Finally, payout ratios and dividend rates continue to rise, underscoring the dynamics that we are acutely focused on. While the Federal Reserves continues to implement tighter monetary policy, we see a soft landing for the economy, which should preserve corporate profit growth.
6
EXCELSIOR FUNDS TRUST | EQUITY INCOME FUND |
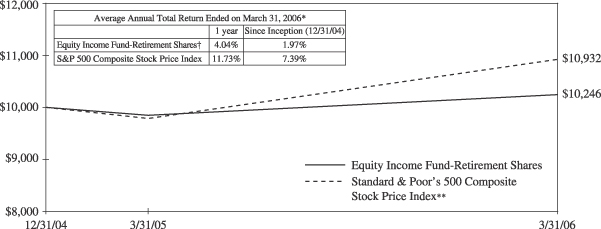
Past performance is not predictive of future performance. Investment returns and principal values will vary and shares may be worth more or less at redemption than their original cost.
The above illustration compares a $10,000 investment made in the Fund and a broad-based index since 12/31/04 (inception date). The chart assumes all dividends and capital gain distributions are reinvested. The Fund’s performance takes into account fees and expenses. The index does not take into account charges, fees and other expenses. Further information relating to Fund performance is contained in the Financial Highlights section of the Prospectus and elsewhere in this report.
| * | | Total return represents the change during the period in a hypothetical account with dividends reinvested. |
| ** | | Source: Standard & Poor’s Corporation—Reflects the reinvestment of income dividends and, where applicable, capital gain distributions. The Standard & Poor’s 500 Composite Stock Price Index is a widely accepted unmanaged index of U.S. stock market performance. |
| † | | Currently certain fees are waived. Had such fees not been waived, returns would have been lower. Returns do not reflect the deduction of taxes that a shareholder would pay on Fund distributions or the redemption of shares. |
7
EXCELSIOR FUNDS, INC. | LARGE CAP GROWTH FUND |
Annual Fiscal Year Review
The market built on a strong end-of-2005 post Thanksgiving rally, with one of the strongest first quarters since 1999, which saw the Standard & Poor’s 500 Index better its full-year 2005 price gain. This solid performance in spite of continued Fed tightening, a long-awaited slow-down in housing activity, continued global geo-political angst and higher oil and gas prices, suggests that consumers and investors remain optimistic. And why not? The U.S. economy continues to grow steadily, albeit at a more moderate pace. Inflation remains a tame worry, not a harsh reality. Finally, equities appear relatively attractive on a price earnings basis versus Treasuries and real estate.
Performance Attribution
The Excelsior Large-Cap Growth Fund outpaced our large-cap growth benchmark over the reporting period. This outperformance can be attributed to successful stock picking, particularly within the telecom, financial, technology and consumer discretionary sectors. We favored what we saw as the beginning of a shift back to growth, from the prevailing value orientation of the markets. This strategy helped us capitalize with holdings in the Financial and Internet Industries, that were strong performers year-long. Our health care overweighting injured our relative performance as did our underweight in the energy and materials sectors. Normally, growth stocks would have outperformed value stocks at this stage of the business cycle. However, equity investors took their cues from the bond market and preferred to hold on to interest-rate-sensitive and low-multiple stocks until clear signs of a sustained rebound emerged.
Outlook
Our outlook remains optimistic, as we continue to find evidence of an investor return to the growth style. Since profits grew at more than double the rate of stocks last year, we may have some more catching up to do. The comparative profit gap between the growth and value styles is beginning to expand in favor of growth. In summary, the earnings, valuation and sentiment data support our view that the return of growth stock investing is just beginning. We expect the Federal Reserve to end its tightening process in the new fiscal year, and we look for a slow down in commodity and energy price gains. Significant post-hurricane rebuilding should also provide stimulus, and the Congressional elections should have positive impact. Overall, profit growth is likely to sustain the equity markets.
8
EXCELSIOR FUNDS, INC. | LARGE CAP GROWTH FUND |
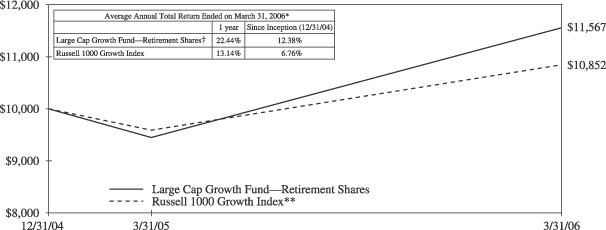
Past performance is not predictive of future performance. Investment returns and principal values will vary and shares may be worth more or less at redemption than their original cost.
The above illustration compares a $10,000 investment made in the Fund and a broad-based index since 12/31/04 (inception date). The chart assumes all dividends and capital gain distributions are reinvested. The Fund’s performance takes into account fees and expenses. The index does not take into account charges, fees and other expenses. Further information relating to Fund performance is contained in the Financial Highlights section of the Prospectus and elsewhere in this report.
| * | | Total return represents the change during the period in a hypothetical account with dividends reinvested. |
| ** | | Source: Frank Russell Company—The Russell 1000 Growth Index is an unmanaged index composed of those Russell 1000 Index companies with higher price-to-book ratios and higher forecasted growth values. The Russell 1000 Index is composed of the 1000 largest companies in The Russell 3000 Index which is composed of 3,000 of the largest U.S. companies by market capitalization. The Index includes dividends reinvested. |
| † | | Currently certain fees are waived. Had certain fees not been waived, returns would have been lower. Returns do not reflect the deduction of taxes that a shareholder would pay on Fund distributions or the redemption of shares. |
9
EXCELSIOR FUNDS TRUST | MID CAP VALUE AND RESTRUCTURING FUND |
Fiscal Year Annual Review
The Federal Reserve will eventually conclude its interest rate hikes and at sixteen times earnings, we believe stocks have room to advance. Over the course of the fiscal year, superb growth in corporate earnings and continued low inflation pushed stocks higher. We expect additional gains going forward despite the presence of several shorter-term negatives, including, high oil prices and rising short term interest rates. To our way of thinking, a moderate economic slow down should prove a sustainable source of earnings growth, especially for mid-cap companies poised to challenge their larger rivals.
Performance Attribution
We continue to target highly selective additions to the Fund. We added in consumer products, particularly in home furnishing, where we established a position with a leader in the specialty mattress category. As utilities restock, coal demand is increasing, and we added in this raw materials sector. We expect operating performance in this area to improve as capital expenditures are undertaken. We also opportunistically added to an existing position, which suffered a setback that we saw as temporary. Proceeds for these purchases came from selling in housewares and utilities. Merger and acquisition activity provided benefits, a trend we expect to continue. Mid-cap stocks were outperformers, with mid-cap indexes rising almost double what broad market measures returned. Our energy holdings continued to do well all year long, but non-energy related stocks also shone. Some of our star performers in prior years struggled, but these holdings continue to represent excellent long-term value in our estimation.
Outlook
Operating results of companies owned in the Fund were strong this year, marked by above average profitability and earnings growth. Continued merger and acquisition activity suggests a continuation of the favorable environment for our investment preference for restructuring companies. A few of the Fund’s troubled children, meaning its poor performing stocks, have recently shown signs of improved management. On the whole, the Fund’s investments sell at attractive discounts to market benchmarks on an earnings, cash flow and book value basis. While our expectations are therefore positive, we continue to keep the Fund well diversified, to mitigate risks, and remain true to our mission of purchasing stocks with improving fundamentals and low valuations.
10
EXCELSIOR FUNDS TRUST | MID CAP VALUE AND RESTRUCTURING FUND |
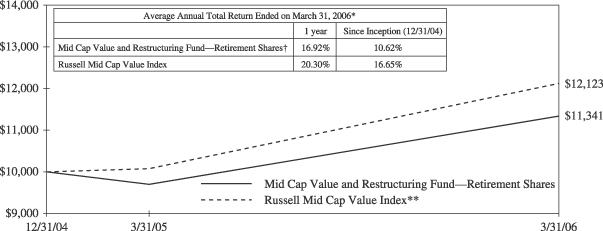
Past performance is not predictive of future performance. Investment returns and principal values will vary and shares may be worth more or less at redemption than their original cost.
The above illustration compares a $10,000 investment made in the Fund and a broad-based index since 12/31/04 (inception date). The chart assumes all dividends and capital gain distributions are reinvested. The Fund’s performance takes into account fees and expenses. The index does not take into account charges, fees and other expenses. Further information relating to Fund performance is contained in the Financial Highlights section of the Prospectus and elsewhere in this report.
| * | | Total return represents the change during the period in a hypothetical account with dividends reinvested. |
| ** | | Source: Frank Russell Company—The Russell Mid Cap Value Index measures the performance of medium-sized value-oriented securities. |
| † | | Currently certain fees are waived. Had certain fees not been waived, returns would have been lower. Returns do not reflect the deduction of taxes that a shareholder would pay on Fund distributions or the redemption of shares. |
11
EXCELSIOR FUNDS, INC. | SMALL CAP FUND |
Annual Fiscal Year Review
The small cap trend seems to have confounded many experts who had concluded that the asset class was due for a bout of underperformance, given the strong multi-year run for small-caps in previous years. The simple fact is, in addition to still many very reasonable valuations, a vast liquidity shift in favor of hedge funds has occurred. These managers may find small and mid-cap issues far more appealing for rapid appreciation. It is very difficult for a hedge fund manager to influence the likes of large-cap industry leaders, but their ownership impact can be significant further down the food chain. Throughout the reporting period, an otherwise attractive environment for small-cap stocks, including positive macroeconomic trends and strong corporate fundamentals, the markets were overshadowed by the triple threat of rising market interest rates, surging oil prices, hurricane devastation and ongoing violence in the Middle East.
Performance Attribution
The portfolio’s positive return in the quarter was driven by several factors. Our long-term investors recall that our disciplines lead us to issues that have heretofore underperformed and carry low valuations relative to their own history. Technology has been a favored area for us. Very noticeably, for the first time in a long time, this sector has begun to contribute to performance. After almost six years of a tech bear market, we are seeing the confluence of many factors, which have led us to add new positions in this sector, and to increase existing holdings. The tech companies that survived the downturn have dramatically improved their balance sheets, utilization rates, and margin structure. At the same time, many firms are shrinking their share base through share repurchase programs. Hence, our activity focus continues on highly selective technology additions to the Fund’s portfolio.
Outlook
If we are correct in our assessment of hedge fund capital inflows as a prime motivator of small cap stock prices, we would look for a continuance of the current trend. Moreover, given our commitment to the technology sector, as capital spending by business ramps higher, we see expanded revenues leading to improved margins and with a smaller share count—a perfect formula for earnings leverage. We think technology is the likely beneficiary of a greater need for productivity, particular as global competition continues.
12
EXCELSIOR FUNDS, INC. | SMALL CAP FUND |
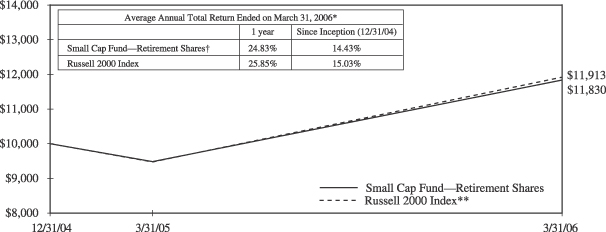
Past performance is not predictive of future performance. Investment returns and principal values will vary and shares may be worth more or less at redemption than their original cost. There is greater volatility associated with an investment in the Small Cap Market.
The above illustration compares a $10,000 investment made in the Fund and a broad-based index since 12/31/04 (inception date). The chart assumes all dividends and capital gain distributions are reinvested. The Fund’s performance takes into account fees and expenses. The index does not take into account charges, fees and other expenses. Further information relating to Fund performance is contained in the Financial Highlights section of the Prospectus and elsewhere in this report.
| * | | Total return represents the change during the period in a hypothetical account with dividends reinvested. |
| ** | | Source: Frank Russell Company—The Russell 2000 Index is an unmanaged index and is composed of the 2,000 smallest companies in the Russell 3000 Index. The Russell 3000 Index is composed of 3,000 of the largest U.S. companies by market capitalization. The index includes dividends reinvested. |
| † | | Currently certain fees are waived. Had certain fees not been waived, returns would have been lower. Returns do not reflect the deduction of taxes that a shareholder would pay on Fund distributions or the redemption of shares. |
13
EXCELSIOR FUNDS, INC. | VALUE AND RESTRUCTURING FUND |
Annual Fiscal Year Review
Long-term equity fundamentals pointed toward higher stock prices in our estimation at the start of the twelve-month period ending March 31. Superb growth in corporate earnings and continued low inflation pushed stocks higher. Stocks mounted a major rally in the last quarter of 2005 and continued to make new five-year highs in the first quarter of 2006. The Federal Reserve will eventually conclude its interest rate hikes while stocks still have room, at sixteen times earnings, to advance.
Performance Attribution
The apparent abatement of corporate defensiveness and increased emphasis on improving businesses favored our type of investing throughout the year, and the fund saw two of its holdings acquired at a premium. Energy holdings continued to do well over the reporting period, and our holdings reflected higher oil and gas prices reflecting increased global demand and shortages from Hurricanes Rita and Katrina. Our non-energy related stocks also fared well, as commercial construction picked up for the first time since 2000 and rental equipment rates soared, boosting our holdings in the sector. Negative impact was recorded in real estate and mortgages; sectors that declined on rising interest rate concerns, as the Fed boosted the fed funds target rate to 4.75% by the end of the reporting period. But we think our holdings in this sector continue to represent excellent long-term value.
Outlook
On the whole, the Fund’s investments sell at an attractive discount to market benchmarks on an earnings, cash flow, and book value basis. Continued merger and acquisition activity suggests a continuation of the favorable environment for our investment preference for restructuring companies. While our expectations are therefore positive, we continue to keep the Fund well diversified to mitigate potential risks, and remain true to our mission of purchasing stocks with improving fundamentals and low valuations. We continue to look for improvement in the energy and commodity sectors, given global demand trends, and health care may prove an important source of positive performance in the coming year. Solid business growth should counteract the Fed’s tightening and higher energy costs, allowing for earnings acceleration for carefully selected stocks.
14
EXCELSIOR FUNDS, INC. | VALUE AND RESTRUCTURING FUND |
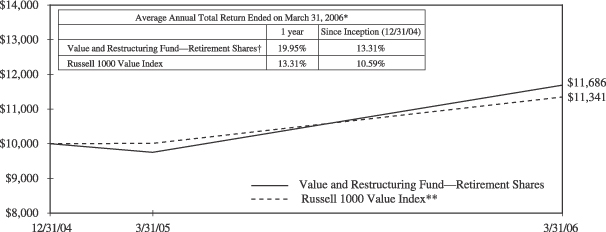
Past performance is not predictive of future performance. Investment returns and principal values will vary and shares may be worth more or less at redemption than their original cost.
The above illustration compares a $10,000 investment made in the Fund and a broad-based index since 12/31/04 (inception date). The chart assumes all dividends and capital gain distributions are reinvested. The Fund’s performance takes into account fees and expenses. The index does not take into account charges, fees and other expenses. Further information relating to Fund performance is contained in the Financial Highlights section of the Prospectus and elsewhere in this report.
| * | | Total return represents the change during the period in a hypothetical account with dividends reinvested. |
| ** | | Source: Frank Russell Company—The Russell 1000 Value Index is an unmanaged index composed of those Russell 1000 Index companies with lower price-to-book ratios and lower forecasted growth values. The Russell 1000 Index is composed of the 1000 largest companies in The Russell 3000 Index which is composed of 3,000 of the largest U.S. companies by market capitalization. The Index includes dividends reinvested. |
| † | | Currently certain fees are waived. Had certain fees not been waived, returns would have been lower. Returns do not reflect the deduction of taxes that a shareholder would pay on Fund distributions or the redemption of shares. |
15
Excelsior Funds, Inc.
Portfolio of Investments — March 31, 2006
Core Bond Fund
| | | | | | | | | | |
Principal Amount
| | | | Rate
| | | Maturity
Date
| | Value
|
ASSET BACKED SECURITIES — 0.10% | | | | | | |
| $ 294,473 | | CIT RV Trust,
1999-A A4 | | 6.16 | % | | 06/15/13 | | $ | 294,413 |
| | | | | | | | | |
|
|
| | | TOTAL ASSET BACKED SECURITIES
(Cost $288,434) | | | 294,413 |
| | | | | | | | | |
|
|
COLLATERALIZED MORTGAGE OBLIGATIONS — 13.02% |
| | | NON-GOVERNMENTAL AGENCY COLLATERALIZED MORTGAGE OBLIGATIONS — 8.61% |
| 2,295,956 | | Citigroup Mortgage Loan Trust, 2004-HYB4 WA(a) | | 4.46 | | | 12/25/34 | | | 2,243,580 |
| 2,192,522 | | Countrywide Alternative Loan Trust, 2004-16CB 1A2 | | 5.50 | | | 07/25/34 | | | 2,152,184 |
| 1,409,477 | | Countrywide Alternative Loan Trust, 2004-22CB 1A1 | | 6.00 | | | 10/25/34 | | | 1,395,569 |
| 7,158,083 | | Indymac Index Mortgage Loan Trust, 2004-AR4 3A(a) | | 4.80 | | | 08/25/34 | | | 7,005,424 |
| 9,127,959 | | JP Morgan Mortgage Trust, 2005-A6 1A1(a) | | 5.15 | | | 09/25/35 | | | 9,008,474 |
| 2,657,887 | | Wells Fargo Mortgage Backed Securities Trust, 2004-EE 3A1 | | 3.99 | | | 12/25/34 | | | 2,578,087 |
| | | | | | | | | |
|
|
| | | | | | | | | | | 24,383,318 |
| | | | | | | | | |
|
|
| | | FEDERAL HOME LOAN MORTGAGE CORPORATION — 3.03% |
| 5,208,627 | | 1602 PH | | 6.00 | | | 04/15/23 | | | 5,220,472 |
| 3,296,147 | | 2333 UZ | | 6.50 | | | 07/15/31 | | | 3,347,404 |
| | | | | | | | | |
|
|
| | | | | | | | | | | 8,567,876 |
| | | | | | | | | |
|
|
| | | FEDERAL NATIONAL MORTGAGE
ASSOCIATION— 0.50% |
| 1,430,000 | | 2003-17 QT | | 5.00 | | | 08/25/27 | | | 1,404,289 |
| | | | | | | | | |
|
|
| | | GOVERNMENT NATIONAL MORTGAGE ASSOCIATION — 0.88% |
| 2,450,621 | | 2005-25 B | | 6.21 | | | 03/16/21 | | | 2,486,037 |
| | | | | | | | | |
|
|
| | | TOTAL COLLATERALIZED MORTGAGE OBLIGATIONS
(Cost $37,574,710) | | | 36,841,520 |
| | | | | | | | | |
|
|
| | | | | | | | | | |
Principal Amount
| | | | Rate
| | | Maturity
Date
| | Value
|
COMMERCIAL MORTGAGE-BACKED SECURITIES — 14.54% |
| $ 1,477,000 | | Bank of America Commercial Mortgage, Inc., 2004-1 A4 | | 4.76 | % | | 11/10/39 | | $ | 1,400,650 |
| 3,705,581 | | Chase Commercial Mortgage Securities Corp., 1997-2 D | | 6.60 | | | 12/19/29 | | | 3,771,967 |
| 1,000,000 | | Credit Suisse First Boston Mortgage Securities Corp., 2002-CKS4 G(a)(b) | | 6.01 | | | 11/15/36 | | | 1,016,760 |
| 1,689,000 | | Greenwich Capital Commercial Funding Corp., 2004-GG1 A1 | | 5.32 | | | 06/10/36 | | | 1,659,529 |
| 2,000,000 | | Morgan Stanley Capital I, 1997-C1F(b) | | 6.85 | | | 02/15/20 | | | 2,010,911 |
| 3,601,000 | | Morgan Stanley Capital I, 1999-WF1 B | | 6.32 | | | 11/15/31 | | | 3,675,836 |
| 3,150,000 | | Morgan Stanley Dean Witter Capital I, 2000-LIF2 C | | 7.50 | | | 10/15/33 | | | 3,384,305 |
| 1,969,034 | | Mortgage Capital Funding, Inc., 1996-MC1 G | | 7.15 | | | 06/15/06 | | | 1,965,698 |
| 773,095 | | Mortgage Capital Funding, Inc., 1996-MC2 D | | 7.26 | | | 12/21/26 | | | 776,091 |
| 3,061,000 | | Mortgage Capital Funding, Inc., 1998-MC1 C | | 6.95 | | | 03/18/30 | | | 3,137,019 |
| 2,521,000 | | Nomura Asset Securities Corp., 1998-D6 A4(a) | | 6.92 | | | 03/15/30 | | | 2,828,507 |
| 3,601,000 | | Wachovia Bank Commercial Mortgage Trust, 2003-C9 A3 | | 4.61 | | | 12/15/35 | | | 3,463,240 |
| 2,305,000 | | Wachovia Bank Commercial Mortgage Trust, 2004-C12 A3 | | 5.23 | | | 07/15/41 | | | 2,282,884 |
| 10,000,000 | | Wachovia Bank Commercial Mortgage Trust, 2005-C20 A5(a)(c) | | 5.09 | | | 07/15/42 | | | 9,775,846 |
| | | | | | | | | |
|
|
| | | TOTAL COMMERCIAL MORTGAGE-BACKED SECURITIES
(Cost $41,540,424) | | | 41,149,243 |
| | | | | | | | | |
|
|
See Notes to Financial Statements.
16
Excelsior Funds, Inc.
Portfolio of Investments — March 31, 2006
Core Bond Fund — (continued)
| | | | | | | | | | |
Principal Amount
| | | | Rate
| | | Maturity
Date
| | Value
|
CORPORATE BONDS — 15.06% |
| $ 1,115,000 | | America Movil S.A. de C.V. | | 5.50 | % | | 03/01/14 | | $ | 1,068,607 |
| 2,000,000 | | Bank One Corp. | | 7.88 | | | 08/01/10 | | | 2,180,832 |
| 3,005,000 | | Bottling Group llc | | 5.50 | | | 04/01/16 | | | 2,966,407 |
| 700,000 | | British Telecommunications plc | | 8.88 | | | 12/15/30 | | | 895,497 |
| 2,800,000 | | Cisco Systems, Inc. | | 5.50 | | | 02/22/16 | | | 2,757,941 |
| 1,081,000 | | CIT Group, Inc. | | 5.88 | | | 10/15/08 | | | 1,093,756 |
| 2,000,000 | | Citigroup, INC. | | 4.25 | | | 07/29/09 | | | 1,937,164 |
| 1,441,000 | | Comcast Cable Communications | | 6.88 | | | 06/15/09 | | | 1,490,246 |
| 2,000,000 | | Comcast Cable Communications | | 6.75 | | | 01/30/11 | | | 2,079,016 |
| 1,441,000 | | DaimlerChrysler N.A. Holding Corp. | | 7.20 | | | 09/01/09 | | | 1,504,655 |
| 600,000 | | Entergy Gulf States | | 5.70 | | | 06/01/15 | | | 575,122 |
| 1,000,000 | | Ford Motor Credit Co. | | 8.63 | | | 11/01/10 | | | 958,056 |
| 2,773,000 | | Household Finance Corp. | | 8.00 | | | 07/15/10 | | | 3,025,750 |
| 1,437,000 | | International Lease Finance Corp. | | 4.50 | | | 05/01/08 | | | 1,412,935 |
| 250,000 | | Iron Mountain, Inc. | | 8.63 | | | 04/01/13 | | | 260,000 |
| 2,881,000 | | Merrill Lynch & Co. MTN | | 5.00 | | | 02/03/14 | | | 2,762,940 |
| 2,800,000 | | Morgan Stanley | | 4.75 | | | 04/01/14 | | | 2,612,380 |
| 2,000,000 | | Morgan Stanley Dean Witter | | 6.75 | | | 04/15/11 | | | 2,105,300 |
| 1,690,000 | | Oracle Corp./ Ozark Holdings(b) | | 5.25 | | | 01/15/16 | | | 1,621,205 |
| 1,441,000 | | Prudential Financial, Inc. | | 5.10 | | | 09/20/14 | | | 1,389,778 |
| 627,000 | | PSEG Energy Holdings, Inc. | | 8.63 | | | 02/15/08 | | | 653,648 |
| 2,000,000 | | RBS Capital Trust III(a) | | 5.51 | | | 09/29/49 | | | 1,929,116 |
| 1,596,000 | | Sprint Capital Corp. | | 8.38 | | | 03/15/12 | | | 1,803,320 |
| 1,153,000 | | Time Warner Cos., Inc. | | 7.25 | | | 10/15/17 | | | 1,233,772 |
| 1,441,000 | | Wal-Mart Stores | | 4.13 | | | 02/15/11 | | | 1,364,284 |
| 950,000 | | Xerox Corp. | | 6.40 | | | 03/15/16 | | | 942,875 |
| | | | | | | | | |
|
|
| | | TOTAL CORPORATE BONDS
(Cost $42,975,196) | | | 42,624,602 |
| | | | | | | | | |
|
|
TAX-EXEMPT SECURITIES — 1.31% |
| 3,600,000 | | University of Texas Revenue Bonds, Series B | | 5.00 | | | 08/15/33 | | | 3,702,456 |
| | | | | | | | | |
|
|
| | | TOTAL TAX-EXEMPT SECURITIES
(Cost $3,691,406) | | | 3,702,456 |
| | | | | | | | | |
|
|
| | | | | | | | | | |
Principal Amount
| | | | Rate
| | | Maturity
Date
| | Value
|
U.S. GOVERNMENT AGENCY BONDS & NOTES — 1.83% |
| | | FANNIE MAE (1.83%): |
| $ 5,000,000 | | MTN | | 6.25 | % | | 02/01/11 | | $ | 5,185,515 |
| | | | | | | | | |
|
|
| | | TOTAL U.S. GOVERNMENT AGENCY BONDS & NOTES
(Cost $5,341,117) | | | 5,185,515 |
| | | | | | | | | |
|
|
U.S. GOVERNMENT AGENCY MORTGAGE PASS THROUGH SECURITIES — 32.03% |
| | | FEDERAL HOME LOAN MORTGAGE CORPORATION — 17.14% |
| 10,000,000 | | TBA | | 4.50 | | | 04/01/21 | | | 9,543,751 |
| 2,888,445 | | Pool # A20105 | | 5.00 | | | 04/01/34 | | | 2,753,346 |
| 9,843,702 | | Pool # A47411 | | 4.50 | | | 10/01/35 | | | 9,080,373 |
| 4,901,581 | | Pool # A48132 | | 7.00 | | | 12/01/35 | | | 5,045,327 |
| 2,999,380 | | Pool # C01811 | | 5.00 | | | 04/01/34 | | | 2,859,092 |
| 133,535 | | Pool # C71221 | | 5.00 | | | 09/01/32 | | | 127,467 |
| 4,887,002 | | Pool # G01842 | | 4.50 | | | 06/01/35 | | | 4,508,040 |
| 15,004,026 | | Pool # G18105 | | 5.00 | | | 03/01/21 | | | 14,624,096 |
| | | | | | | | | |
|
|
| | | | | | | | | | | 48,541,492 |
| | | | | | | | | |
|
|
| | | FEDERAL NATIONAL MORTGAGE
ASSOCIATION — 12.51% |
| 11,809,993 | | Pool # 357824 | | 5.50 | | | 06/01/35 | | | 11,531,302 |
| 1,257,935 | | Pool # 387203 | | 4.80 | | | 01/01/12 | | | 1,227,747 |
| 1,074,138 | | Pool # 387204 | | 4.80 | | | 01/01/12 | | | 1,048,361 |
| 3,780,015 | | Pool # 618322 | | 6.00 | | | 12/01/31 | | | 3,785,055 |
| 4,974,463 | | Pool # 805386 ARM(a) | | 4.90 | | | 01/01/35 | | | 4,920,909 |
| 764,261 | | Pool # 812268 | | 5.50 | | | 05/01/35 | | | 746,227 |
| 911,766 | | Pool # 820989 | | 5.50 | | | 04/01/35 | | | 890,251 |
| 909,179 | | Pool # 821567 | | 5.50 | | | 06/01/35 | | | 887,724 |
| 11,234,831 | | Pool # 829321 | | 4.50 | | | 09/01/35 | | | 10,367,019 |
| | | | | | | | | |
|
|
| | | | | | | | | | | 35,404,595 |
| | | | | | | | | |
|
|
| | | GOVERNMENT NATIONAL MORTGAGE ASSOCIATION — 2.38% |
| 389,975 | | Pool # 2562 | | 6.00 | | | 03/20/28 | | | 394,022 |
| 596,534 | | Pool # 267812 | | 8.50 | | | 06/15/17 | | | 640,097 |
| 2,164,434 | | Pool # 3413 | | 4.50 | | | 07/20/33 | | | 2,018,927 |
| 1,983,052 | | Pool # 3442 | | 5.00 | | | 09/20/33 | | | 1,916,383 |
| 36,385 | | Pool # 532751 | | 9.00 | | | 08/15/30 | | | 39,616 |
| 109,246 | | Pool # 568670 | | 6.50 | | | 04/15/32 | | | 113,284 |
| 300,160 | | Pool # 780548 | | 8.50 | | | 12/15/17 | | | 321,070 |
| 291,452 | | Pool # 780865 | | 9.50 | | | 11/15/17 | | | 318,467 |
| 538,300 | | Pool # 781084 | | 9.00 | | | 12/15/17 | | | 577,178 |
| 390,606 | | Pool # 80311 ARM(a) | | 4.50 | | | 08/20/29 | | | 390,282 |
| | | | | | | | | |
|
|
| | | | | | | | | | | 6,729,326 |
| | | | | | | | | |
|
|
| | | TOTAL U.S. GOVERNMENT AGENCY MORTGAGE PASS THROUGH SECURITIES
(Cost $91,989,929) | | | 90,675,413 |
| | | | | | | | | |
|
|
See Notes to Financial Statements.
17
Excelsior Funds, Inc.
Portfolio of Investments — March 31, 2006
Core Bond Fund — (continued)
| | | | | | | | | | |
Principal Amount
| | | | Rate
| | | Maturity
Date
| | Value
|
U.S. GOVERNMENT SECURITIES — 17.81% |
| | | U.S. TREASURY STRIPS — 4.46% |
| $ 22,600,000 | | | | 0.00 | % | | 11/15/17 | | $ | 12,633,174 |
| | | | | | | | | |
|
|
| | | U.S. TREASURY INFLATION PROTECTED
BONDS — 0.83% |
| 300,000 | | | | 4.25 | | | 01/15/10 | | | 379,904 |
| 2,000,000 | | | | 0.88 | | | 04/15/10 | | | 1,982,919 |
| | | | | | | | | |
|
|
| | | | | | | | | | | 2,362,823 |
| | | | | | | | | |
|
|
| | | U.S. TREASURY NOTES — 12.52% |
| 7,700,000 | | | | 3.63 | | | 01/15/10 | | | 7,381,774 |
| 12,000,000 | | | | 4.50 | | | 11/15/10 | | | 11,838,720 |
| 11,955,000 | | (c) | | 7.63 | | | 11/15/22 | | | 15,346,299 |
| 885,000 | | | | 4.50 | | | 02/15/36 | | | 830,379 |
| | | | | | | | | |
|
|
| | | | | | | | | | | 35,397,172 |
| | | | | | | | | |
|
|
| | | TOTAL U.S. GOVERNMENT SECURITIES
(Cost $52,096,327) | | | 50,393,169 |
| | | | | | | | | |
|
|
| | | | |
Shares
| | | | | | | | | |
REGISTERED INVESTMENT COMPANIES — 2.16% |
| 3,052,268 | | Dreyfus Government Cash Management Fund | | | 3,052,268 |
| 3,052,268 | | Fidelity U.S. Treasury II Fund | | | 3,052,267 |
| | | | | | | | | |
|
|
| | | TOTAL REGISTERED INVESTMENT COMPANIES
(Cost $6,104,535) | | | 6,104,535 |
| | | | | | | | | |
|
|
| | | | | | |
| | |
| | | | | | Value
|
TOTAL INVESTMENTS
(Cost $281,602,078)(d) | | 97.86 | % | | $ | 276,970,866 |
OTHER ASSETS IN EXCESS OF LIABILITIES | | 2.14 | | | | 6,045,059 |
| | |
|
| |
|
|
NET ASSETS | | 100.00 | % | | $ | 283,015,925 |
| | |
|
| |
|
|
| (a) | Variable Rate Security—The rate disclosed is as of March 31, 2006. |
| (b) | Security exempt from registration under Rule 144A of the Securities Act of 1933. This security may be resold in transactions exempt from registration, normally to qualified institutional buyers. At March 31, 2006, these securities amounted to $4,648,876 or 1.64% of net assets. |
| (c) | All or part of the security is segregated by the Fund’s custodian to cover future purchase commitments. |
| (d) | Unrealized appreciation (depreciation) of securities: |
| | | | | | | | | |
Unrealized
Appreciation
| | Unrealized
(Depreciation)
| | | Net Unrealized
Appreciation/
(Depreciation)
| |
| $ | 760,868 | | $ | (5,392,080 | ) | | $ | (4,631,212 | ) |
ARM—Adjustable Rate Mortgage
llc—limited liability company
MTN—Medium Term Note
plc—public limited company
STRIPS—Separately Traded Registered Interest and Principal Securities
The summary of the Fund’s investments as of March 31, 2006 is as follows: (Unaudited)
| | | | | | |
Portfolio Diversification
| | % of
Net
Assets
| | | Value
|
U.S. Government & Agency Securities | | 51.67 | % | | $ | 146,254,097 |
Corporate Bonds | | 15.06 | | | | 42,624,602 |
Commercial Mortgage-Backed Securities | | 14.54 | | | | 41,149,243 |
Collateralized Mortgage Obligations | | 13.02 | | | | 36,841,520 |
Registered Investment Companies | | 2.16 | | | | 6,104,535 |
Tax-Exempt Securities | | 1.31 | | | | 3,702,456 |
Asset Backed Securities | | 0.10 | | | | 294,413 |
| | |
|
| |
|
|
Total Investments | | 97.86 | % | | $ | 276,970,866 |
Other Assets in Excess of Liabilities | | 2.14 | | | | 6,045,059 |
| | |
|
| |
|
|
Net Assets | | 100.00 | % | | $ | 283,015,925 |
| | |
|
| |
|
|
See Notes to Financial Statements.
18
Excelsior Funds, Inc.
Portfolio of Investments — March 31, 2006
Equity Income Fund
| | | | | |
| | | | | | |
| | | | | | |
Shares
| | | | Value
|
| COMMON STOCKS — 92.49% | | |
| | | CONSUMER DISCRETIONARY — 14.17% |
| 106,000 | | CBS Corp., Class B | | $ | 2,541,880 |
| 221,000 | | Circuit City Stores, Inc. | | | 5,410,080 |
| 120,000 | | Lear Corp. | | | 2,127,600 |
| 214,000 | | Leggett & Platt, Inc. | | | 5,215,180 |
| 184,800 | | Newell Rubbermaid, Inc. | | | 4,655,112 |
| 118,000 | | Snap-On, Inc. | | | 4,498,160 |
| 123,400 | | Time Warner, Inc. | | | 2,071,886 |
| 68,500 | | Viacom, Inc., Class B(a) | | | 2,657,800 |
| | | | |
|
|
| | | | | | 29,177,698 |
| | | | |
|
|
| | | CONSUMER STAPLES — 2.67% | | | |
| 77,500 | | Altria Group, Inc. | | | 5,491,650 |
| | | | |
|
|
| | | ENERGY — 8.69% | | | |
| 100,000 | | BP plc ADR | | | 6,894,000 |
| 114,000 | | Chevron Corp. | | | 6,608,580 |
| 60,100 | | Halliburton Co. | | | 4,388,502 |
| | | | |
|
|
| | | | | | 17,891,082 |
| | | | |
|
|
| | | FINANCIAL — 20.45% | | | |
| 105,000 | | Arthur J. Gallagher & Co. | | | 2,920,050 |
| 43,316 | | Bank of America Corp. | | | 1,972,611 |
| 131,000 | | Citigroup, Inc. | | | 6,188,440 |
| 100,000 | | Freddie Mac | | | 6,100,000 |
| 195,000 | | Mellon Financial Corp. | | | 6,942,000 |
| 100,000 | | Morgan Stanley | | | 6,282,000 |
| 93,000 | | RenaissanceRe Holdings Ltd. | | | 4,056,660 |
| 149,000 | | U.S. BanCorp. | | | 4,544,500 |
| 147,500 | | W. P. Stewart & Co. Ltd. | | | 3,109,300 |
| | | | |
|
|
| | | | | | 42,115,561 |
| | | | |
|
|
| | | HEALTH CARE — 6.32% | | | |
| 92,000 | | Eli Lilly & Co. | | | 5,087,600 |
| 101,300 | | Medtronic, Inc. | | | 5,140,975 |
| 50,000 | | Novartis AG ADR | | | 2,772,000 |
| | | | |
|
|
| | | | | | 13,000,575 |
| | | | |
|
|
| | | INDUSTRIALS — 12.05% | | | |
| 112,000 | | Dover Corp. | | | 5,438,720 |
| 177,533 | | General Electric Co. | | | 6,174,598 |
| 163,000 | | Honeywell International, Inc. | | | 6,971,509 |
| 66,275 | | Hubbell, Inc., Class B | | | 3,397,257 |
| 86,000 | | RR Donnelley & Sons Co. | | | 2,813,920 |
| | | | |
|
|
| | | | | | 24,796,004 |
| | | | |
|
|
| | | | | |
| | | | | | |
| | | | | | |
Shares
| | | | Value
|
| COMMON STOCKS — (continued) | | |
| | | INFORMATION TECHNOLOGY — 11.44% |
| 243,000 | | Electronic Data Systems Corp. | | $ | 6,519,690 |
| 138,000 | | Linear Technology Corp. | | | 4,841,040 |
| 200,000 | | Microsoft Corp. | | | 5,442,000 |
| 325,500 | | Nokia Oyj ADR | | | 6,744,360 |
| | | | |
|
|
| | | | | | 23,547,090 |
| | | | |
|
|
| | | RAW/INTERMEDIATE MATERIALS — 11.17% |
| 103,000 | | Eastman Chemical Co. | | | 5,271,540 |
| 201,700 | | Packaging Corp. of America | | | 4,526,148 |
| 15,000 | | Pope Resources Ltd. | | | 498,750 |
| 74,000 | | Rayonier, Inc. | | | 3,373,660 |
| 237,000 | | RPM, Inc. | | | 4,251,780 |
| 70,000 | | Weyerhaeuser Co. | | | 5,070,100 |
| | | | |
|
|
| | | | | | 22,991,978 |
| | | | |
|
|
| | | TELECOMMUNICATION — 5.53% |
| 180,000 | | AT&T, Inc. | | | 4,867,200 |
| 191,500 | | Verizon Communications, Inc. | | | 6,522,490 |
| | | | |
|
|
| | | | | | 11,389,690 |
| | | | |
|
|
| | | TOTAL COMMON STOCKS
(Cost $166,480,153) | | | 190,401,328 |
| | | | |
|
|
| FOREIGN COMMON STOCKS — 3.11% | | |
| | | UNITED KINGDOM — 3.11% | | | |
| 463,400 | | Pearson plc | | | 6,403,518 |
| | | | |
|
|
| | | TOTAL FOREIGN COMMON STOCKS
(Cost $5,497,014) | | | 6,403,518 |
| | | | |
|
|
| CONVERTIBLE PREFERRED STOCKS — 3.73% |
| | | CONSUMER DISCRETIONARY — 2.16% |
| 71,900 | | Ford Motor Co. Capital Trust II, Preferred Exchange, 6.50% | | | 2,160,595 |
| 132,400 | | General Motors Corp., Series C, Preferred Exchange, 6.25% | | | 2,297,140 |
| | | | |
|
|
| | | | | | 4,457,735 |
| | | | |
|
|
| | | ENERGY — 1.57% | | | |
| 89,500 | | EL Paso Energy Capital Trust I, Preferred Exchange, 4.75% | | | 3,222,000 |
| | | | |
|
|
| | | TOTAL CONVERTIBLE PREFERRED STOCKS
(Cost $7,510,071) | | | 7,679,735 |
| | | | |
|
|
See Notes to Financial Statements.
19
Excelsior Funds, Inc.
Portfolio of Investments — March 31, 2006
Equity Income Fund — (continued)
| | | | | |
| | | | | | |
Contracts
| | | | Value
|
| CALL OPTION PURCHASED — 0.34% | | |
| 2,000 | | Time Warner, Inc. Expires 01/19/08 strike price 15 | | $ | 700,000 |
| | | | |
|
|
| | | TOTAL CALL OPTION PURCHASED
(Cost $895,999) | | | 700,000 |
| | | | |
|
|
| | | | | | |
TOTAL INVESTMENTS
(Cost $180,383,237)(b) | | 99.67 | % | | $ | 205,184,581 |
OTHER ASSETS IN EXCESS OF LIABILITIES | | 0.33 | | | | 669,398 |
| | |
|
| |
|
|
NET ASSETS | | 100.00 | % | | $ | 205,853,979 |
| | |
|
| |
|
|
| (a) | Non-income producing security |
| (b) | Unrealized appreciation (depreciation) of securities: |
| | | | |
Unrealized Appreciation
| | Unrealized (Depreciation)
| | Net
Unrealized Appreciation/
(Depreciation)
|
| $26,765,350 | | $(1,964,006) | | $24,801,344 |
ADR—American Depository Receipt
Ltd.—Limited
plc—Public limited company
The summary of the Fund’s investments as of March 31, 2006 is as follows: (Unaudited)
| | | | | | |
Sector Diversification
| | % of
Net
Assets
| | | Value
|
Financial | | 20.45 | % | | $ | 42,115,561 |
Consumer Discretionary | | 19.78 | | | | 40,738,951 |
Industrials | | 12.05 | | | | 24,796,004 |
Information Technology | | 11.44 | | | | 23,547,090 |
Raw/Intermediate Materials | | 11.17 | | | | 22,991,978 |
Energy | | 10.26 | | | | 21,113,082 |
Health Care | | 6.32 | | | | 13,000,575 |
Telecommunication | | 5.53 | | | | 11,389,690 |
Consumer Staples | | 2.67 | | | | 5,491,650 |
| | |
|
| |
|
|
Total Investments | | 99.67 | % | | $ | 205,184,581 |
Other Assets in Excess of Liabilities | | 0.33 | | | | 669,398 |
| | |
|
| |
|
|
Net Assets | | 100.00 | % | | $ | 205,853,979 |
| | |
|
| |
|
|
See Notes to Financial Statements.
20
Excelsior Funds, Inc.
Portfolio of Investments — March 31, 2006
Large Cap Growth Fund
| | | | | |
| | | | | | |
Shares
| | | | Value
|
| COMMON STOCKS — 95.96% | | |
| | | CONSUMER DISCRETIONARY — 17.76% |
| 326,100 | | Carnival Corp., Class A | | $ | 15,447,357 |
| 478,700 | | Coach, Inc.(a) | | | 16,553,446 |
| 563,300 | | eBay(a) | | | 22,002,498 |
| 238,100 | | Lowes Companies, Inc. | | | 15,343,164 |
| 456,000 | | Petsmart, Inc. | | | 12,831,840 |
| 422,900 | | Starbucks Corp.(a) | | | 15,917,956 |
| | | | |
|
|
| | | | | | 98,096,261 |
| | | | |
|
|
| | | FINANCIAL — 7.63% |
| 34,800 | | Chicago Mercantile Exchange | | | 15,573,000 |
| 74,600 | | Lehman Brothers Holding, Inc. | | | 10,781,938 |
| 303,975 | | SLM Corp. | | | 15,788,462 |
| | | | |
|
|
| | | | | | 42,143,400 |
| | | | |
|
|
| | | HEALTH CARE — 34.91% |
| 171,655 | | Alcon, Inc. | | | 17,896,750 |
| 214,685 | | Amgen, Inc.(a) | | | 15,618,334 |
| 431,688 | | Caremark Rx, Inc.(a) | | | 21,230,416 |
| 519,600 | | Celgene Corp.(a) | | | 22,976,712 |
| 183,400 | | Genentech, Inc.(a) | | | 15,499,134 |
| 210,300 | | Gilead Sciences, Inc.(a) | | | 13,084,866 |
| 289,840 | | Medtronic, Inc. | | | 14,709,380 |
| 595,631 | | Patterson Cos., Inc.(a) | | | 20,966,211 |
| 388,100 | | Teva Pharmaceutical Industries Ltd. ADR | | | 15,981,958 |
| 202,876 | | WellPoint, Inc.(a) | | | 15,708,689 |
| 281,482 | | Zimmer Holdings, Inc.(a) | | | 19,028,183 |
| | | | |
|
|
| | | | | | 192,700,633 |
| | | | |
|
|
| | | INDUSTRIALS — 2.94% | | | |
| 188,200 | | Expeditors International of Washington, Inc. | | | 16,258,598 |
| | | | |
|
|
| | | INFORMATION TECHNOLOGY — 28.92% |
| 351,600 | | Apple Computer, Inc.(a) | | | 22,052,352 |
| 361,500 | | Broadcom Corp., Class A(a) | | | 15,602,340 |
| 312,259 | | Dell, Inc.(a) | | | 9,292,828 |
| 284,415 | | Electronic Arts, Inc.(a) | | | 15,563,189 |
| 60,873 | | Google, Inc., Class A(a) | | | 23,740,469 |
| 184,203 | | Infosys Technologies Ltd. ADR | | | 14,342,046 |
| 395,990 | �� | Qualcomm, Inc. | | | 20,041,054 |
| 165,100 | | Research In Motion Ltd.(a) | | | 14,013,688 |
| 144,700 | | SAP AG ADR | | | 7,860,104 |
| 531,500 | | Yahoo!, Inc.(a) | | | 17,146,190 |
| | | | |
|
|
| | | | | | 159,654,260 |
| | | | |
|
|
| | | | | |
| | | | | | |
Shares
| | | | Value
|
| COMMON STOCKS — (continued) | | |
| | | TELECOMMUNICATION — 3.80% |
| 612,700 | | America Movil S.A. de C.V., Series L ADR | | $ | 20,991,102 |
| | | | |
|
|
| | | TOTAL COMMON STOCKS
(Cost $443,598,594) | | | 529,844,254 |
| | | | |
|
|
| | |
Principal
Amount
| | | | |
| REPURCHASE AGREEMENT — 6.69% | | |
| $36,968,000 | | JP Morgan Chase Securities, Inc., 3.40%, dated 03/31/06, to be repurchased 04/03/06, repurchase price $36,978,474 (collateralized by U.S. Treasury Note, par value $27,691,000, 8.125%, maturing 08/15/21; total market value $37,241,507) | | | 36,968,000 |
| | | | |
|
|
| | | TOTAL REPURCHASE AGREEMENT
(Cost $36,968,000) | | | 36,968,000 |
| | | | |
|
|
| | | | | | | |
TOTAL INVESTMENTS
(Cost $480,566,594)(b) | | 102.65 | % | | $ | 566,812,254 | |
LIABILITIES IN EXCESS OF OTHER ASSETS | | (2.65 | ) | | | (14,616,684 | ) |
| | |
|
| |
|
|
|
NET ASSETS | | 100.00 | % | | $ | 552,195,570 | |
| | |
|
| |
|
|
|
| (a) | Non-income producing security |
| (b) | Unrealized appreciation (depreciation) of securities: |
| | | | | | | |
Unrealized
Appreciation
| | Unrealized
(Depreciation)
| | | Net Unrealized
Appreciation/
(Depreciation)
|
| $90,470,304 | | $ | (4,224,644 | ) | | $ | 86,245,660 |
ADR—American Depository Receipt
Ltd.—Limited
See Notes to Financial Statements.
21
Excelsior Funds, Inc.
Portfolio of Investments — March 31, 2006
Large Cap Growth Fund — (continued)
The summary of the Fund’s investments as of March 31, 2006 is as follows: (Unaudited)
| | | | | | | |
Sector Diversification
| | % of
Net
Assets
| | | Value
| |
Health Care | | 34.91 | % | | $ | 192,700,633 | |
Information Technology | | 28.92 | | | | 159,654,260 | |
Consumer Discretionary | | 17.76 | | | | 98,096,261 | |
Financial | | 7.63 | | | | 42,143,400 | |
Repurchase Agreement | | 6.69 | | | | 36,968,000 | |
Telecommunication | | 3.80 | | | | 20,991,102 | |
Industrials | | 2.94 | | | | 16,258,598 | |
| | |
|
| |
|
|
|
Total Investments | | 102.65 | % | | $ | 566,812,254 | |
Liabilities in Excess of Other Assets | | (2.65 | ) | | | (14,616,684 | ) |
| | |
|
| |
|
|
|
Net Assets | | 100.00 | % | | $ | 552,195,570 | |
| | |
|
| |
|
|
|
See Notes to Financial Statements.
22
Excelsior Funds, Inc.
Portfolio of Investments — March 31, 2006
Mid Cap Value and Restructuring Fund
| | | | | |
| | | | | | |
Shares
| | | | Value
|
| COMMON STOCKS — 97.44% | | |
| | | CONSUMER DISCRETIONARY — 26.05% |
| 90,000 | | Autozone, Inc.(a) | | $ | 8,972,100 |
| 126,600 | | Black & Decker Corp. | | | 11,000,274 |
| 745,000 | | Blockbuster, Inc. | | | 2,667,100 |
| 229,661 | | Callaway Golf Co. | | | 3,950,169 |
| 95,000 | | Centex Corp. | | | 5,889,050 |
| 325,000 | | Constellation Brands, Inc.(a) | | | 8,141,250 |
| 270,000 | | EchoStar Communications, Inc.(a) | | | 8,064,900 |
| 170,000 | | Limited Brands | | | 4,158,200 |
| 42,000 | | Morgans Hotel Group(a) | | | 741,720 |
| 379,700 | | Onex Corp. | | | 6,998,251 |
| 210,000 | | Sherwin-Williams Co. | | | 10,382,400 |
| 294,700 | | Tempur-Pedic International, Inc.(a) | | | 4,170,005 |
| 300,000 | | TJX Cos., Inc. | | | 7,446,000 |
| 208,000 | | Zale Corp.(a) | | | 5,830,240 |
| | | | |
|
|
| | | | | | 88,411,659 |
| | | | |
|
|
| | | CONSUMER STAPLES — 2.34% |
| 205,000 | | Dean Foods Co.(a) | | | 7,960,150 |
| | | | |
|
|
| | | ENERGY — 12.45% | | | |
| 130,000 | | Cimarex Energy Co. | | | 5,623,800 |
| 217,000 | | Devon Energy Corp. | | | 13,273,890 |
| 153,700 | | Noble Corp. | | | 12,465,070 |
| 117,600 | | Occidental Petroleum Corp. | | | 10,895,640 |
| | | | |
|
|
| | | | | | 42,258,400 |
| | | | |
|
|
| | | FINANCIAL — 15.21% |
| 167,300 | | Ace Ltd. | | | 8,701,273 |
| 200,000 | | CIT Group, Inc. | | | 10,704,000 |
| 250,000 | | Doral Financial Corp. | | | 2,887,500 |
| 50,000 | | First Marblehead Corp. | | | 2,162,500 |
| 73,000 | | Lehman Brothers Holding, Inc. | | | 10,550,690 |
| 125,000 | | Leucadia National Corp. | | | 7,457,500 |
| 75,000 | | RenaissanceRe Holdings Ltd. | | | 3,271,500 |
| 270,000 | | Sovereign Bancorp, Inc. | | | 5,915,700 |
| | | | |
|
|
| | | | | | 51,650,663 |
| | | | |
|
|
| | | HEALTH CARE — 5.58% | | | |
| 415,000 | | Health Management Associates, Inc., Class A | | | 8,951,550 |
| 215,000 | | Shire Pharmaceuticals plc ADR | | | 9,995,350 |
| | | | |
|
|
| | | | | | 18,946,900 |
| | | | |
|
|
| | | | | |
| | | | | | |
Shares
| | | | Value
|
| COMMON STOCKS — (continued) | | |
| | | INDUSTRIALS — 15.69% |
| 51,500 | | Autoliv, Inc. | | $ | 2,913,870 |
| 235,000 | | Brink’s Co. | | | 11,928,600 |
| 265,000 | | Empresa Brasileira de Aeronautica S.A. ADR | | | 9,765,250 |
| 123,700 | | Lincoln Electric Holdings, Inc. | | | 6,678,563 |
| 210,000 | | Mueller Industries, Inc. | | | 7,494,900 |
| 420,000 | | United Rentals, Inc.(a) | | | 14,490,000 |
| | | | |
|
|
| | | | | | 53,271,183 |
| | | | |
|
|
| | | INFORMATION TECHNOLOGY — 7.21% |
| 190,000 | | Electronic Data Systems Corp. | | | 5,097,700 |
| 280,400 | | Harris Corp. | | | 13,260,116 |
| 580,000 | | Symbol Technologies, Inc. | | | 6,136,400 |
| | | | |
|
|
| | | | | | 24,494,216 |
| | | | |
|
|
| | | RAW/INTERMEDIATE MATERIALS — 7.11% |
| 233,800 | | Aracruz Cellulose S.A. ADR | | | 12,377,372 |
| 225,000 | | Cabot Microelectronics Corp.(a) | | | 8,347,500 |
| 350,000 | | International Coal Group, Inc.(a) | | | 3,409,000 |
| | | | |
|
|
| | | | | | 24,133,872 |
| | | | |
|
|
| | | REAL ESTATE — 2.34% |
| 126,600 | | St. Joe Co. | | | 7,955,544 |
| | | | |
|
|
| | | UTILITIES — 3.46% | | | |
| 406,800 | | EL Paso Corp. | | | 4,901,940 |
| 320,000 | | Williams Cos., Inc. | | | 6,844,800 |
| | | | |
|
|
| | | | | | 11,746,740 |
| | | | |
|
|
| | | TOTAL COMMON STOCKS
(Cost $208,393,057) | | | 330,829,327 |
| | | | |
|
|
| FOREIGN COMMON STOCKS — 1.94% | | |
| | | NETHERLANDS — 1.94% |
| 99,500 | | Hunter Douglas NV | | | 6,598,774 |
| | | | |
|
|
| | | TOTAL FOREIGN COMMON STOCKS
(Cost $3,662,399) | | | 6,598,774 |
| | | | |
|
|
| CONVERTIBLE PREFERRED STOCKS — 0.14% |
| | | CONSUMER DISCRETIONARY — 0.14% |
| 500 | | Blockbuster, Inc., Preferred Exchange, 7.50%(b) | | | 465,000 |
| | | | |
|
|
| | | TOTAL CONVERTIBLE PREFERRED STOCKS
(Cost $500,000) | | | 465,000 |
| | | | |
|
|
See Notes to Financial Statements.
23
Excelsior Funds, Inc.
Portfolio of Investments — March 31, 2006
Mid Cap Value and Restructuring Fund — (continued)
| | | | | |
| | | | | | |
Principal Amount
| | | | Value
|
| REPURCHASE AGREEMENT — 0.44% | | |
| $1,484,000 | | JP Morgan Chase Securities, Inc., 3.40%, dated 03/31/06, to be repurchased 04/03/06, repurchase price $1,484,420 (collateralized by U.S. Treasury Note, par value $1,112,000, 8.125%, maturing 08/15/21; total market value $1,494,979) | | $ | 1,484,000 |
| | | | |
|
|
| | | TOTAL REPURCHASE AGREEMENT
(Cost $1,484,000) | | | 1,484,000 |
| | | | |
|
|
| | | | | | |
TOTAL INVESTMENTS
(Cost $214,039,456)(c) | | 99.96 | % | | $ | 339,377,101 |
OTHER ASSETS IN EXCESS OF LIABILITIES | | 0.04 | | | | 120,025 |
| | |
|
| |
|
|
NET ASSETS | | 100.00 | % | | $ | 339,497,126 |
| | |
|
| |
|
|
| (a) | Non-income producing security. |
| (b) | Security exempt from registration under Rule 144A of the Securities Act of 1933. This security may be resold in transactions exempt from registration, normally to qualified institutional buyers. At March 31, 2006, these securities amounted to $465,000 or 0.14% of net assets. |
| (c) | Unrealized appreciation (depreciation) of securities: |
| | | | | | | |
Unrealized
Appreciation
| | Unrealized
(Depreciation)
| | | Net Unrealized
Appreciation/
(Depreciation)
|
| $130,550,617 | | $ | (5,212,972 | ) | | $ | 125,337,645 |
ADR—American Depository Receipt
Ltd.—Limited
plc—public limited company
The summary of the Fund’s investments as of March 31, 2006 is as follows: (Unaudited)
| | | | | | |
Sector Diversification
| | % of
Net
Assets
| | | Value
|
Consumer Discretionary | | 28.13 | % | | $ | 95,475,433 |
Industrials | | 15.69 | | | | 53,271,183 |
Financial | | 15.21 | | | | 51,650,663 |
Energy | | 12.45 | | | | 42,258,400 |
Information Technology | | 7.21 | | | | 24,494,216 |
Raw/Intermediate Materials | | 7.11 | | | | 24,133,872 |
Health Care | | 5.58 | | | | 18,946,900 |
Utilities | | 3.46 | | | | 11,746,740 |
Consumer Staples | | 2.34 | | | | 7,960,150 |
Real Estate | | 2.34 | | | | 7,955,544 |
Repurchase Agreement | | 0.44 | | | | 1,484,000 |
| | |
|
| |
|
|
Total Investments | | 99.96 | % | | $ | 339,377,101 |
Other Assets in Excess of Liabilities | | 0.04 | | | | 120,025 |
| | |
|
| |
|
|
Net Assets | | 100.00 | % | | $ | 339,497,126 |
| | |
|
| |
|
|
See Notes to Financial Statements.
24
Excelsior Funds, Inc.
Portfolio of Investments — March 31, 2006
Small Cap Fund
| | | | | |
| | | | | | |
Shares
| | | | Value
|
| COMMON STOCKS — 98.97% | | |
| | | CONSUMER DISCRETIONARY — 14.35% |
| 400,000 | | Cabelas, Inc.(a) | | $ | 8,208,000 |
| 60,000 | | Columbia Sportswear Co.(a) | | | 3,199,800 |
| 320,000 | | Ethan Allen Interiors, Inc. | | | 13,446,400 |
| 800,000 | | Oakley, Inc. | | | 13,616,000 |
| 880,000 | | Sotheby’s Holdings, Inc., Class A(a) | | | 25,555,200 |
| 320,000 | | Thor Industries, Inc. | | | 17,075,200 |
| 200,000 | | Urban Outfitters, Inc.(a) | | | 4,908,000 |
| | | | |
|
|
| | | | | | 86,008,600 |
| | | | |
|
|
| | | CONSUMER STAPLES — 1.98% | | | |
| 380,000 | | Performance Food Group Co.(a) | | | 11,852,200 |
| | | | |
|
|
| | | ENERGY — 5.54% | | | |
| 380,000 | | Helix Energy Solutions Group, Inc.(a) | | | 14,402,000 |
| 400,000 | | TETRA Technologies, Inc.(a) | | | 18,816,000 |
| | | | |
|
|
| | | | | | 33,218,000 |
| | | | |
|
|
| | | FINANCIAL — 10.38% | | | |
| 200,000 | | Greenhill & Co., Inc. | | | 13,222,000 |
| 260,000 | | Jefferies Group, Inc. | | | 15,210,000 |
| 125,000 | | Park National Corp. | | | 13,312,500 |
| 600,000 | | Philadelphia Consolidated Holdings Corp.(a) | | | 20,484,000 |
| | | | |
|
|
| | | | | | 62,228,500 |
| | | | |
|
|
| | | HEALTH CARE — 6.83% | | | |
| 460,000 | | Arrow International, Inc. | | | 15,028,200 |
| 440,000 | | Kensey Nash Corp.(a) | | | 12,584,000 |
| 300,000 | | Molina Healthcare, Inc.(a) | | | 10,041,000 |
| 800,000 | | Orthovita, Inc.(a) | | | 3,312,000 |
| | | | |
|
|
| | | | | | 40,965,200 |
| | | | |
|
|
| | | INDUSTRIALS — 20.65% | | | |
| 220,000 | | Barnes Group, Inc. | | | 8,910,000 |
| 600,000 | | FTI Consulting, Inc.(a) | | | 17,118,000 |
| 660,000 | | Kansas City Southern(a) | | | 16,302,000 |
| 1,200,000 | | MPS Group, Inc.(a) | | | 18,360,000 |
| 1,260,000 | | Quanta Services, Inc.(a) | | | 20,185,200 |
| 520,000 | | Shaw Group, Inc.(a) | | | 15,808,000 |
| 440,000 | | Simpson Manufacturing Co., Inc. | | | 19,052,000 |
| 180,000 | | Triumph Group, Inc.(a) | | | 7,966,800 |
| | | | |
|
|
| | | | | | 123,702,000 |
| | | | |
|
|
| | | | | |
| | | | | | |
Shares
| | | | Value
|
| COMMON STOCKS — (continued) | | |
| | | INFORMATION TECHNOLOGY — 16.05% |
| 280,000 | | CACI International, Inc., Class A(a) | | $ | 18,410,000 |
| 660,000 | | Dendrite International, Inc.(a) | | | 9,009,000 |
| 700,000 | | Forrester Research, Inc.(a) | | | 15,624,000 |
| 1,400,000 | | Keane, Inc.(a) | | | 22,050,000 |
| 760,000 | | Manhattan Associates, Inc.(a) | | | 16,720,000 |
| 400,000 | | MAXIMUS, Inc. | | | 14,392,000 |
| | | | |
|
|
| | | | | | 96,205,000 |
| | | | |
|
|
| | | RAW/INTERMEDIATE MATERIALS — 3.09% |
| 500,000 | | Cabot Microelectronics Corp.(a) | | | 18,550,000 |
| | | | |
|
|
| | | TECHNOLOGY — 18.48% |
| 700,000 | | CommScope, Inc.(a) | | | 19,985,000 |
| 800,000 | | Fairchild Semiconductor International, Inc.(a) | | | 15,256,000 |
| 1,500,000 | | Kulicke & Soffa Industries, Inc.(a) | | | 14,310,000 |
| 600,000 | | Lattice Semiconductor Corp.(a) | | | 3,996,000 |
| 700,000 | | Palm, Inc.(a) | | | 16,212,000 |
| 600,000 | | Power Integrations(a) | | | 14,868,000 |
| 620,000 | | Technitrol, Inc. | | | 14,867,600 |
| 400,000 | | Varian Semiconductor Equipment Associates, Inc.(a) | | | 11,232,000 |
| | | | |
|
|
| | | | | | 110,726,600 |
| | | | |
|
|
| | | UTILITIES — 1.62% |
| 350,000 | | Aqua America, Inc. | | | 9,737,000 |
| | | | |
|
|
| | | TOTAL COMMON STOCKS (Cost $402,404,879) | | | 593,193,100 |
| | | | |
|
|
See Notes to Financial Statements.
25
Excelsior Funds, Inc.
Portfolio of Investments — March 31, 2006
Small Cap Fund — (continued)
| | | | | |
| | | | | | |
Principal
Amount
| | | | Value
|
| REPURCHASE AGREEMENT — 0.96% | | |
| $5,752,000 | | JP Morgan Chase Securities, Inc., 3.40%, dated 03/31/06, to be repurchased 04/03/06, repurchase price $5,753,630 (collateralized by U.S. Treasury Note, par value $4,309,000, 8.125%, maturing 08/15/21; total market value $5,794,552) | | $ | 5,752,000 |
| | | | |
|
|
| | | TOTAL REPURCHASE AGREEMENT
(Cost $5,752,000) | | | 5,752,000 |
| | | | |
|
|
| | | | | | |
TOTAL INVESTMENTS (Cost $408,156,879)(b) | | 99.93 | % | | $ | 598,945,100 |
OTHER ASSETS IN EXCESS OF LIABILITIES | | 0.07 | | | | 445,094 |
| | |
|
| |
|
|
NET ASSETS | | 100.00 | % | | $ | 599,390,194 |
| | |
|
| |
|
|
| (a) | Non-income producing security |
| (b) | Unrealized appreciation (depreciation) of securities: |
| | | | | | | |
Unrealized Appreciation
| | Unrealized (Depreciation)
| | | Net Unrealized Appreciation/
(Depreciation)
|
| $191,568,402 | | $ | (780,181 | ) | | $ | 190,788,221 |
The summary of the Fund’s investments as of March 31, 2006 is as follows: (Unaudited)
| | | | | | |
Sector Diversification
| | % of
Net
Assets
| | | Value
|
Industrials | | 20.65 | % | | $ | 123,702,000 |
Technology | | 18.48 | | | | 110,726,600 |
Information Technology | | 16.05 | | | | 96,205,000 |
Consumer Discretionary | | 14.35 | | | | 86,008,600 |
Financial | | 10.38 | | | | 62,228,500 |
Health Care | | 6.83 | | | | 40,965,200 |
Energy | | 5.54 | | | | 33,218,000 |
Raw/Intermediate Materials | | 3.09 | | | | 18,550,000 |
Consumer Staples | | 1.98 | | | | 11,852,200 |
Utilities | | 1.62 | | | | 9,737,000 |
Repurchase Agreement | | 0.96 | | | | 5,752,000 |
| | |
|
| |
|
|
Total Investments | | 99.93 | % | | $ | 598,945,100 |
Other Assets in Excess of Liabilities | | 0.07 | | | | 445,094 |
| | |
|
| |
|
|
Net Assets | | 100.00 | % | | $ | 599,390,194 |
| | |
|
| |
|
|
See Notes to Financial Statements.
26
Excelsior Funds, Inc.
Portfolio of Investments — March 31, 2006
Value and Restructuring Fund
| | | | | |
| | | | | | |
Shares
| | | | Value
|
| COMMON STOCKS — 95.72% | | |
| | | CONSUMER DISCRETIONARY — 16.31% |
| 1,700,000 | | Avon Products, Inc. | | $ | 52,989,000 |
| 2,150,000 | | Black & Decker Corp. | | | 186,813,500 |
| 2,400,000 | | CBS Corp., Class B | | | 57,552,000 |
| 2,750,000 | | Centex Corp. | | | 170,472,500 |
| 1,800,000 | | EchoStar Communications, Inc.(a) | | | 53,766,000 |
| 1,000,000 | | Harman International Industries, Inc. | | | 111,130,000 |
| 2,000,000 | | Interpublic Group of Companies, Inc.(a)(b) | | | 19,120,000 |
| 2,100,000 | | Leggett & Platt, Inc. | | | 51,177,000 |
| 2,000,000 | | Liberty Media Corp., Class A(a) | | | 16,420,000 |
| 714,340 | | Morgans Hotel Group(a) | | | 12,615,244 |
| 2,600,000 | | Newell Rubbermaid, Inc. | | | 65,494,000 |
| 2,750,000 | | TJX Cos., Inc. | | | 68,255,000 |
| 5,750,000 | | XM Satellite Radio Holdings, Inc., Class A(a) | | | 128,052,500 |
| 2,250,000 | | Zale Corp.(a) | | | 63,067,500 |
| | | | |
|
|
| | | | | | 1,056,924,244 |
| | | | |
|
|
| | | CONSUMER STAPLES — 4.00% | | |
| 1,750,000 | | ConAgra Foods, Inc. | | | 37,555,000 |
| 2,475,000 | | Dean Foods Co.(a) | | | 96,104,250 |
| 1,000,000 | | Kraft Foods, Inc., Class A | | | 30,310,000 |
| 2,010,000 | | Loews Corp. - Carolina Group | | | 95,012,700 |
| | | | |
|
|
| | | | | | 258,981,950 |
| | | | |
|
|
| | | ENERGY — 13.35% | | |
| 1,650,000 | | Burlington Resources, Inc. | | | 151,651,500 |
| 1,450,000 | | ConocoPhillips | | | 91,567,500 |
| 2,250,000 | | Devon Energy Corp.(b) | | | 137,632,500 |
| 1,500,000 | | Mariner Energy, Inc.(a) | | | 30,765,000 |
| 2,000,000 | | Noble Energy, Inc. | | | 87,840,000 |
| 1,775,000 | | Petrobras ADR | | | 153,839,250 |
| 2,000,000 | | Petrohawk Energy Corp.(a) | | | 27,400,000 |
| 2,900,000 | | Rossetta Resources, Inc.(a) | | | 52,084,000 |
| 1,900,000 | | Todco, Class A | | | 74,879,000 |
| 1,425,000 | | W&T Offshore, Inc. | | | 57,441,750 |
| | | | |
|
|
| | | | | | 865,100,500 |
| | | | |
|
|
| | | FINANCIAL — 18.00% | | |
| 2,000,000 | | Ace Ltd. | | | 104,020,000 |
| 2,800,000 | | Amvescap plc ADR | | | 52,808,000 |
| 2,250,000 | | Apollo Investment Corp.(c) | | | 40,072,500 |
| | | | | |
| | | | | | |
Shares
| | | | Value
|
| COMMON STOCKS — (continued) | | |
| | | FINANCIAL — (continued) | | |
| 1,889,800 | | Castlepoint Holdings Ltd. ADR(a)(d) | | $ | 18,898,000 |
| 900,000 | | CIT Group, Inc. | | | 48,168,000 |
| 2,125,000 | | Citigroup, Inc. | | | 100,385,000 |
| 2,500,000 | | Doral Financial Corp. | | | 28,875,000 |
| 1,350,000 | | Freddie Mac | | | 82,350,000 |
| 1,850,000 | | JP Morgan Chase & Co. | | | 77,034,000 |
| 675,000 | | Lehman Brothers Holding, Inc. | | | 97,557,750 |
| 750,000 | | Loews Corp. | | | 75,900,000 |
| 2,250,000 | | Marsh & McLennan Cos., Inc. | | | 66,060,000 |
| 3,000,000 | | MCG Capital Corp. | | | 42,330,000 |
| 1,675,000 | | Metlife, Inc. | | | 81,019,750 |
| 1,800,000 | | Morgan Stanley | | | 113,076,001 |
| 900,000 | | PNC Financial Services Group, Inc. | | | 60,579,000 |
| 2,650,000 | | Primus Guaranty Ltd.(a) | | | 29,547,500 |
| 1,150,000 | | Washington Mutual, Inc. | | | 49,013,000 |
| | | | |
|
|
| | | | | | 1,167,693,501 |
| | | | |
|
|
| | | HEALTH CARE — 4.68% | | |
| 1,800,000 | | AmerisourceBergen Corp. | | | 86,886,000 |
| 2,225,000 | | Baxter International, Inc. | | | 86,352,250 |
| 1,350,000 | | Bristol-Myers Squibb Co. | | | 33,223,500 |
| 1,350,000 | | HCA, Inc. | | | 61,816,500 |
| 725,000 | | Wyeth | | | 35,177,000 |
| | | | |
|
|
| | | | | | 303,455,250 |
| | | | |
|
|
| | | INDUSTRIALS — 12.60% | | |
| 2,725,000 | | AGCO Corp.(a) | | | 56,516,500 |
| 900,000 | | Aries Maritime Transport Ltd. | | | 12,573,000 |
| 925,000 | | Arlington Tankers | | | 21,275,000 |
| 3,500,000 | | Cendant Corp. | | | 60,725,000 |
| 1,000,000 | | Copa Holdings S.A., Class A(a) | | | 22,850,000 |
| 1,350,000 | | Deluxe Corp. | | | 35,329,500 |
| 2,050,000 | | Empresa Brasileira de Aeronautica S.A. ADR | | | 75,542,500 |
| 3,000,000 | | Gol Linhas Aereas Inteligentes S.A. ADR | | | 80,400,000 |
| 1,550,000 | | Ryder Systems, Inc. | | | 69,409,000 |
| 2,600,000 | | Tyco International Ltd. | | | 69,888,000 |
| 1,200,000 | | Union Pacific Corp. | | | 112,020,000 |
| 3,500,000 | | United Rentals, Inc.(a) | | | 120,750,000 |
| 1,375,000 | | United Technologies Corp. | | | 79,708,750 |
| | | | |
|
|
| | | | | | 816,987,250 |
| | | | |
|
|
See Notes to Financial Statements.
27
Excelsior Funds, Inc.
Portfolio of Investments — March 31, 2006
Value and Restructuring Fund — (continued)
| | | | | |
| | | | | | |
Shares
| | | | Value
|
| COMMON STOCKS — (continued) | | |
| | | INFORMATION TECHNOLOGY — 5.38% |
| 3,600,000 | | Harris Corp. | | $ | 170,244,000 |
| 725,000 | | International Business Machines Corp. | | | 59,790,750 |
| 3,000,000 | | Nokia Oyj ADR | | | 62,160,000 |
| 1,600,000 | | Plantronics, Inc. | | | 56,688,000 |
| | | | |
|
|
| | | | | | 348,882,750 |
| | | | |
|
|
| | | RAW/INTERMEDIATE MATERIALS — 11.95% |
| 2,000,000 | | Alpha Natural Resources, Inc.(a) | | | 46,280,000 |
| 2,950,000 | | Celanese Corp., Class A | | | 61,861,500 |
| 2,200,000 | | CF Industries Holdings, Inc. | | | 37,378,000 |
| 1,075,000 | | CNX Gas Corp.(a) | | | 27,950,000 |
| 2,175,000 | | Consol Energy, Inc. | | | 161,298,000 |
| 825,000 | | Eagle Materials, Inc., Class B | | | 52,626,750 |
| 1,450,000 | | Foundation Coal Holdings, Inc. | | | 59,653,000 |
| 3,100,000 | | International Coal Group, Inc.(a) | | | 30,194,000 |
| 1,182,694 | | Lafarge Corp. | | | 99,346,296 |
| 944,900 | | Pinnacle Gas Resources, Inc.(a)(d) | | | 10,393,900 |
| 1,275,000 | | PPG Industries, Inc. | | | 80,771,250 |
| 850,000 | | Southern Copper Corp. | | | 71,808,000 |
| 2,050,000 | | Tronox, Inc. | | | 34,768,000 |
| | | | |
|
|
| | | | | | 774,328,696 |
| | | | |
|
|
| | | REAL ESTATE — 2.83% | | |
| 3,275,715 | | Diamondrock Hospitality Co. | | | 45,237,624 |
| 1,200,000 | | Fieldstone Investment Corp. | | | 14,160,000 |
| 2,900,000 | | Friedman Billings Ramsey Group, Inc., Class A | | | 27,202,000 |
| 1,700,000 | | Host Marriott Corp. | | | 36,380,000 |
| 2,000,000 | | Peoples Choice Financial Corp.(a)(d) | | | 11,000,000 |
| 600,000 | | Taberna Realty Finance Trust(d) | | | 7,950,000 |
| 850,000 | | Ventas, Inc. | | | 28,203,000 |
| 1,500,000 | | Vintage Wine Trust, Inc.(d) | | | 13,500,000 |
| | | | |
|
|
| | | | | | 183,632,624 |
| | | | |
|
|
| | | TELECOMMUNICATION — 4.21% |
| 5,225,000 | | America Movil S.A. de C.V., Series L ADR | | | 179,008,500 |
| 2,408,254 | | Sprint Nextel Corp. | | | 62,229,283 |
| | | | | |
| | | | | | |
Shares
| | | | Value
|
| COMMON STOCKS — (continued) | | |
| | | TELECOMMUNICATION — (continued) |
| 2,400,000 | | Valor Communications, Inc. | | $ | 31,584,000 |
| | | | |
|
|
| | | | | | 272,821,783 |
| | | | |
|
|
| | | UTILITIES — 2.41% | | |
| 1,300,000 | | Centerpoint Energy, Inc. | | | 15,509,000 |
| 1,325,000 | | Duke Energy Corp. | | | 38,623,750 |
| 5,000,000 | | EL Paso Corp. | | | 60,250,000 |
| 649,275 | | Public Service Enterprise Group, Inc. | | | 41,579,571 |
| | | | |
|
|
| | | | | | 155,962,321 |
| | | | |
|
|
| | | TOTAL COMMON STOCKS (Cost $4,103,263,208) | | | 6,204,770,869 |
| | | | |
|
|
| FOREIGN COMMON STOCKS — 1.47% | | |
| | | GERMANY — 0.82% | | |
| 1,400,000 | | Lanxess AG(a) | | | 52,774,176 |
| | | | |
|
|
| | | ITALY — 0.65% | | |
| 5,000,000 | | Enel S.p.A | | | 42,254,747 |
| | | | |
|
|
| | | TOTAL FOREIGN COMMON STOCKS
(Cost $75,072,487) | | | 95,028,923 |
| | | | |
|
|
| CONVERTIBLE PREFERRED STOCKS — 1.02% |
| | | CONSUMER DISCRETIONARY — 0.79% |
| 1,700,000 | | Ford Motor Co. Capital Trust II, Preferred Exchange, 6.50% | | | 51,085,000 |
| | | | |
|
|
| | | RAW/INTERMEDIATE MATERIALS — 0.23% |
| 500,000 | | Celanese Corp., Preferred Exchange, 4.25% | | | 15,125,000 |
| | | | |
|
|
| | | TOTAL CONVERTIBLE PREFERRED STOCKS
(Cost $79,293,818) | | | 66,210,000 |
| | | | |
|
|
See Notes to Financial Statements.
28
Excelsior Funds, Inc.
Portfolio of Investments — March 31, 2006
Value and Restructuring Fund — (continued)
| | | | | |
| | | | | | |
Principal
Amount
| | | | Value
|
| REPURCHASE AGREEMENT — 2.48% | | |
| $160,785,000 | | JP Morgan Chase Securities, Inc., 3.40%, dated 03/31/06, to be repurchased 04/03/06, repurchase price $160,830,556 (collateralized by U.S. Treasury Note, par value $120,438,000, 8.125%, maturing 08/15/21; total market value $161,974,138) | | $ | 160,785,000 |
| | | | |
|
|
| | | TOTAL REPURCHASE AGREEMENT
(Cost $160,785,000) | | | 160,785,000 |
| | | | |
|
|
| | | | | | | |
TOTAL INVESTMENTS
(Cost $4,418,414,513)(e) | | 100.69 | % | | $ | 6,526,794,792 | |
LIABILITIES IN EXCESS OF OTHER ASSETS | | (0.69 | ) | | | (44,777,900 | ) |
| | |
|
| |
|
|
|
NET ASSETS | | 100.00 | % | | $ | 6,482,016,892 | |
| | |
|
| |
|
|
|
| (a) | Non-income producing security. |
| (b) | All or part of the security is segregated by the Fund’s custodian to cover future purchase commitments. |
| (c) | Registered Investment Company |
| (d) | Security exempt from registration under Rule 144A of the Securities Act of 1933. This security may be resold in transactions exempt from registration, normally to qualified institutional buyers. At March 31, 2006, these securities amounted to $61,741,900 or 0.95% of net assets. |
| (e) | Unrealized appreciation (depreciation) of securities: |
| | | | |
Unrealized
Appreciation
| | Unrealized
(Depreciation)
| | Net
Unrealized
Appreciation/
(Depreciation)
|
| $2,228,495,581 | | $(120,115,302) | | $2,108,380,279 |
ADR—American Depository Receipt
Ltd.—Limited
plc—public limited company
| | | | | |
Contracts
| | | | Value
| |
| CALL OPTIONS WRITTEN — 0.00% | |
| (4,468) | | Devon Energy, Expires 04/25/06, strike price 70 (Premiums received $1,760,972) | | $ (22,340 | ) |
| | | | |
|
|
See Notes to Financial Statements.
29
Excelsior Funds, Inc.
Portfolio of Investments — March 31, 2006
Value and Restructuring Fund — (continued)
The summary of the Fund’s investments as of March 31, 2006 is as follows: (Unaudited)
| | | | | | | |
Sector Diversification
| | % of
Net
Assets
| | | Value
| |
Financial | | 18.00 | % | | $ | 1,167,693,501 | |
Consumer Discretionary | | 17.10 | | | | 1,108,009,244 | |
Industrials | | 13.42 | | | | 869,761,426 | |
Energy | | 13.35 | | | | 865,100,500 | |
Raw/Intermediate Materials | | 12.18 | | | | 789,453,696 | |
Information Technology | | 5.38 | | | | 348,882,750 | |
Health Care | | 4.68 | | | | 303,455,250 | |
Telecommunication | | 4.21 | | | | 272,821,783 | |
Consumer Staples | | 4.00 | | | | 258,981,950 | |
Utilities | | 3.06 | | | | 198,217,068 | |
Real Estate | | 2.83 | | | | 183,632,624 | |
Repurchase Agreement | | 2.48 | | | | 160,785,000 | |
| | |
|
| |
|
|
|
Total Investments | | 100.69 | % | | $ | 6,526,794,792 | |
Liabilities in Excess of Other Assets | | (0.69 | ) | | | (44,777,900 | ) |
| | |
|
| |
|
|
|
Net Assets | | 100.00 | % | | $ | 6,482,016,892 | |
| | |
|
| |
|
|
|
See Notes to Financial Statements.
30
[THIS PAGE INTENTIONALLY LEFT BLANK]
Excelsior Funds
Statements of Assets and Liabilities
March 31, 2006
| | | | | | | | |
| | |
| | | Core
Bond Fund
| | | Equity
Income
Fund
| |
ASSETS: | | | | | | | | |
Investments, at cost — see accompanying portfolios | | $ | 281,602,078 | | | $ | 180,383,237 | |
| | |
|
|
| |
|
|
|
Investments, at value (including Repurchase Agreements) (Note 1) | | $ | 276,970,866 | | | $ | 205,184,581 | |
Cash | | | 55,120 | | | | — | |
Foreign currency (cost $0, $0, $0, $0, $0, $479) | | | — | | | | — | |
Dividends and interest receivable | | | 2,035,637 | | | | 574,018 | |
Receivable for investments sold | | | 23,572,035 | | | | 1,931,868 | |
Receivable for fund shares sold | | | 1,379,977 | | | | 318,086 | |
Receivable for forward foreign currency contracts | | | — | | | | 70 | |
Reclaims receivable | | | — | | | | 8,406 | |
Prepaid expenses and other assets | | | 10,629 | | | | 6,313 | |
| | |
|
|
| |
|
|
|
Total Assets | | | 304,024,264 | | | | 208,023,342 | |
| | |
|
|
| |
|
|
|
LIABILITIES: | | | | | | | | |
Payable for dividends declared | | | 1,033,843 | | | | — | |
Payable for investments purchased | | | 19,196,094 | | | | 112,270 | |
Options written, at value (Premiums received: Value and Restructuring Fund — $1,760,972) | | | — | | | | — | |
Cash overdraft | | | — | | | | 1,540,026 | |
Payable for fund shares redeemed | | | 514,125 | | | | 254,910 | |
Investment advisory fees payable (Note 2) | | | 40,687 | | | | 111,630 | |
Administration fees payable (Note 2) | | | 36,260 | | | | 26,922 | |
Distribution and shareholder servicing fees payable (Note 2) | | | 87,672 | | | | 47,598 | |
Directors’/Trustees’ fees and expenses payable (Note 2) | | | 213 | | | | 99 | |
Accrued expenses and other payables | | | 99,445 | | | | 75,908 | |
| | |
|
|
| |
|
|
|
Total Liabilities | | | 21,008,339 | | | | 2,169,363 | |
| | |
|
|
| |
|
|
|
NET ASSETS | | $ | 283,015,925 | | | $ | 205,853,979 | |
| | |
|
|
| |
|
|
|
NET ASSETS consist of: | | | | | | | | |
Undistributed (distributions in excess of) net investment income | | $ | 2,407 | | | $ | 1,253,478 | |
Accumulated net realized gain (loss) on investments, foreign currency transactions and written options | | | (529,099 | ) | | | (6,315,974 | ) |
Unrealized appreciation of investments, foreign currency translations and written options | | | (4,631,212 | ) | | | 24,801,415 | |
Par value (Note 5) | | | 32,015 | | | | 24,054 | |
Paid in capital in excess of par value | | | 288,141,814 | | | | 186,091,006 | |
| | |
|
|
| |
|
|
|
Net Assets | | $ | 283,015,925 | | | $ | 205,853,979 | |
| | |
|
|
| |
|
|
|
Net Assets: | | | | | | | | |
Retirement Shares | | $ | 1,015 | | | $ | 1,019 | |
Shares | | | 281,766,940 | | | | 205,852,960 | |
Institutional Shares | | | 1,247,970 | | | | — | |
Shares outstanding (Note 5): | | | | | | | | |
Retirement Shares | | | 115 | | | | 119 | |
Shares | | | 31,873,492 | | | | 24,053,800 | |
Institutional Shares | | | 141,213 | | | | — | |
NET ASSET VALUE PER SHARE (net assets/shares outstanding): | | | | | | | | |
Retirement Shares | | | $8.85 | (a) | | | $8.59 | (a) |
| | |
|
|
| |
|
|
|
Shares | | | $8.84 | | | | $8.56 | |
| | |
|
|
| |
|
|
|
Institutional Shares | | | $8.84 | | | | — | |
| | |
|
|
| |
|
|
|
| (a) | | Due to rounding net assets divided by shares outstanding does not equal the net asset value per share. |
See Notes to Financial Statements.
32
| | | | | | | | | | | | | | |
| | | |
Large Cap
Growth
Fund
| | | Mid Cap Value
and Restructuring
Fund
| | | Small
Cap Fund
| | | Value and
Restructuring
Fund
| |
| | | | | | | | | | | | | | | |
| $ | 480,566,594 | | | $ | 214,039,456 | | | $ | 408,156,879 | | | $ | 4,418,414,513 | |
|
|
| |
|
|
| |
|
|
| |
|
|
|
| $ | 566,812,254 | | | $ | 339,377,101 | | | $ | 598,945,100 | | | $ | 6,526,794,792 | |
| | — | | | | 16,220 | | | | 212 | | | | 44,798 | |
| | — | | | | — | | | | — | | | | 474 | |
| | 3,491 | | | | 255,748 | | | | 22,943 | | | | 10,435,336 | |
| | — | | | | 530,468 | | | | — | | | | 13,806,049 | |
| | 7,395,467 | | | | 222,171 | | | | 3,510,602 | | | | 26,327,086 | |
| | — | | | | — | | | | — | | | | — | |
| | — | | | | — | | | | — | | | | — | |
| | 6,785 | | | | 12,840 | | | | 19,360 | | | | 176,070 | |
|
|
| |
|
|
| |
|
|
| |
|
|
|
| | 574,217,997 | | | | 340,414,548 | | | | 602,498,217 | | | | 6,577,584,605 | |
|
|
| |
|
|
| |
|
|
| |
|
|
|
| | | | | | | | | | | | | | | |
| | — | | | | — | | | | — | | | | — | |
| | 7,942,955 | | | | 346,880 | | | | 2,210,059 | | | | 80,374,040 | |
|
— |
| | | — | | | | — | | | | 22,340 | |
| | 13,423,985 | | | | — | | | | — | | | | — | |
| | 63,109 | | | | 147,398 | | | | 204,301 | | | | 6,892,296 | |
| | 311,985 | | | | 184,075 | | | | 361,263 | | | | 3,196,180 | |
| | 65,988 | | | | 42,839 | | | | 72,588 | | | | 804,492 | |
| | 104,777 | | | | 72,002 | | | | 113,419 | | | | 2,907,743 | |
| | 332 | | | | 250 | | | | 411 | | | | 4,582 | |
| | 109,296 | | | | 123,978 | | | | 145,982 | | | | 1,366,040 | |
|
|
| |
|
|
| |
|
|
| |
|
|
|
| | 22,022,427 | | | | 917,422 | | | | 3,108,023 | | | | 95,567,713 | |
|
|
| |
|
|
| |
|
|
| |
|
|
|
| $ | 552,195,570 | | | $ | 339,497,126 | | | $ | 599,390,194 | | | $ | 6,482,016,892 | |
|
|
| |
|
|
| |
|
|
| |
|
|
|
| | | | | | | | | | | | | | | |
| $ | — | | | $ | — | | | $ | — | | | $ | 19,146,231 | |
| | | | | | | | | | | | | | | |
| | (135,908,141 | ) | | | (1,981,324 | ) | | | 18,575,511 | | | | (147,509,706 | ) |
| | 86,245,660 | | | | 125,337,645 | | | | 190,788,221 | | | | 2,110,118,905 | |
| | 55,738 | | | | 173 | | | | 31,165 | | | | 126,227 | |
| | 601,802,313 | | | | 216,140,632 | | | | 389,995,297 | | | | 4,500,135,235 | |
|
|
| |
|
|
| |
|
|
| |
|
|
|
| $ | 552,195,570 | | | $ | 339,497,126 | | | $ | 599,390,194 | | | $ | 6,482,016,892 | |
|
|
| |
|
|
| |
|
|
| |
|
|
|
| | | | | | | | | | | | | | | |
| $ | 1,199 | | | $ | 1,131 | | | $ | 1,204 | | | $ | 895,867 | |
| | 552,194,371 | | | | 237,531,224 | | | | 599,388,990 | | | | 6,230,753,829 | |
| | — | | | | 101,964,771 | | | | — | | | | 250,367,196 | |
| | | | | | | | | | | | | | | |
| | 122 | | | | 58 | | | | 63 | | | | 18,152 | |
| | 55,738,243 | | | | 12,094,786 | | | | 31,165,107 | | | | 126,226,771 | |
| | — | | | | 5,179,373 | | | | — | | | | 5,071,900 | |
| | | | | | | | | | | | | | | |
| | $9.82 | (a) | | | $19.62 | (a) | | | $19.12 | (a) | | | $49.35 | |
|
|
| |
|
|
| |
|
|
| |
|
|
|
| | $9.91 | | | | $19.64 | | | | $19.23 | | | | $49.36 | |
|
|
| |
|
|
| |
|
|
| |
|
|
|
| | — | | | | $19.69 | | | | — | | | | $49.36 | |
|
|
| |
|
|
| |
|
|
| |
|
|
|
See Notes to Financial Statements.
33
Excelsior Funds
Statements of Operations
For the Year Ended March 31, 2006
| | | | | | | | |
| | |
| | | Core
Bond Fund
| | | Equity
Income
Fund
| |
INVESTMENT INCOME: | | | | | | | | |
Dividend income | | $ | 363,045 | | | $ | 7,388,134 | |
Interest income | | | 11,931,800 | | | | 107,923 | |
Less: Foreign taxes withheld | | | — | | | | (79,987 | ) |
| | |
|
|
| |
|
|
|
Total Income | | | 12,294,845 | | | | 7,416,070 | |
EXPENSES: | | | | | | | | |
Investment advisory fees (Note 2) | | | 1,861,068 | | | | 1,602,621 | |
Distribution and shareholder servicing fees — Retirement Shares (Note 2) | | | 8 | | | | 8 | |
Shareholder servicing fees — Shares (Note 2) | | | 619,871 | | | | 534,204 | |
Shareholder servicing fees — Institutional Shares (Note 2) | | | — | | | | — | |
Administration fees (Note 2) | | | 374,736 | | | | 322,704 | |
Transfer agent fees | | | 115,087 | | | | 22,944 | |
Legal and audit fees | | | 21,339 | | | | 43,474 | |
Custodian fees | | | 31,771 | | | | 12,353 | |
Directors’/Trustees’ fees and expenses (Note 2) | | | 10,076 | | | | 9,042 | |
Miscellaneous expenses | | | 186,792 | | | | 63,034 | |
| | |
|
|
| |
|
|
|
Total Expenses | | | 3,220,748 | | | | 2,610,384 | |
Fees waived and reimbursed by: Investment Adviser (Note 2) | | | (987,738 | ) | | | (342,433 | ) |
| | |
|
|
| |
|
|
|
Net Expenses | | | 2,233,010 | | | | 2,267,951 | |
| | |
|
|
| |
|
|
|
NET INVESTMENT INCOME (LOSS) | | | 10,061,835 | | | | 5,148,119 | |
| | |
|
|
| |
|
|
|
REALIZED AND UNREALIZED GAIN (LOSS) ON INVESTMENTS (NOTE 1): | | | | | | | | |
Net realized gain (loss) on: | | | | | | | | |
Security transactions | | | 1,284,930 | | | | (5,659,467 | ) |
Foreign currency transactions | | | — | | | | 1,370 | |
Written options | | | — | | | | (17,851 | ) |
| | |
|
|
| |
|
|
|
Total net realized gain (loss) | | | 1,284,930 | | | | (5,675,948 | ) |
Change in unrealized appreciation (depreciation) of investments, foreign currency translations and written options during the year | | | (7,274,735 | ) | | | 10,334,632 | |
| | |
|
|
| |
|
|
|
Net realized and unrealized gain (loss) on investments, foreign currency transactions and written options | | | (5,989,805 | ) | | | 4,658,684 | |
| | |
|
|
| |
|
|
|
Net increase in net assets resulting from operations | | $ | 4,072,030 | | | $ | 9,806,803 | |
| | |
|
|
| |
|
|
|
See Notes to Financial Statements.
34
| | | | | | | | | | | | | | |
| | | | |
Large Cap
Growth
Fund
| | | Mid Cap Value
and Restructuring
Fund
| | | Small
Cap
Fund
| | | Value and
Restructuring
Fund
| |
| | | | | | | | | | | | | | | |
| $ | 1,423,153 | | | $ | 3,495,855 | | | $ | 2,249,188 | | | $ | 115,976,766 | |
| | 582,033 | | | | 95,298 | | | | 87,180 | | | | 2,934,780 | |
| | (36,685 | ) | | | (41,289 | ) | | | — | | | | (898,879 | ) |
|
|
| |
|
|
| |
|
|
| |
|
|
|
| | 1,968,501 | | | | 3,549,864 | | | | 2,336,368 | | | | 118,012,667 | |
| | | | | | | | | | | | | | | |
| | 2,350,713 | | | | 2,000,968 | | | | 3,314,855 | | | | 31,707,572 | |
| | 9 | | | | 8 | | | | 8 | | | | 1,294 | |
| | 775,681 | | | | 551,305 | | | | 1,295,704 | | | | 12,044,609 | |
| | — | | | | 502 | | | | — | | | | 59,719 | |
| | 473,303 | | | | 464,898 | | | | 782,944 | | | | 7,980,571 | |
| | 76,636 | | | | 80,649 | | | | 93,465 | | | | 1,377,590 | |
| | 37,580 | | | | 46,582 | | | | 69,298 | | | | 339,880 | |
| | 22,461 | | | | 29,585 | | | | 42,512 | | | | 296,791 | |
| | 10,901 | | | | 13,040 | | | | 21,989 | | | | 214,586 | |
| | 96,442 | | | | 87,414 | | | | 126,940 | | | | 1,221,691 | |
|
|
| |
|
|
| |
|
|
| |
|
|
|
| | 3,843,726 | | | | 3,274,951 | | | | 5,747,715 | | | | 55,244,303 | |
| | (383,210 | ) | | | (11,769 | ) | | | (95,946 | ) | | | — | |
|
|
| |
|
|
| |
|
|
| |
|
|
|
| | 3,460,516 | | | | 3,263,182 | | | | 5,651,769 | | | | 55,244,303 | |
|
|
| |
|
|
| |
|
|
| |
|
|
|
| | (1,492,015 | ) | | | 286,682 | | | | (3,315,401 | ) | | | 62,768,364 | |
|
|
| |
|
|
| |
|
|
| |
|
|
|
| | | | | | | | | | | | | | | |
| | | | | | | | | | | | | | | |
| | 3,004,935 | | | | (1,834,984 | ) | | | 29,148,540 | | | | 25,954,026 | |
| | — | | | | 737 | | | | — | | | | (55,500 | ) |
| | — | | | | — | | | | — | | | | (7,456,185 | ) |
|
|
| |
|
|
| |
|
|
| |
|
|
|
| | 3,004,935 | | | | (1,834,247 | ) | | | 29,148,540 | | | | 18,442,341 | |
| | | | | | | | | | | | | | | |
| | 59,460,912 | | | | 51,686,678 | | | | 96,294,626 | | | | 892,712,062 | |
|
|
| |
|
|
| |
|
|
| |
|
|
|
| | | | | | | | | | | | | | | |
| | 62,465,847 | | | | 49,852,431 | | | | 125,443,166 | | | | 911,154,403 | |
|
|
| |
|
|
| |
|
|
| |
|
|
|
| $ | 60,973,832 | | | $ | 50,139,113 | | | $ | 122,127,765 | | | $ | 973,922,767 | |
|
|
| |
|
|
| |
|
|
| |
|
|
|
See Notes to Financial Statements.
35
Excelsior Funds
Statements of Changes in Net Assets
| | | | | | | | | | | | | | | | |
| | |
| | | Core Bond Fund
| | |
Equity Income Fund
| |
| | | Year Ended March 31,
| �� | | Year Ended March 31,
| |
| | | 2006
| | | 2005
| | | 2006
| | | 2005
| |
Net investment income (loss) | | $ | 10,061,835 | | | $ | 10,538,687 | | | $ | 5,148,119 | | | $ | 3,412,422 | |
Net realized gain (loss) on investments and foreign currency transactions | | | 1,284,930 | | | | 3,809,789 | | | | (5,658,097 | ) | | | (44,381 | ) |
Net realized gain (loss) on written options | | | — | | | | — | | | | (17,851 | ) | | | — | |
Change in unrealized appreciation (depreciation) of investments, foreign currency translations and written options during the year | | | (7,274,735 | ) | | | (9,984,664 | ) | | | 10,334,632 | | | | 11,960,531 | |
| | |
|
|
| |
|
|
| |
|
|
| |
|
|
|
Net increase in net assets resulting from operations | | | 4,072,030 | | | | 4,363,812 | | | | 9,806,803 | | | | 15,328,572 | |
| | |
|
|
| |
|
|
| |
|
|
| |
|
|
|
Distributions to shareholders: | | | | | | | | | | | | | | | | |
From net investment income | | | | | | | | | | | | | | | | |
Retirement Shares | | | (38 | ) | | | (4 | ) | | | (18 | ) | | | — | |
Shares | | | (10,218,978 | ) | | | (10,706,658 | ) | | | (4,741,203 | ) | | | (3,002,218 | ) |
Institutional Shares | | | (6,254 | ) | | | — | | | | — | | | | — | |
From net realized gain on investments | | | | | | | | | | | | | | | | |
Retirement shares | | | (13 | ) | | | — | | | | (3 | ) | | | — | |
Shares | | | (3,571,500 | ) | | | (1,392,832 | ) | | | (591,743 | ) | | | (358,338 | ) |
Institutional Shares | | | (13 | ) | | | — | | | | — | | | | — | |
| | |
|
|
| |
|
|
| |
|
|
| |
|
|
|
Total distributions | | | (13,796,796 | ) | | | (12,099,494 | ) | | | (5,332,967 | ) | | | (3,360,556 | ) |
| | |
|
|
| |
|
|
| |
|
|
| |
|
|
|
Increase (decrease) in net assets from fund share transactions (Note 5) | | | 80,807,705 | | | | (49,358,178 | ) | | | 5,710,595 | | | | 83,677,181 | |
| | |
|
|
| |
|
|
| |
|
|
| |
|
|
|
Net increase (decrease) in net assets | | | 71,082,939 | | | | (57,093,860 | ) | | | 10,184,431 | | | | 95,645,197 | |
| | |
|
|
| |
|
|
| |
|
|
| |
|
|
|
NET ASSETS: | | | | | | | | | | | | | | | | |
Beginning of year | | | 211,932,986 | | | | 269,026,846 | | | | 195,669,548 | | | | 100,024,351 | |
| | |
|
|
| |
|
|
| |
|
|
| |
|
|
|
End of year(1) | | $ | 283,015,925 | | | $ | 211,932,986 | | | $ | 205,853,979 | | | $ | 195,669,548 | |
| | |
|
|
| |
|
|
| |
|
|
| |
|
|
|
| | | | | | | | | | | | | | | | |
(1) Including undistributed (distributions in excess of) net investment income | | $ | 2,407 | | | $ | 9,744 | | | $ | 1,253,478 | | | $ | 844,970 | |
| | |
|
|
| |
|
|
| |
|
|
| |
|
|
|
See Notes to Financial Statements.
36
| | | | | | | | | | | | | | | | | | | | | | | | | | | | | | |
| | | |
Large Cap Growth Fund
| | | Mid Cap Value
and Restructuring Fund
| | | Small Cap Fund
| | | Value and Restructuring Fund
| |
Year Ended March 31,
| | | Year Ended March 31,
| | | Year Ended March 31,
| | | Year Ended March 31,
| |
2006
| | | 2005
| | | 2006
| | | 2005
| | | 2006
| | | 2005
| | | 2006
| | | 2005
| |
| $ | (1,492,015 | ) | | $ | (953,709 | ) | | $ | 286,682 | | | $ | 4,522,387 | | | $ | (3,315,401 | ) | | $ | (2,842,605 | ) | | $ | 62,768,364 | | | $ | 33,469,906 | |
|
3,004,935 |
| | | (480,165 | ) | | | (1,834,247 | ) | | | 12,485,605 | | | | 29,148,540 | | | | 31,179,377 | | | | 25,898,526 | | | | 25,789,954 | |
| | — | | | | — | | | | — | | | | — | | | | — | | | | — | | | | (7,456,185 | ) | | | 2,015,708 | |
|
59,460,912 |
| | | 7,803,728 | | | | 51,686,678 | | | | 10,433,850 | | | | 96,294,626 | | | | 15,666,672 | | | | 892,712,062 | | | | 348,650,183 | |
|
|
| |
|
|
| |
|
|
| |
|
|
| |
|
|
| |
|
|
| |
|
|
| |
|
|
|
| | 60,973,832 | | | | 6,369,854 | | | | 50,139,113 | | | | 27,441,842 | | | | 122,127,765 | | | | 44,003,444 | | | | 973,922,767 | | | | 409,925,751 | |
|
|
| |
|
|
| |
|
|
| |
|
|
| |
|
|
| |
|
|
| |
|
|
| |
|
|
|
| | | | | | | | | | | | | | | | | | | | | | | | | | | | | | | |
| | | | | | | | | | | | | | | | | | | | | | | | | | | | | | | |
| | — | | | | — | | | | — | | | | — | | | | — | | | | — | | | | (1,311 | ) | | | — | |
| | — | | | | — | | | | (377,856 | ) | | | (2,985,864 | ) | | | — | | | | — | | | | (50,184,813 | ) | | | (31,399,379 | ) |
| | — | | | | — | | | | (320,565 | ) | | | (1,745,081 | ) | | | — | | | | — | | | | (2,339,479 | ) | | | (542,162 | ) |
| | | | | | | | | | | | | | | | | | | | | | | | | | | | | | | |
| | — | | | | — | | | | — | | | | — | | | | (53 | ) | | | — | | | | — | | | | — | |
| | — | | | | — | | | | — | | | | — | | | | (26,879,094 | ) | | | — | | | | — | | | | — | |
| | — | | | | — | | | | — | | | | — | | | | — | | | | — | | | | — | | | | — | |
|
|
| |
|
|
| |
|
|
| |
|
|
| |
|
|
| |
|
|
| |
|
|
| |
|
|
|
| | — | | | | — | | | | (698,421 | ) | | | (4,730,945 | ) | | | (26,879,147 | ) | | | — | | | | (52,525,603 | ) | | | (31,941,541 | ) |
|
|
| |
|
|
| |
|
|
| |
|
|
| |
|
|
| |
|
|
| |
|
|
| |
|
|
|
|
281,160,848 |
| | | 76,460,299 | | | | (6,359,254 | ) | | | (13,744,291 | ) | | | 15,919,054 | | | | 91,762,562 | | | | 930,527,802 | | | | 969,013,914 | |
|
|
| |
|
|
| |
|
|
| |
|
|
| |
|
|
| |
|
|
| |
|
|
| |
|
|
|
| | 342,134,680 | | | | 82,830,153 | | | | 43,081,438 | | | | 8,966,606 | | | | 111,167,672 | | | | 135,766,006 | | | | 1,851,924,966 | | | | 1,346,998,124 | |
|
|
| |
|
|
| |
|
|
| |
|
|
| |
|
|
| |
|
|
| |
|
|
| |
|
|
|
| | | | | | | | | | | | | | | | | | | | | | | | | | | | | | | |
| | 210,060,890 | | | | 127,230,737 | | | | 296,415,688 | | | | 287,449,082 | | | | 488,222,522 | | | | 352,456,516 | | | | 4,630,091,926 | | | | 3,283,093,802 | |
|
|
| |
|
|
| |
|
|
| |
|
|
| |
|
|
| |
|
|
| |
|
|
| |
|
|
|
| $ | 552,195,570 | | | $ | 210,060,890 | | | $ | 339,497,126 | | | $ | 296,415,688 | | | $ | 599,390,194 | | | $ | 488,222,522 | | | $ | 6,482,016,892 | | | $ | 4,630,091,926 | |
|
|
| |
|
|
| |
|
|
| |
|
|
| |
|
|
| |
|
|
| |
|
|
| |
|
|
|
| | | | | | | | | | | | | | | | | | | | | | | | | | | | | | | |
$ |
— |
| | $ | — | | | $ | — | | | $ | 388,063 | | | $ | — | | | $ | — | | | $ | 19,146,231 | | | $ | 8,690,692 | |
|
|
| |
|
|
| |
|
|
| |
|
|
| |
|
|
| |
|
|
| |
|
|
| |
|
|
|
See Notes to Financial Statements.
37
Excelsior Funds
Financial Highlights — Selected Per Share Data and Ratios
| | | | | | | | | | | | | | | | | | | | | | | |
| | | Net Asset Value,
Beginning of
Year
| | Net
Investment
Income (Loss)
| | | Net Realized and
Unrealized
Gain (Loss) of
Investments
and Options
| | | Total From
Investment
Operations
| | | Dividends
From Net
Investment
Income
| | | Distributions
From Net
Realized
Gain on
Investments
and Options
| |
CORE BOND FUND — (12/31/04*) | | | | | | | | | | | | | | | | | | | | | | | |
Retirement Shares | | | | | | | | | | | | | | | | | | | | | | | |
Year Ended March 31, 2006 | | $ | 9.16 | | $ | 0.33 | (2) | | $ | (0.19 | )(2) | | $ | 0.14 | | | $ | (0.33 | ) | | $ | (0.12 | ) |
Period Ended March 31, 2005 | | | 9.27 | | | 0.07 | (2) | | | (0.06 | )(2) | | | 0.01 | | | | (0.12 | ) | | | — | |
EQUITY INCOME FUND — (12/31/04*) | | | | | | | | | | | | | | | | | | | | |
Retirement Shares | | | | | | | | | | | | | | | | | | | | | | | |
Year Ended March 31, 2006 | | $ | 8.43 | | $ | 0.15 | (2) | | $ | 0.18 | (2) | | $ | 0.33 | | | $ | (0.15 | ) | | $ | (0.02 | ) |
Period Ended March 31, 2005 | | | 8.50 | | | — | (2)(3) | | | (0.07 | )(2) | | | (0.07 | ) | | | — | | | | — | |
LARGE CAP GROWTH FUND | | | | | | | | | | | | | | | | | | | | | | | |
Retirement Shares — (12/31/04*) | | | | | | | | | | | | | | | | | | | | | | | |
Year Ended March 31, 2006 | | $ | 8.02 | | $ | (0.11 | )(2) | | $ | 1.91 | (2) | | $ | 1.80 | | | | — | | | | — | |
Period Ended March 31, 2005 | | | 8.49 | | | (0.03 | )(2) | | | (0.44 | )(2) | | | (0.47 | ) | | | — | | | | — | |
MID CAP VALUE AND RESTRUCTURING FUND — (12/31/04*) | | | | | | | | | | | | | | | | | |
Retirement Shares | | | | | | | | | | | | | | | | | | | | | | | |
Year Ended March 31, 2006 | | $ | 16.78 | | $ | (0.06 | )(2) | | $ | 2.90 | (2) | | $ | 2.84 | | | | — | | | | — | |
Period Ended March 31, 2005 | | | 17.26 | | | (0.01 | )(2) | | | (0.47 | )(2) | | | (0.48 | ) | | | — | | | | — | |
SMALL CAP FUND — (12/31/04*) | | | | | | | | | | | | | | | | | | | | |
Retirement Shares | | | | | | | | | | | | | | | | | | | | | | | |
Year Ended March 31, 2006 | | $ | 16.12 | | $ | (0.19 | )(2) | | $ | 4.08 | (2) | | $ | 3.89 | | | | — | | | $ | (0.89 | ) |
Period Ended March 31, 2005 | | | 17.00 | | | (0.04 | )(2) | | | (0.84 | )(2) | | | (0.88 | ) | | | — | | | | — | |
VALUE AND RESTRUCTURING FUND — (12/31/04*) | | | | | | | | | | | | | | | | | |
Retirement Shares | | | | | | | | | | | | | | | | | | | | | | | |
Year Ended March 31, 2006 | | $ | 41.49 | | $ | 0.42 | (2) | | $ | 7.81 | (2) | | $ | 8.23 | | | $ | (0.37 | ) | | | — | |
Period Ended March 31, 2005 | | | 42.43 | | | (0.04 | )(2) | | | (0.90 | )(2) | | | (0.94 | ) | | | — | | | | — | |
| * | Commencement of Operations |
| (1) | Expense ratios before waiver of fees and reimbursement of expenses (if any) by adviser and administrator. |
| (2) | For comparative purposes per share amounts are based on average shares outstanding. |
| (3) | Amount represents less than $0.01 per share. |
See Notes to Financial Statements.
38
| | | | | | | | | | | | | | | | | | | | | | | |
Total
Distributions
| | | Net Asset
Value,
End of
Year
| | Total
Return
| | | Net Assets,
End of
Year
(000)
| |
Ratio of Net
Operating
Expenses
to Average
Net Assets
| | | Ratio of Gross
Operating
Expenses to
Average
Net Assets(1)
| | | Ratio of Net
Investment
Income (Loss)
to Average
Net Assets
| | | Portfolio
Turnover
Rate
| |
| | | | | | | | | | | | | | | | | | | | | | | | |
| | | | | | | | | | | | | | | | | | | | | | | | |
| $ | (0.45 | ) | | $ | 8.85 | | 1.48 | % | | $ | 1 | | 1.40 | % | | 1.78 | % | | 3.57 | % | | 95 | % |
| | (0.12 | ) | | | 9.16 | | 0.10 | %(4) | | | 1 | | 1.40 | %(5) | | 1.77 | %(5) | | 3.60 | %(5) | | 90 | % |
| | | | | | | | | | | | | | | | | | | | | | | | |
| | | | | | | | | | | | | | | | | | | | | | | | |
| $ | (0.17 | ) | | $ | 8.59 | | 4.04 | % | | $ | 1 | | 1.60 | % | | 1.84 | % | | 1.78 | % | | 46 | % |
| | — | | | | 8.43 | | (1.52 | )%(4) | | | 1 | | 1.55 | %(5) | | 1.76 | %(5) | | 0.02 | %(5) | | 19 | % |
| | | | | | | | | | | | | | | | | | | | | | | | |
| | | | | | | | | | | | | | | | | | | | | | | | |
| | — | | | $ | 9.82 | | 22.44 | % | | $ | 1 | | 1.70 | % | | 1.99 | % | | (1.20 | )% | | 24 | % |
| | — | | | | 8.02 | | (5.54 | )%(4) | | | 1 | | 1.55 | %(5) | | 1.78 | %(5) | | (1.45 | )%(5) | | 25 | % |
| | | | | | | | | | | | | | | | | | | | | | | | |
| | | | | | | | | | | | | | | | | | | | | | | | |
| | — | | | $ | 19.62 | | 16.92 | % | | $ | 1 | | 1.46 | % | | 1.46 | % | | (0.34 | )% | | 23 | % |
| | — | | | | 16.78 | | (3.01 | )%(4) | | | 1 | | 1.56 | %(5) | | 1.66 | %(5) | | (0.13 | )%(5) | | 28 | % |
| | | | | | | | | | | | | | | | | | | | | | | | |
| | | | | | | | | | | | | | | | | | | | | | | | |
| $ | (0.89 | ) | | $ | 19.12 | | 24.83 | % | | $ | 1 | | 1.56 | % | | 1.56 | % | | (1.13 | )% | | 65 | % |
| | — | | | | 16.12 | | (5.23 | )%(4) | | | 1 | | 1.55 | %(5) | | 1.58 | %(5) | | (1.28 | )%(5) | | 61 | % |
| | | | | | | | | | | | | | | | | | | | | | | | |
| | | | | | | | | | | | | | | | | | | | | | | | |
| $ | (0.37 | ) | | $ | 49.35 | | 19.95 | % | | $ | 896 | | 1.56 | % | | 1.56 | % | | 0.90 | % | | 12 | % |
| | — | | | | 41.49 | | (2.58 | )%(4) | | | 1 | | 1.57 | %(5) | | 1.59 | %(5) | | (0.35 | )%(5) | | 8 | % |
See Notes to Financial Statements.
39
EXCELSIOR FUNDS
NOTES TO FINANCIAL STATEMENTS
1. Significant Accounting Policies:
Excelsior Funds, Inc. (“Excelsior Fund”) was incorporated under the laws of the State of Maryland on August 2, 1984. Excelsior Funds Trust (the “Trust”) is a statutory trust organized under the laws of the State of Delaware on April 27, 1994. Excelsior Fund and the Trust are registered under the Investment Company Act of 1940 (the “1940 Act”), as amended as open-ended diversified management investment companies.
Excelsior Fund and the Trust currently offer shares in fifteen and seven managed investment portfolios, respectively, each having its own investment objectives and policies. The following is a summary of significant accounting policies for Core Bond Fund (formerly Managed Income Fund), Large Cap Growth Fund, Small Cap Fund and Value and Restructuring Fund, portfolios of Excelsior Fund, Equity Income Fund and Mid Cap Value and Restructuring Fund (formerly Mid Cap Value Fund), portfolios of the Trust (each a “Fund”, collectively the “Funds”). Such policies are in conformity with accounting principles generally accepted in the United States of America and are consistently followed by Excelsior Fund and the Trust in the preparation of their financial statements. The preparation of financial statements requires management to make estimates and assumptions that affect the reported amounts and disclosures in the financial statements. Actual results could differ from these estimates.
The Equity Income Fund, Large Cap Growth Fund and Small Cap Fund offer two classes of shares: Retirement Shares and Shares. The Core Bond Fund, Mid Cap Value and Restructuring Fund and Value and Restructuring Fund offer three classes of shares: Retirement Shares, Shares and Institutional Shares. The Financial Highlights of the Shares and Institutional Shares as well as the financial statements for the remaining portfolios of Excelsior Fund and the Trust are presented separately.
(a) Portfolio valuation:
Investments in securities that are traded on a recognized domestic and foreign stock exchange are valued at the last sale price on the exchange on which such securities are primarily traded or at the last quoted sale price on a national securities market. Securities traded over-the-counter are valued each business day on the basis of closing over-the-counter sale prices. Equity securities that are traded on the NASDAQ National Market System for which quotations are readily available are valued at the official closing price. Securities for which there were no transactions are valued at the last quoted sales price for the most recent day such prices were available. Securities for which market quotations are not readily available are valued in good faith at fair value pursuant to procedures adopted by the Board of Directors with regard to Excelsior Fund and the Board of Trustees with regard to the Trust. The Funds have engaged a third party fair value service provider to systematically recommend the adjustment of closing market prices of securities traded principally in foreign markets.
Short-term debt instruments that mature in 60 days or less are valued at amortized cost, which approximates market value. If available, debt securities are priced based upon valuations provided by independent, third-party pricing agents. The third-party pricing agents value debt securities at an evaluated price by employing methodologies that utilize actual market transactions, broker-supplied valuations, or other methodologies designed to identify the market value for such securities.
40
Investment valuations, other assets and liabilities initially expressed in foreign currencies are converted each business day into U.S. dollars based upon current exchange rates. Purchases and sales of foreign investments and income and expenses are converted into U.S. dollars based upon currency exchange rates prevailing on the respective dates of such transactions. The Funds do not isolate the portion of gains and losses on investment securities that is due to changes in the foreign exchange rates from that which is due to changes in market prices of such securities. The Funds report gains and losses on foreign currency related transactions as realized and unrealized gains or losses for financial reporting purposes, whereas such components are treated as ordinary income or loss for federal income tax purposes.
(b) Forward foreign currency exchange contracts:
The Funds’ participation in forward currency exchange contracts will be limited to hedging involving either specific transactions or portfolio positions. Transaction hedging involves the purchase or sale of foreign currency with respect to specific receivables or payables of a Fund generally arising in connection with the purchase or sale of its portfolio securities. Risk may arise upon entering into these contracts from the potential inability of counterparties to meet the terms of their contracts and is generally limited to the amount of unrealized gain on the contracts, if any, at the date of default. Risk may also arise from unanticipated movements in the value of foreign currency relative to the U.S. dollar. Contracts are marked to market daily and the change in market value is recorded as unrealized appreciation or depreciation. Realized gains or losses arising from such transactions are included in net realized gains or losses from foreign currency transactions.
The Equity Income Fund had the following forward foreign currency contracts outstanding as of March 31, 2006:
| | | | | | | | | | |
Settlement Dates
| | Currency to
Receive
| | | In
Exchange
For
| | | Unrealized
Appreciation
|
Foreign Currency Purchases: | | | | | | | | | | |
04/05/06 | | GBP | (79,291) | | $ | (137,816 | ) | | $ | 70 |
(c) Covered call options written:
Certain Funds may engage in writing covered call options. By writing a covered call option, a Fund forgoes the opportunity to profit from an increase in the market price of the underlying security above the exercise price, except insofar as the premium represents such a profit.
When a Fund writes an option, an amount equal to the net premium (the premium less the commission) received by that Fund is included in the liability section of that Fund’s statement of assets and liabilities as a deferred credit. The amount of the deferred credit will be subsequently marked to market to reflect the current value of the option written. The current value of the traded option is the last sale price or, in the absence of a sale, the last quoted sale price for the most recent day such price was available. If an option expires on the stipulated expiration date, or if the Fund involved enters into a closing purchase transaction, the Fund will realize a gain (or loss if the cost of a closing purchase transaction exceeds the net premium received when the option is sold), and the deferred credit related to such option will be eliminated. If an option is exercised, the Fund involved may deliver the underlying security from its portfolio or purchase the underlying security in the open market. In either event, the proceeds of the sale will be increased by the net premium originally received, and the Fund involved will realize a gain or loss. Premiums from expired call
41
options written by the Fund and net gains from closing purchase transactions are treated as short-term capital gains for Federal income tax purposes, and losses on closing purchase transactions are short-term capital losses.
There is no assurance that a liquid secondary market on an exchange will exist for any particular option. A covered option writer, unable to effect a closing purchase transaction, will not be able to sell the underlying security until the option expires or is delivered upon exercise. As a result, the writer in such circumstances will be subject to the risk of market decline in the underlying security during such period and to the risk that market values increase beyond the option exercise price, in each case to the extent not offset by the net premium. A Fund will write an option on a particular security only if the Adviser believes that a liquid secondary market will exist on an exchange for options of the same series, which will permit the Fund to make a closing purchase transaction in order to close out its position.
During the year ended March 31, 2006, the Value and Restructuring Fund had the following written option transactions:
| | | | | | | |
| Written Option Transactions | | Number of
Contracts
| | | Premiums
| |
Outstanding, beginning of year | | (20,000 | ) | | $ | (2,633,972 | ) |
Options written | | (32,827 | ) | | | (12,444,685 | ) |
Options expired | | — | | | | — | |
Options exercised | | 11,932 | | | | 3,090,507 | |
Options terminated in closing purchase transactions | | 36,427 | | | | 10,227,178 | |
| | |
|
| |
|
|
|
Outstanding, end of year | | (4,468 | ) | | $ | (1,760,972 | ) |
| | |
|
| |
|
|
|
(d) Security transactions and investment income:
Security transactions are recorded on a trade date basis. Realized gains and losses on investments sold are recorded on the basis of identified cost. Interest income, adjusted for amortization of premiums and, when appropriate, discounts on investments, is earned from settlement date and is recorded on the accrual basis. Dividend income is recorded on the ex-dividend date, except for certain dividends from foreign securities, which are recorded as soon as the Funds are informed of the dividend.
(e) Repurchase agreements:
The Funds may purchase portfolio securities from financial institutions deemed to be creditworthy by the investment adviser subject to the seller’s agreement to repurchase and the Funds’ agreement to resell such securities at mutually agreed upon prices. Securities purchased subject to such repurchase agreements are deposited with the Funds’ custodian or sub-custodian or are maintained in the Federal Reserve/Treasury book-entry system and must have, at all times, an aggregate market value not less than the repurchase price (including accrued interest).
Default or bankruptcy of the seller may, however, expose the applicable Fund to possible delay in connection with the disposition of the securities or loss to the extent that proceeds from a sale of the underlying securities were less than the repurchase price under the agreement.
42
(f) TBA purchase commitments:
Certain Funds may enter into “TBA” (To Be Announced) purchase commitments to purchase securities for a fixed price at a future date, typically not exceeding 45 days. TBA purchase commitments may be considered securities in themselves, and involve risk of loss if the value of the security to be purchased declines prior to settlement date. The Fund must maintain liquid securities having a value not less than the purchase price (including accrued interest) for such purchase commitments. Unsettled TBA purchase commitments are valued at the current market value of the underlying securities, according to the procedures described under “Portfolio Valuation” above.
(g) Distributions to shareholders:
Dividends equal to all or substantially all of each Fund’s net investment income will be declared and paid as follows: for Equity Income Fund, Large Cap Growth Fund, Mid Cap Value and Restructuring Fund, Small Cap Fund and Value and Restructuring Fund, dividends will be declared and paid at least quarterly; for the Core Bond Fund, dividends from net investment income are declared daily and paid monthly. Net realized capital gains, unless offset by any available capital loss carryforward, are distributed at least annually. Dividends and distributions are recorded on the ex-dividend date.
(h) Expense allocation:
Expenses directly attributable to a Fund are charged to that Fund. Other expenses are allocated to the respective Fund based on average daily net assets. Expenses attributable to a specific class of shares, such as shareholder servicing fees, are charged directly to that class.
2. Investment Advisory Fee, Administration Fee, Shareholder Servicing Fees and Related Party Transactions:
Prior to December 16, 2005, the Funds were advised jointly by United States Trust Company of New York and U.S. Trust Company, N.A., through their respective separate identifiable divisions. Effective December 16, 2005, U.S. Trust Company, N.A.’s separately identifiable division was reorganized into a separate corporate entity named UST Advisers, Inc., a Delaware corporation that is a wholly-owned subsidiary of U.S. Trust Company, N.A. and the Funds were advised by either UST Advisers, Inc. or U.S. Trust New York Asset Management Division (“NYAMD”), the separately identifiable division of United States Trust Company of New York.
Effective March 31, 2006, United States Trust Company of New York converted to a national charter and changed its name to United States Trust Company, National Association (“USTC-NA”) and merged with U.S. Trust Company, N.A., with USTC-NA as the surviving entity. As of March 31, 2006, the Funds are advised by NYAMD, a separate identifiable division of USTC-NA, or UST Advisers, Inc. (together with NYAMD, the “Advisers”), a wholly-owned subsidiary of USTC-NA. USTC-NA is a wholly-owned subsidiary of US Trust Corporation, a registered bank holding company, which, in turn, is a wholly-owned subsidiary of The Charles Schwab Corporation. For the services provided pursuant to the Investment Advisory Agreements, each Adviser receives a fee, computed daily and paid monthly, as follows:
| | | |
Core Bond Fund | | 0.75 | % |
Equity Income Fund | | 0.75 | % |
43
| | | |
Large Cap Growth Fund | | 0.75 | % |
Mid Cap Value and Restructuring Fund | | 0.65 | % |
Small Cap Fund | | 0.75 | %* |
Value and Restructuring Fund | | 0.60 | % |
| * | | Effective January 1, 2006, Small Cap Fund changed its advisory fee from 0.60% to 0.75%. |
UST Advisers, Inc. and BISYS Fund Services Ohio, Inc. (collectively, the “Administrators”) provide administrative services to the Funds. For the services provided to the Funds, the Administrators are entitled jointly to annual fees, computed daily and paid monthly, based on the combined aggregate average daily net assets of Excelsior Fund, Excelsior Tax-Exempt Funds, Inc. (“Excelsior Tax-Exempt Fund”) and the Trust (excluding the international equity portfolios of Excelsior Fund and the Trust), all of which are affiliated investment companies, as follows: 0.200% of the first $200 million, 0.175% of the next $200 million and 0.150% over $400 million. The Administrators are entitled jointly to annual fees, computed daily and paid monthly, at the annual rate of 0.20% of the average daily net assets of the Emerging Markets Fund, International Equity Fund, International Fund and Pacific/Asia Fund. Administration fees payable by each Fund of the Excelsior Fund, the Trust and Excelsior Tax-Exempt Fund are determined in proportion to the relative average daily net assets of the respective Fund for the period paid. For the year ended March 31, 2006, administration fees charged to the Funds were as follows:
| | | |
| | | Administration
Fees
|
Core Bond Fund | | $ | 374,736 |
Equity Income Fund | | | 322,704 |
Large Cap Growth Fund | | | 473,303 |
Mid Cap Value and Restructuring Fund | | | 464,898 |
Small Cap Fund | | | 782,944 |
Value and Restructuring Fund | | | 7,980,571 |
From time to time, in its sole discretion, each Adviser may undertake to waive a portion or all of the fees payable to it and may also reimburse the Funds for a portion of other expenses. For the nine months ended December 31, 2005, and the three months ended March 31, 2006, the Advisers have contractually agreed to waive investment advisory fees and to reimburse other ordinary operating expenses to the extent necessary to keep total operating expenses from exceeding the following annual percentages of each Fund’s average daily net assets:
| | | | | | |
| | | Nine
Months Ended
December, 31
2005
| | | Three
Months Ended
March 31,
2006
| |
Core Bond Fund — Retirement Shares | | 1.40 | % | | 1.40 | % |
Equity Income Fund — Retirement Shares | | 1.55 | % | | 1.60 | % |
Large Cap Growth Fund — Retirement Shares | | 1.55 | % | | 1.70 | % |
Mid Cap Value and Restructuring Fund — Retirement Shares | | 1.64 | % | | 1.64 | % |
Small Cap Fund — Retirement Shares | | 1.55 | % | �� | 1.75 | % |
Value and Restructuring Fund — Retirement Shares | | 1.64 | % | | 1.64 | % |
Core Bond Fund — Shares | | 0.90 | % | | 0.90 | % |
Equity Income Fund — Shares | | 1.05 | % | | 1.10 | % |
Large Cap Growth Fund — Shares | | 1.05 | % | | 1.20 | % |
44
| | | | | | |
| | | Nine
Months Ended
December, 31
2005
| | | Three
Months Ended
March 31,
2006
| |
Mid Cap Value and Restructuring Fund — Shares | | 1.14 | % | | 1.14 | % |
Small Cap Fund — Shares | | 1.05 | % | | 1.25 | % |
Value and Restructuring Fund — Shares | | 1.14 | % | | 1.14 | % |
Core Bond Fund — Institutional Shares* | | N/A | | | 0.65 | % |
Mid Cap Value and Restructuring Fund — Institutional Shares | | 0.89 | % | | 0.89 | % |
Value and Restructuring Fund — Institutional Shares | | 0.89 | % | | 0.89 | % |
| * | | Institutional Shares commenced operations November 29, 2005. |
For the year ended March 31, 2006, pursuant to the above, investment advisory fees waived by the Advisers were as follows:
| | | | |
Core Bond Fund | | $ | (987,738 | ) |
Equity Income Fund | | | (342,433 | ) |
Large Cap Growth Fund | | | (383,210 | ) |
Mid Cap Value and Restructuring Fund | | | (11,769 | ) |
Small Cap Fund | | | (95,946 | ) |
Value and Restructuring Fund | | | — | |
The Funds have entered into shareholder servicing agreements with various service organizations, which include Charles Schwab & Co. Inc. (“CS & Co.”) and UST Advisers, Inc. Services included in the servicing agreements are assisting in processing purchase, exchange and redemption requests; transmitting and receiving funds in connection with customer orders to purchase, exchange or redeem shares; and providing periodic statements. Shareholder servicing fees are incurred on a Fund or class level (where applicable). In consideration for these services, each service organization receives a fee from the Funds, computed daily and paid monthly, at an annual rate up to 0.25% of the average daily net assets of the Fund’s shares held by each service organization’s customers. The Advisers, out of their own resources, may additionally compensate certain organizations for providing these and other services.
For the year ended March 31, 2006, shareholder servicing fees paid to CS & Co. and the Advisers were as follows:
| | | |
Core Bond Fund | | $ | 473,281 |
Equity Income Fund | | | 566,460 |
Large Cap Growth Fund | | | 780,934 |
Mid Cap Value and Restructuring Fund | | | 516,587 |
Small Cap Fund | | | 1,307,062 |
Value and Restructuring Fund | | | 6,206,822 |
BISYS Fund Services Limited Partnership (the “Distributor”) serves as the Distributor of the Funds. Shares of each Fund are sold without a sales charge on a continuous basis by the Distributor.
Certain Funds have adopted a Distribution Plan pursuant to Rule 12b-1 under the 1940 Act, under which the Core Bond Fund, Equity Income Fund, Large Cap Growth Fund, Mid Cap Value and Restructuring Fund, Small Cap Fund and Value and Restructuring Fund may compensate the
45
Distributor monthly for its services which are intended to result in the sale of Retirement Shares, in an amount not to exceed the annual rate of 0.50%, of the average daily net asset value of such Fund’s Retirement Shares. For the year ended March 31, 2006, fees charged for Retirement Shares of the Core Bond Fund, Equity Income Fund, Large Cap Growth Fund, Mid Cap Value and Restructuring Fund, Small Cap Fund and Value and Restructuring Fund were $4, $4, $6, $4, $5 and $874, respectively. There were no charges for the year ended March 31, 2006 for the Fund Shares of the Mid Cap Value and Restructuring Fund.
Each Independent Director/Trustee of the Funds receives a total annual fee of $100,000 paid by the Funds and other affiliated registered investment companies managed by the Advisers. The Chairman of the Board receives an additional $30,000, the Chairman of the Audit Committee receives an additional $15,000, and the Chairman of the Nominating Committee receives an additional $5,000 for serving in those capacities. In addition, Directors and Trustees are reimbursed by Excelsior Fund and the Trust, respectively, for reasonable expenses incurred when acting in their capacity as Directors and Trustees.
3. Purchases, Sales and Maturities of Securities:
For the year ended March 31, 2006, purchases, sales and maturities of securities, excluding short-term investments and written options transactions, for the Funds aggregated:
| | | | | | |
| | | Purchases
| | Sales and
Maturities
|
Core Bond Fund | | | | | | |
U.S. Government | | $ | 234,143,975 | | $ | 174,000,688 |
Other | | | 72,340,542 | | | 48,360,840 |
Equity Income Fund | | | 108,605,648 | | | 95,065,360 |
Large Cap Growth Fund | | | 339,168,170 | | | 73,745,338 |
Mid Cap Value and Restructuring Fund | | | 70,799,348 | | | 78,148,689 |
Small Cap Fund | | | 335,812,355 | | | 354,073,150 |
Value and Restructuring Fund | | | 1,502,162,032 | | | 628,388,980 |
4. Federal Taxes:
It is the policy of Excelsior Fund and the Trust that each Fund qualify or continue to qualify as a regulated investment company, by complying with the requirements of the Internal Revenue Code applicable to regulated investment companies, and by distributing substantially all of its taxable earnings to its shareholders.
In order to avoid a federal excise tax, each Fund is required to distribute certain minimum amounts of net realized capital gain and net investment income for the respective twelve-month periods ending October 31 and December 31 each calendar year.
Net realized gains of the Funds derived in certain countries are subject to certain foreign taxation.
Dividends and distributions are determined in accordance with federal income tax regulations and may differ from accounting principles generally accepted in the United States of America. These differences are primarily due to differing treatments for net operating losses, foreign currency transactions, passive foreign investment companies, partnership income, deferral of losses on wash sales
46
and net capital losses and net currency losses incurred after October 31 through the end of the fiscal year (“Post-October losses”). To the extent these differences are permanent, adjustments are made to the appropriate equity accounts in the period that these differences arise. Accordingly, the following reclassifications, as of March 31, 2006, were made to/from the following accounts:
| | | | | | | | | | | |
| | | Undistributed
Net Investment
Income
| | Accumulated
Net Realized
Gain (Loss)
| | | Paid-In-Capital
| |
Core Bond Fund | | $ | 156,098 | | $ | (156,098 | ) | | | — | |
Equity Income Fund | | | 1,610 | | | (1,610 | ) | | | — | |
Large Cap Growth Fund | | | 1,492,015 | | | — | | | $ | (1,492,015 | ) |
Mid Cap Value and Restructuring Fund | | | 23,676 | | | (737 | ) | | | (22,939 | ) |
Small Cap Fund | | | 3,315,401 | | | (3,315,401 | ) | | | — | |
Value and Restructuring Fund | | | 212,778 | | | (212,779 | ) | | | 1 | |
The tax character of dividends and distributions declared during the years ended March 31, 2006 and March 31, 2005 were as follows:
| | | | | | | | | | | | |
| | | Ordinary
Income
| | Long-Term
Capital Gain
| | Return of
Capital
| | Total
|
Core Bond Fund | | | | | | | | | | | | |
Year ended March 31, 2006 | | $ | 11,105,896 | | $ | 2,085,376 | | | — | | $ | 13,191,272 |
Year ended March 31, 2005 | | | 11,633,310 | | | 1,031,057 | | | — | | | 12,664,367 |
Equity Income Fund | | | | | | | | | | | | |
Year ended March 31, 2006 | | | 5,332,967 | | | — | | | — | | | 5,332,967 |
Year ended March 31, 2005 | | | 3,360,556 | | | — | | | — | | | 3,360,556 |
Large Cap Growth Fund | | | | | | | | | | | | |
Year ended March 31, 2006 | | | — | | | — | | | — | | | — |
Year ended March 31, 2005 | | | — | | | — | | | — | | | — |
Mid Cap Value and Restructuring Fund | | | | | | | | | | | | |
Year ended March 31, 2006 | | $ | 675,482 | | | — | | $ | 22,939 | | $ | 698,421 |
Year ended March 31, 2005 | | | 4,730,945 | | | — | | | — | | | 4,730,945 |
Small Cap Fund | | | | | | | | | | | | |
Year ended March 31, 2006 | | | — | | $ | 26,879,147 | | | — | | | 26,879,147 |
Year ended March 31, 2005 | | | — | | | — | | | — | | | — |
Value and Restructuring Fund | | | | | | | | | | | | |
Year ended March 31, 2006 | | | 52,525,603 | | | — | | | — | | | 52,525,603 |
Year ended March 31, 2005 | | | 31,941,541 | | | — | | | — | | | 31,941,541 |
As of March 31, 2006, the components of distributable earnings (accumulated losses) on a tax basis were as follows:
| | | | | | | | | | | | | | | | | | | | | | | | | |
| | | Undistributed
Ordinary
Income
| | Undistributed
Long-Term
Capital Gain
| | Distributions
Payable
| | | Accumulated
Capital and
Other Losses
| | | Post-October
Losses
| | | Unrealized
Appreciation
(Depreciation)
| | | Total
Accumulated
Earnings/
(Deficit)
| |
Core Bond Fund | | $ | 1,036,250 | | — | | $ | (1,033,843 | ) | | $ | (529,099 | ) | | | — | | | $ | (4,631,212 | ) | | $ | (5,157,904 | ) |
Equity Income Fund | | | 1,216,345 | | — | | | — | | | | (1,951,842 | ) | | $ | (4,044,151 | ) | | | 24,501,867 | | | | 19,722,219 | |
47
| | | | | | | | | | | | | | | | | | |
| | | Undistributed
Ordinary
Income
| | Undistributed
Long-Term
Capital Gain
| | Distributions
Payable
| | Accumulated
Capital and
Other Losses
| | | Post-October
Losses
| | | Unrealized
Appreciation
(Depreciation)
| | Total
Accumulated
Earnings/
(Deficit)
| |
Large Cap Growth Fund | | — | | | — | | — | | (135,908,141 | ) | | — | | | 86,245,660 | | (49,662,481 | ) |
Mid Cap Value and Restructuring Fund | | — | | | — | | — | | (1,074,502 | ) | | (894,861 | ) | | 125,325,684 | | 123,356,321 | |
Small Cap Fund | | 2,271,022 | | $ | 17,828,320 | | — | | — | | | — | | | 189,264,390 | | 209,363,732 | |
Value and Restructuring Fund | | 21,152,963 | | | — | | — | | (146,597,297 | ) | | — | | | 2,109,206,496 | | 1,983,762,162 | |
Post-October losses are deemed to arise on the first business day of a Fund’s next taxable year.
For federal income tax purposes, capital loss carryforwards may be carried forward and applied against future capital gains. To the extent that such carryforwards are utilized, capital gains distributions will be reduced. At March 31, 2006, the following Funds had capital loss carryforwards available to offset future net capital gains through the indicated expiration dates:
| | | | | | | | | | | | | | | | | | | | | |
| | | Expires
| | |
| | | 2008
| | 2010
| | 2011
| | 2012
| | 2013
| | 2014
| | Total
|
Equity Income Fund | | | — | | | — | | | — | | | — | | | — | | $ | 1,951,842 | | $ | 1,951,842 |
Large Cap Growth Fund | | $ | 5,368,992 | | $ | 24,653,640 | | $ | 83,374,895 | | $ | 22,030,449 | | $ | 480,165 | | | — | | | 135,908,141 |
Mid Cap Value and Restructuring Fund | | | — | | | — | | | 121,536 | | | — | | | — | | | 952,966 | | | 1,074,502 |
Value and Restructuring Fund | | | — | | | — | | | 119,233,763 | | | 27,363,534 | | | — | | | — | | | 146,597,297 |
At March 31, 2006, aggregate gross unrealized appreciation for all securities and call options written for which there was an excess of value over estimated tax cost and aggregate gross unrealized depreciation for all securities for which there was an excess of estimated tax cost over value is as follows:
| | | | | | | | | | | | | | |
| | | Federal Tax
Cost
| | Tax Basis
Unrealized
Appreciation
| | Tax Basis
Unrealized
(Depreciation)
| | | Net Unrealized
Appreciation
| |
Core Bond Fund | | $ | 281,602,078 | | $ | 761,879 | | $ | (5,393,091 | ) | | $ | (4,631,212 | ) |
Equity Income Fund | | | 180,682,714 | | | 26,465,873 | | | (1,964,006 | ) | | | 24,501,867 | |
Large Cap Growth Fund | | | 480,566,594 | | | 90,470,304 | | | (4,224,644 | ) | | | 86,245,660 | |
Mid Cap Value and Restructuring Fund | | | 214,051,417 | | | 130,538,656 | | | (5,212,972 | ) | | | 125,325,684 | |
Small Cap Fund | | | 409,680,710 | | | 190,044,571 | | | (780,181 | ) | | | 189,264,390 | |
Value and Restructuring Fund | | | 4,419,326,922 | | | 2,229,321,803 | | | (120,115,302 | ) | | | 2,109,206,501 | |
5. Capital Transactions:
Excelsior Fund has authorized capital of 35 billion shares of Common Stock, 29.3756 billion of which is currently classified to represent interests in certain classes of shares. Authorized capital currently offered for each Fund is as follows: 1.5 billion shares of the Value and Restructuring Fund; 1 billion shares each of the Large Cap Growth Fund, Small Cap Fund; and 750 million shares of the Core Bond Fund. Each share has a par value of $0.001 and represents an equal proportionate interest in
48
the particular Fund with other shares of the same Fund and is entitled to such dividends and distributions of taxable earnings on the assets belonging to such Fund as are declared at the discretion of Excelsior Fund’s Board of Directors.
The Trust has authorized an unlimited number of shares of beneficial interest of each class of each Fund. Each share has a par value of $0.00001 and represents an equal proportionate interest in the particular Fund with other shares of the same Fund, and is entitled to such dividends and distributions of taxable earnings on the assets belonging to such Fund as are declared at the discretion of the Trust’s Board of Trustees.
Capital Share Transactions
| | | | | | | | | | | | | | |
| | | Core Bond Fund*
| |
| | | Year Ended 03/31/06
| | | Year Ended 03/31/05
| |
| | | Shares
| | | Amount
| | | Shares
| | | Amount
| |
Sold: | | | | | | | | | | | | | | |
Retirement Shares | | — | | | | — | | | 126 | | | $ | 1,050 | |
Shares | | 13,774,392 | | | $ | 125,488,152 | | | 7,544,152 | | | | 69,875,602 | |
Institutional Shares | | 141,024 | | | | 1,262,505 | | | — | | | | — | |
Issued as reinvestment of dividends: | | | | | | | | | | | | | | |
Retirement Shares | | 5 | | | | 50 | | | — | | | | 4 | |
Shares | | 681,642 | | | | 6,160,386 | | | 331,579 | | | | 3,062,096 | |
Institutional Shares | | 189 | | | | 1,685 | | | — | | | | — | |
Redeemed: | | | | | | | | | | | | | | |
Retirement Shares | | — | | | | — | | | — | | | | — | |
Shares | | (5,733,516 | ) | | | (52,104,922 | ) | | (4,431,412 | ) | | | (40,768,322 | ) |
Institutional Shares | | (16 | ) | | | (151 | ) | | — | | | | — | |
Redemption in-kind | | — | | | | — | | | (8,833,002 | ) | | | (81,528,608 | ) |
| | |
|
| |
|
|
| |
|
| |
|
|
|
Net Increase (Decrease) | | 8,863,721 | | | $ | 80,807,705 | | | (5,388,557 | ) | | $ | (49,358,178 | ) |
| | |
|
| |
|
|
| |
|
| |
|
|
|
| | | | | | | | | | | | | | |
| | | Equity Income Fund
| |
| | | Year Ended 03/31/06
| | | Year Ended 03/31/05
| |
| | | Shares
| | | Amount
| | | Shares
| | | Amount
| |
Sold: | | | | | | | | | | | | | | |
Retirement Shares | | — | | | | — | | | 136 | | | $ | 1,150 | |
Shares | | 8,070,602 | | | $ | 67,137,307 | | | 12,455,777 | | | | 99,825,944 | |
Issued as reinvestment of dividends: | | | | | | | | | | | | | | |
Retirement Shares | | 3 | | | | 21 | | | — | | | | — | |
Shares | | 115,326 | | | | 946,155 | | | 77,738 | | | | 622,458 | |
Redeemed: | | | | | | | | | | | | | | |
Retirement Shares | | (20 | ) | | | (159 | ) | | — | | | | — | |
Shares | | (7,466,868 | ) | | | (62,372,729 | ) | | (2,085,368 | ) | | | (16,772,371 | ) |
| | |
|
| |
|
|
| |
|
| |
|
|
|
Net Increase (Decrease) | | 719,043 | | | $ | 5,710,595 | | | 10,448,283 | | | $ | 83,677,181 | |
| | |
|
| |
|
|
| |
|
| |
|
|
|
49
| | | | | | | | | | | | | | |
| | | Large Cap Growth Fund
| |
| | | Year Ended 03/31/06
| | | Year Ended 03/31/05
| |
| | | Shares
| | | Amount
| | | Shares
| | | Amount
| |
Sold: | | | | | | | | | | | | | | |
Retirement Shares | | — | | | | — | | | 142 | | | $ | 1,150 | |
Shares | | 33,887,361 | | | $ | 319,718,556 | | | 14,085,811 | | | | 111,219,637 | |
Issued as reinvestment of dividends: | | | | | | | | | | | | | | |
Retirement Shares | | — | | | | — | | | — | | | | — | |
Shares | | — | | | | — | | | — | | | | — | |
Redeemed: | | | | | | | | | | | | | | |
Retirement Shares | | (20 | ) | | | (161 | ) | | — | | | | — | |
Shares | | (4,286,908 | ) | | | (38,557,547 | ) | | (4,443,816 | ) | | | (34,760,488 | ) |
| | |
|
| |
|
|
| |
|
| |
|
|
|
Net Increase (Decrease) | | 29,600,433 | | | $ | 281,160,848 | | | 9,642,137 | | | $ | 76,460,299 | |
| | |
|
| |
|
|
| |
|
| |
|
|
|
| | | | | | | | | | | | | | |
| | | Mid Cap Value and Restructuring Fund
| |
| | | Year Ended 03/31/06
| | | Year Ended 03/31/05
| |
| | | Shares
| | | Amount
| | | Shares
| | | Amount
| |
Sold: | | | | | | | | | | | | | | |
Retirement Shares | | — | | | | — | | | 68 | | | $ | 1,150 | |
Shares | | 2,206,027 | | | $ | 39,222,163 | | | 4,506,275 | | | | 71,247,527 | |
Institutional Shares | | 1,449,107 | | | | 26,024,928 | | | 1,440,444 | | | | 23,328,088 | |
Issued as reinvestment of dividends: | | | | | | | | | | | | | | |
Retirement Shares | | — | | | | — | | | — | | | | — | |
Shares | | 8,110 | | | | 140,000 | | | 65,005 | | | | 1,086,350 | |
Institutional Shares | | 12,203 | | | | 211,487 | | | 40,959 | | | | 681,342 | |
Redeemed: | | | | | | | | | | | | | | |
Retirement Shares | | (10 | ) | | | (162 | ) | | — | | | | — | |
Shares | | (2,927,490 | ) | | | (51,792,912 | ) | | (3,620,972 | ) | | | (58,289,434 | ) |
Institutional Shares | | (1,134,926 | ) | | | (20,164,758 | ) | | (1,119,376 | ) | | | (18,369,260 | ) |
Redemption in-kind | | — | | | | — | | | (1,892,982 | ) | | | (33,430,054 | ) |
| | |
|
| |
|
|
| |
|
| |
|
|
|
Net Increase (Decrease) | | (386,979 | ) | | $ | (6,359,254 | ) | | (580,579 | ) | | $ | (13,744,291 | ) |
| | |
|
| |
|
|
| |
|
| |
|
|
|
| | | | | | | | | | | | | | |
| | | Small Cap Fund
| |
| | | Year Ended 03/31/06
| | | Year Ended 03/31/05
| |
| | | Shares
| | | Amount
| | | Shares
| | | Amount
| |
Sold: | | | | | | | | | | | | | | |
Retirement Shares | | — | | | | — | | | 70 | | | $ | 1,150 | |
Shares | | 7,764,353 | | | $ | 131,311,856 | | | 15,104,853 | | | | 235,106,641 | |
Issued as reinvestment of dividends: | | | | | | | | | | | | | | |
Retirement Shares | | 3 | | | | 53 | | | — | | | | — | |
Shares | | 431,637 | | | | 7,363,728 | | | — | | | | — | |
Redeemed: | | | | | | | | | | | | | | |
Retirement Shares | | (10 | ) | | | (153 | ) | | — | | | | — | |
Shares | | (7,277,592 | ) | | | (122,756,430 | ) | | (7,918,805 | ) | | | (124,749,437 | ) |
Redemption in-kind | | — | | | | — | | | (1,099,692 | ) | | | (18,595,792 | ) |
| | |
|
| |
|
|
| |
|
| |
|
|
|
Net Increase (Decrease) | | 918,391 | | | $ | 15,919,054 | | | 6,086,426 | | | $ | 91,762,562 | |
| | |
|
| |
|
|
| |
|
| |
|
|
|
50
| | | | | | | | | | | | | | |
| | | Value and Restructuring Fund
| |
| | | Year Ended 03/31/06
| | | Year Ended 03/31/05
| |
| | | Shares
| | | Amount
| | | Shares
| | | Amount
| |
Sold: | | | | | | | | | | | | | | |
Retirement Shares | | 18,213 | | | $ | 867,236 | | | 103 | | | $ | 4,238 | |
Shares | | 42,481,646 | | | | 1,944,842,088 | | | 39,449,835 | | | | 1,550,480,361 | |
Institutional Shares | | 1,588,442 | | | | 71,855,109 | | | 3,740,751 | | | | 154,963,204 | |
Issued as reinvestment of dividends: | | | | | | | | | | | | | | |
Retirement Shares | | 26 | | | | 1,182 | | | — | | | | — | |
Shares | | 922,183 | | | | 40,504,847 | | | 647,698 | | | | 24,887,348 | |
Institutional Shares | | 45,241 | | | | 1,988,952 | | | 3,356 | | | | 131,791 | |
Redeemed: | | | | | | | | | | | | | | |
Retirement Shares | | (115 | ) | | | (5,554 | ) | | (75 | ) | | | (3,149 | ) |
Shares | | (25,114,636 | ) | | | (1,109,338,591 | ) | | (18,527,714 | ) | | | (724,974,993 | ) |
Institutional Shares | | (450,627 | ) | | | (20,187,467 | ) | | (873,380 | ) | | | (36,474,886 | ) |
| | |
|
| |
|
|
| |
|
| |
|
|
|
Net Increase (Decrease) | | 19,490,373 | | | $ | 930,527,802 | | | 24,440,574 | | | $ | 969,013,914 | |
| | |
|
| |
|
|
| |
|
| |
|
|
|
| * | | Institutional Shares commenced operations on November 29, 2005. |
6. Guarantees:
In the normal course of business, the Funds enter into contracts that provide general indemnifications. The Funds’ maximum exposure under these arrangements is dependent on future claims that may be made against the Funds and, therefore, cannot be established; however, based on experience, the risk of loss from such claims is considered remote.
7. Legal Proceedings:
The Adviser and Excelsior Funds, Inc., Excelsior Tax-Exempt Funds, Inc., and Excelsior Funds Trust (the “Companies”) were contacted in September, 2003 by the Office of the New York State Attorney General (the “NYAG”), and the Adviser was contacted by the Securities and Exchange Commission (the “SEC”) and later by the Attorney General of the State of West Virginia, in connection with their investigations of practices in the mutual fund industry identified as “market timing” and “late trading” of mutual fund shares (the “Investigations”). The Adviser and the Companies have provided full cooperation with respect to these Investigations and continue to review the facts and circumstances relevant to the Investigations. As disclosed previously by the Adviser and its affiliates, with respect to the Adviser, these investigations have been focusing on circumstances in which a small number of parties were permitted to engage in short-term trading of shares of certain of the Excelsior Funds. The short-term trading activities permitted under these arrangements have been terminated and the Adviser has strengthened its policies and procedures to deter frequent trading of shares of the Excelsior Funds.
The Adviser, certain of its affiliates, the Companies and others have also been named in several class action and derivative lawsuits which allege that the Adviser, certain of its affiliates, the Companies and others allowed certain parties to engage in illegal and improper mutual fund trading practices, which
allegedly caused financial injury to the shareholders of certain of the Excelsior Funds managed by the Adviser. Each seeks unspecified monetary damages and related equitable relief.
51
The class and derivative actions described above have been transferred to the United States District Court for the District of Maryland for coordinated and consolidated pre-trial proceedings. In November 2005, the Maryland court dismissed many of the plaintiffs’ claims in both the investor class action and the derivative lawsuits. Plaintiffs’ claims under Sections 10(b) and 20(a) of the Securities Exchange Act and under Section 36(b) and 48(a) of the Investment Company Act, however, have not been dismissed. Discovery has commenced with respect to plaintiffs’ remaining claims.
While the ultimate outcome of these matters cannot be predicted with any certainty at this time, based on currently available information and consultation with counsel, the Adviser believes that the resolution of the pending Investigations and private lawsuits will not have a material adverse financial impact on the Companies, and further believes that the pending Investigations and private lawsuits are not likely to materially affect the Adviser’s ability to provide investment management services to the Companies.
8. Other Federal Tax Information (Unaudited):
For corporate shareholders, the following percentage of the total ordinary income distributions paid during the fiscal year ended March 31, 2006, qualify for the corporate dividends received deduction for the following Funds.
| | | |
Fund
| | Percentage
| |
Equity Income Fund | | 100.00 | % |
Mid Cap Value and Restructuring Fund | | 96.25 | % |
Value and Restructuring Fund | | 100.00 | % |
For the year ended March 31, 2006, the following Funds paid qualified dividend income for purposes of reduced individual federal income tax rates of:
| | | |
Fund
| | Percentage
| |
Equity Income Fund | | 100.00 | % |
Mid Cap Value and Restructuring Fund | | 96.20 | % |
Value and Restructuring Fund | | 100.00 | % |
9. Special Meeting of Shareholders (Unaudited)
A special meeting of the shareholders of the Excelsior Small Cap Fund was held on November 17, 2005. At the meeting shareholders voted and approved the following proposals:
Proposal 1: To approve an amendment to the Investment Advisory Agreement to increase the Advisory Fee payable by the Fund.
| | | | | | | | |
| | | # of Shares
| | % of Outstanding Shares
| | | % of Shares Voted
| |
Affirmative | | 18,091,185.598 | | 59.300 | % | | 94.032 | % |
Against | | 977,482.820 | | 3.204 | % | | 5.081 | % |
Abstain | | 170,690.817 | | 0.559 | % | | 0.887 | % |
| | |
| |
|
| |
|
|
Total | | 19,239,359.235 | | 63.063 | % | | 100.000 | % |
| | |
| |
|
| |
|
|
52
Proposal 2: To approve a change in the investment objective of the Fund.
| | | | | | | | |
| | | # of Shares
| | % of Outstanding Shares
| | | % of Shares Voted
| |
Affirmative | | 18,465,354.384 | | 60.526 | % | | 95.977 | % |
Against | | 582,211.624 | | 1.909 | % | | 3.026 | % |
Abstain | | 191,793.227 | | 0.628 | % | | 0.997 | % |
| | |
| |
|
| |
|
|
Total | | 19,239,359.235 | | 63.063 | % | | 100.000 | % |
| | |
| |
|
| |
|
|
53
REPORT OF INDEPENDENT REGISTERED PUBLIC ACCOUNTING FIRM
To the Board of Directors/Trustees and Shareholders of
Excelsior Funds, Inc. and Excelsior Funds Trust
We have audited the accompanying statements of assets and liabilities, including the portfolios of investments, of the Equity Income Fund, Large Cap Growth Fund, Core Bond Fund (formerly, Managed Income Fund), Mid Cap Value and Restructuring Fund (formerly, Mid Cap Value Fund), Small Cap Fund, and Value and Restructuring Fund (four of the portfolios constituting the Excelsior Funds, Inc. and two of the portfolios constituting the Excelsior Funds Trust) (collectively, the “Funds”) as of March 31, 2006, and the related statements of operations for the year then ended, the statements of changes in net assets for each of the two years in the period then ended, and the financial highlights (Retirement) for the year ended March 31, 2006 and the period December 31, 2004 (commencement of Retirement Shares operations) through March 31, 2005. These financial statements and financial highlights are the responsibility of the Funds’ management. Our responsibility is to express an opinion on these financial statements and financial highlights based on our audits.
We conducted our audits in accordance with the standards of the Public Company Accounting Oversight Board (United States). Those standards require that we plan and perform the audit to obtain reasonable assurance about whether the financial statements and financial highlights are free of material misstatement. The Funds are not required to have, nor were we engaged to perform, an audit of their internal control over financial reporting. Our audits included consideration of internal control over financial reporting as a basis for designing audit procedures that are appropriate in the circumstances, but not for the purpose of expressing an opinion on the effectiveness of the Funds’ internal control over financial reporting. Accordingly, we express no such opinion. An audit also includes examining, on a test basis, evidence supporting the amounts and disclosures in the financial statements, assessing the accounting principles used and significant estimates made by management, as well as evaluating the overall financial statement presentation. Our procedures included confirmation of securities owned as of March 31, 2006, by correspondence with the custodian and brokers; where replies were not received from brokers, we performed other auditing procedures. We believe that our audits provide a reasonable basis for our opinion.
In our opinion, the financial statements and financial highlights referred to above present fairly, in all material respects, the financial position of Equity Income Fund, Large Cap Growth Fund, Core Bond Fund, Mid Cap Value and Restructuring Fund, Small Cap Fund, and Value and Restructuring Fund as of March 31, 2006, the results of their operations for the year then ended, the changes in their net assets for each of the two years in the period then ended, and the financial highlights for the year ended March 31, 2006 and the period December 31, 2004 (commencement of Retirement Shares operations) through March 31, 2005, in conformity with accounting principles generally accepted in the United States of America.
DELOITTE & TOUCHE LLP
New York, New York
May 22, 2006
54
Directors/Trustees and Officers of the Excelsior Funds Complex (Unaudited)
Information pertaining to the Directors/Trustees and Officers of Excelsior Fund, Excelsior Tax-Exempt Fund and Excelsior Funds Trust (each a “Company” and collectively, the “Excelsior Funds Complex”) is set forth below. Directors/Trustees who are not deemed to be “interested persons” of the Excelsior Funds Complex as defined in the 1940 Act are referred to as “Independent Board Members.” Directors/Trustees who are deemed to be “interested persons” of the Excelsior Funds Complex are referred to as “Interested Board Members”. The following information is as of May 20, 2006.
“On February 24, 2006, the Boards of Directors/Trustees (the “Boards”) of the Companies approved an increase in the size of the Boards to ten (10) directors/trustees (together, the “Directors”) and approved the nomination of Mariann Byerwalter, Nils Hakansson, William A. Hasler and Randall W. Merk (the “Candidates”) as Directors of the Companies, subject to shareholder approval at an upcoming Special Meeting of Shareholders of the Companies (the “Meeting”). Each of the Candidates is currently a director/trustee of the Laudus Funds, the Laudus Variable Insurance Trust (together, the “Laudus Funds”) and of other funds included in the Schwab mutual fund complex for which Charles Schwab Investment Management acts as investment adviser (together, the “Fund Complex”). The Companies are in the same Fund Complex as the Laudus Funds. If approved by Shareholders at the Meeting, Ms. Byerwalter and Messrs. Hakansson and Hasler would become disinterested persons of the Companies under the Investment Company Act of 1940, as amended. Mr. Merk would become an interested person of the Companies.
The Boards also approved the nominations of six existing Directors to be submitted to shareholders for approval at the Meeting: Messrs. Bailey, Collins, Drake, Hall, Lynch and Piel (the “Existing Directors” and, together with the Candidates, the “Nominees”). Frederick S. Wonham, a current Director of the Companies and Chairman of the Board of each Company, has notified the Boards that he intends to resign from the Boards, consistent with the Companies’ retirement age policy, effective as of the date of the Meeting. The Boards have elected Rodman Drake, currently a Director of the Companies and Chairman of their Joint Audit Committee, as the Chairman of the Boards of the Companies effective upon Mr. Wonham’s resignation.
The Boards have proposed to increase the size of each Board from seven to ten so that a single group of Directors (i.e., a unitary board) can oversee each of the Companies and the Laudus Funds. At a meeting held on March 16, 2006, the Laudus Funds’ Boards approved the nominations of the Existing Directors for election to the Laudus Funds’ Boards, subject to approval by shareholders of each of the Laudus Funds. Each of the Candidates has notified the Boards that, even if approved by the Companies’ shareholders at the Meeting, the Candidates will not serve as members of the Boards unless the shareholders of each of the Companies and the Laudus Funds approve the election of each of the other Nominees. Similarly, each of the existing Directors has informed the Laudus Funds Boards that, even if approved by shareholders of the Laudus Funds at their shareholders meeting, the Existing Directors will not serve as members of the Laudus Funds Boards unless the shareholders of each of the Companies and the Laudus Funds approve the election of each of the other Nominees.
55
| | | | | | |
Name and Address(1) Age Time Served with the Excelsior Funds Complex
| | Principal Occupation
During the Past Five Years
| | Number of
Portfolios in Fund Complex Overseen by Director/Trustee(3)
| | Other Directorships Held by
Director/Trustee(4)
|
DIRECTORS/TRUSTEES(2) INDEPENDENT BOARD MEMBERS | | | | |
Frederick S. Wonham
Age: 75
Since 1997 | | Retired. Chairman of the Boards and Director (since 1997) and President and Treasurer (from 1995 to February 2002) of Excelsior Funds, Inc. and Excelsior Tax-Exempt Funds, Inc.; Chairman of the Board and Trustee (since 1997) and President and Treasurer (from 1995 to February 2002) of Excelsior Funds Trust. | | 29 | | None. |
| | | |
Rodman L. Drake
Age: 63
Since 1994 | | Director and Chairman of Audit Committee of Excelsior Funds, Inc. and Excelsior Tax-Exempt Funds, Inc. (since 1996); Trustee of Excelsior Funds Trust (since 1994); Co-Founder of Baringo Capital LLC (since 2002); President, Continuation Investments Group, Inc. (from 1997 to 2001). | | 29 | | Director and Chairman, Hyperion Total Return Fund, Inc., and Hyperion Strategic Mortgage Fund Inc. (since 1991); Director, Jackson Hewitt Tax Services, Inc. (since June 2004); Director, Student Loan Corporation (since May 2005). |
| | | |
Morrill Melton (“Mel”) Hall, Jr.
Age: 61
Since 2000 | | Director of Excelsior Funds, Inc. and Excelsior Tax-Exempt Funds, Inc. (since 2000); Trustee of Excelsior Funds Trust (since 2000); Chairman (since 1984) and Chief Executive Officer (since 1991); Comprehensive Health Services, Inc. (health care management and administration). | | 29 | | None. |
| | | |
Roger M. Lynch
Age: 64
Since 2001 | | Retired. Director of Excelsior Funds, Inc. and Excelsior Tax- Exempt Funds, Inc. and Trustee of Excelsior Funds Trust (since 2001); President, Corporate Asset Funding Co., Inc. (asset securitization) (from 1987 to 1999); Limited Partner (from 1986 to 1999), Goldman Sachs & Co. | | 29 | | None. |
| | | |
Jonathan Piel
Age: 67
Since 1994 | | Director and Chairman of Nominating Committee, Excelsior Funds, Inc. and Excelsior Tax-Exempt Funds, Inc. (since 1996); Trustee, Excelsior Funds Trust (since 1994); Cable Television producer and website designer. The Editor Scientific American (from 1984 to 1986) and Vice President, Scientific American, Inc. (from 1986 to 1994); Director, National Institute of Social Sciences; member, Advisory Board. The Stone Age Institute, Bloomington Indiana. | | 29 | | None. |
56
| | | | | | |
Name and Address(1) Age Time Served with the Excelsior Funds Complex
| | Principal Occupation
During the Past Five Years
| | Number of
Portfolios in Fund Complex Overseen by Director/Trustee(3)
| | Other Directorships Held by
Director/Trustee(4)
|
John. D. Collins
Age: 67
Since 2005 | | Retired. Director, Excelsior Funds, Inc. and Excelsior Tax-Exempt Funds, Inc. (since 2005); Trustee, Excelsior Funds Trust (since 2005); Consultant, KPMG, LLP (from July 1999 to June 2000); Partner, KPMG, LLP (from March 1962 to June 1999). | | 29 | | Director, Mrs. Fields’ Famous Brands LLC (consumer products) (since December 2004). |
| INTERESTED BOARD MEMBER(5) | | | | |
James L. Bailey
114 West 47th Street
New York, NY 10036
Age: 60
Since 2004 | | Chief Operating Officer of U.S. Trust Corporation (since December 2004) and Executive Vice President of U.S. Trust Corporation and United States Trust Company of New York (since 2003); President, Excelsior Funds, Inc., Excelsior Tax-Exempt Funds, Inc. and Excelsior Funds Trust (from 2003 to July 2004); Consultant in the financial services industry (from August 2000 to January 2003); Executive Vice President of Citicorp (from 1992 to August 2000). | | 29 | | None. |
| OFFICERS | | | | | | |
Joseph Trainor, CFA
Age: 44
114 West 47th Street
New York, NY 10036 | | Managing Director of United States Trust Company of New York (since 2003) and President, U.S. Trust Institutional; President of MFS Institutional Advisors (from 1998 to 2002). | | N/A | | N/A |
| | | |
George Pereira
Age: 42
101 Montgomery St.
San Francisco, CA 94104 | | Senior Vice President and Chief Financial Officer, Charles Schwab Investment Management, Inc.; Director, Charles Schwab Asset Management (Ireland) Limited. From December 1999 to November 2004, Sr. Vice President, Financial Reporting, Charles Schwab & Co., Inc. From September 1999 to December 1999, Chief Financial Officer, Commerzbank Capital Markets. Prior to September 1999, Managing Director at the New York Stock Exchange. | | N/A | | N/A |
| | | |
Stefanie A. Firtell
Age: 32
114 West 47th Street
New York, NY 10036 | | Vice President, United States Trust Company of New York (since April 2005); Compliance Officer and Head of Regulatory Responses, Assistant Vice President, Deutsche Asset Management (from 2003 to 2005); Assistant Corporate Secretary, Triare Companies, Inc. (from 2002 to 2003); Attorney, Paul, Weiss, Rifkind, Wharton & Garrison (from 2001 to 2002); and Attorney, Cadwalder Wickersham & Taft (from 2000 to 2001). | | N/A | | N/A |
57
| | | | | | |
Name and Address(1) Age Time Served with the Excelsior Funds Complex
| | Principal Occupation
During the Past Five Years
| | Number of
Portfolios in Fund Complex Overseen by Director/Trustee(3)
| | Other Directorships Held by
Director/Trustee(4)
|
Wyndham Clark
Age: 47
225 High Ridge Road
Stamford, CT 06905 | | Vice President and AML Officer, U.S. Trust Company, N.A. (since 2003); Vice President and Deputy Director Risk Management, IBJ Whitehall (banking) (from 2001 to 2002); and Vice President and Chief Risk Officer, EMAC, LLC (commercial lender, asset backed security issuer) (from 1999 to 2001). | | N/A | | N/A |
| | | |
Petros (Peter) L. Tsirigotis
Age: 37
114 West 47th Street
New York, NY 10036 | | Senior Vice President and Assistant General Counsel, U.S. Trust (since September 2005); Vice President and Corporate Counsel, Prudential Financial (September 2004 to September 2005); Associate, Schulte Roth and Zabel LLP (November 2002 to September 2004) and Dechert LLP (August 2000 to November 2002). Prior to August 2000, Mr. Tsirigotis was an Attorney/Advisor (Division of Investment Management) and Financial Economist (Office of Economic Analysis) with the Securities and Exchange Commission in Washington, D.C. | | N/A | | N/A |
| (1) | Each independent director/trustee may be contacted by writing to Excelsior Funds, 225 High Ridge Road, Stamford, CT 06905. |
| (2) | Each director/trustee shall hold office until the election and qualification of his or her successor, or until he or she sooner dies, resigns or is removed. The officers of each Company shall hold office for a one year term and until their respective successors are chosen and qualified, or in each case until he or she sooner dies, resigns, is removed, or becomes disqualified in accordance with each Company’s by-laws. |
| (3) | The Excelsior Funds Complex consists of all registered investment companies (Excelsior Funds Inc., Excelsior Tax-Exempt Funds, Inc. and Excelsior Funds Trust) for which U.S. Trust serves as investment adviser. As of May 20, 2006, the Excelsior Funds Complex consisted of 29 Funds. |
| (4) | Directorships of companies required to report to the Securities and Exchange Commission under the Securities Exchange Act of 1934 (i.e., “public companies”) or other investment companies registered under the 1940 Act. |
| (5) | “Interested person” of the Company is defined in the 1940 Act. Mr. Bailey is considered an “interested person” because of his affiliation with the Adviser. |
For more information regarding the Directors/Trustees and Officers, please refer to the Statement of Additional Information, which is available upon request by calling 1-800-446-1012.
58
DISCLOSURE OF FUND EXPENSES (Unaudited)
We believe it is important for you to understand the impact of fees regarding your investment. As a shareholder of the fund, you incur ongoing, or operating costs, which include costs for portfolio management, administrative services, and shareholder reports (like this one), among others. Operating expenses, which are deducted from a fund’s gross income, directly reduce the investment return of the fund. A fund’s expenses are expressed as a percentage of its average net assets. This figure is known as the expense ratio. The following examples are intended to help you understand the ongoing costs (in dollars) of investing in your fund and to compare these costs with those of other mutual funds. The examples are based on an investment of $1,000 made at the beginning of the period shown and held for the entire period.
The table on the following page illustrates your fund’s costs in two ways.
| | · | Actual expenses. This section provides information about actual account values and actual expenses based on the Funds’ actual return for the period. This section is designed to help you to estimate the actual expenses after fee waivers that you paid over the period. The “Ending Account Value” shown is derived from the fund’s actual return, and the fourth column shows the dollar amount that would have been paid by an investor who started with $1,000 in the fund. You may use the information here, together with the amount you invested, to estimate the expenses that you paid over the period. |
To do so, simply divide your account value by $1,000 (for example, an $8,600 account value divided by $1,000 = $8.6), then multiply the result by the number given for your fund under the heading “Expenses Paid During Period”.
| | · | Hypothetical expenses. This section provides information about hypothetical account values and hypothetical expenses that would have been incurred by an investor in the Fund based on an assumed rate of return of 5% per year before expenses. This section is designed to help you compare your fund’s costs with those of other mutual funds. It assumes that the fund had a return of 5% before expenses during the year, but that the expense ratio is unchanged. In this case, because the return used is not the fund’s actual return, the results cannot be used to estimate the actual ending account balance or expenses you paid for the period. You may use this information to compare the ongoing costs of investing in your Fund and other funds. To do so, compare this 5% hypothetical example with the 5% hypothetical examples that appear in shareholder reports of other funds. |
59
DISCLOSURE OF FUND EXPENSES (Unaudited) (continued)
Please note that the expenses shown in the table are meant to highlight and help you compare ongoing costs only, which are described in the Prospectus. Therefore, the hypothetical example is useful in comparing ongoing costs only, and will not help you determine the relative total costs of owning different funds.
| | | | | | | | | | | | |
| | | Beginning
Account
Value
10/01/2005
| | Ending
Account
Value
03/31/2006
| | Annualized
Expense
Ratios*
| | | Expenses
Paid
During
Period**
|
Actual Fund Return | | | | | | | | | | | | |
Core Bond Fund — Retirement Shares | | $ | 1,000.00 | | $ | 997.00 | | 1.41 | % | | $ | 7.02 |
Equity Income Fund — Retirement Shares | | | 1,000.00 | | | 1,042.70 | | 1.60 | | | | 8.15 |
Large Cap Growth Fund — Retirement Shares | | | 1,000.00 | | | 1,098.40 | | 1.86 | | | | 9.73 |
Mid Cap Value and Restructuring Fund — Retirement Shares | | | 1,000.00 | | | 1,101.60 | | 1.47 | | | | 7.70 |
Small Cap Fund — Retirement Shares | | | 1,000.00 | | | 1,158.50 | | 1.67 | | | | 8.99 |
Value and Restructuring Fund — Retirement Shares | | | 1,000.00 | | | 1,071.50 | | 1.55 | | | | 8.01 |
| | | | |
Hypothetical 5% Return | | | | | | | | | | | | |
Core Bond Fund — Retirement Shares | | | 1,000.00 | | | 1,017.90 | | 1.41 | | | | 7.09 |
Equity Income Fund — Retirement Shares | | | 1,000.00 | | | 1,016.95 | | 1.60 | | | | 8.05 |
Large Cap Growth Fund — Retirement Shares | | | 1,000.00 | | | 1,015.66 | | 1.86 | | | | 9.35 |
Mid Cap Value and Restructuring Fund — Retirement Shares | | | 1,000.00 | | | 1,017.60 | | 1.47 | | | | 7.39 |
Small Cap Fund — Retirement Shares | | | 1,000.00 | | | 1,016.60 | | 1.67 | | | | 8.40 |
Value and Restructuring Fund — Retirement Shares | | | 1,000.00 | | | 1,017.20 | | 1.55 | | | | 7.80 |
| * | Annualized expense ratios of certain funds are after fee waivers and expense reimbursements by the investment adviser. Absent such waivers and reimbursements, expenses paid during the period would have been greater. |
| ** | Expenses are equal to the Fund’s annualized expense ratio multiplied by the average account value over the period, multiplied by the number of days in the most recent fiscal half-year (182) then divided by 365. |
60
AR-RETIRE-0306
The registrant has adopted a code of ethics that applies to the registrant’s principal executive officer, principal financial officer, principal accounting officer or controller, or persons performing similar functions. This code of ethics is included as an Exhibit.
During the period covered by the report, with respect to the registrant’s code of ethics that applies to its principal executive officer, principal financial officer, principal accounting officer or controller, or persons performing similar functions; there have been no amendments to, nor any waivers granted from, a provision that relates to any element of the code of ethics definition enumerated in paragraph (b) of this Item 2.
| Item 3. | Audit Committee Financial Expert. |
3(a)(1) The registrant’s board of directors has determined that the registrant has at least one audit committee financial expert serving on its audit committee.
3(a)(2) The audit committee financial experts are Frederick S. Wonham and Rodman L. Drake, who are “independent” for purposes of this Item 3 of Form N-CSR.
| Item 4. | Principal Accountant Fees and Services. |
For the fiscal years ended March 31, 2006 and March 31, 2005, the aggregate fees billed by Deloitte & Touche LLP for professional services rendered for the audits of the financial statements, or services that are normally provided in connection with statutory and regulatory filings or engagements for the fiscal year for the Registrant are shown in the table below.
| | | | | | |
| | | 2006 |
| | | All fees and services to the
Registrant that were pre-approved | | All fees and services to services
Affiliates that were pre-approved |
(a) Audit Fees (1) | | $ | 487,444 | | | N/A |
(b) Audit-Related Fees (2) | | $ | 0 | | $ | 0 |
(c) Tax Fees (3) | | $ | 101,000 | | $ | 0 |
(d) All Other Fees (4) | | $ | 0 | | $ | 0 |
| | | | | | |
| | | 2005 |
| | | All fees and services to the
Registrant that were pre-approved | | All fees and services to services
Affiliates that were pre-approved |
(a) Audit Fees (1) | | $ | 475,822 | | | N/A |
(b) Audit-Related Fees (2) | | $ | 20,477 | | $ | 0 |
(c) Tax Fees (3) | | $ | 104,000 | | $ | 0 |
(d) All Other Fees (4) | | $ | 0 | | $ | 0 |
| (1) | | Audit fees include amounts related to the audit of the Registrant’s annual financial statements and services normally provided by the accountant in connection with statutory and regulatory filings. |
| (2) | | For the fiscal year ended March 31, 2006, there were no fees for assurance and related services by Deloitte & Touche LLP reasonably related to the performance of the audit of the Registrant’s financial statements that were not reported under (a) of this item. For the fiscal year ended March 31, 2005, there were audit related fees of $20,477 for assurance and related services by Deloitte & Touche. Such assurance services included a review of the accounting conversion on December 13, 2004 for the Registrant. |
| (3) | | For the fiscal year ended March 31, 2006, the aggregate tax fees billed for professional services rendered by Deloitte & Touche LLP for tax compliance, tax advice, and tax planning were $101,000. Such tax services included the review of income and excise tax returns for the Registrant. For the fiscal year ended March 31, 2005, the aggregate tax fees billed for professional services rendered by Deloitte & Touche LLP for tax compliance, tax advice, and tax planning were $104,000. Such tax services included the review of income and excise tax returns for the Registrant. |
| (4) | | For the fiscal years ended March 31, 2005 and March 31, 2004, there were no fees billed for professional services rendered by Deloitte & Touche LLP, to the Registrant, other than the services reported in (a) through (c) of this Item. |
(e) (1) The audit committee has adopted policies and procedures that require pre-approval of audit and non-audit services for the Funds and certain other services provided to the Fund’s affiliates in accordance with Rule 2-01 (c) (7) of Regulation S-X. The pre-approval requirement for non-audit services for the Funds, the Funds’ investment adviser and the adviser’s control affiliates may be waived if: (i) the aggregate amount of all services provided constitutes not more than 5% of the total amount of revenues paid to the Funds’ independent accountant by the Funds and the Funds’ investment adviser and its control affiliates that provide ongoing services to the Funds during the fiscal year in which the services are provided that would have to be pre-approved by the Funds’ Audit Committee; (ii) such services were not recognized at the time of the engagement to be
non-audit services; and (iii) such services are promptly brought to the attention of the Audit Committee and approved prior to the completion of the audit by the Audit Committee or by its designated Audit Committee member (s).
(e)(2) Percentage of fees billed applicable to non-audit services pursuant to waiver of pre-approval requirement were as follows:
| | | | |
| | | 2006 | | 2005 |
Audit-Related Fees | | N/A | | N/A |
Tax Fees | | N/A | | N/A |
All Other Fees | | N/A | | N/A |
(f) Not applicable.
(g) For the fiscal years ended March 31, 2006 and March 31, 2005, the aggregate non-audit fees billed by Deloitte & Touche LLP for services rendered to the Registrant and the Advisers and any entity controlling, controlled by, or under common control with the Advisers that provided ongoing services to the Registrant were $1,187,420 and $1, 248,972, respectively.
(h) The Registrant’s Audit Committee has considered whether its principal accountant’s provision of non-audit services that were rendered to the Registrant’s investment adviser, and any control persons of the investment adviser that provides ongoing services to the Registrant, that were not pre-approved pursuant to paragraph (c) (7)(ii) of Rule 2-01 of Regulation S-X, is compatible with maintaining the principal accountant’s independence.
| Item 5. | Audit Committee of Listed Registrants. |
Not applicable.
| Item 6. | Schedule of Investments. |
Complete schedule of investments is included in Item 1.
| Item 7. | Disclosure of Proxy Voting Policies and Procedures for Closed-End Management Investment Companies. |
Not applicable.
| Item 8. | Portfolio Managers of Closed-End Management Investment Companies. |
Not applicable.
| Item 9. | Purchases of Equity Securities by Closed-End Management Investment Company and Affiliated Purchasers. |
Not applicable.
| Item 10. | Submission of Matters to a Vote of Security Holders. |
There have been no material changes to the procedures by which shareholders may recommend nominees to the Registrant’s board of directors after Registrant last provided disclosure in response to the requirement of Item 7(d) (2) (ii) (G) of Schedule 14A, or this Item 10.
| Item 11. | Controls and Procedures. |
The registrant’s principal executive officer and principal financial officer have concluded, based on their evaluation of the registrant’s disclosure controls and procedures as conducted within 90 days of the filing date of this report, that these disclosure controls and procedures are adequately designed and are operating effectively to ensure that information required to be disclosed by the registrant on Form N-CSR is recorded, processed, summarized and reported within the time periods specified in the Securities and Exchange Commission’s rules and forms.
There were no changes in the registrant’s internal control over financial reporting that occurred during the second fiscal quarter of the period covered by this report that have materially affected or are reasonably likely to materially affect, the registrant’s internal control over financial reporting.
(a) (1) The code of ethics that is the subject of the disclosure required by Item 2 is attached hereto.
(a)(2) A separate certification for the principal executive officer and the principal financial officer of the registrant as required by Rule 30a-2 (a) under the Investment Company Act of 1940, as amended (17 CFR 270.30a-2(a)), are filed herewith.
(b) Officer certifications as required by Rule 30a-2 (b) under the Investment Company Act of 1940, as amended (17 CFR 270.30a-2(b)) also accompany this filing as an Exhibit.
SIGNATURES
Pursuant to the requirements of the Securities Exchange Act of 1934 and the Investment Company Act of 1940, the registrant has duly caused this report to be signed on its behalf by the undersigned, thereunto duly authorized.
| | |
Excelsior Funds, Inc (Registrant) |
| |
By (Signature and Title)* | | /s/ Evelyn Dilsaver |
| | Evelyn Dilsaver President |
Date June 2, 2006
Pursuant to the requirements of the Securities Exchange Act of 1934 and the Investment Company Act of 1940, this report has been signed below by the following persons on behalf of the registrant and in the capacities and on the dates indicated.
| | |
| |
By (Signature and Title)* | | /s/ Evelyn Dilsaver |
| | Evelyn Dilsaver President |
Date June 2, 2006
| | |
| |
By (Signature and Title)* | | /s/ George Pereira |
| | George Pereira Treasurer |
Date June 2, 2006
| * | | Print the name and title of each signing officer under his or her signature. |