UNITED STATES
SECURITIES AND EXCHANGE COMMISSION
Washington, D.C. 20549
FORM N-CSR
CERTIFIED SHAREHOLDER REPORT
OF
REGISTERED MANAGEMENT INVESTMENT COMPANIES
| Investment Company Act file number: | 811-04098 | |
Name of Registrant: | Vanguard Chester Funds | |
Address of Registrant: | P.O. Box 2600 | |
| Valley Forge, PA 19482 | ||
Name and address of agent for service: | Anne E. Robinson, Esquire | |
| P.O. Box 876 | ||
| Valley Forge, PA 19482 | ||
Registrant’s telephone number, including area code: (610) 669-1000 | ||
Date of fiscal year end: September 30 | ||
Date of reporting period: October 1, 2016 – March 31, 2017 | ||
Item 1: Reports to Shareholders | ||
Semiannual Report | March 31, 2017
Vanguard PRIMECAP Fund
A new format, unwavering commitment
As you begin reading this report, you’ll notice that we’ve made some improvements to the opening sections—based on feedback from you, our clients.
Page 1 starts with a new ”Your Fund’s Performance at a Glance,” a concise, handy summary of how your fund performed during the period.
In the renamed ”Chairman’s Perspective,” Bill McNabb will focus on enduring principles and investment insights.
We’ve modified some tables, and eliminated some redundancy, but we haven’t removed any information.
At Vanguard, we’re always looking for better ways to communicate and to help you make sound investment decisions. Thank you for entrusting your assets to us.
| Contents | |
| Your Fund’s Performance at a Glance. | 1 |
| Chairman’s Perspective. | 2 |
| Advisor’s Report. | 6 |
| Fund Profile. | 8 |
| Performance Summary. | 9 |
| Financial Statements. | 10 |
| About Your Fund’s Expenses. | 21 |
| Glossary. | 23 |
Please note: The opinions expressed in this report are just that—informed opinions. They should not be considered promises or advice.
Also, please keep in mind that the information and opinions cover the period through the date on the front of this report. Of course, the
risks of investing in your fund are spelled out in the prospectus.
See the Glossary for definitions of investment terms used in this report.
About the cover: No matter what language you speak, Vanguard has one consistent message and set of principles. Our primary
focus is on you, our clients. We conduct our business with integrity as a faithful steward of your assets. This message is shown
translated into seven languages, reflecting our expanding global presence.
Your Fund’s Performance at a Glance
• Vanguard PRIMECAP Fund returned about 11% for the six months ended March 31, 2017, exceeding the return of about 10% for its benchmark, the Standard and Poor’s 500 Index, and the more than 8% return of its multi-capitalization growth fund peers.
• Value stocks outpaced their growth counterparts during the period, and small-cap stocks outperformed large-caps. Seven of PRIMECAP’s industry sectors posted gains; health care, consumer staples, and real estate hurt results.
• PRIMECAP Management Company, the fund’s advisor, traditionally invests most heavily in the information technology and health care sectors. The fund’s technology stocks advanced about 16%, well ahead of those in the benchmark, and contributed about six percentage points to results. However, health care stocks were among the largest detractors from performance.
| Total Returns: Six Months Ended March 31, 2017 | |
| Total | |
| Returns | |
| Vanguard PRIMECAP Fund | |
| Investor Shares | 10.97% |
| Admiral™ Shares | 11.00 |
| S&P 500 Index | 10.12 |
| Multi-Cap Growth Funds Average | 8.35 |
| Multi-Cap Growth Funds Average: Derived from data provided by Lipper, a Thomson Reuters Company. | |
| Admiral Shares carry lower expenses and are available to investors who meet certain account-balance requirements. |
| Expense Ratios | |||
| Your Fund Compared With Its Peer Group | |||
| Investor | Admiral | Peer Group | |
| Shares | Shares | Average | |
| PRIMECAP Fund | 0.39% | 0.33% | 1.23% |
The fund expense ratios shown are from the prospectus dated January 27, 2017, and represent estimated costs for the current fiscal year. For
the six months ended March 31, 2017, the fund’s annualized expense ratios were 0.39% for Investor Shares and 0.32% for Admiral Shares.
The peer-group expense ratio is derived from data provided by Lipper, a Thomson Reuters Company, and captures information through
year-end 2016.
Peer group: Multi-Cap Growth Funds.
1
Chairman’s Perspective

Bill McNabb
Chairman and Chief Executive Officer
Dear Shareholder,
For many people, including me, falling interest rates have been the general trend in the bond market throughout our working lives. At the beginning of 1983, the year I graduated from business school, the yield of the benchmark 10-year U.S. Treasury note stood at more than 10%. It was less than 2.5% at the beginning of 2017.
Because bond prices move in the opposite direction from rates, my career happens to have overlapped with the greatest bull market for bonds in history.
It appears that may be changing. And, of course, there’s no shortage of advice about how to prepare for the shift.
Rates may be headed higher (really)
This bond bull market has reminded us time and again just how hard it is to predict when rates will rise or fall and by how much. If you follow bonds, you might recall the markets bracing for a sustained rate increase back in 2010 as the economy pulled out of recession, or again in 2013 when the Federal Reserve said it would start tapering its bond purchases, or again at the end of 2015 when the Fed raised short-term rates for the first time in almost a decade. And yet, prognostications notwithstanding, interest rates remained anchored near historical lows.
That said, rates seem to be on an upswing. With economic activity picking up, wages starting to move higher, and inflation coming
2
off recent lows, the Fed has nudged short-term rates higher twice in recent months and has signaled that further gradual increases are likely through 2018. The perceived pro-growth stance of the new U.S. administration also has played a role in framing a case for higher rates.
Short-term pain, longer-term gain
Bond investors are understandably concerned. If interest rates shoot up, the market value of bonds will drop sharply, with prices falling to bring yields in line with the new, prevailing higher rates. That’s the potential short-term pain. But long-term investors should actually want rates to go up. If you like bonds that pay 2%, you should love bonds that pay 4%, right?
There’s a simple—though imperfect—rule of thumb that helps make clear this point. If the time frame of your investing goal exceeds the time frame of your bond portfolio (a medium-term goal matched with short-term bonds, or a long-term goal paired with bonds not quite as long-term), rising rates will work out in your favor, maybe decidedly so.
Think of it this way: If you have a big cash need in the near future—say, a tuition bill coming due in a few years—and you own bonds that are long-term in nature, this time-frame mismatch could spell trouble if rates rise sharply; you’d be selling bonds that would be worth less. But if you’re saving to retire ten or 15 years down the road and rates are steadily rising, over time you’ll be earning higher and higher yields.
| Market Barometer | |||
| Total Returns | |||
| Periods Ended March 31, 2017 | |||
| Six | One | Five Years | |
| Months | Year | (Annualized) | |
| Stocks | |||
| Russell 1000 Index (Large-caps) | 10.09% | 17.43% | 13.26% |
| Russell 2000 Index (Small-caps) | 11.52 | 26.22 | 12.35 |
| Russell 3000 Index (Broad U.S. market) | 10.19 | 18.07 | 13.18 |
| FTSE All-World ex US Index (International) | 6.74 | 13.50 | 4.82 |
| Bonds | |||
| Bloomberg Barclays U.S. Aggregate Bond Index | |||
| (Broad taxable market) | -2.18% | 0.44% | 2.34% |
| Bloomberg Barclays Municipal Bond Index | |||
| (Broad tax-exempt market) | -2.10 | 0.15 | 3.24 |
| Citigroup Three-Month U.S. Treasury Bill Index | 0.21 | 0.34 | 0.10 |
| CPI | |||
| Consumer Price Index | 0.98% | 2.38% | 1.23% |
3
Josh Barrickman, our head of fixed income indexing for the Americas, calls it “the virtuous cycle of compounding interest at a higher rate.”
The bottom line is, you can end up better off than if rates haven’t risen because you’re earning more income, which over time more than washes away any price hit.
Beware of short-sighted, short-term moves
This logic can be difficult to grasp, tempting anxious bond investors to make drastic shifts to lessen the immediate pain of rising rates. Unfortunately, such moves can backfire.
Taking shelter in short-term bonds, for example, might seem like a good idea. Their prices generally hold up better than those of longer-term bonds in a rising-rate environment. But they also offer less income.
For example, when the market started worrying about rising rates in 2010, moving into short-term securities—and staying there—would have proved costly. Through 2016, those securities returned roughly half of what the broad U.S. bond market did.
Favoring high-yield bonds is another tack some investors take, expecting higher income to help cushion price declines.
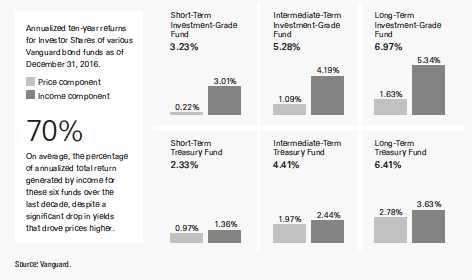
| What has driven long-term returns for Vanguard bond funds? |
4
High-yield securities, however, typically perform best when stocks are rising, making them unlikely to zig when stocks zag.
We saw clear evidence of the correlation between stocks and high-yield bonds in the frantic markets following the United Kingdom’s vote to leave the European Union last year. From June 23 to June 27, both U.S. stocks and U.S. high-yield bonds lost ground. The broad U.S. bond market, meanwhile, climbed 1.2% as investors sought a safe haven.
Your portfolio is more than the sum of its parts
Different assets have different roles to play in a balanced and diversified portfolio. Stocks are valuable because they can produce higher returns over time, while bonds can provide a crucial counterweight to the volatility of stocks.
Perhaps the most important thing to keep in mind about bonds is that although their prices can fluctuate, they remain “fixed income” securities. Barring default, you can be certain of getting income until the bonds mature. It’s that income that drives returns for patient bond investors who resist the urge to jump in and out of the market, as you can see in the accompanying box.
A lot has changed since I first started following the bond market, but the important role that bonds can play in a balanced and diversified portfolio hasn’t.
As always, thank you for investing with Vanguard.
Sincerely,

F. William McNabb III
Chairman and Chief Executive Officer
April 14, 2017
5
Advisor’s Report
For the six months ended March 31, 2017, Vanguard PRIMECAP Fund returned 10.97% for Investor Shares and 11.00% for Admiral Shares. These returns exceeded both the 10.12% return of the fund’s benchmark, the unmanaged Standard & Poor’s 500 Index, and the 8.35% average return of its multi-capitalization growth fund competitors.
The investment environment
Donald Trump’s unexpected victory in the U.S. presidential election resulted in significant market shifts, including higher U.S. stock prices and bond yields. Financials was the best-performing sector in the S&P 500 Index during the period as investors bid up the prices of bank stocks in anticipation of higher interest rates and a reduced regulatory burden. Defensive sectors such as consumer staples, telecommunication services, and utilities underperformed. Health care stocks were volatile as investors considered the impact of a potential repeal of the Affordable Care Act and politicians continued to criticize drug companies for their pricing practices. Cyclical sectors such as industrials, information technology, and consumer discretionary outperformed.
Portfolio update
The portfolio remains heavily overweighted in information technology, health care, and industrial stocks, with these sectors making up 78% of ending assets, compared with 46% in the S&P 500 Index. The portfolio’s most significant underweights are in consumer staples, energy, real estate, and utilities, which collectively accounted for 1% of ending assets, compared with 22% in the S&P 500 Index. The portfolio is also significantly underweighted in financials, materials, and telecommunication services, which represented 9% of ending assets, compared with 20% in the index.
In information technology, the fund is most overweighted in semiconductor and semiconductor equipment stocks (12% versus 3% for the S&P 500 Index) and software (11% versus 5% for the index). During the period, the fund’s semiconductor and semiconductor equipment holdings returned 24%, led by NVIDIA (+59%), Micron Technology (+63%), and Texas Instruments (+16%).
Within health care, the fund is most overweighted in biotechnology and pharmaceutical stocks, whose 20% combined weighting was more than double the 8% in the S&P 500 Index. The health care sector underperformed with a return of 4%, and our health care holdings returned 1%. Drug stocks were hurt by pricing concerns, a lull in industry productivity, and the failure of a couple of high-profile drug candidates in clinical trials.
The fund is also significantly overweighted in industrial stocks (17% versus 10% for the S&P 500 Index) because of its investments in airlines (7% versus 1% for the index) and air freight & logistics (4% versus 1%). The fund’s airline holdings returned 32%.
As of March 31, 2017, the fund’s top 10 holdings represented 41% of assets.
6
Advisor perspectives
The fund is most heavily weighted in information technology stocks, which accounted for 36% of holdings as of the end of the period, compared with 22% in the S&P 500 Index. We expect the semiconductor industry to continue to grow as declining costs for information processing, storage, and transmission drive increased consumption. For example, the number of internet-connected endpoints is expected to grow rapidly, as previously unconnected objects such as industrial equipment, cars, consumer electronics, and appliances are brought online and as low-cost sensors enable new applications for businesses and consumers.
This so-called “internet of things” is expected to transform the manufacturing and health care industries as the availability of real-time information will allow for dramatic cost and quality improvements. Meanwhile, software algorithms are becoming increasingly capable of “learning” and solving complex problems by ingesting and processing enormous quantities of data. Semiconductors are the physical devices that enable the internet of things, self-learning algorithms, and the vast majority of other information processing, storage, and transmission-based products and services that businesses and consumers increasingly rely on. Barriers to entry in the semiconductor and semiconductor equipment industries are significant, and the industry has consolidated over the past couple of decades. However, China-based companies are expected to play an increasing role in the global industry, a trend we are watching closely.
Outside of information technology, we remain enthusiastic about the fund’s airline holdings, whose extraordinarily low valuation multiples reflect a high degree of skepticism about their ability to sustain current profits. We are excited by the prospects for our health care holdings, many of which currently trade at below-average valuations in spite of superior secular growth prospects.
Conclusion
As bottom-up stock pickers, we spend our time searching for opportunities to invest in stocks with long-term prospects we find to be materially better than market prices would seem to imply. Our approach often results in portfolios that bear little resemblance to market indices, creating the possibility for substantial deviations in relative performance. For example, our relative returns were significantly negative during the first half of calendar 2016 when the fund’s overweighted sectors and industries underperformed, and we expect to experience similar conditions in the future. We nonetheless believe that this approach can generate superior results for shareholders over the long term.
PRIMECAP Management Company April 14, 2017
7
PRIMECAP Fund
Fund Profile
As of March 31, 2017
| Share-Class Characteristics | ||
| Investor | Admiral | |
| Shares | Shares | |
| Ticker Symbol | VPMCX | VPMAX |
| Expense Ratio1 | 0.39% | 0.33% |
| 30-Day SEC Yield | 1.22% | 1.29% |
| Portfolio Characteristics | |||
| DJ | |||
| U.S. Total | |||
| S&P 500 | Market | ||
| Fund | Index | FA Index | |
| Number of Stocks | 132 | 505 | 3,813 |
| Median Market Cap | $65.1B | $88.5B | $58.2B |
| Price/Earnings Ratio | 22.1x | 23.9x | 25.4x |
| Price/Book Ratio | 4.1x | 3.1x | 3.0x |
| Return on Equity | 19.0% | 17.2% | 16.3% |
| Earnings Growth Rate | 10.3% | 7.0% | 7.3% |
| Dividend Yield | 1.6% | 2.0% | 1.9% |
| Foreign Holdings | 9.7% | 0.0% | 0.0% |
| Turnover Rate | |||
| (Annualized) | 6% | — | — |
| Short-Term Reserves | 3.7% | — | — |
| Sector Diversification (% of equity exposure) | |||
| DJ | |||
| U.S. Total | |||
| S&P 500 | Market | ||
| Fund | Index FA | Index | |
| Consumer | |||
| Discretionary | 8.1% | 12.3% | 12.7% |
| Consumer Staples | 0.3 | 9.3 | 8.3 |
| Energy | 1.1 | 6.6 | 6.2 |
| Financials | 7.3 | 14.4 | 14.8 |
| Health Care | 24.8 | 13.9 | 13.3 |
| Industrials | 18.0 | 10.1 | 10.7 |
| Information | |||
| Technology | 37.8 | 22.1 | 21.2 |
| Materials | 1.7 | 2.8 | 3.4 |
| Real Estate | 0.0 | 2.9 | 4.1 |
| Telecommunication | |||
| Services | 0.9 | 2.4 | 2.1 |
| Utilities | 0.0 | 3.2 | 3.2 |
| Volatility Measures | ||
| DJ | ||
| U.S. Total | ||
| S&P 500 | Market | |
| Index | FA Index | |
| R-Squared | 0.88 | 0.89 |
| Beta | 1.03 | 1.00 |
| These measures show the degree and timing of the fund’s | ||
| fluctuations compared with the indexes over 36 months. | ||
| Ten Largest Holdings (% of total net assets) | ||
| Biogen Inc. | Biotechnology | 4.8% |
| Eli Lilly & Co. | Pharmaceuticals | 4.6 |
| Alphabet Inc. | Internet Software & | |
| Services | 4.5 | |
| Texas Instruments Inc. | Semiconductors | 4.5 |
| Adobe Systems Inc. | Application Software | 4.4 |
| Microsoft Corp. | Systems Software | 4.3 |
| Amgen Inc. | Biotechnology | 4.0 |
| FedEx Corp. | Air Freight & | |
| Logistics | 3.6 | |
| Southwest Airlines Co. | Airlines | 3.5 |
| Roche Holding AG | Pharmaceuticals | 2.7 |
| Top Ten | 40.9% | |
| The holdings listed exclude any temporary cash investments and | ||
| equity index products. | ||
Investment Focus
1 The expense ratios shown are from the prospectus dated January 27, 2017, and represent estimated costs for the current fiscal year. For the six
months ended March 31, 2017, the annualized expense ratios were 0.39% for Investor Shares and 0.32% for Admiral Shares.
8
PRIMECAP Fund
Performance Summary
All of the returns in this report represent past performance, which is not a guarantee of future results that may be achieved by the fund. (Current performance may be lower or higher than the performance data cited. For performance data current to the most recent month-end, visit our website at vanguard.com/performance.) Note, too, that both investment returns and principal value can fluctuate widely, so an investor’s shares, when sold, could be worth more or less than their original cost. The returns shown do not reflect taxes that a shareholder would pay on fund distributions or on the sale of fund shares.
Fiscal-Year Total Returns (%): September 30, 2006, Through March 31, 2017
![]()
Note: For 2017, performance data reflect the six months ended March 31, 2017.
| Average Annual Total Returns: Periods Ended March 31, 2017 | ||||
| Inception | One | Five | Ten | |
| Date | Year | Years | Years | |
| Investor Shares | 11/1/1984 | 22.17% | 16.31% | 10.17% |
| Admiral Shares | 11/12/2001 | 22.25 | 16.40 | 10.27 |
See Financial Highlights for dividend and capital gains information.
9
PRIMECAP Fund
Financial Statements (unaudited)
Statement of Net Assets
As of March 31, 2017
The fund reports a complete list of its holdings in regulatory filings four times in each fiscal year, at the quarter-ends. For the second and fourth fiscal quarters, the lists appear in the fund’s semiannual and annual reports to shareholders. For the first and third fiscal quarters, the fund files the lists with the Securities and Exchange Commission on Form N-Q. Shareholders can look up the fund’s Forms N-Q on the SEC’s website at sec.gov. Forms N-Q may also be reviewed and copied at the SEC’s Public Reference Room (see the back cover of this report for further information).
| Market | |||
| Value• | |||
| Shares | ($000) | ||
| Common Stocks (96.3%) | |||
| Consumer Discretionary (7.8%) | |||
| Ross Stores Inc. | 9,009,800 | 593,475 | |
| ^ | Sony Corp. ADR | 17,497,700 | 590,197 |
| TJX Cos. Inc. | 6,945,900 | 549,282 | |
| L Brands Inc. | 10,102,543 | 475,830 | |
| Walt Disney Co. | 4,008,600 | 454,535 | |
| Carnival Corp. | 7,065,400 | 416,223 | |
| Royal Caribbean Cruises | |||
| Ltd. | 2,810,333 | 275,722 | |
| * | Amazon.com Inc. | 208,465 | 184,813 |
| Whirlpool Corp. | 491,258 | 84,167 | |
| Bed Bath & Beyond Inc. | 1,603,375 | 63,269 | |
| Comcast Corp. Class A | 1,443,200 | 54,250 | |
| * | Charter Communications | ||
| Inc. Class A | 138,500 | 45,334 | |
| Lowe’s Cos. Inc. | 533,400 | 43,851 | |
| VF Corp. | 755,200 | 41,513 | |
| Marriott International Inc. | |||
| Class A | 343,300 | 32,332 | |
| MGM Resorts | |||
| International | 1,100,000 | 30,140 | |
| Newell Brands Inc. | 493,700 | 23,288 | |
| Las Vegas Sands Corp. | 391,100 | 22,320 | |
| ^,* | Tesla Inc. | 70,000 | 19,481 |
| CBS Corp. Class B | 205,000 | 14,219 | |
| Hilton Worldwide | |||
| Holdings Inc. | 191,266 | 11,181 | |
| * | CarMax Inc. | 157,500 | 9,327 |
| * | AutoZone Inc. | 11,800 | 8,532 |
| Adient plc | 70,000 | 5,087 | |
| 4,048,368 | |||
| Consumer Staples (0.3%) | |||
| CVS Health Corp. | 2,119,065 | 166,347 | |
| Energy (1.1%) | |||
| Schlumberger Ltd. | 2,472,500 | 193,102 | |
| EOG Resources Inc. | 1,906,100 | 185,940 | |
| ^,* | Transocean Ltd. | 7,914,579 | 98,536 |
| Noble Energy Inc. | 2,199,800 | 75,541 | |
| National Oilwell Varco Inc. | 462,100 | 18,526 | |
| 571,645 | |||
| Financials (7.0%) | |||
| JPMorgan Chase & Co. | 10,973,900 | 963,947 | |
| Charles Schwab Corp. | 20,099,900 | 820,277 | |
| Wells Fargo & Co. | 11,217,000 | 624,338 | |
| Marsh & McLennan | |||
| Cos. Inc. | 6,608,976 | 488,337 | |
| Progressive Corp. | 5,003,000 | 196,018 | |
| US Bancorp | 3,425,000 | 176,387 | |
| Discover Financial | |||
| Services | 1,573,400 | 107,605 | |
| CME Group Inc. | 844,850 | 100,368 | |
| Citigroup Inc. | 1,250,000 | 74,775 | |
| American Express Co. | 412,700 | 32,649 | |
| Travelers Cos. Inc. | 244,400 | 29,460 | |
| Chubb Ltd. | 41,233 | 5,618 | |
| 3,619,779 | |||
| Health Care (23.8%) | |||
| * | Biogen Inc. | 9,167,097 | 2,506,468 |
| Eli Lilly & Co. | 28,457,200 | 2,393,535 | |
| Amgen Inc. | 12,595,500 | 2,066,544 | |
| Roche Holding AG | 5,438,500 | 1,390,808 | |
| Novartis AG ADR | 12,547,865 | 931,930 | |
| * | Boston Scientific Corp. | 27,164,560 | 675,583 |
| ^ | AstraZeneca plc ADR | 18,265,000 | 568,772 |
| Medtronic plc | 6,045,700 | 487,042 | |
| Thermo Fisher | |||
| Scientific Inc. | 2,578,600 | 396,073 | |
| Abbott Laboratories | 5,890,768 | 261,609 | |
| * | Bioverativ Inc. | 4,583,548 | 249,620 |
| Johnson & Johnson | 700,000 | 87,185 | |
| Merck & Co. Inc. | 975,000 | 61,951 | |
| Agilent Technologies Inc. | 1,060,400 | 56,063 | |
| Sanofi ADR | 1,046,100 | 47,336 | |
| * | BioMarin Pharmaceutical | ||
| Inc. | 448,243 | 39,347 | |
| Bristol-Myers Squibb Co. | 625,000 | 33,987 | |
10
PRIMECAP Fund
| Market | |||
| Value• | |||
| Shares | ($000) | ||
| AbbVie Inc. | 500,000 | 32,580 | |
| Zimmer Biomet Holdings | |||
| Inc. | 230,000 | 28,085 | |
| GlaxoSmithKline plc ADR | 575,000 | 24,242 | |
| Stryker Corp. | 180,900 | 23,815 | |
| 12,362,575 | |||
| Industrials (17.4%) | |||
| FedEx Corp. | 9,471,668 | 1,848,396 | |
| 1 | Southwest Airlines Co. | 33,597,600 | 1,806,207 |
| Airbus SE | 11,632,658 | 887,130 | |
| American Airlines Group | |||
| Inc. | 17,559,200 | 742,754 | |
| Alaska Air Group Inc. | 5,023,600 | 463,276 | |
| Caterpillar Inc. | 4,752,600 | 440,851 | |
| Honeywell International | |||
| Inc. | 3,310,700 | 413,407 | |
| * | United Continental | ||
| Holdings Inc. | 5,801,500 | 409,818 | |
| Delta Air Lines Inc. | 7,610,500 | 349,779 | |
| Deere & Co. | 3,171,700 | 345,271 | |
| Union Pacific Corp. | 2,400,700 | 254,282 | |
| United Parcel Service | |||
| Inc. Class B | 2,132,470 | 228,814 | |
| Boeing Co. | 856,600 | 151,498 | |
| United Technologies | |||
| Corp. | 1,153,700 | 129,457 | |
| CSX Corp. | 2,530,000 | 117,771 | |
| Safran SA | 1,356,800 | 101,264 | |
| Pentair plc | 1,240,000 | 77,847 | |
| Textron Inc. | 1,035,000 | 49,256 | |
| General Dynamics Corp. | 170,000 | 31,824 | |
| Siemens AG | 220,000 | 30,134 | |
| Rockwell Collins Inc. | 310,000 | 30,120 | |
| Johnson Controls | |||
| International plc | 700,000 | 29,484 | |
| Rockwell Automation Inc. | 153,500 | 23,901 | |
| TransDigm Group Inc. | 89,000 | 19,594 | |
| Expeditors International | |||
| of Washington Inc. | 185,000 | 10,451 | |
| * | Herc Holdings Inc. | 142,699 | 6,977 |
| 8,999,563 | |||
| Information Technology (36.4%) | |||
| Texas Instruments Inc. | 28,690,600 | 2,311,315 | |
| * | Adobe Systems Inc. | 17,490,970 | 2,276,100 |
| Microsoft Corp. | 34,191,100 | 2,251,826 | |
| NVIDIA Corp. | 10,926,200 | 1,190,191 | |
| * | Alphabet Inc. Class C | 1,433,111 | 1,188,852 |
| * | Alphabet Inc. Class A | 1,339,675 | 1,135,776 |
| * | Micron Technology Inc. | 32,215,000 | 931,014 |
| * | Alibaba Group Holding | ||
| Ltd. ADR | 8,194,200 | 883,581 | |
| Hewlett Packard | |||
| Enterprise Co. | 29,307,985 | 694,599 | |
| KLA-Tencor Corp. | 6,949,500 | 660,689 | |
| 1 | NetApp Inc. | 14,104,800 | 590,286 |
| HP Inc. | 31,452,585 | 562,372 | |
| Cisco Systems Inc. | 14,871,150 | 502,645 | |
| Intuit Inc. | 4,275,000 | 495,857 | |
| Intel Corp. | 13,664,000 | 492,861 | |
| QUALCOMM Inc. | 8,351,750 | 478,889 | |
| Activision Blizzard Inc. | 5,857,100 | 292,035 | |
| Oracle Corp. | 6,000,000 | 267,660 | |
| ^ | Telefonaktiebolaget LM | ||
| Ericsson ADR | 36,722,504 | 243,837 | |
| Analog Devices Inc. | 2,435,000 | 199,548 | |
| 1 | Plantronics Inc. | 3,619,000 | 195,824 |
| Visa Inc. Class A | 1,680,200 | 149,319 | |
| Corning Inc. | 5,126,300 | 138,410 | |
| * | Dell Technologies Inc. | ||
| Class V | 1,999,948 | 128,157 | |
| * | BlackBerry Ltd. | 10,205,900 | 79,096 |
| Apple Inc. | 539,700 | 77,533 | |
| * | eBay Inc. | 2,225,200 | 74,700 |
| * | Yahoo! Inc. | 1,363,100 | 63,261 |
| * | salesforce.com Inc. | 733,000 | 60,465 |
| * | Entegris Inc. | 2,525,872 | 59,105 |
| * | PayPal Holdings Inc. | 1,250,000 | 53,775 |
| Applied Materials Inc. | 1,157,500 | 45,027 | |
| * | Rambus Inc. | 3,023,770 | 39,732 |
| Mastercard Inc. Class A | 250,000 | 28,118 | |
| * | Keysight Technologies | ||
| Inc. | 332,000 | 11,999 | |
| Western Digital Corp. | 116,650 | 9,627 | |
| 18,864,081 | |||
| Materials (1.6%) | |||
| Monsanto Co. | 5,900,125 | 667,894 | |
| Praxair Inc. | 906,600 | 107,523 | |
| Dow Chemical Co. | 675,000 | 42,890 | |
| ^ | Potash Corp. of | ||
| Saskatchewan Inc. | 640,000 | 10,931 | |
| 829,238 | |||
| Real Estate (0.0%) | |||
| Park Hotels & Resorts Inc. 59,251 | 1,521 | ||
| Telecommunication Services (0.9%) | |||
| AT&T Inc. | 10,595,842 | 440,257 | |
| * | T-Mobile US Inc. | 110,000 | 7,105 |
| 447,362 | |||
| Total Common Stocks | |||
| (Cost $21,578,295) | 49,910,479 | ||
| Temporary Cash Investment (4.1%) | |||
| Money Market Fund (4.1%) | |||
| 2,3 | Vanguard Market | ||
| Liquidity Fund, 0.965% | |||
| (Cost $2,140,208) | 21,401,288 | 2,140,557 | |
| Total Investments (100.4%) | |||
| (Cost $23,718,503) | 52,051,036 | ||
11
PRIMECAP Fund
| Market | |
| Value• | |
| ($000) | |
| Other Assets and Liabilities (-0.4%) | |
| Other Assets | 152,986 |
| Liabilities 3 | (351,251) |
| Net Assets (100%) | 51,852,771 |
| Amount | |
| ($000) | |
| Statement of Assets and Liabilities | |
| Assets | |
| Investments in Securities, at Value | |
| Unaffiliated Issuers | 47,318,162 |
| Affiliated Vanguard Funds | 2,140,557 |
| Other Affiliated Issuers | 2,592,317 |
| Total Investments in Securities | 52,051,036 |
| Investment in Vanguard | 3,581 |
| Receivables for Investment | |
| Securities Sold | 20,721 |
| Receivables for Accrued Income | 95,188 |
| Receivables for Capital Shares Issued | 20,457 |
| Other Assets | 13,039 |
| Total Assets | 52,204,022 |
| Liabilities | |
| Payables for Investment Securities | |
| Purchased | 32,143 |
| Collateral for Securities on Loan | 206,238 |
| Payables to Investment Advisor | 24,206 |
| Payables for Capital Shares Redeemed | 11,013 |
| Payables to Vanguard | 63,614 |
| Other Liabilities | 14,037 |
| Total Liabilities | 351,251 |
| Net Assets | 51,852,771 |
| At March 31, 2017, net assets consisted of: | |
| Amount | |
| ($000) | |
| Paid-in Capital | 22,589,132 |
| Undistributed Net Investment Income | 165,249 |
| Accumulated Net Realized Gains | 767,292 |
| Unrealized Appreciation (Depreciation) | |
| Investment Securities | 28,332,533 |
| Foreign Currencies | (1,435) |
| Net Assets | 51,852,771 |
| Investor Shares—Net Assets | |
| Applicable to 67,980,281 outstanding | |
| $.001 par value shares of beneficial | |
| interest (unlimited authorization) | 7,732,011 |
| Net Asset Value Per Share— | |
| Investor Shares | $113.74 |
| Admiral Shares—Net Assets | |
| Applicable to 374,450,345 outstanding | |
| $.001 par value shares of beneficial | |
| interest (unlimited authorization) | 44,120,760 |
| Net Asset Value Per Share— | |
| Admiral Shares | $117.83 |
• See Note A in Notes to Financial Statements.
^ Includes partial security positions on loan to broker-dealers. The total value of securities on loan is $199,352,000.
* Non-income-producing security.
1 Considered an affiliated company of the fund as the fund owns more than 5% of the outstanding voting securities of such company.
2 Affiliated money market fund available only to Vanguard funds and certain trusts and accounts managed by Vanguard. Rate shown is the
7-day yield.
3 Includes $206,238,000 of collateral received for securities on loan.
ADR—American Depositary Receipt.
See accompanying Notes, which are an integral part of the Financial Statements.
12
PRIMECAP Fund
Statement of Operations
| Six Months Ended | |
| March 31, 2017 | |
| ($000) | |
| Investment Income | |
| Income | |
| Dividends1 | 437,993 |
| Interest | 7,490 |
| Securities Lending—Net | 374 |
| Total Income | 445,857 |
| Expenses | |
| Investment Advisory Fees—Note B | 47,167 |
| The Vanguard Group—Note C | |
| Management and Administrative—Investor Shares | 6,828 |
| Management and Administrative—Admiral Shares | 25,290 |
| Marketing and Distribution—Investor Shares | 640 |
| Marketing and Distribution—Admiral Shares | 1,269 |
| Custodian Fees | 149 |
| Shareholders’ Reports—Investor Shares | 56 |
| Shareholders’ Reports—Admiral Shares | 64 |
| Trustees’ Fees and Expenses | 47 |
| Total Expenses | 81,510 |
| Net Investment Income | 364,347 |
| Realized Net Gain (Loss) | |
| Investment Securities Sold | 849,885 |
| Foreign Currencies | (377) |
| Realized Net Gain (Loss) | 849,508 |
| Change in Unrealized Appreciation (Depreciation) | |
| Investment Securities | 3,946,760 |
| Foreign Currencies | (1,104) |
| Change in Unrealized Appreciation (Depreciation) | 3,945,656 |
| Net Increase (Decrease) in Net Assets Resulting from Operations | 5,159,511 |
| 1 Dividends are net of foreign withholding taxes of $13,142,000. | |
See accompanying Notes, which are an integral part of the Financial Statements.
13
PRIMECAP Fund
Statement of Changes in Net Assets
| Six Months Ended | Year Ended | |
| March 31, | September 30, | |
| 2017 | 2016 | |
| ($000) | ($000) | |
| Increase (Decrease) in Net Assets | ||
| Operations | ||
| Net Investment Income | 364,347 | 641,839 |
| Realized Net Gain (Loss) | 849,508 | 2,232,245 |
| Change in Unrealized Appreciation (Depreciation) | 3,945,656 | 4,416,438 |
| Net Increase (Decrease) in Net Assets Resulting from Operations | 5,159,511 | 7,290,522 |
| Distributions | ||
| Net Investment Income | ||
| Investor Shares | (92,535) | (86,405) |
| Admiral Shares | (531,693) | (426,673) |
| Realized Capital Gain1 | ||
| Investor Shares | (269,344) | (370,752) |
| Admiral Shares | (1,457,828) | (1,709,108) |
| Total Distributions | (2,351,400) | (2,592,938) |
| Capital Share Transactions | ||
| Investor Shares | (281,789) | (945,771) |
| Admiral Shares | 1,885,749 | 1,174,655 |
| Net Increase (Decrease) from Capital Share Transactions | 1,603,960 | 228,884 |
| Total Increase (Decrease) | 4,412,071 | 4,926,468 |
| Net Assets | ||
| Beginning of Period | 47,440,700 | 42,514,232 |
| End of Period2 | 51,852,771 | 47,440,700 |
| 1 Includes fiscal 2017 and 2016 short-term gain distributions totaling $54,305,000 and $0, respectively. Short-term gain distributions are | ||
| treated as ordinary income dividends for tax purposes. | ||
| 2 Net Assets—End of Period includes undistributed (overdistributed) net investment income of $165,249,000 and $425,507,000. | ||
See accompanying Notes, which are an integral part of the Financial Statements.
14
PRIMECAP Fund
Financial Highlights
| Investor Shares | |||||||
| Six Months | |||||||
| Ended | |||||||
| For a Share Outstanding | March 31, | Year Ended September 30, | |||||
| Throughout Each Period | 2017 | 2016 | 2015 | 2014 | 2013 | 2012 | |
| Net Asset Value, Beginning of Period | $107.60 | $96.99 | $104.16 | $87.83 | $69.39 | $58.46 | |
| Investment Operations | |||||||
| Net Investment Income | .787 | 1.401 | 1.329 | 1.124 | 1.033 | .866 | |
| Net Realized and Unrealized Gain (Loss) | |||||||
| on Investments | 10.656 | 15.103 | (1.631) | 19.812 | 19.093 | 12.857 | |
| Total from Investment Operations | 11.443 | 16.504 | (. 302) | 20.936 | 20.126 | 13.723 | |
| Distributions | |||||||
| Dividends from Net Investment Income | (1.356) | (1.114) | (1.160) | (.836) | (.965) | (.689) | |
| Distributions from Realized Capital Gains | (3.947) | (4.780) | (5.708) | (3.770) | (.721) | (2.104) | |
| Total Distributions | (5.303) | (5.894) | (6.868) | (4.606) | (1.686) | (2.793) | |
| Net Asset Value, End of Period | $113.74 | $107.60 | $96.99 | $104.16 | $87.83 | $69.39 | |
| Total Return1 | 10.97% | 17.40% | -0.76% | 24.72% | 29.63% | 24.17% | |
| Ratios/Supplemental Data | |||||||
| Net Assets, End of Period (Millions) | $7,732 | $7,588 | $7,741 | $13,273 | $13,059 | $13,632 | |
| Ratio of Total Expenses to | |||||||
| Average Net Assets | 0.39% | 0.39% | 0.40% | 0.44% | 0.45% | 0.45% | |
| Ratio of Net Investment Income to | |||||||
| Average Net Assets | 1.43% | 1.37% | 1.33% | 1.17% | 1.32% | 1.30% | |
| Portfolio Turnover Rate | 6% | 6% | 9% | 11% | 5% | 6% | |
The expense ratio, net investment income ratio, and turnover rate for the current period have been annualized.
1 Total returns do not include transaction or account service fees that may have applied in the periods shown. Fund prospectuses provide
information about any applicable transaction and account service fees.
See accompanying Notes, which are an integral part of the Financial Statements.
15
PRIMECAP Fund
Financial Highlights
| Admiral Shares | |||||||
| Six Months | |||||||
| Ended | |||||||
| For a Share Outstanding | March 31, | Year Ended September 30, | |||||
| Throughout Each Period | 2017 | 2016 | 2015 | 2014 | 2013 | 2012 | |
| Net Asset Value, Beginning of Period | $111.52 | $100.53 | $108.08 | $91.15 | $72.03 | $60.69 | |
| Investment Operations | |||||||
| Net Investment Income | .861 | 1.532 | 1.550 | 1.286 | 1.178 | .974 | |
| Net Realized and Unrealized Gain (Loss) | |||||||
| on Investments | 11.028 | 15.645 | (1.784) | 20.536 | 19.769 | 13.333 | |
| Total from Investment Operations | 11.889 | 17.177 | (. 234) | 21.822 | 20.947 | 14.307 | |
| Distributions | |||||||
| Dividends from Net Investment Income | (1.491) | (1.236) | (1.403) | (.983) | (1.079) | (.785) | |
| Distributions from Realized Capital Gains | (4.088) | (4.951) | (5.913) | (3.909) | (.748) | (2.182) | |
| Total Distributions | (5.579) | (6.187) | (7.316) | (4.892) | (1.827) | (2.967) | |
| Net Asset Value, End of Period | $117.83 | $111.52 | $100.53 | $108.08 | $91.15 | $72.03 | |
| Total Return1 | 11.00% | 17.48% | -0.69% | 24.85% | 29.73% | 24.29% | |
| Ratios/Supplemental Data | |||||||
| Net Assets, End of Period (Millions) | $44,121 | $39,852 | $34,773 | $30,982 | $23,129 | $15,978 | |
| Ratio of Total Expenses to | |||||||
| Average Net Assets | 0.32% | 0.33% | 0.34% | 0.35% | 0.36% | 0.36% | |
| Ratio of Net Investment Income to | |||||||
| Average Net Assets | 1.50% | 1.43% | 1.39% | 1.26% | 1.41% | 1.39% | |
| Portfolio Turnover Rate | 6% | 6% | 9% | 11% | 5% | 6% | |
The expense ratio, net investment income ratio, and turnover rate for the current period have been annualized.
1 Total returns do not include transaction or account service fees that may have applied in the periods shown. Fund prospectuses provide
information about any applicable transaction and account service fees.
See accompanying Notes, which are an integral part of the Financial Statements.
16
PRIMECAP Fund
Notes to Financial Statements
Vanguard PRIMECAP Fund is registered under the Investment Company Act of 1940 as an open-end investment company, or mutual fund. The fund offers two classes of shares: Investor Shares and Admiral Shares. Investor Shares are available to any investor who meets the fund’s minimum purchase requirements. Admiral Shares are designed for investors who meet certain administrative, service, and account-size criteria.
A. The following significant accounting policies conform to generally accepted accounting principles for U.S. investment companies. The fund consistently follows such policies in preparing its financial statements.
1. Security Valuation: Securities are valued as of the close of trading on the New York Stock Exchange (generally 4 p.m., Eastern time) on the valuation date. Equity securities are valued at the latest quoted sales prices or official closing prices taken from the primary market in which each security trades; such securities not traded on the valuation date are valued at the mean of the latest quoted bid and asked prices. Securities for which market quotations are not readily available, or whose values have been affected by events occurring before the fund’s pricing time but after the close of the securities’ primary markets, are valued at their fair values calculated according to procedures adopted by the board of trustees. These procedures include obtaining quotations from an independent pricing service, monitoring news to identify significant market- or security-specific events, and evaluating changes in the values of foreign market proxies (for example, ADRs, futures contracts, or exchange-traded funds), between the time the foreign markets close and the fund’s pricing time. When fair-value pricing is employed, the prices of securities used by a fund to calculate its net asset value may differ from quoted or published prices for the same securities. Investments in Vanguard Market Liquidity Fund are valued at that fund’s net asset value.
2. Foreign Currency: Securities and other assets and liabilities denominated in foreign currencies are translated into U.S. dollars using exchange rates obtained from an independent third party as of the fund’s pricing time on the valuation date. Realized gains (losses) and unrealized appreciation (depreciation) on investment securities include the effects of changes in exchange rates since the securities were purchased, combined with the effects of changes in security prices. Fluctuations in the value of other assets and liabilities resulting from changes in exchange rates are recorded as unrealized foreign currency gains (losses) until the assets or liabilities are settled in cash, at which time they are recorded as realized foreign currency gains (losses).
3. Federal Income Taxes: The fund intends to continue to qualify as a regulated investment company and distribute all of its taxable income. Management has analyzed the fund’s tax positions taken for all open federal income tax years (September 30, 2013–2016), and for the period ended March 31, 2017, and has concluded that no provision for federal income tax is required in the fund’s financial statements.
4. Distributions: Distributions to shareholders are recorded on the ex-dividend date.
5. Securities Lending: To earn additional income, the fund lends its securities to qualified institutional borrowers. Security loans are subject to termination by the fund at any time, and are required to be secured at all times by collateral in an amount at least equal to the market value of securities loaned. Daily market fluctuations could cause the value of loaned securities to be more or less than the value of the collateral received. When this occurs, the collateral is adjusted and settled on the next business day. The fund further mitigates its counterparty risk by entering into securities lending transactions only with a diverse group of prequalified counterparties, monitoring their financial strength, and entering into master securities lending agreements with its counterparties. The master securities
17
PRIMECAP Fund
lending agreements provide that, in the event of a counterparty’s default (including bankruptcy), the fund may terminate any loans with that borrower, determine the net amount owed, and sell or retain the collateral up to the net amount owed to the fund; however, such actions may be subject to legal proceedings. While collateral mitigates counterparty risk, in the event of a default the fund may experience delays and costs in recovering the securities loaned. The fund invests cash collateral received in Vanguard Market Liquidity Fund, and records a liability in the Statement of Assets and Liabilities for the return of the collateral, during the period the securities are on loan. Securities lending income represents fees charged to borrowers plus income earned on invested cash collateral, less expenses associated with the loan. During the term of the loan, the fund is entitled to all distributions made on or in respect of the loaned securities.
6. Credit Facility: The fund and certain other funds managed by The Vanguard Group (“Vanguard”) participate in a $3.1 billion committed credit facility provided by a syndicate of lenders pursuant to a credit agreement that may be renewed annually; each fund is individually liable for its borrowings, if any, under the credit facility. Borrowings may be utilized for temporary and emergency purposes, and are subject to the fund’s regulatory and contractual borrowing restrictions. The participating funds are charged administrative fees and an annual commitment fee of 0.10% of the undrawn amount of the facility; these fees are allocated to the funds based on a method approved by the fund’s board of trustees and included in Management and Administrative expenses on the fund’s Statement of Operations. Any borrowings under this facility bear interest at a rate based upon the higher of the one-month London Interbank Offered Rate, federal funds effective rate, or overnight bank funding rate plus an agreed-upon spread.
The fund had no borrowings outstanding at March 31, 2017, or at any time during the period then ended.
7. Other: Dividend income is recorded on the ex-dividend date. Interest income includes income distributions received from Vanguard Market Liquidity Fund and is accrued daily. Premiums and discounts on debt securities purchased are amortized and accreted, respectively, to interest income over the lives of the respective securities. Security transactions are accounted for on the date securities are bought or sold. Costs used to determine realized gains (losses) on the sale of investment securities are those of the specific securities sold.
Each class of shares has equal rights as to assets and earnings, except that each class separately bears certain class-specific expenses related to maintenance of shareholder accounts (included in Management and Administrative expenses) and shareholder reporting. Marketing and distribution expenses are allocated to each class of shares based on a method approved by the board of trustees. Income, other non-class-specific expenses, and gains and losses on investments are allocated to each class of shares based on its relative net assets.
B. PRIMECAP Management Company provides investment advisory services to the fund for a fee calculated at an annual percentage rate of average net assets. For the six months ended March 31, 2017, the investment advisory fee represented an effective annual rate of 0.19% of the fund’s average net assets.
C. In accordance with the terms of a Funds’ Service Agreement (the “FSA”) between Vanguard and the fund, Vanguard furnishes to the fund corporate management, administrative, marketing, and distribution services at Vanguard’s cost of operations (as defined by the FSA). These costs of operations are allocated to the fund based on methods and guidelines approved by the board of trustees. Vanguard does not require reimbursement in the current period for certain costs of
18
PRIMECAP Fund
operations (such as deferred compensation/benefits and risk/insurance costs); the fund’s liability for these costs of operations is included in Payables to Vanguard on the Statement of Assets and Liabilities.
Upon the request of Vanguard, the fund may invest up to 0.40% of its net assets as capital in Vanguard. At March 31, 2017, the fund had contributed to Vanguard capital in the amount of $3,581,000, representing 0.01% of the fund’s net assets and 1.43% of Vanguard’s capitalization. The fund’s trustees and officers are also directors and employees, respectively, of Vanguard.
D. Various inputs may be used to determine the value of the fund’s investments. These inputs are summarized in three broad levels for financial statement purposes. The inputs or methodologies used to value securities are not necessarily an indication of the risk associated with investing in those securities.
Level 1—Quoted prices in active markets for identical securities.
Level 2—Other significant observable inputs (including quoted prices for similar securities, interest rates, prepayment speeds, credit risk, etc.).
Level 3—Significant unobservable inputs (including the fund’s own assumptions used to determine the fair value of investments).
The following table summarizes the market value of the fund’s investments as of March 31, 2017, based on the inputs used to value them:
| Level 1 | Level 2 | Level 3 | |
| Investments | ($000) | ($000) | ($000) |
| Common Stocks | 47,501,143 | 2,409,336 | — |
| Temporary Cash Investments | 2,140,557 | — | — |
| Total | 49,641,700 | 2,409,336 | — |
E. Distributions are determined on a tax basis and may differ from net investment income and realized capital gains for financial reporting purposes. Differences may be permanent or temporary. Permanent differences are reclassified among capital accounts in the financial statements to reflect their tax character. Temporary differences arise when certain items of income, expense, gain, or loss are recognized in different periods for financial statement and tax purposes. These differences will reverse at some time in the future. Differences in classification may also result from the treatment of short-term gains as ordinary income for tax purposes. The fund’s tax-basis capital gains and losses are determined only at the end of each fiscal year.
At March 31, 2017, the cost of investment securities for tax purposes was $23,718,503,000. Net unrealized appreciation of investment securities for tax purposes was $28,332,533,000, consisting of unrealized gains of $29,095,648,000 on securities that had risen in value since their purchase and $763,115,000 in unrealized losses on securities that had fallen in value since their purchase.
F. During the six months ended March 31, 2017, the fund purchased $1,434,903,000 of investment securities and sold $2,040,367,000 of investment securities, other than temporary cash investments.
19
PRIMECAP Fund
G. Capital share transactions for each class of shares were:
| Six Months Ended | Year Ended | |||
| March 31, 2017 | September 30, 2016 | |||
| Amount | Shares | Amount | Shares | |
| ($000) | (000) | ($000) | (000) | |
| Investor Shares | ||||
| Issued | 312,679 | 2,865 | 501,353 | 5,081 |
| Issued in Lieu of Cash Distributions | 353,910 | 3,324 | 448,254 | 4,430 |
| Redeemed | (948,378) | (8,730) | (1,895,378) | (18,802) |
| Net Increase (Decrease)—Investor Shares | (281,789) | (2,541) | (945,771) | (9,291) |
| Admiral Shares | ||||
| Issued | 1,515,006 | 13,441 | 3,167,275 | 30,714 |
| Issued in Lieu of Cash Distributions | 1,880,345 | 17,051 | 2,027,098 | 19,341 |
| Redeemed | (1,509,602) | (13,409) | (4,019,718) | (38,593) |
| Net Increase (Decrease)—Admiral Shares | 1,885,749 | 17,083 | 1,174,655 | 11,462 |
H. Certain of the fund’s investments are in companies that are considered to be affiliated companies of the fund because the fund owns more than 5% of the outstanding voting securities of the company or the issuer is another member of The Vanguard Group. Transactions during the period in securities of these companies were as follows:
| Current Period Transactions | ||||||
| Sept. 30, | Proceeds | March 31, | ||||
| 2016 | from | Capital Gain | 2017 | |||
| Market | Purchases | Securities | Distributions | Market | ||
| Value | at Cost | Sold1 | Income | Received | Value | |
| ($000) | ($000) | ($000) | ($000) | ($000) | ($000) | |
| NetApp Inc. | 505,263 | — | 29 | 5,360 | — | 590,286 |
| Plantronics Inc. | 188,043 | — | — | 1,086 | — | 195,824 |
| Southwest Airlines Co. | 1,306,611 | — | — | 6,720 | — | 1,806,207 |
| Vanguard Market Liquidity Fund | 1,902,618 | NA2 | NA 2 | 7,490 | — | 2,140,557 |
| Total | 3,902,535 | — | — | 20,656 | — | 4,732,874 |
| 1 Includes net realized gain (loss) on affiliated investment securities sold of $0. | ||||||
| 2 Not applicable—purchases and sales are for temporary cash investment purposes. | ||||||
I. Management has determined that no material events or transactions occurred subsequent to March 31, 2017, that would require recognition or disclosure in these financial statements.
20
About Your Fund’s Expenses
As a shareholder of the fund, you incur ongoing costs, which include costs for portfolio management, administrative services, and shareholder reports (like this one), among others. Operating expenses, which are deducted from a fund’s gross income, directly reduce the investment return of the fund.
A fund’s expenses are expressed as a percentage of its average net assets. This figure is known as the expense ratio. The following examples are intended to help you understand the ongoing costs (in dollars) of investing in your fund and to compare these costs with those of other mutual funds. The examples are based on an investment of $1,000 made at the beginning of the period shown and held for the entire period.
The accompanying table illustrates your fund’s costs in two ways:
• Based on actual fund return. This section helps you to estimate the actual expenses that you paid over the period. The ”Ending Account Value“ shown is derived from the fund‘s actual return, and the third column shows the dollar amount that would have been paid by an investor who started with $1,000 in the fund. You may use the information here, together with the amount you invested, to estimate the expenses that you paid over the period.
To do so, simply divide your account value by $1,000 (for example, an $8,600 account value divided by $1,000 = 8.6), then multiply the result by the number given for your fund under the heading ”Expenses Paid During Period.“
• Based on hypothetical 5% yearly return. This section is intended to help you compare your fund‘s costs with those of other mutual funds. It assumes that the fund had a yearly return of 5% before expenses, but that the expense ratio is unchanged. In this case—because the return used is not the fund’s actual return—the results do not apply to your investment. The example is useful in making comparisons because the Securities and Exchange Commission requires all mutual funds to calculate expenses based on a 5% return. You can assess your fund’s costs by comparing this hypothetical example with the hypothetical examples that appear in shareholder reports of other funds.
Note that the expenses shown in the table are meant to highlight and help you compare ongoing costs only and do not reflect transaction costs incurred by the fund for buying and selling securities. Further, the expenses do not include any purchase, redemption, or account service fees described in the fund prospectus. If such fees were applied to your account, your costs would be higher. Your fund does not carry a “sales load.”
The calculations assume no shares were bought or sold during the period. Your actual costs may have been higher or lower, depending on the amount of your investment and the timing of any purchases or redemptions.
You can find more information about the fund’s expenses, including annual expense ratios, in the Financial Statements section of this report. For additional information on operating expenses and other shareholder costs, please refer to your fund’s current prospectus.
21
| Six Months Ended March 31, 2017 | |||
| Beginning | Ending | Expenses | |
| Account Value | Account Value | Paid During | |
| PRIMECAP Fund | 9/30/2016 | 3/31/2017 | Period |
| Based on Actual Fund Return | |||
| Investor Shares | $1,000.00 | $1,109.71 | $2.05 |
| Admiral Shares | 1,000.00 | 1,110.03 | 1.68 |
| Based on Hypothetical 5% Yearly Return | |||
| Investor Shares | $1,000.00 | $1,022.99 | $1.97 |
| Admiral Shares | 1,000.00 | 1,023.34 | 1.61 |
The calculations are based on expenses incurred in the most recent six-month period. The fund’s annualized six-month expense ratios for that
period are 0.39% for Investor Shares and 0.32% for Admiral Shares. The dollar amounts shown as “Expenses Paid” are equal to the
annualized expense ratio multiplied by the average account value over the period, multiplied by the number of days in the most recent
six-month period, then divided by the number of days in the most recent 12-month period (182/365).
22
Glossary
30-Day SEC Yield. A fund’s 30-day SEC yield is derived using a formula specified by the U.S. Securities and Exchange Commission. Under the formula, data related to the fund’s security holdings in the previous 30 days are used to calculate the fund’s hypothetical net income for that period, which is then annualized and divided by the fund’s estimated average net assets over the calculation period. For the purposes of this calculation, a security’s income is based on its current market yield to maturity (for bonds), its actual income (for asset-backed securities), or its projected dividend yield (for stocks). Because the SEC yield represents hypothetical annualized income, it will differ—at times significantly—from the fund’s actual experience. As a result, the fund’s income distributions may be higher or lower than implied by the SEC yield.
Beta. A measure of the magnitude of a fund’s past share-price fluctuations in relation to the ups and downs of a given market index. The index is assigned a beta of 1.00. Compared with a given index, a fund with a beta of 1.20 typically would have seen its share price rise or fall by 12% when the index rose or fell by 10%. For this report, beta is based on returns over the past 36 months for both the fund and the index. Note that a fund’s beta should be reviewed in conjunction with its R-squared (see definition). The lower the R-squared, the less correlation there is between the fund and the index, and the less reliable beta is as an indicator of volatility.
Dividend Yield. Dividend income earned by stocks, expressed as a percentage of the aggregate market value (or of net asset value, for a fund). The yield is determined by dividing the amount of the annual dividends by the aggregate value (or net asset value) at the end of the period. For a fund, the dividend yield is based solely on stock holdings and does not include any income produced by other investments.
Earnings Growth Rate. The average annual rate of growth in earnings over the past five years for the stocks now in a fund.
Equity Exposure. A measure that reflects a fund’s investments in stocks and stock futures. Any holdings in short-term reserves are excluded.
Expense Ratio. A fund’s total annual operating expenses expressed as a percentage of the fund’s average net assets. The expense ratio includes management and administrative expenses, but does not include the transaction costs of buying and selling portfolio securities.
Foreign Holdings. The percentage of a fund represented by securities or depositary receipts of companies based outside the United States.
Inception Date. The date on which the assets of a fund (or one of its share classes) are first invested in accordance with the fund’s investment objective. For funds with a subscription period, the inception date is the day after that period ends. Investment performance is measured from the inception date.
Median Market Cap. An indicator of the size of companies in which a fund invests; the midpoint of market capitalization (market price x shares outstanding) of a fund’s stocks, weighted by the proportion of the fund’s assets invested in each stock. Stocks representing half of the fund’s assets have market capitalizations above the median, and the rest are below it.
Price/Book Ratio. The share price of a stock divided by its net worth, or book value, per share. For a fund, the weighted average price/book ratio of the stocks it holds.
23
Price/Earnings Ratio. The ratio of a stock’s current price to its per-share earnings over the past year. For a fund, the weighted average P/E of the stocks it holds. P/E is an indicator of market expectations about corporate prospects; the higher the P/E, the greater the expectations for a company’s future growth.
R-Squared. A measure of how much of a fund’s past returns can be explained by the returns from the market in general, as measured by a given index. If a fund’s total returns were precisely synchronized with an index’s returns, its R-squared would be 1.00. If the fund’s returns bore no relationship to the index’s returns, its R-squared would be 0. For this report, R-squared is based on returns over the past 36 months for both the fund and the index.
Return on Equity. The annual average rate of return generated by a company during the past five years for each dollar of shareholder’s equity (net income divided by shareholder’s equity). For a fund, the weighted average return on equity for the companies whose stocks it holds.
Short-Term Reserves. The percentage of a fund invested in highly liquid, short-term securities that can be readily converted to cash.
Turnover Rate. An indication of the fund’s trading activity. Funds with high turnover rates incur higher transaction costs and may be more likely to distribute capital gains (which may be taxable to investors). The turnover rate excludes in-kind transactions, which have minimal impact on costs.
24
This page intentionally left blank.
This page intentionally left blank.
This page intentionally left blank.
The People Who Govern Your Fund
The trustees of your mutual fund are there to see that the fund is operated and managed in your best interests since, as a shareholder, you are a part owner of the fund. Your fund’s trustees also serve on the board of directors of The Vanguard Group, Inc., which is owned by the Vanguard funds and provides services to them on an at-cost basis.
A majority of Vanguard’s board members are independent, meaning that they have no affiliation with Vanguard or the funds they oversee, apart from the sizable personal investments they have made as private individuals. The independent board members have distinguished backgrounds in business, academia, and public service. Each of the trustees and executive officers oversees 195 Vanguard funds.
The following table provides information for each trustee and executive officer of the fund. The mailing address of the trustees and officers is P.O. Box 876, Valley Forge, PA 19482. More information about the trustees is in the Statement of Additional Information, which can be obtained, without charge, by contacting Vanguard at 800-662-7447, or online at vanguard.com.
InterestedTrustee1
F. William McNabb III
Born 1957. Trustee Since July 2009. Chairman of the Board. Principal Occupation(s) During the Past Five Years and Other Experience: Chairman of the Board of The Vanguard Group, Inc., and of each of the investment companies served by The Vanguard Group, since January 2010; Director of The Vanguard Group since 2008; Chief Executive Officer and President of The Vanguard Group, and of each of the investment companies served by The Vanguard Group, since 2008; Director of Vanguard Marketing Corporation; Managing Director of The Vanguard Group (1995–2008).
IndependentTrustees
Emerson U. Fullwood
Born 1948. Trustee Since January 2008. Principal Occupation(s) During the Past Five Years and Other Experience: Executive Chief Staff and Marketing Officer for North America and Corporate Vice President (retired 2008) of Xerox Corporation (document management products and services); Executive in Residence and 2009–2010 Distinguished Minett Professor at the Rochester Institute of Technology; Lead Director of SPX FLOW, Inc. (multi-industry manufacturing); Director of the United Way of Rochester, the University of Rochester Medical Center, Monroe Community College Foundation, North Carolina A&T University, and Roberts Wesleyan College.
Rajiv L. Gupta
Born 1945. Trustee Since December 2001.2 Principal Occupation(s) During the Past Five Years and Other Experience: Chairman and Chief Executive Officer (retired 2009) and President (2006–2008) of Rohm and Haas Co. (chemicals); Director of Arconic Inc. (diversified manufacturer), HP Inc. (printer and personal computer manufacturing), and Delphi Automotive plc (automotive components); Senior Advisor at New Mountain Capital.
Amy Gutmann
Born 1949. Trustee Since June 2006. Principal Occupation(s) During the Past Five Years and Other Experience: President of the University of Pennsylvania; Christopher H. Browne Distinguished Professor of Political Science, School of Arts and Sciences, and Professor of Communication, Annenberg School for Communication, with secondary faculty appointments in the Department of Philosophy, School of Arts and Sciences, and at the Graduate School of Education, University of Pennsylvania; Trustee of the National Constitution Center; Chair of the Presidential Commission for the Study of Bioethical Issues.
JoAnn Heffernan Heisen
Born 1950. Trustee Since July 1998. Principal Occupation(s) During the Past Five Years and Other Experience: Corporate Vice President and Chief Global Diversity Officer (retired 2008) and Member of the Executive Committee (1997–2008) of Johnson & Johnson (pharmaceuticals/medical devices/consumer products); Director of Skytop Lodge Corporation (hotels) and the Robert Wood Johnson Foundation; Member of the Advisory Board of the Institute for Women’s Leadership at Rutgers University.
F. Joseph Loughrey
Born 1949. Trustee Since October 2009. Principal Occupation(s) During the Past Five Years and Other Experience: President and Chief Operating Officer (retired 2009) of Cummins Inc. (industrial machinery); Chairman of the Board of Hillenbrand, Inc. (specialized consumer services), Oxfam America, and the Lumina
Foundation for Education; Director of SKF AB (industrial machinery), Hyster-Yale Materials Handling, Inc. (forklift trucks), and the V Foundation for Cancer Research; Member of the Advisory Council for the College of Arts and Letters and Chair of the Advisory Board to the Kellogg Institute for International Studies, both at the University of Notre Dame.
Mark Loughridge
Born 1953. Trustee Since March 2012. Principal Occupation(s) During the Past Five Years and Other Experience: Senior Vice President and Chief Financial Officer (retired 2013) at IBM (information technology services); Fiduciary Member of IBM’s Retirement Plan Committee (2004–2013); Director of the Dow Chemical Company; Member of the Council on Chicago Booth.
Scott C. Malpass
Born 1962. Trustee Since March 2012. Principal Occupation(s) During the Past Five Years and Other Experience: Chief Investment Officer and Vice President at the University of Notre Dame; Assistant Professor of Finance at the Mendoza College of Business at Notre Dame; Member of the Notre Dame 403(b) Investment Committee, the Board of Advisors for Spruceview Capital Partners, and the Investment Advisory Committee of Major League Baseball; Board Member of TIFF Advisory Services, Inc., and Catholic Investment Services, Inc. (investment advisors); Member of the Board of Superintendence of the Institute for the Works of Religion.
André F. Perold
Born 1952. Trustee Since December 2004. Principal Occupation(s) During the Past Five Years and Other Experience: George Gund Professor of Finance and Banking, Emeritus at the Harvard Business School (retired 2011); Chief Investment Officer and Co-Managing Partner of HighVista Strategies LLC (private investment firm); Overseer of the Museum of Fine Arts Boston.
Peter F. Volanakis
Born 1955. Trustee Since July 2009. Principal Occupation(s) During the Past Five Years and Other Experience: President and Chief Operating Officer (retired 2010) of Corning Incorporated (communications equipment); Chairman of the Board of Trustees of Colby-Sawyer College; Member of the Board of Hypertherm, Inc. (industrial cutting systems, software, and consumables).
Executive Officers
Glenn Booraem
Born 1967. Investment Stewardship Officer Since February 2017. Principal Occupation(s) During the Past Five Years and Other Experience: Principal of The Vanguard Group, Inc.; Treasurer (2015–2017), Controller (2010–2015), and Assistant Controller (2001–2010) of each of the investment companies served by The Vanguard Group.
Thomas J. Higgins
Born 1957. Chief Financial Officer Since September 2008. Principal Occupation(s) During the Past Five Years and Other Experience: Principal of The Vanguard Group, Inc.; Chief Financial Officer of each of the investment companies served by The Vanguard Group; Treasurer of each of the investment companies served by The Vanguard Group (1998–2008).
Peter Mahoney
Born 1974. Controller Since May 2015. Principal Occupation(s) During the Past Five Years and Other Experience: Principal of The Vanguard Group, Inc.; Controller of each of the investment companies served by The Vanguard Group; Head of International Fund Services at The Vanguard Group (2008–2014).
Anne E. Robinson
Born 1970. Secretary Since September 2016. Principal Occupation(s) During the Past Five Years and Other Experience: Managing Director of The Vanguard Group, Inc.; General Counsel of The Vanguard Group; Secretary of The Vanguard Group and of each of the investment companies served by The Vanguard Group; Director and Senior Vice President of Vanguard Marketing Corporation; Managing Director and General Counsel of Global Cards and Consumer Services at Citigroup (2014–2016); Counsel at American Express (2003–2014).
Michael Rollings
Born 1963. Treasurer Since February 2017. Principal Occupation(s) During the Past Five Years and Other Experience: Managing Director of The Vanguard Group, Inc.; Treasurer of each of the investment companies served by The Vanguard Group; Executive Vice President and Chief Financial Officer of MassMutual Financial Group (2006–2016).
| Vanguard Senior Management Team | |
| Mortimer J. Buckley | James M. Norris |
| John James | Thomas M. Rampulla |
| Martha G. King | Glenn W. Reed |
| John T. Marcante | Karin A. Risi |
| Chris D. McIsaac | |
| Chairman Emeritus and Senior Advisor | |
| John J. Brennan | |
| Chairman, 1996–2009 | |
| Chief Executive Officer and President, 1996–2008 | |
| Founder | |
| John C. Bogle | |
| Chairman and Chief Executive Officer, 1974–1996 | |
1 Mr. McNabb is considered an “interested person,” as defined in the Investment Company Act of 1940, because he is an officer of the Vanguard funds.
2 December 2002 for Vanguard Equity Income Fund, the Vanguard Municipal Bond Funds, and the Vanguard State Tax-Exempt Funds.
 | |
| P.O. Box 2600 | |
| Valley Forge, PA 19482-2600 | |
| Connect with Vanguard® > vanguard.com | |
| Fund Information > 800-662-7447 | |
| Direct Investor Account Services > 800-662-2739 | |
| Institutional Investor Services > 800-523-1036 | |
| Text Telephone for People | |
| Who Are Deaf or Hard of Hearing > 800-749-7273 | |
| This material may be used in conjunction | |
| with the offering of shares of any Vanguard | |
| fund only if preceded or accompanied by | |
| the fund’s current prospectus. | |
| All comparative mutual fund data are from Lipper, a | |
| Thomson Reuters Company, or Morningstar, Inc., unless | |
| otherwise noted. | |
| You can obtain a free copy of Vanguard’s proxy voting | |
| guidelines by visiting vanguard.com/proxyreporting or by | |
| calling Vanguard at 800-662-2739. The guidelines are | |
| also available from the SEC’s website, sec.gov. In | |
| addition, you may obtain a free report on how your fund | |
| voted the proxies for securities it owned during the 12 | |
| months ended June 30. To get the report, visit either | |
| vanguard.com/proxyreporting or sec.gov. | |
| You can review and copy information about your fund at | |
| the SEC’s Public Reference Room in Washington, D.C. To | |
| find out more about this public service, call the SEC at | |
| 202-551-8090. Information about your fund is also | |
| available on the SEC’s website, and you can receive | |
| copies of this information, for a fee, by sending a | |
| request in either of two ways: via email addressed to | |
| publicinfo@sec.gov or via regular mail addressed to the | |
| Public Reference Section, Securities and Exchange | |
| Commission, Washington, DC 20549-1520. | |
| © 2017 The Vanguard Group, Inc. | |
| All rights reserved. | |
| Vanguard Marketing Corporation, Distributor. | |
| Q592 052017 | |
Semiannual Report | March 31, 2017
Vanguard Target Retirement Funds
Vanguard Target Retirement Income Fund
Vanguard Target Retirement 2010 Fund
Vanguard Target Retirement 2015 Fund
Vanguard Target Retirement 2020 Fund
Vanguard Target Retirement 2025 Fund
Vanguard Target Retirement 2030 Fund
A new format, unwavering commitment
As you begin reading this report, you’ll notice that we’ve made some improvements to the opening sections—based on feedback from you, our clients.
Page 1 starts with a new ”Your Fund’s Performance at a Glance,” a concise, handy summary of how your fund performed during the period.
In the renamed ”Chairman’s Perspective,” Bill McNabb will focus on enduring principles and investment insights.
We’ve modified some tables, and eliminated some redundancy, but we haven’t removed any information.
At Vanguard, we’re always looking for better ways to communicate and to help you make sound investment decisions. Thank you for entrusting your assets to us.
| Contents | |
| Your Fund’s Performance at a Glance. | 1 |
| Chairman’s Perspective. | 3 |
| Target Retirement Income Fund. | 7 |
| Target Retirement 2010 Fund. | 17 |
| Target Retirement 2015 Fund. | 27 |
| Target Retirement 2020 Fund. | 37 |
| Target Retirement 2025 Fund. | 47 |
| Target Retirement 2030 Fund. | 57 |
| About Your Fund’s Expenses. | 67 |
| Trustees Approve Advisory Arrangements. | 69 |
| Glossary. | 71 |
Please note: The opinions expressed in this report are just that—informed opinions. They should not be considered promises or advice.
Also, please keep in mind that the information and opinions cover the period through the date on the front of this report. Of course, the
risks of investing in your fund are spelled out in the prospectus.
See the Glossary for definitions of investment terms used in this report.
About the cover: No matter what language you speak, Vanguard has one consistent message and set of principles. Our primary
focus is on you, our clients. We conduct our business with integrity as a faithful steward of your assets. This message is shown
translated into seven languages, reflecting our expanding global presence.
Your Fund’s Performance at a Glance
• For the six months ended March 31, 2017, the six Vanguard Target Retirement Funds covered in this report recorded returns ranging from 1.44% for the Target Retirement Income Fund to 5.55% for the Target Retirement 2030 Fund. (The funds with retirement dates of 2035 through 2060 are covered in a separate report.) The funds with a greater allocation to stocks performed best.
• Each fund posted returns that were in line with those of its composite benchmark after expenses. Three surpassed the average return of their peers.
• Vanguard Target Retirement Funds are designed to reach an allocation of 70% bonds and 30% stocks within seven years after their target date.
• The 2010 Fund has been closed to new investors effective January 5, 2017. In the third quarter, the 2010 Fund is scheduled to merge with the Target Retirement Income Fund, as their asset allocations have become identical.
| Total Returns: Six Months Ended March 31, 2017 | |
| Total | |
| Returns | |
| Vanguard Target Retirement Income Fund | 1.44% |
| Target Income Composite Index | 1.49 |
| Mixed-Asset Target Today Funds Average | 1.86 |
| For a benchmark description, see the Glossary. | |
| Mixed-Asset Target Today Funds Average: Derived from data provided by Lipper, a Thomson Reuters Company. | |
| Vanguard Target Retirement 2010 Fund | 1.48% |
| Target 2010 Composite Index | 1.58 |
| Mixed-Asset Target 2010 Funds Average | 2.50 |
| For a benchmark description, see the Glossary. | |
| Mixed-Asset Target 2010 Funds Average: Derived from data provided by Lipper, a Thomson Reuters Company. | |
| Vanguard Target Retirement 2015 Fund | 2.81% |
| Target 2015 Composite Index | 2.96 |
| Mixed-Asset Target 2015 Funds Average | 2.93 |
| For a benchmark description, see the Glossary. | |
| Mixed-Asset Target 2015 Funds Average: Derived from data provided by Lipper, a Thomson Reuters Company. | |
1
| Total | |
| Returns | |
| Vanguard Target Retirement 2020 Fund | 3.91% |
| Target 2020 Composite Index | 3.99 |
| Mixed-Asset Target 2020 Funds Average | 3.04 |
| For a benchmark description, see the Glossary. | |
| Mixed-Asset Target 2020 Funds Average: Derived from data provided by Lipper, a Thomson Reuters Company. | |
| Vanguard Target Retirement 2025 Fund | 4.70% |
| Target 2025 Composite Index | 4.84 |
| Mixed-Asset Target 2025 Funds Average | 4.14 |
| For a benchmark description, see the Glossary. | |
| Mixed-Asset Target 2025 Funds Average: Derived from data provided by Lipper, a Thomson Reuters Company. | |
| Vanguard Target Retirement 2030 Fund | 5.55% |
| Target 2030 Composite Index | 5.67 |
| Mixed-Asset Target 2030 Funds Average | 5.02 |
| For a benchmark description, see the Glossary. | |
| Mixed-Asset Target 2030 Funds Average: Derived from data provided by Lipper, a Thomson Reuters Company. | |
Investments in Target Retirement Funds are subject to the risks of their underlying funds. The year in the fund name refers
to the approximate year (the target date) when an investor in the fund would retire and leave the work force. The fund will
gradually shift its emphasis from more aggressive investments to more conservative ones based on its target date. An
investment in a Target Retirement Fund is not guaranteed at any time, including on or after the target date.
| Expense Ratios | ||
| Your Fund Compared With Its Peer Group | ||
| Acquired Fund Fees | Peer Group | |
| and Expenses | Average | |
| Target Retirement Income Fund | 0.13% | 0.43% |
| Target Retirement 2010 Fund | 0.13 | 0.36 |
| Target Retirement 2015 Fund | 0.14 | 0.35 |
| Target Retirement 2020 Fund | 0.14 | 0.45 |
| Target Retirement 2025 Fund | 0.14 | 0.40 |
| Target Retirement 2030 Fund | 0.15 | 0.44 |
The fund expense figures shown—drawn from the prospectus dated January 27, 2017—represent an estimate of the weighted average of the expense ratios and any transaction fees charged by the underlying mutual funds (the ”acquired” funds) in which the Target Retirement Funds invest. The Target Retirement Funds do not charge any expenses or fees of their own. For the six months ended March 31, 2017, the annualized acquired fund fees and expenses were 0.13% for the Income Fund, 0.13% for the 2010 Fund, 0.14% for the 2015 Fund, 0.14% for the 2020 Fund, 0.14% for the 2025 Fund, and 0.15% for the 2030 Fund. Peer-group expense ratios are derived from data provided by Lipper, a Thomson Reuters Company, and capture information through year-end 2016.
Peer groups: For the Income Fund, Mixed-Asset Target Today Funds; for the 2010 Fund, Mixed-Asset Target 2010 Funds; for the 2015 Fund, Mixed-Asset Target 2015 Funds; for the 2020 Fund, Mixed-Asset Target 2020 Funds; for the 2025 Fund, Mixed-Asset Target 2025 Funds; and for the 2030 Fund, Mixed-Asset Target 2030 Funds.
2
Chairman’s Perspective

Bill McNabb
Chairman and Chief Executive Officer
Dear Shareholder,
For many people, including me, falling interest rates have been the general trend in the bond market throughout our working lives. At the beginning of 1983, the year I graduated from business school, the yield of the benchmark 10-year U.S. Treasury note stood at more than 10%. It was less than 2.5% at the beginning of 2017.
Because bond prices move in the opposite direction from rates, my career happens to have overlapped with the greatest bull market for bonds in history.
It appears that may be changing. And, of course, there’s no shortage of advice about how to prepare for the shift.
Rates may be headed higher (really)
This bond bull market has reminded us time and again just how hard it is to predict when rates will rise or fall and by how much. If you follow bonds, you might recall the markets bracing for a sustained rate increase back in 2010 as the economy pulled out of recession, or again in 2013 when the Federal Reserve said it would start tapering its bond purchases, or again at the end of 2015 when the Fed raised short-term rates for the first time in almost a decade. And yet, prognostications notwithstanding, interest rates remained anchored near historical lows.
That said, rates seem to be on an upswing. With economic activity picking up, wages starting to move higher, and inflation coming
3
off recent lows, the Fed has nudged short-term rates higher twice in recent months and has signaled that further gradual increases are likely through 2018. The perceived pro-growth stance of the new U.S. administration also has played a role in framing a case for higher rates.
Short-term pain, longer-term gain
Bond investors are understandably concerned. If interest rates shoot up, the market value of bonds will drop sharply, with prices falling to bring yields in line with the new, prevailing higher rates. That’s the potential short-term pain. But long-term investors should actually want rates to go up. If you like bonds that pay 2%, you should love bonds that pay 4%, right?
There’s a simple—though imperfect—rule of thumb that helps make clear this point. If the time frame of your investing goal exceeds the time frame of your bond portfolio (a medium-term goal matched with short-term bonds, or a long-term goal paired with bonds not quite as long-term), rising rates will work out in your favor, maybe decidedly so.
Think of it this way: If you have a big cash need in the near future—say, a tuition bill coming due in a few years—and you own bonds that are long-term in nature, this time-frame mismatch could spell trouble if rates rise sharply; you’d be selling bonds that would be worth less. But if you’re saving to retire ten or 15 years down the road and rates are steadily rising, over time you’ll be earning higher and higher yields.
| Market Barometer | |||
| Total Returns | |||
| Periods Ended March 31, 2017 | |||
| Six | One | Five Years | |
| Months | Year | (Annualized) | |
| Stocks | |||
| Russell 1000 Index (Large-caps) | 10.09% | 17.43% | 13.26% |
| Russell 2000 Index (Small-caps) | 11.52 | 26.22 | 12.35 |
| Russell 3000 Index (Broad U.S. market) | 10.19 | 18.07 | 13.18 |
| FTSE All-World ex US Index (International) | 6.74 | 13.50 | 4.82 |
| Bonds | |||
| Bloomberg Barclays U.S. Aggregate Bond Index | |||
| (Broad taxable market) | -2.18% | 0.44% | 2.34% |
| Bloomberg Barclays Municipal Bond Index | |||
| (Broad tax-exempt market) | -2.10 | 0.15 | 3.24 |
| Citigroup Three-Month U.S. Treasury Bill Index | 0.21 | 0.34 | 0.10 |
| CPI | |||
| Consumer Price Index | 0.98% | 2.38% | 1.23% |
4
Josh Barrickman, our head of fixed income indexing for the Americas, calls it “the virtuous cycle of compounding interest at a higher rate.”
The bottom line is, you can end up better off than if rates haven’t risen because you’re earning more income, which over time more than washes away any price hit.
Beware of short-sighted, short-term moves
This logic can be difficult to grasp, tempting anxious bond investors to make drastic shifts to lessen the immediate pain of rising rates. Unfortunately, such moves can backfire.
Taking shelter in short-term bonds, for example, might seem like a good idea. Their prices generally hold up better than those of longer-term bonds in a rising-rate environment. But they also offer less income.
For example, when the market started worrying about rising rates in 2010, moving into short-term securities—and staying there—would have proved costly. Through 2016, those securities returned roughly half of what the broad U.S. bond market did.
Favoring high-yield bonds is another tack some investors take, expecting higher income to help cushion price declines.
| What has driven long-term returns for Vanguard bond funds? |

Source: Vanguard.
High-yield securities, however, typically perform best when stocks are rising, making them unlikely to zig when stocks zag.
We saw clear evidence of the correlation between stocks and high-yield bonds in the frantic markets following the United Kingdom’s vote to leave the European Union last year. From June 23 to June 27, both U.S. stocks and U.S. high-yield bonds lost ground. The broad U.S. bond market, meanwhile, climbed 1.2% as investors sought a safe haven.
Your portfolio is more than the sum of its parts
Different assets have different roles to play in a balanced and diversified portfolio. Stocks are valuable because they can produce higher returns over time, while bonds can provide a crucial counterweight to the volatility of stocks.
Perhaps the most important thing to keep in mind about bonds is that although their prices can fluctuate, they remain “fixed income” securities. Barring default, you can be certain of getting income until the bonds mature. It’s that income that drives returns for patient bond investors who resist the urge to jump in and out of the market, as you can see in the accompanying box.
A lot has changed since I first started following the bond market, but the important role that bonds can play in a balanced and diversified portfolio hasn’t.
As always, thank you for investing with Vanguard.
Sincerely,

F. William McNabb III
Chairman and Chief Executive Officer
April 14, 2017
6
Target Retirement Income Fund
Fund Profile
As of March 31, 2017
| Total Fund Characteristics | |
| Ticker Symbol | VTINX |
| 30-Day SEC Yield | 1.80% |
| Acquired Fund Fees and Expenses1 | 0.13% |
| Allocation to Underlying Vanguard Funds | |
| Vanguard Total Bond Market II Index Fund | |
| Investor Shares | 37.4% |
| Vanguard Total Stock Market Index Fund | |
| Investor Shares | 18.0 |
| Vanguard Short-Term Inflation-Protected | |
| Securities Index Fund Investor Shares | 16.6 |
| Vanguard Total International Bond Index | |
| Fund Investor Shares | 15.9 |
| Vanguard Total International Stock Index | |
| Fund Investor Shares | 12.1 |
| Total Fund Volatility Measures | ||
| Bloomberg | ||
| Target | Barclays US | |
| Income | Aggregate | |
| Composite | Bond | |
| Index | Index | |
| R-Squared | 0.99 | 0.23 |
| Beta | 0.99 | 0.60 |
| These measures show the degree and timing of the fund’s | ||
| fluctuations compared with the indexes over 36 months. | ||
Fund Asset Allocation
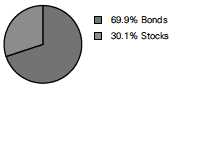
1 This figure—drawn from the prospectus dated January 27, 2017—represents an estimate of the weighted average of the expense ratios and any
transaction fees charged by the underlying mutual funds (the ”acquired” funds) in which the Target Retirement Income Fund invests. The fund does
not charge any expenses or fees of its own. For the six months ended March 31, 2017, the annualized acquired fund fees and expenses were 0.13%.
7
Target Retirement Income Fund
Performance Summary
All of the returns in this report represent past performance, which is not a guarantee of future results that may be achieved by the fund. (Current performance may be lower or higher than the performance data cited. For performance data current to the most recent month-end, visit our website at vanguard.com/performance.) Note, too, that both investment returns and principal value can fluctuate widely, so an investor’s shares, when sold, could be worth more or less than their original cost. The returns shown do not reflect taxes that a shareholder would pay on fund distributions or on the sale of fund shares.
Fiscal-Year Total Returns (%): September 30, 2006, Through March 31, 2017
For a benchmark description, see the Glossary.
Note: For 2017, performance data reflect the six months ended March 31, 2017.
| Average Annual Total Returns: Periods Ended March 31, 2017 | ||||||
| Ten Years | ||||||
| Inception Date | One Year | Five Years | Income | Capital | Total | |
| Target Retirement Income | ||||||
| Fund | 10/27/2003 | 5.36% | 4.61% | 2.57% | 2.38% | 4.95% |
See Financial Highlights for dividend and capital gains information.
8
Target Retirement Income Fund
Financial Statements (unaudited)
Statement of Net Assets
As of March 31, 2017
The fund reports a complete list of its holdings in regulatory filings four times in each fiscal year, at the quarter-ends. For the second and fourth fiscal quarters, the lists appear in the fund’s semiannual and annual reports to shareholders. For the first and third fiscal quarters, the fund files the lists with the Securities and Exchange Commission on Form N-Q. Shareholders can look up the fund’s Forms N-Q on the SEC’s website at sec.gov. Forms N-Q may also be reviewed and copied at the SEC’s Public Reference Room (see the back cover of this report for further information).
| Market | ||
| Value• | ||
| Shares | ($000) | |
| Investment Companies (100.0%) | ||
| U.S. Stock Fund (18.0%) | ||
| Vanguard Total Stock Market Index Fund Investor Shares | 32,990,970 | 1,947,787 |
| International Stock Fund (12.1%) | ||
| Vanguard Total International Stock Index Fund Investor Shares | 82,306,394 | 1,310,318 |
| U.S. Bond Funds (54.0%) | ||
| 1 Vanguard Total Bond Market II Index Fund Investor Shares | 379,723,783 | 4,040,261 |
| Vanguard Short-Term Inflation-Protected Securities Index Fund Investor Shares | 72,370,927 | 1,794,799 |
| 5,835,060 | ||
| International Bond Fund (15.9%) | ||
| Vanguard Total International Bond Index Fund Investor Shares | 159,008,362 | 1,718,880 |
| Total Investment Companies (Cost $9,385,713) | 10,812,045 | |
| Temporary Cash Investment (0.0%) | ||
| Money Market Fund (0.0%) | ||
| 1 Vanguard Market Liquidity Fund, 0.965% (Cost $1,191) | 11,910 | 1,191 |
| Total Investments (100.0%) (Cost $9,386,904) | 10,813,236 | |
| Other Assets and Liabilities (0.0%) | ||
| Other Assets | 60,704 | |
| Liabilities | (56,924) | |
| 3,780 | ||
| Net Assets (100%) | ||
| Applicable to 827,040,519 outstanding $.001 par value shares of | ||
| beneficial interest (unlimited authorization) | 10,817,016 | |
| Net Asset Value Per Share | $13.08 | |
9
| Target Retirement Income Fund | |
| Amount | |
| ($000) | |
| Statement of Assets and Liabilities | |
| Assets | |
| Investments in Securities, at Value Affiliated Vanguard Funds | 10,813,236 |
| Receivables for Investment Securities Sold | 31,630 |
| Receivables for Accrued Income | 9,746 |
| Receivables for Capital Shares Issued | 19,328 |
| Total Assets | 10,873,940 |
| Liabilities | |
| Payables for Investment Securities Purchased | 33,746 |
| Payables for Capital Shares Redeemed | 23,178 |
| Total Liabilities | 56,924 |
| Net Assets | 10,817,016 |
| At March 31, 2017, net assets consisted of: | |
| Amount | |
| ($000) | |
| Paid-in Capital | 9,312,951 |
| Undistributed Net Investment Income | 3,374 |
| Accumulated Net Realized Gains | 74,359 |
| Unrealized Appreciation (Depreciation) | 1,426,332 |
| Net Assets | 10,817,016 |
• See Note A in Notes to Financial Statements.
1 Affiliated fund available only to Vanguard funds and certain trusts and accounts managed by Vanguard. Rate shown for Vanguard Market
Liquidity Fund is the 7-day yield.
See accompanying Notes, which are an integral part of the Financial Statements.
10
Target Retirement Income Fund
Statement of Operations
| Six Months Ended | |
| March 31, 2017 | |
| ($000) | |
| Investment Income | |
| Income | |
| Income Distributions Received from Affiliated Funds | 110,218 |
| Net Investment Income—Note B | 110,218 |
| Realized Net Gain (Loss) | |
| Capital Gain Distributions Received from Affiliated Funds | 4,082 |
| Affiliated Investment Securities Sold | 78,176 |
| Realized Net Gain (Loss) | 82,258 |
| Change in Unrealized Appreciation (Depreciation) of Investment Securities | (46,239) |
| Net Increase (Decrease) in Net Assets Resulting from Operations | 146,237 |
See accompanying Notes, which are an integral part of the Financial Statements.
11
Target Retirement Income Fund
Statement of Changes in Net Assets
| Six Months Ended | Year Ended | |
| March 31, | September 30, | |
| 2017 | 2016 | |
| ($000) | ($000) | |
| Increase (Decrease) in Net Assets | ||
| Operations | ||
| Net Investment Income | 110,218 | 186,663 |
| Realized Net Gain (Loss) | 82,258 | 68,724 |
| Change in Unrealized Appreciation (Depreciation) | (46,239) | 510,311 |
| Net Increase (Decrease) in Net Assets Resulting from Operations | 146,237 | 765,698 |
| Distributions | ||
| Net Investment Income | (116,357) | (185,318) |
| Realized Capital Gain1 | (34,498) | (171,451) |
| Total Distributions | (150,855) | (356,769) |
| Capital Share Transactions | ||
| Issued | 1,322,265 | 2,074,919 |
| Issued in Lieu of Cash Distributions | 143,757 | 340,239 |
| Redeemed | (1,434,219) | (2,667,677) |
| Net Increase (Decrease) from Capital Share Transactions | 31,803 | (252,519) |
| Total Increase (Decrease) | 27,185 | (156,410) |
| Net Assets | ||
| Beginning of Period | 10,789,831 | 10,633,421 |
| End of Period2 | 10,817,016 | 10,789,831 |
| 1 Includes fiscal 2017 and 2016 short-term gain distributions totaling $3,515,000 and $8,126,000, respectively. Short-term gain distributions | ||
| are treated as ordinary income dividends for tax purposes. | ||
| 2 Net Assets—End of Period includes undistributed (overdistributed) net investment income of $3,374,000 and $9,513,000. | ||
See accompanying Notes, which are an integral part of the Financial Statements.
12
Target Retirement Income Fund
Financial Highlights
| Six Months | |||||||
| Ended | |||||||
| For a Share Outstanding | March 31, | Year Ended September 30, | |||||
| Throughout Each Period | 2017 | 2016 | 2015 | 2014 | 2013 | 2012 | |
| Net Asset Value, Beginning of Period | $13.08 | $12.59 | $12.84 | $12.46 | $12.23 | $11.22 | |
| Investment Operations | |||||||
| Net Investment Income | .134 | .229 | .238 | .220 | .246 | .275 | |
| Capital Gain Distributions Received | .006 | .007 | .015 | .002 | .067 | .052 | |
| Net Realized and Unrealized Gain (Loss) | |||||||
| on Investments | .044 | . 692 | (. 225) | . 572 | .185 | . 977 | |
| Total from Investment Operations | .184 | . 928 | . 028 | .794 | .498 | 1.304 | |
| Distributions | |||||||
| Dividends from Net Investment Income | (.142) | (. 227) | (. 236) | (. 218) | (. 247) | (. 273) | |
| Distributions from Realized Capital Gains | (. 042) | (. 211) | (. 042) | (.196) | (. 021) | (. 021) | |
| Total Distributions | (.184) | (. 438) | (. 278) | (. 414) | (. 268) | (. 294) | |
| Net Asset Value, End of Period | $13.08 | $13.08 | $12.59 | $12.84 | $12.46 | $12.23 | |
| Total Return1 | 1.44% | 7.54% | 0.18% | 6.47% | 4.12% | 11.74% | |
| Ratios/Supplemental Data | |||||||
| Net Assets, End of Period (Millions) | $10,817 | $10,790 | $10,633 | $11,215 | $10,163 | $9,382 | |
| Ratio of Total Expenses to | |||||||
| Average Net Assets | — | — | — | — | — | — | |
| Acquired Fund Fees and Expenses | 0.13% | 0.13% | 0.14% | 0.16% | 0.16% | 0.16% | |
| Ratio of Net Investment Income to | |||||||
| Average Net Assets | 2.08% | 1.78% | 1.83% | 1.74% | 1.99% | 2.31% | |
| Portfolio Turnover Rate | 9% | 11% | 14% | 6% | 40% | 7% | |
| The expense ratio, acquired fund fees and expenses, net investment income ratio, and turnover rate for the current period have been | |||||||
| annualized. | |||||||
| 1 Total returns do not include account service fees that may have applied in the periods shown. Fund prospectuses provide information about | |||||||
| any applicable account service fees. | |||||||
See accompanying Notes, which are an integral part of the Financial Statements.
13
Target Retirement Income Fund
Notes to Financial Statements
Vanguard Target Retirement Income Fund is registered under the Investment Company Act of 1940 as an open-end investment company, or mutual fund. The fund follows a balanced investment strategy by investing in selected Vanguard funds to achieve its targeted allocation of assets to U.S. and international stocks, and U.S. and international bonds. Financial statements and other information about each underlying fund are available on vanguard.com.
A. The following significant accounting policies conform to generally accepted accounting principles for U.S. investment companies. The fund consistently follows such policies in preparing its financial statements.
1. Security Valuation: Investments are valued at the net asset value of each underlying Vanguard fund determined as of the close of the New York Stock Exchange (generally 4 p.m., Eastern time) on the valuation date.
2. Federal Income Taxes: The fund intends to continue to qualify as a regulated investment company and distribute all of its taxable income. Management has analyzed the fund’s tax positions taken for all open federal income tax years (September 30, 2013–2016), and for the period ended March 31, 2017, and has concluded that no provision for federal income tax is required in the fund’s financial statements.
3. Distributions: Distributions to shareholders are recorded on the ex-dividend date.
4. Credit Facility: The fund and certain other funds managed by The Vanguard Group (“Vanguard”) participate in a $3.1 billion committed credit facility provided by a syndicate of lenders pursuant to a credit agreement that may be renewed annually; each fund is individually liable for its borrowings, if any, under the credit facility. Borrowings may be utilized for temporary and emergency purposes, and are subject to the fund’s regulatory and contractual borrowing restrictions. The participating funds are charged administrative fees and an annual commitment fee of 0.10% of the undrawn amount of the facility; these fees are allocated to the funds based on a method approved by the fund’s board of trustees and borne by the funds in which the fund invests (see Note B). Any borrowings under this facility bear interest at a rate based upon the higher of the one-month London Interbank Offered Rate, federal funds effective rate, or overnight bank funding rate plus an agreed-upon spread.
The fund had no borrowings outstanding at March 31, 2017, or at any time during the period then ended.
5. Other: Income and capital gain distributions received are recorded on the ex-dividend date. Security transactions are accounted for on the date securities are bought or sold. Costs used to determine realized gains (losses) on the sale of investment securities are those of the specific securities sold.
B. In accordance with the terms of a Funds’ Service Agreement (the “FSA”) between Vanguard and the fund, Vanguard furnishes to the fund investment advisory, corporate management, administrative, marketing, and distribution services at Vanguard’s cost of operations (as defined by the FSA). These costs of operations are allocated to the fund based on methods and guidelines approved by the board of trustees. The FSA provides that expenses otherwise allocable to Vanguard funds-of-funds may be reduced or eliminated to the extent of savings realized by the underlying Vanguard funds by virtue of being part of a fund-of-funds. Accordingly, all expenses for services provided by Vanguard to the fund and all other expenses incurred by the fund during the period ended March 31, 2017, were borne by the underlying Vanguard funds in which the fund invests. The fund’s trustees and officers are also trustees and officers, respectively, of the underlying Vanguard funds, as well as directors and employees, respectively, of Vanguard.
14
Target Retirement Income Fund
C. Various inputs may be used to determine the value of the fund’s investments. These inputs are summarized in three broad levels for financial statement purposes. The inputs or methodologies used to value securities are not necessarily an indication of the risk associated with investing in those securities.
Level 1—Quoted prices in active markets for identical securities.
Level 2—Other significant observable inputs (including quoted prices for similar securities, interest rates, prepayment speeds, credit risk, etc.).
Level 3—Significant unobservable inputs (including the fund’s own assumptions used to determine the fair value of investments).
At March 31, 2017, 100% of the market value of the fund’s investments was determined based on Level 1 inputs.
D. Distributions are determined on a tax basis and may differ from net investment income and realized capital gains for financial reporting purposes. Differences may be permanent or temporary. Permanent differences are reclassified among capital accounts in the financial statements to reflect their tax character. Temporary differences arise when certain items of income, expense, gain, or loss are recognized in different periods for financial statement and tax purposes. These differences will reverse at some time in the future. Differences in classification may also result from the treatment of short-term gains as ordinary income for tax purposes. The fund’s tax-basis capital gains and losses are determined only at the end of each fiscal year.
At March 31, 2017, the cost of investment securities for tax purposes was $9,386,904,000. Net unrealized appreciation of investment securities for tax purposes was $1,426,332,000, consisting entirely of unrealized gains on securities that had risen in value since their purchase.
E. Capital shares issued and redeemed were:
| Six Months Ended | Year Ended | |
| March 31, 2017 | September 30, 2016 | |
| Shares | Shares | |
| (000) | (000) | |
| Issued | 102,062 | 162,780 |
| Issued in Lieu of Cash Distributions | 11,191 | 26,995 |
| Redeemed | (110,853) | (209,799) |
| Net Increase (Decrease) in Shares Outstanding | 2,400 | (20,024) |
15
Target Retirement Income Fund
F. Transactions during the period in affiliated underlying Vanguard funds were as follows:
| Current Period Transactions | ||||||
| Sept. 30, | Proceeds | March 31, | ||||
| 2016 | from | Capital Gain | 2017 | |||
| Market | Purchases | Securities | Distributions | Market | ||
| Value | at Cost | Sold | Income | Received | Value | |
| ($000) | ($000) | ($000) | ($000) | ($000) | ($000) | |
| Vanguard Market Liquidity Fund | 371 | NA1 | NA1 | 5 | — | 1,191 |
| Vanguard Short-Term | ||||||
| Inflation-Protected Securities | ||||||
| Index Fund | 1,812,902 | 32,274 | 48,159 | 9,746 | — | 1,794,799 |
| Vanguard Total Bond Market II | ||||||
| Index Fund | 4,017,379 | 271,105 | 103,104 | 46,063 | 4,082 | 4,040,261 |
| Vanguard Total International | ||||||
| Bond Index Fund | 1,718,889 | 75,533 | 20,235 | 20,447 | — | 1,718,880 |
| Vanguard Total International | ||||||
| Stock Index Fund | 1,303,867 | 49,784 | 108,813 | 14,467 | — | 1,310,318 |
| Vanguard Total Stock Market | ||||||
| Index Fund | 1,951,622 | 65,882 | 238,818 | 19,490 | — | 1,947,787 |
| Total | 10,805,030 | 494,578 | 519,129 | 110,218 | 4,082 | 10,813,236 |
| 1 Not applicable—purchases and sales are for temporary cash investment purposes. | ||||||
G. In December 2016, the fund’s board of trustees approved a plan of reorganization of Vanguard Target Retirement 2010 Fund into Vanguard Target Retirement Income Fund. The reorganization does not require shareholder approval. Shares of Vanguard Target Retirement 2010 Fund will be exchanged for new shares of Vanguard Target Retirement Income Fund. The reorganization is expected to qualify as a tax-free reorganization for federal income tax purposes, and to be completed in July 2017. In anticipation of the reorganization, the Vanguard Target Retirement 2010 Fund has been closed to new accounts.
Management has determined that no other material events or transactions occurred subsequent to March 31, 2017, that would require recognition or disclosure in these financial statements.
16
Target Retirement 2010 Fund
Fund Profile
As of March 31, 2017
| Total Fund Characteristics | |
| Ticker Symbol | VTENX |
| 30-Day SEC Yield | 1.80% |
| Acquired Fund Fees and Expenses1 | 0.13% |
| Allocation to Underlying Vanguard Funds | |
| Vanguard Total Bond Market II Index Fund | |
| Investor Shares | 37.1% |
| Vanguard Total Stock Market Index Fund | |
| Investor Shares | 18.3 |
| Vanguard Short-Term Inflation-Protected | |
| Securities Index Fund Investor Shares | 16.5 |
| Vanguard Total International Bond Index | |
| Fund Investor Shares | 15.8 |
| Vanguard Total International Stock Index | |
| Fund Investor Shares | 12.3 |
| Total Fund Volatility Measures | ||
| MSCI US | ||
| Target 2010 | Broad | |
| Composite | Market | |
| Index | Index | |
| R-Squared | 1.00 | 0.72 |
| Beta | 0.99 | 0.32 |
| These measures show the degree and timing of the fund’s | ||
| fluctuations compared with the indexes over 36 months. | ||
Fund Asset Allocation
| 69.4% Bonds |
| 30.6% Stocks |
1 This figure—drawn from the prospectus dated January 27, 2017—represents an estimate of the weighted average of the expense ratios and any transaction fees charged by the underlying mutual funds (the ”acquired” funds) in which the Target Retirement 2010 Fund invests. The fund does not charge any expenses or fees of its own. For the six months ended March 31, 2017, the annualized acquired fund fees and expenses were 0.13%.
![]()
Target Retirement 2010 Fund
Performance Summary
All of the returns in this report represent past performance, which is not a guarantee of future results that may be achieved by the fund. (Current performance may be lower or higher than the performance data cited. For performance data current to the most recent month-end, visit our website at vanguard.com/performance.) Note, too, that both investment returns and principal value can fluctuate widely, so an investor’s shares, when sold, could be worth more or less than their original cost. The returns shown do not reflect taxes that a shareholder would pay on fund distributions or on the sale of fund shares.
Fiscal-Year Total Returns (%): September 30, 2006, Through March 31, 2017
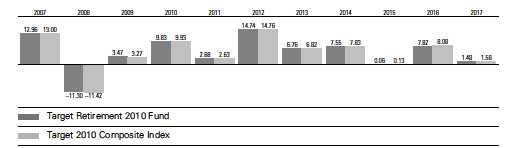
For a benchmark description, see the Glossary.
Note: For 2017, performance data reflect the six months ended March 31, 2017.
| Average Annual Total Returns: Periods Ended March 31, 2017 | ||||||
| Ten Years | ||||||
| Inception Date | One Year | Five Years | Income | Capital | Total | |
| Target Retirement 2010 | ||||||
| Fund | 6/7/2006 | 5.55% | 5.32% | 2.29% | 2.39% | 4.68% |
See Financial Highlights for dividend and capital gains information.
18
Target Retirement 2010 Fund
Financial Statements (unaudited)
Statement of Net Assets
As of March 31, 2017
The fund reports a complete list of its holdings in regulatory filings four times in each fiscal year, at the quarter-ends. For the second and fourth fiscal quarters, the lists appear in the fund’s semiannual and annual reports to shareholders. For the first and third fiscal quarters, the fund files the lists with the Securities and Exchange Commission on Form N-Q. Shareholders can look up the fund’s Forms N-Q on the SEC’s website at sec.gov. Forms N-Q may also be reviewed and copied at the SEC’s Public Reference Room (see the back cover of this report for further information).
| Market | ||
| Value• | ||
| Shares | ($000) | |
| Investment Companies (100.0%) | ||
| U.S. Stock Fund (18.3%) | ||
| Vanguard Total Stock Market Index Fund Investor Shares | 17,204,399 | 1,015,748 |
| International Stock Fund (12.3%) | ||
| Vanguard Total International Stock Index Fund Investor Shares | 42,833,487 | 681,909 |
| U.S. Bond Funds (53.6%) | ||
| 1 Vanguard Total Bond Market II Index Fund Investor Shares | 193,566,043 | 2,059,543 |
| Vanguard Short-Term Inflation-Protected Securities Index Fund Investor Shares | 37,057,027 | 919,014 |
| 2,978,557 | ||
| International Bond Fund (15.8%) | ||
| Vanguard Total International Bond Index Fund Investor Shares | 81,344,992 | 879,339 |
| Total Investments (100.0%) (Cost $4,746,009) | 5,555,553 | |
| Other Assets and Liabilities (0.0%) | ||
| Other Assets | 15,020 | |
| Liabilities | (15,074) | |
| (54) | ||
| Net Assets (100%) | ||
| Applicable to 213,860,509 outstanding $.001 par value shares of | ||
| beneficial interest (unlimited authorization) | 5,555,499 | |
| Net Asset Value Per Share | $25.98 | |
19
Target Retirement 2010 Fund
| Amount | |
| ($000) | |
| Statement of Assets and Liabilities | |
| Assets | |
| Investments in Securities, at Value—Affiliated Vanguard Funds | 5,555,553 |
| Receivables for Investment Securities Sold | 5,873 |
| Receivables for Capital Shares Issued | 4,143 |
| Receivables for Accrued Income | 5,004 |
| Total Assets | 5,570,573 |
| Liabilities | |
| Payables for Investment Securities Purchased | 5,004 |
| Payables for Capital Shares Redeemed | 8,433 |
| Other Liabilities | 1,637 |
| Total Liabilities | 15,074 |
| Net Assets | 5,555,499 |
| At March 31, 2017, net assets consisted of: | |
| Amount | |
| ($000) | |
| Paid-in Capital | 4,637,939 |
| Undistributed Net Investment Income | 20,881 |
| Accumulated Net Realized Gains | 87,135 |
| Unrealized Appreciation (Depreciation) | 809,544 |
| Net Assets | 5,555,499 |
• See Note A in Notes to Financial Statements.
1 Affiliated fund available only to Vanguard funds and certain trusts and accounts managed by Vanguard.
See accompanying Notes, which are an integral part of the Financial Statements.
20
Target Retirement 2010 Fund
Statement of Operations
| Six Months Ended | |
| March 31, 2017 | |
| ($000) | |
| Investment Income | |
| Income | |
| Income Distributions Received from Affiliated Funds | 58,409 |
| Net Investment Income—Note B | 58,409 |
| Realized Net Gain (Loss) | |
| Capital Gain Distributions Received from Affiliated Funds | 2,150 |
| Affiliated Investment Securities Sold | 99,176 |
| Realized Net Gain (Loss) | 101,326 |
| Change in Unrealized Appreciation (Depreciation) of Investment Securities | (79,253) |
| Net Increase (Decrease) in Net Assets Resulting from Operations | 80,482 |
See accompanying Notes, which are an integral part of the Financial Statements.
21
Target Retirement 2010 Fund
Statement of Changes in Net Assets
| Six Months Ended | Year Ended | |
| March 31, | September 30, | |
| 2017 | 2016 | |
| ($000) | ($000) | |
| Increase (Decrease) in Net Assets | ||
| Operations | ||
| Net Investment Income | 58,409 | 105,450 |
| Realized Net Gain (Loss) | 101,326 | 117,523 |
| Change in Unrealized Appreciation (Depreciation) | (79,253) | 216,049 |
| Net Increase (Decrease) in Net Assets Resulting from Operations | 80,482 | 439,022 |
| Distributions | ||
| Net Investment Income | (101,345) | (106,386) |
| Realized Capital Gain1 | (79,394) | (204,297) |
| Total Distributions | (180,739) | (310,683) |
| Capital Share Transactions | ||
| Issued | 517,992 | 1,092,650 |
| Issued in Lieu of Cash Distributions | 176,983 | 304,528 |
| Redeemed | (846,712) | (1,860,505) |
| Net Increase (Decrease) from Capital Share Transactions | (151,737) | (463,327) |
| Total Increase (Decrease) | (251,994) | (334,988) |
| Net Assets | ||
| Beginning of Period | 5,807,493 | 6,142,481 |
| End of Period2 | 5,555,499 | 5,807,493 |
| 1 Includes fiscal 2017 and 2016 short-term gain distributions totaling $1,747,000 and $3,122,000, respectively. Short-term gain distributions | ||
| are treated as ordinary income dividends for tax purposes. | ||
| 2 Net Assets—End of Period includes undistributed (overdistributed) net investment income of $20,881,000 and $63,817,000. | ||
See accompanying Notes, which are an integral part of the Financial Statements.
22
Target Retirement 2010 Fund
Financial Highlights
| Six Months | |||||||
| Ended | |||||||
| For a Share Outstanding | March 31, | Year Ended September 30, | |||||
| Throughout Each Period | 2017 | 2016 | 2015 | 2014 | 2013 | 2012 | |
| Net Asset Value, Beginning of Period | $26.45 | $25.90 | $26.67 | $25.50 | $24.45 | $21.91 | |
| Investment Operations | |||||||
| Net Investment Income | . 277 | .498 | .529 | .487 | .516 | .571 | |
| Capital Gain Distributions Received | .009 | .014 | .036 | .004 | .103 | .100 | |
| Net Realized and Unrealized Gain (Loss) | |||||||
| on Investments | .082 | 1.431 | (.534) | 1.402 | .999 | 2.502 | |
| Total from Investment Operations | .368 | 1.943 | .031 | 1.893 | 1.618 | 3.173 | |
| Distributions | |||||||
| Dividends from Net Investment Income | (. 470) | (. 477) | (. 464) | (. 422) | (. 531) | (. 596) | |
| Distributions from Realized Capital Gains | (. 368) | (. 916) | (. 337) | (. 301) | (. 037) | (. 037) | |
| Total Distributions | (. 838) | (1.393) | (. 801) | (.723) | (. 568) | (. 633) | |
| Net Asset Value, End of Period | $25.98 | $26.45 | $25.90 | $26.67 | $25.50 | $24.45 | |
| Total Return1 | 1.48% | 7.82% | 0.06% | 7.55% | 6.76% | 14.74% | |
| Ratios/Supplemental Data | |||||||
| Net Assets, End of Period (Millions) | $5,555 | $5,807 | $6,142 | $6,952 | $6,679 | $6,155 | |
| Ratio of Total Expenses to | |||||||
| Average Net Assets | — | — | — | — | — | — | |
| Acquired Fund Fees and Expenses | 0.13% | 0.13% | 0.14% | 0.16% | 0.16% | 0.16% | |
| Ratio of Net Investment Income to | |||||||
| Average Net Assets | 2.08% | 1.81% | 1.86% | 1.83% | 2.08% | 2.51% | |
| Portfolio Turnover Rate | 6% | 8% | 15% | 13% | 38% | 12% | |
The expense ratio, acquired fund fees and expenses, net investment income ratio, and turnover rate for the current period have been
annualized.
1 Total returns do not include account service fees that may have applied in the periods shown. Fund prospectuses provide information about
any applicable account service fees.
See accompanying Notes, which are an integral part of the Financial Statements.
23
Target Retirement 2010 Fund
Notes to Financial Statements
Vanguard Target Retirement 2010 Fund is registered under the Investment Company Act of 1940 as an open-end investment company, or mutual fund. The fund follows a balanced investment strategy by investing in selected Vanguard funds to achieve its targeted allocation of assets to U.S. and international stocks, and U.S. and international bonds. Financial statements and other information about each underlying fund are available on vanguard.com.
A. The following significant accounting policies conform to generally accepted accounting principles for U.S. investment companies. The fund consistently follows such policies in preparing its financial statements.
1. Security Valuation: Investments are valued at the net asset value of each underlying Vanguard fund determined as of the close of the New York Stock Exchange (generally 4 p.m., Eastern time) on the valuation date.
2. Federal Income Taxes: The fund intends to continue to qualify as a regulated investment company and distribute all of its taxable income. Management has analyzed the fund’s tax positions taken for all open federal income tax years (September 30, 2013–2016), and for the period ended March 31, 2017, and has concluded that no provision for federal income tax is required in the fund’s financial statements.
3. Distributions: Distributions to shareholders are recorded on the ex-dividend date.
4. Credit Facility: The fund and certain other funds managed by The Vanguard Group (“Vanguard”) participate in a $3.1 billion committed credit facility provided by a syndicate of lenders pursuant to a credit agreement that may be renewed annually; each fund is individually liable for its borrowings, if any, under the credit facility. Borrowings may be utilized for temporary and emergency purposes, and are subject to the fund’s regulatory and contractual borrowing restrictions. The participating funds are charged administrative fees and an annual commitment fee of 0.10% of the undrawn amount of the facility; these fees are allocated to the funds based on a method approved by the fund’s board of trustees and borne by the funds in which the fund invests (see Note B). Any borrowings under this facility bear interest at a rate based upon the higher of the one-month London Interbank Offered Rate, federal funds effective rate, or overnight bank funding rate plus an agreed-upon spread.
The fund had no borrowings outstanding at March 31, 2017, or at any time during the period then ended.
5. Other: Income and capital gain distributions received are recorded on the ex-dividend date. Security transactions are accounted for on the date securities are bought or sold. Costs used to determine realized gains (losses) on the sale of investment securities are those of the specific securities sold.
B. In accordance with the terms of a Funds’ Service Agreement (the “FSA”) between Vanguard and the fund, Vanguard furnishes to the fund investment advisory, corporate management, administrative, marketing, and distribution services at Vanguard’s cost of operations (as defined by the FSA). These costs of operations are allocated to the fund based on methods and guidelines approved by the board of trustees. The FSA provides that expenses otherwise allocable to Vanguard funds-of-funds may be reduced or eliminated to the extent of savings realized by the underlying Vanguard funds by virtue of being part of a fund-of-funds. Accordingly, all expenses for services provided by Vanguard to the fund and all other expenses incurred by the fund during the period ended March 31, 2017, were borne by the underlying Vanguard funds in which the fund invests. The fund’s trustees and officers are also trustees and officers, respectively, of the underlying Vanguard funds, as well as directors and employees, respectively, of Vanguard.
24
Target Retirement 2010 Fund
C. Various inputs may be used to determine the value of the fund’s investments. These inputs are summarized in three broad levels for financial statement purposes. The inputs or methodologies used to value securities are not necessarily an indication of the risk associated with investing in those securities.
Level 1—Quoted prices in active markets for identical securities.
Level 2—Other significant observable inputs (including quoted prices for similar securities, interest rates, prepayment speeds, credit risk, etc.).
Level 3—Significant unobservable inputs (including the fund’s own assumptions used to determine the fair value of investments).
At March 31, 2017, 100% of the market value of the fund’s investments was determined based on Level 1 inputs.
D. Distributions are determined on a tax basis and may differ from net investment income and realized capital gains for financial reporting purposes. Differences may be permanent or temporary. Permanent differences are reclassified among capital accounts in the financial statements to reflect their tax character. Temporary differences arise when certain items of income, expense, gain, or loss are recognized in different periods for financial statement and tax purposes. These differences will reverse at some time in the future. Differences in classification may also result from the treatment of short-term gains as ordinary income for tax purposes. The fund’s tax-basis capital gains and losses are determined only at the end of each fiscal year.
At March 31, 2017, the cost of investment securities for tax purposes was $4,746,009,000. Net unrealized appreciation of investment securities for tax purposes was $809,544,000, consisting entirely of unrealized gains on securities that had risen in value since their purchase.
E. Capital shares issued and redeemed were:
| Six Months Ended | Year Ended | |
| March 31, 2017 | September 30, 2016 | |
| Shares | Shares | |
| (000) | (000) | |
| Issued | 20,006 | 42,556 |
| Issued in Lieu of Cash Distributions | 6,998 | 12,186 |
| Redeemed | (32,736) | (72,302) |
| Net Increase (Decrease) in Shares Outstanding | (5,732) | (17,560) |
25
Target Retirement 2010 Fund
F. Transactions during the period in affiliated underlying Vanguard funds were as follows:
| Current Period Transactions | ||||||
| Sept. 30, | Proceeds | March 31, | ||||
| 2016 | from | Capital Gain | 2017 | |||
| Market | Purchases | Securities | Distributions | Market | ||
| Value | at Cost | Sold | Income | Received | Value | |
| ($000) | ($000) | ($000) | ($000) | ($000) | ($000) | |
| Vanguard Market Liquidity Fund | 7,173 | NA1 | NA1 | 3 | — | — |
| Vanguard Short-Term | ||||||
| Inflation-Protected Securities | ||||||
| Index Fund | 920,048 | 19,326 | 19,225 | 5,011 | — | 919,014 |
| Vanguard Total Bond Market II | ||||||
| Index Fund | 2,116,007 | 87,648 | 67,719 | 24,081 | 2,150 | 2,059,543 |
| Vanguard Total International | ||||||
| Bond Index Fund | 909,221 | 14,676 | 15,205 | 10,760 | — | 879,339 |
| Vanguard Total International | ||||||
| Stock Index Fund | 751,211 | 23,722 | 127,675 | 7,950 | — | 681,909 |
| Vanguard Total Stock Market | ||||||
| Index Fund | 1,122,778 | 31,648 | 230,831 | 10,604 | — | 1,015,748 |
| Total | 5,826,438 | 177,020 | 460,655 | 58,409 | 2,150 | 5,555,553 |
| 1 Not applicable—purchases and sales are for temporary cash investment purposes. | ||||||
G. In December 2016, the fund’s board of trustees approved a plan of reorganization of Vanguard Target Retirement 2010 Fund into Vanguard Target Retirement Income Fund. The reorganization does not require shareholder approval. Shares of Vanguard Target Retirement 2010 Fund will be exchanged for new shares of Vanguard Target Retirement Income Fund. The reorganization is expected to qualify as a tax-free reorganization for federal income tax purposes, and to be completed in July 2017. In anticipation of the reorganization, the Vanguard Target Retirement 2010 Fund has been closed to new accounts.
Management has determined that no other material events or transactions occurred subsequent to March 31, 2017, that would require recognition or disclosure in these financial statements.
26
Target Retirement 2015 Fund
Fund Profile
As of March 31, 2017
| Total Fund Characteristics | |
| Ticker Symbol | VTXVX |
| 30-Day SEC Yield | 1.91% |
| Acquired Fund Fees and Expenses1 | 0.14% |
| Allocation to Underlying Vanguard Funds | |
| Vanguard Total Bond Market II Index Fund | |
| Investor Shares | 31.6% |
| Vanguard Total Stock Market Index Fund | |
| Investor Shares | 26.8 |
| Vanguard Total International Stock Index | |
| Fund Investor Shares | 17.9 |
| Vanguard Total International Bond Index | |
| Fund Investor Shares | 13.4 |
| Vanguard Short-Term Inflation-Protected | |
| Securities Index Fund Investor Shares | 10.3 |
| Total Fund Volatility Measures | ||
| MSCI US | ||
| Target 2015 | Broad | |
| Composite | Market | |
| Index | Index | |
| R-Squared | 1.00 | 0.84 |
| Beta | 0.98 | 0.45 |
| These measures show the degree and timing of the fund’s | ||
| fluctuations compared with the indexes over 36 months. | ||
Fund Asset Allocation
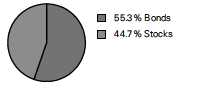
1 This figure—drawn from the prospectus dated January 27, 2017—represents an estimate of the weighted average of the expense ratios and any
transaction fees charged by the underlying mutual funds (the ”acquired” funds) in which the Target Retirement 2015 Fund invests. The fund does not
charge any expenses or fees of its own. For the six months ended March 31, 2017, the annualized acquired fund fees and expenses were 0.14%.
27
Target Retirement 2015 Fund
Performance Summary
All of the returns in this report represent past performance, which is not a guarantee of future results that may be achieved by the fund. (Current performance may be lower or higher than the performance data cited. For performance data current to the most recent month-end, visit our website at vanguard.com/performance.) Note, too, that both investment returns and principal value can fluctuate widely, so an investor’s shares, when sold, could be worth more or less than their original cost. The returns shown do not reflect taxes that a shareholder would pay on fund distributions or on the sale of fund shares.
Fiscal-Year Total Returns (%): September 30, 2006, Through March 31, 2017
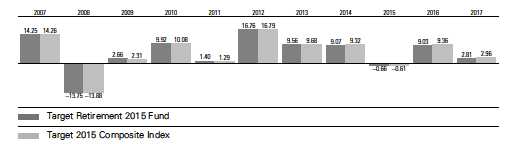
For a benchmark description, see the Glossary.
Note: For 2017, performance data reflect the six months ended March 31, 2017.
| Average Annual Total Returns: Periods Ended March 31, 2017 | ||||||
| Ten Years | ||||||
| Inception Date | One Year | Five Years | Income | Capital | Total | |
| Target Retirement 2015 | ||||||
| Fund | 10/27/2003 | 7.70% | 6.45% | 2.41% | 2.61% | 5.02% |
See Financial Highlights for dividend and capital gains information.
28
Target Retirement 2015 Fund
Financial Statements (unaudited)
Statement of Net Assets
As of March 31, 2017
The fund reports a complete list of its holdings in regulatory filings four times in each fiscal year, at the quarter-ends. For the second and fourth fiscal quarters, the lists appear in the fund’s semiannual and annual reports to shareholders. For the first and third fiscal quarters, the fund files the lists with the Securities and Exchange Commission on Form N-Q. Shareholders can look up the fund’s Forms N-Q on the SEC’s website at sec.gov. Forms N-Q may also be reviewed and copied at the SEC’s Public Reference Room (see the back cover of this report for further information).
| Market | ||
| Value• | ||
| Shares | ($000) | |
| Investment Companies (100.0%) | ||
| U.S. Stock Fund (26.8%) | ||
| Vanguard Total Stock Market Index Fund Investor Shares | 77,898,010 | 4,599,098 |
| International Stock Fund (17.9%) | ||
| Vanguard Total International Stock Index Fund Investor Shares | 193,040,494 | 3,073,205 |
| U.S. Bond Funds (41.9%) | ||
| 1 Vanguard Total Bond Market II Index Fund Investor Shares | 509,207,909 | 5,417,972 |
| Vanguard Short-Term Inflation-Protected Securities Index Fund Investor Shares | 71,500,352 | 1,773,209 |
| 7,191,181 | ||
| International Bond Fund (13.4%) | ||
| Vanguard Total International Bond Index Fund Investor Shares | 212,726,537 | 2,299,574 |
| Total Investment Companies (Cost $13,771,254) | 17,163,058 | |
| Temporary Cash Investment (0.0%) | ||
| Money Market Fund (0.0%) | ||
| 1 Vanguard Market Liquidity Fund, 0.965% (Cost $1,743) | 17,425 | 1,743 |
| Total Investments (100.0%) (Cost $13,772,997) | 17,164,801 | |
| Other Assets and Liabilities (0.0%) | ||
| Other Assets | 83,888 | |
| Liabilities | (85,072) | |
| (1,184) | ||
| Net Assets (100%) | ||
| Applicable to 1,143,917,945 outstanding $.001 par value shares of | ||
| beneficial interest (unlimited authorization) | 17,163,617 | |
| Net Asset Value Per Share | $15.00 | |
29
Target Retirement 2015 Fund
| Amount | |
| ($000) | |
| Statement of Assets and Liabilities | |
| Assets | |
| Investments in Securities, at Value—Affiliated Vanguard Funds | 17,164,801 |
| Receivables for Investment Securities Sold | 45,000 |
| Receivables for Capital Shares Issued | 25,830 |
| Receivables for Accrued Income | 13,058 |
| Total Assets | 17,248,689 |
| Liabilities | |
| Payables for Investment Securities Purchased | 48,608 |
| Payables for Capital Shares Redeemed | 36,464 |
| Total Liabilities | 85,072 |
| Net Assets | 17,163,617 |
| At March 31, 2017, net assets consisted of: | |
| Amount | |
| ($000) | |
| Paid-in Capital | 13,404,221 |
| Undistributed Net Investment Income | 65,392 |
| Accumulated Net Realized Gains | 302,200 |
| Unrealized Appreciation (Depreciation) | 3,391,804 |
| Net Assets | 17,163,617 |
• See Note A in Notes to Financial Statements.
1 Affiliated fund available only to Vanguard funds and certain trusts and accounts managed by Vanguard. Rate shown for Vanguard Market
Liquidity Fund is the 7-day yield.
See accompanying Notes, which are an integral part of the Financial Statements.
30
Target Retirement 2015 Fund
Statement of Operations
| Six Months Ended | |
| March 31, 2017 | |
| ($000) | |
| Investment Income | |
| Income | |
| Income Distributions Received from Affiliated Funds | 181,244 |
| Net Investment Income—Note B | 181,244 |
| Realized Net Gain (Loss) | |
| Capital Gain Distributions Received from Affiliated Funds | 5,540 |
| Affiliated Investment Securities Sold | 336,141 |
| Realized Net Gain (Loss) | 341,681 |
| Change in Unrealized Appreciation (Depreciation) of Investment Securities | (43,763) |
| Net Increase (Decrease) in Net Assets Resulting from Operations | 479,162 |
See accompanying Notes, which are an integral part of the Financial Statements.
31
Target Retirement 2015 Fund
Statement of Changes in Net Assets
| Six Months Ended | Year Ended | |
| March 31, | September 30, | |
| 2017 | 2016 | |
| ($000) | ($000) | |
| Increase (Decrease) in Net Assets | ||
| Operations | ||
| Net Investment Income | 181,244 | 349,495 |
| Realized Net Gain (Loss) | 341,681 | 510,780 |
| Change in Unrealized Appreciation (Depreciation) | (43,763) | 681,539 |
| Net Increase (Decrease) in Net Assets Resulting from Operations | 479,162 | 1,541,814 |
| Distributions | ||
| Net Investment Income | (327,192) | (358,456) |
| Realized Capital Gain1 | (347,118) | (835,597) |
| Total Distributions | (674,310) | (1,194,053) |
| Capital Share Transactions | ||
| Issued | 1,822,445 | 3,035,107 |
| Issued in Lieu of Cash Distributions | 660,086 | 1,169,881 |
| Redeemed | (2,602,369) | (5,932,510) |
| Net Increase (Decrease) from Capital Share Transactions | (119,838) | (1,727,522) |
| Total Increase (Decrease) | (314,986) | (1,379,761) |
| Net Assets | ||
| Beginning of Period | 17,478,603 | 18,858,364 |
| End of Period2 | 17,163,617 | 17,478,603 |
| 1 Includes fiscal 2017 and 2016 short-term gain distributions totaling $3,623,000 and $10,790,000, respectively. Short-term gain distributions | ||
| are treated as ordinary income dividends for tax purposes. | ||
| 2 Net Assets—End of Period includes undistributed (overdistributed) net investment income of $65,392,000 and $211,340,000. | ||
See accompanying Notes, which are an integral part of the Financial Statements.
32
Target Retirement 2015 Fund
Financial Highlights
| Six Months | |||||||
| Ended | |||||||
| For a Share Outstanding | March 31, | Year Ended September 30, | |||||
| Throughout Each Period | 2017 | 2016 | 2015 | 2014 | 2013 | 2012 | |
| Net Asset Value, Beginning of Period | $15.19 | $14.90 | $15.44 | $14.49 | $13.54 | $11.91 | |
| Investment Operations | |||||||
| Net Investment Income | .162 | .311 | .327 | .300 | .298 | .327 | |
| Capital Gain Distributions Received | .005 | .007 | .018 | .002 | .039 | .053 | |
| Net Realized and Unrealized Gain (Loss) | |||||||
| on Investments | . 239 | .968 | (. 433) | .996 | .929 | 1.583 | |
| Total from Investment Operations | .406 | 1.286 | (.088) | 1.298 | 1.266 | 1.963 | |
| Distributions | |||||||
| Dividends from Net Investment Income | (. 289) | (. 299) | (. 284) | (. 261) | (. 298) | (. 313) | |
| Distributions from Realized Capital Gains | (. 307) | (. 697) | (.168) | (. 087) | (. 018) | (. 020) | |
| Total Distributions | (. 596) | (. 996) | (. 452) | (. 348) | (. 316) | (. 333) | |
| Net Asset Value, End of Period | $15.00 | $15.19 | $14.90 | $15.44 | $14.49 | $13.54 | |
| Total Return1 | 2.81% | 9.03% | -0.66% | 9.07% | 9.56% | 16.76% | |
| Ratios/Supplemental Data | |||||||
| Net Assets, End of Period (Millions) | $17,164 | $17,479 | $18,858 | $21,741 | $19,739 | $16,838 | |
| Ratio of Total Expenses to | |||||||
| Average Net Assets | — | — | — | — | — | — | |
| Acquired Fund Fees and Expenses | 0.14% | 0.14% | 0.14% | 0.16% | 0.16% | 0.16% | |
| Ratio of Net Investment Income to | |||||||
| Average Net Assets | 2.12% | 1.96% | 1.95% | 1.99% | 2.17% | 2.59% | |
| Portfolio Turnover Rate | 8% | 9% | 16% | 10% | 26% | 13% | |
| The expense ratio, acquired fund fees and expenses, net investment income ratio, and turnover rate for the current period have been | |||||||
| annualized. | |||||||
| 1 Total returns do not include account service fees that may have applied in the periods shown. Fund prospectuses provide information about | |||||||
| any applicable account service fees. | |||||||
See accompanying Notes, which are an integral part of the Financial Statements.
33
Target Retirement 2015 Fund
Notes to Financial Statements
Vanguard Target Retirement 2015 Fund is registered under the Investment Company Act of 1940 as an open-end investment company, or mutual fund. The fund follows a balanced investment strategy by investing in selected Vanguard funds to achieve its targeted allocation of assets to U.S. and international stocks, and U.S. and international bonds. Financial statements and other information about each underlying fund are available on vanguard.com.
A. The following significant accounting policies conform to generally accepted accounting principles for U.S. investment companies. The fund consistently follows such policies in preparing its financial statements.
1. Security Valuation: Investments are valued at the net asset value of each underlying Vanguard fund determined as of the close of the New York Stock Exchange (generally 4 p.m., Eastern time) on the valuation date.
2. Federal Income Taxes: The fund intends to continue to qualify as a regulated investment company and distribute all of its taxable income. Management has analyzed the fund’s tax positions taken for all open federal income tax years (September 30, 2013–2016), and for the period ended March 31, 2017, and has concluded that no provision for federal income tax is required in the fund’s financial statements.
3. Distributions: Distributions to shareholders are recorded on the ex-dividend date.
4. Credit Facility: The fund and certain other funds managed by The Vanguard Group (“Vanguard”) participate in a $3.1 billion committed credit facility provided by a syndicate of lenders pursuant to a credit agreement that may be renewed annually; each fund is individually liable for its borrowings, if any, under the credit facility. Borrowings may be utilized for temporary and emergency purposes, and are subject to the fund’s regulatory and contractual borrowing restrictions. The participating funds are charged administrative fees and an annual commitment fee of 0.10% of the undrawn amount of the facility; these fees are allocated to the funds based on a method approved by the fund’s board of trustees and borne by the funds in which the fund invests (see Note B). Any borrowings under this facility bear interest at a rate based upon the higher of the one-month London Interbank Offered Rate, federal funds effective rate, or overnight bank funding rate plus an agreed-upon spread.
The fund had no borrowings outstanding at March 31, 2017, or at any time during the period then ended.
5. Other: Income and capital gain distributions received are recorded on the ex-dividend date. Security transactions are accounted for on the date securities are bought or sold. Costs used to determine realized gains (losses) on the sale of investment securities are those of the specific securities sold.
B. In accordance with the terms of a Funds’ Service Agreement (the “FSA”) between Vanguard and the fund, Vanguard furnishes to the fund investment advisory, corporate management, administrative, marketing, and distribution services at Vanguard’s cost of operations (as defined by the FSA). These costs of operations are allocated to the fund based on methods and guidelines approved by the board of trustees. The FSA provides that expenses otherwise allocable to Vanguard funds-of-funds may be reduced or eliminated to the extent of savings realized by the underlying Vanguard funds by virtue of being part of a fund-of-funds. Accordingly, all expenses for services provided by Vanguard to the fund and all other expenses incurred by the fund during the period ended March 31, 2017, were borne by the underlying Vanguard funds in which the fund invests. The fund’s trustees and officers are also trustees and officers, respectively, of the underlying Vanguard funds, as well as directors and employees, respectively, of Vanguard.
34
Target Retirement 2015 Fund
C. Various inputs may be used to determine the value of the fund’s investments. These inputs are summarized in three broad levels for financial statement purposes. The inputs or methodologies used to value securities are not necessarily an indication of the risk associated with investing in those securities.
Level 1—Quoted prices in active markets for identical securities.
Level 2—Other significant observable inputs (including quoted prices for similar securities, interest rates, prepayment speeds, credit risk, etc.).
Level 3—Significant unobservable inputs (including the fund’s own assumptions used to determine the fair value of investments).
At March 31, 2017, 100% of the market value of the fund’s investments was determined based on Level 1 inputs.
D. Distributions are determined on a tax basis and may differ from net investment income and realized capital gains for financial reporting purposes. Differences may be permanent or temporary. Permanent differences are reclassified among capital accounts in the financial statements to reflect their tax character. Temporary differences arise when certain items of income, expense, gain, or loss are recognized in different periods for financial statement and tax purposes. These differences will reverse at some time in the future. Differences in classification may also result from the treatment of short-term gains as ordinary income for tax purposes. The fund’s tax-basis capital gains and losses are determined only at the end of each fiscal year.
At March 31, 2017, the cost of investment securities for tax purposes was $13,772,997,000. Net unrealized appreciation of investment securities for tax purposes was $3,391,804,000, consisting entirely of unrealized gains on securities that had risen in value since their purchase.
E. Capital shares issued and redeemed were:
| Six Months Ended | Year Ended | |
| March 31, 2017 | September 30, 2016 | |
| Shares | Shares | |
| (000) | (000) | |
| Issued | 122,430 | 206,486 |
| Issued in Lieu of Cash Distributions | 45,555 | 81,639 |
| Redeemed | (174,989) | (403,033) |
| Net Increase (Decrease) in Shares Outstanding | (7,004) | (114,908) |
35
Target Retirement 2015 Fund
F. Transactions during the period in affiliated underlying Vanguard funds were as follows:
| Current Period Transactions | ||||||
| Sept. 30, | Proceeds | March 31, | ||||
| 2016 | from | Capital Gain | 2017 | |||
| Market | Purchases | Securities | Distributions | Market | ||
| Value | at Cost | Sold | Income | Received | Value | |
| ($000) | ($000) | ($000) | ($000) | ($000) | ($000) | |
| Vanguard Market Liquidity Fund | 5,362 | NA1 | NA1 | 4 | — | 1,743 |
| Vanguard Short-Term | ||||||
| Inflation-Protected Securities | ||||||
| Index Fund | 1,669,223 | 105,658 | — | 9,143 | — | 1,773,209 |
| Vanguard Total Bond Market II | ||||||
| Index Fund | 5,387,819 | 327,346 | 102,833 | 62,021 | 5,540 | 5,417,972 |
| Vanguard Total International | ||||||
| Bond Index Fund | 2,326,492 | 57,209 | 9,413 | 27,545 | — | 2,299,574 |
| Vanguard Total International | ||||||
| Stock Index Fund | 3,245,691 | 100,575 | 429,662 | 35,419 | — | 3,073,205 |
| Vanguard Total Stock Market | ||||||
| Index Fund | 4,867,412 | 54,881 | 729,718 | 47,112 | — | 4,599,098 |
| Total | 17,501,999 | 645,669 | 1,271,626 | 181,244 | 5,540 | 17,164,801 |
| 1 Not applicable—purchases and sales are for temporary cash investment purposes. | ||||||
G. Management has determined that no material events or transactions occurred subsequent to March 31, 2017, that would require recognition or disclosure in these financial statements.
36
Target Retirement 2020 Fund
Fund Profile
As of March 31, 2017
| Total Fund Characteristics | |
| Ticker Symbol | VTWNX |
| 30-Day SEC Yield | 2.04% |
| Acquired Fund Fees and Expenses1 | 0.14% |
| Allocation to Underlying Vanguard Funds | |
| Vanguard Total Stock Market Index Fund | |
| Investor Shares | 33.5% |
| Vanguard Total Bond Market II Index Fund | |
| Investor Shares | 28.7 |
| Vanguard Total International Stock Index | |
| Fund Investor Shares | 22.8 |
| Vanguard Total International Bond Index | |
| Fund Investor Shares | 12.1 |
| Vanguard Short-Term Inflation-Protected | |
| Securities Index Fund Investor Shares | 2.9 |
| Total Fund Volatility Measures | ||
| MSCI US | ||
| Target 2020 | Broad | |
| Composite | Market | |
| Index | Index | |
| R-Squared | 1.00 | 0.88 |
| Beta | 0.98 | 0.55 |
| These measures show the degree and timing of the fund’s | ||
| fluctuations compared with the indexes over 36 months. | ||
Fund Asset Allocation
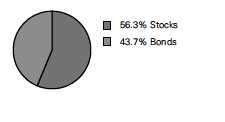
1 This figure—drawn from the prospectus dated January 27, 2017—represents an estimate of the weighted average of the expense ratios and any transaction fees charged by the underlying mutual funds (the ”acquired” funds) in which the Target Retirement 2020 Fund invests. The fund does not charge any expenses or fees of its own. For the six months ended March 31, 2017, the annualized acquired fund fees and expenses were 0.14%.
37
Target Retirement 2020 Fund
Performance Summary
All of the returns in this report represent past performance, which is not a guarantee of future results that may be achieved by the fund. (Current performance may be lower or higher than the performance data cited. For performance data current to the most recent month-end, visit our website at vanguard.com/performance.) Note, too, that both investment returns and principal value can fluctuate widely, so an investor’s shares, when sold, could be worth more or less than their original cost. The returns shown do not reflect taxes that a shareholder would pay on fund distributions or on the sale of fund shares.
Fiscal-Year Total Returns (%): September 30, 2006, Through March 31, 2017
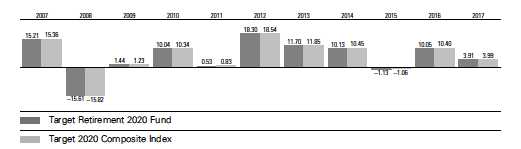
For a benchmark description, see the Glossary.
Note: For 2017, performance data reflect the six months ended March 31, 2017.
| Average Annual Total Returns: Periods Ended March 31, 2017 | ||||||
| Ten Years | ||||||
| Inception Date | One Year | Five Years | Income | Capital | Total | |
| Target Retirement 2020 | ||||||
| Fund | 6/7/2006 | 9.44% | 7.34% | 2.22% | 3.01% | 5.23% |
See Financial Highlights for dividend and capital gains information.
38
Target Retirement 2020 Fund
Financial Statements (unaudited)
Statement of Net Assets
As of March 31, 2017
The fund reports a complete list of its holdings in regulatory filings four times in each fiscal year, at the quarter-ends. For the second and fourth fiscal quarters, the lists appear in the fund’s semiannual and annual reports to shareholders. For the first and third fiscal quarters, the fund files the lists with the Securities and Exchange Commission on Form N-Q. Shareholders can look up the fund’s Forms N-Q on the SEC’s website at sec.gov. Forms N-Q may also be reviewed and copied at the SEC’s Public Reference Room (see the back cover of this report for further information).
| Market | ||
| Value• | ||
| Shares | ($000) | |
| Investment Companies (99.9%) | ||
| U.S. Stock Fund (33.6%) | ||
| Vanguard Total Stock Market Index Fund Investor Shares | 167,161,865 | 9,869,236 |
| International Stock Fund (22.8%) | ||
| Vanguard Total International Stock Index Fund Investor Shares | 420,335,287 | 6,691,738 |
| U.S. Bond Funds (31.5%) | ||
| 1 Vanguard Total Bond Market II Index Fund Investor Shares | 791,513,837 | 8,421,707 |
| Vanguard Short-Term Inflation-Protected Securities Index Fund Investor Shares | 34,078,748 | 845,153 |
| 9,266,860 | ||
| International Bond Fund (12.0%) | ||
| Vanguard Total International Bond Index Fund Investor Shares | 327,700,560 | 3,542,443 |
| Total Investment Companies (Cost $23,555,137) | 29,370,277 | |
| Temporary Cash Investment (0.0%) | ||
| Money Market Fund (0.0%) | ||
| 1 Vanguard Market Liquidity Fund, 0.965% (Cost $3,398) | 33,980 | 3,399 |
| Total Investments (99.9%) (Cost $23,558,535) | 29,373,676 | |
| Other Assets and Liabilities (0.1%) | ||
| Other Assets | 192,347 | |
| Liabilities | (174,899) | |
| 17,448 | ||
| Net Assets (100%) | ||
| Applicable to 999,056,433 outstanding $.001 par value shares of | ||
| beneficial interest (unlimited authorization) | 29,391,124 | |
| Net Asset Value Per Share | $29.42 | |
39
Target Retirement 2020 Fund
| Amount | |
| ($000) | |
| Statement of Assets and Liabilities | |
| Assets | |
| Investments in Securities, at Value—Affiliated Vanguard Funds | 29,373,676 |
| Receivables for Investment Securities Sold | 68,378 |
| Receivables for Capital Shares Issued | 103,688 |
| Receivables for Accrued Income | 20,281 |
| Total Assets | 29,566,023 |
| Liabilities | |
| Payables for Investment Securities Purchased | 66,780 |
| Payables for Capital Shares Redeemed | 108,119 |
| Total Liabilities | 174,899 |
| Net Assets | 29,391,124 |
| At March 31, 2017, net assets consisted of: | |
| Amount | |
| ($000) | |
| Paid-in Capital | 23,303,453 |
| Undistributed Net Investment Income | 118,289 |
| Accumulated Net Realized Gains | 154,241 |
| Unrealized Appreciation (Depreciation) | 5,815,141 |
| Net Assets | 29,391,124 |
• See Note A in Notes to Financial Statements.
1 Affiliated fund available only to Vanguard funds and certain trusts and accounts managed by Vanguard. Rate shown for Vanguard Market
Liquidity Fund is the 7-day yield.
See accompanying Notes, which are an integral part of the Financial Statements.
40
Target Retirement 2020 Fund
Statement of Operations
| Six Months Ended | |
| March 31, 2017 | |
| ($000) | |
| Investment Income | |
| Income | |
| Income Distributions Received from Affiliated Funds | 307,934 |
| Net Investment Income—Note B | 307,934 |
| Realized Net Gain (Loss) | |
| Capital Gain Distributions Received from Affiliated Funds | 8,288 |
| Affiliated Investment Securities Sold | 156,262 |
| Realized Net Gain (Loss) | 164,550 |
| Change in Unrealized Appreciation (Depreciation) of Investment Securities | 623,951 |
| Net Increase (Decrease) in Net Assets Resulting from Operations | 1,096,435 |
See accompanying Notes, which are an integral part of the Financial Statements.
41
Target Retirement 2020 Fund
Statement of Changes in Net Assets
| Six Months Ended | Year Ended | |
| March 31, | September 30, | |
| 2017 | 2016 | |
| ($000) | ($000) | |
| Increase (Decrease) in Net Assets | ||
| Operations | ||
| Net Investment Income | 307,934 | 568,590 |
| Realized Net Gain (Loss) | 164,550 | 402,528 |
| Change in Unrealized Appreciation (Depreciation) | 623,951 | 1,587,346 |
| Net Increase (Decrease) in Net Assets Resulting from Operations | 1,096,435 | 2,558,464 |
| Distributions | ||
| Net Investment Income | (540,313) | (550,582) |
| Realized Capital Gain1 | (205,071) | (498,411) |
| Total Distributions | (745,384) | (1,048,993) |
| Capital Share Transactions | ||
| Issued | 4,446,489 | 6,393,675 |
| Issued in Lieu of Cash Distributions | 733,928 | 1,028,442 |
| Redeemed | (3,682,562) | (8,082,609) |
| Net Increase (Decrease) from Capital Share Transactions | 1,497,855 | (660,492) |
| Total Increase (Decrease) | 1,848,906 | 848,979 |
| Net Assets | ||
| Beginning of Period | 27,542,218 | 26,693,239 |
| End of Period2 | 29,391,124 | 27,542,218 |
| 1 Includes fiscal 2017 and 2016 short-term gain distributions totaling $6,153,000 and $47,512,000, respectively. Short-term gain distributions | ||
| are treated as ordinary income dividends for tax purposes. | ||
| 2 Net Assets—End of Period includes undistributed (overdistributed) net investment income of $118,289,000 and $350,668,000. | ||
See accompanying Notes, which are an integral part of the Financial Statements.
42
Target Retirement 2020 Fund
Financial Highlights
| Six Months | |||||||
| Ended | |||||||
| For a Share Outstanding | March 31, | Year Ended September 30, | |||||
| Throughout Each Period | 2017 | 2016 | 2015 | 2014 | 2013 | 2012 | |
| Net Asset Value, Beginning of Period | $29.09 | $27.52 | $28.40 | $26.26 | $24.04 | $20.83 | |
| Investment Operations | |||||||
| Net Investment Income | . 310 | . 619 | . 622 | .577 | .528 | .569 | |
| Capital Gain Distributions Received | .008 | .012 | .026 | .004 | .047 | .079 | |
| Net Realized and Unrealized Gain (Loss) | |||||||
| on Investments | .787 | 2.065 | (.946) | 2.054 | 2.179 | 3.106 | |
| Total from Investment Operations | 1.105 | 2.696 | (.298) | 2.635 | 2.754 | 3.754 | |
| Distributions | |||||||
| Dividends from Net Investment Income | (. 562) | (. 591) | (. 541) | (. 484) | (. 508) | (. 513) | |
| Distributions from Realized Capital Gains | (. 213) | (. 535) | (. 041) | (. 011) | (. 026) | (. 031) | |
| Total Distributions | (.775) | (1.126) | (. 582) | (. 495) | (. 534) | (. 544) | |
| Net Asset Value, End of Period | $29.42 | $29.09 | $27.52 | $28.40 | $26.26 | $24.04 | |
| Total Return1 | 3.91% | 10.05% | -1.13% | 10.13% | 11.70% | 18.30% | |
| Ratios/Supplemental Data | |||||||
| Net Assets, End of Period (Millions) | $29,391 | $27,542 | $26,693 | $27,488 | $21,785 | $16,078 | |
| Ratio of Total Expenses to | |||||||
| Average Net Assets | — | — | — | — | — | — | |
| Acquired Fund Fees and Expenses | 0.14% | 0.14% | 0.14% | 0.16% | 0.16% | 0.16% | |
| Ratio of Net Investment Income to | |||||||
| Average Net Assets | 2.20% | 2.14% | 2.07% | 2.14% | 2.23% | 2.62% | |
| Portfolio Turnover Rate | 8% | 15% | 25% | 7% | 17% | 8% | |
The expense ratio, acquired fund fees and expenses, net investment income ratio, and turnover rate for the current period have been annualized.
1 Total returns do not include account service fees that may have applied in the periods shown. Fund prospectuses provide information about
any applicable account service fees.
See accompanying Notes, which are an integral part of the Financial Statements.
43
Target Retirement 2020 Fund
Notes to Financial Statements
Vanguard Target Retirement 2020 Fund is registered under the Investment Company Act of 1940 as an open-end investment company, or mutual fund. The fund follows a balanced investment strategy by investing in selected Vanguard funds to achieve its targeted allocation of assets to U.S. and international stocks, and U.S. and international bonds. Financial statements and other information about each underlying fund are available on vanguard.com.
A. The following significant accounting policies conform to generally accepted accounting principles for U.S. investment companies. The fund consistently follows such policies in preparing its financial statements.
1. Security Valuation: Investments are valued at the net asset value of each underlying Vanguard fund determined as of the close of the New York Stock Exchange (generally 4 p.m., Eastern time) on the valuation date.
2. Federal Income Taxes: The fund intends to continue to qualify as a regulated investment company and distribute all of its taxable income. Management has analyzed the fund’s tax positions taken for all open federal income tax years (September 30, 2013–2016), and for the period ended March 31, 2017, and has concluded that no provision for federal income tax is required in the fund’s financial statements.
3. Distributions: Distributions to shareholders are recorded on the ex-dividend date.
4. Credit Facility: The fund and certain other funds managed by The Vanguard Group (“Vanguard”) participate in a $3.1 billion committed credit facility provided by a syndicate of lenders pursuant to a credit agreement that may be renewed annually; each fund is individually liable for its borrowings, if any, under the credit facility. Borrowings may be utilized for temporary and emergency purposes, and are subject to the fund’s regulatory and contractual borrowing restrictions. The participating funds are charged administrative fees and an annual commitment fee of 0.10% of the undrawn amount of the facility; these fees are allocated to the funds based on a method approved by the fund’s board of trustees and borne by the funds in which the fund invests (see Note B). Any borrowings under this facility bear interest at a rate based upon the higher of the one-month London Interbank Offered Rate, federal funds effective rate, or overnight bank funding rate plus an agreed-upon spread.
The fund had no borrowings outstanding at March 31, 2017, or at any time during the period then ended.
5. Other: Income and capital gain distributions received are recorded on the ex-dividend date. Security transactions are accounted for on the date securities are bought or sold. Costs used to determine realized gains (losses) on the sale of investment securities are those of the specific securities sold.
B. In accordance with the terms of a Funds’ Service Agreement (the “FSA”) between Vanguard and the fund, Vanguard furnishes to the fund investment advisory, corporate management, administrative, marketing, and distribution services at Vanguard’s cost of operations (as defined by the FSA). These costs of operations are allocated to the fund based on methods and guidelines approved by the board of trustees. The FSA provides that expenses otherwise allocable to Vanguard funds-of-funds may be reduced or eliminated to the extent of savings realized by the underlying Vanguard funds by virtue of being part of a fund-of-funds. Accordingly, all expenses for services provided by Vanguard to the fund and all other expenses incurred by the fund during the period ended March 31, 2017, were borne by the underlying Vanguard funds in which the fund invests. The fund’s trustees and officers are also trustees and officers, respectively, of the underlying Vanguard funds, as well as directors and employees, respectively, of Vanguard.
44
Target Retirement 2020 Fund
C. Various inputs may be used to determine the value of the fund’s investments. These inputs are summarized in three broad levels for financial statement purposes. The inputs or methodologies used to value securities are not necessarily an indication of the risk associated with investing in those securities.
Level 1—Quoted prices in active markets for identical securities.
Level 2—Other significant observable inputs (including quoted prices for similar securities, interest
rates, prepayment speeds, credit risk, etc.).
Level 3—Significant unobservable inputs (including the fund’s own assumptions used to determine
the fair value of investments).
At March 31, 2017, 100% of the market value of the fund’s investments was determined based on Level 1 inputs.
D. Distributions are determined on a tax basis and may differ from net investment income and realized capital gains for financial reporting purposes. Differences may be permanent or temporary. Permanent differences are reclassified among capital accounts in the financial statements to reflect their tax character. Temporary differences arise when certain items of income, expense, gain, or loss are recognized in different periods for financial statement and tax purposes. These differences will reverse at some time in the future. Differences in classification may also result from the treatment of short-term gains as ordinary income for tax purposes.
At March 31, 2017, the cost of investment securities for tax purposes was $23,558,535,000. Net unrealized appreciation of investment securities for tax purposes was $5,815,141,000, consisting entirely of unrealized gains on securities that had risen in value since their purchase.
E. Capital shares issued and redeemed were:
| Six Months Ended | Year Ended | |
| March 31, 2017 | September 30, 2016 | |
| Shares | Shares | |
| (000) | (000) | |
| Issued | 154,019 | 229,362 |
| Issued in Lieu of Cash Distributions | 26,017 | 37,534 |
| Redeemed | (127,631) | (290,081) |
| Net Increase (Decrease) in Shares Outstanding | 52,405 | (23,185) |
45
Target Retirement 2020 Fund
F. Transactions during the period in affiliated underlying Vanguard funds were as follows:
| Current Period Transactions | ||||||
| Sept. 30, | Proceeds | March 31, | ||||
| 2016 | from | Capital Gain | 2017 | |||
| Market | Purchases | Securities | Distributions | Market | ||
| Value | at Cost | Sold | Income | Received | Value | |
| ($000) | ($000) | ($000) | ($000) | ($000) | ($000) | |
| Vanguard Market Liquidity Fund | 24,057 | NA1 | NA1 | 29 | — | 3,399 |
| Vanguard Short-Term | ||||||
| Inflation-Protected Securities | ||||||
| Index Fund | 587,988 | 256,759 | — | 3,560 | — | 845,153 |
| Vanguard Total Bond Market II | ||||||
| Index Fund | 7,860,605 | 1,065,911 | 222,803 | 93,323 | 8,288 | 8,421,707 |
| Vanguard Total International | ||||||
| Bond Index Fund | 3,310,495 | 338,635 | — | 40,180 | — | 3,542,443 |
| Vanguard Total International | ||||||
| Stock Index Fund | 6,312,587 | 289,372 | 249,519 | 72,887 | — | 6,691,738 |
| Vanguard Total Stock Market | ||||||
| Index Fund | 9,496,059 | 258,586 | 714,611 | 97,955 | — | 9,869,236 |
| Total | 27,591,791 | 2,209,263 | 1,186,933 | 307,934 | 8,288 | 29,373,676 |
| 1 Not applicable—purchases and sales are for temporary cash investment purposes. | ||||||
G. Management has determined that no material events or transactions occurred subsequent to March 31, 2017, that would require recognition or disclosure in these financial statements.
46
Target Retirement 2025 Fund
Fund Profile
As of March 31, 2017
| Total Fund Characteristics | |
| Ticker Symbol | VTTVX |
| 30-Day SEC Yield | 2.09% |
| Acquired Fund Fees and Expenses1 | 0.14% |
| Allocation to Underlying Vanguard Funds | |
| Vanguard Total Stock Market Index Fund | |
| Investor Shares | 38.6% |
| Vanguard Total International Stock Index | |
| Fund Investor Shares | 26.0 |
| Vanguard Total Bond Market II Index Fund | |
| Investor Shares | 24.9 |
| Vanguard Total International Bond Index | |
| Fund Investor Shares | 10.5 |
| Total Fund Volatility Measures | ||
| MSCI US | ||
| Target 2025 | Broad | |
| Composite | Market | |
| Index | Index | |
| R-Squared | 1.00 | 0.91 |
| Beta | 0.98 | 0.63 |
| These measures show the degree and timing of the fund’s | ||
| fluctuations compared with the indexes over 36 months. | ||
Fund Asset Allocation

1 This figure—drawn from the prospectus dated January 27, 2017—represents an estimate of the weighted average of the expense ratios and any
transaction fees charged by the underlying mutual funds (the ”acquired” funds) in which the Target Retirement 2025 Fund invests. The fund does not
charge any expenses or fees of its own. For the six months ended March 31, 2017, the annualized acquired fund fees and expenses were 0.14%.

Target Retirement 2025 Fund
Performance Summary
All of the returns in this report represent past performance, which is not a guarantee of future results that may be achieved by the fund. (Current performance may be lower or higher than the performance data cited. For performance data current to the most recent month-end, visit our website at vanguard.com/performance.) Note, too, that both investment returns and principal value can fluctuate widely, so an investor’s shares, when sold, could be worth more or less than their original cost. The returns shown do not reflect taxes that a shareholder would pay on fund distributions or on the sale of fund shares.
Fiscal-Year Total Returns (%): September 30, 2006, Through March 31, 2017

For a benchmark description, see the Glossary.
Note: For 2017, performance data reflect the six months ended March 31, 2017.
| Average Annual Total Returns: Periods Ended March 31, 2017 | |||||
| Ten Years | |||||
| Inception Date One Year | Five Years | Income | Capital | Total | |
| Target Retirement 2025 | |||||
| Fund | 10/27/2003 10.71% | 7.94% | 2.31% | 2.97% | 5.28% |
See Financial Highlights for dividend and capital gains information.
48
Target Retirement 2025 Fund
Financial Statements (unaudited)
Statement of Net Assets
As of March 31, 2017
The fund reports a complete list of its holdings in regulatory filings four times in each fiscal year, at the quarter-ends. For the second and fourth fiscal quarters, the lists appear in the fund’s semiannual and annual reports to shareholders. For the first and third fiscal quarters, the fund files the lists with the Securities and Exchange Commission on Form N-Q. Shareholders can look up the fund’s Forms N-Q on the SEC’s website at sec.gov. Forms N-Q may also be reviewed and copied at the SEC’s Public Reference Room (see the back cover of this report for further information).
| Market | ||
| Value• | ||
| Shares | ($000) | |
| Investment Companies (100.0%) | ||
| U.S. Stock Fund (38.6%) | ||
| Vanguard Total Stock Market Index Fund Investor Shares | 223,156,225 | 13,175,143 |
| International Stock Fund (26.0%) | ||
| Vanguard Total International Stock Index Fund Investor Shares | 558,610,299 | 8,893,076 |
| U.S. Bond Fund (24.9%) | ||
| 1 Vanguard Total Bond Market II Index Fund Investor Shares | 800,584,312 | 8,518,217 |
| International Bond Fund (10.5%) | ||
| Vanguard Total International Bond Index Fund Investor Shares | 330,556,304 | 3,573,314 |
| Total Investment Companies (Cost $26,318,483) | 34,159,750 | |
| Temporary Cash Investment (0.1%) | ||
| Money Market Fund (0.1%) | ||
| 1 Vanguard Market Liquidity Fund, 0.965% (Cost $16,929) | 169,257 | 16,929 |
| Total Investments (100.1%) (Cost $26,335,412) | 34,176,679 | |
| Other Assets and Liabilities (-0.1%) | ||
| Other Assets | 115,283 | |
| Liabilities | (133,003) | |
| (17,720) | ||
| Net Assets (100%) | ||
| Applicable to 1,997,559,394 outstanding $.001 par value shares of | ||
| beneficial interest (unlimited authorization) | 34,158,959 | |
| Net Asset Value Per Share | $17.10 | |
49
Target Retirement 2025 Fund
| Amount | |
| ($000) | |
| Statement of Assets and Liabilities | |
| Assets | |
| Investments in Securities, at Value—Affiliated Vanguard Funds | 34,176,679 |
| Receivables for Investment Securities Sold | 38,509 |
| Receivables for Accrued Income | 20,390 |
| Receivables for Capital Shares Issued | 56,384 |
| Total Assets | 34,291,962 |
| Liabilities | |
| Payables for Investment Securities Purchased | 44,890 |
| Payables for Capital Shares Redeemed | 88,113 |
| Total Liabilities | 133,003 |
| Net Assets | 34,158,959 |
| At March 31, 2017, net assets consisted of: | |
| Amount | |
| ($000) | |
| Paid-in Capital | 26,014,802 |
| Undistributed Net Investment Income | 137,895 |
| Accumulated Net Realized Gains | 164,995 |
| Unrealized Appreciation (Depreciation) | 7,841,267 |
| Net Assets | 34,158,959 |
• See Note A in Notes to Financial Statements.
1 Affiliated fund available only to Vanguard funds and certain trusts and accounts managed by Vanguard. Rate shown for Vanguard Market
Liquidity Fund is the 7-day yield.
See accompanying Notes, which are an integral part of the Financial Statements.
50
Target Retirement 2025 Fund
Statement of Operations
| Six Months Ended | |
| March 31, 2017 | |
| ($000) | |
| Investment Income | |
| Income | |
| Income Distributions Received from Affiliated Funds | 360,124 |
| Net Investment Income—Note B | 360,124 |
| Realized Net Gain (Loss) | |
| Capital Gain Distributions Received from Affiliated Funds | 8,304 |
| Affiliated Investment Securities Sold | 171,745 |
| Realized Net Gain (Loss) | 180,049 |
| Change in Unrealized Appreciation (Depreciation) of Investment Securities | 995,342 |
| Net Increase (Decrease) in Net Assets Resulting from Operations | 1,535,515 |
See accompanying Notes, which are an integral part of the Financial Statements.
51
Target Retirement 2025 Fund
Statement of Changes in Net Assets
| Six Months Ended | Year Ended | |
| March 31, | September 30, | |
| 2017 | 2016 | |
| ($000) | ($000) | |
| Increase (Decrease) in Net Assets | ||
| Operations | ||
| Net Investment Income | 360,124 | 662,090 |
| Realized Net Gain (Loss) | 180,049 | 408,716 |
| Change in Unrealized Appreciation (Depreciation) | 995,342 | 2,032,698 |
| Net Increase (Decrease) in Net Assets Resulting from Operations | 1,535,515 | 3,103,504 |
| Distributions | ||
| Net Investment Income | (632,367) | (624,626) |
| Realized Capital Gain1 | (214,270) | (796,306) |
| Total Distributions | (846,637) | (1,420,932) |
| Capital Share Transactions | ||
| Issued | 4,845,731 | 6,760,157 |
| Issued in Lieu of Cash Distributions | 834,522 | 1,393,339 |
| Redeemed | (3,916,606) | (8,177,173) |
| Net Increase (Decrease) from Capital Share Transactions | 1,763,647 | (23,677) |
| Total Increase (Decrease) | 2,452,525 | 1,658,895 |
| Net Assets | ||
| Beginning of Period | 31,706,434 | 30,047,539 |
| End of Period2 | 34,158,959 | 31,706,434 |
| 1 Includes fiscal 2017 and 2016 short-term gain distributions totaling $5,608,000 and $69,403,000. Short-term gain distributions are treated | ||
| as ordinary income dividends for tax purposes. | ||
| 2 Net Assets—End of Period includes undistributed (overdistributed) net investment income of $137,895,000 and $410,138,000. | ||
See accompanying Notes, which are an integral part of the Financial Statements.
52
Target Retirement 2025 Fund
Financial Highlights
| Six Months | |||||||
| Ended | |||||||
| For a Share Outstanding | March 31, | Year Ended September 30, | |||||
| Throughout Each Period | 2017 | 2016 | 2015 | 2014 | 2013 | 2012 | |
| Net Asset Value, Beginning of Period | $16.77 | $15.90 | $16.50 | $15.18 | $13.70 | $11.71 | |
| Investment Operations | |||||||
| Net Investment Income | .179 | .362 | .364 | .350 | .316 | .331 | |
| Capital Gain Distributions Received | .004 | .006 | .012 | .002 | .021 | .036 | |
| Net Realized and Unrealized Gain (Loss) | |||||||
| on Investments | .585 | 1.280 | (.624) | 1.272 | 1.451 | 1.927 | |
| Total from Investment Operations | .768 | 1.648 | (.248) | 1.624 | 1.788 | 2.294 | |
| Distributions | |||||||
| Dividends from Net Investment Income | (. 327) | (. 342) | (. 322) | (. 287) | (. 296) | (. 291) | |
| Distributions from Realized Capital Gains | (.111) | (. 436) | (. 030) | (. 017) | (. 012) | (. 013) | |
| Total Distributions | (. 438) | (.778) | (. 352) | (. 304) | (. 308) | (. 304) | |
| Net Asset Value, End of Period | $17.10 | $16.77 | $15.90 | $16.50 | $15.18 | $13.70 | |
| Total Return1 | 4.70% | 10.67% | -1.60% | 10.80% | 13.34% | 19.89% | |
| Ratios/Supplemental Data | |||||||
| Net Assets, End of Period (Millions) $34,159 | $31,706 | $30,048 | $31,428 | $25,642 | $20,022 | ||
| Ratio of Total Expenses to | |||||||
| Average Net Assets | — | — | — | — | — | — | |
| Acquired Fund Fees and Expenses | 0.14% | 0.14% | 0.15% | 0.17% | 0.17% | 0.17% | |
| Ratio of Net Investment Income to | |||||||
| Average Net Assets | 2.22% | 2.18% | 2.07% | 2.15% | 2.27% | 2.64% | |
| Portfolio Turnover Rate | 11% | 15% | 24% | 7% | 16% | 9% | |
| The expense ratio, acquired fund fees and expenses, net investment income ratio, and turnover rate for the current period have been | |||||||
| annualized. | |||||||
| 1 Total returns do not include account service fees that may have applied in the periods shown. Fund prospectuses provide information about | |||||||
| any applicable account service fees. | |||||||
See accompanying Notes, which are an integral part of the Financial Statements.
53
Target Retirement 2025 Fund
Notes to Financial Statements
Vanguard Target Retirement 2025 Fund is registered under the Investment Company Act of 1940 as an open-end investment company, or mutual fund. The fund follows a balanced investment strategy by investing in selected Vanguard funds to achieve its targeted allocation of assets to U.S. and international stocks, and U.S. and international bonds. Financial statements and other information about each underlying fund are available on vanguard.com.
A. The following significant accounting policies conform to generally accepted accounting principles for U.S. investment companies. The fund consistently follows such policies in preparing its financial statements.
1. Security Valuation: Investments are valued at the net asset value of each underlying Vanguard fund determined as of the close of the New York Stock Exchange (generally 4 p.m., Eastern time) on the valuation date.
2. Federal Income Taxes: The fund intends to continue to qualify as a regulated investment company and distribute all of its taxable income. Management has analyzed the fund’s tax positions taken for all open federal income tax years (September 30, 2013–2016), and for the period ended March 31, 2017, and has concluded that no provision for federal income tax is required in the fund’s financial statements.
3. Distributions: Distributions to shareholders are recorded on the ex-dividend date.
4. Credit Facility: The fund and certain other funds managed by The Vanguard Group (“Vanguard”) participate in a $3.1 billion committed credit facility provided by a syndicate of lenders pursuant to a credit agreement that may be renewed annually; each fund is individually liable for its borrowings, if any, under the credit facility. Borrowings may be utilized for temporary and emergency purposes, and are subject to the fund’s regulatory and contractual borrowing restrictions. The participating funds are charged administrative fees and an annual commitment fee of 0.10% of the undrawn amount of the facility; these fees are allocated to the funds based on a method approved by the fund’s board of trustees and borne by the funds in which the fund invests (see Note B). Any borrowings under this facility bear interest at a rate based upon the higher of the one-month London Interbank Offered Rate, federal funds effective rate, or overnight bank funding rate plus an agreed-upon spread.
The fund had no borrowings outstanding at March 31, 2017, or at any time during the period then ended.
5. Other: Income and capital gain distributions received are recorded on the ex-dividend date. Security transactions are accounted for on the date securities are bought or sold. Costs used to determine realized gains (losses) on the sale of investment securities are those of the specific securities sold.
B. In accordance with the terms of a Funds’ Service Agreement (the “FSA”) between Vanguard and the fund, Vanguard furnishes to the fund investment advisory, corporate management, administrative, marketing, and distribution services at Vanguard’s cost of operations (as defined by the FSA). These costs of operations are allocated to the fund based on methods and guidelines approved by the board of trustees. The FSA provides that expenses otherwise allocable to Vanguard funds-of-funds may be reduced or eliminated to the extent of savings realized by the underlying Vanguard funds by virtue of being part of a fund-of-funds. Accordingly, all expenses for services provided by Vanguard to the fund and all other expenses incurred by the fund during the period ended March 31, 2017, were borne by the underlying Vanguard funds in which the fund invests. The fund’s trustees and officers are also trustees and officers, respectively, of the underlying Vanguard funds, as well as directors and employees, respectively, of Vanguard.
54
Target Retirement 2025 Fund
C. Various inputs may be used to determine the value of the fund’s investments. These inputs are summarized in three broad levels for financial statement purposes. The inputs or methodologies used to value securities are not necessarily an indication of the risk associated with investing in those securities.
Level 1—Quoted prices in active markets for identical securities.
Level 2—Other significant observable inputs (including quoted prices for similar securities, interest rates, prepayment speeds, credit risk, etc.).
Level 3—Significant unobservable inputs (including the fund’s own assumptions used to determine the fair value of investments).
At March 31, 2017, 100% of the market value of the fund’s investments was determined based on Level 1 inputs.
D. Distributions are determined on a tax basis and may differ from net investment income and realized capital gains for financial reporting purposes. Differences may be permanent or temporary. Permanent differences are reclassified among capital accounts in the financial statements to reflect their tax character. Temporary differences arise when certain items of income, expense, gain, or loss are recognized in different periods for financial statement and tax purposes. These differences will reverse at some time in the future. Differences in classification may also result from the treatment of short-term gains as ordinary income for tax purposes. The fund’s tax-basis capital gains and losses are determined only at the end of each fiscal year.
At March 31, 2017, the cost of investment securities for tax purposes was $26,335,412,000. Net unrealized appreciation of investment securities for tax purposes was $7,841,267,000, consisting entirely of unrealized gains on securities that had risen in value since their purchase.
E. Capital shares issued and redeemed were:
| Six Months Ended | Year Ended | |
| March 31, 2017 | September 30, 2016 | |
| Shares | Shares | |
| (000) | (000) | |
| Issued | 290,020 | 422,218 |
| Issued in Lieu of Cash Distributions | 51,135 | 88,242 |
| Redeemed | (234,684) | (509,271) |
| Net Increase (Decrease) in Shares Outstanding | 106,471 | 1,189 |
55
Target Retirement 2025 Fund
F. Transactions during the period in affiliated underlying Vanguard funds were as follows:
| Current Period Transactions | ||||||
| Sept. 30, | Proceeds | March 31, | ||||
| 2016 | from | Capital Gain | 2017 | |||
| Market | Purchases | Securities | Distributions | Market | ||
| Value | at Cost | Sold | Income | Received | Value | |
| ($000) | ($000) | ($000) | ($000) | ($000) | ($000) | |
| Vanguard Market Liquidity Fund | 4,263 | NA1 | NA1 | 37 | — | 16,929 |
| Vanguard Total Bond Market II | ||||||
| Index Fund | 7,759,432 | 1,523,855 | 486,402 | 93,140 | 8,304 | 8,518,217 |
| Vanguard Total International | ||||||
| Bond Index Fund | 3,219,117 | 458,840 | — | 40,118 | — | 3,573,314 |
| Vanguard Total International | ||||||
| Stock Index Fund | 8,289,872 | 502,229 | 348,326 | 96,333 | — | 8,893,076 |
| Vanguard Total Stock Market | ||||||
| Index Fund | 12,461,906 | 530,421 | 918,281 | 130,496 | — | 13,175,143 |
| Total | 31,734,590 | 3,015,345 | 1,753,009 | 360,124 | 8,304 | 34,176,679 |
| 1 Not applicable—purchases and sales are for temporary cash investment purposes. | ||||||
G. Management has determined that no material events or transactions occurred subsequent to March 31, 2017, that would require recognition or disclosure in these financial statements.
56
Target Retirement 2030 Fund
Fund Profile
As of March 31, 2017
| Total Fund Characteristics | |
| Ticker Symbol | VTHRX |
| 30-Day SEC Yield | 2.10% |
| Acquired Fund Fees and Expenses1 | 0.15% |
| Allocation to Underlying Vanguard Funds | |
| Vanguard Total Stock Market Index Fund | |
| Investor Shares | 43.1% |
| Vanguard Total International Stock Index | |
| Fund Investor Shares | 28.9 |
| Vanguard Total Bond Market II Index Fund | |
| Investor Shares | 19.7 |
| Vanguard Total International Bond Index | |
| Fund Investor Shares | 8.3 |
| Total Fund Volatility Measures | ||
| MSCI US | ||
| Target 2030 | Broad | |
| Composite | Market | |
| Index | Index | |
| R-Squared | 1.00 | 0.92 |
| Beta | 0.98 | 0.70 |
| These measures show the degree and timing of the fund’s | ||
| fluctuations compared with the indexes over 36 months. | ||
Fund Asset Allocation
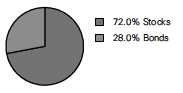
1 This figure—drawn from the prospectus dated January 27, 2017—represents an estimate of the weighted average of the expense ratios and any
transaction fees charged by the underlying mutual funds (the ”acquired” funds) in which the Target Retirement 2030 Fund invests. The fund does not
charge any expenses or fees of its own. For the six months ended March 31, 2017, the annualized acquired fund fees and expenses were 0.15%.

Target Retirement 2030 Fund
Performance Summary
All of the returns in this report represent past performance, which is not a guarantee of future results that may be achieved by the fund. (Current performance may be lower or higher than the performance data cited. For performance data current to the most recent month-end, visit our website at vanguard.com/performance.) Note, too, that both investment returns and principal value can fluctuate widely, so an investor’s shares, when sold, could be worth more or less than their original cost. The returns shown do not reflect taxes that a shareholder would pay on fund distributions or on the sale of fund shares.
Fiscal-Year Total Returns (%): September 30, 2006, Through March 31, 2017
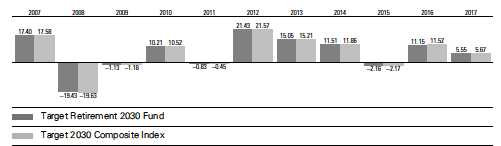
For a benchmark description, see the Glossary.
Note: For 2017, performance data reflect the six months ended March 31, 2017.
| Average Annual Total Returns: Periods Ended March 31, 2017 | |||||
| Ten Years | |||||
| Inception Date One Year | Five Years | Income | Capital | Total | |
| Target Retirement 2030 | |||||
| Fund | 6/7/2006 11.90% | 8.50% | 2.11% | 3.20% | 5.31% |
See Financial Highlights for dividend and capital gains information.
58
Target Retirement 2030 Fund
Financial Statements (unaudited)
Statement of Net Assets
As of March 31, 2017
The fund reports a complete list of its holdings in regulatory filings four times in each fiscal year, at the quarter-ends. For the second and fourth fiscal quarters, the lists appear in the fund’s semiannual and annual reports to shareholders. For the first and third fiscal quarters, the fund files the lists with the Securities and Exchange Commission on Form N-Q. Shareholders can look up the fund’s Forms N-Q on the SEC’s website at sec.gov. Forms N-Q may also be reviewed and copied at the SEC’s Public Reference Room (see the back cover of this report for further information).
| Market | ||
| Value• | ||
| Shares | ($000) | |
| Investment Companies (100.0%) | ||
| U.S. Stock Fund (43.1%) | ||
| Vanguard Total Stock Market Index Fund Investor Shares | 203,962,116 | 12,041,923 |
| International Stock Fund (28.9%) | ||
| Vanguard Total International Stock Index Fund Investor Shares | 507,296,086 | 8,076,154 |
| U.S. Bond Fund (19.7%) | ||
| 1 Vanguard Total Bond Market II Index Fund Investor Shares | 517,248,449 | 5,503,524 |
| International Bond Fund (8.3%) | ||
| Vanguard Total International Bond Index Fund Investor Shares | 214,827,409 | 2,322,284 |
| Total Investment Companies (Cost $21,576,748) | 27,943,885 | |
| Temporary Cash Investment (0.0%) | ||
| Money Market Fund (0.0%) | ||
| 1 Vanguard Market Liquidity Fund, 0.965% (Cost $9,441) | 94,388 | 9,441 |
| Total Investments (100.0%) (Cost $21,586,189) | 27,953,326 | |
| Other Assets and Liabilities (0.0%) | ||
| Other Assets | 156,675 | |
| Liabilities | (150,625) | |
| 6,050 | ||
| Net Assets (100%) | ||
| Applicable to 911,109,109 outstanding $.001 par value shares of | ||
| beneficial interest (unlimited authorization) | 27,959,376 | |
| Net Asset Value Per Share | $30.69 | |
59
Target Retirement 2030 Fund
| Amount | |
| ($000) | |
| Statement of Assets and Liabilities | |
| Assets | |
| Investments in Securities, at Value—Affiliated Vanguard Funds | 27,953,326 |
| Receivables for Investment Securities Sold | 56,020 |
| Receivables for Accrued Income | 13,100 |
| Receivables for Capital Shares Issued | 87,555 |
| Total Assets | 28,110,001 |
| Liabilities | |
| Payables for Investment Securities Purchased | 59,600 |
| Payables for Capital Shares Redeemed | 91,025 |
| Total Liabilities | 150,625 |
| Net Assets | 27,959,376 |
| At March 31, 2017, net assets consisted of: | |
| Amount | |
| ($000) | |
| Paid-in Capital | 21,478,389 |
| Undistributed Net Investment Income | 109,929 |
| Accumulated Net Realized Gains | 3,921 |
| Unrealized Appreciation (Depreciation) | 6,367,137 |
| Net Assets | 27,959,376 |
• See Note A in Notes to Financial Statements.
1 Affiliated fund available only to Vanguard funds and certain trusts and accounts managed by Vanguard. Rate shown for Vanguard Market
Liquidity Fund is the 7-day yield.
See accompanying Notes, which are an integral part of the Financial Statements.
60
Target Retirement 2030 Fund
Statement of Operations
| Six Months Ended | |
| March 31, 2017 | |
| ($000) | |
| Investment Income | |
| Income | |
| Income Distributions Received from Affiliated Funds | 286,832 |
| Net Investment Income—Note B | 286,832 |
| Realized Net Gain (Loss) | |
| Capital Gain Distributions Received from Affiliated Funds | 5,163 |
| Affiliated Investment Securities Sold | 12,907 |
| Realized Net Gain (Loss) | 18,070 |
| Change in Unrealized Appreciation (Depreciation) of Investment Securities | 1,140,437 |
| Net Increase (Decrease) in Net Assets Resulting from Operations | 1,445,339 |
See accompanying Notes, which are an integral part of the Financial Statements.
61
Target Retirement 2030 Fund
Statement of Changes in Net Assets
| Six Months Ended | Year Ended | |
| March 31, | September 30, | |
| 2017 | 2016 | |
| ($000) | ($000) | |
| Increase (Decrease) in Net Assets | ||
| Operations | ||
| Net Investment Income | 286,832 | 512,248 |
| Realized Net Gain (Loss) | 18,070 | 237,704 |
| Change in Unrealized Appreciation (Depreciation) | 1,140,437 | 1,747,746 |
| Net Increase (Decrease) in Net Assets Resulting from Operations | 1,445,339 | 2,497,698 |
| Distributions | ||
| Net Investment Income | (497,507) | (471,700) |
| Realized Capital Gain1 | (103,475) | (343,700) |
| Total Distributions | (600,982) | (815,400) |
| Capital Share Transactions | ||
| Issued | 4,497,416 | 6,307,641 |
| Issued in Lieu of Cash Distributions | 591,343 | 798,019 |
| Redeemed | (2,939,424) | (6,506,588) |
| Net Increase (Decrease) from Capital Share Transactions | 2,149,335 | 599,072 |
| Total Increase (Decrease) | 2,993,692 | 2,281,370 |
| Net Assets | ||
| Beginning of Period | 24,965,684 | 22,684,314 |
| End of Period2 | 27,959,376 | 24,965,684 |
| 1 Includes fiscal 2017 and 2016 short-term gain distributions totaling $33,425,000 and $40,296,000, respectively. Short-term gain distributions | ||
| are treated as ordinary income dividends for tax purposes. | ||
| 2 Net Assets—End of Period includes undistributed (overdistributed) net investment income of $109,929,000 and $320,604,000. | ||
See accompanying Notes, which are an integral part of the Financial Statements.
62
Target Retirement 2030 Fund
Financial Highlights
| Six Months | |||||||
| Ended | |||||||
| For a Share Outstanding | March 31, | Year Ended September 30, | |||||
| Throughout Each Period | 2017 | 2016 | 2015 | 2014 | 2013 | 2012 | |
| Net Asset Value, Beginning of Period | $29.77 | $27.77 | $28.95 | $26.46 | $23.51 | $19.81 | |
| Investment Operations | |||||||
| Net Investment Income | . 315 | .634 | .633 | .613 | . 540 | . 561 | |
| Capital Gain Distributions Received | .006 | .008 | .016 | .002 | .027 | .044 | |
| Net Realized and Unrealized Gain (Loss) | |||||||
| on Investments | 1.295 | 2.390 | (1.242) | 2.402 | 2.897 | 3.580 | |
| Total from Investment Operations | 1.616 | 3.032 | (.593) | 3.017 | 3.464 | 4.185 | |
| Distributions | |||||||
| Dividends from Net Investment Income | (. 576) | (. 597) | (. 558) | (. 491) | (. 499) | (. 468) | |
| Distributions from Realized Capital Gains | (.120) | (. 435) | (. 029) | (. 036) | (. 015) | (. 017) | |
| Total Distributions | (. 696) | (1.032) | (. 587) | (. 527) | (. 514) | (. 485) | |
| Net Asset Value, End of Period | $30.69 | $29.77 | $27.77 | $28.95 | $26.46 | $23.51 | |
| Total Return1 | 5.55% | 11.15% | -2.16% | 11.51% | 15.05% | 21.43% | |
| Ratios/Supplemental Data | |||||||
| Net Assets, End of Period (Millions) $27,959 | $24,966 | $22,684 | $23,085 | $17,795 | $12,647 | ||
| Ratio of Total Expenses to | |||||||
| Average Net Assets | — | — | — | — | — | — | |
| Acquired Fund Fees and Expenses | 0.15% | 0.15% | 0.15% | 0.17% | 0.17% | 0.17% | |
| Ratio of Net Investment Income to | |||||||
| Average Net Assets | 2.21% | 2.20% | 2.08% | 2.16% | 2.30% | 2.66% | |
| Portfolio Turnover Rate | 9% | 16% | 24% | 7% | 14% | 4% | |
| The expense ratio, acquired fund fees and expenses, net investment income ratio, and turnover rate for the current period have been | |||||||
| annualized. | |||||||
| 1 Total returns do not include account service fees that may have applied in the periods shown. Fund prospectuses provide information about | |||||||
| any applicable account service fees. | |||||||
See accompanying Notes, which are an integral part of the Financial Statements.
63
Target Retirement 2030 Fund
Notes to Financial Statements
Vanguard Target Retirement 2030 Fund is registered under the Investment Company Act of 1940 as an open-end investment company, or mutual fund. The fund follows a balanced investment strategy by investing in selected Vanguard funds to achieve its targeted allocation of assets to U.S. and international stocks, and U.S. and international bonds. Financial statements and other information about each underlying fund are available on vanguard.com.
A. The following significant accounting policies conform to generally accepted accounting principles for U.S. investment companies. The fund consistently follows such policies in preparing its financial statements.
1. Security Valuation: Investments are valued at the net asset value of each underlying Vanguard fund determined as of the close of the New York Stock Exchange (generally 4 p.m., Eastern time) on the valuation date.
2. Federal Income Taxes: The fund intends to continue to qualify as a regulated investment company and distribute all of its taxable income. Management has analyzed the fund’s tax positions taken for all open federal income tax years (September 30, 2013–2016), and for the period ended March 31, 2017, and has concluded that no provision for federal income tax is required in the fund’s financial statements.
3. Distributions: Distributions to shareholders are recorded on the ex-dividend date.
4. Credit Facility: The fund and certain other funds managed by The Vanguard Group (“Vanguard”) participate in a $3.1 billion committed credit facility provided by a syndicate of lenders pursuant to a credit agreement that may be renewed annually; each fund is individually liable for its borrowings, if any, under the credit facility. Borrowings may be utilized for temporary and emergency purposes, and are subject to the fund’s regulatory and contractual borrowing restrictions. The participating funds are charged administrative fees and an annual commitment fee of 0.10% of the undrawn amount of the facility; these fees are allocated to the funds based on a method approved by the fund’s board of trustees and borne by the funds in which the fund invests (see Note B). Any borrowings under this facility bear interest at a rate based upon the higher of the one-month London Interbank Offered Rate, federal funds effective rate, or overnight bank funding rate plus an agreed-upon spread.
The fund had no borrowings outstanding at March 31, 2017, or at any time during the period then ended.
5. Other: Income and capital gain distributions received are recorded on the ex-dividend date. Security transactions are accounted for on the date securities are bought or sold. Costs used to determine realized gains (losses) on the sale of investment securities are those of the specific securities sold.
B. In accordance with the terms of a Funds’ Service Agreement (the “FSA”) between Vanguard and the fund, Vanguard furnishes to the fund investment advisory, corporate management, administrative, marketing, and distribution services at Vanguard’s cost of operations (as defined by the FSA). These costs of operations are allocated to the fund based on methods and guidelines approved by the board of trustees. The FSA provides that expenses otherwise allocable to Vanguard funds-of-funds may be reduced or eliminated to the extent of savings realized by the underlying Vanguard funds by virtue of being part of a fund-of-funds. Accordingly, all expenses for services provided by Vanguard to the fund and all other expenses incurred by the fund during the period ended March 31, 2017, were borne by the underlying Vanguard funds in which the fund invests. The fund’s trustees and officers are also trustees and officers, respectively, of the underlying Vanguard funds, as well as directors and employees, respectively, of Vanguard.
64
Target Retirement 2030 Fund
C. Various inputs may be used to determine the value of the fund’s investments. These inputs are summarized in three broad levels for financial statement purposes. The inputs or methodologies used to value securities are not necessarily an indication of the risk associated with investing in those securities.
Level 1—Quoted prices in active markets for identical securities.
Level 2—Other significant observable inputs (including quoted prices for similar securities, interest rates, prepayment speeds, credit risk, etc.).
Level 3—Significant unobservable inputs (including the fund’s own assumptions used to determine the fair value of investments).
At March 31, 2017, 100% of the market value of the fund’s investments was determined based on Level 1 inputs.
D. Distributions are determined on a tax basis and may differ from net investment income and realized capital gains for financial reporting purposes. Differences may be permanent or temporary. Permanent differences are reclassified among capital accounts in the financial statements to reflect their tax character. Temporary differences arise when certain items of income, expense, gain, or loss are recognized in different periods for financial statement and tax purposes. These differences will reverse at some time in the future. Differences in classification may also result from the treatment of short-term gains as ordinary income for tax purposes. The fund’s tax-basis capital gains and losses are determined only at the end of each fiscal year.
At March 31, 2017, the cost of investment securities for tax purposes was $21,586,189,000. Net unrealized appreciation of investment securities for tax purposes was $6,367,137,000, consisting entirely of unrealized gains on securities that had risen in value since their purchase.
E. Capital shares issued and redeemed were:
| Six Months Ended | Year Ended | |
| March 31, 2017 | September 30, 2016 | |
| Shares | Shares | |
| (000) | (000) | |
| Issued | 150,622 | 222,843 |
| Issued in Lieu of Cash Distributions | 20,272 | 28,460 |
| Redeemed | (98,540) | (229,481) |
| Net Increase (Decrease) in Shares Outstanding | 72,354 | 21,822 |
65
Target Retirement 2030 Fund
F. Transactions during the period in affiliated underlying Vanguard funds were as follows:
| Current Period Transactions | ||||||
| Sept. 30, | Proceeds | March 31, | ||||
| 2016 | from | Capital Gain | 2017 | |||
| Market | Purchases | Securities | Distributions | Market | ||
| Value | at Cost | Sold | Income | Received | Value | |
| ($000) | ($000) | ($000) | ($000) | ($000) | ($000) | |
| Vanguard Market Liquidity Fund | 18,778 | NA1 | NA1 | 39 | — | 9,441 |
| Vanguard Total Bond Market II | ||||||
| Index Fund | 4,792,722 | 1,274,181 | 391,297 | 58,638 | 5,163 | 5,503,524 |
| Vanguard Total International | ||||||
| Bond Index Fund | 1,968,265 | 418,571 | — | 25,182 | — | 2,322,284 |
| Vanguard Total International | ||||||
| Stock Index Fund | 7,270,181 | 571,783 | 173,700 | 85,820 | — | 8,076,154 |
| Vanguard Total Stock Market | ||||||
| Index Fund | 10,955,214 | 672,433 | 567,812 | 117,153 | — | 12,041,923 |
| Total | 25,005,160 | 2,936,968 | 1,132,809 | 286,832 | 5,163 | 27,953,326 |
| 1 Not applicable—purchases and sales are for temporary cash investment purposes. | ||||||
G. Management has determined that no material events or transactions occurred subsequent to
March 31, 2017, that would require recognition or disclosure in these financial statements.
66
About Your Fund’s Expenses
As a shareholder of the fund, you incur ongoing costs, which include costs for portfolio management, administrative services, and shareholder reports (like this one), among others. Operating expenses, which are deducted from a fund’s gross income, directly reduce the investment return of the fund.
A typical fund’s expenses are expressed as a percentage of its average net assets. The Target Retirement Funds have no direct expenses, but each fund bears its proportionate share of the costs for the underlying funds in which it invests. These indirect expenses make up the acquired fund fees and expenses, also expressed as a percentage of average net assets.
The following examples are intended to help you understand the ongoing cost (in dollars) of investing in your fund and to compare these costs with those of other mutual funds. The examples are based on an investment of $1,000 made at the beginning of the period shown and held for the entire period. The costs were calculated using the acquired fund fees and expenses for each Target Retirement Fund.
The accompanying table illustrates your fund’s costs in two ways:
• Based on actual fund return. This section helps you to estimate the actual expenses that you paid over the period. The ”Ending Account Value“ shown is derived from the fund‘s actual return, and the third column shows the dollar amount that would have been paid by an investor who started with $1,000 in the fund. You may use the information here, together with the amount you invested, to estimate the expenses that you paid over the period.
To do so, simply divide your account value by $1,000 (for example, an $8,600 account value divided by $1,000 = 8.6), then multiply the result by the number given for your fund under the heading ”Expenses Paid During Period.“
• Based on hypothetical 5% yearly return. This section is intended to help you compare your fund‘s costs with those of other mutual funds. It assumes that the fund had a yearly return of 5% before expenses, but that the expense ratio is unchanged. In this case—because the return used is not the fund’s actual return—the results do not apply to your investment. The example is useful in making comparisons because the Securities and Exchange Commission requires all mutual funds to calculate expenses based on a 5% return. You can assess your fund’s costs by comparing this hypothetical example with the hypothetical examples that appear in shareholder reports of other funds.
Note that the expenses shown in the table are meant to highlight and help you compare ongoing costs only and do not reflect transaction costs incurred by the fund for buying and selling securities. Further, the expenses do not include any purchase, redemption, or account service fees described in the fund prospectus. If such fees were applied to your account, your costs would be higher. Your fund does not carry a “sales load.”
The calculations assume no shares were bought or sold during the period. Your actual costs may have been higher or lower, depending on the amount of your investment and the timing of any purchases or redemptions.
You can find more information about the fund’s expenses, including annual expense ratios, in the Financial Statements section of this report. For additional information on operating expenses and other shareholder costs, please refer to your fund’s current prospectus.
67
| Six Months Ended March 31, 2017 | |||
| Beginning | Ending | Expenses | |
| Account Value | Account Value | Paid During | |
| 9/30/2016 | 3/31/2017 | Period | |
| Based on Actual Fund Return | |||
| Target Retirement Income Fund | $1,000.00 | $1,014.38 | $0.65 |
| Target Retirement 2010 Fund | $1,000.00 | $1,014.79 | $0.65 |
| Target Retirement 2015 Fund | $1,000.00 | $1,028.08 | $0.71 |
| Target Retirement 2020 Fund | $1,000.00 | $1,039.14 | $0.71 |
| Target Retirement 2025 Fund | $1,000.00 | $1,047.03 | $0.71 |
| Target Retirement 2030 Fund | $1,000.00 | $1,055.49 | $0.77 |
| Based on Hypothetical 5% Yearly Return | |||
| Target Retirement Income Fund | $1,000.00 | $1,024.28 | $0.66 |
| Target Retirement 2010 Fund | $1,000.00 | $1,024.28 | $0.66 |
| Target Retirement 2015 Fund | $1,000.00 | $1,024.23 | $0.71 |
| Target Retirement 2020 Fund | $1,000.00 | $1,024.23 | $0.71 |
| Target Retirement 2025 Fund | $1,000.00 | $1,024.23 | $0.71 |
| Target Retirement 2030 Fund | $1,000.00 | $1,024.18 | $0.76 |
The calculations are based on the acquired fund fees and expenses for the most recent six-month period. The funds’ annualized expense
figures for that period are (in order as listed from top to bottom above) 0.13%, 0.13%, 0.14%, 0.14%, 0.14%, and 0.15%. The dollar amounts
shown as ”Expenses Paid” are equal to the annualized expense figures for the underlying funds multiplied by the average account value over
the period, multiplied by the number of days in the most recent six-month period, then divided by the number of days in the most recent
12-month period (182/365).
68
Trustees Approve Advisory Arrangements
The board of trustees of Vanguard Target Retirement Funds has renewed each fund’s investment advisory arrangement with The Vanguard Group, Inc. (Vanguard), through its Equity Index Group. The board determined that continuing each fund’s internalized management structure was in the best interests of the funds and their shareholders.
The board based its decision upon an evaluation of the advisor’s investment staff, portfolio management process, and performance. This evaluation included information provided to the board by Vanguard’s Portfolio Review Department, which is responsible for fund and advisor oversight and product management. The Portfolio Review Department met regularly with the advisor and made monthly presentations to the board during the fiscal year that directed the board’s focus to relevant information and topics.
The board, or an investment committee made up of board members, also received information throughout the year during advisor presentations. For each advisor presentation, the board was provided with letters and reports that included information about, among other things, the advisory firm and the advisor’s assessment of the investment environment, portfolio performance, and portfolio characteristics.
In addition, the board received monthly reports, which included a Market and Economic Report, a Fund Dashboard Monthly Summary, and a Fund Performance Report.
Prior to their meeting, the trustees were provided with a memo and materials that summarized the information they received over the course of the year. They also considered the factors discussed below, among others. However, no single factor determined whether the board approved the arrangements. Rather, it was the totality of the circumstances that drove the board’s decision.
Nature, extent, and quality of services
The board reviewed the quality of the funds’ investment management services over both the short and long term, and took into account the organizational depth and stability of the advisor. The board considered that Vanguard has been managing investments for more than three decades. The Equity Index Group adheres to a sound, disciplined investment management process; the team has considerable experience, stability, and depth.
The board concluded that Vanguard’s experience, stability, depth, and performance, among other factors, warranted continuation of the advisory arrangements.
Investment performance
The board considered the performance of each fund, including any periods of outperformance or underperformance compared with a relevant benchmark index and peer group. The board concluded that the performance was such that the advisory arrangements should continue. Information about each fund’s most recent performance can be found in the Performance Summary pages of this report.
Cost
The board concluded that the funds’ acquired fund fees and expenses were well below the average expense ratios charged by funds in their respective peer groups. The funds do not incur advisory expenses directly; however, the board noted that each of the underlying funds in which the funds invest has advisory expenses well below the relevant peer-group average. Information about the funds’ acquired fund fees and expenses appears in the About Your Fund’s Expenses section of this report as well as in the Financial Statements sections.
69
The board does not conduct a profitability analysis of Vanguard because of Vanguard’s unique “at-cost” structure. Unlike most other mutual fund management companies, Vanguard is owned by the funds it oversees and produces “profits” only in the form of reduced expenses for fund shareholders.
The benefit of economies of scale
The board concluded that Vanguard’s at-cost arrangements with the Target Retirement Funds and their underlying funds ensure that the funds will realize economies of scale as the assets of the underlying funds grow, with the cost to shareholders declining as assets increase.
The board will consider whether to renew the advisory arrangements again after a one-year period.
70
Glossary
30-Day SEC Yield. A fund’s 30-day SEC yield is derived using a formula specified by the U.S. Securities and Exchange Commission. Under the formula, data related to the fund’s security holdings in the previous 30 days are used to calculate the fund’s hypothetical net income for that period, which is then annualized and divided by the fund’s estimated average net assets over the calculation period. For the purposes of this calculation, a security’s income is based on its current market yield to maturity (for bonds), its actual income (for asset-backed securities), or its projected dividend yield (for stocks). Because the SEC yield represents hypothetical annualized income, it will differ—at times significantly—from the fund’s actual experience. As a result, the fund’s income distributions may be higher or lower than implied by the SEC yield.
Acquired Fund Fees and Expenses. Funds that invest in other Vanguard funds incur no direct expenses, but they do bear proportionate shares of the operating, administrative, and advisory expenses of the underlying funds, and they must pay any fees charged by those funds. The figure for acquired fund fees and expenses represents a weighted average of these underlying costs. Acquired is a term that the Securities and Exchange Commission applies to any mutual fund whose shares are owned by another fund.
Beta. A measure of the magnitude of a fund’s past share-price fluctuations in relation to the ups and downs of a given market index. The index is assigned a beta of 1.00. Compared with a given index, a fund with a beta of 1.20 typically would have seen its share price rise or fall by 12% when the index rose or fell by 10%. For this report, beta is based on returns over the past 36 months for both the fund and the index. Note that a fund’s beta should be reviewed in conjunction with its R-squared (see definition). The lower the R-squared, the less correlation there is between the fund and the index, and the less reliable beta is as an indicator of volatility.
Expense Ratio. A fund’s total annual operating expenses expressed as a percentage of the fund’s average net assets. The expense ratio includes management and administrative expenses, but does not include the transaction costs of buying and selling portfolio securities.
Inception Date. The date on which the assets of a fund (or one of its share classes) are first invested in accordance with the fund’s investment objective. For funds with a subscription period, the inception date is the day after that period ends. Investment performance is measured from the inception date.
R-Squared. A measure of how much of a fund’s past returns can be explained by the returns from the market in general, as measured by a given index. If a fund’s total returns were precisely synchronized with an index’s returns, its R-squared would be 1.00. If the fund’s returns bore no relationship to the index’s returns, its R-squared would be 0. For this report, R-squared is based on returns over the past 36 months for both the fund and the index.
71
Benchmark Information
Target 2010 Composite Index: Derived by applying the fund’s target asset allocation to the results of the following benchmarks: for international stocks of developed markets, the MSCI EAFE Index through December 15, 2010, the MSCI ACWI ex USA IMI Index through June 2, 2013, and the FTSE Global All Cap ex US Index thereafter; for emerging-market stocks, the Select Emerging Markets Index through August 23, 2006, the MSCI Emerging Markets Index through December 15, 2010, the MSCI ACWI ex USA IMI Index through June 2, 2013, and the FTSE Global All Cap ex US Index thereafter; for U.S. bonds, the Bloomberg Barclays U.S. Aggregate Bond Index through December 31, 2009, and the Bloomberg Barclays U.S. Aggregate Float Adjusted Index thereafter, as well as the Bloomberg Barclays U.S. Treasury Inflation Protected Securities Index through June 2, 2013, and the Bloomberg Barclays U.S. Treasury Inflation-Protected Securities (TIPS) 0-5 Year Index thereafter; for short-term reserves, the Citigroup Three-Month Treasury Bill Index through June 2, 2013; for international bonds, the Bloomberg Barclays Global Aggregate ex-USD Float Adjusted RIC Capped Index beginning June 3, 2013; and for U.S. stocks, the MSCI US Broad Market Index through June 2, 2013, and the CRSP US Total Market Index thereafter. International stock benchmark returns are adjusted for withholding taxes.
Target 2015 Composite Index: Derived by applying the fund’s target asset allocation to the results of the following benchmarks: for international stocks of developed markets, the MSCI EAFE Index through December 15, 2010, the MSCI ACWI ex USA IMI Index through June 2, 2013, and the FTSE Global All Cap ex US Index thereafter; for emerging-market stocks, the Select Emerging Markets Index through August 23, 2006, the MSCI Emerging Markets Index through December 15, 2010, the MSCI ACWI ex USA IMI Index through June 2, 2013, and the FTSE Global All Cap ex US Index thereafter; for U.S. bonds, the Bloomberg Barclays U.S. Aggregate Bond Index through December 31, 2009, and the Bloomberg Barclays U.S. Aggregate Float Adjusted Index thereafter, as well as the Bloomberg Barclays U.S. Treasury Inflation Protected Securities Index through June 2, 2013, and the Bloomberg Barclays U.S. Treasury Inflation-Protected Securities (TIPS) 0-5 Year Index thereafter; for international bonds, the Bloomberg Barclays Global Aggregate ex-USD Float Adjusted RIC Capped Index beginning June 3, 2013; and for U.S. stocks, the Dow Jones U.S. Total Stock Market Index (formerly known as the Dow Jones Wilshire 5000 Index) through April 22, 2005, the MSCI US Broad Market Index through June 2, 2013, and the CRSP US Total Market Index thereafter. International stock benchmark returns are adjusted for withholding taxes.
Target 2020 Composite Index: Derived by applying the fund’s target asset allocation to the results of the following benchmarks: for international stocks of developed markets, the MSCI EAFE Index through December 15, 2010, the MSCI ACWI ex USA IMI Index through June 2, 2013, and the FTSE Global All Cap ex US Index thereafter; for emerging-market stocks, the Select Emerging Markets Index through August 23, 2006, the MSCI Emerging Markets Index through December 15, 2010, the MSCI ACWI ex USA IMI Index through June 2, 2013, and the FTSE Global All Cap ex US Index thereafter; for U.S. bonds, the Bloomberg Barclays U.S. Aggregate Bond Index through December 31, 2009, and the Bloomberg Barclays U.S. Aggregate Float Adjusted Index thereafter; for international bonds, the Bloomberg Barclays Global Aggregate ex-USD Float Adjusted RIC Capped Index beginning June 3, 2013; and for U.S. stocks, the MSCI US Broad Market Index through June 2, 2013, and the CRSP US Total Market Index thereafter. International stock benchmark returns are adjusted for withholding taxes.
72
Target 2025 Composite Index: Derived by applying the fund’s target asset allocation to the results of the following benchmarks: for international stocks of developed markets, the MSCI EAFE Index through December 15, 2010, the MSCI ACWI ex USA IMI Index through June 2, 2013, and the FTSE Global All Cap ex US Index thereafter; for emerging-market stocks, the Select Emerging Markets Index through August 23, 2006, the MSCI Emerging Markets Index through December 15, 2010, the MSCI ACWI ex USA IMI Index through June 2, 2013, and the FTSE Global All Cap ex US Index thereafter; for U.S. bonds, the Bloomberg Barclays U.S. Aggregate Bond Index through December 31, 2009, and the Bloomberg Barclays U.S. Aggregate Float Adjusted Index thereafter; for international bonds, the Bloomberg Barclays Global Aggregate ex-USD Float Adjusted RIC Capped Index beginning June 3, 2013; and for U.S. stocks, the Dow Jones U.S. Total Stock Market Index (formerly known as the Dow Jones Wilshire 5000 Index) through April 22, 2005, the MSCI US Broad Market Index through June 2, 2013, and the CRSP US Total Market Index thereafter. International stock benchmark returns are adjusted for withholding taxes.
Target 2030 Composite Index: Derived by applying the fund’s target asset allocation to the results of the following benchmarks: for international stocks of developed markets, the MSCI EAFE Index through December 15, 2010, the MSCI ACWI ex USA IMI Index through June 2, 2013, and the FTSE Global All Cap ex US Index thereafter; for emerging-market stocks, the Select Emerging Markets Index through August 23, 2006, the MSCI Emerging Markets Index through December 15, 2010, the MSCI ACWI ex USA IMI Index through June 2, 2013, and the FTSE Global All Cap ex US Index thereafter; for U.S. bonds, the Bloomberg Barclays U.S. Aggregate Bond Index through December 31, 2009, and the Bloomberg Barclays U.S. Aggregate Float Adjusted Index thereafter; for international bonds, the Bloomberg Barclays Global Aggregate ex-USD Float Adjusted RIC Capped Index beginning June 3, 2013; and for U.S. stocks, the MSCI US Broad Market Index through June 2, 2013, and the CRSP US Total Market Index thereafter. International stock benchmark returns are adjusted for withholding taxes.
Target Income Composite Index: Derived by applying the fund’s target asset allocation to the results of the following benchmarks: for international stocks of developed markets, the MSCI EAFE Index through December 15, 2010, the MSCI ACWI ex USA IMI Index through June 2, 2013, and the FTSE Global All Cap ex US Index thereafter; for emerging-market stocks, the Select Emerging Markets Index through August 23, 2006, the MSCI Emerging Markets Index through December 15, 2010, the MSCI ACWI ex USA IMI Index through June 2, 2013, and the FTSE Global All Cap ex US Index thereafter; for U.S. bonds, the Bloomberg Barclays U.S. Aggregate Bond Index through December 31, 2009, and the Bloomberg Barclays U.S. Aggregate Float Adjusted Index thereafter, as well as the Bloomberg Barclays U.S. Treasury Inflation Protected Securities Index through June 2, 2013, and the Bloomberg Barclays U.S. Treasury Inflation-Protected Securities (TIPS) 0-5 Year Index thereafter; for short-term reserves, the Citigroup Three-Month Treasury Bill Index through June 2, 2013; for international bonds, the Bloomberg Barclays Global Aggregate ex-USD Float Adjusted RIC Capped Index beginning June 3, 2013; and for U.S. stocks, the Dow Jones U.S. Total Stock Market Index (formerly known as the Dow Jones Wilshire 5000 Index) through April 22, 2005, the MSCI US Broad Market Index through June 2, 2013, and the CRSP US Total Market Index thereafter. International stock benchmark returns are adjusted for withholding taxes.
73
This page intentionally left blank.
This page intentionally left blank.
The People Who Govern Your Fund
The trustees of your mutual fund are there to see that the fund is operated and managed in your best interests since, as a shareholder, you are a part owner of the fund. Your fund’s trustees also serve on the board of directors of The Vanguard Group, Inc., which is owned by the Vanguard funds and provides services to them on an at-cost basis.
A majority of Vanguard’s board members are independent, meaning that they have no affiliation with Vanguard or the funds they oversee, apart from the sizable personal investments they have made as private individuals. The independent board members have distinguished backgrounds in business, academia, and public service. Each of the trustees and executive officers oversees 195 Vanguard funds.
The following table provides information for each trustee and executive officer of the fund. The mailing address of the trustees and officers is P.O. Box 876, Valley Forge, PA 19482. More information about the trustees is in the Statement of Additional Information, which can be obtained, without charge, by contacting Vanguard at 800-662-7447, or online at vanguard.com.
InterestedTrustee1
F. William McNabb III
Born 1957. Trustee Since July 2009. Chairman of the Board. Principal Occupation(s) During the Past Five Years and Other Experience: Chairman of the Board of The Vanguard Group, Inc., and of each of the investment companies served by The Vanguard Group, since January 2010; Director of The Vanguard Group since 2008; Chief Executive Officer and President of The Vanguard Group, and of each of the investment companies served by The Vanguard Group, since 2008; Director of Vanguard Marketing Corporation; Managing Director of The Vanguard Group (1995–2008).
IndependentTrustees
Emerson U. Fullwood
Born 1948. Trustee Since January 2008. Principal Occupation(s) During the Past Five Years and Other Experience: Executive Chief Staff and Marketing Officer for North America and Corporate Vice President (retired 2008) of Xerox Corporation (document management products and services); Executive in Residence and 2009–2010 Distinguished Minett Professor at the Rochester Institute of Technology; Lead Director of SPX FLOW, Inc. (multi-industry manufacturing); Director of the United Way of Rochester, the University of Rochester Medical Center, Monroe Community College Foundation, North Carolina A&T University, and Roberts Wesleyan College.
Rajiv L. Gupta
Born 1945. Trustee Since December 2001.2 Principal Occupation(s) During the Past Five Years and Other Experience: Chairman and Chief Executive Officer (retired 2009) and President (2006–2008) of Rohm and Haas Co. (chemicals); Director of Arconic Inc. (diversified manufacturer), HP Inc. (printer and personal computer manufacturing), and Delphi Automotive plc (automotive components); Senior Advisor at New Mountain Capital.
Amy Gutmann
Born 1949. Trustee Since June 2006. Principal Occupation(s) During the Past Five Years and Other Experience: President of the University of Pennsylvania; Christopher H. Browne Distinguished Professor of Political Science, School of Arts and Sciences, and Professor of Communication, Annenberg School for Communication, with secondary faculty appointments in the Department of Philosophy, School of Arts and Sciences, and at the Graduate School of Education, University of Pennsylvania; Trustee of the National Constitution Center; Chair of the Presidential Commission for the Study of Bioethical Issues.
JoAnn Heffernan Heisen
Born 1950. Trustee Since July 1998. Principal Occupation(s) During the Past Five Years and Other Experience: Corporate Vice President and Chief Global Diversity Officer (retired 2008) and Member of the Executive Committee (1997–2008) of Johnson & Johnson (pharmaceuticals/medical devices/consumer products); Director of Skytop Lodge Corporation (hotels) and the Robert Wood Johnson Foundation; Member of the Advisory Board of the Institute for Women’s Leadership at Rutgers University.
F. Joseph Loughrey
Born 1949. Trustee Since October 2009. Principal Occupation(s) During the Past Five Years and Other Experience: President and Chief Operating Officer (retired 2009) of Cummins Inc. (industrial machinery); Chairman of the Board of Hillenbrand, Inc. (specialized consumer services), Oxfam America, and the Lumina
Foundation for Education; Director of SKF AB (industrial machinery), Hyster-Yale Materials Handling, Inc. (forklift trucks), and the V Foundation for Cancer Research; Member of the Advisory Council for the College of Arts and Letters and Chair of the Advisory Board to the Kellogg Institute for International Studies, both at the University of Notre Dame.
Mark Loughridge
Born 1953. Trustee Since March 2012. Principal Occupation(s) During the Past Five Years and Other Experience: Senior Vice President and Chief Financial Officer (retired 2013) at IBM (information technology services); Fiduciary Member of IBM’s Retirement Plan Committee (2004–2013); Director of the Dow Chemical Company; Member of the Council on Chicago Booth.
Scott C. Malpass
Born 1962. Trustee Since March 2012. Principal Occupation(s) During the Past Five Years and Other Experience: Chief Investment Officer and Vice President at the University of Notre Dame; Assistant Professor of Finance at the Mendoza College of Business at Notre Dame; Member of the Notre Dame 403(b) Investment Committee, the Board of Advisors for Spruceview Capital Partners, and the Investment Advisory Committee of Major League Baseball; Board Member of TIFF Advisory Services, Inc., and Catholic Investment Services, Inc. (investment advisors); Member of the Board of Superintendence of the Institute for the Works of Religion.
André F. Perold
Born 1952. Trustee Since December 2004. Principal Occupation(s) During the Past Five Years and Other Experience: George Gund Professor of Finance and Banking, Emeritus at the Harvard Business School (retired 2011); Chief Investment Officer and Co-Managing Partner of HighVista Strategies LLC (private investment firm); Overseer of the Museum of Fine Arts Boston.
Peter F. Volanakis
Born 1955. Trustee Since July 2009. Principal Occupation(s) During the Past Five Years and Other Experience: President and Chief Operating Officer (retired 2010) of Corning Incorporated (communications equipment); Chairman of the Board of Trustees of Colby-Sawyer College; Member of the Board of Hypertherm, Inc. (industrial cutting systems, software, and consumables).
Executive Officers
Glenn Booraem
Born 1967. Investment Stewardship Officer Since February 2017. Principal Occupation(s) During the Past Five Years and Other Experience: Principal of The Vanguard Group, Inc.; Treasurer (2015–2017), Controller (2010–2015), and Assistant Controller (2001–2010) of each of the investment companies served by The Vanguard Group.
Thomas J. Higgins
Born 1957. Chief Financial Officer Since September 2008. Principal Occupation(s) During the Past Five Years and Other Experience: Principal of The Vanguard Group, Inc.; Chief Financial Officer of each of the investment companies served by The Vanguard Group; Treasurer of each of the investment companies served by The Vanguard Group (1998–2008).
Peter Mahoney
Born 1974. Controller Since May 2015. Principal Occupation(s) During the Past Five Years and Other Experience: Principal of The Vanguard Group, Inc.; Controller of each of the investment companies served by The Vanguard Group; Head of International Fund Services at The Vanguard Group (2008–2014).
Anne E. Robinson
Born 1970. Secretary Since September 2016. Principal Occupation(s) During the Past Five Years and Other Experience: Managing Director of The Vanguard Group, Inc.; General Counsel of The Vanguard Group; Secretary of The Vanguard Group and of each of the investment companies served by The Vanguard Group; Director and Senior Vice President of Vanguard Marketing Corporation; Managing Director and General Counsel of Global Cards and Consumer Services at Citigroup (2014–2016); Counsel at American Express (2003–2014).
Michael Rollings
Born 1963. Treasurer Since February 2017. Principal Occupation(s) During the Past Five Years and Other Experience: Managing Director of The Vanguard Group, Inc.; Treasurer of each of the investment companies served by The Vanguard Group; Executive Vice President and Chief Financial Officer of MassMutual Financial Group (2006–2016).
| Vanguard Senior Management Team | |
| Mortimer J. Buckley | James M. Norris |
| John James | Thomas M. Rampulla |
| Martha G. King | Glenn W. Reed |
| John T. Marcante | Karin A. Risi |
| Chris D. McIsaac | |
| Chairman Emeritus and Senior Advisor | |
| John J. Brennan | |
| Chairman, 1996–2009 | |
| Chief Executive Officer and President, 1996–2008 | |
| Founder | |
| John C. Bogle | |
| Chairman and Chief Executive Officer, 1974–1996 | |
1 Mr. McNabb is considered an “interested person,” as defined in the Investment Company Act of 1940, because he is an officer of the Vanguard funds.
2 December 2002 for Vanguard Equity Income Fund, the Vanguard Municipal Bond Funds, and the Vanguard State Tax-Exempt Funds.
 | |
| P.O. Box 2600 | |
| Valley Forge, PA 19482-2600 | |
| Connect with Vanguard® > vanguard.com | |
| Fund Information > 800-662-7447 | |
| Direct Investor Account Services > 800-662-2739 | |
| Institutional Investor Services > 800-523-1036 | |
| Text Telephone for People | |
| Who Are Deaf or Hard of Hearing > 800-749-7273 | |
| This material may be used in conjunction | |
| with the offering of shares of any Vanguard | |
| fund only if preceded or accompanied by | |
| the fund’s current prospectus. | |
| All comparative mutual fund data are from Lipper, a | |
| Thomson Reuters Company, or Morningstar, Inc., unless | |
| otherwise noted. | |
| You can obtain a free copy of Vanguard’s proxy voting | |
| guidelines by visiting vanguard.com/proxyreporting or by | |
| calling Vanguard at 800-662-2739. The guidelines are | |
| also available from the SEC’s website, sec.gov. In | |
| addition, you may obtain a free report on how your fund | |
| voted the proxies for securities it owned during the 12 | |
| months ended June 30. To get the report, visit either | |
| vanguard.com/proxyreporting or sec.gov. | |
| You can review and copy information about your fund at | |
| the SEC’s Public Reference Room in Washington, D.C. To | |
| find out more about this public service, call the SEC at | |
| 202-551-8090. Information about your fund is also | |
| available on the SEC’s website, and you can receive | |
| copies of this information, for a fee, by sending a | |
| request in either of two ways: via email addressed to | |
| publicinfo@sec.gov or via regular mail addressed to the | |
| Public Reference Section, Securities and Exchange | |
| Commission, Washington, DC 20549-1520. | |
| © 2017 The Vanguard Group, Inc. | |
| All rights reserved. | |
| Vanguard Marketing Corporation, Distributor. | |
| Q3082 052017 | |
Semiannual Report | March 31, 2017
Vanguard Target Retirement Funds
Vanguard Target Retirement 2035 Fund
Vanguard Target Retirement 2040 Fund
Vanguard Target Retirement 2045 Fund
Vanguard Target Retirement 2050 Fund
Vanguard Target Retirement 2055 Fund
Vanguard Target Retirement 2060 Fund
A new format, unwavering commitment
As you begin reading this report, you’ll notice that we’ve made some improvements to the opening sections—based on feedback from you, our clients.
Page 1 starts with a new ”Your Fund’s Performance at a Glance,” a concise, handy summary of how your fund performed during the period.
In the renamed ”Chairman’s Perspective,” Bill McNabb will focus on enduring principles and investment insights.
We’ve modified some tables, and eliminated some redundancy, but we haven’t removed any information.
At Vanguard, we’re always looking for better ways to communicate and to help you make sound investment decisions. Thank you for entrusting your assets to us.
| Contents | |
| Your Fund’s Performance at a Glance. | 1 |
| Chairman’s Perspective. | 3 |
| Target Retirement 2035 Fund. | 7 |
| Target Retirement 2040 Fund. | 17 |
| Target Retirement 2045 Fund. | 27 |
| Target Retirement 2050 Fund. | 37 |
| Target Retirement 2055 Fund. | 47 |
| Target Retirement 2060 Fund. | 57 |
| About Your Fund’s Expenses. | 67 |
| Trustees Approve Advisory Arrangements. | 69 |
| Glossary. | 71 |
Please note: The opinions expressed in this report are just that—informed opinions. They should not be considered promises or advice.
Also, please keep in mind that the information and opinions cover the period through the date on the front of this report. Of course, the
risks of investing in your fund are spelled out in the prospectus.
See the Glossary for definitions of investment terms used in this report.
About the cover: No matter what language you speak, Vanguard has one consistent message and set of principles. Our primary
focus is on you, our clients. We conduct our business with integrity as a faithful steward of your assets. This message is shown
translated into seven languages, reflecting our expanding global presence.
Your Fund’s Performance at a Glance
• For the six months ended March 31, 2017, U.S. stock markets returned about 10% and international stock markets returned nearly 7%.
• U.S. bonds returned about –2%, while international bonds returned about –2% for U.S.-based investors.
• In this investing environment, the six Vanguard Target Retirement Funds covered in this report recorded returns ranging from 6.35% for the Target Retirement 2035 Fund to 7.51% for both the Target Retirement 2045 Fund and the Target Retirement 2050 Fund. (Funds with retirement dates of 2010 through 2030, as well as the Target Retirement Income Fund, are covered in a separate report.)
• Each fund posted returns that were both in line with those of its composite benchmark after expenses and higher than the average return of its peer group.
• Vanguard Target Retirement Funds are designed to reach an allocation of 70% bonds and 30% stocks within seven years after their target date.
| Total Returns: Six Months Ended March 31, 2017 | |
| Total | |
| Returns | |
| Vanguard Target Retirement 2035 Fund | 6.35% |
| Target 2035 Composite Index | 6.50 |
| Mixed-Asset Target 2035 Funds Average | 6.14 |
| For a benchmark description, see the Glossary. | |
| Mixed-Asset Target 2035 Funds Average: Derived from data provided by Lipper, a Thomson Reuters Company. | |
| Vanguard Target Retirement 2040 Fund | 7.22% |
| Target 2040 Composite Index | 7.34 |
| Mixed-Asset Target 2040 Funds Average | 6.47 |
| For a benchmark description, see the Glossary. | |
| Mixed-Asset Target 2040 Funds Average: Derived from data provided by Lipper, a Thomson Reuters Company. | |
| Vanguard Target Retirement 2045 Fund | 7.51% |
| Target 2045 Composite Index | 7.62 |
| Mixed-Asset Target 2045 Funds Average | 7.03 |
| For a benchmark description, see the Glossary. | |
| Mixed-Asset Target 2045 Funds Average: Derived from data provided by Lipper, a Thomson Reuters Company. | |
1
| Total | |
| Returns | |
| Vanguard Target Retirement 2050 Fund | 7.51% |
| Target 2050 Composite Index | 7.62 |
| Mixed-Asset Target 2050 Funds Average | 6.89 |
| For a benchmark description, see the Glossary. | |
| Mixed-Asset Target 2050 Funds Average: Derived from data provided by Lipper, a Thomson Reuters Company. | |
| Vanguard Target Retirement 2055 Fund | 7.50% |
| Target 2055 Composite Index | 7.62 |
| Mixed-Asset Target 2055+ Funds Average | 7.32 |
| For a benchmark description, see the Glossary. | |
| Mixed-Asset Target 2055+ Funds Average: Derived from data provided by Lipper, a Thomson Reuters Company. | |
| Vanguard Target Retirement 2060 Fund | 7.49% |
| Target 2060 Composite Index | 7.62 |
| Mixed-Asset Target 2055+ Funds Average | 7.32 |
| For a benchmark description, see the Glossary. | |
| Mixed-Asset Target 2055+ Funds Average: Derived from data provided by Lipper, a Thomson Reuters Company. | |
Investments in Target Retirement Funds are subject to the risks of their underlying funds. The year in the fund name refers to the approximate year (the target date) when an investor in the fund would retire and leave the work force. The fund will gradually shift its emphasis from more aggressive investments to more conservative ones based on its target date. An investment in a Target Retirement Fund is not guaranteed at any time, including on or after the target date.
| Expense Ratios | ||
| Your Fund Compared With Its Peer Group | ||
| Acquired Fund Fees | Peer Group | |
| and Expenses | Average | |
| Target Retirement 2035 Fund | 0.15% | 0.40% |
| Target Retirement 2040 Fund | 0.16 | 0.42 |
| Target Retirement 2045 Fund | 0.16 | 0.38 |
| Target Retirement 2050 Fund | 0.16 | 0.41 |
| Target Retirement 2055 Fund | 0.16 | 0.38 |
| Target Retirement 2060 Fund | 0.16 | 0.38 |
The fund expense figures shown—drawn from the prospectus dated January 27, 2017—represent an estimate of the weighted average of
the expense ratios and any transaction fees charged by the underlying mutual funds (the ”acquired” funds) in which the Target Retirement
Funds invest. The Target Retirement Funds do not charge any expenses or fees of their own. For the six months ended March 31, 2017, the
annualized acquired fund fees and expenses were 0.15% for the 2035 Fund, 0.16% for the 2040 Fund, 0.16% for the 2045 Fund, 0.16% for the
2050 Fund, 0.16% for the 2055 Fund, and 0.16% for the 2060 Fund. Peer-group expense ratios are derived from data provided by Lipper, a
Thomson Reuters Company, and capture information through year-end 2016.
Peer groups: For the 2035 Fund, Mixed-Asset Target 2035 Funds; for the 2040 Fund, Mixed-Asset Target 2040 Funds; for the 2045 Fund,
Mixed-Asset Target 2045 Funds; for the 2050 Fund, Mixed-Asset Target 2050 Funds; for the 2055 and 2060 Funds, Mixed-Asset Target 2055+
Funds.
2
Chairman’s Perspective

Bill McNabb
Chairman and Chief Executive Officer
Dear Shareholder,
For many people, including me, falling interest rates have been the general trend in the bond market throughout our working lives. At the beginning of 1983, the year I graduated from business school, the yield of the benchmark 10-year U.S. Treasury note stood at more than 10%. It was less than 2.5% at the beginning of 2017.
Because bond prices move in the opposite direction from rates, my career happens to have overlapped with the greatest bull market for bonds in history.
It appears that may be changing. And, of course, there’s no shortage of advice about how to prepare for the shift.
Rates may be headed higher (really)
This bond bull market has reminded us time and again just how hard it is to predict when rates will rise or fall and by how much. If you follow bonds, you might recall the markets bracing for a sustained rate increase back in 2010 as the economy pulled out of recession, or again in 2013 when the Federal Reserve said it would start tapering its bond purchases, or again at the end of 2015 when the Fed raised short-term rates for the first time in almost a decade. And yet, prognostications notwithstanding, interest rates remained anchored near historical lows.
That said, rates seem to be on an upswing. With economic activity picking up, wages starting to move higher, and inflation coming
3
off recent lows, the Fed has nudged short-term rates higher twice in recent months and has signaled that further gradual increases are likely through 2018. The perceived pro-growth stance of the new U.S. administration also has played a role in framing a case for higher rates.
Short-term pain, longer-term gain
Bond investors are understandably concerned. If interest rates shoot up, the market value of bonds will drop sharply, with prices falling to bring yields in line with the new, prevailing higher rates. That’s the potential short-term pain. But long-term investors should actually want rates to go up. If you like bonds that pay 2%, you should love bonds that pay 4%, right?
There’s a simple—though imperfect—rule of thumb that helps make clear this point. If the time frame of your investing goal exceeds the time frame of your bond portfolio (a medium-term goal matched with short-term bonds, or a long-term goal paired with bonds not quite as long-term), rising rates will work out in your favor, maybe decidedly so.
Think of it this way: If you have a big cash need in the near future—say, a tuition bill coming due in a few years—and you own bonds that are long-term in nature, this time-frame mismatch could spell trouble if rates rise sharply; you’d be selling bonds that would be worth less. But if you’re saving to retire ten or 15 years down the road and rates are steadily rising, over time you’ll be earning higher and higher yields.
| Market Barometer | |||
| Total Returns | |||
| Periods Ended March 31, 2017 | |||
| Six | One | Five Years | |
| Months | Year | (Annualized) | |
| Stocks | |||
| Russell 1000 Index (Large-caps) | 10.09% | 17.43% | 13.26% |
| Russell 2000 Index (Small-caps) | 11.52 | 26.22 | 12.35 |
| Russell 3000 Index (Broad U.S. market) | 10.19 | 18.07 | 13.18 |
| FTSE All-World ex US Index (International) | 6.74 | 13.50 | 4.82 |
| Bonds | |||
| Bloomberg Barclays U.S. Aggregate Bond Index | |||
| (Broad taxable market) | -2.18% | 0.44% | 2.34% |
| Bloomberg Barclays Municipal Bond Index | |||
| (Broad tax-exempt market) | -2.10 | 0.15 | 3.24 |
| Citigroup Three-Month U.S. Treasury Bill Index | 0.21 | 0.34 | 0.10 |
| CPI | |||
| Consumer Price Index | 0.98% | 2.38% | 1.23% |
4
Josh Barrickman, our head of fixed income indexing for the Americas, calls it “the virtuous cycle of compounding interest at a higher rate.”
The bottom line is, you can end up better off than if rates haven’t risen because you’re earning more income, which over time more than washes away any price hit.
Beware of short-sighted, short-term moves
This logic can be difficult to grasp, tempting anxious bond investors to make drastic shifts to lessen the immediate pain of rising rates. Unfortunately, such moves can backfire.
Taking shelter in short-term bonds, for example, might seem like a good idea. Their prices generally hold up better than those of longer-term bonds in a rising-rate environment. But they also offer less income.
For example, when the market started worrying about rising rates in 2010, moving into short-term securities—and staying there—would have proved costly. Through 2016, those securities returned roughly half of what the broad U.S. bond market did.
Favoring high-yield bonds is another tack some investors take, expecting higher income to help cushion price declines.
| What has driven long-term returns for Vanguard bond funds? |
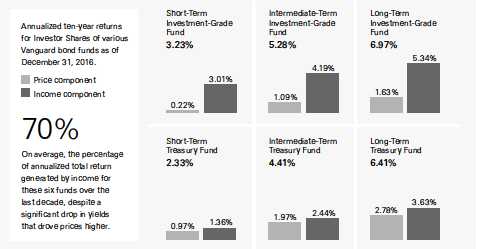
| Source: Vanguard. |
5
High-yield securities, however, typically perform best when stocks are rising, making them unlikely to zig when stocks zag.
We saw clear evidence of the correlation between stocks and high-yield bonds in the frantic markets following the United Kingdom’s vote to leave the European Union last year. From June 23 to June 27, both U.S. stocks and U.S. high-yield bonds lost ground. The broad U.S. bond market, meanwhile, climbed 1.2% as investors sought a safe haven.
Your portfolio is more than the sum of its parts
Different assets have different roles to play in a balanced and diversified portfolio. Stocks are valuable because they can produce higher returns over time, while bonds can provide a crucial counterweight to the volatility of stocks.
Perhaps the most important thing to keep in mind about bonds is that although their prices can fluctuate, they remain “fixed income” securities. Barring default, you can be certain of getting income until the bonds mature. It’s that income that drives returns for patient bond investors who resist the urge to jump in and out of the market, as you can see in the accompanying box.
A lot has changed since I first started following the bond market, but the important role that bonds can play in a balanced and diversified portfolio hasn’t.
As always, thank you for investing with Vanguard.
Sincerely,

F. William McNabb III
Chairman and Chief Executive Officer April 14, 2017
6
Target Retirement 2035 Fund
Fund Profile
As of March 31, 2017
| Total Fund Characteristics | |
| Ticker Symbol | VTTHX |
| 30-Day SEC Yield | 2.11% |
| Acquired Fund Fees and Expenses1 | 0.15% |
| Allocation to Underlying Vanguard Funds | |
| Vanguard Total Stock Market Index Fund | |
| Investor Shares | 47.6% |
| Vanguard Total International Stock Index | |
| Fund Investor Shares | 32.0 |
| Vanguard Total Bond Market II Index Fund | |
| Investor Shares | 14.4 |
| Vanguard Total International Bond Index | |
| Fund Investor Shares | 6.0 |
| Total Fund Volatility Measures | ||
| MSCI US | ||
| Target 2035 | Broad | |
| Composite | Market | |
| Index | Index | |
| R-Squared | 1.00 | 0.93 |
| Beta | 0.98 | 0.77 |
| These measures show the degree and timing of the fund’s | ||
| fluctuations compared with the indexes over 36 months. | ||
Fund Asset Allocation
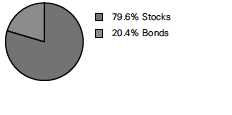
1 This figure—drawn from the prospectus dated January 27, 2017—represents an estimate of the weighted average of the expense ratios and any
transaction fees charged by the underlying mutual funds (the ”acquired” funds) in which the Target Retirement 2035 Fund invests. The fund does not
charge any expenses or fees of its own. For the six months ended March 31, 2017, the annualized acquired fund fees and expenses were 0.15%.
7
Target Retirement 2035 Fund
Performance Summary
All of the returns in this report represent past performance, which is not a guarantee of future results that may be achieved by the fund. (Current performance may be lower or higher than the performance data cited. For performance data current to the most recent month-end, visit our website at vanguard.com/performance.) Note, too, that both investment returns and principal value can fluctuate widely, so an investor’s shares, when sold, could be worth more or less than their original cost. The returns shown do not reflect taxes that a shareholder would pay on fund distributions or on the sale of fund shares.
Fiscal-Year Total Returns (%): September 30, 2006, Through March 31, 2017

For a benchmark description, see the Glossary.
Note: For 2017, performance data reflect the six months ended March 31, 2017.
| Average Annual Total Returns: Periods Ended March 31, 2017 | |||||
| Ten Years | |||||
| Inception Date One Year | Five Years | Income | Capital | Total | |
| Target Retirement 2035 | |||||
| Fund | 10/27/2003 13.04% | 9.05% | 2.23% | 3.23% | 5.46% |
See Financial Highlights for dividend and capital gains information.
8
Target Retirement 2035 Fund
Financial Statements (unaudited)
Statement of Net Assets
As of March 31, 2017
The fund reports a complete list of its holdings in regulatory filings four times in each fiscal year, at the quarter-ends. For the second and fourth fiscal quarters, the lists appear in the fund’s semiannual and annual reports to shareholders. For the first and third fiscal quarters, the fund files the lists with the Securities and Exchange Commission on Form N-Q. Shareholders can look up the fund’s Forms N-Q on the SEC’s website at sec.gov. Forms N-Q may also be reviewed and copied at the SEC’s Public Reference Room (see the back cover of this report for further information).
| Market | ||
| Value• | ||
| Shares | ($000) | |
| Investment Companies (100.0%) | ||
| U.S. Stock Fund (47.6%) | ||
| Vanguard Total Stock Market Index Fund Investor Shares | 217,846,526 | 12,861,659 |
| International Stock Fund (32.0%) | ||
| Vanguard Total International Stock Index Fund Investor Shares | 543,715,453 | 8,655,950 |
| U.S. Bond Fund (14.4%) | ||
| 1 Vanguard Total Bond Market II Index Fund Investor Shares | 366,019,252 | 3,894,445 |
| International Bond Fund (6.0%) | ||
| Vanguard Total International Bond Index Fund Investor Shares | 149,196,896 | 1,612,818 |
| Total Investment Companies (Cost $19,905,425) | 27,024,872 | |
| Temporary Cash Investment (0.0%) | ||
| Money Market Fund (0.0%) | ||
| 1 Vanguard Market Liquidity Fund, 0.965% (Cost $11,786) | 117,844 | 11,787 |
| Total Investments (100.0%) (Cost $19,917,211) | 27,036,659 | |
| Other Assets and Liabilities (0.0%) | ||
| Other Assets | 91,972 | |
| Liabilities | (86,318) | |
| 5,654 | ||
| Net Assets (100%) | ||
| Applicable to 1,444,205,110 outstanding $.001 par value shares of | ||
| beneficial interest (unlimited authorization) | 27,042,313 | |
| Net Asset Value Per Share | $18.72 | |
9
Target Retirement 2035 Fund
| Amount | |
| ($000) | |
| Statement of Assets and Liabilities | |
| Assets | |
| Investments in Securities, at Value—Affiliated Vanguard Funds | 27,036,659 |
| Receivables for Investment Securities Sold | 27,265 |
| Receivables for Accrued Income | 9,279 |
| Receivables for Capital Shares Issued | 55,428 |
| Total Assets | 27,128,631 |
| Liabilities | |
| Payables for Investment Securities Purchased | 21,279 |
| Payables for Capital Shares Redeemed | 65,039 |
| Total Liabilities | 86,318 |
| Net Assets | 27,042,313 |
| At March 31, 2017, net assets consisted of: | |
| Amount | |
| ($000) | |
| Paid-in Capital | 19,785,059 |
| Undistributed Net Investment Income | 104,068 |
| Accumulated Net Realized Gains | 33,738 |
| Unrealized Appreciation (Depreciation) | 7,119,448 |
| Net Assets | 27,042,313 |
• See Note A in Notes to Financial Statements.
1 Affiliated fund available only to Vanguard funds and certain trusts and accounts managed by Vanguard. Rate shown for Vanguard Market
Liquidity Fund is the 7-day yield.
See accompanying Notes, which are an integral part of the Financial Statements.
10
Target Retirement 2035 Fund
Statement of Operations
| Six Months Ended | |
| March 31, 2017 | |
| ($000) | |
| Investment Income | |
| Income | |
| Income Distributions Received from Affiliated Funds | 278,491 |
| Net Investment Income—Note B | 278,491 |
| Realized Net Gain (Loss) | |
| Capital Gain Distributions Received from Affiliated Funds | 3,648 |
| Affiliated Investment Securities Sold | 42,811 |
| Realized Net Gain (Loss) | 46,459 |
| Change in Unrealized Appreciation (Depreciation) of Investment Securities | 1,278,849 |
| Net Increase (Decrease) in Net Assets Resulting from Operations | 1,603,799 |
See accompanying Notes, which are an integral part of the Financial Statements.
11
Target Retirement 2035 Fund
Statement of Changes in Net Assets
| Six Months Ended | Year Ended | |
| March 31, | September 30, | |
| 2017 | 2016 | |
| ($000) | ($000) | |
| Increase (Decrease) in Net Assets | ||
| Operations | ||
| Net Investment Income | 278,491 | 512,267 |
| Realized Net Gain (Loss) | 46,459 | 318,684 |
| Change in Unrealized Appreciation (Depreciation) | 1,278,849 | 1,756,197 |
| Net Increase (Decrease) in Net Assets Resulting from Operations | 1,603,799 | 2,587,148 |
| Distributions | ||
| Net Investment Income | (494,181) | (480,079) |
| Realized Capital Gain1 | (187,678) | (537,016) |
| Total Distributions | (681,859) | (1,017,095) |
| Capital Share Transactions | ||
| Issued | 3,741,270 | 5,337,665 |
| Issued in Lieu of Cash Distributions | 672,952 | 999,667 |
| Redeemed | (2,824,455) | (6,177,230) |
| Net Increase (Decrease) from Capital Share Transactions | 1,589,767 | 160,102 |
| Total Increase (Decrease) | 2,511,707 | 1,730,155 |
| Net Assets | ||
| Beginning of Period | 24,530,606 | 22,800,451 |
| End of Period2 | 27,042,313 | 24,530,606 |
| 1 Includes fiscal 2017 and 2016 short-term gain distributions totaling $5,136,000 and $36,232,000, respectively. Short-term gain distributions | ||
| are treated as ordinary income dividends for tax purposes. | ||
| 2 Net Assets—End of Period includes undistributed (overdistributed) net investment income of $104,068,000 and $319,758,000. | ||
See accompanying Notes, which are an integral part of the Financial Statements.
12
Target Retirement 2035 Fund
Financial Highlights
| Six Months | |||||||
| Ended | |||||||
| For a Share Outstanding | March 31, | Year Ended September 30, | |||||
| Throughout Each Period | 2017 | 2016 | 2015 | 2014 | 2013 | 2012 | |
| Net Asset Value, Beginning of Period | $18.09 | $16.95 | $17.79 | $16.16 | $14.15 | $11.77 | |
| Investment Operations | |||||||
| Net Investment Income | .192 | .393 | .391 | .359 | .340 | .344 | |
| Capital Gain Distributions Received | .003 | .003 | .007 | .001 | .011 | .016 | |
| Net Realized and Unrealized Gain (Loss) | |||||||
| on Investments | .926 | 1.530 | (.865) | 1.594 | 1.972 | 2.307 | |
| Total from Investment Operations | 1.121 | 1.926 | (.467) | 1.954 | 2.323 | 2.667 | |
| Distributions | |||||||
| Dividends from Net Investment Income | (. 356) | (. 371) | (. 368) | (. 324) | (. 307) | (. 281) | |
| Distributions from Realized Capital Gains | (.135) | (. 415) | (. 005) | — | (. 006) | (. 006) | |
| Total Distributions | (. 491) | (.786) | (. 373) | (. 324) | (. 313) | (. 287) | |
| Net Asset Value, End of Period | $18.72 | $18.09 | $16.95 | $17.79 | $16.16 | $14.15 | |
| Total Return1 | 6.35% | 11.64% | -2.75% | 12.20% | 16.77% | 22.98% | |
| Ratios/Supplemental Data | |||||||
| Net Assets, End of Period (Millions) | $27,042 | $24,531 | $22,800 | $23,826 | $19,026 | $14,220 | |
| Ratio of Total Expenses to | |||||||
| Average Net Assets | — | — | — | — | — | — | |
| Acquired Fund Fees and Expenses | 0.15% | 0.15% | 0.15% | 0.18% | 0.18% | 0.18% | |
| Ratio of Net Investment Income to | |||||||
| Average Net Assets | 2.20% | 2.21% | 2.07% | 2.17% | 2.33% | 2.68% | |
| Portfolio Turnover Rate | 10% | 14% | 23% | 6% | 12% | 6% | |
The expense ratio, acquired fund fees and expenses, net investment income ratio, and turnover rate for the current period have been annualized.
1 Total returns do not include account service fees that may have applied in the periods shown. Fund prospectuses provide information about
any applicable account service fees.
See accompanying Notes, which are an integral part of the Financial Statements.
13
Target Retirement 2035 Fund
Notes to Financial Statements
Vanguard Target Retirement 2035 Fund is registered under the Investment Company Act of 1940 as an open-end investment company, or mutual fund. The fund follows a balanced investment strategy by investing in selected Vanguard funds to achieve its targeted allocation of assets to U.S. and international stocks, and U.S. and international bonds. Financial statements and other information about each underlying fund are available on vanguard.com.
A. The following significant accounting policies conform to generally accepted accounting principles for U.S. investment companies. The fund consistently follows such policies in preparing its financial statements.
1. Security Valuation: Investments are valued at the net asset value of each underlying Vanguard fund determined as of the close of the New York Stock Exchange (generally 4 p.m., Eastern time) on the valuation date.
2. Federal Income Taxes: The fund intends to continue to qualify as a regulated investment company and distribute all of its taxable income. Management has analyzed the fund’s tax positions taken for all open federal income tax years (September 30, 2013–2016), and for the period ended March 31, 2017, and has concluded that no provision for federal income tax is required in the fund’s financial statements.
3. Distributions: Distributions to shareholders are recorded on the ex-dividend date.
4. Credit Facility: The fund and certain other funds managed by The Vanguard Group (“Vanguard”) participate in a $3.1 billion committed credit facility provided by a syndicate of lenders pursuant to a credit agreement that may be renewed annually; each fund is individually liable for its borrowings, if any, under the credit facility. Borrowings may be utilized for temporary and emergency purposes, and are subject to the fund’s regulatory and contractual borrowing restrictions. The participating funds are charged administrative fees and an annual commitment fee of 0.10% of the undrawn amount of the facility; these fees are allocated to the funds based on a method approved by the fund’s board of trustees and borne by the funds in which the fund invests (see Note B). Any borrowings under this facility bear interest at a rate based upon the higher of the one-month London Interbank Offered Rate, federal funds effective rate, or overnight bank funding rate plus an agreed-upon spread.
The fund had no borrowings outstanding at March 31, 2017, or at any time during the period then ended.
5. Other: Income and capital gain distributions received are recorded on the ex-dividend date. Security transactions are accounted for on the date securities are bought or sold. Costs used to determine realized gains (losses) on the sale of investment securities are those of the specific securities sold.
B. In accordance with the terms of a Funds’ Service Agreement (the “FSA”) between Vanguard and the fund, Vanguard furnishes to the fund investment advisory, corporate management, administrative, marketing, and distribution services at Vanguard’s cost of operations (as defined by the FSA). These costs of operations are allocated to the fund based on methods and guidelines approved by the board of trustees. The FSA provides that expenses otherwise allocable to Vanguard funds-of-funds may be reduced or eliminated to the extent of savings realized by the underlying Vanguard funds by virtue of being part of a fund-of-funds. Accordingly, all expenses for services provided by Vanguard to the fund and all other expenses incurred by the fund during the period ended March 31, 2017, were borne by the underlying Vanguard funds in which the fund invests. The fund’s trustees and officers are also trustees and officers, respectively, of the underlying Vanguard funds, as well as directors and employees, respectively, of Vanguard.
14
Target Retirement 2035 Fund
C. Various inputs may be used to determine the value of the fund’s investments. These inputs are summarized in three broad levels for financial statement purposes. The inputs or methodologies used to value securities are not necessarily an indication of the risk associated with investing in those securities.
Level 1—Quoted prices in active markets for identical securities.
Level 2—Other significant observable inputs (including quoted prices for similar securities, interest rates, prepayment speeds, credit risk, etc.).
Level 3—Significant unobservable inputs (including the fund’s own assumptions used to determine the fair value of investments).
At March 31, 2017, 100% of the market value of the fund’s investments was determined based on Level 1 inputs.
D. Distributions are determined on a tax basis and may differ from net investment income and realized capital gains for financial reporting purposes. Differences may be permanent or temporary. Permanent differences are reclassified among capital accounts in the financial statements to reflect their tax character. Temporary differences arise when certain items of income, expense, gain, or loss are recognized in different periods for financial statement and tax purposes. These differences will reverse at some time in the future. Differences in classification may also result from the treatment of short-term gains as ordinary income for tax purposes. The fund’s tax-basis capital gains and losses are determined only at the end of each fiscal year.
At March 31, 2017, the cost of investment securities for tax purposes was $19,917,211,000. Net unrealized appreciation of investment securities for tax purposes was $7,119,448,000, consisting entirely of unrealized gains on securities that had risen in value since their purchase.
E. Capital shares issued and redeemed were:
| Six Months Ended | Year Ended | |
| March 31, 2017 | September 30, 2016 | |
| Shares | Shares | |
| (000) | (000) | |
| Issued | 205,825 | 311,062 |
| Issued in Lieu of Cash Distributions | 37,977 | 58,597 |
| Redeemed | (155,753) | (358,384) |
| Net Increase (Decrease) in Shares Outstanding | 88,049 | 11,275 |
15
Target Retirement 2035 Fund
F. Transactions during the period in affiliated underlying Vanguard funds were as follows:
| Current Period Transactions | ||||||
| Sept. 30, | Proceeds | March 31, | ||||
| 2016 | from | Capital Gain | 2017 | |||
| Market | Purchases | Securities | Distributions | Market | ||
| Value | at Cost | Sold | Income | Received | Value | |
| ($000) | ($000) | ($000) | ($000) | ($000) | ($000) | |
| Vanguard Market Liquidity Fund | 10,393 | NA1 | NA1 | 26 | — | 11,787 |
| Vanguard Total Bond Market II | ||||||
| Index Fund | 3,433,858 | 880,102 | 296,694 | 41,669 | 3,648 | 3,894,445 |
| Vanguard Total International | ||||||
| Bond Index Fund | 1,385,325 | 273,248 | — | 17,886 | — | 1,612,818 |
| Vanguard Total International | ||||||
| Stock Index Fund | 7,873,202 | 600,676 | 253,771 | 92,769 | — | 8,655,950 |
| Vanguard Total Stock Market | ||||||
| Index Fund | 11,838,917 | 643,889 | 675,540 | 126,141 | — | 12,861,659 |
| Total | 24,541,695 | 2,397,915 | 1,226,005 | 278,491 | 3,648 | 27,036,659 |
| 1 Not applicable—purchases and sales are for temporary cash investment purposes. | ||||||
G. Management has determined that no material events or transactions occurred subsequent to March 31, 2017, that would require recognition or disclosure in these financial statements.
16
Target Retirement 2040 Fund
Fund Profile
As of March 31, 2017
| Total Fund Characteristics | |
| Ticker Symbol | VFORX |
| 30-Day SEC Yield | 2.12% |
| Acquired Fund Fees and Expenses1 | 0.16% |
| Allocation to Underlying Vanguard Funds | |
| Vanguard Total Stock Market Index Fund | |
| Investor Shares | 51.9% |
| Vanguard Total International Stock Index | |
| Fund Investor Shares | 35.0 |
| Vanguard Total Bond Market II Index Fund | |
| Investor Shares | 9.2 |
| Vanguard Total International Bond Index | |
| Fund Investor Shares | 3.9 |
| Total Fund Volatility Measures | ||
| MSCI US | ||
| Target 2040 | Broad | |
| Composite | Market | |
| Index | Index | |
| R-Squared | 1.00 | 0.93 |
| Beta | 0.98 | 0.84 |
| These measures show the degree and timing of the fund’s | ||
| fluctuations compared with the indexes over 36 months. | ||
Fund Asset Allocation
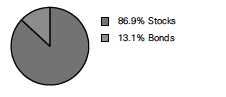
1 This figure—drawn from the prospectus dated January 27, 2017—represents an estimate of the weighted average of the expense ratios and any
transaction fees charged by the underlying mutual funds (the ”acquired” funds) in which the Target Retirement 2040 Fund invests. The fund does not
charge any expenses or fees of its own. For the six months ended March 31, 2017, the annualized acquired fund fees and expenses were 0.16%.
17
Target Retirement 2040 Fund
Performance Summary
All of the returns in this report represent past performance, which is not a guarantee of future results that may be achieved by the fund. (Current performance may be lower or higher than the performance data cited. For performance data current to the most recent month-end, visit our website at vanguard.com/performance.) Note, too, that both investment returns and principal value can fluctuate widely, so an investor’s shares, when sold, could be worth more or less than their original cost. The returns shown do not reflect taxes that a shareholder would pay on fund distributions or on the sale of fund shares.
Fiscal-Year Total Returns (%): September 30, 2006, Through March 31, 2017
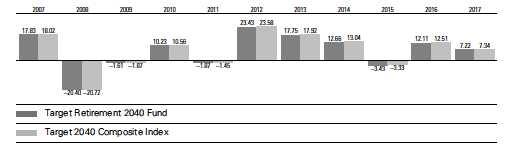
For a benchmark description, see the Glossary.
Note: For 2017, performance data reflect the six months ended March 31, 2017.
| Average Annual Total Returns: Periods Ended March 31, 2017 | |||||
| Ten Years | |||||
| Inception Date One Year | Five Years | Income | Capital | Total | |
| Target Retirement 2040 | |||||
| Fund | 6/7/2006 14.32% | 9.43% | 2.09% | 3.60% | 5.69% |
See Financial Highlights for dividend and capital gains information.
18
Target Retirement 2040 Fund
Financial Statements (unaudited)
Statement of Net Assets
As of March 31, 2017
The fund reports a complete list of its holdings in regulatory filings four times in each fiscal year, at the quarter-ends. For the second and fourth fiscal quarters, the lists appear in the fund’s semiannual and annual reports to shareholders. For the first and third fiscal quarters, the fund files the lists with the Securities and Exchange Commission on Form N-Q. Shareholders can look up the fund’s Forms N-Q on the SEC’s website at sec.gov. Forms N-Q may also be reviewed and copied at the SEC’s Public Reference Room (see the back cover of this report for further information).
| Market | ||
| Value• | ||
| Shares | ($000) | |
| Investment Companies (99.9%) | ||
| U.S. Stock Fund (51.9%) | ||
| Vanguard Total Stock Market Index Fund Investor Shares | 174,848,268 | 10,323,042 |
| International Stock Fund (34.9%) | ||
| Vanguard Total International Stock Index Fund Investor Shares | 436,304,905 | 6,945,974 |
| U.S. Bond Fund (9.2%) | ||
| 1 Vanguard Total Bond Market II Index Fund Investor Shares | 170,909,208 | 1,818,474 |
| International Bond Fund (3.9%) | ||
| Vanguard Total International Bond Index Fund Investor Shares | 70,765,034 | 764,970 |
| Total Investment Companies (Cost $14,813,896) | 19,852,460 | |
| Temporary Cash Investment (0.0%) | ||
| Money Market Fund (0.0%) | ||
| 1 Vanguard Market Liquidity Fund, 0.965% (Cost $6,923) | 69,222 | 6,923 |
| Total Investments (99.9%) (Cost $14,820,819) | 19,859,383 | |
| Other Assets and Liabilities (0.1%) | ||
| Other Assets | 110,890 | |
| Liabilities | (95,472) | |
| 15,418 | ||
| Net Assets (100%) | ||
| Applicable to 620,467,769 outstanding $.001 par value shares of | ||
| beneficial interest (unlimited authorization) | 19,874,801 | |
| Net Asset Value Per Share | $32.03 | |
19
Target Retirement 2040 Fund
| Amount | |
| ($000) | |
| Statement of Assets and Liabilities | |
| Assets | |
| Investments in Securities, at Value—Affiliated Vanguard Funds | 19,859,383 |
| Receivables for Investment Securities Sold | 39,429 |
| Receivables for Accrued Income | 4,271 |
| Receivables for Capital Shares Issued | 67,190 |
| Total Assets | 19,970,273 |
| Liabilities | |
| Payables for Investment Securities Purchased | 36,070 |
| Payables for Capital Shares Redeemed | 59,402 |
| Total Liabilities | 95,472 |
| Net Assets | 19,874,801 |
| At March 31, 2017, net assets consisted of: | |
| Amount | |
| ($000) | |
| Paid-in Capital | 14,760,349 |
| Undistributed Net Investment Income | 75,248 |
| Accumulated Net Realized Gains | 640 |
| Unrealized Appreciation (Depreciation) | 5,038,564 |
| Net Assets | 19,874,801 |
• See Note A in Notes to Financial Statements.
1 Affiliated fund available only to Vanguard funds and certain trusts and accounts managed by Vanguard. Rate shown for Vanguard Market
Liquidity Fund is the 7-day yield.
See accompanying Notes, which are an integral part of the Financial Statements.
20
Target Retirement 2040 Fund
Statement of Operations
| Six Months Ended | |
| March 31, 2017 | |
| ($000) | |
| Investment Income | |
| Income | |
| Income Distributions Received from Affiliated Funds | 199,660 |
| Net Investment Income—Note B | 199,660 |
| Realized Net Gain (Loss) | |
| Capital Gain Distributions Received from Affiliated Funds | 1,618 |
| Affiliated Investment Securities Sold | 9,064 |
| Realized Net Gain (Loss) | 10,682 |
| Change in Unrealized Appreciation (Depreciation) of Investment Securities | 1,097,958 |
| Net Increase (Decrease) in Net Assets Resulting from Operations | 1,308,300 |
See accompanying Notes, which are an integral part of the Financial Statements.
21
Target Retirement 2040 Fund
Statement of Changes in Net Assets
| Six Months Ended | Year Ended | |
| March 31, | September 30, | |
| 2017 | 2016 | |
| ($000) | ($000) | |
| Increase (Decrease) in Net Assets | ||
| Operations | ||
| Net Investment Income | 199,660 | 358,638 |
| Realized Net Gain (Loss) | 10,682 | 134,456 |
| Change in Unrealized Appreciation (Depreciation) | 1,097,958 | 1,383,092 |
| Net Increase (Decrease) in Net Assets Resulting from Operations | 1,308,300 | 1,876,186 |
| Distributions | ||
| Net Investment Income | (349,771) | (329,503) |
| Realized Capital Gain1 | (72,933) | (125,908) |
| Total Distributions | (422,704) | (455,411) |
| Capital Share Transactions | ||
| Issued | 3,141,373 | 4,604,224 |
| Issued in Lieu of Cash Distributions | 415,990 | 446,191 |
| Redeemed | (1,939,229) | (4,824,349) |
| Net Increase (Decrease) from Capital Share Transactions | 1,618,134 | 226,066 |
| Total Increase (Decrease) | 2,503,730 | 1,646,841 |
| Net Assets | ||
| Beginning of Period | 17,371,071 | 15,724,230 |
| End of Period2 | 19,874,801 | 17,371,071 |
| 1 Includes fiscal 2017 and 2016 short-term gain distributions totaling $10,861,000 and $24,110,000, respectively. Short-term gain distributions | ||
| are treated as ordinary income dividends for tax purposes. | ||
| 2 Net Assets—End of Period includes undistributed (overdistributed) net investment income of $75,248,000 and $225,359,000. | ||
See accompanying Notes, which are an integral part of the Financial Statements.
22
Target Retirement 2040 Fund
Financial Highlights
| Six Months | |||||||
| Ended | |||||||
| For a Share Outstanding | March 31, | Year Ended September 30, | |||||
| Throughout Each Period | 2017 | 2016 | 2015 | 2014 | 2013 | 2012 | |
| Net Asset Value, Beginning of Period | $30.59 | $28.09 | $29.66 | $26.80 | $23.26 | $19.26 | |
| Investment Operations | |||||||
| Net Investment Income | . 323 | . 660 | . 648 | .593 | .546 | .559 | |
| Capital Gain Distributions Received | .003 | .003 | .007 | .001 | .012 | .022 | |
| Net Realized and Unrealized Gain (Loss) | |||||||
| on Investments | 1.838 | 2.687 | (1.634) | 2.773 | 3.485 | 3.872 | |
| Total from Investment Operations | 2.164 | 3.350 | (.979) | 3.367 | 4.043 | 4.453 | |
| Distributions | |||||||
| Dividends from Net Investment Income | (. 599) | (. 615) | (. 574) | (. 500) | (. 496) | (. 444) | |
| Distributions from Realized Capital Gains | (.125) | (. 235) | (. 017) | (. 007) | (. 007) | (. 009) | |
| Total Distributions | (.724) | (. 850) | (. 591) | (. 507) | (. 503) | (. 453) | |
| Net Asset Value, End of Period | $32.03 | $30.59 | $28.09 | $29.66 | $26.80 | $23.26 | |
| Total Return1 | 7.22% | 12.11% | -3.43% | 12.66% | 17.75% | 24.43% | |
| Ratios/Supplemental Data | |||||||
| Net Assets, End of Period (Millions) | $19,875 | $17,371 | $15,724 | $15,912 | $12,013 | $7,982 | |
| Ratio of Total Expenses to | |||||||
| Average Net Assets | — | — | — | — | — | — | |
| Acquired Fund Fees and Expenses | 0.16% | 0.16% | 0.16% | 0.18% | 0.18% | 0.18% | |
| Ratio of Net Investment Income to | |||||||
| Average Net Assets | 2.19% | 2.23% | 2.09% | 2.18% | 2.36% | 2.69% | |
| Portfolio Turnover Rate | 8% | 16% | 21% | 6% | 9% | 3% | |
The expense ratio, acquired fund fees and expenses, net investment income ratio, and turnover rate for the current period have been annualized.
1 Total returns do not include account service fees that may have applied in the periods shown. Fund prospectuses provide information about
any applicable account service fees.
See accompanying Notes, which are an integral part of the Financial Statements.
23
Target Retirement 2040 Fund
Notes to Financial Statements
Vanguard Target Retirement 2040 Fund is registered under the Investment Company Act of 1940 as an open-end investment company, or mutual fund. The fund follows a balanced investment strategy by investing in selected Vanguard funds to achieve its targeted allocation of assets to U.S. and international stocks, and U.S. and international bonds. Financial statements and other information about each underlying fund are available on vanguard.com.
A. The following significant accounting policies conform to generally accepted accounting principles for U.S. investment companies. The fund consistently follows such policies in preparing its financial statements.
1. Security Valuation: Investments are valued at the net asset value of each underlying Vanguard fund determined as of the close of the New York Stock Exchange (generally 4 p.m., Eastern time) on the valuation date.
2. Federal Income Taxes: The fund intends to continue to qualify as a regulated investment company and distribute all of its taxable income. Management has analyzed the fund’s tax positions taken for all open federal income tax years (September 30, 2013–2016), and for the period ended March 31, 2017, and has concluded that no provision for federal income tax is required in the fund’s financial statements.
3. Distributions: Distributions to shareholders are recorded on the ex-dividend date.
4. Credit Facility: The fund and certain other funds managed by The Vanguard Group (“Vanguard”) participate in a $3.1 billion committed credit facility provided by a syndicate of lenders pursuant to a credit agreement that may be renewed annually; each fund is individually liable for its borrowings, if any, under the credit facility. Borrowings may be utilized for temporary and emergency purposes, and are subject to the fund’s regulatory and contractual borrowing restrictions. The participating funds are charged administrative fees and an annual commitment fee of 0.10% of the undrawn amount of the facility; these fees are allocated to the funds based on a method approved by the fund’s board of trustees and borne by the funds in which the fund invests (see Note B). Any borrowings under this facility bear interest at a rate based upon the higher of the one-month London Interbank Offered Rate, federal funds effective rate, or overnight bank funding rate plus an agreed-upon spread.
The fund had no borrowings outstanding at March 31, 2017, or at any time during the period then ended.
5. Other: Income and capital gain distributions received are recorded on the ex-dividend date. Security transactions are accounted for on the date securities are bought or sold. Costs used to determine realized gains (losses) on the sale of investment securities are those of the specific securities sold.
B. In accordance with the terms of a Funds’ Service Agreement (the “FSA”) between Vanguard and the fund, Vanguard furnishes to the fund investment advisory, corporate management, administrative, marketing, and distribution services at Vanguard’s cost of operations (as defined by the FSA). These costs of operations are allocated to the fund based on methods and guidelines approved by the board of trustees. The FSA provides that expenses otherwise allocable to Vanguard funds-of-funds may be reduced or eliminated to the extent of savings realized by the underlying Vanguard funds by virtue of being part of a fund-of-funds. Accordingly, all expenses for services provided by Vanguard to the fund and all other expenses incurred by the fund during the period ended March 31, 2017, were borne by the underlying Vanguard funds in which the fund invests. The fund’s trustees and officers are also trustees and officers, respectively, of the underlying Vanguard funds, as well as directors and employees, respectively, of Vanguard.
24
Target Retirement 2040 Fund
C. Various inputs may be used to determine the value of the fund’s investments. These inputs are summarized in three broad levels for financial statement purposes. The inputs or methodologies used to value securities are not necessarily an indication of the risk associated with investing in those securities.
Level 1—Quoted prices in active markets for identical securities.
Level 2—Other significant observable inputs (including quoted prices for similar securities, interest rates, prepayment speeds, credit risk, etc.).
Level 3—Significant unobservable inputs (including the fund’s own assumptions used to determine the fair value of investments).
At March 31, 2017, 100% of the market value of the fund’s investments was determined based on Level 1 inputs.
D. Distributions are determined on a tax basis and may differ from net investment income and realized capital gains for financial reporting purposes. Differences may be permanent or temporary. Permanent differences are reclassified among capital accounts in the financial statements to reflect their tax character. Temporary differences arise when certain items of income, expense, gain, or loss are recognized in different periods for financial statement and tax purposes. These differences will reverse at some time in the future. Differences in classification may also result from the treatment of short-term gains as ordinary income for tax purposes. The fund’s tax-basis capital gains and losses are determined only at the end of each fiscal year.
At March 31, 2017, the cost of investment securities for tax purposes was $14,820,819,000. Net unrealized appreciation of investment securities for tax purposes was $5,038,564,000, consisting entirely of unrealized gains on securities that had risen in value since their purchase.
E. Capital shares issued and redeemed were:
| Six Months Ended | Year Ended | |
| March 31, 2017 | September 30, 2016 | |
| Shares | Shares | |
| (000) | (000) | |
| Issued | 101,463 | 159,514 |
| Issued in Lieu of Cash Distributions | 13,784 | 15,461 |
| Redeemed | (62,717) | (166,772) |
| Net Increase (Decrease) in Shares Outstanding | 52,530 | 8,203 |
25
Target Retirement 2040 Fund
F. Transactions during the period in affiliated underlying Vanguard funds were as follows:
| Current Period Transactions | ||||||
| Sept. 30, | Proceeds | March 31, | ||||
| 2016 | from | Capital Gain | 2017 | |||
| Market | Purchases | Securities | Distributions | Market | ||
| Value | at Cost | Sold | Income | Received | Value | |
| ($000) | ($000) | ($000) | ($000) | ($000) | ($000) | |
| Vanguard Market Liquidity Fund | 12,522 | NA1 | NA1 | 20 | — | 6,923 |
| Vanguard Total Bond Market II | ||||||
| Index Fund | 1,507,016 | 593,035 | 227,595 | 18,824 | 1,618 | 1,818,474 |
| Vanguard Total International | ||||||
| Bond Index Fund | 592,479 | 192,218 | — | 7,907 | — | 764,970 |
| Vanguard Total International | ||||||
| Stock Index Fund | 6,091,376 | 592,455 | 89,324 | 73,343 | — | 6,945,974 |
| Vanguard Total Stock Market | ||||||
| Index Fund | 9,176,256 | 706,438 | 388,916 | 99,566 | — | 10,323,042 |
| Total | 17,379,649 | 2,084,146 | 705,835 | 199,660 | 1,618 | 19,859,383 |
| 1 Not applicable—purchases and sales are for temporary cash investment purposes. | ||||||
G. Management has determined that no material events or transactions occurred subsequent to March 31, 2017, that would require recognition or disclosure in these financial statements.
26
Target Retirement 2045 Fund
Fund Profile
As of March 31, 2017
| Total Fund Characteristics | |
| Ticker Symbol | VTIVX |
| 30-Day SEC Yield | 2.13% |
| Acquired Fund Fees and Expenses1 | 0.16% |
| Allocation to Underlying Vanguard Funds | |
| Vanguard Total Stock Market Index Fund | |
| Investor Shares | 53.7% |
| Vanguard Total International Stock Index | |
| Fund Investor Shares | 36.2 |
| Vanguard Total Bond Market II Index Fund | |
| Investor Shares | 7.1 |
| Vanguard Total International Bond Index | |
| Fund Investor Shares | 3.0 |
| Total Fund Volatility Measures | ||
| MSCI US | ||
| Target 2045 | Broad | |
| Composite | Market | |
| Index | Index | |
| R-Squared | 1.00 | 0.93 |
| Beta | 0.98 | 0.85 |
| These measures show the degree and timing of the fund’s | ||
| fluctuations compared with the indexes over 36 months. | ||
Fund Asset Allocation
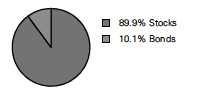
1 This figure—drawn from the prospectus dated January 27, 2017—represents an estimate of the weighted average of the expense ratios and any
transaction fees charged by the underlying mutual funds (the ”acquired” funds) in which the Target Retirement 2045 Fund invests. The fund does not
charge any expenses or fees of its own. For the six months ended March 31, 2017, the annualized acquired fund fees and expenses were 0.16%.
27
Target Retirement 2045 Fund
Performance Summary
All of the returns in this report represent past performance, which is not a guarantee of future results that may be achieved by the fund. (Current performance may be lower or higher than the performance data cited. For performance data current to the most recent month-end, visit our website at vanguard.com/performance.) Note, too, that both investment returns and principal value can fluctuate widely, so an investor’s shares, when sold, could be worth more or less than their original cost. The returns shown do not reflect taxes that a shareholder would pay on fund distributions or on the sale of fund shares.
Fiscal-Year Total Returns (%): September 30, 2006, Through March 31, 2017
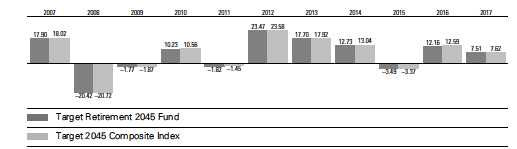
For a benchmark description, see the Glossary.
Note: For 2017, performance data reflect the six months ended March 31, 2017.
| Average Annual Total Returns: Periods Ended March 31, 2017 | |||||
| Ten Years | |||||
| Inception Date One Year | Five Years | Income | Capital | Total | |
| Target Retirement 2045 | |||||
| Fund | 10/27/2003 14.71% | 9.50% | 2.21% | 3.49% | 5.70% |
See Financial Highlights for dividend and capital gains information.
28
Target Retirement 2045 Fund
Financial Statements (unaudited)
Statement of Net Assets
As of March 31, 2017
The fund reports a complete list of its holdings in regulatory filings four times in each fiscal year, at the quarter-ends. For the second and fourth fiscal quarters, the lists appear in the fund’s semiannual and annual reports to shareholders. For the first and third fiscal quarters, the fund files the lists with the Securities and Exchange Commission on Form N-Q. Shareholders can look up the fund’s Forms N-Q on the SEC’s website at sec.gov. Forms N-Q may also be reviewed and copied at the SEC’s Public Reference Room (see the back cover of this report for further information).
| Market | ||
| Value• | ||
| Shares | ($000) | |
| Investment Companies (100.0%) | ||
| U.S. Stock Fund (53.7%) | ||
| Vanguard Total Stock Market Index Fund Investor Shares | 164,520,462 | 9,713,288 |
| International Stock Fund (36.2%) | ||
| Vanguard Total International Stock Index Fund Investor Shares | 411,560,294 | 6,552,040 |
| U.S. Bond Fund (7.1%) | ||
| 1 Vanguard Total Bond Market II Index Fund Investor Shares | 120,260,463 | 1,279,571 |
| International Bond Fund (3.0%) | ||
| Vanguard Total International Bond Index Fund Investor Shares | 50,073,402 | 541,294 |
| Total Investment Companies (Cost $13,236,212) | 18,086,193 | |
| Temporary Cash Investment (0.0%) | ||
| Money Market Fund (0.0%) | ||
| 1 Vanguard Market Liquidity Fund, 0.965% (Cost $8,373) | 83,711 | 8,373 |
| Total Investments (100.0%) (Cost $13,244,585) | 18,094,566 | |
| Other Assets and Liabilities (0.0%) | ||
| Other Assets | 55,878 | |
| Liabilities | (57,487) | |
| (1,609) | ||
| Net Assets (100%) | ||
| Applicable to 901,820,706 outstanding $.001 par value shares of | ||
| beneficial interest (unlimited authorization) | 18,092,957 | |
| Net Asset Value Per Share | $20.06 | |
29
Target Retirement 2045 Fund
| Amount | |
| ($000) | |
| Statement of Assets and Liabilities | |
| Assets | |
| Investments in Securities, at Value—Affiliated Vanguard Funds | 18,094,566 |
| Receivables for Investment Securities Sold | 14,000 |
| Receivables for Accrued Income | 3,086 |
| Receivables for Capital Shares Issued | 38,792 |
| Total Assets | 18,150,444 |
| Liabilities | |
| Payables for Investment Securities Purchased | 19,417 |
| Payables for Capital Shares Redeemed | 38,070 |
| Total Liabilities | 57,487 |
| Net Assets | 18,092,957 |
| At March 31, 2017, net assets consisted of: | |
| Amount | |
| ($000) | |
| Paid-in Capital | 13,172,037 |
| Undistributed Net Investment Income | 67,949 |
| Accumulated Net Realized Gains | 2,990 |
| Unrealized Appreciation (Depreciation) | 4,849,981 |
| Net Assets | 18,092,957 |
• See Note A in Notes to Financial Statements.
1 Affiliated fund available only to Vanguard funds and certain trusts and accounts managed by Vanguard. Rate shown for Vanguard Market
Liquidity Fund is the 7-day yield.
See accompanying Notes, which are an integral part of the Financial Statements.
30
Target Retirement 2045 Fund
Statement of Operations
| Six Months Ended | |
| March 31, 2017 | |
| ($000) | |
| Investment Income | |
| Income | |
| Income Distributions Received from Affiliated Funds | 183,095 |
| Net Investment Income—Note B | 183,095 |
| Realized Net Gain (Loss) | |
| Capital Gain Distributions Received from Affiliated Funds | 1,218 |
| Affiliated Investment Securities Sold | 9,227 |
| Realized Net Gain (Loss) | 10,445 |
| Change in Unrealized Appreciation (Depreciation) of Investment Securities | 1,047,624 |
| Net Increase (Decrease) in Net Assets Resulting from Operations | 1,241,164 |
See accompanying Notes, which are an integral part of the Financial Statements.
31
Target Retirement 2045 Fund
Statement of Changes in Net Assets
| Six Months Ended | Year Ended | |
| March 31, | September 30, | |
| 2017 | 2016 | |
| ($000) | ($000) | |
| Increase (Decrease) in Net Assets | ||
| Operations | ||
| Net Investment Income | 183,095 | 330,513 |
| Realized Net Gain (Loss) | 10,445 | 137,100 |
| Change in Unrealized Appreciation (Depreciation) | 1,047,624 | 1,271,291 |
| Net Increase (Decrease) in Net Assets Resulting from Operations | 1,241,164 | 1,738,904 |
| Distributions | ||
| Net Investment Income | (323,102) | (302,945) |
| Realized Capital Gain1 | (79,182) | (156,182) |
| Total Distributions | (402,284) | (459,127) |
| Capital Share Transactions | ||
| Issued | 2,629,648 | 3,900,183 |
| Issued in Lieu of Cash Distributions | 397,131 | 451,577 |
| Redeemed | (1,759,299) | (3,927,553) |
| Net Increase (Decrease) from Capital Share Transactions | 1,267,480 | 424,207 |
| Total Increase (Decrease) | 2,106,360 | 1,703,984 |
| Net Assets | ||
| Beginning of Period | 15,986,597 | 14,282,613 |
| End of Period2 | 18,092,957 | 15,986,597 |
1 Includes fiscal 2017 and 2016 short-term gain distributions totaling $6,807,000 and $14,912,000, respectively. Short-term gain distributions
are treated as ordinary income dividends for tax purposes.
2 Net Assets—End of Period includes undistributed (overdistributed) net investment income of $67,949,000 and $207,956,000.
See accompanying Notes, which are an integral part of the Financial Statements.
32
Target Retirement 2045 Fund
Financial Highlights
| Six Months | |||||||
| Ended | |||||||
| For a Share Outstanding | March 31, | Year Ended September 30, | |||||
| Throughout Each Period | 2017 | 2016 | 2015 | 2014 | 2013 | 2012 | |
| Net Asset Value, Beginning of Period | $19.12 | $17.60 | $18.61 | $16.82 | $14.61 | $12.10 | |
| Investment Operations | |||||||
| Net Investment Income | .201 | .411 | .406 | .376 | .350 | .354 | |
| Capital Gain Distributions Received | .001 | .002 | .004 | .001 | .008 | .014 | |
| Net Realized and Unrealized Gain (Loss) | |||||||
| on Investments | 1.205 | 1.692 | (1.034) | 1.747 | 2.173 | 2.433 | |
| Total from Investment Operations | 1.407 | 2.105 | (.624) | 2.124 | 2.531 | 2.801 | |
| Distributions | |||||||
| Dividends from Net Investment Income | (. 375) | (. 386) | (. 383) | (. 334) | (. 316) | (. 286) | |
| Distributions from Realized Capital Gains | (. 092) | (.199) | (. 003) | — | (. 005) | (. 005) | |
| Total Distributions | (. 467) | (. 585) | (. 386) | (. 334) | (. 321) | (. 291) | |
| Net Asset Value, End of Period | $20.06 | $19.12 | $17.60 | $18.61 | $16.82 | $14.61 | |
| Total Return1 | 7.51% | 12.16% | -3.49% | 12.73% | 17.70% | 23.47% | |
| Ratios/Supplemental Data | |||||||
| Net Assets, End of Period (Millions) $18,093 | $15,987 | $14,283 | $14,491 | $11,441 | $8,163 | ||
| Ratio of Total Expenses to | |||||||
| Average Net Assets | — | — | — | — | — | — | |
| Acquired Fund Fees and Expenses | 0.16% | 0.16% | 0.16% | 0.18% | 0.18% | 0.18% | |
| Ratio of Net Investment Income to | |||||||
| Average Net Assets | 2.19% | 2.43% | 2.10% | 2.17% | 2.36% | 2.70% | |
| Portfolio Turnover Rate | 8% | 13% | 20% | 7% | 10% | 7% | |
The expense ratio, acquired fund fees and expenses, net investment income ratio, and turnover rate for the current period have been annualized.
1 Total returns do not include account service fees that may have applied in the periods shown. Fund prospectuses provide information about
any applicable account service fees.
See accompanying Notes, which are an integral part of the Financial Statements.
33
Target Retirement 2045 Fund
Notes to Financial Statements
Vanguard Target Retirement 2045 Fund is registered under the Investment Company Act of 1940 as an open-end investment company, or mutual fund. The fund follows a balanced investment strategy by investing in selected Vanguard funds to achieve its targeted allocation of assets to U.S. and international stocks, and U.S. and international bonds. Financial statements and other information about each underlying fund are available on vanguard.com.
A. The following significant accounting policies conform to generally accepted accounting principles for U.S. investment companies. The fund consistently follows such policies in preparing its financial statements.
1. Security Valuation: Investments are valued at the net asset value of each underlying Vanguard fund determined as of the close of the New York Stock Exchange (generally 4 p.m., Eastern time) on the valuation date.
2. Federal Income Taxes: The fund intends to continue to qualify as a regulated investment company and distribute all of its taxable income. Management has analyzed the fund’s tax positions taken for all open federal income tax years (September 30, 2013–2016), and for the period ended March 31, 2017, and has concluded that no provision for federal income tax is required in the fund’s financial statements.
3. Distributions: Distributions to shareholders are recorded on the ex-dividend date.
4. Credit Facility: The fund and certain other funds managed by The Vanguard Group (“Vanguard”) participate in a $3.1 billion committed credit facility provided by a syndicate of lenders pursuant to a credit agreement that may be renewed annually; each fund is individually liable for its borrowings, if any, under the credit facility. Borrowings may be utilized for temporary and emergency purposes, and are subject to the fund’s regulatory and contractual borrowing restrictions. The participating funds are charged administrative fees and an annual commitment fee of 0.10% of the undrawn amount of the facility; these fees are allocated to the funds based on a method approved by the fund’s board of trustees and borne by the funds in which the fund invests (see Note B). Any borrowings under this facility bear interest at a rate based upon the higher of the one-month London Interbank Offered Rate, federal funds effective rate, or overnight bank funding rate plus an agreed-upon spread.
The fund had no borrowings outstanding at March 31, 2017, or at any time during the period then ended.
5. Other: Income and capital gain distributions received are recorded on the ex-dividend date. Security transactions are accounted for on the date securities are bought or sold. Costs used to determine realized gains (losses) on the sale of investment securities are those of the specific securities sold.
B. In accordance with the terms of a Funds’ Service Agreement (the “FSA”) between Vanguard and the fund, Vanguard furnishes to the fund investment advisory, corporate management, administrative, marketing, and distribution services at Vanguard’s cost of operations (as defined by the FSA). These costs of operations are allocated to the fund based on methods and guidelines approved by the board of trustees. The FSA provides that expenses otherwise allocable to Vanguard funds-of-funds may be reduced or eliminated to the extent of savings realized by the underlying Vanguard funds by virtue of being part of a fund-of-funds. Accordingly, all expenses for services provided by Vanguard to the fund and all other expenses incurred by the fund during the period ended March 31, 2017, were borne by the underlying Vanguard funds in which the fund invests. The fund’s trustees and officers are also trustees and officers, respectively, of the underlying Vanguard funds, as well as directors and employees, respectively, of Vanguard.
34
Target Retirement 2045 Fund
C. Various inputs may be used to determine the value of the fund’s investments. These inputs are summarized in three broad levels for financial statement purposes. The inputs or methodologies used to value securities are not necessarily an indication of the risk associated with investing in those securities.
Level 1—Quoted prices in active markets for identical securities.
Level 2—Other significant observable inputs (including quoted prices for similar securities, interest rates, prepayment speeds, credit risk, etc.).
Level 3—Significant unobservable inputs (including the fund’s own assumptions used to determine the fair value of investments).
At March 31, 2017, 100% of the market value of the fund’s investments was determined based on Level 1 inputs.
D. Distributions are determined on a tax basis and may differ from net investment income and realized capital gains for financial reporting purposes. Differences may be permanent or temporary. Permanent differences are reclassified among capital accounts in the financial statements to reflect their tax character. Temporary differences arise when certain items of income, expense, gain, or loss are recognized in different periods for financial statement and tax purposes. These differences will reverse at some time in the future. Differences in classification may also result from the treatment of short-term gains as ordinary income for tax purposes. The fund’s tax-basis capital gains and losses are determined only at the end of each fiscal year.
At March 31, 2017, the cost of investment securities for tax purposes was $13,244,584,000. Net unrealized appreciation of investment securities for tax purposes was $4,849,981,000, consisting entirely of unrealized gains on securities that had risen in value since their purchase.
E. Capital shares issued and redeemed were:
| Six Months Ended | Year Ended | |
| March 31, 2017 | September 30, 2016 | |
| Shares | Shares | |
| (000) | (000) | |
| Issued | 135,812 | 216,385 |
| Issued in Lieu of Cash Distributions | 21,034 | 25,032 |
| Redeemed | (91,057) | (216,842) |
| Net Increase (Decrease) in Shares Outstanding | 65,789 | 24,575 |
35
Target Retirement 2045 Fund
F. Transactions during the period in affiliated underlying Vanguard funds were as follows:
| Current Period Transactions | ||||||
| Sept. 30, | Proceeds | March 31, | ||||
| 2016 | from | Capital Gain | 2017 | |||
| Market | Purchases | Securities | Distributions | Market | ||
| Value | at Cost | Sold | Income | Received | Value | |
| ($000) | ($000) | ($000) | ($000) | ($000) | ($000) | |
| Vanguard Market Liquidity Fund | 5,775 | NA1 | NA1 | 16 | — | 8,373 |
| Vanguard Total Bond Market II | ||||||
| Index Fund | 1,130,351 | 358,740 | 168,456 | 13,852 | 1,218 | 1,279,571 |
| Vanguard Total International | ||||||
| Bond Index Fund | 458,181 | 98,207 | — | 5,946 | — | 541,294 |
| Vanguard Total International | ||||||
| Stock Index Fund | 5,745,381 | 614,648 | 137,726 | 69,275 | — | 6,552,040 |
| Vanguard Total Stock Market | ||||||
| Index Fund | 8,646,434 | 672,792 | 389,210 | 94,006 | — | 9,713,288 |
| Total | 15,986,122 | 1,744,387 | 695,392 | 183,095 | 1,218 | 18,094,566 |
| 1 Not applicable—purchases and sales are for temporary cash investment purposes. | ||||||
G. Management has determined that no material events or transactions occurred subsequent to March 31, 2017, that would require recognition or disclosure in these financial statements.
36
Target Retirement 2050 Fund
Fund Profile
As of March 31, 2017
| Total Fund Characteristics | |
| Ticker Symbol | VFIFX |
| 30-Day SEC Yield | 2.13% |
| Acquired Fund Fees and Expenses1 | 0.16% |
| Allocation to Underlying Vanguard Funds | |
| Vanguard Total Stock Market Index Fund | |
| Investor Shares | 54.0% |
| Vanguard Total International Stock Index | |
| Fund Investor Shares | 35.9 |
| Vanguard Total Bond Market II Index Fund | |
| Investor Shares | 7.1 |
| Vanguard Total International Bond Index | |
| Fund Investor Shares | 3.0 |
| Total Fund Volatility Measures | ||
| MSCI US | ||
| Target 2050 | Broad | |
| Composite | Market | |
| Index | Index | |
| R-Squared | 1.00 | 0.93 |
| Beta | 0.98 | 0.85 |
| These measures show the degree and timing of the fund’s | ||
| fluctuations compared with the indexes over 36 months. | ||
Fund Asset Allocation
1 This figure—drawn from the prospectus dated January 27, 2017—represents an estimate of the weighted average of the expense ratios and any
transaction fees charged by the underlying mutual funds (the ”acquired” funds) in which the Target Retirement 2050 Fund invests. The fund does not
charge any expenses or fees of its own. For the six months ended March 31, 2017, the annualized acquired fund fees and expenses were 0.16%.
37
Target Retirement 2050 Fund
Performance Summary
All of the returns in this report represent past performance, which is not a guarantee of future results that may be achieved by the fund. (Current performance may be lower or higher than the performance data cited. For performance data current to the most recent month-end, visit our website at vanguard.com/performance.) Note, too, that both investment returns and principal value can fluctuate widely, so an investor’s shares, when sold, could be worth more or less than their original cost. The returns shown do not reflect taxes that a shareholder would pay on fund distributions or on the sale of fund shares.
Fiscal-Year Total Returns (%): September 30, 2006, Through March 31, 2017
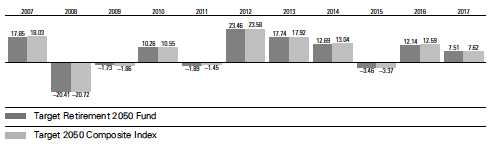
For a benchmark description, see the Glossary.
Note: For 2017, performance data reflect the six months ended March 31, 2017.
| Average Annual Total Returns: Periods Ended March 31, 2017 | |||||
| Ten Years | |||||
| Inception Date One Year | Five Years | Income | Capital | Total | |
| Target Retirement 2050 | |||||
| Fund | 6/7/2006 14.70% | 9.50% | 2.08% | 3.63% | 5.71% |
See Financial Highlights for dividend and capital gains information.
38
Target Retirement 2050 Fund
Financial Statements (unaudited)
Statement of Net Assets
As of March 31, 2017
The fund reports a complete list of its holdings in regulatory filings four times in each fiscal year, at the quarter-ends. For the second and fourth fiscal quarters, the lists appear in the fund’s semiannual and annual reports to shareholders. For the first and third fiscal quarters, the fund files the lists with the Securities and Exchange Commission on Form N-Q. Shareholders can look up the fund’s Forms N-Q on the SEC’s website at sec.gov. Forms N-Q may also be reviewed and copied at the SEC’s Public Reference Room (see the back cover of this report for further information).
| Market | ||
| Value• | ||
| Shares | ($000) | |
| Investment Companies (99.9%) | ||
| U.S. Stock Fund (54.0%) | ||
| Vanguard Total Stock Market Index Fund Investor Shares | 105,358,365 | 6,220,358 |
| International Stock Fund (35.9%) | ||
| Vanguard Total International Stock Index Fund Investor Shares | 260,064,248 | 4,140,223 |
| U.S. Bond Fund (7.0%) | ||
| 1 Vanguard Total Bond Market II Index Fund Investor Shares | 76,416,041 | 813,067 |
| International Bond Fund (3.0%) | ||
| Vanguard Total International Bond Index Fund Investor Shares | 31,731,520 | 343,018 |
| Total Investment Companies (Cost $8,979,724) | 11,516,666 | |
| Temporary Cash Investment (0.1%) | ||
| Money Market Fund (0.1%) | ||
| 1 Vanguard Market Liquidity Fund, 0.965% (Cost $6,399) | 63,982 | 6,399 |
| Total Investments (100.0%) (Cost $8,986,123) | 11,523,065 | |
| Other Assets and Liabilities (0.0%) | ||
| Other Assets | 51,089 | |
| Liabilities | (46,707) | |
| 4,382 | ||
| Net Assets (100%) | ||
| Applicable to 357,181,915 outstanding $.001 par value shares of | ||
| beneficial interest (unlimited authorization) | 11,527,447 | |
| Net Asset Value Per Share | $32.27 | |
39
Target Retirement 2050 Fund
| Amount | |
| ($000) | |
| Statement of Assets and Liabilities | |
| Assets | |
| Investments in Securities, at Value—Affiliated Vanguard Funds | 11,523,065 |
| Receivables for Investment Securities Sold | 8,038 |
| Receivables for Accrued Income | 1,952 |
| Receivables for Capital Shares Issued | 41,099 |
| Total Assets | 11,574,154 |
| Liabilities | |
| Payables for Investment Securities Purchased | 15,114 |
| Payables for Capital Shares Redeemed | 31,593 |
| Total Liabilities | 46,707 |
| Net Assets | 11,527,447 |
| At March 31, 2017, net assets consisted of: | |
| Amount | |
| ($000) | |
| Paid-in Capital | 8,947,412 |
| Undistributed Net Investment Income | 43,006 |
| Accumulated Net Realized Gains | 87 |
| Unrealized Appreciation (Depreciation) | 2,536,942 |
| Net Assets | 11,527,447 |
• See Note A in Notes to Financial Statements.
1 Affiliated fund available only to Vanguard funds and certain trusts and accounts managed by Vanguard. Rate shown for Vanguard Market
Liquidity Fund is the 7-day yield.
See accompanying Notes, which are an integral part of the Financial Statements.
40
Target Retirement 2050 Fund
Statement of Operations
| Six Months Ended | |
| March 31, 2017 | |
| ($000) | |
| Investment Income | |
| Income | |
| Income Distributions Received from Affiliated Funds | 113,229 |
| Net Investment Income—Note B | 113,229 |
| Realized Net Gain (Loss) | |
| Capital Gain Distributions Received from Affiliated Funds | 751 |
| Affiliated Investment Securities Sold | 4,905 |
| Realized Net Gain (Loss) | 5,656 |
| Change in Unrealized Appreciation (Depreciation) of Investment Securities | 653,494 |
| Net Increase (Decrease) in Net Assets Resulting from Operations | 772,379 |
See accompanying Notes, which are an integral part of the Financial Statements.
41
Target Retirement 2050 Fund
Statement of Changes in Net Assets
| Six Months Ended | Year Ended | |
| March 31, | September 30, | |
| 2017 | 2016 | |
| ($000) | ($000) | |
| Increase (Decrease) in Net Assets | ||
| Operations | ||
| Net Investment Income | 113,229 | 191,973 |
| Realized Net Gain (Loss) | 5,656 | 25,508 |
| Change in Unrealized Appreciation (Depreciation) | 653,494 | 795,513 |
| Net Increase (Decrease) in Net Assets Resulting from Operations | 772,379 | 1,012,994 |
| Distributions | ||
| Net Investment Income | (193,374) | (163,313) |
| Realized Capital Gain1 | (11,266) | (24,567) |
| Total Distributions | (204,640) | (187,880) |
| Capital Share Transactions | ||
| Issued | 2,144,876 | 3,089,676 |
| Issued in Lieu of Cash Distributions | 201,511 | 184,437 |
| Redeemed | (1,020,474) | (2,358,228) |
| Net Increase (Decrease) from Capital Share Transactions | 1,325,913 | 915,885 |
| Total Increase (Decrease) | 1,893,652 | 1,740,999 |
| Net Assets | ||
| Beginning of Period | 9,633,795 | 7,892,796 |
| End of Period2 | 11,527,447 | 9,633,795 |
| 1 Includes fiscal 2017 and 2016 short-term gain distributions totaling $2,504,000 and $12,842,000, respectively. Short-term gain distributions | ||
| are treated as ordinary income dividends for tax purposes. | ||
| 2 Net Assets—End of Period includes undistributed (overdistributed) net investment income of $43,006,000 and $123,151,000. | ||
See accompanying Notes, which are an integral part of the Financial Statements.
42
Target Retirement 2050 Fund
Financial Highlights
| Six Months | |||||||
| Ended | |||||||
| For a Share Outstanding | March 31, | Year Ended September 30, | |||||
| Throughout Each Period | 2017 | 2016 | 2015 | 2014 | 2013 | 2012 | |
| Net Asset Value, Beginning of Period | $30.63 | $27.95 | $29.53 | $26.69 | $23.16 | $19.17 | |
| Investment Operations | |||||||
| Net Investment Income | . 315 | . 636 | . 623 | .586 | .539 | .549 | |
| Capital Gain Distributions Received | .002 | .003 | .006 | .001 | .012 | .022 | |
| Net Realized and Unrealized Gain (Loss) | |||||||
| on Investments | 1.944 | 2.714 | (1.609) | 2.771 | 3.473 | 3.866 | |
| Total from Investment Operations | 2.261 | 3.353 | (.980) | 3.358 | 4.024 | 4.437 | |
| Distributions | |||||||
| Dividends from Net Investment Income | (. 587) | (. 585) | (. 596) | (. 518) | (. 487) | (. 439) | |
| Distributions from Realized Capital Gains | (. 034) | (. 088) | (. 004) | — | (. 007) | (. 008) | |
| Total Distributions | (. 621) | (. 673) | (. 600) | (. 518) | (. 494) | (. 447) | |
| Net Asset Value, End of Period | $32.27 | $30.63 | $27.95 | $29.53 | $26.69 | $23.16 | |
| Total Return1 | 7.51% | 12.14% | -3.46% | 12.69% | 17.74% | 23.46% | |
| Ratios/Supplemental Data | |||||||
| Net Assets, End of Period (Millions) | $11,527 | $9,634 | $7,893 | $7,389 | $5,355 | $3,467 | |
| Ratio of Total Expenses to | |||||||
| Average Net Assets | — | — | — | — | — | — | |
| Acquired Fund Fees and Expenses | 0.16% | 0.16% | 0.16% | 0.18% | 0.18% | 0.18% | |
| Ratio of Net Investment Income to | |||||||
| Average Net Assets | 2.19% | 2.24% | 2.11% | 2.19% | 2.36% | 2.70% | |
| Portfolio Turnover Rate | 5% | 12% | 18% | 7% | 9% | 4% | |
The expense ratio, acquired fund fees and expenses, net investment income ratio, and turnover rate for the current period have been annualized.
1 Total returns do not include account service fees that may have applied in the periods shown. Fund prospectuses provide information about
any applicable account service fees.
See accompanying Notes, which are an integral part of the Financial Statements.
43
Target Retirement 2050 Fund
Notes to Financial Statements
Vanguard Target Retirement 2050 Fund is registered under the Investment Company Act of 1940 as an open-end investment company, or mutual fund. The fund follows a balanced investment strategy by investing in selected Vanguard funds to achieve its targeted allocation of assets to U.S. and international stocks, and U.S. and international bonds. Financial statements and other information about each underlying fund are available on vanguard.com.
A. The following significant accounting policies conform to generally accepted accounting principles for U.S. investment companies. The fund consistently follows such policies in preparing its financial statements.
1. Security Valuation: Investments are valued at the net asset value of each underlying Vanguard fund determined as of the close of the New York Stock Exchange (generally 4 p.m., Eastern time) on the valuation date.
2. Federal Income Taxes: The fund intends to continue to qualify as a regulated investment company and distribute all of its taxable income. Management has analyzed the fund’s tax positions taken for all open federal income tax years (September 30, 2013–2016), and for the period ended March 31, 2017, and has concluded that no provision for federal income tax is required in the fund’s financial statements.
3. Distributions: Distributions to shareholders are recorded on the ex-dividend date.
4. Credit Facility: The fund and certain other funds managed by The Vanguard Group (“Vanguard”) participate in a $3.1 billion committed credit facility provided by a syndicate of lenders pursuant to a credit agreement that may be renewed annually; each fund is individually liable for its borrowings, if any, under the credit facility. Borrowings may be utilized for temporary and emergency purposes, and are subject to the fund’s regulatory and contractual borrowing restrictions. The participating funds are charged administrative fees and an annual commitment fee of 0.10% of the undrawn amount of the facility; these fees are allocated to the funds based on a method approved by the fund’s board of trustees and borne by the funds in which the fund invests (see Note B). Any borrowings under this facility bear interest at a rate based upon the higher of the one-month London Interbank Offered Rate, federal funds effective rate, or overnight bank funding rate plus an agreed-upon spread.
The fund had no borrowings outstanding at March 31, 2017, or at any time during the period then ended.
5. Other: Income and capital gain distributions received are recorded on the ex-dividend date. Security transactions are accounted for on the date securities are bought or sold. Costs used to determine realized gains (losses) on the sale of investment securities are those of the specific securities sold.
B. In accordance with the terms of a Funds’ Service Agreement (the “FSA”) between Vanguard and the fund, Vanguard furnishes to the fund investment advisory, corporate management, administrative, marketing, and distribution services at Vanguard’s cost of operations (as defined by the FSA). These costs of operations are allocated to the fund based on methods and guidelines approved by the board of trustees. The FSA provides that expenses otherwise allocable to Vanguard funds-of-funds may be reduced or eliminated to the extent of savings realized by the underlying Vanguard funds by virtue of being part of a fund-of-funds. Accordingly, all expenses for services provided by Vanguard to the fund and all other expenses incurred by the fund during the period ended March 31, 2017, were borne by the underlying Vanguard funds in which the fund invests. The fund’s trustees and officers are also trustees and officers, respectively, of the underlying Vanguard funds, as well as directors and employees, respectively, of Vanguard.
44
Target Retirement 2050 Fund
C. Various inputs may be used to determine the value of the fund’s investments. These inputs are summarized in three broad levels for financial statement purposes. The inputs or methodologies used to value securities are not necessarily an indication of the risk associated with investing in those securities.
Level 1—Quoted prices in active markets for identical securities.
Level 2—Other significant observable inputs (including quoted prices for similar securities, interest rates, prepayment speeds, credit risk, etc.).
Level 3—Significant unobservable inputs (including the fund’s own assumptions used to determine the fair value of investments).
At March 31, 2017, 100% of the market value of the fund’s investments was determined based on Level 1 inputs.
D. Distributions are determined on a tax basis and may differ from net investment income and realized capital gains for financial reporting purposes. Differences may be permanent or temporary. Permanent differences are reclassified among capital accounts in the financial statements to reflect their tax character. Temporary differences arise when certain items of income, expense, gain, or loss are recognized in different periods for financial statement and tax purposes. These differences will reverse at some time in the future. Differences in classification may also result from the treatment of short-term gains as ordinary income for tax purposes. The fund’s tax-basis capital gains and losses are determined only at the end of each fiscal year.
At March 31, 2017, the cost of investment securities for tax purposes was $8,986,123,000. Net unrealized appreciation of investment securities for tax purposes was $2,536,942,000, consisting entirely of unrealized gains on securities that had risen in value since their purchase.
E. Capital shares issued and redeemed were:
| Six Months Ended | Year Ended | |
| March 31, 2017 | September 30, 2016 | |
| Shares | Shares | |
| (000) | (000) | |
| Issued | 68,889 | 107,122 |
| Issued in Lieu of Cash Distributions | 6,635 | 6,382 |
| Redeemed | (32,824) | (81,445) |
| Net Increase (Decrease) in Shares Outstanding | 42,700 | 32,059 |
45
Target Retirement 2050 Fund
F. Transactions during the period in affiliated underlying Vanguard funds were as follows:
| Current Period Transactions | ||||||
| Sept. 30, | Proceeds | March 31, | ||||
| 2016 | from | Capital Gain | 2017 | |||
| Market | Purchases | Securities | Distributions | Market | ||
| Value | at Cost | Sold | Income | Received | Value | |
| ($000) | ($000) | ($000) | ($000) | ($000) | ($000) | |
| Vanguard Market Liquidity Fund | 7,485 | NA1 | NA1 | 15 | — | 6,399 |
| Vanguard Total Bond Market II | ||||||
| Index Fund | 683,264 | 244,238 | 89,639 | 8,564 | 751 | 813,067 |
| Vanguard Total International | ||||||
| Bond Index Fund | 274,376 | 77,713 | — | 3,618 | — | 343,018 |
| Vanguard Total International | ||||||
| Stock Index Fund | 3,464,877 | 506,176 | 39,912 | 42,817 | — | 4,140,223 |
| Vanguard Total Stock Market | ||||||
| Index Fund | 5,211,104 | 676,308 | 150,238 | 58,215 | — | 6,220,358 |
| Total | 9,641,106 | 1,504,435 | 279,789 | 113,229 | 751 | 11,523,065 |
| 1 Not applicable—purchases and sales are for temporary cash investment purposes. | ||||||
G. Management has determined that no material events or transactions occurred subsequent to March 31, 2017, that would require recognition or disclosure in these financial statements.
46
Target Retirement 2055 Fund
Fund Profile
As of March 31, 2017
| Total Fund Characteristics | |
| Ticker Symbol | VFFVX |
| 30-Day SEC Yield | 2.13% |
| Acquired Fund Fees and Expenses1 | 0.16% |
| Allocation to Underlying Vanguard Funds | |
| Vanguard Total Stock Market Index Fund | |
| Investor Shares | 54.1% |
| Vanguard Total International Stock Index | |
| Fund Investor Shares | 35.8 |
| Vanguard Total Bond Market II Index Fund | |
| Investor Shares | 7.1 |
| Vanguard Total International Bond Index | |
| Fund Investor Shares | 3.0 |
| Total Fund Volatility Measures | ||
| MSCI US | ||
| Target 2055 | Broad | |
| Composite | Market | |
| Index | Index | |
| R-Squared | 1.00 | 0.93 |
| Beta | 0.98 | 0.85 |
| These measures show the degree and timing of the fund’s | ||
| fluctuations compared with the indexes over 36 months. | ||
Fund Asset Allocation

1 This figure—drawn from the prospectus dated January 27, 2017—represents an estimate of the weighted average of the expense ratios and any
transaction fees charged by the underlying mutual funds (the ”acquired” funds) in which the Target Retirement 2055 Fund invests. The fund does not
charge any expenses or fees of its own. For the six months ended March 31, 2017, the annualized acquired fund fees and expenses were 0.16%.
47
Target Retirement 2055 Fund
Performance Summary
All of the returns in this report represent past performance, which is not a guarantee of future results that may be achieved by the fund. (Current performance may be lower or higher than the performance data cited. For performance data current to the most recent month-end, visit our website at vanguard.com/performance.) Note, too, that both investment returns and principal value can fluctuate widely, so an investor’s shares, when sold, could be worth more or less than their original cost. The returns shown do not reflect taxes that a shareholder would pay on fund distributions or on the sale of fund shares.
Fiscal-Year Total Returns (%): August 18, 2010, Through March 31, 2017
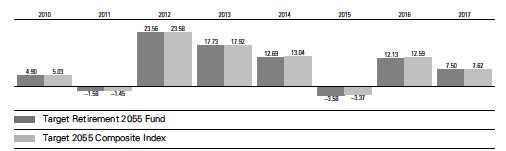
For a benchmark description, see the Glossary.
Note: For 2017, performance data reflect the six months ended March 31, 2017.
| Average Annual Total Returns: Periods Ended March 31, 2017 | |||||
| Since Inception | |||||
| Inception Date One Year | Five Years | Income | Capital | Total | |
| Target Retirement 2055 | |||||
| Fund | 8/18/2010 14.70% | 9.47% | 1.91% | 8.86% | 10.77% |
See Financial Highlights for dividend and capital gains information.
48
Target Retirement 2055 Fund
Financial Statements (unaudited)
Statement of Net Assets
As of March 31, 2017
The fund reports a complete list of its holdings in regulatory filings four times in each fiscal year, at the quarter-ends. For the second and fourth fiscal quarters, the lists appear in the fund’s semiannual and annual reports to shareholders. For the first and third fiscal quarters, the fund files the lists with the Securities and Exchange Commission on Form N-Q. Shareholders can look up the fund’s Forms N-Q on the SEC’s website at sec.gov. Forms N-Q may also be reviewed and copied at the SEC’s Public Reference Room (see the back cover of this report for further information).
| Market | ||
| Value• | ||
| Shares | ($000) | |
| Investment Companies (99.8%) | ||
| U.S. Stock Fund (54.1%) | ||
| Vanguard Total Stock Market Index Fund Investor Shares | 41,039,872 | 2,422,994 |
| International Stock Fund (35.7%) | ||
| Vanguard Total International Stock Index Fund Investor Shares | 100,574,825 | 1,601,151 |
| U.S. Bond Fund (7.0%) | ||
| 1 Vanguard Total Bond Market II Index Fund Investor Shares | 29,636,563 | 315,333 |
| International Bond Fund (3.0%) | ||
| Vanguard Total International Bond Index Fund Investor Shares | 12,326,132 | 133,246 |
| Total Investment Companies (Cost $3,901,676) | 4,472,724 | |
| Temporary Cash Investment (0.1%) | ||
| Money Market Fund (0.1%) | ||
| 1 Vanguard Market Liquidity Fund, 0.965% (Cost $2,483) | 24,826 | 2,483 |
| Total Investments (99.9%) (Cost $3,904,159) | 4,475,207 | |
| Other Assets and Liabilities (0.1%) | ||
| Other Assets | 23,459 | |
| Liabilities | (19,801) | |
| 3,658 | ||
| Net Assets (100%) | ||
| Applicable to 128,176,627 outstanding $.001 par value shares of | ||
| beneficial interest (unlimited authorization) | 4,478,865 | |
| Net Asset Value Per Share | $34.94 | |
49
Target Retirement 2055 Fund
| Amount | |
| ($000) | |
| Statement of Assets and Liabilities | |
| Assets | |
| Investments in Securities, at Value—Affiliated Vanguard Funds | 4,475,207 |
| Receivables for Investment Securities Sold | 4,700 |
| Receivables for Accrued Income | 754 |
| Receivables for Capital Shares Issued | 18,005 |
| Total Assets | 4,498,666 |
| Liabilities | |
| Payables for Investment Securities Purchased | 11,924 |
| Payables for Capital Shares Redeemed | 7,877 |
| Total Liabilities | 19,801 |
| Net Assets | 4,478,865 |
| At March 31, 2017, net assets consisted of: | |
| Amount | |
| ($000) | |
| Paid-in Capital | 3,893,532 |
| Undistributed Net Investment Income | 16,645 |
| Accumulated Net Realized Losses | (2,360) |
| Unrealized Appreciation (Depreciation) | 571,048 |
| Net Assets | 4,478,865 |
• See Note A in Notes to Financial Statements.
1 Affiliated fund available only to Vanguard funds and certain trusts and accounts managed by Vanguard. Rate shown for Vanguard Market
Liquidity Fund is the 7-day yield.
See accompanying Notes, which are an integral part of the Financial Statements.
50
Target Retirement 2055 Fund
Statement of Operations
| Six Months Ended | |
| March 31, 2017 | |
| ($000) | |
| Investment Income | |
| Income | |
| Income Distributions Received from Affiliated Funds | 42,340 |
| Net Investment Income—Note B | 42,340 |
| Realized Net Gain (Loss) | |
| Capital Gain Distributions Received from Affiliated Funds | 278 |
| Affiliated Investment Securities Sold | (408) |
| Realized Net Gain (Loss) | (130) |
| Change in Unrealized Appreciation (Depreciation) of Investment Securities | 247,906 |
| Net Increase (Decrease) in Net Assets Resulting from Operations | 290,116 |
See accompanying Notes, which are an integral part of the Financial Statements.
51
Target Retirement 2055 Fund
Statement of Changes in Net Assets
| Six Months Ended | Year Ended | |
| March 31, | September 30, | |
| 2017 | 2016 | |
| ($000) | ($000) | |
| Increase (Decrease) in Net Assets | ||
| Operations | ||
| Net Investment Income | 42,340 | 62,698 |
| Realized Net Gain (Loss) | (130) | 5,634 |
| Change in Unrealized Appreciation (Depreciation) | 247,906 | 262,818 |
| Net Increase (Decrease) in Net Assets Resulting from Operations | 290,116 | 331,150 |
| Distributions | ||
| Net Investment Income | (73,319) | (46,523) |
| Realized Capital Gain1 | (224) | (1,255) |
| Total Distributions | (73,543) | (47,778) |
| Capital Share Transactions | ||
| Issued | 1,160,436 | 1,535,226 |
| Issued in Lieu of Cash Distributions | 72,303 | 46,827 |
| Redeemed | (369,447) | (745,024) |
| Net Increase (Decrease) from Capital Share Transactions | 863,292 | 837,029 |
| Total Increase (Decrease) | 1,079,865 | 1,120,401 |
| Net Assets | ||
| Beginning of Period | 3,399,000 | 2,278,599 |
| End of Period2 | 4,478,865 | 3,399,000 |
1 Includes fiscal 2017 and 2016 short-term gain distributions totaling $224,000 and $78,000 respectively. Short-term gain distributions are
treated as ordinary income dividends for tax purposes.
2 Net Assets—End of Period includes undistributed (overdistributed) net investment income of $16,645,000 and $47,624,000
See accompanying Notes, which are an integral part of the Financial Statements.
52
Target Retirement 2055 Fund
Financial Highlights
| Six Months | |||||||
| Ended | |||||||
| For a Share Outstanding | March 31, | Year Ended September 30, | |||||
| Throughout Each Period | 2017 | 2016 | 2015 | 2014 | 2013 | 2012 | |
| Net Asset Value, Beginning of Period | $33.15 | $30.14 | $31.80 | $28.67 | $24.81 | $20.45 | |
| Investment Operations | |||||||
| Net Investment Income | . 3701 | .642 | .631 | . 577 | .6411 | .540 | |
| Capital Gain Distributions Received | .0021 | .003 | .005 | .001 | .0111 | .022 | |
| Net Realized and Unrealized Gain (Loss) | |||||||
| on Investments | 2.074 | 2.974 | (1.736) | 3.033 | 3.668 | 4.202 | |
| Total from Investment Operations | 2.446 | 3.619 | (1.100) | 3.611 | 4.320 | 4.764 | |
| Distributions | |||||||
| Dividends from Net Investment Income | (. 654) | (. 593) | (. 554) | (. 477) | (. 447) | (. 391) | |
| Distributions from Realized Capital Gains | (. 002) | (. 016) | (. 006) | (. 004) | (. 013) | (. 013) | |
| Total Distributions | (. 656) | (. 609) | (. 560) | (. 481) | (. 460) | (. 404) | |
| Net Asset Value, End of Period | $34.94 | $33.15 | $30.14 | $31.80 | $28.67 | $24.81 | |
| Total Return2 | 7.50% | 12.13% | -3.58% | 12.69% | 17.73% | 23.56% | |
| Ratios/Supplemental Data | |||||||
| Net Assets, End of Period (Millions) | $4,479 | $3,399 | $2,279 | $1,670 | $915 | $381 | |
| Ratio of Total Expenses to | |||||||
| Average Net Assets | — | — | — | — | — | — | |
| Acquired Fund Fees and Expenses | 0.16% | 0.16% | 0.16% | 0.18% | 0.18% | 0.18% | |
| Ratio of Net Investment Income to | |||||||
| Average Net Assets | 2.21% | 2.27% | 2.17% | 2.22% | 2.39% | 2.76% | |
| Portfolio Turnover Rate | 3% | 8% | 18% | 7% | 9% | 3% | |
The expense ratio, acquired fund fees and expenses, net investment income ratio, and turnover rate for the current period have been annualized.
1 Calculated based on average shares outstanding.
2 Total returns do not include account service fees that may have applied in the periods shown. Fund prospectuses provide information about
any applicable account service fees.
See accompanying Notes, which are an integral part of the Financial Statements.
53
Target Retirement 2055 Fund
Notes to Financial Statements
Vanguard Target Retirement 2055 Fund is registered under the Investment Company Act of 1940 as an open-end investment company, or mutual fund. The fund follows a balanced investment strategy by investing in selected Vanguard funds to achieve its targeted allocation of assets to U.S. and international stocks, and U.S. and international bonds. Financial statements and other information about each underlying fund are available on vanguard.com.
A. The following significant accounting policies conform to generally accepted accounting principles for U.S. investment companies. The fund consistently follows such policies in preparing its financial statements.
1. Security Valuation: Investments are valued at the net asset value of each underlying Vanguard fund determined as of the close of the New York Stock Exchange (generally 4 p.m., Eastern time) on the valuation date.
2. Federal Income Taxes: The fund intends to continue to qualify as a regulated investment company and distribute all of its taxable income. Management has analyzed the fund’s tax positions taken for all open federal income tax years (September 30, 2013–2016), and for the period ended March 31, 2017, and has concluded that no provision for federal income tax is required in the fund’s financial statements.
3. Distributions: Distributions to shareholders are recorded on the ex-dividend date.
4. Credit Facility: The fund and certain other funds managed by The Vanguard Group (“Vanguard”) participate in a $3.1 billion committed credit facility provided by a syndicate of lenders pursuant to a credit agreement that may be renewed annually; each fund is individually liable for its borrowings, if any, under the credit facility. Borrowings may be utilized for temporary and emergency purposes, and are subject to the fund’s regulatory and contractual borrowing restrictions. The participating funds are charged administrative fees and an annual commitment fee of 0.10% of the undrawn amount of the facility; these fees are allocated to the funds based on a method approved by the fund’s board of trustees and borne by the funds in which the fund invests (see Note B). Any borrowings under this facility bear interest at a rate based upon the higher of the one-month London Interbank Offered Rate, federal funds effective rate, or overnight bank funding rate plus an agreed-upon spread.
The fund had no borrowings outstanding at March 31, 2017, or at any time during the period then ended.
5. Other: Income and capital gain distributions received are recorded on the ex-dividend date. Security transactions are accounted for on the date securities are bought or sold. Costs used to determine realized gains (losses) on the sale of investment securities are those of the specific securities sold.
B. In accordance with the terms of a Funds’ Service Agreement (the “FSA”) between Vanguard and the fund, Vanguard furnishes to the fund investment advisory, corporate management, administrative, marketing, and distribution services at Vanguard’s cost of operations (as defined by the FSA). These costs of operations are allocated to the fund based on methods and guidelines approved by the board of trustees. The FSA provides that expenses otherwise allocable to Vanguard funds-of-funds may be reduced or eliminated to the extent of savings realized by the underlying Vanguard funds by virtue of being part of a fund-of-funds. Accordingly, all expenses for services provided by Vanguard to the fund and all other expenses incurred by the fund during the period ended March 31, 2017, were borne by the underlying Vanguard funds in which the fund invests. The fund’s trustees and officers are also trustees and officers, respectively, of the underlying Vanguard funds, as well as directors and employees, respectively, of Vanguard.
54
Target Retirement 2055 Fund
C. Various inputs may be used to determine the value of the fund’s investments. These inputs are summarized in three broad levels for financial statement purposes. The inputs or methodologies used to value securities are not necessarily an indication of the risk associated with investing in those securities.
Level 1—Quoted prices in active markets for identical securities.
Level 2—Other significant observable inputs (including quoted prices for similar securities, interest rates, prepayment speeds, credit risk, etc.).
Level 3—Significant unobservable inputs (including the fund’s own assumptions used to determine the fair value of investments).
At March 31, 2017, 100% of the market value of the fund’s investments was determined based on Level 1 inputs.
D. Distributions are determined on a tax basis and may differ from net investment income and realized capital gains for financial reporting purposes. Differences may be permanent or temporary. Permanent differences are reclassified among capital accounts in the financial statements to reflect their tax character. Temporary differences arise when certain items of income, expense, gain, or loss are recognized in different periods for financial statement and tax purposes. These differences will reverse at some time in the future. Differences in classification may also result from the treatment of short-term gains as ordinary income for tax purposes. The fund’s tax-basis capital gains and losses are determined only at the end of each fiscal year.
At March 31, 2017, the cost of investment securities for tax purposes was $3,904,159,000. Net unrealized appreciation of investment securities for tax purposes was $571,048,000, consisting of unrealized gains of $574,237,000 on securities that had risen in value since their purchase and $3,189,000 in unrealized losses on securities that had fallen in value since their purchase.
E. Capital shares issued and redeemed were:
| Six Months Ended | Year Ended | |
| March 31, 2017 | September 30, 2016 | |
| Shares | Shares | |
| (000) | (000) | |
| Issued | 34,430 | 49,206 |
| Issued in Lieu of Cash Distributions | 2,199 | 1,497 |
| Redeemed | (10,977) | (23,777) |
| Net Increase (Decrease) in Shares Outstanding | 25,652 | 26,926 |
55
Target Retirement 2055 Fund
F. Transactions during the period in affiliated underlying Vanguard funds were as follows:
| Current Period Transactions | ||||||
| Sept. 30, | Proceeds | March 31, | ||||
| 2016 | from | Capital Gain | 2017 | |||
| Market | Purchases | Securities | Distributions | Market | ||
| Value | at Cost | Sold | Income | Received | Value | |
| ($000) | ($000) | ($000) | ($000) | ($000) | ($000) | |
| Vanguard Market Liquidity Fund | 4,193 | NA1 | NA1 | 13 | — | 2,483 |
| Vanguard Total Bond Market II | ||||||
| Index Fund | 245,049 | 114,986 | 35,820 | 3,183 | 278 | 315,333 |
| Vanguard Total International | ||||||
| Bond Index Fund | 95,263 | 41,196 | — | 1,334 | — | 133,246 |
| Vanguard Total International | ||||||
| Stock Index Fund | 1,221,202 | 307,233 | 7,936 | 15,942 | — | 1,601,151 |
| Vanguard Total Stock Market | ||||||
| Index Fund | 1,837,903 | 421,474 | 15,324 | 21,868 | — | 2,422,994 |
| Total | 3,403,610 | 884,889 | 59,080 | 42,340 | 278 | 4,475,207 |
| 1 Not applicable—purchases and sales are for temporary cash investment purposes. | ||||||
G. Management has determined that no material events or transactions occurred subsequent to March 31, 2017, that would require recognition or disclosure in these financial statements.
56
Target Retirement 2060 Fund
Fund Profile
As of March 31, 2017
| Total Fund Characteristics | |
| Ticker Symbol | VTTSX |
| 30-Day SEC Yield | 2.13% |
| Acquired Fund Fees and Expenses1 | 0.16% |
| Allocation to Underlying Vanguard Funds | |
| Vanguard Total Stock Market Index Fund | |
| Investor Shares | 54.2% |
| Vanguard Total International Stock Index | |
| Fund Investor Shares | 35.8 |
| Vanguard Total Bond Market II Index Fund | |
| Investor Shares | 7.0 |
| Vanguard Total International Bond Index | |
| Fund Investor Shares | 3.0 |
| Total Fund Volatility Measures | ||
| MSCI US | ||
| Target 2060 | Broad | |
| Composite | Market | |
| Index | Index | |
| R-Squared | 1.00 | 0.93 |
| Beta | 0.98 | 0.85 |
| These measures show the degree and timing of the fund’s | ||
| fluctuations compared with the indexes over 36 months. | ||
Fund Asset Allocation
1 This figure—drawn from the prospectus dated January 27, 2017—represents an estimate of the weighted average of the expense ratios and any
transaction fees charged by the underlying mutual funds (the ”acquired” funds) in which the Target Retirement 2060 Fund invests. The fund does not
charge any expenses or fees of its own. For the six months ended March 31, 2017, the annualized acquired fund fees and expenses were 0.16%.
57
Target Retirement 2060 Fund
Performance Summary
All of the returns in this report represent past performance, which is not a guarantee of future results that may be achieved by the fund. (Current performance may be lower or higher than the performance data cited. For performance data current to the most recent month-end, visit our website at vanguard.com/performance.) Note, too, that both investment returns and principal value can fluctuate widely, so an investor’s shares, when sold, could be worth more or less than their original cost. The returns shown do not reflect taxes that a shareholder would pay on fund distributions or on the sale of fund shares.
Fiscal-Year Total Returns (%): January 19, 2012, Through March 31, 2017
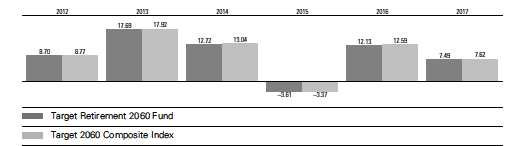
For a benchmark description, see the Glossary.
Note: For 2017, performance data reflect the six months ended March 31, 2017.
| Average Annual Total Returns: Periods Ended March 31, 2017 | |||||
| Since Inception | |||||
| Inception Date One Year | Five Years | Income | Capital | Total | |
| Target Retirement 2060 | |||||
| Fund | 1/19/2012 14.67% | 9.53% | 1.73% | 8.72% | 10.45% |
See Financial Highlights for dividend and capital gains information.
58
Target Retirement 2060 Fund
Financial Statements (unaudited)
Statement of Net Assets
As of March 31, 2017
The fund reports a complete list of its holdings in regulatory filings four times in each fiscal year, at the quarter-ends. For the second and fourth fiscal quarters, the lists appear in the fund’s semiannual and annual reports to shareholders. For the first and third fiscal quarters, the fund files the lists with the Securities and Exchange Commission on Form N-Q. Shareholders can look up the fund’s Forms N-Q on the SEC’s website at sec.gov. Forms N-Q may also be reviewed and copied at the SEC’s Public Reference Room (see the back cover of this report for further information).
| Market | ||
| Value• | ||
| Shares | ($000) | |
| Investment Companies (99.8%) | ||
| U.S. Stock Fund (54.1%) | ||
| Vanguard Total Stock Market Index Fund Investor Shares | 14,377,138 | 848,826 |
| International Stock Fund (35.7%) | ||
| Vanguard Total International Stock Index Fund Investor Shares | 35,261,661 | 561,366 |
| U.S. Bond Fund (7.0%) | ||
| 1 Vanguard Total Bond Market II Index Fund Investor Shares | 10,357,561 | 110,205 |
| International Bond Fund (3.0%) | ||
| Vanguard Total International Bond Index Fund Investor Shares | 4,337,319 | 46,886 |
| Total Investment Companies (Cost $1,401,775) | 1,567,283 | |
| Temporary Cash Investment (0.1%) | ||
| Money Market Fund (0.1%) | ||
| 1 Vanguard Market Liquidity Fund, 0.965% (Cost $1,342) | 13,418 | 1,342 |
| Total Investments (99.9%) (Cost $1,403,117) | 1,568,625 | |
| Other Assets and Liabilities (0.1%) | ||
| Other Assets | 7,669 | |
| Liabilities | (6,765) | |
| 904 | ||
| Net Assets (100%) | ||
| Applicable to 50,901,060 outstanding $.001 par value shares of | ||
| beneficial interest (unlimited authorization) | 1,569,529 | |
| Net Asset Value Per Share | $30.83 | |
59
Target Retirement 2060 Fund
| Amount | |
| ($000) | |
| Statement of Assets and Liabilities | |
| Assets | |
| Investments in Securities, at Value—Affiliated Vanguard Funds | 1,568,625 |
| Receivables for Investment Securities Sold | 1,900 |
| Receivables for Accrued Income | 263 |
| Receivables for Capital Shares Issued | 5,506 |
| Total Assets | 1,576,294 |
| Liabilities | |
| Payables for Investment Securities Purchased | 5,366 |
| Payables for Capital Shares Redeemed | 1,399 |
| Total Liabilities | 6,765 |
| Net Assets | 1,569,529 |
| At March 31, 2017, net assets consisted of: | |
| Amount | |
| ($000) | |
| Paid-in Capital | 1,398,618 |
| Undistributed Net Investment Income | 5,787 |
| Accumulated Net Realized Losses | (384) |
| Unrealized Appreciation (Depreciation) | 165,508 |
| Net Assets | 1,569,529 |
• See Note A in Notes to Financial Statements.
1 Affiliated fund available only to Vanguard funds and certain trusts and accounts managed by Vanguard. Rate shown for Vanguard Market
Liquidity Fund is the 7-day yield.
See accompanying Notes, which are an integral part of the Financial Statements.
60
Target Retirement 2060 Fund
Statement of Operations
| Six Months Ended | |
| March 31, 2017 | |
| ($000) | |
| Investment Income | |
| Income | |
| Income Distributions Received from Affiliated Funds | 14,469 |
| Net Investment Income—Note B | 14,469 |
| Realized Net Gain (Loss) | |
| Capital Gain Distributions Received from Affiliated Funds | 95 |
| Affiliated Investment Securities Sold | (165) |
| Realized Net Gain (Loss) | (70) |
| Change in Unrealized Appreciation (Depreciation) of Investment Securities | 84,952 |
| Net Increase (Decrease) in Net Assets Resulting from Operations | 99,351 |
See accompanying Notes, which are an integral part of the Financial Statements.
61
Target Retirement 2060 Fund
Statement of Changes in Net Assets
| Six Months Ended | Year Ended | |
| March 31, | September 30, | |
| 2017 | 2016 | |
| ($000) | ($000) | |
| Increase (Decrease) in Net Assets | ||
| Operations | ||
| Net Investment Income | 14,469 | 20,971 |
| Realized Net Gain (Loss) | (70) | 893 |
| Change in Unrealized Appreciation (Depreciation) | 84,952 | 88,315 |
| Net Increase (Decrease) in Net Assets Resulting from Operations | 99,351 | 110,179 |
| Distributions | ||
| Net Investment Income | (24,622) | (14,861) |
| Realized Capital Gain1 | (77) | (591) |
| Total Distributions | (24,699) | (15,452) |
| Capital Share Transactions | ||
| Issued | 470,340 | 553,901 |
| Issued in Lieu of Cash Distributions | 24,165 | 15,145 |
| Redeemed | (142,569) | (254,153) |
| Net Increase (Decrease) from Capital Share Transactions | 351,936 | 314,893 |
| Total Increase (Decrease) | 426,588 | 409,620 |
| Net Assets | ||
| Beginning of Period | 1,142,941 | 733,321 |
| End of Period2 | 1,569,529 | 1,142,941 |
1 Includes fiscal 2017 and 2016 short-term gain distributions totaling $77,000 and $325,000 respectively. Short-term gain distributions are
treated as ordinary income dividends for tax purposes.
2 Net Assets—End of Period includes undistributed (overdistributed) net investment income of $5,787,000 and $15,940,000.
See accompanying Notes, which are an integral part of the Financial Statements.
62
Target Retirement 2060 Fund
Financial Highlights
| Six Months | Jan. 19, | ||||||
| Ended | 20121 to | ||||||
| For a Share Outstanding | March 31, | Year Ended September 30, | Sept. 30, | ||||
| Throughout Each Period | 2017 | 2016 | 2015 | 2014 | 2013 | 2012 | |
| Net Asset Value, Beginning of Period | $29.25 | $26.58 | $28.03 | $25.21 | $21.74 | $20.00 | |
| Investment Operations | |||||||
| Net Investment Income | . 327 2 | . 555 | . 540 | .6152 | .5812 | .218 | |
| Capital Gain Distributions Received | .002 2 | .003 | .004 | .0012 | .007 2 | .002 | |
| Net Realized and Unrealized Gain (Loss) | |||||||
| on Investments | 1.827 | 2.635 | (1.523) | 2.572 | 3.203 | 1.520 | |
| Total from Investment Operations | 2.156 | 3.193 | (.979) | 3.188 | 3.791 | 1.740 | |
| Distributions | |||||||
| Dividends from Net Investment Income | (. 574) | (. 503) | (. 464) | (. 367) | (. 315) | — | |
| Distributions from Realized Capital Gains | (. 002) | (. 020) | (. 007) | (. 001) | (. 006) | — | |
| Total Distributions | (. 576) | (. 523) | (. 471) | (. 368) | (. 321) | — | |
| Net Asset Value, End of Period | $30.83 | $29.25 | $26.58 | $28.03 | $25.21 | $21.74 | |
| Total Return3 | 7.49% | 12.13% | -3.61% | 12.72% | 17.69% | 8.70% | |
| Ratios/Supplemental Data | |||||||
| Net Assets, End of Period (Millions) | $1,570 | $1,143 | $733 | $485 | $217 | $33 | |
| Ratio of Total Expenses to | |||||||
| Average Net Assets | — | — | — | — | — | — | |
| Acquired Fund Fees and Expenses | 0.16% | 0.16% | 0.16% | 0.18% | 0.18% | 0.18%4 | |
| Ratio of Net Investment Income to | |||||||
| Average Net Assets | 2.22% | 2.28% | 2.19% | 2.25% | 2.45% | 2.99%4 | |
| Portfolio Turnover Rate | 3% | 6% | 21% | 11% | 10% | 40% | |
The expense ratio, acquired fund fees and expenses, net investment income ratio, and turnover rate for the current period have been annualized.
1 Inception.
2 Calculated based on average shares outstanding.
3 Total returns do not include account service fees that may have applied in the periods shown. Fund prospectuses provide information about
any applicable transaction fees.
4 Annualized.
See accompanying Notes, which are an integral part of the Financial Statements.
63
Target Retirement 2060 Fund
Notes to Financial Statements
Vanguard Target Retirement 2060 Fund is registered under the Investment Company Act of 1940 as an open-end investment company, or mutual fund. The fund follows a balanced investment strategy by investing in selected Vanguard funds to achieve its targeted allocation of assets to U.S. and international stocks, and U.S. and international bonds. Financial statements and other information about each underlying fund are available on vanguard.com.
A. The following significant accounting policies conform to generally accepted accounting principles for U.S. investment companies. The fund consistently follows such policies in preparing its financial statements.
1. Security Valuation: Investments are valued at the net asset value of each underlying Vanguard fund determined as of the close of the New York Stock Exchange (generally 4 p.m., Eastern time) on the valuation date.
2. Federal Income Taxes: The fund intends to continue to qualify as a regulated investment company and distribute all of its taxable income. Management has analyzed the fund’s tax positions taken for all open federal income tax years (September 30, 2013–2016), and for the period ended March 31, 2017, and has concluded that no provision for federal income tax is required in the fund’s financial statements.
3. Distributions: Distributions to shareholders are recorded on the ex-dividend date.
4. Credit Facility: The fund and certain other funds managed by The Vanguard Group (“Vanguard”) participate in a $3.1 billion committed credit facility provided by a syndicate of lenders pursuant to a credit agreement that may be renewed annually; each fund is individually liable for its borrowings, if any, under the credit facility. Borrowings may be utilized for temporary and emergency purposes, and are subject to the fund’s regulatory and contractual borrowing restrictions. The participating funds are charged administrative fees and an annual commitment fee of 0.10% of the undrawn amount of the facility; these fees are allocated to the funds based on a method approved by the fund’s board of trustees and borne by the funds in which the fund invests (see Note B). Any borrowings under this facility bear interest at a rate based upon the higher of the one-month London Interbank Offered Rate, federal funds effective rate, or overnight bank funding rate plus an agreed-upon spread.
The fund had no borrowings outstanding at March 31, 2017, or at any time during the period then ended.
5. Other: Income and capital gain distributions received are recorded on the ex-dividend date. Security transactions are accounted for on the date securities are bought or sold. Costs used to determine realized gains (losses) on the sale of investment securities are those of the specific securities sold.
B. In accordance with the terms of a Funds’ Service Agreement (the “FSA”) between Vanguard and the fund, Vanguard furnishes to the fund investment advisory, corporate management, administrative, marketing, and distribution services at Vanguard’s cost of operations (as defined by the FSA). These costs of operations are allocated to the fund based on methods and guidelines approved by the board of trustees. The FSA provides that expenses otherwise allocable to Vanguard funds-of-funds may be reduced or eliminated to the extent of savings realized by the underlying Vanguard funds by virtue of being part of a fund-of-funds. Accordingly, all expenses for services provided by Vanguard to the fund and all other expenses incurred by the fund during the period ended March 31, 2017, were borne by the underlying Vanguard funds in which the fund invests. The fund’s trustees and officers are also trustees and officers, respectively, of the underlying Vanguard funds, as well as directors and employees, respectively, of Vanguard.
64
Target Retirement 2060 Fund
C. Various inputs may be used to determine the value of the fund’s investments. These inputs are summarized in three broad levels for financial statement purposes. The inputs or methodologies used to value securities are not necessarily an indication of the risk associated with investing in those securities.
Level 1—Quoted prices in active markets for identical securities.
Level 2—Other significant observable inputs (including quoted prices for similar securities, interest rates, prepayment speeds, credit risk, etc.).
Level 3—Significant unobservable inputs (including the fund’s own assumptions used to determine the fair value of investments).
At March 31, 2017, 100% of the market value of the fund’s investments was determined based on Level 1 inputs.
D. Distributions are determined on a tax basis and may differ from net investment income and realized capital gains for financial reporting purposes. Differences may be permanent or temporary. Permanent differences are reclassified among capital accounts in the financial statements to reflect their tax character. Temporary differences arise when certain items of income, expense, gain, or loss are recognized in different periods for financial statement and tax purposes. These differences will reverse at some time in the future. Differences in classification may also result from the treatment of short-term gains as ordinary income for tax purposes. The fund’s tax-basis capital gains and losses are determined only at the end of each fiscal year.
At March 31, 2017, the cost of investment securities for tax purposes was $1,403,117,000. Net unrealized appreciation of investment securities for tax purposes was $165,508,000, consisting of unrealized gains of $166,583,000 on securities that had risen in value since their purchase and $1,075,000 in unrealized losses on securities that had fallen in value since their purchase.
E. Capital shares issued and redeemed were:
| Six Months Ended | Year Ended | |
| March 31, 2017 | September 30, 2016 | |
| Shares | Shares | |
| (000) | (000) | |
| Issued | 15,798 | 20,147 |
| Issued in Lieu of Cash Distributions | 833 | 549 |
| Redeemed | (4,801) | (9,210) |
| Net Increase (Decrease) in Shares Outstanding | 11,830 | 11,486 |
65
Target Retirement 2060 Fund
F. Transactions during the period in affiliated underlying Vanguard funds were as follows:
| Current Period Transactions | ||||||
| Sept. 30, | Proceeds | March 31, | ||||
| 2016 | from | Capital Gain | 2017 | |||
| Market | Purchases | Securities | Distributions | Market | ||
| Value | at Cost | Sold | Income | Received | Value | |
| ($000) | ($000) | ($000) | ($000) | ($000) | ($000) | |
| Vanguard Market Liquidity Fund | 893 | NA1 | NA1 | 5 | — | 1,342 |
| Vanguard Total Bond Market II | ||||||
| Index Fund | 82,405 | 43,224 | 12,467 | 1,088 | 95 | 110,205 |
| Vanguard Total International | ||||||
| Bond Index Fund | 32,213 | 15,750 | — | 446 | — | 46,886 |
| Vanguard Total International | ||||||
| Stock Index Fund | 411,442 | 124,068 | 2,209 | 5,429 | — | 561,366 |
| Vanguard Total Stock Market | ||||||
| Index Fund | 617,141 | 178,053 | 7,124 | 7,501 | — | 848,826 |
| Total | 1,144,094 | 361,095 | 21,800 | 14,469 | 95 | 1,568,625 |
| 1 Not applicable—purchases and sales are for temporary cash investment purposes. | ||||||
G. Management has determined that no material events or transactions occurred subsequent to March 31, 2017, that would require recognition or disclosure in these financial statements.
66
About Your Fund’s Expenses
As a shareholder of the fund, you incur ongoing costs, which include costs for portfolio management, administrative services, and shareholder reports (like this one), among others. Operating expenses, which are deducted from a fund’s gross income, directly reduce the investment return of the fund.
A typical fund’s expenses are expressed as a percentage of its average net assets. The Target Retirement Funds have no direct expenses, but each fund bears its proportionate share of the costs for the underlying funds in which it invests. These indirect expenses make up the acquired fund fees and expenses, also expressed as a percentage of average net assets.
The following examples are intended to help you understand the ongoing cost (in dollars) of investing in your fund and to compare these costs with those of other mutual funds. The examples are based on an investment of $1,000 made at the beginning of the period shown and held for the entire period. The costs were calculated using the acquired fund fees and expenses for each Target Retirement Fund.
The accompanying table illustrates your fund’s costs in two ways:
• Based on actual fund return. This section helps you to estimate the actual expenses that you paid over the period. The ”Ending Account Value“ shown is derived from the fund‘s actual return, and the third column shows the dollar amount that would have been paid by an investor who started with $1,000 in the fund. You may use the information here, together with the amount you invested, to estimate the expenses that you paid over the period.
To do so, simply divide your account value by $1,000 (for example, an $8,600 account value divided by $1,000 = 8.6), then multiply the result by the number given for your fund under the heading ”Expenses Paid During Period.“
• Based on hypothetical 5% yearly return. This section is intended to help you compare your fund‘s costs with those of other mutual funds. It assumes that the fund had a yearly return of 5% before expenses, but that the expense ratio is unchanged. In this case—because the return used is not the fund’s actual return—the results do not apply to your investment. The example is useful in making comparisons because the Securities and Exchange Commission requires all mutual funds to calculate expenses based on a 5% return. You can assess your fund’s costs by comparing this hypothetical example with the hypothetical examples that appear in shareholder reports of other funds.
Note that the expenses shown in the table are meant to highlight and help you compare ongoing costs only and do not reflect transaction costs incurred by the fund for buying and selling securities. Further, the expenses do not include any purchase, redemption, or account service fees described in the fund prospectus. If such fees were applied to your account, your costs would be higher. Your fund does not carry a “sales load.”
The calculations assume no shares were bought or sold during the period. Your actual costs may have been higher or lower, depending on the amount of your investment and the timing of any purchases or redemptions.
You can find more information about the fund’s expenses, including annual expense ratios, in the Financial Statements section of this report. For additional information on operating expenses and other shareholder costs, please refer to your fund’s current prospectus.
67
| Six Months Ended March 31, 2017 | |||
| Beginning | Ending | Expenses | |
| Account Value | Account Value | Paid During | |
| 9/30/2016 | 3/31/2017 | Period | |
| Based on Actual Fund Return | |||
| Target Retirement 2035 Fund | $1,000.00 | $1,063.51 | $0.77 |
| Target Retirement 2040 Fund | $1,000.00 | $1,072.19 | $0.83 |
| Target Retirement 2045 Fund | $1,000.00 | $1,075.11 | $0.83 |
| Target Retirement 2050 Fund | $1,000.00 | $1,075.09 | $0.83 |
| Target Retirement 2055 Fund | $1,000.00 | $1,075.03 | $0.83 |
| Target Retirement 2060 Fund | $1,000.00 | $1,074.94 | $0.83 |
| Based on Hypothetical 5% Yearly Return | |||
| Target Retirement 2035 Fund | $1,000.00 | $1,024.18 | $0.76 |
| Target Retirement 2040 Fund | $1,000.00 | $1,024.13 | $0.81 |
| Target Retirement 2045 Fund | $1,000.00 | $1,024.07 | $0.81 |
| Target Retirement 2050 Fund | $1,000.00 | $1,024.07 | $0.81 |
| Target Retirement 2055 Fund | $1,000.00 | $1,024.07 | $0.81 |
| Target Retirement 2060 Fund | $1,000.00 | $1,024.07 | $0.81 |
The calculations are based on the acquired fund fees and expenses for the most recent six-month period. The funds’ annualized expense
figures for the period are (in order as listed from top to bottom above) 0.15%, 0.16%, 0.16%, 0.16%, 0.16%, and 0.16%. The dollar amounts
shown as ”Expenses Paid” are equal to the annualized average weighted expense ratio for the underlying funds multiplied by the average
account value over the period, multiplied by the number of days in the most recent six-month period, then divided by the number of days in
the most recent 12-month period (182/365).
68
Trustees Approve Advisory Arrangements
The board of trustees of Vanguard Target Retirement Funds has renewed each fund’s investment advisory arrangement with The Vanguard Group, Inc. (Vanguard), through its Equity Index Group. The board determined that continuing each fund’s internalized management structure was in the best interests of the funds and their shareholders.
The board based its decision upon an evaluation of the advisor’s investment staff, portfolio management process, and performance. This evaluation included information provided to the board by Vanguard’s Portfolio Review Department, which is responsible for fund and advisor oversight and product management. The Portfolio Review Department met regularly with the advisor and made monthly presentations to the board during the fiscal year that directed the board’s focus to relevant information and topics.
The board, or an investment committee made up of board members, also received information throughout the year during advisor presentations. For each advisor presentation, the board was provided with letters and reports that included information about, among other things, the advisory firm and the advisor’s assessment of the investment environment, portfolio performance, and portfolio characteristics.
In addition, the board received monthly reports, which included a Market and Economic Report, a Fund Dashboard Monthly Summary, and a Fund Performance Report.
Prior to their meeting, the trustees were provided with a memo and materials that summarized the information they received over the course of the year. They also considered the factors discussed below, among others. However, no single factor determined whether the board approved the arrangements. Rather, it was the totality of the circumstances that drove the board’s decision.
Nature, extent, and quality of services
The board reviewed the quality of the funds’ investment management services over both the short and long term, and took into account the organizational depth and stability of the advisor. The board considered that Vanguard has been managing investments for more than three decades. The Equity Index Group adheres to a sound, disciplined investment management process; the team has considerable experience, stability, and depth.
The board concluded that Vanguard’s experience, stability, depth, and performance, among other factors, warranted continuation of the advisory arrangements.
Investment performance
The board considered the performance of each fund, including any periods of outperformance or underperformance compared with a relevant benchmark index and peer group. The board concluded that the performance was such that the advisory arrangements should continue. Information about each fund’s most recent performance can be found in the Performance Summary pages of this report.
Cost
The board concluded that the funds’ acquired fund fees and expenses were well below the average expense ratios charged by funds in their respective peer groups. The funds do not incur advisory expenses directly; however, the board noted that each of the underlying funds in which the funds invest has advisory expenses well below the relevant peer-group average. Information about the funds’ acquired fund fees and expenses appears in the About Your Fund’s Expenses section of this report as well as in the Financial Statements sections.
69
The board does not conduct a profitability analysis of Vanguard because of Vanguard’s unique “at-cost” structure. Unlike most other mutual fund management companies, Vanguard is owned by the funds it oversees, and produces “profits” only in the form of reduced expenses for fund shareholders.
The benefit of economies of scale
The board concluded that Vanguard’s at-cost arrangements with the Target Retirement Funds and their underlying funds ensure that the funds will realize economies of scale as the assets of the underlying funds grow, with the cost to shareholders declining as assets increase.
The board will consider whether to renew the advisory arrangements again after a one-year period.
70
Glossary
30-Day SEC Yield. A fund’s 30-day SEC yield is derived using a formula specified by the U.S. Securities and Exchange Commission. Under the formula, data related to the fund’s security holdings in the previous 30 days are used to calculate the fund’s hypothetical net income for that period, which is then annualized and divided by the fund’s estimated average net assets over the calculation period. For the purposes of this calculation, a security’s income is based on its current market yield to maturity (for bonds), its actual income (for asset-backed securities), or its projected dividend yield (for stocks). Because the SEC yield represents hypothetical annualized income, it will differ—at times significantly—from the fund’s actual experience. As a result, the fund’s income distributions may be higher or lower than implied by the SEC yield.
Acquired Fund Fees and Expenses. Funds that invest in other Vanguard funds incur no direct expenses, but they do bear proportionate shares of the operating, administrative, and advisory expenses of the underlying funds, and they must pay any fees charged by those funds. The figure for acquired fund fees and expenses represents a weighted average of these underlying costs. Acquired is a term that the Securities and Exchange Commission applies to any mutual fund whose shares are owned by another fund.
Beta. A measure of the magnitude of a fund’s past share-price fluctuations in relation to the ups and downs of a given market index. The index is assigned a beta of 1.00. Compared with a given index, a fund with a beta of 1.20 typically would have seen its share price rise or fall by 12% when the index rose or fell by 10%. For this report, beta is based on returns over the past 36 months for both the fund and the index. Note that a fund’s beta should be reviewed in conjunction with its R-squared (see definition). The lower the R-squared, the less correlation there is between the fund and the index, and the less reliable beta is as an indicator of volatility.
Expense Ratio. A fund’s total annual operating expenses expressed as a percentage of the fund’s average net assets. The expense ratio includes management and administrative expenses, but does not include the transaction costs of buying and selling portfolio securities.
Inception Date. The date on which the assets of a fund (or one of its share classes) are first invested in accordance with the fund’s investment objective. For funds with a subscription period, the inception date is the day after that period ends. Investment performance is measured from the inception date.
R-Squared. A measure of how much of a fund’s past returns can be explained by the returns from the market in general, as measured by a given index. If a fund’s total returns were precisely synchronized with an index’s returns, its R-squared would be 1.00. If the fund’s returns bore no relationship to the index’s returns, its R-squared would be 0. For this report, R-squared is based on returns over the past 36 months for both the fund and the index.
71
Benchmark Information
Target 2035 Composite Index: Derived by applying the fund’s target asset allocation to the results of the following benchmarks: for international stocks of developed markets, the MSCI EAFE Index through December 15, 2010, the MSCI ACWI ex USA IMI Index through June 2, 2013, and the FTSE Global All Cap ex US Index thereafter; for emerging-market stocks, the Select Emerging Markets Index through August 23, 2006, the MSCI Emerging Markets Index through December 15, 2010, the MSCI ACWI ex USA IMI Index through June 2, 2013, and the FTSE Global All Cap ex US Index thereafter; for U.S. bonds, the Bloomberg Barclays U.S. Aggregate Bond Index through December 31, 2009, and the Bloomberg Barclays U.S. Aggregate Float Adjusted Index thereafter; for international bonds, the Bloomberg Barclays Global Aggregate ex-USD Float Adjusted RIC Capped Index beginning June 3, 2013; and for U.S. stocks, the Dow Jones U.S. Total Stock Market Index (formerly known as the Dow Jones Wilshire 5000 Index) through April 22, 2005, the MSCI US Broad Market Index through June 2, 2013, and the CRSP US Total Market Index thereafter. International stock benchmark returns are adjusted for withholding taxes.
Target 2040 Composite Index: Derived by applying the fund’s target asset allocation to the results of the following benchmarks: for international stocks of developed markets, the MSCI EAFE Index through December 15, 2010, the MSCI ACWI ex USA IMI Index through June 2, 2013, and the FTSE Global All Cap ex US Index thereafter; for emerging-market stocks, the Select Emerging Markets Index through August 23, 2006, the MSCI Emerging Markets Index through December 15, 2010, the MSCI ACWI ex USA IMI Index through June 2, 2013, and the FTSE Global All Cap ex US Index thereafter; for U.S. bonds, the Bloomberg Barclays U.S. Aggregate Bond Index through December 31, 2009, and the Bloomberg Barclays U.S. Aggregate Float Adjusted Index thereafter; for international bonds, the Bloomberg Barclays Global Aggregate ex-USD Float Adjusted RIC Capped Index beginning June 3, 2013; and for U.S. stocks, the MSCI US Broad Market Index through June 2, 2013, and the CRSP US Total Market Index thereafter. International stock benchmark returns are adjusted for withholding taxes.
Target 2045 Composite Index: Derived by applying the fund’s target asset allocation to the results of the following benchmarks: for international stocks of developed markets, the MSCI EAFE Index through December 15, 2010, the MSCI ACWI ex USA IMI Index through June 2, 2013, and the FTSE Global All Cap ex US Index thereafter; for emerging-market stocks, the Select Emerging Markets Index through August 23, 2006, the MSCI Emerging Markets Index through December 15, 2010, the MSCI ACWI ex USA IMI Index through June 2, 2013, and the FTSE Global All Cap ex US Index thereafter; for U.S. bonds, the Bloomberg Barclays U.S. Aggregate Bond Index through December 31, 2009, and the Bloomberg Barclays U.S. Aggregate Float Adjusted Index thereafter; for international bonds, the Bloomberg Barclays Global Aggregate ex-USD Float Adjusted RIC Capped Index beginning June 3, 2013; and for U.S. stocks, the Dow Jones U.S. Total Stock Market Index (formerly known as the Dow Jones Wilshire 5000 Index) through April 22, 2005, the MSCI US Broad Market Index through June 2, 2013, and the CRSP US Total Market Index thereafter. International stock benchmark returns are adjusted for withholding taxes.
72
Target 2050 Composite Index: Derived by applying the fund’s target asset allocation to the results of the following benchmarks: for international stocks of developed markets, the MSCI EAFE Index through December 15, 2010, the MSCI ACWI ex USA IMI Index through June 2, 2013, and the FTSE Global All Cap ex US Index thereafter; for emerging-market stocks, the Select Emerging Markets Index through August 23, 2006, the MSCI Emerging Markets Index through December 15, 2010, the MSCI ACWI ex USA IMI Index through June 2, 2013, and the FTSE Global All Cap ex US Index thereafter; for U.S. bonds, the Bloomberg Barclays U.S. Aggregate Bond Index through December 31, 2009, and the Bloomberg Barclays U.S. Aggregate Float Adjusted Index thereafter; for international bonds, the Bloomberg Barclays Global Aggregate ex-USD Float Adjusted RIC Capped Index beginning June 3, 2013; and for U.S. stocks, the MSCI US Broad Market Index through June 2, 2013, and the CRSP US Total Market Index thereafter. International stock benchmark returns are adjusted for withholding taxes.
Target 2055 Composite Index: Derived by applying the fund’s target asset allocation to the results of the following benchmarks: for international stocks of developed markets, the MSCI EAFE Index through December 15, 2010, the MSCI ACWI ex USA IMI Index through June 2, 2013, and the FTSE Global All Cap ex US Index thereafter; for emerging-market stocks, the MSCI Emerging Markets Index through December 15, 2010, the MSCI ACWI ex USA IMI Index through June 2, 2013, and the FTSE Global All Cap ex US Index thereafter; for U.S. bonds, the Bloomberg Barclays U.S. Aggregate Float Adjusted Index; for international bonds, the Bloomberg Barclays Global Aggregate ex-USD Float Adjusted RIC Capped Index beginning June 3, 2013; and for U.S. stocks, the MSCI US Broad Market Index through June 2, 2013, and the CRSP US Total Market Index thereafter. International stock benchmark returns are adjusted for withholding taxes.
Target 2060 Composite Index: Derived by applying the fund’s target asset allocation to the results of the following benchmarks: for international stocks of developed markets, the MSCI ACWI ex USA IMI Index through June 2, 2013, and the FTSE Global All Cap ex US Index thereafter; for emerging-market stocks, the MSCI ACWI ex USA IMI Index through June 2, 2013, and the FTSE Global All Cap ex US Index thereafter; for U.S. bonds, the Bloomberg Barclays U.S. Aggregate Float Adjusted Index; for international bonds, the Bloomberg Barclays Global Aggregate ex-USD Float Adjusted RIC Capped Index beginning June 3, 2013; and for U.S. stocks, the MSCI US Broad Market Index through June 2, 2013, and the CRSP US Total Market Index thereafter. International stock benchmark returns are adjusted for withholding taxes.
73
This page intentionally left blank.
This page intentionally left blank.
The People Who Govern Your Fund
The trustees of your mutual fund are there to see that the fund is operated and managed in your best interests since, as a shareholder, you are a part owner of the fund. Your fund’s trustees also serve on the board of directors of The Vanguard Group, Inc., which is owned by the Vanguard funds and provides services to them on an at-cost basis.
A majority of Vanguard’s board members are independent, meaning that they have no affiliation with Vanguard or the funds they oversee, apart from the sizable personal investments they have made as private individuals. The independent board members have distinguished backgrounds in business, academia, and public service. Each of the trustees and executive officers oversees 195 Vanguard funds.
The following table provides information for each trustee and executive officer of the fund. The mailing address of the trustees and officers is P.O. Box 876, Valley Forge, PA 19482. More information about the trustees is in the Statement of Additional Information, which can be obtained, without charge, by contacting Vanguard at 800-662-7447, or online at vanguard.com.
InterestedTrustee1
F. William McNabb III
Born 1957. Trustee Since July 2009. Chairman of the Board. Principal Occupation(s) During the Past Five Years and Other Experience: Chairman of the Board of The Vanguard Group, Inc., and of each of the investment companies served by The Vanguard Group, since January 2010; Director of The Vanguard Group since 2008; Chief Executive Officer and President of The Vanguard Group, and of each of the investment companies served by The Vanguard Group, since 2008; Director of Vanguard Marketing Corporation; Managing Director of The Vanguard Group (1995–2008).
IndependentTrustees
Emerson U. Fullwood
Born 1948. Trustee Since January 2008. Principal Occupation(s) During the Past Five Years and Other Experience: Executive Chief Staff and Marketing Officer for North America and Corporate Vice President (retired 2008) of Xerox Corporation (document management products and services); Executive in Residence and 2009–2010 Distinguished Minett Professor at the Rochester Institute of Technology; Lead Director of SPX FLOW, Inc. (multi-industry manufacturing); Director of the United Way of Rochester, the University of Rochester Medical Center, Monroe Community College Foundation, North Carolina A&T University, and Roberts Wesleyan College.
Rajiv L. Gupta
Born 1945. Trustee Since December 2001.2 Principal Occupation(s) During the Past Five Years and Other Experience: Chairman and Chief Executive Officer (retired 2009) and President (2006–2008) of Rohm and Haas Co. (chemicals); Director of Arconic Inc. (diversified manufacturer), HP Inc. (printer and personal computer manufacturing), and Delphi Automotive plc (automotive components); Senior Advisor at New Mountain Capital.
Amy Gutmann
Born 1949. Trustee Since June 2006. Principal Occupation(s) During the Past Five Years and Other Experience: President of the University of Pennsylvania; Christopher H. Browne Distinguished Professor of Political Science, School of Arts and Sciences, and Professor of Communication, Annenberg School for Communication, with secondary faculty appointments in the Department of Philosophy, School of Arts and Sciences, and at the Graduate School of Education, University of Pennsylvania; Trustee of the National Constitution Center; Chair of the Presidential Commission for the Study of Bioethical Issues.
JoAnn Heffernan Heisen
Born 1950. Trustee Since July 1998. Principal Occupation(s) During the Past Five Years and Other Experience: Corporate Vice President and Chief Global Diversity Officer (retired 2008) and Member of the Executive Committee (1997–2008) of Johnson & Johnson (pharmaceuticals/medical devices/consumer products); Director of Skytop Lodge Corporation (hotels) and the Robert Wood Johnson Foundation; Member of the Advisory Board of the Institute for Women’s Leadership at Rutgers University.
F. Joseph Loughrey
Born 1949. Trustee Since October 2009. Principal Occupation(s) During the Past Five Years and Other Experience: President and Chief Operating Officer (retired 2009) of Cummins Inc. (industrial machinery); Chairman of the Board of Hillenbrand, Inc. (specialized consumer services), Oxfam America, and the Lumina
Foundation for Education; Director of SKF AB (industrial machinery), Hyster-Yale Materials Handling, Inc. (forklift trucks), and the V Foundation for Cancer Research; Member of the Advisory Council for the College of Arts and Letters and Chair of the Advisory Board to the Kellogg Institute for International Studies, both at the University of Notre Dame.
Mark Loughridge
Born 1953. Trustee Since March 2012. Principal Occupation(s) During the Past Five Years and Other Experience: Senior Vice President and Chief Financial Officer (retired 2013) at IBM (information technology services); Fiduciary Member of IBM’s Retirement Plan Committee (2004–2013); Director of the Dow Chemical Company; Member of the Council on Chicago Booth.
Scott C. Malpass
Born 1962. Trustee Since March 2012. Principal Occupation(s) During the Past Five Years and Other Experience: Chief Investment Officer and Vice President at the University of Notre Dame; Assistant Professor of Finance at the Mendoza College of Business at Notre Dame; Member of the Notre Dame 403(b) Investment Committee, the Board of Advisors for Spruceview Capital Partners, and the Investment Advisory Committee of Major League Baseball; Board Member of TIFF Advisory Services, Inc., and Catholic Investment Services, Inc. (investment advisors); Member of the Board of Superintendence of the Institute for the Works of Religion.
André F. Perold
Born 1952. Trustee Since December 2004. Principal Occupation(s) During the Past Five Years and Other Experience: George Gund Professor of Finance and Banking, Emeritus at the Harvard Business School (retired 2011); Chief Investment Officer and Co-Managing Partner of HighVista Strategies LLC (private investment firm); Overseer of the Museum of Fine Arts Boston.
Peter F. Volanakis
Born 1955. Trustee Since July 2009. Principal Occupation(s) During the Past Five Years and Other Experience: President and Chief Operating Officer (retired 2010) of Corning Incorporated (communications equipment); Chairman of the Board of Trustees of Colby-Sawyer College; Member of the Board of Hypertherm, Inc. (industrial cutting systems, software, and consumables).
Executive Officers
Glenn Booraem
Born 1967. Investment Stewardship Officer Since February 2017. Principal Occupation(s) During the Past Five Years and Other Experience: Principal of The Vanguard Group, Inc.; Treasurer (2015–2017), Controller (2010–2015), and Assistant Controller (2001–2010) of each of the investment companies served by The Vanguard Group.
Thomas J. Higgins
Born 1957. Chief Financial Officer Since September 2008. Principal Occupation(s) During the Past Five Years and Other Experience: Principal of The Vanguard Group, Inc.; Chief Financial Officer of each of the investment companies served by The Vanguard Group; Treasurer of each of the investment companies served by The Vanguard Group (1998–2008).
Peter Mahoney
Born 1974. Controller Since May 2015. Principal Occupation(s) During the Past Five Years and Other Experience: Principal of The Vanguard Group, Inc.; Controller of each of the investment companies served by The Vanguard Group; Head of International Fund Services at The Vanguard Group (2008–2014).
Anne E. Robinson
Born 1970. Secretary Since September 2016. Principal Occupation(s) During the Past Five Years and Other Experience: Managing Director of The Vanguard Group, Inc.; General Counsel of The Vanguard Group; Secretary of The Vanguard Group and of each of the investment companies served by The Vanguard Group; Director and Senior Vice President of Vanguard Marketing Corporation; Managing Director and General Counsel of Global Cards and Consumer Services at Citigroup (2014–2016); Counsel at American Express (2003–2014).
Michael Rollings
Born 1963. Treasurer Since February 2017. Principal Occupation(s) During the Past Five Years and Other Experience: Managing Director of The Vanguard Group, Inc.; Treasurer of each of the investment companies served by The Vanguard Group; Executive Vice President and Chief Financial Officer of MassMutual Financial Group (2006–2016).
| Vanguard Senior Management Team | |
| Mortimer J. Buckley | James M. Norris |
| John James | Thomas M. Rampulla |
| Martha G. King | Glenn W. Reed |
| John T. Marcante | Karin A. Risi |
| Chris D. McIsaac | |
| Chairman Emeritus and Senior Advisor | |
| John J. Brennan | |
| Chairman, 1996–2009 | |
| Chief Executive Officer and President, 1996–2008 | |
| Founder | |
| John C. Bogle | |
| Chairman and Chief Executive Officer, 1974–1996 | |
1 Mr. McNabb is considered an “interested person,” as defined in the Investment Company Act of 1940, because he is an officer of the Vanguard funds.
2 December 2002 for Vanguard Equity Income Fund, the Vanguard Municipal Bond Funds, and the Vanguard State Tax-Exempt Funds.
 | |
| P.O. Box 2600 | |
| Valley Forge, PA 19482-2600 | |
| Connect with Vanguard® > vanguard.com | |
| Fund Information > 800-662-7447 | |
| Direct Investor Account Services > 800-662-2739 | |
| Institutional Investor Services > 800-523-1036 | |
| Text Telephone for People | |
| Who Are Deaf or Hard of Hearing > 800-749-7273 | |
| This material may be used in conjunction | |
| with the offering of shares of any Vanguard | |
| fund only if preceded or accompanied by | |
| the fund’s current prospectus. | |
| All comparative mutual fund data are from Lipper, a | |
| Thomson Reuters Company, or Morningstar, Inc., unless | |
| otherwise noted. | |
| You can obtain a free copy of Vanguard’s proxy voting | |
| guidelines by visiting vanguard.com/proxyreporting or by | |
| calling Vanguard at 800-662-2739. The guidelines are | |
| also available from the SEC’s website, sec.gov. In | |
| addition, you may obtain a free report on how your fund | |
| voted the proxies for securities it owned during the 12 | |
| months ended June 30. To get the report, visit either | |
| vanguard.com/proxyreporting or sec.gov. | |
| You can review and copy information about your fund at | |
| the SEC’s Public Reference Room in Washington, D.C. To | |
| find out more about this public service, call the SEC at | |
| 202-551-8090. Information about your fund is also | |
| available on the SEC’s website, and you can receive | |
| copies of this information, for a fee, by sending a | |
| request in either of two ways: via email addressed to | |
| publicinfo@sec.gov or via regular mail addressed to the | |
| Public Reference Section, Securities and Exchange | |
| Commission, Washington, DC 20549-1520. | |
| © 2017 The Vanguard Group, Inc. | |
| All rights reserved. | |
| Vanguard Marketing Corporation, Distributor. | |
| Q3082B 052017 | |
Semiannual Report | March 31, 2017
Vanguard Institutional Target Retirement Funds
Vanguard Institutional Target Retirement Income Fund
Vanguard Institutional Target Retirement 2010 Fund
Vanguard Institutional Target Retirement 2015 Fund
Vanguard Institutional Target Retirement 2020 Fund
Vanguard Institutional Target Retirement 2025 Fund
Vanguard Institutional Target Retirement 2030 Fund
A new format, unwavering commitment
As you begin reading this report, you’ll notice that we’ve made some improvements to the opening sections—based on feedback from you, our clients.
Page 1 starts with a new ”Your Fund’s Performance at a Glance,” a concise, handy summary of how your fund performed during the period.
In the renamed ”Chairman’s Perspective,” Bill McNabb will focus on enduring principles and investment insights.
We’ve modified some tables, and eliminated some redundancy, but we haven’t removed any information.
At Vanguard, we’re always looking for better ways to communicate and to help you make sound investment decisions. Thank you for entrusting your assets to us.
| Contents | |
| Your Fund’s Performance at a Glance. | 1 |
| Chairman’s Perspective. | 3 |
| Institutional Target Retirement Income Fund. | 7 |
| Institutional Target Retirement 2010 Fund. | 17 |
| Institutional Target Retirement 2015 Fund. | 27 |
| Institutional Target Retirement 2020 Fund. | 37 |
| Institutional Target Retirement 2025 Fund. | 47 |
| Institutional Target Retirement 2030 Fund. | 57 |
| About Your Fund’s Expenses. | 67 |
| Trustees Approve Advisory Arrangements. | 69 |
| Glossary. | 71 |
Please note: The opinions expressed in this report are just that—informed opinions. They should not be considered promises or advice.
Also, please keep in mind that the information and opinions cover the period through the date on the front of this report. Of course, the
risks of investing in your fund are spelled out in the prospectus.
See the Glossary for definitions of investment terms used in this report.
About the cover: No matter what language you speak, Vanguard has one consistent message and set of principles. Our primary
focus is on you, our clients. We conduct our business with integrity as a faithful steward of your assets. This message is shown
translated into seven languages, reflecting our expanding global presence.
Your Fund’s Performance at a Glance
• For the six months ended March 31, 2017, returns for the six Vanguard Institutional Target Retirement Funds covered in this report ranged from 1.44% for the Institutional Target Retirement Income Fund to 5.55% for the Institutional Target Retirement 2030 Fund. (The funds with retirement dates of 2035 through 2060 are covered in a separate report.) The funds with a greater allocation to stocks performed best.
• Each fund’s return was in line with its composite benchmark after expenses. Three funds surpassed the average return of their peers.
• Vanguard Institutional Target Retirement Funds are designed to reach an allocation of 70% bonds and 30% stocks within seven years after their target date.
• The 2010 Fund has been closed to new investors effective January 5, 2017. In the third quarter, the 2010 Fund is scheduled to merge with the Target Retirement Fund, as their asset allocations have become identical.
| Total Returns: Six Months Ended March 31, 2017 | |
| Total | |
| Returns | |
| Vanguard Institutional Target Retirement Income Fund | 1.44% |
| Target Income Composite Index | 1.49 |
| Mixed-Asset Target Today Funds Average | 1.86 |
| For a benchmark description, see the Glossary. | |
| Mixed-Asset Target Today Funds Average: Derived from data provided by Lipper, a Thomson Reuters Company. | |
| Vanguard Institutional Target Retirement 2010 Fund | 1.52% |
| Target 2010 Composite Index | 1.58 |
| Mixed-Asset Target 2010 Funds Average | 2.50 |
| For a benchmark description, see the Glossary. | |
| Mixed-Asset Target 2010 Funds Average: Derived from data provided by Lipper, a Thomson Reuters Company. | |
| Vanguard Institutional Target Retirement 2015 Fund | 2.88% |
| Target 2015 Composite Index | 2.96 |
| Mixed-Asset Target 2015 Funds Average | 2.93 |
| For a benchmark description, see the Glossary. | |
| Mixed-Asset Target 2015 Funds Average: Derived from data provided by Lipper, a Thomson Reuters Company. | |
1
| Total | |
| Returns | |
| Vanguard Institutional Target Retirement 2020 Fund | 3.93% |
| Target 2020 Composite Index | 3.99 |
| Mixed-Asset Target 2020 Funds Average | 3.04 |
| For a benchmark description, see the Glossary. | |
| Mixed-Asset Target 2020 Funds Average: Derived from data provided by Lipper, a Thomson Reuters Company. | |
| Vanguard Institutional Target Retirement 2025 Fund | 4.78% |
| Target 2025 Composite Index | 4.84 |
| Mixed-Asset Target 2025 Funds Average | 4.14 |
| For a benchmark description, see the Glossary. | |
| Mixed-Asset Target 2025 Funds Average: Derived from data provided by Lipper, a Thomson Reuters Company. | |
| Vanguard Institutional Target Retirement 2030 Fund | 5.55% |
| Target 2030 Composite Index | 5.67 |
| Mixed-Asset Target 2030 Funds Average | 5.02 |
| For a benchmark description, see the Glossary. | |
| Mixed-Asset Target 2030 Funds Average: Derived from data provided by Lipper, a Thomson Reuters Company. | |
Investments in Target Retirement Funds are subject to the risks of their underlying funds. The year in the fund name refers to the approximate year (the target date) when an investor in the fund would retire and leave the work force. The fund will gradually shift its emphasis from more aggressive investments to more conservative ones based on its target date. An investment in a Target Retirement Fund is not guaranteed at any time, including on or after the target date.
2
Chairman’s Perspective

Bill McNabb
Chairman and Chief Executive Officer
Dear Shareholder,
For many people, including me, falling interest rates have been the general trend in the bond market throughout our working lives. At the beginning of 1983, the year I graduated from business school, the yield of the benchmark 10-year U.S. Treasury note stood at more than 10%. It was less than 2.5% at the beginning of 2017.
Because bond prices move in the opposite direction from rates, my career happens to have overlapped with the greatest bull market for bonds in history.
It appears that may be changing. And, of course, there’s no shortage of advice about how to prepare for the shift.
Rates may be headed higher (really)
This bond bull market has reminded us time and again just how hard it is to predict when rates will rise or fall and by how much. If you follow bonds, you might recall the markets bracing for a sustained rate increase back in 2010 as the economy pulled out of recession, or again in 2013 when the Federal Reserve said it would start tapering its bond purchases, or again at the end of 2015 when the Fed raised short-term rates for the first time in almost a decade. And yet, prognostications notwithstanding, interest rates remained anchored near historical lows.
That said, rates seem to be on an upswing. With economic activity picking up, wages starting to move higher, and inflation coming
3
off recent lows, the Fed has nudged short-term rates higher twice in recent months and has signaled that further gradual increases are likely through 2018. The perceived pro-growth stance of the new U.S. administration also has played a role in framing a case for higher rates.
Short-term pain, longer-term gain
Bond investors are understandably concerned. If interest rates shoot up, the market value of bonds will drop sharply, with prices falling to bring yields in line with the new, prevailing higher rates. That’s the potential short-term pain. But long-term investors should actually want rates to go up. If you like bonds that pay 2%, you should love bonds that pay 4%, right?
There’s a simple—though imperfect—rule of thumb that helps make clear this point. If the time frame of your investing goal exceeds the time frame of your bond portfolio (a medium-term goal matched with short-term bonds, or a long-term goal paired with bonds not quite as long-term), rising rates will work out in your favor, maybe decidedly so.
Think of it this way: If you have a big cash need in the near future—say, a tuition bill coming due in a few years—and you own bonds that are long-term in nature, this time-frame mismatch could spell trouble if rates rise sharply; you’d be selling bonds that would be worth less. But if you’re saving to retire ten or 15 years down the road and rates are steadily rising, over time you’ll be earning higher and higher yields.
| Market Barometer | |||
| Total Returns | |||
| Periods Ended March 31, 2017 | |||
| Six | One | Five Years | |
| Months | Year | (Annualized) | |
| Stocks | |||
| Russell 1000 Index (Large-caps) | 10.09% | 17.43% | 13.26% |
| Russell 2000 Index (Small-caps) | 11.52 | 26.22 | 12.35 |
| Russell 3000 Index (Broad U.S. market) | 10.19 | 18.07 | 13.18 |
| FTSE All-World ex US Index (International) | 6.74 | 13.50 | 4.82 |
| Bonds | |||
| Bloomberg Barclays U.S. Aggregate Bond Index | |||
| (Broad taxable market) | -2.18% | 0.44% | 2.34% |
| Bloomberg Barclays Municipal Bond Index | |||
| (Broad tax-exempt market) | -2.10 | 0.15 | 3.24 |
| Citigroup Three-Month U.S. Treasury Bill Index | 0.21 | 0.34 | 0.10 |
| CPI | |||
| Consumer Price Index | 0.98% | 2.38% | 1.23% |
4
Josh Barrickman, our head of fixed income indexing for the Americas, calls it “the virtuous cycle of compounding interest at a higher rate.”
The bottom line is, you can end up better off than if rates haven’t risen because you’re earning more income, which over time more than washes away any price hit.
Beware of short-sighted, short-term moves
This logic can be difficult to grasp, tempting anxious bond investors to make drastic shifts to lessen the immediate pain of rising rates. Unfortunately, such moves can backfire.
Taking shelter in short-term bonds, for example, might seem like a good idea. Their prices generally hold up better than those of longer-term bonds in a rising-rate environment. But they also offer less income.
For example, when the market started worrying about rising rates in 2010, moving into short-term securities—and staying there—would have proved costly. Through 2016, those securities returned roughly half of what the broad U.S. bond market did.
Favoring high-yield bonds is another tack some investors take, expecting higher income to help cushion price declines.
| What has driven long-term returns for Vanguard bond funds? |
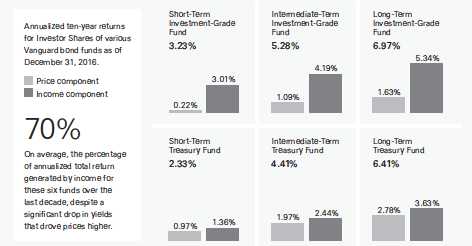
| Source: Vanguard. |
5
High-yield securities, however, typically perform best when stocks are rising, making them unlikely to zig when stocks zag.
We saw clear evidence of the correlation between stocks and high-yield bonds in the frantic markets following the United Kingdom’s vote to leave the European Union last year. From June 23 to June 27, both U.S. stocks and U.S. high-yield bonds lost ground. The broad U.S. bond market, meanwhile, climbed 1.2% as investors sought a safe haven.
Your portfolio is more than the sum of its parts
Different assets have different roles to play in a balanced and diversified portfolio. Stocks are valuable because they can produce higher returns over time, while bonds can provide a crucial counterweight to the volatility of stocks.
Perhaps the most important thing to keep in mind about bonds is that although their prices can fluctuate, they remain “fixed income” securities. Barring default, you can be certain of getting income until the bonds mature. It’s that income that drives returns for patient bond investors who resist the urge to jump in and out of the market, as you can see in the accompanying box.
A lot has changed since I first started following the bond market, but the important role that bonds can play in a balanced and diversified portfolio hasn’t.
As always, thank you for investing with Vanguard.
Sincerely,
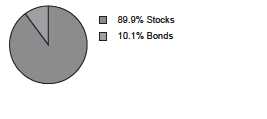
F. William McNabb III
Chairman and Chief Executive Officer
April 14, 2017
6
Institutional Target Retirement Income Fund
Fund Profile
As of March 31, 2017
| Total Fund Characteristics | |
| Ticker Symbol | VITRX |
| 30-Day SEC Yield | 1.85% |
| Acquired Fund Fees and Expenses1 | 0.09% |
| Allocation to Underlying Vanguard Funds | |
| Vanguard Total Bond Market II Index Fund | |
| Investor Shares | 37.3% |
| Vanguard Total Stock Market Index Fund | |
| Institutional Shares | 18.0 |
| Vanguard Short-Term Inflation-Protected | |
| Securities Index Fund Admiral Shares | 16.8 |
| Vanguard Total International Bond Index | |
| Fund Admiral Shares | 15.9 |
| Vanguard Total International Stock Index | |
| Fund Investor Shares | 12.0 |
Fund Asset Allocation
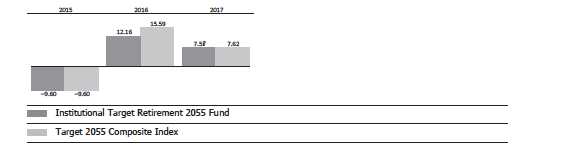
1 This figure—drawn from the prospectus dated January 27, 2017—represents an estimate of the weighted average of the expense ratios and any
transaction fees charged by the underlying mutual funds (the ”acquired” funds) in which the Institutional Target Retirement Income Fund invests. The
fund does not charge any expenses or fees of its own. For the six months ended March 31, 2017, the annualized acquired fund fees and expenses
were 0.09%.
7
Institutional Target Retirement Income Fund
Performance Summary
All of the returns in this report represent past performance, which is not a guarantee of future results that may be achieved by the fund. (Current performance may be lower or higher than the performance data cited. For performance data current to the most recent month-end, visit our website at vanguard.com/performance.) Note, too, that both investment returns and principal value can fluctuate widely, so an investor’s shares, when sold, could be worth more or less than their original cost. The returns shown do not reflect taxes that a shareholder would pay on fund distributions or on the sale of fund shares.
Fiscal-Year Total Returns (%): June 26, 2015, Through March 31, 2017
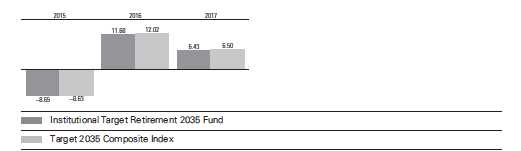
For a benchmark description, see the Glossary.
Note: For 2017, performance data reflect the six months ended March 31, 2017.
| Average Annual Total Returns: Period Ended March 31, 2017 | |||||
| Since Inception | |||||
| Inception Date | One Year | Income | Capital | Total | |
| Institutional Target | |||||
| Retirement Income Fund | 6/26/2015 | 5.48% | 1.78% | 1.89% | 3.67% |
See Financial Highlights for dividend and capital gains information.
8
Institutional Target Retirement Income Fund
Financial Statements (unaudited)
Statement of Net Assets
As of March 31, 2017
The fund reports a complete list of its holdings in regulatory filings four times in each fiscal year, at the quarter-ends. For the second and fourth fiscal quarters, the lists appear in the fund’s semiannual and annual reports to shareholders. For the first and third fiscal quarters, the fund files the lists with the Securities and Exchange Commission on Form N-Q. Shareholders can look up the fund’s Forms N-Q on the SEC’s website at sec.gov. Forms N-Q may also be reviewed and copied at the SEC’s Public Reference Room (see the back cover of this report for further information).
| Market | ||
| Value• | ||
| Shares | ($000) | |
| Investment Companies (100.0%) | ||
| U.S. Stock Fund (18.0%) | ||
| Vanguard Total Stock Market Index Fund Institutional Shares | 7,322,903 | 432,564 |
| International Stock Fund (12.0%) | ||
| Vanguard Total International Stock Index Fund Investor Shares | 18,192,968 | 289,632 |
| U.S. Bond Funds (54.1%) | ||
| 1 Vanguard Total Bond Market II Index Fund Investor Shares | 84,432,966 | 898,367 |
| Vanguard Short-Term Inflation-Protected Securities Index Fund Admiral Shares | 16,263,955 | 403,509 |
| 1,301,876 | ||
| International Bond Fund (15.9%) | ||
| Vanguard Total International Bond Index Fund Admiral Shares | 17,744,533 | 383,459 |
| Total Investment Companies (Cost $2,328,165) | 2,407,531 | |
| Temporary Cash Investment (0.0%) | ||
| Money Market Fund (0.0%) | ||
| 1 Vanguard Market Liquidity Fund, 0.965% (Cost $—) | 3 | — |
| Total Investments (100.0%) (Cost $2,328,165) | 2,407,531 | |
| Other Assets and Liabilities (0.0%) | ||
| Other Assets | 9,493 | |
| Liabilities | (9,854) | |
| (361) | ||
| Net Assets (100%) | ||
| Applicable to 116,517,055 outstanding $.001 par value shares of | ||
| beneficial interest (unlimited authorization) | 2,407,170 | |
| Net Asset Value Per Share | $20.66 | |
9
Institutional Target Retirement Income Fund
| Amount | |
| ($000) | |
| Statement of Assets and Liabilities | |
| Assets | |
| Investments in Securities, at Value—Affiliated Vanguard Funds | 2,407,531 |
| Receivables for Accrued Income | 2,162 |
| Receivables for Capital Shares Issued | 7,331 |
| Total Assets | 2,417,024 |
| Liabilities | |
| Payables for Investment Securities Purchased | 8,345 |
| Payables for Capital Shares Redeemed | 1,023 |
| Other Liabilities | 486 |
| Total Liabilities | 9,854 |
| Net Assets | 2,407,170 |
| At March 31, 2017, net assets consisted of: | |
| Amount | |
| ($000) | |
| Paid-in Capital | 2,325,347 |
| Undistributed Net Investment Income | 752 |
| Accumulated Net Realized Gains | 1,705 |
| Unrealized Appreciation (Depreciation) | 79,366 |
| Net Assets | 2,407,170 |
• See Note A in Notes to Financial Statements.
1 Affiliated fund available only to Vanguard funds and certain trusts and accounts managed by Vanguard. Rate shown for Vanguard Market
Liquidity Fund is the 7-day yield.
See accompanying Notes, which are an integral part of the Financial Statements.
10
Institutional Target Retirement Income Fund
Statement of Operations
| Six Months Ended | |
| March 31, 2017 | |
| ($000) | |
| Investment Income | |
| Income | |
| Income Distributions Received from Affiliated Funds | 23,645 |
| Net Investment Income—Note B | 23,645 |
| Realized Net Gain (Loss) | |
| Capital Gain Distributions Received from Affiliated Funds | 844 |
| Affiliated Investment Securities Sold | 1,562 |
| Realized Net Gain (Loss) | 2,406 |
| Change in Unrealized Appreciation (Depreciation) of Investment Securities | 9,440 |
| Net Increase (Decrease) in Net Assets Resulting from Operations | 35,491 |
See accompanying Notes, which are an integral part of the Financial Statements.
11
Institutional Target Retirement Income Fund
Statement of Changes in Net Assets
| Six Months Ended | Year Ended | |
| March 31, | September 30, | |
| 2017 | 2016 | |
| ($000) | ($000) | |
| Increase (Decrease) in Net Assets | ||
| Operations | ||
| Net Investment Income | 23,645 | 28,797 |
| Realized Net Gain (Loss) | 2,406 | 661 |
| Change in Unrealized Appreciation (Depreciation) | 9,440 | 87,221 |
| Net Increase (Decrease) in Net Assets Resulting from Operations | 35,491 | 116,679 |
| Distributions | ||
| Net Investment Income | (24,391) | (27,795) |
| Realized Capital Gain1 | (952) | (68) |
| Total Distributions | (25,343) | (27,863) |
| Capital Share Transactions | ||
| Issued | 562,838 | 1,311,304 |
| Issued in Lieu of Cash Distributions | 25,135 | 27,701 |
| Redeemed | (221,451) | (240,274) |
| Net Increase (Decrease) from Capital Share Transactions | 366,522 | 1,098,731 |
| Total Increase (Decrease) | 376,670 | 1,187,547 |
| Net Assets | ||
| Beginning of Period | 2,030,500 | 842,953 |
| End of Period2 | 2,407,170 | 2,030,500 |
| 1 Includes fiscal 2017 and 2016 short-term gain distributions totaling $688,000 and $68,000, respectively. Short-term gain distributions | ||
| are treated as ordinary income dividends for tax purposes. | ||
| 2 Net Assets—End of Period includes undistributed (overdistributed) net investment income of $752,000 and $1,498,000. | ||
See accompanying Notes, which are an integral part of the Financial Statements.
12
Institutional Target Retirement Income Fund
Financial Highlights
| Six Months | Year | June 26, | |
| Ended | Ended | 20151 to | |
| March 31, | Sept. 30, | Sept. 30, | |
| For a Share Outstanding Throughout Each Period | 2017 | 2016 | 2015 |
| Net Asset Value, Beginning of Period | $20.60 | $19.46 | $20.00 |
| Investment Operations | |||
| Net Investment Income | . 235 | . 341 | .1112 |
| Capital Gain Distributions Received | .004 | .010 | — |
| Net Realized and Unrealized Gain (Loss) on Investments | .054 | 1.127 | (.599) |
| Total from Investment Operations | .293 | 1.478 | (.488) |
| Distributions | |||
| Dividends from Net Investment Income | (. 224) | (. 337) | (. 052) |
| Distributions from Realized Capital Gains | (.009) | (.001) | — |
| Total Distributions | (. 233) | (. 338) | (. 052) |
| Net Asset Value, End of Period | $20.66 | $20.60 | $19.46 |
| Total Return | 1.44% | 7.66% | -2.44% |
| Ratios/Supplemental Data | |||
| Net Assets, End of Period (Millions) | $2,407 | $2,031 | $843 |
| Ratio of Total Expenses to Average Net Assets | — | — | — |
| Acquired Fund Fees and Expenses | 0.09% | 0.09% | 0.10%3 |
| Ratio of Net Investment Income to Average Net Assets | 2.16% | 1.83% | 1.99%3 |
| Portfolio Turnover Rate | 11% | 7% | 1% |
| The expense ratio, acquired fund fees and expenses, net investment income ratio, and turnover rate for the current period have been annualized. | |||
| 1 Inception. | |||
| 2 Calculated based on average shares outstanding. | |||
| 3 Annualized. | |||
See accompanying Notes, which are an integral part of the Financial Statements.
13
Institutional Target Retirement Income Fund
Notes to Financial Statements
Vanguard Institutional Target Retirement Income Fund is registered under the Investment Company Act of 1940 as an open-end investment company, or mutual fund. The fund follows a balanced investment strategy by investing in selected Vanguard funds to achieve its targeted allocation of assets to U.S. and international stocks, and U.S. and international bonds. Financial statements and other information about each underlying fund are available on vanguard.com.
A. The following significant accounting policies conform to generally accepted accounting principles for U.S. investment companies. The fund consistently follows such policies in preparing its financial statements.
1. Security Valuation: Investments are valued at the net asset value of each underlying Vanguard fund determined as of the close of the New York Stock Exchange (generally 4 p.m., Eastern time) on the valuation date.
2. Federal Income Taxes: The fund intends to continue to qualify as a regulated investment company and distribute all of its taxable income. Management has analyzed the fund’s tax positions taken for all open federal income tax years (September 30, 2015–2016), and for the period ended March 31, 2017, and has concluded that no provision for federal income tax is required in the fund’s financial statements.
3. Distributions: Distributions to shareholders are recorded on the ex-dividend date.
4. Credit Facility: The fund and certain other funds managed by The Vanguard Group (“Vanguard”) participate in a $3.1 billion committed credit facility provided by a syndicate of lenders pursuant to a credit agreement that may be renewed annually; each fund is individually liable for its borrowings, if any, under the credit facility. Borrowings may be utilized for temporary and emergency purposes, and are subject to the fund’s regulatory and contractual borrowing restrictions. The participating funds are charged administrative fees and an annual commitment fee of 0.10% of the undrawn amount of the facility; these fees are allocated to the funds based on a method approved by the fund’s board of trustees and borne by the funds in which the fund invests (see Note B). Any borrowings under this facility bear interest at a rate based upon the higher of the one-month London Interbank Offered Rate, federal funds effective rate, or overnight bank funding rate plus an agreed-upon spread.
The fund had no borrowings outstanding at March 31, 2017, or at any time during the period then ended.
5. Other: Income and capital gain distributions received are recorded on the ex-dividend date. Security transactions are accounted for on the date securities are bought or sold. Costs used to determine realized gains (losses) on the sale of investment securities are those of the specific securities sold.
B. In accordance with the terms of a Funds’ Service Agreement (the “FSA”) between Vanguard and the fund, Vanguard furnishes to the fund investment advisory, corporate management, administrative, marketing, and distribution services at Vanguard’s cost of operations (as defined by the FSA). These costs of operations are allocated to the fund based on methods and guidelines approved by the board of trustees. The FSA provides that expenses otherwise allocable to Vanguard funds-of-funds may be reduced or eliminated to the extent of savings realized by the underlying Vanguard funds by virtue of being part of a fund-of-funds. Accordingly, all expenses for services provided by Vanguard to the fund and all other expenses incurred by the fund during the period ended March 31, 2017, were borne by the underlying Vanguard funds in which the fund invests. The fund’s trustees and officers are also trustees and officers, respectively, of the underlying Vanguard funds, as well as directors and employees, respectively, of Vanguard.
14
Institutional Target Retirement Income Fund
C. Various inputs may be used to determine the value of the fund’s investments. These inputs are summarized in three broad levels for financial statement purposes. The inputs or methodologies used to value securities are not necessarily an indication of the risk associated with investing in those securities.
Level 1—Quoted prices in active markets for identical securities.
Level 2—Other significant observable inputs (including quoted prices for similar securities, interest rates, prepayment speeds, credit risk, etc.).
Level 3—Significant unobservable inputs (including the fund’s own assumptions used to determine the fair value of investments).
At March 31, 2017, 100% of the market value of the fund’s investments was determined based on Level 1 inputs.
D. Distributions are determined on a tax basis and may differ from net investment income and realized capital gains for financial reporting purposes. Differences may be permanent or temporary. Permanent differences are reclassified among capital accounts in the financial statements to reflect their tax character. Temporary differences arise when certain items of income, expense, gain, or loss are recognized in different periods for financial statement and tax purposes. These differences will reverse at some time in the future. Differences in classification may also result from the treatment of short-term gains as ordinary income for tax purposes. The fund’s tax-basis capital gains and losses are determined only at the end of each fiscal year.
At March 31, 2017, the cost of investment securities for tax purposes was $2,328,165,000. Net unrealized appreciation of investment securities for tax purposes was $79,366,000, consisting of unrealized gains of $87,544,000 on securities that had risen in value since their purchase and $8,178,000 in unrealized losses on securities that had fallen in value since their purchase.
E. Capital shares issued and redeemed were:
| Six Months Ended | Year Ended | |
| March 31, 2017 | September 30, 2016 | |
| Shares | Shares | |
| (000) | (000) | |
| Issued | 27,574 | 65,895 |
| Issued in Lieu of Cash Distributions | 1,236 | 1,381 |
| Redeemed | (10,839) | (12,038) |
| Net Increase (Decrease) in Shares Outstanding | 17,971 | 55,238 |
At March 31, 2017, one shareholder was the record of beneficial owner of 27% of the fund’s net assets. If the shareholder were to redeem its investment in the fund, the redemption might lead to the realization of taxable capital gains.
15
Institutional Target Retirement Income Fund
F. Transactions during the period in affiliated underlying Vanguard funds were as follows:
| Current Period Transactions | ||||||
| Sept. 30, | Proceeds | March 31, | ||||
| 2016 | from | Capital Gain | 2017 | |||
| Market | Purchases | Securities | Distributions | Market | ||
| Value | at Cost | Sold | Income | Received | Value | |
| ($000) | ($000) | ($000) | ($000) | ($000) | ($000) | |
| Vanguard Market Liquidity Fund | — | NA1 | NA1 | 2 | — | — |
| Vanguard Short-Term | ||||||
| Inflation-Protected Securities | ||||||
| Index Fund | 338,055 | 71,971 | 5,932 | 2,620 | — | 403,509 |
| Vanguard Total Bond Market II | ||||||
| Index Fund | 750,039 | 212,438 | 36,666 | 9,582 | 844 | 898,367 |
| Vanguard Total International | ||||||
| Bond Index Fund | 328,408 | 65,986 | 206 | 4,146 | — | 383,459 |
| Vanguard Total International | ||||||
| Stock Index Fund | 242,762 | 46,752 | 14,696 | 2,993 | — | 289,632 |
| Vanguard Total Stock Market | ||||||
| Index Fund | 365,313 | 90,560 | 58,255 | 4,302 | — | 432,564 |
| Total | 2,024,577 | 487,707 | 115,755 | 23,645 | 844 | 2,407,531 |
| 1 Not applicable—purchases and sales are for temporary cash investment purposes. | ||||||
G. In December 2016, the fund’s board of trustees approved a plan of reorganization of Vanguard Institutional Target Retirement 2010 Fund into Vanguard Institutional Target Retirement Income Fund. The reorganization does not require shareholder approval. Shares of Vanguard Institutional Target Retirement 2010 Fund will be exchanged for new shares of Vanguard Institutional Target Retirement Income Fund. The reorganization is expected to qualify as a tax-free reorganization for federal income tax purposes, and to be completed in July 2017. In anticipation of the reorganization, Vanguard Institutional Target Retirement 2010 Fund has been closed to new accounts.
Management has determined that no other material events or transactions occurred subsequent to March 31, 2017, that would require recognition or disclosure in these financial statements.
16
Institutional Target Retirement 2010 Fund
Fund Profile
As of March 31, 2017
| Total Fund Characteristics | |
| Ticker Symbol | VIRTX |
| 30-Day SEC Yield | 1.85% |
| Acquired Fund Fees and Expenses1 | 0.09% |
| Allocation to Underlying Vanguard Funds | |
| Vanguard Total Bond Market II Index Fund | |
| Investor Shares | 37.1% |
| Vanguard Total Stock Market Index Fund | |
| Institutional Shares | 18.3 |
| Vanguard Short-Term Inflation-Protected | |
| Securities Index Fund Admiral Shares | 16.6 |
| Vanguard Total International Bond Index | |
| Fund Admiral Shares | 15.9 |
| Vanguard Total International Stock Index | |
| Fund Investor Shares | 12.1 |
Fund Asset Allocation
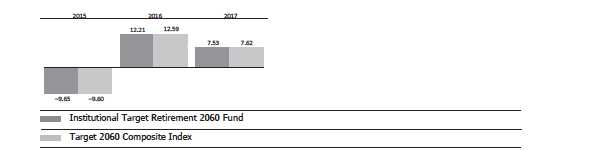
1 This figure—drawn from the prospectus dated January 27, 2017—represents an estimate of the weighted average of the expense ratios and any transaction fees charged by the underlying mutual funds (the ”acquired” funds) in which the Institutional Target Retirement 2010 Fund invests. The fund does not charge any expenses or fees of its own. For the six months ended March 31, 2017, the annualized acquired fund fees and expenses were 0.09%.
17
Institutional Target Retirement 2010 Fund
Performance Summary
All of the returns in this report represent past performance, which is not a guarantee of future results that may be achieved by the fund. (Current performance may be lower or higher than the performance data cited. For performance data current to the most recent month-end, visit our website at vanguard.com/performance.) Note, too, that both investment returns and principal value can fluctuate widely, so an investor’s shares, when sold, could be worth more or less than their original cost. The returns shown do not reflect taxes that a shareholder would pay on fund distributions or on the sale of fund shares.
Fiscal-Year Total Returns (%): June 26, 2015, Through March 31, 2017

For a benchmark description, see the Glossary.
Note: For 2017, performance data reflect the six months ended March 31, 2017.
| Average Annual Total Returns: Period Ended March 31, 2017 | |||||
| Since Inception | |||||
| Inception Date | One Year | Income | Capital | Total | |
| Institutional Target | |||||
| Retirement 2010 Fund | 6/26/2015 | 5.64% | 1.43% | 2.06% | 3.49% |
See Financial Highlights for dividend and capital gains information.
18
Institutional Target Retirement 2010 Fund
Financial Statements (unaudited)
Statement of Net Assets
As of March 31, 2017
The fund reports a complete list of its holdings in regulatory filings four times in each fiscal year, at the quarter-ends. For the second and fourth fiscal quarters, the lists appear in the fund’s semiannual and annual reports to shareholders. For the first and third fiscal quarters, the fund files the lists with the Securities and Exchange Commission on Form N-Q. Shareholders can look up the fund’s Forms N-Q on the SEC’s website at sec.gov. Forms N-Q may also be reviewed and copied at the SEC’s Public Reference Room (see the back cover of this report for further information).
| Market | ||
| Value• | ||
| Shares | ($000) | |
| Investment Companies (100.0%) | ||
| U.S. Stock Fund (18.3%) | ||
| Vanguard Total Stock Market Index Fund Institutional Shares | 6,272,841 | 370,537 |
| International Stock Fund (12.1%) | ||
| Vanguard Total International Stock Index Fund Investor Shares | 15,433,201 | 245,697 |
| U.S. Bond Funds (53.7%) | ||
| 1 Vanguard Total Bond Market II Index Fund Investor Shares | 70,697,998 | 752,227 |
| Vanguard Short-Term Inflation-Protected Securities Index Fund Admiral Shares | 13,543,826 | 336,022 |
| 1,088,249 | ||
| International Bond Fund (15.9%) | ||
| Vanguard Total International Bond Index Fund Admiral Shares | 14,879,545 | 321,547 |
| Total Investment Companies (Cost $1,954,597) | 2,026,030 | |
| Temporary Cash Investment (0.0%) | ||
| Money Market Fund (0.0%) | ||
| 1 Vanguard Market Liquidity Fund, 0.965% (Cost $—) | 3 | — |
| Total Investments (100.0%) (Cost $1,954,597) | 2,026,030 | |
| Other Assets and Liabilities (0.0%) | ||
| Other Assets | 7,000 | |
| Liabilities | (6,566) | |
| 434 | ||
| Net Assets (100%) | ||
| Applicable to 97,795,153 outstanding $.001 par value shares of | ||
| beneficial interest (unlimited authorization) | 2,026,464 | |
| Net Asset Value Per Share | $20.72 | |
19
Institutional Target Retirement 2010 Fund
| Amount | |
| ($000) | |
| Statement of Assets and Liabilities | |
| Assets | |
| Investments in Securities, at Value—Affiliated Vanguard Funds | 2,026,030 |
| Receivables for Accrued Income | 1,822 |
| Receivables for Capital Shares Issued | 5,178 |
| Total Assets | 2,033,030 |
| Liabilities | |
| Payables for Investment Securities Purchased | 4,347 |
| Payables for Capital Shares Redeemed | 1,022 |
| Other Liabilities | 1,197 |
| Total Liabilities | 6,566 |
| Net Assets | 2,026,464 |
| At March 31, 2017, net assets consisted of: | |
| Amount | |
| ($000) | |
| Paid-in Capital | 1,945,939 |
| Undistributed Net Investment Income | 7,583 |
| Accumulated Net Realized Gains | 1,509 |
| Unrealized Appreciation (Depreciation) | 71,433 |
| Net Assets | 2,026,464 |
• See Note A in Notes to Financial Statements.
1 Affiliated fund available only to Vanguard funds and certain trusts and accounts managed by Vanguard. Rate shown for Vanguard Market
Liquidity Fund is the 7-day yield.
See accompanying Notes, which are an integral part of the Financial Statements.
20
Institutional Target Retirement 2010 Fund
Statement of Operations
| Six Months Ended | |
| March 31, 2017 | |
| ($000) | |
| Investment Income | |
| Income | |
| Income Distributions Received from Affiliated Funds | 20,923 |
| Net Investment Income—Note B | 20,923 |
| Realized Net Gain (Loss) | |
| Capital Gain Distributions Received from Affiliated Funds | 735 |
| Affiliated Investment Securities Sold | 1,457 |
| Realized Net Gain (Loss) | 2,192 |
| Change in Unrealized Appreciation (Depreciation) of Investment Securities | 8,263 |
| Net Increase (Decrease) in Net Assets Resulting from Operations | 31,378 |
See accompanying Notes, which are an integral part of the Financial Statements.
21
Institutional Target Retirement 2010 Fund
Statement of Changes in Net Assets
| Six Months Ended | Year Ended | |
| March 31, | September 30, | |
| 2017 | 2016 | |
| ($000) | ($000) | |
| Increase (Decrease) in Net Assets | ||
| Operations | ||
| Net Investment Income | 20,923 | 26,448 |
| Realized Net Gain (Loss) | 2,192 | 336 |
| Change in Unrealized Appreciation (Depreciation) | 8,263 | 81,605 |
| Net Increase (Decrease) in Net Assets Resulting from Operations | 31,378 | 108,389 |
| Distributions | ||
| Net Investment Income | (33,043) | (8,112) |
| Realized Capital Gain1 | (879) | (179) |
| Total Distributions | (33,922) | (8,291) |
| Capital Share Transactions | ||
| Issued | 387,368 | 1,160,101 |
| Issued in Lieu of Cash Distributions | 33,829 | 8,286 |
| Redeemed | (230,013) | (215,491) |
| Net Increase (Decrease) from Capital Share Transactions | 191,184 | 952,896 |
| Total Increase (Decrease) | 188,640 | 1,052,994 |
| Net Assets | ||
| Beginning of Period | 1,837,824 | 784,830 |
| End of Period2 | 2,026,464 | 1,837,824 |
| 1 Includes fiscal 2017 and 2016 short-term gain distributions totaling $565,000 and $119,000, respectively. Short-term gain distributions | ||
| are treated as ordinary income dividends for tax purposes. | ||
| 2 Net Assets—End of Period includes undistributed (overdistributed) net investment income of $7,583,000 and $19,693,000. | ||
See accompanying Notes, which are an integral part of the Financial Statements.
22
Institutional Target Retirement 2010 Fund
Financial Highlights
| Six Months | Year | June 26, | |
| Ended | Ended | 20151 to | |
| March 31, | Sept. 30, | Sept. 30, | |
| For a Share Outstanding Throughout Each Period | 2017 | 2016 | 2015 |
| Net Asset Value, Beginning of Period | $20.78 | $19.40 | $20.00 |
| Investment Operations | |||
| Net Investment Income | . 212 | . 376 2 | .1152 |
| Capital Gain Distributions Received | .007 | .009 2 | — |
| Net Realized and Unrealized Gain (Loss) on Investments | .088 | 1.134 | (.715) |
| Total from Investment Operations | .307 | 1.519 | (.600) |
| Distributions | |||
| Dividends from Net Investment Income | (.357) | (.136) | — |
| Distributions from Realized Capital Gains | (.010) | (.003) | — |
| Total Distributions | (.367) | (.139) | — |
| Net Asset Value, End of Period | $20.72 | $20.78 | $19.40 |
| Total Return | 1.52% | 7.87% | -3.00% |
| Ratios/Supplemental Data | |||
| Net Assets, End of Period (Millions) | $2,026 | $1,838 | $785 |
| Ratio of Total Expenses to Average Net Assets | — | — | — |
| Acquired Fund Fees and Expenses | 0.09% | 0.09% | 0.10%3 |
| Ratio of Net Investment Income to Average Net Assets | 2.16% | 1.86% | 2.02%3 |
| Portfolio Turnover Rate | 13% | 8% | 3% |
| The expense ratio, acquired fund fees and expenses, net investment income ratio, and turnover rate for the current period have been annualized. | |||
| 1 Inception. | |||
| 2 Calculated based on average shares outstanding. | |||
| 3 Annualized. | |||
See accompanying Notes, which are an integral part of the Financial Statements.
23
Institutional Target Retirement 2010 Fund
Notes to Financial Statements
Vanguard Institutional Target Retirement 2010 Fund is registered under the Investment Company Act of 1940 as an open-end investment company, or mutual fund. The fund follows a balanced investment strategy by investing in selected Vanguard funds to achieve its targeted allocation of assets to U.S. and international stocks, and U.S. and international bonds. Financial statements and other information about each underlying fund are available on vanguard.com.
A. The following significant accounting policies conform to generally accepted accounting principles for U.S. investment companies. The fund consistently follows such policies in preparing its financial statements.
1. Security Valuation: Investments are valued at the net asset value of each underlying Vanguard fund determined as of the close of the New York Stock Exchange (generally 4 p.m., Eastern time) on the valuation date.
2. Federal Income Taxes: The fund intends to continue to qualify as a regulated investment company and distribute all of its taxable income. Management has analyzed the fund’s tax positions taken for all open federal income tax years (September 30, 2015–2016), and for the period ended March 31, 2017, and has concluded that no provision for federal income tax is required in the fund’s financial statements.
3. Distributions: Distributions to shareholders are recorded on the ex-dividend date.
4. Credit Facility: The fund and certain other funds managed by The Vanguard Group (“Vanguard”) participate in a $3.1 billion committed credit facility provided by a syndicate of lenders pursuant to a credit agreement that may be renewed annually; each fund is individually liable for its borrowings, if any, under the credit facility. Borrowings may be utilized for temporary and emergency purposes, and are subject to the fund’s regulatory and contractual borrowing restrictions. The participating funds are charged administrative fees and an annual commitment fee of 0.10% of the undrawn amount of the facility; these fees are allocated to the funds based on a method approved by the fund’s board of trustees and borne by the funds in which the fund invests (see Note B). Any borrowings under this facility bear interest at a rate based upon the higher of the one-month London Interbank Offered Rate, federal funds effective rate, or overnight bank funding rate plus an agreed-upon spread.
The fund had no borrowings outstanding at March 31, 2017, or at any time during the period then ended.
5. Other: Income and capital gain distributions received are recorded on the ex-dividend date. Security transactions are accounted for on the date securities are bought or sold. Costs used to determine realized gains (losses) on the sale of investment securities are those of the specific securities sold.
B. In accordance with the terms of a Funds’ Service Agreement (the “FSA”) between Vanguard and the fund, Vanguard furnishes to the fund investment advisory, corporate management, administrative, marketing, and distribution services at Vanguard’s cost of operations (as defined by the FSA). These costs of operations are allocated to the fund based on methods and guidelines approved by the board of trustees. The FSA provides that expenses otherwise allocable to Vanguard funds-of-funds may be reduced or eliminated to the extent of savings realized by the underlying Vanguard funds by virtue of being part of a fund-of-funds. Accordingly, all expenses for services provided by Vanguard to the fund and all other expenses incurred by the fund during the period ended March 31, 2017, were borne by the underlying Vanguard funds in which the fund invests. The fund’s trustees and officers are also trustees and officers, respectively, of the underlying Vanguard funds, as well as directors and employees, respectively, of Vanguard.
24
Institutional Target Retirement 2010 Fund
C. Various inputs may be used to determine the value of the fund’s investments. These inputs are summarized in three broad levels for financial statement purposes. The inputs or methodologies used to value securities are not necessarily an indication of the risk associated with investing in those securities.
Level 1—Quoted prices in active markets for identical securities.
Level 2—Other significant observable inputs (including quoted prices for similar securities, interest rates, prepayment speeds, credit risk, etc.).
Level 3—Significant unobservable inputs (including the fund’s own assumptions used to determine the fair value of investments).
At March 31, 2017, 100% of the market value of the fund’s investments was determined based on Level 1 inputs.
D. Distributions are determined on a tax basis and may differ from net investment income and realized capital gains for financial reporting purposes. Differences may be permanent or temporary. Permanent differences are reclassified among capital accounts in the financial statements to reflect their tax character. Temporary differences arise when certain items of income, expense, gain, or loss are recognized in different periods for financial statement and tax purposes. These differences will reverse at some time in the future. Differences in classification may also result from the treatment of short-term gains as ordinary income for tax purposes. The fund’s tax-basis capital gains and losses are determined only at the end of each fiscal year.
At March 31, 2017, the cost of investment securities for tax purposes was $1,954,597,000. Net unrealized appreciation of investment securities for tax purposes was $71,433,000, consisting of unrealized gains of $79,702,000 on securities that had risen in value since their purchase and $8,269,000 in unrealized losses on securities that had fallen in value since their purchase.
E. Capital shares issued and redeemed were:
| Six Months Ended | Year Ended | |
| March 31, 2017 | September 30, 2016 | |
| Shares | Shares | |
| (000) | (000) | |
| Issued | 18,915 | 58,314 |
| Issued in Lieu of Cash Distributions | 1,677 | 422 |
| Redeemed | (11,224) | (10,770) |
| Net Increase (Decrease) in Shares Outstanding | 9,368 | 47,966 |
At March 31, 2017, one shareholder was the record or beneficial owner of 34% of the fund’s net assets. If the shareholder were to redeem its investment in the fund, the redemption might lead to the realization of taxable capital gains.
25
Institutional Target Retirement 2010 Fund
F. Transactions during the period in affiliated underlying Vanguard funds were as follows:
| Current Period Transactions | ||||||
| Sept. 30, | Proceeds | March 31, | ||||
| 2016 | from | Capital Gain | 2017 | |||
| Market | Purchases | Securities | Distributions | Market | ||
| Value | at Cost | Sold | Income | Received | Value | |
| ($000) | ($000) | ($000) | ($000) | ($000) | ($000) | |
| Vanguard Market Liquidity Fund | — | NA1 | NA1 | 2 | — | — |
| Vanguard Short-Term | ||||||
| Inflation-Protected Securities | ||||||
| Index Fund | 288,516 | 55,649 | 7,517 | 2,288 | — | 336,022 |
| Vanguard Total Bond Market II | ||||||
| Index Fund | 663,486 | 147,860 | 34,298 | 8,336 | 735 | 752,227 |
| Vanguard Total International | ||||||
| Bond Index Fund | 293,388 | 37,823 | — | 3,639 | — | 321,547 |
| Vanguard Total International | ||||||
| Stock Index Fund | 234,362 | 23,858 | 25,301 | 2,750 | — | 245,697 |
| Vanguard Total Stock Market | ||||||
| Index Fund | 349,764 | 47,211 | 58,491 | 3,908 | — | 370,537 |
| Total | 1,829,516 | 312,401 | 125,607 | 20,923 | 735 | 2,026,030 |
| 1 Not applicable—purchases and sales are for temporary cash investment purposes. | ||||||
G. In December 2016, the fund’s board of trustees approved a plan of reorganization of Vanguard Institutional Target Retirement 2010 Fund into Vanguard Institutional Target Retirement Income Fund. The reorganization does not require shareholder approval. Shares of Vanguard Institutional Target Retirement 2010 Fund will be exchanged for new shares of Vanguard Institutional Target Retirement Income Fund. The reorganization is expected to qualify as a tax-free reorganization for federal income tax purposes, and to be completed in July 2017. In anticipation of the reorganization, Vanguard Institutional Target Retirement 2010 Fund has been closed to new accounts.
Management has determined that no other material events or transactions occurred subsequent to March 31, 2017, that would require recognition or disclosure in these financial statements.
26
Institutional Target Retirement 2015 Fund
Fund Profile
As of March 31, 2017
| Total Fund Characteristics | |
| Ticker Symbol | VITVX |
| 30-Day SEC Yield | 1.96% |
| Acquired Fund Fees and Expenses1 | 0.09% |
| Allocation to Underlying Vanguard Funds | |
| Vanguard Total Bond Market II Index Fund | |
| Investor Shares | 31.6% |
| Vanguard Total Stock Market Index Fund | |
| Institutional Shares | 26.7 |
| Vanguard Total International Stock Index | |
| Fund Investor Shares | 18.0 |
| Vanguard Total International Bond Index | |
| Fund Admiral Shares | 13.4 |
| Vanguard Short-Term Inflation-Protected | |
| Securities Index Fund Admiral Shares | 10.3 |
Fund Asset Allocation

1 This figure—drawn from the prospectus dated January 27, 2017—represents an estimate of the weighted average of the expense ratios and any
transaction fees charged by the underlying mutual funds (the ”acquired” funds) in which the Institutional Target Retirement 2015 Fund invests. The
fund does not charge any expenses or fees of its own. For the six months ended March 31, 2017, the annualized acquired fund fees and expenses
were 0.09%.
27
Institutional Target Retirement 2015 Fund
Performance Summary
All of the returns in this report represent past performance, which is not a guarantee of future results that may be achieved by the fund. (Current performance may be lower or higher than the performance data cited. For performance data current to the most recent month-end, visit our website at vanguard.com/performance.) Note, too, that both investment returns and principal value can fluctuate widely, so an investor’s shares, when sold, could be worth more or less than their original cost. The returns shown do not reflect taxes that a shareholder would pay on fund distributions or on the sale of fund shares.
Fiscal-Year Total Returns (%): June 26, 2015, Through March 31, 2017
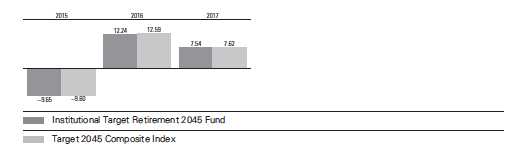
For a benchmark description, see the Glossary.
Note: For 2017, performance data reflect the six months ended March 31, 2017.
| Average Annual Total Returns: Period Ended March 31, 2017 | |||||
| Since Inception | |||||
| Inception Date | One Year | Income | Capital | Total | |
| Institutional Target | |||||
| Retirement 2015 Fund | 6/26/2015 | 7.79% | 1.55% | 2.37% | 3.92% |
See Financial Highlights for dividend and capital gains information.
28
Institutional Target Retirement 2015 Fund
Financial Statements (unaudited)
Statement of Net Assets
As of March 31, 2017
The fund reports a complete list of its holdings in regulatory filings four times in each fiscal year, at the quarter-ends. For the second and fourth fiscal quarters, the lists appear in the fund’s semiannual and annual reports to shareholders. For the first and third fiscal quarters, the fund files the lists with the Securities and Exchange Commission on Form N-Q. Shareholders can look up the fund’s Forms N-Q on the SEC’s website at sec.gov. Forms N-Q may also be reviewed and copied at the SEC’s Public Reference Room (see the back cover of this report for further information).
| Market | ||
| Value• | ||
| Shares | ($000) | |
| Investment Companies (100.0%) | ||
| U.S. Stock Fund (26.7%) | ||
| Vanguard Total Stock Market Index Fund Institutional Shares | 30,908,062 | 1,825,739 |
| International Stock Fund (18.0%) | ||
| Vanguard Total International Stock Index Fund Investor Shares | 77,641,483 | 1,236,052 |
| U.S. Bond Funds (41.9%) | ||
| 1 Vanguard Total Bond Market II Index Fund Investor Shares | 203,035,017 | 2,160,293 |
| Vanguard Short-Term Inflation-Protected Securities Index Fund Admiral Shares | 28,499,258 | 707,067 |
| 2,867,360 | ||
| International Bond Fund (13.4%) | ||
| Vanguard Total International Bond Index Fund Admiral Shares | 42,542,669 | 919,347 |
| Total Investment Companies (Cost $6,516,095) | 6,848,498 | |
| Temporary Cash Investment (0.0%) | ||
| Money Market Fund (0.0%) | ||
| 1 Vanguard Market Liquidity Fund, 0.965% (Cost $1) | 8 | 1 |
| Total Investments (100.0%) (Cost $6,516,096) | 6,848,499 | |
| Other Assets and Liabilities (0.0%) | ||
| Other Assets | 29,410 | |
| Liabilities | (27,974) | |
| 1,436 | ||
| Net Assets (100%) | ||
| Applicable to 328,844,209 outstanding $.001 par value shares of | ||
| beneficial interest (unlimited authorization) | 6,849,935 | |
| Net Asset Value Per Share | $20.83 | |
29
Institutional Target Retirement 2015 Fund
| Amount | |
| ($000) | |
| Statement of Assets and Liabilities | |
| Assets | |
| Investments in Securities, at Value—Affiliated Vanguard Funds | 6,848,499 |
| Receivables for Accrued Income | 5,191 |
| Receivables for Capital Shares Issued | 24,219 |
| Total Assets | 6,877,909 |
| Liabilities | |
| Payables for Investment Securities Purchased | 24,382 |
| Payables for Capital Shares Redeemed | 2,349 |
| Other Liabilities | 1,243 |
| Total Liabilities | 27,974 |
| Net Assets | 6,849,935 |
| At March 31, 2017, net assets consisted of: | |
| Amount | |
| ($000) | |
| Paid-in Capital | 6,486,744 |
| Undistributed Net Investment Income | 26,280 |
| Accumulated Net Realized Gains | 4,508 |
| Unrealized Appreciation (Depreciation) | 332,403 |
| Net Assets | 6,849,935 |
• See Note A in Notes to Financial Statements.
1 Affiliated fund available only to Vanguard funds and certain trusts and accounts managed by Vanguard. Rate shown for Vanguard Market
Liquidity Fund is the 7-day yield.
See accompanying Notes, which are an integral part of the Financial Statements.
30
Institutional Target Retirement 2015 Fund
Statement of Operations
| Six Months Ended | |
| March 31, 2017 | |
| ($000) | |
| Investment Income | |
| Income | |
| Income Distributions Received from Affiliated Funds | 69,680 |
| Net Investment Income—Note B | 69,680 |
| Realized Net Gain (Loss) | |
| Capital Gain Distributions Received from Affiliated Funds | 2,041 |
| Affiliated Investment Securities Sold | 4,603 |
| Realized Net Gain (Loss) | 6,644 |
| Change in Unrealized Appreciation (Depreciation) of Investment Securities | 113,726 |
| Net Increase (Decrease) in Net Assets Resulting from Operations | 190,050 |
See accompanying Notes, which are an integral part of the Financial Statements.
31
Institutional Target Retirement 2015 Fund
Statement of Changes in Net Assets
| Six Months Ended | Year Ended | |
| March 31, | September 30, | |
| 2017 | 2016 | |
| ($000) | ($000) | |
| Increase (Decrease) in Net Assets | ||
| Operations | ||
| Net Investment Income | 69,680 | 97,172 |
| Realized Net Gain (Loss) | 6,644 | 1,159 |
| Change in Unrealized Appreciation (Depreciation) | 113,726 | 317,514 |
| Net Increase (Decrease) in Net Assets Resulting from Operations | 190,050 | 415,845 |
| Distributions | ||
| Net Investment Income | (115,625) | (31,436) |
| Realized Capital Gain1 | (3,156) | (207) |
| Total Distributions | (118,781) | (31,643) |
| Capital Share Transactions | ||
| Issued | 1,178,133 | 3,476,404 |
| Issued in Lieu of Cash Distributions | 118,060 | 31,604 |
| Redeemed | (540,274) | (659,666) |
| Net Increase (Decrease) from Capital Share Transactions | 755,919 | 2,848,342 |
| Total Increase (Decrease) | 827,188 | 3,232,544 |
| Net Assets | ||
| Beginning of Period | 6,022,747 | 2,790,203 |
| End of Period2 | 6,849,935 | 6,022,747 |
| 1 Includes fiscal 2017 and 2016 short-term gain distributions totaling $1,791,000 and $207,000, respectively. Short-term gain distributions | ||
| are treated as ordinary income dividends for tax purposes. | ||
| 2 Net Assets—End of Period includes undistributed (overdistributed) net investment income of $26,280,000 and $72,225,000. | ||
See accompanying Notes, which are an integral part of the Financial Statements.
32
Institutional Target Retirement 2015 Fund
Financial Highlights
| Six Months | Year | June 26, | |
| Ended | Ended | 20151 to | |
| March 31, | Sept. 30, | Sept. 30, | |
| For a Share Outstanding Throughout Each Period | 2017 | 2016 | 2015 |
| Net Asset Value, Beginning of Period | $20.64 | $19.06 | $20.00 |
| Investment Operations | |||
| Net Investment Income | . 213 | . 345 | .124 2 |
| Capital Gain Distributions Received | .006 | .008 | — |
| Net Realized and Unrealized Gain (Loss) on Investments | .362 | 1.380 | (1.064) |
| Total from Investment Operations | .581 | 1.733 | (.940) |
| Distributions | |||
| Dividends from Net Investment Income | (.381) | (.152) | — |
| Distributions from Realized Capital Gains | (.010) | (.001) | — |
| Total Distributions | (.391) | (.153) | — |
| Net Asset Value, End of Period | $20.83 | $20.64 | $19.06 |
| Total Return | 2.88% | 9.14% | -4.70% |
| Ratios/Supplemental Data | |||
| Net Assets, End of Period (Millions) | $6,850 | $6,023 | $2,790 |
| Ratio of Total Expenses to Average Net Assets | — | — | — |
| Acquired Fund Fees and Expenses | 0.09% | 0.09% | 0.10%3 |
| Ratio of Net Investment Income to Average Net Assets | 2.19% | 2.04% | 2.21%3 |
| Portfolio Turnover Rate | 9% | 10% | 1% |
| The expense ratio, acquired fund fees and expenses, net investment income ratio, and turnover rate for the current period have been annualized. | |||
| 1 Inception. | |||
| 2 Calculated based on average shares outstanding. | |||
| 3 Annualized. | |||
See accompanying Notes, which are an integral part of the Financial Statements.
33
Institutional Target Retirement 2015 Fund
Notes to Financial Statements
Vanguard Institutional Target Retirement 2015 Fund is registered under the Investment Company Act of 1940 as an open-end investment company, or mutual fund. The fund follows a balanced investment strategy by investing in selected Vanguard funds to achieve its targeted allocation of assets to U.S. and international stocks, and U.S. and international bonds. Financial statements and other information about each underlying fund are available on vanguard.com.
A. The following significant accounting policies conform to generally accepted accounting principles for U.S. investment companies. The fund consistently follows such policies in preparing its financial statements.
1. Security Valuation: Investments are valued at the net asset value of each underlying Vanguard fund determined as of the close of the New York Stock Exchange (generally 4 p.m., Eastern time) on the valuation date.
2. Federal Income Taxes: The fund intends to continue to qualify as a regulated investment company and distribute all of its taxable income. Management has analyzed the fund’s tax positions taken for all open federal income tax years (September 30, 2015–2016), and for the period ended March 31, 2017, and has concluded that no provision for federal income tax is required in the fund’s financial statements.
3. Distributions: Distributions to shareholders are recorded on the ex-dividend date.
4. Credit Facility: The fund and certain other funds managed by The Vanguard Group (“Vanguard”) participate in a $3.1 billion committed credit facility provided by a syndicate of lenders pursuant to a credit agreement that may be renewed annually; each fund is individually liable for its borrowings, if any, under the credit facility. Borrowings may be utilized for temporary and emergency purposes, and are subject to the fund’s regulatory and contractual borrowing restrictions. The participating funds are charged administrative fees and an annual commitment fee of 0.10% of the undrawn amount of the facility; these fees are allocated to the funds based on a method approved by the fund’s board of trustees and borne by the funds in which the fund invests (see Note B). Any borrowings under this facility bear interest at a rate based upon the higher of the one-month London Interbank Offered Rate, federal funds effective rate, or overnight bank funding rate plus an agreed-upon spread.
The fund had no borrowings outstanding at March 31, 2017, or at any time during the period then ended.
5. Other: Income and capital gain distributions received are recorded on the ex-dividend date. Security transactions are accounted for on the date securities are bought or sold. Costs used to determine realized gains (losses) on the sale of investment securities are those of the specific securities sold.
B. In accordance with the terms of a Funds’ Service Agreement (the “FSA”) between Vanguard and the fund, Vanguard furnishes to the fund investment advisory, corporate management, administrative, marketing, and distribution services at Vanguard’s cost of operations (as defined by the FSA). These costs of operations are allocated to the fund based on methods and guidelines approved by the board of trustees. The FSA provides that expenses otherwise allocable to Vanguard funds-of-funds may be reduced or eliminated to the extent of savings realized by the underlying Vanguard funds by virtue of being part of a fund-of-funds. Accordingly, all expenses for services provided by Vanguard to the fund and all other expenses incurred by the fund during the period ended March 31, 2017, were borne by the underlying Vanguard funds in which the fund invests. The fund’s trustees and officers are also trustees and officers, respectively, of the underlying Vanguard funds, as well as directors and employees, respectively, of Vanguard.
34
Institutional Target Retirement 2015 Fund
C. Various inputs may be used to determine the value of the fund’s investments. These inputs are
summarized in three broad levels for financial statement purposes. The inputs or methodologies
used to value securities are not necessarily an indication of the risk associated with investing in
those securities.
Level 1—Quoted prices in active markets for identical securities.
Level 2—Other significant observable inputs (including quoted prices for similar securities, interest rates, prepayment speeds, credit risk, etc.).
Level 3—Significant unobservable inputs (including the fund’s own assumptions used to determine the fair value of investments).
At March 31, 2017, 100% of the market value of the fund’s investments was determined based on Level 1 inputs.
D. Distributions are determined on a tax basis and may differ from net investment income and realized capital gains for financial reporting purposes. Differences may be permanent or temporary. Permanent differences are reclassified among capital accounts in the financial statements to reflect their tax character. Temporary differences arise when certain items of income, expense, gain, or loss are recognized in different periods for financial statement and tax purposes. These differences will reverse at some time in the future. Differences in classification may also result from the treatment of short-term gains as ordinary income for tax purposes. The fund’s tax-basis capital gains and losses are determined only at the end of each fiscal year.
At March 31, 2017, the cost of investment securities for tax purposes was $6,516,096,000. Net unrealized appreciation of investment securities for tax purposes was $332,403,000, consisting of unrealized gains of $352,802,000 on securities that had risen in value since their purchase and $20,399,000 in unrealized losses on securities that had fallen in value since their purchase.
E. Capital shares issued and redeemed were:
| Six Months Ended | Year Ended | |
| March 31, 2017 | September 30, 2016 | |
| Shares | Shares | |
| (000) | (000) | |
| Issued | 57,582 | 177,151 |
| Issued in Lieu of Cash Distributions | 5,871 | 1,623 |
| Redeemed | (26,376) | (33,396) |
| Net Increase (Decrease) in Shares Outstanding | 37,077 | 145,378 |
At March 31, 2017, one shareholder was the record or beneficial owner of 31% of the fund’s net assets. If the shareholder were to redeem its investment in the fund, the redemption might lead to the realization of taxable capital gains.
35
Institutional Target Retirement 2015 Fund
F. Transactions during the period in affiliated underlying Vanguard funds were as follows:
| Current Period Transactions | ||||||
| Sept. 30, | Proceeds | March 31, | ||||
| 2016 | from | Capital Gain | 2017 | |||
| Market | Purchases | Securities | Distributions | Market | ||
| Value | at Cost | Sold | Income | Received | Value | |
| ($000) | ($000) | ($000) | ($000) | ($000) | ($000) | |
| Vanguard Market Liquidity Fund | 56 | NA1 | NA1 | 3 | — | 1 |
| Vanguard Short-Term | ||||||
| Inflation-Protected Securities | ||||||
| Index Fund | 583,720 | 133,045 | 8,635 | 4,544 | — | 707,067 |
| Vanguard Total Bond Market II | ||||||
| Index Fund | 1,852,305 | 456,944 | 80,887 | 23,249 | 2,041 | 2,160,293 |
| Vanguard Total International | ||||||
| Bond Index Fund | 813,923 | 132,979 | 933 | 10,069 | — | 919,347 |
| Vanguard Total International | ||||||
| Stock Index Fund | 1,106,773 | 111,597 | 45,081 | 13,088 | — | 1,236,052 |
| Vanguard Total Stock Market | ||||||
| Index Fund | 1,656,707 | 176,250 | 158,538 | 18,727 | — | 1,825,739 |
| Total | 6,013,484 | 1,010,815 | 294,074 | 69,680 | 2,041 | 6,848,499 |
| 1 Not applicable—purchases and sales are for temporary cash investment purposes. | ||||||
G. Management has determined that no material events or transactions occurred subsequent to March 31, 2017, that would require recognition or disclosure in these financial statements.
36
Institutional Target Retirement 2020 Fund
Fund Profile
As of March 31, 2017
| Total Fund Characteristics | |
| Ticker Symbol | VITWX |
| 30-Day SEC Yield | 2.08% |
| Acquired Fund Fees and Expenses1 | 0.10% |
| Allocation to Underlying Vanguard Funds | |
| Vanguard Total Stock Market Index Fund | |
| Institutional Shares | 33.2% |
| Vanguard Total Bond Market II Index Fund | |
| Investor Shares | 28.7 |
| Vanguard Total International Stock Index | |
| Fund Investor Shares | 22.7 |
| Vanguard Total International Bond Index | |
| Fund Admiral Shares | 12.2 |
| Vanguard Short-Term Inflation-Protected | |
| Securities Index Fund Admiral Shares | 3.2 |
Fund Asset Allocation

1 This figure—drawn from the prospectus dated January 27, 2017—represents an estimate of the weighted average of the expense ratios and any
transaction fees charged by the underlying mutual funds (the ”acquired” funds) in which the Institutional Target Retirement 2020 Fund invests. The
fund does not charge any expenses or fees of its own. For the six months ended March 31, 2017, the annualized acquired fund fees and expenses
were 0.09%.
37
Institutional Target Retirement 2020 Fund
Performance Summary
All of the returns in this report represent past performance, which is not a guarantee of future results that may be achieved by the fund. (Current performance may be lower or higher than the performance data cited. For performance data current to the most recent month-end, visit our website at vanguard.com/performance.) Note, too, that both investment returns and principal value can fluctuate widely, so an investor’s shares, when sold, could be worth more or less than their original cost. The returns shown do not reflect taxes that a shareholder would pay on fund distributions or on the sale of fund shares.
Fiscal-Year Total Returns (%): June 26, 2015, Through March 31, 2017
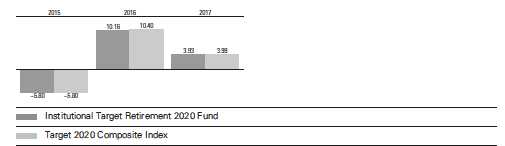
For a benchmark description, see the Glossary.
Note: For 2017, performance data reflect the six months ended March 31, 2017.
| Average Annual Total Returns: Period Ended March 31, 2017 | |||||
| Since Inception | |||||
| Inception Date | One Year | Income | Capital | Total | |
| Institutional Target | |||||
| Retirement 2020 Fund | 6/26/2015 | 9.51% | 1.62% | 2.76% | 4.38% |
See Financial Highlights for dividend and capital gains information.
38
Institutional Target Retirement 2020 Fund
Financial Statements (unaudited)
Statement of Net Assets
As of March 31, 2017
The fund reports a complete list of its holdings in regulatory filings four times in each fiscal year, at the quarter-ends. For the second and fourth fiscal quarters, the lists appear in the fund’s semiannual and annual reports to shareholders. For the first and third fiscal quarters, the fund files the lists with the Securities and Exchange Commission on Form N-Q. Shareholders can look up the fund’s Forms N-Q on the SEC’s website at sec.gov. Forms N-Q may also be reviewed and copied at the SEC’s Public Reference Room (see the back cover of this report for further information).
| Market | ||
| Value• | ||
| Shares | ($000) | |
| Investment Companies (99.9%) | ||
| U.S. Stock Fund (33.2%) | ||
| Vanguard Total Stock Market Index Fund Institutional Shares | 82,957,375 | 4,900,292 |
| International Stock Fund (22.7%) | ||
| Vanguard Total International Stock Index Fund Investor Shares | 210,236,914 | 3,346,972 |
| U.S. Bond Funds (31.8%) | ||
| 1 Vanguard Total Bond Market II Index Fund Investor Shares | 397,128,531 | 4,225,447 |
| Vanguard Short-Term Inflation-Protected Securities Index Fund Admiral Shares | 18,748,280 | 465,145 |
| 4,690,592 | ||
| International Bond Fund (12.2%) | ||
| Vanguard Total International Bond Index Fund Admiral Shares | 83,061,479 | 1,794,959 |
| Total Investment Companies (Cost $13,895,647) | 14,732,815 | |
| Temporary Cash Investment (0.0%) | ||
| Money Market Fund (0.0%) | ||
| 1 Vanguard Market Liquidity Fund, 0.965% (Cost $3,944) | 39,432 | 3,944 |
| Total Investments (99.9%) (Cost $13,899,591) | 14,736,759 | |
| Other Assets and Liabilities (0.1%) | ||
| Other Assets | 84,206 | |
| Liabilities | (76,652) | |
| 7,554 | ||
| Net Assets (100%) | ||
| Applicable to 703,276,744 outstanding $.001 par value shares of | ||
| beneficial interest (unlimited authorization) | 14,744,313 | |
| Net Asset Value Per Share | $20.97 | |
39
Institutional Target Retirement 2020 Fund
| Amount | |
| ($000) | |
| Statement of Assets and Liabilities | |
| Assets | |
| Investments in Securities, at Value—Affiliated Vanguard Funds | 14,736,759 |
| Receivables for Accrued Income | 10,110 |
| Receivables for Capital Shares Issued | 74,096 |
| Total Assets | 14,820,965 |
| Liabilities | |
| Payables for Investment Securities Purchased | 75,833 |
| Payables for Capital Shares Redeemed | 819 |
| Total Liabilities | 76,652 |
| Net Assets | 14,744,313 |
| At March 31, 2017, net assets consisted of: | |
| Amount | |
| ($000) | |
| Paid-in Capital | 13,843,915 |
| Undistributed Net Investment Income | 58,994 |
| Accumulated Net Realized Gains | 4,236 |
| Unrealized Appreciation (Depreciation) | 837,168 |
| Net Assets | 14,744,313 |
• See Note A in Notes to Financial Statements.
1 Affiliated fund available only to Vanguard funds and certain trusts and accounts managed by Vanguard. Rate shown for Vanguard Market
Liquidity Fund is the 7-day yield.
See accompanying Notes, which are an integral part of the Financial Statements.
40
Institutional Target Retirement 2020 Fund
Statement of Operations
| Six Months Ended | |
| March 31, 2017 | |
| ($000) | |
| Investment Income | |
| Income | |
| Income Distributions Received from Affiliated Funds | 145,113 |
| Net Investment Income—Note B | 145,113 |
| Realized Net Gain (Loss) | |
| Capital Gain Distributions Received from Affiliated Funds | 3,757 |
| Affiliated Investment Securities Sold | 3,274 |
| Realized Net Gain (Loss) | 7,031 |
| Change in Unrealized Appreciation (Depreciation) of Investment Securities | 382,466 |
| Net Increase (Decrease) in Net Assets Resulting from Operations | 534,610 |
See accompanying Notes, which are an integral part of the Financial Statements.
41
Institutional Target Retirement 2020 Fund
Statement of Changes in Net Assets
| Six Months Ended | Year Ended | |
| March 31, | September 30, | |
| 2017 | 2016 | |
| ($000) | ($000) | |
| Increase (Decrease) in Net Assets | ||
| Operations | ||
| Net Investment Income | 145,113 | 197,155 |
| Realized Net Gain (Loss) | 7,031 | 3,648 |
| Change in Unrealized Appreciation (Depreciation) | 382,466 | 650,773 |
| Net Increase (Decrease) in Net Assets Resulting from Operations | 534,610 | 851,576 |
| Distributions | ||
| Net Investment Income | (237,390) | (60,615) |
| Realized Capital Gain1 | (5,950) | (748) |
| Total Distributions | (243,340) | (61,363) |
| Capital Share Transactions | ||
| Issued | 3,196,734 | 6,547,919 |
| Issued in Lieu of Cash Distributions | 241,217 | 61,249 |
| Redeemed | (598,407) | (621,147) |
| Net Increase (Decrease) from Capital Share Transactions | 2,839,544 | 5,988,021 |
| Total Increase (Decrease) | 3,130,814 | 6,778,234 |
| Net Assets | ||
| Beginning of Period | 11,613,499 | 4,835,265 |
| End of Period2 | 14,744,313 | 11,613,499 |
| 1 Includes fiscal 2017 and 2016 short-term gain distributions totaling $3,279,000 and $374,000, respectively. Short-term gain distributions | ||
| are treated as ordinary income dividends for tax purposes. | ||
| 2 Net Assets—End of Period includes undistributed (overdistributed) net investment income of $58,994,000 and $151,271,000. | ||
See accompanying Notes, which are an integral part of the Financial Statements.
42
Institutional Target Retirement 2020 Fund
Financial Highlights
| Six Months | Year | June 26, | |
| Ended | Ended | 20151 to | |
| March 31, | Sept. 30, | Sept. 30, | |
| For a Share Outstanding Throughout Each Period | 2017 | 2016 | 2015 |
| Net Asset Value, Beginning of Period | $20.58 | $18.84 | $20.00 |
| Investment Operations | |||
| Net Investment Income | . 207 | . 444 2 | .1382 |
| Capital Gain Distributions Received | .006 | .0072 | — |
| Net Realized and Unrealized Gain (Loss) on Investments | .578 | 1.453 | (1.298) |
| Total from Investment Operations | .791 | 1.904 | (1.160) |
| Distributions | |||
| Dividends from Net Investment Income | (.391) | (.162) | — |
| Distributions from Realized Capital Gains | (.010) | (.002) | — |
| Total Distributions | (.401) | (.164) | — |
| Net Asset Value, End of Period | $20.97 | $20.58 | $18.84 |
| Total Return | 3.93% | 10.16% | -5.80% |
| Ratios/Supplemental Data | |||
| Net Assets, End of Period (Millions) | $14,744 | $11,613 | $4,835 |
| Ratio of Total Expenses to Average Net Assets | — | — | — |
| Acquired Fund Fees and Expenses | 0.09% | 0.10% | 0.10%3 |
| Ratio of Net Investment Income to Average Net Assets | 2.25% | 2.25% | 2.48%3 |
| Portfolio Turnover Rate | 6% | 5% | 2% |
| The expense ratio, acquired fund fees and expenses, net investment income ratio, and turnover rate for the current period have been annualized. | |||
| 1 Inception. | |||
| 2 Calculated based on average shares outstanding. | |||
| 3 Annualized. | |||
See accompanying Notes, which are an integral part of the Financial Statements.
43
Institutional Target Retirement 2020 Fund
Notes to Financial Statements
Vanguard Institutional Target Retirement 2020 Fund is registered under the Investment Company Act of 1940 as an open-end investment company, or mutual fund. The fund follows a balanced investment strategy by investing in selected Vanguard funds to achieve its targeted allocation of assets to U.S. and international stocks, and U.S. and international bonds. Financial statements and other information about each underlying fund are available on vanguard.com.
A. The following significant accounting policies conform to generally accepted accounting principles for U.S. investment companies. The fund consistently follows such policies in preparing its financial statements.
1. Security Valuation: Investments are valued at the net asset value of each underlying Vanguard fund determined as of the close of the New York Stock Exchange (generally 4 p.m., Eastern time) on the valuation date.
2. Federal Income Taxes: The fund intends to continue to qualify as a regulated investment company and distribute all of its taxable income. Management has analyzed the fund’s tax positions taken for all open federal income tax years (September 30, 2015–2016), and for the period ended March 31, 2017, and has concluded that no provision for federal income tax is required in the fund’s financial statements.
3. Distributions: Distributions to shareholders are recorded on the ex-dividend date.
4. Credit Facility: The fund and certain other funds managed by The Vanguard Group (“Vanguard”) participate in a $3.1 billion committed credit facility provided by a syndicate of lenders pursuant to a credit agreement that may be renewed annually; each fund is individually liable for its borrowings, if any, under the credit facility. Borrowings may be utilized for temporary and emergency purposes, and are subject to the fund’s regulatory and contractual borrowing restrictions. The participating funds are charged administrative fees and an annual commitment fee of 0.10% of the undrawn amount of the facility; these fees are allocated to the funds based on a method approved by the fund’s board of trustees and borne by the funds in which the fund invests (see Note B). Any borrowings under this facility bear interest at a rate based upon the higher of the one-month London Interbank Offered Rate, federal funds effective rate, or overnight bank funding rate plus an agreed-upon spread.
The fund had no borrowings outstanding at March 31, 2017, or at any time during the period then ended.
5. Other: Income and capital gain distributions received are recorded on the ex-dividend date. Security transactions are accounted for on the date securities are bought or sold. Costs used to determine realized gains (losses) on the sale of investment securities are those of the specific securities sold.
B. In accordance with the terms of a Funds’ Service Agreement (the “FSA”) between Vanguard and the fund, Vanguard furnishes to the fund investment advisory, corporate management, administrative, marketing, and distribution services at Vanguard’s cost of operations (as defined by the FSA). These costs of operations are allocated to the fund based on methods and guidelines approved by the board of trustees. The FSA provides that expenses otherwise allocable to Vanguard funds-of-funds may be reduced or eliminated to the extent of savings realized by the underlying Vanguard funds by virtue of being part of a fund-of-funds. Accordingly, all expenses for services provided by Vanguard to the fund and all other expenses incurred by the fund during the period ended March 31, 2017, were borne by the underlying Vanguard funds in which the fund invests. The fund’s trustees and officers are also trustees and officers, respectively, of the underlying Vanguard funds, as well as directors and employees, respectively, of Vanguard.
44
Institutional Target Retirement 2020 Fund
C. Various inputs may be used to determine the value of the fund’s investments. These inputs are summarized in three broad levels for financial statement purposes. The inputs or methodologies used to value securities are not necessarily an indication of the risk associated with investing in those securities.
Level 1—Quoted prices in active markets for identical securities.
Level 2—Other significant observable inputs (including quoted prices for similar securities, interest rates, prepayment speeds, credit risk, etc.).
Level 3—Significant unobservable inputs (including the fund’s own assumptions used to determine the fair value of investments).
At March 31, 2017, 100% of the market value of the fund’s investments was determined based on Level 1 inputs.
D. Distributions are determined on a tax basis and may differ from net investment income and realized capital gains for financial reporting purposes. Differences may be permanent or temporary. Permanent differences are reclassified among capital accounts in the financial statements to reflect their tax character. Temporary differences arise when certain items of income, expense, gain, or loss are recognized in different periods for financial statement and tax purposes. These differences will reverse at some time in the future. Differences in classification may also result from the treatment of short-term gains as ordinary income for tax purposes. The fund’s tax-basis capital gains and losses are determined only at the end of each fiscal year.
At March 31, 2017, the cost of investment securities for tax purposes was $13,899,591,000. Net unrealized appreciation of investment securities for tax purposes was $837,168,000, consisting of unrealized gains of $876,716,000 on securities that had risen in value since their purchase and $39,548,000 in unrealized losses on securities that had fallen in value since their purchase.
E. Capital shares issued and redeemed were:
| Six Months Ended | Year Ended | |
| March 31, 2017 | September 30, 2016 | |
| Shares | Shares | |
| (000) | (000) | |
| Issued | 156,138 | 336,206 |
| Issued in Lieu of Cash Distributions | 11,995 | 3,164 |
| Redeemed | (29,205) | (31,724) |
| Net Increase (Decrease) in Shares Outstanding | 138,928 | 307,646 |
At March 31, 2017, one shareholder was the record or beneficial owner of 35% of the fund’s net assets. If the shareholder were to redeem its investment in the fund, the redemption might lead to the realization of taxable capital gains.
45
Institutional Target Retirement 2020 Fund
F. Transactions during the period in affiliated underlying Vanguard funds were as follows:
| Current Period Transactions | ||||||
| Sept. 30, | Proceeds | March 31, | ||||
| 2016 | from | Capital Gain | 2017 | |||
| Market | Purchases | Securities | Distributions | Market | ||
| Value | at Cost | Sold | Income | Received | Value | |
| ($000) | ($000) | ($000) | ($000) | ($000) | ($000) | |
| Vanguard Market Liquidity Fund | 2 | NA1 | NA1 | 8 | — | 3,944 |
| Vanguard Short-Term | ||||||
| Inflation-Protected Securities | ||||||
| Index Fund | 259,311 | 206,866 | 1,120 | 2,169 | — | 465,145 |
| Vanguard Total Bond Market II | ||||||
| Index Fund | 3,278,731 | 1,165,510 | 98,775 | 43,216 | 3,757 | 4,225,447 |
| Vanguard Total International | ||||||
| Bond Index Fund | 1,427,024 | 415,070 | — | 18,285 | — | 1,794,959 |
| Vanguard Total International | ||||||
| Stock Index Fund | 2,641,993 | 542,972 | 7,537 | 33,313 | — | 3,346,972 |
| Vanguard Total Stock Market | ||||||
| Index Fund | 3,981,250 | 792,442 | 256,662 | 48,122 | — | 4,900,292 |
| Total | 11,588,311 | 3,122,860 | 364,094 | 145,113 | 3,757 | 14,736,759 |
| 1 Not applicable—purchases and sales are for temporary cash investment purposes. | ||||||
G. Management has determined that no material events or transactions occurred subsequent to March 31, 2017, that would require recognition or disclosure in these financial statements.
46
Institutional Target Retirement 2025 Fund
Fund Profile
As of March 31, 2017
| Total Fund Characteristics | |
| Ticker Symbol | VRIVX |
| 30-Day SEC Yield | 2.13% |
| Acquired Fund Fees and Expenses1 | 0.10% |
| Allocation to Underlying Vanguard Funds | |
| Vanguard Total Stock Market Index Fund | |
| Institutional Shares | 38.5% |
| Vanguard Total International Stock Index | |
| Fund Investor Shares | 25.9 |
| Vanguard Total Bond Market II Index Fund | |
| Investor Shares | 25.0 |
| Vanguard Total International Bond Index | |
| Fund Admiral Shares | 10.6 |
Fund Asset Allocation
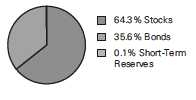
1 This figure—drawn from the prospectus dated January 27, 2017—represents an estimate of the weighted average of the expense ratios and any
transaction fees charged by the underlying mutual funds (the ”acquired” funds) in which the Institutional Target Retirement 2025 Fund invests. The
fund does not charge any expenses or fees of its own. For the six months ended March 31, 2017, the annualized acquired fund fees and expenses
were 0.09%.
47
Institutional Target Retirement 2025 Fund
Performance Summary
All of the returns in this report represent past performance, which is not a guarantee of future results that may be achieved by the fund. (Current performance may be lower or higher than the performance data cited. For performance data current to the most recent month-end, visit our website at vanguard.com/performance.) Note, too, that both investment returns and principal value can fluctuate widely, so an investor’s shares, when sold, could be worth more or less than their original cost. The returns shown do not reflect taxes that a shareholder would pay on fund distributions or on the sale of fund shares.
Fiscal-Year Total Returns (%): June 26, 2015, Through March 31, 2017
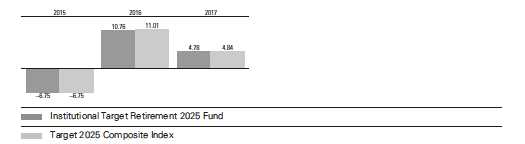
For a benchmark description, see the Glossary.
Note: For 2017, performance data reflect the six months ended March 31, 2017.
| Average Annual Total Returns: Period Ended March 31, 2017 | |||||
| Since Inception | |||||
| Inception Date | One Year | Income | Capital | Total | |
| Institutional Target | |||||
| Retirement 2025 Fund | 6/26/2015 | 10.79% | 1.64% | 2.95% | 4.59% |
See Financial Highlights for dividend and capital gains information.
48
Institutional Target Retirement 2025 Fund
Financial Statements (unaudited)
Statement of Net Assets
As of March 31, 2017
The fund reports a complete list of its holdings in regulatory filings four times in each fiscal year, at the quarter-ends. For the second and fourth fiscal quarters, the lists appear in the fund’s semiannual and annual reports to shareholders. For the first and third fiscal quarters, the fund files the lists with the Securities and Exchange Commission on Form N-Q. Shareholders can look up the fund’s Forms N-Q on the SEC’s website at sec.gov. Forms N-Q may also be reviewed and copied at the SEC’s Public Reference Room (see the back cover of this report for further information).
| Market | ||
| Value• | ||
| Shares | ($000) | |
| Investment Companies (99.9%) | ||
| U.S. Stock Fund (38.4%) | ||
| Vanguard Total Stock Market Index Fund Institutional Shares | 115,336,894 | 6,812,950 |
| International Stock Fund (25.9%) | ||
| Vanguard Total International Stock Index Fund Investor Shares | 288,473,532 | 4,592,499 |
| U.S. Bond Fund (25.0%) | ||
| 1 Vanguard Total Bond Market II Index Fund Investor Shares | 416,076,836 | 4,427,057 |
| International Bond Fund (10.6%) | ||
| Vanguard Total International Bond Index Fund Admiral Shares | 86,954,090 | 1,879,078 |
| Total Investment Companies (Cost $16,589,607) | 17,711,584 | |
| Temporary Cash Investment (0.0%) | ||
| Money Market Fund (0.0%) | ||
| 1 Vanguard Market Liquidity Fund, 0.965% (Cost $5,764) | 57,628 | 5,764 |
| Total Investments (99.9%) (Cost $16,595,371) | 17,717,348 | |
| Other Assets and Liabilities (0.1%) | ||
| Other Assets | 128,208 | |
| Liabilities | (114,090) | |
| 14,118 | ||
| Net Assets (100%) | ||
| Applicable to 842,865,958 outstanding $.001 par value shares of | ||
| beneficial interest (unlimited authorization) | 17,731,466 | |
| Net Asset Value Per Share | $21.04 | |
49
Institutional Target Retirement 2025 Fund
| Amount | |
| ($000) | |
| Statement of Assets and Liabilities | |
| Assets | |
| Investments in Securities, at Value—Affiliated Vanguard Funds | 17,717,348 |
| Receivables for Investment Securities Sold | 15,055 |
| Receivables for Accrued Income | 10,492 |
| Receivables for Capital Shares Issued | 102,661 |
| Total Assets | 17,845,556 |
| Liabilities | |
| Payables for Investment Securities Purchased | 112,992 |
| Payables for Capital Shares Redeemed | 1,098 |
| Total Liabilities | 114,090 |
| Net Assets | 17,731,466 |
| At March 31, 2017, net assets consisted of: | |
| Amount | |
| ($000) | |
| Paid-in Capital | 16,534,990 |
| Undistributed Net Investment Income | 71,714 |
| Accumulated Net Realized Gains | 2,785 |
| Unrealized Appreciation (Depreciation) | 1,121,977 |
| Net Assets | 17,731,466 |
• See Note A in Notes to Financial Statements.
1 Affiliated fund available only to Vanguard funds and certain trusts and accounts managed by Vanguard. Rate shown for Vanguard Market
Liquidity Fund is the 7-day yield.
See accompanying Notes, which are an integral part of the Financial Statements.
50
Institutional Target Retirement 2025 Fund
Statement of Operations
| Six Months Ended | |
| March 31, 2017 | |
| ($000) | |
| Investment Income | |
| Income | |
| Income Distributions Received from Affiliated Funds | 173,743 |
| Net Investment Income—Note B | 173,743 |
| Realized Net Gain (Loss) | |
| Capital Gain Distributions Received from Affiliated Funds | 3,810 |
| Affiliated Investment Securities Sold | 1,754 |
| Realized Net Gain (Loss) | 5,564 |
| Change in Unrealized Appreciation (Depreciation) of Investment Securities | 581,680 |
| Net Increase (Decrease) in Net Assets Resulting from Operations | 760,987 |
See accompanying Notes, which are an integral part of the Financial Statements.
51
Institutional Target Retirement 2025 Fund
Statement of Changes in Net Assets
| Six Months Ended | Year Ended | |
| March 31, | September 30, | |
| 2017 | 2016 | |
| ($000) | ($000) | |
| Increase (Decrease) in Net Assets | ||
| Operations | ||
| Net Investment Income | 173,743 | 230,756 |
| Realized Net Gain (Loss) | 5,564 | 3,521 |
| Change in Unrealized Appreciation (Depreciation) | 581,680 | 798,617 |
| Net Increase (Decrease) in Net Assets Resulting from Operations | 760,987 | 1,032,894 |
| Distributions | ||
| Net Investment Income | (282,158) | (69,282) |
| Realized Capital Gain1 | (5,974) | (420) |
| Total Distributions | (288,132) | (69,702) |
| Capital Share Transactions | ||
| Issued | 3,813,773 | 7,657,545 |
| Issued in Lieu of Cash Distributions | 284,805 | 69,540 |
| Redeemed | (466,383) | (426,094) |
| Net Increase (Decrease) from Capital Share Transactions | 3,632,195 | 7,300,991 |
| Total Increase (Decrease) | 4,105,050 | 8,264,183 |
| Net Assets | ||
| Beginning of Period | 13,626,416 | 5,362,233 |
| End of Period2 | 17,731,466 | 13,626,416 |
| 1 Includes fiscal 2017 and 2016 short-term gain distributions totaling $3,311,000 and $420,000, respectively. Short-term gain distributions | ||
| are treated as ordinary income dividends for tax purposes. | ||
| 2 Net Assets—End of Period includes undistributed (overdistributed) net investment income of $71,714,000 and $180,129,000. | ||
See accompanying Notes, which are an integral part of the Financial Statements.
52
Institutional Target Retirement 2025 Fund
Financial Highlights
| Six Months | Year | June 26, | |
| Ended | Ended | 20151 to | |
| March 31, | Sept. 30, | Sept. 30, | |
| For a Share Outstanding Throughout Each Period | 2017 | 2016 | 2015 |
| Net Asset Value, Beginning of Period | $20.48 | $18.65 | $20.00 |
| Investment Operations | |||
| Net Investment Income | . 206 | . 452 2 | .1402 |
| Capital Gain Distributions Received | .005 | .0062 | — |
| Net Realized and Unrealized Gain (Loss) on Investments | .749 | 1.538 | (1.490) |
| Total from Investment Operations | .960 | 1.996 | (1.350) |
| Distributions | |||
| Dividends from Net Investment Income | (.392) | (.165) | — |
| Distributions from Realized Capital Gains | (.008) | (.001) | — |
| Total Distributions | (.400) | (.166) | — |
| Net Asset Value, End of Period | $21.04 | $20.48 | $18.65 |
| Total Return | 4.78% | 10.76% | -6.75% |
| Ratios/Supplemental Data | |||
| Net Assets, End of Period (Millions) | $17,731 | $13,626 | $5,362 |
| Ratio of Total Expenses to Average Net Assets | — | — | — |
| Acquired Fund Fees and Expenses | 0.09% | 0.10% | 0.10%3 |
| Ratio of Net Investment Income to Average Net Assets | 2.27% | 2.30% | 2.52%3 |
| Portfolio Turnover Rate | 5% | 4% | 1% |
| The expense ratio, acquired fund fees and expenses, net investment income ratio, and turnover rate for the current period have been annualized. | |||
| 1 Inception. | |||
| 2 Calculated based on average shares outstanding. | |||
| 3 Annualized. | |||
See accompanying Notes, which are an integral part of the Financial Statements.
53
Institutional Target Retirement 2025 Fund
Notes to Financial Statements
Vanguard Institutional Target Retirement 2025 Fund is registered under the Investment Company Act of 1940 as an open-end investment company, or mutual fund. The fund follows a balanced investment strategy by investing in selected Vanguard funds to achieve its targeted allocation of assets to U.S. and international stocks, and U.S. and international bonds. Financial statements and other information about each underlying fund are available on vanguard.com.
A. The following significant accounting policies conform to generally accepted accounting principles for U.S. investment companies. The fund consistently follows such policies in preparing its financial statements.
1. Security Valuation: Investments are valued at the net asset value of each underlying Vanguard fund determined as of the close of the New York Stock Exchange (generally 4 p.m., Eastern time) on the valuation date.
2. Federal Income Taxes: The fund intends to continue to qualify as a regulated investment company and distribute all of its taxable income. Management has analyzed the fund’s tax positions taken for all open federal income tax years (September 30, 2015–2016), and for the period ended March 31, 2017, and has concluded that no provision for federal income tax is required in the fund’s financial statements.
3. Distributions: Distributions to shareholders are recorded on the ex-dividend date.
4. Credit Facility: The fund and certain other funds managed by The Vanguard Group (“Vanguard”) participate in a $3.1 billion committed credit facility provided by a syndicate of lenders pursuant to a credit agreement that may be renewed annually; each fund is individually liable for its borrowings, if any, under the credit facility. Borrowings may be utilized for temporary and emergency purposes, and are subject to the fund’s regulatory and contractual borrowing restrictions. The participating funds are charged administrative fees and an annual commitment fee of 0.10% of the undrawn amount of the facility; these fees are allocated to the funds based on a method approved by the fund’s board of trustees and borne by the funds in which the fund invests (see Note B). Any borrowings under this facility bear interest at a rate based upon the higher of the one-month London Interbank Offered Rate, federal funds effective rate, or overnight bank funding rate plus an agreed-upon spread.
The fund had no borrowings outstanding at March 31, 2017, or at any time during the period then ended.
5. Other: Income and capital gain distributions received are recorded on the ex-dividend date. Security transactions are accounted for on the date securities are bought or sold. Costs used to determine realized gains (losses) on the sale of investment securities are those of the specific securities sold.
B. In accordance with the terms of a Funds’ Service Agreement (the “FSA”) between Vanguard and the fund, Vanguard furnishes to the fund investment advisory, corporate management, administrative, marketing, and distribution services at Vanguard’s cost of operations (as defined by the FSA). These costs of operations are allocated to the fund based on methods and guidelines approved by the board of trustees. The FSA provides that expenses otherwise allocable to Vanguard funds-of-funds may be reduced or eliminated to the extent of savings realized by the underlying Vanguard funds by virtue of being part of a fund-of-funds. Accordingly, all expenses for services provided by Vanguard to the fund and all other expenses incurred by the fund during the period ended March 31, 2017, were borne by the underlying Vanguard funds in which the fund invests. The fund’s trustees and officers are also trustees and officers, respectively, of the underlying Vanguard funds, as well as directors and employees, respectively, of Vanguard.
54
Institutional Target Retirement 2025 Fund
C. Various inputs may be used to determine the value of the fund’s investments. These inputs are summarized in three broad levels for financial statement purposes. The inputs or methodologies used to value securities are not necessarily an indication of the risk associated with investing in those securities.
Level 1—Quoted prices in active markets for identical securities.
Level 2—Other significant observable inputs (including quoted prices for similar securities, interest rates, prepayment speeds, credit risk, etc.).
Level 3—Significant unobservable inputs (including the fund’s own assumptions used to determine the fair value of investments).
At March 31, 2017, 100% of the market value of the fund’s investments was determined based on Level 1 inputs.
D. Distributions are determined on a tax basis and may differ from net investment income and realized capital gains for financial reporting purposes. Differences may be permanent or temporary. Permanent differences are reclassified among capital accounts in the financial statements to reflect their tax character. Temporary differences arise when certain items of income, expense, gain, or loss are recognized in different periods for financial statement and tax purposes. These differences will reverse at some time in the future. Differences in classification may also result from the treatment of short-term gains as ordinary income for tax purposes. The fund’s tax-basis capital gains and losses are determined only at the end of each fiscal year.
At March 31, 2017, the cost of investment securities for tax purposes was $16,595,371,000. Net unrealized appreciation of investment securities for tax purposes was $1,121,977,000, consisting of unrealized gains of $1,164,058,000 on securities that had risen in value since their purchase and $42,081,000 in unrealized losses on securities that had fallen in value since their purchase.
E. Capital shares issued and redeemed were:
| Six Months Ended | Year Ended | |
| March 31, 2017 | September 30, 2016 | |
| Shares | Shares | |
| (000) | (000) | |
| Issued | 186,179 | 396,056 |
| Issued in Lieu of Cash Distributions | 14,184 | 3,609 |
| Redeemed | (22,765) | (21,891) |
| Net Increase (Decrease) in Shares Outstanding | 177,598 | 377,774 |
At March 31, 2017, one shareholder was the record or beneficial owner of 31% of the fund’s net assets. If the shareholder were to redeem its investment in the fund, the redemption might lead to the realization of taxable capital gains.
55
Institutional Target Retirement 2025 Fund
F. Transactions during the period in affiliated underlying Vanguard funds were as follows:
| Current Period Transactions | ||||||
| Sept. 30, | Proceeds | March 31, | ||||
| 2016 | from | Capital Gain | 2017 | |||
| Market | Purchases | Securities | Distributions | Market | ||
| Value | at Cost | Sold | Income | Received | Value | |
| ($000) | ($000) | ($000) | ($000) | ($000) | ($000) | |
| Vanguard Market Liquidity Fund | 3,049 | NA1 | NA1 | 19 | — | 5,764 |
| Vanguard Total Bond Market II | ||||||
| Index Fund | 3,312,072 | 1,381,292 | 145,761 | 44,206 | 3,810 | 4,427,057 |
| Vanguard Total International | ||||||
| Bond Index Fund | 1,434,178 | 491,927 | — | 18,516 | — | 1,879,078 |
| Vanguard Total International | ||||||
| Stock Index Fund | 3,542,135 | 818,554 | — | 45,235 | — | 4,592,499 |
| Vanguard Total Stock Market | ||||||
| Index Fund | 5,299,479 | 1,202,872 | 208,598 | 65,767 | — | 6,812,950 |
| Total | 13,590,913 | 3,894,645 | 354,359 | 173,743 | 3,810 | 17,717,348 |
| 1 Not applicable—purchases and sales are for temporary cash investment purposes. | ||||||
G. Management has determined that no material events or transactions occurred subsequent to March 31, 2017, that would require recognition or disclosure in these financial statements.
56
Institutional Target Retirement 2030 Fund
Fund Profile
As of March 31, 2017
| Total Fund Characteristics | |
| Ticker Symbol | VTTWX |
| 30-Day SEC Yield | 2.15% |
| Acquired Fund Fees and Expenses1 | 0.10% |
| Allocation to Underlying Vanguard Funds | |
| Vanguard Total Stock Market Index Fund | |
| Institutional Shares | 43.0% |
| Vanguard Total International Stock Index | |
| Fund Investor Shares | 28.9 |
| Vanguard Total Bond Market II Index Fund | |
| Investor Shares | 19.7 |
| Vanguard Total International Bond Index | |
| Fund Admiral Shares | 8.4 |
Fund Asset Allocation
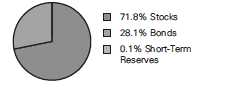
1 This figure—drawn from the prospectus dated January 27, 2017—represents an estimate of the weighted average of the expense ratios and any
transaction fees charged by the underlying mutual funds (the ”acquired” funds) in which the Institutional Target Retirement 2030 Fund invests. The
fund does not charge any expenses or fees of its own. For the six months ended March 31, 2017, the annualized acquired fund fees and expenses
were 0.09%.
57
Institutional Target Retirement 2030 Fund
Performance Summary
All of the returns in this report represent past performance, which is not a guarantee of future results that may be achieved by the fund. (Current performance may be lower or higher than the performance data cited. For performance data current to the most recent month-end, visit our website at vanguard.com/performance.) Note, too, that both investment returns and principal value can fluctuate widely, so an investor’s shares, when sold, could be worth more or less than their original cost. The returns shown do not reflect taxes that a shareholder would pay on fund distributions or on the sale of fund shares.
Fiscal-Year Total Returns (%): June 26, 2015, Through March 31, 2017
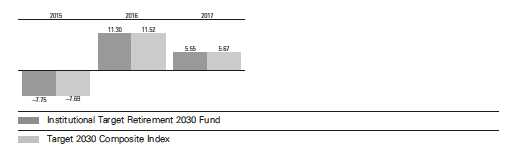
For a benchmark description, see the Glossary.
Note: For 2017, performance data reflect the six months ended March 31, 2017.
| Average Annual Total Returns: Period Ended March 31, 2017 | |||||
| Since Inception | |||||
| Inception Date | One Year | Income | Capital | Total | |
| Institutional Target | |||||
| Retirement 2030 Fund | 6/26/2015 | 11.93% | 1.65% | 3.02% | 4.67% |
See Financial Highlights for dividend and capital gains information.
58
Institutional Target Retirement 2030 Fund
Financial Statements (unaudited)
Statement of Net Assets
As of March 31, 2017
The fund reports a complete list of its holdings in regulatory filings four times in each fiscal year, at the quarter-ends. For the second and fourth fiscal quarters, the lists appear in the fund’s semiannual and annual reports to shareholders. For the first and third fiscal quarters, the fund files the lists with the Securities and Exchange Commission on Form N-Q. Shareholders can look up the fund’s Forms N-Q on the SEC’s website at sec.gov. Forms N-Q may also be reviewed and copied at the SEC’s Public Reference Room (see the back cover of this report for further information).
| Market | ||
| Value• | ||
| Shares | ($000) | |
| Investment Companies (100.0%) | ||
| U.S. Stock Fund (43.0%) | ||
| Vanguard Total Stock Market Index Fund Institutional Shares | 111,036,358 | 6,558,918 |
| International Stock Fund (28.9%) | ||
| Vanguard Total International Stock Index Fund Investor Shares | 277,624,532 | 4,419,783 |
| U.S. Bond Fund (19.7%) | ||
| 1 Vanguard Total Bond Market II Index Fund Investor Shares | 283,304,165 | 3,014,356 |
| International Bond Fund (8.4%) | ||
| Vanguard Total International Bond Index Fund Admiral Shares | 59,032,951 | 1,275,702 |
| Total Investment Companies (Cost $14,184,421) | 15,268,759 | |
| Temporary Cash Investment (0.0%) | ||
| Money Market Fund (0.0%) | ||
| 1 Vanguard Market Liquidity Fund, 0.965% (Cost $2,744) | 27,433 | 2,744 |
| Total Investments (100.0%) (Cost $14,187,165) | 15,271,503 | |
| Amount | ||
| ($000) | ||
| Other Assets and Liabilities (0.0%) | ||
| Other Assets | 110,111 | |
| Liabilities | (103,546) | |
| 6,565 | ||
| Net Assets (100%) | ||
| Applicable to 725,052,423 outstanding $.001 par value shares of | ||
| beneficial interest (unlimited authorization) | 15,278,068 | |
| Net Asset Value Per Share | $21.07 | |
59
| Institutional Target Retirement 2030 Fund | |
| Amount | |
| ($000) | |
| Statement of Assets and Liabilities | |
| Assets | |
| Investments in Securities, at Value—Affiliated Vanguard Funds | 15,271,503 |
| Receivables for Investment Securities Sold | 17,152 |
| Receivables for Accrued Income | 7,113 |
| Receivables for Capital Shares Issued | 85,846 |
| Total Assets | 15,381,614 |
| Liabilities | |
| Payables for Investment Securities Purchased | 101,613 |
| Payables for Capital Shares Redeemed | 1,933 |
| Total Liabilities | 103,546 |
| Net Assets | 15,278,068 |
| At March 31, 2017, net assets consisted of: | |
| Amount | |
| ($000) | |
| Paid-in Capital | 14,132,109 |
| Undistributed Net Investment Income | 60,653 |
| Accumulated Net Realized Gains | 968 |
| Unrealized Appreciation (Depreciation) | 1,084,338 |
| Net Assets | 15,278,068 |
• See Note A in Notes to Financial Statements.
1 Affiliated fund available only to Vanguard funds and certain trusts and accounts managed by Vanguard. Rate shown for Vanguard Market
Liquidity Fund is the 7-day yield.
See accompanying Notes, which are an integral part of the Financial Statements.
60
Institutional Target Retirement 2030 Fund
Statement of Operations
| Six Months Ended | |
| March 31, 2017 | |
| ($000) | |
| Investment Income | |
| Income | |
| Income Distributions Received from Affiliated Funds | 148,083 |
| Net Investment Income—Note B | 148,083 |
| Realized Net Gain (Loss) | |
| Capital Gain Distributions Received from Affiliated Funds | 2,551 |
| Affiliated Investment Securities Sold | 342 |
| Realized Net Gain (Loss) | 2,893 |
| Change in Unrealized Appreciation (Depreciation) of Investment Securities | 606,281 |
| Net Increase (Decrease) in Net Assets Resulting from Operations | 757,257 |
See accompanying Notes, which are an integral part of the Financial Statements.
61
Institutional Target Retirement 2030 Fund
Statement of Changes in Net Assets
| Six Months Ended | Year Ended | |
| March 31, | September 30, | |
| 2017 | 2016 | |
| ($000) | ($000) | |
| Increase (Decrease) in Net Assets | ||
| Operations | ||
| Net Investment Income | 148,083 | 197,264 |
| Realized Net Gain (Loss) | 2,893 | 2,058 |
| Change in Unrealized Appreciation (Depreciation) | 606,281 | 706,266 |
| Net Increase (Decrease) in Net Assets Resulting from Operations | 757,257 | 905,588 |
| Distributions | ||
| Net Investment Income | (241,723) | (58,300) |
| Realized Capital Gain1 | (3,875) | (358) |
| Total Distributions | (245,598) | (58,658) |
| Capital Share Transactions | ||
| Issued | 3,531,784 | 6,510,570 |
| Issued in Lieu of Cash Distributions | 243,168 | 58,472 |
| Redeemed | (494,309) | (361,459) |
| Net Increase (Decrease) from Capital Share Transactions | 3,280,643 | 6,207,583 |
| Total Increase (Decrease) | 3,792,302 | 7,054,513 |
| Net Assets | ||
| Beginning of Period | 11,485,766 | 4,431,253 |
| End of Period2 | 15,278,068 | 11,485,766 |
| 1 Includes fiscal 2017 and 2016 short-term gain distributions totaling $2,153,000 and $358,000 respectively. Short-term gain distributions | ||
| are treated as ordinary income dividends for tax purposes. | ||
| 2 Net Assets—End of Period includes undistributed (overdistributed) net investment income of $60,653,000 and $154,293,000. | ||
See accompanying Notes, which are an integral part of the Financial Statements.
62
Institutional Target Retirement 2030 Fund
Financial Highlights
| Six Months | Year | June 26, | |
| Ended | Ended | 20151 to | |
| March 31, | Sept. 30, | Sept. 30, | |
| For a Share Outstanding Throughout Each Period | 2017 | 2016 | 2015 |
| Net Asset Value, Beginning of Period | $20.36 | $18.45 | $20.00 |
| Investment Operations | |||
| Net Investment Income | . 204 | . 455 2 | .1452 |
| Capital Gain Distributions Received | .004 | .0042 | — |
| Net Realized and Unrealized Gain (Loss) on Investments | .901 | 1.615 | (1.695) |
| Total from Investment Operations | 1.109 | 2.074 | (1.550) |
| Distributions | |||
| Dividends from Net Investment Income | (.393) | (.163) | — |
| Distributions from Realized Capital Gains | (.006) | (.001) | — |
| Total Distributions | (.399) | (.164) | — |
| Net Asset Value, End of Period | $21.07 | $20.36 | $18.45 |
| Total Return | 5.55% | 11.30% | -7.75% |
| Ratios/Supplemental Data | |||
| Net Assets, End of Period (Millions) | $15,278 | $11,486 | $4,431 |
| Ratio of Total Expenses to Average Net Assets | — | — | — |
| Acquired Fund Fees and Expenses | 0.09% | 0.10% | 0.10%3 |
| Ratio of Net Investment Income to Average Net Assets | 2.27% | 2.34% | 2.64%3 |
| Portfolio Turnover Rate | 5% | 3% | 1% |
| The expense ratio, acquired fund fees and expenses, net investment income ratio, and turnover rate for the current period have been annualized. | |||
| 1 Inception. | |||
| 2 Calculated based on average shares outstanding. | |||
| 3 Annualized. | |||
See accompanying Notes, which are an integral part of the Financial Statements.
63
Institutional Target Retirement 2030 Fund
Notes to Financial Statements
Vanguard Institutional Target Retirement 2030 Fund is registered under the Investment Company Act of 1940 as an open-end investment company, or mutual fund. The fund follows a balanced investment strategy by investing in selected Vanguard funds to achieve its targeted allocation of assets to U.S. and international stocks, and U.S. and international bonds. Financial statements and other information about each underlying fund are available on vanguard.com.
A. The following significant accounting policies conform to generally accepted accounting principles for U.S. investment companies. The fund consistently follows such policies in preparing its financial statements.
1. Security Valuation: Investments are valued at the net asset value of each underlying Vanguard fund determined as of the close of the New York Stock Exchange (generally 4 p.m., Eastern time) on the valuation date.
2. Federal Income Taxes: The fund intends to continue to qualify as a regulated investment company and distribute all of its taxable income. Management has analyzed the fund’s tax positions taken for all open federal income tax years (September 30, 2015–2016), and for the period ended March 31, 2017, and has concluded that no provision for federal income tax is required in the fund’s financial statements.
3. Distributions: Distributions to shareholders are recorded on the ex-dividend date.
4. Credit Facility: The fund and certain other funds managed by The Vanguard Group (“Vanguard”) participate in a $3.1 billion committed credit facility provided by a syndicate of lenders pursuant to a credit agreement that may be renewed annually; each fund is individually liable for its borrowings, if any, under the credit facility. Borrowings may be utilized for temporary and emergency purposes, and are subject to the fund’s regulatory and contractual borrowing restrictions. The participating funds are charged administrative fees and an annual commitment fee of 0.10% of the undrawn amount of the facility; these fees are allocated to the funds based on a method approved by the fund’s board of trustees and borne by the funds in which the fund invests (see Note B). Any borrowings under this facility bear interest at a rate based upon the higher of the one-month London Interbank Offered Rate, federal funds effective rate, or overnight bank funding rate plus an agreed-upon spread.
The fund had no borrowings outstanding at March 31, 2017, or at any time during the period then ended.
5. Other: Income and capital gain distributions received are recorded on the ex-dividend date. Security transactions are accounted for on the date securities are bought or sold. Costs used to determine realized gains (losses) on the sale of investment securities are those of the specific securities sold.
B. In accordance with the terms of a Funds’ Service Agreement (the “FSA”) between Vanguard and the fund, Vanguard furnishes to the fund investment advisory, corporate management, administrative, marketing, and distribution services at Vanguard’s cost of operations (as defined by the FSA). These costs of operations are allocated to the fund based on methods and guidelines approved by the board of trustees. The FSA provides that expenses otherwise allocable to Vanguard funds-of-funds may be reduced or eliminated to the extent of savings realized by the underlying Vanguard funds by virtue of being part of a fund-of-funds. Accordingly, all expenses for services provided by Vanguard to the fund and all other expenses incurred by the fund during the period ended March 31, 2017, were borne by the underlying Vanguard funds in which the fund invests. The fund’s trustees and officers are also trustees and officers, respectively, of the underlying Vanguard funds, as well as directors and employees, respectively, of Vanguard.
64
Institutional Target Retirement 2030 Fund
C. Various inputs may be used to determine the value of the fund’s investments. These inputs are summarized in three broad levels for financial statement purposes. The inputs or methodologies used to value securities are not necessarily an indication of the risk associated with investing in those securities.
Level 1—Quoted prices in active markets for identical securities.
Level 2—Other significant observable inputs (including quoted prices for similar securities, interest rates, prepayment speeds, credit risk, etc.).
Level 3—Significant unobservable inputs (including the fund’s own assumptions used to determine the fair value of investments).
At March 31, 2017, 100% of the market value of the fund’s investments was determined based on Level 1 inputs.
D. Distributions are determined on a tax basis and may differ from net investment income and realized capital gains for financial reporting purposes. Differences may be permanent or temporary. Permanent differences are reclassified among capital accounts in the financial statements to reflect their tax character. Temporary differences arise when certain items of income, expense, gain, or loss are recognized in different periods for financial statement and tax purposes. These differences will reverse at some time in the future. Differences in classification may also result from the treatment of short-term gains as ordinary income for tax purposes. The fund’s tax-basis capital gains and losses are determined only at the end of each fiscal year.
At March 31, 2017, the cost of investment securities for tax purposes was $14,187,165,000. Net unrealized appreciation of investment securities for tax purposes was $1,084,338,000, consisting of unrealized gains of $1,112,020,000 on securities that had risen in value since their purchase and $27,682,000 in unrealized losses on securities that had fallen in value since their purchase.
E. Capital shares issued and redeemed were:
| Six Months Ended | Year Ended | |
| March 31, 2017 | September 30, 2016 | |
| Shares | Shares | |
| (000) | (000) | |
| Issued | 172,832 | 339,804 |
| Issued in Lieu of Cash Distributions | 12,146 | 3,052 |
| Redeemed | (24,195) | (18,710) |
| Net Increase (Decrease) in Shares Outstanding | 160,783 | 324,146 |
At March 31, 2017, one shareholder was the record or beneficial owner of 34% of the fund’s net assets. If the shareholder were to redeem its investment in the fund, the redemption might lead to the realization of taxable capital gains.
65
Institutional Target Retirement 2030 Fund
F. Transactions during the period in affiliated underlying Vanguard funds were as follows:
| Current Period Transactions | ||||||
| Sept. 30, | Proceeds | March 31, | ||||
| 2016 | from | Capital Gain | 2017 | |||
| Market | Purchases | Securities | Distributions | Market | ||
| Value | at Cost | Sold | Income | Received | Value | |
| ($000) | ($000) | ($000) | ($000) | ($000) | ($000) | |
| Vanguard Market Liquidity Fund | 3 | NA1 | NA1 | 14 | — | 2,744 |
| Vanguard Total Bond Market II | ||||||
| Index Fund | 2,179,713 | 1,046,958 | 132,781 | 29,662 | 2,551 | 3,014,356 |
| Vanguard Total International | ||||||
| Bond Index Fund | 947,145 | 359,817 | — | 12,386 | — | 1,275,702 |
| Vanguard Total International | ||||||
| Stock Index Fund | 3,333,395 | 873,697 | 11,036 | 43,173 | — | 4,419,783 |
| Vanguard Total Stock Market | ||||||
| Index Fund | 4,983,834 | 1,286,488 | 205,094 | 62,848 | — | 6,558,918 |
| Total | 11,444,090 | 3,566,960 | 348,911 | 148,083 | 2,551 | 15,271,503 |
| 1 Not applicable—purchases and sales are for temporary cash investment purposes. | ||||||
G. Management has determined that no material events or transactions occurred subsequent to March 31, 2017, that would require recognition or disclosure in these financial statements.
66
About Your Fund’s Expenses
As a shareholder of the fund, you incur ongoing costs, which include costs for portfolio management, administrative services, and shareholder reports (like this one), among others. Operating expenses, which are deducted from a fund’s gross income, directly reduce the investment return of the fund.
A typical fund’s expenses are expressed as a percentage of its average net assets. The Institutional Target Retirement Funds have no direct expenses, but each fund bears its proportionate share of the costs for the underlying funds in which it invests. These indirect expenses make up the acquired fund fees and expenses, also expressed as a percentage of average net assets.
The following examples are intended to help you understand the ongoing cost (in dollars) of investing in your fund and to compare these costs with those of other mutual funds. The examples are based on an investment of $1,000 made at the beginning of the period shown and held for the entire period. The costs were calculated using the acquired fund fees and expenses for each Institutional Target Retirement Fund.
The accompanying table illustrates your fund’s costs in two ways:
• Based on actual fund return. This section helps you to estimate the actual expenses that you paid over the period. The ”Ending Account Value“ shown is derived from the fund‘s actual return, and the third column shows the dollar amount that would have been paid by an investor who started with $1,000 in the fund. You may use the information here, together with the amount you invested, to estimate the expenses that you paid over the period.
To do so, simply divide your account value by $1,000 (for example, an $8,600 account value divided by $1,000 = 8.6), then multiply the result by the number given for your fund under the heading ”Expenses Paid During Period.“
• Based on hypothetical 5% yearly return. This section is intended to help you compare your fund‘s costs with those of other mutual funds. It assumes that the fund had a yearly return of 5% before expenses, but that the expense ratio is unchanged. In this case—because the return used is not the fund’s actual return—the results do not apply to your investment. The example is useful in making comparisons because the Securities and Exchange Commission requires all mutual funds to calculate expenses based on a 5% return. You can assess your fund’s costs by comparing this hypothetical example with the hypothetical examples that appear in shareholder reports of other funds.
Note that the expenses shown in the table are meant to highlight and help you compare ongoing costs only and do not reflect transaction costs incurred by the fund for buying and selling securities. Further, the expenses do not include any purchase, redemption, or account service fees described in the fund prospectus. If such fees were applied to your account, your costs would be higher. Your fund does not carry a “sales load.”
The calculations assume no shares were bought or sold during the period. Your actual costs may have been higher or lower, depending on the amount of your investment and the timing of any purchases or redemptions.
You can find more information about the fund’s expenses, including annual expense ratios, in the Financial Statements section of this report. For additional information on operating expenses and other shareholder costs, please refer to your fund’s current prospectus.
67
| Six Months Ended March 31, 2017 | |||
| Beginning | Ending | Expenses | |
| Account Value | Account Value | Paid During | |
| 9/30/2016 | 3/31/2017 | Period | |
| Based on Actual Fund Return | |||
| Institutional Target Retirement Income Fund | $1,000.00 | $1,014.44 | $0.45 |
| Institutional Target Retirement 2010 Fund | $1,000.00 | $1,015.23 | $0.45 |
| Institutional Target Retirement 2015 Fund | $1,000.00 | $1,028.85 | $0.46 |
| Institutional Target Retirement 2020 Fund | $1,000.00 | $1,039.26 | $0.46 |
| Institutional Target Retirement 2025 Fund | $1,000.00 | $1,047.82 | $0.46 |
| Institutional Target Retirement 2030 Fund | $1,000.00 | $1,055.51 | $0.46 |
| Based on Hypothetical 5% Yearly Return | |||
| Institutional Target Retirement Income Fund | $1,000.00 | $1,024.48 | $0.45 |
| Institutional Target Retirement 2010 Fund | $1,000.00 | $1,024.48 | $0.45 |
| Institutional Target Retirement 2015 Fund | $1,000.00 | $1,024.48 | $0.45 |
| Institutional Target Retirement 2020 Fund | $1,000.00 | $1,024.48 | $0.45 |
| Institutional Target Retirement 2025 Fund | $1,000.00 | $1,024.48 | $0.45 |
| Institutional Target Retirement 2030 Fund | $1,000.00 | $1,024.48 | $0.45 |
The calculations are based on the acquired fund fees and expenses for the most recent six-month period. The funds’ annualized expense
figures for that period are (in order as listed from top to bottom above) 0.09%, 0.09%, 0.09%, 0.09%, 0.09%, and 0.09%. The dollar amounts
shown as ”Expenses Paid” are equal to the annualized expense figures for the underlying funds multiplied by the average account value over
the period, multiplied by the number of days in the most recent six-month period, then divided by the number of days in the most recent
12-month period (182/365).
68
Trustees Approve Advisory Arrangements
The board of trustees of Vanguard Institutional Target Retirement Funds has renewed each fund’s investment advisory arrangement with The Vanguard Group, Inc. (Vanguard), through its Equity Index Group. The board determined that continuing each fund’s internalized management structure was in the best interests of the funds and their shareholders.
The board based its decision upon an evaluation of the advisor’s investment staff, portfolio management process, and performance. This evaluation included information provided to the board by Vanguard’s Portfolio Review Department, which is responsible for fund and advisor oversight and product management. The Portfolio Review Department met regularly with the advisor and made monthly presentations to the board during the fiscal year that directed the board’s focus to relevant information and topics.
The board, or an investment committee made up of board members, also received information throughout the year during advisor presentations. For each advisor presentation, the board was provided with letters and reports that included information about, among other things, the advisory firm and the advisor’s assessment of the investment environment, portfolio performance, and portfolio characteristics.
In addition, the board received monthly reports, which included a Market and Economic Report, a Fund Dashboard Monthly Summary, and a Fund Performance Report.
Prior to their meeting, the trustees were provided with a memo and materials that summarized the information they received over the course of the year. They also considered the factors discussed below, among others. However, no single factor determined whether the board approved the arrangements. Rather, it was the totality of the circumstances that drove the board’s decision.
Nature, extent, and quality of services
The board reviewed the quality of the investment management services provided to the funds and took into account the organizational depth and stability of the advisor. The board considered that Vanguard has been managing investments for more than three decades. The Equity Index Group adheres to a sound, disciplined investment management process; the team has considerable experience, stability, and depth.
The board concluded that Vanguard’s experience, stability, depth, and performance, among other factors, warranted continuation of the advisory arrangements.
Investment performance
The board considered the performance of each fund since its inception in 2015, including any periods of outperformance or underperformance compared with a relevant benchmark index and peer group. The board concluded that the performance was such that the advisory arrangements should continue. Information about each fund’s most recent performance can be found in the Performance Summary pages of this report.
Cost
The board concluded that the funds’ acquired fund fees and expenses were well below the expense ratios charged by funds in their respective peer groups. The funds do not incur advisory expenses directly; however, the board noted that each of the underlying funds in which the funds invest has advisory expenses well below the relevant peer-group average. Information about the funds’ acquired fund fees and expenses appears in the About Your Fund’s Expenses section of this report as well as in the Financial Statements sections.
69
The board did not conduct a profitability analysis of Vanguard, because of Vanguard’s unique “at-cost” structure. Unlike most other mutual fund management companies, Vanguard is owned by the funds it oversees and produces “profits” only in the form of reduced expenses for fund shareholders.
The benefit of economies of scale
The board concluded that Vanguard’s at-cost arrangements with the Institutional Target Retirement Funds and their underlying funds ensures that the funds will realize economies of scale as the assets of the underlying funds grow, with the cost to shareholders declining as assets increase.
The board will consider whether to renew the advisory arrangements again after a one-year period.
70
Glossary
30-Day SEC Yield. A fund’s 30-day SEC yield is derived using a formula specified by the U.S. Securities and Exchange Commission. Under the formula, data related to the fund’s security holdings in the previous 30 days are used to calculate the fund’s hypothetical net income for that period, which is then annualized and divided by the fund’s estimated average net assets over the calculation period. For the purposes of this calculation, a security’s income is based on its current market yield to maturity (for bonds), its actual income (for asset-backed securities), or its projected dividend yield (for stocks). Because the SEC yield represents hypothetical annualized income, it will differ—at times significantly—from the fund’s actual experience. As a result, the fund’s income distributions may be higher or lower than implied by the SEC yield.
Acquired Fund Fees and Expenses. Funds that invest in other Vanguard funds incur no direct expenses, but they do bear proportionate shares of the operating, administrative, and advisory expenses of the underlying funds, and they must pay any fees charged by those funds. The figure for acquired fund fees and expenses represents a weighted average of these underlying costs. Acquired is a term that the Securities and Exchange Commission applies to any mutual fund whose shares are owned by another fund.
Expense Ratio. A fund’s total annual operating expenses expressed as a percentage of the fund’s average net assets. The expense ratio includes management and administrative expenses, but does not include the transaction costs of buying and selling portfolio securities.
Inception Date. The date on which the assets of a fund (or one of its share classes) are first invested in accordance with the fund’s investment objective. For funds with a subscription period, the inception date is the day after that period ends. Investment performance is measured from the inception date.
Benchmark Information
Target 2010 Composite Index: Derived by applying the fund’s target asset allocation to the results of the following benchmarks: for international stocks of developed markets, the MSCI EAFE Index through December 15, 2010, the MSCI ACWI ex USA IMI Index through June 2, 2013, and the FTSE Global All Cap ex US Index thereafter; for emerging-market stocks, the Select Emerging Markets Index through August 23, 2006, the MSCI Emerging Markets Index through December 15, 2010, the MSCI ACWI ex USA IMI Index through June 2, 2013, and the FTSE Global All Cap ex US Index thereafter; for U.S. bonds, the Bloomberg Barclays U.S. Aggregate Bond Index through December 31, 2009, and the Bloomberg Barclays U.S. Aggregate Float Adjusted Index thereafter, as well as the Bloomberg Barclays U.S. Treasury Inflation Protected Securities Index through June 2, 2013, and the Bloomberg Barclays U.S. Treasury Inflation-Protected Securities (TIPS) 0–5 Year Index thereafter; for short-term reserves, the Citigroup Three-Month Treasury Bill Index through June 2, 2013; for international bonds, the Bloomberg Barclays Global Aggregate ex-USD Float Adjusted RIC Capped Index beginning June 3, 2013; and for U.S. stocks, the MSCI US Broad Market Index through June 2, 2013, and the CRSP US Total Market Index thereafter. International stock benchmark returns are adjusted for withholding taxes.
71
Target 2015 Composite Index: Derived by applying the fund’s target asset allocation to the results of the following benchmarks: for international stocks of developed markets, the MSCI EAFE Index through December 15, 2010, the MSCI ACWI ex USA IMI Index through June 2, 2013, and the FTSE Global All Cap ex US Index thereafter; for emerging-market stocks, the Select Emerging Markets Index through August 23, 2006, the MSCI Emerging Markets Index through December 15, 2010, the MSCI ACWI ex USA IMI Index through June 2, 2013, and the FTSE Global All Cap ex US Index thereafter; for U.S. bonds, the Bloomberg Barclays U.S. Aggregate Bond Index through December 31, 2009, and the Bloomberg Barclays U.S. Aggregate Float Adjusted Index thereafter, as well as the Bloomberg Barclays U.S. Treasury Inflation Protected Securities Index through June 2, 2013, and the Bloomberg Barclays U.S. Treasury Inflation-Protected Securities (TIPS) 0–5 Year Index thereafter; for international bonds, the Bloomberg Barclays Global Aggregate ex-USD Float Adjusted RIC Capped Index beginning June 3, 2013; and for U.S. stocks, the Dow Jones U.S. Total Stock Market Index (formerly known as the Dow Jones Wilshire 5000 Index) through April 22, 2005, the MSCI US Broad Market Index through June 2, 2013, and the CRSP US Total Market Index thereafter. International stock benchmark returns are adjusted for withholding taxes.
Target 2020 Composite Index: Derived by applying the fund’s target asset allocation to the results of the following benchmarks: for international stocks of developed markets, the MSCI EAFE Index through December 15, 2010, the MSCI ACWI ex USA IMI Index through June 2, 2013, and the FTSE Global All Cap ex US Index thereafter; for emerging-market stocks, the Select Emerging Markets Index through August 23, 2006, the MSCI Emerging Markets Index through December 15, 2010, the MSCI ACWI ex USA IMI Index through June 2, 2013, and the FTSE Global All Cap ex US Index thereafter; for U.S. bonds, the Bloomberg Barclays U.S. Aggregate Bond Index through December 31, 2009, and the Bloomberg Barclays U.S. Aggregate Float Adjusted Index thereafter; for international bonds, the Bloomberg Barclays Global Aggregate ex-USD Float Adjusted RIC Capped Index beginning June 3, 2013; and for U.S. stocks, the MSCI US Broad Market Index through June 2, 2013, and the CRSP US Total Market Index thereafter. International stock benchmark returns are adjusted for withholding taxes.
Target 2025 Composite Index: Derived by applying the fund’s target asset allocation to the results of the following benchmarks: for international stocks of developed markets, the MSCI EAFE Index through December 15, 2010, the MSCI ACWI ex USA IMI Index through June 2, 2013, and the FTSE Global All Cap ex US Index thereafter; for emerging-market stocks, the Select Emerging Markets Index through August 23, 2006, the MSCI Emerging Markets Index through December 15, 2010, the MSCI ACWI ex USA IMI Index through June 2, 2013, and the FTSE Global All Cap ex US Index thereafter; for U.S. bonds, the Bloomberg Barclays U.S. Aggregate Bond Index through December 31, 2009, and the Bloomberg Barclays U.S. Aggregate Float Adjusted Index thereafter; for international bonds, the Bloomberg Barclays Global Aggregate ex-USD Float Adjusted RIC Capped Index beginning June 3, 2013; and for U.S. stocks, the Dow Jones U.S. Total Stock Market Index (formerly known as the Dow Jones Wilshire 5000 Index) through April 22, 2005, the MSCI US Broad Market Index through June 2, 2013, and the CRSP US Total Market Index thereafter. International stock benchmark returns are adjusted for withholding taxes.
72
Target 2030 Composite Index: Derived by applying the fund’s target asset allocation to the results of the following benchmarks: for international stocks of developed markets, the MSCI EAFE Index through December 15, 2010, the MSCI ACWI ex USA IMI Index through June 2, 2013, and the FTSE Global All Cap ex US Index thereafter; for emerging-market stocks, the Select Emerging Markets Index through August 23, 2006, the MSCI Emerging Markets Index through December 15, 2010, the MSCI ACWI ex USA IMI Index through June 2, 2013, and the FTSE Global All Cap ex US Index thereafter; for U.S. bonds, the Bloomberg Barclays U.S. Aggregate Bond Index through December 31, 2009, and the Bloomberg Barclays U.S. Aggregate Float Adjusted Index thereafter; for international bonds, the Bloomberg Barclays Global Aggregate ex-USD Float Adjusted RIC Capped Index beginning June 3, 2013; and for U.S. stocks, the MSCI US Broad Market Index through June 2, 2013, and the CRSP US Total Market Index thereafter. International stock benchmark returns are adjusted for withholding taxes.
Target Income Composite Index: Derived by applying the fund’s target asset allocation to the results of the following benchmarks: for international stocks of developed markets, the MSCI EAFE Index through December 15, 2010, the MSCI ACWI ex USA IMI Index through June 2, 2013, and the FTSE Global All Cap ex US Index thereafter; for emerging-market stocks, the Select Emerging Markets Index through August 23, 2006, the MSCI Emerging Markets Index through December 15, 2010, the MSCI ACWI ex USA IMI Index through June 2, 2013, and the FTSE Global All Cap ex US Index thereafter; for U.S. bonds, the Bloomberg Barclays U.S. Aggregate Bond Index through December 31, 2009, and the Bloomberg Barclays U.S. Aggregate Float Adjusted Index thereafter, as well as the Bloomberg Barclays U.S. Treasury Inflation Protected Securities Index through June 2, 2013, and the Bloomberg Barclays U.S. Treasury Inflation-Protected Securities (TIPS) 0–5 Year Index thereafter; for short-term reserves, the Citigroup Three-Month Treasury Bill Index through June 2, 2013; for international bonds, the Bloomberg Barclays Global Aggregate ex-USD Float Adjusted RIC Capped Index beginning June 3, 2013; and for U.S. stocks, the Dow Jones U.S. Total Stock Market Index (formerly known as the Dow Jones Wilshire 5000 Index) through April 22, 2005, the MSCI US Broad Market Index through June 2, 2013, and the CRSP US Total Market Index thereafter. International stock benchmark returns are adjusted for withholding taxes.
73
This page intentionally left blank.
This page intentionally left blank.
The People Who Govern Your Fund
The trustees of your mutual fund are there to see that the fund is operated and managed in your best interests since, as a shareholder, you are a part owner of the fund. Your fund’s trustees also serve on the board of directors of The Vanguard Group, Inc., which is owned by the Vanguard funds and provides services to them on an at-cost basis.
A majority of Vanguard’s board members are independent, meaning that they have no affiliation with Vanguard or the funds they oversee, apart from the sizable personal investments they have made as private individuals. The independent board members have distinguished backgrounds in business, academia, and public service. Each of the trustees and executive officers oversees 195 Vanguard funds.
The following table provides information for each trustee and executive officer of the fund. The mailing address of the trustees and officers is P.O. Box 876, Valley Forge, PA 19482. More information about the trustees is in the Statement of Additional Information, which can be obtained, without charge, by contacting Vanguard at 800-662-7447, or online at vanguard.com.
InterestedTrustee1
F. William McNabb III
Born 1957. Trustee Since July 2009. Chairman of the Board. Principal Occupation(s) During the Past Five Years and Other Experience: Chairman of the Board of The Vanguard Group, Inc., and of each of the investment companies served by The Vanguard Group, since January 2010; Director of The Vanguard Group since 2008; Chief Executive Officer and President of The Vanguard Group, and of each of the investment companies served by The Vanguard Group, since 2008; Director of Vanguard Marketing Corporation; Managing Director of The Vanguard Group (1995–2008).
IndependentTrustees
Emerson U. Fullwood
Born 1948. Trustee Since January 2008. Principal Occupation(s) During the Past Five Years and Other Experience: Executive Chief Staff and Marketing Officer for North America and Corporate Vice President (retired 2008) of Xerox Corporation (document management products and services); Executive in Residence and 2009–2010 Distinguished Minett Professor at the Rochester Institute of Technology; Lead Director of SPX FLOW, Inc. (multi-industry manufacturing); Director of the United Way of Rochester, the University of Rochester Medical Center, Monroe Community College Foundation, North Carolina A&T University, and Roberts Wesleyan College.
Rajiv L. Gupta
Born 1945. Trustee Since December 2001.2 Principal Occupation(s) During the Past Five Years and Other Experience: Chairman and Chief Executive Officer (retired 2009) and President (2006–2008) of Rohm and Haas Co. (chemicals); Director of Arconic Inc. (diversified manufacturer), HP Inc. (printer and personal computer manufacturing), and Delphi Automotive plc (automotive components); Senior Advisor at New Mountain Capital.
Amy Gutmann
Born 1949. Trustee Since June 2006. Principal Occupation(s) During the Past Five Years and Other Experience: President of the University of Pennsylvania; Christopher H. Browne Distinguished Professor of Political Science, School of Arts and Sciences, and Professor of Communication, Annenberg School for Communication, with secondary faculty appointments in the Department of Philosophy, School of Arts and Sciences, and at the Graduate School of Education, University of Pennsylvania; Trustee of the National Constitution Center; Chair of the Presidential Commission for the Study of Bioethical Issues.
JoAnn Heffernan Heisen
Born 1950. Trustee Since July 1998. Principal Occupation(s) During the Past Five Years and Other Experience: Corporate Vice President and Chief Global Diversity Officer (retired 2008) and Member of the Executive Committee (1997–2008) of Johnson & Johnson (pharmaceuticals/medical devices/consumer products); Director of Skytop Lodge Corporation (hotels) and the Robert Wood Johnson Foundation; Member of the Advisory Board of the Institute for Women’s Leadership at Rutgers University.
F. Joseph Loughrey
Born 1949. Trustee Since October 2009. Principal Occupation(s) During the Past Five Years and Other Experience: President and Chief Operating Officer (retired 2009) of Cummins Inc. (industrial machinery); Chairman of the Board of Hillenbrand, Inc. (specialized consumer services), Oxfam America, and the Lumina
Foundation for Education; Director of SKF AB (industrial machinery), Hyster-Yale Materials Handling, Inc. (forklift trucks), and the V Foundation for Cancer Research; Member of the Advisory Council for the College of Arts and Letters and Chair of the Advisory Board to the Kellogg Institute for International Studies, both at the University of Notre Dame.
Mark Loughridge
Born 1953. Trustee Since March 2012. Principal Occupation(s) During the Past Five Years and Other Experience: Senior Vice President and Chief Financial Officer (retired 2013) at IBM (information technology services); Fiduciary Member of IBM’s Retirement Plan Committee (2004–2013); Director of the Dow Chemical Company; Member of the Council on Chicago Booth.
Scott C. Malpass
Born 1962. Trustee Since March 2012. Principal Occupation(s) During the Past Five Years and Other Experience: Chief Investment Officer and Vice President at the University of Notre Dame; Assistant Professor of Finance at the Mendoza College of Business at Notre Dame; Member of the Notre Dame 403(b) Investment Committee, the Board of Advisors for Spruceview Capital Partners, and the Investment Advisory Committee of Major League Baseball; Board Member of TIFF Advisory Services, Inc., and Catholic Investment Services, Inc. (investment advisors); Member of the Board of Superintendence of the Institute for the Works of Religion.
André F. Perold
Born 1952. Trustee Since December 2004. Principal Occupation(s) During the Past Five Years and Other Experience: George Gund Professor of Finance and Banking, Emeritus at the Harvard Business School (retired 2011); Chief Investment Officer and Co-Managing Partner of HighVista Strategies LLC (private investment firm); Overseer of the Museum of Fine Arts Boston.
Peter F. Volanakis
Born 1955. Trustee Since July 2009. Principal Occupation(s) During the Past Five Years and Other Experience: President and Chief Operating Officer (retired 2010) of Corning Incorporated (communications equipment); Chairman of the Board of Trustees of Colby-Sawyer College; Member of the Board of Hypertherm, Inc. (industrial cutting systems, software, and consumables).
Executive Officers
Glenn Booraem
Born 1967. Investment Stewardship Officer Since February 2017. Principal Occupation(s) During the Past Five Years and Other Experience: Principal of The Vanguard Group, Inc.; Treasurer (2015–2017), Controller (2010–2015), and Assistant Controller (2001–2010) of each of the investment companies served by The Vanguard Group.
Thomas J. Higgins
Born 1957. Chief Financial Officer Since September 2008. Principal Occupation(s) During the Past Five Years and Other Experience: Principal of The Vanguard Group, Inc.; Chief Financial Officer of each of the investment companies served by The Vanguard Group; Treasurer of each of the investment companies served by The Vanguard Group (1998–2008).
Peter Mahoney
Born 1974. Controller Since May 2015. Principal Occupation(s) During the Past Five Years and Other Experience: Principal of The Vanguard Group, Inc.; Controller of each of the investment companies served by The Vanguard Group; Head of International Fund Services at The Vanguard Group (2008–2014).
Anne E. Robinson
Born 1970. Secretary Since September 2016. Principal Occupation(s) During the Past Five Years and Other Experience: Managing Director of The Vanguard Group, Inc.; General Counsel of The Vanguard Group; Secretary of The Vanguard Group and of each of the investment companies served by The Vanguard Group; Director and Senior Vice President of Vanguard Marketing Corporation; Managing Director and General Counsel of Global Cards and Consumer Services at Citigroup (2014–2016); Counsel at American Express (2003–2014).
Michael Rollings
Born 1963. Treasurer Since February 2017. Principal Occupation(s) During the Past Five Years and Other Experience: Managing Director of The Vanguard Group, Inc.; Treasurer of each of the investment companies served by The Vanguard Group; Executive Vice President and Chief Financial Officer of MassMutual Financial Group (2006–2016).
| Vanguard Senior Management Team | |
| Mortimer J. Buckley | James M. Norris |
| John James | Thomas M. Rampulla |
| Martha G. King | Glenn W. Reed |
| John T. Marcante | Karin A. Risi |
| Chris D. McIsaac | |
| Chairman Emeritus and Senior Advisor | |
| John J. Brennan | |
| Chairman, 1996–2009 | |
| Chief Executive Officer and President, 1996–2008 | |
| Founder | |
| John C. Bogle | |
| Chairman and Chief Executive Officer, 1974–1996 | |
1 Mr. McNabb is considered an “interested person,” as defined in the Investment Company Act of 1940, because he is an officer of the Vanguard funds.
2 December 2002 for Vanguard Equity Income Fund, the Vanguard Municipal Bond Funds, and the Vanguard State Tax-Exempt Funds.
 | |
| P.O. Box 2600 | |
| Valley Forge, PA 19482-2600 | |
| Connect with Vanguard® > vanguard.com | |
| Fund Information > 800-662-7447 | |
| Direct Investor Account Services > 800-662-2739 | |
| Institutional Investor Services > 800-523-1036 | |
| Text Telephone for People | |
| Who Are Deaf or Hard of Hearing > 800-749-7273 | |
| This material may be used in conjunction | |
| with the offering of shares of any Vanguard | |
| fund only if preceded or accompanied by | |
| the fund’s current prospectus. | |
| All comparative mutual fund data are from Lipper, a | |
| Thomson Reuters Company, or Morningstar, Inc., unless | |
| otherwise noted. | |
| You can obtain a free copy of Vanguard’s proxy voting | |
| guidelines by visiting vanguard.com/proxyreporting or by | |
| calling Vanguard at 800-662-2739. The guidelines are | |
| also available from the SEC’s website, sec.gov. In | |
| addition, you may obtain a free report on how your fund | |
| voted the proxies for securities it owned during the 12 | |
| months ended June 30. To get the report, visit either | |
| vanguard.com/proxyreporting or sec.gov. | |
| You can review and copy information about your fund at | |
| the SEC’s Public Reference Room in Washington, D.C. To | |
| find out more about this public service, call the SEC at | |
| 202-551-8090. Information about your fund is also | |
| available on the SEC’s website, and you can receive | |
| copies of this information, for a fee, by sending a | |
| request in either of two ways: via email addressed to | |
| publicinfo@sec.gov or via regular mail addressed to the | |
| Public Reference Section, Securities and Exchange | |
| Commission, Washington, DC 20549-1520. | |
| © 2017 The Vanguard Group, Inc. | |
| All rights reserved. | |
| Vanguard Marketing Corporation, Distributor. | |
| Q6732 052017 | |
Semiannual Report | March 31, 2017
Vanguard Institutional Target Retirement Funds
Vanguard Institutional Target Retirement 2035 Fund
Vanguard Institutional Target Retirement 2040 Fund
Vanguard Institutional Target Retirement 2045 Fund
Vanguard Institutional Target Retirement 2050 Fund
Vanguard Institutional Target Retirement 2055 Fund
Vanguard Institutional Target Retirement 2060 Fund
A new format, unwavering commitment
As you begin reading this report, you’ll notice that we’ve made some improvements to the opening sections—based on feedback from you, our clients.
Page 1 starts with a new ”Your Fund’s Performance at a Glance,” a concise, handy summary of how your fund performed during the period.
In the renamed ”Chairman’s Perspective,” Bill McNabb will focus on enduring principles and investment insights.
We’ve modified some tables, and eliminated some redundancy, but we haven’t removed any information.
At Vanguard, we’re always looking for better ways to communicate and to help you make sound investment decisions. Thank you for entrusting your assets to us.
| Contents | |
| Your Fund’s Performance at a Glance. | 1 |
| Chairman’s Perspective. | 3 |
| Institutional Target Retirement 2035 Fund. | 7 |
| Institutional Target Retirement 2040 Fund. | 17 |
| Institutional Target Retirement 2045 Fund. | 27 |
| Institutional Target Retirement 2050 Fund. | 37 |
| Institutional Target Retirement 2055 Fund. | 47 |
| Institutional Target Retirement 2060 Fund. | 57 |
| About Your Fund’s Expenses. | 67 |
| Trustees Approve Advisory Arrangement. | 69 |
| Glossary. | 71 |
Please note: The opinions expressed in this report are just that—informed opinions. They should not be considered promises or advice.
Also, please keep in mind that the information and opinions cover the period through the date on the front of this report. Of course, the
risks of investing in your fund are spelled out in the prospectus.
See the Glossary for definitions of investment terms used in this report.
About the cover: No matter what language you speak, Vanguard has one consistent message and set of principles. Our primary
focus is on you, our clients. We conduct our business with integrity as a faithful steward of your assets. This message is shown
translated into seven languages, reflecting our expanding global presence.
Your Fund’s Performance at a Glance
• For the six months ended March 31, 2017, U.S. stock markets returned about 10% and international stock markets returned nearly 7%.
• U.S. bonds returned about –2%. International bonds also returned about –2% for U.S.-based investors.
• The six Vanguard Institutional Target Retirement Funds covered in this report recorded returns ranging from 6.43% for the Institutional Target Retirement 2035 Fund to 7.58% for the Institutional Target Retirement 2055 Fund. (Funds with retirement dates of 2010 through 2030, as well as the Institutional Target Retirement Income Fund, are covered in a separate report.)
• Each fund generated returns that were in line with those of its composite benchmark after expenses and surpassed the average return of its peers.
• Vanguard Institutional Target Retirement Funds are designed to reach an allocation of 70% bonds and 30% stocks within seven years after their target date.
| Total Returns: Six Months Ended March 31, 2017 | |
| Total | |
| Returns | |
| Vanguard Institutional Target Retirement 2035 Fund | 6.43% |
| Target 2035 Composite Index | 6.50 |
| Mixed-Asset Target 2035 Funds Average | 6.14 |
| For a benchmark description, see the Glossary. | |
| Mixed-Asset Target 2035 Funds Average: Derived from data provided by Lipper, a Thomson Reuters Company. |
| Vanguard Institutional Target Retirement 2040 Fund | 7.26% |
| Target 2040 Composite Index | 7.34 |
| Mixed-Asset Target 2040 Funds Average | 6.47 |
| For a benchmark description, see the Glossary. | |
| Mixed-Asset Target 2040 Funds Average: Derived from data provided by Lipper, a Thomson Reuters Company. |
| Vanguard Institutional Target Retirement 2045 Fund | 7.54% |
| Target 2045 Composite Index | 7.62 |
| Mixed-Asset Target 2045 Funds Average | 7.03 |
| For a benchmark description, see the Glossary. | |
| Mixed-Asset Target 2045 Funds Average: Derived from data provided by Lipper, a Thomson Reuters Company. |
1
| Total | |
| Returns | |
| Vanguard Institutional Target Retirement 2050 Fund | 7.54% |
| Target 2050 Composite Index | 7.62 |
| Mixed-Asset Target 2050 Funds Average | 6.89 |
| For a benchmark description, see the Glossary. | |
| Mixed-Asset Target 2050 Funds Average: Derived from data provided by Lipper, a Thomson Reuters Company. |
| Vanguard Institutional Target Retirement 2055 Fund | 7.58% |
| Target 2055 Composite Index | 7.62 |
| Mixed-Asset Target 2055+ Funds Average | 7.32 |
| For a benchmark description, see the Glossary. | |
| Mixed-Asset Target 2055+ Funds Average: Derived from data provided by Lipper, a Thomson Reuters Company. |
| Vanguard Institutional Target Retirement 2060 Fund | 7.53% |
| Target 2060 Composite Index | 7.62 |
| Mixed-Asset Target 2055+ Funds Average | 7.32 |
| For a benchmark description, see the Glossary. | |
| Mixed-Asset Target 2055+ Funds Average: Derived from data provided by Lipper, a Thomson Reuters Company. |
Investments in Target Retirement Funds are subject to the risks of their underlying funds. The year in the fund name refers
to the approximate year (the target date) when an investor in the fund would retire and leave the work force. The fund will
gradually shift its emphasis from more aggressive investments to more conservative ones based on its target date. An
investment in a Target Retirement Fund is not guaranteed at any time, including on or after the target date.
2
Chairman’s Perspective
Bill McNabb
Chairman and Chief Executive Officer
Dear Shareholder,
For many people, including me, falling interest rates have been the general trend in the bond market throughout our working lives. At the beginning of 1983, the year I graduated from business school, the yield of the benchmark 10-year U.S. Treasury note stood at more than 10%. It was less than 2.5% at the beginning of 2017.
Because bond prices move in the opposite direction from rates, my career happens to have overlapped with the greatest bull market for bonds in history.
It appears that may be changing. And, of course, there’s no shortage of advice about how to prepare for the shift.
Rates may be headed higher (really)
This bond bull market has reminded us time and again just how hard it is to predict when rates will rise or fall and by how much. If you follow bonds, you might recall the markets bracing for a sustained rate increase back in 2010 as the economy pulled out of recession, or again in 2013 when the Federal Reserve said it would start tapering its bond purchases, or again at the end of 2015 when the Fed raised short-term rates for the first time in almost a decade. And yet, prognostications notwithstanding, interest rates remained anchored near historical lows.
That said, rates seem to be on an upswing. With economic activity picking up, wages starting to move higher, and inflation coming
3
off recent lows, the Fed has nudged short-term rates higher twice in recent months and has signaled that further gradual increases are likely through 2018. The perceived pro-growth stance of the new U.S. administration also has played a role in framing a case for higher rates.
Short-term pain, longer-term gain
Bond investors are understandably concerned. If interest rates shoot up, the market value of bonds will drop sharply, with prices falling to bring yields in line with the new, prevailing higher rates. That’s the potential short-term pain. But long-term investors should actually want rates to go up. If you like bonds that pay 2%, you should love bonds that pay 4%, right?
There’s a simple—though imperfect—rule of thumb that helps make clear this point. If the time frame of your investing goal exceeds the time frame of your bond portfolio (a medium-term goal matched with short-term bonds, or a long-term goal paired with bonds not quite as long-term), rising rates will work out in your favor, maybe decidedly so.
Think of it this way: If you have a big cash need in the near future—say, a tuition bill coming due in a few years—and you own bonds that are long-term in nature, this time-frame mismatch could spell trouble if rates rise sharply; you’d be selling bonds that would be worth less. But if you’re saving to retire ten or 15 years down the road and rates are steadily rising, over time you’ll be earning higher and higher yields.
| Market Barometer | |||
| Total Returns | |||
| Periods Ended March 31, 2017 | |||
| Six | One | Five Years | |
| Months | Year | (Annualized) | |
| Stocks | |||
| Russell 1000 Index (Large-caps) | 10.09% | 17.43% | 13.26% |
| Russell 2000 Index (Small-caps) | 11.52 | 26.22 | 12.35 |
| Russell 3000 Index (Broad U.S. market) | 10.19 | 18.07 | 13.18 |
| FTSE All-World ex US Index (International) | 6.74 | 13.50 | 4.82 |
| Bonds | |||
| Bloomberg Barclays U.S. Aggregate Bond Index | |||
| (Broad taxable market) | -2.18% | 0.44% | 2.34% |
| Bloomberg Barclays Municipal Bond Index | |||
| (Broad tax-exempt market) | -2.10 | 0.15 | 3.24 |
| Citigroup Three-Month U.S. Treasury Bill Index | 0.21 | 0.34 | 0.10 |
| CPI | |||
| Consumer Price Index | 0.98% | 2.38% | 1.23% |
4
Josh Barrickman, our head of fixed income indexing for the Americas, calls it “the virtuous cycle of compounding interest at a higher rate.”
The bottom line is, you can end up better off than if rates haven’t risen because you’re earning more income, which over time more than washes away any price hit.
Beware of short-sighted, short-term moves
This logic can be difficult to grasp, tempting anxious bond investors to make drastic shifts to lessen the immediate pain of rising rates. Unfortunately, such moves can backfire.
Taking shelter in short-term bonds, for example, might seem like a good idea. Their prices generally hold up better than those of longer-term bonds in a rising-rate environment. But they also offer less income.
For example, when the market started worrying about rising rates in 2010, moving into short-term securities—and staying there—would have proved costly. Through 2016, those securities returned roughly half of what the broad U.S. bond market did.
Favoring high-yield bonds is another tack some investors take, expecting higher income to help cushion price declines.
| What has driven long-term returns for Vanguard bond funds? |
| Source: Vanguard. |
5
High-yield securities, however, typically perform best when stocks are rising, making them unlikely to zig when stocks zag.
We saw clear evidence of the correlation between stocks and high-yield bonds in the frantic markets following the United Kingdom’s vote to leave the European Union last year. From June 23 to June 27, both U.S. stocks and U.S. high-yield bonds lost ground. The broad U.S. bond market, meanwhile, climbed 1.2% as investors sought a safe haven.
Your portfolio is more than the sum of its parts
Different assets have different roles to play in a balanced and diversified portfolio. Stocks are valuable because they can produce higher returns over time, while bonds can provide a crucial counterweight to the volatility of stocks.
Perhaps the most important thing to keep in mind about bonds is that although their prices can fluctuate, they remain “fixed income” securities. Barring default, you can be certain of getting income until the bonds mature. It’s that income that drives returns for patient bond investors who resist the urge to jump in and out of the market, as you can see in the accompanying box.
A lot has changed since I first started following the bond market, but the important role that bonds can play in a balanced and diversified portfolio hasn’t.
As always, thank you for investing with Vanguard.
Sincerely,
F. William McNabb III
Chairman and Chief Executive Officer
April 14, 2017
6
Institutional Target Retirement 2035 Fund
Fund Profile
As of March 31, 2017
| Total Fund Characteristics | |
| Ticker Symbol | VITFX |
| 30-Day SEC Yield | 2.17% |
| Acquired Fund Fees and Expenses1 | 0.10% |
| Allocation to Underlying Vanguard Funds | |
| Vanguard Total Stock Market Index Fund | |
| Institutional Shares | 47.5% |
| Vanguard Total International Stock Index | |
| Fund Investor Shares | 31.9 |
| Vanguard Total Bond Market II Index Fund | |
| Investor Shares | 14.5 |
| Vanguard Total International Bond Index | |
| Fund Admiral Shares | 6.1 |
Fund Asset Allocation
1 This figure—drawn from the prospectus dated January 27, 2017—represents an estimate of the weighted average of the expense ratios and any
transaction fees charged by the underlying mutual funds (the ”acquired” funds) in which the Institutional Target Retirement 2035 Fund invests. The
fund does not charge any expenses or fees of its own. For the six months ended March 31, 2017, the annualized acquired fund fees and expenses
were 0.09%.
7
Institutional Target Retirement 2035 Fund
Performance Summary
All of the returns in this report represent past performance, which is not a guarantee of future results that may be achieved by the fund. (Current performance may be lower or higher than the performance data cited. For performance data current to the most recent month-end, visit our website at vanguard.com/performance.) Note, too, that both investment returns and principal value can fluctuate widely, so an investor’s shares, when sold, could be worth more or less than their original cost. The returns shown do not reflect taxes that a shareholder would pay on fund distributions or on the sale of fund shares.
Fiscal-Year Total Returns (%): June 26, 2015, Through March 31, 2017
For a benchmark description, see the Glossary.
Note: For 2017, performance data reflect the six months ended March 31, 2017.
| Average Annual Total Returns: Period Ended March 31, 2017 | |||||
| Since Inception | |||||
| Inception Date | One Year | Income | Capital | Total | |
| Institutional Target | |||||
| Retirement 2035 Fund | 6/26/2015 | 13.14% | 1.65% | 3.13% | 4.78% |
See Financial Highlights for dividend and capital gains information.
8
Institutional Target Retirement 2035 Fund
Financial Statements (unaudited)
Statement of Net Assets
As of March 31, 2017
The fund reports a complete list of its holdings in regulatory filings four times in each fiscal year, at the quarter-ends. For the second and fourth fiscal quarters, the lists appear in the fund’s semiannual and annual reports to shareholders. For the first and third fiscal quarters, the fund files the lists with the Securities and Exchange Commission on Form N-Q. Shareholders can look up the fund’s Forms N-Q on the SEC’s website at sec.gov. Forms N-Q may also be reviewed and copied at the SEC’s Public Reference Room (see the back cover of this report for further information).
| Market | ||
| Value• | ||
| Shares | ($000) | |
| Investment Companies (99.9%) | ||
| U.S. Stock Fund (47.5%) | ||
| Vanguard Total Stock Market Index Fund Institutional Shares | 113,481,377 | 6,703,345 |
| International Stock Fund (31.9%) | ||
| Vanguard Total International Stock Index Fund Investor Shares | 282,377,635 | 4,495,452 |
| U.S. Bond Fund (14.4%) | ||
| 1 Vanguard Total Bond Market II Index Fund Investor Shares | 191,525,112 | 2,037,827 |
| International Bond Fund (6.1%) | ||
| Vanguard Total International Bond Index Fund Admiral Shares | 39,928,218 | 862,849 |
| Total Investment Companies (Cost $12,995,453) | 14,099,473 | |
| Temporary Cash Investment (0.0%) | ||
| Money Market Fund (0.0%) | ||
| 1 Vanguard Market Liquidity Fund, 0.965% (Cost $5,156) | 51,547 | 5,156 |
| Total Investments (99.9%) (Cost $13,000,609) | 14,104,629 | |
| Other Assets and Liabilities (0.1%) | ||
| Other Assets | 103,990 | |
| Liabilities | (92,713) | |
| 11,277 | ||
| Net Assets (100%) | ||
| Applicable to 668,643,756 outstanding $.001 par value shares of | ||
| beneficial interest (unlimited authorization) | 14,115,906 | |
| Net Asset Value Per Share | $21.11 | |
9
Institutional Target Retirement 2035 Fund
| Amount | |
| ($000) | |
| Statement of Assets and Liabilities | |
| Assets | |
| Investments in Securities, at Value—Affiliated Vanguard Funds | 14,104,629 |
| Receivables for Investment Securities Sold | 20,238 |
| Receivables for Accrued Income | 4,797 |
| Receivables for Capital Shares Issued | 78,955 |
| Total Assets | 14,208,619 |
| Liabilities | |
| Payables for Investment Securities Purchased | 91,797 |
| Payables for Capital Shares Redeemed | 916 |
| Total Liabilities | 92,713 |
| Net Assets | 14,115,906 |
| At March 31, 2017, net assets consisted of: | |
| Amount | |
| ($000) | |
| Paid-in Capital | 12,955,410 |
| Undistributed Net Investment Income | 55,867 |
| Accumulated Net Realized Gains | 609 |
| Unrealized Appreciation (Depreciation) | 1,104,020 |
| Net Assets | 14,115,906 |
• See Note A in Notes to Financial Statements.
1 Affiliated fund available only to Vanguard funds and certain trusts and accounts managed by Vanguard. Rate shown for Vanguard Market
Liquidity Fund is the 7-day yield.
See accompanying Notes, which are an integral part of the Financial Statements.
10
Institutional Target Retirement 2035 Fund
Statement of Operations
| Six Months Ended | |
| March 31, 2017 | |
| ($000) | |
| Investment Income | |
| Income | |
| Income Distributions Received from Affiliated Funds | 136,814 |
| Net Investment Income—Note B | 136,814 |
| Realized Net Gain (Loss) | |
| Capital Gain Distributions Received from Affiliated Funds | 1,723 |
| Affiliated Investment Securities Sold | 268 |
| Realized Net Gain (Loss) | 1,991 |
| Change in Unrealized Appreciation (Depreciation) of Investment Securities | 655,292 |
| Net Increase (Decrease) in Net Assets Resulting from Operations | 794,097 |
See accompanying Notes, which are an integral part of the Financial Statements.
11
Institutional Target Retirement 2035 Fund
Statement of Changes in Net Assets
| Six Months Ended | Year Ended | |
| March 31, | September 30, | |
| 2017 | 2016 | |
| ($000) | ($000) | |
| Increase (Decrease) in Net Assets | ||
| Operations | ||
| Net Investment Income | 136,814 | 184,298 |
| Realized Net Gain (Loss) | 1,991 | 1,217 |
| Change in Unrealized Appreciation (Depreciation) | 655,292 | 688,907 |
| Net Increase (Decrease) in Net Assets Resulting from Operations | 794,097 | 874,422 |
| Distributions | ||
| Net Investment Income | (225,679) | (54,138) |
| Realized Capital Gain1 | (2,578) | — |
| Total Distributions | (228,257) | (54,138) |
| Capital Share Transactions | ||
| Issued | 2,992,901 | 6,102,339 |
| Issued in Lieu of Cash Distributions | 225,973 | 53,955 |
| Redeemed | (370,390) | (311,926) |
| Net Increase (Decrease) from Capital Share Transactions | 2,848,484 | 5,844,368 |
| Total Increase (Decrease) | 3,414,324 | 6,664,652 |
| Net Assets | ||
| Beginning of Period | 10,701,582 | 4,036,930 |
| End of Period2 | 14,115,906 | 10,701,582 |
1 Includes fiscal 2017 and 2016 short-term gain distributions totaling $1,489,000 and $0 respectively. Short-term gain distributions are treated
as ordinary income dividends for tax purposes.
2 Net Assets—End of Period includes undistributed (overdistributed) net investment income of $55,867,000 and $144,710,000.
See accompanying Notes, which are an integral part of the Financial Statements.
12
Institutional Target Retirement 2035 Fund
Financial Highlights
| Six Months | Year | June 26, | |
| Ended | Ended | 20151 to | |
| March 31, | Sept. 30, | Sept. 30, | |
| For a Share Outstanding Throughout Each Period | 2017 | 2016 | 2015 |
| Net Asset Value, Beginning of Period | $20.23 | $18.27 | $20.00 |
| Investment Operations | |||
| Net Investment Income | . 204 | . 457 2 | .1422 |
| Capital Gain Distributions Received | .003 | .003 | — |
| Net Realized and Unrealized Gain (Loss) on Investments | 1.072 | 1.664 | (1.872) |
| Total from Investment Operations | 1.279 | 2.124 | (1.730) |
| Distributions | |||
| Dividends from Net Investment Income | (.394) | (.164) | — |
| Distributions from Realized Capital Gains | (.005) | — | — |
| Total Distributions | (.399) | (.164) | — |
| Net Asset Value, End of Period | $21.11 | $20.23 | $18.27 |
| Total Return | 6.43% | 11.68% | -8.65% |
| Ratios/Supplemental Data | |||
| Net Assets, End of Period (Millions) | $14,116 | $10,702 | $4,037 |
| Ratio of Total Expenses to Average Net Assets | — | — | — |
| Acquired Fund Fees and Expenses | 0.09% | 0.10% | 0.10%3 |
| Ratio of Net Investment Income to Average Net Assets | 2.26% | 2.37% | 2.62%3 |
| Portfolio Turnover Rate | 5% | 2% | — |
| The expense ratio, acquired fund fees and expenses, net investment income ratio, and turnover rate for the current period have been annualized. | |||
| 1 Inception. | |||
| 2 Calculated based on average shares outstanding. | |||
| 3 Annualized. | |||
See accompanying Notes, which are an integral part of the Financial Statements.
13
Institutional Target Retirement 2035 Fund
Notes to Financial Statements
Vanguard Institutional Target Retirement 2035 Fund is registered under the Investment Company Act of 1940 as an open-end investment company, or mutual fund. The fund follows a balanced investment strategy by investing in selected Vanguard funds to achieve its targeted allocation of assets to U.S. and international stocks, and U.S. and international bonds. Financial statements and other information about each underlying fund are available on vanguard.com.
A. The following significant accounting policies conform to generally accepted accounting principles for U.S. investment companies. The fund consistently follows such policies in preparing its financial statements.
1. Security Valuation: Investments are valued at the net asset value of each underlying Vanguard fund determined as of the close of the New York Stock Exchange (generally 4 p.m., Eastern time) on the valuation date.
2. Federal Income Taxes: The fund intends to continue to qualify as a regulated investment company and distribute all of its taxable income. Management has analyzed the fund’s tax positions taken for all open federal income tax years (September 30, 2015–2016), and for the period ended March 31, 2017, and has concluded that no provision for federal income tax is required in the fund’s financial statements. 3. Distributions: Distributions to shareholders are recorded on the ex-dividend date.
4. Credit Facility: The fund and certain other funds managed by The Vanguard Group (“Vanguard”) participate in a $3.1 billion committed credit facility provided by a syndicate of lenders pursuant to a credit agreement that may be renewed annually; each fund is individually liable for its borrowings, if any, under the credit facility. Borrowings may be utilized for temporary and emergency purposes, and are subject to the fund’s regulatory and contractual borrowing restrictions. The participating funds are charged administrative fees and an annual commitment fee of 0.10% of the undrawn amount of the facility; these fees are allocated to the funds based on a method approved by the fund’s board of trustees and borne by the funds in which the fund invests (see Note B). Any borrowings under this facility bear interest at a rate based upon the higher of the one-month London Interbank Offered Rate, federal funds effective rate, or overnight bank funding rate plus an agreed-upon spread.
The fund had no borrowings outstanding at March 31, 2017, or at any time during the period then ended.
5. Other: Income and capital gain distributions received are recorded on the ex-dividend date. Security transactions are accounted for on the date securities are bought or sold. Costs used to determine realized gains (losses) on the sale of investment securities are those of the specific securities sold.
B. In accordance with the terms of a Funds’ Service Agreement (the “FSA”) between Vanguard and the fund, Vanguard furnishes to the fund investment advisory, corporate management, administrative, marketing, and distribution services at Vanguard’s cost of operations (as defined by the FSA). These costs of operations are allocated to the fund based on methods and guidelines approved by the board of trustees. The FSA provides that expenses otherwise allocable to Vanguard funds-of-funds may be reduced or eliminated to the extent of savings realized by the underlying Vanguard funds by virtue of being part of a fund-of-funds. Accordingly, all expenses for services provided by Vanguard to the fund and all other expenses incurred by the fund during the period ended March 31, 2017, were borne by the underlying Vanguard funds in which the fund invests. The fund’s trustees and officers are also trustees and officers, respectively, of the underlying Vanguard funds, as well as directors and employees, respectively, of Vanguard.
14
Institutional Target Retirement 2035 Fund
C. Various inputs may be used to determine the value of the fund’s investments. These inputs are summarized in three broad levels for financial statement purposes. The inputs or methodologies used to value securities are not necessarily an indication of the risk associated with investing in those securities.
Level 1—Quoted prices in active markets for identical securities.
Level 2—Other significant observable inputs (including quoted prices for similar securities, interest rates, prepayment speeds, credit risk, etc.).
Level 3—Significant unobservable inputs (including the fund’s own assumptions used to determine the fair value of investments).
At March 31, 2017, 100% of the market value of the fund’s investments was determined based on Level 1 inputs.
D. Distributions are determined on a tax basis and may differ from net investment income and realized capital gains for financial reporting purposes. Differences may be permanent or temporary. Permanent differences are reclassified among capital accounts in the financial statements to reflect their tax character. Temporary differences arise when certain items of income, expense, gain, or loss are recognized in different periods for financial statement and tax purposes. These differences will reverse at some time in the future. Differences in classification may also result from the treatment of short-term gains as ordinary income for tax purposes. The fund’s tax-basis capital gains and losses are determined only at the end of each fiscal year.
At March 31, 2017, the cost of investment securities for tax purposes was $12,995,453,000. Net unrealized appreciation of investment securities for tax purposes was $1,104,020,000, consisting of unrealized gains of $1,122,783,000 on securities that had risen in value since their purchase and $18,763,000 in unrealized losses on securities that had fallen in value since their purchase.
E. Capital shares issued and redeemed were:
| Six Months Ended | Year Ended | |
| March 31, 2017 | September 30, 2016 | |
| Shares | Shares | |
| (000) | (000) | |
| Issued | 146,639 | 321,366 |
| Issued in Lieu of Cash Distributions | 11,310 | 2,831 |
| Redeemed | (18,210) | (16,279) |
| Net Increase (Decrease) in Shares Outstanding | 139,739 | 307,918 |
At March 31, 2017, one shareholder was the record or beneficial owner of 31% of the fund’s net assets. If the shareholder were to redeem its investment in the fund, the redemption might lead to the realization of taxable capital gains.
15
Institutional Target Retirement 2035 Fund
F. Transactions during the period in affiliated underlying Vanguard funds were as follows:
| Current Period Transactions | ||||||
| Sept. 30, | Proceeds | March 31, | ||||
| 2016 | from | Capital Gain | 2017 | |||
| Market | Purchases | Securities | Distributions | Market | ||
| Value | at Cost | Sold | Income | Received | Value | |
| ($000) | ($000) | ($000) | ($000) | ($000) | ($000) | |
| Vanguard Market Liquidity Fund | 1,869 | NA1 | NA1 | 14 | — | 5,156 |
| Vanguard Total Bond Market II | ||||||
| Index Fund | 1,483,982 | 723,914 | 116,270 | 20,032 | 1,723 | 2,037,827 |
| Vanguard Total International | ||||||
| Bond Index Fund | 634,610 | 249,129 | — | 8,302 | — | 862,849 |
| Vanguard Total International | ||||||
| Stock Index Fund | 3,406,782 | 868,090 | 6,229 | 44,171 | — | 4,495,452 |
| Vanguard Total Stock Market | ||||||
| Index Fund | 5,140,542 | 1,239,179 | 179,816 | 64,295 | — | 6,703,345 |
| Total | 10,667,785 | 3,080,312 | 302,315 | 136,814 | 1,723 | 14,104,629 |
| 1 Not applicable—purchases and sales are for temporary cash investment purposes. | ||||||
G. Management has determined that no material events or transactions occurred subsequent to March 31, 2017, that would require recognition or disclosure in these financial statements.
16
Institutional Target Retirement 2040 Fund
Fund Profile
As of March 31, 2017
| Total Fund Characteristics | |
| Ticker Symbol | VIRSX |
| 30-Day SEC Yield | 2.18% |
| Acquired Fund Fees and Expenses1 | 0.10% |
| Allocation to Underlying Vanguard Funds | |
| Vanguard Total Stock Market Index Fund | |
| Institutional Shares | 52.1% |
| Vanguard Total International Stock Index | |
| Fund Investor Shares | 34.8 |
| Vanguard Total Bond Market II Index Fund | |
| Investor Shares | 9.2 |
| Vanguard Total International Bond Index | |
| Fund Admiral Shares | 3.9 |
Fund Asset Allocation
1 This figure—drawn from the prospectus dated January 27, 2017—represents an estimate of the weighted average of the expense ratios and any transaction fees charged by the underlying mutual funds (the ”acquired” funds) in which the Institutional Target Retirement 2040 Fund invests. The fund does not charge any expenses or fees of its own. For the six months ended March 31, 2017, the annualized acquired fund fees and expenses were 0.09%.
17
Institutional Target Retirement 2040 Fund
Performance Summary
All of the returns in this report represent past performance, which is not a guarantee of future results that may be achieved by the fund. (Current performance may be lower or higher than the performance data cited. For performance data current to the most recent month-end, visit our website at vanguard.com/performance.) Note, too, that both investment returns and principal value can fluctuate widely, so an investor’s shares, when sold, could be worth more or less than their original cost. The returns shown do not reflect taxes that a shareholder would pay on fund distributions or on the sale of fund shares.
Fiscal-Year Total Returns (%): June 26, 2015, Through March 31, 2017
For a benchmark description, see the Glossary.
Note: For 2017, performance data reflect the six months ended March 31, 2017.
| Average Annual Total Returns: Period Ended March 31, 2017 | |||||
| Since Inception | |||||
| Inception Date | One Year | Income | Capital | Total | |
| Institutional Target | |||||
| Retirement 2040 Fund | 6/26/2015 | 14.38% | 1.66% | 3.20% | 4.86% |
See Financial Highlights for dividend and capital gains information.
18
Institutional Target Retirement 2040 Fund
Financial Statements (unaudited)
Statement of Net Assets
As of March 31, 2017
The fund reports a complete list of its holdings in regulatory filings four times in each fiscal year, at the quarter-ends. For the second and fourth fiscal quarters, the lists appear in the fund’s semiannual and annual reports to shareholders. For the first and third fiscal quarters, the fund files the lists with the Securities and Exchange Commission on Form N-Q. Shareholders can look up the fund’s Forms N-Q on the SEC’s website at sec.gov. Forms N-Q may also be reviewed and copied at the SEC’s Public Reference Room (see the back cover of this report for further information).
| Market | ||
| Value• | ||
| Shares | ($000) | |
| Investment Companies (100.0%) | ||
| U.S. Stock Fund (52.1%) | ||
| Vanguard Total Stock Market Index Fund Institutional Shares | 103,721,104 | 6,126,806 |
| International Stock Fund (34.8%) | ||
| Vanguard Total International Stock Index Fund Investor Shares | 257,303,242 | 4,096,267 |
| U.S. Bond Fund (9.2%) | ||
| 1 Vanguard Total Bond Market II Index Fund Investor Shares | 101,477,881 | 1,079,725 |
| International Bond Fund (3.9%) | ||
| Vanguard Total International Bond Index Fund Admiral Shares | 21,062,219 | 455,154 |
| Total Investment Companies (Cost $10,747,132) | 11,757,952 | |
| Temporary Cash Investment (0.0%) | ||
| Money Market Fund (0.0%) | ||
| 1 Vanguard Market Liquidity Fund, 0.965% (Cost $4,205) | 42,041 | 4,205 |
| Total Investments (100.0%) (Cost $10,751,337) | 11,762,157 | |
| Other Assets and Liabilities (0.0%) | ||
| Other Assets | 81,539 | |
| Liabilities | (75,719) | |
| 5,820 | ||
| Net Assets (100%) | ||
| Applicable to 556,599,838 outstanding $.001 par value shares of | ||
| beneficial interest (unlimited authorization) | 11,767,977 | |
| Net Asset Value Per Share | $21.14 | |
19
Institutional Target Retirement 2040 Fund
| Amount | |
| ($000) | |
| Statement of Assets and Liabilities | |
| Assets | |
| Investments in Securities, at Value—Affiliated Vanguard Funds | 11,762,157 |
| Receivables for Investment Securities Sold | 18,286 |
| Receivables for Accrued Income | 2,515 |
| Receivables for Capital Shares Issued | 60,738 |
| Total Assets | 11,843,696 |
| Liabilities | |
| Payables for Investment Securities Purchased | 75,215 |
| Payables for Capital Shares Redeemed | 504 |
| Total Liabilities | 75,719 |
| Net Assets | 11,767,977 |
| At March 31, 2017, net assets consisted of: | |
| Amount | |
| ($000) | |
| Paid-in Capital | 10,711,551 |
| Undistributed Net Investment Income | 45,816 |
| Accumulated Net Realized Losses | (210) |
| Unrealized Appreciation (Depreciation) | 1,010,820 |
| Net Assets | 11,767,977 |
• See Note A in Notes to Financial Statements.
1 Affiliated fund available only to Vanguard funds and certain trusts and accounts managed by Vanguard. Rate shown for Vanguard Market
Liquidity Fund is the 7-day yield.
See accompanying Notes, which are an integral part of the Financial Statements.
20
Institutional Target Retirement 2040 Fund
Statement of Operations
| Six Months Ended | |
| March 31, 2017 | |
| ($000) | |
| Investment Income | |
| Income | |
| Income Distributions Received from Affiliated Funds | 112,778 |
| Net Investment Income—Note B | 112,778 |
| Realized Net Gain (Loss) | |
| Capital Gain Distributions Received from Affiliated Funds | 880 |
| Affiliated Investment Securities Sold | (442) |
| Realized Net Gain (Loss) | 438 |
| Change in Unrealized Appreciation (Depreciation) of Investment Securities | 624,197 |
| Net Increase (Decrease) in Net Assets Resulting from Operations | 737,413 |
See accompanying Notes, which are an integral part of the Financial Statements.
21
Institutional Target Retirement 2040 Fund
Statement of Changes in Net Assets
| Six Months Ended | Year Ended | |
| March 31, | September 30, | |
| 2017 | 2016 | |
| ($000) | ($000) | |
| Increase (Decrease) in Net Assets | ||
| Operations | ||
| Net Investment Income | 112,778 | 150,878 |
| Realized Net Gain (Loss) | 438 | 584 |
| Change in Unrealized Appreciation (Depreciation) | 624,197 | 573,943 |
| Net Increase (Decrease) in Net Assets Resulting from Operations | 737,413 | 725,405 |
| Distributions | ||
| Net Investment Income | (185,811) | (42,868) |
| Realized Capital Gain1 | (1,229) | — |
| Total Distributions | (187,040) | (42,868) |
| Capital Share Transactions | ||
| Issued | 2,675,912 | 5,238,013 |
| Issued in Lieu of Cash Distributions | 185,271 | 42,639 |
| Redeemed | (367,756) | (270,523) |
| Net Increase (Decrease) from Capital Share Transactions | 2,493,427 | 5,010,129 |
| Total Increase (Decrease) | 3,043,800 | 5,692,666 |
| Net Assets | ||
| Beginning of Period | 8,724,177 | 3,031,511 |
| End of Period2 | 11,767,977 | 8,724,177 |
1 Includes fiscal 2017 and 2016 short-term gain distributions totaling $709,000 and $0 respectively. Short-term gain distributions are treated
as ordinary income dividends for tax purposes.
2 Net Assets—End of Period includes undistributed (overdistributed) net investment income of $45,816,000 and $118,844,000.
See accompanying Notes, which are an integral part of the Financial Statements.
22
Institutional Target Retirement 2040 Fund
Financial Highlights
| Six Months | Year | June 26, | |
| Ended | Ended | 20151 to | |
| March 31, | Sept. 30, | Sept. 30, | |
| For a Share Outstanding Throughout Each Period | 2017 | 2016 | 2015 |
| Net Asset Value, Beginning of Period | $20.10 | $18.08 | $20.00 |
| Investment Operations | |||
| Net Investment Income | . 201 | . 4612 | .1512 |
| Capital Gain Distributions Received | .002 | .0022 | — |
| Net Realized and Unrealized Gain (Loss) on Investments | 1.233 | 1.718 | (2.071) |
| Total from Investment Operations | 1.436 | 2.181 | (1.920) |
| Distributions | |||
| Dividends from Net Investment Income | (.393) | (.161) | — |
| Distributions from Realized Capital Gains | (.003) | — | — |
| Total Distributions | (.396) | (.161) | — |
| Net Asset Value, End of Period | $21.14 | $20.10 | $18.08 |
| Total Return | 7.26% | 12.12% | -9.60% |
| Ratios/Supplemental Data | |||
| Net Assets, End of Period (Millions) | $11,768 | $8,724 | $3,032 |
| Ratio of Total Expenses to Average Net Assets | — | — | — |
| Acquired Fund Fees and Expenses | 0.09% | 0.10% | 0.10%3 |
| Ratio of Net Investment Income to Average Net Assets | 2.27% | 2.62% | 2.81%3 |
| Portfolio Turnover Rate | 5% | 0% | 1% |
| The expense ratio, acquired fund fees and expenses, net investment income ratio, and turnover rate for the current period have been annualized. | |||
| 1 Inception. | |||
| 2 Calculated based on average shares outstanding. | |||
| 3 Annualized. | |||
See accompanying Notes, which are an integral part of the Financial Statements.
23
Institutional Target Retirement 2040 Fund
Notes to Financial Statements
Vanguard Institutional Target Retirement 2040 Fund is registered under the Investment Company Act of 1940 as an open-end investment company, or mutual fund. The fund follows a balanced investment strategy by investing in selected Vanguard funds to achieve its targeted allocation of assets to U.S. and international stocks, and U.S. and international bonds. Financial statements and other information about each underlying fund are available on vanguard.com.
A. The following significant accounting policies conform to generally accepted accounting principles for U.S. investment companies. The fund consistently follows such policies in preparing its financial statements.
1. Security Valuation: Investments are valued at the net asset value of each underlying Vanguard fund determined as of the close of the New York Stock Exchange (generally 4 p.m., Eastern time) on the valuation date.
2. Federal Income Taxes: The fund intends to continue to qualify as a regulated investment company and distribute all of its taxable income. Management has analyzed the fund’s tax positions taken for all open federal income tax years (September 30, 2015–2016), and for the period ended March 31, 2017, and has concluded that no provision for federal income tax is required in the fund’s financial statements. 3. Distributions: Distributions to shareholders are recorded on the ex-dividend date.
4. Credit Facility: The fund and certain other funds managed by The Vanguard Group (“Vanguard”) participate in a $3.1 billion committed credit facility provided by a syndicate of lenders pursuant to a credit agreement that may be renewed annually; each fund is individually liable for its borrowings, if any, under the credit facility. Borrowings may be utilized for temporary and emergency purposes, and are subject to the fund’s regulatory and contractual borrowing restrictions. The participating funds are charged administrative fees and an annual commitment fee of 0.10% of the undrawn amount of the facility; these fees are allocated to the funds based on a method approved by the fund’s board of trustees and borne by the funds in which the fund invests (see Note B). Any borrowings under this facility bear interest at a rate based upon the higher of the one-month London Interbank Offered Rate, federal funds effective rate, or overnight bank funding rate plus an agreed-upon spread.
The fund had no borrowings outstanding at March 31, 2017, or at any time during the period then ended.
5. Other: Income and capital gain distributions received are recorded on the ex-dividend date. Security transactions are accounted for on the date securities are bought or sold. Costs used to determine realized gains (losses) on the sale of investment securities are those of the specific securities sold.
B. In accordance with the terms of a Funds’ Service Agreement (the “FSA”) between Vanguard and the fund, Vanguard furnishes to the fund investment advisory, corporate management, administrative, marketing, and distribution services at Vanguard’s cost of operations (as defined by the FSA). These costs of operations are allocated to the fund based on methods and guidelines approved by the board of trustees. The FSA provides that expenses otherwise allocable to Vanguard funds-of-funds may be reduced or eliminated to the extent of savings realized by the underlying Vanguard funds by virtue of being part of a fund-of-funds. Accordingly, all expenses for services provided by Vanguard to the fund and all other expenses incurred by the fund during the period ended March 31, 2017, were borne by the underlying Vanguard funds in which the fund invests. The fund’s trustees and officers are also trustees and officers, respectively, of the underlying Vanguard funds, as well as directors and employees, respectively, of Vanguard.
24
Institutional Target Retirement 2040 Fund
C. Various inputs may be used to determine the value of the fund’s investments. These inputs are summarized in three broad levels for financial statement purposes. The inputs or methodologies used to value securities are not necessarily an indication of the risk associated with investing in those securities.
Level 1—Quoted prices in active markets for identical securities.
Level 2—Other significant observable inputs (including quoted prices for similar securities, interest rates, prepayment speeds, credit risk, etc.).
Level 3—Significant unobservable inputs (including the fund’s own assumptions used to determine the fair value of investments).
At March 31, 2017, 100% of the market value of the fund’s investments was determined based on Level 1 inputs.
D. Distributions are determined on a tax basis and may differ from net investment income and realized capital gains for financial reporting purposes. Differences may be permanent or temporary. Permanent differences are reclassified among capital accounts in the financial statements to reflect their tax character. Temporary differences arise when certain items of income, expense, gain, or loss are recognized in different periods for financial statement and tax purposes. These differences will reverse at some time in the future. Differences in classification may also result from the treatment of short-term gains as ordinary income for tax purposes. The fund’s tax-basis capital gains and losses are determined only at the end of each fiscal year.
At March 31, 2017, the cost of investment securities for tax purposes was $10,751,337,000. Net unrealized appreciation of investment securities for tax purposes was $1,010,820,000, consisting of unrealized gains of $1,020,460,000 on securities that had risen in value since their purchase and $9,640,000 in unrealized losses on securities that had fallen in value since their purchase.
E. Capital shares issued and redeemed were:
| Six Months Ended | Year Ended | |
| March 31, 2017 | September 30, 2016 | |
| Shares | Shares | |
| (000) | (000) | |
| Issued | 131,430 | 278,300 |
| Issued in Lieu of Cash Distributions | 9,301 | 2,249 |
| Redeemed | (18,107) | (14,266) |
| Net Increase (Decrease) in Shares Outstanding | 122,624 | 266,283 |
At March 31, 2017, one shareholder was the record or beneficial owner of 32% of the fund’s net assets. If the shareholder were to redeem its investment in the fund, the redemption might lead to the realization of taxable capital gains.
25
Institutional Target Retirement 2040 Fund
F. Transactions during the period in affiliated underlying Vanguard funds were as follows:
| Current Period Transactions | ||||||
| Sept. 30, | Proceeds | March 31, | ||||
| 2016 | from | Capital Gain | 2017 | |||
| Market | Purchases | Securities | Distributions | Market | ||
| Value | at Cost | Sold | Income | Received | Value | |
| ($000) | ($000) | ($000) | ($000) | ($000) | ($000) | |
| Vanguard Market Liquidity Fund | 2 | NA1 | NA1 | 10 | — | 4,205 |
| Vanguard Total Bond Market II | ||||||
| Index Fund | 752,334 | 432,172 | 77,742 | 10,344 | 880 | 1,079,725 |
| Vanguard Total International | ||||||
| Bond Index Fund | 322,118 | 143,610 | — | 4,257 | — | 455,154 |
| Vanguard Total International | ||||||
| Stock Index Fund | 3,049,503 | 846,526 | 7,582 | 39,895 | — | 4,096,267 |
| Vanguard Total Stock Market | ||||||
| Index Fund | 4,584,021 | 1,258,876 | 169,639 | 58,272 | — | 6,126,806 |
| Total | 8,707,978 | 2,681,184 | 254,963 | 112,778 | 880 | 11,762,157 |
| 1 Not applicable—purchases and sales are for temporary cash investment purposes. | ||||||
G. Management has determined that no material events or transactions occurred subsequent to March 31, 2017, that would require recognition or disclosure in these financial statements.
26
Institutional Target Retirement 2045 Fund
Fund Profile
As of March 31, 2017
| Total Fund Characteristics | |
| Ticker Symbol | VITLX |
| 30-Day SEC Yield | 2.19% |
| Acquired Fund Fees and Expenses1 | 0.10% |
| Allocation to Underlying Vanguard Funds | |
| Vanguard Total Stock Market Index Fund | |
| Institutional Shares | 54.1% |
| Vanguard Total International Stock Index | |
| Fund Investor Shares | 35.8 |
| Vanguard Total Bond Market II Index Fund | |
| Investor Shares | 7.1 |
| Vanguard Total International Bond Index | |
| Fund Admiral Shares | 3.0 |
Fund Asset Allocation
1 This figure—drawn from the prospectus dated January 27, 2017—represents an estimate of the weighted average of the expense ratios and any transaction fees charged by the underlying mutual funds (the ”acquired” funds) in which the Institutional Target Retirement 2045 Fund invests. The fund does not charge any expenses or fees of its own. For the six months ended March 31, 2017, the annualized acquired fund fees and expenses were 0.09%.
27
Institutional Target Retirement 2045 Fund
Performance Summary
All of the returns in this report represent past performance, which is not a guarantee of future results that may be achieved by the fund. (Current performance may be lower or higher than the performance data cited. For performance data current to the most recent month-end, visit our website at vanguard.com/performance.) Note, too, that both investment returns and principal value can fluctuate widely, so an investor’s shares, when sold, could be worth more or less than their original cost. The returns shown do not reflect taxes that a shareholder would pay on fund distributions or on the sale of fund shares.
Fiscal-Year Total Returns (%): June 26, 2015, Through March 31, 2017
For a benchmark description, see the Glossary.
Note: For 2017, performance data reflect the six months ended March 31, 2017.
| Average Annual Total Returns: Period Ended March 31, 2017 | |||||
| Since Inception | |||||
| Inception Date | One Year | Income | Capital | Total | |
| Institutional Target | |||||
| Retirement 2045 Fund | 6/26/2015 | 14.79% | 1.64% | 3.40% | 5.04% |
See Financial Highlights for dividend and capital gains information.
28
Institutional Target Retirement 2045 Fund
Financial Statements (unaudited)
Statement of Net Assets
As of March 31, 2017
The fund reports a complete list of its holdings in regulatory filings four times in each fiscal year, at the quarter-ends. For the second and fourth fiscal quarters, the lists appear in the fund’s semiannual and annual reports to shareholders. For the first and third fiscal quarters, the fund files the lists with the Securities and Exchange Commission on Form N-Q. Shareholders can look up the fund’s Forms N-Q on the SEC’s website at sec.gov. Forms N-Q may also be reviewed and copied at the SEC’s Public Reference Room (see the back cover of this report for further information).
| Market | ||
| Value• | ||
| Shares | ($000) | |
| Investment Companies (99.9%) | ||
| U.S. Stock Fund (54.0%) | ||
| Vanguard Total Stock Market Index Fund Institutional Shares | 87,559,128 | 5,172,118 |
| International Stock Fund (35.8%) | ||
| Vanguard Total International Stock Index Fund Investor Shares | 215,085,673 | 3,424,164 |
| U.S. Bond Fund (7.1%) | ||
| 1 Vanguard Total Bond Market II Index Fund Investor Shares | 63,453,566 | 675,146 |
| International Bond Fund (3.0%) | ||
| Vanguard Total International Bond Index Fund Admiral Shares | 13,188,229 | 284,997 |
| Total Investment Companies (Cost $8,726,850) | 9,556,425 | |
| Temporary Cash Investment (0.0%) | ||
| Money Market Fund (0.0%) | ||
| 1 Vanguard Market Liquidity Fund, 0.965% (Cost $4,453) | 44,520 | 4,453 |
| Total Investments (99.9%) (Cost $8,731,303) | 9,560,878 | |
| Other Assets and Liabilities (0.1%) | ||
| Other Assets | 65,533 | |
| Liabilities | (54,853) | |
| 10,680 | ||
| Net Assets (100%) | ||
| Applicable to 451,308,383 outstanding $.001 par value shares of | ||
| beneficial interest (unlimited authorization) | 9,571,558 | |
| Net Asset Value Per Share | $21.21 | |
29
Institutional Target Retirement 2045 Fund
| Amount | |
| ($000) | |
| Statement of Assets and Liabilities | |
| Assets | |
| Investments in Securities, at Value—Affiliated Vanguard Funds | 9,560,878 |
| Receivables for Investment Securities Sold | 5,169 |
| Receivables for Accrued Income | 1,614 |
| Receivables for Capital Shares Issued | 58,750 |
| Total Assets | 9,626,411 |
| Liabilities | |
| Payables for Investment Securities Purchased | 54,113 |
| Payables for Capital Shares Redeemed | 740 |
| Total Liabilities | 54,853 |
| Net Assets | 9,571,558 |
| At March 31, 2017, net assets consisted of: | |
| Amount | |
| ($000) | |
| Paid-in Capital | 8,704,460 |
| Undistributed Net Investment Income | 37,089 |
| Accumulated Net Realized Gains | 434 |
| Unrealized Appreciation (Depreciation) | 829,575 |
| Net Assets | 9,571,558 |
• See Note A in Notes to Financial Statements.
1 Affiliated fund available only to Vanguard funds and certain trusts and accounts managed by Vanguard. Rate shown for Vanguard Market
Liquidity Fund is the 7-day yield.
See accompanying Notes, which are an integral part of the Financial Statements.
30
Institutional Target Retirement 2045 Fund
Statement of Operations
| Six Months Ended | |
| March 31, 2017 | |
| ($000) | |
| Investment Income | |
| Income | |
| Income Distributions Received from Affiliated Funds | 90,770 |
| Net Investment Income—Note B | 90,770 |
| Realized Net Gain (Loss) | |
| Capital Gain Distributions Received from Affiliated Funds | 578 |
| Affiliated Investment Securities Sold | 376 |
| Realized Net Gain (Loss) | 954 |
| Change in Unrealized Appreciation (Depreciation) of Investment Securities | 523,682 |
| Net Increase (Decrease) in Net Assets Resulting from Operations | 615,406 |
See accompanying Notes, which are an integral part of the Financial Statements.
31
Institutional Target Retirement 2045 Fund
Statement of Changes in Net Assets
| Six Months Ended | Year Ended | |
| March 31, | September 30, | |
| 2017 | 2016 | |
| ($000) | ($000) | |
| Increase (Decrease) in Net Assets | ||
| Operations | ||
| Net Investment Income | 90,770 | 118,493 |
| Realized Net Gain (Loss) | 954 | 351 |
| Change in Unrealized Appreciation (Depreciation) | 523,682 | 454,611 |
| Net Increase (Decrease) in Net Assets Resulting from Operations | 615,406 | 573,455 |
| Distributions | ||
| Net Investment Income | (147,574) | (33,117) |
| Realized Capital Gain1 | (873) | — |
| Total Distributions | (148,447) | (33,117) |
| Capital Share Transactions | ||
| Issued | 2,222,206 | 4,302,587 |
| Issued in Lieu of Cash Distributions | 146,968 | 33,014 |
| Redeemed | (253,944) | (203,649) |
| Net Increase (Decrease) from Capital Share Transactions | 2,115,230 | 4,131,952 |
| Total Increase (Decrease) | 2,582,189 | 4,672,290 |
| Net Assets | ||
| Beginning of Period | 6,989,369 | 2,317,079 |
| End of Period2 | 9,571,558 | 6,989,369 |
1 Includes fiscal 2017 and 2016 short-term gain distributions totaling $493,000 and $0, respectively. Short-term gain distributions are treated
as ordinary income dividends for tax purposes.
2 Net Assets—End of Period includes undistributed (overdistributed) net investment income of $37,089,000 and $93,893,000.
See accompanying Notes, which are an integral part of the Financial Statements.
32
Institutional Target Retirement 2045 Fund
Financial Highlights
| Six Months | Year | June 26, | |
| Ended | Ended | 20151 to | |
| March 31, | Sept. 30, | Sept. 30, | |
| For a Share Outstanding Throughout Each Period | 2017 | 2016 | 2015 |
| Net Asset Value, Beginning of Period | $20.11 | $18.07 | $20.00 |
| Investment Operations | |||
| Net Investment Income | . 201 | . 464 2 | .1492 |
| Capital Gain Distributions Received | .001 | .002 | — |
| Net Realized and Unrealized Gain (Loss) on Investments | 1.289 | 1.736 | (2.079) |
| Total from Investment Operations | 1.491 | 2.202 | (1.930) |
| Distributions | |||
| Dividends from Net Investment Income | (.389) | (.162) | — |
| Distributions from Realized Capital Gains | (.002) | — | — |
| Total Distributions | (.391) | (.162) | — |
| Net Asset Value, End of Period | $21.21 | $20.11 | $18.07 |
| Total Return | 7.54% | 12.24% | -9.65% |
| Ratios/Supplemental Data | |||
| Net Assets, End of Period (Millions) | $9,572 | $6,989 | $2,317 |
| Ratio of Total Expenses to Average Net Assets | — | — | — |
| Acquired Fund Fees and Expenses | 0.09% | 0.10% | 0.10%3 |
| Ratio of Net Investment Income to Average Net Assets | 2.26% | 2.42% | 2.79%3 |
| Portfolio Turnover Rate | 4% | 1% | 0% |
The expense ratio, acquired fund fees and expenses, net investment income ratio, and turnover rate for the current period have been annualized.
1 Inception.
2 Calculated based on average shares outstanding.
3 Annualized.
See accompanying Notes, which are an integral part of the Financial Statements.
33
Institutional Target Retirement 2045 Fund
Notes to Financial Statements
Vanguard Institutional Target Retirement 2045 Fund is registered under the Investment Company Act of 1940 as an open-end investment company, or mutual fund. The fund follows a balanced investment strategy by investing in selected Vanguard funds to achieve its targeted allocation of assets to U.S. and international stocks, and U.S. and international bonds. Financial statements and other information about each underlying fund are available on vanguard.com.
A. The following significant accounting policies conform to generally accepted accounting principles for U.S. investment companies. The fund consistently follows such policies in preparing its financial statements.
1. Security Valuation: Investments are valued at the net asset value of each underlying Vanguard fund determined as of the close of the New York Stock Exchange (generally 4 p.m., Eastern time) on the valuation date.
2. Federal Income Taxes: The fund intends to continue to qualify as a regulated investment company and distribute all of its taxable income. Management has analyzed the fund’s tax positions taken for all open federal income tax years (September 30, 2015–2016), and for the period ended March 31, 2017, and has concluded that no provision for federal income tax is required in the fund’s financial statements. 3. Distributions: Distributions to shareholders are recorded on the ex-dividend date.
4. Credit Facility: The fund and certain other funds managed by The Vanguard Group (“Vanguard”) participate in a $3.1 billion committed credit facility provided by a syndicate of lenders pursuant to a credit agreement that may be renewed annually; each fund is individually liable for its borrowings, if any, under the credit facility. Borrowings may be utilized for temporary and emergency purposes, and are subject to the fund’s regulatory and contractual borrowing restrictions. The participating funds are charged administrative fees and an annual commitment fee of 0.10% of the undrawn amount of the facility; these fees are allocated to the funds based on a method approved by the fund’s board of trustees and borne by the funds in which the fund invests (see Note B). Any borrowings under this facility bear interest at a rate based upon the higher of the one-month London Interbank Offered Rate, federal funds effective rate, or overnight bank funding rate plus an agreed-upon spread.
The fund had no borrowings outstanding at March 31, 2017, or at any time during the period then ended.
5. Other: Income and capital gain distributions received are recorded on the ex-dividend date. Security transactions are accounted for on the date securities are bought or sold. Costs used to determine realized gains (losses) on the sale of investment securities are those of the specific securities sold.
B. In accordance with the terms of a Funds’ Service Agreement (the “FSA”) between Vanguard and the fund, Vanguard furnishes to the fund investment advisory, corporate management, administrative, marketing, and distribution services at Vanguard’s cost of operations (as defined by the FSA). These costs of operations are allocated to the fund based on methods and guidelines approved by the board of trustees. The FSA provides that expenses otherwise allocable to Vanguard funds-of-funds may be reduced or eliminated to the extent of savings realized by the underlying Vanguard funds by virtue of being part of a fund-of-funds. Accordingly, all expenses for services provided by Vanguard to the fund and all other expenses incurred by the fund during the period ended March 31, 2017, were borne by the underlying Vanguard funds in which the fund invests. The fund’s trustees and officers are also trustees and officers, respectively, of the underlying Vanguard funds, as well as directors and employees, respectively, of Vanguard.
34
Institutional Target Retirement 2045 Fund
C. Various inputs may be used to determine the value of the fund’s investments. These inputs are summarized in three broad levels for financial statement purposes. The inputs or methodologies used to value securities are not necessarily an indication of the risk associated with investing in those securities.
Level 1—Quoted prices in active markets for identical securities.
Level 2—Other significant observable inputs (including quoted prices for similar securities, interest rates, prepayment speeds, credit risk, etc.).
Level 3—Significant unobservable inputs (including the fund’s own assumptions used to determine the fair value of investments).
At March 31, 2017, 100% of the market value of the fund’s investments was determined based on Level 1 inputs.
D. Distributions are determined on a tax basis and may differ from net investment income and realized capital gains for financial reporting purposes. Differences may be permanent or temporary. Permanent differences are reclassified among capital accounts in the financial statements to reflect their tax character. Temporary differences arise when certain items of income, expense, gain, or loss are recognized in different periods for financial statement and tax purposes. These differences will reverse at some time in the future. Differences in classification may also result from the treatment of short-term gains as ordinary income for tax purposes. The fund’s tax-basis capital gains and losses are determined only at the end of each fiscal year.
At March 31, 2017, the cost of investment securities for tax purposes was $8,731,303,000. Net unrealized appreciation of investment securities for tax purposes was $829,575,000, consisting of unrealized gains of $835,647,000 on securities that had risen in value since their purchase and $6,072,000 in unrealized losses on securities that had fallen in value since their purchase.
E. Capital shares issued and redeemed were:
| Six Months Ended | Year Ended | |
| March 31, 2017 | September 30, 2016 | |
| Shares | Shares | |
| (000) | (000) | |
| Issued | 108,856 | 228,312 |
| Issued in Lieu of Cash Distributions | 7,367 | 1,741 |
| Redeemed | (12,480) | (10,725) |
| Net Increase (Decrease) in Shares Outstanding | 103,743 | 219,328 |
At March 31, 2017, one shareholder was the record or beneficial owner of 28% of the fund’s net assets. If the shareholder were to redeem its investment in the fund, the redemption might lead to the realization of taxable capital gains.
35
Institutional Target Retirement 2045 Fund
F. Transactions during the period in affiliated underlying Vanguard funds were as follows:
| Current Period Transactions | ||||||
| Sept. 30, | Proceeds | March 31, | ||||
| 2016 | from | Capital Gain | 2017 | |||
| Market | Purchases | Securities | Distributions | Market | ||
| Value | at Cost | Sold | Income | Received | Value | |
| ($000) | ($000) | ($000) | ($000) | ($000) | ($000) | |
| Vanguard Market Liquidity Fund | 1,266 | NA1 | NA1 | 16 | — | 4,453 |
| Vanguard Total Bond Market II | ||||||
| Index Fund | 485,809 | 224,506 | 37,238 | 6,685 | 578 | 675,146 |
| Vanguard Total International | ||||||
| Bond Index Fund | 208,090 | 83,768 | — | 2,757 | — | 284,997 |
| Vanguard Total International | ||||||
| Stock Index Fund | 2,498,811 | 755,598 | 3,885 | 32,972 | — | 3,424,164 |
| Vanguard Total Stock Market | ||||||
| Index Fund | 3,767,707 | 1,136,325 | 107,124 | 48,340 | — | 5,172,118 |
| Total | 6,961,683 | 2,220,197 | 148,247 | 90,770 | 578 | 9,560,878 |
| 1 Not applicable—purchases and sales are for temporary cash investment purposes. | ||||||
G. Management has determined that no material events or transactions occurred subsequent to March 31, 2017, that would require recognition or disclosure in these financial statements.
36
Institutional Target Retirement 2050 Fund
Fund Profile
As of March 31, 2017
| Total Fund Characteristics | |
| Ticker Symbol | VTRLX |
| 30-Day SEC Yield | 2.19% |
| Acquired Fund Fees and Expenses1 | 0.10% |
| Allocation to Underlying Vanguard Funds | |
| Vanguard Total Stock Market Index Fund | |
| Institutional Shares | 54.1% |
| Vanguard Total International Stock Index | |
| Fund Investor Shares | 35.8 |
| Vanguard Total Bond Market II Index Fund | |
| Investor Shares | 7.1 |
| Vanguard Total International Bond Index | |
| Fund Admiral Shares | 3.0 |
Fund Asset Allocation
![]()
1 This figure—drawn from the prospectus dated January 27, 2017—represents an estimate of the weighted average of the expense ratios and any
transaction fees charged by the underlying mutual funds (the ”acquired” funds) in which the Institutional Target Retirement 2050 Fund invests. The
fund does not charge any expenses or fees of its own. For the six months ended March 31, 2017, the annualized acquired fund fees and expenses
were 0.09%.
37
Institutional Target Retirement 2050 Fund
Performance Summary
All of the returns in this report represent past performance, which is not a guarantee of future results that may be achieved by the fund. (Current performance may be lower or higher than the performance data cited. For performance data current to the most recent month-end, visit our website at vanguard.com/performance.) Note, too, that both investment returns and principal value can fluctuate widely, so an investor’s shares, when sold, could be worth more or less than their original cost. The returns shown do not reflect taxes that a shareholder would pay on fund distributions or on the sale of fund shares.
Fiscal-Year Total Returns (%): June 26, 2015, Through March 31, 2017
For a benchmark description, see the Glossary.
Note: For 2017, performance data reflect the six months ended March 31, 2017.
| Average Annual Total Returns: Period Ended March 31, 2017 | |||||
| Since Inception | |||||
| Inception Date | One Year | Income | Capital | Total | |
| Institutional Target | |||||
| Retirement 2050 Fund | 6/26/2015 | 14.73% | 1.62% | 3.42% | 5.04% |
See Financial Highlights for dividend and capital gains information.
38
Institutional Target Retirement 2050 Fund
Financial Statements (unaudited)
Statement of Net Assets
As of March 31, 2017
The fund reports a complete list of its holdings in regulatory filings four times in each fiscal year, at the quarter-ends. For the second and fourth fiscal quarters, the lists appear in the fund’s semiannual and annual reports to shareholders. For the first and third fiscal quarters, the fund files the lists with the Securities and Exchange Commission on Form N-Q. Shareholders can look up the fund’s Forms N-Q on the SEC’s website at sec.gov. Forms N-Q may also be reviewed and copied at the SEC’s Public Reference Room (see the back cover of this report for further information).
| Market | ||
| Value• | ||
| Shares | ($000) | |
| Investment Companies (99.9%) | ||
| U.S. Stock Fund (54.1%) | ||
| Vanguard Total Stock Market Index Fund Institutional Shares | 56,632,219 | 3,345,265 |
| International Stock Fund (35.8%) | ||
| Vanguard Total International Stock Index Fund Investor Shares | 138,978,352 | 2,212,536 |
| U.S. Bond Fund (7.0%) | ||
| 1 Vanguard Total Bond Market II Index Fund Investor Shares | 41,105,628 | 437,364 |
| International Bond Fund (3.0%) | ||
| Vanguard Total International Bond Index Fund Admiral Shares | 8,521,526 | 184,150 |
| Total Investment Companies (Cost $5,652,888) | 6,179,315 | |
| Temporary Cash Investment (0.0%) | ||
| Money Market Fund (0.0%) | ||
| 1 Vanguard Market Liquidity Fund, 0.965% (Cost $2,676) | 26,755 | 2,676 |
| Total Investments (99.9%) (Cost $5,655,564) | 6,181,991 | |
| Other Assets and Liabilities (0.1%) | ||
| Other Assets | 50,700 | |
| Liabilities | (47,563) | |
| 3,137 | ||
| Net Assets (100%) | ||
| Applicable to 291,463,416 outstanding $.001 par value shares of | ||
| beneficial interest (unlimited authorization) | 6,185,128 | |
| Net Asset Value Per Share | $21.22 | |
39
InstitutionalTargetRetirement2050 Fund
| Amount | ||
| ($000) | ||
| Statement of Assets and Liabilities | ||
| Assets | ||
| Investments in Securities, at Value—Affiliated Vanguard | Funds | 6,181,991 |
| Receivables for Investment Securities Sold | 4,513 | |
| Receivables for Accrued Income | 1,040 | |
| Receivables for Capital Shares Issued | 45,147 | |
| Total Assets | 6,232,691 | |
| Liabilities | ||
| Payables for Investment Securities Purchased | 47,040 | |
| Payables for Capital Shares Redeemed | 523 | |
| Total Liabilities | 47,563 | |
| Net Assets | 6,185,128 | |
| At March 31, 2017, net assets consisted of: | ||
| Amount | ||
| ($000) | ||
| Paid-in Capital | 5,634,952 | |
| Undistributed Net Investment Income | 23,666 | |
| Accumulated Net Realized Gains | 83 | |
| Unrealized Appreciation (Depreciation) | 526,427 | |
| Net Assets | 6,185,128 | |
• SeeNote Ain NotestoFinancialStatements.
1 Affiliated fund available only to Vanguard funds and certain trusts and accounts managed by Vanguard. Rate shown for Vanguard Market
Liquidity Fund is the 7-day yield.
See accompanying Notes, which are an integral part of the Financial Statements.
40
InstitutionalTargetRetirement2050 Fund
Statement of Operations
| Six Months Ended | |
| March 31, 2017 | |
| ($000) | |
| Investment Income | |
| Income | |
| Income Distributions Received from Affiliated Funds | 57,741 |
| Net Investment Income—Note B | 57,741 |
| Realized Net Gain (Loss) | |
| Capital Gain Distributions Received from Affiliated Funds | 364 |
| Affiliated Investment Securities Sold | (11) |
| Realized Net Gain (Loss) | 353 |
| Change in Unrealized Appreciation (Depreciation) of Investment Securities | 334,287 |
| Net Increase (Decrease) in Net Assets Resulting from Operations | 392,381 |
See accompanying Notes, which are an integral part of the Financial Statements.
41
InstitutionalTargetRetirement2050 Fund
Statement of Changes in NetAssets
| Six Months Ended | Year Ended | |
| March 31, | September 30, | |
| 2017 | 2016 | |
| ($000) | ($000) | |
| Increase (Decrease) in Net Assets | ||
| Operations | ||
| Net Investment Income | 57,741 | 70,655 |
| Realized Net Gain (Loss) | 353 | 233 |
| Change in Unrealized Appreciation (Depreciation) | 334,287 | 270,453 |
| Net Increase (Decrease) in Net Assets Resulting from Operations | 392,381 | 341,341 |
| Distributions | ||
| Net Investment Income | (90,785) | (18,343) |
| Realized Capital Gain1 | (502) | — |
| Total Distributions | (91,287) | (18,343) |
| Capital Share Transactions | ||
| Issued | 1,670,448 | 2,864,884 |
| Issued in Lieu of Cash Distributions | 90,205 | 18,188 |
| Redeemed | (206,015) | (135,302) |
| Net Increase (Decrease) from Capital Share Transactions | 1,554,638 | 2,747,770 |
| Total Increase (Decrease) | 1,855,732 | 3,070,768 |
| Net Assets | ||
| Beginning of Period | 4,329,396 | 1,258,628 |
| End of Period2 | 6,185,128 | 4,329,396 |
| 1 Includes fiscal 2017 and 2016 short-term gain distributions totaling $287,000 and $0, respectively. Short-term gain distributions are treated | ||
| as ordinary income dividends for tax purposes. | ||
| 2 Net Assets—End of Period includes undistributed (overdistributed) net investment income of $23,666,000 and $56,710,000. | ||
See accompanying Notes, which are an integral part of the Financial Statements.
42
InstitutionalTargetRetirement2050 Fund
Financial Highlights
| Six Months | Year | June 26, | |
| Ended | Ended | 20151 to | |
| March 31, | Sept. 30, | Sept. 30, | |
| For a Share Outstanding Throughout Each Period | 2017 | 2016 | 2015 |
| Net Asset Value, Beginning of Period | $20.11 | $18.07 | $20.00 |
| Investment Operations | |||
| Net Investment Income | .2302 | .4662 | .1492 |
| Capital Gain Distributions Received | .0012 | .0022 | — |
| Net Realized and Unrealized Gain (Loss) on Investments | 1.261 | 1.732 | (2.079) |
| Total from Investment Operations | 1.492 | 2.200 | (1.930) |
| Distributions | |||
| Dividends from Net Investment Income | (.380) | (.160) | — |
| Distributions from Realized Capital Gains | (.002) | — | — |
| Total Distributions | (.382) | (.160) | — |
| Net Asset Value, End of Period | $21.22 | $20.11 | $18.07 |
| Total Return | 7.54% | 12.23% | -9.65% |
| Ratios/Supplemental Data | |||
| Net Assets, End of Period (Millions) | $6,185 | $4,329 | $1,259 |
| Ratio of Total Expenses to Average Net Assets | — | — | — |
| Acquired Fund Fees and Expenses | 0.09% | 0.10% | 0.10%3 |
| Ratio of Net Investment Income to Average Net Assets | 2.27% | 2.43% | 2.81%3 |
| Portfolio Turnover Rate | 4% | 1% | 1% |
| Theexpenseratio,acquiredfundfeesandexpenses,netinvestmentincomeratio,andturnoverrateforthecurrentperiodhavebeenannualized. | |||
| 1Inception. | |||
| 2 Calculated based on average shares outstanding. | |||
| 3 Annualized. | |||
See accompanying Notes, which are an integral part of the Financial Statements.
43
InstitutionalTargetRetirement2050 Fund
Notes to Financial Statements
Vanguard Institutional Target Retirement 2050 Fund is registered under the Investment Company Act of 1940 as an open-end investment company, or mutual fund. The fund follows a balanced investment strategy by investing in selected Vanguard funds to achieve its targeted allocation of assets to U.S. and international stocks, and U.S. and international bonds. Financial statements and other information about each underlying fund are available on vanguard.com.
A. The following significant accounting policies conform to generally accepted accounting principles forU.S. investmentcompanies. Thefundconsistentlyfollowssuchpoliciesinpreparingitsfinancial statements.
1. SecurityValuation:InvestmentsarevaluedatthenetassetvalueofeachunderlyingVanguardfund determined as of the close of the New YorkStock Exchange (generally 4 p.m., Easterntime) on the valuationdate.
2. Federal Income Taxes: The fund intends to continue to qualify as a regulated investment company and distribute all of its taxable income. Management has analyzed the fund’s tax positions taken for all open federal income tax years (September 30, 2015–2016), and for the period ended March 31, 2017, and has concluded that no provision for federal income tax is required in the fund’s financial statements. 3. Distributions: Distributions to shareholders are recorded on the ex-dividend date.
4. Credit Facility: The fund and certain other funds managed by The Vanguard Group (“Vanguard”) participate in a $3.1 billion committed credit facility provided by a syndicate of lenders pursuant to a credit agreement that may be renewed annually; each fund is individually liable for its borrowings, if any, under the credit facility. Borrowings may be utilized for temporary and emergency purposes, and are subject to the fund’s regulatory and contractual borrowing restrictions. The participating funds are charged administrative fees and an annual commitment fee of 0.10% of the undrawn amount of the facility; these fees are allocated to the funds based on a method approved by the fund’s board of trustees and borne by the funds in which the fund invests (see Note B). Any borrowings under this facility bear interest at a rate based upon the higher of the one-month London Interbank Offered Rate, federal funds effective rate, or overnight bank funding rate plus an agreed-upon spread.
The fund had no borrowings outstanding at March 31, 2017, or at any time during the period then ended.
5. Other: Income and capital gain distributions received are recorded on the ex-dividend date. Security transactions are accounted for on the date securities are bought or sold. Costs used to determine realized gains (losses) on the sale of investment securities are those of the specific securities sold.
B. In accordance with the terms of a Funds’ Service Agreement (the “FSA”) between Vanguard and the fund, Vanguard furnishes to the fund investment advisory, corporate management, administrative, marketing, and distribution services at Vanguard’s cost of operations (as defined by the FSA). These costs of operations are allocated to the fund based on methods and guidelines approved by the board of trustees. The FSA provides that expenses otherwise allocable to Vanguard funds-of-funds may be reduced or eliminated to the extent of savings realized by the underlying Vanguard funds by virtue of being part of a fund-of-funds. Accordingly, all expenses for services provided by Vanguard to the fund and all other expenses incurred by the fund during the period ended March 31, 2017, were borne by the underlying Vanguard funds in which the fund invests. The fund’s trustees and officers are also trustees and officers, respectively, of the underlying Vanguard funds, as well as directors and employees, respectively, of Vanguard.
44
InstitutionalTargetRetirement2050 Fund
C. Various inputs may be used to determine the value of the fund’s investments. These inputs are summarized in three broad levels for financial statement purposes. The inputs or methodologies used to value securities are not necessarily an indication of the risk associated with investing in those securities.
Level 1—Quoted prices in active markets for identical securities.
Level 2—Other significant observable inputs (including quoted prices for similar securities, interest rates, prepayment speeds, credit risk, etc.).
Level 3—Significant unobservable inputs (including the fund’s own assumptions used to determine the fair value of investments).
At March 31, 2017, 100% of the market value of the fund’s investments was determined based on Level1inputs.
D. Distributions are determined on a tax basis and may differ from net investment income and realized capital gains for financial reporting purposes. Differences may be permanent or temporary. Permanent differences are reclassified among capital accounts in the financial statements to reflect their tax character. Temporary differences arise when certain items of income, expense, gain, or loss are recognized in different periods for financial statement and tax purposes. These differences will reverse at some time in the future. Differences in classification may also result from the treatment of short-term gains as ordinary income for tax purposes. The fund’s tax-basis capital gains and losses are determined only at the end of each fiscal year.
At March 31, 2017, the cost of investment securities for tax purposes was $5,655,564,000. Net unrealized appreciation of investment securities for tax purposes was $526,427,000, consisting of unrealized gains of $530,419,000 on securities that had risen in value since their purchase and $3,992,000 in unrealized losses on securities that had fallen in value since their purchase.
E. Capital shares issued and redeemed were:
| Six Months Ended | Year Ended | |
| March 31, 2017 | September 30, 2016 | |
| Shares | Shares | |
| (000) | (000) | |
| Issued | 81,791 | 151,751 |
| Issued in Lieu of Cash Distributions | 4,519 | 959 |
| Redeemed | (10,096) | (7,110) |
| Net Increase (Decrease) in Shares Outstanding | 76,214 | 145,600 |
At March 31, 2017, one shareholder was the record or beneficial owner of 28% of the fund’s net assets. If the shareholder were to redeem its investment in the fund, the redemption might lead to the realization of taxable capital gains.
InstitutionalTargetRetirement2050 Fund
F. Transactions during the period in affiliated underlying Vanguard funds were as follows:
| Current Period Transactions | ||||||
| Sept. 30, | Proceeds | March 31, | ||||
| 2016 | from | Capital Gain | 2017 | |||
| Market | Purchases | Securities | Distributions | Market | ||
| Value | at Cost | Sold | Income | Received | Value | |
| ($000) | ($000) | ($000) | ($000) | ($000) | ($000) | |
| Vanguard Market Liquidity Fund | 1,065 | NA1 | NA1 | 11 | — | 2,676 |
| Vanguard Total Bond Market II | ||||||
| Index Fund | 308,788 | 163,668 | 23,909 | 4,248 | 364 | 437,364 |
| Vanguard Total International | ||||||
| Bond Index Fund | 128,417 | 59,971 | — | 1,731 | — | 184,150 |
| Vanguard Total International | ||||||
| Stock Index Fund | 1,546,635 | 558,530 | 4,828 | 20,922 | — | 2,212,536 |
| VanguardTotalStockMarket | ||||||
| Index Fund | 2,331,764 | 844,330 | 68,327 | 30,829 | — | 3,345,265 |
| Total | 4,316,669 | 1,626,499 | 97,064 | 57,741 | 364 | 6,181,991 |
| 1 Not applicable—purchases and sales are for temporary cash investment purposes. | ||||||
G. Managementhasdeterminedthatnomaterialeventsortransactionsoccurredsubsequentto March31,2017,thatwouldrequirerecognitionordisclosureinthesefinancialstatements.
InstitutionalTargetRetirement2055Fund
Fund Profile
As of March 31, 2017
| Total Fund Characteristics | |
| Ticker Symbol | VIVLX |
| 30-Day SEC Yield | 2.19% |
| Acquired Fund Fees and Expenses1 | 0.10% |
| Allocation to Underlying Vanguard Funds | |
| Vanguard Total Stock Market Index Fund | |
| Institutional Shares | 54.1% |
| Vanguard Total International Stock Index | |
| Fund Investor Shares | 35.8 |
| Vanguard Total Bond Market II Index Fund | |
| Investor Shares | 7.1 |
| Vanguard Total International Bond Index | |
| Fund Admiral Shares | 3.0 |
Fund Asset Allocation
1 This figure—drawn from the prospectus dated January 27, 2017—represents an estimate of the weighted average of the expense ratios and any transaction fees charged by the underlying mutual funds (the ”acquired” funds) in which the Institutional Target Retirement 2055 Fund invests. The fund does not charge any expenses or fees of its own. For the six months ended March 31, 2017, the annualized acquired fund fees and expenses were 0.09%.
47
InstitutionalTargetRetirement2055 Fund
Performance Summary
All of the returns in this report represent past performance, which is not a guarantee of future results that may be achieved by the fund. (Current performance may be lower or higher than theperformancedatacited. Forperformancedatacurrentto themost recentmonth-end, visit our website at vanguard.com/performance.) Note, too, that both investment returns and principal value can fluctuate widely, so an investor’s shares, when sold, could be worth more or less than their original cost. The returns shown do not reflect taxes that a shareholder would pay on fund distributions or on the sale of fund shares.
Fiscal-Year Total Returns (%): June 26, 2015, Through March 31, 2017
For a benchmark description, see the Glossary.
Note: For 2017, performance data reflect the six months ended March 31, 2017.
| Average Annual Total Returns: Period Ended March 31, 2017 | |||||
| Since Inception | |||||
| Inception Date | One Year | Income | Capital | Total | |
| Institutional Target | |||||
| Retirement 2055 Fund | 6/26/2015 | 14.77% | 1.55% | 3.51% | 5.06% |
See Financial Highlights for dividend and capital gains information.
48
InstitutionalTargetRetirement2055 Fund
Financial Statements (unaudited)
Statement of Net Assets
As of March 31, 2017
The fund reports a complete list of its holdings in regulatory filings four times in each fiscal year, at the quarter-ends. For the second and fourth fiscal quarters, the lists appear in the fund’s semiannual and annual reports to shareholders. For the first and third fiscal quarters, the fund files the lists with the Securities and Exchange Commission on Form N-Q. Shareholders can look up the fund’s Forms N-Q on the SEC’s website at sec.gov. Forms N-Q may also be reviewed and copied at the SEC’s Public Reference Room (see the back cover of this report for further information).
| Market | ||
| Value• | ||
| Shares | ($000) | |
| Investment Companies (99.8%) | ||
| U.S. Stock Fund (54.0%) | ||
| Vanguard Total Stock Market Index Fund Institutional Shares | 21,901,557 | 1,293,725 |
| International Stock Fund (35.7%) | ||
| Vanguard Total International Stock Index Fund Investor Shares | 53,717,352 | 855,180 |
| U.S. Bond Fund (7.1%) | ||
| 1 Vanguard Total Bond Market II Index Fund Investor Shares | 15,891,870 | 169,090 |
| International Bond Fund (3.0%) | ||
| Vanguard Total International Bond Index Fund Admiral Shares | 3,279,424 | 70,868 |
| Total Investment Companies (Cost $2,194,569) | 2,388,863 | |
| Temporary Cash Investment (0.1%) | ||
| Money Market Fund (0.1%) | ||
| 1 Vanguard Market Liquidity Fund, 0.965% (Cost $1,692) | 16,915 | 1,692 |
| Total Investments (99.9%) (Cost $2,196,261) | 2,390,555 | |
| Other Assets and Liabilities (0.1%) | ||
| Other Assets | 23,004 | |
| Liabilities | (20,464) | |
| 2,540 | ||
| Net Assets (100%) | ||
| Applicable to 112,634,804 outstanding $.001 par value shares of | ||
| beneficial interest (unlimited authorization) | 2,393,095 | |
| Net Asset Value Per Share | $21.25 | |
49
InstitutionalTargetRetirement2055 Fund
| Amount | ||
| ($000) | ||
| Statement of Assets and Liabilities | ||
| Assets | ||
| Investments in Securities, at Value—Affiliated Vanguard | Funds | 2,390,555 |
| Receivables for Investment Securities Sold | 1,997 | |
| Receivables for Accrued Income | 398 | |
| Receivables for Capital Shares Issued | 20,609 | |
| Total Assets | 2,413,559 | |
| Liabilities | ||
| Payables for Investment Securities Purchased | 19,498 | |
| Payables for Capital Shares Redeemed | 966 | |
| Total Liabilities | 20,464 | |
| Net Assets | 2,393,095 | |
| At March 31, 2017, net assets consisted of: | ||
| Amount | ||
| ($000) | ||
| Paid-in Capital | 2,189,814 | |
| Undistributed Net Investment Income | 9,054 | |
| Accumulated Net Realized Losses | (67) | |
| Unrealized Appreciation (Depreciation) | 194,294 | |
| Net Assets | 2,393,095 | |
• SeeNote Ain NotestoFinancialStatements.
1 Affiliated fund available only to Vanguard funds and certain trusts and accounts managed by Vanguard. Rate shown for Vanguard Market
Liquidity Fund is the 7-day yield.
See accompanying Notes, which are an integral part of the Financial Statements.
50
InstitutionalTargetRetirement2055 Fund
Statement of Operations
| Six Months Ended | |
| March 31, 2017 | |
| ($000) | |
| Investment Income | |
| Income | |
| Income Distributions Received from Affiliated Funds | 21,505 |
| Net Investment Income—Note B | 21,505 |
| Realized Net Gain (Loss) | |
| Capital Gain Distributions Received from Affiliated Funds | 132 |
| Affiliated Investment Securities Sold | (79) |
| Realized Net Gain (Loss) | 53 |
| Change in Unrealized Appreciation (Depreciation) of Investment Securities | 125,140 |
| Net Increase (Decrease) in Net Assets Resulting from Operations | 146,698 |
See accompanying Notes, which are an integral part of the Financial Statements.
51
InstitutionalTargetRetirement2055 Fund
Statement of Changes in NetAssets
| Six Months Ended | Year Ended | |
| March 31, | September 30, | |
| 2017 | 2016 | |
| ($000) | ($000) | |
| Increase (Decrease) in Net Assets | ||
| Operations | ||
| Net Investment Income | 21,505 | 23,312 |
| Realized Net Gain (Loss) | 53 | 46 |
| Change in Unrealized Appreciation (Depreciation) | 125,140 | 90,488 |
| Net Increase (Decrease) in Net Assets Resulting from Operations | 146,698 | 113,846 |
| Distributions | ||
| Net Investment Income | (31,435) | (5,544) |
| Realized Capital Gain1 | (131) | (35) |
| Total Distributions | (31,566) | (5,579) |
| Capital Share Transactions | ||
| Issued | 801,160 | 1,099,916 |
| Issued in Lieu of Cash Distributions | 31,142 | 5,531 |
| Redeemed | (81,563) | (59,524) |
| Net Increase (Decrease) from Capital Share Transactions | 750,739 | 1,045,923 |
| Total Increase (Decrease) | 865,871 | 1,154,190 |
| Net Assets | ||
| Beginning of Period | 1,527,224 | 373,034 |
| End of Period2 | 2,393,095 | 1,527,224 |
1 Includes fiscal 2017 and 2016 short-term gain distributions totaling $87,000 and $35,000, respectively. Short-term gain distributions are
treated as ordinary income dividends for tax purposes.
2 Net Assets—End of Period includes undistributed (overdistributed) net investment income of $9,054,000 and $18,984,000.
See accompanying Notes, which are an integral part of the Financial Statements.
52
InstitutionalTargetRetirement2055 Fund
Financial Highlights
| Six Months | Year | June 26, | |
| Ended | Ended | 20151 to | |
| March 31, | Sept. 30, | Sept. 30, | |
| For a Share Outstanding Throughout Each Period | 2017 | 2016 | 2015 |
| Net Asset Value, Beginning of Period | $20.11 | $18.08 | $20.00 |
| Investment Operations | |||
| Net Investment Income | .2322 | .4702 | .1572 |
| Capital Gain Distributions Received | .0012 | .001 | — |
| Net Realized and Unrealized Gain (Loss) on Investments | 1.269 | 1.718 | (2.077) |
| Total from Investment Operations | 1.502 | 2.189 | (1.920) |
| Distributions | |||
| Dividends from Net Investment Income | (.360) | (.158) | — |
| Distributions from Realized Capital Gains | (.002) | (.001) | — |
| Total Distributions | (.362) | (.159) | — |
| Net Asset Value, End of Period | $21.25 | $20.11 | $18.08 |
| Total Return | 7.58% | 12.16% | -9.60% |
| Ratios/Supplemental Data | |||
| Net Assets, End of Period (Millions) | $2,393 | $1,527 | $373 |
| Ratio of Total Expenses to Average Net Assets | — | — | — |
| Acquired Fund Fees and Expenses | 0.09% | 0.10% | 0.10%3 |
| Ratio of Net Investment Income to Average Net Assets | 2.29% | 2.47% | 3.05%3 |
| Portfolio Turnover Rate | 4% | 1% | 1% |
| Theexpenseratio,acquiredfundfeesandexpenses,netinvestmentincomeratio,andturnoverrateforthecurrentperiodhavebeenannualized. | |||
| 1Inception. | |||
| 2 Calculated based on average shares outstanding. | |||
| 3 Annualized. | |||
See accompanying Notes, which are an integral part of the Financial Statements.
53
InstitutionalTargetRetirement2055 Fund
Notes to Financial Statements
Vanguard Institutional Target Retirement 2055 Fund is registered under the Investment Company Act of 1940 as an open-end investment company, or mutual fund. The fund follows a balanced investment strategy by investing in selected Vanguard funds to achieve its targeted allocation of assets to U.S. and international stocks, and U.S. and international bonds. Financial statements and other information about each underlying fund are available on vanguard.com.
A. The following significant accounting policies conform to generally accepted accounting principles forU.S. investmentcompanies. Thefundconsistentlyfollowssuchpoliciesinpreparingitsfinancial statements.
1. SecurityValuation:InvestmentsarevaluedatthenetassetvalueofeachunderlyingVanguardfund determined as of the close of the New YorkStock Exchange (generally 4 p.m., Easterntime) on the valuationdate.
2. Federal Income Taxes: The fund intends to continue to qualify as a regulated investment company and distribute all of its taxable income. Management has analyzed the fund’s tax positions taken for all open federal income tax years (September 30, 2015–2016), and for the period ended March 31, 2017, and has concluded that no provision for federal income tax is required in the fund’s financial statements. 3. Distributions: Distributions to shareholders are recorded on the ex-dividend date.
4. Credit Facility: The fund and certain other funds managed by The Vanguard Group (“Vanguard”) participate in a $3.1 billion committed credit facility provided by a syndicate of lenders pursuant to a credit agreement that may be renewed annually; each fund is individually liable for its borrowings, if any, under the credit facility. Borrowings may be utilized for temporary and emergency purposes, and are subject to the fund’s regulatory and contractual borrowing restrictions. The participating funds are charged administrative fees and an annual commitment fee of 0.10% of the undrawn amount of the facility; these fees are allocated to the funds based on a method approved by the fund’s board of trustees and borne by the funds in which the fund invests (see Note B). Any borrowings under this facility bear interest at a rate based upon the higher of the one-month London Interbank Offered Rate, federal funds effective rate, or overnight bank funding rate plus an agreed-upon spread.
The fund had no borrowings outstanding at March 31, 2017, or at any time during the period then ended.
5. Other: Income and capital gain distributions received are recorded on the ex-dividend date. Security transactions are accounted for on the date securities are bought or sold. Costs used to determine realized gains (losses) on the sale of investment securities are those of the specific securities sold.
B. In accordance with the terms of a Funds’ Service Agreement (the “FSA”) between Vanguard and the fund, Vanguard furnishes to the fund investment advisory, corporate management, administrative, marketing, and distribution services at Vanguard’s cost of operations (as defined by the FSA). These costs of operations are allocated to the fund based on methods and guidelines approved by the board of trustees. The FSA provides that expenses otherwise allocable to Vanguard funds-of-funds may be reduced or eliminated to the extent of savings realized by the underlying Vanguard funds by virtue of being part of a fund-of-funds. Accordingly, all expenses for services provided by Vanguard to the fund and all other expenses incurred by the fund during the period ended March 31, 2017, were borne by the underlying Vanguard funds in which the fund invests. The fund’s trustees and officers are also trustees and officers, respectively, of the underlying Vanguard funds, as well as directors and employees, respectively, of Vanguard.
54
InstitutionalTargetRetirement2055 Fund
C. Various inputs may be used to determine the value of the fund’s investments. These inputs are summarized in three broad levels for financial statement purposes. The inputs or methodologies used to value securities are not necessarily an indication of the risk associated with investing in those securities.
Level 1—Quoted prices in active markets for identical securities.
Level 2—Other significant observable inputs (including quoted prices for similar securities, interest rates, prepayment speeds, credit risk, etc.).
Level 3—Significant unobservable inputs (including the fund’s own assumptions used to determine the fair value of investments).
At March 31, 2017, 100% of the market value of the fund’s investments was determined based on Level1inputs.
D. Distributions are determined on a tax basis and may differ from net investment income and realized capital gains for financial reporting purposes. Differences may be permanent or temporary. Permanent differences are reclassified among capital accounts in the financial statements to reflect their tax character. Temporary differences arise when certain items of income, expense, gain, or loss are recognized in different periods for financial statement and tax purposes. These differences will reverse at some time in the future. Differences in classification may also result from the treatment of short-term gains as ordinary income for tax purposes. The fund’s tax-basis capital gains and losses are determined only at the end of each fiscal year.
At March 31, 2017, the cost of investment securities for tax purposes was $2,196,261,000. Net unrealized appreciation of investment securities for tax purposes was $194,294,000, consisting of unrealized gains of $195,860,000 on securities that had risen in value since their purchase and $1,566,000 in unrealized losses on securities that had fallen in value since their purchase.
E. Capital shares issued and redeemed were:
| Six Months Ended | Year Ended | |
| March 31, 2017 | September 30, 2016 | |
| Shares | Shares | |
| (000) | (000) | |
| Issued | 39,141 | 58,130 |
| Issued in Lieu of Cash Distributions | 1,558 | 292 |
| Redeemed | (3,990) | (3,134) |
| Net Increase (Decrease) in Shares Outstanding | 36,709 | 55,288 |
At March 31, 2017, one shareholder was the record or beneficial owner of 26% of the fund’s net assets. If the shareholder were to redeem its investment in the fund, the redemption might lead to the realization of taxable capital gains.
55
InstitutionalTargetRetirement2055 Fund
F. Transactions during the period in affiliated underlying Vanguard funds were as follows:
| Current Period Transactions | ||||||
| Sept. 30, | Proceeds | March 31, | ||||
| 2016 | from | Capital Gain | 2017 | |||
| Market | Purchases | Securities | Distributions | Market | ||
| Value | at Cost | Sold | Income | Received | Value | |
| ($000) | ($000) | ($000) | ($000) | ($000) | ($000) | |
| Vanguard Market Liquidity Fund | 746 | NA1 | NA1 | 6 | — | 1,692 |
| Vanguard Total Bond Market II | ||||||
| Index Fund | 106,412 | 78,307 | 11,687 | 1,566 | 132 | 169,090 |
| Vanguard Total International | ||||||
| Bond Index Fund | 45,232 | 27,164 | — | 640 | — | 70,868 |
| Vanguard Total International | ||||||
| Stock Index Fund | 546,748 | 272,091 | 6,619 | 7,737 | — | 855,180 |
| VanguardTotalStockMarket | ||||||
| Index Fund | 822,011 | 402,567 | 18,424 | 11,556 | — | 1,293,725 |
| Total | 1,521,149 | 780,129 | 36,730 | 21,505 | 132 | 2,390,555 |
| 1 Not applicable—purchases and sales are for temporary cash investment purposes. | ||||||
G. Managementhasdeterminedthatnomaterialeventsortransactionsoccurredsubsequentto March31,2017,thatwouldrequirerecognitionordisclosureinthesefinancialstatements.
56
InstitutionalTargetRetirement2060Fund
Fund Profile
As of March 31, 2017
| Total Fund Characteristics | |
| Ticker Symbol | VILVX |
| 30-Day SEC Yield | 2.19% |
| Acquired Fund Fees and Expenses1 | 0.10% |
| Allocation to Underlying Vanguard Funds | |
| Vanguard Total Stock Market Index Fund | |
| Institutional Shares | 54.1% |
| Vanguard Total International Stock Index | |
| Fund Investor Shares | 35.8 |
| Vanguard Total Bond Market II Index Fund | |
| Investor Shares | 7.1 |
| Vanguard Total International Bond Index | |
| Fund Admiral Shares | 3.0 |
Fund Asset Allocation
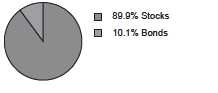
1 This figure—drawn from the prospectus dated January 27, 2017—represents an estimate of the weighted average of the expense ratios and any transaction fees charged by the underlying mutual funds (the ”acquired” funds) in which the Institutional Target Retirement 2060 Fund invests. The fund does not charge any expenses or fees of its own. For the six months ended March 31, 2017, the annualized acquired fund fees and expenses were 0.09%.
57
InstitutionalTargetRetirement2060 Fund
Performance Summary
All of the returns in this report represent past performance, which is not a guarantee of future results that may be achieved by the fund. (Current performance may be lower or higher than theperformancedatacited. Forperformancedatacurrentto themost recentmonth-end, visit our website at vanguard.com/performance.) Note, too, that both investment returns and principal value can fluctuate widely, so an investor’s shares, when sold, could be worth more or less than their original cost. The returns shown do not reflect taxes that a shareholder would pay on fund distributions or on the sale of fund shares.
Fiscal-Year Total Returns (%): June 26, 2015, Through March 31, 2017
For a benchmark description, see the Glossary.
Note: For 2017, performance data reflect the six months ended March 31, 2017.
| Average Annual Total Returns: Period Ended March 31, 2017 | |||||
| Since Inception | |||||
| Inception Date | One Year | Income | Capital | Total | |
| Institutional Target | |||||
| Retirement 2060 Fund | 6/26/2015 | 14.78% | 1.57% | 3.45% | 5.02% |
See Financial Highlights for dividend and capital gains information.
58
InstitutionalTargetRetirement2060 Fund
Financial Statements (unaudited)
Statement of Net Assets
As of March 31, 2017
The fund reports a complete list of its holdings in regulatory filings four times in each fiscal year, at the quarter-ends. For the second and fourth fiscal quarters, the lists appear in the fund’s semiannual and annual reports to shareholders. For the first and third fiscal quarters, the fund files the lists with the Securities and Exchange Commission on Form N-Q. Shareholders can look up the fund’s Forms N-Q on the SEC’s website at sec.gov. Forms N-Q may also be reviewed and copied at the SEC’s Public Reference Room (see the back cover of this report for further information).
| Market | ||
| Value• | ||
| Shares | ($000) | |
| Investment Companies (99.7%) | ||
| U.S. Stock Fund (53.9%) | ||
| Vanguard Total Stock Market Index Fund Institutional Shares | 5,091,155 | 300,735 |
| International Stock Fund (35.7%) | ||
| Vanguard Total International Stock Index Fund Investor Shares | 12,518,489 | 199,294 |
| U.S. Bond Fund (7.1%) | ||
| 1 Vanguard Total Bond Market II Index Fund Investor Shares | 3,701,087 | 39,380 |
| International Bond Fund (3.0%) | ||
| Vanguard Total International Bond Index Fund Admiral Shares | 768,042 | 16,597 |
| Total Investment Companies (Cost $513,638) | 556,006 | |
| Temporary Cash Investment (0.1%) | ||
| Money Market Fund (0.1%) | ||
| 1 Vanguard Market Liquidity Fund, 0.965% (Cost $540) | 5,399 | 540 |
| Total Investments (99.8%) (Cost $514,178) | 556,546 | |
| Other Assets and Liabilities (0.2%) | ||
| Other Assets | 5,729 | |
| Liabilities | (4,619) | |
| 1,110 | ||
| Net Assets (100%) | ||
| Applicable to 26,267,887 outstanding $.001 par value shares of | ||
| beneficial interest (unlimited authorization) | 557,656 | |
| Net Asset Value Per Share | $21.23 | |
59
InstitutionalTargetRetirement2060 Fund
| Amount | |
| ($000) | |
| Statement of Assets and Liabilities | |
| Assets | |
| Investments in Securities, at Value—Affiliated Vanguard Funds | 556,546 |
| Receivables for Investment Securities Sold | 622 |
| Receivables for Accrued Income | 92 |
| Receivables for Capital Shares Issued | 5,015 |
| Total Assets | 562,275 |
| Liabilities | |
| Payables for Investment Securities Purchased | 4,564 |
| Payables for Capital Shares Redeemed | 55 |
| Total Liabilities | 4,619 |
| Net Assets | 557,656 |
| At March 31, 2017, net assets consisted of: | |
| Amount | |
| ($000) | |
| Paid-in Capital | 513,210 |
| Undistributed Net Investment Income | 2,107 |
| Accumulated Net Realized Losses | (29) |
| Unrealized Appreciation (Depreciation) | 42,368 |
| Net Assets | 557,656 |
• SeeNote Ain NotestoFinancialStatements.
1 Affiliated fund available only to Vanguard funds and certain trusts and accounts managed by Vanguard. Rate shown for Vanguard Market
Liquidity Fund is the 7-day yield.
See accompanying Notes, which are an integral part of the Financial Statements.
60
InstitutionalTargetRetirement2060 Fund
Statement of Operations
| Six Months Ended | |
| March 31, 2017 | |
| ($000) | |
| Investment Income | |
| Income | |
| Income Distributions Received from Affiliated Funds | 4,900 |
| Net Investment Income—Note B | 4900 |
| Realized Net Gain (Loss) | |
| Capital Gain Distributions Received from Affiliated Funds | 30 |
| Affiliated Investment Securities Sold | (26) |
| Realized Net Gain (Loss) | 4 |
| Change in Unrealized Appreciation (Depreciation) of Investment Securities | 28,347 |
| Net Increase (Decrease) in Net Assets Resulting from Operations | 33,251 |
See accompanying Notes, which are an integral part of the Financial Statements.
61
InstitutionalTargetRetirement2060 Fund
Statement of Changes in NetAssets
| Six Months Ended | Year Ended | |
| March 31, | September 30, | |
| 2017 | 2016 | |
| ($000) | ($000) | |
| Increase (Decrease) in Net Assets | ||
| Operations | ||
| Net Investment Income | 4,900 | 5,225 |
| Realized Net Gain (Loss) | 4 | 4 |
| Change in Unrealized Appreciation (Depreciation) | 28,347 | 20,526 |
| Net Increase (Decrease) in Net Assets Resulting from Operations | 33,251 | 25,755 |
| Distributions | ||
| Net Investment Income | (7,097) | (1,314) |
| Realized Capital Gain1 | (28) | (8) |
| Total Distributions | (7,125) | (1,322) |
| Capital Share Transactions | ||
| Issued | 223,644 | 244,013 |
| Issued in Lieu of Cash Distributions | 7,005 | 1,322 |
| Redeemed | (33,616) | (30,040) |
| Net Increase (Decrease) from Capital Share Transactions | 197,033 | 215,295 |
| Total Increase (Decrease) | 223,159 | 239,728 |
| Net Assets | ||
| Beginning of Period | 334,497 | 94,769 |
| End of Period2 | 557,656 | 334,497 |
| 1 Includes fiscal 2017 and 2016 short-term gain distributions totaling $22,000 and $8,000, respectively. Short-term gain distributions are | ||
| treated as ordinary income dividends for tax purposes. | ||
| 2 Net Assets—End of Period includes undistributed (overdistributed) net investment income of $2,107,000 and $4,304,000. | ||
See accompanying Notes, which are an integral part of the Financial Statements.
62
InstitutionalTargetRetirement2060 Fund
Financial Highlights
| Six Months | Year | June 26, | |
| Ended | Ended | 20151 to | |
| March 31, | Sept. 30, | Sept. 30, | |
| For a Share Outstanding Throughout Each Period | 2017 | 2016 | 2015 |
| Net Asset Value, Beginning of Period | $20.10 | $18.07 | $20.00 |
| Investment Operations | |||
| Net Investment Income | .2342 | .4662 | .1352 |
| Capital Gain Distributions Received | .0012 | .0012 | — |
| Net Realized and Unrealized Gain (Loss) on Investments | 1.255 | 1.729 | (2.065) |
| Total from Investment Operations | 1.490 | 2.196 | (1.930) |
| Distributions | |||
| Dividends from Net Investment Income | (.359) | (.165) | — |
| Distributions from Realized Capital Gains | (.001) | (.001) | — |
| Total Distributions | (.360) | (.166) | — |
| Net Asset Value, End of Period | $21.23 | $20.10 | $18.07 |
| Total Return | 7.53% | 12.21% | -9.65% |
| Ratios/Supplemental Data | |||
| Net Assets, End of Period (Millions) | $558 | $334 | $95 |
| Ratio of Total Expenses to Average Net Assets | — | — | — |
| Acquired Fund Fees and Expenses | 0.09% | 0.10% | 0.10%3 |
| Ratio of Net Investment Income to Average Net Assets | 2.31% | 2.45% | 2.53%3 |
| Portfolio Turnover Rate | 6% | 4% | 4% |
| The expense ratio, acquired fund fees and expenses, net investment income ratio, and turnover for the current period have been annualized. | |||
| 1Inception. | |||
| 2 Calculated based on average shares outstanding. | |||
| 3 Annualized. | |||
See accompanying Notes, which are an integral part of the Financial Statements.
63
InstitutionalTargetRetirement2060 Fund
Notes to Financial Statements
Vanguard Institutional Target Retirement 2060 Fund is registered under the Investment Company Act of 1940 as an open-end investment company, or mutual fund. The fund follows a balanced investment strategy by investing in selected Vanguard funds to achieve its targeted allocation of assets to U.S. and international stocks, and U.S. and international bonds. Financial statements and other information about each underlying fund are available on vanguard.com.
A. The following significant accounting policies conform to generally accepted accounting principles forU.S. investmentcompanies. Thefundconsistentlyfollowssuchpoliciesinpreparingitsfinancial statements.
1. SecurityValuation:InvestmentsarevaluedatthenetassetvalueofeachunderlyingVanguardfund determined as of the close of the New YorkStock Exchange (generally 4 p.m., Easterntime) on the valuationdate.
2. Federal Income Taxes: The fund intends to continue to qualify as a regulated investment company and distribute all of its taxable income. Management has analyzed the fund’s tax positions taken for all open federal income tax years (September 30, 2015–2016), and for the period ended March 31, 2017, and has concluded that no provision for federal income tax is required in the fund’s financial statements. 3. Distributions: Distributions to shareholders are recorded on the ex-dividend date.
4. Credit Facility: The fund and certain other funds managed by The Vanguard Group (“Vanguard”) participate in a $3.1 billion committed credit facility provided by a syndicate of lenders pursuant to a credit agreement that may be renewed annually; each fund is individually liable for its borrowings, if any, under the credit facility. Borrowings may be utilized for temporary and emergency purposes, and are subject to the fund’s regulatory and contractual borrowing restrictions. The participating funds are charged administrative fees and an annual commitment fee of 0.10% of the undrawn amount of the facility; these fees are allocated to the funds based on a method approved by the fund’s board of trustees and borne by the funds in which the fund invests (see Note B). Any borrowings under this facility bear interest at a rate based upon the higher of the one-month London Interbank Offered Rate, federal funds effective rate, or overnight bank funding rate plus an agreed-upon spread.
The fund had no borrowings outstanding at March 31, 2017, or at any time during the period then ended.
5. Other: Income and capital gain distributions received are recorded on the ex-dividend date. Security transactions are accounted for on the date securities are bought or sold. Costs used to determine realized gains (losses) on the sale of investment securities are those of the specific securities sold.
B. In accordance with the terms of a Funds’ Service Agreement (the “FSA”) between Vanguard and the fund, Vanguard furnishes to the fund investment advisory, corporate management, administrative, marketing, and distribution services at Vanguard’s cost of operations (as defined by the FSA). These costs of operations are allocated to the fund based on methods and guidelines approved by the board of trustees. The FSA provides that expenses otherwise allocable to Vanguard funds-of-funds may be reduced or eliminated to the extent of savings realized by the underlying Vanguard funds by virtue of being part of a fund-of-funds. Accordingly, all expenses for services provided by Vanguard to the fund and all other expenses incurred by the fund during the period ended March 31, 2017, were borne by the underlying Vanguard funds in which the fund invests. The fund’s trustees and officers are also trustees and officers, respectively, of the underlying Vanguard funds, as well as directors and employees, respectively, of Vanguard.
64
InstitutionalTargetRetirement2060 Fund
C. Various inputs may be used to determine the value of the fund’s investments. These inputs are summarized in three broad levels for financial statement purposes. The inputs or methodologies used to value securities are not necessarily an indication of the risk associated with investing in those securities.
Level 1—Quoted prices in active markets for identical securities.
Level 2—Other significant observable inputs (including quoted prices for similar securities, interest rates, prepayment speeds, credit risk, etc.).
Level 3—Significant unobservable inputs (including the fund’s own assumptions used to determine the fair value of investments).
At March 31, 2017, 100% of the market value of the fund’s investments was determined based on Level1inputs.
D. Distributions are determined on a tax basis and may differ from net investment income and realized capital gains for financial reporting purposes. Differences may be permanent or temporary. Permanent differences are reclassified among capital accounts in the financial statements to reflect their tax character. Temporary differences arise when certain items of income, expense, gain, or loss are recognized in different periods for financial statement and tax purposes. These differences will reverse at some time in the future. Differences in classification may also result from the treatment of short-term gains as ordinary income for tax purposes. The fund’s tax-basis capital gains and losses are determined only at the end of each fiscal year.
At March 31, 2017, the cost of investment securities for tax purposes was $514,178,000. Net unrealized appreciation of investment securities for tax purposes was $42,368,000, consisting of unrealized gains of $42,677,000 on securities that had risen in value since their purchase and $309,000 in unrealized losses on securities that had fallen in value since their purchase.
E. Capital shares issued and redeemed were:
| Six Months Ended | Year Ended | |
| March 31, 2017 | September 30, 2016 | |
| Shares | Shares | |
| (000) | (000) | |
| Issued | 10,924 | 12,908 |
| Issued in Lieu of Cash Distributions | 351 | 70 |
| Redeemed | (1,648) | (1,581) |
| Net Increase (Decrease) in Shares Outstanding | 9,627 | 11,397 |
At March 31, 2017, one shareholder was the record or beneficial owner of 25% of the fund’s net assets. If the shareholder were to redeem its investment in the fund, the redemption might lead to the realization of taxable capital gains.
65
InstitutionalTargetRetirement2060 Fund
F. Transactions during the period in affiliated underlying Vanguard funds were as follows:
| Current Period Transactions | ||||||
| Sept. 30, | Proceeds | March 31, | ||||
| 2016 | from | Capital Gain | 2017 | |||
| Market | Purchases | Securities | Distributions | Market | ||
| Value | at Cost | Sold | Income | Received | Value | |
| ($000) | ($000) | ($000) | ($000) | ($000) | ($000) | |
| Vanguard Market Liquidity Fund | 410 | NA1 | NA1 | 3 | — | 540 |
| Vanguard Total Bond Market II | ||||||
| Index Fund | 23,180 | 21,157 | 4,092 | 354 | 30 | 39,380 |
| Vanguard Total International | ||||||
| Bond Index Fund | 9,902 | 7,063 | 33 | 141 | — | 16,597 |
| Vanguard Total International | ||||||
| Stock Index Fund | 119,551 | 72,820 | 2,899 | 1,766 | — | 199,294 |
| VanguardTotalStockMarket | ||||||
| Index Fund | 180,198 | 106,439 | 5,601 | 2,636 | — | 300,735 |
| Total | 333,241 | 207,479 | 12,625 | 4,900 | 30 | 556,546 |
| 1 Not applicable—purchases and sales are for temporary cash investment purposes. | ||||||
G. Managementhasdeterminedthatnomaterialeventsortransactionsoccurredsubsequentto March31,2017,thatwouldrequirerecognitionordisclosureinthesefinancialstatements.
66
About Your Fund’s Expenses
As a shareholder of the fund, you incur ongoing costs, which include costs for portfolio management, administrative services, and shareholder reports (like this one), among others. Operating expenses, which are deducted from a fund’s gross income, directly reduce the investment return of the fund.
A typical fund’s expenses are expressed as a percentage of its average net assets. The Institutional Target Retirement Funds have no direct expenses, but each fund bears its proportionate share of the costs for the underlying funds in which it invests. These indirect expenses make up the acquired fund fees and expenses, also expressed as a percentage of average net assets.
The following examples are intended to help you understand the ongoing cost (in dollars) of investing in your fund and to compare these costs with those of other mutual funds. The examples are based on an investment of $1,000 made at the beginning of the period shown and held for the entire period. The costs were calculated using the acquired fund fees and expenses for each Institutional Target Retirement Fund.
The accompanying table illustrates your fund’s costs in two ways:
• Based on actual fund return. This section helps you to estimate the actual expenses that you paid over the period. The ”Ending Account Value“ shown is derived from the fund‘s actual return, and the thirdcolumn shows the dollaramount that would havebeenpaidby an investorwho started with $1,000 in the fund. You may use the information here, together with the amount you invested, to estimate the expenses that you paid over the period.
To do so, simply divide your account value by $1,000 (for example, an $8,600 account value divided by $1,000 = 8.6), then multiply the result by the number given for your fund under the heading ”Expenses Paid During Period.“
• Based on hypothetical 5% yearly return. This section is intended to help you compare your fund‘s costs with those of other mutual funds. It assumes that the fund had a yearly return of 5% before expenses, but that the expense ratio is unchanged. In this case—because the return used is not the fund’s actual return—the results do not apply to your investment. The example is useful in making comparisons because the Securities and Exchange Commission requires all mutual fundsto calculate expenses based on a 5% return. You can assess your fund’s costs by comparing this hypothetical examplewiththehypotheticalexamplesthatappearinshareholderreportsofotherfunds.
Note that the expenses shown in the table are meant to highlight and help you compare ongoing costs only and do not reflect transaction costs incurred by the fund for buying and selling securities. Further, the expenses do not include any purchase, redemption, or account service fees described in the fund prospectus. If such fees were applied to your account, your costs would be higher. Your fund does not carry a “sales load.” The calculations assume no shares were bought or sold during the period. Your actual costs may have been higher or lower, depending on the amount of your investment and the timing of any purchases or redemptions.
You can find more information about the fund’s expenses, including annual expense ratios, in the Financial Statements section of this report. For additional information on operating expenses and other shareholder costs, please refer to your fund’s current prospectus.
67
InstitutionalTargetRetirement2060 Fund
| Six Months Ended March 31, 2017 | |||
| Beginning | Ending | Expenses | |
| Account Value | Account Value | Paid During | |
| 9/30/2016 | 3/31/2017 | Period | |
| Based on Actual Fund Return | |||
| Institutional Target Retirement 2035 Fund | $1,000.00 | $1,064.31 | $0.46 |
| Institutional Target Retirement 2040 Fund | $1,000.00 | $1,072.63 | $0.47 |
| Institutional Target Retirement 2045 Fund | $1,000.00 | $1,075.39 | $0.47 |
| Institutional Target Retirement 2050 Fund | $1,000.00 | $1,075.40 | $0.47 |
| Institutional Target Retirement 2055 Fund | $1,000.00 | $1,075.80 | $0.47 |
| Institutional Target Retirement 2060 Fund | $1,000.00 | $1,075.28 | $0.47 |
| Based on Hypothetical 5% Yearly Return | |||
| Institutional Target Retirement 2035 Fund | $1,000.00 | $1,024.48 | $0.45 |
| Institutional Target Retirement 2040 Fund | $1,000.00 | $1,024.48 | $0.45 |
| Institutional Target Retirement 2045 Fund | $1,000.00 | $1,024.48 | $0.45 |
| Institutional Target Retirement 2050 Fund | $1,000.00 | $1,024.48 | $0.45 |
| Institutional Target Retirement 2055 Fund | $1,000.00 | $1,024.48 | $0.45 |
| Institutional Target Retirement 2060 Fund | $1,000.00 | $1,024.48 | $0.45 |
Thecalculationsarebasedontheacquiredfundfeesandexpensesforthemostrecentsix-monthperiod. Thefunds’annualizedexpense
figuresforthatperiodare(inorderaslistedfromtoptobottomabove)0.09%,0.09%,0.09%,0.09%,0.09%,and0.09%. Thedollaramounts
shown as ”Expenses Paid” are equal to the annualized expense figures for the underlying funds multiplied by the average account value over
the period, multiplied by the number of days in the most recent six-month period, then divided by the number of days in the most recent
12-month period (182/365).
68
Trustees Approve Advisory Arrangement
The board of trustees of Vanguard Institutional TargetRetirement Funds has renewed each fund’s investmentadvisoryarrangementwithTheVanguardGroup,Inc.(Vanguard),throughitsEquityIndex Group. Theboarddeterminedthatcontinuingeachfund’sinternalizedmanagementstructurewasin thebestinterestsofthefundsandtheirshareholders.
Theboardbaseditsdecisionuponan evaluation ofthe advisor’sinvestmentstaff,portfolio managementprocess,andperformance.Thisevaluationincludedinformationprovidedtotheboard byVanguard’sPortfolioReviewDepartment,whichisresponsibleforadvisoroversightandproduct management. The Portfolio Review Department met regularly with the advisor and made monthly presentationstotheboardduringthefiscalyearthatdirectedtheboard’sfocustorelevantinformation and topics.
Theboard,oraninvestmentcommitteemadeupofboardmembers,alsoreceivedinformation throughout the year during advisor presentations. For each advisor presentation, the board was providedwithlettersandreportsthatincludedinformationabout,amongotherthings,theadvisory firm and the advisor’s assessment of the investment environment, portfolio performance, and portfolio characteristics.
Inaddition, theboardreceivedmonthlyreports, whichincludeda Marketand EconomicReport, a FundDashboardMonthly Summary, and a FundPerformanceReport.
Prior totheirmeeting, thetrusteeswereprovided witha memoand materialsthat summarized the information they received over the course of the year. They also considered the factors discussed below,amongothers.However,nosinglefactordeterminedwhethertheboardapprovedthe arrangements. Rather,itwasthetotalityofthecircumstancesthatdrovetheboard’sdecision.
Nature, extent, and quality of services
Theboard reviewedthequalityoftheinvestment managementservicesprovided to thefundsand tookintoaccounttheorganizationaldepthandstabilityoftheadvisor. Theboardconsideredthat Vanguard hasbeen managing investmentsfor more thanthree decades. The Equity Index Group adheres to a sound, disciplined investment management process; the team has considerable experience, stability, anddepth.
The board concluded that Vanguard’s experience, stability, depth, and performance, among other factors, warranted continuation of the advisory arrangements.
Investment performance
Theboard consideredthe performance of each fund sincetheir inceptions in 2015, includingany periods of outperformance or underperformance compared with a relevant benchmark index and peer group. Theboardconcludedthattheperformancewassuchthattheadvisoryarrangements should continue. Informationabouteach fund’smostrecentperformance canbefoundinthePerformance Summarypagesofthis report.
69
InstitutionalTargetRetirement2060 Fund
Cost
The board concluded that the funds’ acquired fund fees and expenses were well below the expense ratios charged by funds in their respective peer groups. The funds do not incur advisory expenses directly; however, the board noted that each of the underlying funds in which the funds invest has advisory expenses well below the relevant peer-group average. Information about the funds’ acquired fund fees and expenses appears in the About Your Fund’s Expenses section of this report as well as in the Financial Statements sections.
The board did not conduct a profitability analysis of Vanguard because of Vanguard’s unique “at-cost” structure. Unlike most other mutual fund management companies, Vanguard is owned by the funds it oversees and produces “profits” only in the form of reduced expenses for fund shareholders.
The benefit of economies of scale
The board concluded that Vanguard’s at-cost arrangement with the Institutional Target Retirement Funds and their underlying funds ensures that the funds will realize economies of scale as the assets of the underlying funds grow, with the cost to shareholders declining as assets increase.
The board will consider whether to renew the advisory arrangement again after a one-year period.
70
Glossary
30-Day SEC Yield. A fund’s 30-day SEC yield is derived using a formula specified by the U.S. Securities and Exchange Commission. Under the formula, data related to the fund’s security holdings in the previous 30 days are used to calculate the fund’s hypothetical net income for that period, which is then annualized and divided by the fund’s estimated average net assets over the calculation period. For the purposes of this calculation, a security’s income is based on its current market yield to maturity (for bonds), its actual income (for asset-backed securities), or its projected dividend yield (for stocks). Because the SEC yield represents hypothetical annualized income, it will differ—at times significantly—from the fund’s actual experience. As a result, the fund’s income distributions may be higher or lower than implied by the SEC yield.
Acquired Fund Fees and Expenses. Funds that invest in other Vanguard funds incur no direct expenses, but they do bear proportionate shares of the operating, administrative, and advisory expenses of the underlying funds, and they must pay any fees charged by those funds. The figure for acquired fund fees and expenses represents a weighted average of these underlying costs.
Acquired is a term that the Securities and Exchange Commission applies to any mutual fund whose shares are owned by another fund.
Expense Ratio. A fund’s total annual operating expenses expressed as a percentage of the fund’s average net assets. The expense ratio includes management and administrative expenses, but does not include the transaction costs of buying and selling portfolio securities.
Inception Date. The date on which the assets of a fund (or one of its share classes) are first invested in accordance with the fund’s investment objective. For funds with a subscription period, the inception date is the day after that period ends. Investment performance is measured from the inception date.
Benchmark Information
Target 2035 Composite Index: Derived by applying the fund’s target asset allocation to the results of the following benchmarks: for international stocks of developed markets, the MSCI EAFE Index through December 15, 2010, the MSCI ACWI ex USA IMI Index through June 2, 2013, and the FTSE Global All Cap ex US Index thereafter; for emerging-market stocks, the Select Emerging Markets Index through August 23, 2006, the MSCI Emerging Markets Index through December 15, 2010, the MSCI ACWI ex USA IMI Index through June 2, 2013, and the FTSE Global All Cap ex US Index thereafter; for U.S. bonds, the Bloomberg Barclays U.S. Aggregate Bond Index through December 31, 2009, and the Bloomberg Barclays U.S. Aggregate Float Adjusted Index thereafter; for international bonds, the Bloomberg Barclays Global Aggregate ex-USD Float Adjusted RIC Capped Index beginning June 3, 2013; and for U.S. stocks, the Dow Jones U.S. Total Stock Market Index (formerly known as the Dow Jones Wilshire 5000 Index) through April 22, 2005, the MSCI US Broad Market Index through June 2, 2013, and the CRSP US Total Market Index thereafter. International stock benchmark returns are adjusted for withholding taxes.
72
Target 2040 Composite Index: Derived by applying the fund’s target asset allocation to the results of the following benchmarks: for international stocks of developed markets, the MSCI EAFE Index through December 15, 2010, the MSCI ACWI ex USA IMI Index through June 2, 2013, and the FTSE Global All Cap ex US Index thereafter; for emerging-market stocks, the Select Emerging Markets Index through August 23, 2006, the MSCI Emerging Markets Index through December 15, 2010, the MSCI ACWI ex USA IMI Index through June 2, 2013, and the FTSE Global All Cap ex US Index thereafter; for U.S. bonds, the Bloomberg Barclays U.S. Aggregate Bond Index through December 31, 2009, and the Bloomberg Barclays U.S. Aggregate Float Adjusted Index thereafter; for international bonds, the Bloomberg Barclays Global Aggregate ex-USD Float Adjusted RIC Capped Index beginning June 3, 2013; and for U.S. stocks, the MSCI US Broad Market Index through June 2, 2013, and the CRSP US Total Market Index thereafter. International stock benchmark returns are adjusted for withholding taxes.
Target 2045 Composite Index: Derived by applying the fund’s target asset allocation to the results of the following benchmarks: for international stocks of developed markets, the MSCI EAFE Index through December 15, 2010, the MSCI ACWI ex USA IMI Index through June 2, 2013, and the FTSE Global All Cap ex US Index thereafter; for emerging-market stocks, the Select Emerging Markets Index through August 23, 2006, the MSCI Emerging Markets Index through December 15, 2010, the MSCI ACWI ex USA IMI Index through June 2, 2013, and the FTSE Global All Cap ex US Index thereafter; for U.S. bonds, the Bloomberg Barclays U.S. Aggregate Bond Index through December 31, 2009, and the Bloomberg Barclays U.S. Aggregate Float Adjusted Index thereafter; for international bonds, the Bloomberg Barclays Global Aggregate ex-USD Float Adjusted RIC Capped Index beginning June 3, 2013; and for U.S. stocks, the Dow Jones U.S. Total Stock Market Index (formerly known as the Dow Jones Wilshire 5000 Index) through April 22, 2005, the MSCI US Broad Market Index through June 2, 2013, and the CRSP US Total Market Index thereafter. International stock benchmark returns are adjusted for withholding taxes.
Target 2050 Composite Index: Derived by applying the fund’s target asset allocation to the results of the following benchmarks: for international stocks of developed markets, the MSCI EAFE Index through December 15, 2010, the MSCI ACWI ex USA IMI Index through June 2, 2013, and the FTSE Global All Cap ex US Index thereafter; for emerging-market stocks, the Select Emerging Markets Index through August 23, 2006, the MSCI Emerging Markets Index through December 15, 2010, the MSCI ACWI ex USA IMI Index through June 2, 2013, and the FTSE Global All Cap ex US Index thereafter; for U.S. bonds, the Bloomberg Barclays U.S. Aggregate Bond Index through December 31, 2009, and the Bloomberg Barclays U.S. Aggregate Float Adjusted Index thereafter; for international bonds, the Bloomberg Barclays Global Aggregate ex-USD Float Adjusted RIC Capped Index beginning June 3, 2013; and for U.S. stocks, the MSCI US Broad Market Index through June 2, 2013, and the CRSP US Total Market Index thereafter. International stock benchmark returns are adjusted for withholding taxes.
71
Target 2055 Composite Index: Derived by applying the fund’s target asset allocation to the results of the following benchmarks: for international stocks of developed markets, the MSCI EAFE Index through December 15, 2010, the MSCI ACWI ex USA IMI Index through June 2, 2013, and the FTSE Global All Cap ex US Index thereafter; for emerging-market stocks, the MSCI Emerging Markets Index through December 15, 2010, the MSCI ACWI ex USA IMI Index through June 2, 2013, and the FTSE Global All Cap ex US Index thereafter; for U.S. bonds, the Bloomberg Barclays U.S. Aggregate Float Adjusted Index; for international bonds, the Bloomberg Barclays Global Aggregate ex-USD Float Adjusted RIC Capped Index beginning June 3, 2013; and for U.S. stocks, the MSCI US Broad Market Index through June 2, 2013, and the CRSP US Total Market Index thereafter. International stock benchmark returns are adjusted for withholding taxes.
Target 2060 Composite Index: Derived by applying the fund’s target asset allocation to the results of the following benchmarks: for international stocks of developed markets, the MSCI ACWI ex USA IMI Index through June 2, 2013, and the FTSE Global All Cap ex US Index thereafter;for emerging-market stocks, the MSCI ACWI ex USA IMI Index through June 2, 2013, and the FTSE Global All Cap ex US Index thereafter; for U.S. bonds, the Bloomberg Barclays U.S. Aggregate Float Adjusted Index; for international bonds, the Bloomberg Barclays Global Aggregate ex-USD Float Adjusted RIC Capped Index beginning June 3, 2013; and for U.S. stocks, the MSCI US Broad Market Index through June 2, 2013, and the CRSP US Total Market Index thereafter. International stock benchmark returns are adjusted for withholding taxes.
72
This page intentionally left blank.
73
This page intentionally left blank.
The People Who Govern Your Fund
The trustees of your mutual fund are there to see that the fund is operated and managed in your best interests since, as a shareholder, you are a part owner of the fund. Your fund’s trustees also serve on the board of directors of The Vanguard Group, Inc., which is owned by the Vanguard funds and provides services to them on an at-cost basis.
A majority of Vanguard’s board members are independent, meaning that they have no affiliation with Vanguard or the funds they oversee, apart from the sizable personal investments they have made as private individuals. The independent board members have distinguished backgrounds in business, academia, and public service. Each of the trustees and executive officers oversees 195 Vanguard funds.
The following table provides information for each trustee and executive officer of the fund. The mailing address of the trustees and officers is P.O. Box 876, Valley Forge, PA 19482. More information about the trustees is in the Statement of Additional Information, which can be obtained, without charge, by contacting Vanguard at 800-662-7447, or online at vanguard.com.
Interested Trustee1 F.
William McNabb III
Born 1957. Trustee Since July 2009. Chairman of the Board. Principal Occupation(s) During the Past Five Years and Other Experience: Chairman of the Board of The Vanguard Group, Inc., and of each of the investment companies served by The Vanguard Group, since January 2010; Director of The Vanguard Group since 2008; Chief Executive Officer and President of The Vanguard Group, and of each of the investment companies served by The Vanguard Group, since 2008; Director of Vanguard Marketing Corporation; Managing Director of The Vanguard Group (1995–2008).
Independent Trustees
Emerson U. Fullwood
Born 1948. Trustee Since January 2008. Principal Occupation(s) During the Past Five Years and Other Experience: Executive Chief Staff and Marketing Officer for North America and Corporate Vice President (retired 2008) of Xerox Corporation (document management products and services); Executive in Residence and 2009–2010 Distinguished Minett Professor at the Rochester Institute of Technology; Lead Director of SPX FLOW, Inc. (multi-industry manufacturing); Director of the United Way of Rochester, the University of Rochester Medical Center, Monroe Community College Foundation, North Carolina A&T University, and Roberts Wesleyan College.
Rajiv L. Gupta
Born 1945. Trustee Since December 2001.2 Principal Occupation(s) During the Past Five Years and Other Experience: Chairman and Chief Executive Officer (retired 2009) and President (2006–2008) of Rohm and Haas Co. (chemicals); Director of Arconic Inc. (diversified manufacturer), HP Inc. (printer and personal computer manufacturing), and Delphi Automotive plc (automotive components); Senior Advisor at New Mountain Capital.
Amy Gutmann
Born 1949. Trustee Since June 2006. Principal Occupation(s) During the Past Five Years and Other Experience: President of the University of Pennsylvania; Christopher H. Browne Distinguished Professor of Political Science, School of Arts and Sciences, and Professor of Communication, Annenberg School for Communication, with secondary faculty appointments in the Department of Philosophy, School of Arts and Sciences, and at the Graduate School of Education, University of Pennsylvania; Trustee of the National Constitution Center; Chair of the Presidential Commission for the Study of Bioethical Issues.
JoAnn Heffernan Heisen
Born 1950. Trustee Since July 1998. Principal Occupation(s) During the Past Five Years and Other Experience: Corporate Vice President and Chief Global Diversity Officer (retired 2008) and Member of the Executive Committee (1997–2008) of Johnson & Johnson (pharmaceuticals/medical devices/consumer products); Director of Skytop Lodge Corporation (hotels) and the Robert Wood Johnson Foundation; Member of the Advisory Board of the Institute for Women’s Leadership at Rutgers University.
F. Joseph Loughrey
Born 1949. Trustee Since October 2009. Principal Occupation(s) During the Past Five Years and Other Experience: President and Chief Operating Officer (retired 2009) of Cummins Inc. (industrial machinery); Chairman of the Board of Hillenbrand, Inc. (specialized consumer services), Oxfam America, and the Lumina
Foundation for Education; Director of SKF AB (industrial machinery), Hyster-Yale Materials Handling, Inc. (forklift trucks), and the V Foundation for Cancer Research; Member of the Advisory Council for the College of Arts and Letters and Chair of the Advisory Board to the Kellogg Institute for International Studies, both at the University of Notre Dame.
Mark Loughridge
Born 1953. Trustee Since March 2012. Principal Occupation(s) During the Past Five Years and Other Experience: Senior Vice President and Chief Financial Officer (retired 2013) at IBM (information technology services); Fiduciary Member of IBM’s Retirement Plan Committee (2004–2013); Director of the Dow Chemical Company; Member of the Council on Chicago Booth.
Scott C. Malpass
Born 1962. Trustee Since March 2012. Principal Occupation(s) During the Past Five Years and Other Experience: Chief Investment Officer and Vice President at the University of Notre Dame; Assistant Professor of Finance at the Mendoza College of Business at Notre Dame; Member of the Notre Dame 403(b) Investment Committee, the Board of Advisors for Spruceview Capital Partners, and the Investment Advisory Committee of Major League Baseball; Board Member of TIFF Advisory Services, Inc., and Catholic Investment Services, Inc. (investment advisors); Member of the Board of Superintendence of the Institute for the Works of Religion.
André F. Perold
Born 1952. Trustee Since December 2004. Principal Occupation(s)During the Past Five Years and Other Experience: George Gund Professor of Finance and Banking, Emeritus at the Harvard Business School (retired 2011); Chief Investment Officer and Co-Managing Partner of HighVista Strategies LLC (private investment firm); Overseer of the Museum of Fine Arts Boston.
Peter F. Volanakis
Born 1955. Trustee Since July 2009. Principal Occupation(s) During the Past Five Years and Other Experience: President and Chief Operating Officer (retired 2010) of Corning Incorporated (communications equipment); Chairman of the Board of Trustees of Colby-Sawyer College; Member of the Board of Hypertherm, Inc. (industrial cutting systems, software, and consumables).
Executive Officers
Glenn Booraem
Born 1967. Investment Stewardship Officer Since February 2017. Principal Occupation(s) During the Past Five Years and Other Experience: Principal of TheVanguardGroup, Inc.;Treasurer(2015–2017), Controller (2010–2015), and Assistant Controller (2001–2010) of each of the investment companies served by The Vanguard Group.
Thomas J. Higgins
Born 1957. Chief Financial Officer Since September 2008. Principal Occupation(s) During the Past Five Years and Other Experience: Principal of The Vanguard Group, Inc.; Chief Financial Officer of each of the investment companies served by The Vanguard Group; Treasurer of each of the investment companies served by The Vanguard Group (1998–2008).
Peter Mahoney
Born 1974. Controller Since May 2015. Principal Occupation(s) During the Past Five Years and Other Experience: Principal of The Vanguard Group, Inc.; Controller of each of the investment companies served by The Vanguard Group; Head of International Fund Services at The Vanguard Group (2008–2014).
Anne E. Robinson
Born 1970. Secretary Since September 2016. Principal Occupation(s) During the Past Five Years and Other Experience: Managing Director of The Vanguard Group, Inc.; General Counsel of The Vanguard Group; Secretary of The Vanguard Group and of each of the investment companies served by The Vanguard Group; Director and Senior Vice President of Vanguard Marketing Corporation; Managing Director and General Counsel of Global Cards and Consumer Services at Citigroup (2014–2016); Counsel at American Express (2003–2014).
Michael Rollings
Born 1963. Treasurer Since February 2017. Principal Occupation(s) During the Past Five Years and Other Experience: Managing Director of The Vanguard Group, Inc.; Treasurer of each of the investment companies served by The Vanguard Group; Executive Vice President and Chief Financial Officer of MassMutual Financial Group (2006–2016).
| Vanguard Senior Management Team | |
| Mortimer J. Buckley | James M. Norris |
| John James | Thomas M. Rampulla |
| Martha G. King | Glenn W. Reed |
| John T. Marcante | Karin A. Risi |
| Chris D. McIsaac | |
| Chairman Emeritus and Senior Advisor | |
| John J. Brennan | |
| Chairman, 1996–2009 | |
| Chief Executive Officer and President, 1996–2008 | |
| Founder | |
| John C. Bogle | |
| Chairman and Chief Executive Officer, 1974–1996 | |
1 Mr. McNabbisconsideredan“interestedperson,”asdefinedintheInvestmentCompanyActof1940,becauseheisanofficerofthe Vanguardfunds.
2 December 2002 for Vanguard Equity Income Fund, the Vanguard Municipal Bond Funds, and the Vanguard State Tax-Exempt Funds.
| |
| P.O. Box 2600 | |
| Valley Forge, PA 19482-2600 | |
| Connect with Vanguard® > vanguard.com | |
| Fund Information > 800-662-7447 | |
| Direct Investor Account Services > 800-662-2739 | |
| Institutional Investor Services > 800-523-1036 | |
| Text Telephone for People | |
| Who Are Deaf or Hard of Hearing > 800-749-7273 | |
| This material may be used in conjunction | |
| with the offering of shares of any Vanguard | |
| fund only if preceded or accompanied by | |
| the fund’s current prospectus. | |
| All comparative mutual fund data are from Lipper, a | |
| Thomson Reuters Company, or Morningstar, Inc., unless | |
| otherwise noted. | |
| YoucanobtainafreecopyofVanguard’sproxyvoting | |
| guidelines byvisitingvanguard.com/proxyreporting orby | |
| callingVanguardat800-662-2739. Theguidelinesare | |
| also available from the SEC’s website, sec.gov. In | |
| addition, you may obtain a free report on how your fund | |
| votedtheproxiesforsecuritiesitownedduringthe12 | |
| months ended June 30. To get the report, visit either | |
| vanguard.com/proxyreporting or sec.gov. | |
| You can review and copy information about your fund at | |
| the SEC’s Public Reference Room in Washington, D.C. To | |
| find out more about this public service, call the SEC at | |
| 202-551-8090. Information about your fund is also | |
| available on the SEC’s website, and you can receive | |
| copies of this information, for a fee, by sending a | |
| request in either of two ways: via email addressed to | |
| publicinfo@sec.gov or via regular mail addressed to the | |
| Public Reference Section, Securities and Exchange | |
| Commission, Washington, DC 20549-1520. | |
| © 2017 The Vanguard Group, Inc. | |
| All rights reserved. | |
| Vanguard Marketing Corporation, Distributor. | |
Item 2: Code of Ethics. The Registrant has adopted a code of ethics that applies to the Registrant’s
principal executive officer, principal financial officer, principal accounting officer or controller or
persons performing similar functions. The Code of Ethics was amended during the reporting
period covered by this report to make certain technical, non-material changes.
Item 3: Audit Committee Financial Expert.
Not Applicable.
Item 4: Principal Accountant Fees and Services.
(a) Audit Fees.
Not Applicable.
Item 5: Audit Committee of Listed Registrants.
Not Applicable.
Item 6: Investments.
Not Applicable.
Item 7: Disclosure of Proxy Voting Policies and Procedures for Closed-End Management
Investment Companies.
Not Applicable.
Item 8: Portfolio Managers of Closed-End Management Investment Companies.
Not Applicable.
Item 9: Purchase of Equity Securities by Closed-End Management Investment Company and
Affiliated Purchasers.
Not Applicable.
Item 10: Submission of Matters to a Vote of Security Holders.
Not Applicable.
Item 11: Controls and Procedures.
(a) Disclosure Controls and Procedures. The Principal Executive and Financial
Officers concluded that the Registrant’s Disclosure Controls and Procedures are effective
based on their evaluation of the Disclosure Controls and Procedures as of a date within 90 days of the filing date of this report.
(b) Internal Control Over Financial Reporting. There were no significant changes in Registrant’s Internal Control Over Financial Reporting or in other factors that could significantly affect this control subsequent to the date of the evaluation, including any corrective actions with regard to significant deficiencies and material weaknesses.
Item 12: Exhibits.
(a) Certifications.
Pursuant to the requirements of the Securities Exchange Act of 1934 and the Investment Company Act of 1940, the registrant has duly caused this report to be signed on its behalf by the undersigned, thereunto duly authorized.
| VANGUARD CHESTER FUNDS | |
| BY: | /s/ F. WILLIAM MCNABB III* |
| F. WILLIAM MCNABB III | |
| CHIEF EXECUTIVE OFFICER | |
| Date: May 18, 2017 | |
Pursuant to the requirements of the Securities Exchange Act of 1934 and the Investment Company Act of 1940, this report has been signed below by the following persons on behalf of the registrant and in the capacities and on the dates indicated.
| VANGUARD CHESTER FUNDS | |
| BY: | /s/ F. WILLIAM MCNABB III* |
| F. WILLIAM MCNABB III | |
| CHIEF EXECUTIVE OFFICER | |
| Date: May 18, 2017 | |
| VANGUARD CHESTER FUNDS | |
| BY: | /s/ THOMAS J. HIGGINS* |
| THOMAS J. HIGGINS | |
| CHIEF FINANCIAL OFFICER | |
| Date: May 18, 2017 | |
* By: /s/ Anne E. Robinson
Anne E. Robinson, pursuant to a Power of Attorney filed on October 4, 2016 see file Number
33-32548, Incorporated by Reference.