UNITED STATES
SECURITIES AND EXCHANGE COMMISSION
Washington, D.C. 20549
FORM N-CSR
CERTIFIED SHAREHOLDER REPORT
OF
REGISTERED MANAGEMENT INVESTMENT COMPANIES
| Investment Company Act file number: | 811-04098 | |
Name of Registrant: | Vanguard Chester Funds | |
Address of Registrant: | P.O. Box 2600 | |
| Valley Forge, PA 19482 | ||
Name and address of agent for service: | Heidi Stam, Esquire | |
| P.O. Box 876 | ||
| Valley Forge, PA 19482 | ||
Registrant’s telephone number, including area code: (610) 669-1000 | ||
Date of fiscal year end: September 30 | ||
Date of reporting period: October 1, 2013 – March 31, 2014 | ||
Item 1: Reports to Shareholders | ||
![]()
Semiannual Report | March 31, 2014
Vanguard PRIMECAP Fund

Vanguard’s Principles for Investing Success
We want to give you the best chance of investment success. These principles, grounded in Vanguard’s research and experience, can put you on the right path.
Goals. Create clear, appropriate investment goals.
Balance. Develop a suitable asset allocation using broadly diversified funds. Cost. Minimize cost.
Discipline. Maintain perspective and long-term discipline.
A single theme unites these principles: Focus on the things you can control.
We believe there is no wiser course for any investor.
| Contents | |
| Your Fund’s Total Returns. | 1 |
| Chairman’s Letter. | 2 |
| Advisor’s Report. | 8 |
| Fund Profile. | 11 |
| Performance Summary. | 13 |
| Financial Statements. | 14 |
| About Your Fund’s Expenses. | 25 |
| Glossary. | 27 |
Please note: The opinions expressed in this report are just that—informed opinions. They should not be considered promises or advice.
Also, please keep in mind that the information and opinions cover the period through the date on the front of this report. Of course, the
risks of investing in your fund are spelled out in the prospectus.
See the Glossary for definitions of investment terms used in this report.
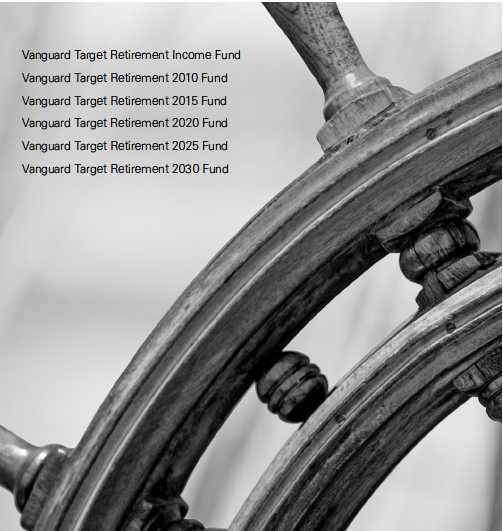
About the cover: The ship’s wheel represents leadership and guidance, essential qualities in navigating difficult seas.
This one is a replica based on an 18th-century British vessel. The HMSVanguard, another ship of that era, served as the
flagship for British Admiral Horatio Nelson when he defeated a French fleet at the Battle of the Nile.
Your Fund’s Total Returns
| Six Months Ended March 31, 2014 | |
| Total | |
| Returns | |
| Vanguard PRIMECAP Fund | |
| Investor Shares | 16.11% |
| Admiral™ Shares | 16.17 |
| S&P 500 Index | 12.51 |
| Multi-Cap Growth Funds Average | 10.66 |
| Multi-Cap Growth Funds Average: Derived from data provided by Lipper, a Thomson Reuters Company. | |
| Admiral Shares carry lower expenses and are available to investors who meet certain account-balance requirements. | |
| Your Fund’s Performance at a Glance | ||||
| September 30, 2013, Through March 31, 2014 | ||||
| Distributions Per Share | ||||
| Starting | Ending | Income | Capital | |
| Share Price | Share Price | Dividends | Gains | |
| Vanguard PRIMECAP Fund | ||||
| Investor Shares | $87.83 | $96.97 | $0.836 | $3.770 |
| Admiral Shares | 91.15 | 100.57 | 0.983 | 3.909 |
1

Chairman’s Letter
Dear Shareholder,
A potent blend of factors benefited Vanguard PRIMECAP Fund over the six months ended March 31: skilled fund management, ample investment opportunities, and accommodative monetary policy. The fund produced a return above 16%, easily surpassing the returns of its comparative standards, the Standard & Poor’s 500 Index (+12.51%) and the average return of peer funds (+10.66%).
The PRIMECAP Fund earned its benchmark-beating returns in the most familiar places—information technology and health care stocks. PRIMECAP Management Company, the fund’s advisor, has traditionally focused on these areas and established significant holdings in them. Exposure to each during the period was over 30%, making them by far the fund’s largest sectors at about double their weighting in the benchmark index.
Technology and health care stocks were also the fund’s top contributors for the half year. Industrials, the only other sector to which the fund has significant exposure, also did well. In fact, none of the eight sectors represented in the portfolio produced a decline for the fund.
Despite recent choppiness, U.S. stocks were productive
The broad U.S. stock market recorded a gain of about 12% for the six months ended March 31, although the path became increasingly rocky over the
2
period’s second half. Corporate earnings, for the most part, continued to rise as the U.S. economy showed modest growth.
While the Federal Reserve’s stimulative bond-buying program has helped support the market for several years, since January the Fed has been making monthly cuts in its purchases, creating some apprehension among investors. Slow economic growth in China and the conflict in Ukraine have also caused market turbulence.
International stocks returned about 5%. The developed markets of Europe, where there’s been some improvement in the economy, posted a strong advance, while the developed markets of the Pacific region and emerging markets had weaker results.
Bonds reclaimed some lost ground following a difficult stretch
Over the six months, the broad U.S. taxable bond market returned 1.70%, a welcome result in view of the market’s struggles for much of calendar-year 2013. The yield of the 10-year Treasury note finished the half year at 2.72%, up from 2.63% at September’s end, but down from nearly 3% on December 31. (Bond prices and yields move in opposite directions.)
Many bond investors have been focusing on the possibility of interest rates moving higher and the negative effect that would have on bond prices. However, there’s a flip side to rising rates. As noted recently by the new head of our Fixed Income Group, Greg Davis, long-term investors
| Market Barometer | |||
| Total Returns | |||
| Periods Ended March 31, 2014 | |||
| Six | One | Five Years | |
| Months | Year | (Annualized) | |
| Stocks | |||
| Russell 1000 Index (Large-caps) | 12.48% | 22.41% | 21.73% |
| Russell 2000 Index (Small-caps) | 9.94 | 24.90 | 24.31 |
| Russell 3000 Index (Broad U.S. market) | 12.28 | 22.61 | 21.93 |
| FTSE All-World ex US Index (International) | 5.25 | 12.50 | 15.93 |
| Bonds | |||
| Barclays U.S. Aggregate Bond Index (Broad taxable market) | 1.70% | -0.10% | 4.80% |
| Barclays Municipal Bond Index (Broad tax-exempt market) | 3.65 | 0.39 | 5.71 |
| Citigroup Three-Month U.S. Treasury Bill Index | 0.00 | 0.05 | 0.08 |
| CPI | |||
| Consumer Price Index | 0.92% | 1.51% | 2.13% |
3
can benefit over time because “you’re going to be reinvesting those coupon payments and principal payments at higher rates.”
Municipal bonds returned 3.65% for the six months, another major improvement over calendar-year 2013, as investors waded back into the muni market; many had fled last year when challenges surfaced for some issuers. For money market and savings accounts, returns remained meager because of the Fed’s target of 0%–0.25% for short-term interest rates.
International bond markets (as measured by the Barclays Global Aggregate Index ex USD) returned 2.05%.
The advisor’s patience was rewarded in technology and health care
In its nearly 30 years of existence, the PRIMECAP Fund has carved out an enviable record, establishing an average annual return a few percentage points higher than that of both its benchmark and the average return of peer funds. (You can see the fund’s historical returns on the Performance Summary page.)
Paradoxically, a byproduct of this long-term outperformance has been short-term underperformance on occasion. The PRIMECAP Fund has traditionally maintained holdings very different from those in its benchmark. This approach creates the opportunity to outperform, but also the risk of lagging the index in any given period.
| Expense Ratios | |||
| Your Fund Compared With Its Peer Group | |||
| Investor | Admiral | Peer Group | |
| Shares | Shares | Average | |
| PRIMECAP Fund | 0.45% | 0.36% | 1.34% |
The fund expense ratios shown are from the prospectus dated January 27, 2014, and represent estimated costs for the current fiscal year. For
the six months ended March 31, 2014, the fund’s annualized expense ratios were 0.44% for Investor Shares and 0.35% for Admiral Shares.
The peer-group expense ratio is derived from data provided by Lipper, a Thomson Reuters Company, and captures information through
year-end 2013.
Peer group: Multi-Cap Growth Funds.
4
Patience is crucial to reaping the potential benefits of PRIMECAP Management’s investment strategy. The advisor, after completing exhaustive and meticulous company research, displays faith in its decisions as part of a long-term investment strategy that sometimes won’t deliver the desired results for months or even years. In each fiscal year from 2009 through 2012, the fund trailed one or both of its comparative standards as the advisor’s sector exposure and stock decisions didn’t align with the market’s movements. But the advisor never wavered from its intended course, and the results over the past 18 months have been impressive.
As I mentioned earlier, the information technology and health care sectors supplied much of the PRIMECAP Fund’s return. Outperformance was most evident in the fund’s technology stocks, which surged more than 20%, or about 5 percentage points more than those in the benchmark. Most of the strength came from the software, semiconductor, and internet areas, with the hardware industry helping out.
A common theme was PRIMECAP Management’s commitment to technology companies that have emerged in fine shape after enduring difficult stretches. Central to that conviction is the advisor’s view that certain technology areas will reap ongoing benefit from internet and smartphone growth across the globe.
Within the health care sector, the advisor had various hits and misses, but its heavy allocation to a few top firms in the bio-technology and pharmaceutical industries boosted results. The advisor’s long-term approach is particularly evident in health care, a sector it believes will grow at a faster pace than the overall economy.
PRIMECAP Management is focused on identifying companies with promising medicines at early stages in the pipeline and steadily adjusting its investments in them as appropriate. The aging segment of the U.S. population, which requires much more health care than the rest of the population, and the Food and Drug Administration’s more favorable approach to approval of new medicines have worked in the fund’s favor.
While the PRIMECAP Fund leans heavily toward health care and technology, during the half-year about 15% of its assets on average were devoted to the industrial sector. The size of this allocation, combined with the sector’s 20% return for the fund, helped to lift overall performance relative to the benchmark index. Most of the gain was due to a 56% jump for the portfolio’s airline stocks. Consolidation in the airline industry has led to a favorable pricing environment and improved profitability.
For more about the advisor’s strategy and the fund’s positioning during the six months, please see the Advisor’s Report that follows this letter.
5
Divining the future is tricky, but preparing for it is prudent
Predictions are often made but rarely come true. In an interview with our newsletter In The Vanguard, University of Pennsylvania professor Philip Tetlock noted: “As a whole, experts [are] slightly more accurate than the proverbial dart-throwing chimpanzee.”
| The appeal of low-cost investing is growing |
| Minimizing investment costs is a critical part of every investor’s toolkit. Why? Because every |
| dollar paid for fund management expenses is simply a dollar less that can work on your behalf. |
| Put another way, the lower your mutual fund’s costs, the greater your share of the fund’s return. |
| Not surprisingly, research indicates that lower-cost investments have tended to outperform |
| their higher-cost counterparts. |
| Investors are catching on to the value of lower-cost mutual funds. Funds with lower expense |
| ratios dominated in attracting investment dollars over the decade ended December 31, 2012, |
| according to a Vanguard research paper titled Costs Matter: Are Fund Investors Voting With |
| Their Feet? (You can read the paper at vanguard.com/matter.) And, as the chart below shows, |
| Vanguard’s leadership in keeping down costs for investors seems to have encouraged the |
| industry to reduce its average costs—at least over the past decade. |
| Even so, Vanguard’s average expenses continue to be less than one-fifth the industry average: |
| 0.19% versus 1.08% (as of December 31, 2013). That cost difference remains a powerful tool |
| in the hands of Vanguard clients. |
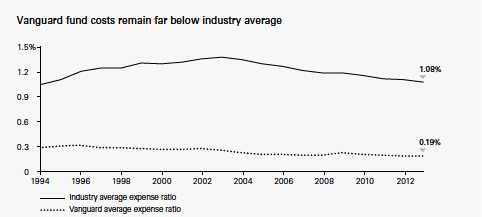
| Sources: Vanguard and Lipper, a Thomson Reuters Company. |
6
Dr. Tetlock’s extensive research on the accuracy of predictions found that it’s best to think in terms of probabilities and to avoid bold, specific declarations about what the future holds. At Vanguard, we agree that forecasting the economy and capital markets should be leavened with modesty. Joe Davis, our chief economist, is fond of saying that we “treat the future with the humility it deserves.”
That’s why our economists don’t make the pinpoint projections that you’ll see elsewhere. Instead, using sophisticated statistical models, we provide a range and probability of potential outcomes—for example, the return of U.S. stocks. And we explain our rationale for such outcomes, allowing you to make better-informed decisions about risk and return.
In January, as they do each year, our economists issued Vanguard’s Economic and Investment Outlook. They also update their perspectives periodically and address significant developments, such as changes in Federal Reserve policy. (You can read the Outlook paper at vanguard.com/research.)
Our forecasts acknowledge that no one can envision every scenario. And that underlines one of Vanguard’s core investment principles: Develop a suitable asset allocation using broadly diversified funds. Having a balanced portfolio can help you get through unforeseen events and achieve your goals—even without a crystal ball.
As always, thank you for entrusting your assets to Vanguard.
Sincerely,

F. William McNabb III
Chairman and Chief Executive Officer
April 10, 2014
7
Advisor’s Report
For the six months ended March 31, 2014, Vanguard PRIMECAP Fund returned 16.11% for Investor Shares and 16.17% for Admiral Shares, exceeding both the 12.51% return of its benchmark, the unmanaged S&P 500 Index, and the 10.66% average return of its multi-capitalization growth fund competitors. Favorable stock selection in the information technology and industrial sectors was the main reason for the positive performance.
Investment environment
Over the past six months, U.S. equities continued to appreciate, with the S&P 500 Index reaching an all-time high during the first calendar quarter of 2014. However, almost all of the positive returns during the period were generated during the fourth calendar quarter of 2013. Trends during the fourth quarter were generally consistent with those witnessed earlier in the calendar year, as cyclical sectors such as consumer discretionary and industrials continued to lead the market. “Momentum stocks,” particularly in the information technology sector, outperformed during this period and into early 2014.
More recently, U.S. equities have been led by defensive sectors such as utilities, the best-performing sector over the first three months of 2014. Stocks with low price/earnings multiples and high dividend yields, including a number of the fund’s holdings in the health care and information technology sectors, generally outperformed the broader market, while many momentum stocks experienced sudden and severe price declines.
During the period, the Federal Reserve continued to tighten U.S. monetary policy by “tapering” the amount of its monthly bond purchases by $10 billion per month. On March 19, Janet Yellen, the new Federal Reserve chair, stated that the Fed would likely continue the tapering so long as economic data continued to improve, and also that the Fed was likely to keep its federal funds rate target at the current level (between 0% and 0.25%) for a considerable time after the asset purchase program ends. Long-term interest rates, which had risen in calendar 2013, dropped over the past three months, with the 10-year Treasury note yielding 2.72% on March 31, down from 2.97% on December 31.
On the geopolitical front, Russia invaded Ukraine and annexed the strategically important province of Crimea. As this letter was being written, tensions remained high, stirring investor concerns.
Outlook for U.S. equities
Looking ahead, we are cautious about the prospects for U.S. equities, though we continue to believe they represent a more attractive investment than bonds at current prices. As of late March, the S&P 500 Index in aggregate was trading at approximately 17 times calendar-2013 estimated earnings per share of $110, a reasonable valuation by historical standards. However, we are skeptical that the S&P 500 can sustain its recent growth rate in earnings per share.
8
Over the past two years, revenues per share for the S&P 500 grew at a 2.2% compounded average rate, while earnings per share grew at 6.2%. Looking at the next two years, consensus S&P 500 estimates assume that growth in revenue per share will accelerate to 3.6% annually while growth in earnings per share rises to 9.9% per year. We are concerned that these estimates may prove overly optimistic and may need to be revised downward.
Consumer debt levels in the United States remain high and wage growth has been tepid, suggesting that the scope for growth based on additional consumer credit expansion is limited. In addition, we are concerned by the U.S. government’s persistent fiscal deficits and high debt levels relative to GDP (gross domestic product), particularly in light of the aging population.
Portfolio update and outlook
The portfolio remains significantly overweighted in health care and information technology stocks. As of March 31, these two sectors accounted for nearly 64% of the fund’s assets (versus 32% for the S&P 500), including nine of the ten largest holdings in the fund.
The fund’s outperformance over the past six months was driven by favorable stock selection in the information technology and industrial sectors, overweight positions in the health care and information technology sectors, and underweight positions in the consumer staples, consumer discretionary, energy, and telecommunication services sectors. In the information technology
area, the fund’s substantial holdings in “old technology” companies such as Adobe Systems (+27%), Hewlett-Packard (+56%), and Microsoft (+25%) contributed to the index-leading result. In the industrial sector, the fund’s airline holdings, including Southwest Airlines (+63%) and Alaska Air (+50%), significantly outperformed the broader market.
We believe that many of our holdings, particularly in the information technology and health care sectors, are attractively valued. A significant number of the fund’s holdings in these sectors are characterized by high dividend yields, strong balance sheets, and low price/earnings multiples.
Information technology
In the information technology area, exploitation of the internet continues to proliferate through the adoption of smartphones, internet-connected machines, and other innovations. We believe we have positioned the fund to benefit from the ongoing growth of the internet by investing in companies that provide enabling technologies as well as companies that provide internet-based services directly to end users. We also remain optimistic that advances in health care technologies will continue, as we discuss below.
Health care
The fund’s substantial investments in health care reflect our belief that innovation in this area will continue, as well as our expectation that the consumption of health care services will grow more rapidly than
9
the overall economy for the foreseeable future. In terms of innovation, the precipitous decline in the cost of genetic sequencing is allowing researchers to identify links to diseases and rapidly develop therapies that improve the standard of care. Increasingly, drugs developed on the basis of a better understanding of the genetic causes of a disease are providing higher cure rates with fewer side effects than conventional treatments.
Furthermore, global demographic trends should support growth in demand for health care given the aging of populations in most developed countries as well as in China.
As the proportion of elderly people in the population increases, health care spending grows, because older people consume substantially more health care resources than the general population. We are also optimistic that the expected rise in living
standards in many developing countries will open up new markets for health care products and services over time.
Conclusion
We remain committed to our investment philosophy, which is based on individual stock selection. Although this “bottom-up” approach can lead to periods of under-performance when the stocks in our portfolio fall out of favor, we believe it can generate superior results for investors over the long term.
PRIMECAP Management Company
April 8, 2014
10
PRIMECAP Fund
Fund Profile
As of March 31, 2014
| Share-Class Characteristics | ||
| Investor | Admiral | |
| Shares | Shares | |
| Ticker Symbol | VPMCX | VPMAX |
| Expense Ratio1 | 0.45% | 0.36% |
| 30-Day SEC Yield | 1.08% | 1.17% |
| Portfolio Characteristics | |||
| DJ | |||
| U.S. | |||
| Total | |||
| Market | |||
| S&P 500 | FA | ||
| Fund | Index | Index | |
| Number of Stocks | 123 | 500 | 3,674 |
| Median Market Cap | $62.9B | $66.3B | $43.7B |
| Price/Earnings Ratio | 20.7x | 18.6x | 20.1x |
| Price/Book Ratio | 3.5x | 2.6x | 2.6x |
| Return on Equity | 20.1% | 18.6% | 17.2% |
| Earnings Growth | |||
| Rate | 15.7% | 12.1% | 12.4% |
| Dividend Yield | 1.6% | 2.0% | 1.9% |
| Foreign Holdings | 10.5% | 0.0% | 0.0% |
| Turnover Rate | |||
| (Annualized) | 17% | — | — |
| Short-Term Reserves | 4.1% | — | — |
| Volatility Measures | ||
| DJ | ||
| U.S. Total | ||
| S&P 500 | Market | |
| Index | FA Index | |
| R-Squared | 0.93 | 0.94 |
| Beta | 1.02 | 0.98 |
| These measures show the degree and timing of the fund’s fluctuations compared with the indexes over 36 months. | ||
| Ten Largest Holdings (% of total net assets) | ||
| Biogen Idec Inc. | Biotechnology | 7.4% |
| Amgen Inc. | Biotechnology | 4.7 |
| Roche Holding AG | Pharmaceuticals | 4.3 |
| Eli Lilly & Co. | Pharmaceuticals | 4.1 |
| Texas Instruments Inc. | Semiconductors | 3.9 |
| Microsoft Corp. | Systems Software | 3.9 |
| FedEx Corp. | Air Freight & | |
| Logistics | 3.8 | |
| Google Inc. | Internet Software & | |
| Services | 3.8 | |
| Adobe Systems Inc. | Application Software | 3.7 |
| Novartis AG | Pharmaceuticals | 2.9 |
| Top Ten | 42.5% | |
| The holdings listed exclude any temporary cash investments and equity index products. | ||
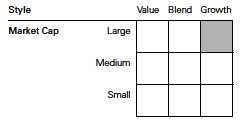
Investment Focus
1 The expense ratios shown are from the prospectus dated January 27, 2014, and represent estimated costs for the current fiscal year. For the six
months ended March 31, 2014, the annualized expense ratios were 0.44% for Investor Shares and 0.35% for Admiral Shares.
11
PRIMECAP Fund
| Sector Diversification (% of equity exposure) | |||
| DJ | |||
| U.S. Total | |||
| S&P 500 | Market | ||
| Fund | Index | FA Index | |
| Consumer | |||
| Discretionary | 7.8% | 12.1% | 12.8% |
| Consumer Staples | 0.7 | 9.7 | 8.4 |
| Energy | 4.8 | 10.1 | 9.4 |
| Financials | 5.4 | 16.4 | 17.6 |
| Health Care | 31.9 | 13.4 | 13.0 |
| Industrials | 14.7 | 10.7 | 11.5 |
| Information | |||
| Technology | 31.9 | 18.6 | 18.1 |
| Materials | 2.8 | 3.5 | 3.9 |
| Telecommunication | |||
| Services | 0.0 | 2.4 | 2.2 |
| Utilities | 0.0 | 3.1 | 3.1 |
12
PRIMECAP Fund
Performance Summary
All of the returns in this report represent past performance, which is not a guarantee of future results that may be achieved by the fund. (Current performance may be lower or higher than the performance data cited. For performance data current to the most recent month-end, visit our website at vanguard.com/performance.) Note, too, that both investment returns and principal value can fluctuate widely, so an investor’s shares, when sold, could be worth more or less than their original cost. The returns shown do not reflect taxes that a shareholder would pay on fund distributions or on the sale of fund shares.
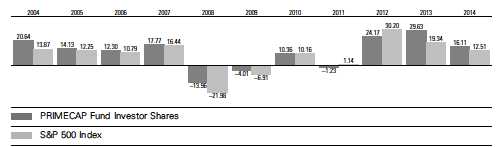
Fiscal-Year Total Returns (%): September 30, 2003, Through March 31, 2014
| Average Annual Total Returns: Periods Ended March 31, 2014 | ||||
| Inception | One | Five | Ten | |
| Date | Year | Years | Years | |
| Investor Shares | 11/1/1984 | 28.55% | 21.66% | 10.04% |
| Admiral Shares | 11/12/2001 | 28.66 | 21.77 | 10.17 |
See Financial Highlights for dividend and capital gains information.
13
PRIMECAP Fund
Financial Statements (unaudited)
Statement of Net Assets
As of March 31, 2014
The fund reports a complete list of its holdings in regulatory filings four times in each fiscal year, at the quarter-ends. For the second and fourth fiscal quarters, the lists appear in the fund’s semiannual and annual reports to shareholders. For the first and third fiscal quarters, the fund files the lists with the Securities and Exchange Commission on Form N-Q. Shareholders can look up the fund’s Forms N-Q on the SEC’s website at sec.gov. Forms N-Q may also be reviewed and copied at the SEC’s Public Reference Room (see the back cover of this report for further information).
| Market | |||
| Value | |||
| Shares | ($000) | ||
| Common Stocks (95.9%) | |||
| Consumer Discretionary (7.5%) | |||
| * | DIRECTV | 8,053,962 | 615,484 |
| L Brands Inc. | 9,471,722 | 537,710 | |
| Walt Disney Co. | 5,550,000 | 444,388 | |
| TJX Cos. Inc. | 6,875,000 | 416,969 | |
| Ross Stores Inc. | 3,712,600 | 265,637 | |
| Carnival Corp. | 5,818,100 | 220,273 | |
| ^ | Sony Corp. ADR | 10,050,000 | 192,156 |
| * | Bed Bath & Beyond Inc. | 2,300,975 | 158,307 |
| Whirlpool Corp. | 835,800 | 124,919 | |
| Time Warner Cable Inc. | 293,304 | 40,235 | |
| VF Corp. | 432,400 | 26,757 | |
| * | Amazon.com Inc. | 76,000 | 25,575 |
| Las Vegas Sands Corp. | 300,000 | 24,234 | |
| Macy’s Inc. | 385,800 | 22,874 | |
| 3,115,518 | |||
| Consumer Staples (0.7%) | |||
| CVS Caremark Corp. | 1,794,065 | 134,304 | |
| Costco Wholesale Corp. | 915,000 | 102,187 | |
| Kellogg Co. | 700,000 | 43,897 | |
| PepsiCo Inc. | 100,000 | 8,350 | |
| 288,738 | |||
| Energy (4.6%) | |||
| ^ | Transocean Ltd. | 14,152,679 | 585,072 |
| EOG Resources Inc. | 1,865,000 | 365,857 | |
| Schlumberger Ltd. | 3,632,200 | 354,140 | |
| Noble Energy Inc. | 4,840,176 | 343,846 | |
| Exxon Mobil Corp. | 615,000 | 60,073 | |
| * | Southwestern Energy Co. | 933,779 | 42,963 |
| * | Cameron | ||
| International Corp. | 687,500 | 42,467 | |
| Encana Corp. | 1,979,000 | 42,311 | |
| National Oilwell Varco Inc. | 310,000 | 24,140 | |
| ^ | Petroleo Brasileiro | ||
| SA ADR Type A | 600,000 | 8,322 | |
| Cabot Oil & Gas Corp. | 240,000 | 8,131 | |
| Petroleo Brasileiro | |||
| SA ADR | 400,000 | 5,260 | |
| Noble Corp. plc | 100,000 | 3,274 | |
| Range Resources Corp. | 12,500 | 1,037 | |
| 1,886,893 | |||
| Financials (5.2%) | |||
| Charles Schwab Corp. | 26,723,992 | 730,367 | |
| Marsh & McLennan | |||
| Cos. Inc. | 13,282,000 | 654,803 | |
| Wells Fargo & Co. | 8,040,900 | 399,954 | |
| Chubb Corp. | 2,730,500 | 243,834 | |
| CME Group Inc. | 716,107 | 52,999 | |
| American Express Co. | 482,100 | 43,403 | |
| Discover Financial Services 175,000 | 10,183 | ||
| US Bancorp | 110,000 | 4,715 | |
| 2,140,258 | |||
| Health Care (30.5%) | |||
| * | Biogen Idec Inc. | 10,073,695 | 3,081,241 |
| Amgen Inc. | 15,947,300 | 1,966,940 | |
| Roche Holding AG | 5,872,200 | 1,766,145 | |
| Eli Lilly & Co. | 29,092,000 | 1,712,355 | |
| Novartis AG ADR | 13,898,565 | 1,181,656 | |
| Medtronic Inc. | 16,323,952 | 1,004,576 | |
| Johnson & Johnson | 6,289,500 | 617,818 | |
| * | Boston Scientific Corp. | 28,342,560 | 383,191 |
| GlaxoSmithKline plc ADR | 4,824,100 | 257,752 | |
| Abbott Laboratories | 5,932,900 | 228,476 | |
| Thermo Fisher | |||
| Scientific Inc. | 1,776,600 | 213,618 | |
| AbbVie Inc. | 2,709,800 | 139,284 | |
| Sanofi ADR | 1,235,000 | 64,566 | |
| Stryker Corp. | 259,000 | 21,101 | |
| Zimmer Holdings Inc. | 197,000 | 18,632 | |
| 12,657,351 | |||
| Industrials (14.1%) | |||
| FedEx Corp. | 11,969,012 | 1,586,612 | |
| Southwest Airlines Co. | 34,559,300 | 815,945 | |
| Honeywell | |||
| International Inc. | 5,992,347 | 555,850 | |
14
PRIMECAP Fund
| Market | |||
| Value | |||
| Shares | ($000) | ||
| Caterpillar Inc. | 4,050,000 | 402,448 | |
| Union Pacific Corp. | 1,828,700 | 343,174 | |
| Airbus Group NV | 4,373,700 | 313,250 | |
| Alaska Air Group Inc. | 3,103,900 | 289,625 | |
| Boeing Co. | 1,744,260 | 218,887 | |
| United Parcel Service Inc. | |||
| Class B | 2,181,070 | 212,393 | |
| CH Robinson | |||
| Worldwide Inc. | 4,049,000 | 212,127 | |
| Deere & Co. | 1,961,500 | 178,104 | |
| Delta Air Lines Inc. | 3,778,000 | 130,908 | |
| United Technologies Corp. 1,007,000 | 117,658 | ||
| * | United Continental | ||
| Holdings Inc. | 2,597,700 | 115,935 | |
| Pentair Ltd. | 1,300,000 | 103,142 | |
| Rockwell Automation Inc. | 775,000 | 96,526 | |
| Canadian Pacific | |||
| Railway Ltd. | 447,800 | 67,363 | |
| Expeditors International of | |||
| Washington Inc. | 890,742 | 35,300 | |
| Pall Corp. | 205,000 | 18,341 | |
| CSX Corp. | 510,000 | 14,775 | |
| Donaldson Co. Inc. | 150,000 | 6,360 | |
| Norfolk Southern Corp. | 46,100 | 4,480 | |
| Safran SA | 42,000 | 2,910 | |
| * | American Airlines | ||
| Group Inc. | 60,000 | 2,196 | |
| Cummins Inc. | 12,150 | 1,810 | |
| Republic Services Inc. | |||
| Class A | 17,000 | 581 | |
| 5,846,700 | |||
| Information Technology (30.6%) | |||
| Texas Instruments Inc. | 34,424,093 | 1,623,096 | |
| Microsoft Corp. | 39,003,677 | 1,598,761 | |
| * | Google Inc. Class A | 1,417,843 | 1,580,200 |
| * | Adobe Systems Inc. | 23,310,070 | 1,532,404 |
| QUALCOMM Inc. | 9,609,350 | 757,793 | |
| Hewlett-Packard Co. | 20,483,690 | 662,852 | |
| Intuit Inc. | 7,536,800 | 585,835 | |
| * | Micron Technology Inc. | 20,120,000 | 476,039 |
| Intel Corp. | 17,810,500 | 459,689 | |
| EMC Corp. | 16,647,800 | 456,316 | |
| Oracle Corp. | 9,995,000 | 408,895 | |
| KLA-Tencor Corp. | 4,528,700 | 313,114 | |
| Visa Inc. Class A | 1,370,138 | 295,758 | |
| Cisco Systems Inc. | 11,427,950 | 256,100 | |
| NVIDIA Corp. | 13,870,000 | 248,412 | |
| Accenture plc Class A | 2,386,100 | 190,220 | |
| 1 | Plantronics Inc. | 3,701,500 | 164,532 |
| NetApp Inc. | 4,290,000 | 158,301 | |
| Symantec Corp. | 7,316,900 | 146,119 | |
| Telefonaktiebolaget | |||
| LM Ericsson ADR | 9,308,914 | 124,088 | |
| Analog Devices Inc. | 2,235,000 | 118,768 | |
| Corning Inc. | 5,243,200 | 109,163 | |
| *,^ | BlackBerry Ltd. | 10,438,600 | 84,344 |
| Activision Blizzard Inc. | 3,945,000 | 80,636 | |
| Apple Inc. | 78,000 | 41,866 | |
| SanDisk Corp. | 500,000 | 40,595 | |
| * | Entegris Inc. | 2,583,472 | 31,286 |
| MasterCard Inc. Class A | 412,500 | 30,814 | |
| Applied Materials Inc. | 1,220,000 | 24,912 | |
| * | Rambus Inc. | 2,000,000 | 21,500 |
| Altera Corp. | 450,000 | 16,308 | |
| * | eBay Inc. | 293,000 | 16,185 |
| ASML Holding NV | 148,175 | 13,834 | |
| * | F5 Networks Inc. | 97,400 | 10,386 |
| * | Salesforce.com Inc. | 154,000 | 8,792 |
| Motorola Solutions Inc. | 30,000 | 1,929 | |
| 12,689,842 | |||
| Materials (2.7%) | |||
| Monsanto Co. | 6,663,460 | 758,102 | |
| Potash Corp. of | |||
| Saskatchewan Inc. | 5,919,200 | 214,393 | |
| Praxair Inc. | 925,000 | 121,147 | |
| EI du Pont de Nemours | |||
| & Co. | 150,000 | 10,065 | |
| Celanese Corp. Class A | 60,000 | 3,331 | |
| LyondellBasell Industries | |||
| NV Class A | 18,700 | 1,663 | |
| 1,108,701 | |||
| Total Common Stocks | |||
| (Cost $18,616,444) | 39,734,001 | ||
| Temporary Cash Investment (4.2%) | |||
| Money Market Fund (4.2%) | |||
| 2,3 | Vanguard Market Liquidity | ||
| Fund, 0.122% | |||
| (Cost $1,750,249) 1,750,249,434 | 1,750,249 | ||
| Total Investments (100.1%) | |||
| (Cost $20,366,693) | 41,484,250 | ||
| Other Assets and Liabilities (-0.1%) | |||
| Other Assets | 173,537 | ||
| Liabilities3 | (222,163) | ||
| (48,626) | |||
| Net Assets (100%) | 41,435,624 | ||
15
PRIMECAP Fund
| At March 31, 2014, net assets consisted of: | |
| Amount | |
| ($000) | |
| Paid-in Capital | 18,548,019 |
| Undistributed Net Investment Income | 123,315 |
| Accumulated Net Realized Gains | 1,645,594 |
| Unrealized Appreciation (Depreciation) | |
| Investment Securities | 21,117,557 |
| Foreign Currencies | 1,139 |
| Net Assets | 41,435,624 |
| Investor Shares—Net Assets | |
| Applicable to 143,392,413 outstanding | |
| $.001 par value shares of beneficial | |
| interest (unlimited authorization) | 13,905,072 |
| Net Asset Value Per Share— | |
| Investor Shares | $96.97 |
| Admiral Shares—Net Assets | |
| Applicable to 273,742,357 outstanding | |
| $.001 par value shares of beneficial | |
| interest (unlimited authorization) | 27,530,552 |
| Net Asset Value Per Share— | |
| Admiral Shares | $100.57 |
See Note A in Notes to Financial Statements.
* Non-income-producing security.
^ Includes partial security positions on loan to broker-dealers. The total value of securities on loan is $59,645,000.
1 Considered an affiliated company of the fund as the fund owns more than 5% of the outstanding voting securities of such company.
2 Affiliated money market fund available only to Vanguard funds and certain trusts and accounts managed by Vanguard. Rate shown is
the 7-day yield.
3 Includes $63,154,000 of collateral received for securities on loan.
ADR—American Depositary Receipt.
See accompanying Notes, which are an integral part of the Financial Statements.
16
PRIMECAP Fund
Statement of Operations
| Six Months Ended | |
| March 31, 2014 | |
| ($000) | |
| Investment Income | |
| Income | |
| Dividends1,2 | 352,014 |
| Interest2 | 1,041 |
| Securities Lending | 481 |
| Total Income | 353,536 |
| Expenses | |
| Investment Advisory Fees—Note B | 39,735 |
| The Vanguard Group—Note C | |
| Management and Administrative—Investor Shares | 14,957 |
| Management and Administrative—Admiral Shares | 17,165 |
| Marketing and Distribution—Investor Shares | 1,067 |
| Marketing and Distribution—Admiral Shares | 1,725 |
| Custodian Fees | 372 |
| Shareholders’ Reports—Investor Shares | 40 |
| Shareholders’ Reports—Admiral Shares | 50 |
| Trustees’ Fees and Expenses | 30 |
| Total Expenses | 75,141 |
| Net Investment Income | 278,395 |
| Realized Net Gain (Loss) | |
| Investment Securities Sold2 | 1,782,723 |
| Foreign Currencies | 192 |
| Realized Net Gain (Loss) | 1,782,915 |
| Change in Unrealized Appreciation (Depreciation) | |
| Investment Securities | 3,739,276 |
| Foreign Currencies | 438 |
| Change in Unrealized Appreciation (Depreciation) | 3,739,714 |
| Net Increase (Decrease) in Net Assets Resulting from Operations | 5,801,024 |
| 1 Dividends are net of foreign withholding taxes of $14,510,000. | |
| 2 Dividend income, interest income, and realized net gain (loss) from affiliated companies of the fund were $740,000, $1,041,000, and $0, respectively. | |
See accompanying Notes, which are an integral part of the Financial Statements.
17
PRIMECAP Fund
Statement of Changes in Net Assets
| Six Months Ended | Year Ended | |
| March 31, | September 30, | |
| 2014 | 2013 | |
| ($000) | ($000) | |
| Increase (Decrease) in Net Assets | ||
| Operations | ||
| Net Investment Income | 278,395 | 448,283 |
| Realized Net Gain (Loss) | 1,782,915 | 1,544,820 |
| Change in Unrealized Appreciation (Depreciation) | 3,739,714 | 6,421,396 |
| Net Increase (Decrease) in Net Assets Resulting from Operations | 5,801,024 | 8,414,499 |
| Distributions | ||
| Net Investment Income | ||
| Investor Shares | (118,024) | (181,566) |
| Admiral Shares | (253,860) | (236,821) |
| Realized Capital Gain1 | ||
| Investor Shares | (532,238) | (135,657) |
| Admiral Shares | (1,009,500) | (164,172) |
| Total Distributions | (1,913,622) | (718,216) |
| Capital Share Transactions | ||
| Investor Shares | (519,751) | (3,902,726) |
| Admiral Shares | 1,879,892 | 2,784,511 |
| Net Increase (Decrease) from Capital Share Transactions | 1,360,141 | (1,118,215) |
| Total Increase (Decrease) | 5,247,543 | 6,578,068 |
| Net Assets | ||
| Beginning of Period | 36,188,081 | 29,610,013 |
| End of Period2 | 41,435,624 | 36,188,081 |
| 1 Includes fiscal 2014 and 2013 short-term gain distributions totaling $8,179,000 and $0, respectively. Short-term gain distributions are | ||
| treated as ordinary income dividends for tax purposes. | ||
| 2 Net Assets—End of Period includes undistributed net investment income of $123,315,000 and $216,612,000. | ||
See accompanying Notes, which are an integral part of the Financial Statements.
18
PRIMECAP Fund
Financial Highlights
| Investor Shares | |||||||
| Six Months | |||||||
| Ended | |||||||
| For a Share Outstanding | March 31, | Year Ended September 30, | |||||
| Throughout Each Period | 2014 | 2013 | 2012 | 2011 | 2010 | 2009 | |
| Net Asset Value, Beginning of Period | $87.83 | $69.39 | $58.46 | $60.36 | $55.10 | $62.76 | |
| Investment Operations | |||||||
| Net Investment Income | .635 | 1.033 | . 866 | .651 | .6311 | .500 | |
| Net Realized and Unrealized Gain (Loss) | |||||||
| on Investments | 13.111 | 19.093 | 12.857 | (1.266) | 5.076 | (3.990) | |
| Total from Investment Operations | 13.746 | 20.126 | 13.723 | (.615) | 5.707 | (3.490) | |
| Distributions | |||||||
| Dividends from Net Investment Income | (. 836) | (. 965) | (. 689) | (. 614) | (. 447) | (. 508) | |
| Distributions from Realized Capital Gains | (3.770) | (.721) | (2.104) | (.671) | — | (3.662) | |
| Total Distributions | (4.606) | (1.686) | (2.793) | (1.285) | (.447) | (4.170) | |
| Net Asset Value, End of Period | $96.97 | $87.83 | $69.39 | $58.46 | $60.36 | $55.10 | |
| Total Return2 | 16.11% | 29.63% | 24.17% | -1.23% | 10.36% | -4.01% | |
| Ratios/Supplemental Data | |||||||
| Net Assets, End of Period (Millions) | $13,905 | $13,059 | $13,632 | $14,359 | $18,028 | $17,795 | |
| Ratio of Total Expenses to | |||||||
| Average Net Assets | 0.44% | 0.45% | 0.45% | 0.45% | 0.45% | 0.49% | |
| Ratio of Net Investment Income to | |||||||
| Average Net Assets | 1.37% | 1.32% | 1.30% | 0.95% | 1.05%1 | 1.02% | |
| Portfolio Turnover Rate | 17% | 5% | 6% | 8% | 5% | 4% | |
The expense ratio, net income ratio, and turnover rate for the current period have been annualized.
1 Net investment income per share and the ratio of net investment income to average net assets include $.128 and 0.21%, respectively,
resulting from a special dividend from Weyerhaeuser Co. in July 2010.
2 Total returns do not include transaction or account service fees that may have applied in the periods shown. Fund prospectuses provide
information about any applicable transaction and account service fees.
See accompanying Notes, which are an integral part of the Financial Statements.
19
PRIMECAP Fund
Financial Highlights
| Admiral Shares | |||||||
| Six Months | |||||||
| Ended | |||||||
| For a Share Outstanding | March 31, | Year Ended September 30, | |||||
| Throughout Each Period | 2014 | 2013 | 2012 | 2011 | 2010 | 2009 | |
| Net Asset Value, Beginning of Period | $91.15 | $72.03 | $60.69 | $62.65 | $57.20 | $65.19 | |
| Investment Operations | |||||||
| Net Investment Income | .714 | 1.178 | .974 | .738 | .7111 | .580 | |
| Net Realized and Unrealized Gain (Loss) | |||||||
| on Investments | 13.598 | 19.769 | 13.333 | (1.319) | 5.269 | (4.160) | |
| Total from Investment Operations | 14.312 | 20.947 | 14.307 | (.581) | 5.980 | (3.580) | |
| Distributions | |||||||
| Dividends from Net Investment Income | (. 983) | (1.079) | (.785) | (. 683) | (. 530) | (. 612) | |
| Distributions from Realized Capital Gains | (3.909) | (.748) | (2.182) | (.696) | — | (3.798) | |
| Total Distributions | (4.892) | (1.827) | (2.967) | (1.379) | (.530) | (4.410) | |
| Net Asset Value, End of Period | $100.57 | $91.15 | $72.03 | $60.69 | $62.65 | $57.20 | |
| Total Return | 16.17% | 29.73% | 24.29% | -1.14% | 10.46% | -3.90% | |
| Ratios/Supplemental Data | |||||||
| Net Assets, End of Period (Millions) | $27,531 | $23,129 | $15,978 | $11,088 | $9,765 | $9,222 | |
| Ratio of Total Expenses to | |||||||
| Average Net Assets | 0.35% | 0.36% | 0.36% | 0.36% | 0.36% | 0.37% | |
| Ratio of Net Investment Income to | |||||||
| Average Net Assets | 1.46% | 1.41% | 1.39% | 1.04% | 1.14%1 | 1.14% | |
| Portfolio Turnover Rate | 17% | 5% | 6% | 8% | 5% | 4% | |
The expense ratio, net income ratio, and turnover rate for the current period have been annualized.
1 Net investment income per share and the ratio of net investment income to average net assets include $.133 and 0.21%, respectively,
resulting from a special dividend from Weyerhaeuser Co. in July 2010.
See accompanying Notes, which are an integral part of the Financial Statements.
20
PRIMECAP Fund
Notes to Financial Statements
Vanguard PRIMECAP Fund is registered under the Investment Company Act of 1940 as an open-end investment company, or mutual fund. The fund offers two classes of shares: Investor Shares and Admiral Shares. Investor Shares are available to any investor who meets the fund’s minimum purchase requirements. Admiral Shares are designed for investors who meet certain administrative, service, and account-size criteria.
A. The following significant accounting policies conform to generally accepted accounting principles for U.S. mutual funds. The fund consistently follows such policies in preparing its financial statements.
1. Security Valuation: Securities are valued as of the close of trading on the New York Stock Exchange (generally 4 p.m., Eastern time) on the valuation date. Equity securities are valued at the latest quoted sales prices or official closing prices taken from the primary market in which each security trades; such securities not traded on the valuation date are valued at the mean of the latest quoted bid and asked prices. Securities for which market quotations are not readily available, or whose values have been affected by events occurring before the fund’s pricing time but after the close of the securities’ primary markets, are valued at their fair values calculated according to procedures adopted by the board of trustees. These procedures include obtaining quotations from an independent pricing service, monitoring news to identify significant market- or security-specific events, and evaluating changes in the values of foreign market proxies (for example, ADRs, futures contracts, or exchange-traded funds), between the time the foreign markets close and the fund’s pricing time. When fair-value pricing is employed, the prices of securities used by a fund to calculate its net asset value may differ from quoted or published prices for the same securities. Investments in Vanguard Market Liquidity Fund are valued at that fund’s net asset value.
2. Foreign Currency: Securities and other assets and liabilities denominated in foreign currencies are translated into U.S. dollars using exchange rates obtained from an independent third party as of the fund’s pricing time on the valuation date. Realized gains (losses) and unrealized appreciation (depreciation) on investment securities include the effects of changes in exchange rates since the securities were purchased, combined with the effects of changes in security prices. Fluctuations in the value of other assets and liabilities resulting from changes in exchange rates are recorded as unrealized foreign currency gains (losses) until the assets or liabilities are settled in cash, at which time they are recorded as realized foreign currency gains (losses).
3. Federal Income Taxes: The fund intends to continue to qualify as a regulated investment company and distribute all of its taxable income. Management has analyzed the fund’s tax positions taken for all open federal income tax years (September 31, 2010–2013), and for the period ended March 31, 2014, and has concluded that no provision for federal income tax is required in the fund’s financial statements.
4. Distributions: Distributions to shareholders are recorded on the ex-dividend date.
5. Securities Lending: To earn additional income, the fund lends its securities to qualified institutional borrowers. Security loans are required to be secured at all times by collateral in an amount at least equal to the market value of securities loaned. Daily market fluctuations could cause the value of loaned securities to be more or less than the value of the collateral received. When this occurs, the collateral is adjusted and settled on the next business day. The fund further mitigates its counterparty risk by entering into securities lending transactions only with a diverse group of prequalified counterparties, monitoring their financial strength, and entering into master securities lending agreements with its counterparties. The master securities lending agreements provide that, in the event of a counterparty’s default (including bankruptcy), the fund may terminate any loans with that borrower, determine the net amount owed, and sell or retain the collateral up to the net amount owed to the fund; however, such actions may be subject to legal proceedings. While collateral
21
PRIMECAP Fund
mitigates counterparty risk, in the absence of a default the fund may experience delays and costs in recovering the securities loaned. The fund invests cash collateral received in Vanguard Market Liquidity Fund, and records a liability in the Statement of Net Assets for the return of the collateral, during the period the securities are on loan. Securities lending income represents fees charged to borrowers plus income earned on invested cash collateral, less expenses associated with the loan.
6. Credit Facility: The fund and certain other funds managed by The Vanguard Group participate in a $2.89 billion committed credit facility provided by a syndicate of lenders pursuant to a credit agreement which may be renewed annually; each fund is individually liable for its borrowings, if any, under the credit facility. Borrowings may be utilized for temporary and emergency purposes, and are subject to the fund’s regulatory and contractual borrowing restrictions. The participating funds are charged administrative fees and an annual commitment fee of 0.06% of the undrawn amount of the facility, which are allocated to the funds in accordance with a methodology approved by the board of trustees and included in Management and Administrative expenses on the fund’s Statement of Operations. Any borrowings under this facility bear interest at a rate equal to the higher of the Federal Funds Rate or LIBOR Reference Rate plus an agreed-upon spread.
The fund had no borrowings outstanding at March 31, 2014, or at any time during the period then ended.
7. Other: Dividend income is recorded on the ex-dividend date. Interest income includes income distributions received from Vanguard Market Liquidity Fund and is accrued daily. Security transactions are accounted for on the date securities are bought or sold. Costs used to determine realized gains (losses) on the sale of investment securities are those of the specific securities sold.
Each class of shares has equal rights as to assets and earnings, except that each class separately bears certain class-specific expenses related to maintenance of shareholder accounts (included in Management and Administrative expenses) and shareholder reporting. Marketing and distribution expenses are allocated to each class of shares based on a method approved by the board of trustees. Income, other non-class-specific expenses, and gains and losses on investments are allocated to each class of shares based on its relative net assets.
B. PRIMECAP Management Company provides investment advisory services to the fund for a fee calculated at an annual percentage rate of average net assets. For the six months ended March 31, 2014, the investment advisory fee represented an effective annual rate of 0.20% of the fund’s average net assets.
C. The Vanguard Group furnishes at cost corporate management, administrative, marketing, and distribution services. The costs of such services are allocated to the fund under methods approved by the board of trustees. The fund has committed to provide up to 0.40% of its net assets in capital contributions to Vanguard. At March 31, 2014, the fund had contributed capital of $4,456,000 to Vanguard (included in Other Assets), representing 0.01% of the fund’s net assets and 1.78% of Vanguard’s capitalization. The fund’s trustees and officers are also directors and officers of Vanguard.
22
PRIMECAP Fund
D. Various inputs may be used to determine the value of the fund’s investments. These inputs are summarized in three broad levels for financial statement purposes. The inputs or methodologies used to value securities are not necessarily an indication of the risk associated with investing in those securities.
Level 1—Quoted prices in active markets for identical securities.
Level 2—Other significant observable inputs (including quoted prices for similar securities, interest rates, prepayment speeds, credit risk, etc.).
Level 3—Significant unobservable inputs (including the fund’s own assumptions used to determine the fair value of investments).
The following table summarizes the market value of the fund’s investments as of March 31, 2014, based on the inputs used to value them:
| Level 1 | Level 2 | Level 3 | |
| Investments | ($000) | ($000) | ($000) |
| Common Stocks | 37,651,696 | 2,082,305 | — |
| Temporary Cash Investments | 1,750,249 | — | — |
| Total | 39,401,945 | 2,082,305 | — |
E. Distributions are determined on a tax basis and may differ from net investment income and realized capital gains for financial reporting purposes. Differences may be permanent or temporary. Permanent differences are reclassified among capital accounts in the financial statements to reflect their tax character. Temporary differences arise when certain items of income, expense, gain, or loss are recognized in different periods for financial statement and tax purposes. These differences will reverse at some time in the future. Differences in classification may also result from the treatment of short-term gains as ordinary income for tax purposes. The fund’s tax-basis capital gains and losses are determined only at the end of each fiscal year.
During the six months ended March 31, 2014, the fund realized net foreign currency gains of $192,000, which increased distributable net income for tax purposes; accordingly, such gains have been reclassified from accumulated net realized gains to undistributed net investment income.
At March 31, 2014, the cost of investment securities for tax purposes was $20,366,693,000. Net unrealized appreciation of investment securities for tax purposes was $21,117,557,000, consisting of unrealized gains of $21,807,422,000 on securities that had risen in value since their purchase and $689,865,000 in unrealized losses on securities that had fallen in value since their purchase.
F. During the six months ended March 31, 2014, the fund purchased $3,144,292,000 of investment securities and sold $3,572,690,000 of investment securities, other than temporary cash investments.
23
PRIMECAP Fund
G. Capital share transactions for each class of shares were:
| Six Months Ended | Year Ended | |||
| March 31, 2014 | September 30, 2013 | |||
| Amount | Shares | Amount | Shares | |
| ($000) | (000) | ($000) | (000) | |
| Investor Shares | ||||
| Issued | 325,833 | 3,500 | 668,647 | 8,660 |
| Issued in Lieu of Cash Distributions | 642,434 | 7,204 | 313,404 | 4,485 |
| Redeemed | (1,488,018) | (16,007) | (4,884,777) | (60,900) |
| Net Increase (Decrease)—Investor Shares | (519,751) | (5,303) | (3,902,726) | (47,755) |
| Admiral Shares | ||||
| Issued | 1,660,429 | 17,198 | 4,361,547 | 51,652 |
| Issued in Lieu of Cash Distributions | 1,203,134 | 13,011 | 378,497 | 5,223 |
| Redeemed | (983,671) | (10,200) | (1,955,533) | (24,968) |
| Net Increase (Decrease)—Admiral Shares | 1,879,892 | 20,009 | 2,784,511 | 31,907 |
H. The fund has invested in a company that is considered to be an affiliated company of the fund because the fund owns more than 5% of the outstanding voting securities of the company. Transactions during the period in securities of this company were as follows:
| Current Period Transactions | |||||
| Sept. 30, 2013 | Proceeds from | Mar. 31, 2014 | |||
| Market | Purchases | Securities | Dividend | Market | |
| Value | at Cost | Sold | Income | Value | |
| ($000) | ($000) | ($000) | ($000) | ($000) | |
| Plantronics Inc. | 170,454 | — | — | 740 | 164,532 |
I. Management has determined that no material events or transactions occurred subsequent to March 31, 2014, that would require recognition or disclosure in these financial statements.
24
About Your Fund’s Expenses
As a shareholder of the fund, you incur ongoing costs, which include costs for portfolio management, administrative services, and shareholder reports (like this one), among others. Operating expenses, which are deducted from a fund’s gross income, directly reduce the investment return of the fund.
A fund’s expenses are expressed as a percentage of its average net assets. This figure is known as the expense ratio. The following examples are intended to help you understand the ongoing costs (in dollars) of investing in your fund and to compare these costs with those of other mutual funds. The examples are based on an investment of $1,000 made at the beginning of the period shown and held for the entire period.
The accompanying table illustrates your fund’s costs in two ways:
• Based on actual fund return. This section helps you to estimate the actual expenses that you paid over the period. The ”Ending Account Value“ shown is derived from the fund‘s actual return, and the third column shows the dollar amount that would have been paid by an investor who started with $1,000 in the fund. You may use the information here, together with the amount you invested, to estimate the expenses that you paid over the period.
To do so, simply divide your account value by $1,000 (for example, an $8,600 account value divided by $1,000 = 8.6), then multiply the result by the number given for your fund under the heading ”Expenses Paid During Period.“
• Based on hypothetical 5% yearly return. This section is intended to help you compare your fund‘s costs with those of other mutual funds. It assumes that the fund had a yearly return of 5% before expenses, but that the expense ratio is unchanged. In this case—because the return used is not the fund’s actual return—the results do not apply to your investment. The example is useful in making comparisons because the Securities and Exchange Commission requires all mutual funds to calculate expenses based on a 5% return. You can assess your fund’s costs by comparing this hypothetical example with the hypothetical examples that appear in shareholder reports of other funds.
Note that the expenses shown in the table are meant to highlight and help you compare ongoing costs only and do not reflect transaction costs incurred by the fund for buying and selling securities. Further, the expenses do not include any purchase, redemption, or account service fees described in the fund prospectus. If such fees were applied to your account, your costs would be higher. Your fund does not carry a “sales load.”
The calculations assume no shares were bought or sold during the period. Your actual costs may have been higher or lower, depending on the amount of your investment and the timing of any purchases or redemptions.
You can find more information about the fund’s expenses, including annual expense ratios, in the Financial Statements section of this report. For additional information on operating expenses and other shareholder costs, please refer to your fund’s current prospectus.
25
| Six Months Ended March 31, 2014 | |||
| Beginning | Ending | Expenses | |
| Account Value | Account Value | Paid During | |
| PRIMECAP Fund | 9/30/2013 | 3/31/2014 | Period |
| Based on Actual Fund Return | |||
| Investor Shares | $1,000.00 | $1,161.09 | $2.37 |
| Admiral Shares | 1,000.00 | 1,161.72 | 1.89 |
| Based on Hypothetical 5% Yearly Return | |||
| Investor Shares | $1,000.00 | $1,022.74 | $2.22 |
| Admiral Shares | 1,000.00 | 1,023.19 | 1.77 |
The calculations are based on expenses incurred in the most recent six-month period. The fund’s annualized six-month expense ratios for that
period are 0.44% for Investor Shares and 0.35% for Admiral Shares. The dollar amounts shown as “Expenses Paid” are equal to the
annualized expense ratio multiplied by the average account value over the period, multiplied by the number of days in the most recent
six-month period, then divided by the number of days in the most recent 12-month period.
26
Glossary
30-Day SEC Yield. A fund’s 30-day SEC yield is derived using a formula specified by the U.S. Securities and Exchange Commission. Under the formula, data related to the fund’s security holdings in the previous 30 days are used to calculate the fund’s hypothetical net income for that period, which is then annualized and divided by the fund’s estimated average net assets over the calculation period. For the purposes of this calculation, a security’s income is based on its current market yield to maturity (for bonds), its actual income (for asset-backed securities), or its projected dividend yield (for stocks). Because the SEC yield represents hypothetical annualized income, it will differ—at times significantly—from the fund’s actual experience. As a result, the fund’s income distributions may be higher or lower than implied by the SEC yield.
Beta. A measure of the magnitude of a fund’s past share-price fluctuations in relation to the ups and downs of a given market index. The index is assigned a beta of 1.00. Compared with a given index, a fund with a beta of 1.20 typically would have seen its share price rise or fall by 12% when the index rose or fell by 10%. For this report, beta is based on returns over the past 36 months for both the fund and the index. Note that a fund’s beta should be reviewed in conjunction with its R-squared (see definition). The lower the R-squared, the less correlation there is between the fund and the index, and the less reliable beta is as an indicator of volatility.
Dividend Yield. Dividend income earned by stocks, expressed as a percentage of the aggregate market value (or of net asset value, for a fund). The yield is determined by dividing the amount of the annual dividends by the aggregate value (or net asset value) at the end of the period. For a fund, the dividend yield is based solely on stock holdings and does not include any income produced by other investments.
Earnings Growth Rate. The average annual rate of growth in earnings over the past five years for the stocks now in a fund.
Equity Exposure. A measure that reflects a fund’s investments in stocks and stock futures. Any holdings in short-term reserves are excluded.
Expense Ratio. A fund’s total annual operating expenses expressed as a percentage of the fund’s average net assets. The expense ratio includes management and administrative expenses, but does not include the transaction costs of buying and selling portfolio securities.
Foreign Holdings. The percentage of a fund represented by securities or depositary receipts of companies based outside the United States.
Inception Date. The date on which the assets of a fund (or one of its share classes) are first invested in accordance with the fund’s investment objective. For funds with a subscription period, the inception date is the day after that period ends. Investment performance is measured from the inception date.
Median Market Cap. An indicator of the size of companies in which a fund invests; the midpoint of market capitalization (market price x shares outstanding) of a fund’s stocks, weighted by the proportion of the fund’s assets invested in each stock. Stocks representing half of the fund’s assets have market capitalizations above the median, and the rest are below it.
Price/Book Ratio. The share price of a stock divided by its net worth, or book value, per share. For a fund, the weighted average price/book ratio of the stocks it holds.
27
Price/Earnings Ratio. The ratio of a stock’s current price to its per-share earnings over the past year. For a fund, the weighted average P/E of the stocks it holds. P/E is an indicator of market expectations about corporate prospects; the higher the P/E, the greater the expectations for a company’s future growth.
R-Squared. A measure of how much of a fund’s past returns can be explained by the returns from the market in general, as measured by a given index. If a fund’s total returns were precisely synchronized with an index’s returns, its R-squared would be 1.00. If the fund’s returns bore no relationship to the index’s returns, its R-squared would be 0. For this report, R-squared is based on returns over the past 36 months for both the fund and the index.
Return on Equity. The annual average rate of return generated by a company during the past five years for each dollar of shareholder’s equity (net income divided by shareholder’s equity). For a fund, the weighted average return on equity for the companies whose stocks it holds.
Short-Term Reserves. The percentage of a fund invested in highly liquid, short-term securities that can be readily converted to cash.
Turnover Rate. An indication of the fund’s trading activity. Funds with high turnover rates incur higher transaction costs and may be more likely to distribute capital gains (which may be taxable to investors). The turnover rate excludes in-kind transactions, which have minimal impact on costs.
28
This page intentionally left blank.
This page intentionally left blank.
This page intentionally left blank.
The People Who Govern Your Fund
The trustees of your mutual fund are there to see that the fund is operated and managed in your best interests since, as a shareholder, you are a part owner of the fund. Your fund’s trustees also serve on the board of directors of The Vanguard Group, Inc., which is owned by the Vanguard funds and provides services to them on an at-cost basis.
A majority of Vanguard’s board members are independent, meaning that they have no affiliation with Vanguard or the funds they oversee, apart from the sizable personal investments they have made as private individuals. The independent board members have distinguished backgrounds in business, academia, and public service. Each of the trustees and executive officers oversees 179 Vanguard funds.
The following table provides information for each trustee and executive officer of the fund. More information about the trustees is in the Statement of Additional Information, which can be obtained, without charge, by contacting Vanguard at 800-662-7447, or online at vanguard.com.
| InterestedTrustee1 | and Delphi Automotive LLP (automotive components); |
| Senior Advisor at New Mountain Capital. | |
| F. William McNabb III | |
| Born 1957. Trustee Since July 2009. Chairman of the | Amy Gutmann |
| Board. Principal Occupation(s) During the Past Five | Born 1949. Trustee Since June 2006. Principal |
| Years: Chairman of the Board of The Vanguard Group, | Occupation(s) During the Past Five Years: President of |
| Inc., and of each of the investment companies served | the University of Pennsylvania; Christopher H. Browne |
| by The Vanguard Group, since January 2010; Director | Distinguished Professor of Political Science, School of |
| of The Vanguard Group since 2008; Chief Executive | Arts and Sciences, and Professor of Communication, |
| Officer and President of The Vanguard Group, and of | Annenberg School for Communication, with secondary |
| each of the investment companies served by The | faculty appointments in the Department of Philosophy, |
| Vanguard Group, since 2008; Director of Vanguard | School of Arts and Sciences, and at the Graduate |
| Marketing Corporation; Managing Director of The | School of Education, University of Pennsylvania; |
| Vanguard Group (1995–2008). | Trustee of the National Constitution Center; Chair |
| of the Presidential Commission for the Study of | |
| Bioethical Issues. | |
| IndependentTrustees | |
| JoAnn Heffernan Heisen | |
| Emerson U. Fullwood | Born 1950. Trustee Since July 1998. Principal |
| Born 1948. Trustee Since January 2008. Principal | Occupation(s) During the Past Five Years: Corporate |
| Occupation(s) During the Past Five Years: Executive | Vice President and Chief Global Diversity Officer |
| Chief Staff and Marketing Officer for North America | (retired 2008) and Member of the Executive |
| and Corporate Vice President (retired 2008) of Xerox | Committee (1997–2008) of Johnson & Johnson |
| Corporation (document management products and | (pharmaceuticals/medical devices/consumer |
| services); Executive in Residence and 2009–2010 | products); Director of Skytop Lodge Corporation |
| Distinguished Minett Professor at the Rochester | (hotels), the University Medical Center at Princeton, |
| Institute of Technology; Director of SPX Corporation | the Robert Wood Johnson Foundation, and the Center |
| (multi-industry manufacturing), the United Way of | for Talent Innovation; Member of the Advisory Board |
| Rochester, Amerigroup Corporation (managed health | of the Maxwell School of Citizenship and Public Affairs |
| care), the University of Rochester Medical Center, | at Syracuse University. |
| Monroe Community College Foundation, and North | |
| Carolina A&T University. | F. Joseph Loughrey |
| Born 1949. Trustee Since October 2009. Principal | |
| Rajiv L. Gupta | Occupation(s) During the Past Five Years: President |
| Born 1945. Trustee Since December 2001.2 | and Chief Operating Officer (retired 2009) of Cummins |
| Principal Occupation(s) During the Past Five Years: | Inc. (industrial machinery); Chairman of the Board |
| Chairman and Chief Executive Officer (retired 2009) | of Hillenbrand, Inc. (specialized consumer services), |
| and President (2006–2008) of Rohm and Haas Co. | and of Oxfam America; Director of SKF AB (industrial |
| (chemicals); Director of Tyco International, Ltd. | machinery), Hyster-Yale Materials Handling, Inc. |
| (diversified manufacturing and services), Hewlett- | (forklift trucks), the Lumina Foundation for Education, |
| Packard Co. (electronic computer manufacturing), |
| and the V Foundation for Cancer Research; Member | Executive Officers | |
| of the Advisory Council for the College of Arts and | ||
| Letters and of the Advisory Board to the Kellogg | Glenn Booraem | |
| Institute for International Studies, both at the | Born 1967. Controller Since July 2010. Principal | |
| University of Notre Dame. | Occupation(s) During the Past Five Years: Principal | |
| of The Vanguard Group, Inc.; Controller of each of | ||
| Mark Loughridge | the investment companies served by The Vanguard | |
| Born 1953. Trustee Since March 2012. Principal | Group; Assistant Controller of each of the investment | |
| Occupation(s) During the Past Five Years: Senior Vice | companies served by The Vanguard Group (2001–2010). | |
| President and Chief Financial Officer (retired 2013) | ||
| at IBM (information technology services); Fiduciary | Thomas J. Higgins | |
| Member of IBM’s Retirement Plan Committee (2004– | Born 1957. Chief Financial Officer Since September | |
| 2013); Member of the Council on Chicago Booth. | 2008. Principal Occupation(s) During the Past Five | |
| Years: Principal of The Vanguard Group, Inc.; Chief | ||
| Scott C. Malpass | Financial Officer of each of the investment companies | |
| Born 1962. Trustee Since March 2012. Principal | served by The Vanguard Group; Treasurer of each of | |
| Occupation(s) During the Past Five Years: Chief | the investment companies served by The Vanguard | |
| Investment Officer and Vice President at the University | Group (1998–2008). | |
| of Notre Dame; Assistant Professor of Finance at the | ||
| Mendoza College of Business at Notre Dame; Member | Kathryn J. Hyatt | |
| of the Notre Dame 403(b) Investment Committee; | Born 1955. Treasurer Since November 2008. Principal | |
| Board Member of TIFF Advisory Services, Inc. | Occupation(s) During the Past Five Years: Principal of | |
| (investment advisor); Member of the Investment | The Vanguard Group, Inc.; Treasurer of each of the | |
| Advisory Committees of the Financial Industry | investment companies served by The Vanguard | |
| Regulatory Authority (FINRA) and of Major League | Group; Assistant Treasurer of each of the investment | |
| Baseball. | companies served by The Vanguard Group (1988–2008). | |
| André F. Perold | Heidi Stam | |
| Born 1952. Trustee Since December 2004. Principal | Born 1956. Secretary Since July 2005. Principal | |
| Occupation(s) During the Past Five Years: George | Occupation(s) During the Past Five Years: Managing | |
| Gund Professor of Finance and Banking, Emeritus | Director of The Vanguard Group, Inc.; General Counsel | |
| at the Harvard Business School (retired 2011); | of The Vanguard Group; Secretary of The Vanguard | |
| Chief Investment Officer and Managing Partner of | Group and of each of the investment companies | |
| HighVista Strategies LLC (private investment firm); | served by The Vanguard Group; Director and Senior | |
| Director of Rand Merchant Bank; Overseer of the | Vice President of Vanguard Marketing Corporation. | |
| Museum of Fine Arts Boston. | ||
| Vanguard Senior ManagementTeam | ||
| Alfred M. Rankin, Jr. | ||
| Born 1941. Trustee Since January 1993. Principal | Mortimer J. Buckley | Chris D. McIsaac |
| Occupation(s) During the Past Five Years: Chairman, | Kathleen C. Gubanich | Michael S. Miller |
| President, and Chief Executive Officer of NACCO | Paul A. Heller | James M. Norris |
| Industries, Inc. (housewares/lignite), and of Hyster- | Martha G. King | Glenn W. Reed |
| Yale Materials Handling, Inc. (forklift trucks); Chairman | John T. Marcante | |
| of the Board of University Hospitals of Cleveland. | ||
| Peter F. Volanakis | Chairman Emeritus and Senior Advisor | |
| Born 1955. Trustee Since July 2009. Principal | ||
| Occupation(s) During the Past Five Years: President | John J. Brennan | |
| and Chief Operating Officer (retired 2010) of Corning | Chairman, 1996–2009 | |
| Incorporated (communications equipment); Trustee of | Chief Executive Officer and President, 1996–2008 | |
| Colby-Sawyer College; Member of the Advisory Board | ||
| of the Norris Cotton Cancer Center and of the Advisory | ||
| Board of the Parthenon Group (strategy consulting). | Founder | |
| John C. Bogle | ||
| Chairman and Chief Executive Officer, 1974–1996 | ||
1 Mr. McNabb is considered an “interested person,” as defined in the Investment Company Act of 1940, because he is an officer of the
Vanguard funds.
2 December 2002 for Vanguard Equity Income Fund, the Vanguard Municipal Bond Funds, and the Vanguard State Tax-Exempt Funds.
 | |
| P.O. Box 2600 | |
| Valley Forge, PA 19482-2600 | |
| Connect with Vanguard® > vanguard.com | |
| Fund Information > 800-662-7447 | |
| Direct Investor Account Services > 800-662-2739 | |
| Institutional Investor Services > 800-523-1036 | |
| Text Telephone for People | |
| With Hearing Impairment > 800-749-7273 | |
| This material may be used in conjunction | |
| with the offering of shares of any Vanguard | |
| fund only if preceded or accompanied by | |
| the fund’s current prospectus. | |
| All comparative mutual fund data are from Lipper, a | |
| Thomson Reuters Company, or Morningstar, Inc., unless | |
| otherwise noted. | |
| You can obtain a free copy of Vanguard’s proxy voting | |
| guidelines by visiting vanguard.com/proxyreporting or by | |
| calling Vanguard at 800-662-2739. The guidelines are | |
| also available from the SEC’s website, sec.gov. In | |
| addition, you may obtain a free report on how your fund | |
| voted the proxies for securities it owned during the 12 | |
| months ended June 30. To get the report, visit either | |
| vanguard.com/proxyreporting or sec.gov. | |
| You can review and copy information about your fund at | |
| the SEC’s Public Reference Room in Washington, D.C. To | |
| find out more about this public service, call the SEC at | |
| 202-551-8090. Information about your fund is also | |
| available on the SEC’s website, and you can receive | |
| copies of this information, for a fee, by sending a | |
| request in either of two ways: via e-mail addressed to | |
| publicinfo@sec.gov or via regular mail addressed to the | |
| Public Reference Section, Securities and Exchange | |
| Commission, Washington, DC 20549-1520. | |
| © 2014 The Vanguard Group, Inc. | |
| All rights reserved. | |
| Vanguard Marketing Corporation, Distributor. | |
| Q592 052014 | |
![]()
Semiannual Report | March 31, 2014
Vanguard Target Retirement Funds
Vanguard’s Principles for Investing Success
We want to give you the best chance of investment success. These principles,
grounded in Vanguard’s research and experience, can put you on the right path.
Goals. Create clear, appropriate investment goals.
Balance. Develop a suitable asset allocation using broadly diversified funds.
Cost. Minimize cost.
Discipline. Maintain perspective and long-term discipline.
A single theme unites these principles: Focus on the things you can control.
We believe there is no wiser course for any investor.
| Contents | |
| Your Fund’s Total Returns. | 1 |
| Chairman’s Letter. | 2 |
| Target Retirement Income Fund. | |
| Target Retirement 2010 Fund. | 1 |
| Target Retirement 2015 Fund. | 2 |
| Target Retirement 2020 Fund. | 3 |
| Target Retirement 2025 Fund. | 4 |
| Target Retirement 2030 Fund. | 5 |
| About Your Fund’s Expenses. | 6 |
| Trustees Approve Advisory Arrangement. | 6 |
| Glossary. | 6 |
Please note: The opinions expressed in this report are just that—informed opinions. They should not be considered promises or advice.
Also, please keep in mind that the information and opinions cover the period through the date on the front of this report. Of course, the
risks of investing in your fund are spelled out in the prospectus.
See the Glossary for definitions of investment terms used in this report.
About the cover: The ship’s wheel represents leadership and guidance, essential qualities in navigating difficult seas.
This one is a replica based on an 18th-century British vessel. The HMSVanguard, another ship of that era, served as the
flagship for British Admiral Horatio Nelson when he defeated a French fleet at the Battle of the Nile.
Your Fund’s Total Returns
| Six Months Ended March 31, 2014 | |
| Total | |
| Returns | |
| Vanguard Target Retirement Income Fund | 4.03% |
| Target Income Composite Index | 4.19 |
| Mixed-Asset Target Allocation Conservative Funds Average | 4.71 |
| Mixed-Asset Target Allocation Conservative Funds Average: Derived from data provided by Lipper, a Thomson Reuters Company. | |
| Vanguard Target Retirement 2010 Fund | 4.97% |
| Target 2010 Composite Index | 5.10 |
| Mixed-Asset Target 2010 Funds Average | 4.63 |
| Mixed-Asset Target 2010 Funds Average: Derived from data provided by Lipper, a Thomson Reuters Company. | |
| Vanguard Target Retirement 2015 Fund | 6.18% |
| Target 2015 Composite Index | 6.32 |
| Mixed-Asset Target 2015 Funds Average | 5.06 |
| Mixed-Asset Target 2015 Funds Average: Derived from data provided by Lipper, a Thomson Reuters Company. | |
| Vanguard Target Retirement 2020 Fund | 7.03% |
| Target 2020 Composite Index | 7.21 |
| Mixed-Asset Target 2020 Funds Average | 5.58 |
| Mixed-Asset Target 2020 Funds Average: Derived from data provided by Lipper, a Thomson Reuters Company. | |
| Vanguard Target Retirement 2025 Fund | 7.65% |
| Target 2025 Composite Index | 7.84 |
| Mixed-Asset Target 2025 Funds Average | 6.76 |
| Mixed-Asset Target 2025 Funds Average: Derived from data provided by Lipper, a Thomson Reuters Company. | |
| Vanguard Target Retirement 2030 Fund | 8.31% |
| Target 2030 Composite Index | 8.47 |
| Mixed-Asset Target 2030 Funds Average | 7.11 |
| Mixed-Asset Target 2030 Funds Average: Derived from data provided by Lipper, a Thomson Reuters Company. | |
| For a benchmark description, see the Glossary. |
Investments in Target Retirement Funds are subject to the risks of their underlying funds. The year in the fund name
refers to the approximate year (the target date) when an investor in the fund would retire and leave the work force.
The fund will gradually shift its emphasis from more aggressive investments to more conservative ones based on its
target date. An investment in a Target Retirement Fund is not guaranteed at any time, including on or after the target
date.
1

Chairman’s Letter
Dear Shareholder,
U.S. stocks notched solid gains—more than double that of international stocks—for the six months ended March 31, 2014. Bonds, meanwhile, recovered some lost ground after slumping in the previous fiscal year as investors worried about the direction of interest rates.
For the half year, returns for the six Vanguard Target Retirement Funds in this report—the Income Fund as well as the funds dated 2010 through 2030—ranged from about 4% to more than 8%. (The funds with retirement dates of 2035 through 2060 are covered in a separate report.)
The funds with the largest stock allocations performed best. Although investing in stocks can often result in more volatility, this time around it turned out to be an advantage.
Despite recent choppiness, U.S. stocks were productive
The broad U.S. stock market recorded a gain of about 12% for the six months ended March 31, although its path became increasingly rocky over the period’s second half. Corporate earnings, for the most part, continued to rise as the U.S. economy showed modest growth.
2
The Federal Reserve’s stimulative bond-buying program has helped support the market for several years. Since January, however, the Fed has been making monthly cuts in its purchases, and this has created some apprehension among investors. Slow economic growth in China and the conflict in Ukraine have also caused market turbulence.
International stocks returned about 5%. The developed markets of Europe, where the economy has improved somewhat, posted strong results; the developed markets of the Pacific region and emerging markets had weaker results.
Bonds reclaimed ground after a difficult stretch
Over the six months, the broad U.S. taxable bond market returned 1.70%, a welcome result after its struggles for much of calendar-year 2013. The yield of the 10-year Treasury note finished the half year at 2.72%, up from 2.63% at September’s end but down from nearly 3% on December 31. (Bond prices and yields move in opposite directions.)
Many bond investors have been focusing on the possibility of interest rates moving higher and the negative effect that would have on bond prices. However, there’s a
| Market Barometer | |||
| Total Returns | |||
| Periods Ended March 31, 2014 | |||
| Six | One | Five Years | |
| Months | Year | (Annualized) | |
| Stocks | |||
| Russell 1000 Index (Large-caps) | 12.48% | 22.41% | 21.73% |
| Russell 2000 Index (Small-caps) | 9.94 | 24.90 | 24.31 |
| Russell 3000 Index (Broad U.S. market) | 12.28 | 22.61 | 21.93 |
| FTSE All-World ex US Index (International) | 5.25 | 12.50 | 15.93 |
| Bonds | |||
| Barclays U.S. Aggregate Bond Index (Broad taxable market) | 1.70% | -0.10% | 4.80% |
| Barclays Municipal Bond Index (Broad tax-exempt market) | 3.65 | 0.39 | 5.71 |
| Citigroup Three-Month U.S. Treasury Bill Index | 0.00 | 0.05 | 0.08 |
| CPI | |||
| Consumer Price Index | 0.92% | 1.51% | 2.13% |
3
flip side to rising rates. As Greg Davis, the new head of our Fixed Income Group, recently noted, long-term investors can benefit over time because they’re “going to be reinvesting those coupon payments and principal payments at higher rates.”
Municipal bonds returned 3.65% for the six months, another major improvement over calendar-year 2013, as investors waded back into the muni market. Many had fled last year when challenges surfaced for some issuers. Money market and savings account returns remained meager because of the Fed’s target of 0%–0.25% for short-term interest rates.
International bond markets (as measured by the Barclays Global Aggregate Index ex USD) returned 2.05%.
Underlying stock funds lifted the funds’ results
The Vanguard Target Retirement Funds provide investors access to broadly diversified “funds of funds” that automatically rebalance as the target retirement date approaches. Each portfolio shifts from a growth-oriented, stock-heavy asset allocation to one that is more conservative and more focused on bonds. This gradual shift is critical for investors nearing or in retirement, who are increasingly concerned about income and preserving their wealth.
| Expense Ratios | ||
| Your Fund Compared With Its Peer Group | ||
| Acquired Fund Fees | Peer Group | |
| and Expenses | Average | |
| Target Retirement Income Fund | 0.16% | 0.88% |
| Target Retirement 2010 Fund | 0.16 | 0.54 |
| Target Retirement 2015 Fund | 0.16 | 0.49 |
| Target Retirement 2020 Fund | 0.16 | 0.57 |
| Target Retirement 2025 Fund | 0.17 | 0.49 |
| Target Retirement 2030 Fund | 0.17 | 0.56 |
The fund expense figures shown—drawn from the prospectus dated January 27, 2014—represent an estimate of the weighted average of
the expense ratios and any transaction fees charged by the underlying mutual funds (the ”acquired” funds) in which the Target Retirement
Funds invest. The Target Retirement Funds do not charge any expenses or fees of their own. For the six months ended March 31, 2014, the
annualized acquired fund fees and expenses were 0.17% for the Income Fund, 0.17% for the 2010 Fund, 0.17% for the 2015 Fund, 0.17% for
the 2020 Fund, 0.17% for the 2025 Fund, and 0.17% for the 2030 Fund. Peer-group expense ratios are derived from data provided by Lipper, a
Thomson Reuters Company, and capture information through year-end 2013.
Peer groups: For the Income Fund, Mixed-Asset Target Allocation Conservative Funds; for the 2010 Fund, Mixed-Asset Target 2010 Funds; for
the 2015 Fund, Mixed-Asset Target 2015 Funds; for the 2020 Fund, Mixed-Asset Target 2020 Funds; for the 2025 Fund, Mixed-Asset Target
2025 Funds; and for the Target Retirement 2030 Fund, Mixed-Asset Target 2030 Funds.
4
As you’re probably aware, the funds covered in this report are designed for investors already in retirement or within 20 years of retiring. Therefore, they tend to be more conservative, with a larger proportion of their assets in bonds than their longer-dated counterparts.
| The appeal of low-cost investing is growing |
| Minimizing investment costs is a critical part of every investor’s toolkit. Why? Because every |
| dollar paid for fund management expenses is simply a dollar less that can work on your behalf. |
| Put another way, the lower your mutual fund’s costs, the greater your share of the fund’s return. |
| Not surprisingly, research indicates that lower-cost investments have tended to outperform |
| their higher-cost counterparts. |
| Investors are catching on to the value of lower-cost mutual funds. Funds with lower expense |
| ratios dominated in attracting investment dollars over the decade ended December 31, 2012, |
| according to a Vanguard research paper titled Costs Matter: Are Fund Investors Voting With |
| Their Feet? (You can read the paper at vanguard.com/matter.) And, as the chart below shows, |
| Vanguard’s leadership in keeping down costs for investors seems to have encouraged the |
| industry to reduce its average costs—at least over the past decade. |
| Even so, Vanguard’s average expenses continue to be less than one-fifth the industry average: |
| 0.19% versus 1.08% (as of December 31, 2013). That cost difference remains a powerful tool |
| in the hands of Vanguard clients. |
| Vanguard fund costs remain far below industry average |
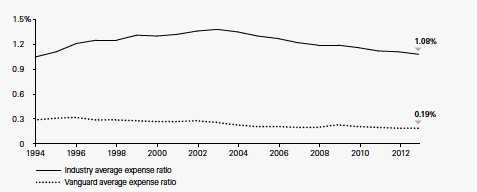
| Sources: Vanguard and Lipper, a Thomson Reuters Company. |
5
Given the stock market’s strong performance during the six months, it comes as no surprise that the 2030 Fund, which held about 77% of its assets in stocks and about 23% in bonds, garnered the best result, with a return of 8.31%. The most conservative of the group, the Income Fund, was also the weakest performer, returning 4.03%. The results of the four other funds fell in between.
The Target Retirement Funds’ fixed income component had a limited but positive impact on overall performance. Vanguard Total International Bond Index Fund, a relatively new addition to all six retirement funds, stood out most, with a 2.65% return for the period. International bonds benefited from central bank policies in Europe and Japan aimed at pushing down interest rates, thus boosting bond prices.
Vanguard Total Bond Market II Index Fund, another core holding in the retirement funds, returned 1.65%. Demand for U.S. bonds picked up a bit at the end of 2013 and into early 2014 as concerns resurfaced about the pace of growth in the United States and China and signs of economic and political instability in some emerging markets.
With inflation expectations in the United States moderating, Vanguard Short-Term Inflation-Protected Securities Index Fund, which is held by the three most conservative portfolios (the Income Fund, 2010 Fund, and 2015 Fund), returned –0.11%.
Divining the future is tricky, but preparing for it is prudent
Predictions are often made but rarely come true. In an interview with our newsletter In The Vanguard, University of Pennsylvania professor Philip Tetlock noted, “As a whole, experts [are] slightly more accurate than the proverbial dart-throwing chimpanzee.”
Dr. Tetlock’s extensive research on the accuracy of predictions found that it’s best to think in terms of probabilities and to avoid bold, specific declarations about what the future holds. At Vanguard, we agree that forecasting the economy and capital markets should be leavened with modesty. Joe Davis, our chief economist, is fond of saying that we “treat the future with the humility it deserves.”
That’s why our economists don’t make the pinpoint projections that you’ll see elsewhere. Instead, using sophisticated statistical models, we provide a range and probability of potential outcomes—for example, the return of U.S. stocks. And we explain our rationale for such outcomes, allowing you to make better-informed decisions about risk and return.
In January, as they do each year, our economists issued Vanguard’s Economic and Investment Outlook. They also update their perspectives periodically and address significant developments such as changes in Federal Reserve policy. (You can read our most recent outlook at vanguard.com/research.)
6
Our forecasts acknowledge that no one can envision every scenario. And that reality underlines one of Vanguard’s core investment principles: Develop a suitable asset allocation using broadly diversified funds. Having a balanced portfolio can help you get through unforeseen events and achieve your goals—even without a crystal ball.
As always, thank you for investing with Vanguard.
Sincerely,

F. William McNabb III
Chairman and Chief Executive Officer
April 11, 2014
| Your Fund’s Performance at a Glance | ||||
| September 30, 2013, Through March 31, 2014 | ||||
| Distributions Per Share | ||||
| Starting | Ending | Income | Capital | |
| Share Price | Share Price | Dividends | Gains | |
| Target Retirement Income Fund | $12.46 | $12.65 | $0.112 | $0.196 |
| Target Retirement 2010 Fund | $25.50 | $26.03 | $0.422 | $0.301 |
| Target Retirement 2015 Fund | $14.49 | $15.03 | $0.261 | $0.087 |
| Target Retirement 2020 Fund | $26.26 | $27.60 | $0.484 | $0.011 |
| Target Retirement 2025 Fund | $15.18 | $16.03 | $0.287 | $0.017 |
| Target Retirement 2030 Fund | $26.46 | $28.12 | $0.491 | $0.036 |
8
Target Retirement Income Fund
Fund Profile
As of March 31, 2014
| Total Fund Characteristics | |
| Ticker Symbol | VTINX |
| 30-Day SEC Yield | 1.72% |
| Acquired Fund Fees and Expenses1 | 0.16% |
| Allocation to Underlying Vanguard Funds | |
| Vanguard Total Bond Market II Index Fund | |
| Investor Shares | 39.2% |
| Vanguard Total Stock Market Index Fund | |
| Investor Shares | 21.1 |
| Vanguard Short-Term Inflation Protected | |
| Securities Index Fund Investor Shares | 16.7 |
| Vanguard Total International Bond Index | |
| Fund Investor Shares | 14.0 |
| Vanguard Total International Stock Index | |
| Fund Investor Shares | 9.0 |
| Total Fund Volatility Measures | ||
| Target | Barclays | |
| Income | Aggregate | |
| Composite | Bond | |
| Index | Index | |
| R-Squared | 1.00 | 0.07 |
| Beta | 1.00 | 0.41 |
| These measures show the degree and timing of the fund’s fluctuations compared with the indexes over 36 months. | ||
Fund Asset Allocation
1 This figure—drawn from the prospectus dated January 27, 2014—represents an estimate of the weighted average of the expense ratios and any
transaction fees charged by the underlying mutual funds (the ”acquired” funds) in which the Target Retirement Income Fund invests. The fund does
not charge any expenses or fees of its own. For the six months ended March 31, 2014, the annualized acquired fund fees and expenses were 0.17%.
9
Target Retirement Income Fund
Performance Summary
All of the returns in this report represent past performance, which is not a guarantee of future results that may be achieved by the fund. (Current performance may be lower or higher than the performance data cited. For performance data current to the most recent month-end, visit our website at vanguard.com/performance.) Note, too, that both investment returns and principal value can fluctuate widely, so an investor’s shares, when sold, could be worth more or less than their original cost. The returns shown do not reflect taxes that a shareholder would pay on fund distributions or on the sale of fund shares.
Fiscal-Year Total Returns (%): October 27, 2003, Through March 31, 2014
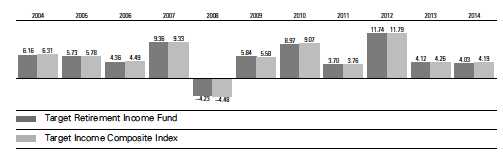
Note: For 2014, performance data reflect the six months ended March 31, 2014.
| Average Annual Total Returns: Periods Ended March 31, 2014 | ||||||
| Ten Years | ||||||
| Inception Date | One Year | Five Years | Income | Capital | Total | |
| Target Retirement Income | ||||||
| Fund | 10/27/2003 | 4.89% | 9.32% | 3.16% | 2.16% | 5.32% |
See Financial Highlights for dividend and capital gains information.
10
Target Retirement Income Fund
Financial Statements (unaudited)
Statement of Net Assets
As of March 31, 2014
The fund reports a complete list of its holdings in regulatory filings four times in each fiscal year, at the quarter-ends. For the second and fourth fiscal quarters, the lists appear in the fund’s semiannual and annual reports to shareholders. For the first and third fiscal quarters, the fund files the lists with the Securities and Exchange Commission on Form N-Q. Shareholders can look up the fund’s Forms N-Q on the SEC’s website at sec.gov. Forms N-Q may also be reviewed and copied at the SEC’s Public Reference Room (see the back cover of this report for further information).
| Market | ||
| Value | ||
| Shares | ($000) | |
| Investment Companies (100.0%) | ||
| U.S. Stock Fund (21.1%) | ||
| Vanguard Total Stock Market Index Fund Investor Shares | 47,942,180 | 2,272,939 |
| International Stock Fund (9.0%) | ||
| Vanguard Total International Stock Index Fund Investor Shares | 58,121,617 | 974,118 |
| U.S. Bond Funds (55.9%) | ||
| 1 Vanguard Total Bond Market II Index Fund Investor Shares | 396,750,001 | 4,221,420 |
| Vanguard Short-Term Inflation-Protected Securities Index Fund Investor Shares | 72,977,274 | 1,803,998 |
| 6,025,418 | ||
| International Bond Fund (14.0%) | ||
| Vanguard Total International Bond Index Fund Investor Shares | 149,199,953 | 1,505,428 |
| Total Investment Companies (Cost $9,594,804) | 10,777,903 | |
| Temporary Cash Investment (0.1%) | ||
| Money Market Fund (0.1%) | ||
| 1 Vanguard Market Liquidity Fund, 0.122% (Cost $7,852) | 7,851,839 | 7,852 |
| Total Investments (100.1%) (Cost $9,602,656) | 10,785,755 | |
| Other Assets and Liabilities (-0.1%) | ||
| Other Assets | 45,635 | |
| Liabilities | (52,214) | |
| (6,579) | ||
| Net Assets (100%) | ||
| Applicable to 852,034,225 outstanding $.001 par value shares of | ||
| beneficial interest (unlimited authorization) | 10,779,176 | |
| Net Asset Value Per Share | $12.65 | |
11
Target Retirement Income Fund
| At March 31, 2014, net assets consisted of: | |
| Amount | |
| ($000) | |
| Paid-in Capital | 9,555,411 |
| Undistributed Net Investment Income | 3,093 |
| Accumulated Net Realized Gains | 37,573 |
| Unrealized Appreciation (Depreciation) | 1,183,099 |
| Net Assets | 10,779,176 |
See Note A in Notes to Financial Statements.
1 Affiliated fund available only to Vanguard funds and certain trusts and accounts managed by Vanguard. Rate shown for Vanguard Market
Liquidity Fund is the 7-day yield.
See accompanying Notes, which are an integral part of the Financial Statements.
12
Target Retirement Income Fund
Statement of Operations
| Six Months Ended | |
| March 31, 2014 | |
| ($000) | |
| Investment Income | |
| Income | |
| Income Distributions Received | 92,098 |
| Net Investment Income—Note B | 92,098 |
| Realized Net Gain (Loss) | |
| Capital Gain Distributions Received | 1,933 |
| Investment Securities Sold | 40,805 |
| Realized Net Gain (Loss) | 42,738 |
| Change in Unrealized Appreciation (Depreciation) of Investment Securities | 282,656 |
| Net Increase (Decrease) in Net Assets Resulting from Operations | 417,492 |
See accompanying Notes, which are an integral part of the Financial Statements.
13
Target Retirement Income Fund
Statement of Changes in Net Assets
| Six Months Ended | Year Ended | |
| March 31, | September 30, | |
| 2014 | 2013 | |
| ($000) | ($000) | |
| Increase (Decrease) in Net Assets | ||
| Operations | ||
| Net Investment Income | 92,098 | 199,821 |
| Realized Net Gain (Loss) | 42,738 | 237,175 |
| Change in Unrealized Appreciation (Depreciation) | 282,656 | (40,097) |
| Net Increase (Decrease) in Net Assets Resulting from Operations | 417,492 | 396,899 |
| Distributions | ||
| Net Investment Income | (93,564) | (200,619) |
| Realized Capital Gain1 | (161,457) | (16,647) |
| Total Distributions | (255,021) | (217,266) |
| Capital Share Transactions | ||
| Issued | 1,598,115 | 3,006,065 |
| Issued in Lieu of Cash Distributions | 245,404 | 209,124 |
| Redeemed | (1,389,442) | (2,614,401) |
| Net Increase (Decrease) from Capital Share Transactions | 454,077 | 600,788 |
| Total Increase (Decrease) | 616,548 | 780,421 |
| Net Assets | ||
| Beginning of Period | 10,162,628 | 9,382,207 |
| End of Period2 | 10,779,176 | 10,162,628 |
| 1 Includes fiscal 2014 and 2013 short-term gain distributions totaling $2,471,000 and $16,647,000, respectively. Short-term gain distributions | ||
| are treated as ordinary income dividends for tax purposes. | ||
| 2 Net Assets—End of Period includes undistributed net investment income of $3,093,000 and $4,559,000. | ||
See accompanying Notes, which are an integral part of the Financial Statements.
14
Target Retirement Income Fund
Financial Highlights
| Six Months | |||||||
| Ended | |||||||
| For a Share Outstanding | March 31, | Year Ended September 30, | |||||
| Throughout Each Period | 2014 | 2013 | 2012 | 2011 | 2010 | 2009 | |
| Net Asset Value, Beginning of Period | $12.46 | $12.23 | $11.22 | $11.13 | $10.49 | $10.19 | |
| Investment Operations | |||||||
| Net Investment Income | .110 | . 246 | . 275 | . 3031 | .288 | .268 | |
| Capital Gain Distributions Received | .002 | .067 | .052 | .0301 | — | — | |
| Net Realized and Unrealized Gain (Loss) | |||||||
| on Investments | . 386 | .185 | . 977 | . 080 | . 640 | . 302 | |
| Total from Investment Operations | .498 | .498 | 1.304 | .413 | . 928 | .570 | |
| Distributions | |||||||
| Dividends from Net Investment Income | (.112) | (.247) | (.273) | (.299) | (.288) | (.270) | |
| Distributions from Realized Capital Gains | (.196) | (. 021) | (. 021) | (. 024) | — | — | |
| Total Distributions | (. 308) | (. 268) | (. 294) | (. 323) | (. 288) | (. 270) | |
| Net Asset Value, End of Period | $12.65 | $12.46 | $12.23 | $11.22 | $11.13 | $10.49 | |
| Total Return2 | 4.03% | 4.12% | 11.74% | 3.70% | 8.97% | 5.84% | |
| Ratios/Supplemental Data | |||||||
| Net Assets, End of Period (Millions) | $10,779 | $10,163 | $9,382 | $4,765 | $3,623 | $2,463 | |
| Ratio of Total Expenses to | |||||||
| Average Net Assets | — | — | — | — | — | — | |
| Acquired Fund Fees and Expenses | 0.17% | 0.16% | 0.16% | 0.17% | 0.17% | 0.21% | |
| Ratio of Net Investment Income to | |||||||
| Average Net Assets | 1.75% | 1.99% | 2.31% | 2.65% | 2.70% | 2.78% | |
| Portfolio Turnover Rate | 8% | 40% | 7% | 14%3 | 12% | 29%4 | |
The expense ratio, acquired fund fees and expenses, net income ratio, and turnover rate for the current period have been annualized.
1 Calculated based on average shares outstanding.
2 Total returns do not include account service fees that may have applied in the periods shown. Fund prospectuses provide information about
any applicable account service fees.
3 Excludes the value of mutual fund shares delivered and received in connection with a change in the fund’s international equity investments
from Vanguard European, Pacific, and Emerging Markets Stock Index Funds to Vanguard Total International Stock Index Fund because those
transactions were effected in kind and did not cause the fund to incur transaction costs.
4 Excludes the value of mutual fund shares delivered and received in connection with a change in the fund’s bond investments from Vanguard
Total Bond Market Index Fund to Vanguard Total Bond Market II Index Fund because those transactions were effected in kind and did not
cause the fund to incur transaction costs.
See accompanying Notes, which are an integral part of the Financial Statements.
15
Target Retirement Income Fund
Notes to Financial Statements
Vanguard Target Retirement Income Fund is registered under the Investment Company Act of 1940 as an open-end investment company, or mutual fund. The fund follows a balanced investment strategy by investing in selected Vanguard funds to achieve its targeted allocation of assets to U.S. stocks, international stocks, U.S. bonds, and international bonds. Financial statements and other information about each underlying fund are available on vanguard.com
A. The following significant accounting policies conform to generally accepted accounting principles for U.S. mutual funds. The fund consistently follows such policies in preparing its financial statements.
1. Security Valuation: Investments are valued at the net asset value of each underlying Vanguard fund determined as of the close of the New York Stock Exchange (generally 4 p.m., Eastern time) on the valuation date.
2. Federal Income Taxes: The fund intends to continue to qualify as a regulated investment company and distribute all of its taxable income. Management has analyzed the fund’s tax positions taken for all open federal income tax years (September 30, 2010–2013), and for the period ended March 31, 2014, and has concluded that no provision for federal income tax is required in the fund’s financial statements.
3. Distributions: Distributions to shareholders are recorded on the ex-dividend date.
4. Credit Facility: The fund and certain other funds managed by The Vanguard Group participate in a $2.89 billion committed credit facility provided by a syndicate of lenders pursuant to a credit agreement which may be renewed annually; each fund is individually liable for its borrowings, if any, under the credit facility. Borrowings may be utilized for temporary and emergency purposes, and are subject to the fund’s regulatory and contractual borrowing restrictions. The participating funds are charged administrative fees and an annual commitment fee of 0.06% of the undrawn amount of the facility, which are allocated to the funds in accordance with a methodology approved by the board of trustees and borne by the funds in which the fund invests (See Note B). Any borrowings under this facility bear interest at a rate equal to the higher of the Federal Funds Rate or LIBOR Reference Rate plus an agreed-upon spread.
The fund had no borrowings outstanding at March 31, 2014, or at any time during the period then ended.
5. Other: Income and capital gain distributions received are recorded on the ex-dividend date. Security transactions are accounted for on the date securities are bought or sold. Costs used to determine realized gains (losses) on the sale of investment securities are those of the specific securities sold.
B. Under a service agreement, The Vanguard Group furnishes investment advisory, corporate management, administrative, marketing, and distribution services to the fund. The service agreement provides that the fund’s expenses may be reduced or eliminated to the extent of savings realized by the Vanguard funds by the operation of the fund. Accordingly, all incremental expenses for services provided by Vanguard and all other expenses incurred by the fund during the period ended March 31, 2014, were borne by the funds in which the fund invests. The fund’s trustees and officers are also directors and officers of Vanguard and the funds in which the fund invests.
C. Various inputs may be used to determine the value of the fund’s investments. These inputs are summarized in three broad levels for financial statement purposes. The inputs or methodologies used to value securities are not necessarily an indication of the risk associated with investing in those securities.
16
Target Retirement Income Fund
Level 1—Quoted prices in active markets for identical securities.
Level 2—Other significant observable inputs (including quoted prices for similar securities, interest rates, prepayment speeds, credit risk, etc.).
Level 3—Significant unobservable inputs (including the fund’s own assumptions used to determine the fair value of investments).
At March 31, 2014, 100% of the market value of the fund’s investments was determined based on Level 1 inputs.
D. Distributions are determined on a tax basis and may differ from net investment income and realized capital gains for financial reporting purposes. Differences may be permanent or temporary. Permanent differences are reclassified among capital accounts in the financial statements to reflect their tax character. Temporary differences arise when certain items of income, expense, gain, or loss are recognized in different periods for financial statement and tax purposes. These differences will reverse at some time in the future. Differences in classification may also result from the treatment of short-term gains as ordinary income for tax purposes. The fund’s tax-basis capital gains and losses are determined only at the end of each fiscal year.
At March 31, 2014, the cost of investment securities for tax purposes was $9,602,656,000. Net unrealized appreciation of investment securities for tax purposes was $1,183,099,000, consisting of unrealized gains of $1,208,429,000 on securities that had risen in value since their purchase and $25,330,000 in unrealized losses on securities that had fallen in value since their purchase.
E. During the six months ended March 31, 2014, the fund purchased $731,731,000 of investment securities and sold $437,706,000 of investment securities, other than temporary cash investments.
F. Capital shares issued and redeemed were:
| Six Months Ended | Year Ended | |
| March 31, 2014 | September 30, 2013 | |
| Shares | Shares | |
| (000) | (000) | |
| Issued | 126,932 | 243,245 |
| Issued in Lieu of Cash Distributions | 19,631 | 17,060 |
| Redeemed | (110,285) | (211,747) |
| Net Increase (Decrease) in Shares Outstanding | 36,278 | 48,558 |
G. Management has determined that no material events or transactions occurred subsequent to March 31, 2014, that would require recognition or disclosure in these financial statements.
17
Target Retirement 2010 Fund
Fund Profile
As of March 31, 2014
| Total Fund Characteristics | |
| Ticker Symbol | VTENX |
| 30-Day SEC Yield | 1.80% |
| Acquired Fund Fees and Expenses1 | 0.16% |
| Allocation to Underlying Vanguard Funds | |
| Vanguard Total Bond Market II Index Fund | |
| Investor Shares | 36.0% |
| Vanguard Total Stock Market Index Fund | |
| Investor Shares | 27.2 |
| Vanguard Short-Term Inflation Protected | |
| Securities Index Fund Investor Shares | 12.9 |
| Vanguard Total International Bond Index | |
| Fund Investor Shares | 12.1 |
| Vanguard Total International Stock Index | |
| Fund Investor Shares | 11.8 |
| Total Fund Volatility Measures | ||
| Target 2010 | MSCI US | |
| Composite | Broad Market | |
| Index | Index | |
| R-Squared | 1.00 | 0.87 |
| Beta | 0.98 | 0.44 |
| These measures show the degree and timing of the fund’s fluctuations compared with the indexes over 36 months. | ||
Fund Asset Allocation
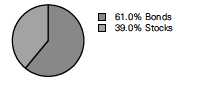
1 This figure—drawn from the prospectus dated January 27, 2014—represents an estimate of the weighted average of the expense ratios and any
transaction fees charged by the underlying mutual funds (the ”acquired” funds) in which the Target Retirement 2010 Fund invests. The fund does not
charge any expenses or fees of its own. For the six months ended March 31, 2014, the annualized acquired fund fees and expenses were 0.17%.
18
Target Retirement 2010 Fund
Performance Summary
All of the returns in this report represent past performance, which is not a guarantee of future results that may be achieved by the fund. (Current performance may be lower or higher than the performance data cited. For performance data current to the most recent month-end, visit our website at vanguard.com/performance.) Note, too, that both investment returns and principal value can fluctuate widely, so an investor’s shares, when sold, could be worth more or less than their original cost. The returns shown do not reflect taxes that a shareholder would pay on fund distributions or on the sale of fund shares.
Fiscal-Year Total Returns (%): June 7, 2006, Through March 31, 2014
Note: For 2014, performance data reflect the six months ended March 31, 2014.
| Average Annual Total Returns: Periods Ended March 31, 2014 | ||||||
| Since Inception | ||||||
| Inception Date | One Year | Five Years | Income | Capital | Total | |
| Target Retirement 2010 | ||||||
| Fund | 6/7/2006 | 7.15% | 12.12% | 2.37% | 3.65% | 6.02% |
See Financial Highlights for dividend and capital gains information.
19
Target Retirement 2010 Fund
Financial Statements (unaudited)
Statement of Net Assets
As of March 31, 2014
The fund reports a complete list of its holdings in regulatory filings four times in each fiscal year, at the quarter-ends. For the second and fourth fiscal quarters, the lists appear in the fund’s semiannual and annual reports to shareholders. For the first and third fiscal quarters, the fund files the lists with the Securities and Exchange Commission on Form N-Q. Shareholders can look up the fund’s Forms N-Q on the SEC’s website at sec.gov. Forms N-Q may also be reviewed and copied at the SEC’s Public Reference Room (see the back cover of this report for further information).
| Market | ||
| Value | ||
| Shares | ($000) | |
| Investment Companies (100.2%) | ||
| U.S. Stock Fund (27.2%) | ||
| Vanguard Total Stock Market Index Fund Investor Shares | 39,473,016 | 1,871,416 |
| International Stock Fund (11.9%) | ||
| Vanguard Total International Stock Index Fund Investor Shares | 48,631,029 | 815,056 |
| U.S. Bond Funds (49.0%) | ||
| 1 Vanguard Total Bond Market II Index Fund Investor Shares | 233,346,137 | 2,482,803 |
| Vanguard Short-Term Inflation-Protected Securities Index Fund Investor Shares | 35,850,824 | 886,232 |
| 3,369,035 | ||
| International Bond Fund (12.1%) | ||
| Vanguard Total International Bond Index Fund Investor Shares | 82,759,293 | 835,041 |
| Total Investment Companies (Cost $5,942,151) | 6,890,548 | |
| Temporary Cash Investment (0.0%) | ||
| Money Market Fund (0.0%) | ||
| 1 Vanguard Market Liquidity Fund, 0.122% (Cost $1,397) | 1,397,000 | 1,397 |
| Total Investments (100.2%) (Cost $5,943,548) | 6,891,945 | |
| Other Assets and Liabilities (-0.2%) | ||
| Other Assets | 36,627 | |
| Liabilities | (48,084) | |
| (11,457) | ||
| Net Assets (100%) | ||
| Applicable to 264,341,646 outstanding $.001 par value shares of | ||
| beneficial interest (unlimited authorization) | 6,880,488 | |
| Net Asset Value Per Share | $26.03 | |
20
Target Retirement 2010 Fund
| At March 31, 2014, net assets consisted of: | |
| Amount | |
| ($000) | |
| Paid-in Capital | 5,850,126 |
| Undistributed Net Investment Income | 29,841 |
| Accumulated Net Realized Gains | 52,124 |
| Unrealized Appreciation (Depreciation) | 948,397 |
| Net Assets | 6,880,488 |
See Note A in Notes to Financial Statements.
1 Affiliated fund available only to Vanguard funds and certain trusts and accounts managed by Vanguard. Rate shown for Vanguard Market
Liquidity Fund is the 7-day yield.
See accompanying Notes, which are an integral part of the Financial Statements.
21
| Target Retirement 2010 Fund | |
| Statement of Operations | |
| Six Months Ended | |
| March 31, 2014 | |
| ($000) | |
| Investment Income | |
| Income | |
| Income Distributions Received | 63,262 |
| Net Investment Income—Note B | 63,262 |
| Realized Net Gain (Loss) | |
| Capital Gain Distributions Received | 1,146 |
| Investment Securities Sold | 58,114 |
| Realized Net Gain (Loss) | 59,260 |
| Change in Unrealized Appreciation (Depreciation) of Investment Securities | 206,561 |
| Net Increase (Decrease) in Net Assets Resulting from Operations | 329,083 |
See accompanying Notes, which are an integral part of the Financial Statements.
22
| Target Retirement 2010 Fund | ||
| Statement of Changes in Net Assets | ||
| Six Months Ended | Year Ended | |
| March 31, | September 30, | |
| 2014 | 2013 | |
| ($000) | ($000) | |
| Increase (Decrease) in Net Assets | ||
| Operations | ||
| Net Investment Income | 63,262 | 138,234 |
| Realized Net Gain (Loss) | 59,260 | 149,071 |
| Change in Unrealized Appreciation (Depreciation) | 206,561 | 145,289 |
| Net Increase (Decrease) in Net Assets Resulting from Operations | 329,083 | 432,594 |
| Distributions | ||
| Net Investment Income | (109,648) | (138,503) |
| Realized Capital Gain1 | (78,208) | (9,651) |
| Total Distributions | (187,856) | (148,154) |
| Capital Share Transactions | ||
| Issued | 993,769 | 2,006,950 |
| Issued in Lieu of Cash Distributions | 184,495 | 145,950 |
| Redeemed | (1,118,089) | (1,913,559) |
| Net Increase (Decrease) from Capital Share Transactions | 60,175 | 239,341 |
| Total Increase (Decrease) | 201,402 | 523,781 |
| Net Assets | ||
| Beginning of Period | 6,679,086 | 6,155,305 |
| End of Period2 | 6,880,488 | 6,679,086 |
1 Includes fiscal 2014 and 2013 short-term gain distributions totaling $520,000 and $9,651,000 respectively. Short-term gain distributions are
treated as ordinary income dividends for tax purposes.
2 Net Assets—End of Period includes undistributed net investment income of $29,841,000 and $76,227,000.
See accompanying Notes, which are an integral part of the Financial Statements.
23
| Target Retirement 2010 Fund | |||||||
| Financial Highlights | |||||||
| Six Months | |||||||
| Ended | |||||||
| For a Share Outstanding | March 31, | Year Ended September 30, | |||||
| Throughout Each Period | 2014 | 2013 | 2012 | 2011 | 2010 | 2009 | |
| Net Asset Value, Beginning of Period | $25.50 | $24.45 | $21.91 | $21.87 | $20.39 | $20.47 | |
| Investment Operations | |||||||
| Net Investment Income | . 244 | .516 | .571 | .5601 | .520 | .553 | |
| Capital Gain Distributions Received | .004 | .103 | .100 | .0561 | — | — | |
| Net Realized and Unrealized Gain (Loss) | |||||||
| on Investments | 1.005 | . 999 | 2.502 | (. 022) | 1.455 | . 046 | |
| Total from Investment Operations | 1.253 | 1.618 | 3.173 | . 594 | 1.975 | . 599 | |
| Distributions | |||||||
| Dividends from Net Investment Income | (. 422) | (. 531) | (. 596) | (. 511) | (. 495) | (. 679) | |
| Distributions from Realized Capital Gains | (. 301) | (. 037) | (. 037) | (. 043) | — | — | |
| Total Distributions | (.723) | (. 568) | (. 633) | (. 554) | (. 495) | (. 679) | |
| Net Asset Value, End of Period | $26.03 | $25.50 | $24.45 | $21.91 | $21.87 | $20.39 | |
| Total Return2 | 4.97% | 6.76% | 14.74% | 2.68% | 9.83% | 3.47% | |
| Ratios/Supplemental Data | |||||||
| Net Assets, End of Period (Millions) | $6,880 | $6,679 | $6,155 | $4,747 | $4,247 | $3,065 | |
| Ratio of Total Expenses to | |||||||
| Average Net Assets | — | — | — | — | — | — | |
| Acquired Fund Fees and Expenses | 0.17% | 0.16% | 0.16% | 0.17% | 0.17% | 0.21% | |
| Ratio of Net Investment Income to | |||||||
| Average Net Assets | 1.86% | 2.08% | 2.51% | 2.46% | 2.67% | 3.15% | |
| Portfolio Turnover Rate | 15% | 38% | 12% | 27%3 | 19% | 41%4 | |
The expense ratio, acquired fund fees and expenses, net income ratio, and turnover rate for the current period have been annualized.
1 Calculated based on average shares outstanding.
2 Total returns do not include account service fees that may have applied in the periods shown. Fund prospectuses provide information about
any applicable account service fees.
3 Excludes the value of mutual fund shares delivered and received in connection with a change in the fund’s international equity investments
from Vanguard European, Pacific, and Emerging Markets Stock Index Funds to Vanguard Total International Stock Index Fund because those
transactions were effected in kind and did not cause the fund to incur transaction costs.
4 Excludes the value of mutual fund shares delivered and received in connection with a change in the fund’s bond investments from Vanguard
Total Bond Market Index Fund to Vanguard Total Bond Market II Index Fund because those transactions were effected in kind and did not
cause the fund to incur transaction costs.
See accompanying Notes, which are an integral part of the Financial Statements.
24
Target Retirement 2010 Fund
Notes to Financial Statements
Vanguard Target Retirement 2010 Fund is registered under the Investment Company Act of 1940 as an open-end investment company, or mutual fund. The fund follows a balanced investment strategy by investing in selected Vanguard funds to achieve its targeted allocation of assets to U.S. stocks, international stocks, U.S. bonds, and international bonds. Financial statements and other information about each underlying fund are available on vanguard.com.
A. The following significant accounting policies conform to generally accepted accounting principles for U.S. mutual funds. The fund consistently follows such policies in preparing its financial statements.
1. Security Valuation: Investments are valued at the net asset value of each underlying Vanguard fund determined as of the close of the New York Stock Exchange (generally 4 p.m., Eastern time) on the valuation date.
2. Federal Income Taxes: The fund intends to continue to qualify as a regulated investment company and distribute all of its taxable income. Management has analyzed the fund’s tax positions taken for all open federal income tax years (September 30, 2010–2013), and for the period ended March 31, 2014, and has concluded that no provision for federal income tax is required in the fund’s financial statements.
3. Distributions: Distributions to shareholders are recorded on the ex-dividend date.
4. Credit Facility: The fund and certain other funds managed by The Vanguard Group participate in a $2.89 billion committed credit facility provided by a syndicate of lenders pursuant to a credit agreement which may be renewed annually; each fund is individually liable for its borrowings, if any, under the credit facility. Borrowings may be utilized for temporary and emergency purposes, and are subject to the fund’s regulatory and contractual borrowing restrictions. The participating funds are charged administrative fees and an annual commitment fee of 0.06% of the undrawn amount of the facility, which are allocated to the funds in accordance with a methodology approved by the board of trustees and borne by the funds in which the fund invests (See Note B). Any borrowings under this facility bear interest at a rate equal to the higher of the Federal Funds Rate or LIBOR Reference Rate plus an agreed-upon spread.
The fund had no borrowings outstanding at March 31, 2014, or at any time during the period then ended.
5. Other: Income and capital gain distributions received are recorded on the ex-dividend date. Security transactions are accounted for on the date securities are bought or sold. Costs used to determine realized gains (losses) on the sale of investment securities are those of the specific securities sold.
B. Under a service agreement, The Vanguard Group furnishes investment advisory, corporate management, administrative, marketing, and distribution services to the fund. The service agreement provides that the fund’s expenses may be reduced or eliminated to the extent of savings realized by the Vanguard funds by the operation of the fund. Accordingly, all incremental expenses for services provided by Vanguard and all other expenses incurred by the fund during the period ended March 31, 2014, were borne by the funds in which the fund invests. The fund’s trustees and officers are also directors and officers of Vanguard and the funds in which the fund invests.
C. Various inputs may be used to determine the value of the fund’s investments. These inputs are summarized in three broad levels for financial statement purposes. The inputs or methodologies used to value securities are not necessarily an indication of the risk associated with investing in those securities.
25
Target Retirement 2010 Fund
Level 1—Quoted prices in active markets for identical securities.
Level 2—Other significant observable inputs (including quoted prices for similar securities, interest rates, prepayment speeds, credit risk, etc.).
Level 3—Significant unobservable inputs (including the fund’s own assumptions used to determine the fair value of investments).
At March 31, 2014, 100% of the market value of the fund’s investments was determined based on Level 1 inputs.
D. Distributions are determined on a tax basis and may differ from net investment income and realized capital gains for financial reporting purposes. Differences may be permanent or temporary. Permanent differences are reclassified among capital accounts in the financial statements to reflect their tax character. Temporary differences arise when certain items of income, expense, gain, or loss are recognized in different periods for financial statement and tax purposes. These differences will reverse at some time in the future. Differences in classification may also result from the treatment of short-term gains as ordinary income for tax purposes. The fund’s tax-basis capital gains and losses are determined only at the end of each fiscal year.
At March 31, 2014, the cost of investment securities for tax purposes was $5,943,548,000. Net unrealized appreciation of investment securities for tax purposes was $948,397,000, consisting of unrealized gains of $960,729,000 on securities that had risen in value since their purchase and $12,332,000 in unrealized losses on securities that had fallen in value since their purchase.
E. During the six months ended March 31, 2014, the fund purchased $504,716,000 of investment securities and sold $559,867,000 of investment securities, other than temporary cash investments.
F. Capital shares issued and redeemed were:
| Six Months Ended | Year Ended | |
| March 31, 2014 | September 30, 2013 | |
| Shares | Shares | |
| (000) | (000) | |
| Issued | 38,514 | 81,038 |
| Issued in Lieu of Cash Distributions | 7,224 | 6,076 |
| Redeemed | (43,298) | (76,925) |
| Net Increase (Decrease) in Shares Outstanding | 2,440 | 10,189 |
G. Management has determined that no material events or transactions occurred subsequent to March 31, 2014, that would require recognition or disclosure in these financial statements.
26
Target Retirement 2015 Fund
Fund Profile
As of March 31, 2014
| Total Fund Characteristics | |
| Ticker Symbol | VTXVX |
| 30-Day SEC Yield | 1.96% |
| Acquired Fund Fees and Expenses1 | 0.16% |
| Allocation to Underlying Vanguard Funds | |
| Vanguard Total Stock Market Index Fund | |
| Investor Shares | 36.7% |
| Vanguard Total Bond Market II Index Fund | |
| Investor Shares | 31.7 |
| Vanguard Total International Stock Index | |
| Fund Investor Shares | 15.8 |
| Vanguard Total International Bond Index | |
| Fund Investor Shares | 9.5 |
| Vanguard Short-Term Inflation Protected | |
| Securities Index Fund Investor Shares | 6.3 |
| Total Fund Volatility Measures | ||
| Target 2015 | MSCI US | |
| Composite | Broad Market | |
| Index | Index | |
| R-Squared | 1.00 | 0.93 |
| Beta | 0.99 | 0.56 |
| These measures show the degree and timing of the fund’s fluctuations compared with the indexes over 36 months. | ||
Fund Asset Allocation
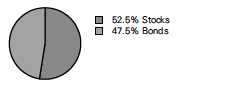
1 This figure—drawn from the prospectus dated January 27, 2014—represents an estimate of the weighted average of the expense ratios and any
transaction fees charged by the underlying mutual funds (the ”acquired” funds) in which the Target Retirement 2015 Fund invests. The fund does not
charge any expenses or fees of its own. For the six months ended March 31, 2014, the annualized acquired fund fees and expenses were 0.17%.
27
Target Retirement 2015 Fund
Performance Summary
All of the returns in this report represent past performance, which is not a guarantee of future results that may be achieved by the fund. (Current performance may be lower or higher than the performance data cited. For performance data current to the most recent month-end, visit our website at vanguard.com/performance.) Note, too, that both investment returns and principal value can fluctuate widely, so an investor’s shares, when sold, could be worth more or less than their original cost. The returns shown do not reflect taxes that a shareholder would pay on fund distributions or on the sale of fund shares.
Fiscal-Year Total Returns (%): October 27, 2003, Through March 31, 2014
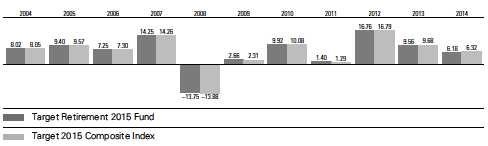
Note: For 2014, performance data reflect the six months ended March 31, 2014.
| Average Annual Total Returns: Periods Ended March 31, 2014 | ||||||
| Ten Years | ||||||
| Inception Date | One Year | Five Years | Income | Capital | Total | |
| Target Retirement 2015 | ||||||
| Fund | 10/27/2003 | 9.89% | 13.70% | 2.51% | 3.55% | 6.06% |
See Financial Highlights for dividend and capital gains information.
28
Target Retirement 2015 Fund
Financial Statements (unaudited)
Statement of Net Assets
As of March 31, 2014
The fund reports a complete list of its holdings in regulatory filings four times in each fiscal year, at the quarter-ends. For the second and fourth fiscal quarters, the lists appear in the fund’s semiannual and annual reports to shareholders. For the first and third fiscal quarters, the fund files the lists with the Securities and Exchange Commission on Form N-Q. Shareholders can look up the fund’s Forms N-Q on the SEC’s website at sec.gov. Forms N-Q may also be reviewed and copied at the SEC’s Public Reference Room (see the back cover of this report for further information).
| Market | ||
| Value | ||
| Shares | ($000) | |
| Investment Companies (99.9%) | ||
| U.S. Stock Fund (36.6%) | ||
| Vanguard Total Stock Market Index Fund Investor Shares | 164,124,850 | 7,781,159 |
| International Stock Fund (15.8%) | ||
| Vanguard Total International Stock Index Fund Investor Shares | 200,361,490 | 3,358,059 |
| U.S. Bond Funds (38.0%) | ||
| 1 Vanguard Total Bond Market II Index Fund Investor Shares | 632,324,406 | 6,727,932 |
| Vanguard Short-Term Inflation-Protected Securities Index Fund Investor Shares | 54,275,790 | 1,341,697 |
| 8,069,629 | ||
| International Bond Fund (9.5%) | ||
| Vanguard Total International Bond Index Fund Investor Shares | 199,302,377 | 2,010,961 |
| Total Investment Companies (Cost $17,287,565) | 21,219,808 | |
| Other Assets and Liabilities (0.1%) | ||
| Other Assets | 245,572 | |
| Liabilities | (230,971) | |
| 14,601 | ||
| Net Assets (100%) | ||
| Applicable to 1,412,529,707 outstanding $.001 par value shares of | ||
| beneficial interest (unlimited authorization) | 21,234,409 | |
| Net Asset Value Per Share | $15.03 | |
| At March 31, 2014, net assets consisted of: | ||
| Amount | ||
| ($000) | ||
| Paid-in Capital | 17,098,552 | |
| Undistributed Net Investment Income | 98,871 | |
| Accumulated Net Realized Gains | 104,743 | |
| Unrealized Appreciation (Depreciation) | 3,932,243 | |
| Net Assets | 21,234,409 | |
See Note A in Notes to Financial Statements.
1 Affiliated fund available only to Vanguard funds and certain trusts and accounts managed by Vanguard.
See accompanying Notes, which are an integral part of the Financial Statements.
29
| Target Retirement 2015 Fund | |
| Statement of Operations | |
| Six Months Ended | |
| March 31, 2014 | |
| ($000) | |
| Investment Income | |
| Income | |
| Income Distributions Received | 209,574 |
| Net Investment Income—Note B | 209,574 |
| Realized Net Gain (Loss) | |
| Capital Gain Distributions Received | 3,100 |
| Investment Securities Sold | 109,680 |
| Realized Net Gain (Loss) | 112,780 |
| Change in Unrealized Appreciation (Depreciation) of Investment Securities | 908,758 |
| Net Increase (Decrease) in Net Assets Resulting from Operations | 1,231,112 |
See accompanying Notes, which are an integral part of the Financial Statements.
30
| Target Retirement 2015 Fund | ||
| Statement of Changes in Net Assets | ||
| Six Months Ended | Year Ended | |
| March 31, | September 30, | |
| 2014 | 2013 | |
| ($000) | ($000) | |
| Increase (Decrease) in Net Assets | ||
| Operations | ||
| Net Investment Income | 209,574 | 408,230 |
| Realized Net Gain (Loss) | 112,780 | 204,972 |
| Change in Unrealized Appreciation (Depreciation) | 908,758 | 1,107,450 |
| Net Increase (Decrease) in Net Assets Resulting from Operations | 1,231,112 | 1,720,652 |
| Distributions | ||
| Net Investment Income | (357,912) | (384,520) |
| Realized Capital Gain1 | (119,304) | (23,226) |
| Total Distributions | (477,216) | (407,746) |
| Capital Share Transactions | ||
| Issued | 2,856,828 | 5,113,964 |
| Issued in Lieu of Cash Distributions | 470,363 | 403,269 |
| Redeemed | (2,586,002) | (3,929,112) |
| Net Increase (Decrease) from Capital Share Transactions | 741,189 | 1,588,121 |
| Total Increase (Decrease) | 1,495,085 | 2,901,027 |
| Net Assets | ||
| Beginning of Period | 19,739,324 | 16,838,297 |
| End of Period2 | 21,234,409 | 19,739,324 |
1 Includes fiscal 2014 and 2013 short-term gain distributions totaling $2,743,000 and $23,226,000, respectively. Short-term gain distributions
are treated as ordinary income dividends for tax purposes.
2 Net Assets—End of Period includes undistributed net investment income of $98,871,000 and $247,209,000.
See accompanying Notes, which are an integral part of the Financial Statements.
31
| Target Retirement 2015 Fund | |||||||
| Financial Highlights | |||||||
| Six Months | |||||||
| Ended | |||||||
| For a Share Outstanding | March 31, | Year Ended September 30, | |||||
| Throughout Each Period | 2014 | 2013 | 2012 | 2011 | 2010 | 2009 | |
| Net Asset Value, Beginning of Period | $14.49 | $13.54 | $11.91 | $12.03 | $11.21 | $11.34 | |
| Investment Operations | |||||||
| Net Investment Income | .149 | . 298 | . 327 | . 2831 | .285 | .307 | |
| Capital Gain Distributions Received | .002 | .039 | .053 | .0311 | — | — | |
| Net Realized and Unrealized Gain (Loss) | |||||||
| on Investments | .737 | . 929 | 1.583 | (.134) | . 811 | (. 072) | |
| Total from Investment Operations | . 888 | 1.266 | 1.963 | .180 | 1.096 | . 235 | |
| Distributions | |||||||
| Dividends from Net Investment Income | (. 261) | (. 298) | (. 313) | (. 276) | (. 276) | (. 365) | |
| Distributions from Realized Capital Gains | (.087) | (.018) | (.020) | (.024) | — | — | |
| Total Distributions | (. 348) | (. 316) | (. 333) | (. 300) | (. 276) | (. 365) | |
| Net Asset Value, End of Period | $15.03 | $14.49 | $13.54 | $11.91 | $12.03 | $11.21 | |
| Total Return2 | 6.18% | 9.56% | 16.76% | 1.40% | 9.92% | 2.66% | |
| Ratios/Supplemental Data | |||||||
| Net Assets, End of Period (Millions) $21,234 | $19,739 | $16,838 | $13,435 | $12,466 | $9,507 | ||
| Ratio of Total Expenses to | |||||||
| Average Net Assets | — | — | — | — | — | — | |
| Acquired Fund Fees and Expenses | 0.17% | 0.16% | 0.16% | 0.17% | 0.17% | 0.21% | |
| Ratio of Net Investment Income to | |||||||
| Average Net Assets | 2.03% | 2.17% | 2.59% | 2.24% | 2.62% | 3.31% | |
| Portfolio Turnover Rate | 12% | 26% | 13% | 27%3 | 19% | 37%4 | |
The expense ratio, acquired fund fees and expenses, net income ratio, and turnover rate for the current period have been annualized.
1 Calculated based on average shares outstanding.
2 Total returns do not include account service fees that may have applied in the periods shown. Fund prospectuses provide information about
any applicable account service fees.
3 Excludes the value of mutual fund shares delivered and received in connection with a change in the fund’s international equity investments
from Vanguard European, Pacific, and Emerging Markets Stock Index Funds to Vanguard Total International Stock Index Fund because those
transactions were effected in kind and did not cause the fund to incur transaction costs.
4 Excludes the value of mutual fund shares delivered and received in connection with a change in the fund’s bond investments from Vanguard
Total Bond Market Index Fund to Vanguard Total Bond Market II Index Fund because those transactions were effected in kind and did not
cause the fund to incur transaction costs.
See accompanying Notes, which are an integral part of the Financial Statements.
32
Target Retirement 2015 Fund
Notes to Financial Statements
Vanguard Target Retirement 2015 Fund is registered under the Investment Company Act of 1940 as an open-end investment company, or mutual fund. The fund follows a balanced investment strategy by investing in selected Vanguard funds to achieve its targeted allocation of assets to U.S. stocks, international stocks, U.S. bonds, and international bonds. Financial statements and other information about each underlying fund are available on vanguard.com.
A. The following significant accounting policies conform to generally accepted accounting principles for U.S. mutual funds. The fund consistently follows such policies in preparing its financial statements.
1. Security Valuation: Investments are valued at the net asset value of each underlying Vanguard fund determined as of the close of the New York Stock Exchange (generally 4 p.m., Eastern time) on the valuation date.
2. Federal Income Taxes: The fund intends to continue to qualify as a regulated investment company and distribute all of its taxable income. Management has analyzed the fund’s tax positions taken for all open federal income tax years (September 30, 2010–2013), and for the period ended March 31, 2014, and has concluded that no provision for federal income tax is required in the fund’s financial statements.
3. Distributions: Distributions to shareholders are recorded on the ex-dividend date.
4. Credit Facility: The fund and certain other funds managed by The Vanguard Group participate in a $2.89 billion committed credit facility provided by a syndicate of lenders pursuant to a credit agreement which may be renewed annually; each fund is individually liable for its borrowings, if any, under the credit facility. Borrowings may be utilized for temporary and emergency purposes, and are subject to the fund’s regulatory and contractual borrowing restrictions. The participating funds are charged administrative fees and an annual commitment fee of 0.06% of the undrawn amount of the facility, which are allocated to the funds in accordance with a methodology approved by the board of trustees and borne by the funds in which the fund invests (See Note B). Any borrowings under this facility bear interest at a rate equal to the higher of the Federal Funds Rate or LIBOR Reference Rate plus an agreed-upon spread.
The fund had no borrowings outstanding at March 31, 2014, or at any time during the period then ended.
5. Other: Income and capital gain distributions received are recorded on the ex-dividend date. Security transactions are accounted for on the date securities are bought or sold. Costs used to determine realized gains (losses) on the sale of investment securities are those of the specific securities sold.
B. Under a service agreement, The Vanguard Group furnishes investment advisory, corporate management, administrative, marketing, and distribution services to the fund. The service agreement provides that the fund’s expenses may be reduced or eliminated to the extent of savings realized by the Vanguard funds by the operation of the fund. Accordingly, all incremental expenses for services provided by Vanguard and all other expenses incurred by the fund during the period ended March 31, 2014, were borne by the funds in which the fund invests. The fund’s trustees and officers are also directors and officers of Vanguard and the funds in which the fund invests.
C. Various inputs may be used to determine the value of the fund’s investments. These inputs are summarized in three broad levels for financial statement purposes. The inputs or methodologies used to value securities are not necessarily an indication of the risk associated with investing in those securities.
33
Target Retirement 2015 Fund
Level 1—Quoted prices in active markets for identical securities.
Level 2—Other significant observable inputs (including quoted prices for similar securities, interest rates, prepayment speeds, credit risk, etc.).
Level 3—Significant unobservable inputs (including the fund’s own assumptions used to determine the fair value of investments).
At March 31, 2014, 100% of the market value of the fund’s investments was determined based on Level 1 inputs.
D. Distributions are determined on a tax basis and may differ from net investment income and realized capital gains for financial reporting purposes. Differences may be permanent or temporary. Permanent differences are reclassified among capital accounts in the financial statements to reflect their tax character. Temporary differences arise when certain items of income, expense, gain, or loss are recognized in different periods for financial statement and tax purposes. These differences will reverse at some time in the future. Differences in classification may also result from the treatment of short-term gains as ordinary income for tax purposes. The fund’s tax-basis capital gains and losses are determined only at the end of each fiscal year.
At March 31, 2014, the cost of investment securities for tax purposes was $17,287,565,000. Net unrealized appreciation of investment securities for tax purposes was $3,932,243,000, consisting of unrealized gains of $3,955,128,000 on securities that had risen in value since their purchase and $22,885,000 in unrealized losses on securities that had fallen in value since their purchase.
E. During the six months ended March 31, 2014, the fund purchased $1,687,902,000 of investment securities and sold $1,227,777,000 of investment securities, other than temporary cash investments.
F. Capital shares issued and redeemed were:
| Six Months Ended | Year Ended | |
| March 31, 2014 | September 30, 2013 | |
| Shares | Shares | |
| (000) | (000) | |
| Issued | 192,942 | 368,573 |
| Issued in Lieu of Cash Distributions | 31,932 | 30,344 |
| Redeemed | (174,301) | (280,939) |
| Net Increase (Decrease) in Shares Outstanding | 50,573 | 117,978 |
G. Management has determined that no material events or transactions occurred subsequent to March 31, 2014, that would require recognition or disclosure in these financial statements.
34
Target Retirement 2020 Fund
Fund Profile
As of March 31, 2014
| Total Fund Characteristics | |
| Ticker Symbol | VTWNX |
| 30-Day SEC Yield | 2.09% |
| Acquired Fund Fees and Expenses1 | 0.16% |
| Allocation to Underlying Vanguard Funds | |
| Vanguard Total Stock Market Index Fund | |
| Investor Shares | 43.3% |
| Vanguard Total Bond Market II Index Fund | |
| Investor Shares | 30.5 |
| Vanguard Total International Stock Index | |
| Fund Investor Shares | 18.6 |
| Vanguard Total International Bond Index | |
| Fund Investor Shares | 7.6 |
| Total Fund Volatility Measures | ||
| Target 2020 | MSCI US | |
| Composite | Broad Market | |
| Index | Index | |
| R-Squared | 1.00 | 0.95 |
| Beta | 0.99 | 0.65 |
| These measures show the degree and timing of the fund’s fluctuations compared with the indexes over 36 months. | ||
Fund Asset Allocation

1 This figure—drawn from the prospectus dated January 27, 2014—represents an estimate of the weighted average of the expense ratios and any
transaction fees charged by the underlying mutual funds (the ”acquired” funds) in which the Target Retirement 2020 Fund invests. The fund does not
charge any expenses or fees of its own. For the six months ended March 31, 2014, the annualized acquired fund fees and expenses were 0.17%.
35
Target Retirement 2020 Fund
Performance Summary
All of the returns in this report represent past performance, which is not a guarantee of future results that may be achieved by the fund. (Current performance may be lower or higher than the performance data cited. For performance data current to the most recent month-end, visit our website at vanguard.com/performance.) Note, too, that both investment returns and principal value can fluctuate widely, so an investor’s shares, when sold, could be worth more or less than their original cost. The returns shown do not reflect taxes that a shareholder would pay on fund distributions or on the sale of fund shares.
Fiscal-Year Total Returns (%): June 7, 2006, Through March 31, 2014
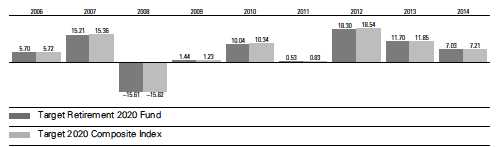
Note: For 2014, performance data reflect the six months ended March 31, 2014.
| Average Annual Total Returns: Periods Ended March 31, 2014 | ||||||
| Since Inception | ||||||
| Inception Date | One Year | Five Years | Income | Capital | Total | |
| Target Retirement 2020 | ||||||
| Fund | 6/7/2006 | 11.98% | 14.93% | 2.19% | 4.27% | 6.46% |
See Financial Highlights for dividend and capital gains information.
36
Target Retirement 2020 Fund
Financial Statements (unaudited)
Statement of Net Assets
As of March 31, 2014
The fund reports a complete list of its holdings in regulatory filings four times in each fiscal year, at the quarter-ends. For the second and fourth fiscal quarters, the lists appear in the fund’s semiannual and annual reports to shareholders. For the first and third fiscal quarters, the fund files the lists with the Securities and Exchange Commission on Form N-Q. Shareholders can look up the fund’s Forms N-Q on the SEC’s website at sec.gov. Forms N-Q may also be reviewed and copied at the SEC’s Public Reference Room (see the back cover of this report for further information).
| Market | ||
| Value | ||
| Shares | ($000) | |
| Investment Companies (99.9%) | ||
| U.S. Stock Fund (43.2%) | ||
| Vanguard Total Stock Market Index Fund Investor Shares | 231,260,083 | 10,964,041 |
| International Stock Fund (18.6%) | ||
| Vanguard Total International Stock Index Fund Investor Shares | 281,948,155 | 4,725,451 |
| U.S. Bond Fund (30.5%) | ||
| 1 Vanguard Total Bond Market II Index Fund Investor Shares | 728,024,815 | 7,746,184 |
| International Bond Fund (7.6%) | ||
| Vanguard Total International Bond Index Fund Investor Shares | 191,228,376 | 1,929,494 |
| Total Investment Companies (Cost $20,817,167) | 25,365,170 | |
| Temporary Cash Investment (0.0%) | ||
| Money Market Fund (0.0%) | ||
| 1 Vanguard Market Liquidity Fund, 0.122% (Cost $8,343) | 8,342,637 | 8,343 |
| Total Investments (99.9%) (Cost $20,825,510) | 25,373,513 | |
| Other Assets and Liabilities (0.1%) | ||
| Other Assets | 145,715 | |
| Liabilities | (129,260) | |
| 16,455 | ||
| Net Assets (100%) | ||
| Applicable to 919,960,968 outstanding $.001 par value shares of | ||
| beneficial interest (unlimited authorization) | 25,389,968 | |
| Net Asset Value Per Share | $27.60 | |
37
| Target Retirement 2020 Fund | |
| At March 31, 2014, net assets consisted of: | |
| Amount | |
| ($000) | |
| Paid-in Capital | 20,695,626 |
| Undistributed Net Investment Income | 125,044 |
| Accumulated Net Realized Gains | 21,295 |
| Unrealized Appreciation (Depreciation) | 4,548,003 |
| Net Assets | 25,389,968 |
See Note A in Notes to Financial Statements.
1 Affiliated fund available only to Vanguard funds and certain trusts and accounts managed by Vanguard. Rate shown for Vanguard Market
Liquidity Fund is the 7-day yield.
See accompanying Notes, which are an integral part of the Financial Statements.
38
| Target Retirement 2020 Fund | |
| Statement of Operations | |
| Six Months Ended | |
| March 31, 2014 | |
| ($000) | |
| Investment Income | |
| Income | |
| Income Distributions Received | 259,258 |
| Net Investment Income—Note B | 259,258 |
| Realized Net Gain (Loss) | |
| Capital Gain Distributions Received | 3,327 |
| Investment Securities Sold | 24,617 |
| Realized Net Gain (Loss) | 27,944 |
| Change in Unrealized Appreciation (Depreciation) of Investment Securities | 1,310,460 |
| Net Increase (Decrease) in Net Assets Resulting from Operations | 1,597,662 |
See accompanying Notes, which are an integral part of the Financial Statements.
39
| Target Retirement 2020 Fund | ||
| Statement of Changes in Net Assets | ||
| Six Months Ended | Year Ended | |
| March 31, | September 30, | |
| 2014 | 2013 | |
| ($000) | ($000) | |
| Increase (Decrease) in Net Assets | ||
| Operations | ||
| Net Investment Income | 259,258 | 434,879 |
| Realized Net Gain (Loss) | 27,944 | 73,607 |
| Change in Unrealized Appreciation (Depreciation) | 1,310,460 | 1,631,720 |
| Net Increase (Decrease) in Net Assets Resulting from Operations | 1,597,662 | 2,140,206 |
| Distributions | ||
| Net Investment Income | (416,278) | (362,212) |
| Realized Capital Gain1 | (9,461) | (18,538) |
| Total Distributions | (425,739) | (380,750) |
| Capital Share Transactions | ||
| Issued | 4,565,872 | 7,050,481 |
| Issued in Lieu of Cash Distributions | 419,089 | 376,274 |
| Redeemed | (2,551,573) | (3,479,383) |
| Net Increase (Decrease) from Capital Share Transactions | 2,433,388 | 3,947,372 |
| Total Increase (Decrease) | 3,605,311 | 5,706,828 |
| Net Assets | ||
| Beginning of Period | 21,784,657 | 16,077,829 |
| End of Period2 | 25,389,968 | 21,784,657 |
1 Includes fiscal 2014 and 2013 short-term gain distributions totaling $3,440,000 and $18,538,000, respectively. Short-term gain distributions
are treated as ordinary income dividends for tax purposes.
2 Net Assets—End of Period includes undistributed net investment income of $125,044,000 and $282,064,000.
See accompanying Notes, which are an integral part of the Financial Statements.
40
| Target Retirement 2020 Fund | |||||||
| Financial Highlights | |||||||
| Six Months | |||||||
| Ended | |||||||
| For a Share Outstanding | March 31, | Year Ended September 30, | |||||
| Throughout Each Period | 2014 | 2013 | 2012 | 2011 | 2010 | 2009 | |
| Net Asset Value, Beginning of Period | $26.26 | $24.04 | $20.83 | $21.17 | $19.66 | $20.03 | |
| Investment Operations | |||||||
| Net Investment Income | . 280 | . 528 | . 569 | . 4731 | .5101 | .5391 | |
| Capital Gain Distributions Received | .004 | .047 | .079 | .0441 | — | — | |
| Net Realized and Unrealized Gain (Loss) | |||||||
| on Investments | 1.551 | 2.179 | 3.106 | (. 378) | 1.440 | (. 360) | |
| Total from Investment Operations | 1.835 | 2.754 | 3.754 | .139 | 1.950 | .179 | |
| Distributions | |||||||
| Dividends from Net Investment Income | (. 484) | (. 508) | (. 513) | (. 444) | (. 440) | (. 549) | |
| Distributions from Realized Capital Gains | (. 011) | (. 026) | (. 031) | (. 035) | — | — | |
| Total Distributions | (. 495) | (. 534) | (. 544) | (. 479) | (. 440) | (. 549) | |
| Net Asset Value, End of Period | $27.60 | $26.26 | $24.04 | $20.83 | $21.17 | $19.66 | |
| Total Return2 | 7.03% | 11.70% | 18.30% | 0.53% | 10.04% | 1.44% | |
| Ratios/Supplemental Data | |||||||
| Net Assets, End of Period (Millions) $25,390 | $21,785 | $16,078 | $11,032 | $8,890 | $5,706 | ||
| Ratio of Total Expenses to | |||||||
| Average Net Assets | — | — | — | — | — | — | |
| Acquired Fund Fees and Expenses | 0.17% | 0.16% | 0.16% | 0.17% | 0.17% | 0.21% | |
| Ratio of Net Investment Income to | |||||||
| Average Net Assets | 2.19% | 2.23% | 2.62% | 2.11% | 2.51% | 3.19% | |
| Portfolio Turnover Rate | 9% | 17% | 8% | 23%3 | 14% | 27%4 | |
The expense ratio, acquired fund fees and expenses, net income ratio, and turnover rate for the current period have been annualized.
1 Calculated based on average shares outstanding.
2 Total returns do not include account service fees that may have applied in the periods shown. Fund prospectuses provide information about
any applicable account service fees.
3 Excludes the value of mutual fund shares delivered and received in connection with a change in the fund’s international equity investments
from Vanguard European, Pacific, and Emerging Markets Stock Index Funds to Vanguard Total International Stock Index Fund because those
transactions were effected in kind and did not cause the fund to incur transaction costs.
4 Excludes the value of mutual fund shares delivered and received in connection with a change in the fund’s bond investments from Vanguard
Total Bond Market Index Fund to Vanguard Total Bond Market II Index Fund because those transactions were effected in kind and did not
cause the fund to incur transaction costs.
See accompanying Notes, which are an integral part of the Financial Statements.
41
Target Retirement 2020 Fund
Notes to Financial Statements
Vanguard Target Retirement 2020 Fund is registered under the Investment Company Act of 1940 as an open-end investment company, or mutual fund. The fund follows a balanced investment strategy by investing in selected Vanguard funds to achieve its targeted allocation of assets to U.S. stocks, international stocks, U.S. bonds, and international bonds. Financial statements and other information about each underlying fund are available on vanguard.com.
A. The following significant accounting policies conform to generally accepted accounting principles for U.S. mutual funds. The fund consistently follows such policies in preparing its financial statements.
1. Security Valuation: Investments are valued at the net asset value of each underlying Vanguard fund determined as of the close of the New York Stock Exchange (generally 4 p.m., Eastern time) on the valuation date.
2. Federal Income Taxes: The fund intends to continue to qualify as a regulated investment company and distribute all of its taxable income. Management has analyzed the fund’s tax positions taken for all open federal income tax years (September 30, 2010–2013), and for the period ended March 31, 2014, and has concluded that no provision for federal income tax is required in the fund’s financial statements.
3. Distributions: Distributions to shareholders are recorded on the ex-dividend date.
4. Credit Facility: The fund and certain other funds managed by The Vanguard Group participate in a $2.89 billion committed credit facility provided by a syndicate of lenders pursuant to a credit agreement which may be renewed annually; each fund is individually liable for its borrowings, if any, under the credit facility. Borrowings may be utilized for temporary and emergency purposes, and are subject to the fund’s regulatory and contractual borrowing restrictions. The participating funds are charged administrative fees and an annual commitment fee of 0.06% of the undrawn amount of the facility, which are allocated to the funds in accordance with a methodology approved by the board of trustees and borne by the funds in which the fund invests (See Note B). Any borrowings under this facility bear interest at a rate equal to the higher of the Federal Funds Rate or LIBOR Reference Rate plus an agreed-upon spread.
The fund had no borrowings outstanding at March 31, 2014, or at any time during the period then ended.
5. Other: Income and capital gain distributions received are recorded on the ex-dividend date. Security transactions are accounted for on the date securities are bought or sold. Costs used to determine realized gains (losses) on the sale of investment securities are those of the specific securities sold.
B. Under a service agreement, The Vanguard Group furnishes investment advisory, corporate management, administrative, marketing, and distribution services to the fund. The service agreement provides that the fund’s expenses may be reduced or eliminated to the extent of savings realized by the Vanguard funds by the operation of the fund. Accordingly, all incremental expenses for services provided by Vanguard and all other expenses incurred by the fund during the period ended March 31, 2014, were borne by the funds in which the fund invests. The fund’s trustees and officers are also directors and officers of Vanguard and the funds in which the fund invests.
C. Various inputs may be used to determine the value of the fund’s investments. These inputs are summarized in three broad levels for financial statement purposes. The inputs or methodologies used to value securities are not necessarily an indication of the risk associated with investing in those securities.
42
Target Retirement 2020 Fund
Level 1—Quoted prices in active markets for identical securities.
Level 2—Other significant observable inputs (including quoted prices for similar securities, interest rates, prepayment speeds, credit risk, etc.).
Level 3—Significant unobservable inputs (including the fund’s own assumptions used to determine the fair value of investments).
At March 31, 2014, 100% of the market value of the fund’s investments was determined based on Level 1 inputs.
D. Distributions are determined on a tax basis and may differ from net investment income and realized capital gains for financial reporting purposes. Differences may be permanent or temporary. Permanent differences are reclassified among capital accounts in the financial statements to reflect their tax character. Temporary differences arise when certain items of income, expense, gain, or loss are recognized in different periods for financial statement and tax purposes. These differences will reverse at some time in the future. Differences in classification may also result from the treatment of short-term gains as ordinary income for tax purposes. The fund’s tax-basis capital gains and losses are determined only at the end of each fiscal year.
At March 31, 2014, the cost of investment securities for tax purposes was $20,825,510,000. Net unrealized appreciation of investment securities for tax purposes was $4,548,003,000, consisting of unrealized gains of $4,561,649,000 on securities that had risen in value since their purchase and $13,646,000 in unrealized losses on securities that had fallen in value since their purchase.
E. During the six months ended March 31, 2014, the fund purchased $3,312,002,000 of investment securities and sold $1,064,465,000 of investment securities, other than temporary cash investments.
F. Capital shares issued and redeemed were:
| Six Months Ended | Year Ended | |
| March 31, 2014 | September 30, 2013 | |
| Shares | Shares | |
| (000) | (000) | |
| Issued | 168,835 | 283,506 |
| Issued in Lieu of Cash Distributions | 15,522 | 15,924 |
| Redeemed | (94,124) | (138,429) |
| Net Increase (Decrease) in Shares Outstanding | 90,233 | 161,001 |
G. Management has determined that no material events or transactions occurred subsequent to March 31, 2014, that would require recognition or disclosure in these financial statements.
43
Target Retirement 2025 Fund
Fund Profile
As of March 31, 2014
| Total Fund Characteristics | |
| Ticker Symbol | VTTVX |
| 30-Day SEC Yield | 2.09% |
| Acquired Fund Fees and Expenses1 | 0.17% |
| Allocation to Underlying Vanguard Funds | |
| Vanguard Total Stock Market Index Fund | |
| Investor Shares | 48.5% |
| Vanguard Total Bond Market II Index Fund | |
| Investor Shares | 24.6 |
| Vanguard Total International Stock Index | |
| Fund Investor Shares | 20.8 |
| Vanguard Total International Bond Index | |
| Fund Investor Shares | 6.1 |
| Total Fund Volatility Measures | ||
| Target 2025 | MSCI US | |
| Composite | Broad Market | |
| Index | Index | |
| R-Squared | 1.00 | 0.96 |
| Beta | 1.00 | 0.74 |
| These measures show the degree and timing of the fund’s fluctuations compared with the indexes over 36 months. | ||
Fund Asset Allocation
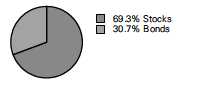
1 This figure—drawn from the prospectus dated January 27, 2014—represents an estimate of the weighted average of the expense ratios and any
transaction fees charged by the underlying mutual funds (the ”acquired” funds) in which the Target Retirement 2025 Fund invests. The fund does not
charge any expenses or fees of its own. For the six months ended March 31, 2014, the annualized acquired fund fees and expenses were 0.17%.
44
Target Retirement 2025 Fund
Performance Summary
All of the returns in this report represent past performance, which is not a guarantee of future results that may be achieved by the fund. (Current performance may be lower or higher than the performance data cited. For performance data current to the most recent month-end, visit our website at vanguard.com/performance.) Note, too, that both investment returns and principal value can fluctuate widely, so an investor’s shares, when sold, could be worth more or less than their original cost. The returns shown do not reflect taxes that a shareholder would pay on fund distributions or on the sale of fund shares.
Fiscal-Year Total Returns (%): October 27, 2003, Through March 31, 2014
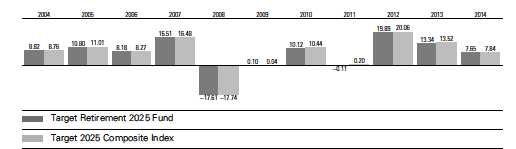
For a benchmark description, see the Glossary.
Note: For 2014, performance data reflect the six months ended March 31, 2014.
Average Annual Total Returns: Periods Ended March 31, 2014
| Ten Years | ||||||
| Inception Date | One Year | Five Years | Income | Capital | Total | |
| Target Retirement 2025 | ||||||
| Fund | 10/27/2003 | 13.40% | 16.06% | 2.31% | 4.07% | 6.38% |
See Financial Highlights for dividend and capital gains information.
45
Target Retirement 2025 Fund
Financial Statements (unaudited)
Statement of Net Assets
As of March 31, 2014
The fund reports a complete list of its holdings in regulatory filings four times in each fiscal year, at the quarter-ends. For the second and fourth fiscal quarters, the lists appear in the fund’s semiannual and annual reports to shareholders. For the first and third fiscal quarters, the fund files the lists with the Securities and Exchange Commission on Form N-Q. Shareholders can look up the fund’s Forms N-Q on the SEC’s website at sec.gov. Forms N-Q may also be reviewed and copied at the SEC’s Public Reference Room (see the back cover of this report for further information).
| Market | ||
| Value | ||
| Shares | ($000) | |
| Investment Companies (99.9%) | ||
| U.S. Stock Fund (48.4%) | ||
| Vanguard Total Stock Market Index Fund Investor Shares | 300,250,911 | 14,234,896 |
| International Stock Fund (20.8%) | ||
| Vanguard Total International Stock Index Fund Investor Shares | 365,555,026 | 6,126,702 |
| U.S. Bond Fund (24.6%) | ||
| 1 Vanguard Total Bond Market II Index Fund Investor Shares | 679,087,186 | 7,225,488 |
| International Bond Fund (6.1%) | ||
| Vanguard Total International Bond Index Fund Investor Shares | 178,373,208 | 1,799,786 |
| Total Investment Companies (Cost $23,112,127) | 29,386,872 | |
| Temporary Cash Investment (0.0%) | ||
| Money Market Fund (0.0%) | ||
| 1 Vanguard Market Liquidity Fund, 0.122% (Cost $1,317) | 1,317,000 | 1,317 |
| Total Investments (99.9%) (Cost $23,113,444) | 29,388,189 | |
| Other Assets and Liabilities (0.1%) | ||
| Other Assets | 178,395 | |
| Liabilities | (135,062) | |
| 43,333 | ||
| Net Assets (100%) | ||
| Applicable to 1,835,945,183 outstanding $.001 par value shares of | ||
| beneficial interest (unlimited authorization) | 29,431,522 | |
| Net Asset Value Per Share | $16.03 | |
46
| Target Retirement 2025 Fund | |
| At March 31, 2014, net assets consisted of: | |
| Amount | |
| ($000) | |
| Paid-in Capital | 22,973,155 |
| Undistributed Net Investment Income | 145,346 |
| Accumulated Net Realized Gains | 38,276 |
| Unrealized Appreciation (Depreciation) | 6,274,745 |
| Net Assets | 29,431,522 |
See Note A in Notes to Financial Statements.
1 Affiliated fund available only to Vanguard funds and certain trusts and accounts managed by Vanguard. Rate shown for Vanguard Market
Liquidity Fund is the 7-day yield.
See accompanying Notes, which are an integral part of the Financial Statements.
47
| Target Retirement 2025 Fund | |
| Statement of Operations | |
| Six Months Ended | |
| March 31, 2014 | |
| ($000) | |
| Investment Income | |
| Income | |
| Income Distributions Received | 304,223 |
| Net Investment Income—Note B | 304,223 |
| Realized Net Gain (Loss) | |
| Capital Gain Distributions Received | 3,125 |
| Investment Securities Sold | 42,378 |
| Realized Net Gain (Loss) | 45,503 |
| Change in Unrealized Appreciation (Depreciation) of Investment Securities | 1,678,622 |
| Net Increase (Decrease) in Net Assets Resulting from Operations | 2,028,348 |
See accompanying Notes, which are an integral part of the Financial Statements.
48
| Target Retirement 2025 Fund | ||
| Statement of Changes in Net Assets | ||
| Six Months Ended | Year Ended | |
| March 31, | September 30, | |
| 2014 | 2013 | |
| ($000) | ($000) | |
| Increase (Decrease) in Net Assets | ||
| Operations | ||
| Net Investment Income | 304,223 | 533,278 |
| Realized Net Gain (Loss) | 45,503 | 118,453 |
| Change in Unrealized Appreciation (Depreciation) | 1,678,622 | 2,280,063 |
| Net Increase (Decrease) in Net Assets Resulting from Operations | 2,028,348 | 2,931,794 |
| Distributions | ||
| Net Investment Income | (498,816) | (454,865) |
| Realized Capital Gain1 | (29,547) | (18,440) |
| Total Distributions | (528,363) | (473,305) |
| Capital Share Transactions | ||
| Issued | 4,328,804 | 6,898,529 |
| Issued in Lieu of Cash Distributions | 520,244 | 468,277 |
| Redeemed | (2,559,183) | (4,205,203) |
| Net Increase (Decrease) from Capital Share Transactions | 2,289,865 | 3,161,603 |
| Total Increase (Decrease) | 3,789,850 | 5,620,092 |
| Net Assets | ||
| Beginning of Period | 25,641,672 | 20,021,580 |
| End of Period2 | 29,431,522 | 25,641,672 |
1 Includes fiscal 2014 and 2013 short-term gain distributions totaling $29,547,000 and $18,440,000 respectively. Short-term gain distributions
are treated as ordinary income dividends for tax purposes.
2 Net Assets—End of Period includes undistributed net investment income of $145,346,000 and $339,939,000.
See accompanying Notes, which are an integral part of the Financial Statements.
49
| Target Retirement 2025 Fund | |||||||
| Financial Highlights | |||||||
| Six Months | |||||||
| Ended | |||||||
| For a Share Outstanding | March 31, | Year Ended September 30, | |||||
| Throughout Each Period | 2014 | 2013 | 2012 | 2011 | 2010 | 2009 | |
| Net Asset Value, Beginning of Period | $15.18 | $13.70 | $11.71 | $11.97 | $11.11 | $11.49 | |
| Investment Operations | |||||||
| Net Investment Income | .165 | .316 | .331 | .2571 | .262 | .279 | |
| Capital Gain Distributions Received | .002 | .021 | .036 | .0201 | — | — | |
| Net Realized and Unrealized Gain (Loss) | |||||||
| on Investments | . 987 | 1.451 | 1.927 | (. 271) | . 850 | (. 336) | |
| Total from Investment Operations | 1.154 | 1.788 | 2.294 | . 006 | 1.112 | (. 057) | |
| Distributions | |||||||
| Dividends from Net Investment Income | (. 287) | (. 296) | (. 291) | (. 250) | (. 252) | (. 323) | |
| Distributions from Realized Capital Gains | (. 017) | (. 012) | (. 013) | (. 016) | — | — | |
| Total Distributions | (. 304) | (. 308) | (. 304) | (. 266) | (. 252) | (. 323) | |
| Net Asset Value, End of Period | $16.03 | $15.18 | $13.70 | $11.71 | $11.97 | $11.11 | |
| Total Return2 | 7.65% | 13.34% | 19.89% | -0.11% | 10.12% | 0.10% | |
| Ratios/Supplemental Data | |||||||
| Net Assets, End of Period (Millions) $29,432 | $25,642 | $20,022 | $14,997 | $13,652 | $9,932 | ||
| Ratio of Total Expenses to | |||||||
| Average Net Assets | — | — | — | — | — | — | |
| Acquired Fund Fees and Expenses | 0.17% | 0.17% | 0.17% | 0.18% | 0.18% | 0.21% | |
| Ratio of Net Investment Income to | |||||||
| Average Net Assets | 2.20% | 2.27% | 2.64% | 2.01% | 2.42% | 3.09% | |
| Portfolio Turnover Rate | 8% | 16% | 9% | 23%3 | 11% | 21%4 | |
The expense ratio, acquired fund fees and expenses, net income ratio, and turnover rate for the current period have been annualized.
1 Calculated based on average shares outstanding.
2 Total returns do not include account service fees that may have applied in the periods shown. Fund prospectuses provide information about
any applicable account service fees.
3 Excludes the value of mutual fund shares delivered and received in connection with a change in the fund’s international equity investments
from Vanguard European, Pacific, and Emerging Markets Stock Index Funds to Vanguard Total International Stock Index Fund because those
transactions were effected in kind and did not cause the fund to incur transaction costs.
4 Excludes the value of mutual fund shares delivered and received in connection with a change in the fund’s bond investments from Vanguard
Total Bond Market Index Fund to Vanguard Total Bond Market II Index Fund because those transactions were effected in kind and did not
cause the fund to incur transaction costs.
See accompanying Notes, which are an integral part of the Financial Statements.
50
Target Retirement 2025 Fund
Notes to Financial Statements
Vanguard Target Retirement 2025 Fund is registered under the Investment Company Act of 1940 as an open-end investment company, or mutual fund. The fund follows a balanced investment strategy by investing in selected Vanguard funds to achieve its targeted allocation of assets to U.S. stocks, international stocks, U.S. bonds, and international bonds. Financial statements and other information about each underlying fund are available on vanguard.com.
A. The following significant accounting policies conform to generally accepted accounting principles for U.S. mutual funds. The fund consistently follows such policies in preparing its financial statements.
1. Security Valuation: Investments are valued at the net asset value of each underlying Vanguard fund determined as of the close of the New York Stock Exchange (generally 4 p.m., Eastern time) on the valuation date.
2. Federal Income Taxes: The fund intends to continue to qualify as a regulated investment company and distribute all of its taxable income. Management has analyzed the fund’s tax positions taken for all open federal income tax years (September 30, 2010–2013), and for the period ended March 31, 2014, and has concluded that no provision for federal income tax is required in the fund’s financial statements.
3. Distributions: Distributions to shareholders are recorded on the ex-dividend date.
4. Credit Facility: The fund and certain other funds managed by The Vanguard Group participate in a $2.89 billion committed credit facility provided by a syndicate of lenders pursuant to a credit agreement which may be renewed annually; each fund is individually liable for its borrowings, if any, under the credit facility. Borrowings may be utilized for temporary and emergency purposes, and are subject to the fund’s regulatory and contractual borrowing restrictions. The participating funds are charged administrative fees and an annual commitment fee of 0.06% of the undrawn amount of the facility, which are allocated to the funds in accordance with a methodology approved by the board of trustees and borne by the funds in which the fund invests (See Note B). Any borrowings under this facility bear interest at a rate equal to the higher of the Federal Funds Rate or LIBOR Reference Rate plus an agreed-upon spread.
The fund had no borrowings outstanding at March 31, 2014, or at any time during the period then ended.
5. Other: Income and capital gain distributions received are recorded on the ex-dividend date. Security transactions are accounted for on the date securities are bought or sold. Costs used to determine realized gains (losses) on the sale of investment securities are those of the specific securities sold.
B. Under a service agreement, The Vanguard Group furnishes investment advisory, corporate management, administrative, marketing, and distribution services to the fund. The service agreement provides that the fund’s expenses may be reduced or eliminated to the extent of savings realized by the Vanguard funds by the operation of the fund. Accordingly, all incremental expenses for services provided by Vanguard and all other expenses incurred by the fund during the period ended March 31, 2014, were borne by the funds in which the fund invests. The fund’s trustees and officers are also directors and officers of Vanguard and the funds in which the fund invests.
C. Various inputs may be used to determine the value of the fund’s investments. These inputs are summarized in three broad levels for financial statement purposes. The inputs or methodologies used to value securities are not necessarily an indication of the risk associated with investing in those securities.
51
Target Retirement 2025 Fund
Level 1—Quoted prices in active markets for identical securities.
Level 2—Other significant observable inputs (including quoted prices for similar securities, interest rates, prepayment speeds, credit risk, etc.).
Level 3—Significant unobservable inputs (including the fund’s own assumptions used to determine the fair value of investments).
At March 31, 2014, 100% of the market value of the fund’s investments was determined based on Level 1 inputs.
D. Distributions are determined on a tax basis and may differ from net investment income and realized capital gains for financial reporting purposes. Differences may be permanent or temporary. Permanent differences are reclassified among capital accounts in the financial statements to reflect their tax character. Temporary differences arise when certain items of income, expense, gain, or loss are recognized in different periods for financial statement and tax purposes. These differences will reverse at some time in the future. Differences in classification may also result from the treatment of short-term gains as ordinary income for tax purposes. The fund’s tax-basis capital gains and losses are determined only at the end of each fiscal year.
At March 31, 2014, the cost of investment securities for tax purposes was $23,113,444,000. Net unrealized appreciation of investment securities for tax purposes was $6,274,745,000, consisting of unrealized gains of $6,287,882,000 on securities that had risen in value since their purchase and $13,137,000 in unrealized losses on securities that had fallen in value since their purchase.
E. During the six months ended March 31, 2014, the fund purchased $3,106,449,000 of investment securities and sold $1,084,972,000 of investment securities, other than temporary cash investments.
F. Capital shares issued and redeemed were:
| Six Months Ended | Year Ended | |
| March 31, 2014 | September 30, 2013 | |
| Shares | Shares | |
| (000) | (000) | |
| Issued | 275,945 | 483,653 |
| Issued in Lieu of Cash Distributions | 33,179 | 34,790 |
| Redeemed | (162,647) | (290,706) |
| Net Increase (Decrease) in Shares Outstanding | 146,477 | 227,737 |
G. Management has determined that no material events or transactions occurred subsequent to March 31, 2014, that would require recognition or disclosure in these financial statements.
52
Target Retirement 2030 Fund
Fund Profile
As of March 31, 2014
| Total Fund Characteristics | |
| Ticker Symbol | VTHRX |
| 30-Day SEC Yield | 2.09% |
| Acquired Fund Fees and Expenses1 | 0.17% |
| Allocation to Underlying Vanguard Funds | |
| Vanguard Total Stock Market Index Fund | |
| Investor Shares | 53.8% |
| Vanguard Total International Stock Index | |
| Fund Investor Shares | 23.1 |
| Vanguard Total Bond Market II Index Fund | |
| Investor Shares | 18.5 |
| Vanguard Total International Bond Index | |
| Fund Investor Shares | 4.6 |
| Total Fund Volatility Measures | ||
| Target 2030 | MSCI US | |
| Composite | Broad Market | |
| Index | Index | |
| R-Squared | 1.00 | 0.96 |
| Beta | 1.00 | 0.82 |
| These measures show the degree and timing of the fund’s fluctuations compared with the indexes over 36 months. | ||
Fund Asset Allocation
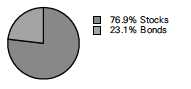
1 This figure—drawn from the prospectus dated January 27, 2014—represents an estimate of the weighted average of the expense ratios and any
transaction fees charged by the underlying mutual funds (the ”acquired” funds) in which the Target Retirement 2030 Fund invests. The fund does not
charge any expenses or fees of its own. For the six months ended March 31, 2014, the annualized acquired fund fees and expenses were 0.17%.
53
Target Retirement 2030 Fund
Performance Summary
All of the returns in this report represent past performance, which is not a guarantee of future results that may be achieved by the fund. (Current performance may be lower or higher than the performance data cited. For performance data current to the most recent month-end, visit our website at vanguard.com/performance.) Note, too, that both investment returns and principal value can fluctuate widely, so an investor’s shares, when sold, could be worth more or less than their original cost. The returns shown do not reflect taxes that a shareholder would pay on fund distributions or on the sale of fund shares.
Fiscal-Year Total Returns (%): June 7, 2006, Through March 31, 2014
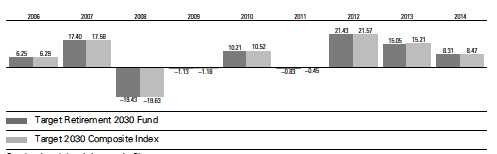
Note: For 2014, performance data reflect the six months ended March 31, 2014.
| Average Annual Total Returns: Periods Ended March 31, 2014 | ||||||
| Since Inception | ||||||
| Inception Date | One Year | Five Years | Income | Capital | Total | |
| Target Retirement 2030 | ||||||
| Fund | 6/7/2006 | 14.96% | 17.17% | 2.05% | 4.51% | 6.56% |
See Financial Highlights for dividend and capital gains information.
54
Target Retirement 2030 Fund
Financial Statements (unaudited)
Statement of Net Assets
As of March 31, 2014
The fund reports a complete list of its holdings in regulatory filings four times in each fiscal year, at the quarter-ends. For the second and fourth fiscal quarters, the lists appear in the fund’s semiannual and annual reports to shareholders. For the first and third fiscal quarters, the fund files the lists with the Securities and Exchange Commission on Form N-Q. Shareholders can look up the fund’s Forms N-Q on the SEC’s website at sec.gov. Forms N-Q may also be reviewed and copied at the SEC’s Public Reference Room (see the back cover of this report for further information).
| Market | ||
| Value | ||
| Shares | ($000) | |
| Investment Companies (99.9%) | ||
| U.S. Stock Fund (53.6%) | ||
| Vanguard Total Stock Market Index Fund Investor Shares | 237,625,810 | 11,265,840 |
| International Stock Fund (23.1%) | ||
| Vanguard Total International Stock Index Fund Investor Shares | 289,524,015 | 4,852,422 |
| U.S. Bond Fund (18.6%) | ||
| 1 Vanguard Total Bond Market II Index Fund Investor Shares | 366,375,492 | 3,898,235 |
| International Bond Fund (4.6%) | ||
| Vanguard Total International Bond Index Fund Investor Shares | 96,235,689 | 971,018 |
| Total Investment Companies (Cost $16,506,231) | 20,987,515 | |
| Temporary Cash Investment (0.0%) | ||
| Money Market Fund (0.0%) | ||
| 1 Vanguard Market Liquidity Fund, 0.122% (Cost $3,799) | 3,798,858 | 3,799 |
| Total Investments (99.9%) (Cost $16,510,030) | 20,991,314 | |
| Other Assets and Liabilities (0.1%) | ||
| Other Assets | 131,886 | |
| Liabilities | (100,952) | |
| 30,934 | ||
| Net Assets (100%) | ||
| Applicable to 747,580,401 outstanding $.001 par value shares of | ||
| beneficial interest (unlimited authorization) | 21,022,248 | |
| Net Asset Value Per Share | $28.12 | |
55
| Target Retirement 2030 Fund | |
| At March 31, 2014, net assets consisted of: | |
| Amount | |
| ($000) | |
| Paid-in Capital | 16,425,774 |
| Undistributed Net Investment Income | 103,099 |
| Accumulated Net Realized Gains | 12,091 |
| Unrealized Appreciation (Depreciation) | 4,481,284 |
| Net Assets | 21,022,248 |
See Note A in Notes to Financial Statements.
1 Affiliated fund available only to Vanguard funds and certain trusts and accounts managed by Vanguard. Rate shown for Vanguard Market
Liquidity Fund is the 7-day yield.
See accompanying Notes, which are an integral part of the Financial Statements.
56
| Target Retirement 2030 Fund | |
| Statement of Operations | |
| Six Months Ended | |
| March 31, 2014 | |
| ($000) | |
| Investment Income | |
| Income | |
| Income Distributions Received | 216,474 |
| Net Investment Income—Note B | 216,474 |
| Realized Net Gain (Loss) | |
| Capital Gain Distributions Received | 1,657 |
| Investment Securities Sold | 19,081 |
| Realized Net Gain (Loss) | 20,738 |
| Change in Unrealized Appreciation (Depreciation) of Investment Securities | 1,302,260 |
| Net Increase (Decrease) in Net Assets Resulting from Operations | 1,539,472 |
See accompanying Notes, which are an integral part of the Financial Statements.
57
| Target Retirement 2030 Fund | ||
| Statement of Changes in Net Assets | ||
| Six Months Ended | Year Ended | |
| March 31, | September 30, | |
| 2014 | 2013 | |
| ($000) | ($000) | |
| Increase (Decrease) in Net Assets | ||
| Operations | ||
| Net Investment Income | 216,474 | 361,634 |
| Realized Net Gain (Loss) | 20,738 | 40,881 |
| Change in Unrealized Appreciation (Depreciation) | 1,302,260 | 1,795,127 |
| Net Increase (Decrease) in Net Assets Resulting from Operations | 1,539,472 | 2,197,642 |
| Distributions | ||
| Net Investment Income | (343,337) | (289,870) |
| Realized Capital Gain1 | (25,173) | (8,714) |
| Total Distributions | (368,510) | (298,584) |
| Capital Share Transactions | ||
| Issued | 3,686,182 | 5,741,317 |
| Issued in Lieu of Cash Distributions | 361,941 | 294,856 |
| Redeemed | (1,991,462) | (2,787,514) |
| Net Increase (Decrease) from Capital Share Transactions | 2,056,661 | 3,248,659 |
| Total Increase (Decrease) | 3,227,623 | 5,147,717 |
| Net Assets | ||
| Beginning of Period | 17,794,625 | 12,646,908 |
| End of Period2 | 21,022,248 | 17,794,625 |
1 Includes fiscal 2014 and 2013 short-term gain distributions totaling $23,076,000 and $8,714,000, respectively. Short-term gain distributions
are treated as ordinary income dividends for tax purposes.
2 Net Assets—End of Period includes undistributed net investment income of $103,099,000 and $229,962,000.
See accompanying Notes, which are an integral part of the Financial Statements.
58
| Target Retirement 2030 Fund | |||||||
| Financial Highlights | |||||||
| Six Months | |||||||
| Ended | |||||||
| For a Share Outstanding | March 31, | Year Ended September 30, | |||||
| Throughout Each Period | 2014 | 2013 | 2012 | 2011 | 2010 | 2009 | |
| Net Asset Value, Beginning of Period | $26.46 | $23.51 | $19.81 | $20.36 | $18.84 | $19.63 | |
| Investment Operations | |||||||
| Net Investment Income | . 287 | . 540 | . 561 | . 398 | . 4531 | .4661 | |
| Capital Gain Distributions Received | .002 | .027 | .044 | .011 | — | — | |
| Net Realized and Unrealized Gain (Loss) | |||||||
| on Investments | 1.898 | 2.897 | 3.580 | (. 542) | 1.453 | (.793) | |
| Total from Investment Operations | 2.187 | 3.464 | 4.185 | (.133) | 1.906 | (. 327) | |
| Distributions | |||||||
| Dividends from Net Investment Income | (. 491) | (. 499) | (. 468) | (. 395) | (. 386) | (. 463) | |
| Distributions from Realized Capital Gains | (. 036) | (. 015) | (. 017) | (. 022) | — | — | |
| Total Distributions | (. 527) | (. 514) | (. 485) | (. 417) | (. 386) | (. 463) | |
| Net Asset Value, End of Period | $28.12 | $26.46 | $23.51 | $19.81 | $20.36 | $18.84 | |
| Total Return2 | 8.31% | 15.05% | 21.43% | -0.83% | 10.21% | -1.13% | |
| Ratios/Supplemental Data | |||||||
| Net Assets, End of Period (Millions) $21,022 | $17,795 | $12,647 | $8,245 | $6,533 | $4,003 | ||
| Ratio of Total Expenses to | |||||||
| Average Net Assets | — | — | — | — | — | — | |
| Acquired Fund Fees and Expenses | 0.17% | 0.17% | 0.17% | 0.18% | 0.19% | 0.21% | |
| Ratio of Net Investment Income to | |||||||
| Average Net Assets | 2.22% | 2.30% | 2.66% | 1.91% | 2.32% | 2.92% | |
| Portfolio Turnover Rate | 8% | 14% | 4% | 19%3 | 9% | 13% 4 | |
The expense ratio, acquired fund fees and expenses, net income ratio, and turnover rate for the current period have been annualized.
1 Calculated based on average shares outstanding.
2 Total returns do not include account service fees that may have applied in the periods shown. Fund prospectuses provide information about
any applicable account service fees.
3 Excludes the value of mutual fund shares delivered and received in connection with a change in the fund’s international equity investments
from Vanguard European, Pacific, and Emerging Markets Stock Index Funds to Vanguard Total International Stock Index Fund because those
transactions were effected in kind and did not cause the fund to incur transaction costs.
4 Excludes the value of mutual fund shares delivered and received in connection with a change in the fund’s bond investments from Vanguard
Total Bond Market Index Fund to Vanguard Total Bond Market II Index Fund because those transactions were effected in kind and did not
cause the fund to incur transaction costs.
See accompanying Notes, which are an integral part of the Financial Statements.
59
Target Retirement 2030 Fund
Notes to Financial Statements
Vanguard Target Retirement 2030 Fund is registered under the Investment Company Act of 1940 as an open-end investment company, or mutual fund. The fund follows a balanced investment strategy by investing in selected Vanguard funds to achieve its targeted allocation of assets to U.S. stocks, international stocks, U.S. bonds, and international bonds. Financial statements and other information about each underlying fund are available on vanguard.com.
A. The following significant accounting policies conform to generally accepted accounting principles for U.S. mutual funds. The fund consistently follows such policies in preparing its financial statements.
1. Security Valuation: Investments are valued at the net asset value of each underlying Vanguard fund determined as of the close of the New York Stock Exchange (generally 4 p.m., Eastern time) on the valuation date.
2. Federal Income Taxes: The fund intends to continue to qualify as a regulated investment company and distribute all of its taxable income. Management has analyzed the fund’s tax positions taken for all open federal income tax years (September 30, 2010–2013), and for the period ended March 31, 2014, and has concluded that no provision for federal income tax is required in the fund’s financial statements.
3. Distributions: Distributions to shareholders are recorded on the ex-dividend date.
4. Credit Facility: The fund and certain other funds managed by The Vanguard Group participate in a $2.89 billion committed credit facility provided by a syndicate of lenders pursuant to a credit agreement which may be renewed annually; each fund is individually liable for its borrowings, if any, under the credit facility. Borrowings may be utilized for temporary and emergency purposes, and are subject to the fund’s regulatory and contractual borrowing restrictions. The participating funds are charged administrative fees and an annual commitment fee of 0.06% of the undrawn amount of the facility, which are allocated to the funds in accordance with a methodology approved by the board of trustees and borne by the funds in which the fund invests (See Note B). Any borrowings under this facility bear interest at a rate equal to the higher of the Federal Funds Rate or LIBOR Reference Rate plus an agreed-upon spread.
The fund had no borrowings outstanding at March 31, 2014, or at any time during the period then ended.
5. Other: Income and capital gain distributions received are recorded on the ex-dividend date. Security transactions are accounted for on the date securities are bought or sold. Costs used to determine realized gains (losses) on the sale of investment securities are those of the specific securities sold.
B. Under a service agreement, The Vanguard Group furnishes investment advisory, corporate management, administrative, marketing, and distribution services to the fund. The service agreement provides that the fund’s expenses may be reduced or eliminated to the extent of savings realized by the Vanguard funds by the operation of the fund. Accordingly, all incremental expenses for services provided by Vanguard and all other expenses incurred by the fund during the period ended March 31, 2014, were borne by the funds in which the fund invests. The fund’s trustees and officers are also directors and officers of Vanguard and the funds in which the fund invests.
C. Various inputs may be used to determine the value of the fund’s investments. These inputs are summarized in three broad levels for financial statement purposes. The inputs or methodologies used to value securities are not necessarily an indication of the risk associated with investing in those securities.
60
Target Retirement 2030 Fund
Level 1—Quoted prices in active markets for identical securities.
Level 2—Other significant observable inputs (including quoted prices for similar securities, interest rates, prepayment speeds, credit risk, etc.).
Level 3—Significant unobservable inputs (including the fund’s own assumptions used to determine the fair value of investments).
At March 31, 2014, 100% of the market value of the fund’s investments was determined based on Level 1 inputs.
D. Distributions are determined on a tax basis and may differ from net investment income and realized capital gains for financial reporting purposes. Differences may be permanent or temporary. Permanent differences are reclassified among capital accounts in the financial statements to reflect their tax character. Temporary differences arise when certain items of income, expense, gain, or loss are recognized in different periods for financial statement and tax purposes. These differences will reverse at some time in the future. Differences in classification may also result from the treatment of short-term gains as ordinary income for tax purposes. The fund’s tax-basis capital gains and losses are determined only at the end of each fiscal year.
At March 31, 2014, the cost of investment securities for tax purposes was $16,510,030,000. Net unrealized appreciation of investment securities for tax purposes was $4,481,284,000, consisting of unrealized gains of $4,487,588,000 on securities that had risen in value since their purchase and $6,304,000 in unrealized losses on securities that had fallen in value since their purchase.
E. During the six months ended March 31, 2014, the fund purchased $2,663,744,000 of investment securities and sold $787,814,000 of investment securities, other than temporary cash investments.
F. Capital shares issued and redeemed were:
| Six Months Ended | Year Ended | |
| March 31, 2014 | September 30, 2013 | |
| Shares | Shares | |
| (000) | (000) | |
| Issued | 134,261 | 233,050 |
| Issued in Lieu of Cash Distributions | 13,157 | 12,748 |
| Redeemed | (72,258) | (111,235) |
| Net Increase (Decrease) in Shares Outstanding | 75,160 | 134,563 |
G. Management has determined that no material events or transactions occurred subsequent to March 31, 2014, that would require recognition or disclosure in these financial statements.
61
About Your Fund’s Expenses
As a shareholder of the fund, you incur ongoing costs, which include costs for portfolio management, administrative services, and shareholder reports (like this one), among others. Operating expenses, which are deducted from a fund’s gross income, directly reduce the investment return of the fund.
A typical fund’s expenses are expressed as a percentage of its average net assets. The Target Retirement Funds have no direct expenses, but each fund bears its proportionate share of the costs for the underlying funds in which it invests. These indirect expenses make up the acquired fund fees and expenses, also expressed as a percentage of average net assets.
The following examples are intended to help you understand the ongoing cost (in dollars) of investing in your fund and to compare these costs with those of other mutual funds. The examples are based on an investment of $1,000 made at the beginning of the period shown and held for the entire period. The costs were calculated using the acquired fund fees and expenses for each Target Retirement Fund.
The accompanying table illustrates your fund’s costs in two ways:
• Based on actual fund return. This section helps you to estimate the actual expenses that you paid over the period. The ”Ending Account Value“ shown is derived from the fund‘s actual return, and the third column shows the dollar amount that would have been paid by an investor who started with $1,000 in the fund. You may use the information here, together with the amount you invested, to estimate the expenses that you paid over the period.
To do so, simply divide your account value by $1,000 (for example, an $8,600 account value divided by $1,000 = 8.6), then multiply the result by the number given for your fund under the heading ”Expenses Paid During Period.“
• Based on hypothetical 5% yearly return. This section is intended to help you compare your fund‘s costs with those of other mutual funds. It assumes that the fund had a yearly return of 5% before expenses, but that the expense ratio is unchanged. In this case—because the return used is not the fund’s actual return—the results do not apply to your investment. The example is useful in making comparisons because the Securities and Exchange Commission requires all mutual funds to calculate expenses based on a 5% return. You can assess your fund’s costs by comparing this hypothetical example with the hypothetical examples that appear in shareholder reports of other funds.
Note that the expenses shown in the table are meant to highlight and help you compare ongoing costs only and do not reflect transaction costs incurred by the fund for buying and selling securities. Further, the expenses do not include any purchase, redemption, or account service fees described in the fund prospectus. If such fees were applied to your account, your costs would be higher. Your fund does not carry a “sales load.”
The calculations assume no shares were bought or sold during the period. Your actual costs may have been higher or lower, depending on the amount of your investment and the timing of any purchases or redemptions.
You can find more information about the fund’s expenses, including annual expense ratios, in the Financial Statements section of this report. For additional information on operating expenses and other shareholder costs, please refer to your fund’s current prospectus.
62
| Six Months Ended March 31, 2014 | |||
| Beginning | Ending | Expenses | |
| Account Value | Account Value | Paid During | |
| 9/30/2013 | 3/31/2014 | Period | |
| Based on Actual Fund Return | |||
| Target Retirement Income Fund | $1,000.00 | $1,040.34 | $0.86 |
| Target Retirement 2010 Fund | $1,000.00 | $1,049.68 | $0.87 |
| Target Retirement 2015 Fund | $1,000.00 | $1,061.77 | $0.87 |
| Target Retirement 2020 Fund | $1,000.00 | $1,070.30 | $0.88 |
| Target Retirement 2025 Fund | $1,000.00 | $1,076.47 | $0.88 |
| Target Retirement 2030 Fund | $1,000.00 | $1,083.09 | $0.88 |
| Based on Hypothetical 5% Yearly Return | |||
| Target Retirement Income Fund | $1,000.00 | $1,024.08 | $0.86 |
| Target Retirement 2010 Fund | $1,000.00 | $1,024.08 | $0.86 |
| Target Retirement 2015 Fund | $1,000.00 | $1,024.08 | $0.86 |
| Target Retirement 2020 Fund | $1,000.00 | $1,024.08 | $0.86 |
| Target Retirement 2025 Fund | $1,000.00 | $1,024.08 | $0.86 |
| Target Retirement 2030 Fund | $1,000.00 | $1,024.08 | $0.86 |
The calculations are based on the acquired fund fees and expenses for the most recent six-month period. The funds’ annualized expense
figures for that period are (in order as listed from top to bottom above) 0.17%, 0.17%, 0.17%, 0.17%, 0.17%, and 0.17%. The dollar amounts
shown as ”Expenses Paid” are equal to the annualized expense figures for the underlying funds multiplied by the average account value over
the period, multiplied by the number of days in the most recent six-month period, then divided by the number of days in the most recent
12-month period.
63
Trustees Approve Advisory Arrangement
The board of trustees of Vanguard Target Retirement Funds has renewed the funds’ investment advisory arrangement with The Vanguard Group, Inc. (Vanguard). Vanguard—through its Equity Investment Group—serves as the investment advisor to the funds. The board determined that continuing the funds’ internalized management structure was in the best interests of the funds and their shareholders.
The board based its decision upon an evaluation of the advisor’s investment staff, portfolio management process, and performance. The trustees considered the factors discussed below, among others. However, no single factor determined whether the board approved the arrangement. Rather, it was the totality of the circumstances that drove the board’s decision.
Nature, extent, and quality of services
The board considered the quality of the funds’ investment management services over both the short and long term, and took into account the organizational depth and stability of the advisor. The board noted that Vanguard has been managing investments for more than three decades. The Equity Investment Group adheres to a sound, disciplined investment management process; the team has considerable experience, stability, and depth.
The board concluded that Vanguard’s experience, stability, depth, and performance, among other factors, warranted continuation of the advisory arrangement.
Investment performance
The board considered the performance of the funds, including any periods of outperformance or underperformance compared relative to a benchmark index and peer groups. The board concluded that the performance was such that the advisory arrangement should continue. Information about each fund’s most recent performance can be found in the Performance Summary pages of this report.
Cost
The board concluded that the funds’ acquired fund fees and expenses were well below the average expense ratios charged by funds in their respective peer groups. The funds do not incur advisory expenses directly; however; the board noted that each of the underlying funds in which the funds invest has advisory expenses well below the relevant peer-group average. Information about the funds’ acquired fund fees and expenses appears in the About Your Fund’s Expenses section of this report as well as in the Financial Statements sections.
The board does not conduct a profitability analysis of Vanguard, because of Vanguard’s unique “at-cost” structure. Unlike most other mutual fund management companies, Vanguard is owned by the funds it oversees, and produces “profits” only in the form of reduced expenses for fund shareholders.
The benefit of economies of scale
The board concluded that Vanguard’s at-cost arrangement with the Target Retirement Funds and their underlying funds ensures that the funds will realize economies of scale as they grow, with the cost to shareholders declining as fund assets increase.
The board will consider whether to renew the advisory arrangement again after a one-year period.
64
Glossary
30-Day SEC Yield. A fund’s 30-day SEC yield is derived using a formula specified by the U.S. Securities and Exchange Commission. Under the formula, data related to the fund’s security holdings in the previous 30 days are used to calculate the fund’s hypothetical net income for that period, which is then annualized and divided by the fund’s estimated average net assets over the calculation period. For the purposes of this calculation, a security’s income is based on its current market yield to maturity (for bonds), its actual income (for asset-backed securities), or its projected dividend yield (for stocks). Because the SEC yield represents hypothetical annualized income, it will differ—at times significantly—from the fund’s actual experience. As a result, the fund’s income distributions may be higher or lower than implied by the SEC yield.
Acquired Fund Fees and Expenses. Funds that invest in other Vanguard funds incur no direct expenses, but they do bear proportionate shares of the operating, administrative, and advisory expenses of the underlying funds, and they must pay any fees charged by those funds. The figure for acquired fund fees and expenses represents a weighted average of these underlying costs. Acquired is a term that the Securities and Exchange Commission applies to any mutual fund whose shares are owned by another fund.
Beta. A measure of the magnitude of a fund’s past share-price fluctuations in relation to the ups and downs of a given market index. The index is assigned a beta of 1.00. Compared with a given index, a fund with a beta of 1.20 typically would have seen its share price rise or fall by 12% when the index rose or fell by 10%. For this report, beta is based on returns over the past 36 months for both the fund and the index. Note that a fund’s beta should be reviewed in conjunction with its R-squared (see definition). The lower the R-squared, the less correlation there is between the fund and the index, and the less reliable beta is as an indicator of volatility.
Expense Ratio. A fund’s total annual operating expenses expressed as a percentage of the fund’s average net assets. The expense ratio includes management and administrative expenses, but does not include the transaction costs of buying and selling portfolio securities.
Inception Date. The date on which the assets of a fund (or one of its share classes) are first invested in accordance with the fund’s investment objective. For funds with a subscription period, the inception date is the day after that period ends. Investment performance is measured from the inception date.
R-Squared. A measure of how much of a fund’s past returns can be explained by the returns from the market in general, as measured by a given index. If a fund’s total returns were precisely synchronized with an index’s returns, its R-squared would be 1.00. If the fund’s returns bore no relationship to the index’s returns, its R-squared would be 0. For this report, R-squared is based on returns over the past 36 months for both the fund and the index.
65
Benchmark Information
Target 2010 Composite Index: Derived by applying the fund’s target asset allocation to the results of the following benchmarks: for international stocks of developed markets, the MSCI EAFE Index through December 15, 2010, the MSCI ACWI ex USA IMI Index through June 2, 2013, and the FTSE Global All Cap ex US Index thereafter; for emerging-market stocks, the Select Emerging Markets Index through August 23, 2006, the MSCI Emerging Markets Index through December 15, 2010, the MSCI ACWI ex USA IMI Index through June 2, 2013, and the FTSE Global All Cap ex US Index thereafter; for U.S. bonds, the Barclays U.S. Aggregate Bond Index through December 31, 2009, and the Barclays U.S. Aggregate Float Adjusted Index thereafter, as well as the Barclays U.S. Treasury Inflation Protected Securities Index through June 2, 2013, and the Barclays U.S. Treasury Inflation-Protected Securities (TIPS) 0-5 Year Index thereafter; for short-term reserves, the Citigroup Three-Month Treasury Bill Index through June 2, 2013; for international bonds, the Barclays Global Aggregate ex-USD Float Adjusted RIC Capped Index beginning June 2, 2013; and for U.S. stocks, the MSCI US Broad Market Index through June 2, 2013, and the CRSP US Total Market Index thereafter. International stock benchmark returns are adjusted for withholding taxes.
Target 2015 Composite Index: Derived by applying the fund’s target asset allocation to the results of the following benchmarks: for international stocks of developed markets, the MSCI EAFE Index through December 15, 2010, the MSCI ACWI ex USA IMI Index through June 2, 2013, and the FTSE Global All Cap ex US Index thereafter; for emerging-market stocks, the Select Emerging Markets Index through August 23, 2006, the MSCI Emerging Markets Index through December 15, 2010, the MSCI ACWI ex USA IMI Index through June 2, 2013, and the FTSE Global All Cap ex US Index thereafter; for U.S. bonds, the Barclays U.S. Aggregate Bond Index through December 31, 2009, and the Barclays U.S. Aggregate Float Adjusted Index thereafter, as well as the Barclays U.S. Treasury Inflation Protected Securities Index through June 2, 2013, and the Barclays U.S. Treasury Inflation-Protected Securities (TIPS) 0-5 Year Index thereafter; for international bonds, the Barclays Global Aggregate ex-USD Float Adjusted RIC Capped Index beginning June 2, 2013; and for U.S. stocks, the Dow Jones U.S. Total Stock Market Index (formerly known as the Dow Jones Wilshire 5000 Index) through April 22, 2005, the MSCI US Broad Market Index through June 2, 2013, and the CRSP US Total Market Index thereafter. International stock benchmark returns are adjusted for withholding taxes.
Target 2020 Composite Index: Derived by applying the fund’s target asset allocation to the results of the following benchmarks: for international stocks of developed markets, the MSCI EAFE Index through December 15, 2010, the MSCI ACWI ex USA IMI Index through June 2, 2013, and the FTSE Global All Cap ex US Index thereafter; for emerging-market stocks, the Select Emerging Markets Index through August 23, 2006, the MSCI Emerging Markets Index through December 15, 2010, the MSCI ACWI ex USA IMI Index through June 2, 2013, and the FTSE Global All Cap ex US Index thereafter; for U.S. bonds, the Barclays U.S. Aggregate Bond Index through December 31, 2009, and the Barclays U.S. Aggregate Float Adjusted Index thereafter; for international bonds, the Barclays Global Aggregate ex-USD Float Adjusted RIC Capped Index; and for U.S. stocks, the MSCI US Broad Market Index through June 2, 2013, and the CRSP US Total Market Index thereafter. International stock benchmark returns are adjusted for withholding taxes.
66
Target 2025 Composite Index: Derived by applying the fund’s target asset allocation to the results of the following benchmarks: for international stocks of developed markets, the MSCI EAFE Index through December 15, 2010, the MSCI ACWI ex USA IMI Index through June 2, 2013, and the FTSE Global All Cap ex US Index thereafter; for emerging-market stocks, the Select Emerging Markets Index through August 23, 2006, the MSCI Emerging Markets Index through December 15, 2010, the MSCI ACWI ex USA IMI Index through June 2, 2013, and the FTSE Global All Cap ex US Index thereafter; for U.S. bonds, the Barclays U.S. Aggregate Bond Index through December 31, 2009, and the Barclays U.S. Aggregate Float Adjusted Index thereafter; for international bonds, the Barclays Global Aggregate ex-USD Float Adjusted RIC Capped Index beginning June 2, 2013; and for U.S. stocks, the Dow Jones U.S. Total Stock Market Index (formerly known as the Dow Jones Wilshire 5000 Index) through April 22, 2005, the MSCI US Broad Market Index through June 2, 2013, and the CRSP US Total Market Index thereafter. International stock benchmark returns are adjusted for withholding taxes.
Target 2030 Composite Index: Derived by applying the fund’s target asset allocation to the results of the following benchmarks: for international stocks of developed markets, the MSCI EAFE Index through December 15, 2010, the MSCI ACWI ex USA IMI Index through June 2, 2013, and the FTSE Global All Cap ex US Index thereafter; for emerging-market stocks, the Select Emerging Markets Index through August 23, 2006, the MSCI Emerging Markets Index through December 15, 2010, the MSCI ACWI ex USA IMI Index through June 2, 2013, and the FTSE Global All Cap ex US Index thereafter; for U.S. bonds, the Barclays U.S. Aggregate Bond Index through December 31, 2009, and the Barclays U.S. Aggregate Float Adjusted Index thereafter; for international bonds, the Barclays Global Aggregate ex-USD Float Adjusted RIC Capped Index beginning June 2, 2013; and for U.S. stocks, the MSCI US Broad Market Index through June 2, 2013, and the CRSP US Total Market Index thereafter. International stock benchmark returns are adjusted for withholding taxes.
Target Income Composite Index: Derived by applying the fund’s target asset allocation to the results of the following benchmarks: for international stocks of developed markets, the MSCI EAFE Index through December 15, 2010, the MSCI ACWI ex USA IMI Index through June 2, 2013, and the FTSE Global All Cap ex US Index thereafter; for emerging-market stocks, the Select Emerging Markets Index through August 23, 2006, the MSCI Emerging Markets Index through December 15, 2010, the MSCI ACWI ex USA IMI Index through June 2, 2013, and the FTSE Global All Cap ex US Index thereafter; for U.S. bonds, the Barclays U.S. Aggregate Bond Index through December 31, 2009, and the Barclays U.S. Aggregate Float Adjusted Index thereafter, as well as the Barclays U.S. Treasury Inflation Protected Securities Index through June 2, 2013, and the Barclays U.S. Treasury Inflation-Protected Securities (TIPS) 0-5 Year Index thereafter; for short-term reserves, the Citigroup Three-Month Treasury Bill Index through June 2, 2013; for international bonds, the Barclays Global Aggregate ex-USD Float Adjusted RIC Capped Index; and for U.S. stocks, the Dow Jones U.S. Total Stock Market Index (formerly known as the Dow Jones Wilshire 5000 Index) through April 22, 2005, the MSCI US Broad Market Index through June 2, 2013, and the CRSP US Total Market Index thereafter. International stock benchmark returns are adjusted for withholding taxes.
67
The People Who Govern Your Fund
The trustees of your mutual fund are there to see that the fund is operated and managed in your best interests since, as a shareholder, you are a part owner of the fund. Your fund’s trustees also serve on the board of directors of The Vanguard Group, Inc., which is owned by the Vanguard funds and provides services to them on an at-cost basis.
A majority of Vanguard’s board members are independent, meaning that they have no affiliation with Vanguard or the funds they oversee, apart from the sizable personal investments they have made as private individuals. The independent board members have distinguished backgrounds in business, academia, and public service. Each of the trustees and executive officers oversees 179 Vanguard funds.
The following table provides information for each trustee and executive officer of the fund. More information about the trustees is in the Statement of Additional Information, which can be obtained, without charge, by contacting Vanguard at 800-662-7447, or online at vanguard.com.
| InterestedTrustee1 | and Delphi Automotive LLP (automotive components); |
| Senior Advisor at New Mountain Capital. | |
| F. William McNabb III | |
| Born 1957. Trustee Since July 2009. Chairman of the | Amy Gutmann |
| Board. Principal Occupation(s) During the Past Five | Born 1949. Trustee Since June 2006. Principal |
| Years: Chairman of the Board of The Vanguard Group, | Occupation(s) During the Past Five Years: President of |
| Inc., and of each of the investment companies served | the University of Pennsylvania; Christopher H. Browne |
| by The Vanguard Group, since January 2010; Director | Distinguished Professor of Political Science, School of |
| of The Vanguard Group since 2008; Chief Executive | Arts and Sciences, and Professor of Communication, |
| Officer and President of The Vanguard Group, and of | Annenberg School for Communication, with secondary |
| each of the investment companies served by The | faculty appointments in the Department of Philosophy, |
| Vanguard Group, since 2008; Director of Vanguard | School of Arts and Sciences, and at the Graduate |
| Marketing Corporation; Managing Director of The | School of Education, University of Pennsylvania; |
| Vanguard Group (1995–2008). | Trustee of the National Constitution Center; Chair |
| of the Presidential Commission for the Study of | |
| Bioethical Issues. | |
| IndependentTrustees | |
| Emerson U. Fullwood | JoAnn Heffernan Heisen |
| Born 1948. Trustee Since January 2008. Principal | Born 1950. Trustee Since July 1998. Principal |
| Occupation(s) During the Past Five Years: Executive | Occupation(s) During the Past Five Years: Corporate |
| Chief Staff and Marketing Officer for North America | Vice President and Chief Global Diversity Officer |
| and Corporate Vice President (retired 2008) of Xerox | (retired 2008) and Member of the Executive |
| Corporation (document management products and | Committee (1997–2008) of Johnson & Johnson |
| services); Executive in Residence and 2009–2010 | (pharmaceuticals/medical devices/consumer |
| Distinguished Minett Professor at the Rochester | products); Director of Skytop Lodge Corporation |
| Institute of Technology; Director of SPX Corporation | (hotels), the University Medical Center at Princeton, |
| (multi-industry manufacturing), the United Way of | the Robert Wood Johnson Foundation, and the Center |
| Rochester, Amerigroup Corporation (managed health | for Talent Innovation; Member of the Advisory Board |
| care), the University of Rochester Medical Center, | of the Maxwell School of Citizenship and Public Affairs |
| Monroe Community College Foundation, and North | at Syracuse University. |
| Carolina A&T University. | |
| F. Joseph Loughrey | |
| Rajiv L. Gupta | Born 1949. Trustee Since October 2009. Principal |
| Born 1945. Trustee Since December 2001. 2 | Occupation(s) During the Past Five Years: President |
| Principal Occupation(s) During the Past Five Years: | and Chief Operating Officer (retired 2009) of Cummins |
| Chairman and Chief Executive Officer (retired 2009) | Inc. (industrial machinery); Chairman of the Board |
| and President (2006–2008) of Rohm and Haas Co. | of Hillenbrand, Inc. (specialized consumer services), |
| (chemicals); Director of Tyco International, Ltd. | and of Oxfam America; Director of SKF AB (industrial |
| (diversified manufacturing and services), Hewlett- | machinery), Hyster-Yale Materials Handling, Inc. |
| Packard Co. (electronic computer manufacturing), | (forklift trucks), the Lumina Foundation for Education, |
| and the V Foundation for Cancer Research; Member | Executive Officers | |
| of the Advisory Council for the College of Arts and | ||
| Letters and of the Advisory Board to the Kellogg | Glenn Booraem | |
| Institute for International Studies, both at the | Born 1967. Controller Since July 2010. Principal | |
| University of Notre Dame. | Occupation(s) During the Past Five Years: Principal | |
| of The Vanguard Group, Inc.; Controller of each of | ||
| Mark Loughridge | the investment companies served by The Vanguard | |
| Born 1953. Trustee Since March 2012. Principal | Group; Assistant Controller of each of the investment | |
| Occupation(s) During the Past Five Years: Senior Vice | companies served by The Vanguard Group (2001–2010). | |
| President and Chief Financial Officer (retired 2013) | ||
| at IBM (information technology services); Fiduciary | Thomas J. Higgins | |
| Member of IBM’s Retirement Plan Committee (2004– | Born 1957. Chief Financial Officer Since September | |
| 2013); Member of the Council on Chicago Booth. | 2008. Principal Occupation(s) During the Past Five | |
| Years: Principal of The Vanguard Group, Inc.; Chief | ||
| Scott C. Malpass | Financial Officer of each of the investment companies | |
| Born 1962. Trustee Since March 2012. Principal | served by The Vanguard Group; Treasurer of each of | |
| Occupation(s) During the Past Five Years: Chief | the investment companies served by The Vanguard | |
| Investment Officer and Vice President at the University | Group (1998–2008). | |
| of Notre Dame; Assistant Professor of Finance at the | ||
| Mendoza College of Business at Notre Dame; Member | Kathryn J. Hyatt | |
| of the Notre Dame 403(b) Investment Committee; | Born 1955. Treasurer Since November 2008. Principal | |
| Board Member of TIFF Advisory Services, Inc. | Occupation(s) During the Past Five Years: Principal of | |
| (investment advisor); Member of the Investment | The Vanguard Group, Inc.; Treasurer of each of the | |
| Advisory Committees of the Financial Industry | investment companies served by The Vanguard | |
| Regulatory Authority (FINRA) and of Major League | Group; Assistant Treasurer of each of the investment | |
| Baseball. | companies served by The Vanguard Group (1988–2008). | |
| André F. Perold | Heidi Stam | |
| Born 1952. Trustee Since December 2004. Principal | Born 1956. Secretary Since July 2005. Principal | |
| Occupation(s) During the Past Five Years: George | Occupation(s) During the Past Five Years: Managing | |
| Gund Professor of Finance and Banking, Emeritus | Director of The Vanguard Group, Inc.; General Counsel | |
| at the Harvard Business School (retired 2011); | of The Vanguard Group; Secretary of The Vanguard | |
| Chief Investment Officer and Managing Partner of | Group and of each of the investment companies | |
| HighVista Strategies LLC (private investment firm); | served by The Vanguard Group; Director and Senior | |
| Director of Rand Merchant Bank; Overseer of the | Vice President of Vanguard Marketing Corporation. | |
| Museum of Fine Arts Boston. | ||
| Vanguard Senior ManagementTeam | ||
| Alfred M. Rankin, Jr. | ||
| Born 1941. Trustee Since January 1993. Principal | Mortimer J. Buckley | Chris D. McIsaac |
| Occupation(s) During the Past Five Years: Chairman, | Kathleen C. Gubanich | Michael S. Miller |
| President, and Chief Executive Officer of NACCO | Paul A. Heller | James M. Norris |
| Industries, Inc. (housewares/lignite), and of Hyster- | Martha G. King | Glenn W. Reed |
| Yale Materials Handling, Inc. (forklift trucks); Chairman | John T. Marcante | |
| of the Board of University Hospitals of Cleveland. | ||
| Peter F. Volanakis | Chairman Emeritus and Senior Advisor | |
| Born 1955. Trustee Since July 2009. Principal | ||
| Occupation(s) During the Past Five Years: President | John J. Brennan | |
| and Chief Operating Officer (retired 2010) of Corning | Chairman, 1996–2009 | |
| Incorporated (communications equipment); Trustee of | Chief Executive Officer and President, 1996–2008 | |
| Colby-Sawyer College; Member of the Advisory Board | ||
| of the Norris Cotton Cancer Center and of the Advisory | ||
| Board of the Parthenon Group (strategy consulting). | Founder | |
| John C. Bogle | ||
| Chairman and Chief Executive Officer, 1974–1996 | ||
1 Mr. McNabb is considered an “interested person,” as defined in the Investment Company Act of 1940, because he is an officer of the
Vanguard funds.
2 December 2002 for Vanguard Equity Income Fund, the Vanguard Municipal Bond Funds, and the Vanguard State Tax-Exempt Funds.
 | |
| P.O. Box 2600 | |
| Valley Forge, PA 19482-2600 | |
| Connect with Vanguard® > vanguard.com | |
| Fund Information > 800-662-7447 | |
| Direct Investor Account Services > 800-662-2739 | |
| Institutional Investor Services > 800-523-1036 | |
| Text Telephone for People | |
| With Hearing Impairment > 800-749-7273 | |
| This material may be used in conjunction | |
| with the offering of shares of any Vanguard | |
| fund only if preceded or accompanied by | |
| the fund’s current prospectus. | |
| All comparative mutual fund data are from Lipper, a | |
| Thomson Reuters Company, or Morningstar, Inc., unless | |
| otherwise noted. | |
| You can obtain a free copy of Vanguard’s proxy voting | |
| guidelines by visiting vanguard.com/proxyreporting or by | |
| calling Vanguard at 800-662-2739. The guidelines are | |
| also available from the SEC’s website, sec.gov. In | |
| addition, you may obtain a free report on how your fund | |
| voted the proxies for securities it owned during the 12 | |
| months ended June 30. To get the report, visit either | |
| vanguard.com/proxyreporting or sec.gov. | |
| You can review and copy information about your fund at | |
| the SEC’s Public Reference Room in Washington, D.C. To | |
| find out more about this public service, call the SEC at | |
| 202-551-8090. Information about your fund is also | |
| available on the SEC’s website, and you can receive | |
| copies of this information, for a fee, by sending a | |
| request in either of two ways: via e-mail addressed to | |
| publicinfo@sec.gov or via regular mail addressed to the | |
| Public Reference Section, Securities and Exchange | |
| Commission, Washington, DC 20549-1520. | |
| © 2014 The Vanguard Group, Inc. | |
| All rights reserved. | |
| Vanguard Marketing Corporation, Distributor. | |
| Q3082 052014 | |
![]()
Semiannual Report | March 31, 2014
Vanguard Target Retirement Funds
Vanguard’s Principles for Investing Success
We want to give you the best chance of investment success. These principles,
grounded in Vanguard’s research and experience, can put you on the right path.
Goals. Create clear, appropriate investment goals.
Balance. Develop a suitable asset allocation using broadly diversified funds.
Cost. Minimize cost.
Discipline. Maintain perspective and long-term discipline.
A single theme unites these principles: Focus on the things you can control.
We believe there is no wiser course for any investor.
| Contents | |
| Your Fund’s Total Returns. | 1 |
| Chairman’s Letter. | 2 |
| Target Retirement 2035 Fund. | 8 |
| Target Retirement 2040 Fund. | 17 |
| Target Retirement 2045 Fund. | 26 |
| Target Retirement 2050 Fund. | 35 |
| Target Retirement 2055 Fund. | 44 |
| Target Retirement 2060 Fund. | 53 |
| About Your Fund’s Expenses. | 62 |
| Trustees Approve Advisory Arrangement. | 64 |
| Glossary. | 65 |
Please note: The opinions expressed in this report are just that—informed opinions. They should not be considered promises or advice.
Also, please keep in mind that the information and opinions cover the period through the date on the front of this report. Of course, the
risks of investing in your fund are spelled out in the prospectus.
See the Glossary for definitions of investment terms used in this report.
About the cover: The ship’s wheel represents leadership and guidance, essential qualities in navigating difficult seas.
This one is a replica based on an 18th-century British vessel. The HMSVanguard, another ship of that era, served as the
flagship for British Admiral Horatio Nelson when he defeated a French fleet at the Battle of the Nile.
Your Fund’s Total Returns
| Six Months Ended March 31, 2014 | |
| Total | |
| Returns | |
| Vanguard Target Retirement 2035 Fund | 8.92% |
| Target 2035 Composite Index | 9.10 |
| Mixed-Asset Target 2035 Funds Average | 7.91 |
| Mixed-Asset Target 2035 Funds Average: Derived from data provided by Lipper, a Thomson Reuters Company. | |
| Vanguard Target Retirement 2040 Fund | 9.36% |
| Target 2040 Composite Index | 9.54 |
| Mixed-Asset Target 2040 Funds Average | 7.91 |
| Mixed-Asset Target 2040 Funds Average: Derived from data provided by Lipper, a Thomson Reuters Company. | |
| Vanguard Target Retirement 2045 Fund | 9.40% |
| Target 2045 Composite Index | 9.54 |
| Mixed-Asset Target 2045 Funds Average | 8.43 |
| Mixed-Asset Target 2045 Funds Average: Derived from data provided by Lipper, a Thomson Reuters Company. | |
| Vanguard Target Retirement 2050 Fund | 9.37% |
| Target 2050 Composite Index | 9.54 |
| Mixed-Asset Target 2050 Funds Average | 8.19 |
| Mixed-Asset Target 2050 Funds Average: Derived from data provided by Lipper, a Thomson Reuters Company. | |
| Vanguard Target Retirement 2055 Fund | 9.39% |
| Target 2055 Composite Index | 9.54 |
| Spliced Mixed-Asset Target 2055+ Funds Average | 8.86 |
| Spliced Mixed-Asset Target 2055+ Funds Average: Derived from data provided by Lipper, a Thomson Reuters Company. | |
| Vanguard Target Retirement 2060 Fund | 9.39% |
| Target 2060 Composite Index | 9.54 |
| Spliced Mixed-Asset Target 2055+ Funds Average | 8.86 |
| Spliced Mixed-Asset Target 2055+ Funds Average: Derived from data provided by Lipper, a Thomson Reuters Company. | |
| For a benchmark description, see the Glossary. |
Investments in Target Retirement Funds are subject to the risks of their underlying funds. The year in the fund name
refers to the approximate year (the target date) when an investor in the fund would retire and leave the work force.
The fund will gradually shift its emphasis from more aggressive investments to more conservative ones based on its
target date. An investment in a Target Retirement Fund is not guaranteed at any time, including on or after the target
date.
1

Chairman’s Letter
Dear Shareholder,
U.S. stocks notched solid gains—more than double that of international stocks—for the six months ended March 31, 2014. Bonds, meanwhile, recovered some lost ground after slumping in the previous fiscal year as investors worried about the direction of interest rates.
For the half year, returns for all six Target Retirement Funds in this report—the funds dated 2035 through 2060—hovered around 9%. (The Target Retirement Income Fund and the funds with retirement dates of 2010 through 2030 are covered in a separate report.)
Despite recent choppiness, U.S. stocks were productive
The broad U.S. stock market recorded a gain of about 12% for the six months ended March 31, although its path became increasingly rocky over the period’s second half. Corporate earnings, for the most part, continued to rise as the U.S. economy showed modest growth.
The Federal Reserve’s stimulative bond-buying program has helped support the market for several years. Since January, however, the Fed has been making monthly cuts in its purchases, creating some apprehension among investors. Slow economic growth in China and the conflict in Ukraine have also caused market turbulence.
International stocks returned about 5%. The developed markets of Europe, where the economy has improved somewhat,
2
posted strong results; the developed markets of the Pacific region and emerging markets were weaker.
Bonds reclaimed ground after a difficult stretch
Over the six months, the broad U.S. taxable bond market returned 1.70%, a welcome result in view of the market’s struggles for much of calendar-year 2013. The yield of the 10-year Treasury note finished the half year at 2.72%, up from 2.63% at September’s end but down from nearly 3% on December 31. (Bond prices and yields move in opposite directions.)
Many bond investors have been focusing on the possibility of interest rates moving higher and the negative effect that would have on bond prices. However, there’s a flip side to rising rates. As noted recently by the new head of our Fixed Income Group, Greg Davis, long-term investors can benefit over time because they’re “going to be reinvesting those coupon payments and principal payments at higher rates.”
Municipal bonds returned 3.65% for the six months, another major improvement over calendar-year 2013, as investors waded back into the muni market; many had fled last year when challenges surfaced for some issuers. Money market and savings account returns remained meager because of the Fed’s target of 0%–0.25% for short-term interest rates.
International bond markets (as measured by the Barclays Global Aggregate Index ex USD) returned 2.05%.
| Market Barometer | |||
| Total Returns | |||
| Periods Ended March 31, 2014 | |||
| Six | One | Five Years | |
| Months | Year | (Annualized) | |
| Stocks | |||
| Russell 1000 Index (Large-caps) | 12.48% | 22.41% | 21.73% |
| Russell 2000 Index (Small-caps) | 9.94 | 24.90 | 24.31 |
| Russell 3000 Index (Broad U.S. market) | 12.28 | 22.61 | 21.93 |
| FTSE All-World ex US Index (International) | 5.25 | 12.50 | 15.93 |
| Bonds | |||
| Barclays U.S. Aggregate Bond Index (Broad taxable market) | 1.70% | -0.10% | 4.80% |
| Barclays Municipal Bond Index (Broad tax-exempt market) | 3.65 | 0.39 | 5.71 |
| Citigroup Three-Month U.S. Treasury Bill Index | 0.00 | 0.05 | 0.08 |
| CPI | |||
| Consumer Price Index | 0.92% | 1.51% | 2.13% |
3
Underlying stock funds lifted the funds’ results
The Vanguard Target Retirement Funds provide investors access to broadly diversified “funds of funds” that automatically rebalance as the target retirement date approaches. Each portfolio shifts from a growth-oriented, stock-heavy asset allocation to one that is more conservative and more focused on bonds. This gradual shift is critical for investors nearing or in retirement who are increasingly concerned about income and preserving their wealth.
As you’re probably aware, the funds discussed in this report are designed for investors who expect to retire more than 20 years from now. These funds tend to be more focused on building wealth, with a larger proportion of their assets in stocks than their shorter-dated counterparts.
The retirement funds’ heavy allocation to stocks worked in their favor during the period. The 2040 through 2060 Funds, which held about 90% of their assets in stocks and about 10% in bonds, returned more than 9%. The Target Retirement 2035 Fund, the most conservative of the batch with about 84% of its assets in stocks and about 16% in bonds, returned 8.92%.
The Target Retirement Funds’ fixed income component had a limited but positive impact on overall returns. Vanguard Total International Bond Index Fund, a relatively new addition to all six
| Expense Ratios | ||
| Your Fund Compared With Its Peer Group | ||
| Acquired Fund Fees | Peer Group | |
| and Expenses | Average | |
| Target Retirement 2035 Fund | 0.18% | 0.47% |
| Target Retirement 2040 Fund | 0.18 | 0.55 |
| Target Retirement 2045 Fund | 0.18 | 0.47 |
| Target Retirement 2050 Fund | 0.18 | 0.52 |
| Target Retirement 2055 Fund | 0.18 | 0.47 |
| Target Retirement 2060 Fund | 0.18 | 0.47 |
The fund expense figures shown—drawn from the prospectus dated January 27, 2014—represent an estimate of the weighted average of
the expense ratios and any transaction fees charged by the underlying mutual funds (the ”acquired” funds) in which the Target Retirement
Funds invest. The Target Retirement Funds do not charge any expenses or fees of their own. For the six months ended March 31, 2014, the
annualized acquired fund fees and expenses were 0.18% for the 2035 Fund, 0.18% for the 2040 Fund, 0.18% for the 2045 Fund, 0.18% for the
2050 Fund, 0.18% for the 2055 Fund, and 0.18% for the 2060 Fund. Peer-group expense ratios are derived from data provided by Lipper, a
Thomson Reuters Company, and capture information through year-end 2013.
Peer groups: For the 2035 Fund, Mixed-Asset Target 2035 Funds; for the 2040 Fund, Mixed-Asset Target 2040 Funds; for the 2045 Fund,
Mixed-Asset Target 2045 Funds; for the 2050 Fund, Mixed-Asset Target 2050 Funds, for the 2055 and 2060 Funds, Mixed-Asset Target 2055+
Funds.
4
retirement funds, stood out most, with a 2.65% return for the period. International bond prices benefited from central bank policies in Europe and Japan aimed at pushing down interest rates.
Vanguard Total Bond Market II Index Fund, another core holding in the retirement funds, returned 1.65%. U.S. bond prices picked up a bit at the end of 2013 and into early 2014. Demand was spurred by
| The appeal of low-cost investing is growing |
| Minimizing investment costs is a critical part of every investor’s toolkit. Why? Because every |
| dollar paid for fund management expenses is simply a dollar less that can work on your behalf. |
| Put another way, the lower your mutual fund’s costs, the greater your share of the fund’s return. |
| Not surprisingly, research indicates that lower-cost investments have tended to outperform |
| their higher-cost counterparts. |
| Investors are catching on to the value of lower-cost mutual funds. Funds with lower expense |
| ratios dominated in attracting investment dollars over the decade ended December 31, 2012, |
| according to a Vanguard research paper titled Costs Matter: Are Fund Investors Voting With |
| Their Feet? (You can read the paper at vanguard.com/matter.) And, as the chart below shows, |
| Vanguard’s leadership in keeping down costs for investors seems to have encouraged the |
| industry to reduce its average costs—at least over the past decade. |
| Even so, Vanguard’s average expenses continue to be less than one-fifth the industry average: |
| 0.19% versus 1.08% (as of December 31, 2013). That cost difference remains a powerful tool |
| in the hands of Vanguard clients. |
| Vanguard fund costs remain far below industry average |
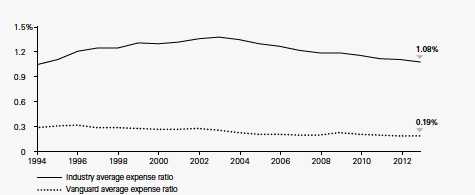
| Sources: Vanguard and Lipper, a Thomson Reuters Company. |
5
concerns about the pace of growth in the United States and China and signs of economic and political instability in some emerging markets.
Divining the future is tricky, but preparing for it is prudent
Predictions are often made but rarely come true. In an interview with our newsletter In The Vanguard, University of Pennsylvania professor Philip Tetlock noted, “As a whole, experts [are] slightly more accurate than the proverbial dart-throwing chimpanzee.”
Dr. Tetlock’s extensive research on the accuracy of predictions found that it’s best to think in terms of probabilities and to avoid bold, specific declarations about what the future holds. At Vanguard, we agree that forecasting the economy and capital markets should be leavened with modesty. Joe Davis, our chief economist, is fond of saying that we “treat the future with the humility it deserves.”
That’s why our economists don’t make the pinpoint projections that you’ll see elsewhere. Instead, using sophisticated statistical models, we provide a range and probability of potential outcomes—for example, the return of U.S. stocks. And we explain our rationale for such outcomes, allowing you to make better-informed decisions about risk and return.
In January, as they do each year, our economists issued Vanguard’s Economic and Investment Outlook. They also update their perspectives periodically and address significant developments, such as changes in Federal Reserve policy. (You can read our most recent outlook at vanguard.com/ research.)
Our forecasts acknowledge that no one can envision every scenario. And that underlines one of Vanguard’s core investment principles: Develop a suitable asset allocation using broadly diversified funds. Having a balanced portfolio can help you get through unforeseen events and achieve your goals—even without a crystal ball.
As always, thank you for investing with Vanguard.
Sincerely,

F. William McNabb III
Chairman and Chief Executive Officer
April 11, 2014
6
| Your Fund’s Performance at a Glance | ||||
| September 30, 2013, Through March 31, 2014 | ||||
| Distributions Per Share | ||||
| Starting | Ending | Income | Capital | |
| Share Price | Share Price | Dividends | Gains | |
| Target Retirement 2035 Fund | $16.16 | $17.27 | $0.324 | $0.000 |
| Target Retirement 2040 Fund | $26.80 | $28.79 | $0.500 | $0.007 |
| Target Retirement 2045 Fund | $16.82 | $18.06 | $0.334 | $0.000 |
| Target Retirement 2050 Fund | $26.69 | $28.66 | $0.518 | $0.000 |
| Target Retirement 2055 Fund | $28.67 | $30.87 | $0.477 | $0.004 |
| Target Retirement 2060 Fund | $25.21 | $27.20 | $0.367 | $0.001 |
7
Target Retirement 2035 Fund
Fund Profile
As of March 31, 2014
| Total Fund Characteristics | |
| Ticker Symbol | VTTHX |
| 30-Day SEC Yield | 2.09% |
| Acquired Fund Fees and Expenses1 | 0.18% |
| Allocation to Underlying Vanguard Funds | |
| Vanguard Total Stock Market Index Fund | |
| Investor Shares | 59.0% |
| Vanguard Total International Stock Index | |
| Fund Investor Shares | 25.3 |
| Vanguard Total Bond Market II Index Fund | |
| Investor Shares | 12.6 |
| Vanguard Total International Bond Index | |
| Fund Investor Shares | 3.1 |
| Total Fund Volatility Measures | ||
| Target 2035 | MSCI US | |
| Composite | Broad Market | |
| Index | Index | |
| R-Squared | 1.00 | 0.97 |
| Beta | 0.99 | 0.90 |
| These measures show the degree and timing of the fund’s fluctuations compared with the indexes over 36 months. | ||
Fund Asset Allocation
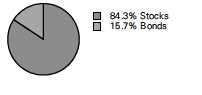
1 This figure—drawn from the prospectus dated January 27, 2014—represents an estimate of the weighted average of the expense ratios and any
transaction fees charged by the underlying mutual funds (the ”acquired” funds) in which the Target Retirement 2035 Fund invests. The fund does not
charge any expenses or fees of its own. For the six months ended March 31, 2014, the annualized acquired fund fees and expenses were 0.18%.
8
All of the returns in this report represent past performance, which is not a guarantee of future results that may be achieved by the fund. (Current performance may be lower or higher than the performance data cited. For performance data current to the most recent month-end, visit our website at vanguard.com/performance.) Note, too, that both investment returns and principal value can fluctuate widely, so an investor’s shares, when sold, could be worth more or less than their original cost. The returns shown do not reflect taxes that a shareholder would pay on fund distributions or on the sale of fund shares.
Fiscal-Year Total Returns (%): October 27, 2003, Through March 31, 2014
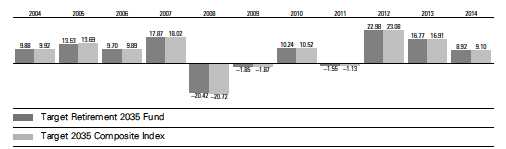
Note: For 2014, performance data reflect the six months ended March 31, 2014.
Average Annual Total Returns: Periods Ended March 31, 2014
| Ten Years | ||||||
| Inception Date | One Year | Five Years | Income | Capital | Total | |
| Target Retirement 2035 | ||||||
| Fund | 10/27/2003 | 16.41% | 18.15% | 2.15% | 4.72% | 6.87% |
See Financial Highlights for dividend and capital gains information.
9
Target Retirement 2035 Fund
Financial Statements (unaudited)
Statement of Net Assets
As of March 31, 2014
The fund reports a complete list of its holdings in regulatory filings four times in each fiscal year, at the quarter-ends. For the second and fourth fiscal quarters, the lists appear in the fund’s semiannual and annual reports to shareholders. For the first and third fiscal quarters, the fund files the lists with the Securities and Exchange Commission on Form N-Q. Shareholders can look up the fund’s Forms N-Q on the SEC’s website at sec.gov. Forms N-Q may also be reviewed and copied at the SEC’s Public Reference Room (see the back cover of this report for further information).
| Market | ||
| Value | ||
| Shares | ($000) | |
| Investment Companies (100.0%) | ||
| U.S. Stock Fund (58.9%) | ||
| Vanguard Total Stock Market Index Fund Investor Shares | 275,079,436 | 13,041,516 |
| International Stock Fund (25.3%) | ||
| Vanguard Total International Stock Index Fund Investor Shares | 334,672,310 | 5,609,108 |
| U.S. Bond Fund (12.6%) | ||
| 1 Vanguard Total Bond Market II Index Fund Investor Shares | 261,887,786 | 2,786,486 |
| International Bond Fund (3.2%) | ||
| Vanguard Total International Bond Index Fund Investor Shares | 68,789,675 | 694,088 |
| Total Investment Companies (Cost $16,712,540) | 22,131,198 | |
| Temporary Cash Investment (0.0%) | ||
| Money Market Fund (0.0%) | ||
| 1 Vanguard Market Liquidity Fund, 0.122% (Cost $5,053) | 5,053,000 | 5,053 |
| Total Investments (100.0%) (Cost $16,717,593) | 22,136,251 | |
| Other Assets and Liabilities (0.0%) | ||
| Other Assets | 110,432 | |
| Liabilities | (105,403) | |
| 5,029 | ||
| Net Assets (100%) | ||
| Applicable to 1,281,917,004 outstanding $.001 par value shares of | ||
| beneficial interest (unlimited authorization) | 22,141,280 | |
| Net Asset Value Per Share | $17.27 | |
10
| Target Retirement 2035 Fund | |
| At March 31, 2014, net assets consisted of: | |
| Amount | |
| ($000) | |
| Paid-in Capital | 16,628,819 |
| Undistributed Net Investment Income | 107,348 |
| Accumulated Net Realized Losses | (13,545) |
| Unrealized Appreciation (Depreciation) | 5,418,658 |
| Net Assets | 22,141,280 |
See Note A in Notes to Financial Statements.
1 Affiliated fund available only to Vanguard funds and certain trusts and accounts managed by Vanguard. Rate shown for Vanguard Market
Liquidity Fund is the 7-day yield.
See accompanying Notes, which are an integral part of the Financial Statements.
11
| Target Retirement 2035 Fund | |
| Statement of Operations | |
| Six Months Ended | |
| March 31, 2014 | |
| ($000) | |
| Investment Income | |
| Income | |
| Income Distributions Received | 230,902 |
| Net Investment Income—Note B | 230,902 |
| Realized Net Gain (Loss) | |
| Capital Gain Distributions Received | 1,185 |
| Investment Securities Sold | 11,403 |
| Realized Net Gain (Loss) | 12,588 |
| Change in Unrealized Appreciation (Depreciation) of Investment Securities | 1,511,482 |
| Net Increase (Decrease) in Net Assets Resulting from Operations | 1,754,972 |
See accompanying Notes, which are an integral part of the Financial Statements.
12
| Target Retirement 2035 Fund | ||
| Statement of Changes in Net Assets | ||
| Six Months Ended | Year Ended | |
| March 31, | September 30, | |
| 2014 | 2013 | |
| ($000) | ($000) | |
| Increase (Decrease) in Net Assets | ||
| Operations | ||
| Net Investment Income | 230,902 | 398,402 |
| Realized Net Gain (Loss) | 12,588 | 45,931 |
| Change in Unrealized Appreciation (Depreciation) | 1,511,482 | 2,193,228 |
| Net Increase (Decrease) in Net Assets Resulting from Operations | 1,754,972 | 2,637,561 |
| Distributions | ||
| Net Investment Income | (393,936) | (326,142) |
| Realized Capital Gain1 | — | (6,374) |
| Total Distributions | (393,936) | (332,516) |
| Capital Share Transactions | ||
| Issued | 3,175,025 | 5,012,842 |
| Issued in Lieu of Cash Distributions | 388,557 | 329,351 |
| Redeemed | (1,809,586) | (2,840,996) |
| Net Increase (Decrease) from Capital Share Transactions | 1,753,996 | 2,501,197 |
| Total Increase (Decrease) | 3,115,032 | 4,806,242 |
| Net Assets | ||
| Beginning of Period | 19,026,248 | 14,220,006 |
| End of Period2 | 22,141,280 | 19,026,248 |
1 Includes fiscal 2013 short-term gain distributions totaling $6,374,000. Short-term gain distributions are treated as ordinary income dividends
for tax purposes.
2 Net Assets—End of Period includes undistributed net investment income of $107,348,000 and $270,382,000.
See accompanying Notes, which are an integral part of the Financial Statements.
13
| Target Retirement 2035 Fund | |||||||
| Financial Highlights | |||||||
| Six Months | |||||||
| Ended | |||||||
| For a Share Outstanding | March 31, | Year Ended September 30, | |||||
| Throughout Each Period | 2014 | 2013 | 2012 | 2011 | 2010 | 2009 | |
| Net Asset Value, Beginning of Period | $16.16 | $14.15 | $11.77 | $12.22 | $11.31 | $11.90 | |
| Investment Operations | |||||||
| Net Investment Income | .178 | .340 | .344 | .235 | .250 | .2731 | |
| Capital Gain Distributions Received | .001 | .011 | .016 | .006 | — | — | |
| Net Realized and Unrealized Gain (Loss) | |||||||
| on Investments | 1.255 | 1.972 | 2.307 | (.402) | .898 | (.564) | |
| Total from Investment Operations | 1.434 | 2.323 | 2.667 | (.161) | 1.148 | (.291) | |
| Distributions | |||||||
| Dividends from Net Investment Income | (. 324) | (. 307) | (. 281) | (. 236) | (. 238) | (. 299) | |
| Distributions from Realized Capital Gains | — | (.006) | (.006) | (.053) | — | — | |
| Total Distributions | (. 324) | (. 313) | (. 287) | (. 289) | (. 238) | (. 299) | |
| Net Asset Value, End of Period | $17.27 | $16.16 | $14.15 | $11.77 | $12.22 | $11.31 | |
| Total Return2 | 8.92% | 16.77% | 22.98% | -1.55% | 10.24% | -1.85% | |
| Ratios/Supplemental Data | |||||||
| Net Assets, End of Period (Millions) | $22,141 | $19,026 | $14,220 | $10,239 | $9,223 | $6,780 | |
| Ratio of Total Expenses to | |||||||
| Average Net Assets | — | — | — | — | — | — | |
| Acquired Fund Fees and Expenses | 0.18% | 0.18% | 0.18% | 0.19% | 0.19% | 0.21% | |
| Ratio of Net Investment Income to | |||||||
| Average Net Assets | 2.23% | 2.33% | 2.68% | 1.81% | 2.24% | 2.88% | |
| Portfolio Turnover Rate | 6% | 12% | 6% | 18%3 | 6% | 9% 4 | |
The expense ratio, acquired fund fees and expenses, net income ratio, and turnover rate for the current period have been annualized.
1 Calculated based on average shares outstanding.
2 Total returns do not include account service fees that may have applied in the periods shown. Fund prospectuses provide information about
any applicable account service fees.
3 Excludes the value of mutual fund shares delivered and received in connection with a change in the fund’s international equity investments
from Vanguard European, Pacific, and Emerging Markets Stock Index Funds to Vanguard Total International Stock Index Fund because those
transactions were effected in kind and did not cause the fund to incur transaction costs.
4 Excludes the value of mutual fund shares delivered and received in connection with a change in the fund’s bond investments from Vanguard
Total Bond Market Index Fund to Vanguard Total Bond Market II Index Fund because those transactions were effected in kind and did not
cause the fund to incur transaction costs.
See accompanying Notes, which are an integral part of the Financial Statements.
14
Target Retirement 2035 Fund
Notes to Financial Statements
Vanguard Target Retirement 2035 Fund is registered under the Investment Company Act of 1940 as an open-end investment company, or mutual fund. The fund follows a balanced investment strategy by investing in selected Vanguard funds to achieve its targeted allocation of assets to U.S. stocks, international stocks, U.S. bonds, and international bonds. Financial statements and other information about each underlying fund are available on vanguard.com.
A. The following significant accounting policies conform to generally accepted accounting principles for U.S. mutual funds. The fund consistently follows such policies in preparing its financial statements.
1. Security Valuation: Investments are valued at the net asset value of each underlying Vanguard fund determined as of the close of the New York Stock Exchange (generally 4 p.m., Eastern time) on the valuation date.
2. Federal Income Taxes: The fund intends to continue to qualify as a regulated investment company and distribute all of its taxable income. Management has analyzed the fund’s tax positions taken for all open federal income tax years (September 30, 2010–2013), and for the period ended March 31, 2014, and has concluded that no provision for federal income tax is required in the fund’s financial statements.
3. Distributions: Distributions to shareholders are recorded on the ex-dividend date.
4. Credit Facility: The fund and certain other funds managed by The Vanguard Group participate in a $2.89 billion committed credit facility provided by a syndicate of lenders pursuant to a credit agreement which may be renewed annually; each fund is individually liable for its borrowings, if any, under the credit facility. Borrowings may be utilized for temporary and emergency purposes, and are subject to the fund’s regulatory and contractual borrowing restrictions. The participating funds are charged administrative fees and an annual commitment fee of 0.06% of the undrawn amount of the facility, which are allocated to the funds in accordance with a methodology approved by the board of trustees and borne by the funds in which the fund invests (See Note B). Any borrowings under this facility bear interest at a rate equal to the higher of the Federal Funds Rate or LIBOR Reference Rate plus an agreed-upon spread.
The fund had no borrowings outstanding at March 31, 2014, or at any time during the period then ended.
5. Other: Income and capital gain distributions received are recorded on the ex-dividend date. Security transactions are accounted for on the date securities are bought or sold. Costs used to determine realized gains (losses) on the sale of investment securities are those of the specific securities sold.
B. Under a service agreement, The Vanguard Group furnishes investment advisory, corporate management, administrative, marketing, and distribution services to the fund. The service agreement provides that the fund’s expenses may be reduced or eliminated to the extent of savings realized by the Vanguard funds by the operation of the fund. Accordingly, all incremental expenses for services provided by Vanguard and all other expenses incurred by the fund during the period ended March 31, 2014, were borne by the funds in which the fund invests. The fund’s trustees and officers are also directors and officers of Vanguard and the funds in which the fund invests.
C. Various inputs may be used to determine the value of the fund’s investments. These inputs are summarized in three broad levels for financial statement purposes. The inputs or methodologies used to value securities are not necessarily an indication of the risk associated with investing in those securities.
15
Target Retirement 2035 Fund
Level 1—Quoted prices in active markets for identical securities.
Level 2—Other significant observable inputs (including quoted prices for similar securities, interest rates, prepayment speeds, credit risk, etc.).
Level 3—Significant unobservable inputs (including the fund’s own assumptions used to determine the fair value of investments).
At March 31, 2014, 100% of the market value of the fund’s investments was determined based on Level 1 inputs.
D. Distributions are determined on a tax basis and may differ from net investment income and realized capital gains for financial reporting purposes. Differences may be permanent or temporary. Permanent differences are reclassified among capital accounts in the financial statements to reflect their tax character. Temporary differences arise when certain items of income, expense, gain, or loss are recognized in different periods for financial statement and tax purposes. These differences will reverse at some time in the future. Differences in classification may also result from the treatment of short-term gains as ordinary income for tax purposes.
The fund’s tax-basis capital gains and losses are determined only at the end of each fiscal year. For tax purposes, at September 30, 2013, the fund had available capital losses totaling $23,213,000 that may be carried forward indefinitely to offset future net capital gains. The fund will use these capital losses to offset net taxable capital gains, if any, realized during the year ending September 30, 2014; should the fund realize net capital losses for the year, the losses will be added to the loss carryforward balance above.
At March 31, 2014, the cost of investment securities for tax purposes was $16,717,593,000. Net unrealized appreciation of investment securities for tax purposes was $5,418,658,000, consisting of unrealized gains of $5,423,291,000 on securities that had risen in value since their purchase and $4,633,000 in unrealized losses on securities that had fallen in value since their purchase.
E. During the six months ended March 31, 2014, the fund purchased $2,257,255,000 of investment securities and sold $670,348,000 of investment securities, other than temporary cash investments.
F. Capital shares issued and redeemed were:
| Six Months Ended | Year Ended | |
| March 31, 2014 | September 30, 2013 | |
| Shares | Shares | |
| (000) | (000) | |
| Issued | 188,611 | 335,609 |
| Issued in Lieu of Cash Distributions | 23,005 | 23,660 |
| Redeemed | (107,049) | (186,558) |
| Net Increase (Decrease) in Shares Outstanding | 104,567 | 172,711 |
G. Management has determined that no material events or transactions occurred subsequent to March 31, 2014, that would require recognition or disclosure in these financial statements.
16
Target Retirement 2040 Fund
Fund Profile
As of March 31, 2014
| Total Fund Characteristics | |
| Ticker Symbol | VFORX |
| 30-Day SEC Yield | 2.09% |
| Acquired Fund Fees and Expenses1 | 0.18% |
| Allocation to Underlying Vanguard Funds | |
| Vanguard Total Stock Market Index Fund | |
| Investor Shares | 62.9% |
| Vanguard Total International Stock Index | |
| Fund Investor Shares | 27.0 |
| Vanguard Total Bond Market II Index Fund | |
| Investor Shares | 8.1 |
| Vanguard Total International Bond Index | |
| Fund Investor Shares | 2.0 |
| Total Fund Volatility Measures | ||
| Target 2040 | MSCI US | |
| Composite | Broad Market | |
| Index | Index | |
| R-Squared | 1.00 | 0.97 |
| Beta | 1.00 | 0.93 |
| These measures show the degree and timing of the fund’s fluctuations compared with the indexes over 36 months. | ||
Fund Asset Allocation
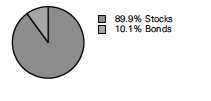
1 This figure—drawn from the prospectus dated January 27, 2014—represents an estimate of the weighted average of the expense ratios and any
transaction fees charged by the underlying mutual funds (the ”acquired” funds) in which the Target Retirement 2040 Fund invests. The fund does not
charge any expenses or fees of its own. For the six months ended March 31, 2014, the annualized acquired fund fees and expenses were 0.18%.
17
Target Retirement 2040 Fund
Performance Summary
All of the returns in this report represent past performance, which is not a guarantee of future results that may be achieved by the fund. (Current performance may be lower or higher than the performance data cited. For performance data current to the most recent month-end, visit our website at vanguard.com/performance.) Note, too, that both investment returns and principal value can fluctuate widely, so an investor’s shares, when sold, could be worth more or less than their original cost. The returns shown do not reflect taxes that a shareholder would pay on fund distributions or on the sale of fund shares.
Fiscal-Year Total Returns (%): June 7, 2006, Through March 31, 2014
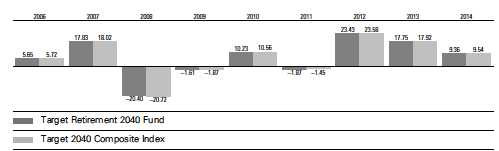
Note: For 2014, performance data reflect the six months ended March 31, 2014.
| Average Annual Total Returns: Periods Ended March 31, 2014 | |||||
| Since Inception | |||||
| Inception Date One Year | Five Years | Income | Capital | Total | |
| Target Retirement 2040 | |||||
| Fund | 6/7/2006 17.47% | 18.44% | 2.00% | 4.83% | 6.83% |
See Financial Highlights for dividend and capital gains information.
18
Target Retirement 2040 Fund
Financial Statements (unaudited)
Statement of Net Assets
As of March 31, 2014
The fund reports a complete list of its holdings in regulatory filings four times in each fiscal year, at the quarter-ends. For the second and fourth fiscal quarters, the lists appear in the fund’s semiannual and annual reports to shareholders. For the first and third fiscal quarters, the fund files the lists with the Securities and Exchange Commission on Form N-Q. Shareholders can look up the fund’s Forms N-Q on the SEC’s website at sec.gov. Forms N-Q may also be reviewed and copied at the SEC’s Public Reference Room (see the back cover of this report for further information).
| Market | ||
| Value | ||
| Shares | ($000) | |
| Investment Companies (99.8%) | ||
| U.S. Stock Fund (62.8%) | ||
| Vanguard Total Stock Market Index Fund Investor Shares | 190,924,119 | 9,051,712 |
| International Stock Fund (27.0%) | ||
| Vanguard Total International Stock Index Fund Investor Shares | 231,721,911 | 3,883,659 |
| U.S. Bond Fund (8.0%) | ||
| 1 Vanguard Total Bond Market II Index Fund Investor Shares | 108,854,682 | 1,158,214 |
| International Bond Fund (2.0%) | ||
| Vanguard Total International Bond Index Fund Investor Shares | 28,592,744 | 288,501 |
| Total Investment Companies (Cost $10,998,175) | 14,382,086 | |
| Temporary Cash Investment (0.1%) | ||
| Money Market Fund (0.1%) | ||
| 1 Vanguard Market Liquidity Fund, 0.122% (Cost $8,881) | 8,881,083 | 8,881 |
| Total Investments (99.9%) (Cost $11,007,056) | 14,390,967 | |
| Other Assets and Liabilities (0.1%) | ||
| Other Assets | 73,952 | |
| Liabilities | (60,450) | |
| 13,502 | ||
| Net Assets (100%) | ||
| Applicable to 500,273,035 outstanding $.001 par value shares of | ||
| beneficial interest (unlimited authorization) | 14,404,469 | |
| Net Asset Value Per Share | $28.79 | |
19
| Target Retirement 2040 Fund | |
| At March 31, 2014, net assets consisted of: | |
| Amount | |
| ($000) | |
| Paid-in Capital | 10,945,219 |
| Undistributed Net Investment Income | 70,213 |
| Accumulated Net Realized Gains | 5,126 |
| Unrealized Appreciation (Depreciation) | 3,383,911 |
| Net Assets | 14,404,469 |
See Note A in Notes to Financial Statements.
1 Affiliated fund available only to Vanguard funds and certain trusts and accounts managed by Vanguard. Rate shown for Vanguard Market
Liquidity Fund is the 7-day yield.
See accompanying Notes, which are an integral part of the Financial Statements.
20
| Target Retirement 2040 Fund | |
| Statement of Operations | |
| Six Months Ended | |
| March 31, 2014 | |
| ($000) | |
| Investment Income | |
| Income | |
| Income Distributions Received | 148,915 |
| Net Investment Income—Note B | 148,915 |
| Realized Net Gain (Loss) | |
| Capital Gain Distributions Received | 495 |
| Investment Securities Sold | 10,129 |
| Realized Net Gain (Loss) | 10,624 |
| Change in Unrealized Appreciation (Depreciation) of Investment Securities | 1,018,205 |
| Net Increase (Decrease) in Net Assets Resulting from Operations | 1,177,744 |
See accompanying Notes, which are an integral part of the Financial Statements.
21
| Target Retirement 2040 Fund | ||
| Statement of Changes in Net Assets | ||
| Six Months Ended | Year Ended | |
| March 31, | September 30, | |
| 2014 | 2013 | |
| ($000) | ($000) | |
| Increase (Decrease) in Net Assets | ||
| Operations | ||
| Net Investment Income | 148,915 | 241,052 |
| Realized Net Gain (Loss) | 10,624 | 5,883 |
| Change in Unrealized Appreciation (Depreciation) | 1,018,205 | 1,425,108 |
| Net Increase (Decrease) in Net Assets Resulting from Operations | 1,177,744 | 1,672,043 |
| Distributions | ||
| Net Investment Income | (233,406) | (184,948) |
| Realized Capital Gain1 | (3,268) | (2,610) |
| Total Distributions | (236,674) | (187,558) |
| Capital Share Transactions | ||
| Issued | 2,572,812 | 4,047,039 |
| Issued in Lieu of Cash Distributions | 232,555 | 184,925 |
| Redeemed | (1,354,909) | (1,685,838) |
| Net Increase (Decrease) from Capital Share Transactions | 1,450,458 | 2,546,126 |
| Total Increase (Decrease) | 2,391,528 | 4,030,611 |
| Net Assets | ||
| Beginning of Period | 12,012,941 | 7,982,330 |
| End of Period2 | 14,404,469 | 12,012,941 |
1 Includes fiscal 2014 and 2013 short-term gain distributions totaling $467,000 and $2,610,000, respectively. Short-term gain distributions are
treated as ordinary income dividends for tax purposes.
2 Net Assets—End of Period includes undistributed net investment income of $70,213,000 and $154,704,000.
See accompanying Notes, which are an integral part of the Financial Statements.
22
| Target Retirement 2040 Fund | |||||||
| Financial Highlights | |||||||
| Six Months | |||||||
| Ended | |||||||
| For a Share Outstanding | March 31, | Year Ended September 30, | |||||
| Throughout Each Period | 2014 | 2013 | 2012 | 2011 | 2010 | 2009 | |
| Net Asset Value, Beginning of Period | $26.80 | $23.26 | $19.26 | $20.03 | $18.52 | $19.36 | |
| Investment Operations | |||||||
| Net Investment Income | .295 | .546 | .559 | .369 | .393 | .4351 | |
| Capital Gain Distributions Received | .001 | .012 | .022 | .006 | — | — | |
| Net Realized and Unrealized Gain (Loss) | |||||||
| on Investments | 2.201 | 3.485 | 3.872 | (.705) | 1.485 | (.849) | |
| Total from Investment Operations | 2.497 | 4.043 | 4.453 | (.330) | 1.878 | (.414) | |
| Distributions | |||||||
| Dividends from Net Investment Income | (. 500) | (. 496) | (. 444) | (. 368) | (. 368) | (. 426) | |
| Distributions from Realized Capital Gains | (. 007) | (. 007) | (. 009) | (. 072) | — | — | |
| Total Distributions | (. 507) | (. 503) | (. 453) | (. 440) | (. 368) | (. 426) | |
| Net Asset Value, End of Period | $28.79 | $26.80 | $23.26 | $19.26 | $20.03 | $18.52 | |
| Total Return2 | 9.36% | 17.75% | 23.43% | -1.87% | 10.23% | -1.61% | |
| Ratios/Supplemental Data | |||||||
| Net Assets, End of Period (Millions) $14,404 | $12,013 | $7,982 | $4,977 | $3,831 | $2,330 | ||
| Ratio of Total Expenses to | |||||||
| Average Net Assets | — | — | — | — | — | — | |
| Acquired Fund Fees and Expenses | 0.18% | 0.18% | 0.18% | 0.19% | 0.19% | 0.21% | |
| Ratio of Net Investment Income to | |||||||
| Average Net Assets | 2.25% | 2.36% | 2.69% | 1.79% | 2.23% | 2.78% | |
| Portfolio Turnover Rate | 7% | 9% | 3% | 15%3 | 7% | 9%4 | |
The expense ratio, acquired fund fees and expenses, net income ratio, and turnover rate for the current period have been annualized.
1 Calculated based on average shares outstanding.
2 Total returns do not include account service fees that may have applied in the periods shown. Fund prospectuses provide information about
any applicable account service fees.
3 Excludes the value of mutual fund shares delivered and received in connection with a change in the fund’s international equity investments
from Vanguard European, Pacific, and Emerging Markets Stock Index Funds to Vanguard Total International Stock Index Fund because those
transactions were effected in kind and did not cause the fund to incur transaction costs.
4 Excludes the value of mutual fund shares delivered and received in connection with a change in the fund’s bond investments from Vanguard
Total Bond Market Index Fund to Vanguard Total Bond Market II Index Fund because those transactions were effected in kind and did not
cause the fund to incur transaction costs.
See accompanying Notes, which are an integral part of the Financial Statements.
23
Target Retirement 2040 Fund
Notes to Financial Statements
Vanguard Target Retirement 2040 Fund is registered under the Investment Company Act of 1940 as an open-end investment company, or mutual fund. The fund follows a balanced investment strategy by investing in selected Vanguard funds to achieve its targeted allocation of assets to U.S. stocks, international stocks, U.S. bonds, and international bonds. Financial statements and other information about each underlying fund are available on vanguard.com.
A. The following significant accounting policies conform to generally accepted accounting principles for U.S. mutual funds. The fund consistently follows such policies in preparing its financial statements.
1. Security Valuation: Investments are valued at the net asset value of each underlying Vanguard fund determined as of the close of the New York Stock Exchange (generally 4 p.m., Eastern time) on the valuation date.
2. Federal Income Taxes: The fund intends to continue to qualify as a regulated investment company and distribute all of its taxable income. Management has analyzed the fund’s tax positions taken for all open federal income tax years (September 30, 2010–2013), and for the period ended March 31, 2014, and has concluded that no provision for federal income tax is required in the fund’s financial statements.
3. Distributions: Distributions to shareholders are recorded on the ex-dividend date.
4. Credit Facility: The fund and certain other funds managed by The Vanguard Group participate in a $2.89 billion committed credit facility provided by a syndicate of lenders pursuant to a credit agreement which may be renewed annually; each fund is individually liable for its borrowings, if any, under the credit facility. Borrowings may be utilized for temporary and emergency purposes, and are subject to the fund’s regulatory and contractual borrowing restrictions. The participating funds are charged administrative fees and an annual commitment fee of 0.06% of the undrawn amount of the facility, which are allocated to the funds in accordance with a methodology approved by the board of trustees and borne by the funds in which the fund invests (See Note B). Any borrowings under this facility bear interest at a rate equal to the higher of the Federal Funds Rate or LIBOR Reference Rate plus an agreed-upon spread.
The fund had no borrowings outstanding at March 31, 2014, or at any time during the period then ended.
5. Other: Income and capital gain distributions received are recorded on the ex-dividend date. Security transactions are accounted for on the date securities are bought or sold. Costs used to determine realized gains (losses) on the sale of investment securities are those of the specific securities sold.
B. Under a service agreement, The Vanguard Group furnishes investment advisory, corporate management, administrative, marketing, and distribution services to the fund. The service agreement provides that the fund’s expenses may be reduced or eliminated to the extent of savings realized by the Vanguard funds by the operation of the fund. Accordingly, all incremental expenses for services provided by Vanguard and all other expenses incurred by the fund during the period ended March 31, 2014, were borne by the funds in which the fund invests. The fund’s trustees and officers are also directors and officers of Vanguard and the funds in which the fund invests.
C. Various inputs may be used to determine the value of the fund’s investments. These inputs are summarized in three broad levels for financial statement purposes. The inputs or methodologies used to value securities are not necessarily an indication of the risk associated with investing in those securities.
24
Target Retirement 2040 Fund
Level 1—Quoted prices in active markets for identical securities.
Level 2—Other significant observable inputs (including quoted prices for similar securities, interest rates, prepayment speeds, credit risk, etc.).
Level 3—Significant unobservable inputs (including the fund’s own assumptions used to determine the fair value of investments).
At March 31, 2014, 100% of the market value of the fund’s investments was determined based on Level 1 inputs.
D. Distributions are determined on a tax basis and may differ from net investment income and realized capital gains for financial reporting purposes. Differences may be permanent or temporary. Permanent differences are reclassified among capital accounts in the financial statements to reflect their tax character. Temporary differences arise when certain items of income, expense, gain, or loss are recognized in different periods for financial statement and tax purposes. These differences will reverse at some time in the future. Differences in classification may also result from the treatment of short-term gains as ordinary income for tax purposes. The fund’s tax-basis capital gains and losses are determined only at the end of each fiscal year.
At March 31, 2014, the cost of investment securities for tax purposes was $11,007,056,000. Net unrealized appreciation of investment securities for tax purposes was $3,383,911,000, consisting of unrealized gains of $3,385,882,000 on securities that had risen in value since their purchase and $1,971,000 in unrealized losses on securities that had fallen in value since their purchase.
E. During the six months ended March 31, 2014, the fund purchased $1,827,999,000 of investment securities and sold $481,108,000 of investment securities, other than temporary cash investments.
F. Capital shares issued and redeemed were:
| Six Months Ended | Year Ended | |
| March 31, 2014 | September 30, 2013 | |
| Shares | Shares | |
| (000) | (000) | |
| Issued | 91,897 | 164,144 |
| Issued in Lieu of Cash Distributions | 8,261 | 8,082 |
| Redeemed | (48,159) | (67,148) |
| Net Increase (Decrease) in Shares Outstanding | 51,999 | 105,078 |
G. Management has determined that no material events or transactions occurred subsequent to March 31, 2014, that would require recognition or disclosure in these financial statements.
25
Target Retirement 2045 Fund
Fund Profile
As of March 31, 2014
| Total Fund Characteristics | |
| Ticker Symbol | VTIVX |
| 30-Day SEC Yield | 2.09% |
| Acquired Fund Fees and Expenses1 | 0.18% |
| Allocation to Underlying Vanguard Funds | |
| Vanguard Total Stock Market Index Fund | |
| Investor Shares | 62.9% |
| Vanguard Total International Stock Index | |
| Fund Investor Shares | 27.1 |
| Vanguard Total Bond Market II Index Fund | |
| Investor Shares | 8.0 |
| Vanguard Total International Bond Index | |
| Fund Investor Shares | 2.0 |
| Total Fund Volatility Measures | ||
| Target 2045 | MSCI US | |
| Composite | Broad Market | |
| Index | Index | |
| R-Squared | 1.00 | 0.97 |
| Beta | 1.00 | 0.93 |
| These measures show the degree and timing of the fund’s fluctuations compared with the indexes over 36 months. | ||
Fund Asset Allocation
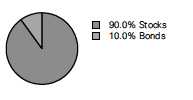
1 This figure—drawn from the prospectus dated January 27, 2014—represents an estimate of the weighted average of the expense ratios and any
transaction fees charged by the underlying mutual funds (the ”acquired” funds) in which the Target Retirement 2045 Fund invests. The fund does not
charge any expenses or fees of its own. For the six months ended March 31, 2014, the annualized acquired fund fees and expenses were 0.18%.
26
Target Retirement 2045 Fund
Performance Summary
All of the returns in this report represent past performance, which is not a guarantee of future results that may be achieved by the fund. (Current performance may be lower or higher than the performance data cited. For performance data current to the most recent month-end, visit our website at vanguard.com/performance.) Note, too, that both investment returns and principal value can fluctuate widely, so an investor’s shares, when sold, could be worth more or less than their original cost. The returns shown do not reflect taxes that a shareholder would pay on fund distributions or on the sale of fund shares.
Fiscal-Year Total Returns (%): October 27, 2003, Through March 31, 2014
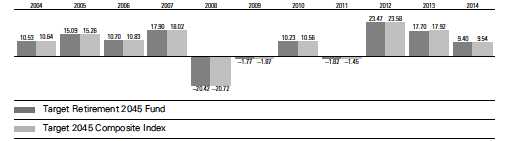
Note: For 2014, performance data reflect the six months ended March 31, 2014.
Average Annual Total Returns: Periods Ended March 31, 2014
| Ten Years | ||||||
| Inception Date | One Year | Five Years | Income | Capital | Total | |
| Target Retirement 2045 | ||||||
| Fund | 10/27/2003 | 17.51% | 18.46% | 2.09% | 5.16% | 7.25% |
See Financial Highlights for dividend and capital gains information.
27
Target Retirement 2045 Fund
Financial Statements (unaudited)
Statement of Net Assets
As of March 31, 2014
The fund reports a complete list of its holdings in regulatory filings four times in each fiscal year, at the quarter-ends. For the second and fourth fiscal quarters, the lists appear in the fund’s semiannual and annual reports to shareholders. For the first and third fiscal quarters, the fund files the lists with the Securities and Exchange Commission on Form N-Q. Shareholders can look up the fund’s Forms N-Q on the SEC’s website at sec.gov. Forms N-Q may also be reviewed and copied at the SEC’s Public Reference Room (see the back cover of this report for further information).
| Market | ||
| Value | ||
| Shares | ($000) | |
| Investment Companies (100.0%) | ||
| U.S. Stock Fund (62.9%) | ||
| Vanguard Total Stock Market Index Fund Investor Shares | 177,354,432 | 8,408,374 |
| International Stock Fund (27.1%) | ||
| Vanguard Total International Stock Index Fund Investor Shares | 215,816,528 | 3,617,085 |
| U.S. Bond Fund (8.0%) | ||
| 1 Vanguard Total Bond Market II Index Fund Investor Shares | 99,973,091 | 1,063,714 |
| International Bond Fund (2.0%) | ||
| Vanguard Total International Bond Index Fund Investor Shares | 26,258,946 | 264,953 |
| Total Investment Companies (Cost $10,031,662) | 13,354,126 | |
| Temporary Cash Investment (0.0%) | ||
| Money Market Fund (0.0%) | ||
| 1 Vanguard Market Liquidity Fund, 0.122% (Cost $6,523) | 6,523,444 | 6,523 |
| Total Investments (100.0%) (Cost $10,038,185) | 13,360,649 | |
| Other Assets and Liabilities (0.0%) | ||
| Other Assets | 47,675 | |
| Liabilities | (42,306) | |
| 5,369 | ||
| Net Assets (100%) | ||
| Applicable to 740,088,262 outstanding $.001 par value shares of | ||
| beneficial interest (unlimited authorization) | 13,366,018 | |
| Net Asset Value Per Share | $18.06 | |
28
Target Retirement 2045 Fund
| At March 31, 2014, net assets consisted of: | |
| Amount | |
| ($000) | |
| Paid-in Capital | 9,995,289 |
| Undistributed Net Investment Income | 64,813 |
| Accumulated Net Realized Losses | (16,548) |
| Unrealized Appreciation (Depreciation) | 3,322,464 |
| Net Assets | 13,366,018 |
See Note A in Notes to Financial Statements.
1 Affiliated fund available only to Vanguard funds and certain trusts and accounts managed by Vanguard. Rate shown for Vanguard Market
Liquidity Fund is the 7-day yield.
See accompanying Notes, which are an integral part of the Financial Statements.
29
| Target Retirement 2045 Fund | |
| Statement of Operations | |
| Six Months Ended | |
| March 31, 2014 | |
| ($000) | |
| Investment Income | |
| Income | |
| Income Distributions Received | 139,639 |
| Net Investment Income—Note B | 139,639 |
| Realized Net Gain (Loss) | |
| Capital Gain Distributions Received | 469 |
| Investment Securities Sold | 7,561 |
| Realized Net Gain (Loss) | 8,030 |
| Change in Unrealized Appreciation (Depreciation) of Investment Securities | 960,988 |
| Net Increase (Decrease) in Net Assets Resulting from Operations | 1,108,657 |
See accompanying Notes, which are an integral part of the Financial Statements.
30
| Target Retirement 2045 Fund | ||
| Statement of Changes in Net Assets | ||
| Six Months Ended | Year Ended | |
| March 31, | September 30, | |
| 2014 | 2013 | |
| ($000) | ($000) | |
| Increase (Decrease) in Net Assets | ||
| Operations | ||
| Net Investment Income | 139,639 | 234,541 |
| Realized Net Gain (Loss) | 8,030 | 9,477 |
| Change in Unrealized Appreciation (Depreciation) | 960,988 | 1,382,551 |
| Net Increase (Decrease) in Net Assets Resulting from Operations | 1,108,657 | 1,626,569 |
| Distributions | ||
| Net Investment Income | (234,724) | (186,901) |
| Realized Capital Gain1 | — | (2,957) |
| Total Distributions | (234,724) | (189,858) |
| Capital Share Transactions | ||
| Issued | 2,040,157 | 3,187,991 |
| Issued in Lieu of Cash Distributions | 231,885 | 188,279 |
| Redeemed | (1,221,078) | (1,534,886) |
| Net Increase (Decrease) from Capital Share Transactions | 1,050,964 | 1,841,384 |
| Total Increase (Decrease) | 1,924,897 | 3,278,095 |
| Net Assets | ||
| Beginning of Period | 11,441,121 | 8,163,026 |
| End of Period2 | 13,366,018 | 11,441,121 |
1 Includes fiscal 2013 short-term gain distributions totaling $2,957,000. Short-term gain distributions are treated as ordinary income dividends
for tax purposes.
2 Net Assets—End of Period includes undistributed net investment income of $64,813,000 and $159,898,000.
See accompanying Notes, which are an integral part of the Financial Statements.
31
| Target Retirement 2045 Fund | |||||||
| Financial Highlights | |||||||
| Six Months | |||||||
| Ended | |||||||
| For a Share Outstanding | March 31, | Year Ended September 30, | |||||
| Throughout Each Period | 2014 | 2013 | 2012 | 2011 | 2010 | 2009 | |
| Net Asset Value, Beginning of Period | $16.82 | $14.61 | $12.10 | $12.64 | $11.70 | $12.29 | |
| Investment Operations | |||||||
| Net Investment Income | .187 | .350 | .354 | .237 | .257 | .2811 | |
| Capital Gain Distributions Received | .001 | .008 | .014 | .005 | — | — | |
| Net Realized and Unrealized Gain (Loss) | |||||||
| on Investments | 1.386 | 2.173 | 2.433 | (.436) | .929 | (.570) | |
| Total from Investment Operations | 1.574 | 2.531 | 2.801 | (.194) | 1.186 | (.289) | |
| Distributions | |||||||
| Dividends from Net Investment Income | (. 334) | (. 316) | (. 286) | (. 242) | (. 246) | (. 301) | |
| Distributions from Realized Capital Gains | — | (.005) | (.005) | (.104) | — | — | |
| Total Distributions | (. 334) | (. 321) | (. 291) | (. 346) | (. 246) | (. 301) | |
| Net Asset Value, End of Period | $18.06 | $16.82 | $14.61 | $12.10 | $12.64 | $11.70 | |
| Total Return2 | 9.40% | 17.70% | 23.47% | -1.82% | 10.23% | -1.77% | |
| Ratios/Supplemental Data | |||||||
| Net Assets, End of Period (Millions) | $13,366 | $11,441 | $8,163 | $5,702 | $4,918 | $3,560 | |
| Ratio of Total Expenses to | |||||||
| Average Net Assets | — | — | — | — | — | — | |
| Acquired Fund Fees and Expenses | 0.18% | 0.18% | 0.18% | 0.19% | 0.19% | 0.21% | |
| Ratio of Net Investment Income to | |||||||
| Average Net Assets | 2.24% | 2.36% | 2.70% | 1.79% | 2.24% | 2.86% | |
| Portfolio Turnover Rate | 8% | 10% | 7% | 16%3 | 6% | 10% 4 | |
The expense ratio, acquired fund fees and expenses, net income ratio, and turnover rate for the current period have been annualized.
1 Calculated based on average shares outstanding.
2 Total returns do not include account service fees that may have applied in the periods shown. Fund prospectuses provide information about
any applicable account service fees.
3 Excludes the value of mutual fund shares delivered and received in connection with a change in the fund’s international equity investments
from Vanguard European, Pacific, and Emerging Markets Stock Index Funds to Vanguard Total International Stock Index Fund because those
transactions were effected in kind and did not cause the fund to incur transaction costs.
4 Excludes the value of mutual fund shares delivered and received in connection with a change in the fund’s bond investments from Vanguard
Total Bond Market Index Fund to Vanguard Total Bond Market II Index Fund because those transactions were effected in kind and did not
cause the fund to incur transaction costs.
See accompanying Notes, which are an integral part of the Financial Statements.
32
Target Retirement 2045 Fund
Notes to Financial Statements
Vanguard Target Retirement 2045 Fund is registered under the Investment Company Act of 1940 as an open-end investment company, or mutual fund. The fund follows a balanced investment strategy by investing in selected Vanguard funds to achieve its targeted allocation of assets to U.S. stocks, international stocks, U.S. bonds, and international bonds. Financial statements and other information about each underlying fund are available on vanguard.com.
A. The following significant accounting policies conform to generally accepted accounting principles for U.S. mutual funds. The fund consistently follows such policies in preparing its financial statements.
1. Security Valuation: Investments are valued at the net asset value of each underlying Vanguard fund determined as of the close of the New York Stock Exchange (generally 4 p.m., Eastern time) on the valuation date.
2. Federal Income Taxes: The fund intends to continue to qualify as a regulated investment company and distribute all of its taxable income. Management has analyzed the fund’s tax positions taken for all open federal income tax years (September 30, 2010–2013), and for the period ended March 31, 2014, and has concluded that no provision for federal income tax is required in the fund’s financial statements.
3. Distributions: Distributions to shareholders are recorded on the ex-dividend date.
4. Credit Facility: The fund and certain other funds managed by The Vanguard Group participate in a $2.89 billion committed credit facility provided by a syndicate of lenders pursuant to a credit agreement which may be renewed annually; each fund is individually liable for its borrowings, if any, under the credit facility. Borrowings may be utilized for temporary and emergency purposes, and are subject to the fund’s regulatory and contractual borrowing restrictions. The participating funds are charged administrative fees and an annual commitment fee of 0.06% of the undrawn amount of the facility, which are allocated to the funds in accordance with a methodology approved by the board of trustees and borne by the funds in which the fund invests (See Note B). Any borrowings under this facility bear interest at a rate equal to the higher of the Federal Funds Rate or LIBOR Reference Rate plus an agreed-upon spread.
The fund had no borrowings outstanding at March 31, 2014, or at any time during the period then ended.
5. Other: Income and capital gain distributions received are recorded on the ex-dividend date. Security transactions are accounted for on the date securities are bought or sold. Costs used to determine realized gains (losses) on the sale of investment securities are those of the specific securities sold.
B. Under a service agreement, The Vanguard Group furnishes investment advisory, corporate management, administrative, marketing, and distribution services to the fund. The service agreement provides that the fund’s expenses may be reduced or eliminated to the extent of savings realized by the Vanguard funds by the operation of the fund. Accordingly, all incremental expenses for services provided by Vanguard and all other expenses incurred by the fund during the period ended March 31, 2014, were borne by the funds in which the fund invests. The fund’s trustees and officers are also directors and officers of Vanguard and the funds in which the fund invests.
C. Various inputs may be used to determine the value of the fund’s investments. These inputs are summarized in three broad levels for financial statement purposes. The inputs or methodologies used to value securities are not necessarily an indication of the risk associated with investing in those securities.
33
Target Retirement 2045 Fund
Level 1—Quoted prices in active markets for identical securities.
Level 2—Other significant observable inputs (including quoted prices for similar securities, interest rates, prepayment speeds, credit risk, etc.).
Level 3—Significant unobservable inputs (including the fund’s own assumptions used to determine the fair value of investments).
At March 31, 2014, 100% of the market value of the fund’s investments was determined based on Level 1 inputs.
D. Distributions are determined on a tax basis and may differ from net investment income and realized capital gains for financial reporting purposes. Differences may be permanent or temporary. Permanent differences are reclassified among capital accounts in the financial statements to reflect their tax character. Temporary differences arise when certain items of income, expense, gain, or loss are recognized in different periods for financial statement and tax purposes. These differences will reverse at some time in the future. Differences in classification may also result from the treatment of short-term gains as ordinary income for tax purposes.
The fund’s tax-basis capital gains and losses are determined only at the end of each fiscal year. For tax purposes, at September 30, 2013, the fund had available capital losses totaling $22,317,000 that may be carried forward indefinitely to offset future net capital gains. The fund will use these capital losses to offset net taxable capital gains, if any, realized during the year ending September 30, 2014; should the fund realize net capital losses for the year, the losses will be added to the loss carryforward balance above.
At March 31, 2014, the cost of investment securities for tax purposes was $10,038,185,000. Net unrealized appreciation of investment securities for tax purposes was $3,322,464,000, consisting of unrealized gains of $3,324,443,000 on securities that had risen in value since their purchase and $1,979,000 in unrealized losses on securities that had fallen in value since their purchase.
E. During the six months ended March 31, 2014, the fund purchased $1,438,668,000 of investment securities and sold $481,428,000 of investment securities, other than temporary cash investments.
F. Capital shares issued and redeemed were:
| Six Months Ended | Year Ended | |
| March 31, 2014 | September 30, 2013 | |
| Shares | Shares | |
| (000) | (000) | |
| Issued | 116,049 | 205,525 |
| Issued in Lieu of Cash Distributions | 13,131 | 13,102 |
| Redeemed | (69,162) | (97,476) |
| Net Increase (Decrease) in Shares Outstanding | 60,018 | 121,151 |
G. Management has determined that no material events or transactions occurred subsequent to March 31, 2014, that would require recognition or disclosure in these financial statements.
34
Target Retirement 2050 Fund
Fund Profile
As of March 31, 2014
| Total Fund Characteristics | |
| Ticker Symbol | VFIFX |
| 30-Day SEC Yield | 2.10% |
| Acquired Fund Fees and Expenses1 | 0.18% |
| Allocation to Underlying Vanguard Funds | |
| Vanguard Total Stock Market Index Fund | |
| Investor Shares | 63.0% |
| Vanguard Total International Stock Index | |
| Fund Investor Shares | 27.1 |
| Vanguard Total Bond Market II Index Fund | |
| Investor Shares | 7.9 |
| Vanguard Total International Bond Index | |
| Fund Investor Shares | 2.0 |
| Total Fund Volatility Measures | ||
| Target 2050 | MSCI US | |
| Composite | Broad Market | |
| Index | Index | |
| R-Squared | 1.00 | 0.97 |
| Beta | 1.00 | 0.93 |
| These measures show the degree and timing of the fund’s fluctuations compared with the indexes over 36 months. | ||
Fund Asset Allocation
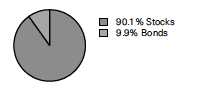
1 This figure—drawn from the prospectus dated January 27, 2014—represents an estimate of the weighted average of the expense ratios and any
transaction fees charged by the underlying mutual funds (the ”acquired” funds) in which the Target Retirement 2050 Fund invests. The fund does not
charge any expenses or fees of its own. For the six months ended March 31, 2014, the annualized acquired fund fees and expenses were 0.18%.
35
Target Retirement 2050 Fund
Performance Summary
All of the returns in this report represent past performance, which is not a guarantee of future results that may be achieved by the fund. (Current performance may be lower or higher than the performance data cited. For performance data current to the most recent month-end, visit our website at vanguard.com/performance.) Note, too, that both investment returns and principal value can fluctuate widely, so an investor’s shares, when sold, could be worth more or less than their original cost. The returns shown do not reflect taxes that a shareholder would pay on fund distributions or on the sale of fund shares.
Fiscal-Year Total Returns (%): June 7, 2006, Through March 31, 2014
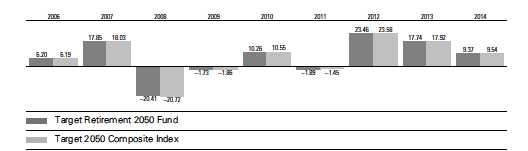
Note: For 2014, performance data reflect the six months ended March 31, 2014.
Average Annual Total Returns: Periods Ended March 31, 2014
| Since Inception | ||||||
| Inception Date | One Year | Five Years | Income | Capital | Total | |
| Target Retirement 2050 | ||||||
| Fund | 6/7/2006 | 17.46% | 18.46% | 2.02% | 4.87% | 6.89% |
See Financial Highlights for dividend and capital gains information.
36
Target Retirement 2050 Fund
Financial Statements (unaudited)
Statement of Net Assets
As of March 31, 2014
The fund reports a complete list of its holdings in regulatory filings four times in each fiscal year, at the quarter-ends. For the second and fourth fiscal quarters, the lists appear in the fund’s semiannual and annual reports to shareholders. For the first and third fiscal quarters, the fund files the lists with the Securities and Exchange Commission on Form N-Q. Shareholders can look up the fund’s Forms N-Q on the SEC’s website at sec.gov. Forms N-Q may also be reviewed and copied at the SEC’s Public Reference Room (see the back cover of this report for further information).
| Market | ||
| Value | ||
| Shares | ($000) | |
| Investment Companies (99.8%) | ||
| U.S. Stock Fund (62.8%) | ||
| Vanguard Total Stock Market Index Fund Investor Shares | 87,336,107 | 4,140,605 |
| International Stock Fund (27.1%) | ||
| Vanguard Total International Stock Index Fund Investor Shares | 106,386,133 | 1,783,032 |
| U.S. Bond Fund (7.9%) | ||
| 1 Vanguard Total Bond Market II Index Fund Investor Shares | 49,080,095 | 522,212 |
| International Bond Fund (2.0%) | ||
| Vanguard Total International Bond Index Fund Investor Shares | 12,891,410 | 130,074 |
| Total Investment Companies (Cost $5,086,263) | 6,575,923 | |
| Temporary Cash Investment (0.1%) | ||
| Money Market Fund (0.1%) | ||
| 1 Vanguard Market Liquidity Fund, 0.122% (Cost $3,854) | 3,853,813 | 3,854 |
| Total Investments (99.9%) (Cost $5,090,117) | 6,579,777 | |
| Other Assets and Liabilities (0.1%) | ||
| Other Assets | 34,508 | |
| Liabilities | (28,451) | |
| 6,057 | ||
| Net Assets (100%) | ||
| Applicable to 229,758,448 outstanding $.001 par value shares of | ||
| beneficial interest (unlimited authorization) | 6,585,834 | |
| Net Asset Value Per Share | $28.66 | |
37
Target Retirement 2050 Fund
| At March 31, 2014, net assets consisted of: | |
| Amount | |
| ($000) | |
| Paid-in Capital | 5,068,050 |
| Undistributed Net Investment Income | 31,873 |
| Accumulated Net Realized Losses | (3,749) |
| Unrealized Appreciation (Depreciation) | 1,489,660 |
| Net Assets | 6,585,834 |
See Note A in Notes to Financial Statements.
1 Affiliated fund available only to Vanguard funds and certain trusts and accounts managed by Vanguard. Rate shown for Vanguard Market
Liquidity Fund is the 7-day yield.
See accompanying Notes, which are an integral part of the Financial Statements.
38
Target Retirement 2050 Fund
Statement of Operations
| Six Months Ended | |
| March 31, 2014 | |
| ($000) | |
| Investment Income | |
| Income | |
| Income Distributions Received | 67,246 |
| Net Investment Income—Note B | 67,246 |
| Realized Net Gain (Loss) | |
| Capital Gain Distributions Received | 221 |
| Investment Securities Sold | 3,423 |
| Realized Net Gain (Loss) | 3,644 |
| Change in Unrealized Appreciation (Depreciation) of Investment Securities | 457,964 |
| Net Increase (Decrease) in Net Assets Resulting from Operations | 528,854 |
See accompanying Notes, which are an integral part of the Financial Statements.
39
| Target Retirement 2050 Fund | ||
| Statement of Changes in Net Assets | ||
| Six Months Ended | Year Ended | |
| March 31, | September 30, | |
| 2014 | 2013 | |
| ($000) | ($000) | |
| Increase (Decrease) in Net Assets | ||
| Operations | ||
| Net Investment Income | 67,246 | 105,695 |
| Realized Net Gain (Loss) | 3,644 | (383) |
| Change in Unrealized Appreciation (Depreciation) | 457,964 | 625,961 |
| Net Increase (Decrease) in Net Assets Resulting from Operations | 528,854 | 731,273 |
| Distributions | ||
| Net Investment Income | (108,670) | (79,191) |
| Realized Capital Gain1 | — | (1,138) |
| Total Distributions | (108,670) | (80,329) |
| Capital Share Transactions | ||
| Issued | 1,314,685 | 1,926,591 |
| Issued in Lieu of Cash Distributions | 106,885 | 79,320 |
| Redeemed | (611,030) | (769,063) |
| Net Increase (Decrease) from Capital Share Transactions | 810,540 | 1,236,848 |
| Total Increase (Decrease) | 1,230,724 | 1,887,792 |
| Net Assets | ||
| Beginning of Period | 5,355,110 | 3,467,318 |
| End of Period2 | 6,585,834 | 5,355,110 |
1 Includes fiscal 2013 short-term gain distributions totaling $1,138,000. Short-term gain distributions are treated as ordinary income dividends
for tax purposes.
2 Net Assets—End of Period includes undistributed net investment income of $31,873,000 and $73,297,000.
See accompanying Notes, which are an integral part of the Financial Statements.
40
| Target Retirement 2050 Fund | |||||||
| Financial Highlights | |||||||
| Six Months | |||||||
| Ended | |||||||
| For a Share Outstanding | March 31, | Year Ended September 30, | |||||
| Throughout Each Period | 2014 | 2013 | 2012 | 2011 | 2010 | 2009 | |
| Net Asset Value, Beginning of Period | $26.69 | $23.16 | $19.17 | $20.10 | $18.58 | $19.43 | |
| Investment Operations | |||||||
| Net Investment Income | .292 | .539 | .549 | .360 | .399 | .4311 | |
| Capital Gain Distributions Received | .001 | .012 | .022 | .006 | — | — | |
| Net Realized and Unrealized Gain (Loss) | |||||||
| on Investments | 2.195 | 3.473 | 3.866 | (.682) | 1.492 | (.866) | |
| Total from Investment Operations | 2.488 | 4.024 | 4.437 | (.316) | 1.891 | (.435) | |
| Distributions | |||||||
| Dividends from Net Investment Income | (. 518) | (. 487) | (. 439) | (. 370) | (. 371) | (. 415) | |
| Distributions from Realized Capital Gains | — | (.007) | (.008) | (.244) | — | — | |
| Total Distributions | (. 518) | (. 494) | (. 447) | (. 614) | (. 371) | (. 415) | |
| Net Asset Value, End of Period | $28.66 | $26.69 | $23.16 | $19.17 | $20.10 | $18.58 | |
| Total Return2 | 9.37% | 17.74% | 23.46% | -1.89% | 10.26% | -1.73% | |
| Ratios/Supplemental Data | |||||||
| Net Assets, End of Period (Millions) | $6,586 | $5,355 | $3,467 | $2,074 | $1,517 | $924 | |
| Ratio of Total Expenses to | |||||||
| Average Net Assets | — | — | — | — | — | — | |
| Acquired Fund Fees and Expenses | 0.18% | 0.18% | 0.18% | 0.19% | 0.19% | 0.21% | |
| Ratio of Net Investment Income to | |||||||
| Average Net Assets | 2.26% | 2.36% | 2.70% | 1.79% | 2.21% | 2.74% | |
| Portfolio Turnover Rate | 7% | 9% | 4% | 15%3 | 10% | 8%4 | |
The expense ratio, acquired fund fees and expenses, net income ratio, and turnover rate for the current period have been annualized.
1 Calculated based on average shares outstanding.
2 Total returns do not include account service fees that may have applied in the periods shown. Fund prospectuses provide information about
any applicable account service fees.
3 Excludes the value of mutual fund shares delivered and received in connection with a change in the fund’s international equity investments
from Vanguard European, Pacific, and Emerging Markets Stock Index Funds to Vanguard Total International Stock Index Fund because those
transactions were effected in kind and did not cause the fund to incur transaction costs.
4 Excludes the value of mutual fund shares delivered and received in connection with a change in the fund’s bond investments from Vanguard
Total Bond Market Index Fund to Vanguard Total Bond Market II Index Fund because those transactions were effected in kind and did not
cause the fund to incur transaction costs.
See accompanying Notes, which are an integral part of the Financial Statements.
41
Target Retirement 2050 Fund
Notes to Financial Statements
Vanguard Target Retirement 2050 Fund is registered under the Investment Company Act of 1940 as an open-end investment company, or mutual fund. The fund follows a balanced investment strategy by investing in selected Vanguard funds to achieve its targeted allocation of assets to U.S. stocks, international stocks, U.S. bonds, and international bonds. Financial statements and other information about each underlying fund are available on vanguard.com.
A. The following significant accounting policies conform to generally accepted accounting principles for U.S. mutual funds. The fund consistently follows such policies in preparing its financial statements.
1. Security Valuation: Investments are valued at the net asset value of each underlying Vanguard fund determined as of the close of the New York Stock Exchange (generally 4 p.m., Eastern time) on the valuation date.
2. Federal Income Taxes: The fund intends to continue to qualify as a regulated investment company and distribute all of its taxable income. Management has analyzed the fund’s tax positions taken for all open federal income tax years (September 30, 2010–2013), and for the period ended March 31, 2014, and has concluded that no provision for federal income tax is required in the fund’s financial statements.
3. Distributions: Distributions to shareholders are recorded on the ex-dividend date.
4. Credit Facility: The fund and certain other funds managed by The Vanguard Group participate in a $2.89 billion committed credit facility provided by a syndicate of lenders pursuant to a credit agreement which may be renewed annually; each fund is individually liable for its borrowings, if any, under the credit facility. Borrowings may be utilized for temporary and emergency purposes, and are subject to the fund’s regulatory and contractual borrowing restrictions. The participating funds are charged administrative fees and an annual commitment fee of 0.06% of the undrawn amount of the facility, which are allocated to the funds in accordance with a methodology approved by the board of trustees and borne by the funds in which the fund invests (See Note B). Any borrowings under this facility bear interest at a rate equal to the higher of the Federal Funds Rate or LIBOR Reference Rate plus an agreed-upon spread.
The fund had no borrowings outstanding at March 31, 2014, or at any time during the period then ended.
5. Other: Income and capital gain distributions received are recorded on the ex-dividend date. Security transactions are accounted for on the date securities are bought or sold. Costs used to determine realized gains (losses) on the sale of investment securities are those of the specific securities sold.
B. Under a service agreement, The Vanguard Group furnishes investment advisory, corporate management, administrative, marketing, and distribution services to the fund. The service agreement provides that the fund’s expenses may be reduced or eliminated to the extent of savings realized by the Vanguard funds by the operation of the fund. Accordingly, all incremental expenses for services provided by Vanguard and all other expenses incurred by the fund during the period ended March 31, 2014, were borne by the funds in which the fund invests. The fund’s trustees and officers are also directors and officers of Vanguard and the funds in which the fund invests.
C. Various inputs may be used to determine the value of the fund’s investments. These inputs are summarized in three broad levels for financial statement purposes. The inputs or methodologies used to value securities are not necessarily an indication of the risk associated with investing in those securities.
42
Target Retirement 2050 Fund
Level 1—Quoted prices in active markets for identical securities.
Level 2—Other significant observable inputs (including quoted prices for similar securities, interest rates, prepayment speeds, credit risk, etc.).
Level 3—Significant unobservable inputs (including the fund’s own assumptions used to determine the fair value of investments).
At March 31, 2014, 100% of the market value of the fund’s investments was determined based on Level 1 inputs.
D. Distributions are determined on a tax basis and may differ from net investment income and realized capital gains for financial reporting purposes. Differences may be permanent or temporary. Permanent differences are reclassified among capital accounts in the financial statements to reflect their tax character. Temporary differences arise when certain items of income, expense, gain, or loss are recognized in different periods for financial statement and tax purposes. These differences will reverse at some time in the future. Differences in classification may also result from the treatment of short-term gains as ordinary income for tax purposes.
The fund’s tax-basis capital gains and losses are determined only at the end of each fiscal year. For tax purposes, at September 30, 2013, the fund had available capital losses totaling $5,721,000 that may be carried forward indefinitely to offset future net capital gains. The fund will use these capital losses to offset net taxable capital gains, if any, realized during the year ending September 30, 2014; should the fund realize net capital losses for the year, the losses will be added to the loss carryforward balance above.
At March 31, 2014, the cost of investment securities for tax purposes was $5,090,117,000. Net unrealized appreciation of investment securities for tax purposes was $1,489,660,000, consisting of unrealized gains of $1,490,531,000 on securities that had risen in value since their purchase and $871,000 in unrealized losses on securities that had fallen in value since their purchase.
E. During the six months ended March 31, 2014, the fund purchased $981,212,000 of investment securities and sold $215,121,000 of investment securities, other than temporary cash investments.
F. Capital shares issued and redeemed were:
| Six Months Ended | Year Ended | |
| March 31, 2014 | September 30, 2013 | |
| Shares | Shares | |
| (000) | (000) | |
| Issued | 47,124 | 78,284 |
| Issued in Lieu of Cash Distributions | 3,813 | 3,480 |
| Redeemed | (21,823) | (30,850) |
| Net Increase (Decrease) in Shares Outstanding | 29,114 | 50,914 |
G. Management has determined that no material events or transactions occurred subsequent to March 31, 2014, that would require recognition or disclosure in these financial statements.
43
Target Retirement 2055 Fund
Fund Profile
As of March 31, 2014
| Total Fund Characteristics | |
| Ticker Symbol | VFFVX |
| 30-Day SEC Yield | 2.10% |
| Acquired Fund Fees and Expenses1 | 0.18% |
| Allocation to Underlying Vanguard Funds | |
| Vanguard Total Stock Market Index Fund | |
| Investor Shares | 62.9% |
| Vanguard Total International Stock Index | |
| Fund Investor Shares | 27.1 |
| Vanguard Total Bond Market II Index Fund | |
| Investor Shares | 8.0 |
| Vanguard Total International Bond Index | |
| Fund Investor Shares | 2.0 |
| Total Fund Volatility Measures | ||
| Target 2055 | MSCI US | |
| Composite | Broad Market | |
| Index | Index | |
| R-Squared | 1.00 | 0.97 |
| Beta | 1.00 | 0.93 |
| These measures show the degree and timing of the fund’s fluctuations compared with the indexes over 36 months. | ||
Fund Asset Allocation

1 This figure—drawn from the prospectus dated January 27, 2014—represents an estimate of the weighted average of the expense ratios and any
transaction fees charged by the underlying mutual funds (the ”acquired” funds) in which the Target Retirement 2055 Fund invests. The fund does not
charge any expenses or fees of its own. For the six months ended March 31, 2014, the annualized acquired fund fees and expenses were 0.18%.
44
Target Retirement 2055 Fund
Performance Summary
All of the returns in this report represent past performance, which is not a guarantee of future results that may be achieved by the fund. (Current performance may be lower or higher than the performance data cited. For performance data current to the most recent month-end, visit our website at vanguard.com/performance.) Note, too, that both investment returns and principal value can fluctuate widely, so an investor’s shares, when sold, could be worth more or less than their original cost. The returns shown do not reflect taxes that a shareholder would pay on fund distributions or on the sale of fund shares.
Fiscal-Year Total Returns (%): August 18, 2010, Through March 31, 2014
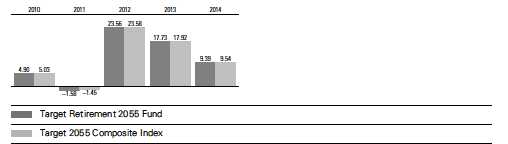
Note: For 2014, performance data reflect the six months ended March 31, 2014.
| Average Annual Total Returns: Periods Ended March 31, 2014 | |||||
| Since Inception | |||||
| Inception Date | One Year | Income | Capital | Total | |
| Target Retirement 2055 | |||||
| Fund | 8/18/2010 | 17.50% | 1.86% | 12.85% | 14.71% |
See Financial Highlights for dividend and capital gains information.
45
Target Retirement 2055 Fund
Financial Statements (unaudited)
Statement of Net Assets
As of March 31, 2014
The fund reports a complete list of its holdings in regulatory filings four times in each fiscal year, at the quarter-ends. For the second and fourth fiscal quarters, the lists appear in the fund’s semiannual and annual reports to shareholders. For the first and third fiscal quarters, the fund files the lists with the Securities and Exchange Commission on Form N-Q. Shareholders can look up the fund’s Forms N-Q on the SEC’s website at sec.gov. Forms N-Q may also be reviewed and copied at the SEC’s Public Reference Room (see the back cover of this report for further information).
| Market | ||
| Value | ||
| Shares | ($000) | |
| Investment Companies (99.6%) | ||
| U.S. Stock Fund (62.6%) | ||
| Vanguard Total Stock Market Index Fund Investor Shares | 17,544,781 | 831,798 |
| International Stock Fund (27.0%) | ||
| Vanguard Total International Stock Index Fund Investor Shares | 21,441,828 | 359,365 |
| U.S. Bond Fund (8.0%) | ||
| 1 Vanguard Total Bond Market II Index Fund Investor Shares | 9,988,918 | 106,282 |
| International Bond Fund (2.0%) | ||
| Vanguard Total International Bond Index Fund Investor Shares | 2,623,859 | 26,475 |
| Total Investment Companies (Cost $1,128,440) | 1,323,920 | |
| Temporary Cash Investment (0.2%) | ||
| Money Market Fund (0.2%) | ||
| 1 Vanguard Market Liquidity Fund, 0.122% (Cost $2,222) | 2,221,920 | 2,222 |
| Total Investments (99.8%) (Cost $1,130,662) | 1,326,142 | |
| Other Assets and Liabilities (0.2%) | ||
| Other Assets | 10,307 | |
| Liabilities | (7,989) | |
| 2,318 | ||
| Net Assets (100%) | ||
| Applicable to 43,032,157 outstanding $.001 par value shares of | ||
| beneficial interest (unlimited authorization) | 1,328,460 | |
| Net Asset Value Per Share | $30.87 | |
46
| Target Retirement 2055 Fund | |
| At March 31, 2014, net assets consisted of: | |
| Amount | |
| ($000) | |
| Paid-in Capital | 1,127,010 |
| Undistributed Net Investment Income | 6,354 |
| Accumulated Net Realized Losses | (384) |
| Unrealized Appreciation (Depreciation) | 195,480 |
| Net Assets | 1,328,460 |
See Note A in Notes to Financial Statements.
1 Affiliated fund available only to Vanguard funds and certain trusts and accounts managed by Vanguard. Rate shown for Vanguard Market
Liquidity Fund is the 7-day yield.
See accompanying Notes, which are an integral part of the Financial Statements.
47
| Target Retirement 2055 Fund | |
| Statement of Operations | |
| Six Months Ended | |
| March 31, 2014 | |
| ($000) | |
| Investment Income | |
| Income | |
| Income Distributions Received | 12,846 |
| Net Investment Income—Note B | 12,846 |
| Realized Net Gain (Loss) | |
| Capital Gain Distributions Received | 41 |
| Investment Securities Sold | 25 |
| Realized Net Gain (Loss) | 66 |
| Change in Unrealized Appreciation (Depreciation) of Investment Securities | 84,539 |
| Net Increase (Decrease) in Net Assets Resulting from Operations | 97,451 |
See accompanying Notes, which are an integral part of the Financial Statements.
48
| Target Retirement 2055 Fund | ||
| Statement of Changes in Net Assets | ||
| Six Months Ended | Year Ended | |
| March 31, | September 30, | |
| 2014 | 2013 | |
| ($000) | ($000) | |
| Increase (Decrease) in Net Assets | ||
| Operations | ||
| Net Investment Income | 12,846 | 15,546 |
| Realized Net Gain (Loss) | 66 | (168) |
| Change in Unrealized Appreciation (Depreciation) | 84,539 | 91,119 |
| Net Increase (Decrease) in Net Assets Resulting from Operations | 97,451 | 106,497 |
| Distributions | ||
| Net Investment Income | (17,283) | (8,415) |
| Realized Capital Gain1 | (145) | (245) |
| Total Distributions | (17,428) | (8,660) |
| Capital Share Transactions | ||
| Issued | 447,464 | 567,744 |
| Issued in Lieu of Cash Distributions | 17,158 | 8,573 |
| Redeemed | (131,072) | (140,041) |
| Net Increase (Decrease) from Capital Share Transactions | 333,550 | 436,276 |
| Total Increase (Decrease) | 413,573 | 534,113 |
| Net Assets | ||
| Beginning of Period | 914,887 | 380,774 |
| End of Period2 | 1,328,460 | 914,887 |
1 Includes fiscal 2014 and 2013 short-term gain distributions totaling $0 and $132,000, respectively. Short-term gain distributions are treated
as ordinary income dividends for tax purposes.
2 Net Assets—End of Period includes undistributed net investment income of $6,354,000 and $10,791,000.
See accompanying Notes, which are an integral part of the Financial Statements.
49
Target Retirement 2055 Fund
Financial Highlights
| Six Months | Aug. 18, | ||||
| Ended | 20101 to | ||||
| March 31, | Year Ended September 30, | Sept. 30, | |||
| For a Share Outstanding Throughout Each Period | 2014 | 2013 | 2012 | 2011 | 2010 |
| Net Asset Value, Beginning of Period | $28.67 | $24.81 | $20.45 | $20.98 | $20.00 |
| Investment Operations | |||||
| Net Investment Income | . 345 2 | .6412 | .540 | . 388 2 | .063 |
| Capital Gain Distributions Received | .0012 | .0112 | .022 | .001 | — |
| Net Realized and Unrealized Gain (Loss) | |||||
| on Investments | 2.335 | 3.668 | 4.202 | (.698) | .917 |
| Total from Investment Operations | 2.681 | 4.320 | 4.764 | (.309) | .980 |
| Distributions | |||||
| Dividends from Net Investment Income | (. 477) | (. 447) | (. 391) | (.179) | — |
| Distributions from Realized Capital Gains | (. 004) | (. 013) | (. 013) | (. 042) | — |
| Total Distributions | (. 481) | (. 460) | (. 404) | (. 221) | — |
| Net Asset Value, End of Period | $30.87 | $28.67 | $24.81 | $20.45 | $20.98 |
| Total Return3 | 9.39% | 17.73% | 23.56% | -1.58% | 4.90% |
| Ratios/Supplemental Data | |||||
| Net Assets, End of Period (Millions) | $1,328 | $915 | $381 | $124 | $2 |
| Ratio of Total Expenses to | |||||
| Average Net Assets | — | — | — | — | — |
| Acquired Fund Fees and Expenses | 0.18% | 0.18% | 0.18% | 0.19% | 0.22%4 |
| Ratio of Net Investment Income to | |||||
| Average Net Assets | 2.31% | 2.39% | 2.76% | 1.71% | 2.73%4 |
| Portfolio Turnover Rate | 7% | 9% | 3% | 12%5 | 3% |
The expense ratio, acquired fund fees and expenses, net income ratio, and turnover rate for the current period have been annualized.
1 Inception.
2 Calculated based on average shares outstanding.
3 Total returns do not include account service fees that may have applied in the periods shown. Fund prospectuses provide information about
any applicable account service fees.
4 Annualized.
5 Excludes the value of mutual fund shares delivered and received in connection with a change in the fund’s international equity investments
from Vanguard European, Pacific, and Emerging Markets Stock Index Funds to Vanguard Total International Stock Index Fund because those
transactions were effected in kind and did not cause the fund to incur transaction costs.
See accompanying Notes, which are an integral part of the Financial Statements.
50
Target Retirement 2055 Fund
Notes to Financial Statements
Vanguard Target Retirement 2055 Fund is registered under the Investment Company Act of 1940 as an open-end investment company, or mutual fund. The fund follows a balanced investment strategy by investing in selected Vanguard funds to achieve its targeted allocation of assets to U.S. stocks, international stocks, U.S. bonds, and international bonds. Financial statements and other information about each underlying fund are available on vanguard.com.
A. The following significant accounting policies conform to generally accepted accounting principles for U.S. mutual funds. The fund consistently follows such policies in preparing its financial statements.
1. Security Valuation: Investments are valued at the net asset value of each underlying Vanguard fund determined as of the close of the New York Stock Exchange (generally 4 p.m., Eastern time) on the valuation date.
2. Federal Income Taxes: The fund intends to continue to qualify as a regulated investment company and distribute all of its taxable income. Management has analyzed the fund’s tax positions taken for all open federal income tax years (September 30, 2010–2013), and for the period ended March 31, 2014, and has concluded that no provision for federal income tax is required in the fund’s financial statements.
3. Distributions: Distributions to shareholders are recorded on the ex-dividend date.
4. Credit Facility: The fund and certain other funds managed by The Vanguard Group participate in a $2.89 billion committed credit facility provided by a syndicate of lenders pursuant to a credit agreement which may be renewed annually; each fund is individually liable for its borrowings, if any, under the credit facility. Borrowings may be utilized for temporary and emergency purposes, and are subject to the fund’s regulatory and contractual borrowing restrictions. The participating funds are charged administrative fees and an annual commitment fee of 0.06% of the undrawn amount of the facility, which are allocated to the funds in accordance with a methodology approved by the board of trustees and borne by the funds in which the fund invests (See Note B). Any borrowings under this facility bear interest at a rate equal to the higher of the Federal Funds Rate or LIBOR Reference Rate plus an agreed-upon spread.
The fund had no borrowings outstanding at March 31, 2014, or at any time during the period then ended.
5. Other: Income and capital gain distributions received are recorded on the ex-dividend date. Security transactions are accounted for on the date securities are bought or sold. Costs used to determine realized gains (losses) on the sale of investment securities are those of the specific securities sold.
B. Under a service agreement, The Vanguard Group furnishes investment advisory, corporate management, administrative, marketing, and distribution services to the fund. The service agreement provides that the fund’s expenses may be reduced or eliminated to the extent of savings realized by the Vanguard funds by the operation of the fund. Accordingly, all incremental expenses for services provided by Vanguard and all other expenses incurred by the fund during the period ended March 31, 2014, were borne by the funds in which the fund invests. The fund’s trustees and officers are also directors and officers of Vanguard and the funds in which the fund invests.
C. Various inputs may be used to determine the value of the fund’s investments. These inputs are summarized in three broad levels for financial statement purposes. The inputs or methodologies used to value securities are not necessarily an indication of the risk associated with investing in those securities.
51
Target Retirement 2055 Fund
Level 1—Quoted prices in active markets for identical securities.
Level 2—Other significant observable inputs (including quoted prices for similar securities, interest rates, prepayment speeds, credit risk, etc.).
Level 3—Significant unobservable inputs (including the fund’s own assumptions used to determine the fair value of investments).
At March 31, 2014, 100% of the market value of the fund’s investments was determined based on Level 1 inputs.
D. Distributions are determined on a tax basis and may differ from net investment income and realized capital gains for financial reporting purposes. Differences may be permanent or temporary. Permanent differences are reclassified among capital accounts in the financial statements to reflect their tax character. Temporary differences arise when certain items of income, expense, gain, or loss are recognized in different periods for financial statement and tax purposes. These differences will reverse at some time in the future. Differences in classification may also result from the treatment of short-term gains as ordinary income for tax purposes. The fund’s tax-basis capital gains and losses are determined only at the end of each fiscal year.
At March 31, 2014, the cost of investment securities for tax purposes was $1,130,662,000. Net unrealized appreciation of investment securities for tax purposes was $195,480,000, consisting of unrealized gains of $196,246,000 on securities that had risen in value since their purchase and $766,000 in unrealized losses on securities that had fallen in value since their purchase.
E. During the six months ended March 31, 2014, the fund purchased $363,014,000 of investment securities and sold $36,389,000 of investment securities, other than temporary cash investments.
F. Capital shares issued and redeemed were:
| Six Months Ended | Year Ended | |
| March 31, 2014 | September 30, 2013 | |
| Shares | Shares | |
| (000) | (000) | |
| Issued | 14,905 | 21,406 |
| Issued in Lieu of Cash Distributions | 569 | 350 |
| Redeemed | (4,354) | (5,194) |
| Net Increase (Decrease) in Shares Outstanding | 11,120 | 16,562 |
G. Management has determined that no material events or transactions occurred subsequent to March 31, 2014, that would require recognition or disclosure in these financial statements.
52
Target Retirement 2060 Fund
Fund Profile
As of March 31, 2014
| Total Fund Characteristics | |
| Ticker Symbol | VTTSX |
| 30-Day SEC Yield | 2.10% |
| Acquired Fund Fees and Expenses1 | 0.18% |
| Allocation to Underlying Vanguard Funds | |
| Vanguard Total Stock Market Index Fund | |
| Investor Shares | 63.0% |
| Vanguard Total International Stock Index | |
| Fund Investor Shares | 27.0 |
| Vanguard Total Bond Market II Index Fund | |
| Investor Shares | 8.0 |
| Vanguard Total International Bond Index | |
| Fund Investor Shares | 2.0 |
Fund Asset Allocation

1 This figure—drawn from the prospectus dated January 27, 2014—represents an estimate of the weighted average of the expense ratios and any
transaction fees charged by the underlying mutual funds (the ”acquired” funds) in which the Target Retirement 2060 Fund invests. The fund does not
charge any expenses or fees of its own. For the six months ended March 31, 2014, the annualized acquired fund fees and expenses were 0.18%.
53
Target Retirement 2060 Fund
Performance Summary
All of the returns in this report represent past performance, which is not a guarantee of future results that may be achieved by the fund. (Current performance may be lower or higher than the performance data cited. For performance data current to the most recent month-end, visit our website at vanguard.com/performance.) Note, too, that both investment returns and principal value can fluctuate widely, so an investor’s shares, when sold, could be worth more or less than their original cost. The returns shown do not reflect taxes that a shareholder would pay on fund distributions or on the sale of fund shares.
Fiscal-Year Total Returns (%): January 19, 2012, Through March 31, 2014
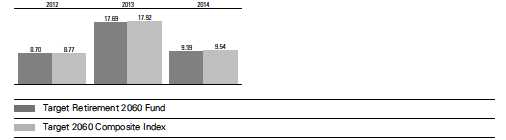
Note: For 2014, performance data reflect the six months ended March 31, 2014.
| Average Annual Total Returns: Periods Ended March 31, 2014 | |||||
| Since Inception | |||||
| Inception Date | One Year | Income | Capital | Total | |
| Target Retirement 2060 | |||||
| Fund | 1/19/2012 | 17.50% | 1.49% | 15.06% | 16.55% |
See Financial Highlights for dividend and capital gains information.
54
Target Retirement 2060 Fund
Financial Statements (unaudited)
Statement of Net Assets
As of March 31, 2014
The fund reports a complete list of its holdings in regulatory filings four times in each fiscal year, at the quarter-ends. For the second and fourth fiscal quarters, the lists appear in the fund’s semiannual and annual reports to shareholders. For the first and third fiscal quarters, the fund files the lists with the Securities and Exchange Commission on Form N-Q. Shareholders can look up the fund’s Forms N-Q on the SEC’s website at sec.gov. Forms N-Q may also be reviewed and copied at the SEC’s Public Reference Room (see the back cover of this report for further information).
| Market | ||
| Value | ||
| Shares | ($000) | |
| Investment Companies (99.9%) | ||
| U.S. Stock Fund (62.9%) | ||
| Vanguard Total Stock Market Index Fund Investor Shares | 4,807,091 | 227,904 |
| International Stock Fund (27.0%) | ||
| Vanguard Total International Stock Index Fund Investor Shares | 5,825,699 | 97,639 |
| U.S. Bond Fund (8.0%) | ||
| 1 Vanguard Total Bond Market II Index Fund Investor Shares | 2,729,996 | 29,047 |
| International Bond Fund (2.0%) | ||
| Vanguard Total International Bond Index Fund Investor Shares | 717,154 | 7,236 |
| Total Investment Companies (Cost $323,698) | 361,826 | |
| Temporary Cash Investment (0.2%) | ||
| Money Market Fund (0.2%) | ||
| 1 Vanguard Market Liquidity Fund, 0.122% (Cost $814) | 813,841 | 814 |
| Total Investments (100.1%) (Cost $324,512) | 362,640 | |
| Other Assets and Liabilities (-0.1%) | ||
| Other Assets | 2,235 | |
| Liabilities | (2,596) | |
| (361) | ||
| Net Assets (100%) | ||
| Applicable to 13,316,736 outstanding $.001 par value shares of | ||
| beneficial interest (unlimited authorization) | 362,279 | |
| Net Asset Value Per Share | $27.20 | |
55
Target Retirement 2060 Fund
| At March 31, 2014, net assets consisted of: | |
| Amount | |
| ($000) | |
| Paid-in Capital | 322,441 |
| Undistributed Net Investment Income | 1,740 |
| Accumulated Net Realized Losses | (30) |
| Unrealized Appreciation (Depreciation) | 38,128 |
| Net Assets | 362,279 |
See Note A in Notes to Financial Statements.
1 Affiliated fund available only to Vanguard funds and certain trusts and accounts managed by Vanguard. Rate shown for Vanguard Market
Liquidity Fund is the 7-day yield.
See accompanying Notes, which are an integral part of the Financial Statements.
56
| Target Retirement 2060 Fund | |
| Statement of Operations | |
| Six Months Ended | |
| March 31, 2014 | |
| ($000) | |
| Investment Income | |
| Income | |
| Income Distributions Received | 3,368 |
| Net Investment Income—Note B | 3,368 |
| Realized Net Gain (Loss) | |
| Capital Gain Distributions Received | 10 |
| Investment Securities Sold | 16 |
| Realized Net Gain (Loss) | 26 |
| Change in Unrealized Appreciation (Depreciation) of Investment Securities | 21,387 |
| Net Increase (Decrease) in Net Assets Resulting from Operations | 24,781 |
See accompanying Notes, which are an integral part of the Financial Statements.
57
| Target Retirement 2060 Fund | ||
| Statement of Changes in Net Assets | ||
| Six Months Ended | Year Ended | |
| March 31, | September 30, | |
| 2014 | 2013 | |
| ($000) | ($000) | |
| Increase (Decrease) in Net Assets | ||
| Operations | ||
| Net Investment Income | 3,368 | 2,846 |
| Realized Net Gain (Loss) | 26 | 141 |
| Change in Unrealized Appreciation (Depreciation) | 21,387 | 15,512 |
| Net Increase (Decrease) in Net Assets Resulting from Operations | 24,781 | 18,499 |
| Distributions | ||
| Net Investment Income | (3,832) | (784) |
| Realized Capital Gain1 | (10) | (15) |
| Total Distributions | (3,842) | (799) |
| Capital Share Transactions | ||
| Issued | 171,638 | 205,842 |
| Issued in Lieu of Cash Distributions | 3,794 | 790 |
| Redeemed | (51,249) | (40,404) |
| Net Increase (Decrease) from Capital Share Transactions | 124,183 | 166,228 |
| Total Increase (Decrease) | 145,122 | 183,928 |
| Net Assets | ||
| Beginning of Period | 217,157 | 33,229 |
| End of Period2 | 362,279 | 217,157 |
1 Includes fiscal 2014 and 2013 short-term gain distributions totaling $0 and $15,000, respectively. Short-term gain distributions are treated
as ordinary income dividends for tax purposes.
2 Net Assets—End of Period includes undistributed net investment income of $1,740,000 and $2,204,000.
See accompanying Notes, which are an integral part of the Financial Statements.
58
Target Retirement 2060 Fund
Financial Highlights
| Six Months | Year | Jan. 19, | |
| Ended | Ended | 20121 to | |
| March 31, | Sept. 30, | Sept. 30, | |
| For a Share Outstanding Throughout Each Period | 2014 | 2013 | 2012 |
| Net Asset Value, Beginning of Period | $25.21 | $21.74 | $20.00 |
| Investment Operations | |||
| Net Investment Income | .3092 | .5812 | .218 |
| Capital Gain Distributions Received | .0012 | .0072 | .002 |
| Net Realized and Unrealized Gain (Loss) on Investments | 2.048 | 3.203 | 1.520 |
| Total from Investment Operations | 2.358 | 3.791 | 1.740 |
| Distributions | |||
| Dividends from Net Investment Income | (.367) | (.315) | — |
| Distributions from Realized Capital Gains | (.001) | (.006) | — |
| Total Distributions | (.368) | (.321) | — |
| Net Asset Value, End of Period | $27.20 | $25.21 | $21.74 |
| Total Return3 | 9.39% | 17.69% | 8.70% |
| Ratios/Supplemental Data | |||
| Net Assets, End of Period (Millions) | $362 | $217 | $33 |
| Ratio of Total Expenses to Average Net Assets | — | — | — |
| Acquired Fund Fees and Expenses | 0.18% | 0.18% | 0.18%4 |
| Ratio of Net Investment Income to Average Net Assets | 2.35% | 2.45% | 2.99%4 |
| Portfolio Turnover Rate | 7% | 10% | 40% |
The expense ratio, acquired fund fees and expenses, net income ratio, and turnover rate for the current period have been annualized.
1 Inception.
2 Calculated based on average shares outstanding.
3 Total returns do not include account service fees that may have applied in the periods shown. Fund prospectuses provide information about
any applicable account service fees.
4 Annualized.
See accompanying Notes, which are an integral part of the Financial Statements.
59
Target Retirement 2060 Fund
Notes to Financial Statements
Vanguard Target Retirement 2060 Fund is registered under the Investment Company Act of 1940 as an open-end investment company, or mutual fund. The fund follows a balanced investment strategy by investing in selected Vanguard funds to achieve its targeted allocation of assets to U.S. stocks, international stocks, U.S. bonds, and international bonds. Financial statements and other information about each underlying fund are available on vanguard.com.
A. The following significant accounting policies conform to generally accepted accounting principles for U.S. mutual funds. The fund consistently follows such policies in preparing its financial statements.
1. Security Valuation: Investments are valued at the net asset value of each underlying Vanguard fund determined as of the close of the New York Stock Exchange (generally 4 p.m., Eastern time) on the valuation date.
2. Federal Income Taxes: The fund intends to continue to qualify as a regulated investment company and distribute all of its taxable income. Management has analyzed the fund’s tax positions taken for all open federal income tax years (September 30, 2012–2013), and for the period ended March 31, 2014, and has concluded that no provision for federal income tax is required in the fund’s financial statements.
3. Distributions: Distributions to shareholders are recorded on the ex-dividend date.
4. Credit Facility: The fund and certain other funds managed by The Vanguard Group participate in a $2.89 billion committed credit facility provided by a syndicate of lenders pursuant to a credit agreement which may be renewed annually; each fund is individually liable for its borrowings, if any, under the credit facility. Borrowings may be utilized for temporary and emergency purposes, and are subject to the fund’s regulatory and contractual borrowing restrictions. The participating funds are charged administrative fees and an annual commitment fee of 0.06% of the undrawn amount of the facility, which are allocated to the funds in accordance with a methodology approved by the board of trustees and borne by the funds in which the fund invests (See Note B). Any borrowings under this facility bear interest at a rate equal to the higher of the Federal Funds Rate or LIBOR Reference Rate plus an agreed-upon spread.
The fund had no borrowings outstanding at March 31, 2014, or at any time during the period then ended.
5. Other: Income and capital gain distributions received are recorded on the ex-dividend date. Security transactions are accounted for on the date securities are bought or sold. Costs used to determine realized gains (losses) on the sale of investment securities are those of the specific securities sold.
B. Under a service agreement, The Vanguard Group furnishes investment advisory, corporate management, administrative, marketing, and distribution services to the fund. The service agreement provides that the fund’s expenses may be reduced or eliminated to the extent of savings realized by the Vanguard funds by the operation of the fund. Accordingly, all incremental expenses for services provided by Vanguard and all other expenses incurred by the fund during the period ended March 31, 2014, were borne by the funds in which the fund invests. The fund’s trustees and officers are also directors and officers of Vanguard and the funds in which the fund invests.
C. Various inputs may be used to determine the value of the fund’s investments. These inputs are summarized in three broad levels for financial statement purposes. The inputs or methodologies used to value securities are not necessarily an indication of the risk associated with investing in those securities.
60
Target Retirement 2060 Fund
Level 1—Quoted prices in active markets for identical securities.
Level 2—Other significant observable inputs (including quoted prices for similar securities, interest rates, prepayment speeds, credit risk, etc.).
Level 3—Significant unobservable inputs (including the fund’s own assumptions used to determine the fair value of investments).
At March 31, 2014, 100% of the market value of the fund’s investments was determined based on Level 1 inputs.
D. Distributions are determined on a tax basis and may differ from net investment income and realized capital gains for financial reporting purposes. Differences may be permanent or temporary. Permanent differences are reclassified among capital accounts in the financial statements to reflect their tax character. Temporary differences arise when certain items of income, expense, gain, or loss are recognized in different periods for financial statement and tax purposes. These differences will reverse at some time in the future. Differences in classification may also result from the treatment of short-term gains as ordinary income for tax purposes. The fund’s tax-basis capital gains and losses are determined only at the end of each fiscal year.
At March 31, 2014, the cost of investment securities for tax purposes was $324,512,000. Net unrealized appreciation of investment securities for tax purposes was $38,128,000, consisting of unrealized gains of $38,329,000 on securities that had risen in value since their purchase and $201,000 in unrealized losses on securities that had fallen in value since their purchase.
E. During the six months ended March 31, 2014, the fund purchased $134,712,000 of investment securities and sold $10,243,000 of investment securities, other than temporary cash investments.
F. Capital shares issued and redeemed were:
| Six Months Ended | Year Ended | |
| March 31, 2014 | September 30, 2013 | |
| Shares | Shares | |
| (000) | (000) | |
| Issued | 6,495 | 8,760 |
| Issued in Lieu of Cash Distributions | 143 | 37 |
| Redeemed | (1,935) | (1,712) |
| Net Increase (Decrease) in Shares Outstanding | 4,703 | 7,085 |
G. Management has determined that no material events or transactions occurred subsequent to March 31, 2014, that would require recognition or disclosure in these financial statements.
61
About Your Fund’s Expenses
As a shareholder of the fund, you incur ongoing costs, which include costs for portfolio management, administrative services, and shareholder reports (like this one), among others. Operating expenses, which are deducted from a fund’s gross income, directly reduce the investment return of the fund.
A typical fund’s expenses are expressed as a percentage of its average net assets. The Target Retirement Funds have no direct expenses, but each fund bears its proportionate share of the costs for the underlying funds in which it invests. These indirect expenses make up the acquired fund fees and expenses, also expressed as a percentage of average net assets.
The following examples are intended to help you understand the ongoing cost (in dollars) of investing in your fund and to compare these costs with those of other mutual funds. The examples are based on an investment of $1,000 made at the beginning of the period shown and held for the entire period. The costs were calculated using the acquired fund fees and expenses for each Target Retirement Fund.
The accompanying table illustrates your fund’s costs in two ways:
• Based on actual fund return. This section helps you to estimate the actual expenses that you paid over the period. The ”Ending Account Value“ shown is derived from the fund‘s actual return, and the third column shows the dollar amount that would have been paid by an investor who started with $1,000 in the fund. You may use the information here, together with the amount you invested, to estimate the expenses that you paid over the period.
To do so, simply divide your account value by $1,000 (for example, an $8,600 account value divided by $1,000 = 8.6), then multiply the result by the number given for your fund under the heading ”Expenses Paid During Period.“
• Based on hypothetical 5% yearly return. This section is intended to help you compare your fund‘s costs with those of other mutual funds. It assumes that the fund had a yearly return of 5% before expenses, but that the expense ratio is unchanged. In this case—because the return used is not the fund’s actual return—the results do not apply to your investment. The example is useful in making comparisons because the Securities and Exchange Commission requires all mutual funds to calculate expenses based on a 5% return. You can assess your fund’s costs by comparing this hypothetical example with the hypothetical examples that appear in shareholder reports of other funds.
Note that the expenses shown in the table are meant to highlight and help you compare ongoing costs only and do not reflect transaction costs incurred by the fund for buying and selling securities. Further, the expenses do not include any purchase, redemption, or account service fees described in the fund prospectus. If such fees were applied to your account, your costs would be higher. Your fund does not carry a “sales load.”
The calculations assume no shares were bought or sold during the period. Your actual costs may have been higher or lower, depending on the amount of your investment and the timing of any purchases or redemptions.
You can find more information about the fund’s expenses, including annual expense ratios, in the Financial Statements section of this report. For additional information on operating expenses and other shareholder costs, please refer to your fund’s current prospectus.
62
| Six Months Ended March 31, 2014 | |||
| Beginning | Ending | Expenses | |
| Account Value | Account Value | Paid During | |
| 9/30/2013 | 3/31/2014 | Period | |
| Based on Actual Fund Return | |||
| Target Retirement 2035 Fund | $1,000.00 | $1,089.19 | $0.94 |
| Target Retirement 2040 Fund | $1,000.00 | $1,093.60 | $0.94 |
| Target Retirement 2045 Fund | $1,000.00 | $1,094.03 | $0.94 |
| Target Retirement 2050 Fund | $1,000.00 | $1,093.65 | $0.94 |
| Target Retirement 2055 Fund | $1,000.00 | $1,093.90 | $0.94 |
| Target Retirement 2060 Fund | $1,000.00 | $1,093.87 | $0.94 |
| Based on Hypothetical 5% Yearly Return | |||
| Target Retirement 2035 Fund | $1,000.00 | $1,024.03 | $0.91 |
| Target Retirement 2040 Fund | $1,000.00 | $1,024.03 | $0.91 |
| Target Retirement 2045 Fund | $1,000.00 | $1,024.03 | $0.91 |
| Target Retirement 2050 Fund | $1,000.00 | $1,024.03 | $0.91 |
| Target Retirement 2055 Fund | $1,000.00 | $1,024.03 | $0.91 |
| Target Retirement 2060 Fund | $1,000.00 | $1,024.03 | $0.91 |
The calculations are based on the acquired fund fees and expenses for the most recent six-month period. The funds’ annualized expense
figures for the period are (in order as listed from top to bottom above) 0.18%, 0.18%, 0.18%, 0.18%, 0.18%, and 0.18%. The dollar amounts
shown as ”Expenses Paid” are equal to the annualized average weighted expense ratio for the underlying funds multiplied by the average
account value over the period, multiplied by the number of days in the most recent six-month period, then divided by the number of days in
the most recent 12-month period.
63
Trustees Approve Advisory Arrangement
The board of trustees of Vanguard Target Retirement Funds has renewed the funds’ investment advisory arrangement with The Vanguard Group, Inc. (Vanguard). Vanguard—through its Equity Investment Group—serves as the investment advisor to the funds. The board determined that continuing the funds’ internalized management structure was in the best interests of the funds and their shareholders.
The board based its decision upon an evaluation of the advisor’s investment staff, portfolio management process, and performance. The trustees considered the factors discussed below, among others. However, no single factor determined whether the board approved the arrangement. Rather, it was the totality of the circumstances that drove the board’s decision.
Nature, extent, and quality of services
The board considered the quality of the funds’ investment management services over both the short and long term, and took into account the organizational depth and stability of the advisor. The board noted that Vanguard has been managing investments for more than three decades. The Equity Investment Group adheres to a sound, disciplined investment management process; the team has considerable experience, stability, and depth.
The board concluded that Vanguard’s experience, stability, depth, and performance, among other factors, warranted continuation of the advisory arrangement.
Investment performance
The board considered the performance of the funds, including any periods of outperformance or underperformance compared relative to a benchmark index and peer groups. The board concluded that the performance was such that the advisory arrangement should continue. Information about each fund’s most recent performance can be found in the Performance Summary pages of this report.
Cost
The board concluded that the funds’ acquired fund fees and expenses were well below the average expense ratios charged by funds in their respective peer groups. The funds do not incur advisory expenses directly; however; the board noted that each of the underlying funds in which the funds invest has advisory expenses well below the relevant peer-group average. Information about the funds’ acquired fund fees and expenses appears in the About Your Fund’s Expenses section of this report as well as in the Financial Statements sections.
The board does not conduct a profitability analysis of Vanguard, because of Vanguard’s unique “at-cost” structure. Unlike most other mutual fund management companies, Vanguard is owned by the funds it oversees, and produces “profits” only in the form of reduced expenses for fund shareholders.
The benefit of economies of scale
The board concluded that Vanguard’s at-cost arrangement with the Target Retirement Funds and their underlying funds ensures that the funds will realize economies of scale as they grow, with the cost to shareholders declining as fund assets increase.
The board will consider whether to renew the advisory arrangement again after a one-year period.
64
Glossary
30-Day SEC Yield. A fund’s 30-day SEC yield is derived using a formula specified by the U.S. Securities and Exchange Commission. Under the formula, data related to the fund’s security holdings in the previous 30 days are used to calculate the fund’s hypothetical net income for that period, which is then annualized and divided by the fund’s estimated average net assets over the calculation period. For the purposes of this calculation, a security’s income is based on its current market yield to maturity (for bonds), its actual income (for asset-backed securities), or its projected dividend yield (for stocks). Because the SEC yield represents hypothetical annualized income, it will differ—at times significantly—from the fund’s actual experience. As a result, the fund’s income distributions may be higher or lower than implied by the SEC yield.
Acquired Fund Fees and Expenses. Funds that invest in other Vanguard funds incur no direct expenses, but they do bear proportionate shares of the operating, administrative, and advisory expenses of the underlying funds, and they must pay any fees charged by those funds. The figure for acquired fund fees and expenses represents a weighted average of these underlying costs. Acquired is a term that the Securities and Exchange Commission applies to any mutual fund whose shares are owned by another fund.
Beta. A measure of the magnitude of a fund’s past share-price fluctuations in relation to the ups and downs of a given market index. The index is assigned a beta of 1.00. Compared with a given index, a fund with a beta of 1.20 typically would have seen its share price rise or fall by 12% when the index rose or fell by 10%. For this report, beta is based on returns over the past 36 months for both the fund and the index. Note that a fund’s beta should be reviewed in conjunction with its R-squared (see definition). The lower the R-squared, the less correlation there is between the fund and the index, and the less reliable beta is as an indicator of volatility.
Expense Ratio. A fund’s total annual operating expenses expressed as a percentage of the fund’s average net assets. The expense ratio includes management and administrative expenses, but does not include the transaction costs of buying and selling portfolio securities.
Inception Date. The date on which the assets of a fund (or one of its share classes) are first invested in accordance with the fund’s investment objective. For funds with a subscription period, the inception date is the day after that period ends. Investment performance is measured from the inception date.
R-Squared. A measure of how much of a fund’s past returns can be explained by the returns from the market in general, as measured by a given index. If a fund’s total returns were precisely synchronized with an index’s returns, its R-squared would be 1.00. If the fund’s returns bore no relationship to the index’s returns, its R-squared would be 0. For this report, R-squared is based on returns over the past 36 months for both the fund and the index.
Benchmark Information
Spliced Mixed-Asset Target 2055+ Funds Average: Mixed-Asset Target 2050 Funds Average
through August 31, 2013; Mixed-Asset Target 2055+ Funds Average thereafter.
65
Target 2035 Composite Index: Derived by applying the fund’s target asset allocation to the results of the following benchmarks: for international stocks of developed markets, the MSCI EAFE Index through December 15, 2010, the MSCI ACWI ex USA IMI Index through June 2, 2013, and the FTSE Global All Cap ex US Index thereafter; for emerging-market stocks, the Select Emerging Markets Index through August 23, 2006, the MSCI Emerging Markets Index through December 15, 2010, the MSCI ACWI ex USA IMI Index through June 2, 2013, and the FTSE Global All Cap ex US Index thereafter; for U.S. bonds, the Barclays U.S. Aggregate Bond Index through December 31, 2009, and the Barclays U.S. Aggregate Float Adjusted Index thereafter; for international bonds, the Barclays Global Aggregate ex-USD Float Adjusted RIC Capped Index beginning June 3, 2013; and for U.S. stocks, the Dow Jones U.S. Total Stock Market Index (formerly known as the Dow Jones Wilshire 5000 Index) through April 22, 2005, the MSCI US Broad Market Index through June 2, 2013, and the CRSP US Total Market Index thereafter. International stock benchmark returns are adjusted for withholding taxes.
Target 2040 Composite Index: Derived by applying the fund’s target asset allocation to the results of the following benchmarks: for international stocks of developed markets, the MSCI EAFE Index through December 15, 2010, the MSCI ACWI ex USA IMI Index through June 2, 2013, and the FTSE Global All Cap ex US Index thereafter; for emerging-market stocks, the Select Emerging Markets Index through August 23, 2006, the MSCI Emerging Markets Index through December 15, 2010, the MSCI ACWI ex USA IMI Index through June 2, 2013, and the FTSE Global All Cap ex US Index thereafter; for U.S. bonds, the Barclays U.S. Aggregate Bond Index through December 31, 2009, and the Barclays U.S. Aggregate Float Adjusted Index thereafter; for international bonds, the Barclays Global Aggregate ex-USD Float Adjusted RIC Capped Index beginning June 3, 2013; and for U.S. stocks, the MSCI US Broad Market Index through June 2, 2013, and the CRSP US Total Market Index thereafter. International stock benchmark returns are adjusted for withholding taxes.
Target 2045 Composite Index: Derived by applying the fund’s target asset allocation to the results of the following benchmarks: for international stocks of developed markets, the MSCI EAFE Index through December 15, 2010, the MSCI ACWI ex USA IMI Index through June 2, 2013, and the FTSE Global All Cap ex US Index thereafter; for emerging-market stocks, the Select Emerging Markets Index through August 23, 2006, the MSCI Emerging Markets Index through December 15, 2010, the MSCI ACWI ex USA IMI Index through June 2, 2013, and the FTSE Global All Cap ex US Index thereafter; for U.S. bonds, the Barclays U.S. Aggregate Bond Index through December 31, 2009, and the Barclays U.S. Aggregate Float Adjusted Index thereafter; for international bonds, the Barclays Global Aggregate ex-USD Float Adjusted RIC Capped Index beginning June 3, 2013; and for U.S. stocks, the Dow Jones U.S. Total Stock Market Index (formerly known as the Dow Jones Wilshire 5000 Index) through April 22, 2005, the MSCI US Broad Market Index through June 2, 2013, and the CRSP US Total Market Index thereafter. International stock benchmark returns are adjusted for withholding taxes.
66
Target 2050 Composite Index: Derived by applying the fund’s target asset allocation to the results of the following benchmarks: for international stocks of developed markets, the MSCI EAFE Index through December 15, 2010, the MSCI ACWI ex USA IMI Index through June 2, 2013, and the FTSE Global All Cap ex US Index thereafter; for emerging-market stocks, the Select Emerging Markets Index through August 23, 2006, the MSCI Emerging Markets Index through December 15, 2010, the MSCI ACWI ex USA IMI Index through June 2, 2013, and the FTSE Global All Cap ex US Index thereafter; for U.S. bonds, the Barclays U.S. Aggregate Bond Index through December 31, 2009, and the Barclays U.S. Aggregate Float Adjusted Index thereafter; for international bonds, the Barclays Global Aggregate ex-USD Float Adjusted RIC Capped Index beginning June 3, 2013; and for U.S. stocks, the MSCI US Broad Market Index through June 2, 2013, and the CRSP US Total Market Index thereafter. International stock benchmark returns are adjusted for withholding taxes.
Target 2055 Composite Index: Derived by applying the fund’s target asset allocation to the results of the following benchmarks: for international stocks of developed markets, the MSCI EAFE Index through December 15, 2010, the MSCI ACWI ex USA IMI Index through June 2, 2013, and the FTSE Global All Cap ex US Index thereafter; for emerging-market stocks, the MSCI Emerging Markets Index through December 15, 2010, the MSCI ACWI ex USA IMI Index through June 2, 2013, and the FTSE Global All Cap ex US Index thereafter; for U.S. bonds, the Barclays U.S. Aggregate Float Adjusted Index; for international bonds, the Barclays Global Aggregate ex-USD Float Adjusted RIC Capped Index beginning June 3, 2013; and for U.S. stocks, the MSCI US Broad Market Index through June 2, 2013, and the CRSP US Total Market Index thereafter. International stock benchmark returns are adjusted for withholding taxes.
Target 2060 Composite Index: Derived by applying the fund’s target asset allocation to the results of the following benchmarks: for international stocks of developed markets, the MSCI ACWI ex USA IMI Index through June 2, 2013, and the FTSE Global All Cap ex US Index thereafter; for emerging-market stocks, the MSCI ACWI ex USA IMI Index through June 2, 2013, and the FTSE Global All Cap ex US Index thereafter; for U.S. bonds, the Barclays U.S. Aggregate Float Adjusted Index; for international bonds, the Barclays Global Aggregate ex-USD Float Adjusted RIC Capped Index beginning June 3, 2013; and for U.S. stocks, the MSCI US Broad Market Index through June 2, 2013, and the CRSP US Total Market Index thereafter. International stock benchmark returns are adjusted for withholding taxes.
67
The People Who Govern Your Fund
The trustees of your mutual fund are there to see that the fund is operated and managed in your best interests since, as a shareholder, you are a part owner of the fund. Your fund’s trustees also serve on the board of directors of The Vanguard Group, Inc., which is owned by the Vanguard funds and provides services to them on an at-cost basis.
A majority of Vanguard’s board members are independent, meaning that they have no affiliation with Vanguard or the funds they oversee, apart from the sizable personal investments they have made as private individuals. The independent board members have distinguished backgrounds in business, academia, and public service. Each of the trustees and executive officers oversees 179 Vanguard funds.
The following table provides information for each trustee and executive officer of the fund. More information about the trustees is in the Statement of Additional Information, which can be obtained, without charge, by contacting Vanguard at 800-662-7447, or online at vanguard.com.
| InterestedTrustee1 | and Delphi Automotive LLP (automotive components); |
| Senior Advisor at New Mountain Capital. | |
| F. William McNabb III | |
| Born 1957. Trustee Since July 2009. Chairman of the | Amy Gutmann |
| Board. Principal Occupation(s) During the Past Five | Born 1949. Trustee Since June 2006. Principal |
| Years: Chairman of the Board of The Vanguard Group, | Occupation(s) During the Past Five Years: President of |
| Inc., and of each of the investment companies served | the University of Pennsylvania; Christopher H. Browne |
| by The Vanguard Group, since January 2010; Director | Distinguished Professor of Political Science, School of |
| of The Vanguard Group since 2008; Chief Executive | Arts and Sciences, and Professor of Communication, |
| Officer and President of The Vanguard Group, and of | Annenberg School for Communication, with secondary |
| each of the investment companies served by The | faculty appointments in the Department of Philosophy, |
| Vanguard Group, since 2008; Director of Vanguard | School of Arts and Sciences, and at the Graduate |
| Marketing Corporation; Managing Director of The | School of Education, University of Pennsylvania; |
| Vanguard Group (1995–2008). | Trustee of the National Constitution Center; Chair |
| of the Presidential Commission for the Study of | |
| IndependentTrustees | Bioethical Issues. |
| Emerson U. Fullwood | JoAnn Heffernan Heisen |
| Born 1948. Trustee Since January 2008. Principal | Born 1950. Trustee Since July 1998. Principal |
| Occupation(s) During the Past Five Years: Executive | Occupation(s) During the Past Five Years: Corporate |
| Chief Staff and Marketing Officer for North America | Vice President and Chief Global Diversity Officer |
| and Corporate Vice President (retired 2008) of Xerox | (retired 2008) and Member of the Executive |
| Corporation (document management products and | Committee (1997–2008) of Johnson & Johnson |
| services); Executive in Residence and 2009–2010 | (pharmaceuticals/medical devices/consumer |
| Distinguished Minett Professor at the Rochester | products); Director of Skytop Lodge Corporation |
| Institute of Technology; Director of SPX Corporation | (hotels), the University Medical Center at Princeton, |
| (multi-industry manufacturing), the United Way of | the Robert Wood Johnson Foundation, and the Center |
| Rochester, Amerigroup Corporation (managed health | for Talent Innovation; Member of the Advisory Board |
| care), the University of Rochester Medical Center, | of the Maxwell School of Citizenship and Public Affairs |
| Monroe Community College Foundation, and North | at Syracuse University. |
| Carolina A&T University. | |
| F. Joseph Loughrey | |
| Rajiv L. Gupta | Born 1949. Trustee Since October 2009. Principal |
| Born 1945. Trustee Since December 2001.2 | Occupation(s) During the Past Five Years: President |
| Principal Occupation(s) During the Past Five Years: | and Chief Operating Officer (retired 2009) of Cummins |
| Chairman and Chief Executive Officer (retired 2009) | Inc. (industrial machinery); Chairman of the Board |
| and President (2006–2008) of Rohm and Haas Co. | of Hillenbrand, Inc. (specialized consumer services), |
| (chemicals); Director of Tyco International, Ltd. | and of Oxfam America; Director of SKF AB (industrial |
| (diversified manufacturing and services), Hewlett- | machinery), Hyster-Yale Materials Handling, Inc. |
| Packard Co. (electronic computer manufacturing), | (forklift trucks), the Lumina Foundation for Education, |
| and the V Foundation for Cancer Research; Member | Executive Officers | |
| of the Advisory Council for the College of Arts and | ||
| Letters and of the Advisory Board to the Kellogg | Glenn Booraem | |
| Institute for International Studies, both at the | Born 1967. Controller Since July 2010. Principal | |
| University of Notre Dame. | Occupation(s) During the Past Five Years: Principal | |
| of The Vanguard Group, Inc.; Controller of each of | ||
| Mark Loughridge | the investment companies served by The Vanguard | |
| Born 1953. Trustee Since March 2012. Principal | Group; Assistant Controller of each of the investment | |
| Occupation(s) During the Past Five Years: Senior Vice | companies served by The Vanguard Group (2001–2010). | |
| President and Chief Financial Officer (retired 2013) | ||
| at IBM (information technology services); Fiduciary | Thomas J. Higgins | |
| Member of IBM’s Retirement Plan Committee (2004– | Born 1957. Chief Financial Officer Since September | |
| 2013); Member of the Council on Chicago Booth. | 2008. Principal Occupation(s) During the Past Five | |
| Years: Principal of The Vanguard Group, Inc.; Chief | ||
| Scott C. Malpass | Financial Officer of each of the investment companies | |
| Born 1962. Trustee Since March 2012. Principal | served by The Vanguard Group; Treasurer of each of | |
| Occupation(s) During the Past Five Years: Chief | the investment companies served by The Vanguard | |
| Investment Officer and Vice President at the University | Group (1998–2008). | |
| of Notre Dame; Assistant Professor of Finance at the | ||
| Mendoza College of Business at Notre Dame; Member | Kathryn J. Hyatt | |
| of the Notre Dame 403(b) Investment Committee; | Born 1955. Treasurer Since November 2008. Principal | |
| Board Member of TIFF Advisory Services, Inc. | Occupation(s) During the Past Five Years: Principal of | |
| (investment advisor); Member of the Investment | The Vanguard Group, Inc.; Treasurer of each of the | |
| Advisory Committees of the Financial Industry | investment companies served by The Vanguard | |
| Regulatory Authority (FINRA) and of Major League | Group; Assistant Treasurer of each of the investment | |
| Baseball. | companies served by The Vanguard Group (1988–2008). | |
| André F. Perold | Heidi Stam | |
| Born 1952. Trustee Since December 2004. Principal | Born 1956. Secretary Since July 2005. Principal | |
| Occupation(s) During the Past Five Years: George | Occupation(s) During the Past Five Years: Managing | |
| Gund Professor of Finance and Banking, Emeritus | Director of The Vanguard Group, Inc.; General Counsel | |
| at the Harvard Business School (retired 2011); | of The Vanguard Group; Secretary of The Vanguard | |
| Chief Investment Officer and Managing Partner of | Group and of each of the investment companies | |
| HighVista Strategies LLC (private investment firm); | served by The Vanguard Group; Director and Senior | |
| Director of Rand Merchant Bank; Overseer of the | Vice President of Vanguard Marketing Corporation. | |
| Museum of Fine Arts Boston. | ||
| Vanguard Senior ManagementTeam | ||
| Alfred M. Rankin, Jr. | ||
| Born 1941. Trustee Since January 1993. Principal | Mortimer J. Buckley | Chris D. McIsaac |
| Occupation(s) During the Past Five Years: Chairman, | Kathleen C. Gubanich | Michael S. Miller |
| President, and Chief Executive Officer of NACCO | Paul A. Heller | James M. Norris |
| Industries, Inc. (housewares/lignite), and of Hyster- | Martha G. King | Glenn W. Reed |
| Yale Materials Handling, Inc. (forklift trucks); Chairman | John T. Marcante | |
| of the Board of University Hospitals of Cleveland. | ||
| Peter F. Volanakis | Chairman Emeritus and Senior Advisor | |
| Born 1955. Trustee Since July 2009. Principal | ||
| Occupation(s) During the Past Five Years: President | John J. Brennan | |
| and Chief Operating Officer (retired 2010) of Corning | Chairman, 1996–2009 | |
| Incorporated (communications equipment); Trustee of | Chief Executive Officer and President, 1996–2008 | |
| Colby-Sawyer College; Member of the Advisory Board | ||
| of the Norris Cotton Cancer Center and of the Advisory | Founder | |
| Board of the Parthenon Group (strategy consulting). | ||
| John C. Bogle | ||
| Chairman and Chief Executive Officer, 1974–1996 | ||
1 Mr. McNabb is considered an “interested person,” as defined in the Investment Company Act of 1940, because he is an officer of the
Vanguard funds.
2 December 2002 for Vanguard Equity Income Fund, the Vanguard Municipal Bond Funds, and the Vanguard State Tax-Exempt Funds.
 | |
| P.O. Box 2600 | |
| Valley Forge, PA 19482-2600 | |
| Connect with Vanguard® > vanguard.com | |
| Fund Information > 800-662-7447 | |
| Direct Investor Account Services > 800-662-2739 | |
| Institutional Investor Services > 800-523-1036 | |
| Text Telephone for People | |
| With Hearing Impairment > 800-749-7273 | |
| This material may be used in conjunction | |
| with the offering of shares of any Vanguard | |
| fund only if preceded or accompanied by | |
| the fund’s current prospectus. | |
| All comparative mutual fund data are from Lipper, a | |
| Thomson Reuters Company, or Morningstar, Inc., unless | |
| otherwise noted. | |
| You can obtain a free copy of Vanguard’s proxy voting | |
| guidelines by visiting vanguard.com/proxyreporting or by | |
| calling Vanguard at 800-662-2739. The guidelines are | |
| also available from the SEC’s website, sec.gov. In | |
| addition, you may obtain a free report on how your fund | |
| voted the proxies for securities it owned during the 12 | |
| months ended June 30. To get the report, visit either | |
| vanguard.com/proxyreporting or sec.gov. | |
| You can review and copy information about your fund at | |
| the SEC’s Public Reference Room in Washington, D.C. To | |
| find out more about this public service, call the SEC at | |
| 202-551-8090. Information about your fund is also | |
| available on the SEC’s website, and you can receive | |
| copies of this information, for a fee, by sending a | |
| request in either of two ways: via e-mail addressed to | |
| publicinfo@sec.gov or via regular mail addressed to the | |
| Public Reference Section, Securities and Exchange | |
| Commission, Washington, DC 20549-1520. | |
| © 2014 The Vanguard Group, Inc. | |
| All rights reserved. | |
| Vanguard Marketing Corporation, Distributor. | |
| Q3082B 052014 | |
Item 2: Code of Ethics.
Not Applicable.
Item 3:
Not Applicable.
Item 4: Principal Accountant Fees and Services.
Not. Applicable.
Item 5: Audit Committee of Listed Registrants.
Not Applicable.
Item 6: Investments.
Not Applicable.
Item 7: Disclosure of Proxy Voting Policies and Procedures for Closed-End Management
Investment Companies.
Not Applicable.
Item 8: Portfolio Managers of Closed-End Management Investment Companies.
Not Applicable.
Item 9: Purchase of Equity Securities by Closed-End Management Investment Company and
Affiliated Purchasers.
Not Applicable.
Item 10: Submission of Matters to a Vote of Security Holders.
Not Applicable.
Item 11: Controls and Procedures.
(a) Disclosure Controls and Procedures. The Principal Executive and Financial Officers concluded that the Registrant’s Disclosure Controls and Procedures are effective based on their evaluation of the Disclosure Controls and Procedures as of a date within 90 days of the filing date of this report.
(b) Internal Control Over Financial Reporting. There were no significant changes in Registrant’s Internal Control Over Financial Reporting or in other factors that could significantly affect this control subsequent to the date of the evaluation, including any corrective actions with regard to significant deficiencies and material weaknesses.
Item 12: Exhibits.
(a) Certifications.
Pursuant to the requirements of the Securities Exchange Act of 1934 and the Investment Company Act of 1940, the registrant has duly caused this report to be signed on its behalf by the undersigned, thereunto duly authorized.
| VANGUARD CHESTER FUNDS | |
| BY: | /s/ F. WILLIAM MCNABB III* |
| F. WILLIAM MCNABB III | |
| CHIEF EXECUTIVE OFFICER | |
| Date: May 19, 2014 | |
Pursuant to the requirements of the Securities Exchange Act of 1934 and the Investment Company Act of 1940, this report has been signed below by the following persons on behalf of the registrant and in the capacities and on the dates indicated.
| VANGUARD CHESTER FUNDS | |
BY: | /s/ F. WILLIAM MCNABB III* |
| F. WILLIAM MCNABB III | |
| CHIEF EXECUTIVE OFFICER | |
Date: May 19, 2014 | |
| VANGUARD CHESTER FUNDS |
BY: | /s/ THOMAS J. HIGGINS* |
| THOMAS J. HIGGINS | |
| CHIEF FINANCIAL OFFICER | |
Date: May 19, 2014 | |
* By: /s/ Heidi Stam
Heidi Stam, pursuant to a Power of Attorney filed on April 22, 2014 see file Number
2-17620, Incorporated by Reference.