UNITED STATES
SECURITIES AND EXCHANGE COMMISSION
Washington, D.C. 20549
FORM N-CSR
CERTIFIED SHAREHOLDER REPORT
OF
REGISTERED MANAGEMENT INVESTMENT COMPANIES
Investment Company Act file number: 811-04098
Name of Registrant: Vanguard Chester Funds
Address of Registrant:
P.O. Box 2600
Valley Forge, PA 19482
Name and address of agent for service:
Heidi Stam, Esquire
P.O. Box 876
Valley Forge, PA 19482
Registrant’s telephone number, including area code: (610) 669-1000
Date of fiscal year end: September 30
Date of reporting period: October 1, 2012 – March 31, 2013
Item 1: Reports to Shareholders
|
| Semiannual Report | March 31, 2013 |
| Vanguard PRIMECAP Fund |
 |
> Vanguard PRIMECAP Fund returned about 17% for the six months ended March 31, 2013, surpassing the performance of its benchmark index and the average return of peer funds.
> The broad U.S. stock market advanced more than 11% as the nation’s economic recovery continued and corporate earnings remained strong.
> Health care and information technology, the fund’s two largest sectors, contributed the most to its results.
| Contents | |
| Your Fund’s Total Returns. | 1 |
| Chairman’s Letter. | 2 |
| Advisor’s Report. | 7 |
| Fund Profile. | 10 |
| Performance Summary. | 11 |
| Financial Statements. | 12 |
| About Your Fund’s Expenses. | 23 |
| Glossary. | 25 |
Please note: The opinions expressed in this report are just that—informed opinions. They should not be considered promises or advice. Also, please keep in mind that the information and opinions cover the period through the date on the front of this report. Of course, the risks of investing in your fund are spelled out in the prospectus.
See the Glossary for definitions of investment terms used in this report.
About the cover: Our cover photograph shows rigging on the HMSSurprise, a replica of an 18th-century Royal Navy frigate. It was featured in the 2003 movie Master and Commander: The Far Side of the World, which was based on Patrick O’Brian’s sea novels, set amid the Napoleonic Wars. Vanguard was named for another ship of that era, the HMSVanguard, which was the flagship of British Admiral Horatio Nelson at the Battle of the Nile.
Your Fund’s Total Returns
| Six Months Ended March 31, 2013 | |
| Total | |
| Returns | |
| Vanguard PRIMECAP Fund | |
| Investor Shares | 17.08% |
| Admiral™ Shares | 17.14 |
| S&P 500 Index | 10.19 |
| Multi-Cap Growth Funds Average | 8.88 |
| Multi-Cap Growth Funds Average: Derived from data provided by Lipper Inc. | |
| Admiral Shares carry lower expenses and are available to investors who meet certain account-balance requirements. | |
| Your Fund’s Performance at a Glance | ||||
| September 30, 2012, Through March 31, 2013 | ||||
| Distributions Per Share | ||||
| Starting | Ending | Income | Capital | |
| Share Price | Share Price | Dividends | Gains | |
| Vanguard PRIMECAP Fund | ||||
| Investor Shares | $69.39 | $79.33 | $0.965 | $0.721 |
| Admiral Shares | 72.03 | 82.30 | 1.079 | 0.748 |
1

Chairman’s Letter
Dear Shareholder,
In an investing climate that was ripe for stocks of all sizes and styles, Vanguard PRIMECAP Fund delivered especially robust results for the six-month period ended March 31. The fund returned about 17%, ending far ahead of the benchmark Standard & Poor’s 500 Index, which rose about 10%, and the nearly 9% average return of fund peers.
PRIMECAP’s superior performance against its comparative standards was especially pleasing in the wake of some recent fiscal periods, when the fund frequently found itself looking up at the returns of its benchmark and peer group. Although we’re encouraged by the latest results, we recognize that six months is just a page in the fund’s nearly 30-year history and that meaningful conclusions are formed from longer-term data.
Indeed, patience and commitment are central to the investment process of PRIMECAP Management Company, the fund’s advisor. Its willingness to hold to its convictions through the inevitable down times has often led to periods of reward.
Global equity markets delivered a powerful rally
Global stocks advanced for the fifth straight month to finish the half year ended March 31 with impressive gains. The S&P 500 Index closed at a record high on the period’s final business day. World financial markets in recent months
2
shrugged off the U.S. “fiscal cliff” crisis, the unsettled Italian national elections, and a controversial bailout package for Cyprus.
Peter Westaway, Vanguard’s chief European economist, said that the latest developments in the European debt crisis had been “rather bad,” but that the market had for the most part already priced in these events. “As always,” he said, “we think investors should assess their portfolios carefully and avoid making impulsive moves.”
The broad U.S. stock market, as measured by the Russell 3000 Index, rose more than 11% as the economic recovery kept slowly building momentum; the housing market rebounded further, and the labor market improved. International equities were up more than 9%. Returns were about 16% for developed markets in the Pacific region, where Japan’s accommodative monetary policy has helped spark the nation’s stock market, and nearly 10% in Europe. Stocks in emerging markets rose about 4%.
Bond returns barely budged as yields lingered near lows
The broad U.S. taxable bond market scraped out a minuscule gain of 0.09% for the half-year as U.S. Treasury yields remained just slightly above their all-time lows. Although the yield of the benchmark 10-year Treasury note increased during the six months and topped 2.00% at various times, it closed the period at about 1.85%. (Bond prices and yields move in opposite directions.)
| Market Barometer | |||
| Total Returns | |||
| Periods Ended March 31, 2013 | |||
| Six | One | Five Years | |
| Months | Year | (Annualized) | |
| Stocks | |||
| Russell 1000 Index (Large-caps) | 11.10% | 14.43% | 6.15% |
| Russell 2000 Index (Small-caps) | 14.48 | 16.30 | 8.24 |
| Russell 3000 Index (Broad U.S. market) | 11.35 | 14.56 | 6.32 |
| MSCI All Country World Index ex USA (International) | 9.20 | 8.36 | -0.39 |
| Bonds | |||
| Barclays U.S. Aggregate Bond Index (Broad taxable market) | 0.09% | 3.77% | 5.47% |
| Barclays Municipal Bond Index (Broad tax-exempt market) | 0.96 | 5.25 | 6.10 |
| Citigroup Three-Month U.S. Treasury Bill Index | 0.05 | 0.08 | 0.30 |
| CPI | |||
| Consumer Price Index | 0.59% | 1.47% | 1.74% |
3
Municipal bonds returned almost 1% for the six months despite price declines in March. And returns of money market funds and savings accounts barely registered as short-term interest rates remained between 0% and 0.25% under the Federal Reserve’s four-year-old policy.
Robert Auwaerter, head of Vanguard’s Fixed Income Group, doesn’t anticipate abrupt policy changes from the central bank. “We don’t see the Fed changing course in the near term,” he said, “and when the Fed does, we expect it’ll go slowly so as not to undo the efforts made to keep interest rates low and to stimulate the economy.”
Health care and technology stocks drove the fund’s strong performance
PRIMECAP Management’s patience and commitment, the traits I noted earlier, stem from the company’s investment approach, which combines fundamental research, individual decision-making, and unwavering discipline with a long-term investment horizon. Overall, the advisor applies a contrarian strategy in searching for growth stocks that the market finds unfavorable.
PRIMECAP Management’s rigorous selection process leads to a portfolio that is more concentrated than the S&P 500; the fund’s holdings numbered about 125 as of March 31. As a result, the fund
| Expense Ratios | |||
| Your Fund Compared With Its Peer Group | |||
| Investor | Admiral | Peer Group | |
| Shares | Shares | Average | |
| PRIMECAP Fund | 0.45% | 0.36% | 1.31% |
The fund expense ratios shown are from the prospectus dated January 28, 2013, and represent estimated costs for the current fiscal year. For the six months ended March 31, 2013, the fund’s annualized expense ratios were 0.45% for Investor Shares and 0.36% for Admiral Shares. The peer-group expense ratio is derived from data provided by Lipper Inc. and captures information through year-end 2012.
Peer group: Multi-Cap Growth Funds.
4
is likely to perform very differently from the benchmark as the advisor strives to exceed it over the long term.
The advisor has mined the health care and information technology sectors more than any others in its search for stock market gems. Sometimes these sparkle immediately, and sometimes they take longer to reveal their value. The advisor’s devotion to both sectors has been notable over the years, and in the past six months so was the sectors’ performance. The fund held more than 30% of its assets in each of them on average, about double the benchmark’s overall exposure.
The health care sector was the fund’s most productive, contributing 7 percentage points to its return. Over the past few years, PRIMECAP Management has gradually increased its exposure to this sector––as well as made more astute stock choices within it––as long-term trends in the industry have produced a favorable environment for health care companies.
In the recent period, the fund benefited from both its overall allocation to the sector and its specific holdings, particularly in the pharmaceutical and biotechnology industries. Large companies in both fields have profited from improved pipelines of new medicines as well as favorable rulings from the Food and Drug Administration. Decreasing costs and streamlined operations have also boosted the bottom line.
Within the technology sector, the fund fared well relative to the benchmark index partly because of stocks it didn’t own or owned in small amounts. Chief among these was Apple, whose stock dropped about 33% as investors grew concerned about the firm’s ability to sustain its high-flying growth given increased competition in the computer and mobile device arena. (Of course, the lack of exposure to Apple has also meant that the fund didn’t benefit from the company’s soaring stock price over the past few years.)
Conversely, the PRIMECAP Fund’s holdings in the software, semiconductor, and communication equipment industries performed strongly, as several companies stirred both investor and customer interest with innovative new products and services.
While health care and technology dominated the overall return, the fund’s industrial holdings also helped. Here, airline and aerospace and defense corporations were among the strongest contributors. None of the industry sectors recorded a decline for the fund, although holdings in the financial and consumer discretionary sectors trailed their counterparts in the benchmark.
For more about the advisor’s strategy and the fund’s positioning during the six months, please see the Advisor’s Report that follows this letter.
5
Low cost and talent drive successful active management
Investors sometimes ask if it’s a contradiction that Vanguard, a champion of index investing, offers actively managed mutual funds. To understand how active funds fit into our philosophy, consider for a moment why indexing has proved its mettle: It’s a generally low-cost, tax-efficient way to build a diversified portfolio that lets you keep more of your fund’s returns. Because index funds seek to track the overall market or a segment of it, they typically cost much less to run than funds that are actively managed in an effort to outperform the market. And the less you pay for a fund, the more of its returns come back to you.
The same principle—low cost—drives our approach to active funds. The other essential ingredient is talent. Some wonder how we can afford to hire top active managers when we place such importance on keeping investing costs low. The answer lies in the characteristics of Vanguard’s structure and culture—our mutual ownership, our large scale, a long-term perspective, and a rigorous oversight process, which I lead. (You can read more about our approach in The Case for Vanguard Active Management: Solving the Low-Cost/Top-Talent Paradox? at vanguard.com/research.)
These enduring advantages don’t guarantee outperformance, of course. Even in those cases where an active stock fund outperforms over long periods, it doesn’t necessarily mean that investors earned more than the index results every year—or even every decade. And investors have no way of knowing beforehand which funds will outperform.
But for those willing to accept the greater risks that come with active investing, we believe Vanguard’s combination of talented advisors and low costs can improve the odds.
As always, thank you for entrusting your assets to Vanguard.
Sincerely,

F. William McNabb III
Chairman and Chief Executive Officer
April 10, 2013
6
Advisor’s Report
For the six months ended March 31, 2013, Vanguard PRIMECAP Fund returned 17.08% for Investor Shares and 17.14% for Admiral Shares, exceeding both the 10.19% return of its benchmark, the unmanaged S&P 500 Index, and the 8.88% average return of its multi-capitalization growth fund competitors. Favorable stock selection in the information technology and health care sectors was the main reason for the positive performance.
Investment environment
The economic environment during the period was clouded by uncertainty over the fiscal challenges faced by the federal government. Although the passage of the American Taxpayer Relief Act of 2012 in early January averted the tax issues related to the “fiscal cliff,” it only delayed budget sequestration until March, when automatic spending reductions began to take effect. We expect that the federal spending cuts, along with higher payroll and other taxes, will have a negative impact on U.S. economic growth. Meanwhile, Europe continues to face difficulties due to sovereign-debt crises, as evidenced by the recent unconventional bailout of Cyprus.
The stock market shrugged off these challenges. Continued monetary stimulus by central banks in the United States, Europe, and Japan likely contributed to the strong gains. The U.S. housing market recovery appears to be accelerating, aided by the current low-interest-rate environment. The corporate sector remains an area of strength, with profit margins near
all-time highs. Consumer spending has resumed growth, despite the expiration of the payroll tax holiday at the beginning of 2013.
Management of the fund
While our focus is on the long term, we are encouraged by the fund’s performance in the past six months. After generally lagging the return of the S&P 500 Index for two-and-a-half years, the fund’s results improved dramatically. We remain committed to our investment philosophy, which is to identify companies that, over time, will exceed the market’s expectations.
This strategy has led us to build and maintain significant investments in health care and information technology companies that we believe offer the potential for higher returns than the overall market.
As of March 31, 2013, these two sectors made up more than 60% of the fund’s assets (versus 31% of the S&P 500 Index). Nine of the ten largest holdings were either health care or information technology stocks.
Information technology
The fund’s holdings in this sector were the largest contributors to its outperformance relative to the S&P 500 Index. Our selections returned 14.6% for the period, while the index sector declined a bit. The fund’s standouts were Research In Motion (+93%), Adobe Systems (+34%), and Texas Instruments (+31%). It also helped to have minimal exposure to Apple (–33%).
7
We believe that the technology companies in the fund remain attractively valued. In fact, the price/earnings ratio of the sector relative to the S&P 500 Index is at its lowest level since 1990. Many of these stocks have free cash flow yields of more than 7%, placing them in the index’s top quintile for non-financial companies. These metrics appear even more compelling when we consider the strong prospects and growing cash balances that characterize many of the fund’s technology holdings.
We maintain the view expressed in previous letters that these companies should benefit as consumers and businesses use computers for an ever-increasing number of tasks, driving growth in demand for semiconductors, computer hardware, software, storage, networking, and technology-driven services such as consulting and data analytics.
Health care
Holdings in health care returned 23.0%. Strong stock selection helped drive results. Some of the largest positions in the fund were among the top contributors to relative returns, including Roche (+29%), Biogen Idec (+29%), Amgen (+23%), Eli Lilly (+22%), and Novartis (+20%).
We remain excited about our health care stocks. Global demographic trends and ongoing innovation should sustain the sector’s growth over the foreseeable future. Aging populations worldwide, along with rising standards of living in emerging markets, should lead to greater demand for health-related products. As the elderly cohort increases, spending will grow, because older people typically consume three times as many health care resources as the general population. In addition, as household wealth increases in developing nations, their populations’ willingness and ability to spend on health care should rise as well.
At the same time, the industry’s considerable investment in research and development over the years is driving the design of new and more effective therapies for many diseases, such as cancer, diabetes, and Alzheimer’s. The precipitous decline in the cost of genetic sequencing is allowing researchers to identify previously unknown diseases and to rapidly develop therapies that improve the standard of care and save lives. Increasingly, drugs developed based on genetic research are providing higher cure rates with fewer side effects than conventional treatments.
Other sectors
Stock selection in industrials also boosted the fund’s results. Alaska Air (+82%), European Aeronautic Defence & Space (+61%), and Southwest Airlines (+54%) were among the biggest contributors. Relative to the index, the fund benefited from both stock selection and an underweight position in the energy sector. Underweight positions helped in utilities and telecommunications as well.
On the other hand, the fund’s significant underweighting in financials, which led all sectors in the S&P 500 Index with an 18.0% return, hurt relative performance for the period. This was partially offset by
8
stock selection in the sector, with the most help coming from Charles Schwab (+39%). Poor stock picks in the consumer discretionary and materials sectors also restrained results. In relative terms, the biggest detractors were L Brands (–3%) and DIRECTV (+8%) in consumer discretionary and Potash Corporation (–9%) in materials.
Outlook
As we assess the remainder of the fiscal year, we are more cautious in our outlook for U.S. equities than we were a year ago. The S&P 500 Index has appreciated significantly and is trading at an all-time high, and we believe valuations are stretched in some segments of the market. We have concerns regarding economic growth, which could pressure revenue and earnings expansion. Furthermore, the ongoing uncertainties surrounding fiscal and tax policies are discouraging consumers and companies from making investment decisions.
However, stocks remain attractively valued relative to bonds and most other asset classes, increasing the likelihood that net investment flows to stocks from bonds and money market funds could support prices. From mid-2007 to year-end 2012, domestic stock funds experienced more than $600 billion in net outflows while bond funds gained more than $1.1 trillion in net inflows. If investors develop a greater tolerance for risk as they seek higher returns, this trend could reverse, leading to higher equity prices. Preliminary estimates indicate that domestic stock funds gained nearly $20 billion in net inflows in the first quarter of 2013, the largest quarterly amount since the second quarter of 2009.
We are more optimistic about investment opportunities in certain segments of the market. Specifically, valuations in health care and information technology appear attractive. The price/earnings ratios of these sectors relative to the overall S&P 500 Index are below their 15-year averages. Health care is trading in line with the index instead of at its typical 10% premium, and information technology is trading at a 10% discount instead of at its historical 35% premium. Yet in the second half of 2012, revenue growth rates in these sectors exceeded those of the other eight in the index, each of which is trading above its 15-year average.
PRIMECAP Management Company
April 12, 2013
9
PRIMECAP Fund
Fund Profile
As of March 31, 2013
| Share-Class Characteristics | ||
| Investor | Admiral | |
| Shares | Shares | |
| Ticker Symbol | VPMCX | VPMAX |
| Expense Ratio1 | 0.45% | 0.36% |
| 30-Day SEC Yield | 1.19% | 1.28% |
| Portfolio Characteristics | |||
| DJ U.S. | |||
| Total | |||
| Market | |||
| S&P 500 | FA | ||
| Fund | Index | Index | |
| Number of Stocks | 123 | 500 | 3,586 |
| Median Market Cap | $46.4B | $58.7B | $40.0B |
| Price/Earnings Ratio | 19.7x | 17.0x | 18.1x |
| Price/Book Ratio | 3.3x | 2.3x | 2.3x |
| Return on Equity | 20.1% | 18.1% | 16.6% |
| Earnings Growth Rate | 11.7% | 9.6% | 9.6% |
| Dividend Yield | 1.7% | 2.1% | 2.0% |
| Foreign Holdings | 12.7% | 0.0% | 0.0% |
| Turnover Rate | |||
| (Annualized) | 4% | — | — |
| Short-Term Reserves | 3.2% | — | — |
| Sector Diversification (% of equity exposure) | |||
| DJ U.S. | |||
| Total | |||
| Market | |||
| S&P 500 | FA | ||
| Fund | Index | Index | |
| Consumer Discretionary | 8.6% | 11.6% | 12.4% |
| Consumer Staples | 0.8 | 11.0 | 9.5 |
| Energy | 4.4 | 10.9 | 10.1 |
| Financials | 5.1 | 15.9 | 17.3 |
| Health Care | 33.1 | 12.6 | 12.2 |
| Industrials | 13.9 | 10.1 | 11.1 |
| Information Technology | 30.4 | 18.0 | 17.4 |
| Materials | 3.6 | 3.4 | 3.8 |
| Telecommunication | |||
| Services | 0.0 | 3.0 | 2.6 |
| Utilities | 0.1 | 3.5 | 3.6 |
| Volatility Measures | ||
| DJ U.S. | ||
| Total | ||
| Market | ||
| S&P 500 | FA | |
| Index | Index | |
| R-Squared | 0.97 | 0.97 |
| Beta | 1.05 | 1.01 |
These measures show the degree and timing of the fund’s fluctuations compared with the indexes over 36 months.
| Ten Largest Holdings (% of total net assets) | ||
| Biogen Idec Inc. | Biotechnology | 6.5% |
| Amgen Inc. | Biotechnology | 6.2 |
| Eli Lilly & Co. | Pharmaceuticals | 4.2 |
| Roche Holding AG | Pharmaceuticals | 4.2 |
| Google Inc. | Internet Software & | |
| Services | 4.1 | |
| FedEx Corp. | Air Freight & | |
| Logistics | 3.7 | |
| Texas Instruments Inc. | Semiconductors | 3.5 |
| Microsoft Corp. | Systems Software | 3.2 |
| Novartis AG | Pharmaceuticals | 3.2 |
| Adobe Systems Inc. | Application Software | 3.1 |
| Top Ten | 41.9% | |
The holdings listed exclude any temporary cash investments and equity index products.
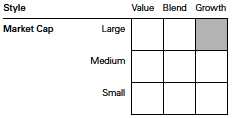
Investment Focus
1 The expense ratios shown are from the prospectus dated January 28, 2013, and represent estimated costs for the current fiscal year. For the six months ended March 31, 2013, the annualized expense ratios were 0.45% for Investor Shares and 0.36% for Admiral Shares.
10
PRIMECAP Fund
Performance Summary
All of the returns in this report represent past performance, which is not a guarantee of future results that may be achieved by the fund. (Current performance may be lower or higher than the performance data cited. For performance data current to the most recent month-end, visit our website at vanguard.com/performance.) Note, too, that both investment returns and principal value can fluctuate widely, so an investor’s shares, when sold, could be worth more or less than their original cost. The returns shown do not reflect taxes that a shareholder would pay on fund distributions or on the sale of fund shares.
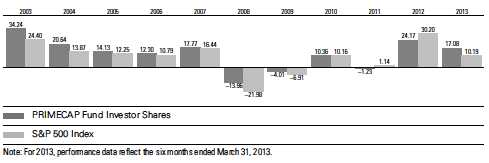
Fiscal-Year Total Returns (%): September 30, 2002, Through March 31, 2013
| Average Annual Total Returns: Periods Ended March 31, 2013 | ||||
| Inception | One | Five | Ten | |
| Date | Year | Years | Years | |
| Investor Shares | 11/1/1984 | 19.23% | 7.30% | 11.46% |
| Admiral Shares | 11/12/2001 | 19.34 | 7.40 | 11.59 |
See Financial Highlights for dividend and capital gains information.
11
PRIMECAP Fund
Financial Statements (unaudited)
Statement of Net Assets
As of March 31, 2013
The fund reports a complete list of its holdings in regulatory filings four times in each fiscal year, at the quarter-ends. For the second and fourth fiscal quarters, the lists appear in the fund’s semiannual and annual reports to shareholders. For the first and third fiscal quarters, the fund files the lists with the Securities and Exchange Commission on Form N-Q. Shareholders can look up the fund’s Forms N-Q on the SEC’s website at sec.gov. Forms N-Q may also be reviewed and copied at the SEC’s Public Reference Room (see the back cover of this report for further information).
| Market | |||
| Value | |||
| Shares | ($000) | ||
| Common Stocks (97.1%) | |||
| Consumer Discretionary (8.4%) | |||
| * | DIRECTV | 11,553,062 | 654,019 |
| L Brands Inc. | 9,429,987 | 421,143 | |
| TJX Cos. Inc. | 6,875,000 | 321,406 | |
| Walt Disney Co. | 5,575,000 | 316,660 | |
| Whirlpool Corp. | 1,935,800 | 229,315 | |
| Carnival Corp. | 5,234,800 | 179,554 | |
| ^ | Sony Corp. ADR | 10,050,000 | 175,619 |
| Mattel Inc. | 4,000,000 | 175,160 | |
| * | Bed Bath & Beyond Inc. | 2,300,975 | 148,229 |
| Lowe’s Cos. Inc. | 750,000 | 28,440 | |
| Time Warner Cable Inc. | 260,000 | 24,975 | |
| Ross Stores Inc. | 368,800 | 22,357 | |
| * | Amazon.com Inc. | 70,000 | 18,654 |
| Las Vegas Sands Corp. | 300,000 | 16,905 | |
| VF Corp. | 99,350 | 16,666 | |
| Macy’s Inc. | 358,800 | 15,012 | |
| Target Corp. | 100,000 | 6,845 | |
| 2,770,959 | |||
| Consumer Staples (0.8%) | |||
| Costco Wholesale Corp. | 1,915,000 | 203,201 | |
| Kellogg Co. | 810,000 | 52,188 | |
| PepsiCo Inc. | 145,000 | 11,471 | |
| 266,860 | |||
| Energy (4.3%) | |||
| Noble Energy Inc. | 4,055,000 | 469,001 | |
| EOG Resources Inc. | 2,215,000 | 283,675 | |
| Schlumberger Ltd. | 3,682,200 | 275,760 | |
| Petroleo Brasileiro SA | |||
| ADR Type A | 3,086,200 | 56,014 | |
| * | Transocean Ltd. | 1,075,900 | 55,904 |
| Cenovus Energy Inc. | 1,700,000 | 52,683 | |
| Encana Corp. | 2,560,000 | 49,818 | |
| Exxon Mobil Corp. | 515,000 | 46,407 | |
| Market | |||
| Value | |||
| Shares | ($000) | ||
| * | Cameron International Corp. | 650,000 | 42,380 |
| * | Southwestern Energy Co. | 840,000 | 31,298 |
| National Oilwell Varco Inc. | 420,000 | 29,715 | |
| Noble Corp. | 200,000 | 7,630 | |
| Petroleo Brasileiro | |||
| SA ADR | 400,000 | 6,628 | |
| 1,406,913 | |||
| Financials (4.9%) | |||
| Marsh & McLennan | |||
| Cos. Inc. | 16,006,100 | 607,752 | |
| Charles Schwab Corp. | 28,315,900 | 500,908 | |
| * | Berkshire Hathaway Inc. | ||
| Class B | 2,400,000 | 250,080 | |
| Chubb Corp. | 2,500,000 | 218,825 | |
| American Express Co. | 457,100 | 30,836 | |
| CME Group Inc. | 235,000 | 14,427 | |
| Weyerhaeuser Co. | 300,000 | 9,414 | |
| 1,632,242 | |||
| Health Care (32.1%) | |||
| * | Biogen Idec Inc. | 11,205,462 | 2,161,646 |
| Amgen Inc. | 20,161,100 | 2,066,714 | |
| Eli Lilly & Co. | 24,500,800 | 1,391,401 | |
| Roche Holding AG | 5,900,000 | 1,375,427 | |
| Novartis AG ADR | 14,724,765 | 1,048,992 | |
| Medtronic Inc. | 16,453,952 | 772,678 | |
| Johnson & Johnson | 6,564,800 | 535,228 | |
| * | Life Technologies Corp. | 6,939,300 | 448,487 |
| GlaxoSmithKline plc ADR | 5,121,200 | 240,236 | |
| * | Boston Scientific Corp. | 28,342,560 | 221,355 |
| Abbott Laboratories | 5,082,900 | 179,528 | |
| AbbVie Inc. | 2,449,800 | 99,903 | |
| Sanofi ADR | 1,205,000 | 61,551 | |
| Stryker Corp. | 259,000 | 16,897 | |
| Zimmer Holdings Inc. | 197,000 | 14,818 | |
| 10,634,861 | |||
12
PRIMECAP Fund
| Market | |||
| Value | |||
| Shares | ($000) | ||
| Industrials (13.5%) | |||
| FedEx Corp. | 12,391,070 | 1,216,803 | |
| Honeywell | |||
| International Inc. | 8,309,300 | 626,106 | |
| Southwest Airlines Co. | 34,537,600 | 465,567 | |
| C.H. Robinson | |||
| Worldwide Inc. | 5,986,900 | 355,981 | |
| United Parcel | |||
| Service Inc. Class B | 3,281,070 | 281,844 | |
| Union Pacific Corp. | 1,836,200 | 261,493 | |
| Caterpillar Inc. | 2,840,000 | 246,995 | |
| European | |||
| Aeronautic Defence | |||
| and Space Co. NV | 4,233,700 | 215,786 | |
| * | Alaska Air Group Inc. | 3,090,200 | 197,649 |
| Deere & Co. | 1,961,500 | 168,650 | |
| Boeing Co. | 1,775,760 | 152,449 | |
| PACCAR Inc. | 1,221,000 | 61,734 | |
| ^ | Canadian Pacific | ||
| Railway Ltd. | 447,800 | 58,424 | |
| Expeditors International | |||
| of Washington Inc. | 1,006,700 | 35,949 | |
| Donaldson Co. Inc. | 980,000 | 35,466 | |
| * | Delta Air Lines Inc. | 1,193,000 | 19,696 |
| * | United Continental | ||
| Holdings Inc. | 570,000 | 18,246 | |
| Pall Corp. | 205,000 | 14,016 | |
| CSX Corp. | 490,000 | 12,069 | |
| Granite Construction Inc. | 290,000 | 9,234 | |
| Norfolk Southern Corp. | 46,100 | 3,553 | |
| Rockwell Automation Inc. | 25,000 | 2,159 | |
| Safran SA | 42,000 | 1,874 | |
| Cummins Inc. | 6,750 | 782 | |
| Republic Services Inc. | |||
| Class A | 17,000 | 561 | |
| 4,463,086 | |||
| Information Technology (29.5%) | |||
| * | Google Inc. Class A | 1,695,375 | 1,346,179 |
| Texas Instruments Inc. | 32,880,700 | 1,166,607 | |
| Microsoft Corp. | 36,750,800 | 1,051,440 | |
| * | Adobe Systems Inc. | 23,397,070 | 1,018,007 |
| Intuit Inc. | 11,453,900 | 751,949 | |
| Oracle Corp. | 21,573,633 | 697,691 | |
| QUALCOMM Inc. | 9,602,550 | 642,891 | |
| * | Symantec Corp. | 11,909,200 | 293,919 |
| Intel Corp. | 12,400,000 | 270,940 | |
| Visa Inc. Class A | 1,591,070 | 270,227 | |
| Accenture plc Class A | 3,505,800 | 266,336 | |
| * | EMC Corp. | 9,622,800 | 229,889 |
| Telefonaktiebolaget LM | |||
| Ericsson ADR | 16,808,914 | 211,792 | |
| * | Micron Technology Inc. | 20,000,000 | 199,600 |
| Hewlett-Packard Co. | 8,300,000 | 197,872 | |
| 1 | Plantronics Inc. | 3,701,500 | 163,569 |
| Market | |||
| Value | |||
| Shares | ($000) | ||
| *,^ | Research In Motion Ltd. | 10,438,600 | 150,838 |
| KLA-Tencor Corp. | 2,853,700 | 150,504 | |
| Motorola Solutions Inc. | 1,834,000 | 117,431 | |
| NVIDIA Corp. | 7,390,100 | 94,741 | |
| Corning Inc. | 5,243,200 | 69,892 | |
| * | NetApp Inc. | 1,650,000 | 56,364 |
| Activision Blizzard Inc. | 3,600,000 | 52,452 | |
| Applied Materials Inc. | 3,424,600 | 46,164 | |
| International Business | |||
| Machines Corp. | 190,000 | 40,527 | |
| ^ | ASML Holding NV | 551,775 | 37,526 |
| * | Entegris Inc. | 2,583,472 | 25,473 |
| Apple Inc. | 52,000 | 23,017 | |
| * | SanDisk Corp. | 400,000 | 22,000 |
| Mastercard Inc. Class A | 38,250 | 20,698 | |
| Analog Devices Inc. | 350,000 | 16,271 | |
| Altera Corp. | 400,000 | 14,188 | |
| Cisco Systems Inc. | 630,000 | 13,173 | |
| * | Rambus Inc. | 2,000,000 | 11,220 |
| * | F5 Networks Inc. | 49,250 | 4,387 |
| Dell Inc. | 200,000 | 2,866 | |
| 9,748,640 | |||
| Materials (3.5%) | |||
| Monsanto Co. | 5,912,460 | 624,533 | |
| Potash Corp. of | |||
| Saskatchewan Inc. | 11,559,200 | 453,699 | |
| Praxair Inc. | 625,000 | 69,712 | |
| EI du Pont de Nemours | |||
| & Co. | 100,000 | 4,916 | |
| 1,152,860 | |||
| Utilities (0.1%) | |||
| NextEra Energy Inc. | 229,440 | 17,823 | |
| Public Service Enterprise | |||
| Group Inc. | 381,000 | 13,083 | |
| AES Corp. | 1,000,000 | 12,570 | |
| 43,476 | |||
| Total Common Stocks | |||
| (Cost $17,094,714) | 32,119,897 | ||
| Temporary Cash Investment (3.8%) | |||
| Money Market Fund (3.8%) | |||
| 2,3 | Vanguard Market | ||
| Liquidity Fund, 0.147% | |||
| (Cost $1,255,900) 1,255,900,238 | 1,255,900 | ||
| Total Investments (100.9%) | |||
| (Cost $18,350,614) | 33,375,797 | ||
| Other Assets and Liabilities (-0.9%) | |||
| Other Assets | 441,627 | ||
| Liabilities3 | (739,441) | ||
| (297,814) | |||
| Net Assets (100%) | 33,077,983 | ||
13
PRIMECAP Fund
| At March 31, 2013, net assets consisted of: | |
| Amount | |
| ($000) | |
| Paid-in Capital | 17,454,337 |
| Undistributed Net Investment Income | 72,164 |
| Accumulated Net Realized Gains | 526,661 |
| Unrealized Appreciation (Depreciation) | |
| Investment Securities | 15,025,183 |
| Foreign Currencies | (362) |
| Net Assets | 33,077,983 |
| Investor Shares—Net Assets | |
| Applicable to 180,242,535 outstanding | |
| $.001 par value shares of beneficial | |
| interest (unlimited authorization) | 14,298,596 |
| Net Asset Value Per Share— | |
| Investor Shares | $79.33 |
| Admiral Shares—Net Assets | |
| Applicable to 228,187,062 outstanding | |
| $.001 par value shares of beneficial | |
| interest (unlimited authorization) | 18,779,387 |
| Net Asset Value Per Share— | |
| Admiral Shares | $82.30 |
See Note A in Notes to Financial Statements.
* Non-income-producing security.
^ Part of security position is on loan to broker-dealers. The total value of securities on loan is $184,386,000.
1 Considered an affiliated company of the fund as the fund owns more than 5% of the outstanding voting securities of such company.
2 Affiliated money market fund available only to Vanguard funds and certain trusts and accounts managed by Vanguard. Rate shown is the 7-day yield.
3 Includes $188,737,000 of collateral received for securities on loan.
ADR–American Depositary Receipt.
See accompanying Notes, which are an integral part of the Financial Statements.
14
PRIMECAP Fund
| Statement of Operations | |
| Six Months Ended | |
| March 31, 2013 | |
| ($000) | |
| Investment Income | |
| Income | |
| Dividends1,2 | 326,916 |
| Interest2 | 689 |
| Security Lending | 1,051 |
| Total Income | 328,656 |
| Expenses | |
| Investment Advisory Fees—Note B | 31,809 |
| The Vanguard Group—Note C | |
| Management and Administrative—Investor Shares | 15,046 |
| Management and Administrative—Admiral Shares | 11,093 |
| Marketing and Distribution—Investor Shares | 1,170 |
| Marketing and Distribution—Admiral Shares | 1,207 |
| Custodian Fees | 202 |
| Shareholders’ Reports—Investor Shares | 44 |
| Shareholders’ Reports—Admiral Shares | 38 |
| Trustees’ Fees and Expenses | 46 |
| Total Expenses | 60,655 |
| Net Investment Income | 268,001 |
| Realized Net Gain (Loss) | |
| Investment Securities Sold2 | 544,035 |
| Foreign Currencies | 294 |
| Realized Net Gain (Loss) | 544,329 |
| Change in Unrealized Appreciation (Depreciation) | |
| Investment Securities | 4,067,979 |
| Foreign Currencies | (744) |
| Change in Unrealized Appreciation (Depreciation) | 4,067,235 |
| Net Increase (Decrease) in Net Assets Resulting from Operations | 4,879,565 |
1 Dividends are net of foreign withholding taxes of $13,660,000.
2 Dividend income, interest income, and realized net gain (loss) from affiliated companies of the fund were $740,000, $689,000, and $92,675,000, respectively.
See accompanying Notes, which are an integral part of the Financial Statements.
15
PRIMECAP Fund
| Statement of Changes in Net Assets | ||
| Six Months Ended | Year Ended | |
| March 31, | September 30, | |
| 2013 | 2012 | |
| ($000) | ($000) | |
| Increase (Decrease) in Net Assets | ||
| Operations | ||
| Net Investment Income | 268,001 | 383,777 |
| Realized Net Gain (Loss) | 544,329 | 314,049 |
| Change in Unrealized Appreciation (Depreciation) | 4,067,235 | 5,337,484 |
| Net Increase (Decrease) in Net Assets Resulting from Operations | 4,879,565 | 6,035,310 |
| Distributions | ||
| Net Investment Income | ||
| Investor Shares | (181,566) | (163,746) |
| Admiral Shares | (236,820) | (144,688) |
| Realized Capital Gain1 | ||
| Investor Shares | (135,656) | (500,030) |
| Admiral Shares | (164,172) | (402,175) |
| Total Distributions | (718,214) | (1,210,639) |
| Capital Share Transactions | ||
| Investor Shares | (1,193,406) | (3,252,493) |
| Admiral Shares | 500,025 | 2,590,407 |
| Net Increase (Decrease) from Capital Share Transactions | (693,381) | (662,086) |
| Total Increase (Decrease) | 3,467,970 | 4,162,585 |
| Net Assets | ||
| Beginning of Period | 29,610,013 | 25,447,428 |
| End of Period2 | 33,077,983 | 29,610,013 |
1 Includes fiscal 2013 and 2012 short-term gain distributions totaling $0 and $25,728,000, respectively. Short-term gain distributions are treated as ordinary income dividends for tax purposes.
2 Net Assets—End of Period includes undistributed net investment income of $72,164,000 and $222,255,000.
See accompanying Notes, which are an integral part of the Financial Statements.
16
PRIMECAP Fund
Financial Highlights
| Investor Shares | ||||||
| Six Months | ||||||
| Ended | ||||||
| For a Share Outstanding | March 31, | Year Ended September 30, | ||||
| Throughout Each Period | 2013 | 2012 | 2011 | 2010 | 2009 | 2008 |
| Net Asset Value, Beginning of Period | $69.39 | $58.46 | $60.36 | $55.10 | $62.76 | $77.82 |
| Investment Operations | ||||||
| Net Investment Income | .635 | .866 | .651 | .6311 | .500 | .552 |
| Net Realized and Unrealized Gain (Loss) | ||||||
| on Investments | 10.991 | 12.857 | (1.266) | 5.076 | (3.990) | (10.913) |
| Total from Investment Operations | 11.626 | 13.723 | (.615) | 5.707 | (3.490) | (10.361) |
| Distributions | ||||||
| Dividends from Net Investment Income | (.965) | (.689) | (.614) | (.447) | (.508) | (.476) |
| Distributions from Realized Capital Gains | (.721) | (2.104) | (.671) | — | (3.662) | (4.223) |
| Total Distributions | (1.686) | (2.793) | (1.285) | (.447) | (4.170) | (4.699) |
| Net Asset Value, End of Period | $79.33 | $69.39 | $58.46 | $60.36 | $55.10 | $62.76 |
| Total Return2 | 17.08% | 24.17% | -1.23% | 10.36% | -4.01% | -13.96% |
| Ratios/Supplemental Data | ||||||
| Net Assets, End of Period (Millions) | $14,299 | $13,632 | $14,359 | $18,028 | $17,795 | $19,234 |
| Ratio of Total Expenses to | ||||||
| Average Net Assets | 0.45% | 0.45% | 0.45% | 0.45% | 0.49% | 0.43% |
| Ratio of Net Investment Income to | ||||||
| Average Net Assets | 1.65% | 1.30% | 0.95% | 1.05%1 | 1.02% | 0.76% |
| Portfolio Turnover Rate | 4% | 6% | 8% | 5% | 4% | 11% |
The expense ratio, net income ratio, and turnover rate for the current period have been annualized.
1 Net investment income per share and the ratio of net investment income to average net assets include $.128 and 0.21%, respectively, resulting from a special dividend from Weyerhaeuser Co. in July 2010.
2 Total returns do not include transaction or account service fees that may have applied in the periods shown. Fund prospectuses provide information about any applicable transaction and account service fees.
See accompanying Notes, which are an integral part of the Financial Statements.
17
PRIMECAP Fund
Financial Highlights
| Admiral Shares | ||||||
| Six Months | ||||||
| Ended | ||||||
| For a Share Outstanding | March 31, | Year Ended September 30, | ||||
| Throughout Each Period | 2013 | 2012 | 2011 | 2010 | 2009 | 2008 |
| Net Asset Value, Beginning of Period | $72.03 | $60.69 | $62.65 | $57.20 | $65.19 | $80.82 |
| Investment Operations | ||||||
| Net Investment Income | .700 | .974 | .738 | .7111 | .580 | .664 |
| Net Realized and Unrealized Gain (Loss) | ||||||
| on Investments | 11.397 | 13.333 | (1.319) | 5.269 | (4.160) | (11.327) |
| Total from Investment Operations | 12.097 | 14.307 | (.581) | 5.980 | (3.580) | (10.663) |
| Distributions | ||||||
| Dividends from Net Investment Income | (1.079) | (.785) | (.683) | (.530) | (.612) | (.586) |
| Distributions from Realized Capital Gains | (.748) | (2.182) | (.696) | — | (3.798) | (4.381) |
| Total Distributions | (1.827) | (2.967) | (1.379) | (.530) | (4.410) | (4.967) |
| Net Asset Value, End of Period | $82.30 | $72.03 | $60.69 | $62.65 | $57.20 | $65.19 |
| Total Return2 | 17.14% | 24.29% | -1.14% | 10.46% | -3.90% | -13.85% |
| Ratios/Supplemental Data | ||||||
| Net Assets, End of Period (Millions) | $18,779 | $15,978 | $11,088 | $9,765 | $9,222 | $9,651 |
| Ratio of Total Expenses to | ||||||
| Average Net Assets | 0.36% | 0.36% | 0.36% | 0.36% | 0.37% | 0.31% |
| Ratio of Net Investment Income to | ||||||
| Average Net Assets | 1.74% | 1.39% | 1.04% | 1.14%1 | 1.14% | 0.88% |
| Portfolio Turnover Rate | 4% | 6% | 8% | 5% | 4% | 11% |
The expense ratio, net income ratio, and turnover rate for the current period have been annualized.
1 Net investment income per share and the ratio of net investment income to average net assets include $.133 and 0.21%, respectively, resulting from a special dividend from Weyerhaeuser Co. in July 2010.
2 Total returns do not include transaction or account service fees that may have applied in the periods shown. Fund prospectuses provide information about any applicable transaction and account service fees.
See accompanying Notes, which are an integral part of the Financial Statements.
18
PRIMECAP Fund
Notes to Financial Statements
Vanguard PRIMECAP Fund is registered under the Investment Company Act of 1940 as an open-end investment company, or mutual fund. The fund offers two classes of shares: Investor Shares and Admiral Shares. Investor Shares are available to any investor who meets the fund’s minimum purchase requirements. Admiral Shares are designed for investors who meet certain administrative, service, and account-size criteria.
A. The following significant accounting policies conform to generally accepted accounting principles for U.S. mutual funds. The fund consistently follows such policies in preparing its financial statements.
1. Security Valuation: Securities are valued as of the close of trading on the New York Stock Exchange (generally 4 p.m., Eastern time) on the valuation date. Equity securities are valued at the latest quoted sales prices or official closing prices taken from the primary market in which each security trades; such securities not traded on the valuation date are valued at the mean of the latest quoted bid and asked prices. Securities for which market quotations are not readily available, or whose values have been affected by events occurring before the fund’s pricing time but after the close of the securities’ primary markets, are valued at their fair values calculated according to procedures adopted by the board of trustees. These procedures include obtaining quotations from an independent pricing service, monitoring news to identify significant market- or security-specific events, and evaluating changes in the values of foreign market proxies (for example, ADRs, futures contracts, or exchange-traded funds), between the time the foreign markets close and the fund’s pricing time. When fair-value pricing is employed, the prices of securities used by a fund to calculate its net asset value may differ from quoted or published prices for the same securities. Investments in Vanguard Market Liquidity Fund are valued at that fund’s net asset value.
2. Foreign Currency: Securities and other assets and liabilities denominated in foreign currencies are translated into U.S. dollars using exchange rates obtained from an independent third party as of the fund’s pricing time on the valuation date. Realized gains (losses) and unrealized appreciation (depreciation) on investment securities include the effects of changes in exchange rates since the securities were purchased, combined with the effects of changes in security prices. Fluctuations in the value of other assets and liabilities resulting from changes in exchange rates are recorded as unrealized foreign currency gains (losses) until the assets or liabilities are settled in cash, at which time they are recorded as realized foreign currency gains (losses).
3. Federal Income Taxes: The fund intends to continue to qualify as a regulated investment company and distribute all of its taxable income. Management has analyzed the fund’s tax positions taken for all open federal income tax years (September 30, 2009–2012), and for the period ended March 31, 2013, and has concluded that no provision for federal income tax is required in the fund’s financial statements.
4. Distributions: Distributions to shareholders are recorded on the ex-dividend date.
5. Security Lending: The fund may lend its securities to qualified institutional borrowers to earn additional income. Security loans are required to be secured at all times by collateral at least equal to the market value of securities loaned. Daily market fluctuations could cause the value of loaned securities to be more or less than the value of the collateral received. When this occurs, the collateral is adjusted on the next business day. The fund invests cash collateral received in Vanguard Market
19
PRIMECAP Fund
Liquidity Fund, and records a liability for the return of the collateral, during the period the securities are on loan. Security lending income represents fees charged to borrowers plus income earned on investing cash collateral, less expenses associated with the loan.
6. Other: Dividend income is recorded on the ex-dividend date. Interest income includes income distributions received from Vanguard Market Liquidity Fund and is accrued daily. Security transactions are accounted for on the date securities are bought or sold. Costs used to determine realized gains (losses) on the sale of investment securities are those of the specific securities sold.
Each class of shares has equal rights as to assets and earnings, except that each class separately bears certain class-specific expenses related to maintenance of shareholder accounts (included in Management and Administrative expenses) and shareholder reporting. Marketing and distribution expenses are allocated to each class of shares based on a method approved by the board of trustees. Income, other non-class-specific expenses, and gains and losses on investments are allocated to each class of shares based on its relative net assets.
B. PRIMECAP Management Company, provides investment advisory services to the fund for a fee calculated at an annual percentage rate of average net assets. For the six months ended March 31, 2013, the investment advisory fee represented an effective annual rate of 0.21% of the fund’s average net assets.
C. The Vanguard Group furnishes at cost corporate management, administrative, marketing, and distribution services. The costs of such services are allocated to the fund under methods approved by the board of trustees. The fund has committed to provide up to 0.40% of its net assets in capital contributions to Vanguard. At March 31, 2013, the fund had contributed capital of $4,066,000 to Vanguard (included in Other Assets), representing 0.01% of the fund’s net assets and 1.63% of Vanguard’s capitalization. The fund’s trustees and officers are also directors and officers of Vanguard.
D. Various inputs may be used to determine the value of the fund’s investments. These inputs are summarized in three broad levels for financial statement purposes. The inputs or methodologies used to value securities are not necessarily an indication of the risk associated with investing in those securities.
Level 1—Quoted prices in active markets for identical securities.
Level 2—Other significant observable inputs (including quoted prices for similar securities, interest rates, prepayment speeds, credit risk, etc.).
Level 3—Significant unobservable inputs (including the fund’s own assumptions used to determine the fair value of investments).
The following table summarizes the market value of the fund’s investments as of March 31, 2013, based on the inputs used to value them:
| Level 1 | Level 2 | Level 3 | |
| Investments | ($000) | ($000) | ($000) |
| Common Stocks | 30,351,191 | 1,768,706 | — |
| Temporary Cash Investments | 1,255,900 | — | — |
| Total | 31,607,091 | 1,768,706 | — |
20
PRIMECAP Fund
E. Distributions are determined on a tax basis and may differ from net investment income and realized capital gains for financial reporting purposes. Differences may be permanent or temporary. Permanent differences are reclassified among capital accounts in the financial statements to reflect their tax character. Temporary differences arise when certain items of income, expense, gain, or loss are recognized in different periods for financial statement and tax purposes; these differences will reverse at some time in the future. Differences in classification may also result from the treatment of short-term gains as ordinary income for tax purposes. The fund’s tax-basis capital gains and losses are determined only at the end of each fiscal year.
During the six months ended March 31, 2013, the fund realized net foreign currency gains of $294,000, which increased distributable net income for tax purposes; accordingly, such gains have been reclassified from accumulated net realized gains to undistributed net investment income.
At March 31, 2013, the cost of investment securities for tax purposes was $18,350,614,000. Net unrealized appreciation of investment securities for tax purposes was $15,025,183,000, consisting of unrealized gains of $15,861,173,000 on securities that had risen in value since their purchase and $835,990,000 in unrealized losses on securities that had fallen in value since their purchase.
F. During the six months ended March 31, 2013, the fund purchased $559,548,000 of investment securities and sold $1,764,317,000 of investment securities, other than temporary cash investments.
G. Capital share transactions for each class of shares were:
| Six Months Ended | Year Ended | |||
| March 31, 2013 | September 30, 2012 | |||
| Amount | Shares | Amount | Shares | |
| ($000) | (000) | ($000) | (000) | |
| Investor Shares | ||||
| Issued | 360,318 | 4,927 | 1,018,574 | 15,661 |
| Issued in Lieu of Cash Distributions | 313,403 | 4,485 | 657,028 | 10,847 |
| Redeemed1 | (1,867,127) | (25,620) | (4,928,095) | (75,690) |
| Net Increase (Decrease)—Investor Shares | (1,193,406) | (16,208) | (3,252,493) | (49,182) |
| Admiral Shares | ||||
| Issued | 1,349,539 | 17,727 | 3,650,726 | 54,056 |
| Issued in Lieu of Cash Distributions | 378,497 | 5,223 | 511,390 | 8,139 |
| Redeemed1 | (1,228,011) | (16,589) | (1,571,709) | (23,062) |
| Net Increase (Decrease)—Admiral Shares | 500,025 | 6,361 | 2,590,407 | 39,133 |
| 1 Net of redemption fees for fiscal 2012 of $545,000 (fund total). Effective May 23, 2012, the redemption fee was eliminated. | ||||
21
PRIMECAP Fund
H. Certain of the fund’s investments are in companies that are considered to be affiliated companies of the fund because the fund owns more than 5% of the outstanding voting securities of the company. Transactions during the period in securities of these companies were as follows:
| Current Period Transactions | |||||
| Proceeds | |||||
| Sept. 30, 2012 | from | Mar. 31, 2013 | |||
| Market | Purchases | Securities | Dividend | Market | |
| Value | at Cost | Sold | Income | Value | |
| ($000) | ($000) | ($000) | ($000) | ($000) | |
| Biogen Idec Inc. | 1,790,029 | — | 121,938 | — | NA1 |
| Plantronics Inc. | 130,774 | — | — | 740 | 163,569 |
| 1,920,803 | 740 | 163,569 | |||
| 1 Not applicable—At March 31, 2013, the security was still held, but the issuer was no longer an affiliated company of the fund. | |||||
I. In preparing the financial statements as of March 31, 2013, management considered the impact of subsequent events for potential recognition or disclosure in these financial statements.
22
About Your Fund’s Expenses
As a shareholder of the fund, you incur ongoing costs, which include costs for portfolio management, administrative services, and shareholder reports (like this one), among others. Operating expenses, which are deducted from a fund’s gross income, directly reduce the investment return of the fund.
A fund’s expenses are expressed as a percentage of its average net assets. This figure is known as the expense ratio. The following examples are intended to help you understand the ongoing costs (in dollars) of investing in your fund and to compare these costs with those of other mutual funds. The examples are based on an investment of $1,000 made at the beginning of the period shown and held for the entire period.
The accompanying table illustrates your fund’s costs in two ways:
• Based on actual fund return. This section helps you to estimate the actual expenses that you paid over the period. The ”Ending Account Value“ shown is derived from the fund‘s actual return, and the third column shows the dollar amount that would have been paid by an investor who started with $1,000 in the fund. You may use the information here, together with the amount you invested, to estimate the expenses that you paid over the period.
To do so, simply divide your account value by $1,000 (for example, an $8,600 account value divided by $1,000 = 8.6), then multiply the result by the number given for your fund under the heading ”Expenses Paid During Period.“
• Based on hypothetical 5% yearly return. This section is intended to help you compare your fund‘s costs with those of other mutual funds. It assumes that the fund had a yearly return of 5% before expenses, but that the expense ratio is unchanged. In this case—because the return used is not the fund’s actual return—the results do not apply to your investment. The example is useful in making comparisons because the Securities and Exchange Commission requires all mutual funds to calculate expenses based on a 5% return. You can assess your fund’s costs by comparing this hypothetical example with the hypothetical examples that appear in shareholder reports of other funds.
Note that the expenses shown in the table are meant to highlight and help you compare ongoing costs only and do not reflect transaction costs incurred by the fund for buying and selling securities. Further, the expenses do not include any purchase, redemption, or account service fees described in the fund prospectus. If such fees were applied to your account, your costs would be higher. Your fund does not carry a “sales load.”
The calculations assume no shares were bought or sold during the period. Your actual costs may have been higher or lower, depending on the amount of your investment and the timing of any purchases or redemptions.
You can find more information about the fund’s expenses, including annual expense ratios, in the Financial Statements section of this report. For additional information on operating expenses and other shareholder costs, please refer to your fund’s current prospectus.
23
| Six Months Ended March 31, 2013 | |||
| Beginning | Ending | Expenses | |
| Account Value | Account Value | Paid During | |
| PRIMECAP Fund | 9/30/2012 | 3/31/2013 | Period |
| Based on Actual Fund Return | |||
| Investor Shares | $1,000.00 | $1,170.83 | $2.44 |
| Admiral Shares | 1,000.00 | 1,171.38 | 1.95 |
| Based on Hypothetical 5% Yearly Return | |||
| Investor Shares | $1,000.00 | $1,022.69 | $2.27 |
| Admiral Shares | 1,000.00 | 1,023.14 | 1.82 |
The calculations are based on expenses incurred in the most recent six-month period. The fund’s annualized six-month expense ratios for that period are 0.45% for Investor Shares and 0.36% for Admiral Shares. The dollar amounts shown as “Expenses Paid” are equal to the annualized expense ratio multiplied by the average account value over the period, multiplied by the number of days in the most recent six-month period, then divided by the number of days in the most recent 12-month period.
24
Glossary
30-Day SEC Yield. A fund’s 30-day SEC yield is derived using a formula specified by the U.S. Securities and Exchange Commission. Under the formula, data related to the fund’s security holdings in the previous 30 days are used to calculate the fund’s hypothetical net income for that period, which is then annualized and divided by the fund’s estimated average net assets over the calculation period. For the purposes of this calculation, a security’s income is based on its current market yield to maturity (for bonds), its actual income (for asset-backed securities), or its projected dividend yield (for stocks). Because the SEC yield represents hypothetical annualized income, it will differ—at times significantly—from the fund’s actual experience. As a result, the fund’s income distributions may be higher or lower than implied by the SEC yield.
Beta. A measure of the magnitude of a fund’s past share-price fluctuations in relation to the ups and downs of a given market index. The index is assigned a beta of 1.00. Compared with a given index, a fund with a beta of 1.20 typically would have seen its share price rise or fall by 12% when the index rose or fell by 10%. For this report, beta is based on returns over the past 36 months for both the fund and the index. Note that a fund’s beta should be reviewed in conjunction with its R-squared (see definition). The lower the R-squared, the less correlation there is between the fund and the index, and the less reliable beta is as an indicator of volatility.
Dividend Yield. Dividend income earned by stocks, expressed as a percentage of the aggregate market value (or of net asset value, for a fund). The yield is determined by dividing the amount of the annual dividends by the aggregate value (or net asset value) at the end of the period. For a fund, the dividend yield is based solely on stock holdings and does not include any income produced by other investments.
Earnings Growth Rate. The average annual rate of growth in earnings over the past five years for the stocks now in a fund.
Equity Exposure. A measure that reflects a fund’s investments in stocks and stock futures. Any holdings in short-term reserves are excluded.
Expense Ratio. A fund’s total annual operating expenses expressed as a percentage of the fund’s average net assets. The expense ratio includes management and administrative expenses, but does not include the transaction costs of buying and selling portfolio securities.
Foreign Holdings. The percentage of a fund represented by securities or depositary receipts of companies based outside the United States.
Inception Date. The date on which the assets of a fund (or one of its share classes) are first invested in accordance with the fund’s investment objective. For funds with a subscription period, the inception date is the day after that period ends. Investment performance is measured from the inception date.
Median Market Cap. An indicator of the size of companies in which a fund invests; the midpoint of market capitalization (market price x shares outstanding) of a fund’s stocks, weighted by the proportion of the fund’s assets invested in each stock. Stocks representing half of the fund’s assets have market capitalizations above the median, and the rest are below it.
Price/Book Ratio. The share price of a stock divided by its net worth, or book value, per share. For a fund, the weighted average price/book ratio of the stocks it holds.
25
Price/Earnings Ratio. The ratio of a stock’s current price to its per-share earnings over the past year. For a fund, the weighted average P/E of the stocks it holds. P/E is an indicator of market expectations about corporate prospects; the higher the P/E, the greater the expectations for a company’s future growth.
R-Squared. A measure of how much of a fund’s past returns can be explained by the returns from the market in general, as measured by a given index. If a fund’s total returns were precisely synchronized with an index’s returns, its R-squared would be 1.00. If the fund’s returns bore no relationship to the index’s returns, its R-squared would be 0. For this report, R-squared is based on returns over the past 36 months for both the fund and the index.
Return on Equity. The annual average rate of return generated by a company during the past five years for each dollar of shareholder’s equity (net income divided by shareholder’s equity). For a fund, the weighted average return on equity for the companies whose stocks it holds.
Short-Term Reserves. The percentage of a fund invested in highly liquid, short-term securities that can be readily converted to cash.
Turnover Rate. An indication of the fund’s trading activity. Funds with high turnover rates incur higher transaction costs and may be more likely to distribute capital gains (which may be taxable to investors). The turnover rate excludes in-kind transactions, which have minimal impact on costs.
26
This page intentionally left blank.
The People Who Govern Your Fund
The trustees of your mutual fund are there to see that the fund is operated and managed in your best interests since, as a shareholder, you are a part owner of the fund. Your fund’s trustees also serve on the board of directors of The Vanguard Group, Inc., which is owned by the Vanguard funds and provides services to them on an at-cost basis.
A majority of Vanguard’s board members are independent, meaning that they have no affiliation with Vanguard or the funds they oversee, apart from the sizable personal investments they have made as private individuals. The independent board members have distinguished backgrounds in business, academia, and public service. Each of the trustees and executive officers oversees 180 Vanguard funds.
The following table provides information for each trustee and executive officer of the fund. More information about the trustees is in the Statement of Additional Information, which can be obtained, without charge, by contacting Vanguard at 800-662-7447, or online at vanguard.com.
| InterestedTrustee1 | and Delphi Automotive LLP (automotive components); |
| Senior Advisor at New Mountain Capital; Trustee of | |
| F. William McNabb III | The Conference Board. |
| Born 1957. Trustee Since July 2009. Chairman of the | |
| Board. Principal Occupation(s) During the Past Five | Amy Gutmann |
| Years: Chairman of the Board of The Vanguard Group, | Born 1949. Trustee Since June 2006. Principal |
| Inc., and of each of the investment companies served | Occupation(s) During the Past Five Years: President |
| by The Vanguard Group, since January 2010; Director | of the University of Pennsylvania; Christopher H. |
| of The Vanguard Group since 2008; Chief Executive | Browne Distinguished Professor of Political Science |
| Officer and President of The Vanguard Group and of | in the School of Arts and Sciences with secondary |
| each of the investment companies served by The | appointments at the Annenberg School for |
| Vanguard Group since 2008; Director of Vanguard | Communication and the Graduate School of Education |
| Marketing Corporation; Managing Director of The | of the University of Pennsylvania; Member of the |
| Vanguard Group (1995–2008). | National Commission on the Humanities and Social |
| Sciences; Trustee of Carnegie Corporation of New | |
| York and of the National Constitution Center; Chair | |
| of the U. S. Presidential Commission for the Study | |
| IndependentTrustees | of Bioethical Issues. |
| Emerson U. Fullwood | |
| Born 1948. Trustee Since January 2008. Principal | JoAnn Heffernan Heisen |
| Occupation(s) During the Past Five Years: Executive | Born 1950. Trustee Since July 1998. Principal |
| Chief Staff and Marketing Officer for North America | Occupation(s) During the Past Five Years: Corporate |
| and Corporate Vice President (retired 2008) of Xerox | Vice President and Chief Global Diversity Officer |
| Corporation (document management products and | (retired 2008) and Member of the Executive |
| services); Executive in Residence and 2010 | Committee (1997–2008) of Johnson & Johnson |
| Distinguished Minett Professor at the Rochester | (pharmaceuticals/medical devices/consumer |
| Institute of Technology; Director of SPX Corporation | products); Director of Skytop Lodge Corporation |
| (multi-industry manufacturing), the United Way of | (hotels), the University Medical Center at Princeton, |
| Rochester, Amerigroup Corporation (managed health | the Robert Wood Johnson Foundation, and the Center |
| care), the University of Rochester Medical Center, | for Talent Innovation; Member of the Advisory Board |
| Monroe Community College Foundation, and North | of the Maxwell School of Citizenship and Public Affairs |
| Carolina A&T University. | at Syracuse University. |
| Rajiv L. Gupta | F. Joseph Loughrey |
| Born 1945. Trustee Since December 2001.2 | Born 1949. Trustee Since October 2009. Principal |
| Principal Occupation(s) During the Past Five Years: | Occupation(s) During the Past Five Years: President |
| Chairman and Chief Executive Officer (retired 2009) | and Chief Operating Officer (retired 2009) of Cummins |
| and President (2006–2008) of Rohm and Haas Co. | Inc. (industrial machinery); Chairman of the Board of |
| (chemicals); Director of Tyco International, Ltd. | Hillenbrand, Inc. (specialized consumer services); |
| (diversified manufacturing and services), Hewlett- | Director of SKF AB (industrial machinery), the Lumina |
| Packard Co. (electronic computer manufacturing), |
| Foundation for Education, and Oxfam America; | Executive Officers | |
| Chairman of the Advisory Council for the College of | ||
| Arts and Letters and Member of the Advisory Board to | Glenn Booraem | |
| the Kellogg Institute for International Studies at the | Born 1967. Controller Since July 2010. Principal | |
| University of Notre Dame. | Occupation(s) During the Past Five Years: Principal | |
| of The Vanguard Group, Inc.; Controller of each of | ||
| Mark Loughridge | the investment companies served by The Vanguard | |
| Born 1953. Trustee Since March 2012. Principal | Group; Assistant Controller of each of the investment | |
| Occupation(s) During the Past Five Years: Senior Vice | companies served by The Vanguard Group (2001–2010). | |
| President and Chief Financial Officer at IBM (information | ||
| technology services); Fiduciary Member of IBM’s | Thomas J. Higgins | |
| Retirement Plan Committee. | Born 1957. Chief Financial Officer Since September | |
| 2008. Principal Occupation(s) During the Past Five | ||
| Scott C. Malpass | Years: Principal of The Vanguard Group, Inc.; Chief | |
| Born 1962. Trustee Since March 2012. Principal | Financial Officer of each of the investment companies | |
| Occupation(s) During the Past Five Years: Chief | served by The Vanguard Group; Treasurer of each of | |
| Investment Officer and Vice President at the University | the investment companies served by The Vanguard | |
| of Notre Dame; Assistant Professor of Finance at the | Group (1998–2008). | |
| Mendoza College of Business at Notre Dame; Member | ||
| of the Notre Dame 403(b) Investment Committee; | Kathryn J. Hyatt | |
| Director of TIFF Advisory Services, Inc. (investment | Born 1955. Treasurer Since November 2008. Principal | |
| advisor); Member of the Investment Advisory | Occupation(s) During the Past Five Years: Principal of | |
| Committees of the Financial Industry Regulatory | The Vanguard Group, Inc.; Treasurer of each of the | |
| Authority (FINRA) and of Major League Baseball. | investment companies served by The Vanguard | |
| Group; Assistant Treasurer of each of the investment | ||
| André F. Perold | companies served by The Vanguard Group (1988–2008). | |
| Born 1952. Trustee Since December 2004. Principal | ||
| Occupation(s) During the Past Five Years: George | Heidi Stam | |
| Gund Professor of Finance and Banking at the Harvard | Born 1956. Secretary Since July 2005. Principal | |
| Business School (retired 2011); Chief Investment | Occupation(s) During the Past Five Years: Managing | |
| Officer and Managing Partner of HighVista Strategies | Director of The Vanguard Group, Inc.; General Counsel | |
| LLC (private investment firm); Director of Rand | of The Vanguard Group; Secretary of The Vanguard | |
| Merchant Bank; Overseer of the Museum of Fine | Group and of each of the investment companies | |
| Arts Boston. | served by The Vanguard Group; Director and Senior | |
| Vice President of Vanguard Marketing Corporation. | ||
| Alfred M. Rankin, Jr. | ||
| Born 1941. Trustee Since January 1993. Principal | Vanguard Senior Management Team | |
| Occupation(s) During the Past Five Years: Chairman, | ||
| President, and Chief Executive Officer of NACCO | Mortimer J. Buckley | Chris D. McIsaac |
| Industries, Inc. (housewares/lignite) and of Hyster-Yale | Kathleen C. Gubanich | Michael S. Miller |
| Materials Handling, Inc. (forklift trucks); Director of | Paul A. Heller | James M. Norris |
| the National Association of Manufacturers; Chairman | Martha G. King | Glenn W. Reed |
| of the Board of University Hospitals of Cleveland; | John T. Marcante | |
| Advisory Chairman of the Board of The Cleveland | ||
| Museum of Art. | Chairman Emeritus and Senior Advisor | |
| Peter F. Volanakis | John J. Brennan | |
| Born 1955. Trustee Since July 2009. Principal | Chairman, 1996–2009 | |
| Occupation(s) During the Past Five Years: President | Chief Executive Officer and President, 1996–2008 | |
| and Chief Operating Officer (retired 2010) of Corning | ||
| Incorporated (communications equipment); Director | ||
| of SPX Corporation (multi-industry manufacturing); | Founder | |
| Overseer of the Amos Tuck School of Business | ||
| Administration at Dartmouth College; Advisor to the | John C. Bogle | |
| Norris Cotton Cancer Center. | Chairman and Chief Executive Officer, 1974–1996 | |
1 Mr. McNabb is considered an “interested person,” as defined in the Investment Company Act of 1940, because he is an officer of the Vanguard funds.
2 December 2002 for Vanguard Equity Income Fund, Vanguard Growth Equity Fund, the Vanguard Municipal Bond Funds, and the Vanguard State Tax-Exempt Funds.
 | |
| P.O. Box 2600 | |
| Valley Forge, PA 19482-2600 | |
Connect with Vanguard® > vanguard.com | |
Fund Information > 800-662-7447 | |
| This material may be used in conjunction with the offering of shares of any Vanguard fund only if preceded or accompanied by the fund’s current prospectus. | |
| All comparative mutual fund data are from Lipper Inc. or Morningstar, Inc., unless otherwise noted. | |
| You can obtain a free copy of Vanguard’s proxy voting guidelines by visiting vanguard.com/proxyreporting or by calling Vanguard at 800-662-2739. The guidelines are also available from the SEC’s website, sec.gov. In addition, you may obtain a free report on how your fund voted the proxies for securities it owned during the 12 months ended June 30. To get the report, visit either vanguard.com/proxyreporting or sec.gov. | |
| You can review and copy information about your fund at the SEC’s Public Reference Room in Washington, D.C. To find out more about this public service, call the SEC at 202-551-8090. Information about your fund is also available on the SEC’s website, and you can receive copies of this information, for a fee, by sending a request in either of two ways: via e-mail addressed to publicinfo@sec.gov or via regular mail addressed to the Public Reference Section, Securities and Exchange Commission, Washington, DC 20549-1520. | |
© 2013 The Vanguard Group, Inc. |
|
| Semiannual Report | March 31, 2013 |
| Vanguard Target Retirement Funds |
 |
Vanguard Target Retirement Income Fund |
> Global stock markets rose during the six-month period ended March 31, 2013, despite renewed uncertainties in the Eurozone.
> The U.S. taxable bond market eked out a meager advance as investors looking for higher yields shifted to stocks and away from bonds.
> All six Vanguard Target Retirement Funds discussed in this report posted positive results for the period. Those with higher stock allocations produced the best returns.
| Contents | |
| Your Fund’s Total Returns. | 1 |
| Chairman’s Letter. | 2 |
| Target Retirement Income Fund. | 8 |
| Target Retirement 2010 Fund. | 17 |
| Target Retirement 2015 Fund. | 26 |
| Target Retirement 2020 Fund. | 35 |
| Target Retirement 2025 Fund. | 44 |
| Target Retirement 2030 Fund. | 53 |
| About Your Fund’s Expenses. | 61 |
| Trustees Approve Advisory Arrangement. | 63 |
| Glossary. | 64 |
Please note: The opinions expressed in this report are just that—informed opinions. They should not be considered promises or advice. Also, please keep in mind that the information and opinions cover the period through the date on the front of this report. Of course, the risks of investing in your fund are spelled out in the prospectus.
See the Glossary for definitions of investment terms used in this report.
About the cover: Our cover photograph shows rigging on the HMSSurprise, a replica of an 18th-century Royal Navy frigate. It was featured in the 2003 movie Master and Commander: The Far Side of the World, which was based on Patrick O’Brian’s sea novels, set amid the Napoleonic Wars. Vanguard was named for another ship of that era, the HMSVanguard, which was the flagship of British Admiral Horatio Nelson at the Battle of the Nile.
Your Fund’s Total Returns
| Six Months Ended March 31, 2013 | |
| Total | |
| Returns | |
| Vanguard Target Retirement Income Fund | 3.28% |
| Target Income Composite Index | 3.29 |
| Mixed-Asset Target Allocation Conservative Funds Average | 4.04 |
| Mixed-Asset Target Allocation Conservative Funds Average: Derived from data provided by Lipper Inc. | |
| Vanguard Target Retirement 2010 Fund | 4.58% |
| Target 2010 Composite Index | 4.65 |
| Mixed-Asset Target 2010 Funds Average | 4.33 |
| Mixed-Asset Target 2010 Funds Average: Derived from data provided by Lipper Inc. | |
| Vanguard Target Retirement 2015 Fund | 5.86% |
| Target 2015 Composite Index | 5.92 |
| Mixed-Asset Target 2015 Funds Average | 4.77 |
| Mixed-Asset Target 2015 Funds Average: Derived from data provided by Lipper Inc. | |
| Vanguard Target Retirement 2020 Fund | 6.77% |
| Target 2020 Composite Index | 6.87 |
| Mixed-Asset Target 2020 Funds Average | 5.46 |
| Mixed-Asset Target 2020 Funds Average: Derived from data provided by Lipper Inc. | |
| Vanguard Target Retirement 2025 Fund | 7.59% |
| Target 2025 Composite Index | 7.67 |
| Mixed-Asset Target 2025 Funds Average | 6.87 |
| Mixed-Asset Target 2025 Funds Average: Derived from data provided by Lipper Inc. | |
| Vanguard Target Retirement 2030 Fund | 8.40% |
| Target 2030 Composite Index | 8.48 |
| Mixed-Asset Target 2030 Funds Average | 7.41 |
| Mixed-Asset Target 2030 Funds Average: Derived from data provided by Lipper Inc. | |
Investments in Target Retirement Funds are subject to the risks of their underlying funds. The year in the fund name refers to the approximate year (the target date) when an investor in the fund would retire and leave the work force. The fund will gradually shift its emphasis from more aggressive investments to more conservative ones based on its target date. An investment in a Target Retirement Fund is not guaranteed at any time, including on or after the target date.
1

Chairman’s Letter
Dear Shareholder,
During the six months ended March 31, 2013, stock returns around the world were robust, despite renewed concerns about the Eurozone debt crisis that flared toward the end of the period. Investors seeking higher yields moved away from conservative fixed income investments to stocks, leading to weak returns in the U.S. bond market.
The return of each of the six Vanguard Target Retirement Funds covered in this report reflected its proportional allocation to equity and fixed income markets. (The funds with retirement dates of 2035 through 2060 are covered in a separate report.) The Target Retirement Funds with the greatest exposure to stocks performed best.
Global equity markets delivered a powerful rally
Stock prices worldwide advanced for the fifth straight month to finish the half-year with impressive gains. The Standard & Poor’s 500 Index closed at a record high on the period’s final business day. World financial markets in recent months shrugged off the U.S. “fiscal cliff” crisis, the unsettled Italian national elections, and a controversial bailout package for Cyprus.
Peter Westaway, Vanguard’s chief European economist, said that the latest developments in the European debt crisis had been “rather bad,” but that the market had for the most part already priced in these events. “As always,” he said, “we think investors should assess their portfolios carefully and avoid making impulsive moves.”
2
U.S. equities returned more than 11% as the economic recovery kept slowly building momentum; the housing market rebounded further, and the labor market improved. International equities were up more than 9%. Returns were about 16% for developed markets in the Pacific region, where Japan’s accommodative monetary policy has helped spark the nation’s stock market, and nearly 10% in Europe. Emerging markets stocks rose about 4%.
Bond returns barely budged as yields lingered near lows
The broad U.S. taxable bond market scraped out a minuscule gain of 0.09% for the half-year as U.S. Treasury yields remained just slightly above their all-time lows. Although the yield of the benchmark 10-year Treasury note increased during the six months and topped 2.00% at various times, it closed the period at about 1.85%. (Bond prices and yields move in opposite directions.)
Municipal bonds returned almost 1% for the six months despite price declines in March. And returns of money market funds and savings accounts barely registered as short-term interest rates remained between 0% and 0.25%, under the Federal Reserve’s four-year-old policy.
Robert Auwaerter, head of Vanguard’s Fixed Income Group, doesn’t anticipate abrupt policy changes from the central bank. “We don’t see the Fed changing course in the near term,” he said, “and when the Fed does, we expect it’ll go
| Market Barometer | |||
| Total Returns | |||
| Periods Ended March 31, 2013 | |||
| Six | One | Five Years | |
| Months | Year | (Annualized) | |
| Stocks | |||
| Russell 1000 Index (Large-caps) | 11.10% | 14.43% | 6.15% |
| Russell 2000 Index (Small-caps) | 14.48 | 16.30 | 8.24 |
| Russell 3000 Index (Broad U.S. market) | 11.35 | 14.56 | 6.32 |
| MSCI All Country World Index ex USA (International) | 9.20 | 8.36 | -0.39 |
| Bonds | |||
| Barclays U.S. Aggregate Bond Index (Broad taxable market) | 0.09% | 3.77% | 5.47% |
| Barclays Municipal Bond Index (Broad tax-exempt market) | 0.96 | 5.25 | 6.10 |
| Citigroup Three-Month U.S. Treasury Bill Index | 0.05 | 0.08 | 0.30 |
| CPI | |||
| Consumer Price Index | 0.59% | 1.47% | 1.74% |
3
slowly so as not to undo the efforts made to keep interest rates low and to stimulate the economy.”
Stock-heavy retirement funds edged out funds with more bonds
The Vanguard Target Retirement Funds are “funds of funds” that offer investors professionally managed, diversified portfolios designed to gradually shift from stocks to bonds as the target retirement date approaches. After that date, the adjustments continue for several years until an income phase is reached. The Target Retirement Income Fund has a static allocation; nearly 70% of its assets are in bonds and other fixed income investments.
These retirement funds hold shares in up to five underlying domestic and international stock funds and U.S. fixed-income investments. The Target Retirement Funds’ performance during the six months was closely tied to their varying levels of exposure to the stock and bond markets. The 2030 Fund, which held about 78% of its assets in stocks and 22% in bonds, performed best, returning 8.40%. The most conservative of the group, the Income Fund, was the weakest performer, returning 3.28%.
Results for the four other funds fell in between. The 2025 Fund, which invested about 71% of its assets in stocks, returned 7.59%, and the 2020 Fund, with about 63% in stocks, returned 6.77%. The 2015 Fund, with about 55% in stocks and 45%
| Expense Ratios | ||
| Your Fund Compared With Its Peer Group | ||
| Acquired Fund Fees | Peer Group | |
| and Expenses | Average | |
| Target Retirement Income Fund | 0.16% | 0.92% |
| Target Retirement 2010 Fund | 0.16 | 0.53 |
| Target Retirement 2015 Fund | 0.16 | 0.53 |
| Target Retirement 2020 Fund | 0.16 | 0.58 |
| Target Retirement 2025 Fund | 0.17 | 0.51 |
| Target Retirement 2030 Fund | 0.17 | 0.57 |
The fund expense figures shown—drawn from the prospectus dated January 28, 2013—represent an estimate of the weighted average of the expense ratios and any transaction fees charged by the underlying mutual funds (the ”acquired” funds) in which the Target Retirement Funds invest. The Target Retirement Funds do not charge any expenses or fees of their own. For the six months ended March 31, 2013, the annualized acquired fund fees and expenses were 0.16% for the Income Fund, 0.16% for the 2010 Fund, 0.16% for the 2015 Fund, 0.16% for the 2020 Fund, 0.17% for the 2025 Fund, and 0.17% for the 2030 Fund. Peer-group expense ratios are derived from data provided by Lipper Inc. and capture information through year-end 2012.
Peer groups: For the Income Fund, Mixed-Asset Target Allocation Conservative Funds; for the 2010 Fund, Mixed-Asset Target 2010 Funds; for the 2015 Fund, Mixed-Asset Target 2015 Funds; for the 2020 Fund, Mixed-Asset Target 2020 Funds; for the 2025 Fund, Mixed-Asset Target 2025 Funds, and for the Target Retirement 2030 Fund, Mixed-Asset Target 2030 Funds.
4
in bonds, returned 5.86%. The 2010 Fund, with about 42% in stocks and 58% in fixed income investments, gained 4.58%.
A glance at the retirement funds’ fixed income results shows the extent to which these weighed on overall performance. Vanguard Total Bond Market II Index Fund, a component of all six funds covered in this report, returned 0.02%, while Vanguard Inflation-Protected Securities Fund, which is held by three of the funds, returned 0.23%. Vanguard Prime Money Market Fund, held by two of the funds, returned 0.01%.
As I’ve mentioned earlier, bond yields remain at historic lows. Given the current environment, our expectations for bond returns in coming years are very modest. Still, we maintain that a mix of stocks and bonds, such as those held by Vanguard Target Retirement Funds, can potentially smooth out market swings, because stock and bond prices can move in opposite directions. Bonds may suffer price declines as interest rates rise, but earnings reinvested at those higher rates can enhance returns over time.
| The Target Retirement Funds further diversify their bond holdings |
| Vanguard plans to add the soon-to-launch Vanguard Total International Bond Index |
| Fund to each of the 12 Target Retirement Funds by June 30 of this year, further |
| diversifying them. The new fund will seek to track the Barclays Global Aggregate |
| ex-USD Float Adjusted RIC Capped Index (USD Hedged), which represents about |
| 7,000 high-quality bonds from 52 countries. |
| Each Target Retirement Fund will allocate 20% of its fixed income portfolio to |
| international bonds. Vanguard research has found that adding international bonds to a |
| U.S. bond portfolio can substantially broaden its diversification, which can help further |
| moderate risk. The new fund will use a traditional hedging strategy to help reduce the |
| impact of international currency fluctuations on its holdings. |
| As you can see in the example below, which uses the Target Retirement 2025 Fund, |
| the addition of the international bond fund will enhance diversification without changing |
the funds’ overall stock and bond allocations. |
|
| Vanguard Target Retirement 2025 Fund | ||
| Current allocation | New allocation | |
| Stocks | 71% | 71% |
| Domestic | 50 | 50 |
| International | 21 | 21 |
| Bonds | 29% | 29% |
| Domestic | 29 | 23 |
| International | — | 6 |
5
New international bond fund will join retirement portfolios
In February, we announced plans to add Vanguard Total International Bond Index Fund to our 12 Target Retirement Funds, including the six in this report, by mid-year 2013. The international bond portfolio, which will constitute about 20% of each fund’s fixed income allocation, will further diversify these broad, balanced funds. (See page 5 for more detail.)
In the Income, 2010, and 2015 Funds, we also plan to replace Vanguard Inflation-Protected Securities Fund with Vanguard Short-Term Inflation-Protected Securities Index Fund. Because of its shorter duration, the latter fund is expected to provide an inflation hedge with less interest rate risk than its longer-term counterpart. Both funds invest in Treasury Inflation-Protected Securities (TIPS).
Lastly, we are eliminating Vanguard Prime Money Market Fund from our Income and 2010 Funds. The short-term TIPS fund will take its place in providing exposure to short-maturity securities for these funds.
Please note that the coming changes to the Target Retirement Funds will not alter their overall strategic asset allocation or their glidepath—the progression of allocation adjustments over time.
In saving for your future, right now is always the right time
Earlier this year, we marked “America Saves Week,” an annual event aimed at encouraging people to set aside more for their futures. I know a week devoted to promoting saving isn’t going to generate a lot of popular excitement or headlines. But it is, without a doubt, a worthy cause.
My view is that you should save more than you think you’ll need, particularly for retirement. How much? The right answer is different for everyone. The Vanguard Center for Retirement Research advises that a good target range is between 12% and 15% of your take-home pay, including any match from a workplace retirement plan. If you can’t afford to save that much today, start where you can and increase your savings as your circumstances allow.
If you do take steps to increase your savings now—before another “America Saves Week” comes and goes—you’ll thank yourself later. A Vanguard study titled Penny Saved, Penny Earned (available at vanguard.com/research) examined the different levers we use to achieve financial security. Our researchers found that retirement investors looking to improve the odds of reaching their goals are likely to do better by saving more over longer periods than by relying on the possibility of higher portfolio returns.
As always, thank you for investing with Vanguard.
Sincerely,

F. William McNabb III
Chairman and Chief Executive Officer
April 11, 2013
6
| Your Fund’s Performance at a Glance | ||||
| September 30, 2012, Through March 31, 2013 | ||||
| Distributions Per Share | ||||
| Starting | Ending | Income | Capital | |
| Share Price | Share Price | Dividends | Gains | |
| Target Retirement Income Fund | $12.23 | $12.46 | $0.146 | $0.021 |
| Target Retirement 2010 Fund | $24.45 | $24.98 | $0.531 | $0.037 |
| Target Retirement 2015 Fund | $13.54 | $14.00 | $0.298 | $0.018 |
| Target Retirement 2020 Fund | $24.04 | $25.10 | $0.508 | $0.026 |
| Target Retirement 2025 Fund | $13.70 | $14.41 | $0.296 | $0.012 |
| Target Retirement 2030 Fund | $23.51 | $24.93 | $0.499 | $0.015 |
| Asset Allocation on March 31, 2013 | |||
| Short-Term | |||
| Stocks | Bonds | Reserves | |
| Target Retirement Income Fund | 30.4% | 64.7% | 4.9% |
| Target Retirement 2010 Fund | 42.0% | 55.9% | 2.1% |
| Target Retirement 2015 Fund | 54.7% | 45.3% | 0.0% |
| Target Retirement 2020 Fund | 63.3% | 36.7% | 0.0% |
| Target Retirement 2025 Fund | 70.8% | 29.2% | 0.0% |
| Target Retirement 2030 Fund | 78.1% | 21.9% | 0.0% |
Note: The Income Fund’s allocations do not change. As of March 31, 2013, international stock weightings for the Income, 2010, 2015, 2020, 2025, and 2030 Funds were 9%, 12%, 16%, 19%, 21%, and 23% of assets, respectively.
7
Target Retirement Income Fund
Fund Profile
As of March 31, 2013
| Total Fund Characteristics | |
| Ticker Symbol | VTINX |
| 30-Day SEC Yield | 1.97% |
| Acquired Fund Fees and Expenses1 | 0.16% |
| Allocation to Underlying Vanguard Funds | |
| Vanguard Total Bond Market II Index Fund | |
| Investor Shares | 44.8% |
| Vanguard Total Stock Market Index Fund | |
| Investor Shares | 21.5% |
| Vanguard Inflation-Protected Securities | |
| Fund Investor Shares | 19.9% |
| Vanguard Total International Stock Index | |
| Fund Investor Shares | 8.9% |
| Vanguard Prime Money Market Fund | |
| Investor Shares | 4.9% |
| Total Fund Volatility Measures | ||
| Target | Barclays | |
| Income | Aggregate | |
| Composite | Bond | |
| Index | Index | |
| R-Squared | 1.00 | 0.01 |
| Beta | 0.99 | -0.19 |
These measures show the degree and timing of the fund’s fluctuations compared with the indexes over 36 months.
Fund Asset Allocation
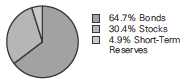
1 This figure—drawn from the prospectus dated January 28, 2013—represents an estimate of the weighted average of the expense ratios and any transaction fees charged by the underlying mutual funds (the ”acquired” funds) in which the Target Retirement Income Fund invests. The fund does not charge any expenses or fees of its own. For the six months ended March 31, 2013, the annualized acquired fund fees and expenses were 0.16%.
8
Target Retirement Income Fund
Performance Summary
All of the returns in this report represent past performance, which is not a guarantee of future results that may be achieved by the fund. (Current performance may be lower or higher than the performance data cited. For performance data current to the most recent month-end, visit our website at vanguard.com/performance.) Note, too, that both investment returns and principal value can fluctuate widely, so an investor’s shares, when sold, could be worth more or less than their original cost. The returns shown do not reflect taxes that a shareholder would pay on fund distributions or on the sale of fund shares.
Fiscal-Year Total Returns (%): October 27, 2003, Through March 31, 2013
| Average Annual Total Returns: Periods Ended March 31, 2013 | ||||||
| Since Inception | ||||||
| Inception Date | One Year | Five Years | Income | Capital | Total | |
| Target Retirement Income | ||||||
| Fund | 10/27/2003 | 6.78% | 5.55% | 3.29% | 2.46% | 5.75% |
See Financial Highlights for dividend and capital gains information.
9
Target Retirement Income Fund
Financial Statements (unaudited)
Statement of Net Assets
As of March 31, 2013
The fund reports a complete list of its holdings in regulatory filings four times in each fiscal year, at the quarter-ends. For the second and fourth fiscal quarters, the lists appear in the fund’s semiannual and annual reports to shareholders. For the first and third fiscal quarters, the fund files the lists with the Securities and Exchange Commission on Form N-Q. Shareholders can look up the fund’s Forms N-Q on the SEC’s website at sec.gov. Forms N-Q may also be reviewed and copied at the SEC’s Public Reference Room (see the back cover of this report for further information).
| Market | ||
| Value | ||
| Shares | ($000) | |
| Investment Companies (100.0%) | ||
| U.S. Stock Fund (21.5%) | ||
| Vanguard Total Stock Market Index Fund Investor Shares | 56,311,174 | 2,218,097 |
| International Stock Fund (8.9%) | ||
| Vanguard Total International Stock Index Fund Investor Shares | 59,725,602 | 917,982 |
| Bond Funds (64.7%) | ||
| 1 Vanguard Total Bond Market II Index Fund Investor Shares | 424,013,398 | 4,625,986 |
| Vanguard Inflation-Protected Securities Fund Investor Shares | 142,668,383 | 2,058,705 |
| 6,684,691 | ||
| Money Market Fund (4.9%) | ||
| Vanguard Prime Money Market Fund Investor Shares | 505,995,843 | 505,996 |
| Total Investment Companies (Cost $9,238,283) | 10,326,766 | |
| Other Assets and Liabilities (0.0%) | ||
| Other Assets | 66,172 | |
| Liabilities | (68,165) | |
| (1,993) | ||
| Net Assets (100%) | ||
| Applicable to 828,920,369 outstanding $.001 par value shares of | ||
| beneficial interest (unlimited authorization) | 10,324,773 | |
| Net Asset Value Per Share | $12.46 | |
| At March 31, 2013, net assets consisted of: | |
| Amount | |
| ($000) | |
| Paid-in Capital | 9,236,748 |
| Undistributed Net Investment Income | 2,019 |
| Accumulated Net Realized Losses | (2,477) |
| Unrealized Appreciation (Depreciation) | 1,088,483 |
| Net Assets | 10,324,773 |
See Note A in Notes to Financial Statements.
1 Affiliated fund available only to Vanguard funds and certain trusts and accounts managed by Vanguard.
See accompanying Notes, which are an integral part of the Financial Statements.
10
Target Retirement Income Fund
| Statement of Operations | |
| Six Months Ended | |
| March 31, 2013 | |
| ($000) | |
| Investment Income | |
| Income | |
| Income Distributions Received | 113,714 |
| Net Investment Income—Note B | 113,714 |
| Realized Net Gain (Loss) | |
| Capital Gain Distributions Received | 52,275 |
| Investment Securities Sold | 3,594 |
| Realized Net Gain (Loss) | 55,869 |
| Change in Unrealized Appreciation (Depreciation) of Investment Securities | 147,943 |
| Net Increase (Decrease) in Net Assets Resulting from Operations | 317,526 |
See accompanying Notes, which are an integral part of the Financial Statements.
11
Target Retirement Income Fund
| Statement of Changes in Net Assets | ||
| Six Months Ended | Year Ended | |
| March 31, | September 30, | |
| 2013 | 2012 | |
| ($000) | ($000) | |
| Increase (Decrease) in Net Assets | ||
| Operations | ||
| Net Investment Income | 113,714 | 172,142 |
| Realized Net Gain (Loss) | 55,869 | 37,941 |
| Change in Unrealized Appreciation (Depreciation) | 147,943 | 522,955 |
| Net Increase (Decrease) in Net Assets Resulting from Operations | 317,526 | 733,038 |
| Distributions | ||
| Net Investment Income | (117,052) | (168,784) |
| Realized Capital Gain1 | (16,648) | (9,699) |
| Total Distributions | (133,700) | (178,483) |
| Capital Share Transactions | ||
| Issued | 1,637,557 | 3,254,326 |
| Issued in Connection with Acquisition of | ||
| Vanguard Target Retirement 2005 Fund—Note G | — | 2,192,576 |
| Issued in Lieu of Cash Distributions | 128,876 | 171,526 |
| Redeemed | (1,007,693) | (1,555,508) |
| Net Increase (Decrease) from Capital Share Transactions | 758,740 | 4,062,920 |
| Total Increase (Decrease) | 942,566 | 4,617,475 |
| Net Assets | ||
| Beginning of Period | 9,382,207 | 4,764,732 |
| End of Period2 | 10,324,773 | 9,382,207 |
1 Includes fiscal 2013 and 2012 short-term gain distributions totaling $16,648,000 and $9,699,000, respectively. Short-term gain distributions are treated as ordinary income dividends for tax purposes.
2 Net Assets—End of Period includes undistributed net investment income of $2,019,000 and $5,357,000.
See accompanying Notes, which are an integral part of the Financial Statements.
12
Target Retirement Income Fund
| Financial Highlights | ||||||
| Six Months | ||||||
| Ended | ||||||
| For a Share Outstanding | March 31, | Year Ended September 30, | ||||
| Throughout Each Period | 2013 | 2012 | 2011 | 2010 | 2009 | 2008 |
| Net Asset Value, Beginning of Period | $12.23 | $11.22 | $11.13 | $10.49 | $10.19 | $11.08 |
| Investment Operations | ||||||
| Net Investment Income | .141 | .275 | .3031 | .288 | .268 | .427 |
| Capital Gain Distributions Received | .066 | .052 | .0301 | — | — | — |
| Net Realized and Unrealized Gain (Loss) | ||||||
| on Investments | .190 | .977 | .080 | .640 | .302 | (.878) |
| Total from Investment Operations | .397 | 1.304 | .413 | .928 | .570 | (.451) |
| Distributions | ||||||
| Dividends from Net Investment Income | (.146) | (.273) | (.299) | (.288) | (.270) | (.439) |
| Distributions from Realized Capital Gains | (.021) | (.021) | (.024) | — | — | — |
| Total Distributions | (.167) | (.294) | (.323) | (.288) | (.270) | (.439) |
| Net Asset Value, End of Period | $12.46 | $12.23 | $11.22 | $11.13 | $10.49 | $10.19 |
| Total Return2 | 3.28% | 11.74% | 3.70% | 8.97% | 5.84% | -4.23% |
| Ratios/Supplemental Data | ||||||
| Net Assets, End of Period (Millions) | $10,325 | $9,382 | $4,765 | $3,623 | $2,463 | $2,046 |
| Ratio of Total Expenses to | ||||||
| Average Net Assets | — | — | — | — | — | — |
| Acquired Fund Fees and Expenses | 0.16% | 0.16% | 0.17% | 0.17% | 0.21% | 0.19% |
| Ratio of Net Investment Income to | ||||||
| Average Net Assets | 2.33% | 2.31% | 2.65% | 2.70% | 2.78% | 4.11% |
| Portfolio Turnover Rate | 3% | 7% | 14%3 | 12% | 29%4 | 14% |
The expense ratio, acquired fund fees and expenses, net income ratio, and turnover rate for the current period have been annualized.
1 Calculated based on average shares outstanding.
2 Total returns do not include account service fees that may have applied in the periods shown. Fund prospectuses provide information about any applicable account service fees.
3 Excludes the value of mutual fund shares delivered and received in connection with a change in the fund’s international equity investments from Vanguard European, Pacific, and Emerging Markets Stock Index Funds to Vanguard Total International Stock Index Fund because those transactions were effected in kind and did not cause the fund to incur transaction costs.
4 Excludes the value of mutual fund shares delivered and received in connection with a change in the fund’s bond investments from Vanguard Total Bond Market Index Fund to Vanguard Total Bond Market II Index Fund because those transactions were effected in kind and did not cause the fund to incur transaction costs.
See accompanying Notes, which are an integral part of the Financial Statements.
13
Target Retirement Income Fund
Notes to Financial Statements
Vanguard Target Retirement Income Fund is registered under the Investment Company Act of 1940 as an open-end investment company, or mutual fund. The fund follows a balanced investment strategy by investing in selected Vanguard funds to achieve its targeted allocation of assets to U.S. stocks, international stocks, bonds, and short-term reserves.
A. The following significant accounting policies conform to generally accepted accounting principles for U.S. mutual funds. The fund consistently follows such policies in preparing its financial statements.
1. Security Valuation: Investments are valued at the net asset value of each underlying Vanguard fund determined as of the close of the New York Stock Exchange (generally 4 p.m., Eastern time) on the valuation date. See Note C.
2. Federal Income Taxes: The fund intends to continue to qualify as a regulated investment company and distribute all of its taxable income. Management has analyzed the fund’s tax positions taken for all open federal income tax years (September 30, 2009–2012), and for the period ended March 31, 2013, and has concluded that no provision for federal income tax is required in the fund’s financial statements.
3. Distributions: Distributions to shareholders are recorded on the ex-dividend date.
4. Other: Income and capital gain distributions received are recorded on the ex-dividend date. Security transactions are accounted for on the date securities are bought or sold. Costs used to determine realized gains (losses) on the sale of investment securities are those of the specific securities sold.
B. Under a service agreement, The Vanguard Group furnishes investment advisory, corporate management, administrative, marketing, and distribution services to the fund. The service agreement provides that the fund’s expenses may be reduced or eliminated to the extent of savings realized by the Vanguard funds by the operation of the fund. Accordingly, all incremental expenses for services provided by Vanguard and all other expenses incurred by the fund during the period ended March 31, 2013, were borne by the funds in which the fund invests. The fund’s trustees and officers are also directors and officers of Vanguard and the funds in which the fund invests.
C. Various inputs may be used to determine the value of the fund’s investments. These inputs are summarized in three broad levels for financial statement purposes. The inputs or methodologies used to value securities are not necessarily an indication of the risk associated with investing in those securities.
Level 1—Quoted prices in active markets for identical securities.
Level 2—Other significant observable inputs (including quoted prices for similar securities, interest rates, prepayment speeds, credit risk, etc.).
Level 3—Significant unobservable inputs (including the fund’s own assumptions used to determine the fair value of investments).
The following table summarizes the market value of the fund’s investments as of March 31, 2013, based on the inputs used to value them:
| Level 1 | Level 2 | Level 3 | |
| Investments | ($000) | ($000) | ($000) |
| Investment Companies | 9,408,784 | 917,982 | — |
14
Target Retirement Income Fund
The fund’s investment in Vanguard Total International Stock Index Fund is normally valued based on Level 1 inputs but was valued in this report based on Level 2 inputs. The most recent quoted net asset value for this underlying fund was as of March 28, 2013. For financial statement purposes, this net asset value was adjusted to revalue certain of the fund’s securities based on March 29, 2013, closing prices because their local markets were open while U.S. markets were closed.
D. Distributions are determined on a tax basis and may differ from net investment income and realized capital gains for financial reporting purposes. Differences may be permanent or temporary. Permanent differences are reclassified among capital accounts in the financial statements to reflect their tax character. Temporary differences arise when certain items of income, expense, gain, or loss are recognized in different periods for financial statement and tax purposes; these differences will reverse at some time in the future. Differences in classification may also result from the treatment of short-term gains as ordinary income for tax purposes.
The fund’s tax-basis capital gains and losses are determined only at the end of each fiscal year.
For tax purposes, at September 30, 2012, the fund had available capital losses totaling $43,292,000 to offset future net capital gains of $36,768,000 through September 30, 2016, and $6,524,000 through September 30, 2018. The fund will use these capital losses to offset net taxable capital gains, if any, realized during the year ending September 30, 2013; should the fund realize net capital losses for the year, the losses will be added to the loss carryforward balance above. Short-term capital gain distributions received are treated as ordinary income for tax purposes, and cannot be offset by capital losses. Capital gain distributions paid during the six months ended March 31, 2013, are from short-term gain distributions received from Vanguard Total Bond Market II Index Fund and Vanguard Inflation-Protected Securities Fund.
At March 31, 2013, the cost of investment securities for tax purposes was $9,238,283,000. Net unrealized appreciation of investment securities for tax purposes was $1,088,483,000, consisting entirely of unrealized gains on securities that had risen in value since their purchase.
E. During the six months ended March 31, 2013, the fund purchased $960,770,000 of investment securities and sold $161,266,000 of investment securities, other than temporary cash investments.
F. Capital shares issued and redeemed were:
| Six Months Ended | Year Ended | |
| March 31, 2013 | September 30, 2012 | |
| Shares | Shares | |
| (000) | (000) | |
| Issued | 133,128 | 274,845 |
| Issued in Connection with Acquisition of | ||
| Vanguard Target Retirement 2005 Fund | — | 184,543 |
| Issued in Lieu of Cash Distributions | 10,541 | 14,464 |
| Redeemed | (81,946) | (131,221) |
| Net Increase (Decrease) in Shares Outstanding | 61,723 | 342,631 |
15
Target Retirement Income Fund
G. On February 10, 2012, the fund acquired all the net assets of Vanguard Target Retirement 2005 Fund pursuant to a plan of reorganization approved by the funds’ board of trustees. The purpose of the transaction was to combine two funds with comparable investment objectives. The acquisition was accomplished by a tax-free exchange of 184,543,000 shares of the fund for 177,808,000 shares of the Vanguard Target Retirement 2005 Fund outstanding as of the close of business on February 10, 2012. The Vanguard Target Retirement 2005 Fund’s net assets as of the close of business on February 10, 2012, of $2,192,576,000, including $237,489,000 of unrealized appreciation, were combined with the fund’s net assets. The net assets of the fund immediately before the acquisition were $5,956,166,000. The net assets of the fund immediately following the acquisition were $8,148,742,000.
H. In preparing the financial statements as of March 31, 2013, management considered the impact of subsequent events for potential recognition or disclosure in these financial statements.
In February 2013, Vanguard announced plans to reallocate 20% of the fund’s fixed income exposure to foreign bonds, through an investment in Vanguard Total International Bond Index Fund. In addition, the fund’s investment in Vanguard Inflation-Protected Securities Fund will be replaced by Vanguard Short-Term Inflation-Protected Securities Index Fund, and its investment in Vanguard Prime Money Market Fund will be eliminated. The fund’s overall fixed income allocation and its strategic asset allocation are not changing. The transition is expected to be completed by June 30, 2013.
16
Target Retirement 2010 Fund
Fund Profile
As of March 31, 2013
| Total Fund Characteristics | |
| Ticker Symbol | VTENX |
| 30-Day SEC Yield | 2.02% |
| Acquired Fund Fees and Expenses1 | 0.16% |
| Allocation to Underlying Vanguard Funds | |
| Vanguard Total Bond Market II Index Fund | |
| Investor Shares | 41.9% |
| Vanguard Total Stock Market Index Fund | |
| Investor Shares | 29.6% |
| Vanguard Inflation-Protected Securities | |
| Fund Investor Shares | 14.0% |
| Vanguard Total International Stock Index | |
| Fund Investor Shares | 12.4% |
| Vanguard Prime Money Market Fund | |
| Investor Shares | 2.1% |
| Total Fund Volatility Measures | ||
| Target 2010 | MSCI US | |
| Composite | Broad Market | |
| Index | Index | |
| R-Squared | 1.00 | 0.93 |
| Beta | 0.98 | 0.45 |
These measures show the degree and timing of the fund’s fluctuations compared with the indexes over 36 months.
Fund Asset Allocation
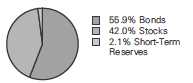
1 This figure—drawn from the prospectus dated January 28, 2013—represents an estimate of the weighted average of the expense ratios and any transaction fees charged by the underlying mutual funds (the ”acquired” funds) in which the Target Retirement 2010 Fund invests. The fund does not charge any expenses or fees of its own. For the six months ended March 31, 2013, the annualized acquired fund fees and expenses were 0.16%.
17
Target Retirement 2010 Fund
Performance Summary
All of the returns in this report represent past performance, which is not a guarantee of future results that may be achieved by the fund. (Current performance may be lower or higher than the performance data cited. For performance data current to the most recent month-end, visit our website at vanguard.com/performance.) Note, too, that both investment returns and principal value can fluctuate widely, so an investor’s shares, when sold, could be worth more or less than their original cost. The returns shown do not reflect taxes that a shareholder would pay on fund distributions or on the sale of fund shares.
Fiscal-Year Total Returns (%): June 7, 2006, Through March 31, 2013
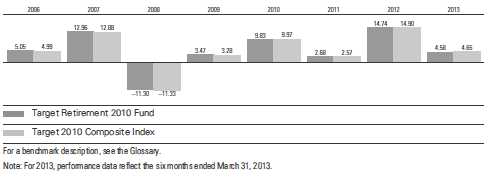
| Average Annual Total Returns: Periods Ended March 31, 2013 | ||||||
| Since Inception | ||||||
| Inception Date | One Year | Five Years | Income | Capital | Total | |
| Target Retirement 2010 | ||||||
| Fund | 6/7/2006 | 7.80% | 5.32% | 2.47% | 3.39% | 5.86% |
See Financial Highlights for dividend and capital gains information.
18
Target Retirement 2010 Fund
Financial Statements (unaudited)
Statement of Net Assets
As of March 31, 2013
The fund reports a complete list of its holdings in regulatory filings four times in each fiscal year, at the quarter-ends. For the second and fourth fiscal quarters, the lists appear in the fund’s semiannual and annual reports to shareholders. For the first and third fiscal quarters, the fund files the lists with the Securities and Exchange Commission on Form N-Q. Shareholders can look up the fund’s Forms N-Q on the SEC’s website at sec.gov. Forms N-Q may also be reviewed and copied at the SEC’s Public Reference Room (see the back cover of this report for further information).
| Market | ||
| Value | ||
| Shares | ($000) | |
| Investment Companies (100.3%) | ||
| U.S. Stock Fund (29.7%) | ||
| Vanguard Total Stock Market Index Fund Investor Shares | 51,872,216 | 2,043,247 |
| International Stock Fund (12.4%) | ||
| Vanguard Total International Stock Index Fund Investor Shares | 55,650,066 | 855,341 |
| Bond Funds (56.1%) | ||
| 1 Vanguard Total Bond Market II Index Fund Investor Shares | 265,171,042 | 2,893,016 |
| Vanguard Inflation-Protected Securities Fund Investor Shares | 66,913,841 | 965,567 |
| 3,858,583 | ||
| Money Market Fund (2.1%) | ||
| Vanguard Prime Money Market Fund Investor Shares | 147,757,258 | 147,757 |
| Total Investment Companies (Cost $6,124,717) | 6,904,928 | |
| Other Assets and Liabilities (-0.3%) | ||
| Other Assets | 28,251 | |
| Liabilities | (50,050) | |
| (21,799) | ||
| Net Assets (100%) | ||
| Applicable to 275,561,505 outstanding $.001 par value shares of | ||
| beneficial interest (unlimited authorization) | 6,883,129 | |
| Net Asset Value Per Share | $24.98 | |
| At March 31, 2013, net assets consisted of: | |
| Amount | |
| ($000) | |
| Paid-in Capital | 6,117,336 |
| Undistributed Net Investment Income | 24,651 |
| Accumulated Net Realized Losses | (39,069) |
| Unrealized Appreciation (Depreciation) | 780,211 |
| Net Assets | 6,883,129 |
See Note A in Notes to Financial Statements.
1 Affiliated fund available only to Vanguard funds and certain trusts and accounts managed by Vanguard.
See accompanying Notes, which are an integral part of the Financial Statements.
19
Target Retirement 2010 Fund
| Statement of Operations | |
| Six Months Ended | |
| March 31, 2013 | |
| ($000) | |
| Investment Income | |
| Income | |
| Income Distributions Received | 76,936 |
| Net Investment Income—Note B | 76,936 |
| Realized Net Gain (Loss) | |
| Capital Gain Distributions Received | 27,526 |
| Investment Securities Sold | 6,055 |
| Realized Net Gain (Loss) | 33,581 |
| Change in Unrealized Appreciation (Depreciation) of Investment Securities | 183,664 |
| Net Increase (Decrease) in Net Assets Resulting from Operations | 294,181 |
See accompanying Notes, which are an integral part of the Financial Statements.
20
Target Retirement 2010 Fund
| Statement of Changes in Net Assets | ||
| Six Months Ended | Year Ended | |
| March 31, | September 30, | |
| 2013 | 2012 | |
| ($000) | ($000) | |
| Increase (Decrease) in Net Assets | ||
| Operations | ||
| Net Investment Income | 76,936 | 138,726 |
| Realized Net Gain (Loss) | 33,581 | 38,287 |
| Change in Unrealized Appreciation (Depreciation) | 183,664 | 561,971 |
| Net Increase (Decrease) in Net Assets Resulting from Operations | 294,181 | 738,984 |
| Distributions | ||
| Net Investment Income | (138,502) | (132,211) |
| Realized Capital Gain1 | (9,651) | (8,208) |
| Total Distributions | (148,153) | (140,419) |
| Capital Share Transactions | ||
| Issued | 1,203,848 | 1,935,277 |
| Issued in Lieu of Cash Distributions | 145,950 | 138,772 |
| Redeemed | (768,002) | (1,264,685) |
| Net Increase (Decrease) from Capital Share Transactions | 581,796 | 809,364 |
| Total Increase (Decrease) | 727,824 | 1,407,929 |
| Net Assets | ||
| Beginning of Period | 6,155,305 | 4,747,376 |
| End of Period2 | 6,883,129 | 6,155,305 |
1 Includes fiscal 2013 and 2012 short-term gain distributions totaling $9,651,000 and $8,208,000, respectively. Short-term gain distributions are treated as ordinary income dividends for tax purposes.
2 Net Assets—End of Period includes undistributed net investment income of $24,651,000 and $86,217,000.
See accompanying Notes, which are an integral part of the Financial Statements.
21
Target Retirement 2010 Fund
| Financial Highlights | ||||||
| Six Months | ||||||
| Ended | ||||||
| For a Share Outstanding | March 31, | Year Ended September 30, | ||||
| Throughout Each Period | 2013 | 2012 | 2011 | 2010 | 2009 | 2008 |
| Net Asset Value, Beginning of Period | $24.45 | $21.91 | $21.87 | $20.39 | $20.47 | $23.54 |
| Investment Operations | ||||||
| Net Investment Income | .277 | .571 | .5601 | .520 | .553 | .7441 |
| Capital Gain Distributions Received | .104 | .100 | .0561 | — | — | — |
| Net Realized and Unrealized Gain (Loss) | ||||||
| on Investments | .717 | 2.502 | (.022) | 1.455 | .046 | (3.354) |
| Total from Investment Operations | 1.098 | 3.173 | .594 | 1.975 | .599 | (2.610) |
| Distributions | ||||||
| Dividends from Net Investment Income | (.531) | (.596) | (.511) | (.495) | (.679) | (.460) |
| Distributions from Realized Capital Gains | (.037) | (.037) | (.043) | — | — | — |
| Total Distributions | (.568) | (.633) | (.554) | (.495) | (.679) | (.460) |
| Net Asset Value, End of Period | $24.98 | $24.45 | $21.91 | $21.87 | $20.39 | $20.47 |
| Total Return2 | 4.58% | 14.74% | 2.68% | 9.83% | 3.47% | -11.30% |
| Ratios/Supplemental Data | ||||||
| Net Assets, End of Period (Millions) | $6,883 | $6,155 | $4,747 | $4,247 | $3,065 | $2,567 |
| Ratio of Total Expenses to | ||||||
| Average Net Assets | — | — | — | — | — | — |
| Acquired Fund Fees and Expenses | 0.16% | 0.16% | 0.17% | 0.17% | 0.21% | 0.19% |
| Ratio of Net Investment Income to | ||||||
| Average Net Assets | 2.37% | 2.51% | 2.46% | 2.67% | 3.15% | 3.34% |
| Portfolio Turnover Rate | 7% | 12% | 27%3 | 19% | 41%4 | 18% |
The expense ratio, acquired fund fees and expenses, net income ratio, and turnover rate for the current period have been annualized.
1 Calculated based on average shares outstanding.
2 Total returns do not include account service fees that may have applied in the periods shown. Fund prospectuses provide information about any applicable account service fees.
3 Excludes the value of mutual fund shares delivered and received in connection with a change in the fund’s international equity investments from Vanguard European, Pacific, and Emerging Markets Stock Index Funds to Vanguard Total International Stock Index Fund because those transactions were effected in kind and did not cause the fund to incur transaction costs.
4 Excludes the value of mutual fund shares delivered and received in connection with a change in the fund’s bond investments from Vanguard Total Bond Market Index Fund to Vanguard Total Bond Market II Index Fund because those transactions were effected in kind and did not cause the fund to incur transaction costs.
See accompanying Notes, which are an integral part of the Financial Statements.
22
Target Retirement 2010 Fund
Notes to Financial Statements
Vanguard Target Retirement 2010 Fund is registered under the Investment Company Act of 1940 as an open-end investment company, or mutual fund. The fund follows a balanced investment strategy by investing in selected Vanguard funds to achieve its targeted allocation of assets to U.S. stocks, international stocks, bonds, and short-term reserves.
A. The following significant accounting policies conform to generally accepted accounting principles for U.S. mutual funds. The fund consistently follows such policies in preparing its financial statements.
1. Security Valuation: Investments are valued at the net asset value of each underlying Vanguard fund determined as of the close of the New York Stock Exchange (generally 4 p.m., Eastern time) on the valuation date. See Note C.
2. Federal Income Taxes: The fund intends to continue to qualify as a regulated investment company and distribute all of its taxable income. Management has analyzed the fund’s tax positions taken for all open federal income tax years (September 30, 2009–2012), and for the period ended March 31, 2013, and has concluded that no provision for federal income tax is required in the fund’s financial statements.
3. Distributions: Distributions to shareholders are recorded on the ex-dividend date.
4. Other: Income and capital gain distributions received are recorded on the ex-dividend date. Security transactions are accounted for on the date securities are bought or sold. Costs used to determine realized gains (losses) on the sale of investment securities are those of the specific securities sold.
B. Under a service agreement, The Vanguard Group furnishes investment advisory, corporate management, administrative, marketing, and distribution services to the fund. The service agreement provides that the fund’s expenses may be reduced or eliminated to the extent of savings realized by the Vanguard funds by the operation of the fund. Accordingly, all incremental expenses for services provided by Vanguard and all other expenses incurred by the fund during the period ended March 31, 2013, were borne by the funds in which the fund invests. The fund’s trustees and officers are also directors and officers of Vanguard and the funds in which the fund invests.
C. Various inputs may be used to determine the value of the fund’s investments. These inputs are summarized in three broad levels for financial statement purposes. The inputs or methodologies used to value securities are not necessarily an indication of the risk associated with investing in those securities.
Level 1—Quoted prices in active markets for identical securities.
Level 2—Other significant observable inputs (including quoted prices for similar securities, interest rates, prepayment speeds, credit risk, etc.).
Level 3—Significant unobservable inputs (including the fund’s own assumptions used to determine the fair value of investments).
The following table summarizes the market value of the fund’s investments as of March 31, 2013, based on the inputs used to value them:
| Level 1 | Level 2 | Level 3 | |
| Investments | ($000) | ($000) | ($000) |
| Investment Companies | 6,049,587 | 855,341 | — |
23
Target Retirement 2010 Fund
The fund’s investment in Vanguard Total International Stock Index Fund is normally valued based on Level 1 inputs but was valued in this report based on Level 2 inputs. The most recent quoted net asset value for this underlying fund was as of March 28, 2013. For financial statement purposes, this net asset value was adjusted to revalue certain of the fund’s securities based on March 29, 2013, closing prices because their local markets were open while U.S. markets were closed.
D. Distributions are determined on a tax basis and may differ from net investment income and realized capital gains for financial reporting purposes. Differences may be permanent or temporary. Permanent differences are reclassified among capital accounts in the financial statements to reflect their tax character. Temporary differences arise when certain items of income, expense, gain, or loss are recognized in different periods for financial statement and tax purposes; these differences will reverse at some time in the future. Differences in classification may also result from the treatment of short-term gains as ordinary income for tax purposes.
The fund’s tax-basis capital gains and losses are determined only at the end of each fiscal year. For tax purposes, at September 30, 2012, the fund had available capital losses totaling $63,820,000 to offset future net capital gains. Of this amount, $47,220,000 is subject to expiration dates; $5,639,000 may be used to offset future net capital gains through September 30, 2017, $26,042,000 through September 30, 2018, and $15,539,000 through September 30, 2019. Capital losses of $16,600,000 realized beginning in fiscal 2012 may be carried forward indefinitely under the Regulated Investment Company Modernization Act of 2010, but must be used before any expiring loss carryforwards. The fund will use these capital losses to offset net taxable capital gains, if any, realized during the year ending September 30, 2013; should the fund realize net capital losses for the year, the losses will be added to the loss carryforward balance above. Short-term capital gain distributions received are treated as ordinary income for tax purposes, and cannot be offset by capital losses. Capital gain distributions paid during the six months ended March 31, 2013, are from short-term gain distributions received from Vanguard Total Bond Market II Index Fund and Vanguard Inflation-Protected Securities Fund.
At March 31, 2013, the cost of investment securities for tax purposes was $6,124,717,000. Net unrealized appreciation of investment securities for tax purposes was $780,211,000, consisting entirely of unrealized gains on securities that had risen in value since their purchase.
E. During the six months ended March 31, 2013, the fund purchased $785,637,000 of investment securities and sold $224,753,000 of investment securities, other than temporary cash investments.
F. Capital shares issued and redeemed were:
| Six Months Ended | Year Ended | |
| March 31, 2013 | September 30, 2012 | |
| Shares | Shares | |
| (000) | (000) | |
| Issued | 49,075 | 82,983 |
| Issued in Lieu of Cash Distributions | 6,076 | 6,184 |
| Redeemed | (31,302) | (54,110) |
| Net Increase (Decrease) in Shares Outstanding | 23,849 | 35,057 |
24
Target Retirement 2010 Fund
G. In preparing the financial statements as of March 31, 2013, management considered the impact of subsequent events for potential recognition or disclosure in these financial statements.
In February 2013, Vanguard announced plans to reallocate 20% of the fund’s fixed income exposure to foreign bonds, through an investment in Vanguard Total International Bond Index Fund. In addition, the fund’s investment in Vanguard Inflation-Protected Securities Fund will be replaced by Vanguard Short-Term Inflation-Protected Securities Index Fund, and its investment in Vanguard Prime Money Market Fund will be eliminated. The fund’s overall fixed income allocation and its strategic asset allocation are not changing. The transition is expected to be completed by June 30, 2013.
25
Target Retirement 2015 Fund
Fund Profile
As of March 31, 2013
| Total Fund Characteristics | |
| Ticker Symbol | VTXVX |
| 30-Day SEC Yield | 2.04% |
| Acquired Fund Fees and Expenses1 | 0.16% |
| Allocation to Underlying Vanguard Funds | |
| Vanguard Total Bond Market II Index Fund | |
| Investor Shares | 39.7% |
| Vanguard Total Stock Market Index Fund | |
| Investor Shares | 38.7% |
| Vanguard Total International Stock Index | |
| Fund Investor Shares | 16.0% |
| Vanguard Inflation-Protected Securities | |
| Fund Investor Shares | 5.6% |
| Total Fund Volatility Measures | ||
| Target 2015 | MSCI US | |
| Composite | Broad Market | |
| Index | Index | |
| R-Squared | 1.00 | 0.96 |
| Beta | 0.99 | 0.57 |
These measures show the degree and timing of the fund’s fluctuations compared with the indexes over 36 months.
Fund Asset Allocation
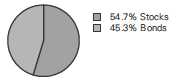
1 This figure—drawn from the prospectus dated January 28, 2013—represents an estimate of the weighted average of the expense ratios and any transaction fees charged by the underlying mutual funds (the ”acquired” funds) in which the Target Retirement 2015 Fund invests. The fund does not charge any expenses or fees of its own. For the six months ended March 31, 2013, the annualized acquired fund fees and expenses were 0.16%.
26
Target Retirement 2015 Fund
Performance Summary
All of the returns in this report represent past performance, which is not a guarantee of future results that may be achieved by the fund. (Current performance may be lower or higher than the performance data cited. For performance data current to the most recent month-end, visit our website at vanguard.com/performance.) Note, too, that both investment returns and principal value can fluctuate widely, so an investor’s shares, when sold, could be worth more or less than their original cost. The returns shown do not reflect taxes that a shareholder would pay on fund distributions or on the sale of fund shares.
Fiscal-Year Total Returns (%): October 27, 2003, Through March 31, 2013
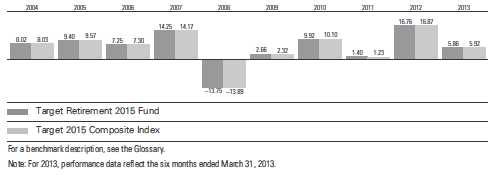
| Average Annual Total Returns: Periods Ended March 31, 2013 | ||||||
| Since Inception | ||||||
| Inception Date | One Year | Five Years | Income | Capital | Total | |
| Target Retirement 2015 | ||||||
| Fund | 10/27/2003 | 8.75% | 5.31% | 2.53% | 3.69% | 6.22% |
See Financial Highlights for dividend and capital gains information.
27
Target Retirement 2015 Fund
Financial Statements (unaudited)
Statement of Net Assets
As of March 31, 2013
The fund reports a complete list of its holdings in regulatory filings four times in each fiscal year, at the quarter-ends. For the second and fourth fiscal quarters, the lists appear in the fund’s semiannual and annual reports to shareholders. For the first and third fiscal quarters, the fund files the lists with the Securities and Exchange Commission on Form N-Q. Shareholders can look up the fund’s Forms N-Q on the SEC’s website at sec.gov. Forms N-Q may also be reviewed and copied at the SEC’s Public Reference Room (see the back cover of this report for further information).
| Market | ||
| Value | ||
| Shares | ($000) | |
| Investment Companies (99.9%) | ||
| U.S. Stock Fund (38.6%) | ||
| Vanguard Total Stock Market Index Fund Investor Shares | 190,851,872 | 7,517,655 |
| International Stock Fund (16.0%) | ||
| Vanguard Total International Stock Index Fund Investor Shares | 201,876,289 | 3,102,839 |
| Bond Funds (45.3%) | ||
| 1 Vanguard Total Bond Market II Index Fund Investor Shares | 708,551,421 | 7,730,296 |
| Vanguard Inflation-Protected Securities Fund Investor Shares | 75,404,290 | 1,088,084 |
| 8,818,380 | ||
| Total Investment Companies (Cost $16,751,928) | 19,438,874 | |
| Other Assets and Liabilities (0.1%) | ||
| Other Assets | 71,733 | |
| Liabilities | (60,350) | |
| 11,383 | ||
| Net Assets (100%) | ||
| Applicable to 1,389,761,524 outstanding $.001 par value shares of | ||
| beneficial interest (unlimited authorization) | 19,450,257 | |
| Net Asset Value Per Share | $14.00 | |
| At March 31, 2013, net assets consisted of: | |
| Amount | |
| ($000) | |
| Paid-in Capital | 16,720,020 |
| Undistributed Net Investment Income | 74,142 |
| Accumulated Net Realized Losses | (30,851) |
| Unrealized Appreciation (Depreciation) | 2,686,946 |
| Net Assets | 19,450,257 |
See Note A in Notes to Financial Statements.
1 Affiliated fund available only to Vanguard funds and certain trusts and accounts managed by Vanguard.
See accompanying Notes, which are an integral part of the Financial Statements.
28
Target Retirement 2015 Fund
| Statement of Operations | |
| Six Months Ended | |
| March 31, 2013 | |
| ($000) | |
| Investment Income | |
| Income | |
| Income Distributions Received | 211,594 |
| Net Investment Income—Note B | 211,594 |
| Realized Net Gain (Loss) | |
| Capital Gain Distributions Received | 52,398 |
| Investment Securities Sold | 3,696 |
| Realized Net Gain (Loss) | 56,094 |
| Change in Unrealized Appreciation (Depreciation) of Investment Securities | 770,911 |
| Net Increase (Decrease) in Net Assets Resulting from Operations | 1,038,599 |
See accompanying Notes, which are an integral part of the Financial Statements.
29
Target Retirement 2015 Fund
| Statement of Changes in Net Assets | ||
| Six Months Ended | Year Ended | |
| March 31, | September 30, | |
| 2013 | 2012 | |
| ($000) | ($000) | |
| Increase (Decrease) in Net Assets | ||
| Operations | ||
| Net Investment Income | 211,594 | 394,621 |
| Realized Net Gain (Loss) | 56,094 | 91,378 |
| Change in Unrealized Appreciation (Depreciation) | 770,911 | 1,819,354 |
| Net Increase (Decrease) in Net Assets Resulting from Operations | 1,038,599 | 2,305,353 |
| Distributions | ||
| Net Investment Income | (384,520) | (356,688) |
| Realized Capital Gain1 | (23,226) | (22,792) |
| Total Distributions | (407,746) | (379,480) |
| Capital Share Transactions | ||
| Issued | 2,871,145 | 4,080,711 |
| Issued in Lieu of Cash Distributions | 403,269 | 375,872 |
| Redeemed | (1,293,307) | (2,978,853) |
| Net Increase (Decrease) from Capital Share Transactions | 1,981,107 | 1,477,730 |
| Total Increase (Decrease) | 2,611,960 | 3,403,603 |
| Net Assets | ||
| Beginning of Period | 16,838,297 | 13,434,694 |
| End of Period2 | 19,450,257 | 16,838,297 |
1 Includes fiscal 2013 and 2012 short-term gain distributions totaling $23,226,000 and $22,792,000, respectively. Short-term gain distributions are treated as ordinary income dividends for tax purposes.
2 Net Assets—End of Period includes undistributed net investment income of $74,142,000 and $247,068,000.
See accompanying Notes, which are an integral part of the Financial Statements.
30
Target Retirement 2015 Fund
| Financial Highlights | ||||||
| Six Months | ||||||
| Ended | ||||||
| For a Share Outstanding | March 31, | Year Ended September 30, | ||||
| Throughout Each Period | 2013 | 2012 | 2011 | 2010 | 2009 | 2008 |
| Net Asset Value, Beginning of Period | $13.54 | $11.91 | $12.03 | $11.21 | $11.34 | $13.49 |
| Investment Operations | ||||||
| Net Investment Income | .152 | .327 | .2831 | .285 | .307 | .3801 |
| Capital Gain Distributions Received | .040 | .053 | .0311 | — | — | — |
| Net Realized and Unrealized Gain (Loss) | ||||||
| on Investments | .584 | 1.583 | (.134) | .811 | (.072) | (2.190) |
| Total from Investment Operations | .776 | 1.963 | .180 | 1.096 | .235 | (1.810) |
| Distributions | ||||||
| Dividends from Net Investment Income | (.298) | (.313) | (.276) | (.276) | (.365) | (.340) |
| Distributions from Realized Capital Gains | (.018) | (.020) | (.024) | — | — | — |
| Total Distributions | (.316) | (.333) | (.300) | (.276) | (.365) | (.340) |
| Net Asset Value, End of Period | $14.00 | $13.54 | $11.91 | $12.03 | $11.21 | $11.34 |
| Total Return2 | 5.86% | 16.76% | 1.40% | 9.92% | 2.66% | -13.75% |
| Ratios/Supplemental Data | ||||||
| Net Assets, End of Period (Millions) | $19,450 | $16,838 | $13,435 | $12,466 | $9,507 | $7,804 |
| Ratio of Total Expenses to | ||||||
| Average Net Assets | — | — | — | — | — | — |
| Acquired Fund Fees and Expenses | 0.16% | 0.16% | 0.17% | 0.17% | 0.21% | 0.18% |
| Ratio of Net Investment Income to | ||||||
| Average Net Assets | 2.37% | 2.59% | 2.24% | 2.62% | 3.31% | 3.02% |
| Portfolio Turnover Rate | 4% | 13% | 27%3 | 19% | 37%4 | 24% |
The expense ratio, acquired fund fees and expenses, net income ratio, and turnover rate for the current period have been annualized.
1 Calculated based on average shares outstanding.
2 Total returns do not include account service fees that may have applied in the periods shown. Fund prospectuses provide information about any applicable account service fees.
3 Excludes the value of mutual fund shares delivered and received in connection with a change in the fund’s international equity investments from Vanguard European, Pacific, and Emerging Markets Stock Index Funds to Vanguard Total International Stock Index Fund because those transactions were effected in kind and did not cause the fund to incur transaction costs.
4 Excludes the value of mutual fund shares delivered and received in connection with a change in the fund’s bond investments from Vanguard Total Bond Market Index Fund to Vanguard Total Bond Market II Index Fund because those transactions were effected in kind and did not cause the fund to incur transaction costs.
See accompanying Notes, which are an integral part of the Financial Statements.
31
Target Retirement 2015 Fund
Notes to Financial Statements
Vanguard Target Retirement 2015 Fund is registered under the Investment Company Act of 1940 as an open-end investment company, or mutual fund. The fund follows a balanced investment strategy by investing in selected Vanguard funds to achieve its targeted allocation of assets to U.S. stocks, international stocks, and bonds.
A. The following significant accounting policies conform to generally accepted accounting principles for U.S. mutual funds. The fund consistently follows such policies in preparing its financial statements.
1. Security Valuation: Investments are valued at the net asset value of each underlying Vanguard fund determined as of the close of the New York Stock Exchange (generally 4 p.m., Eastern time) on the valuation date. See Note C.
2. Federal Income Taxes: The fund intends to continue to qualify as a regulated investment company and distribute all of its taxable income. Management has analyzed the fund’s tax positions taken for all open federal income tax years (September 30, 2009–2012), and for the period ended March 31, 2013, and has concluded that no provision for federal income tax is required in the fund’s financial statements.
3. Distributions: Distributions to shareholders are recorded on the ex-dividend date.
4. Other: Income and capital gain distributions received are recorded on the ex-dividend date. Security transactions are accounted for on the date securities are bought or sold. Costs used to determine realized gains (losses) on the sale of investment securities are those of the specific securities sold.
B. Under a service agreement, The Vanguard Group furnishes investment advisory, corporate management, administrative, marketing, and distribution services to the fund. The service agreement provides that the fund’s expenses may be reduced or eliminated to the extent of savings realized by the Vanguard funds by the operation of the fund. Accordingly, all incremental expenses for services provided by Vanguard and all other expenses incurred by the fund during the period ended March 31, 2013, were borne by the funds in which the fund invests. The fund’s trustees and officers are also directors and officers of Vanguard and the funds in which the fund invests.
C. Various inputs may be used to determine the value of the fund’s investments. These inputs are summarized in three broad levels for financial statement purposes. The inputs or methodologies used to value securities are not necessarily an indication of the risk associated with investing in those securities.
Level 1—Quoted prices in active markets for identical securities.
Level 2—Other significant observable inputs (including quoted prices for similar securities, interest rates, prepayment speeds, credit risk, etc.).
Level 3—Significant unobservable inputs (including the fund’s own assumptions used to determine the fair value of investments).
The following table summarizes the market value of the fund’s investments as of March 31, 2013, based on the inputs used to value them:
| Level 1 | Level 2 | Level 3 | |
| Investments | ($000) | ($000) | ($000) |
| Investment Companies | 16,336,035 | 3,102,839 | — |
32
Target Retirement 2015 Fund
The fund’s investment in Vanguard Total International Stock Index Fund is normally valued based on Level 1 inputs but was valued in this report based on Level 2 inputs. The most recent quoted net asset value for this underlying fund was as of March 28, 2013. For financial statement purposes, this net asset value was adjusted to revalue certain of the fund’s securities based on March 29, 2013, closing prices because their local markets were open while U.S. markets were closed.
D. Distributions are determined on a tax basis and may differ from net investment income and realized capital gains for financial reporting purposes. Differences may be permanent or temporary. Permanent differences are reclassified among capital accounts in the financial statements to reflect their tax character. Temporary differences arise when certain items of income, expense, gain, or loss are recognized in different periods for financial statement and tax purposes; these differences will reverse at some time in the future. Differences in classification may also result from the treatment of short-term gains as ordinary income for tax purposes.
The fund’s tax-basis capital gains and losses are determined only at the end of each fiscal year. For tax purposes, at September 30, 2012, the fund had available capital losses totaling $64,723,000 to offset future net capital gains. Of this amount, $27,719,000 is subject to expiration on September 30, 2018. Capital losses of $37,004,000 realized beginning in fiscal 2012 may be carried forward indefinitely under the Regulated Investment Company Modernization Act of 2010, but must be used before any expiring loss carryforwards. The fund will use these capital losses to offset net taxable capital gains, if any, realized during the year ending September 30, 2013; should the fund realize net capital losses for the year, the losses will be added to the loss carryforward balance above. Short-term capital gain distributions received are treated as ordinary income for tax purposes, and cannot be offset by capital losses. Capital gain distributions paid during the six months ended March 31, 2013, are from the short-term gain distributions received from Vanguard Total Bond Market II Index Fund and Vanguard Inflation-Protected Securities Fund.
At March 31, 2013, the cost of investment securities for tax purposes was $16,751,928,000. Net unrealized appreciation of investment securities for tax purposes was $2,686,946,000, consisting entirely of unrealized gains on securities that had risen in value since their purchase.
E. During the six months ended March 31, 2013, the fund purchased $2,159,403,000 of investment securities and sold $322,403,000 of investment securities, other than temporary cash investments.
F. Capital shares issued and redeemed were:
| Six Months Ended | Year Ended | |
| March 31, 2013 | September 30, 2012 | |
| Shares | Shares | |
| (000) | (000) | |
| Issued | 210,357 | 317,087 |
| Issued in Lieu of Cash Distributions | 30,344 | 30,534 |
| Redeemed | (94,919) | (232,130) |
| Net Increase (Decrease) in Shares Outstanding | 145,782 | 115,491 |
33
Target Retirement 2015 Fund
G. In preparing the financial statements as of March 31, 2013, management considered the impact of subsequent events for potential recognition or disclosure in these financial statements.
In February 2013, Vanguard announced plans to reallocate 20% of the fund’s fixed income exposure to foreign bonds, through an investment in Vanguard Total International Bond Index Fund. In addition, the fund’s investment in Vanguard Inflation-Protected Securities Fund will be replaced by Vanguard Short-Term Inflation-Protected Securities Index Fund. The fund’s overall fixed income allocation and its strategic asset allocation are not changing. The transition is expected to be completed by June 30, 2013.
34
Target Retirement 2020 Fund
Fund Profile
As of March 31, 2013
| Total Fund Characteristics | |
| Ticker Symbol | VTWNX |
| 30-Day SEC Yield | 2.04% |
| Acquired Fund Fees and Expenses1 | 0.16% |
| Allocation to Underlying Vanguard Funds | |
| Vanguard Total Stock Market Index Fund | |
| Investor Shares | 44.6% |
| Vanguard Total Bond Market II Index Fund | |
| Investor Shares | 36.7% |
| Vanguard Total International Stock Index | |
| Fund Investor Shares | 18.7% |
| Total Fund Volatility Measures | ||
| Target 2020 | MSCI US | |
| Composite | Broad Market | |
| Index | Index | |
| R-Squared | 1.00 | 0.97 |
| Beta | 1.00 | 0.66 |
These measures show the degree and timing of the fund’s fluctuations compared with the indexes over 36 months.
Fund Asset Allocation
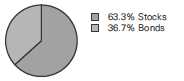
1 This figure—drawn from the prospectus dated January 28, 2013—represents an estimate of the weighted average of the expense ratios and any transaction fees charged by the underlying mutual funds (the ”acquired” funds) in which the Target Retirement 2020 Fund invests. The fund does not charge any expenses or fees of its own. For the six months ended March 31, 2013, the annualized acquired fund fees and expenses were 0.16%.
35
Target Retirement 2020 Fund
Performance Summary
All of the returns in this report represent past performance, which is not a guarantee of future results that may be achieved by the fund. (Current performance may be lower or higher than the performance data cited. For performance data current to the most recent month-end, visit our website at vanguard.com/performance.) Note, too, that both investment returns and principal value can fluctuate widely, so an investor’s shares, when sold, could be worth more or less than their original cost. The returns shown do not reflect taxes that a shareholder would pay on fund distributions or on the sale of fund shares.
Fiscal-Year Total Returns (%): June 7, 2006, Through March 31, 2013
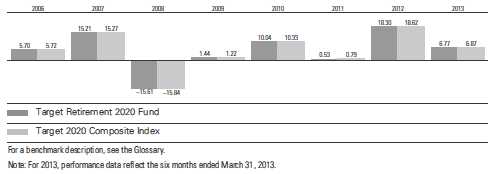
| Average Annual Total Returns: Periods Ended March 31, 2013 | ||||||
| Since Inception | ||||||
| Inception Date | One Year | Five Years | Income | Capital | Total | |
| Target Retirement 2020 | ||||||
| Fund | 6/7/2006 | 9.41% | 5.18% | 2.22% | 3.45% | 5.67% |
See Financial Highlights for dividend and capital gains information.
36
Target Retirement 2020 Fund
Financial Statements (unaudited)
Statement of Net Assets
As of March 31, 2013
The fund reports a complete list of its holdings in regulatory filings four times in each fiscal year, at the quarter-ends. For the second and fourth fiscal quarters, the lists appear in the fund’s semiannual and annual reports to shareholders. For the first and third fiscal quarters, the fund files the lists with the Securities and Exchange Commission on Form N-Q. Shareholders can look up the fund’s Forms N-Q on the SEC’s website at sec.gov. Forms N-Q may also be reviewed and copied at the SEC’s Public Reference Room (see the back cover of this report for further information).
| Market | ||
| Value | ||
| Shares | ($000) | |
| Investment Companies (100.1%) | ||
| U.S. Stock Fund (44.7%) | ||
| Vanguard Total Stock Market Index Fund Investor Shares | 227,922,644 | 8,977,873 |
| International Stock Fund (18.7%) | ||
| Vanguard Total International Stock Index Fund Investor Shares | 244,866,971 | 3,763,605 |
| Bond Fund (36.7%) | ||
| 1 Vanguard Total Bond Market II Index Fund Investor Shares | 676,141,982 | 7,376,709 |
| Total Investment Companies (100.1%) (Cost $17,566,066) | 20,118,187 | |
| Other Assets and Liabilities (-0.1%) | ||
| Other Assets | 82,730 | |
| Liabilities | (100,545) | |
| (17,815) | ||
| Net Assets (100%) | ||
| Applicable to 800,732,096 outstanding $.001 par value shares of | ||
| beneficial interest (unlimited authorization) | 20,100,372 | |
| Net Asset Value Per Share | $25.10 | |
| At March 31, 2013, net assets consisted of: | |
| Amount | |
| ($000) | |
| Paid-in Capital | 17,496,481 |
| Undistributed Net Investment Income | 79,541 |
| Accumulated Net Realized Losses | (27,771) |
| Unrealized Appreciation (Depreciation) | 2,552,121 |
| Net Assets | 20,100,372 |
See Note A in Notes to Financial Statements.
1 Affiliated fund available only to Vanguard funds and certain trusts and accounts managed by Vanguard.
See accompanying Notes, which are an integral part of the Financial Statements.
37
Target Retirement 2020 Fund
| Statement of Operations | |
| Six Months Ended | |
| March 31, 2013 | |
| ($000) | |
| Investment Income | |
| Income | |
| Income Distributions Received | 209,607 |
| Net Investment Income—Note B | 209,607 |
| Realized Net Gain (Loss) | |
| Capital Gain Distributions Received | 35,666 |
| Investment Securities Sold | 6,908 |
| Realized Net Gain (Loss) | 42,574 |
| Change in Unrealized Appreciation (Depreciation) of Investment Securities | 946,298 |
| Net Increase (Decrease) in Net Assets Resulting from Operations | 1,198,479 |
See accompanying Notes, which are an integral part of the Financial Statements.
38
Target Retirement 2020 Fund
| Statement of Changes in Net Assets | ||
| Six Months Ended | Year Ended | |
| March 31, | September 30, | |
| 2013 | 2012 | |
| ($000) | ($000) | |
| Increase (Decrease) in Net Assets | ||
| Operations | ||
| Net Investment Income | 209,607 | 359,941 |
| Realized Net Gain (Loss) | 42,574 | 79,895 |
| Change in Unrealized Appreciation (Depreciation) | 946,298 | 1,764,009 |
| Net Increase (Decrease) in Net Assets Resulting from Operations | 1,198,479 | 2,203,845 |
| Distributions | ||
| Net Investment Income | (362,214) | (281,924) |
| Realized Capital Gain1 | (18,539) | (17,036) |
| Total Distributions | (380,753) | (298,960) |
| Capital Share Transactions | ||
| Issued | 3,955,315 | 4,865,832 |
| Issued in Lieu of Cash Distributions | 376,276 | 296,988 |
| Redeemed | (1,126,774) | (2,021,399) |
| Net Increase (Decrease) from Capital Share Transactions | 3,204,817 | 3,141,421 |
| Total Increase (Decrease) | 4,022,543 | 5,046,306 |
| Net Assets | ||
| Beginning of Period | 16,077,829 | 11,031,523 |
| End of Period2 | 20,100,372 | 16,077,829 |
1 Includes fiscal 2013 and 2012 short-term gain distributions totaling $18,539,000 and $17,036,000, respectively. Short-term gain distributions are treated as ordinary income dividends for tax purposes.
2 Net Assets—End of Period includes undistributed net investment income of $79,541,000 and $232,148,000.
See accompanying Notes, which are an integral part of the Financial Statements.
39
Target Retirement 2020 Fund
| Financial Highlights | ||||||
| Six Months | ||||||
| Ended | ||||||
| For a Share Outstanding | March 31, | Year Ended September 30, | ||||
| Throughout Each Period | 2013 | 2012 | 2011 | 2010 | 2009 | 2008 |
| Net Asset Value, Beginning of Period | $24.04 | $20.83 | $21.17 | $19.66 | $20.03 | $24.15 |
| Investment Operations | ||||||
| Net Investment Income | .260 | .569 | .4731 | .5101 | .5391 | .6191 |
| Capital Gain Distributions Received | .048 | .079 | .0441 | — | — | — |
| Net Realized and Unrealized Gain (Loss) | ||||||
| on Investments | 1.286 | 3.106 | (.378) | 1.440 | (.360) | (4.329) |
| Total from Investment Operations | 1.594 | 3.754 | .139 | 1.950 | .179 | (3.710) |
| Distributions | ||||||
| Dividends from Net Investment Income | (.508) | (.513) | (.444) | (.440) | (.549) | (.410) |
| Distributions from Realized Capital Gains | (.026) | (.031) | (.035) | — | — | — |
| Total Distributions | (.534) | (.544) | (.479) | (.440) | (.549) | (.410) |
| Net Asset Value, End of Period | $25.10 | $24.04 | $20.83 | $21.17 | $19.66 | $20.03 |
| Total Return2 | 6.77% | 18.30% | 0.53% | 10.04% | 1.44% | -15.61% |
| Ratios/Supplemental Data | ||||||
| Net Assets, End of Period (Millions) | $20,100 | $16,078 | $11,032 | $8,890 | $5,706 | $3,859 |
| Ratio of Total Expenses to | ||||||
| Average Net Assets | — | — | — | — | — | — |
| Acquired Fund Fees and Expenses | 0.16% | 0.16% | 0.17% | 0.17% | 0.21% | 0.19% |
| Ratio of Net Investment Income to | ||||||
| Average Net Assets | 2.36% | 2.62% | 2.11% | 2.51% | 3.19% | 2.79% |
| Portfolio Turnover Rate | 2% | 8% | 23%3 | 14% | 27%4 | 15% |
The expense ratio, acquired fund fees and expenses, net income ratio, and turnover rate for the current period have been annualized.
1 Calculated based on average shares outstanding.
2 Total returns do not include transaction fees that may have applied in the periods shown. Fund prospectuses provide information about any applicable transaction fees.
3 Excludes the value of mutual fund shares delivered and received in connection with a change in the fund’s international equity investments from Vanguard European, Pacific, and Emerging Markets Stock Index Funds to Vanguard Total International Stock Index Fund because those transactions were effected in kind and did not cause the fund to incur transaction costs.
4 Excludes the value of mutual fund shares delivered and received in connection with a change in the fund’s bond investments from Vanguard Total Bond Market Index Fund to Vanguard Total Bond Market II Index Fund because those transactions were effected in kind and did not cause the fund to incur transaction costs.
See accompanying Notes, which are an integral part of the Financial Statements.
40
Target Retirement 2020 Fund
Notes to Financial Statements
Vanguard Target Retirement 2020 Fund is registered under the Investment Company Act of 1940 as an open-end investment company, or mutual fund. The fund follows a balanced investment strategy by investing in selected Vanguard funds to achieve its targeted allocation of assets to U.S. stocks, international stocks, and bonds.
A. The following significant accounting policies conform to generally accepted accounting principles for U.S. mutual funds. The fund consistently follows such policies in preparing its financial statements.
1. Security Valuation: Investments are valued at the net asset value of each underlying Vanguard fund determined as of the close of the New York Stock Exchange (generally 4 p.m., Eastern time) on the valuation date. See Note C.
2. Federal Income Taxes: The fund intends to continue to qualify as a regulated investment company and distribute all of its taxable income. Management has analyzed the fund’s tax positions taken for all open federal income tax years (September 30, 2009–2012), and for the period ended March 31, 2013, and has concluded that no provision for federal income tax is required in the fund’s financial statements.
3. Distributions: Distributions to shareholders are recorded on the ex-dividend date.
4. Other: Income and capital gain distributions received are recorded on the ex-dividend date. Security transactions are accounted for on the date securities are bought or sold. Costs used to determine realized gains (losses) on the sale of investment securities are those of the specific securities sold.
B. Under a service agreement, The Vanguard Group furnishes investment advisory, corporate management, administrative, marketing, and distribution services to the fund. The service agreement provides that the fund’s expenses may be reduced or eliminated to the extent of savings realized by the Vanguard funds by the operation of the fund. Accordingly, all incremental expenses for services provided by Vanguard and all other expenses incurred by the fund during the period ended March 31, 2013, were borne by the funds in which the fund invests. The fund’s trustees and officers are also directors and officers of Vanguard and the funds in which the fund invests.
C. Various inputs may be used to determine the value of the fund’s investments. These inputs are summarized in three broad levels for financial statement purposes. The inputs or methodologies used to value securities are not necessarily an indication of the risk associated with investing in those securities.
Level 1—Quoted prices in active markets for identical securities.
Level 2—Other significant observable inputs (including quoted prices for similar securities, interest rates, prepayment speeds, credit risk, etc.).
Level 3—Significant unobservable inputs (including the fund’s own assumptions used to determine the fair value of investments).
The following table summarizes the market value of the fund’s investments as of March 31, 2013, based on the inputs used to value them:
| Level 1 | Level 2 | Level 3 | |
| Investments | ($000) | ($000) | ($000) |
| Investment Companies | 16,354,582 | 3,763,605 | — |
41
Target Retirement 2020 Fund
The fund’s investment in Vanguard Total International Stock Index Fund is normally valued based on Level 1 inputs but was valued in this report based on Level 2 inputs. The most recent quoted net asset value for this underlying fund was as of March 28, 2013. For financial statement purposes, this net asset value was adjusted to revalue certain of the fund’s securities based on March 29, 2013, closing prices because their local markets were open while U.S. markets were closed.
D. Distributions are determined on a tax basis and may differ from net investment income and realized capital gains for financial reporting purposes. Differences may be permanent or temporary. Permanent differences are reclassified among capital accounts in the financial statements to reflect their tax character. Temporary differences arise when certain items of income, expense, gain, or loss are recognized in different periods for financial statement and tax purposes; these differences will reverse at some time in the future. Differences in classification may also result from the treatment of short-term gains as ordinary income for tax purposes.
The fund’s tax-basis capital gains and losses are determined only at the end of each fiscal year. For tax purposes, at September 30, 2012, the fund had available capital losses totaling $46,452,000 to offset future net capital gains. Of this amount, $32,992,000 is subject to expiration dates; $6,167,000 may be used to offset future net capital gains through September 30, 2017, $21,253,000 through September 30, 2018, and $5,572,000 through September 30, 2019. Capital losses of $13,460,000 realized beginning in fiscal 2012 may be carried forward indefinitely under the Regulated Investment Company Modernization Act of 2010, but must be used before any expiring loss carryforwards. The fund will use these capital losses to offset net taxable capital gains, if any, realized during the year ending September 30, 2013; should the fund realize net capital losses for the year, the losses will be added to the loss carryforward balance above. Short-term capital gain distributions received are treated as ordinary income for tax purposes, and cannot be offset by capital losses. Capital gain distributions paid during the six months ended March 31, 2013, are from short-term gain distributions received from Vanguard Total Bond Market II Index Fund.
At March 31, 2013, the cost of investment securities for tax purposes was $17,566,066,000. Net unrealized appreciation of investment securities for tax purposes was $2,552,121,000, consisting entirely of unrealized gains on securities that had risen in value since their purchase.
E. During the six months ended March 31, 2013, the fund purchased $3,313,302,000 of investment securities and sold $211,627,000 of investment securities, other than temporary cash investments.
F. Capital shares issued and redeemed were:
| Six Months Ended | Year Ended | |
| March 31, 2013 | September 30, 2012 | |
| Shares | Shares | |
| (000) | (000) | |
| Issued | 162,461 | 213,996 |
| Issued in Lieu of Cash Distributions | 15,924 | 13,680 |
| Redeemed | (46,381) | (88,615) |
| Net Increase (Decrease) in Shares Outstanding | 132,004 | 139,061 |
42
Target Retirement 2020 Fund
G. In preparing the financial statements as of March 31, 2013, management considered the impact of subsequent events for potential recognition or disclosure in these financial statements.
In February 2013, Vanguard announced plans to reallocate 20% of the fund’s fixed income exposure to foreign bonds, through an investment in Vanguard Total International Bond Index Fund. The fund’s overall fixed income allocation and its strategic asset allocation are not changing. The transition is expected to be completed by June 30, 2013.
43
Target Retirement 2025 Fund
Fund Profile
As of March 31, 2013
| Total Fund Characteristics | |
| Ticker Symbol | VTTVX |
| 30-Day SEC Yield | 2.05% |
| Acquired Fund Fees and Expenses1 | 0.17% |
| Allocation to Underlying Vanguard Funds | |
| Vanguard Total Stock Market Index Fund | |
| Investor Shares | 50.0% |
| Vanguard Total Bond Market II Index Fund | |
| Investor Shares | 29.2% |
| Vanguard Total International Stock Index | |
| Fund Investor Shares | 20.8% |
| Total Fund Volatility Measures | ||
| Target 2025 | MSCI US | |
| Composite | Broad Market | |
| Index | Index | |
| R-Squared | 1.00 | 0.98 |
| Beta | 1.00 | 0.74 |
These measures show the degree and timing of the fund’s fluctuations compared with the indexes over 36 months.
Fund Asset Allocation
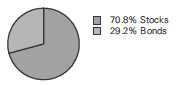
1 This figure—drawn from the prospectus dated January 28, 2013—represents an estimate of the weighted average of the expense ratios and any transaction fees charged by the underlying mutual funds (the ”acquired” funds) in which the Target Retirement 2025 Fund invests. The fund does not charge any expenses or fees of its own. For the six months ended March 31, 2013, the annualized acquired fund fees and expenses were 0.17%.
44
Target Retirement 2025 Fund
Performance Summary
All of the returns in this report represent past performance, which is not a guarantee of future results that may be achieved by the fund. (Current performance may be lower or higher than the performance data cited. For performance data current to the most recent month-end, visit our website at vanguard.com/performance.) Note, too, that both investment returns and principal value can fluctuate widely, so an investor’s shares, when sold, could be worth more or less than their original cost. The returns shown do not reflect taxes that a shareholder would pay on fund distributions or on the sale of fund shares.
Fiscal-Year Total Returns (%): October 27, 2003, Through March 31, 2013
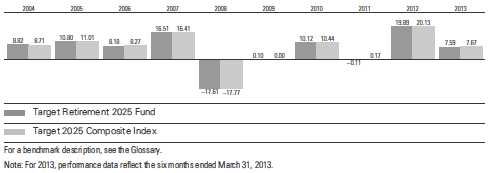
| Average Annual Total Returns: Periods Ended March 31, 2013 | ||||||
| Since Inception | ||||||
| Inception Date | One Year | Five Years | Income | Capital | Total | |
| Target Retirement 2025 | ||||||
| Fund | 10/27/2003 | 10.08% | 5.03% | 2.31% | 3.99% | 6.30% |
See Financial Highlights for dividend and capital gains information.
45
Target Retirement 2025 Fund
Financial Statements (unaudited)
Statement of Net Assets
As of March 31, 2013
The fund reports a complete list of its holdings in regulatory filings four times in each fiscal year, at the quarter-ends. For the second and fourth fiscal quarters, the lists appear in the fund’s semiannual and annual reports to shareholders. For the first and third fiscal quarters, the fund files the lists with the Securities and Exchange Commission on Form N-Q. Shareholders can look up the fund’s Forms N-Q on the SEC’s website at sec.gov. Forms N-Q may also be reviewed and copied at the SEC’s Public Reference Room (see the back cover of this report for further information).
| Market | ||
| Value | ||
| Shares | ($000) | |
| Investment Companies (100.0%) | ||
| U.S. Stock Fund (50.0%) | ||
| Vanguard Total Stock Market Index Fund Investor Shares | 308,546,569 | 12,153,649 |
| International Stock Fund (20.8%) | ||
| Vanguard Total International Stock Index Fund Investor Shares | 329,514,751 | 5,064,642 |
| Bond Fund (29.2%) | ||
| 1 Vanguard Total Bond Market II Index Fund Investor Shares | 651,239,938 | 7,105,028 |
| Total Investment Companies (100.0%) (Cost $20,678,288) | 24,323,319 | |
| Other Assets and Liabilities (0.0%) | ||
| Other Assets | 87,261 | |
| Liabilities | (91,227) | |
| (3,966) | ||
| Net Assets (100%) | ||
| Applicable to 1,688,239,326 outstanding $.001 par value shares of | ||
| beneficial interest (unlimited authorization) | 24,319,353 | |
| Net Asset Value Per Share | $14.41 | |
| At March 31, 2013, net assets consisted of: | |
| Amount | |
| ($000) | |
| Paid-in Capital | 20,634,501 |
| Undistributed Net Investment Income | 93,985 |
| Accumulated Net Realized Losses | (54,164) |
| Unrealized Appreciation (Depreciation) | 3,645,031 |
| Net Assets | 24,319,353 |
See Note A in Notes to Financial Statements.
1 Affiliated fund available only to Vanguard funds and certain trusts and accounts managed by Vanguard.
See accompanying Notes, which are an integral part of the Financial Statements.
46
Target Retirement 2025 Fund
| Statement of Operations | |
| Six Months Ended | |
| March 31, 2013 | |
| ($000) | |
| Investment Income | |
| Income | |
| Income Distributions Received | 260,810 |
| Net Investment Income—Note B | 260,810 |
| Realized Net Gain (Loss) | |
| Capital Gain Distributions Received | 34,762 |
| Investment Securities Sold | 5,830 |
| Realized Net Gain (Loss) | 40,592 |
| Change in Unrealized Appreciation (Depreciation) of Investment Securities | 1,328,971 |
| Net Increase (Decrease) in Net Assets Resulting from Operations | 1,630,373 |
See accompanying Notes, which are an integral part of the Financial Statements.
47
Target Retirement 2025 Fund
| Statement of Changes in Net Assets | ||
| Six Months Ended | Year Ended | |
| March 31, | September 30, | |
| 2013 | 2012 | |
| ($000) | ($000) | |
| Increase (Decrease) in Net Assets | ||
| Operations | ||
| Net Investment Income | 260,810 | 465,615 |
| Realized Net Gain (Loss) | 40,592 | 77,668 |
| Change in Unrealized Appreciation (Depreciation) | 1,328,971 | 2,539,930 |
| Net Increase (Decrease) in Net Assets Resulting from Operations | 1,630,373 | 3,083,213 |
| Distributions | ||
| Net Investment Income | (454,865) | (378,248) |
| Realized Capital Gain1 | (18,440) | (16,898) |
| Total Distributions | (473,305) | (395,146) |
| Capital Share Transactions | ||
| Issued | 3,807,234 | 4,781,176 |
| Issued in Lieu of Cash Distributions | 468,277 | 391,525 |
| Redeemed | (1,134,806) | (2,836,642) |
| Net Increase (Decrease) from Capital Share Transactions | 3,140,705 | 2,336,059 |
| Total Increase (Decrease) | 4,297,773 | 5,024,126 |
| Net Assets | ||
| Beginning of Period | 20,021,580 | 14,997,454 |
| End of Period2 | 24,319,353 | 20,021,580 |
1 Includes fiscal 2013 and 2012 short-term gain distributions totaling $18,440,000 and $16,898,000, respectively. Short-term gain distributions are treated as ordinary income dividends for tax purposes.
2 Net Assets—End of Period includes undistributed net investment income of $93,985,000 and $288,040,000.
See accompanying Notes, which are an integral part of the Financial Statements.
48
Target Retirement 2025 Fund
| Financial Highlights | ||||||
| Six Months | ||||||
| Ended | ||||||
| For a Share Outstanding | March 31, | Year Ended September 30, | ||||
| Throughout Each Period | 2013 | 2012 | 2011 | 2010 | 2009 | 2008 |
| Net Asset Value, Beginning of Period | $13.70 | $11.71 | $11.97 | $11.11 | $11.49 | $14.26 |
| Investment Operations | ||||||
| Net Investment Income | .155 | .331 | .2571 | .262 | .279 | .307 |
| Capital Gain Distributions Received | .022 | .036 | .0201 | — | — | — |
| Net Realized and Unrealized Gain (Loss) | ||||||
| on Investments | .841 | 1.927 | (.271) | .850 | (.336) | (2.767) |
| Total from Investment Operations | 1.018 | 2.294 | .006 | 1.112 | (.057) | (2.460) |
| Distributions | ||||||
| Dividends from Net Investment Income | (.296) | (.291) | (.250) | (.252) | (.323) | (.310) |
| Distributions from Realized Capital Gains | (.012) | (.013) | (.016) | — | — | — |
| Total Distributions | (.308) | (.304) | (.266) | (.252) | (.323) | (.310) |
| Net Asset Value, End of Period | $14.41 | $13.70 | $11.71 | $11.97 | $11.11 | $11.49 |
| Total Return2 | 7.59% | 19.89% | -0.11% | 10.12% | 0.10% | -17.61% |
| Ratios/Supplemental Data | ||||||
| Net Assets, End of Period (Millions) | $24,319 | $20,022 | $14,997 | $13,652 | $9,932 | $7,769 |
| Ratio of Total Expenses to | ||||||
| Average Net Assets | — | — | — | — | — | — |
| Acquired Fund Fees and Expenses | 0.17% | 0.17% | 0.18% | 0.18% | 0.21% | 0.18% |
| Ratio of Net Investment Income to | ||||||
| Average Net Assets | 2.40% | 2.64% | 2.01% | 2.42% | 3.09% | 2.59% |
| Portfolio Turnover Rate | 2% | 9% | 23%3 | 11% | 21%4 | 17% |
The expense ratio, acquired fund fees and expenses, net income ratio, and turnover rate for the current period have been annualized.
1 Calculated based on average shares outstanding.
2 Total returns do not include account service fees that may have applied in the periods shown. Fund prospectuses provide information about any applicable account service fees.
3 Excludes the value of mutual fund shares delivered and received in connection with a change in the fund’s international equity investments from Vanguard European, Pacific, and Emerging Markets Stock Index Funds to Vanguard Total International Stock Index Fund because those transactions were effected in kind and did not cause the fund to incur transaction costs.
4 Excludes the value of mutual fund shares delivered and received in connection with a change in the fund’s bond investments from Vanguard Total Bond Market Index Fund to Vanguard Total Bond Market II Index Fund because those transactions were effected in kind and did not cause the fund to incur transaction costs.
See accompanying Notes, which are an integral part of the Financial Statements.
49
Target Retirement 2025 Fund
Notes to Financial Statements
Vanguard Target Retirement 2025 Fund is registered under the Investment Company Act of 1940 as an open-end investment company, or mutual fund. The fund follows a balanced investment strategy by investing in selected Vanguard funds to achieve its targeted allocation of assets to U.S. stocks, international stocks, and bonds.
A. The following significant accounting policies conform to generally accepted accounting principles for U.S. mutual funds. The fund consistently follows such policies in preparing its financial statements.
1. Security Valuation: Investments are valued at the net asset value of each underlying Vanguard fund determined as of the close of the New York Stock Exchange (generally 4 p.m., Eastern time) on the valuation date. See Note C.
2. Federal Income Taxes: The fund intends to continue to qualify as a regulated investment company and distribute all of its taxable income. Management has analyzed the fund’s tax positions taken for all open federal income tax years (September 30, 2009–2012), and for the period ended March 31, 2013, and has concluded that no provision for federal income tax is required in the fund’s financial statements.
3. Distributions: Distributions to shareholders are recorded on the ex-dividend date.
4. Other: Income and capital gain distributions received are recorded on the ex-dividend date. Security transactions are accounted for on the date securities are bought or sold. Costs used to determine realized gains (losses) on the sale of investment securities are those of the specific securities sold.
B. Under a service agreement, The Vanguard Group furnishes investment advisory, corporate management, administrative, marketing, and distribution services to the fund. The service agreement provides that the fund’s expenses may be reduced or eliminated to the extent of savings realized by the Vanguard funds by the operation of the fund. Accordingly, all incremental expenses for services provided by Vanguard and all other expenses incurred by the fund during the period ended March 31, 2013, were borne by the funds in which the fund invests. The fund’s trustees and officers are also directors and officers of Vanguard and the funds in which the fund invests.
C. Various inputs may be used to determine the value of the fund’s investments. These inputs are summarized in three broad levels for financial statement purposes. The inputs or methodologies used to value securities are not necessarily an indication of the risk associated with investing in those securities.
Level 1—Quoted prices in active markets for identical securities.
Level 2—Other significant observable inputs (including quoted prices for similar securities, interest rates, prepayment speeds, credit risk, etc.).
Level 3—Significant unobservable inputs (including the fund’s own assumptions used to determine the fair value of investments).
The following table summarizes the market value of the fund’s investments as of March 31, 2013, based on the inputs used to value them:
| Level 1 | Level 2 | Level 3 | |
| Investments | ($000) | ($000) | ($000) |
| Investment Companies | 19,258,677 | 5,064,642 | — |
50
Target Retirement 2025 Fund
The fund’s investment in Vanguard Total International Stock Index Fund is normally valued based on Level 1 inputs but was valued in this report based on Level 2 inputs. The most recent quoted net asset value for this underlying fund was as of March 28, 2013. For financial statement purposes, this net asset value was adjusted to revalue certain of the fund’s securities based on March 29, 2013, closing prices because their local markets were open while U.S. markets were closed.
D. Distributions are determined on a tax basis and may differ from net investment income and realized capital gains for financial reporting purposes. Differences may be permanent or temporary. Permanent differences are reclassified among capital accounts in the financial statements to reflect their tax character. Temporary differences arise when certain items of income, expense, gain, or loss are recognized in different periods for financial statement and tax purposes; these differences will reverse at some time in the future. Differences in classification may also result from the treatment of short-term gains as ordinary income for tax purposes.
The fund’s tax-basis capital gains and losses are determined only at the end of each fiscal year. For tax purposes, at September 30, 2012, the fund had available capital losses totaling $74,491,000 to offset future net capital gains. Of this amount, $7,742,000 is subject to expiration on September 30, 2018. Capital losses of $66,749,000 realized beginning in fiscal 2012 may be carried forward indefinitely under the Regulated Investment Company Modernization Act of 2010, but must be used before any expiring loss carryforwards. The fund will use these capital losses to offset net taxable capital gains, if any, realized during the year ending September 30, 2013; should the fund realize net capital losses for the year, the losses will be added to the loss carryforward balance above. Short-term capital gain distributions received are treated as ordinary income for tax purposes, and cannot be offset by capital losses. Capital gain distributions paid during the six months ended March 31, 2013, are from short-term gain distributions received from Vanguard Total Bond Market II Index Fund.
At March 31, 2013, the cost of investment securities for tax purposes was $20,678,288,000. Net unrealized appreciation of investment securities for tax purposes was $3,645,031,000, consisting entirely of unrealized gains on securities that had risen in value since their purchase.
E. During the six months ended March 31, 2013, the fund purchased $3,170,327,000 of investment securities and sold $182,085,000 of investment securities, other than temporary cash investments.
F. Capital shares issued and redeemed were:
| Six Months Ended | Year Ended | |
| March 31, 2013 | September 30, 2012 | |
| Shares | Shares | |
| (000) | (000) | |
| Issued | 273,710 | 369,649 |
| Issued in Lieu of Cash Distributions | 34,790 | 31,883 |
| Redeemed | (81,992) | (220,958) |
| Net Increase (Decrease) in Shares Outstanding | 226,508 | 180,574 |
51
Target Retirement 2025 Fund
G. In preparing the financial statements as of March 31, 2013, management considered the impact of subsequent events for potential recognition or disclosure in these financial statements.
In February 2013, Vanguard announced plans to reallocate 20% of the fund’s fixed income exposure to foreign bonds, through an investment in Vanguard Total International Bond Index Fund. The fund’s overall fixed income allocation and its strategic asset allocation are not changing. The transition is expected to be completed by June 30, 2013.
52
Target Retirement 2030 Fund
Fund Profile
As of March 31, 2013
| Total Fund Characteristics | |
| Ticker Symbol | VTHRX |
| 30-Day SEC Yield | 2.06% |
| Acquired Fund Fees and Expenses1 | 0.17% |
| Allocation to Underlying Vanguard Funds | |
| Vanguard Total Stock Market Index Fund | |
| Investor Shares | 55.1% |
| Vanguard Total International Stock Index | |
| Fund Investor Shares | 23.0% |
| Vanguard Total Bond Market II Index Fund | |
| Investor Shares | 21.9% |
| Total Fund Volatility Measures | ||
| Target 2030 | MSCI US | |
| Composite | Broad Market | |
| Index | Index | |
| R-Squared | 1.00 | 0.98 |
| Beta | 1.00 | 0.82 |
These measures show the degree and timing of the fund’s fluctuations compared with the indexes over 36 months.
Fund Asset Allocation
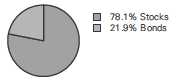
1 This figure—drawn from the prospectus dated January 28, 2013—represents an estimate of the weighted average of the expense ratios and any transaction fees charged by the underlying mutual funds (the ”acquired” funds) in which the Target Retirement 2030 Fund invests. The fund does not charge any expenses or fees of its own. For the six months ended March 31, 2013, the annualized acquired fund fees and expenses were 0.17%.
53
Target Retirement 2030 Fund
Performance Summary
All of the returns in this report represent past performance, which is not a guarantee of future results that may be achieved by the fund. (Current performance may be lower or higher than the performance data cited. For performance data current to the most recent month-end, visit our website at vanguard.com/performance.) Note, too, that both investment returns and principal value can fluctuate widely, so an investor’s shares, when sold, could be worth more or less than their original cost. The returns shown do not reflect taxes that a shareholder would pay on fund distributions or on the sale of fund shares.
Fiscal-Year Total Returns (%): June 7, 2006, Through March 31, 2013

| Average Annual Total Returns: Periods Ended March 31, 2013 | ||||||
| Since Inception | ||||||
| Inception Date | One Year | Five Years | Income | Capital | Total | |
| Target Retirement 2030 | ||||||
| Fund | 6/7/2006 | 10.70% | 4.86% | 2.06% | 3.32% | 5.38% |
See Financial Highlights for dividend and capital gains information.
54
Target Retirement 2030 Fund
Financial Statements (unaudited)
Statement of Net Assets
As of March 31, 2013
The fund reports a complete list of its holdings in regulatory filings four times in each fiscal year, at the quarter-ends. For the second and fourth fiscal quarters, the lists appear in the fund’s semiannual and annual reports to shareholders. For the first and third fiscal quarters, the fund files the lists with the Securities and Exchange Commission on Form N-Q. Shareholders can look up the fund’s Forms N-Q on the SEC’s website at sec.gov. Forms N-Q may also be reviewed and copied at the SEC’s Public Reference Room (see the back cover of this report for further information).
| Market | ||
| Value | ||
| Shares | ($000) | |
| Investment Companies (100.0%) | ||
| U.S. Stock Fund (55.1%) | ||
| Vanguard Total Stock Market Index Fund Investor Shares | 227,408,807 | 8,957,633 |
| International Stock Fund (23.0%) | ||
| Vanguard Total International Stock Index Fund Investor Shares | 243,456,668 | 3,741,929 |
| Bond Fund (21.9%) | ||
| 1 Vanguard Total Bond Market II Index Fund Investor Shares | 325,677,760 | 3,553,144 |
| Total Investment Companies (100.0%) (Cost $13,884,807) | 16,252,706 | |
| Other Assets and Liabilities (0.0%) | ||
| Other Assets | 67,310 | |
| Liabilities | (73,597) | |
| (6,287) | ||
| Net Assets (100%) | ||
| Applicable to 651,650,100 outstanding $.001 par value shares of | ||
| beneficial interest (unlimited authorization) | 16,246,419 | |
| Net Asset Value Per Share | $24.93 | |
| At March 31, 2013, net assets consisted of: | |
| Amount | |
| ($000) | |
| Paid-in Capital | 13,816,402 |
| Undistributed Net Investment Income | 60,531 |
| Accumulated Net Realized Gains | 1,587 |
| Unrealized Appreciation (Depreciation) | 2,367,899 |
| Net Assets | 16,246,419 |
See Note A in Notes to Financial Statements.
1 Affiliated fund available only to Vanguard funds and certain trusts and accounts managed by Vanguard.
See accompanying Notes, which are an integral part of the Financial Statements.
55
Target Retirement 2030 Fund
| Statement of Operations | |
| Six Months Ended | |
| March 31, 2013 | |
| ($000) | |
| Investment Income | |
| Income | |
| Income Distributions Received | 172,853 |
| Net Investment Income—Note B | 172,853 |
| Realized Net Gain (Loss) | |
| Capital Gain Distributions Received | 16,847 |
| Investment Securities Sold | 7,731 |
| Realized Net Gain (Loss) | 24,578 |
| Change in Unrealized Appreciation (Depreciation) of Investment Securities | 984,002 |
| Net Increase (Decrease) in Net Assets Resulting from Operations | 1,181,433 |
See accompanying Notes, which are an integral part of the Financial Statements.
56
Target Retirement 2030 Fund
| Statement of Changes in Net Assets | ||
| Six Months Ended | Year Ended | |
| March 31, | September 30, | |
| 2013 | 2012 | |
| ($000) | ($000) | |
| Increase (Decrease) in Net Assets | ||
| Operations | ||
| Net Investment Income | 172,853 | 282,814 |
| Realized Net Gain (Loss) | 24,578 | 35,619 |
| Change in Unrealized Appreciation (Depreciation) | 984,002 | 1,624,548 |
| Net Increase (Decrease) in Net Assets Resulting from Operations | 1,181,433 | 1,942,981 |
| Distributions | ||
| Net Investment Income | (289,859) | (204,000) |
| Realized Capital Gain1 | (8,713) | (7,410) |
| Total Distributions | (298,572) | (211,410) |
| Capital Share Transactions | ||
| Issued | 3,257,533 | 3,986,357 |
| Issued in Lieu of Cash Distributions | 294,846 | 209,803 |
| Redeemed | (835,729) | (1,525,373) |
| Net Increase (Decrease) from Capital Share Transactions | 2,716,650 | 2,670,787 |
| Total Increase (Decrease) | 3,599,511 | 4,402,358 |
| Net Assets | ||
| Beginning of Period | 12,646,908 | 8,244,550 |
| End of Period2 | 16,246,419 | 12,646,908 |
1 Includes fiscal 2013 and 2012 short-term gain distributions totaling $8,713,000 and $7,410,000, respectively. Short-term gain distributions are treated as ordinary income dividends for tax purposes.
2 Net Assets—End of Period includes undistributed net investment income of $60,531,000 and $177,537,000.
See accompanying Notes, which are an integral part of the Financial Statements.
57
Target Retirement 2030 Fund
| Financial Highlights | ||||||
| Six Months | ||||||
| Ended | ||||||
| For a Share Outstanding | March 31, | Year Ended September 30, | ||||
| Throughout Each Period | 2013 | 2012 | 2011 | 2010 | 2009 | 2008 |
| Net Asset Value, Beginning of Period | $23.51 | $19.81 | $20.36 | $18.84 | $19.63 | $24.74 |
| Investment Operations | ||||||
| Net Investment Income | .262 | .561 | .398 | .4531 | .4661 | .5221 |
| Capital Gain Distributions Received | .028 | .044 | .011 | — | — | — |
| Net Realized and Unrealized Gain (Loss) | ||||||
| on Investments | 1.644 | 3.580 | (.542) | 1.453 | (.793) | (5.262) |
| Total from Investment Operations | 1.934 | 4.185 | (.133) | 1.906 | (.327) | (4.740) |
| Distributions | ||||||
| Dividends from Net Investment Income | (.499) | (.468) | (.395) | (.386) | (.463) | (.370) |
| Distributions from Realized Capital Gains | (.015) | (.017) | (.022) | — | — | — |
| Total Distributions | (.514) | (.485) | (.417) | (.386) | (.463) | (.370) |
| Net Asset Value, End of Period | $24.93 | $23.51 | $19.81 | $20.36 | $18.84 | $19.63 |
| Total Return2 | 8.40% | 21.43% | -0.83% | 10.21% | -1.13% | -19.43% |
| Ratios/Supplemental Data | ||||||
| Net Assets, End of Period (Millions) | $16,246 | $12,647 | $8,245 | $6,533 | $4,003 | $2,359 |
| Ratio of Total Expenses to | ||||||
| Average Net Assets | — | — | — | — | — | — |
| Acquired Fund Fees and Expenses | 0.17% | 0.17% | 0.18% | 0.19% | 0.21% | 0.19% |
| Ratio of Net Investment Income to | ||||||
| Average Net Assets | 2.44% | 2.66% | 1.91% | 2.32% | 2.92% | 2.35% |
| Portfolio Turnover Rate | 2% | 4% | 19%3 | 9% | 13%4 | 6% |
The expense ratio, acquired fund fees and expenses, net income ratio, and turnover rate for the current period have been annualized.
1 Calculated based on average shares outstanding.
2 Total returns do not include account service fees that may have applied in the periods shown. Fund prospectuses provide information about any applicable account service fees.
3 Excludes the value of mutual fund shares delivered and received in connection with a change in the fund’s international equity investments from Vanguard European, Pacific, and Emerging Markets Stock Index Funds to Vanguard Total International Stock Index Fund because those transactions were effected in kind and did not cause the fund to incur transaction costs.
4 Excludes the value of mutual fund shares delivered and received in connection with a change in the fund’s bond investments from Vanguard Total Bond Market Index Fund to Vanguard Total Bond Market II Index Fund because those transactions were effected in kind and did not cause the fund to incur transaction costs.
See accompanying Notes, which are an integral part of the Financial Statements.
58
Target Retirement 2030 Fund
Notes to Financial Statements
Vanguard Target Retirement 2030 Fund is registered under the Investment Company Act of 1940 as an open-end investment company, or mutual fund. The fund follows a balanced investment strategy by investing in selected Vanguard funds to achieve its targeted allocation of assets to U.S. stocks, international stocks, and bonds.
A. The following significant accounting policies conform to generally accepted accounting principles for U.S. mutual funds. The fund consistently follows such policies in preparing its financial statements.
1. Security Valuation: Investments are valued at the net asset value of each underlying Vanguard fund determined as of the close of the New York Stock Exchange (generally 4 p.m., Eastern time) on the valuation date. See Note C.
2. Federal Income Taxes: The fund intends to continue to qualify as a regulated investment company and distribute all of its taxable income. Management has analyzed the fund’s tax positions taken for all open federal income tax years (September 30, 2009–2012), and for the period ended March 31, 2013, and has concluded that no provision for federal income tax is required in the fund’s financial statements.
3. Distributions: Distributions to shareholders are recorded on the ex-dividend date.
4. Other: Income and capital gain distributions received are recorded on the ex-dividend date. Security transactions are accounted for on the date securities are bought or sold. Costs used to determine realized gains (losses) on the sale of investment securities are those of the specific securities sold.
B. Under a service agreement, The Vanguard Group furnishes investment advisory, corporate management, administrative, marketing, and distribution services to the fund. The service agreement provides that the fund’s expenses may be reduced or eliminated to the extent of savings realized by the Vanguard funds by the operation of the fund. Accordingly, all incremental expenses for services provided by Vanguard and all other expenses incurred by the fund during the period ended March 31, 2013, were borne by the funds in which the fund invests. The fund’s trustees and officers are also directors and officers of Vanguard and the funds in which the fund invests.
C. Various inputs may be used to determine the value of the fund’s investments. These inputs are summarized in three broad levels for financial statement purposes. The inputs or methodologies used to value securities are not necessarily an indication of the risk associated with investing in those securities.
Level 1—Quoted prices in active markets for identical securities.
Level 2—Other significant observable inputs (including quoted prices for similar securities, interest rates, prepayment speeds, credit risk, etc.).
Level 3—Significant unobservable inputs (including the fund’s own assumptions used to determine the fair value of investments).
The following table summarizes the market value of the fund’s investments as of March 31, 2013, based on the inputs used to value them:
| Level 1 | Level 2 | Level 3 | |
| Investments | ($000) | ($000) | ($000) |
| Investment Companies | 12,510,777 | 3,741,929 | — |
59
Target Retirement 2030 Fund
The fund’s investment in Vanguard Total International Stock Index Fund is normally valued based on Level 1 inputs but was valued in this report based on Level 2 inputs. The most recent quoted net asset value for this underlying fund was as of March 28, 2013. For financial statement purposes, this net asset value was adjusted to revalue certain of the fund’s securities based on March 29, 2013, closing prices because their local markets were open while U.S. markets were closed.
D. Distributions are determined on a tax basis and may differ from net investment income and realized capital gains for financial reporting purposes. Differences may be permanent or temporary. Permanent differences are reclassified among capital accounts in the financial statements to reflect their tax character. Temporary differences arise when certain items of income, expense, gain, or loss are recognized in different periods for financial statement and tax purposes; these differences will reverse at some time in the future. Differences in classification may also result from the treatment of short-term gains as ordinary income for tax purposes.
The fund’s tax-basis capital gains and losses are determined only at the end of each fiscal year. For tax purposes, at September 30, 2012, the fund had available capital losses totaling $7,257,000 that may be carried forward indefinitely to offset future capital gains. The fund will use these capital losses to offset net taxable capital gains, if any, realized during the year ending September 30, 2013; should the fund realize net capital losses for the year, the losses will be added to the loss carryforward balance above. Short-term capital gain distributions received are treated as ordinary income for tax purposes, and cannot be offset by capital losses. Capital gain distributions paid during the six months ended March 31, 2013, are from short-term gain distributions received from Vanguard Total Bond Market II Index Fund.
At March 31, 2013, the cost of investment securities for tax purposes was $13,884,807,000. Net unrealized appreciation of investment securities for tax purposes was $2,367,899,000, consisting entirely of unrealized gains on securities that had risen in value since their purchase.
E. During the six months ended March 31, 2013, the fund purchased $2,788,837,000 of investment securities and sold $156,027,000 of investment securities, other than temporary cash investments.
F. Capital shares issued and redeemed were:
| Six Months Ended | Year Ended | |
| March 31, 2013 | September 30, 2012 | |
| Shares | Shares | |
| (000) | (000) | |
| Issued | 135,990 | 180,472 |
| Issued in Lieu of Cash Distributions | 12,747 | 10,019 |
| Redeemed | (34,944) | (68,762) |
| Net Increase (Decrease) in Shares Outstanding | 113,793 | 121,729 |
G. In preparing the financial statements as of March 31, 2013, management considered the impact of subsequent events for potential recognition or disclosure in these financial statements.
In February 2013, Vanguard announced plans to reallocate 20% of the fund’s fixed income exposure to foreign bonds, through an investment in Vanguard Total International Bond Index Fund. The fund’s overall fixed income allocation and its strategic asset allocation are not changing. The transition is expected to be completed by June 30, 2013.
60
About Your Fund’s Expenses
As a shareholder of the fund, you incur ongoing costs, which include costs for portfolio management, administrative services, and shareholder reports (like this one), among others. Operating expenses, which are deducted from a fund’s gross income, directly reduce the investment return of the fund.
A typical fund’s expenses are expressed as a percentage of its average net assets. The Target Retirement Funds have no direct expenses, but each fund bears its proportionate share of the costs for the underlying funds in which it invests. These indirect expenses make up the acquired fund fees and expenses, also expressed as a percentage of average net assets.
The following examples are intended to help you understand the ongoing cost (in dollars) of investing in your fund and to compare these costs with those of other mutual funds. The examples are based on an investment of $1,000 made at the beginning of the period shown and held for the entire period. The costs were calculated using the acquired fund fees and expenses for each Target Retirement Fund.
The accompanying table illustrates your fund’s costs in two ways:
• Based on actual fund return. This section helps you to estimate the actual expenses that you paid over the period. The ”Ending Account Value“ shown is derived from the fund‘s actual return, and the third column shows the dollar amount that would have been paid by an investor who started with $1,000 in the fund. You may use the information here, together with the amount you invested, to estimate the expenses that you paid over the period.
To do so, simply divide your account value by $1,000 (for example, an $8,600 account value divided by $1,000 = 8.6), then multiply the result by the number given for your fund under the heading ”Expenses Paid During Period.“
• Based on hypothetical 5% yearly return. This section is intended to help you compare your fund‘s costs with those of other mutual funds. It assumes that the fund had a yearly return of 5% before expenses, but that the expense ratio is unchanged. In this case—because the return used is not the fund’s actual return—the results do not apply to your investment. The example is useful in making comparisons because the Securities and Exchange Commission requires all mutual funds to calculate expenses based on a 5% return. You can assess your fund’s costs by comparing this hypothetical example with the hypothetical examples that appear in shareholder reports of other funds.
Note that the expenses shown in the table are meant to highlight and help you compare ongoing costs only and do not reflect transaction costs incurred by the fund for buying and selling securities. Further, the expenses do not include any purchase, redemption, or account service fees described in the fund prospectus. If such fees were applied to your account, your costs would be higher. Your fund does not carry a “sales load.”
The calculations assume no shares were bought or sold during the period. Your actual costs may have been higher or lower, depending on the amount of your investment and the timing of any purchases or redemptions.
You can find more information about the fund’s expenses, including annual expense ratios, in the Financial Statements section of this report. For additional information on operating expenses and other shareholder costs, please refer to your fund’s current prospectus.
61
| Six Months Ended March 31, 2013 | |||
| Beginning | Ending | Expenses | |
| Account Value | Account Value | Paid During | |
| 9/30/2012 | 3/31/2013 | Period | |
| Based on Actual Fund Return | |||
| Target Retirement Income Fund | $1,000.00 | $1,032.76 | $0.81 |
| Target Retirement 2010 Fund | $1,000.00 | $1,045.84 | $0.82 |
| Target Retirement 2015 Fund | $1,000.00 | $1,058.56 | $0.82 |
| Target Retirement 2020 Fund | $1,000.00 | $1,067.69 | $0.82 |
| Target Retirement 2025 Fund | $1,000.00 | $1,075.89 | $0.88 |
| Target Retirement 2030 Fund | $1,000.00 | $1,083.96 | $0.88 |
| Based on Hypothetical 5% Yearly Return | |||
| Target Retirement Income Fund | $1,000.00 | $1,024.13 | $0.81 |
| Target Retirement 2010 Fund | $1,000.00 | $1,024.13 | $0.81 |
| Target Retirement 2015 Fund | $1,000.00 | $1,024.13 | $0.81 |
| Target Retirement 2020 Fund | $1,000.00 | $1,024.13 | $0.81 |
| Target Retirement 2025 Fund | $1,000.00 | $1,024.08 | $0.86 |
| Target Retirement 2030 Fund | $1,000.00 | $1,024.08 | $0.86 |
The calculations are based on the acquired fund fees and expenses for the most recent six-month period. The funds’ annualized expense figures for that period are (in order as listed from top to bottom above) 0.16%, 0.16%, 0.16%, 0.16%, 0.17%, and 0.17%. The dollar amounts shown as ”Expenses Paid” are equal to the annualized expense figures for the underlying funds multiplied by the average account value over the period, multiplied by the number of days in the most recent six-month period, then divided by the number of days in the most recent 12-month period.
62
Trustees Approve Advisory Arrangement
The board of trustees of Vanguard Target Retirement Funds has renewed the funds’ investment advisory arrangement with The Vanguard Group, Inc. (Vanguard). Vanguard—through its Equity Investment Group—serves as the investment advisor to the funds. The board determined that continuing the funds’ internalized management structure was in the best interests of the funds and their shareholders.
The board based its decision upon an evaluation of the advisor’s investment staff, portfolio management process, and performance. The trustees considered the factors discussed below, among others. However, no single factor determined whether the board approved the arrangement. Rather, it was the totality of the circumstances that drove the board’s decision.
Nature, extent, and quality of services
The board considered the quality of the funds’ investment management services over both the short and long term, and took into account the organizational depth and stability of the advisor. The board noted that Vanguard has been managing investments for more than three decades. The Equity Investment Group adheres to a sound, disciplined investment management process; the team has considerable experience, stability, and depth.
The board concluded that Vanguard’s experience, stability, depth, and performance, among other factors, warranted continuation of the advisory arrangement.
Investment performance
The board considered the performance of the funds, including any periods of outperformance or underperformance relative to a benchmark index and peer groups. The board concluded that the performance was such that the advisory arrangement should continue. Information about each fund’s most recent performance can be found in the Performance Summary pages of this report.
Cost
The board concluded that the funds’ acquired fund fees and expenses were well below the average expense ratios charged by funds in their respective peer groups. The funds do not incur advisory expenses directly; however; the board noted that each of the underlying funds in which the funds invest has advisory expenses well below the relevant peer-group average. Information about the funds’ acquired fund fees and expenses appears in the About Your Fund’s Expenses section of this report as well as in the Financial Statements sections.
The board does not conduct a profitability analysis of Vanguard, because of Vanguard’s unique “at-cost” structure. Unlike most other mutual fund management companies, Vanguard is owned by the funds it oversees, and produces “profits” only in the form of reduced expenses for fund shareholders.
The benefit of economies of scale
The board concluded that Vanguard’s at-cost arrangement with the Target Retirement Funds and their underlying funds ensures that the funds will realize economies of scale as they grow, with the cost to shareholders declining as fund assets increase.
The board will consider whether to renew the advisory arrangement again after a one-year period.
63
Glossary
30-Day SEC Yield. A fund’s 30-day SEC yield is derived using a formula specified by the U.S. Securities and Exchange Commission. Under the formula, data related to the fund’s security holdings in the previous 30 days are used to calculate the fund’s hypothetical net income for that period, which is then annualized and divided by the fund’s estimated average net assets over the calculation period. For the purposes of this calculation, a security’s income is based on its current market yield to maturity (for bonds), its actual income (for asset-backed securities), or its projected dividend yield (for stocks). Because the SEC yield represents hypothetical annualized income, it will differ—at times significantly—from the fund’s actual experience. As a result, the fund’s income distributions may be higher or lower than implied by the SEC yield.
Acquired Fund Fees and Expenses. Funds that invest in other Vanguard funds incur no direct expenses, but they do bear proportionate shares of the operating, administrative, and advisory expenses of the underlying funds, and they must pay any fees charged by those funds. The figure for acquired fund fees and expenses represents a weighted average of these underlying costs. Acquired is a term that the Securities and Exchange Commission applies to any mutual fund whose shares are owned by another fund.
Beta. A measure of the magnitude of a fund’s past share-price fluctuations in relation to the ups and downs of a given market index. The index is assigned a beta of 1.00. Compared with a given index, a fund with a beta of 1.20 typically would have seen its share price rise or fall by 12% when the index rose or fell by 10%. For this report, beta is based on returns over the past 36 months for both the fund and the index. Note that a fund’s beta should be reviewed in conjunction with its R-squared (see definition). The lower the R-squared, the less correlation there is between the fund and the index, and the less reliable beta is as an indicator of volatility.
Expense Ratio. A fund’s total annual operating expenses expressed as a percentage of the fund’s average net assets. The expense ratio includes management and administrative expenses, but does not include the transaction costs of buying and selling portfolio securities.
Inception Date. The date on which the assets of a fund (or one of its share classes) are first invested in accordance with the fund’s investment objective. For funds with a subscription period, the inception date is the day after that period ends. Investment performance is measured from the inception date.
R-Squared. A measure of how much of a fund’s past returns can be explained by the returns from the market in general, as measured by a given index. If a fund’s total returns were precisely synchronized with an index’s returns, its R-squared would be 1.00. If the fund’s returns bore no relationship to the index’s returns, its R-squared would be 0. For this report, R-squared is based on returns over the past 36 months for both the fund and the index.
64
Benchmark Information
Target 2010 Composite Index: Derived by applying the fund’s target asset allocation to the results of the following benchmarks: for international stocks of developed markets, the MSCI EAFE Index through December 15, 2010, and the MSCI ACWI ex USA IMI Index thereafter; for emerging markets stocks, the Select Emerging Markets Index through August 23, 2006, the MSCI Emerging Markets Index through December 15, 2010, and the MSCI ACWI ex USA IMI Index thereafter; for bonds, the Barclays U.S. Aggregate Bond Index through December 31, 2009, and the Barclays U.S. Aggregate Float Adjusted Index thereafter, as well as the Barclays U.S. Treasury Inflation Protected Securities Index; for short-term reserves, the Citigroup Three-Month Treasury Bill Index; and for U.S. stocks, the MSCI US Broad Market Index. MSCI international benchmark returns are adjusted for withholding taxes.
Target 2015 Composite Index: Derived by applying the fund’s target asset allocation to the results of the following benchmarks: for international stocks of developed markets, the MSCI EAFE Index through December 15, 2010, and the MSCI ACWI ex USA IMI Index thereafter; for emerging markets stocks, the Select Emerging Markets Index through August 23, 2006, the MSCI Emerging Markets Index through December 15, 2010, and the MSCI ACWI ex USA IMI Index thereafter; for bonds, the Barclays U.S. Aggregate Bond Index through December 31, 2009, and the Barclays U.S. Aggregate Float Adjusted Index thereafter, as well as the Barclays U.S. Treasury Inflation Protected Securities Index; and for U.S. stocks, the Dow Jones Wilshire 5000 Index through April 22, 2005, and the MSCI US Broad Market Index thereafter. MSCI international benchmark returns are adjusted for withholding taxes.
Target 2020 Composite Index: Derived by applying the fund’s target asset allocation to the results of the following benchmarks: for international stocks of developed markets, the MSCI EAFE Index through December 15, 2010, and the MSCI ACWI ex USA IMI Index thereafter; for emerging markets stocks, the Select Emerging Markets Index through August 23, 2006, the MSCI Emerging Markets Index through December 15, 2010, and the MSCI ACWI ex USA IMI Index thereafter; for bonds, the Barclays U.S. Aggregate Bond Index through December 31, 2009, and the Barclays U.S. Aggregate Float Adjusted Index thereafter; and for U.S. stocks, the MSCI US Broad Market Index. MSCI international benchmark returns are adjusted for withholding taxes.
Target 2025 Composite Index: Derived by applying the fund’s target asset allocation to the results of the following benchmarks: for international stocks of developed markets, the MSCI EAFE Index through December 15, 2010, and the MSCI ACWI ex USA IMI Index thereafter; for emerging markets stocks, the Select Emerging Markets Index through August 23, 2006, the MSCI Emerging Markets Index through December 15, 2010, and the MSCI ACWI ex USA IMI Index thereafter; for bonds, the Barclays U.S. Aggregate Bond Index through December 31, 2009, and the Barclays U.S. Aggregate Float Adjusted Index thereafter; and for U.S. stocks, the Dow Jones Wilshire 5000 Index through April 22, 2005, and the MSCI US Broad Market Index thereafter. MSCI international benchmark returns are adjusted for withholding taxes.
65
Target 2030 Composite Index: Derived by applying the fund’s target asset allocation to the results of the following benchmarks: for international stocks of developed markets, the MSCI EAFE Index through December 15, 2010, and the MSCI ACWI ex USA IMI Index thereafter; for emerging markets stocks, the Select Emerging Markets Index through August 23, 2006, the MSCI Emerging Markets Index through December 15, 2010, and the MSCI ACWI ex USA IMI Index thereafter; for bonds, the Barclays U.S. Aggregate Bond Index through December 31, 2009, and the Barclays U.S. Aggregate Float Adjusted Index thereafter; and for U.S. stocks, the MSCI US Broad Market Index. MSCI international benchmark returns are adjusted for withholding taxes.
Target Income Composite Index: Derived by applying the fund’s target asset allocation to the results of the following benchmarks: for international stocks of developed markets, the MSCI EAFE Index through December 15, 2010, and the MSCI ACWI ex USA IMI Index thereafter; for emerging markets stocks, the Select Emerging Markets Index through August 23, 2006, the MSCI Emerging Markets Index through December 15, 2010, and the MSCI ACWI ex USA IMI Index thereafter; for bonds, the Barclays U.S. Aggregate Bond Index through December 31, 2009, and the Barclays U.S. Aggregate Float Adjusted Index thereafter, as well as the Barclays U.S. Treasury Inflation Protected Securities Index; for short-term reserves, the Citigroup Three-Month Treasury Bill Index; and for U.S. stocks, the Dow Jones Wilshire 5000 Index through April 22, 2005, and the MSCI US Broad Market Index thereafter. MSCI international benchmark returns are adjusted for withholding taxes.
66
This page intentionally left blank.
The People Who Govern Your Fund
The trustees of your mutual fund are there to see that the fund is operated and managed in your best interests since, as a shareholder, you are a part owner of the fund. Your fund’s trustees also serve on the board of directors of The Vanguard Group, Inc., which is owned by the Vanguard funds and provides services to them on an at-cost basis.
A majority of Vanguard’s board members are independent, meaning that they have no affiliation with Vanguard or the funds they oversee, apart from the sizable personal investments they have made as private individuals. The independent board members have distinguished backgrounds in business, academia, and public service. Each of the trustees and executive officers oversees 180 Vanguard funds.
The following table provides information for each trustee and executive officer of the fund. More information about the trustees is in the Statement of Additional Information, which can be obtained, without charge, by contacting Vanguard at 800-662-7447, or online at vanguard.com.
| InterestedTrustee1 | and Delphi Automotive LLP (automotive components); |
| Senior Advisor at New Mountain Capital; Trustee of | |
| F. William McNabb III | The Conference Board. |
| Born 1957. Trustee Since July 2009. Chairman of the | |
| Board. Principal Occupation(s) During the Past Five | Amy Gutmann |
| Years: Chairman of the Board of The Vanguard Group, | Born 1949. Trustee Since June 2006. Principal |
| Inc., and of each of the investment companies served | Occupation(s) During the Past Five Years: President |
| by The Vanguard Group, since January 2010; Director | of the University of Pennsylvania; Christopher H. |
| of The Vanguard Group since 2008; Chief Executive | Browne Distinguished Professor of Political Science |
| Officer and President of The Vanguard Group and of | in the School of Arts and Sciences with secondary |
| each of the investment companies served by The | appointments at the Annenberg School for |
| Vanguard Group since 2008; Director of Vanguard | Communication and the Graduate School of Education |
| Marketing Corporation; Managing Director of The | of the University of Pennsylvania; Member of the |
| Vanguard Group (1995–2008). | National Commission on the Humanities and Social |
| Sciences; Trustee of Carnegie Corporation of New | |
| IndependentTrustees | York and of the National Constitution Center; Chair |
| of the U. S. Presidential Commission for the Study | |
| of Bioethical Issues. | |
| Emerson U. Fullwood | |
| Born 1948. Trustee Since January 2008. Principal | JoAnn Heffernan Heisen |
| Occupation(s) During the Past Five Years: Executive | Born 1950. Trustee Since July 1998. Principal |
| Chief Staff and Marketing Officer for North America | Occupation(s) During the Past Five Years: Corporate |
| and Corporate Vice President (retired 2008) of Xerox | Vice President and Chief Global Diversity Officer |
| Corporation (document management products and | (retired 2008) and Member of the Executive |
| services); Executive in Residence and 2010 | Committee (1997–2008) of Johnson & Johnson |
| Distinguished Minett Professor at the Rochester | (pharmaceuticals/medical devices/consumer |
| Institute of Technology; Director of SPX Corporation | products); Director of Skytop Lodge Corporation |
| (multi-industry manufacturing), the United Way of | (hotels), the University Medical Center at Princeton, |
| Rochester, Amerigroup Corporation (managed health | the Robert Wood Johnson Foundation, and the Center |
| care), the University of Rochester Medical Center, | for Talent Innovation; Member of the Advisory Board |
| Monroe Community College Foundation, and North | of the Maxwell School of Citizenship and Public Affairs |
| Carolina A&T University. | at Syracuse University. |
| Rajiv L. Gupta | F. Joseph Loughrey |
| Born 1945. Trustee Since December 2001.2 | Born 1949. Trustee Since October 2009. Principal |
| Principal Occupation(s) During the Past Five Years: | Occupation(s) During the Past Five Years: President |
| Chairman and Chief Executive Officer (retired 2009) | and Chief Operating Officer (retired 2009) of Cummins |
| and President (2006–2008) of Rohm and Haas Co. | Inc. (industrial machinery); Chairman of the Board of |
| (chemicals); Director of Tyco International, Ltd. | Hillenbrand, Inc. (specialized consumer services); |
| (diversified manufacturing and services), Hewlett- | Director of SKF AB (industrial machinery), the Lumina |
| Packard Co. (electronic computer manufacturing), |
| Foundation for Education, and Oxfam America; | Executive Officers | |
| Chairman of the Advisory Council for the College of | ||
| Arts and Letters and Member of the Advisory Board to | Glenn Booraem | |
| the Kellogg Institute for International Studies at the | Born 1967. Controller Since July 2010. Principal | |
| University of Notre Dame. | Occupation(s) During the Past Five Years: Principal | |
| of The Vanguard Group, Inc.; Controller of each of | ||
| Mark Loughridge | the investment companies served by The Vanguard | |
| Born 1953. Trustee Since March 2012. Principal | Group; Assistant Controller of each of the investment | |
| Occupation(s) During the Past Five Years: Senior Vice | companies served by The Vanguard Group (2001–2010). | |
| President and Chief Financial Officer at IBM (information | ||
| technology services); Fiduciary Member of IBM’s | Thomas J. Higgins | |
| Retirement Plan Committee. | Born 1957. Chief Financial Officer Since September | |
| 2008. Principal Occupation(s) During the Past Five | ||
| Scott C. Malpass | Years: Principal of The Vanguard Group, Inc.; Chief | |
| Born 1962. Trustee Since March 2012. Principal | Financial Officer of each of the investment companies | |
| Occupation(s) During the Past Five Years: Chief | served by The Vanguard Group; Treasurer of each of | |
| Investment Officer and Vice President at the University | the investment companies served by The Vanguard | |
| of Notre Dame; Assistant Professor of Finance at the | Group (1998–2008). | |
| Mendoza College of Business at Notre Dame; Member | ||
| of the Notre Dame 403(b) Investment Committee; | Kathryn J. Hyatt | |
| Director of TIFF Advisory Services, Inc. (investment | Born 1955. Treasurer Since November 2008. Principal | |
| advisor); Member of the Investment Advisory | Occupation(s) During the Past Five Years: Principal of | |
| Committees of the Financial Industry Regulatory | The Vanguard Group, Inc.; Treasurer of each of the | |
| Authority (FINRA) and of Major League Baseball. | investment companies served by The Vanguard | |
| Group; Assistant Treasurer of each of the investment | ||
| André F. Perold | companies served by The Vanguard Group (1988–2008). | |
| Born 1952. Trustee Since December 2004. Principal | ||
| Occupation(s) During the Past Five Years: George | Heidi Stam | |
| Gund Professor of Finance and Banking at the Harvard | Born 1956. Secretary Since July 2005. Principal | |
| Business School (retired 2011); Chief Investment | Occupation(s) During the Past Five Years: Managing | |
| Officer and Managing Partner of HighVista Strategies | Director of The Vanguard Group, Inc.; General Counsel | |
| LLC (private investment firm); Director of Rand | of The Vanguard Group; Secretary of The Vanguard | |
| Merchant Bank; Overseer of the Museum of Fine | Group and of each of the investment companies | |
| Arts Boston. | served by The Vanguard Group; Director and Senior | |
| Vice President of Vanguard Marketing Corporation. | ||
| Alfred M. Rankin, Jr. | ||
| Born 1941. Trustee Since January 1993. Principal | Vanguard Senior ManagementTeam | |
| Occupation(s) During the Past Five Years: Chairman, | ||
| President, and Chief Executive Officer of NACCO | Mortimer J. Buckley | Chris D. McIsaac |
| Industries, Inc. (housewares/lignite) and of Hyster-Yale | Kathleen C. Gubanich | Michael S. Miller |
| Materials Handling, Inc. (forklift trucks); Director of | Paul A. Heller | James M. Norris |
| the National Association of Manufacturers; Chairman | Martha G. King | Glenn W. Reed |
| of the Board of University Hospitals of Cleveland; | John T. Marcante | |
| Advisory Chairman of the Board of The Cleveland | ||
| Museum of Art. | ||
| Chairman Emeritus and Senior Advisor | ||
| Peter F. Volanakis | John J. Brennan | |
| Born 1955. Trustee Since July 2009. Principal | Chairman, 1996–2009 | |
| Occupation(s) During the Past Five Years: President | Chief Executive Officer and President, 1996–2008 | |
| and Chief Operating Officer (retired 2010) of Corning | ||
| Incorporated (communications equipment); Director | Founder | |
| of SPX Corporation (multi-industry manufacturing); | ||
| Overseer of the Amos Tuck School of Business | John C. Bogle | |
| Administration at Dartmouth College; Advisor to the | Chairman and Chief Executive Officer, 1974–1996 | |
| Norris Cotton Cancer Center. | ||
1 Mr. McNabb is considered an “interested person,” as defined in the Investment Company Act of 1940, because he is an officer of the Vanguard funds.
2 December 2002 for Vanguard Equity Income Fund, Vanguard Growth Equity Fund, the Vanguard Municipal Bond Funds, and the Vanguard State Tax-Exempt Funds.
 | |
| P.O. Box 2600 | |
| Valley Forge, PA 19482-2600 | |
Connect with Vanguard® > vanguard.com | |
| Fund Information > 800-662-7447 Direct Investor Account Services > 800-662-2739 Institutional Investor Services > 800-523-1036 Text Telephone for People With Hearing Impairment > 800-749-7273 | |
| |
© 2013 The Vanguard Group, Inc. |
|
| Semiannual Report | March 31, 2013 |
| Vanguard Target Retirement Funds |
 |
Vanguard Target Retirement 2035 Fund |
> Global stock markets rose during the six-month period ended March 31, 2013, despite renewed uncertainties in the Eurozone.
> The U.S. taxable bond market eked out a meager advance as investors looking for higher yields shifted to stocks and away from bonds.
> All six Vanguard Target Retirement Funds discussed in this report posted strong returns for the period.
| Contents | |
| Your Fund’s Total Returns. | 1 |
| Chairman’s Letter. | 2 |
| Target Retirement 2035 Fund. | 8 |
| Target Retirement 2040 Fund. | 16 |
| Target Retirement 2045 Fund. | 24 |
| Target Retirement 2050 Fund. | 32 |
| Target Retirement 2055 Fund. | 40 |
| Target Retirement 2060 Fund. | 48 |
| About Your Fund’s Expenses. | 56 |
| Trustees Approve Advisory Arrangement. | 58 |
| Glossary. | 59 |
Please note: The opinions expressed in this report are just that—informed opinions. They should not be considered promises or advice. Also, please keep in mind that the information and opinions cover the period through the date on the front of this report. Of course, the risks of investing in your fund are spelled out in the prospectus.
See the Glossary for definitions of investment terms used in this report.
About the cover: Our cover photograph shows rigging on the HMSSurprise, a replica of an 18th-century Royal Navy frigate. It was featured in the 2003 movie Master and Commander: The Far Side of the World, which was based on Patrick O’Brian’s sea novels, set amid the Napoleonic Wars. Vanguard was named for another ship of that era, the HMSVanguard, which was the flagship of British Admiral Horatio Nelson at the Battle of the Nile.
Your Fund’s Total Returns
| Six Months Ended March 31, 2013 | |
| Total | |
| Returns | |
| Vanguard Target Retirement 2035 Fund | 9.26% |
| Target 2035 Composite Index | 9.29 |
| Mixed-Asset Target 2035 Funds Average | 8.51 |
| Mixed-Asset Target 2035 Funds Average: Derived from data provided by Lipper Inc. | |
| Vanguard Target Retirement 2040 Fund | 9.62% |
| Target 2040 Composite Index | 9.69 |
| Mixed-Asset Target 2040 Funds Average | 8.48 |
| Mixed-Asset Target 2040 Funds Average: Derived from data provided by Lipper Inc. | |
| Vanguard Target Retirement 2045 Fund | 9.58% |
| Target 2045 Composite Index | 9.69 |
| Mixed-Asset Target 2045 Funds Average | 9.16 |
| Mixed-Asset Target 2045 Funds Average: Derived from data provided by Lipper Inc. | |
| Vanguard Target Retirement 2050 Fund | 9.62% |
| Target 2050 Composite Index | 9.69 |
| Mixed-Asset Target 2050+ Funds Average | 9.17 |
| Mixed-Asset Target 2050+ Funds Average: Derived from data provided by Lipper Inc. | |
| Vanguard Target Retirement 2055 Fund | 9.60% |
| Target 2055 Composite Index | 9.69 |
| Mixed-Asset Target 2050+ Funds Average | 9.17 |
| Mixed-Asset Target 2050+ Funds Average: Derived from data provided by Lipper Inc. | |
| Vanguard Target Retirement 2060 Fund | 9.57% |
| Target 2060 Composite Index | 9.69 |
| Mixed-Asset Target 2050+ Funds Average | 9.17 |
| Mixed-Asset Target 2050+ Funds Average: Derived from data provided by Lipper Inc. | |
For a benchmark description, see the Glossary.
Investments in Target Retirement Funds are subject to the risks of their underlying funds. The year in the fund name refers to the approximate year (the target date) when an investor in the fund would retire and leave the work force. The fund will gradually shift its emphasis from more aggressive investments to more conservative ones based on its target date. An investment in a Target Retirement Fund is not guaranteed at any time, including on or after the target date.
1

Chairman’s Letter
Dear Shareholder,
During the six months ended March 31, 2013, stock returns around the world were robust, despite renewed concerns about the Eurozone debt crisis that flared toward the end of the period. Investors seeking higher yields moved away from conservative fixed income investments to stocks, leading to weak returns in the U.S. bond market.
The six Vanguard Target Retirement Funds covered in this report posted solid returns for the period. (The Target Retirement Income Fund and the funds with target retirement dates of 2010 through 2030 are covered in a separate report.)
Global equity markets delivered a powerful rally
Global stocks advanced for the fifth straight month to finish the half year ended March 31 with impressive gains. The Standard & Poor’s 500 Index closed at a record high on the period’s final business day. Financial markets in recent months shrugged off the U.S. “fiscal cliff” crisis, the unsettled Italian national elections, and a controversial bailout package for Cyprus.
Peter Westaway, Vanguard’s chief European economist, said that the latest developments in the European debt crisis had been “rather bad,” but that the market had for the most part already priced in these events. “As always,” he said, “we think investors should assess their portfolios carefully and avoid making impulsive moves.”
2
U.S. equities returned more than 11% as the economic recovery slowly built momentum; the housing market rebounded further, and the labor market improved. International equities were up more than 9%. Returns were about 16% for developed markets in the Pacific region, where Japan’s accommodative monetary policy has helped spark the nation’s stock market, and nearly 10% in Europe. Emerging markets stocks rose about 4%.
U.S. bond returns barely budged as yields lingered near lows
The broad U.S. taxable bond market scraped out a minuscule return of 0.09% for the half year as U.S. Treasury yields remained just slightly above their all-time lows. Although the yield of the benchmark 10-year Treasury note increased during the six months and topped 2.00% at various times, it closed the period at about 1.85%. (Bond prices and yields move in opposite directions.)
Municipal bonds returned almost 1% for the six months despite price declines in March. And returns of money market funds and savings accounts barely registered as short-term interest rates remained between 0% and 0.25%, under the Federal Reserve’s four-year-old policy.
Robert Auwaerter, head of Vanguard’s Fixed Income Group, doesn’t anticipate abrupt policy changes from the central bank. “We don’t see the Fed changing course in the near term,” he said,
| Market Barometer | |||
| Total Returns | |||
| Periods Ended March 31, 2013 | |||
| Six | One | Five Years | |
| Months | Year | (Annualized) | |
| Stocks | |||
| Russell 1000 Index (Large-caps) | 11.10% | 14.43% | 6.15% |
| Russell 2000 Index (Small-caps) | 14.48 | 16.30 | 8.24 |
| Russell 3000 Index (Broad U.S. market) | 11.35 | 14.56 | 6.32 |
| MSCI All Country World Index ex USA (International) | 9.20 | 8.36 | -0.39 |
| Bonds | |||
| Barclays U.S. Aggregate Bond Index (Broad taxable market) | 0.09% | 3.77% | 5.47% |
| Barclays Municipal Bond Index (Broad tax-exempt market) | 0.96 | 5.25 | 6.10 |
| Citigroup Three-Month U.S. Treasury Bill Index | 0.05 | 0.08 | 0.30 |
| CPI | |||
| Consumer Price Index | 0.59% | 1.47% | 1.74% |
3
“and when the Fed does, we expect it’ll go slowly so as not to undo the efforts made to keep interest rates low and to stimulate the economy.”
Retirement funds benefited from the stock market advance
The Vanguard Target Retirement Funds are “funds of funds” that offer investors professionally managed, diversified portfolios designed to automatically rebalance—gradually shifting from stocks to bonds—as the target retirement date approaches. After that date, the adjustments continue for several years until an income phase is reached.
Each of the funds discussed in this report holds shares in two underlying stock funds, one domestic and one international, as well as in a U.S. bond fund. The retirement funds’ performance for the six months was closely tied to their exposure to the stock and bond markets.
Because the six funds discussed here are designed for investors who expect to work at least 22 more years before retiring, they hold significantly more stocks than bonds. The assumption behind this allocation is that younger investors’ longer time horizon puts them in a good position to invest in stocks. These investors presumably have years to make up for any near-term losses while benefiting from stocks’ potential for higher returns over the long term.
The heavy allocation to stocks worked in the funds’ favor during this period. The Target Retirement 2035 Fund, with about
| Expense Ratios | ||
| Your Fund Compared With Its Peer Group | ||
| Acquired Fund Fees | Peer Group | |
| and Expenses | Average | |
| Target Retirement 2035 Fund | 0.18% | 0.52% |
| Target Retirement 2040 Fund | 0.18 | 0.57 |
| Target Retirement 2045 Fund | 0.18 | 0.51 |
| Target Retirement 2050 Fund | 0.18 | 0.54 |
| Target Retirement 2055 Fund | 0.18 | 0.54 |
| Target Retirement 2060 Fund | 0.18 | 0.54 |
The fund expense figures shown—drawn from the prospectus dated January 28, 2013—represent an estimate of the weighted average of the expense ratios and any transaction fees charged by the underlying mutual funds (the ”acquired” funds) in which the Target Retirement Funds invest. The Target Retirement Funds do not charge any expenses or fees of their own. For the six months ended March 31, 2013, the annualized acquired fund fees and expenses were 0.18% for the 2035 Fund, 0.18% for the 2040 Fund, 0.18% for the 2045 Fund, 0.18% for the 2050 Fund, 0.18% for the 2055 Fund, and 0.18% for the 2060 Fund. Peer-group expense ratios are derived from data provided by Lipper Inc. and capture information through year-end 2012.
Peer groups: For the 2035 Fund, Mixed-Asset Target 2035 Funds; for the 2040 Fund, Mixed-Asset Target 2040 Funds; for the 2045 Fund, Mixed-Asset Target 2045 Funds; for the 2050, 2055, and 2060 Funds, Mixed-Asset Target 2050+ Funds.
4
86% of its assets in stocks and 14% in bonds, returned 9.26%. The 2040 through 2060 Funds, which held about 90% of their assets in stocks and about 10% in bonds, returned slightly more.
A glance at the returns of the underlying funds shows the extent to which they influenced the retirement funds’ overall results. Vanguard Total Stock Market Index Fund, which invests in shares of U.S. companies, was the star performer, returning 11.16%. Vanguard Total International Stock Index Fund, with holdings from both developed and emerging economies abroad, gained 9.70%. Vanguard Total Bond Market II Index Fund had the weakest return, 0.02%. (These returns are for the funds’ Investor Shares.)
As I mentioned earlier, bond yields remain at historic lows. Given the current environment, our expectations for bond returns in coming years are very modest.
| The Target Retirement Funds further diversify their bond holdings |
| Vanguard plans to add the soon-to-be-launched Vanguard Total International Bond |
| Index Fund to each of the 12 Target Retirement Funds by June 30 of this year, |
| further diversifying them. The new fund will seek to track the Barclays Global |
| Aggregate ex-USD Float Adjusted RIC Capped Index (USD Hedged), which |
| represents about 7,000 high-quality bonds from 52 countries. |
| Each Target Retirement Fund will allocate 20% of its fixed income portfolio to |
| international bonds. Vanguard research has found that adding international bonds |
| to a U.S. bond portfolio can substantially broaden its diversification, which can help |
| further moderate risk. The new fund will use a traditional hedging strategy to help |
| reduce the impact of international currency fluctuations on its holdings. |
| As you can see in the example below, which uses the Target Retirement 2045 |
| Fund, the addition of the international bond fund will enhance diversification without |
| changing the funds’ overall stock and bond allocations. |
| Vanguard Target Retirement 2045 Fund | ||
| Current Allocation | New Allocation | |
| Total Stocks | 90% | 90% |
| Domestic | 63 | 63 |
| International | 27 | 27 |
| Total Bonds | 10 | 10 |
| Domestic | 10 | 8 |
| International | — | 2 |
5
However, we continue to believe that a mix of stocks and bonds, such as those held by the Vanguard Target Retirement Funds, can potentially smooth out the effects of market swings, because stock and bond prices can move in opposite directions. Bonds may suffer price declines as interest rates rise, but earnings reinvested at those higher rates can enhance returns over time.
New international bond fund will join the retirement portfolios
In February, we announced plans to add the new Vanguard Total International Bond Index Fund to our 12 Target Retirement Funds, including the six in this report, by the middle of 2013. The international bond fund, which will constitute about 20% of each Target Retirement Fund’s fixed income allocation, will serve to further diversify these broad, balanced portfolios. (See page 5 for more details.)
Please note that this change will not affect the Target Retirement Funds’ current overall strategic asset allocation or their glide path (the progression of allocation adjustments over time).
In saving for your future, right now is always the right time
Earlier this year, we marked “America Saves Week,” an annual event aimed at encouraging people to set aside more for their futures. I know a week devoted to promoting saving isn’t going to generate a lot of popular excitement or headlines. But it is, without a doubt, a worthy cause.
My view is that you should save more than you think you’ll need, particularly for retirement. How much? The right answer is different for everyone. The Vanguard Center for Retirement Research advises that a good target range is between 12% and 15% of your take-home pay, including any match from a workplace retirement plan. If you can’t afford to save that much today, start where you can and increase your savings as your circumstances allow.
If you do take steps to increase your savings now—before another “America Saves Week” comes and goes—you’ll thank yourself later. A Vanguard study titled Penny Saved, Penny Earned (available at vanguard.com/research) examined the different levers we use to achieve financial security. Our researchers found that retirement investors looking to improve the odds of reaching their goals are likely to do better by saving more over longer periods than by relying on the possibility of higher portfolio returns.
As always, thank you for investing with Vanguard.
Sincerely,

F. William McNabb III
Chairman and Chief Executive Officer April 15, 2013
6
| Your Fund’s Performance at a Glance | ||||
| September 30, 2012, Through March 31, 2013 | ||||
| Distributions Per Share | ||||
| Starting | Ending | Income | Capital | |
| Share Price | Share Price | Dividends | Gains | |
| Target Retirement 2035 Fund | $14.15 | $15.12 | $0.307 | $0.006 |
| Target Retirement 2040 Fund | $23.26 | $24.95 | $0.496 | $0.007 |
| Target Retirement 2045 Fund | $14.61 | $15.66 | $0.316 | $0.005 |
| Target Retirement 2050 Fund | $23.16 | $24.85 | $0.487 | $0.007 |
| Target Retirement 2055 Fund | $24.81 | $26.69 | $0.447 | $0.013 |
| Target Retirement 2060 Fund | $21.74 | $23.47 | $0.315 | $0.006 |
| Asset Allocation on March 31, 2013 | |||
| Short-Term | |||
| Stocks | Bonds | Reserves | |
| Target Retirement 2035 Fund | 85.6% | 14.4% | 0.0% |
| Target Retirement 2040 Fund | 90.1% | 9.9% | 0.0% |
| Target Retirement 2045 Fund | 90.0% | 10.0% | 0.0% |
| Target Retirement 2050 Fund | 90.0% | 10.0% | 0.0% |
| Target Retirement 2055 Fund | 90.0% | 10.0% | 0.0% |
| Target Retirement 2060 Fund | 90.0% | 10.0% | 0.0% |
Note: As of March 31, 2013, international stock weightings for the 2035, 2040, 2045, 2050, 2055, and 2060 Funds were 25%, 27%, 27%, 27%, 27%, and 27% of assets, respectively.
7
Target Retirement 2035 Fund
Fund Profile
As of March 31, 2013
| Total Fund Characteristics | |
| Ticker Symbol | VTTHX |
| 30-Day SEC Yield | 2.07% |
| Acquired Fund Fees and Expenses1 | 0.18% |
| Allocation to Underlying Vanguard Funds | |
| Vanguard Total Stock Market Index Fund | |
| Investor Shares | 60.4% |
| Vanguard Total International Stock Index | |
| Fund Investor Shares | 25.2% |
| Vanguard Total Bond Market II Index Fund | |
| Investor Shares | 14.4% |
| Total Fund Volatility Measures | ||
| Target 2035 | MSCI US | |
| Composite | Broad Market | |
| Index | Index | |
| R-Squared | 1.00 | 0.98 |
| Beta | 1.00 | 0.91 |
These measures show the degree and timing of the fund’s fluctuations compared with the indexes over 36 months.
Fund Asset Allocation
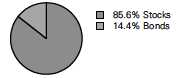
1 This figure—drawn from the prospectus dated January 28, 2013—represents an estimate of the weighted average of the expense ratios and any transaction fees charged by the underlying mutual funds (the ”acquired” funds) in which the Target Retirement 2035 Fund invests. The fund does not charge any expenses or fees of its own. For the six months ended March 31, 2013, the annualized acquired fund fees and expenses were 0.18%.
8
Target Retirement 2035 Fund
Performance Summary
All of the returns in this report represent past performance, which is not a guarantee of future results that may be achieved by the fund. (Current performance may be lower or higher than the performance data cited. For performance data current to the most recent month-end, visit our website at vanguard.com/performance.) Note, too, that both investment returns and principal value can fluctuate widely, so an investor’s shares, when sold, could be worth more or less than their original cost. The returns shown do not reflect taxes that a shareholder would pay on fund distributions or on the sale of fund shares.
Fiscal-Year Total Returns (%): October 27, 2003, Through March 31, 2013
| Average Annual Total Returns: Periods Ended March 31, 2013 | ||||||
| Since Inception | ||||||
| Inception Date | One Year | Five Years | Income | Capital | Total | |
| Target Retirement 2035 | ||||||
| Fund | 10/27/2003 | 11.38% | 4.87% | 2.12% | 4.54% | 6.66% |
See Financial Highlights for dividend and capital gains information.
9
Target Retirement 2035 Fund
Financial Statements (unaudited)
Statement of Net Assets
As of March 31, 2013
The fund reports a complete list of its holdings in regulatory filings four times in each fiscal year, at the quarter-ends. For the second and fourth fiscal quarters, the lists appear in the fund’s semiannual and annual reports to shareholders. For the first and third fiscal quarters, the fund files the lists with the Securities and Exchange Commission on Form N-Q. Shareholders can look up the fund’s Forms N-Q on the SEC’s website at sec.gov. Forms N-Q may also be reviewed and copied at the SEC’s Public Reference Room (see the back cover of this report for further information).
| Market | ||
| Value | ||
| Shares | ($000) | |
| Investment Companies (100.0%) | ||
| U.S. Stock Fund (60.4%) | ||
| Vanguard Total Stock Market Index Fund Investor Shares | 269,204,211 | 10,603,954 |
| International Stock Fund (25.2%) | ||
| Vanguard Total International Stock Index Fund Investor Shares | 288,340,958 | 4,431,801 |
| Bond Fund (14.4%) | ||
| 1 Vanguard Total Bond Market II Index Fund Investor Shares | 232,181,044 | 2,533,095 |
| Total Investments (100.0%) (Cost $14,652,762) | 17,568,850 | |
| Other Assets and Liabilities (0.0%) | ||
| Other Assets | 58,391 | |
| Liabilities | (57,140) | |
| 1,251 | ||
| Net Assets (100%) | ||
| Applicable to 1,162,371,029 outstanding $.001 par value shares of | ||
| beneficial interest (unlimited authorization) | 17,570,101 | |
| Net Asset Value Per Share | $15.12 | |
| At March 31, 2013, net assets consisted of: | |
| Amount | |
| ($000) | |
| Paid-in Capital | 14,645,475 |
| Undistributed Net Investment Income | 64,798 |
| Accumulated Net Realized Losses | (56,260) |
| Unrealized Appreciation (Depreciation) | 2,916,088 |
| Net Assets | 17,570,101 |
See Note A in Notes to Financial Statements.
1 Affiliated fund available only to Vanguard funds and certain trusts and accounts managed by Vanguard.
See accompanying Notes, which are an integral part of the Financial Statements.
10
Target Retirement 2035 Fund
| Statement of Operations | |
| Six Months Ended | |
| March 31, 2013 | |
| ($000) | |
| Investment Income | |
| Income | |
| Income Distributions Received | 192,817 |
| Net Investment Income—Note B | 192,817 |
| Realized Net Gain (Loss) | |
| Capital Gain Distributions Received | 12,080 |
| Investment Securities Sold | 3,724 |
| Realized Net Gain (Loss) | 15,804 |
| Change in Unrealized Appreciation (Depreciation) of Investment Securities | 1,202,140 |
| Net Increase (Decrease) in Net Assets Resulting from Operations | 1,410,761 |
See accompanying Notes, which are an integral part of the Financial Statements.
11
Target Retirement 2035 Fund
| Statement of Changes in Net Assets | ||
| Six Months Ended | Year Ended | |
| March 31, | September 30, | |
| 2013 | 2012 | |
| ($000) | ($000) | |
| Increase (Decrease) in Net Assets | ||
| Operations | ||
| Net Investment Income | 192,817 | 331,291 |
| Realized Net Gain (Loss) | 15,804 | 31,795 |
| Change in Unrealized Appreciation (Depreciation) | 1,202,140 | 2,077,103 |
| Net Increase (Decrease) in Net Assets Resulting from Operations | 1,410,761 | 2,440,189 |
| Distributions | ||
| Net Investment Income | (326,141) | (249,484) |
| Realized Capital Gain1 | (6,374) | (5,327) |
| Total Distributions | (332,515) | (254,811) |
| Capital Share Transactions | ||
| Issued | 2,783,978 | 3,574,347 |
| Issued in Lieu of Cash Distributions | 329,350 | 252,543 |
| Redeemed | (841,479) | (2,031,576) |
| Net Increase (Decrease) from Capital Share Transactions | 2,271,849 | 1,795,314 |
| Total Increase (Decrease) | 3,350,095 | 3,980,692 |
| Net Assets | ||
| Beginning of Period | 14,220,006 | 10,239,314 |
| End of Period2 | 17,570,101 | 14,220,006 |
1 Includes fiscal 2013 and 2012 short-term gain distributions totaling $6,374,000 and $5,327,000, respectively. Short-term gain distributions are treated as ordinary income dividends for tax purposes.
2 Net Assets—End of Period includes undistributed net investment income of $64,798,000 and $198,122,000.
See accompanying Notes, which are an integral part of the Financial Statements.
12
Target Retirement 2035 Fund
| Financial Highlights | ||||||
| Six Months | ||||||
| Ended | ||||||
| For a Share Outstanding | March 31, | Year Ended September 30, | ||||
| Throughout Each Period | 2013 | 2012 | 2011 | 2010 | 2009 | 2008 |
| Net Asset Value, Beginning of Period | $14.15 | $11.77 | $12.22 | $11.31 | $11.90 | $15.25 |
| Investment Operations | ||||||
| Net Investment Income | .166 | . 344 | . 235 | . 250 | . 2731 | .293 |
| Capital Gain Distributions Received | .011 | .016 | .006 | — | — | — |
| Net Realized and Unrealized Gain (Loss) | ||||||
| on Investments | 1.106 | 2.307 | (. 402) | . 898 | (. 564) | (3.353) |
| Total from Investment Operations | 1.283 | 2.667 | (.161) | 1.148 | (. 291) | (3.060) |
| Distributions | ||||||
| Dividends from Net Investment Income | (. 307) | (. 281) | (. 236) | (. 238) | (. 299) | (. 290) |
| Distributions from Realized Capital Gains | (. 006) | (. 006) | (. 053) | — | — | — |
| Total Distributions | (. 313) | (. 287) | (. 289) | (. 238) | (. 299) | (. 290) |
| Net Asset Value, End of Period | $15.12 | $14.15 | $11.77 | $12.22 | $11.31 | $11.90 |
| Total Return2 | 9.26% | 22.98% | -1.55% | 10.24% | -1.85% | -20.42% |
| Ratios/Supplemental Data | ||||||
| Net Assets, End of Period (Millions) | $17,570 | $14,220 | $10,239 | $9,223 | $6,780 | $5,030 |
| Ratio of Total Expenses to | ||||||
| Average Net Assets | — | — | — | — | — | — |
| Acquired Fund Fees and Expenses | 0.18% | 0.18% | 0.19% | 0.19% | 0.21% | 0.18% |
| Ratio of Net Investment Income to | ||||||
| Average Net Assets | 2.48% | 2.68% | 1.81% | 2.24% | 2.88% | 2.28% |
| Portfolio Turnover Rate | 2% | 6% | 18%3 | 6% | 9% 4 | 10% |
The expense ratio, acquired fund fees and expenses, net income ratio, and turnover rate for the current period have been annualized.
1 Calculated based on average shares outstanding.
2 Total returns do not include account service fees that may have applied in the periods shown. Fund prospectuses provide information about any applicable account service fees.
3 Excludes the value of mutual fund shares delivered and received in connection with a change in the fund’s international equity investments from Vanguard European, Pacific, and Emerging Markets Stock Index Funds to Vanguard Total International Stock Index Fund because those transactions were effected in kind and did not cause the fund to incur transaction costs.
4 Excludes the value of mutual fund shares delivered and received in connection with a change in the fund’s bond investments from Vanguard Total Bond Market Index Fund to Vanguard Total Bond Market II Index Fund because those transactions were effected in kind and did not cause the fund to incur transaction costs.
See accompanying Notes, which are an integral part of the Financial Statements.
13
Target Retirement 2035 Fund
Notes to Financial Statements
Vanguard Target Retirement 2035 Fund is registered under the Investment Company Act of 1940 as an open-end investment company, or mutual fund. The fund follows a balanced investment strategy by investing in selected Vanguard funds to achieve its targeted allocation of assets to U.S. stocks, international stocks, and bonds.
A. The following significant accounting policies conform to generally accepted accounting principles for U.S. mutual funds. The fund consistently follows such policies in preparing its financial statements.
1. Security Valuation: Investments are valued at the net asset value of each underlying Vanguard fund determined as of the close of the New York Stock Exchange (generally 4 p.m., Eastern time) on the valuation date. See Note C.
2. Federal Income Taxes: The fund intends to continue to qualify as a regulated investment company and distribute all of its taxable income. Management has analyzed the fund’s tax positions taken for all open federal income tax years (September 30, 2009–2012), and for the period ended March 31, 2013, and has concluded that no provision for federal income tax is required in the fund’s financial statements.
3. Distributions: Distributions to shareholders are recorded on the ex-dividend date.
4. Other: Income and capital gain distributions received are recorded on the ex-dividend date. Security transactions are accounted for on the date securities are bought or sold. Costs used to determine realized gains (losses) on the sale of investment securities are those of the specific securities sold.
B. Under a service agreement, The Vanguard Group furnishes investment advisory, corporate management, administrative, marketing, and distribution services to the fund. The service agreement provides that the fund’s expenses may be reduced or eliminated to the extent of savings realized by the Vanguard funds by the operation of the fund. Accordingly, all incremental expenses for services provided by Vanguard and all other expenses incurred by the fund during the period ended March 31, 2013, were borne by the funds in which the fund invests. The fund’s trustees and officers are also directors and officers of Vanguard and the funds in which the fund invests.
C. Various inputs may be used to determine the value of the fund’s investments. These inputs are summarized in three broad levels for financial statement purposes. The inputs or methodologies used to value securities are not necessarily an indication of the risk associated with investing in those securities.
Level 1—Quoted prices in active markets for identical securities.
Level 2—Other significant observable inputs (including quoted prices for similar securities, interest rates, prepayment speeds, credit risk, etc.).
Level 3—Significant unobservable inputs (including the fund’s own assumptions used to determine the fair value of investments).
The following table summarizes the market value of the fund’s investments as of March 31, 2013, based on the inputs used to value them:
| Level 1 | Level 2 | Level 3 | |
| Investments | ($000) | ($000) | ($000) |
| Investment Companies | 13,137,049 | 4,431,801 | — |
14
Target Retirement 2035 Fund
The fund’s investment in Vanguard Total International Stock Index Fund is normally valued based on Level 1 inputs but was valued in this report based on Level 2 inputs. The most recent quoted net asset value for this underlying fund was as of March 28, 2013. For financial statement purposes, this net asset value was adjusted to revalue certain of the fund’s securities based on March 29, 2013, closing prices because their local markets were open while U.S. markets were closed.
D. Distributions are determined on a tax basis and may differ from net investment income and realized capital gains for financial reporting purposes. Differences may be permanent or temporary. Permanent differences are reclassified among capital accounts in the financial statements to reflect their tax character. Temporary differences arise when certain items of income, expense, gain, or loss are recognized in different periods for financial statement and tax purposes; these differences will reverse at some time in the future. Differences in classification may also result from the treatment of short-term gains as ordinary income for tax purposes.
The fund’s tax-basis capital gains and losses are determined only at the end of each fiscal year. For tax purposes, at September 30, 2012, the fund had available capital losses totaling $60,815,000 that may be carried forward indefinitely to offset future capital gains. The fund will use these capital losses to offset net taxable capital gains, if any, realized during the year ending September 30, 2013; should the fund realize net capital losses for the year, the losses will be added to the loss carryforward balance above. Short-term capital gain distributions received are treated as ordinary income for tax purposes, and cannot be offset by capital losses. Capital gain distributions paid during the six months ended March 31, 2013, are from short-term gain distributions received from Vanguard Total Bond Market II Index Fund.
At March 31, 2013, the cost of investment securities for tax purposes was $14,652,762,000. Net unrealized appreciation of investment securities for tax purposes was $2,916,088,000, consisting entirely of unrealized gains on securities that had risen in value since their purchase.
E. During the six months ended March 31, 2013, the fund purchased $2,291,427,000 of investment securities and sold $129,017,000 of investment securities, other than temporary cash investments.
F. Capital shares issued and redeemed were:
| Six Months Ended | Year Ended | |
| March 31, 2013 | September 30, 2012 | |
| Shares | Shares | |
| (000) | (000) | |
| Issued | 192,487 | 269,022 |
| Issued in Lieu of Cash Distributions | 23,660 | 20,171 |
| Redeemed | (58,415) | (154,290) |
| Net Increase (Decrease) in Shares Outstanding | 157,732 | 134,903 |
G. In preparing the financial statements as of March 31, 2013, management considered the impact of subsequent events for potential recognition or disclosure in these financial statements.
In February 2013, Vanguard announced plans to reallocate 20% of the fund’s fixed income exposure to foreign bonds, through an investment in Vanguard Total International Bond Index Fund. The fund’s overall fixed income allocation and its strategic asset allocation are not changing. The transition is expected to be completed by June 30, 2013.
15
Target Retirement 2040 Fund
Fund Profile
As of March 31, 2013
| Total Fund Characteristics | |
| Ticker Symbol | VFORX |
| 30-Day SEC Yield | 2.08% |
| Acquired Fund Fees and Expenses1 | 0.18% |
| Allocation to Underlying Vanguard Funds | |
| Vanguard Total Stock Market Index Fund | |
| Investor Shares | 63.4% |
| Vanguard Total International Stock Index | |
| Fund Investor Shares | 26.7% |
| Vanguard Total Bond Market II Index Fund | |
| Investor Shares | 9.9% |
| Total Fund Volatility Measures | ||
| Target 2040 | MSCI US | |
| Composite | Broad Market | |
| Index | Index | |
| R-Squared | 1.00 | 0.98 |
| Beta | 1.00 | 0.92 |
These measures show the degree and timing of the fund’s fluctuations compared with the indexes over 36 months.
Fund Asset Allocation
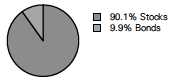
1 This figure—drawn from the prospectus dated January 28, 2013—represents an estimate of the weighted average of the expense ratios and any transaction fees charged by the underlying mutual funds (the ”acquired” funds) in which the Target Retirement 2040 Fund invests. The fund does not charge any expenses or fees of its own. For the six months ended March 31, 2013, the annualized acquired fund fees and expenses were 0.18%.
16
Target Retirement 2040 Fund
Performance Summary
All of the returns in this report represent past performance, which is not a guarantee of future results that may be achieved by the fund. (Current performance may be lower or higher than the performance data cited. For performance data current to the most recent month-end, visit our website at vanguard.com/performance.) Note, too, that both investment returns and principal value can fluctuate widely, so an investor’s shares, when sold, could be worth more or less than their original cost. The returns shown do not reflect taxes that a shareholder would pay on fund distributions or on the sale of fund shares.
Fiscal-Year Total Returns (%): June 7, 2006, Through March 31, 2013
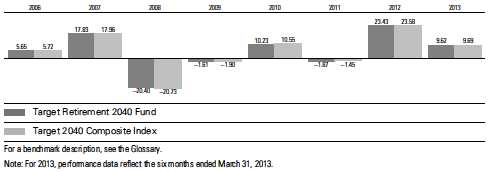
| Average Annual Total Returns: Periods Ended March 31, 2013 | ||||||
| Since Inception | ||||||
| Inception Date | One Year | Five Years | Income | Capital | Total | |
| Target Retirement 2040 | ||||||
| Fund | 6/7/2006 | 11.74% | 5.01% | 2.00% | 3.36% | 5.36% |
See Financial Highlights for dividend and capital gains information.
17
Target Retirement 2040 Fund
Financial Statements (unaudited)
Statement of Net Assets
As of March 31, 2013
The fund reports a complete list of its holdings in regulatory filings four times in each fiscal year, at the quarter-ends. For the second and fourth fiscal quarters, the lists appear in the fund’s semiannual and annual reports to shareholders. For the first and third fiscal quarters, the fund files the lists with the Securities and Exchange Commission on Form N-Q. Shareholders can look up the fund’s Forms N-Q on the SEC’s website at sec.gov. Forms N-Q may also be reviewed and copied at the SEC’s Public Reference Room (see the back cover of this report for further information).
| Market | ||
| Value | ||
| Shares | ($000) | |
| Investment Companies (100.0%) | ||
| U.S. Stock Fund (63.4%) | ||
| Vanguard Total Stock Market Index Fund Investor Shares | 168,538,053 | 6,638,714 |
| International Stock Fund (26.7%) | ||
| Vanguard Total International Stock Index Fund Investor Shares | 181,554,022 | 2,790,486 |
| Bond Fund (9.9%) | ||
| 1 Vanguard Total Bond Market II Index Fund Investor Shares | 95,368,953 | 1,040,475 |
| Total Investment Companies (Cost $8,789,035) | 10,469,675 | |
| Temporary Cash Investment (0.0%) | ||
| Money Market Fund (0.0%) | ||
| 1 Vanguard Market Liquidity Fund, 0.147% (Cost $97) | 97,174 | 97 |
| Total Investments (100.0%) (Cost $8,789,132) | 10,469,772 | |
| Other Assets and Liabilities (0.0%) | ||
| Other Assets | 40,359 | |
| Liabilities | (39,219) | |
| 1,140 | ||
| Net Assets (100%) | ||
| Applicable to 419,663,658 outstanding $.001 par value shares of | ||
| beneficial interest (unlimited authorization) | 10,470,912 | |
| Net Asset Value Per Share | $24.95 | |
| At March 31, 2013, net assets consisted of: | |
| Amount | |
| ($000) | |
| Paid-in Capital | 8,749,842 |
| Undistributed Net Investment Income | 38,367 |
| Accumulated Net Realized Gains | 2,063 |
| Unrealized Appreciation (Depreciation) | 1,680,640 |
| Net Assets | 10,470,912 |
See Note A in Notes to Financial Statements.
1 Affiliated fund available only to Vanguard funds and certain trusts and accounts managed by Vanguard. Rate shown for Vanguard Market Liquidity Fund is the 7-day yield.
See accompanying Notes, which are an integral part of the Financial Statements.
18
Target Retirement 2040 Fund
| Statement of Operations | |
| Six Months Ended | |
| March 31, 2013 | |
| ($000) | |
| Investment Income | |
| Income | |
| Income Distributions Received | 113,115 |
| Net Investment Income—Note B | 113,115 |
| Realized Net Gain (Loss) | |
| Capital Gain Distributions Received | 4,995 |
| Investment Securities Sold | 5,039 |
| Realized Net Gain (Loss) | 10,034 |
| Change in Unrealized Appreciation (Depreciation) of Investment Securities | 740,042 |
| Net Increase (Decrease) in Net Assets Resulting from Operations | 863,191 |
See accompanying Notes, which are an integral part of the Financial Statements.
19
Target Retirement 2040 Fund
| Statement of Changes in Net Assets | ||
| Six Months Ended | Year Ended | |
| March 31, | September 30, | |
| 2013 | 2012 | |
| ($000) | ($000) | |
| Increase (Decrease) in Net Assets | ||
| Operations | ||
| Net Investment Income | 113,115 | 178,202 |
| Realized Net Gain (Loss) | 10,034 | 11,321 |
| Change in Unrealized Appreciation (Depreciation) | 740,042 | 1,107,410 |
| Net Increase (Decrease) in Net Assets Resulting from Operations | 863,191 | 1,296,933 |
| Distributions | ||
| Net Investment Income | (184,949) | (121,325) |
| Realized Capital Gain1 | (2,610) | (2,459) |
| Total Distributions | (187,559) | (123,784) |
| Capital Share Transactions | ||
| Issued | 2,220,484 | 2,765,586 |
| Issued in Lieu of Cash Distributions | 184,925 | 122,539 |
| Redeemed | (592,459) | (1,056,098) |
| Net Increase (Decrease) from Capital Share Transactions | 1,812,950 | 1,832,027 |
| Total Increase (Decrease) | 2,488,582 | 3,005,176 |
| Net Assets | ||
| Beginning of Period | 7,982,330 | 4,977,154 |
| End of Period2 | 10,470,912 | 7,982,330 |
1 Includes fiscal 2013 and 2012 short-term gain distributions totaling $2,610,000 and $2,459,000, respectively. Short-term gain distributions are treated as ordinary income dividends for tax purposes.
2 Net Assets—End of Period includes undistributed net investment income of $38,367,000 and $110,201,000.
See accompanying Notes, which are an integral part of the Financial Statements.
20
Target Retirement 2040 Fund
| Financial Highlights | ||||||
| Six Months | ||||||
| Ended | ||||||
| For a Share Outstanding | March 31, | Year Ended September 30, | ||||
| Throughout Each Period | 2013 | 2012 | 2011 | 2010 | 2009 | 2008 |
| Net Asset Value, Beginning of Period | $23.26 | $19.26 | $20.03 | $18.52 | $19.36 | $24.70 |
| Investment Operations | ||||||
| Net Investment Income | . 266 | . 559 | . 369 | . 393 | . 4351 | .4941 |
| Capital Gain Distributions Received | .013 | .022 | .006 | — | — | — |
| Net Realized and Unrealized Gain (Loss) | ||||||
| on Investments | 1.914 | 3.872 | (.705) | 1.485 | (. 849) | (5.464) |
| Total from Investment Operations | 2.193 | 4.453 | (. 330) | 1.878 | (. 414) | (4.970) |
| Distributions | ||||||
| Dividends from Net Investment Income | (. 496) | (. 444) | (. 368) | (. 368) | (. 426) | (. 370) |
| Distributions from Realized Capital Gains | (. 007) | (. 009) | (. 072) | — | — | — |
| Total Distributions | (. 503) | (. 453) | (. 440) | (. 368) | (. 426) | (. 370) |
| Net Asset Value, End of Period | $24.95 | $23.26 | $19.26 | $20.03 | $18.52 | $19.36 |
| Total Return2 | 9.62% | 23.43% | -1.87% | 10.23% | -1.61% | -20.40% |
| Ratios/Supplemental Data | ||||||
| Net Assets, End of Period (Millions) | $10,471 | $7,982 | $4,977 | $3,831 | $2,330 | $1,199 |
| Ratio of Total Expenses to | ||||||
| Average Net Assets | — | — | — | — | — | — |
| Acquired Fund Fees and Expenses | 0.18% | 0.18% | 0.19% | 0.19% | 0.21% | 0.19% |
| Ratio of Net Investment Income to | ||||||
| Average Net Assets | 2.51% | 2.69% | 1.79% | 2.23% | 2.78% | 2.24% |
| Portfolio Turnover Rate | 3% | 3% | 15%3 | 7% | 9%4 | 4% |
The expense ratio, acquired fund fees and expenses, net income ratio, and turnover rate for the current period have been annualized.
1 Calculated based on average shares outstanding.
2 Total returns do not include account service fees that may have applied in the periods shown. Fund prospectuses provide information about any applicable account service fees.
3 Excludes the value of mutual fund shares delivered and received in connection with a change in the fund’s international equity investments from Vanguard European, Pacific, and Emerging Markets Stock Index Funds to Vanguard Total International Stock Index Fund because those transactions were effected in kind and did not cause the fund to incur transaction costs.
4 Excludes the value of mutual fund shares delivered and received in connection with a change in the fund’s bond investments from Vanguard Total Bond Market Index Fund to Vanguard Total Bond Market II Index Fund because those transactions were effected in kind and did not cause the fund to incur transaction costs.
See accompanying Notes, which are an integral part of the Financial Statements.
21
Target Retirement 2040 Fund
Notes to Financial Statements
Vanguard Target Retirement 2040 Fund is registered under the Investment Company Act of 1940 as an open-end investment company, or mutual fund. The fund follows a balanced investment strategy by investing in selected Vanguard funds to achieve its targeted allocation of assets to U.S. stocks, international stocks, and bonds.
A. The following significant accounting policies conform to generally accepted accounting principles for U.S. mutual funds. The fund consistently follows such policies in preparing its financial statements.
1. Security Valuation: Investments are valued at the net asset value of each underlying Vanguard fund determined as of the close of the New York Stock Exchange (generally 4 p.m., Eastern time) on the valuation date. See Note C.
2. Federal Income Taxes: The fund intends to continue to qualify as a regulated investment company and distribute all of its taxable income. Management has analyzed the fund’s tax positions taken for all open federal income tax years (September 30, 2009–2012), and for the period ended March 31, 2013, and has concluded that no provision for federal income tax is required in the fund’s financial statements.
3. Distributions: Distributions to shareholders are recorded on the ex-dividend date.
4. Other: Income and capital gain distributions received are recorded on the ex-dividend date. Security transactions are accounted for on the date securities are bought or sold. Costs used to determine realized gains (losses) on the sale of investment securities are those of the specific securities sold.
B. Under a service agreement, The Vanguard Group furnishes investment advisory, corporate management, administrative, marketing, and distribution services to the fund. The service agreement provides that the fund’s expenses may be reduced or eliminated to the extent of savings realized by the Vanguard funds by the operation of the fund. Accordingly, all incremental expenses for services provided by Vanguard and all other expenses incurred by the fund during the period ended March 31, 2013, were borne by the funds in which the fund invests. The fund’s trustees and officers are also directors and officers of Vanguard and the funds in which the fund invests.
C. Various inputs may be used to determine the value of the fund’s investments. These inputs are summarized in three broad levels for financial statement purposes. The inputs or methodologies used to value securities are not necessarily an indication of the risk associated with investing in those securities.
Level 1—Quoted prices in active markets for identical securities.
Level 2—Other significant observable inputs (including quoted prices for similar securities, interest rates, prepayment speeds, credit risk, etc.).
Level 3—Significant unobservable inputs (including the fund’s own assumptions used to determine the fair value of investments).
The following table summarizes the market value of the fund’s investments as of March 31, 2013, based on the inputs used to value them:
| Level 1 | Level 2 | Level 3 | |
| Investments | ($000) | ($000) | ($000) |
| Investment Companies | 7,679,189 | 2,790,486 | — |
| Temporary Cash Investments | 97 | — | — |
| Total | 7,679,286 | 2,790,486 | — |
22
Target Retirement 2040 Fund
The fund’s investment in Vanguard Total International Stock Index Fund is normally valued based on Level 1 inputs but was valued in this report based on Level 2 inputs. The most recent quoted net asset value for this underlying fund was as of March 28, 2013. For financial statement purposes, this net asset value was adjusted to revalue certain of the fund’s securities based on March 29, 2013, closing prices because their local markets were open while U.S. markets were closed.
D. Distributions are determined on a tax basis and may differ from net investment income and realized capital gains for financial reporting purposes. Differences may be permanent or temporary. Permanent differences are reclassified among capital accounts in the financial statements to reflect their tax character. Temporary differences arise when certain items of income, expense, gain, or loss are recognized in different periods for financial statement and tax purposes; these differences will reverse at some time in the future. Differences in classification may also result from the treatment of short-term gains as ordinary income for tax purposes. The fund’s tax-basis capital gains and losses are determined only at the end of each fiscal year.
At March 31, 2013, the cost of investment securities for tax purposes was $8,789,132,000. Net unrealized appreciation of investment securities for tax purposes was $1,680,640,000, consisting entirely of unrealized gains on securities that had risen in value since their purchase.
E. During the six months ended March 31, 2013, the fund purchased $1,878,219,000 of investment securities and sold $119,268,000 of investment securities, other than temporary cash investments.
F. Capital shares issued and redeemed were:
| Six Months Ended | Year Ended | |
| March 31, 2013 | September 30, 2012 | |
| Shares | Shares | |
| (000) | (000) | |
| Issued | 93,275 | 127,086 |
| Issued in Lieu of Cash Distributions | 8,082 | 5,969 |
| Redeemed | (24,889) | (48,337) |
| Net Increase (Decrease) in Shares Outstanding | 76,468 | 84,718 |
G. In preparing the financial statements as of March 31, 2013, management considered the impact of subsequent events for potential recognition or disclosure in these financial statements.
In February 2013, Vanguard announced plans to reallocate 20% of the fund’s fixed income exposure to foreign bonds, through an investment in Vanguard Total International Bond Index Fund. The fund’s overall fixed income allocation and its strategic asset allocation are not changing. The transition is expected to be completed by June 30, 2013.
23
Target Retirement 2045 Fund
Fund Profile
As of March 31, 2013
| Total Fund Characteristics | |
| Ticker Symbol | VTIVX |
| 30-Day SEC Yield | 2.08% |
| Acquired Fund Fees and Expenses1 | 0.18% |
| Allocation to Underlying Vanguard Funds | |
| Vanguard Total Stock Market Index Fund | |
| Investor Shares | 63.4% |
| Vanguard Total International Stock Index | |
| Fund Investor Shares | 26.6% |
| Vanguard Total Bond Market II Index Fund | |
| Investor Shares | 10.0% |
| Total Fund Volatility Measures | ||
| Target 2045 | MSCI US | |
| Composite | Broad Market | |
| Index | Index | |
| R-Squared | 1.00 | 0.98 |
| Beta | 1.00 | 0.92 |
These measures show the degree and timing of the fund’s fluctuations compared with the indexes over 36 months.
Fund Asset Allocation
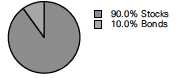
1 This figure—drawn from the prospectus dated January 28, 2013—represents an estimate of the weighted average of the expense ratios and any transaction fees charged by the underlying mutual funds (the ”acquired” funds) in which the Target Retirement 2045 Fund invests. The fund does not charge any expenses or fees of its own. For the six months ended March 31, 2013, the annualized acquired fund fees and expenses were 0.18%.
24
Target Retirement 2045 Fund
Performance Summary
All of the returns in this report represent past performance, which is not a guarantee of future results that may be achieved by the fund. (Current performance may be lower or higher than the performance data cited. For performance data current to the most recent month-end, visit our website at vanguard.com/performance.) Note, too, that both investment returns and principal value can fluctuate widely, so an investor’s shares, when sold, could be worth more or less than their original cost. The returns shown do not reflect taxes that a shareholder would pay on fund distributions or on the sale of fund shares.
Fiscal-Year Total Returns (%): October 27, 2003, Through March 31, 2013
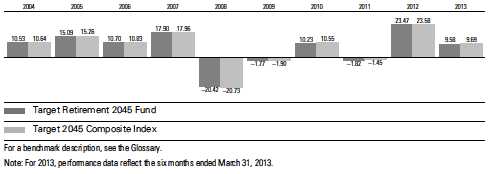
| Average Annual Total Returns: Periods Ended March 31, 2013 | ||||||
| Since Inception | ||||||
| Inception Date | One Year | Five Years | Income | Capital | Total | |
| Target Retirement 2045 | ||||||
| Fund | 10/27/2003 | 11.72% | 4.97% | 2.07% | 4.98% | 7.05% |
See Financial Highlights for dividend and capital gains information.
25
Target Retirement 2045 Fund
Financial Statements (unaudited)
Statement of Net Assets
As of March 31, 2013
The fund reports a complete list of its holdings in regulatory filings four times in each fiscal year, at the quarter-ends. For the second and fourth fiscal quarters, the lists appear in the fund’s semiannual and annual reports to shareholders. For the first and third fiscal quarters, the fund files the lists with the Securities and Exchange Commission on Form N-Q. Shareholders can look up the fund’s Forms N-Q on the SEC’s website at sec.gov. Forms N-Q may also be reviewed and copied at the SEC’s Public Reference Room (see the back cover of this report for further information).
| Market | ||
| Value | ||
| Shares | ($000) | |
| Investment Companies (100.0%) | ||
| U.S. Stock Fund (63.4%) | ||
| Vanguard Total Stock Market Index Fund Investor Shares | 163,549,106 | 6,442,199 |
| International Stock Fund (26.6%) | ||
| Vanguard Total International Stock Index Fund Investor Shares | 176,061,090 | 2,706,059 |
| Bond Fund (10.0%) | ||
| 1 Vanguard Total Bond Market II Index Fund Investor Shares | 93,680,211 | 1,022,051 |
| Total Investments (100.0%) (Cost $8,458,367) | 10,170,309 | |
| Other Assets and Liabilities (0.0%) | ||
| Other Assets | 34,514 | |
| Liabilities | (38,346) | |
| (3,832) | ||
| Net Assets (100%) | ||
| Applicable to 649,098,836 outstanding $.001 par value shares of | ||
| beneficial interest (unlimited authorization) | 10,166,477 | |
| Net Asset Value Per Share | $15.66 | |
| At March 31, 2013, net assets consisted of: | |
| Amount | |
| ($000) | |
| Paid-in Capital | 8,445,385 |
| Undistributed Net Investment Income | 37,494 |
| Accumulated Net Realized Losses | (28,344) |
| Unrealized Appreciation (Depreciation) | 1,711,942 |
| Net Assets | 10,166,477 |
See Note A in Notes to Financial Statements.
1 Affiliated fund available only to Vanguard funds and certain trusts and accounts managed by Vanguard.
See accompanying Notes, which are an integral part of the Financial Statements.
26
Target Retirement 2045 Fund
| Statement of Operations | |
| Six Months Ended | |
| March 31, 2013 | |
| ($000) | |
| Investment Income | |
| Income | |
| Income Distributions Received | 112,137 |
| Net Investment Income—Note B | 112,137 |
| Realized Net Gain (Loss) | |
| Capital Gain Distributions Received | 4,984 |
| Investment Securities Sold | 727 |
| Realized Net Gain (Loss) | 5,711 |
| Change in Unrealized Appreciation (Depreciation) of Investment Securities | 733,017 |
| Net Increase (Decrease) in Net Assets Resulting from Operations | 850,865 |
See accompanying Notes, which are an integral part of the Financial Statements.
27
Target Retirement 2045 Fund
| Statement of Changes in Net Assets | ||
| Six Months Ended | Year Ended | |
| March 31, | September 30, | |
| 2013 | 2012 | |
| ($000) | ($000) | |
| Increase (Decrease) in Net Assets | ||
| Operations | ||
| Net Investment Income | 112,137 | 188,310 |
| Realized Net Gain (Loss) | 5,711 | 24,245 |
| Change in Unrealized Appreciation (Depreciation) | 733,017 | 1,185,281 |
| Net Increase (Decrease) in Net Assets Resulting from Operations | 850,865 | 1,397,836 |
| Distributions | ||
| Net Investment Income | (186,901) | (138,613) |
| Realized Capital Gain1 | (2,957) | (2,423) |
| Total Distributions | (189,858) | (141,036) |
| Capital Share Transactions | ||
| Issued | 1,673,131 | 2,414,872 |
| Issued in Lieu of Cash Distributions | 188,279 | 140,029 |
| Redeemed | (518,966) | (1,350,612) |
| Net Increase (Decrease) from Capital Share Transactions | 1,342,444 | 1,204,289 |
| Total Increase (Decrease) | 2,003,451 | 2,461,089 |
| Net Assets | ||
| Beginning of Period | 8,163,026 | 5,701,937 |
| End of Period2 | 10,166,477 | 8,163,026 |
1 Includes fiscal 2013 and 2012 short-term gain distributions totaling $2,957,000 and $2,423,000, respectively. Short-term gain distributions are treated as ordinary income dividends for tax purposes.
2 Net Assets—End of Period includes undistributed net investment income of $37,494,000 and $112,258,000.
See accompanying Notes, which are an integral part of the Financial Statements.
28
Target Retirement 2045 Fund
| Financial Highlights | ||||||
| Six Months | ||||||
| Ended | ||||||
| For a Share Outstanding | March 31, | Year Ended September 30, | ||||
| Throughout Each Period | 2013 | 2012 | 2011 | 2010 | 2009 | 2008 |
| Net Asset Value, Beginning of Period | $14.61 | $12.10 | $12.64 | $11.70 | $12.29 | $15.75 |
| Investment Operations | ||||||
| Net Investment Income | .173 | . 354 | . 237 | . 257 | . 2811 | .303 |
| Capital Gain Distributions Received | .008 | .014 | .005 | — | — | — |
| Net Realized and Unrealized Gain (Loss) | ||||||
| on Investments | 1.190 | 2.433 | (. 436) | . 929 | (. 570) | (3.463) |
| Total from Investment Operations | 1.371 | 2.801 | (.194) | 1.186 | (. 289) | (3.160) |
| Distributions | ||||||
| Dividends from Net Investment Income | (. 316) | (. 286) | (. 242) | (. 246) | (. 301) | (. 300) |
| Distributions from Realized Capital Gains | (. 005) | (. 005) | (.104) | — | — | — |
| Total Distributions | (. 321) | (. 291) | (. 346) | (. 246) | (. 301) | (. 300) |
| Net Asset Value, End of Period | $15.66 | $14.61 | $12.10 | $12.64 | $11.70 | $12.29 |
| Total Return2 | 9.58% | 23.47% | -1.82% | 10.23% | -1.77% | -20.42% |
| Ratios/Supplemental Data | ||||||
| Net Assets, End of Period (Millions) | $10,166 | $8,163 | $5,702 | $4,918 | $3,560 | $2,493 |
| Ratio of Total Expenses to | ||||||
| Average Net Assets | — | — | — | — | — | — |
| Acquired Fund Fees and Expenses | 0.18% | 0.18% | 0.19% | 0.19% | 0.21% | 0.18% |
| Ratio of Net Investment Income to | ||||||
| Average Net Assets | 2.51% | 2.70% | 1.79% | 2.24% | 2.86% | 2.28% |
| Portfolio Turnover Rate | 3% | 7% | 16%3 | 6% | 10% 4 | 9% |
The expense ratio, acquired fund fees and expenses, net income ratio, and turnover rate for the current period have been annualized.
1 Calculated based on average shares outstanding.
2 Total returns do not include account service fees that may have applied in the periods shown. Fund prospectuses provide information about any applicable account service fees.
3 Excludes the value of mutual fund shares delivered and received in connection with a change in the fund’s international equity investments from Vanguard European, Pacific, and Emerging Markets Stock Index Funds to Vanguard Total International Stock Index Fund because those transactions were effected in kind and did not cause the fund to incur transaction costs.
4 Excludes the value of mutual fund shares delivered and received in connection with a change in the fund’s bond investments from Vanguard Total Bond Market Index Fund to Vanguard Total Bond Market II Index Fund because those transactions were effected in kind and did not cause the fund to incur transaction costs.
See accompanying Notes, which are an integral part of the Financial Statements.
Target Retirement 2045 Fund
Notes to Financial Statements
Vanguard Target Retirement 2045 Fund is registered under the Investment Company Act of 1940 as an open-end investment company, or mutual fund. The fund follows a balanced investment strategy by investing in selected Vanguard funds to achieve its targeted allocation of assets to U.S. stocks, international stocks, and bonds.
A. The following significant accounting policies conform to generally accepted accounting principles for U.S. mutual funds. The fund consistently follows such policies in preparing its financial statements.
1. Security Valuation: Investments are valued at the net asset value of each underlying Vanguard fund determined as of the close of the New York Stock Exchange (generally 4 p.m., Eastern time) on the valuation date. See Note C.
2. Federal Income Taxes: The fund intends to continue to qualify as a regulated investment company and distribute all of its taxable income. Management has analyzed the fund’s tax positions taken for all open federal income tax years (September 30, 2009–2012), and for the period ended March 31, 2013, and has concluded that no provision for federal income tax is required in the fund’s financial statements.
3. Distributions: Distributions to shareholders are recorded on the ex-dividend date.
4. Other: Income and capital gain distributions received are recorded on the ex-dividend date. Security transactions are accounted for on the date securities are bought or sold. Costs used to determine realized gains (losses) on the sale of investment securities are those of the specific securities sold.
B. Under a service agreement, The Vanguard Group furnishes investment advisory, corporate management, administrative, marketing, and distribution services to the fund. The service agreement provides that the fund’s expenses may be reduced or eliminated to the extent of savings realized by the Vanguard funds by the operation of the fund. Accordingly, all incremental expenses for services provided by Vanguard and all other expenses incurred by the fund during the period ended March 31, 2013, were borne by the funds in which the fund invests. The fund’s trustees and officers are also directors and officers of Vanguard and the funds in which the fund invests.
C. Various inputs may be used to determine the value of the fund’s investments. These inputs are summarized in three broad levels for financial statement purposes. The inputs or methodologies used to value securities are not necessarily an indication of the risk associated with investing in those securities.
Level 1—Quoted prices in active markets for identical securities.
Level 2—Other significant observable inputs (including quoted prices for similar securities, interest rates, prepayment speeds, credit risk, etc.).
Level 3—Significant unobservable inputs (including the fund’s own assumptions used to determine the fair value of investments).
The following table summarizes the market value of the fund’s investments as of March 31, 2013, based on the inputs used to value them:
| Level 1 | Level 2 | Level 3 | |
| Investments | ($000) | ($000) | ($000) |
| Investment Companies | 7,464,250 | 2,706,059 | — |
30
Target Retirement 2045 Fund
The fund’s investment in Vanguard Total International Stock Index Fund is normally valued based on Level 1 inputs but was valued in this report based on Level 2 inputs. The most recent quoted net asset value for this underlying fund was as of March 28, 2013. For financial statement purposes, this net asset value was adjusted to revalue certain of the fund’s securities based on March 29, 2013, closing prices because their local markets were open while U.S. markets were closed.
D. Distributions are determined on a tax basis and may differ from net investment income and realized capital gains for financial reporting purposes. Differences may be permanent or temporary. Permanent differences are reclassified among capital accounts in the financial statements to reflect their tax character. Temporary differences arise when certain items of income, expense, gain, or loss are recognized in different periods for financial statement and tax purposes; these differences will reverse at some time in the future. Differences in classification may also result from the treatment of short-term gains as ordinary income for tax purposes.
The fund’s tax-basis capital gains and losses are determined only at the end of each fiscal year. For tax purposes, at September 30, 2012, the fund had available capital losses totaling $30,381,000 that may be carried forward indefinitely to offset future net capital gains. The fund will use these capital losses to offset net taxable capital gains, if any, realized during the year ending September 30, 2013; should the fund realize net capital losses for the year, the losses will be added to the loss carryforward balance above. Short-term capital gain distributions received are treated as ordinary income for tax purposes, and cannot be offset by capital losses. Capital gain distributions paid during the six months ended March 31, 2013, are from short-term gain distributions received from Vanguard Total Bond Market II Index Fund.
At March 31, 2013, the cost of investment securities for tax purposes was $8,458,367,000. Net unrealized appreciation of investment securities for tax purposes was $1,711,942,000, consisting entirely of unrealized gains on securities that had risen in value since their purchase.
E. During the six months ended March 31, 2013, the fund purchased $1,431,394,000 of investment securities and sold $141,944,000 of investment securities, other than temporary cash investments.
F. Capital shares issued and redeemed were:
| Six Months Ended | Year Ended | |
| March 31, 2013 | September 30, 2012 | |
| Shares | Shares | |
| (000) | (000) | |
| Issued | 111,869 | 176,519 |
| Issued in Lieu of Cash Distributions | 13,102 | 10,863 |
| Redeemed | (34,792) | (99,852) |
| Net Increase (Decrease) in Shares Outstanding | 90,179 | 87,530 |
G. In preparing the financial statements as of March 31, 2013, management considered the impact of subsequent events for potential recognition or disclosure in these financial statements.
In February 2013, Vanguard announced plans to reallocate 20% of the fund’s fixed income exposure to foreign bonds, through an investment in Vanguard Total International Bond Index Fund. The fund’s overall fixed income allocation and its strategic asset allocation are not changing. The transition is expected to be completed by June 30, 2013.
31
Target Retirement 2050 Fund
Fund Profile
As of March 31, 2013
| Total Fund Characteristics | |
| Ticker Symbol | VFIFX |
| 30-Day SEC Yield | 2.08% |
| Acquired Fund Fees and Expenses1 | 0.18% |
| Allocation to Underlying Vanguard Funds | |
| Vanguard Total Stock Market Index Fund | |
| Investor Shares | 63.2% |
| Vanguard Total International Stock Index | |
| Fund Investor Shares | 26.8% |
| Vanguard Total Bond Market II Index Fund | |
| Investor Shares | 10.0% |
| Total Fund Volatility Measures | ||
| Target 2050 | MSCI US | |
| Composite | Broad Market | |
| Index | Index | |
| R-Squared | 1.00 | 0.98 |
| Beta | 1.00 | 0.92 |
These measures show the degree and timing of the fund’s fluctuations compared with the indexes over 36 months.
Fund Asset Allocation
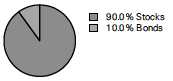
1 This figure—drawn from the prospectus dated January 28, 2013—represents an estimate of the weighted average of the expense ratios and any transaction fees charged by the underlying mutual funds (the ”acquired” funds) in which the Target Retirement 2050 Fund invests. The fund does not charge any expenses or fees of its own. For the six months ended March 31, 2013, the annualized acquired fund fees and expenses were 0.18%.
32
Target Retirement 2050 Fund
Performance Summary
All of the returns in this report represent past performance, which is not a guarantee of future results that may be achieved by the fund. (Current performance may be lower or higher than the performance data cited. For performance data current to the most recent month-end, visit our website at vanguard.com/performance.) Note, too, that both investment returns and principal value can fluctuate widely, so an investor’s shares, when sold, could be worth more or less than their original cost. The returns shown do not reflect taxes that a shareholder would pay on fund distributions or on the sale of fund shares.
Fiscal-Year Total Returns (%): June 7, 2006, Through March 31, 2013
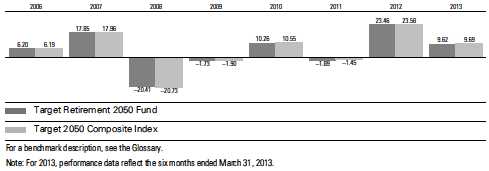 +
+| Average Annual Total Returns: Periods Ended March 31, 2013 | ||||||
| Since Inception | ||||||
| Inception Date | One Year | Five Years | Income | Capital | Total | |
| Target Retirement 2050 | ||||||
| Fund | 6/7/2006 | 11.75% | 4.99% | 2.00% | 3.42% | 5.42% |
See Financial Highlights for dividend and capital gains information.
33
Target Retirement 2050 Fund
Financial Statements (unaudited)
Statement of Net Assets
As of March 31, 2013
The fund reports a complete list of its holdings in regulatory filings four times in each fiscal year, at the quarter-ends. For the second and fourth fiscal quarters, the lists appear in the fund’s semiannual and annual reports to shareholders. For the first and third fiscal quarters, the fund files the lists with the Securities and Exchange Commission on Form N-Q. Shareholders can look up the fund’s Forms N-Q on the SEC’s website at sec.gov. Forms N-Q may also be reviewed and copied at the SEC’s Public Reference Room (see the back cover of this report for further information).
| Market | ||
| Value | ||
| Shares | ($000) | |
| Investment Companies (99.9%) | ||
| U.S. Stock Fund (63.1%) | ||
| Vanguard Total Stock Market Index Fund Investor Shares | 73,214,800 | 2,883,931 |
| International Stock Fund (26.8%) | ||
| Vanguard Total International Stock Index Fund Investor Shares | 79,686,756 | 1,224,786 |
| Bond Fund (10.0%) | ||
| 1 Vanguard Total Bond Market II Index Fund Investor Shares | 41,972,260 | 457,917 |
| Total Investment Companies (Cost $3,835,968) | 4,566,634 | |
| Temporary Cash Investment (0.0%) | ||
| Money Market Fund (0.0%) | ||
| 1 Vanguard Market Liquidity Fund, 0.147% (Cost $604) | 603,825 | 604 |
| Total Investments (99.9%) (Cost $3,836,572) | 4,567,238 | |
| Other Assets and Liabilities (0.1%) | ||
| Other Assets | 17,801 | |
| Liabilities | (15,354) | |
| 2,447 | ||
| Net Assets (100%) | ||
| Applicable to 183,898,853 outstanding $.001 par value shares of | ||
| beneficial interest (unlimited authorization) | 4,569,685 | |
| Net Asset Value Per Share | $24.85 | |
| At March 31, 2013, net assets consisted of: | |
| Amount | |
| ($000) | |
| Paid-in Capital | 3,827,732 |
| Undistributed Net Investment Income | 16,863 |
| Accumulated Net Realized Losses | (5,576) |
| Unrealized Appreciation (Depreciation) | 730,666 |
| Net Assets | 4,569,685 |
See Note A in Notes to Financial Statements.
1 Affiliated fund available only to Vanguard funds and certain trusts and accounts managed by Vanguard. Rate shown for Vanguard Market Liquidity Fund is the 7-day yield.
See accompanying Notes, which are an integral part of the Financial Statements.
34
Target Retirement 2050 Fund
| Statement of Operations | |
| Six Months Ended | |
| March 31, 2013 | |
| ($000) | |
| Investment Income | |
| Income | |
| Income Distributions Received | 49,261 |
| Net Investment Income—Note B | 49,261 |
| Realized Net Gain (Loss) | |
| Capital Gain Distributions Received | 2,178 |
| Investment Securities Sold | (744) |
| Realized Net Gain (Loss) | 1,434 |
| Change in Unrealized Appreciation (Depreciation) of Investment Securities | 324,931 |
| Net Increase (Decrease) in Net Assets Resulting from Operations | 375,626 |
See accompanying Notes, which are an integral part of the Financial Statements.
35
Target Retirement 2050 Fund
| Statement of Changes in Net Assets | ||
| Six Months Ended | Year Ended | |
| March 31, | September 30, | |
| 2013 | 2012 | |
| ($000) | ($000) | |
| Increase (Decrease) in Net Assets | ||
| Operations | ||
| Net Investment Income | 49,261 | 75,474 |
| Realized Net Gain (Loss) | 1,434 | 3,866 |
| Change in Unrealized Appreciation (Depreciation) | 324,931 | 465,291 |
| Net Increase (Decrease) in Net Assets Resulting from Operations | 375,626 | 544,631 |
| Distributions | ||
| Net Investment Income | (79,191) | (50,671) |
| Realized Capital Gain1 | (1,138) | (923) |
| Total Distributions | (80,329) | (51,594) |
| Capital Share Transactions | ||
| Issued | 1,007,501 | 1,387,997 |
| Issued in Lieu of Cash Distributions | 79,320 | 51,071 |
| Redeemed | (279,751) | (538,920) |
| Net Increase (Decrease) from Capital Share Transactions | 807,070 | 900,148 |
| Total Increase (Decrease) | 1,102,367 | 1,393,185 |
| Net Assets | ||
| Beginning of Period | 3,467,318 | 2,074,133 |
| End of Period2 | 4,569,685 | 3,467,318 |
1 Includes fiscal 2013 and 2012 short-term gain distributions totaling $1,138,000 and $923,000, respectively. Short-term gain distributions are treated as ordinary income dividends for tax purposes.
2 Net Assets—End of Period includes undistributed net investment income of $16,863,000 and $46,793,000.
See accompanying Notes, which are an integral part of the Financial Statements.
36
Target Retirement 2050 Fund
| Financial Highlights | ||||||
| Six Months | ||||||
| Ended | ||||||
| For a Share Outstanding | March 31, | Year Ended September 30, | ||||
| Throughout Each Period | 2013 | 2012 | 2011 | 2010 | 2009 | 2008 |
| Net Asset Value, Beginning of Period | $23.16 | $19.17 | $20.10 | $18.58 | $19.43 | $24.79 |
| Investment Operations | ||||||
| Net Investment Income | . 266 | . 549 | . 360 | . 399 | . 4311 | .5031 |
| Capital Gain Distributions Received | .013 | .022 | .006 | — | — | — |
| Net Realized and Unrealized Gain (Loss) | ||||||
| on Investments | 1.905 | 3.866 | (. 682) | 1.492 | (. 866) | (5.493) |
| Total from Investment Operations | 2.184 | 4.437 | (. 316) | 1.891 | (. 435) | (4.990) |
| Distributions | ||||||
| Dividends from Net Investment Income | (. 487) | (. 439) | (. 370) | (. 371) | (. 415) | (. 370) |
| Distributions from Realized Capital Gains | (. 007) | (. 008) | (. 244) | — | — | — |
| Total Distributions | (. 494) | (. 447) | (. 614) | (. 371) | (. 415) | (. 370) |
| Net Asset Value, End of Period | $24.85 | $23.16 | $19.17 | $20.10 | $18.58 | $19.43 |
| Total Return2 | 9.62% | 23.46% | -1.89% | 10.26% | -1.73% | -20.41% |
| Ratios/Supplemental Data | ||||||
| Net Assets, End of Period (Millions) | $4,570 | $3,467 | $2,074 | $1,517 | $924 | $409 |
| Ratio of Total Expenses to | ||||||
| Average Net Assets | — | — | — | — | — | — |
| Acquired Fund Fees and Expenses | 0.18% | 0.18% | 0.19% | 0.19% | 0.21% | 0.19% |
| Ratio of Net Investment Income to | ||||||
| Average Net Assets | 2.51% | 2.70% | 1.79% | 2.21% | 2.74% | 2.27% |
| Portfolio Turnover Rate | 4% | 4% | 15%3 | 10% | 8%4 | 4% |
The expense ratio, acquired fund fees and expenses, net income ratio, and turnover rate for the current period have been annualized.
1 Calculated based on average shares outstanding.
2 Total returns do not include account service fees that may have applied in the periods shown. Fund prospectuses provide information about any applicable account service fees.
3 Excludes the value of mutual fund shares delivered and received in connection with a change in the fund’s international equity investments from Vanguard European, Pacific, and Emerging Markets Stock Index Funds to Vanguard Total International Stock Index Fund because those transactions were effected in kind and did not cause the fund to incur transaction costs.
4 Excludes the value of mutual fund shares delivered and received in connection with a change in the fund’s bond investments from Vanguard Total Bond Market Index Fund to Vanguard Total Bond Market II Index Fund because those transactions were effected in kind and did not cause the fund to incur transaction costs.
See accompanying Notes, which are an integral part of the Financial Statements.
37
Target Retirement 2050 Fund
Notes to Financial Statements
Vanguard Target Retirement 2050 Fund is registered under the Investment Company Act of 1940 as an open-end investment company, or mutual fund. The fund follows a balanced investment strategy by investing in selected Vanguard funds to achieve its targeted allocation of assets to U.S. stocks, international stocks, and bonds.
A. The following significant accounting policies conform to generally accepted accounting principles for U.S. mutual funds. The fund consistently follows such policies in preparing its financial statements.
1. Security Valuation: Investments are valued at the net asset value of each underlying Vanguard fund determined as of the close of the New York Stock Exchange (generally 4 p.m., Eastern time) on the valuation date. See Note C.
2. Federal Income Taxes: The fund intends to continue to qualify as a regulated investment company and distribute all of its taxable income. Management has analyzed the fund’s tax positions taken for all open federal income tax years (September 30, 2009–2012), and for the period ended March 31, 2013, and has concluded that no provision for federal income tax is required in the fund’s financial statements.
3. Distributions: Distributions to shareholders are recorded on the ex-dividend date.
4. Other: Income and capital gain distributions received are recorded on the ex-dividend date. Security transactions are accounted for on the date securities are bought or sold. Costs used to determine realized gains (losses) on the sale of investment securities are those of the specific securities sold.
B. Under a service agreement, The Vanguard Group furnishes investment advisory, corporate management, administrative, marketing, and distribution services to the fund. The service agreement provides that the fund’s expenses may be reduced or eliminated to the extent of savings realized by the Vanguard funds by the operation of the fund. Accordingly, all incremental expenses for services provided by Vanguard and all other expenses incurred by the fund during the period ended March 31, 2013, were borne by the funds in which the fund invests. The fund’s trustees and officers are also directors and officers of Vanguard and the funds in which the fund invests.
C. Various inputs may be used to determine the value of the fund’s investments. These inputs are summarized in three broad levels for financial statement purposes. The inputs or methodologies used to value securities are not necessarily an indication of the risk associated with investing in those securities.
Level 1—Quoted prices in active markets for identical securities.
Level 2—Other significant observable inputs (including quoted prices for similar securities, interest rates, prepayment speeds, credit risk, etc.).
Level 3—Significant unobservable inputs (including the fund’s own assumptions used to determine the fair value of investments).
The following table summarizes the market value of the fund’s investments as of March 31, 2013, based on the inputs used to value them:
| Level 1 | Level 2 | Level 3 | |
| Investments | ($000) | ($000) | ($000) |
| Investment Companies | 3,341,848 | 1,224,786 | — |
| Temporary Cash Investments | 604 | — | — |
| Total | 3,342,452 | 1,224,786 | — |
38
Target Retirement 2050 Fund
The fund’s investment in Vanguard Total International Stock Index Fund is normally valued based on Level 1 inputs but was valued in this report based on Level 2 inputs. The most recent quoted net asset value for this underlying fund was as of March 28, 2013. For financial statement purposes, this net asset value was adjusted to revalue certain of the fund’s securities based on March 29, 2013, closing prices because their local markets were open while U.S. markets were closed.
D. Distributions are determined on a tax basis and may differ from net investment income and realized capital gains for financial reporting purposes. Differences may be permanent or temporary. Permanent differences are reclassified among capital accounts in the financial statements to reflect their tax character. Temporary differences arise when certain items of income, expense, gain, or loss are recognized in different periods for financial statement and tax purposes; these differences will reverse at some time in the future. Differences in classification may also result from the treatment of short-term gains as ordinary income for tax purposes.
The fund’s tax-basis capital gains and losses are determined only at the end of each fiscal year. For tax purposes, at September 30, 2012, the fund had available capital losses totaling $6,063,000 that may be carried forward indefinitely to offset future net capital gains. The fund will use these capital losses to offset net taxable capital gains, if any, realized during the year ending September 30, 2013; should the fund realize net capital losses for the year, the losses will be added to the loss carryforward balance above. Capital gain distributions paid during the six months ended March 31, 2013, are from short-term gain distributions received from Vanguard Total Bond Market II Index Fund.
At March 31, 2013, the cost of investment securities for tax purposes was $3,836,572,000. Net unrealized appreciation of investment securities for tax purposes was $730,666,000, consisting entirely of unrealized gains on securities that had risen in value since their purchase.
E. During the six months ended March 31, 2013, the fund purchased $861,567,000 of investment securities and sold $76,102,000 of investment securities, other than temporary cash investments.
F. Capital shares issued and redeemed were:
| Six Months Ended | Year Ended | |
| March 31, 2013 | September 30, 2012 | |
| Shares | Shares | |
| (000) | (000) | |
| Issued | 42,477 | 64,017 |
| Issued in Lieu of Cash Distributions | 3,480 | 2,499 |
| Redeemed | (11,789) | (25,002) |
| Net Increase (Decrease) in Shares Outstanding | 34,168 | 41,514 |
G. In preparing the financial statements as of March 31, 2013, management considered the impact of subsequent events for potential recognition or disclosure in these financial statements.
In February 2013, Vanguard announced plans to reallocate 20% of the fund’s fixed income exposure to foreign bonds, through an investment in Vanguard Total International Bond Index Fund. The fund’s overall fixed income allocation and its strategic asset allocation are not changing. The transition is expected to be completed by June 30, 2013.
39
Target Retirement 2055 Fund
Fund Profile
As of March 31, 2013
| Total Fund Characteristics | |
| Ticker Symbol | VFFVX |
| 30-Day SEC Yield | 2.08% |
| Acquired Fund Fees and Expenses1 | 0.18% |
| Allocation to Underlying Vanguard Funds | |
| Vanguard Total Stock Market Index Fund | |
| Investor Shares | 63.0% |
| Vanguard Total International Stock Index | |
| Fund Investor Shares | 27.0% |
| Vanguard Total Bond Market II Index Fund | |
| Investor Shares | 10.0% |
Fund Asset Allocation
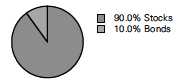
1 This figure—drawn from the prospectus dated January 28, 2013—represents an estimate of the weighted average of the expense ratios and any transaction fees charged by the underlying mutual funds (the ”acquired” funds) in which the Target Retirement 2055 Fund invests. The fund does not charge any expenses or fees of its own. For the six months ended March 31, 2013, the annualized acquired fund fees and expenses were 0.18%.
40
Target Retirement 2055 Fund
Performance Summary
All of the returns in this report represent past performance, which is not a guarantee of future results that may be achieved by the fund. (Current performance may be lower or higher than the performance data cited. For performance data current to the most recent month-end, visit our website at vanguard.com/performance.) Note, too, that both investment returns and principal value can fluctuate widely, so an investor’s shares, when sold, could be worth more or less than their original cost. The returns shown do not reflect taxes that a shareholder would pay on fund distributions or on the sale of fund shares.
Fiscal-Year Total Returns (%): August 18, 2010, Through March 31, 2013
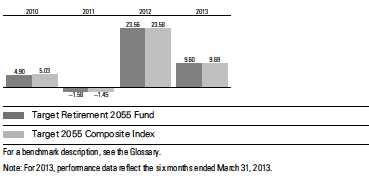
| Average Annual Total Returns: Periods Ended March 31, 2013 | |||||
| Since Inception | |||||
| Inception Date | One Year | Income | Capital | Total | |
| Target Retirement 2055 | |||||
| Fund | 8/18/2010 | 11.76% | 1.87% | 11.79% | 13.66% |
See Financial Highlights for dividend and capital gains information.
41
Target Retirement 2055 Fund
Financial Statements (unaudited)
Statement of Net Assets
As of March 31, 2013
The fund reports a complete list of its holdings in regulatory filings four times in each fiscal year, at the quarter-ends. For the second and fourth fiscal quarters, the lists appear in the fund’s semiannual and annual reports to shareholders. For the first and third fiscal quarters, the fund files the lists with the Securities and Exchange Commission on Form N-Q. Shareholders can look up the fund’s Forms N-Q on the SEC’s website at sec.gov. Forms N-Q may also be reviewed and copied at the SEC’s Public Reference Room (see the back cover of this report for further information).
| Market | ||
| Value | ||
| Shares | ($000) | |
| Investment Companies (99.9%) | ||
| U.S. Stock Fund (63.0%) | ||
| Vanguard Total Stock Market Index Fund Investor Shares | 10,565,566 | 416,178 |
| International Stock Fund (26.9%) | ||
| Vanguard Total International Stock Index Fund Investor Shares | 11,586,868 | 178,090 |
| Bond Fund (10.0%) | ||
| 1 Vanguard Total Bond Market II Index Fund Investor Shares | 6,054,473 | 66,054 |
| Total Investment Companies (Cost $597,193) | 660,322 | |
| Temporary Cash Investment (0.1%) | ||
| Money Market Fund (0.1%) | ||
| 1 Vanguard Market Liquidity Fund, 0.147% (Cost $746) | 746,310 | 746 |
| Total Investments (100.0%) (Cost $597,939) | 661,068 | |
| Other Assets and Liabilities (0.0%) | ||
| Other Assets | 4,642 | |
| Liabilities | (4,472) | |
| 170 | ||
| Net Assets (100%) | ||
| Applicable to 24,774,153 outstanding $.001 par value shares of | ||
| beneficial interest (unlimited authorization) | 661,238 | |
| Net Asset Value Per Share | $26.69 | |
| At March 31, 2013, net assets consisted of: | |
| Amount | |
| ($000) | |
| Paid-in Capital | 595,751 |
| Undistributed Net Investment Income | 2,384 |
| Accumulated Net Realized Losses | (26) |
| Unrealized Appreciation (Depreciation) | 63,129 |
| Net Assets | 661,238 |
See Note A in Notes to Financial Statements.
1 Affiliated fund available only to Vanguard funds and certain trusts and accounts managed by Vanguard. Rate shown for Vanguard Market Liquidity Fund is the 7-day yield.
See accompanying Notes, which are an integral part of the Financial Statements.
42
Target Retirement 2055 Fund
| Statement of Operations | |
| Six Months Ended | |
| March 31, 2013 | |
| ($000) | |
| Investment Income | |
| Income | |
| Income Distributions Received | 6,356 |
| Net Investment Income—Note B | 6,356 |
| Realized Net Gain (Loss) | |
| Capital Gain Distributions Received | 275 |
| Investment Securities Sold | (171) |
| Realized Net Gain (Loss) | 104 |
| Change in Unrealized Appreciation (Depreciation) of Investment Securities | 43,307 |
| Net Increase (Decrease) in Net Assets Resulting from Operations | 49,767 |
See accompanying Notes, which are an integral part of the Financial Statements.
43
Target Retirement 2055 Fund
| Statement of Changes in Net Assets | ||
| Six Months Ended | Year Ended | |
| March 31, | September 30, | |
| 2013 | 2012 | |
| ($000) | ($000) | |
| Increase (Decrease) in Net Assets | ||
| Operations | ||
| Net Investment Income | 6,356 | 6,645 |
| Realized Net Gain (Loss) | 104 | 414 |
| Change in Unrealized Appreciation (Depreciation) | 43,307 | 35,775 |
| Net Increase (Decrease) in Net Assets Resulting from Operations | 49,767 | 42,834 |
| Distributions | ||
| Net Investment Income | (8,415) | (2,904) |
| Realized Capital Gain1 | (245) | (97) |
| Total Distributions | (8,660) | (3,001) |
| Capital Share Transactions | ||
| Issued | 276,175 | 286,736 |
| Issued in Lieu of Cash Distributions | 8,573 | 2,985 |
| Redeemed | (45,391) | (73,016) |
| Net Increase (Decrease) from Capital Share Transactions | 239,357 | 216,705 |
| Total Increase (Decrease) | 280,464 | 256,538 |
| Net Assets | ||
| Beginning of Period | 380,774 | 124,236 |
| End of Period2 | 661,238 | 380,774 |
1 Includes fiscal 2013 and 2012 short-term gain distributions totaling $132,000 and $97,000, respectively. Short-term gain distributions are treated as ordinary income dividends for tax purposes.
2 Net Assets—End of Period includes undistributed net investment income of $2,384,000 and $4,443,000.
See accompanying Notes, which are an integral part of the Financial Statements.
44
Target Retirement 2055 Fund
| Financial Highlights | ||||
| Six Months | Year Ended | Aug. 18, | ||
| Ended | September 30, | 20101 to | ||
| March 31, | Sept. 30, | |||
| For a Share Outstanding Throughout Each Period | 2013 | 2012 | 2011 | 2010 |
| Net Asset Value, Beginning of Period | $24.81 | $20.45 | $20.98 | $20.00 |
| Investment Operations | ||||
| Net Investment Income | .3202 | .540 | .3882 | .063 |
| Capital Gain Distributions Received | .0142 | .022 | .001 | — |
| Net Realized and Unrealized Gain (Loss) on Investments | 2.006 | 4.202 | (.698) | .917 |
| Total from Investment Operations | 2.340 | 4.764 | (.309) | .980 |
| Distributions | ||||
| Dividends from Net Investment Income | (.447) | (.391) | (.179) | — |
| Distributions from Realized Capital Gains | (.013) | (.013) | (.042) | — |
| Total Distributions | (.460) | (.404) | (.221) | — |
| Net Asset Value, End of Period | $26.69 | $24.81 | $20.45 | $20.98 |
| Total Return3 | 9.60% | 23.56% | -1.58% | 4.90% |
| Ratios/Supplemental Data | ||||
| Net Assets, End of Period (Millions) | $661 | $381 | $124 | $2 |
| Ratio of Total Expenses to Average Net Assets | — | — | — | — |
| Acquired Fund Fees and Expenses | 0.18% | 0.18% | 0.19% | 0.22%4 |
| Ratio of Net Investment Income to Average Net Assets | 2.53% | 2.76% | 1.71% | 2.73%4 |
| Portfolio Turnover Rate | 4% | 3% | 12%5 | 3% |
The expense ratio, acquired fund fees and expenses, net income ratio, and turnover rate for the current period have been annualized.
1 Inception.
2 Calculated based on average shares outstanding.
3 Total returns do not include account service fees that may have applied in the periods shown. Fund prospectuses provide information about any applicable account service fees.
4 Annualized.
5 Excludes the value of mutual fund shares delivered and received in connection with a change in the fund’s international equity investments from Vanguard European, Pacific, and Emerging Markets Stock Index Funds to Vanguard Total International Stock Index Fund because those transactions were effected in kind and did not cause the fund to incur transaction costs.
See accompanying Notes, which are an integral part of the Financial Statements.
45
Target Retirement 2055 Fund
Notes to Financial Statements
Vanguard Target Retirement 2055 Fund is registered under the Investment Company Act of 1940 as an open-end investment company, or mutual fund. The fund follows a balanced investment strategy by investing in selected Vanguard funds to achieve its targeted allocation of assets to U.S. stocks, international stocks, and bonds.
A. The following significant accounting policies conform to generally accepted accounting principles for U.S. mutual funds. The fund consistently follows such policies in preparing its financial statements.
1. Security Valuation: Investments are valued at the net asset value of each underlying Vanguard fund determined as of the close of the New York Stock Exchange (generally 4 p.m., Eastern time) on the valuation date. See Note C.
2. Federal Income Taxes: The fund intends to continue to qualify as a regulated investment company and distribute all of its taxable income. Management has analyzed the fund’s tax positions taken for all open federal income tax years (September 30, 2010–2012), and for the period ended March 31, 2013, and has concluded that no provision for federal income tax is required in the fund’s financial statements.
3. Distributions: Distributions to shareholders are recorded on the ex-dividend date.
4. Other: Income and capital gain distributions received are recorded on the ex-dividend date. Security transactions are accounted for on the date securities are bought or sold. Costs used to determine realized gains (losses) on the sale of investment securities are those of the specific securities sold.
B. Under a service agreement, The Vanguard Group furnishes investment advisory, corporate management, administrative, marketing, and distribution services to the fund. The service agreement provides that the fund’s expenses may be reduced or eliminated to the extent of savings realized by the Vanguard funds by the operation of the fund. Accordingly, all incremental expenses for services provided by Vanguard and all other expenses incurred by the fund during the period ended March 31, 2013, were borne by the funds in which the fund invests. The fund’s trustees and officers are also directors and officers of Vanguard and the funds in which the fund invests.
C. Various inputs may be used to determine the value of the fund’s investments. These inputs are summarized in three broad levels for financial statement purposes. The inputs or methodologies used to value securities are not necessarily an indication of the risk associated with investing in those securities.
Level 1—Quoted prices in active markets for identical securities.
Level 2—Other significant observable inputs (including quoted prices for similar securities, interest rates, prepayment speeds, credit risk, etc.).
Level 3—Significant unobservable inputs (including the fund’s own assumptions used to determine the fair value of investments).
The following table summarizes the market value of the fund’s investments as of March 31, 2013, based on the inputs used to value them:
| Level 1 | Level 2 | Level 3 | |
| Investments | ($000) | ($000) | ($000) |
| Investment Companies | 482,232 | 178,090 | — |
| Temporary Cash Investments | 746 | — | — |
| Total | 482,978 | 178,090 | — |
46
Target Retirement 2055 Fund
The fund’s investment in Vanguard Total International Stock Index Fund is normally valued based on Level 1 inputs but was valued in this report based on Level 2 inputs. The most recent quoted net asset value for this underlying fund was as of March 28, 2013. For financial statement purposes, this net asset value was adjusted to revalue certain of the fund’s securities based on March 29, 2013, closing prices because their local markets were open while U.S. markets were closed.
D. Distributions are determined on a tax basis and may differ from net investment income and realized capital gains for financial reporting purposes. Differences may be permanent or temporary. Permanent differences are reclassified among capital accounts in the financial statements to reflect their tax character. Temporary differences arise when certain items of income, expense, gain, or loss are recognized in different periods for financial statement and tax purposes; these differences will reverse at some time in the future. Differences in classification may also result from the treatment of short-term gains as ordinary income for tax purposes. The fund’s tax-basis capital gains and losses are determined only at the end of each fiscal year.
At March 31, 2013, the cost of investment securities for tax purposes was $597,939,000. Net unrealized appreciation of investment securities for tax purposes was $63,129,000, consisting entirely of unrealized gains on securities that had risen in value since their purchase.
E. During the six months ended March 31, 2013, the fund purchased $250,035,000 of investment securities and sold $10,947,000 of investment securities, other than temporary cash investments.
F. Capital shares issued and redeemed were:
| Six Months Ended | Year Ended | |
| March 31, 2013 | September 30, 2012 | |
| Shares | Shares | |
| (000) | (000) | |
| Issued | 10,838 | 12,295 |
| Issued in Lieu of Cash Distributions | 350 | 136 |
| Redeemed | (1,764) | (3,155) |
| Net Increase (Decrease) in Shares Outstanding | 9,424 | 9,276 |
G. In preparing the financial statements as of March 31, 2013, management considered the impact of subsequent events for potential recognition or disclosure in these financial statements.
In February 2013, Vanguard announced plans to reallocate 20% of the fund’s fixed income exposure to foreign bonds, through an investment in Vanguard Total International Bond Index Fund. The fund’s overall fixed income allocation and its strategic asset allocation are not changing. The transition is expected to be completed by June 30, 2013.
47
Target Retirement 2060 Fund
Fund Profile
As of March 31, 2013
| Total Fund Characteristics | |
| Ticker Symbol | VTTSX |
| 30-Day SEC Yield | 2.07% |
| Acquired Fund Fees and Expenses1 | 0.18% |
| Allocation to Underlying Vanguard Funds | |
| Vanguard Total Stock Market Index Fund | |
| Investor Shares | 63.0% |
| Vanguard Total International Stock Index | |
| Fund Investor Shares | 27.0% |
| Vanguard Total Bond Market II Index Fund | |
| Investor Shares | 10.0% |
Fund Asset Allocation
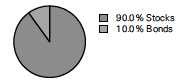
1 This figure—drawn from the prospectus dated January 28, 2013—represents an estimate of the weighted average of the expense ratios and any transaction fees charged by the underlying mutual funds (the ”acquired” funds) in which the Target Retirement 2060 Fund invests. The fund does not charge any expenses or fees of its own. For the six months ended March 31, 2013, the annualized acquired fund fees and expenses were 0.18%.
48
Target Retirement 2060 Fund
Performance Summary
All of the returns in this report represent past performance, which is not a guarantee of future results that may be achieved by the fund. (Current performance may be lower or higher than the performance data cited. For performance data current to the most recent month-end, visit our website at vanguard.com/performance.) Note, too, that both investment returns and principal value can fluctuate widely, so an investor’s shares, when sold, could be worth more or less than their original cost. The returns shown do not reflect taxes that a shareholder would pay on fund distributions or on the sale of fund shares.
Fiscal-Year Total Returns (%): January 19, 2012, Through March 31, 2013
| Average Annual Total Returns: Periods Ended March 31, 2013 | |||||
| Since Inception | |||||
| Inception Date | One Year | Income | Capital | Total | |
| Target Retirement 2060 | |||||
| Fund | 1/19/2012 | 12.04% | 1.40% | 14.36% | 15.76% |
See Financial Highlights for dividend and capital gains information.
49
Target Retirement 2060 Fund
Financial Statements (unaudited)
Statement of Net Assets
As of March 31, 2013
The fund reports a complete list of its holdings in regulatory filings four times in each fiscal year, at the quarter-ends. For the second and fourth fiscal quarters, the lists appear in the fund’s semiannual and annual reports to shareholders. For the first and third fiscal quarters, the fund files the lists with the Securities and Exchange Commission on Form N-Q. Shareholders can look up the fund’s Forms N-Q on the SEC’s website at sec.gov. Forms N-Q may also be reviewed and copied at the SEC’s Public Reference Room (see the back cover of this report for further information).
| Market | ||
| Value | ||
| Shares | ($000) | |
| Investment Companies (99.2%) | ||
| U.S. Stock Fund (62.5%) | ||
| Vanguard Total Stock Market Index Fund Investor Shares | 1,690,195 | 66,577 |
| International Stock Fund (26.8%) | ||
| Vanguard Total International Stock Index Fund Investor Shares | 1,853,598 | 28,490 |
| Bond Fund (9.9%) | ||
| 1 Vanguard Total Bond Market II Index Fund Investor Shares | 968,424 | 10,565 |
| Total Investment Companies (Cost $98,937) | 105,632 | |
| Temporary Cash Investment (0.1%) | ||
| Money Market Fund (0.1%) | ||
| 1 Vanguard Market Liquidity Fund, 0.147% (Cost $90) | 90,273 | 90 |
| Total Investments (99.3%) (Cost $99,027) | 105,722 | |
| Other Assets and Liabilities (0.7%) | ||
| Other Assets | 1,615 | |
| Liabilities | (881) | |
| 734 | ||
| Net Assets (100%) | ||
| Applicable to 4,536,788 outstanding $.001 par value shares of | ||
| beneficial interest (unlimited authorization) | 106,456 | |
| Net Asset Value Per Share | $23.47 | |
| At March 31, 2013, net assets consisted of: | |
| Amount | |
| ($000) | |
| Paid-in Capital | 99,375 |
| Undistributed Net Investment Income | 372 |
| Accumulated Net Realized Gains | 14 |
| Unrealized Appreciation (Depreciation) | 6,695 |
| Net Assets | 106,456 |
See Note A in Notes to Financial Statements.
1 Affiliated fund available only to Vanguard funds and certain trusts and accounts managed by Vanguard. Rate shown for Vanguard Market Liquidity Fund is the 7-day yield.
See accompanying Notes, which are an integral part of the Financial Statements.
50
Target Retirement 2060 Fund
| Statement of Operations | |
| Six Months Ended | |
| March 31, 2013 | |
| ($000) | |
| Investment Income | |
| Income | |
| Income Distributions Received | 822 |
| Net Investment Income—Note B | 822 |
| Realized Net Gain (Loss) | |
| Capital Gain Distributions Received | 34 |
| Investment Securities Sold | 166 |
| Realized Net Gain (Loss) | 200 |
| Change in Unrealized Appreciation (Depreciation) of Investment Securities | 5,466 |
| Net Increase (Decrease) in Net Assets Resulting from Operations | 6,488 |
See accompanying Notes, which are an integral part of the Financial Statements.
51
Target Retirement 2060 Fund
| Statement of Changes in Net Assets | ||
| January 19, | ||
| Six Months Ended | 20121 to | |
| March 31, | September 30, | |
| 2013 | 2012 | |
| ($000) | ($000) | |
| Increase (Decrease) in Net Assets | ||
| Operations | ||
| Net Investment Income | 822 | 334 |
| Realized Net Gain (Loss) | 200 | (171) |
| Change in Unrealized Appreciation (Depreciation) | 5,466 | 1,229 |
| Net Increase (Decrease) in Net Assets Resulting from Operations | 6,488 | 1,392 |
| Distributions | ||
| Net Investment Income | (784) | — |
| Realized Capital Gain2 | (15) | — |
| Total Distributions | (799) | — |
| Capital Share Transactions | ||
| Issued | 80,393 | 43,919 |
| Issued in Lieu of Cash Distributions | 790 | — |
| Redeemed | (13,645) | (12,082) |
| Net Increase (Decrease) from Capital Share Transactions | 67,538 | 31,837 |
| Total Increase (Decrease) | 73,227 | 33,229 |
| Net Assets | ||
| Beginning of Period | 33,229 | — |
| End of Period3 | 106,456 | 33,229 |
1 Inception.
2 Includes fiscal 2013 short-term gain distributions totaling $15,000. Short-term gain distributions are treated as ordinary income dividends for tax purposes.
3 Net Assets—End of Period includes undistributed net investment income of $372,000 and $334,000.
See accompanying Notes, which are an integral part of the Financial Statements.
52
Target Retirement 2060 Fund
| Financial Highlights | ||
| Six Months | Jan. 19, | |
| Ended | 20121 to | |
| March 31, | Sept. 30, | |
| For a Share Outstanding Throughout Each Period | 2013 | 2012 |
| Net Asset Value, Beginning of Period | $21.74 | $20.00 |
| Investment Operations | ||
| Net Investment Income | .2862 | .218 |
| Capital Gain Distributions Received | .0122 | .002 |
| Net Realized and Unrealized Gain (Loss) on Investments | 1.753 | 1.520 |
| Total from Investment Operations | 2.051 | 1.740 |
| Distributions | ||
| Dividends from Net Investment Income | (.315) | — |
| Distributions from Realized Capital Gains | (.006) | — |
| Total Distributions | (.321) | — |
| Net Asset Value, End of Period | $23.47 | $21.74 |
| Total Return3 | 9.57% | 8.70% |
| Ratios/Supplemental Data | ||
| Net Assets, End of Period (Millions) | $106 | $33 |
| Ratio of Total Expenses to Average Net Assets | — | — |
| Acquired Fund Fees and Expenses | 0.18% | 0.18%4 |
| Ratio of Net Investment Income to Average Net Assets | 2.59% | 2.99%4 |
| Portfolio Turnover Rate | 11% | 40% |
The expense ratio, acquired fund fees and expenses, net income ratio, and turnover rate for the current period have been annualized.
1 Inception.
2 Calculated based on average shares outstanding.
3 Total returns do not include account service fees that may have applied in the periods shown. Fund prospectuses provide information about any applicable account service fees.
4 Annualized.
See accompanying Notes, which are an integral part of the Financial Statements.
53
Target Retirement 2060 Fund
Notes to Financial Statements
Vanguard Target Retirement 2060 Fund is registered under the Investment Company Act of 1940 as an open-end investment company, or mutual fund. The fund follows a balanced investment strategy by investing in selected Vanguard funds to achieve its targeted allocation of assets to U.S. stocks, international stocks, and bonds.
A. The following significant accounting policies conform to generally accepted accounting principles for U.S. mutual funds. The fund consistently follows such policies in preparing its financial statements
1. Security Valuation: Investments are valued at the net asset value of each underlying Vanguard fund determined as of the close of the New York Stock Exchange (generally 4 p.m., Eastern time) on the valuation date. See Note C.
2. Federal Income Taxes: The fund intends to continue to qualify as a regulated investment company and distribute all of its taxable income. Management has analyzed the fund’s tax positions taken for its open federal income tax year ended September 30, 2012, and for the period ended March 31, 2013, and has concluded that no provision for federal income tax is required in the fund’s financial statements
3. Distributions: Distributions to shareholders are recorded on the ex-dividend date.
4. Other: Income and capital gain distributions received are recorded on the ex-dividend date. Security transactions are accounted for on the date securities are bought or sold. Costs used to determine realized gains (losses) on the sale of investment securities are those of the specific securities sold.
B. Under a service agreement, The Vanguard Group furnishes investment advisory, corporate management, administrative, marketing, and distribution services to the fund. The service agreement provides that the fund’s expenses may be reduced or eliminated to the extent of savings realized by the Vanguard funds by the operation of the fund. Accordingly, all incremental expenses for services provided by Vanguard and all other expenses incurred by the fund during the period ended March 31, 2013, were borne by the funds in which the fund invests. The fund’s trustees and officers are also directors and officers of Vanguard and the funds in which the fund invests.
C. Various inputs may be used to determine the value of the fund’s investments. These inputs are summarized in three broad levels for financial statement purposes. The inputs or methodologies used to value securities are not necessarily an indication of the risk associated with investing in those securities.
Level 1—Quoted prices in active markets for identical securities.
Level 2—Other significant observable inputs (including quoted prices for similar securities, interest rates, prepayment speeds, credit risk, etc.).
Level 3—Significant unobservable inputs (including the fund’s own assumptions used to determine the fair value of investments).
The following table summarizes the market value of the fund’s investments as of March 31, 2013, based on the inputs used to value them:
| Level 1 | Level 2 | Level 3 | |
| Investments | ($000) | ($000) | ($000) |
| Investment Companies | 77,142 | 28,490 | — |
| Temporary Cash Investments | 90 | — | — |
| Total | 77,232 | 28,490 | — |
54
Target Retirement 2060 Fund
The fund’s investment in Vanguard Total International Stock Index Fund is normally valued based on Level 1 inputs but was valued in this report based on Level 2 inputs. The most recent quoted net asset value for this underlying fund was as of March 28, 2013. For financial statement purposes, this net asset value was adjusted to revalue certain of the fund’s securities based on March 29, 2013, closing prices because their local markets were open while U.S. markets were closed.
D. Distributions are determined on a tax basis and may differ from net investment income and realized capital gains for financial reporting purposes. Differences may be permanent or temporary. Permanent differences are reclassified among capital accounts in the financial statements to reflect their tax character. Temporary differences arise when certain items of income, expense, gain, or loss are recognized in different periods for financial statement and tax purposes; these differences will reverse at some time in the future. Differences in classification may also result from the treatment of short-term gains as ordinary income for tax purposes.
The fund’s tax-basis capital gains and losses are determined only at the end of each fiscal year. For tax purposes, at September 30, 2012, the fund had available capital losses totaling $4,000 that may be carried forward indefinitely to offset future net capital gains. The fund will use these capital losses to offset net taxable capital gains, if any, realized during the year ending September 30, 2013; should the fund realize net capital losses for the year, the losses will be added to the loss carryforward balance above. Capital gain distributions paid during the six months ended March 31, 2013, are from short-term gain distributions received from Vanguard Total Bond Market II Index Fund.
At March 31, 2013, the cost of investment securities for tax purposes was $99,027,000. Net unrealized appreciation of investment securities for tax purposes was $6,695,000, consisting of unrealized gains of $6,729,000 on securities that had risen in value since their purchase and $34,000 in unrealized losses on securities that had fallen in value since their purchase.
E. During the six months ended March 31, 2013, the fund purchased $70,653,000 of investment securities and sold $3,661,000 of investment securities, other than temporary cash investments.
F. Capital shares issued and redeemed were:
| Six Months Ended | January 19, 20121 to | |
| March 31, 2013 | September 30, 2012 | |
| Shares | Shares | |
| (000) | (000) | |
| Issued | 3,583 | 2,110 |
| Issued in Lieu of Cash Distributions | 37 | — |
| Redeemed | (612) | (581) |
| Net Increase (Decrease) in Shares Outstanding | 3,008 | 1,529 |
| 1 Inception. |
G. In preparing the financial statements as of March 31, 2013, management considered the impact of subsequent events for potential recognition or disclosure in these financial statements.
In February 2013, Vanguard announced plans to reallocate 20% of the fund’s fixed income exposure to foreign bonds, through an investment in Vanguard Total International Bond Index Fund. The fund’s overall fixed income allocation and its strategic asset allocation are not changing. The transition is expected to be completed by June 30, 2013.
55
About Your Fund’s Expenses
As a shareholder of the fund, you incur ongoing costs, which include costs for portfolio management, administrative services, and shareholder reports (like this one), among others. Operating expenses, which are deducted from a fund’s gross income, directly reduce the investment return of the fund.
A typical fund’s expenses are expressed as a percentage of its average net assets. The Target Retirement Funds have no direct expenses, but each fund bears its proportionate share of the costs for the underlying funds in which it invests. These indirect expenses make up the acquired fund fees and expenses, also expressed as a percentage of average net assets.
The following examples are intended to help you understand the ongoing cost (in dollars) of investing in your fund and to compare these costs with those of other mutual funds. The examples are based on an investment of $1,000 made at the beginning of the period shown and held for the entire period. The costs were calculated using the acquired fund fees and expenses for each Target Retirement Fund.
The accompanying table illustrates your fund’s costs in two ways:
• Based on actual fund return. This section helps you to estimate the actual expenses that you paid over the period. The ”Ending Account Value“ shown is derived from the fund‘s actual return, and the third column shows the dollar amount that would have been paid by an investor who started with $1,000 in the fund. You may use the information here, together with the amount you invested, to estimate the expenses that you paid over the period.
To do so, simply divide your account value by $1,000 (for example, an $8,600 account value divided by $1,000 = 8.6), then multiply the result by the number given for your fund under the heading ”Expenses Paid During Period.“
• Based on hypothetical 5% yearly return. This section is intended to help you compare your fund‘s costs with those of other mutual funds. It assumes that the fund had a yearly return of 5% before expenses, but that the expense ratio is unchanged. In this case—because the return used is not the fund’s actual return—the results do not apply to your investment. The example is useful in making comparisons because the Securities and Exchange Commission requires all mutual funds to calculate expenses based on a 5% return. You can assess your fund’s costs by comparing this hypothetical example with the hypothetical examples that appear in shareholder reports of other funds.
Note that the expenses shown in the table are meant to highlight and help you compare ongoing costs only and do not reflect transaction costs incurred by the fund for buying and selling securities. Further, the expenses do not include any purchase, redemption, or account service fees described in the fund prospectus. If such fees were applied to your account, your costs would be higher. Your fund does not carry a “sales load.”
The calculations assume no shares were bought or sold during the period. Your actual costs may have been higher or lower, depending on the amount of your investment and the timing of any purchases or redemptions.
You can find more information about the fund’s expenses, including annual expense ratios, in the Financial Statements section of this report. For additional information on operating expenses and other shareholder costs, please refer to your fund’s current prospectus.
56
| Six Months Ended March 31, 2013 | |||
| Beginning | Ending | Expenses | |
| Account Value | Account Value | Paid During | |
| 9/30/2012 | 3/31/2013 | Period | |
| Based on Actual Fund Return | |||
| Target Retirement 2035 Fund | $1,000.00 | $1,092.58 | $0.94 |
| Target Retirement 2040 Fund | $1,000.00 | $1,096.24 | $0.94 |
| Target Retirement 2045 Fund | $1,000.00 | $1,095.81 | $0.94 |
| Target Retirement 2050 Fund | $1,000.00 | $1,096.23 | $0.94 |
| Target Retirement 2055 Fund | $1,000.00 | $1,095.99 | $0.94 |
| Target Retirement 2060 Fund | $1,000.00 | $1,095.67 | $0.94 |
| Based on Hypothetical 5% Yearly Return | |||
| Target Retirement 2035 Fund | $1,000.00 | $1,024.03 | $0.91 |
| Target Retirement 2040 Fund | $1,000.00 | $1,024.03 | $0.91 |
| Target Retirement 2045 Fund | $1,000.00 | $1,024.03 | $0.91 |
| Target Retirement 2050 Fund | $1,000.00 | $1,024.03 | $0.91 |
| Target Retirement 2055 Fund | $1,000.00 | $1,024.03 | $0.91 |
| Target Retirement 2060 Fund | $1,000.00 | $1,024.03 | $0.91 |
The calculations are based on the acquired fund fees and expenses for the most recent six-month period. The funds’ annualized expense figures for the period are (in order as listed from top to bottom above) 0.18%, 0.18%, 0.18%, 0.18%, 0.18%, and 0.18%. The dollar amounts shown as ”Expenses Paid” are equal to the annualized average weighted expense ratio for the underlying funds multiplied by the average account value over the period, multiplied by the number of days in the most recent six-month period, then divided by the number of days in the most recent 12-month period.
57
Trustees Approve Advisory Arrangement
The board of trustees of Vanguard Target Retirement Funds has renewed the funds’ investment advisory arrangement with The Vanguard Group, Inc. (Vanguard). Vanguard—through its Equity Investment Group—serves as the investment advisor to the funds. The board determined that continuing the funds’ internalized management structure was in the best interests of the funds and their shareholders.
The board based its decision upon an evaluation of the advisor’s investment staff, portfolio management process, and performance. The trustees considered the factors discussed below, among others. However, no single factor determined whether the board approved the arrangement. Rather, it was the totality of the circumstances that drove the board’s decision.
Nature, extent, and quality of services
The board considered the quality of the funds’ investment management services over both the short and long term, and took into account the organizational depth and stability of the advisor. The board noted that Vanguard has been managing investments for more than three decades. The Equity Investment Group adheres to a sound, disciplined investment management process; the team has considerable experience, stability, and depth.
The board concluded that Vanguard’s experience, stability, depth, and performance, among other factors, warranted continuation of the advisory arrangement.
Investment performance
The board considered the performance of the funds, including any periods of outperformance or underperformance relative to a benchmark index and peer groups. The board concluded that the performance was such that the advisory arrangement should continue. Information about each fund’s most recent performance can be found in the Performance Summary pages of this report.
Cost
The board concluded that the funds’ acquired fund fees and expenses were well below the average expense ratios charged by funds in their respective peer groups. The funds do not incur advisory expenses directly; however, the board noted that each of the underlying funds in which the funds invest has advisory expenses well below the relevant peer-group average. Information about the funds’ acquired fund fees and expenses appears in the About Your Fund’s Expenses section of this report as well as in the Financial Statements sections.
The board does not conduct a profitability analysis of Vanguard, because of Vanguard’s unique “at-cost” structure. Unlike most other mutual fund management companies, Vanguard is owned by the funds it oversees, and produces “profits” only in the form of reduced expenses for fund shareholders.
The benefit of economies of scale
The board concluded that Vanguard’s at-cost arrangement with the Target Retirement Funds and their underlying funds ensures that the funds will realize economies of scale as they grow, with the cost to shareholders declining as fund assets increase.
The board will consider whether to renew the advisory arrangement again after a one-year period.
58
Glossary
30-Day SEC Yield. A fund’s 30-day SEC yield is derived using a formula specified by the U.S. Securities and Exchange Commission. Under the formula, data related to the fund’s security holdings in the previous 30 days are used to calculate the fund’s hypothetical net income for that period, which is then annualized and divided by the fund’s estimated average net assets over the calculation period. For the purposes of this calculation, a security’s income is based on its current market yield to maturity (for bonds), its actual income (for asset-backed securities), or its projected dividend yield (for stocks). Because the SEC yield represents hypothetical annualized income, it will differ—at times significantly—from the fund’s actual experience. As a result, the fund’s income distributions may be higher or lower than implied by the SEC yield.
Acquired Fund Fees and Expenses. Funds that invest in other Vanguard funds incur no direct expenses, but they do bear proportionate shares of the operating, administrative, and advisory expenses of the underlying funds, and they must pay any fees charged by those funds. The figure for acquired fund fees and expenses represents a weighted average of these underlying costs. Acquired is a term that the Securities and Exchange Commission applies to any mutual fund whose shares are owned by another fund.
Beta. A measure of the magnitude of a fund’s past share-price fluctuations in relation to the ups and downs of a given market index. The index is assigned a beta of 1.00. Compared with a given index, a fund with a beta of 1.20 typically would have seen its share price rise or fall by 12% when the index rose or fell by 10%. For this report, beta is based on returns over the past 36 months for both the fund and the index. Note that a fund’s beta should be reviewed in conjunction with its R-squared (see definition). The lower the R-squared, the less correlation there is between the fund and the index, and the less reliable beta is as an indicator of volatility.
Expense Ratio. A fund’s total annual operating expenses expressed as a percentage of the fund’s average net assets. The expense ratio includes management and administrative expenses, but does not include the transaction costs of buying and selling portfolio securities.
Inception Date. The date on which the assets of a fund (or one of its share classes) are first invested in accordance with the fund’s investment objective. For funds with a subscription period, the inception date is the day after that period ends. Investment performance is measured from the inception date.
R-Squared. A measure of how much of a fund’s past returns can be explained by the returns from the market in general, as measured by a given index. If a fund’s total returns were precisely synchronized with an index’s returns, its R-squared would be 1.00. If the fund’s returns bore no relationship to the index’s returns, its R-squared would be 0. For this report, R-squared is based on returns over the past 36 months for both the fund and the index.
59
Benchmark Information:
Target 2035 Composite Index: Derived by applying the fund’s target asset allocation to the results of the following benchmarks: for international stocks of developed markets, the MSCI EAFE Index through December 15, 2010, and the MSCI ACWI ex USA IMI Index thereafter; for emerging markets stocks, the Select Emerging Markets Index through August 23, 2006, the MSCI Emerging Markets Index through December 15, 2010, and the MSCI ACWI ex USA IMI Index thereafter; for bonds, the Barclays U.S. Aggregate Bond Index through December 31, 2009, and the Barclays U.S. Aggregate Float Adjusted Index thereafter; and for U.S. stocks, the Dow Jones Wilshire 5000 Index through April 22, 2005, and the MSCI US Broad Market Index thereafter. MSCI international benchmark returns are adjusted for withholding taxes.
Target 2040 Composite Index: Derived by applying the fund’s target asset allocation to the results of the following benchmarks: for international stocks of developed markets, the MSCI EAFE Index through December 15, 2010, and the MSCI ACWI ex USA IMI Index thereafter; for emerging markets stocks, the Select Emerging Markets Index through August 23, 2006, the MSCI Emerging Markets Index through December 15, 2010, and the MSCI ACWI ex USA IMI Index thereafter; for bonds, the Barclays U.S. Aggregate Bond Index through December 31, 2009, and the Barclays U.S. Aggregate Float Adjusted Index thereafter; and for U.S. stocks, the MSCI US Broad Market Index. MSCI international benchmark returns are adjusted for withholding taxes.
Target 2045 Composite Index: Derived by applying the fund’s target asset allocation to the results of the following benchmarks: for international stocks of developed markets, the MSCI EAFE Index through December 15, 2010, and the MSCI ACWI ex USA IMI Index thereafter; for emerging markets stocks, the Select Emerging Markets Index through August 23, 2006, the MSCI Emerging Markets Index through December 15, 2010, and the MSCI ACWI ex USA IMI Index thereafter; for bonds, the Barclays U.S. Aggregate Bond Index through December 31, 2009, and the Barclays U.S. Aggregate Float Adjusted Index thereafter; and for U.S. stocks, the Dow Jones Wilshire 5000 Index through April 22, 2005, and the MSCI US Broad Market Index thereafter. MSCI international benchmark returns are adjusted for withholding taxes.
Target 2050 Composite Index: Derived by applying the fund’s target asset allocation to the results of the following benchmarks: for international stocks of developed markets, the MSCI EAFE Index through December 15, 2010, and the MSCI ACWI ex USA IMI Index thereafter; for emerging markets stocks, the Select Emerging Markets Index through August 23, 2006, the MSCI Emerging Markets Index through December 15, 2010, and the MSCI ACWI ex USA IMI Index thereafter; for bonds, the Barclays U.S. Aggregate Bond Index through December 31, 2009, and the Barclays U.S. Aggregate Float Adjusted Index thereafter; and for U.S. stocks, the MSCI US Broad Market Index. MSCI international benchmark returns are adjusted for withholding taxes.
60
Target 2055 Composite Index: Derived by applying the fund’s target asset allocation to the results of the following benchmarks: for international stocks of developed markets, the MSCI EAFE Index through December 15, 2010, and the MSCI ACWI ex USA IMI Index thereafter; for emerging markets stocks, the MSCI Emerging Markets Index through December 15, 2010, and the MSCI ACWI ex USA IMI Index thereafter; for bonds, the Barclays U.S. Aggregate Float Adjusted Index; and for U.S. stocks, the MSCI US Broad Market Index. MSCI international benchmark returns are adjusted for withholding taxes.
Target 2060 Composite Index: Derived by applying the fund’s target asset allocation to the results of the following benchmarks: for international stocks, the MSCI ACWI ex USA IMI Index; for U.S. stocks, the MSCI US Broad Market Index; and for bonds, the Barclays U.S. Aggregate Float Adjusted Index. MSCI international benchmark returns are adjusted for withholding taxes.
61
This page intentionally left blank.
This page intentionally left blank.
The People Who Govern Your Fund
The trustees of your mutual fund are there to see that the fund is operated and managed in your best interests since, as a shareholder, you are a part owner of the fund. Your fund’s trustees also serve on the board of directors of The Vanguard Group, Inc., which is owned by the Vanguard funds and provides services to them on an at-cost basis.
A majority of Vanguard’s board members are independent, meaning that they have no affiliation with Vanguard or the funds they oversee, apart from the sizable personal investments they have made as private individuals. The independent board members have distinguished backgrounds in business, academia, and public service. Each of the trustees and executive officers oversees 180 Vanguard funds.
The following table provides information for each trustee and executive officer of the fund. More information about the trustees is in the Statement of Additional Information, which can be obtained, without charge, by contacting Vanguard at 800-662-7447, or online at vanguard.com.
| InterestedTrustee1 | and Delphi Automotive LLP (automotive components); |
| Senior Advisor at New Mountain Capital; Trustee of | |
| F. William McNabb III | The Conference Board. |
| Born 1957. Trustee Since July 2009. Chairman of the | |
| Board. Principal Occupation(s) During the Past Five | Amy Gutmann |
| Years: Chairman of the Board of The Vanguard Group, | Born 1949. Trustee Since June 2006. Principal |
| Inc., and of each of the investment companies served | Occupation(s) During the Past Five Years: President |
| by The Vanguard Group, since January 2010; Director | of the University of Pennsylvania; Christopher H. |
| of The Vanguard Group since 2008; Chief Executive | Browne Distinguished Professor of Political Science |
| Officer and President of The Vanguard Group and of | in the School of Arts and Sciences with secondary |
| each of the investment companies served by The | appointments at the Annenberg School for |
| Vanguard Group since 2008; Director of Vanguard | Communication and the Graduate School of Education |
| Marketing Corporation; Managing Director of The | of the University of Pennsylvania; Member of the |
| Vanguard Group (1995–2008). | National Commission on the Humanities and Social |
| Sciences; Trustee of Carnegie Corporation of New | |
| IndependentTrustees | York and of the National Constitution Center; Chair |
| of the U.S. Presidential Commission for the Study | |
| Emerson U. Fullwood | of Bioethical Issues. |
| Born 1948. Trustee Since January 2008. Principal | |
| Occupation(s) During the Past Five Years: Executive | JoAnn Heffernan Heisen |
| Chief Staff and Marketing Officer for North America | Born 1950. Trustee Since July 1998. Principal |
| and Corporate Vice President (retired 2008) of Xerox | Occupation(s) During the Past Five Years: Corporate |
| Corporation (document management products and | Vice President and Chief Global Diversity Officer |
| services); Executive in Residence and 2010 | (retired 2008) and Member of the Executive |
| Distinguished Minett Professor at the Rochester | Committee (1997–2008) of Johnson & Johnson |
| Institute of Technology; Director of SPX Corporation | (pharmaceuticals/medical devices/consumer |
| (multi-industry manufacturing), the United Way of | products); Director of Skytop Lodge Corporation |
| Rochester, Amerigroup Corporation (managed health | (hotels), the University Medical Center at Princeton, |
| care), the University of Rochester Medical Center, | the Robert Wood Johnson Foundation, and the Center |
| Monroe Community College Foundation, and North | for Talent Innovation; Member of the Advisory Board |
| Carolina A&T University. | of the Maxwell School of Citizenship and Public Affairs |
| at Syracuse University. | |
| Rajiv L. Gupta | |
| Born 1945. Trustee Since December 2001.2 | F. Joseph Loughrey |
| Principal Occupation(s) During the Past Five Years: | Born 1949. Trustee Since October 2009. Principal |
| Chairman and Chief Executive Officer (retired 2009) | Occupation(s) During the Past Five Years: President |
| and President (2006–2008) of Rohm and Haas Co. | and Chief Operating Officer (retired 2009) of Cummins |
| (chemicals); Director of Tyco International, Ltd. | Inc. (industrial machinery); Chairman of the Board of |
| (diversified manufacturing and services), Hewlett- | Hillenbrand, Inc. (specialized consumer services); |
| Packard Co. (electronic computer manufacturing), | Director of SKF AB (industrial machinery), the Lumina |
| Foundation for Education, and Oxfam America; | Executive Officers | |
| Chairman of the Advisory Council for the College of | ||
| Arts and Letters and Member of the Advisory Board to | Glenn Booraem | |
| the Kellogg Institute for International Studies at the | Born 1967. Controller Since July 2010. Principal | |
| University of Notre Dame. | Occupation(s) During the Past Five Years: Principal | |
| of The Vanguard Group, Inc.; Controller of each of | ||
| Mark Loughridge | the investment companies served by The Vanguard | |
| Born 1953. Trustee Since March 2012. Principal | Group; Assistant Controller of each of the investment | |
| Occupation(s) During the Past Five Years: Senior Vice | companies served by The Vanguard Group (2001–2010). | |
| President and Chief Financial Officer at IBM (information | ||
| technology services); Fiduciary Member of IBM’s | Thomas J. Higgins | |
| Retirement Plan Committee. | Born 1957. Chief Financial Officer Since September | |
| 2008. Principal Occupation(s) During the Past Five | ||
| Scott C. Malpass | Years: Principal of The Vanguard Group, Inc.; Chief | |
| Born 1962. Trustee Since March 2012. Principal | Financial Officer of each of the investment companies | |
| Occupation(s) During the Past Five Years: Chief | served by The Vanguard Group; Treasurer of each of | |
| Investment Officer and Vice President at the University | the investment companies served by The Vanguard | |
| of Notre Dame; Assistant Professor of Finance at the | Group (1998–2008). | |
| Mendoza College of Business at Notre Dame; Member | ||
| of the Notre Dame 403(b) Investment Committee; | Kathryn J. Hyatt | |
| Director of TIFF Advisory Services, Inc. (investment | Born 1955. Treasurer Since November 2008. Principal | |
| advisor); Member of the Investment Advisory | Occupation(s) During the Past Five Years: Principal of | |
| Committees of the Financial Industry Regulatory | The Vanguard Group, Inc.; Treasurer of each of the | |
| Authority (FINRA) and of Major League Baseball. | investment companies served by The Vanguard | |
| Group; Assistant Treasurer of each of the investment | ||
| André F. Perold | companies served by The Vanguard Group (1988–2008). | |
| Born 1952. Trustee Since December 2004. Principal | ||
| Occupation(s) During the Past Five Years: George | Heidi Stam | |
| Gund Professor of Finance and Banking at the Harvard | Born 1956. Secretary Since July 2005. Principal | |
| Business School (retired 2011); Chief Investment | Occupation(s) During the Past Five Years: Managing | |
| Officer and Managing Partner of HighVista Strategies | Director of The Vanguard Group, Inc.; General Counsel | |
| LLC (private investment firm); Director of Rand | of The Vanguard Group; Secretary of The Vanguard | |
| Merchant Bank; Overseer of the Museum of Fine | Group and of each of the investment companies | |
| Arts Boston. | served by The Vanguard Group; Director and Senior | |
| Vice President of Vanguard Marketing Corporation. | ||
| Alfred M. Rankin, Jr. | ||
| Born 1941. Trustee Since January 1993. Principal | Vanguard Senior ManagementTeam | |
| Occupation(s) During the Past Five Years: Chairman, | ||
| President, and Chief Executive Officer of NACCO | Mortimer J. Buckley | Chris D. McIsaac |
| Industries, Inc. (housewares/lignite) and of Hyster-Yale | Kathleen C. Gubanich | Michael S. Miller |
| Materials Handling, Inc. (forklift trucks); Director of | Paul A. Heller | James M. Norris |
| the National Association of Manufacturers; Chairman | Martha G. King | Glenn W. Reed |
| of the Board of University Hospitals of Cleveland; | John T. Marcante | |
| Advisory Chairman of the Board of The Cleveland | ||
| Museum of Art. | Chairman Emeritus and Senior Advisor | |
| Peter F. Volanakis | John J. Brennan | |
| Born 1955. Trustee Since July 2009. Principal | Chairman, 1996–2009 | |
| Occupation(s) During the Past Five Years: President | Chief Executive Officer and President, 1996–2008 | |
| and Chief Operating Officer (retired 2010) of Corning | ||
| Incorporated (communications equipment); Director | ||
| of SPX Corporation (multi-industry manufacturing); | Founder | |
| Overseer of the Amos Tuck School of Business | John C. Bogle | |
| Administration at Dartmouth College; Advisor to the | Chairman and Chief Executive Officer, 1974–1996 | |
| Norris Cotton Cancer Center. | ||
1 Mr. McNabb is considered an “interested person,” as defined in the Investment Company Act of 1940, because he is an officer of the Vanguard funds.
2 December 2002 for Vanguard Equity Income Fund, Vanguard Growth Equity Fund, the Vanguard Municipal Bond Funds, and the Vanguard State Tax-Exempt Funds.
 | |
| P.O. Box 2600 | |
| Valley Forge, PA 19482-2600 | |
Connect with Vanguard® > vanguard.com | |
Fund Information > 800-662-7447 | |
© 2013 The Vanguard Group, Inc. |
Item 2: Code of Ethics.
Not Applicable.
Item 3: Audit Committee Financial Expert.
Not Applicable.
Item 4: Principal Accountant Fees and Services.
Not Applicable.
Item 5: Audit Committee of Listed Registrants.
Not Applicable.
Item 6: Investments.
Not Applicable.
Item 7: Disclosure of Proxy Voting Policies and Procedures for Closed-End Management Investment Companies.
Not Applicable.
Item 8: Portfolio Managers of Closed-End Management Investment Companies.
Not Applicable.
Item 9: Purchase of Equity Securities by Closed-End Management Investment Company and Affiliated Purchasers.
Not Applicable.
Item 10: Submission of Matters to a Vote of Security Holders.
Not Applicable.
Item 11: Controls and Procedures.
(a) Disclosure Controls and Procedures. The Principal Executive and Financial Officers concluded that the Registrant’s Disclosure Controls and Procedures are effective based on their evaluation of the Disclosure Controls and Procedures as of a date within 90 days of the filing date of this report.
(b) Internal Control Over Financial Reporting. There were no significant changes in Registrant’s Internal Control Over Financial Reporting or in other factors that could significantly affect this control subsequent to the date of the evaluation, including any corrective actions with regard to significant deficiencies and material weaknesses.
Item 12: Exhibits.
(a) Certifications.
Pursuant to the requirements of the Securities Exchange Act of 1934 and the Investment Company Act of 1940, the registrant has duly caused this report to be signed on its behalf by the undersigned, thereunto duly authorized.
| VANGUARD CHESTER FUNDS | |
| By: | /s/ F. WILLIAM MCNABB III* |
| F. WILLIAM MCNABB III | |
| CHIEF EXECUTIVE OFFICER | |
| Date: May 17, 2013 | |
Pursuant to the requirements of the Securities Exchange Act of 1934 and the Investment Company Act of 1940, this report has been signed below by the following persons on behalf of the registrant and in the capacities and on the dates indicated.
| VANGUARD CHESTER FUNDS | |
| By: | /s/ F. WILLIAM MCNABB III* |
| F. WILLIAM MCNABB III | |
| CHIEF EXECUTIVE OFFICER | |
| Date: May 17, 2013 | |
| VANGUARD CHESTER FUNDS | |
| By: | /s/ THOMAS J. HIGGINS* |
| THOMAS J. HIGGINS | |
| CHIEF FINANCIAL OFFICER | |
| Date: May 17, 2013 | |
* By: /s/ Heidi Stam
Heidi Stam, pursuant to a Power of Attorney filed on March 27, 2012 see file Number 2-11444, Incorporated by Reference.