UNITED STATES
SECURITIES AND EXCHANGE COMMISSION
WASHINGTON, D.C. 20549
FORM N-CSR
CERTIFIED SHAREHOLDER REPORT OF REGISTERED MANAGEMENT
INVESTMENT COMPANIES
Investment Company Act file number 811-4103
Seligman High Income Fund Series
(Exact name of Registrant as specified in charter)
100 Park Avenue
New York, New York 10017
(Address of principal executive offices) (Zip code)
Lawrence P. Vogel
100 Park Avenue
New York, New York 10017
(Name and address of agent for service)
Registrant’s telephone number, including area code: (212) 850-1864
Date of fiscal year end: 12/31
Date of reporting period: 12/31/07
ITEM 1. REPORTS TO STOCKHOLDERS.
High-Yield Fund
Annual Report
December 31, 2007
Seeking a High Level of
Current Income and the
Potential for Capital
Appreciation by Investing
in a Diversified Portfolio
of High-Yield Securities
J. & W. SELIGMAN & CO.
INCORPORATED
ESTABLISHED 1864
100 Park Avenue, New York, NY 10017
Experience
Seligman has been in business for more than 140 years, at times playing a central role in the financial development of the country and its markets. Over that time, the firm has managed clients’ wealth through dramatic market changes and has remained a consistent, reliable presence on Wall Street. Today, Seligman is drawing on its long history and long-term perspective as we focus on the future and on developing investment solutions that help clients arrive at their goals.
Insight
Asset management is driven by insight — into the direction of the economy, how companies will perform, how markets will behave, and how investors will respond. Portfolio managers at the firm have been in the investment business, on average, for more than 20 years. Over that time, they have refined their ability to assess a company’s prospects, management, and products, while also weighing the impact of economic and market cycles, new trends, and developing technologies.
Solutions
Seligman’s commitment to the development of innovative investment products — including the nation’s first growth mutual fund, pioneering single-state municipal funds, and one of the country’s premier technology funds — defines our past and informs our future. Our ongoing research into the nature of investment risk — begun in the early 1990s — has resulted in the Seligman Time Horizon Matrix® asset allocation strategy that redefines the relationship between risk and reward over time. The strategy offers investors a variety of investment solutions for goals ranging from college savings to retirement planning. Whether you select Seligman for one investment product, or as a comprehensive asset manager, we believe we can help you reach your goals.
|
|
Table of Contents |
|
|
|
1 | |
|
|
2 | |
|
|
4 | |
|
|
7 | |
|
|
9 | |
|
|
10 | |
|
|
20 | |
|
|
21 | |
|
|
22 | |
|
|
23 | |
|
|
30 | |
|
|
34 | |
|
|
Matters Relating to the Trustees’ Consideration of the Continuance of the Management Agreement | 35 |
|
|
38 | |
|
|
42 | |
|
|
43 |
Your annual shareholder report for Seligman High-Yield Fund follows this letter. The report contains an interview with your Portfolio Managers, as well as the Fund’s investment results, portfolio of investments, and financial statements as of December 31, 2007.
For the year ended December 31, 2007, Seligman High-Yield Fund delivered a total return of 0.8%, based on the net asset value of Class A shares (excluding sales charge). For the same period, the Fund’s benchmark, the Lehman Brothers U.S. Corporate High-Yield 2% Issuer Capped Index, returned 2.3%, and the Fund’s peers, as measured by the Lipper High Current Yield Funds Average, returned 1.4%.
Thank you for your continued support of Seligman High-Yield Fund. We look forward to providing you with the investment experience, insight, and solutions you need to help you seek your financial goals for many years to come.
By order of the Board of Trustees,
|
|
|
| ||
| ||
William C. Morris |
| Brian T. Zino |
Chairman |
| President |
February 27, 2008
Manager
J. & W. Seligman & Co.
Incorporated
100 Park Avenue
New York, NY 10017
General Distributor
Seligman Advisors, Inc.
100 Park Avenue
New York, NY 10017
General Counsel
Sullivan & Cromwell LLP
Shareholder Service Agent
Seligman Data Corp.
100 Park Avenue
New York, NY 10017
Mail Inquiries to:
P.O. Box 9759
Providence, RI 02940-9759
Independent Registered
Public Accounting Firm
Deloitte & Touche LLP
Important Telephone Numbers
(800) 221-2450 Shareholder Services
(800) 445-1777 Retirement Plan
Services
(212) 682-7600 Outside the
United States
(800) 622-4597 24-Hour Automated
Telephone Access
Service
1
Interview With Your Portfolio Managers
J. Eric Misenheimer, Paul Langlois, and Henry Rose
|
|
Q: | How did Seligman High-Yield Fund perform for the year ended December 31, 2007? |
|
|
A: | For the year ended December 31, 2007, Seligman High-Yield Fund delivered a total return of 0.8%, based on the net asset value of Class A shares. The Fund’s benchmark, the Lehman Brothers U.S. Corporate High-Yield 2% Issuer Capped Index, returned 2.3%, and the Fund’s peer group, as measured by the Lipper High Current Yield Funds Average, returned 1.4% for the same period. |
|
|
Q: | What market conditions and economic factors materially impacted the Fund’s investment results during the year? |
|
|
A: | The high-yield market began the year on a strong note as investors pursued optimum yield. This increased appetite for risk enabled lower-quality bonds to outperform. Spreads to Treasuries remained tight and the yield curve began to steepen to a more normal shape. Spreads began to widen in the second quarter in response to rising short-term rates, volatility in the equity markets, and a large number of aggressively priced, low-quality new issues. |
|
|
| |
| Sub prime concerns took hold during the summer months and led to a tightening of the reins by credit lenders and a sell-off in the markets. The Federal Reserve Board sought to ease concerns by reducing the discount rate in August and subsequently again in September. The Fed lowered the fed funds target rate by half of a percentage point in September to 4.75%, and by an additional quarter of a percentage point in both October and December to 4.25%. (Subsequent to year-end, the federal funds target rate was lowered to 3.0%.) The yield curve continued to steepen as short-term rates fell and Treasuries rallied. Spreads, which had been at an all-time tight level in June, widened considerably to the highest level in three years. New supply, which had peaked in July, came to a halt. |
|
|
| While investors showed signs of renewed interest following the Fed’s September rate cut, it would not prove to be long lasting. The sub-prime issues proved much worse than anticipated, and some of the write-offs that brokerage firms and banks announced in late summer were multiplied substantially by October. The result was a significant flight-to-quality in November and December as investors became increasingly risk averse. Treasuries continued to rally and lower-quality bonds, including those held by the Fund, sold off. |
|
|
Q: | What investment strategies and techniques materially affected the Fund’s performance during the year? |
|
|
A: | Given the widespread volatility in the fixed income market, the Fund was neutral-to-defensively positioned, and the Fund benefited from an underweight in interest-rate sensitive, higher-quality bonds as well as a relatively short portfolio duration. As investors began to become more risk averse, we took the sell-off as an opportunity to reposition portions of the portfolio, adding risk at what we believed to be good prices. |
|
|
| The Fund benefited earlier in year from its underweight in interest rate sensitive, higher-quality bonds, a relatively short portfolio duration, and strategic positions in equities. The Fund’s ability to invest across capital structures – from equity to debt — and pursue opportunities in alternative yield investments — such as yield enhanced securities — was key to the Fund’s increase in distributions during the year. |
2
Interview With Your Portfolio Managers
J. Eric Misenheimer, Paul Langlois, and Henry Rose
|
|
| The Fund’s portfolio was moved to a more aggressive positioning during the third quarter as we took advantage of the sell-off to increase risk at attractive prices. A position was re-established in the auto sector, and cable/satellite and energy holdings were added to. The Fund continued to underweight housing-related securities. This less-defensive positioning resulted in the Fund’s underperformance versus the benchmark for the year as investors sought higher-quality issues late in the year. |
|
|
| A TEAM APPROACH |
|
|
| Seligman High-Yield Fund is managed by the Seligman High-Yield Team, headed by J. Eric Misenheimer. Mr. Misenheimer and Co-Portfolio Managers Paul Langlois and Henry Rose are assisted by a group of seasoned professionals who are responsible for research and trading consistent with the Fund’s investment objective. Team members include Michael Hunt (trader), Sau Lin Wu (trader), and Jonathan Roth (trader). |
The views and opinions expressed are those of the Portfolio Manager(s), are provided for general information only, and do not constitute specific tax, legal, or investment advice to, or recommendations for, any person. There can be no guarantee as to the accuracy of market forecasts. Opinions, estimates, and forecasts may be changed without notice.
3
This section of the report is intended to help you understand the performance of Seligman High-Yield Fund and to provide a summary of the Fund’s portfolio characteristics.
Performance data quoted in this report represents past performance and does not guarantee or indicate future investment results. The rates of return will vary and the principal value of an investment will fluctuate. Shares, if redeemed, may be worth more or less than their original cost. Current performance may be lower or higher than the performance data quoted. Total returns of the Fund (except for Class I shares) as of the most recent month-end will be available at www.seligman.com1by the seventh business day following that month-end. Calculations assume reinvestment of distributions, if any. Performance data quoted does not reflect the deduction of taxes that an investor may pay on distributions or the redemption of shares.
The chart on page 5 compares $10,000 hypothetical investments made in Class A shares, with and without the initial 4.5% maximum sales charge that became effective on January 7, 2008, and in Class B and Class D shares, without contingent deferred sales charge (“CDSC”), to a $10,000 investment made in the Lehman Brothers U.S. Corporate High-Yield 2% Issuer Capped Index for the ten-year period ended December 31, 2007. The ten-year return for Class B shares reflects automatic conversion to Class A shares approximately eight years after their date of purchase. The performance of Class C, Class I and Class R shares, which commenced on later dates, and of Class A, Class B and Class D shares for other periods, with and without applicable sales charges and CDSCs, is not shown in the chart but is included in the total returns table that follows the chart. The performance of Class C, Class I and Class R shares will differ from the performance shown for Class A, Class B, and Class D shares, based on the differences in sales charges and fees paid by shareholders.
Returns for Class A shares are calculated with and without the effect of the initial 4.5% maximum sales charge. Although for all periods presented the Fund’s Class A shares reflect the 4.5% maximum sales charge, the actual returns for periods prior to January 7, 2008 would have been lower if the 4.75% maximum sales charge then in effect was incurred. Returns for Class B shares are calculated with and without the effect of the maximum 5% CDSC, charged on redemptions made within one year of the date of purchase, declining to 1% in the sixth year and 0% thereafter. Returns for Class C, Class D and Class R shares are calculated with and without the effect of the 1% CDSC, charged on redemptions made within one year of purchase. Effective June 4, 2007, there is no initial sales charge on investments in Class C shares. Class C share returns are presented without an initial sales charge and would have been lower for periods prior to June 4, 2007 if the 1% initial sales charge then in effect was incurred. Class I shares do not have sales charges, and returns are calculated accordingly.
An investment in the Fund is not a deposit in a bank and is not insured or guaranteed by the Federal Deposit Insurance Corporation or any other government agency.
|
|
1 | The website reference is an inactive textual reference and information contained in or otherwise accessible through the website does not form a part of this report or the Fund’s prospectuses or statement of additional information. |
4
Performance Overview
|
Investment Results |
|
|
|
|
|
|
|
|
|
|
|
|
|
|
|
|
|
|
|
|
|
|
|
|
|
|
|
| Average Annual |
| ||||||||||||||||
|
|
|
|
| ||||||||||||||||||
|
| Six | * | One |
| Five |
| Ten |
| Class C |
| Class I |
| Class R |
| |||||||
Class A |
|
|
|
|
|
|
|
|
|
|
|
|
|
|
|
|
|
|
|
|
|
|
With Sales Charge |
|
| (6.58 | )% |
| (3.74 | )% |
| 6.95 | % |
| 0.17 | % | n/a |
|
| n/a |
|
| n/a |
|
|
Without Sales Charge |
|
| (2.16 | ) |
| 0.81 |
|
| 7.95 |
|
| 0.64 |
| n/a |
|
| n/a |
|
| n/a |
|
|
Class B |
|
|
|
|
|
|
|
|
|
|
|
|
|
|
|
|
|
|
|
|
|
|
With CDSC† |
|
| (7.21 | ) |
| (4.60 | ) |
| 6.78 |
|
| n/a |
| n/a |
|
| n/a |
|
| n/a |
|
|
Without CDSC |
|
| (2.52 | ) |
| 0.07 |
|
| 7.09 |
|
| (0.06 | )†† | n/a |
|
| n/a |
|
| n/a |
|
|
Class C |
|
|
|
|
|
|
|
|
|
|
|
|
|
|
|
|
|
|
|
|
|
|
With 1% CDSC |
|
| (3.45 | ) |
| (0.86 | ) |
| n/a |
|
| n/a |
| n/a |
|
| n/a |
|
| n/a |
|
|
Without CDSC |
|
| (2.51 | ) |
| 0.07 |
|
| 7.14 |
|
| n/a |
| (0.31 | )% |
| n/a |
|
| n/a |
|
|
Class D |
|
|
|
|
|
|
|
|
|
|
|
|
|
|
|
|
|
|
|
|
|
|
With 1% CDSC |
|
| (3.45 | ) |
| (0.86 | ) |
| n/a |
|
| n/a |
| n/a |
|
| n/a |
|
| n/a |
|
|
Without CDSC |
|
| (2.51 | ) |
| 0.07 |
|
| 7.15 |
|
| (0.12 | ) | n/a |
|
| n/a |
|
| n/a |
|
|
Class I |
|
| (1.69 | ) |
| 1.18 |
|
| 8.39 |
|
| n/a |
| n/a |
|
| 5.76 | % |
| n/a |
|
|
Class R |
|
|
|
|
|
|
|
|
|
|
|
|
|
|
|
|
|
|
|
|
|
|
With 1% CDSC |
|
| (3.22 | ) |
| (0.37 | ) |
| n/a |
|
| n/a |
| n/a |
|
| n/a |
|
| n/a |
|
|
Without CDSC |
|
| (2.28 | ) |
| 0.56 |
|
| n/a |
|
| n/a |
| n/a |
|
| n/a |
|
| 6.15 | % |
|
Benchmarks** |
|
|
|
|
|
|
|
|
|
|
|
|
|
|
|
|
|
|
|
|
|
|
Lehman Brothers U.S. Corporate |
|
| (0.67 | ) |
| 2.26 |
|
| 10.75 |
|
| 5.59 |
| 6.00 | # |
| 8.64 |
|
| 8.49 |
|
|
Lipper High Current Yield Funds Average |
|
| (1.49 | ) |
| 1.43 |
|
| 9.39 |
|
| 4.00 |
| 4.58 |
|
| 7.38 |
|
| 7.69 |
|
|
|
See footnotes on page 6. |
5
Performance Overview
Investment Results
Net Asset Value Per Share
|
|
|
|
|
|
|
|
|
|
|
|
|
|
|
|
|
|
| 12/31/07 |
| 6/30/07 |
| 12/31/06 |
| |||||||||
Class A |
|
| $ | 3.17 |
|
|
| $ | 3.38 |
|
|
| $ | 3.39 |
|
|
Class B |
|
|
| 3.17 |
|
|
|
| 3.38 |
|
|
|
| 3.39 |
|
|
Class C |
|
|
| 3.18 |
|
|
|
| 3.39 |
|
|
|
| 3.40 |
|
|
Class D |
|
|
| 3.18 |
|
|
|
| 3.39 |
|
|
|
| 3.40 |
|
|
Class I |
|
|
| 3.17 |
|
|
|
| 3.37 |
|
|
|
| 3.39 |
|
|
Class R |
|
|
| 3.17 |
|
|
|
| 3.38 |
|
|
|
| 3.39 |
|
|
|
|
|
|
|
|
|
|
Dividend Per Share and Yield Information |
|
|
| ||||
|
|
|
|
|
| ||
For Periods Ended December 31, 2007 |
|
|
| ||||
Dividends ø |
| SEC 30-Day Yieldsøø |
| ||||
|
| $0.2514 |
|
| 7.25 | % |
|
|
| 0.2268 |
|
| 6.66 |
|
|
|
| 0.2268 |
|
| 6.77 |
|
|
|
| 0.2268 |
|
| 6.81 |
|
|
|
| 0.2639 |
|
| 8.12 |
|
|
|
| 0.2435 |
|
| 7.55 |
|
|
|
|
|
* |
| Returns for periods of less than one year are not annualized. |
** |
| The Lehman Brothers U.S. Corporate High-Yield 2% Issuer Capped Index (“Lehman Index”) and the Lipper High Current Yield Funds Average (“Lipper Average”) are unmanaged benchmarks that assume reinvestment of all distributions and exclude the effect of taxes and sales charges, and the Lehman Index also excludes the effect of fees. The Lipper Average is an average of funds that aim at high (relative) current yield from fixed income securities, have no quality or maturity restrictions, and tend to invest in lower-grade debt instruments. The Lehman Index covers the US corporate bond market of high-yield bonds denominated in US dollars, and is included for comparison with Fund performance. The Lehman Index is constrained from having greater than 2% of the securities of a single issuer. Although the Fund may hold greater than 2% of the securities of a single issuer, the Fund has no current intention of owning greater than 5% of the securities of a single issuer. Investors cannot invest directly in an average or an index. |
ø |
| Represents per share amount paid or declared for the year ended December 31, 2007. |
øø |
| Current yield, representing the annualized yield for the 30-day period ended December 31, 2007, has been computed in accordance with SEC regulations and will vary. |
† |
| The CDSC is 5% if you sell your shares within one year of purchase and 2% for the five-year period. |
†† |
| Ten-year return of Class B shares reflects automatic conversion to Class A shares approximately eight years after their date of purchase. |
# |
| From May 28, 1999. |
6
|
Largest Industries |
|
Largest Portfolio Changes |
|
|
|
Largest Purchases |
| Largest Sales |
| ||
GMAC 7.25%, 3/2/2011* |
| CMS Energy 7.5%, 1/15/2009** |
| ||
Freescale Semiconductor 10.125%, 12/15/2016* |
| Xerox 9.75%, 1/15/2009** |
| ||
GMAC 6.75%, 12/1/2014* |
| MSW Energy Holdings 8.50%, 9/1/2010** |
| ||
Harland Clarke 9.619%, 5/15/2015* |
| Freescale Semiconductor 10.125%, 12/15/2016** |
| ||
Edison Mission Energy 7%, 5/15/2017* |
| Hilton Hotels 7.625%, 12/1/2012** |
| ||
Neff 10%, 6/1/2015* |
| Lyondell Chemical 10.5%, 6/1/2013** |
| ||
Plains Exploration and Production 7.75%, 6/15/2015* |
| Rogers Wireless 7.25%, 12/15/2012** |
| ||
PNA Group 10.75%, 9/1/2016* |
| Clarke American 9.5%, 5/15/2015** |
| ||
Energy Partners 9.75%, 4/15/2014* |
| Playtex 8%, 3/1/2011** |
| ||
Tenet Healthcare 9.25%, 2/1/2015* |
| Hertz 8.875%, 1/1/2014** |
|
Largest portfolio changes from the previous period to the current period are based on cost of purchases and proceeds from sales of securities, listed in descending order.
|
|
* | Position added during the period. |
** | Position eliminated during the period. |
7
Portfolio Overview
|
Top Ten Companies† |
|
|
|
|
|
|
|
|
|
Security |
| Value |
| Percent |
| |||
GMAC |
| $ | 5,551,818 |
|
| 2.2 |
|
|
Charter Communications |
|
| 5,312,543 |
|
| 2.1 |
|
|
Ford Motor |
|
| 5,134,068 |
|
| 2.0 |
|
|
Echostar DBS |
|
| 4,951,250 |
|
| 1.9 |
|
|
AES |
|
| 4,747,500 |
|
| 1.8 |
|
|
HCA |
|
| 4,158,750 |
|
| 1.6 |
|
|
Qwest |
|
| 4,067,415 |
|
| 1.6 |
|
|
Ikon Office Solutions |
|
| 3,991,813 |
|
| 1.6 |
|
|
Reddy Ice Holdings |
|
| 3,610,000 |
|
| 1.4 |
|
|
Dynegy Holdings |
|
| 3,323,063 |
|
| 1.3 |
|
|
The amounts shown for the top ten companies represent the aggregate value of the Fund’s investments in securities issued by the companies or their affiliates.
There can be no assurance that the securities presented have remained or will remain in the Fund’s portfolio. Information regarding the Fund’s portfolio holdings should not be construed as a recommendation to buy or sell any security or as an indication that any security is suitable for a particular investor.
|
|
|
|
|
|
Ratings§ |
|
| Duration* | 4.4 years | |
| |||||
| Moody’s |
|
|
| |
|
|
| |||
Baa | 0.6 | % |
|
|
|
|
|
| |||
Ba | 29.0 |
|
|
|
|
|
|
| |||
B | 49.7 |
|
|
|
|
|
|
| |||
Caa | 20.2 |
|
|
|
|
|
|
| |||
Nonrated | 0.5 |
|
|
|
|
|
|
|
|
|
† | Excludes short-term holdings. |
§ | Credit ratings are those issued by Moody’s Investors Services, Inc. Percentages are based on the market values of long-term corporate bond holdings. |
* | Duration is the average amount of time that it takes to receive the interest and principal of a bond or portfolio of bonds. The duration formula is based on a formula that calculates the weighted average of the cash flows (interest and principal payments) of the bond, discounted to present time. |
8
Understanding and Comparing
Your Fund’s Expenses
As a shareholder of the Fund, you incur ongoing expenses, such as management fees, distribution and/or service (12b-1) fees (as applicable), and other Fund expenses. The information below is intended to help you understand your ongoing expenses (in dollars) of investing in the Fund and to compare them with the ongoing expenses of investing in other mutual funds. Please note that the expenses shown in the table are meant to highlight your ongoing expenses only and do not reflect any transactional costs, such as sales charges (also known as loads) on certain purchases or redemptions. Therefore, the table is useful in comparing ongoing expenses only, and will not help you to determine the relative total expenses of owning different funds. In addition, if transactional costs were included, your total expenses would have been higher.
The table is based on an investment of $1,000 invested at the beginning of July 1, 2007 and held for the entire six-month period ended December 31, 2007.
Actual Expenses
The table below provides information about actual expenses and actual account values. You may use the information, together with the amount you invested, to estimate the expenses that you paid over the period. Simply divide your account value at the beginning of the period by $1,000 (for example, an $8,600 account value divided by $1,000 = 8.6), then multiply the result by the number under the heading entitled “Expenses Paid During Period” for the Fund’s share class that you own to estimate the expenses that you paid on your account during the period.
Hypothetical Example for Comparison Purposes
The table below also provides information about hypothetical expenses and hypothetical account values based on the actual expense ratio of each class and an assumed rate of return of 5% per year before expenses, which is not the actual return of any class of the Fund. The hypothetical expenses and account values may not be used to estimate the ending account value or the actual expenses you paid for the period. You may use this information to compare the ongoing expenses of investing in the Fund and other mutual funds. To do so, compare this 5% hypothetical example with the 5% hypothetical examples that appear in the shareholder reports of the other mutual funds.
|
|
|
|
|
|
|
|
|
|
|
|
|
|
|
|
|
|
|
|
|
|
|
|
|
|
|
|
|
|
| Actual |
| Hypothetical |
| |||||||||||||||
|
|
|
|
|
|
| ||||||||||||||||||
|
| Beginning |
| Annualized |
| Ending |
| Expenses Paid |
| Ending |
| Expenses Paid |
| |||||||||||
Class A |
| $ | 1,000.00 |
|
| 1.38 | % |
| $ | 978.40 |
|
| $ | 6.90 |
|
| $ | 1,018.23 |
|
| $ | 7.04 |
|
|
Class B |
|
| 1,000.00 |
|
| 2.13 |
|
|
| 974.80 |
|
|
| 10.61 |
|
|
| 1,014.46 |
|
|
| 10.82 |
|
|
Class C |
|
| 1,000.00 |
|
| 2.13 |
|
|
| 974.90 |
|
|
| 10.59 |
|
|
| 1,014.48 |
|
|
| 10.81 |
|
|
Class D |
|
| 1,000.00 |
|
| 2.13 |
|
|
| 974.90 |
|
|
| 10.59 |
|
|
| 1,014.49 |
|
|
| 10.80 |
|
|
Class I |
|
| 1,000.00 |
|
| 0.75 |
|
|
| 983.10 |
|
|
| 3.73 |
|
|
| 1,021.44 |
|
|
| 3.81 |
|
|
Class R |
|
| 1,000.00 |
|
| 1.62 |
|
|
| 977.20 |
|
|
| 8.08 |
|
|
| 1,017.03 |
|
|
| 8.24 |
|
|
|
|
* | Expenses of Class B, Class C, Class D, Class I and Class R shares differ from the expenses of Class A shares due to the differences in 12b-1 fees and other class-specific expenses paid by each share class. See the Fund’s prospectuses for a description of each share class and its fees, expenses and sales charges. |
** | Expenses are equal to the annualized expense ratio based on actual expenses for the period July 1, 2007 to December 31, 2007, multiplied by the average account value over the period, multiplied by 184/365 (number of days in the period). |
9
Portfolio of Investments
December 31, 2007
|
|
|
|
|
|
|
|
|
| Principal |
| Value |
| ||
Corporate Bonds 84.1% |
|
|
|
|
|
|
|
| |||||||
Aerospace 1.5% |
|
|
|
|
|
|
|
Hawker Beechcraft: |
|
|
|
|
|
|
|
8.5%, 4/1/2015* |
| $ | 450,000 |
| $ | 451,125 |
|
8.875%, 4/1/2015* |
|
| 450,000 |
|
| 446,625 |
|
9.75%, 4/1/2017* |
|
| 225,000 |
|
| 224,437 |
|
L3 Communications: |
|
|
|
|
|
|
|
6.125%, 7/15/2013 |
|
| 900,000 |
|
| 888,750 |
|
5.875%, 1/15/2015 |
|
| 1,940,000 |
|
| 1,881,800 |
|
|
|
|
|
|
| 3,892,737 |
|
| |||||||
Airlines 0.8% |
|
|
|
|
|
|
|
Continental Airlines 8.75%, 12/1/2011 |
|
| 2,050,000 |
|
| 1,942,375 |
|
| |||||||
Automobiles 3.5% |
|
|
|
|
|
|
|
Allison Transmission 11%, 11/1/2015* |
|
| 1,000,000 |
|
| 915,000 |
|
Ford Motor 7.45%, 7/16/2031 |
|
| 3,250,000 |
|
| 2,429,375 |
|
Ford Motor Credit: |
|
|
|
|
|
|
|
9.75%, 9/15/2010 |
|
| 500,000 |
|
| 477,375 |
|
8.625%, 11/1/2010 |
|
| 1,425,000 |
|
| 1,323,130 |
|
8%, 12/15/2016 |
|
| 750,000 |
|
| 638,016 |
|
General Motors: |
|
|
|
|
|
|
|
7.2%, 1/15/2011 |
|
| 500,000 |
|
| 461,250 |
|
8.375%, 7/15/2033 |
|
| 2,875,000 |
|
| 2,328,750 |
|
Westinghouse Air Brake Technologies 6.875%, 7/31/2013 |
|
| 500,000 |
|
| 495,000 |
|
|
|
|
|
|
| 9,067,896 |
|
| |||||||
Broadcasting 0.4% |
|
|
|
|
|
|
|
LBI Media Holdings 8.5%, 8/1/2017* |
|
| 950,000 |
|
| 920,312 |
|
| |||||||
Building Products 0.8% |
|
|
|
|
|
|
|
Ply Gem Industries 9%, 2/15/2012 |
|
| 1,200,000 |
|
| 936,000 |
|
Texas Industries 7.25%, 7/15/2013 |
|
| 1,050,000 |
|
| 1,034,250 |
|
|
|
|
|
|
| 1,970,250 |
|
| |||||||
Cable 3.1% |
|
|
|
|
|
|
|
Charter Communications Holdings I: |
|
|
|
|
|
|
|
13.5%, 1/15/2014 |
|
| 3,075,000 |
|
| 2,217,844 |
|
11%, 10/1/2015 |
|
| 2,400,000 |
|
| 1,968,000 |
|
Charter Communications Holdings II 10.25%, 9/15/2010 |
|
| 1,000,000 |
|
| 985,000 |
|
CSC Holdings 6.75%, 4/15/2012 |
|
| 1,000,000 |
|
| 961,250 |
|
Liberty Media 8.5%, 7/15/2029 |
|
| 1,000,000 |
|
| 984,493 |
|
Mediacom Broadband 8.5%, 10/15/2015 |
|
| 1,000,000 |
|
| 891,250 |
|
|
|
|
|
|
| 8,007,837 |
|
10
Portfolio of Investments
December 31, 2007
|
|
|
|
|
|
|
|
|
| Principal |
| Value |
| ||
Capital Goods 1.7% |
|
|
|
|
|
|
|
Harland Clarke 9.619%, 5/15/2015# |
| $ | 950,000 |
| $ | 800,375 |
|
Norcross Safety Products 9.875%, 8/15/2011 |
|
| 3,100,000 |
|
| 3,200,750 |
|
SPX 7.625%, 12/15/2014* |
|
| 450,000 |
|
| 459,562 |
|
|
|
|
|
|
| 4,460,687 |
|
| |||||||
Chemicals 2.0% |
|
|
|
|
|
|
|
KI Holdings 0% (9.875%†), 11/15/2014 |
|
| 2,700,000 |
|
| 2,281,500 |
|
MacDermid 9.5%, 4/15/2017* |
|
| 975,000 |
|
| 921,375 |
|
Mosaic 7.625% 12/1/2016* |
|
| 950,000 |
|
| 1,030,750 |
|
Nova Chemicals 7.8625%, 11/15/2013# |
|
| 1,000,000 |
|
| 940,000 |
|
|
|
|
|
|
| 5,173,625 |
|
| |||||||
Consumer Products 3.9% |
|
|
|
|
|
|
|
ACCO Brands 7.625%, 8/15/2015 |
|
| 2,400,000 |
|
| 2,154,000 |
|
Jarden 7.5%, 5/1/2017 |
|
| 1,600,000 |
|
| 1,384,000 |
|
Jostens 0% (10.25%†), 12/1/2013 |
|
| 3,525,000 |
|
| 3,313,500 |
|
Reynolds American 7.625%, 6/1/2016 |
|
| 3,000,000 |
|
| 3,203,988 |
|
|
|
|
|
|
| 10,055,488 |
|
| |||||||
Containers and Packaging 1.6% |
|
|
|
|
|
|
|
AEP Industries 7.875%, 3/15/2013 |
|
| 1,375,000 |
|
| 1,316,562 |
|
Crown Cork & Seal 8%, 4/15/2023 |
|
| 975,000 |
|
| 931,125 |
|
Owens-Brockway Glass Container 8.25%, 5/15/2013 |
|
| 1,900,000 |
|
| 1,980,750 |
|
|
|
|
|
|
| 4,228,437 |
|
| |||||||
Diversified Telecommunication 3.7% |
|
|
|
|
|
|
|
Citizens Communications: |
|
|
|
|
|
|
|
9.25%, 5/15/2011 |
|
| 1,185,000 |
|
| 1,288,687 |
|
6.625%, 3/15/2015 |
|
| 650,000 |
|
| 622,375 |
|
Hawaiian Telecom Communications 12.5%, 5/1/2015 |
|
| 950,000 |
|
| 985,625 |
|
Nordic 8.875%, 5/1/2016* |
|
| 1,500,000 |
|
| 1,545,000 |
|
Qwest: |
|
|
|
|
|
|
|
7.5%, 10/1/2014 |
|
| 2,450,000 |
|
| 2,499,000 |
|
6.875%, 9/15/2033 |
|
| 500,000 |
|
| 463,750 |
|
Qwest Communications: |
|
|
|
|
|
|
|
8.369%, 2/15/2009# |
|
| 333,000 |
|
| 334,665 |
|
6.5%, 6/1/2017 |
|
| 800,000 |
|
| 770,000 |
|
Syniverse Technologies 7.75%, 8/15/2013 |
|
| 950,000 |
|
| 921,500 |
|
|
|
|
|
|
| 9,430,602 |
|
| |||||||
Electric 2.3% |
|
|
|
|
|
|
|
Aquila 14.875%, 7/1/2012 |
|
| 1,800,000 |
|
| 2,268,000 |
|
Midwest Generation 8.3%, 7/2/2009 |
|
| 1,340,910 |
|
| 1,361,024 |
|
Sierra Pacific Resources 8.625%, 3/15/2014 |
|
| 609,000 |
|
| 653,781 |
|
TXU 5.55%, 11/15/2014 |
|
| 2,008,000 |
|
| 1,612,791 |
|
|
|
|
|
|
| 5,895,596 |
|
11
Portfolio of Investments
December 31, 2007
|
|
|
|
|
|
|
|
|
| Principal |
| Value |
| ||
Energy 2.8% |
|
|
|
|
|
|
|
Atlas Pipeline Partners 8.125%, 12/15/2015 |
| $ | 950,000 |
| $ | 945,250 |
|
Bristow Group 7.5%, 9/15/2017* |
|
| 1,000,000 |
|
| 1,010,000 |
|
Complete Production Services 8%, 12/15/2016 |
|
| 925,000 |
|
| 899,562 |
|
El Paso 7%, 6/15/2017 |
|
| 2,000,000 |
|
| 2,012,074 |
|
Energy Partners 9.75%, 4/15/2014 |
|
| 1,220,000 |
|
| 1,159,000 |
|
Opti Canada: |
|
|
|
|
|
|
|
7.875%, 12/15/2014* |
|
| 850,000 |
|
| 835,125 |
|
8.25%, 12/15/2014* |
|
| 250,000 |
|
| 248,750 |
|
|
|
|
|
|
| 7,109,761 |
|
| |||||||
Environmental 0.5% |
|
|
|
|
|
|
|
Browning-Ferris Industries 7.4%, 9/15/2035 |
|
| 1,500,000 |
|
| 1,402,500 |
|
| |||||||
Finance 4.0% |
|
|
|
|
|
|
|
GMAC: |
|
|
|
|
|
|
|
7.25%, 3/2/2011 |
|
| 3,000,000 |
|
| 2,631,390 |
|
6.75%, 12/1/2014 |
|
| 2,575,000 |
|
| 2,079,557 |
|
8%, 11/1/2031 |
|
| 1,000,000 |
|
| 840,871 |
|
Kar Holdings: |
|
|
|
|
|
|
|
8.75%, 5/1/2014* |
|
| 475,000 |
|
| 439,375 |
|
10%, 5/1/2015* |
|
| 475,000 |
|
| 426,312 |
|
Neff 10%, 6/1/2015 |
|
| 2,000,000 |
|
| 1,100,000 |
|
Nuveen Investments 10.5%, 11/15/2015* |
|
| 1,000,000 |
|
| 1,001,250 |
|
SGS International 12%, 12/15/2013 |
|
| 950,000 |
|
| 946,437 |
|
USI Holdings: |
|
|
|
|
|
|
|
8.744%, 11/15/2014*# |
|
| 225,000 |
|
| 193,500 |
|
9.75%, 5/15/2015* |
|
| 225,000 |
|
| 182,250 |
|
Ventas Realty 6.75%, 6/1/2010 |
|
| 500,000 |
|
| 506,250 |
|
|
|
|
|
|
| 10,347,192 |
|
| |||||||
Food and Beverage 4.6% |
|
|
|
|
|
|
|
Chiquita Brands International 8.875%, 12/1/2015 |
|
| 1,000,000 |
|
| 910,000 |
|
Constellation Brands 7.375%, 12/15/2014 |
|
| 500,000 |
|
| 503,750 |
|
Dean Foods 7%, 6/1/2016 |
|
| 1,000,000 |
|
| 895,000 |
|
Del Monte: |
|
|
|
|
|
|
|
8.625%, 12/15/2012 |
|
| 1,950,000 |
|
| 1,974,375 |
|
6.75%, 2/15/2015 |
|
| 675,000 |
|
| 641,250 |
|
Pilgrims Pride 8.375%, 5/1/2017 |
|
| 1,800,000 |
|
| 1,773,000 |
|
Reddy Ice Holdings 0% (10.5%†), 11/1/2012 |
|
| 3,800,000 |
|
| 3,610,000 |
|
Smithfield Foods: |
|
|
|
|
|
|
|
7%, 8/1/2011 |
|
| 650,000 |
|
| 643,500 |
|
7.75%, 7/1/2017 |
|
| 1,000,000 |
|
| 972,500 |
|
|
|
|
|
|
| 11,923,375 |
|
12
Portfolio of Investments
December 31, 2007
|
|
|
|
|
|
|
|
|
| Principal |
| Value |
| ||
Food and Staples Retailing 1.7% |
|
|
|
|
|
|
|
Duane Reade 9.75%, 8/1/2011 |
| $ | 1,150,000 |
| $ | 1,043,625 |
|
Rite Aid: |
|
|
|
|
|
|
|
8.625%, 3/1/2015 |
|
| 975,000 |
|
| 790,969 |
|
7.5%, 3/1/2017 |
|
| 975,000 |
|
| 864,094 |
|
Stater Brothers Holdings 8.125%, 6/15/2012 |
|
| 500,000 |
|
| 496,250 |
|
Susser Holdings: |
|
|
|
|
|
|
|
10.625%, 12/15/2013 |
|
| 670,000 |
|
| 696,800 |
|
10.625%, 12/15/2013* |
|
| 500,000 |
|
| 520,000 |
|
|
|
|
|
|
| 4,411,738 |
|
| |||||||
Gaming 2.3% |
|
|
|
|
|
|
|
Inn Of The Mountain Gods 12%, 11/15/2010 |
|
| 1,175,000 |
|
| 1,227,875 |
|
Mandalay Resort Group 9.375%, 2/15/2010 |
|
| 2,750,000 |
|
| 2,860,000 |
|
San Pasqual 8%, 9/15/2013* |
|
| 950,000 |
|
| 940,500 |
|
Station Casinos 6.875%, 3/1/2016 |
|
| 1,350,000 |
|
| 992,250 |
|
|
|
|
|
|
| 6,020,625 |
|
| |||||||
Healthcare Facilities and Supplies 6.2% |
|
|
|
|
|
|
|
Advanced Medical Optics 7.5%, 5/1/2017 |
|
| 475,000 |
|
| 439,375 |
|
Centene 7.25%, 4/1/2014 |
|
| 1,000,000 |
|
| 980,000 |
|
DaVita 7.25%, 3/15/2015 |
|
| 1,500,000 |
|
| 1,511,250 |
|
Fresenius Medical Care Capital Trust 7.875%, 6/15/2011 |
|
| 1,940,000 |
|
| 2,017,600 |
|
HCA: |
|
|
|
|
|
|
|
9.125%, 11/15/2014 |
|
| 500,000 |
|
| 521,250 |
|
6.5%, 2/15/2016 |
|
| 1,900,000 |
|
| 1,615,000 |
|
9.25%, 11/15/2016 |
|
| 500,000 |
|
| 526,250 |
|
7.5%, 11/6/2033 |
|
| 1,900,000 |
|
| 1,496,250 |
|
HealthSouth: |
|
|
|
|
|
|
|
10.829%, 6/15/2014# |
|
| 1,350,000 |
|
| 1,380,375 |
|
10.75%, 6/15/2016 |
|
| 1,000,000 |
|
| 1,050,000 |
|
Invacare 9.75%, 2/15/2015 |
|
| 500,000 |
|
| 508,750 |
|
Omega Healthcare Investors 7%, 1/15/2016 |
|
| 1,950,000 |
|
| 1,930,500 |
|
PTS Acquisition 9.5%, 4/15/2015*## |
|
| 850,000 |
|
| 792,625 |
|
Tenet Healthcare 9.25%, 2/1/2015 |
|
| 1,150,000 |
|
| 1,069,500 |
|
|
|
|
|
|
| 15,838,725 |
|
Leisure 0.8% |
|
|
|
|
|
|
|
HRP Myrtle Beach Operations 9.894%, 4/1/2012*# |
|
| 1,000,000 |
|
| 957,500 |
|
Universal City Florida Holding 9.661%, 5/1/2010# |
|
| 1,000,000 |
|
| 1,005,000 |
|
|
|
|
|
|
| 1,962,500 |
|
Lodging 1.8% |
|
|
|
|
|
|
|
Felcor Lodging 8.5%, 6/1/2011 |
|
| 2,625,000 |
|
| 2,749,688 |
|
Host Marriott 6.75%, 6/1/2016 |
|
| 1,925,000 |
|
| 1,905,750 |
|
|
|
|
|
|
| 4,655,438 |
|
13
Portfolio of Investments
December 31, 2007
|
|
|
|
|
|
|
|
|
|
| Principal |
|
| Value |
|
Metals and Mining 3.5% |
|
|
|
|
|
|
|
Aleris 10%, 12/15/2016 |
| $ | 1,000,000 |
| $ | 815,000 |
|
FMG Finance 10%, 9/1/2013* |
|
| 2,000,000 |
|
| 2,200,000 |
|
Gerdau Ameristeel 10.375%, 7/15/2011 |
|
| 1,750,000 |
|
| 1,850,625 |
|
Massey Energy 6.875%, 12/15/2013 |
|
| 500,000 |
|
| 473,750 |
|
Peabody Energy 6.875%, 3/15/2013 |
|
| 500,000 |
|
| 505,000 |
|
PNA Group 10.75%, 9/1/2016 |
|
| 1,500,000 |
|
| 1,417,500 |
|
UCAR Finance 10.25%, 2/15/2012 |
|
| 1,596,000 |
|
| 1,653,855 |
|
|
|
|
|
|
| 8,915,730 |
|
|
|
|
|
|
|
|
|
Miscellaneous 0.2% |
|
|
|
|
|
|
|
TRAINS HY-1-2006 7.117%, 5/1/2016* |
|
| 592,000 |
|
| 574,991 |
|
|
|
|
|
|
|
|
|
Oil, Gas and Consumable Fuels 4.0% |
|
|
|
|
|
|
|
Chesapeake Energy 6.5%, 8/15/2017 |
|
| 3,050,000 |
|
| 2,958,500 |
|
Forest Oil 7.25%, 6/15/2019* |
|
| 2,000,000 |
|
| 2,020,000 |
|
Helix Energy 9.5%, 1/15/2016* |
|
| 950,000 |
|
| 971,375 |
|
Mariner Energy 8%, 5/15/2017 |
|
| 950,000 |
|
| 908,437 |
|
Petrohawk Energy 9.125%, 7/15/2013 |
|
| 1,000,000 |
|
| 1,057,500 |
|
Plains Exploration and Production 7.75%, 6/15/2015 |
|
| 1,600,000 |
|
| 1,608,000 |
|
W & T Offshore 8.25%, 6/15/2014* |
|
| 925,000 |
|
| 871,813 |
|
|
|
|
| �� |
| 10,395,625 |
|
|
|
|
|
|
|
|
|
Paper and Forest Products 2.1% |
|
|
|
|
|
|
|
Domtar 7.875%,10/15/2011 |
|
| 950,000 |
|
| 974,938 |
|
Georgia-Pacific 8.875%, 5/15/2031 |
|
| 3,000,000 |
|
| 2,910,000 |
|
Newpage 10%, 5/1/2012* |
|
| 500,000 |
|
| 505,000 |
|
Verso Paper Holdings 9.125%, 8/1/2014 |
|
| 1,000,000 |
|
| 1,015,000 |
|
|
|
|
|
|
| 5,404,938 |
|
|
|
|
|
|
|
|
|
Publishing 3.4% |
|
|
|
|
|
|
|
Dex Media 0% (9%†), 11/15/2013 |
|
| 3,225,000 |
|
| 2,950,875 |
|
Idearc 8%, 11/15/2016 |
|
| 2,000,000 |
|
| 1,845,000 |
|
R H Donnelley 8.875%, 1/15/2016 |
|
| 2,975,000 |
|
| 2,796,500 |
|
Readers Digest 9%, 2/15/2017* |
|
| 1,250,000 |
|
| 1,053,125 |
|
|
|
|
|
|
| 8,645,500 |
|
|
|
|
|
|
|
|
|
Road and Rail 0.4% |
|
|
|
|
|
|
|
American Railcar Industries 7.5%, 3/1/2014 |
|
| 1,000,000 |
|
| 950,000 |
|
|
|
|
|
|
|
|
|
Satellite 2.6% |
|
|
|
|
|
|
|
Echostar DBS: |
|
|
|
|
|
|
|
7%, 10/1/2013 |
|
| 2,000,000 |
|
| 2,030,000 |
|
7.125%, 2/1/2016 |
|
| 2,850,000 |
|
| 2,921,250 |
|
Sirius Satellite Radio 9.625%, 8/1/2013 |
|
| 1,000,000 |
|
| 950,000 |
|
XM Satellite Radio 9.411%, 5/1/2013# |
|
| 800,000 |
|
| 756,000 |
|
|
|
|
|
|
| 6,657,250 |
|
|
See footnotes on page 19. |
14
Portfolio of Investments
December 31, 2007
|
|
|
|
|
|
|
|
|
|
| Principal |
|
| Value |
|
Services 3.9% |
|
|
|
|
|
|
|
Ashtead 9%, 8/15/2016* |
| $ | 1,000,000 |
| $ | 890,000 |
|
Avis Budget Car Rental 7.369%, 5/15/2014# |
|
| 1,250,000 |
|
| 1,156,250 |
|
Harland Clarke Holding 9.5%, 5/15/2015 |
|
| 1,950,000 |
|
| 1,696,500 |
|
Rental Service 9.5%, 12/1/2014 |
|
| 1,000,000 |
|
| 900,000 |
|
Service Corporation 8%, 6/15/2017 |
|
| 3,450,000 |
|
| 3,320,625 |
|
West 11%, 10/15/2016 |
|
| 2,000,000 |
|
| 1,995,000 |
|
|
|
|
|
|
| 9,958,375 |
|
|
|
|
|
|
|
|
|
Specialty Retail 1.1% |
|
|
|
|
|
|
|
Asbury Automotive Group 7.625%, 3/15/2017 |
|
| 925,000 |
|
| 823,250 |
|
Neiman Marcus 9%, 10/15/2015## |
|
| 950,000 |
|
| 984,438 |
|
Sally Holdings 10.5%, 11/15/2016 |
|
| 1,000,000 |
|
| 990,000 |
|
|
|
|
|
|
| 2,797,688 |
|
|
|
|
|
|
|
|
|
Technology 6.7% |
|
|
|
|
|
|
|
Amkor Technology 9.25%, 6/1/2016 |
|
| 1,000,000 |
|
| 1,007,500 |
|
Freescale Semiconductor 10.125%, 12/15/2016 |
|
| 2,800,000 |
|
| 2,324,000 |
|
Ikon Office Solutions: |
|
|
|
|
|
|
|
9.926%, 1/1/2012*# |
|
| 1,000,000 |
|
| 1,010,000 |
|
| |||||||
7.75%, 9/15/2015 |
|
| 2,850,000 |
|
| 2,981,813 |
|
Nortel Networks 10.75%, 7/15/2016* |
|
| 1,500,000 |
|
| 1,582,500 |
|
Seagate Technology 6.375%, 10/1/2011 |
|
| 1,950,000 |
|
| 1,932,938 |
|
Serena Software 10.375%, 3/15/2016 |
|
| 950,000 |
|
| 940,500 |
|
STATS Chip Pac 7.5%, 7/19/2010 |
|
| 2,700,000 |
|
| 2,801,250 |
|
Sunguard Data System 9.125%, 8/15/2013 |
|
| 1,500,000 |
|
| 1,533,750 |
|
Viasystems 10.5%, 1/15/2011 |
|
| 1,175,000 |
|
| 1,175,000 |
|
|
|
|
|
|
| 17,289,251 |
|
|
|
|
|
|
|
|
|
Textile, Apparel and Shoes 0.7% |
|
|
|
|
|
|
|
Quiksilver 6.875%, 4/15/2015 |
|
| 2,125,000 |
|
| 1,832,813 |
|
|
|
|
|
|
|
|
|
Utilities 5.4% |
|
|
|
|
|
|
|
AES 9.375%, 9/15/2010 |
|
| 4,500,000 |
|
| 4,747,500 |
|
Allegheny Energy Supply 7.8%, 3/15/2011 |
|
| 2,000,000 |
|
| 2,095,000 |
|
Dynegy Holdings: |
|
|
|
|
|
|
|
8.75%, 2/15/2012 |
|
| 975,000 |
|
| 989,625 |
|
8.375%, 5/1/2016 |
|
| 2,375,000 |
|
| 2,333,438 |
|
Edison Mission Energy 7%, 5/15/2017 |
|
| 1,850,000 |
|
| 1,826,875 |
|
NRG Energy 7.375%, 2/1/2016 |
|
| 1,908,000 |
|
| 1,865,070 |
|
|
|
|
|
|
| 13,857,508 |
|
Total Corporate Bonds (Cost $224,680,535) |
|
|
|
|
| 215,997,365 |
|
|
See footnotes on page 19. |
15
Portfolio of Investments
December 31, 2007
|
|
|
|
|
|
|
|
|
|
| Shares |
|
| Value |
|
Common Stocks 9.4% |
|
|
|
|
|
|
|
Aerospace and Defense 0.5% |
|
|
|
|
|
|
|
BE Aerospace** |
|
| 11,265 |
| $ | 595,919 |
|
DRS Technologies |
|
| 4,555 |
|
| 247,200 |
|
Hexcel** |
|
| 16,430 |
|
| 398,920 |
|
|
|
|
|
|
| 1,242,039 |
|
|
|
|
|
|
|
|
|
Airlines 0.5% |
|
|
|
|
|
|
|
Continental Airlines** |
|
| 14,150 |
|
| 314,838 |
|
Delta** |
|
| 21,910 |
|
| 326,240 |
|
Northwest** |
|
| 21,710 |
|
| 315,012 |
|
UAL** |
|
| 8,870 |
|
| 316,304 |
|
|
|
|
|
|
| 1,272,394 |
|
|
|
|
|
|
|
|
|
Automobiles 0.2% |
|
|
|
|
|
|
|
Ford Motors** |
|
| 39,550 |
|
| 266,172 |
|
General Motors |
|
| 9,220 |
|
| 229,486 |
|
|
|
|
|
|
| 495,658 |
|
|
|
|
|
|
|
|
|
Auto Components 0.1% |
|
|
|
|
|
|
|
Goodyear Tire and Rubber** |
|
| 12,220 |
|
| 344,848 |
|
|
|
|
|
|
|
|
|
Beverages 0.1% |
|
|
|
|
|
|
|
Constellation Brands (Class A)** |
|
| 10,290 |
|
| 243,256 |
|
|
|
|
|
|
|
|
|
Capital Markets 0.0% |
|
|
|
|
|
|
|
E*TRADE Financial** |
|
| 20,770 |
|
| 73,734 |
|
|
|
|
|
|
|
|
|
Commercial Services and Supplies 0.4% |
|
|
|
|
|
|
|
Allied Waste Industries** |
|
| 18,890 |
|
| 208,168 |
|
Corrections Corporation of America** |
|
| 18,380 |
|
| 542,394 |
|
Mobile Mini** |
|
| 11,110 |
|
| 205,979 |
|
|
|
|
|
|
| 956,541 |
|
|
|
|
|
|
|
|
|
Communications Equipment 0.1% |
|
|
|
|
|
|
|
Corning |
|
| 12,560 |
|
| 301,314 |
|
Comverse Technology** |
|
| 2 |
|
| 35 |
|
|
|
|
|
|
| 301,349 |
|
|
|
|
|
|
|
|
|
Computers and Peripherals 0.5% |
|
|
|
|
|
|
|
Apple** |
|
| 3,385 |
|
| 670,501 |
|
Seagate Technology |
|
| 19,975 |
|
| 509,362 |
|
|
|
|
|
|
| 1,179,863 |
|
|
|
|
|
|
|
|
|
Containers and Packaging 0.6% |
|
|
|
|
|
|
|
Ball |
|
| 9,400 |
|
| 423,000 |
|
Owens-Illinois** |
|
| 11,150 |
|
| 551,925 |
|
Silgan Holdings |
|
| 8,690 |
|
| 451,359 |
|
Smurfit-Stone Container** |
|
| 9,853 |
|
| 104,048 |
|
|
|
|
|
|
| 1,530,332 |
|
|
See footnotes on page 19. |
16
Portfolio of Investments
December 31, 2007
|
|
|
|
|
|
|
|
|
|
| Shares |
|
| Value |
|
Diversified Telecommunication 0.1% |
|
|
|
|
|
|
|
Citizens Communications |
|
| 21,580 |
| $ | 274,713 |
|
|
|
|
|
|
|
|
|
Electric Utilities 0.3% |
|
|
|
|
|
|
|
Allegheny Energy** |
|
| 7,395 |
|
| 470,396 |
|
Sierra Pacific Resources |
|
| 24,120 |
|
| 409,558 |
|
|
|
|
|
|
| 879,954 |
|
|
|
|
|
|
|
|
|
Electronic Equipment and Instruments 0.1% |
|
|
|
|
|
|
|
Flextronics International** |
|
| 26,325 |
|
| 317,479 |
|
|
|
|
|
|
|
|
|
Food Products 0.2% |
|
|
|
|
|
|
|
Pilgrim’s Pride |
|
| 15,625 |
|
| 452,344 |
|
|
|
|
|
|
|
|
|
Health Care Facilities and Supplies 0.1% |
|
|
|
|
|
|
|
Advanced Medical Optics** |
|
| 12,440 |
|
| 305,153 |
|
|
|
|
|
|
|
|
|
Hotels, Restaurants and Leisure 0.3% |
|
|
|
|
|
|
|
Domino’s Pizza** |
|
| 22,550 |
|
| 298,336 |
|
Las Vegas Sands** |
|
| 4,045 |
|
| 416,837 |
|
|
|
|
|
|
| 715,173 |
|
|
|
|
|
|
|
|
|
Independent Power Producers and Energy Traders 0.1% |
|
|
|
|
|
|
|
NRG Energy** |
|
| 4,310 |
|
| 186,795 |
|
|
|
|
|
|
|
|
|
Index Derivatives 2.6% |
|
|
|
|
|
|
|
iShares Russell 2000 Index Fund |
|
| 42,670 |
|
| 3,239,506 |
|
SPDR Trust Series 1 |
|
| 22,680 |
|
| 3,316,043 |
|
|
|
|
|
|
| 6,555,549 |
|
|
|
|
|
|
|
|
|
Media 0.1% |
|
|
|
|
|
|
|
Charter Communications (Class A)** |
|
| 121,110 |
|
| 141,699 |
|
|
|
|
|
|
|
|
|
Metals and Mining 0.5% |
|
|
|
|
|
|
|
Companhia Vale do Rio Doce “CVRD” (ADR) |
|
| 16,230 |
|
| 530,234 |
|
Freeport-McMoRan Copper & Gold |
|
| 5,275 |
|
| 540,371 |
|
Reliance Steel and Aluminum |
|
| 3,365 |
|
| 182,383 |
|
|
|
|
|
|
| 1,252,988 |
|
|
|
|
|
|
|
|
|
Multi-Utilities 0.2% |
|
|
|
|
|
|
|
Aquila** |
|
| 41,655 |
|
| 155,373 |
|
TECO Energy |
|
| 23,815 |
|
| 409,856 |
|
|
|
|
|
|
| 565,229 |
|
|
|
|
|
|
|
|
|
Oil, Gas and Consumable Fuels 0.8% |
|
|
|
|
|
|
|
Chesapeake Energy |
|
| 14,180 |
|
| 555,856 |
|
El Paso |
|
| 28,950 |
|
| 499,098 |
|
Patriot Coal** |
|
| 666 |
|
| 27,799 |
|
Peabody Energy |
|
| 7,750 |
|
| 477,710 |
|
Williams Companies |
|
| 15,405 |
|
| 551,191 |
|
|
|
|
|
|
| 2,111,654 |
|
|
See footnotes on page 19. |
17
|
Portfolio of Investments |
December 31, 2007 |
|
|
|
|
|
|
|
|
|
|
| Shares or |
| Value |
| |
Paper and Forest Products 0.1% |
|
|
|
|
|
|
|
Domtar** |
|
| 20,075 | shs. | $ | 154,377 |
|
|
|
|
|
|
|
|
|
Real Estate Investment Trusts 0.3% |
|
|
|
|
|
|
|
FelCor Lodging Trust |
|
| 13,730 |
|
| 214,051 |
|
Omega Healthcare Investors |
|
| 18,050 |
|
| 289,702 |
|
Senior Housing Properties Trust |
|
| 14,015 |
|
| 317,860 |
|
|
|
|
|
|
| 821,613 |
|
|
|
|
|
|
|
|
|
Road and Rail 0.2% |
|
|
|
|
|
|
|
Kansas City Southern** |
|
| 12,260 |
|
| 420,886 |
|
|
|
|
|
|
|
|
|
Semiconductors and Semiconductor Equipment 0.3% |
|
|
|
|
|
|
|
Advanced Micro Devices |
|
| 31,500 |
|
| 236,250 |
|
Applied Materials |
|
| 23,520 |
|
| 417,715 |
|
|
|
|
|
|
| 653,965 |
|
|
|
|
|
|
|
|
|
Specialty Retail 0.1% |
|
|
|
|
|
|
|
Asbury Automotive Group |
|
| 10,195 |
|
| 153,435 |
|
|
|
|
|
|
|
|
|
Tobacco 0.1% |
|
|
|
|
|
|
|
Reynolds American |
|
| 5,090 |
|
| 335,736 |
|
|
|
|
|
|
|
|
|
Wireless Telecommunication Services 0.1% |
|
|
|
|
|
|
|
Crown Castle International** |
|
| 5,255 |
|
| 218,608 |
|
Total Common Stocks (Cost $25,117,841) |
|
|
|
|
| 24,157,364 |
|
|
|
|
|
|
|
|
|
Short-Term Holdings 6.7% |
|
|
|
|
|
|
|
|
|
|
|
|
|
|
|
Corporate Bond 0.3% |
|
|
|
|
|
|
|
Residential Capital 5.646%, 6/9/2008# (Cost $935,963) |
| $ | 1,000,000 |
|
| 860,000 |
|
|
|
|
|
|
|
|
|
Equity-Linked Notes†† 2.3% |
|
|
|
|
|
|
|
Deutsche Bank: |
|
|
|
|
|
|
|
33.25%, 2/1/2008 (a) |
|
| 500,000 |
|
| 293,040 |
|
25.05%, 3/26/2008 (b) |
|
| 3,000,000 |
|
| 3,088,950 |
|
Goldman Sachs Group: |
|
|
|
|
|
|
|
40%, 2/19/2008 (c) |
|
| 500,000 |
|
| 335,855 |
|
40%, 3/19/2008 (d) |
|
| 500,000 |
|
| 391,875 |
|
35.5%, 4/21/2008 (e) |
|
| 500,000 |
|
| 352,880 |
|
Lehman Brothers: |
|
|
|
|
|
|
|
41.66%, 2/9/2008 (f) |
|
| 500,000 |
|
| 278,491 |
|
39.35%, 3/5/2008 (g) |
|
| 500,000 |
|
| 443,140 |
|
37.51%, 3/19/2008 (h) |
|
| 500,000 |
|
| 415,925 |
|
Morgan Stanley: |
|
|
|
|
|
|
|
44.61%, 2/15/2008 (i) |
|
| 500,000 |
|
| 187,528 |
|
Total Equity-Linked Notes (Cost $7,000,000) |
|
|
|
|
| 5,787,684 |
|
|
See footnotes on page 19. |
18
|
Portfolio of Investments |
December 31, 2007 |
|
|
|
|
|
|
|
|
|
| Principal |
| Value |
| ||
Repurchase Agreement 4.1% |
|
|
|
|
|
|
|
Fixed Income Clearing Corporation 2.85%, dated 12/31/2007 maturing 1/2/2008 in the amount of $10,578,675 collateralized by $10,965,000 Federal Home Loan Bank 5.625%, 11/23/2035, with a fair market value of $10,896,469 (Cost $10,577,000) |
| $ | 10,577,000 |
| $ | 10,577,000 |
|
|
|
|
|
|
|
|
|
Total Short-Term Investments (Cost $18,512,963) |
|
|
|
|
| 17,224,684 |
|
|
|
|
|
|
|
|
|
Total Investments (Cost $268,311,339) 100.2% |
|
|
|
|
| 257,379,413 |
|
|
|
|
|
|
|
|
|
Other Assets Less Liabilities (0.2)% |
|
|
|
|
| (625,561 | ) |
|
|
|
|
|
|
|
|
Net Assets 100.0% |
|
|
|
| $ | 256,753,852 |
|
|
|
|
* | The security may be offered and sold only to “qualified institutional buyer” under Rule 144A of the Security Act of 1933. | |
** | Non-income producing security. | |
# | Floating rate security, the interest rate is reset periodically. The interest rate disclosed reflects the rate in effect at December 31, 2007. | |
## | Pay-in-kind bond. | |
† | Deferred-interest debentures pay no interest for a stipulated number of years, after which they pay the indicated coupon rate. | |
†† | The security may be offered and sold only to a “qualified institutional buyer” under Rule 144A of the Securities Act of 1933. These notes are exchangeable at maturity, based on the terms of the respective notes, for shares of common stock of a company or cash at a maturity value which is generally determined as follows: | |
| The principal amount of the notes plus or minus the lesser of A) the lowest return of the companies’ respective stock prices determined at maturity from the date of purchase of the notes, or B) the percent limit indicated below in parentheses: | |
| (a) | Gemstar-TV Guide International, OfficeMax and Qwest Communications International (+20%) |
| (b) | AES, Crown Holdings and Service Corporation International (no limit) |
| (c) | Delta Air Lines, Discover Financial Services and SAVVIS (no limit) |
| (d) | Gemstar-TV Guide International, UTI Worldwide and Yahoo! (no limit) |
| (e) | Comverse Technology, Northwest Airlines and Qwest Communications International (no limit) |
| (f) | Network Appliance, Rite Aid and Yahoo! (+20%) |
| (g) | Boston Scientific, Comverse Technology and Marvell Technology (no limit) |
| (h) | Comverse Technology, Kohl’s and Marvell Technology (no limit) |
| (i) | QIMONDA ADR, Rite Aid and Washington Mutual (+20%) |
|
|
|
Industry classifications have not been audited by Deloitte & Touche LLP. | ||
|
|
|
See Notes to Financial Statements. |
19
|
December 31, 2007 |
|
|
|
|
|
Assets: |
|
|
|
|
Investments, at value: |
|
|
|
|
Corporate bonds (cost $224,680,535) |
| $ | 215,997,365 |
|
Common stocks (cost $25,117,841) |
|
| 24,157,364 |
|
Equity-linked notes (cost $7,000,000) |
|
| 5,787,684 |
|
Other short-term holdings (cost $11,512,963) |
|
| 11,437,000 |
|
Total investments (cost $268,311,339) |
|
| 257,379,413 |
|
Restricted cash |
|
| 4,000 |
|
Receivable for securities sold |
|
| 30,169 |
|
Dividends and interest receivable |
|
| 4,615,447 |
|
Receivable for shares of Beneficial Interest sold |
|
| 815,683 |
|
Paydown receivable |
|
| 63,857 |
|
Expenses prepaid to shareholder service agent |
|
| 16,264 |
|
Other |
|
| 12,750 |
|
Total Assets: |
|
| 262,937,583 |
|
|
|
|
|
|
Liabilities: |
|
|
|
|
Bank overdraft |
|
| 2,620,326 |
|
Payable for shares of Beneficial Interest repurchased |
|
| 1,992,923 |
|
Dividends payable |
|
| 847,108 |
|
Payable for securities purchased |
|
| 379,563 |
|
Management fee payable |
|
| 143,816 |
|
Distribution and service (12b-1) fees payable |
|
| 103,014 |
|
Accrued expenses and other |
|
| 96,981 |
|
Total Liabilities |
|
| 6,183,731 |
|
Net Assets |
| $ | 256,753,852 |
|
|
|
|
|
|
Composition of Net Assets: |
|
|
|
|
Shares of Beneficial Interest, at par (unlimited shares authorized; |
|
|
|
|
Class A |
| $ | 50,367 |
|
Class B |
|
| 7,184 |
|
Class C |
|
| 5,596 |
|
Class D |
|
| 14,111 |
|
Class I |
|
| 2,501 |
|
Class R |
|
| 1,216 |
|
Additional paid-in capital |
|
| 1,638,899,656 |
|
Undistributed net investment income (Note 6) |
|
| 800,229 |
|
Accumulated net realized loss (Note 6) |
|
| (1,372,095,082 | ) |
Net unrealized depreciation of investments |
|
| (10,931,926 | ) |
Net Assets |
| $ | 256,753,852 |
|
|
|
|
|
|
Net Asset Value Per Share: |
|
|
|
|
Class A ($159,566,373 ÷ 50,367,441 shares) |
| $ | 3.17 |
|
Class B ($22,759,592 ÷ 7,183,853 shares) |
| $ | 3.17 |
|
Class C ($17,787,862 ÷ 5,596,218 shares) |
| $ | 3.18 |
|
Class D ($44,859,612 ÷ 14,111,170 shares) |
| $ | 3.18 |
|
Class I ($7,924,449 ÷ 2,500,809 shares) |
| $ | 3.17 |
|
Class R ($3,855,964 ÷ 1,215,637 shares) |
| $ | 3.17 |
|
|
See Notes to Financial Statements. |
20
|
For the Year Ended December 31, 2007 |
|
|
|
|
|
Investment Income: |
|
|
|
|
Interest |
| $ | 24,812,798 |
|
Dividends |
|
| 442,995 |
|
Other income |
|
| 875,523 |
|
Total Investment Income |
|
| 26,131,316 |
|
|
|
|
|
|
Expenses: |
|
|
|
|
Management fee |
|
| 1,927,944 |
|
Distribution and service (12b-1) fees |
|
| 1,561,226 |
|
Shareholder account services |
|
| 969,665 |
|
Registration |
|
| 126,728 |
|
Custody and related services |
|
| 94,776 |
|
Auditing and legal fees |
|
| 86,094 |
|
Shareholder reports and communications |
|
| 70,967 |
|
Directors’ fees and expenses |
|
| 14,239 |
|
Miscellaneous |
|
| 33,900 |
|
Total Expenses |
|
| 4,885,539 |
|
Net Investment Income |
|
| 21,245,777 |
|
|
|
|
|
|
Net Realized and Unrealized Gain (Loss) on Investments: |
|
|
|
|
Net realized gain on investments |
|
| 2,476,980 |
|
Net change in unrealized appreciation of investments |
|
| (20,609,207 | ) |
Net Loss on Investments |
|
| (18,132,227 | ) |
Increase in Net Assets from Operations |
| $ | 3,113,550 |
|
|
See Notes to Financial Statements. |
21
|
|
|
|
|
|
|
|
|
|
| Year Ended December 31, |
| ||||
|
| ||||||
|
| 2007 |
| 2006 |
| ||
Operations: |
|
|
|
|
|
|
|
Net investment income |
| $ | 21,245,777 |
| $ | 22,874,572 |
|
Net realized gain on investments |
|
| 2,476,980 |
|
| 5,367,908 |
|
Net change in unrealized appreciation of investments |
|
| (20,609,207 | ) |
| 3,831,562 |
|
Increase in Net Assets from Operations |
|
| 3,113,550 |
|
| 32,074,042 |
|
|
|
|
|
|
|
|
|
Distributions to Shareholders: |
|
|
|
|
|
|
|
Dividends from net investment income: |
|
|
|
|
|
|
|
Class A |
|
| (13,071,745 | ) |
| (11,689,382 | ) |
Class B |
|
| (2,389,457 | ) |
| (5,115,297 | ) |
Class C |
|
| (1,484,108 | ) |
| (1,770,851 | ) |
Class D |
|
| (3,523,423 | ) |
| (3,700,331 | ) |
Class I |
|
| (596,414 | ) |
| (531,659 | ) |
Class R |
|
| (180,630 | ) |
| (67,052 | ) |
Total |
|
| (21,245,777 | ) |
| (22,874,572 | ) |
Dividends in excess of net investment income: |
|
|
|
|
|
|
|
Class A |
|
| (60,184 | ) |
| (1,006,930 | ) |
Class B |
|
| (11,001 | ) |
| (440,635 | ) |
Class C |
|
| (6,833 | ) |
| (152,543 | ) |
Class D |
|
| (16,222 | ) |
| (318,748 | ) |
Class I |
|
| (2,746 | ) |
| (45,797 | ) |
Class R |
|
| (832 | ) |
| (5,776 | ) |
Total |
|
| (97,818 | ) |
| (1,970,429 | ) |
Decrease in Net Assets from Distributions |
|
| (21,343,595 | ) |
| (24,845,001 | ) |
|
|
|
|
|
|
|
|
Transactions in Shares of Beneficial Interest: |
|
|
|
|
|
|
|
Net proceeds from sales of shares |
|
| 18,867,364 |
|
| 19,127,082 |
|
Investment of dividends |
|
| 12,135,001 |
|
| 13,270,708 |
|
Exchanged from associated funds |
|
| 8,317,206 |
|
| 9,205,665 |
|
Total |
|
| 39,319,571 |
|
| 41,603,455 |
|
Cost of shares repurchased |
|
| (88,936,830 | ) |
| (123,031,462 | ) |
Exchanged into associated funds |
|
| (8,945,482 | ) |
| (13,397,308 | ) |
Total |
|
| (97,882,312 | ) |
| (136,428,770 | ) |
Decrease in Net Assets from Transactions in Shares of Beneficial Interest |
|
| (58,562,741 | ) |
| (94,825,315 | ) |
Decrease in Net Assets |
|
| (76,792,786 | ) |
| (87,596,274 | ) |
|
|
|
|
|
|
|
|
Net Assets: |
|
|
|
|
|
|
|
Beginning of year |
|
| 333,546,638 |
|
| 421,142,912 |
|
End of Year (includes undistributed (dividends in excess of) net investment income of $801,910 and $(204,231), respectively) |
| $ | 256,753,852 |
| $ | 333,546,638 |
|
|
See Notes to Financial Statements. |
22
|
|
|
1. | Organization and Multiple Classes of Shares — Seligman High-Yield Fund (the “Fund”) is a series of Seligman High Income Fund Series (the “Series”) which is registered with the Securities and Exchange Commission under the Investment Company Act of 1940, as amended (the “1940 Act”), as an open-end diversified management investment company. The Fund offers the following six classes of shares: | |
|
| |
| Class B shares are sold without an initial sales charge but are subject to a distribution fee of 0.75% and a service fee of up to 0.25% on an annual basis, and a CDSC, if applicable, of 5% on redemptions in the first year of purchase, declining to 1% in the sixth year and 0% thereafter. Class B shares will automatically convert to Class A shares approximately eight years after their date of purchase. If Class B shares of the Fund are exchanged for Class B shares of another Seligman mutual fund, the holding period of the shares exchanged will be added to the holding period of the shares acquired, both for determining the applicable CDSC and the conversion of Class B shares to Class A shares. | |
|
| |
| Class C and Class D shares are sold without an initial sales charge but are subject to a distribution fee of up to 0.75% and a service fee of up to 0.25% on an annual basis, and a CDSC, if applicable, of 1% imposed on redemptions made within one year of purchase. | |
|
| |
| Prior to June 4, 2007, Class C shares were sold primarily with an initial sales charge of up to 1%, and a CDSC, if applicable, of 1% imposed on redemptions made within 18 months of purchase; and shares purchased through certain financial intermediaries were bought without an initial sales charge and with a 1% CDSC on redemptions made within 12 months of purchase. | |
|
| |
| The Board of Trustees of the Series has approved the automatic conversion of all of the Fund’s outstanding Class D shares to Class C shares at their relative net asset values on a future date to be determined. The conversion is currently expected to be implemented in the first half of 2008, although it may be delayed or terminated at any time prior to effectiveness. The conversion is not expected to affect individual shareholder account values. | |
|
| |
| Class I shares are offered to certain institutional clients and other investors, as described in the Fund’s Class I shares prospectus. Class I shares are sold without any sales charges and are not subject to distribution or service fees. | |
|
| |
| Class R shares are offered to certain employee benefit plans and are not available to all investors. They are sold without an initial sales charge, but are subject to a distribution fee of up to 0.25% and a service fee of up to 0.25% on an annual basis, and a CDSC, if applicable, of 1% on redemptions made within one year of a plan’s initial purchase of Class R shares. | |
|
| |
| All classes of shares represent interests in the same portfolio of investments, have the same rights and are generally identical in all respects except that each class bears its own class-specific expenses, and has exclusive voting rights with respect to any matter on which a separate vote of any class is required. | |
|
| |
2. | Significant Accounting Policies — The financial statements have been prepared in conformity with accounting principles generally accepted in the United States of America which require management to make certain estimates and assumptions at the date of the financial statements. Actual results may differ from these estimates. The following summarizes the significant accounting policies of the Fund: | |
|
|
|
| a. | Security Valuation and Risk — Securities traded on an exchange are valued at the last sales price on the primary exchange or market on which they are traded. Fixed income securities not listed on an |
23
Notes to Financial Statements
|
|
|
|
| exchange or security market are valued by independent pricing services based on bid prices, which consider such factors as coupons, maturities, credit ratings, liquidity, specific terms and features, and the US Treasury yield curve, or are valued by J. & W. Seligman & Co. Incorporated (the “Manager”) based on quotations provided by primary market makers in such securities. Equity securities not listed on an exchange or security market, or equity securities for which there is no last sales price, are valued at the mean of the most recent bid and asked prices or valued by the Manager based on quotations provided by primary market makers in such securities. Securities for which market quotations are not readily available (or are otherwise no longer valid or reliable) are valued at fair value determined in accordance with procedures approved by the Trustees. This can occur in the event of, among other things, natural disasters, acts of terrorism, market disruptions, intra-day trading halts, and extreme market volatility in the US markets. The determination of fair value involves subjective judgments. As a result, using fair value to price a security may result in a price materially different from the prices used by other mutual funds to determine net asset value or the price that may be realized upon the actual sale of the security. Short-term holdings that mature in more than 60 days are valued at current market quotations. Short-term holdings maturing in 60 days or less are valued at current market quotations or amortized cost if the Manager believes it approximates fair value. |
|
|
|
|
| Fixed income securities are subject to interest rate risk, credit risk, prepayment risk and market risk. High-yield securities are subject to higher volatility in yield and market value and a greater risk of loss of principal and interest than higher-rated, investment grade fixed income securities. |
|
|
|
| b. | Equity-Linked Notes — The Fund may purchase notes created by a counterparty, typically an investment bank. The notes bear interest at a fixed or floating rate. At maturity, the notes must be exchanged for an amount based on the value of one or more equity securities (“Underlying Stocks”) of third party issuers. The exchange value may be limited to an amount less than the actual value of the Underlying Stocks at the maturity date. Any difference between the exchange amount and the original cost of the notes will be a gain or loss. |
|
|
|
| c. | Repurchase Agreements — The Fund may enter into repurchase agreements. Generally, securities received as collateral subject to repurchase agreements are deposited with the Fund’s custodian and, pursuant to the terms of the repurchase agreement, must have an aggregate market value greater than or equal to the repurchase price, plus accrued interest, at all times. On a daily basis, the market value of securities held as collateral for repurchase agreements is monitored to ensure the existence of the proper level of collateral. |
|
|
|
| d. | Restricted Cash — Restricted cash represents deposits that are being held by banks as collateral for letters of credit issued in connection with the Fund’s insurance policies. |
|
|
|
| e. | Multiple Class Allocations — All income, expenses (other than class-specific expenses), and realized and unrealized gains or losses are allocated daily to each class of shares based upon the relative value of shares of each class. Class-specific expenses, which include distribution and service (12b-1) fees and any other items that are specifically attributable to a particular class, are charged directly to such class. For the year ended December 31, 2007, distribution and service (12b-1) fees, shareholder account services and registration expenses were class-specific expenses. |
|
|
|
| f. | Security Transactions and Related Investment Income — Investment transactions are recorded on trade dates. Identified cost of investments sold is used for both financial reporting and federal income tax purposes. Dividends receivable are recorded on ex-dividend dates. Interest income is recorded on an accrual basis. The Fund amortizes discount and premium on portfolio securities for financial reporting purposes. |
|
|
|
| g. | Distributions to Shareholders — Dividends are declared daily and paid monthly. Other distributions paid by the Fund are recorded on ex-dividend dates. |
|
|
|
| h. | Taxes — There is no provision for federal income tax. The Fund has elected to be taxed as a regulated investment company and intends to distribute substantially all taxable net income and net gain realized. |
24
Notes to Financial Statements
|
|
|
|
| On January 1, 2007, the Fund adopted Financial Accounting Standards Board (“FASB”) Interpretation No. 48 (“FIN 48”), “Accounting for Uncertainty in Income Taxes – an interpretation of FASB Statement No. 109.” FIN 48 requires the Fund to measure and recognize in its financial statements the benefit of a tax position taken (or expected to be taken) on an income tax return if such position will more likely than not be sustained upon examination based on the technical merits of the position. The Fund files income tax returns in the US Federal jurisdiction, as well as the New York State and New York City jurisdictions. Based upon its review of tax positions for the Fund’s open tax years of 2004-2007 in these jurisdictions, the Fund has determined that FIN 48 did not have a material impact on the Fund’s financial statements for the year ended December 31, 2007. |
|
|
|
3. | Management Fee, Distribution Services, and Other Transactions — The Manager manages the affairs of the Fund and provides the necessary personnel and facilities. Compensation of all officers of the Fund, all trustees of the Series who are employees of the Manager, and all personnel of the Fund and the Manager is paid by the Manager. The Manager receives a fee, calculated daily and payable monthly, equal to 0.65% per annum of the first $1 billion of the Fund’s average daily net assets and 0.55% per annum of the Fund’s average daily net assets in excess of $1 billion. The management fee reflected in the Statement of Operations represents 0.65% per annum of the Fund’s average daily net assets. | |
|
| |
| For the year ended December 31, 2007, Seligman Advisors, Inc. (the “Distributor”), agent for the distribution of the Fund’s shares and an affiliate of the Manager, received commissions and concessions of $6,276 from sales of Class A and (prior to June 4, 2007) Class C shares. Commissions of $35,701 and $2,388 were also paid to dealers for sales of Class A and Class C shares, respectively. | |
|
| |
| The Fund has an Administration, Shareholder Services and Distribution Plan (the “Plan”) with respect to distribution of its shares. Under the Plan, with respect to Class A shares, service organizations can enter into agreements with the Distributor and receive a continuing fee of up to 0.25% on an annual basis, payable monthly, of the average daily net assets of the Class A shares attributable to the particular service organizations for providing personal services and/or the maintenance of shareholder accounts. The Distributor charges such fees to the Fund pursuant to the Plan. For the year ended December 31, 2007, fees incurred under the Plan aggregated $433,874 or 0.25% per annum of the average daily net assets of Class A shares. | |
|
| |
| Under the Plan, with respect to Class B shares, Class C shares, Class D shares, and Class R shares, service organizations can enter into agreements with the Distributor and receive a continuing fee for providing personal services and/or the maintenance of shareholder accounts of up to 0.25% on an annual basis of the average daily net assets of the Class B, Class C, Class D, and Class R shares for which the organizations are responsible; and, for Class C, Class D, and Class R shares, fees for providing other distribution assistance of up to 0.75% (0.25%, in the case of Class R shares) on an annual basis of such average daily net assets. Such fees are paid monthly by the Fund to the Distributor pursuant to the Plan. | |
|
| |
| For the year ended December 31, 2007, fees incurred under the Plan, equivalent to 1% per annum of the average daily net assets of Class B, Class C, and Class D shares, and 0.50% per annum of average daily net assets of Class R shares, amounted to $366,259, $223,245, $525,887, and $11,961, respectively. | |
|
| |
| The Distributor and Seligman Services, Inc., also an affiliate of the Manager, are eligible to receive distribution and service (12b-1) fees pursuant to the Plan. For the year ended December 31, 2007, the Distributor and Seligman Services, Inc. received distribution and service (12b-1) fees of $18,024. | |
|
| |
| The Distributor is entitled to retain any CDSC imposed on certain redemptions of Class A, Class C, Class D and Class R shares. For the year ended December 31, 2007, such charges amounted to $19,502. The Distributor has sold its rights to third parties to collect any CDSC imposed on redemptions of Class B shares. | |
|
| |
| For the year ended December 31, 2007, Seligman Data Corp., which is owned by certain associated investment companies, charged the Fund at cost $969,665 for shareholder account services in accordance with a methodology approved by the Fund’s trustees. Class I shares receive more limited shareholder services than the Fund’s other classes of shares (the “Retail Classes”). Seligman Data Corp. does not allocate to Class I the costs of any of its departments that do not provide services to the Class I shareholders. |
25
Notes to Financial Statements
|
|
| Costs of Seligman Data Corp. directly attributable to the Retail Classes of the Fund were charged to those classes in proportion to their relative net asset values. Costs directly attributable to Class I shares were charged to Class I. The remaining charges were allocated to the Retail Classes and Class I by Seligman Data Corp. pursuant to a formula based on their net assets, shareholder transaction volumes and number of shareholder accounts. |
|
|
| The Series and certain other associated investment companies (together, the “Guarantors”) have severally but not jointly guaranteed the performance and observance of all the terms and conditions of two leases entered into by Seligman Data Corp., including the payment of rent by Seligman Data Corp. (the “Guaranties”). The leases and the related Guaranties expire in September 2008 and January 2019, respectively. The obligation of the Series to pay any amount due under the Guaranties is limited to a specified percentage of the full amount, which generally is based on the Series’ percentage of the expenses billed by Seligman Data Corp. to all Guarantors in the most recent calendar quarter. At December 31, 2007, the Series’ potential obligation under the Guaranties is $560,500. As of December 31, 2007, no event has occurred which would result in the Series becoming liable to make any payment under the Guaranties. The Fund would bear a portion of any payments made by the Series under the Guaranties. A portion of the rent paid by Seligman Data Corp. is charged to the Fund as part of Seligman Data Corp.’s shareholder account services cost. |
|
|
| Certain officers and trustees of the Series are officers or directors of the Manager, the Distributor, Seligman Services, Inc., and/or Seligman Data Corp. |
|
|
| The Series has a compensation arrangement under which trustees who receive fees may elect to defer receiving such fees. Trustees may elect to have their deferred fees accrue interest or earn a return based on the performance of the Fund or other funds in the Seligman Group of Investment Companies. The cost of such fees and earnings/losses accrued thereon is included in directors’ fees and expenses, and the accumulated balance thereof at December 31, 2007, of $1,479 is included in accrued expenses and other liabilities. Deferred fees and related accrued earnings are not deductible by the Fund for federal income tax purposes until such amounts are paid. |
|
|
4. | Committed Line of Credit — The Fund is a participant in a joint $375 million committed line of credit that is shared by substantially all open-end funds in the Seligman Group of Investment Companies. The trustees have currently limited the Fund’s borrowings to 10% of its net assets. Borrowings pursuant to the credit facility are subject to interest at a rate equal to the overnight federal funds rate plus 0.50%. The Fund incurs a commitment fee of 0.10% per annum on its share of the unused portion of the credit facility. The credit facility may be drawn upon only for temporary purposes and is subject to certain other customary restrictions. The credit facility commitment expires in June 2008, but is renewable annually with the consent of the participating banks. For the year ended December 31, 2007, the Fund did not borrow from the credit facility. |
|
|
5. | Purchases and Sales of Securities — Purchases and sales of portfolio securities, excluding short-term investments, for the year ended December 31, 2007, amounted to $214,312,527 and $283,403,302, respectively. |
|
|
6. | Federal Tax Information — Certain components of income, expense and realized capital gain and loss are recognized at different times or have a different character for federal income tax purposes and for financial reporting purposes. Where such differences are permanent in nature, they are reclassified in the components of net assets based on their characterization for federal income tax purposes. Any such reclassifications will have no effect on net assets, results of operations or net asset value per share of the Fund. As a result of the differences described above, the treatment for financial reporting purposes of distributions made during the year from net investment income or net realized gains may differ from their treatment for federal income tax purposes. Further, the cost of investments also can differ for federal income tax purposes. |
|
|
| At December 31, 2007, the cost of investments for federal income tax purposes was $268,821,578. The tax basis cost was greater than the cost for financial reporting purposes primarily due to the tax deferral of losses on wash sales in the amount of $175,825 and the amortization of premium for financial reporting purposes of $341,150. |
26
Notes to Financial Statements
|
|
| At December 31, 2007, the tax basis components of accumulated losses were as follows: |
|
|
|
|
|
Gross unrealized appreciation of portfolio securities |
| $ | 3,213,121 |
|
Gross unrealized depreciation of portfolio securities |
|
| (14,655,286 | ) |
Net unrealized depreciation of portfolio securities |
|
| (11,442,165 | ) |
Undistributed ordinary income |
|
| 1,142,859 |
|
Capital loss carryforwards |
|
| (1,370,110,003 | ) |
Timing differences (post-October losses) |
|
| (1,815,990 | ) |
Total accumulated losses |
| $ | (1,382,225,299 | ) |
|
|
| At December 31, 2007, the Fund had net capital loss carryforwards for federal income tax purposes of $1,370,110,003, which are available for offset against future taxable net capital gains, with $255,659,477 expiring in 2008, $668,622,539 expiring in 2009, $444,283,739 expiring in 2010, and $1,544,248 expiring in 2012. The amount was determined after adjustments for certain differences between financial reporting and tax purposes, such as wash sale losses. Accordingly, no capital gain distributions are expected to be paid to shareholders until net capital gains have been realized in excess of the available capital loss carryforwards. There can be no assurance that the Fund will be able to utilize all of these capital loss carryforwards before they expire. During the year ended December 31, 2007, prior year’s capital loss carryforwards of $3,267,512 were utilized and $75,368,455 expired. |
|
|
| In addition, from November 1, 2007 through December 31, 2007, the Fund incurred $1,815,990 of net realized capital losses. As permitted by tax regulations, the Fund intends to elect to defer these losses and treat them as arising in the fiscal year ended December 31, 2008. These losses will be available to offset future taxable net gains. |
|
|
| For the years ended December 31, 2007 and 2006, all of the distributions to shareholders were from ordinary income. |
|
|
7. | Transactions in Shares of Beneficial Interest — The Fund has authorized unlimited shares of $0.001 par value Shares of Beneficial Interest. Transactions in Shares of Beneficial Interest were as follows: |
|
|
|
|
|
|
|
|
|
|
|
|
|
|
|
| Year Ended December 31, |
| ||||||||||
|
| ||||||||||||
|
| 2007 |
| 2006 |
| ||||||||
|
| ||||||||||||
Class A |
| Shares |
| Amount |
| Shares |
| Amount |
| ||||
Net proceeds from sales of shares |
|
| 2,729,400 |
| $ | 9,144,259 |
|
| 2,908,239 |
| $ | 9,662,478 |
|
Investment of dividends |
|
| 2,104,623 |
|
| 7,010,714 |
|
| 1,960,526 |
|
| 6,488,284 |
|
Exchanged from associated funds |
|
| 1,806,733 |
|
| 6,038,741 |
|
| 1,285,834 |
|
| 4,238,336 |
|
Converted from Class B* |
|
| 6,015,436 |
|
| 20,295,266 |
|
| 11,062,126 |
|
| 36,659,286 |
|
Total |
|
| 12,656,192 |
|
| 42,488,980 |
|
| 17,216,725 |
|
| 57,048,384 |
|
Cost of shares repurchased |
|
| (14,534,335 | ) |
| (48,718,477 | ) |
| (16,984,499 | ) |
| (56,221,784 | ) |
Exchanged into associated funds |
|
| (1,795,032 | ) |
| (6,016,925 | ) |
| (2,422,750 | ) |
| (7,992,346 | ) |
Total |
|
| (16,329,367 | ) |
| (54,735,402 | ) |
| (19,407,249 | ) |
| (64,214,130 | ) |
Decrease |
|
| (3,673,175 | ) | $ | (12,246,422 | ) |
| (2,190,524 | ) | $ | (7,165,746 | ) |
Class B |
| Shares |
| Amount |
| Shares |
| Amount |
| ||||
Net proceeds from sales of shares |
|
| 112,758 |
| $ | 383,117 |
|
| 269,156 |
| $ | 891,124 |
|
Investment of dividends |
|
| 357,206 |
|
| 1,194,988 |
|
| 750,904 |
|
| 2,487,189 |
|
Exchanged from associated funds |
|
| 246,892 |
|
| 827,688 |
|
| 586,193 |
|
| 1,929,107 |
|
Total |
|
| 716,856 |
|
| 2,405,793 |
|
| 1,606,253 |
|
| 5,307,420 |
|
Cost of shares repurchased |
|
| (3,947,963 | ) |
| (13,295,661 | ) |
| (9,757,814 | ) |
| (32,399,540 | ) |
Exchanged into associated funds |
|
| (292,681 | ) |
| (972,233 | ) |
| (878,870 | ) |
| (2,927,765 | ) |
Converted to Class A* |
|
| (6,000,823 | ) |
| (20,269,764 | ) |
| (11,026,267 | ) |
| (36,600,603 | ) |
Total |
|
| (10,241,467 | ) |
| (34,537,658 | ) |
| (21,662,951 | ) |
| (71,927,908 | ) |
Decrease |
|
| (9,524,611 | ) | $ | (32,131,865 | ) |
| (20,056,698 | ) | $ | (66,620,488 | ) |
|
|
| |
| See footnote on page 28. |
27
Notes to Financial Statements
|
|
|
|
|
|
|
|
|
|
|
|
|
|
|
| Year Ended December 31, |
| ||||||||||
|
| ||||||||||||
|
| 2007 |
| 2006 |
| ||||||||
|
| ||||||||||||
Class C |
| Shares |
| Amount |
| Shares |
| Amount |
| ||||
Net proceeds from sales of shares |
|
| 304,932 |
| $ | 1,037,817 |
|
| 649,658 |
| $ | 2,157,609 |
|
Investment of dividends |
|
| 250,119 |
|
| 838,384 |
|
| 320,982 |
|
| 1,065,596 |
|
Exchanged from associated funds |
|
| 98,412 |
|
| 329,611 |
|
| 193,389 |
|
| 637,996 |
|
Total |
|
| 653,463 |
|
| 2,205,812 |
|
| 1,164,029 |
|
| 3,861,201 |
|
Cost of shares repurchased |
|
| (2,777,948 | ) |
| (9,409,915 | ) |
| (3,157,046 | ) |
| (10,519,029 | ) |
Exchanged into associated funds |
|
| (147,236 | ) |
| (492,795 | ) |
| (313,103 | ) |
| (1,040,730 | ) |
Total |
|
| (2,925,184 | ) |
| (9,902,710 | ) |
| (3,470,149 | ) |
| (11,559,759 | ) |
Decrease |
|
| (2,271,721 | ) | $ | (7,696,898 | ) |
| (2,306,120 | ) | $ | (7,698,558 | ) |
Class D |
| Shares |
| Amount |
| Shares |
| Amount |
| ||||
Net proceeds from sales of shares |
|
| 1,116,139 |
| $ | 3,760,170 |
|
| 1,166,374 |
| $ | 3,874,379 |
|
Investment of dividends |
|
| 696,691 |
|
| 2,330,079 |
|
| 781,158 |
|
| 2,593,432 |
|
Exchanged from associated funds |
|
| 330,693 |
|
| 1,117,653 |
|
| 726,552 |
|
| 2,398,442 |
|
Total |
|
| 2,143,523 |
|
| 7,207,902 |
|
| 2,674,084 |
|
| 8,866,253 |
|
Cost of shares repurchased |
|
| (4,882,575 | ) |
| (16,394,820 | ) |
| (6,294,756 | ) |
| (20,937,851 | ) |
Exchanged into associated funds |
|
| (435,188 | ) |
| (1,463,413 | ) |
| (432,391 | ) |
| (1,434,587 | ) |
Total |
|
| (5,317,763 | ) |
| (17,858,233 | ) |
| (6,727,147 | ) |
| (22,372,438 | ) |
Decrease |
|
| (3,174,240 | ) | $ | (10,650,331 | ) |
| (4,053,063 | ) | $ | (13,506,185 | ) |
Class I |
| Shares |
| Amount |
| Shares |
| Amount |
| ||||
Net proceeds from sales of shares |
|
| 532,585 |
| $ | 1,785,760 |
|
| 485,525 |
| $ | 1,611,054 |
|
Investment of dividends |
|
| 176,969 |
|
| 588,755 |
|
| 170,905 |
|
| 565,105 |
|
Total |
|
| 709,554 |
|
| 2,374,515 |
|
| 656,430 |
|
| 2,176,159 |
|
Cost of shares repurchased |
|
| (240,107 | ) |
| (806,581 | ) |
| (827,485 | ) |
| (2,758,631 | ) |
Increase (decrease) |
|
| 469,447 |
| $ | 1,567,934 |
|
| (171,055 | ) | $ | (582,472 | ) |
Class R |
| Shares |
| Amount |
| Shares |
| Amount |
| ||||
Net proceeds from sales of shares |
|
| 823,413 |
| $ | 2,730,739 |
|
| 262,814 |
| $ | 871,755 |
|
Investment of dividends |
|
| 52,006 |
|
| 172,081 |
|
| 21,468 |
|
| 71,102 |
|
Exchanged from associated funds |
|
| 1,037 |
|
| 3,513 |
|
| 534 |
|
| 1,784 |
|
Total |
|
| 876,456 |
|
| 2,906,333 |
|
| 284,816 |
|
| 944,641 |
|
Cost of shares repurchased |
|
| (93,796 | ) |
| (311,376 | ) |
| (59,083 | ) |
| (194,627 | ) |
Exchanged into associated funds |
|
| (34 | ) |
| (116 | ) |
| (571 | ) |
| (1,880 | ) |
Total |
|
| (93,830 | ) |
| (311,492 | ) |
| (59,654 | ) |
| (196,507 | ) |
Increase |
|
| 782,626 |
| $ | 2,594,841 |
|
| 225,162 |
| $ | 748,134 |
|
|
|
|
| ||
| * | Automatic conversion of Class B shares to Class A shares approximately eight years after the initial purchase date. The amount of dividends accrued on Class B shares between the last dividend payment date and the conversion date is invested in Class A shares and is included in the conversion from Class B amount. |
|
|
8. | Other Matters— In late 2003, the Manager conducted an extensive internal review concerning mutual fund trading practices. The Manager’s review, which covered the period 2001-2003, noted one arrangement that permitted frequent trading in certain open-end registered investment companies managed by the Manager (the “Seligman Funds”); this arrangement was in the process of being closed down by the Manager before September 2003. The Manager identified three other arrangements that permitted frequent trading, all of which had been terminated by September 2002. In January 2004, the Manager, on a voluntary basis, publicly disclosed these four arrangements to its clients and to shareholders of the Seligman Funds. The Manager also provided information concerning mutual fund trading practices to the Securities and Exchange Commission (the “SEC”) and the Office of the Attorney General of the State of New York (“NYAG”). |
28
Notes to Financial Statements
|
|
| In September 2005, the New York staff of the SEC indicated that it was considering recommending to the Commissioners of the SEC the instituting of a formal action against the Manager and the Distributor relating to frequent trading in the Seligman Funds. The Manager responded to the staff in October 2005 that it believed that any action would be both inappropriate and unnecessary, especially in light of the fact that the Manager had previously resolved the underlying issue with the Independent Directors of the Seligman Funds and made recompense to the affected Seligman Funds. |
|
|
| In September 2006, the NYAG commenced a civil action in New York State Supreme Court against the Manager, the Distributor, Seligman Data Corp. and Brian T. Zino (collectively, the “Seligman Parties”), alleging, in substance, that, in addition to the four arrangements noted above, the Seligman Parties permitted other persons to engage in frequent trading and, as a result, the prospectus disclosure used by the registered investment companies managed by the Manager is and has been misleading. The NYAG included other related claims and also claimed that the fees charged by the Manager to the Seligman Funds were excessive. The NYAG is seeking damages of at least $80 million and restitution, disgorgement, penalties and costs and injunctive relief. The Seligman Parties answered the complaint in December 2006 and believe that the claims are without merit. |
|
|
| Any resolution of these matters may include the relief noted above or other sanctions or changes in procedures. Any damages would be paid by the Manager and not by the Seligman Funds. If the NYAG obtains injunctive relief, the Manager and its affiliates could, in the absence of the SEC in its discretion granting exemptive relief, be enjoined from providing advisory and underwriting services to the Seligman Funds and other registered investment companies. |
|
|
| The Manager does not believe that the foregoing legal action or other possible actions will have a material adverse impact on the Manager or its clients, including the Seligman Funds and other investment companies managed by it; however, there can be no assurance of this or that these matters and any related publicity will not affect demand for shares of the Seligman Funds and such other investment companies or have other adverse consequences. |
|
|
9. | Recently Issued Accounting Pronouncement — In September 2006, the FASB issued Statement of Financial Accounting Standards No. 157 (“SFAS No. 157”), “Fair Value Measurements.” SFAS No. 157 defines fair value, establishes a framework for measuring fair value of assets and liabilities and expands disclosure about fair value measurements. SFAS No. 157 is effective for fiscal years beginning after November 15, 2007. The Fund is currently evaluating the impact of the adoption of SFAS No. 157 but believes the impact will be limited to expanded disclosures in the Fund’s financial statements. |
29
The tables below are intended to help you understand each Class’s financial performance for the periods presented. Certain information reflects financial results for a single share of Beneficial Interest of a Class that was held throughout the periods shown. Per share amounts are calculated using average shares outstanding during the period. Total return shows the rate that you would have earned (or lost) on an investment in each Class, assuming you reinvested all your dividends and capital gain distributions, if any. Total returns do not reflect any taxes or sales charges and are not annualized for periods of less than one year.
|
|
|
|
|
|
|
|
|
|
|
|
|
|
|
|
|
|
| Year Ended December 31, |
| |||||||||||||
|
| |||||||||||||||
Class A |
| 2007 |
| 2006 |
| 2005 |
| 2004 |
| 2003 |
| |||||
Per Share Data: |
|
|
|
|
|
|
|
|
|
|
|
|
|
|
|
|
Net Asset Value, Beginning of Year |
| $ | 3.39 |
| $ | 3.31 |
| $ | 3.51 |
| $ | 3.55 |
| $ | 3.16 |
|
Income (Loss) from Investment Operations: |
|
|
|
|
|
|
|
|
|
|
|
|
|
|
|
|
Net investment income |
|
| 0.25 |
|
| 0.21 |
|
| 0.24 |
|
| 0.27 |
|
| 0.26 |
|
Net realized and unrealized gain (loss) on investments |
|
| (0.22 | ) |
| 0.10 |
|
| (0.19 | ) |
| (0.04 | ) |
| 0.40 |
|
Total from Investment Operations |
|
| 0.03 |
|
| 0.31 |
|
| 0.05 |
|
| 0.23 |
|
| 0.66 |
|
Less Distributions: |
|
|
|
|
|
|
|
|
|
|
|
|
|
|
|
|
Dividends from net investment income |
|
| (0.25 | ) |
| (0.21 | ) |
| (0.24 | ) |
| (0.27 | ) |
| (0.26 | ) |
Dividends in excess of net investment income |
|
| — |
|
| (0.02 | ) |
| (0.01 | ) |
| — | ø |
| (0.01 | ) |
Total Distributions |
|
| (0.25 | ) |
| (0.23 | ) |
| (0.25 | ) |
| (0.27 | ) |
| (0.27 | ) |
Net Asset Value, End of Year |
| $ | 3.17 |
| $ | 3.39 |
| $ | 3.31 |
| $ | 3.51 |
| $ | 3.55 |
|
Total Return |
|
| 0.81 | % |
| 9.74 | % |
| 1.57 | % |
| 7.03 | % |
| 21.84 | % |
Ratios/Supplemental Data: |
|
|
|
|
|
|
|
|
|
|
|
|
|
|
|
|
Net assets, end of year (000s omitted) |
| $ | 159,566 |
| $ | 183,042 |
| $ | 186,311 |
| $ | 222,827 |
| $ | 248,869 |
|
Ratio of expenses to average net assets |
|
| 1.38 | % |
| 1.34 | % |
| 1.36 | % |
| 1.28 | % |
| 1.30 | % |
Ratio of net investment income to average net assets |
|
| 7.41 | % |
| 6.42 | % |
| 7.05 | % |
| 7.78 | % |
| 7.88 | % |
Portfolio turnover rate |
|
| 77.94 | % |
| 99.04 | % |
| 79.90 | % |
| 53.38 | % |
| 141.00 | % |
|
|
| |
See footnotes on page 33. |
30
Financial Highlights
|
|
|
|
|
|
|
|
|
|
|
|
|
|
|
|
|
|
| Year Ended December 31, |
| |||||||||||||
|
| |||||||||||||||
Class B |
| 2007 |
| 2006 |
| 2005 |
| 2004 |
| 2003 |
| |||||
Per Share Data: |
|
|
|
|
|
|
|
|
|
|
|
|
|
|
|
|
Net Asset Value, Beginning of Year |
| $ | 3.39 |
| $ | 3.32 |
| $ | 3.52 |
| $ | 3.55 |
| $ | 3.17 |
|
Income (Loss) from Investment Operations: |
|
|
|
|
|
|
|
|
|
|
|
|
|
|
|
|
Net investment income |
|
| 0.22 |
|
| 0.19 |
|
| 0.21 |
|
| 0.24 |
|
| 0.24 |
|
Net realized and unrealized gain (loss) on investments |
|
| (0.21 | ) |
| 0.09 |
|
| (0.18 | ) |
| (0.02 | ) |
| 0.39 |
|
Total from Investment Operations |
|
| 0.01 |
|
| 0.28 |
|
| 0.03 |
|
| 0.22 |
|
| 0.63 |
|
Less Distributions: |
|
|
|
|
|
|
|
|
|
|
|
|
|
|
|
|
Dividends from net investment income |
|
| (0.22 | ) |
| (0.19 | ) |
| (0.21 | ) |
| (0.24 | ) |
| (0.24 | ) |
Dividends in excess of net investment income |
|
| (0.01 | ) |
| (0.02 | ) |
| (0.02 | ) |
| (0.01 | ) |
| (0.01 | ) |
Total Distributions |
|
| (0.23 | ) |
| (0.21 | ) |
| (0.23 | ) |
| (0.25 | ) |
| (0.25 | ) |
Net Asset Value, End of Year |
| $ | 3.17 |
| $ | 3.39 |
| $ | 3.32 |
| $ | 3.52 |
| $ | 3.55 |
|
Total Return |
|
| 0.07 | % |
| 8.62 | % |
| 0.84 | % |
| 6.53 | % |
| 20.64 | % |
Ratios/Supplemental Data: |
|
|
|
|
|
|
|
|
|
|
|
|
|
|
|
|
Net assets, end of year (000s omitted) |
| $ | 22,760 |
| $ | 56,664 |
| $ | 122,052 |
| $ | 228,229 |
| $ | 319,267 |
|
Ratio of expenses to average net assets |
|
| 2.13 | % |
| 2.09 | % |
| 2.11 | % |
| 2.03 | % |
| 2.05 | % |
Ratio of net investment income to average net assets |
|
| 6.66 | % |
| 5.67 | % |
| 6.30 | % |
| 7.03 | % |
| 7.13 | % |
Portfolio turnover rate |
|
| 77.94 | % |
| 99.04 | % |
| 79.90 | % |
| 53.38 | % |
| 141.00 | % |
| ||||||||||||||||
Class C |
|
|
|
|
|
|
|
|
|
|
|
|
|
|
|
|
Per Share Data: |
|
|
|
|
|
|
|
|
|
|
|
|
|
|
|
|
Net Asset Value, Beginning of Year |
| $ | 3.40 |
| $ | 3.33 |
| $ | 3.52 |
| $ | 3.56 |
| $ | 3.17 |
|
Income (Loss) from Investment Operations: |
|
|
|
|
|
|
|
|
|
|
|
|
|
|
|
|
Net investment income |
|
| 0.22 |
|
| 0.19 |
|
| 0.21 |
|
| 0.24 |
|
| 0.24 |
|
Net realized and unrealized gain (loss) on investments |
|
| (0.21 | ) |
| 0.09 |
|
| (0.17 | ) |
| (0.03 | ) |
| 0.40 |
|
Total from Investment Operations |
|
| 0.01 |
|
| 0.28 |
|
| 0.04 |
|
| 0.21 |
|
| 0.64 |
|
Less Distributions: |
|
|
|
|
|
|
|
|
|
|
|
|
|
|
|
|
Dividends from net investment income |
|
| (0.22 | ) |
| (0.19 | ) |
| (0.21 | ) |
| (0.24 | ) |
| (0.24 | ) |
Dividends in excess of net investment income |
|
| (0.01 | ) |
| (0.02 | ) |
| (0.02 | ) |
| (0.01 | ) |
| (0.01 | ) |
Total Distributions |
|
| (0.23 | ) |
| (0.21 | ) |
| (0.23 | ) |
| (0.25 | ) |
| (0.25 | ) |
Net Asset Value, End of Year |
| $ | 3.18 |
| $ | 3.40 |
| $ | 3.33 |
| $ | 3.52 |
| $ | 3.56 |
|
Total Return |
|
| 0.07 | % |
| 8.60 | % |
| 1.13 | % |
| 6.22 | % |
| 20.98 | % |
Ratios/Supplemental Data: |
|
|
|
|
|
|
|
|
|
|
|
|
|
|
|
|
Net assets, end of year (000s omitted) |
| $ | 17,788 |
| $ | 26,742 |
| $ | 33,833 |
| $ | 48,012 |
| $ | 59,892 |
|
Ratio of expenses to average net assets |
|
| 2.13 | % |
| 2.09 | % |
| 2.11 | % |
| 2.03 | % |
| 2.05 | % |
Ratio of net investment income to average net assets |
|
| 6.66 | % |
| 5.67 | % |
| 6.30 | % |
| 7.03 | % |
| 7.13 | % |
Portfolio turnover rate |
|
| 77.94 | % |
| 99.04 | % |
| 79.90 | % |
| 53.38 | % |
| 141.00 | % |
|
|
| |
See footnotes on page 33. |
31
Financial Highlights
|
|
|
|
|
|
|
|
|
|
|
|
|
|
|
|
|
|
| Year Ended December 31, | ||||||||||||||
|
| |||||||||||||||
Class D |
| 2007 |
| 2006 |
| 2005 |
| 2004 |
| 2003 |
| |||||
Per Share Data: |
|
|
|
|
|
|
|
|
|
|
|
|
|
|
|
|
Net Asset Value, Beginning of Year |
| $ | 3.40 |
| $ | 3.33 |
| $ | 3.52 |
| $ | 3.56 |
| $ | 3.17 |
|
Income (Loss) from Investment Operations: |
|
|
|
|
|
|
|
|
|
|
|
|
|
|
|
|
Net investment income |
|
| 0.22 |
|
| 0.19 |
|
| 0.21 |
|
| 0.24 |
|
| 0.24 |
|
Net realized and unrealized gain (loss) on investments |
|
| (0.21 | ) |
| 0.09 |
|
| (0.17 | ) |
| (0.03 | ) |
| 0.40 |
|
Total from Investment Operations |
|
| 0.01 |
|
| 0.28 |
|
| 0.04 |
|
| 0.21 |
|
| 0.64 |
|
Less Distributions: |
|
|
|
|
|
|
|
|
|
|
|
|
|
|
|
|
Dividends from net investment income |
|
| (0.22 | ) |
| (0.19 | ) |
| (0.21 | ) |
| (0.24 | ) |
| (0.24 | ) |
Dividends in excess of net investment income |
|
| (0.01 | ) |
| (0.02 | ) |
| (0.02 | ) |
| (0.01 | ) |
| (0.01 | ) |
Total Distributions |
|
| (0.23 | ) |
| (0.21 | ) |
| (0.23 | ) |
| (0.25 | ) |
| (0.25 | ) |
Net Asset Value, End of Year |
| $ | 3.18 |
| $ | 3.40 |
| $ | 3.33 |
| $ | 3.52 |
| $ | 3.56 |
|
|
|
|
|
|
|
|
|
|
|
|
|
|
|
|
|
|
Total Return |
|
| 0.07 | % |
| 8.60 | % |
| 1.13 | % |
| 6.22 | % |
| 20.98 | % |
|
|
|
|
|
|
|
|
|
|
|
|
|
|
|
|
|
Ratios/Supplemental Data: |
|
|
|
|
|
|
|
|
|
|
|
|
|
|
|
|
Net assets, end of year (000s omitted) |
| $ | 44,860 |
| $ | 58,752 |
| $ | 70,959 |
| $ | 100,125 |
| $ | 128,582 |
|
Ratio of expenses to average net assets |
|
| 2.13 | % |
| 2.10 | % |
| 2.11 | % |
| 2.03 | % |
| 2.05 | % |
Ratio of net investment income to average net assets |
|
| 6.66 | % |
| 5.67 | % |
| 6.30 | % |
| 7.03 | % |
| 7.13 | % |
Portfolio turnover rate |
|
| 77.94 | % |
| 99.04 | % |
| 79.90 | % |
| 53.38 | % |
| 141.00 | % |
|
|
|
|
|
|
|
|
|
|
|
|
|
|
|
|
|
Class I |
|
|
|
|
|
|
|
|
|
|
|
|
|
|
|
|
Per Share Data: |
|
|
|
|
|
|
|
|
|
|
|
|
|
|
|
|
Net Asset Value, Beginning of Year |
| $ | 3.39 |
| $ | 3.31 |
| $ | 3.51 |
| $ | 3.55 |
| $ | 3.16 |
|
Income (Loss) from Investment Operations: |
|
|
|
|
|
|
|
|
|
|
|
|
|
|
|
|
Net investment income |
|
| 0.26 |
|
| 0.23 |
|
| 0.25 |
|
| 0.29 |
|
| 0.28 |
|
Net realized and unrealized gain (loss) on investments |
|
| (0.22 | ) |
| 0.10 |
|
| (0.18 | ) |
| (0.04 | ) |
| 0.40 |
|
Total from Investment Operations |
|
| 0.04 |
|
| 0.33 |
|
| 0.07 |
|
| 0.25 |
|
| 0.68 |
|
Less Distributions: |
|
|
|
|
|
|
|
|
|
|
|
|
|
|
|
|
Dividends from net investment income |
|
| (0.26 | ) |
| (0.23 | ) |
| (0.25 | ) |
| (0.29 | ) |
| (0.28 | ) |
Dividends in excess of net investment income |
|
| — |
|
| (0.02 | ) |
| (0.02 | ) |
| — | ø |
| (0.01 | ) |
Total Distributions |
|
| (0.26 | ) |
| (0.25 | ) |
| (0.27 | ) |
| (0.29 | ) |
| (0.29 | ) |
Net Asset Value, End of Year |
| $ | 3.17 |
| $ | 3.39 |
| $ | 3.31 |
| $ | 3.51 |
| $ | 3.55 |
|
|
|
|
|
|
|
|
|
|
|
|
| �� |
|
|
|
|
Total Return |
|
| 1.18 | % |
| 10.23 | % |
| 2.01 | % |
| 7.46 | % |
| 22.38 | % |
|
|
|
|
|
|
|
|
|
|
|
|
|
|
|
|
|
Ratios/Supplemental Data: |
|
|
|
|
|
|
|
|
|
|
|
|
|
|
|
|
Net assets, end of year (000s omitted) |
| $ | 7,924 |
| $ | 6,879 |
| $ | 7,299 |
| $ | 6,500 |
| $ | 5,472 |
|
Ratio of expenses to average net assets |
|
| 0.88 | % |
| 0.85 | % |
| 0.91 | % |
| 0.85 | % |
| 0.95 | % |
Ratio of net investment income to average net assets |
|
| 7.91 | % |
| 6.92 | % |
| 7.50 | % |
| 8.21 | % |
| 8.23 | % |
Portfolio turnover rate |
|
| 77.94 | % |
| 99.04 | % |
| 79.90 | % |
| 53.38 | % |
| 141.00 | % |
32
Financial Highlights
|
|
|
|
|
|
|
|
|
|
|
|
|
|
|
|
|
|
| Year Ended December 31, |
| 4/30/03* |
| |||||||||||
|
|
|
| |||||||||||||
Class R |
| 2007 |
| 2006 |
| 2005 |
| 2004 |
|
| ||||||
Per Share Data: |
|
|
|
|
|
|
|
|
|
|
|
|
|
|
|
|
Net Asset Value, Beginning of Year |
| $ | 3.39 |
| $ | 3.31 |
| $ | 3.51 |
| $ | 3.55 |
| $ | 3.37 |
|
Income (Loss) from Investment Operations: |
|
|
|
|
|
|
|
|
|
|
|
|
|
|
|
|
Net investment income |
|
| 0.24 |
|
| 0.20 |
|
| 0.23 |
|
| 0.25 |
|
| 0.17 |
|
Net realized and unrealized gain (loss) on investments |
|
| (0.22 | ) |
| 0.10 |
|
| (0.19 | ) |
| (0.02 | ) |
| 0.19 |
|
Total from Investment Operations |
|
| 0.02 |
|
| 0.30 |
|
| 0.04 |
|
| 0.23 |
|
| 0.36 |
|
Less Distributions: |
|
|
|
|
|
|
|
|
|
|
|
|
|
|
|
|
Dividends from net investment income |
|
| (0.24 | ) |
| (0.20 | ) |
| (0.23 | ) |
| (0.25 | ) |
| (0.17 | ) |
Dividends in excess of net investment income |
|
| — |
|
| (0.02 | ) |
| (0.01 | ) |
| (0.02 | ) |
| (0.01 | ) |
Total Distributions |
|
| (0.24 | ) |
| (0.22 | ) |
| (0.24 | ) |
| (0.27 | ) |
| (0.18 | ) |
Net Asset Value, End of Year |
| $ | 3.17 |
| $ | 3.39 |
| $ | 3.31 |
| $ | 3.51 |
| $ | 3.55 |
|
|
|
|
|
|
|
|
|
|
|
|
|
|
|
|
|
|
Total Return |
|
| 0.56 | % |
| 9.48 | % |
| 1.32 | % |
| 6.76 | % |
| 10.99 | % |
|
|
|
|
|
|
|
|
|
|
|
|
|
|
|
|
|
Ratios/Supplemental Data: |
|
|
|
|
|
|
|
|
|
|
|
|
|
|
|
|
Net assets, end of year (000s omitted) |
| $ | 3,856 |
| $ | 1,468 |
| $ | 689 |
| $ | 720 |
| $ | 2 |
|
Ratio of expenses to average net assets |
|
| 1.62 | % |
| 1.59 | % |
| 1.61 | % |
| 1.53 | % |
| 1.56 | %† |
Ratio of net investment income to average net assets |
|
| 7.17 | % |
| 6.17 | % |
| 6.80 | % |
| 7.53 | % |
| 7.64 | %† |
Portfolio turnover rate |
|
| 77.94 | % |
| 99.04 | % |
| 79.90 | % |
| 53.38 | % |
| 141.00 | %‡ |
|
|
† | Annualized. |
* | Commencement of offering of shares. |
‡ | Computed at the Fund level for the year ended December 31, 2003. |
ø | Less than + or – $0.01. |
| |
See Notes to Financial Statements. |
33
Report of Independent Registered
Public Accounting Firm
The Trustees and Shareholders,
Seligman High-Yield Fund of
Seligman High Income Fund Series:
We have audited the accompanying statement of assets and liabilities, including the portfolio of investments, of Seligman High-Yield Fund, one of the funds constituting Seligman High Income Fund Series (the “Fund”) as of December 31, 2007, and the related statement of operations for the year then ended, the statements of changes in net assets for each of the two years in the period then ended, and the financial highlights for each of the periods presented. These financial statements and financial highlights are the responsibility of the Fund’s management. Our responsibility is to express an opinion on these financial statements and financial highlights based on our audits.
We conducted our audits in accordance with the standards of the Public Company Accounting Oversight Board (United States). Those standards require that we plan and perform the audit to obtain reasonable assurance about whether the financial statements and financial highlights are free of material misstatement. The Fund is not required to have, nor were we engaged to perform, an audit of its internal control over financial reporting. Our audits included consideration of internal control over financial reporting as a basis for designing audit procedures that are appropriate in the circumstances, but not for the purpose of expressing an opinion on the effectiveness of the Fund’s internal control over financial reporting. Accordingly, we express no such opinion. An audit also includes examining, on a test basis, evidence supporting the amounts and disclosures in the financial statements, assessing the accounting principles used and significant estimates made by management, as well as evaluating the overall financial statement presentation. Our procedures included confirmation of securities owned as of December 31, 2007, by correspondence with the custodian and brokers; where replies were not received from brokers, we performed other auditing procedures. We believe that our audits provide a reasonable basis for our opinion.
In our opinion, the financial statements and financial highlights referred to above present fairly, in all material respects, the financial position of Seligman High-Yield Fund of Seligman High Income Fund Series as of December 31, 2007, the results of its operations for the year then ended, the changes in its net assets for each of the two years in the period then ended, and the financial highlights for the respective stated periods, in conformity with accounting principles generally accepted in the United States of America.
DELOITTE & TOUCHE LLP
New York, New York
February 27, 2008
34
Matters Relating to the Trustees’
Consideration of the Continuance of the
Management Agreement
The trustees of Seligman High Income Fund Series, of which Seligman High-Yield Fund is a separate series, unanimously approved the continuance of the Management Agreement with the Manager in respect of the Fund at a meeting held on November 15, 2007.
Prior to approval of the continuance of the Management Agreement, the trustees requested and evaluated extensive materials from the Manager. They reviewed the proposed continuance of the Management Agreement with the Manager and with experienced counsel who advised on the legal standards for their consideration. The independent trustees also discussed the proposed continuance in a private session with counsel.
The trustees considered their knowledge of the nature and quality of the services provided by the Manager gained from their experience as directors or trustees of each fund in the Seligman Group of Funds, their overall confidence in the Manager’s integrity and competence gained from that experience, the Manager’s initiative in identifying and raising potential issues with the trustees and its responsiveness, frankness and attention to concerns raised by the trustees in the past, including the Manager’s willingness to consider and implement organizational and operational changes designed to improve investment results and the services provided to the Seligman Group of Funds. The trustees noted that the Board has six regular meetings each year, at each of which they receive presentations from the Manager on the investment results of the Fund and review extensive materials and information presented by the Manager.
The trustees also considered all other factors they believed relevant, including the specific matters discussed below. In their deliberations, the trustees did not identify any particular information that was all-important or controlling, and trustees attributed different weights to the various factors. The trustees determined that the selection of the Manager to manage the Fund, and the overall arrangements between the Fund and the Manager as provided in the Management Agreement, including the management fee, were fair and reasonable in light of the services performed, expenses incurred and such other matters as the trustees considered relevant. The material factors and conclusions that formed the basis for the trustees’ determination included the following:
Nature, Extent and Quality of Services Provided
The trustees considered the scope and quality of services provided by the Manager under the Management Agreement. The trustees considered the quality of the investment research capabilities of the Manager and the other resources it has dedicated to performing services for the Fund. They also noted the professional experience and qualifications of the Fund’s portfolio management team and other senior personnel of the Manager. The trustees also considered the Manager’s selection of brokers and dealers for portfolio transactions and noted that they receive regular reports from the Manager concerning such selection. The quality of administrative and other services, including the Manager’s role in coordinating the activities of the Fund’s other service providers, also was considered. The trustees concluded that, overall, they were satisfied with the nature, extent and quality of services provided to the Fund under the Management Agreement.
On an ongoing basis, the Manager reports to the trustees on the status of various matters described in the Fund’s prospectuses relating to market timing activity, allegations of excessive fees and related matters for certain funds in the Seligman Group of Funds. In connection with the continuance review, the Manager provided an update on those matters. After discussion with the Manager, the Manager’s counsel, the trustees’ special counsel and other counsel independent of the Manager, and consideration of the potential consequences of the various matters, the independent trustees concluded that they retained confidence in the integrity of the Manager and its ability to provide management services to the Fund.
Costs of Services Provided and Profitability
The trustees reviewed information on profitability of the Manager’s investment advisory and investment company activities and its financial condition based on historical information and estimates for the current year, as well as historical and estimated profitability data for the Fund. The trustees reviewed with the Manager’s Chief Financial Officer, the assumptions and methods of allocation used by the Manager in
35
Matters Relating to the Trustees’
Consideration of the Continuance of the
Management Agreement
preparing the profitability data. The trustees recognized that it is difficult to make comparisons of profitability from fund management contracts because comparative information is not generally publicly available and is affected by numerous factors. In reviewing profitability information, the trustees considered the effect of fall-out benefits on the Manager’s expenses, as well as the “revenue sharing” arrangements the Manager has entered into with certain entities that distribute shares of the Seligman Group of Funds. The trustees focused on profitability of the Manager’s relationship with the Fund before taxes and distribution expenses. The trustees concluded that they were satisfied that the Manager’s level of profitability from its relationship with the Fund was not excessive.
Fall-Out Benefits
The trustees considered that the Manager benefits from soft dollar arrangements whereby it receives brokerage and research services from brokers that execute the Seligman Group of Funds’ purchases and sales of securities on an agency basis. They reviewed information about the Manager’s practices with respect to allocating portfolio brokerage for brokerage and research services. The trustees also considered that a broker-dealer affiliate of the Manager receives 12b-1 fees from the Fund in respect of shares held in certain accounts, and that the Fund’s distributor (another affiliate of the Manager) retains a portion of the 12b-1 fees from the Fund and receives a portion of the sales charges on sales or redemptions of certain classes of shares. The trustees further recognized that the Manager’s profitability would be somewhat lower without these benefits. The trustees noted that the Manager may derive reputational and other benefits from its association with the Fund.
Investment Results
The trustees receive and review detailed performance information on the Fund at each regular Board meeting during the year in addition to the information received for the meeting regarding the continuance of the Management Agreement. The trustees reviewed performance information for the Fund for the first nine months of 2007, the preceding seven calendar years and annualized one-, three- and five-year rolling periods ending September 30, 2007. The trustees also reviewed information about the portfolio turnover rates of the Fund compared to other investment companies with similar investment objectives.
The trustees reviewed information comparing the Fund to the Lehman Brothers U.S. Corporate High-Yield 2% Issuer Capped Index and the Lipper High Current Yield Funds Average, as well as performance relative to the other funds in the Lipper High Current Yield Funds Average and to a group of competitor funds selected by the Manager. The Manager noted that a new portfolio manager had been hired in 2006. The Manager reminded the board that the Fund had also implemented new investment strategies and objective in the second half of 2005. The trustees noted that the Fund’s performance ranked above the Lipper median in the most recent period and that the Fund’s results had generally shown relative improvement in recent periods, exceeding the Lipper benchmark in the first nine months of 2007, while slightly trailing its other benchmarks in that period, although the Fund’s results were otherwise below the benchmarks in the periods presented. Taking these and other factors into consideration, the trustees retained confidence in the Manager’s capabilities to manage the Fund.
Management Fees and Other Expenses
The trustees considered the management fee rate paid by the Fund to the Manager. The trustees recognized that it is difficult to make comparisons of management fees because there are variations in the services that are included in the fees paid by other funds. The Manager noted that an unregistered investment company, with investment objectives similar to those of the Fund, whose shares are sold primarily outside the United States, is a client of the Manager. The fee rate charged to that company is higher than that charged to the Fund.
The trustees also compared the Fund’s management fee rate to the rate paid by a subset of funds in the Lipper High Current Yield Funds Average category having net assets in a range that more closely corresponds to the
36
Matters Relating to the Trustees’
Consideration of the Continuance of the
Management Agreement
net assets of the Fund (the “peer group”). The information showed that the Fund’s current effective management fee rate was somewhat higher than the average and the median for the funds in the peer group.
The trustees also considered the total expense ratio of the Fund in comparison to the fees and expenses of funds within its peer group. In considering the expense ratio of the Fund, the trustees noted that it has elected to have shareholder services provided at cost by Seligman Data Corp. (“SDC”), a company owned by certain of the investment companies in the Seligman Group of Funds that provides shareholder services to the Fund and other investment companies in the Seligman Group of Funds at cost. SDC provides services exclusively to the Seligman Group of Funds, and the trustees believed that the arrangement with SDC has provided the Fund and its shareholders with a consistently high level of service.
The trustees also noted that the Fund’s expense ratio was nearly the highest in its peer group and considerably higher than the median and the average for the peer group. The Manager explained that the Fund’s relatively high expenses were attributable in part to the Fund’s small size relative to the funds in its peer group and high shareholder purchase and redemption activity levels, all of which adversely affected its expense ratio. The trustees concluded that the Fund’s expense ratio was acceptable in the Fund’s particular circumstances.
Economies of Scale
The trustees noted that Fund’s management fee schedules contain breakpoints that reduce the fee rate on assets above specified levels, although, at the Fund’s current asset levels, it was unlikely to benefit from them in the next year. The trustees recognized that there is no direct relationship between the economies of scale realized by funds and those realized by their investment adviser as assets increase. The trustees do not believe that there is a uniform methodology for establishing breakpoints that give effect to fund specific services provided by the Manager. The trustees also observed that in the investment company industry as a whole, as well as among funds similar to the Fund, there is no uniformity or pattern in the fees and asset levels at which breakpoints (if any) apply, and that the advisory agreements for many competitor funds do not have breakpoints at all. Having taken these factors into account, the trustees concluded that the Fund’s breakpoint arrangements were acceptable under the Fund’s circumstances.
37
Trustees and Officers
Information pertaining to the Trustees and Officers of Seligman High-Yield Fund is set forth below.
Independent Trustees
|
|
|
Name, (Age), Position(s) |
| Principal Occupation(s) During Past Five Years, Directorships and Other Information |
Maureen Fonseca (52)3 |
| Head of School, The Masters School (educational training); Director or Trustee of each of the investment companies of the Seligman Group of Funds† (with the exception of Seligman Technologies Fund, Inc. and Seligman New Technologies Fund II, Inc.); Trustee, New York State Association of Independent Schools and Greens Farms Academy (educational training); and Commissioner, Middle States Association (educational training). |
John R. Galvin (78)1,3 |
| Dean Emeritus, Fletcher School of Law and Diplomacy at Tufts University; Director or Trustee of each of the investment companies of the Seligman Group of Funds†; and Chairman Emeritus, American Council on Germany. Formerly, Director, Raytheon Co. (defense and commercial electronics), Governor of the Center for Creative Leadership, and Trustee, Institute for Defense Analyses. From February 1995 until June 1997, Director, USLIFE Corporation (life insurance). From June 1987 to June 1992, Supreme Allied Commander, NATO, and Commander-in-Chief, United States European Command. |
John F. Maher (64)1,3 |
| Retired President and Chief Executive Officer, and former Director, Great Western Financial Corporation (bank holding company) and its principal subsidiary, Great Western Bank (a federal savings bank); and Director or Trustee of each of the investment companies of the Seligman Group of Funds† (with the exception of Seligman Technologies Fund, Inc. and Seligman New Technologies Fund II, Inc.). From 1989 to 1999, Director, Baker Hughes (energy products and services). |
Frank A. McPherson (74)2,3 |
| Retired Chairman of the Board and Chief Executive Officer of Kerr-McGee Corporation (diversified energy and chemical company); Director or Trustee of each of the investment companies of the Seligman Group of Funds†; and Director, DCP Midstream GP, LLP (natural gas processing and transporting), Integris Health (owner of various hospitals), Oklahoma Medical Research Foundation, Oklahoma Foundation for Excellence in Education, National Cowboy and Western Heritage Museum, and Oklahoma City Museum of Art. Formerly, Director, ConocoPhillips (integrated international oil corporation), Kimberly-Clark Corporation (consumer products), Oklahoma Chapter of the Nature Conservancy, Boys and Girls Clubs of Oklahoma, Oklahoma City Public Schools Foundation, Oklahoma City Chamber of Commerce and BOK Financial (bank holding company). From 1990 until 1994, Director, the Federal Reserve System’s Kansas City Reserve Bank. |
38
Trustees and Officers
Independent Trustees (continued)
|
|
|
Name, (Age), Position(s) |
| Principal Occupation(s) During Past Five Years, Directorships and Other Information |
Betsy S. Michel (65)2,3 |
| Attorney; Director or Trustee of each of the investment companies of the Seligman Group of Funds†; and Trustee, The Geraldine R. Dodge Foundation (charitable foundation), and Drew University (Madison, NJ). Formerly, Chairman of the Board of Trustees of St. George’s School (Newport, RI); and Trustee, World Learning, Inc. (international educational training), and Council of New Jersey Grantmakers. |
Leroy C. Richie (66)1,3 |
| Counsel, Lewis & Munday, P.C. (law firm); Director or Trustee of each of the investment companies of the Seligman Group of Funds†; Director, Vibration Control Technologies, LLC (auto vibration technology) and OGE Energy Corp.; Lead Outside Director, Digital Ally Inc. (digital imaging) and Infinity, Inc. (oil and gas exploration and production); Director and Chairman, Highland Park Michigan Economic Development Corp.; and Chairman, Detroit Public Schools Foundation. Formerly, Chairman and Chief Executive Officer, Q Standards Worldwide, Inc. (library of technical standards); Director, Kerr-McGee Corporation (diversified energy and chemical company); Trustee, New York University Law Center Foundation; and Vice Chairman, Detroit Medical Center and Detroit Economic Growth Corp. From 1990 until 1997, Vice President and General Counsel, Automotive Legal Affairs, Chrysler Corporation. |
Robert L. Shafer (75)2,3 |
| Ambassador and Permanent Observer of the Sovereign Military Order of Malta to the United Nations; and Director or Trustee of each of the investment companies of the Seligman Group of Funds†. From May 1987 until June 1997, Director, USLIFE Corporation (life insurance) and from December 1973 until January 1996, Vice President, Pfizer Inc. (pharmaceuticals). |
James N. Whitson (72)1,3 |
| Retired Executive Vice President and Chief Operating Officer, Sammons Enterprises, Inc. (a diversified holding company); Director or Trustee of each of the investment companies of the Seligman Group of Funds†; and Director, CommScope, Inc. (manufacturer of coaxial cable). Formerly, Director and Consultant, Sammons Enterprises, Inc. and Director, C-SPAN (cable television networks). |
39
Trustees and Officers
Interested Trustees and Principal Officers
|
|
|
Name, (Age), Position(s) |
| Principal Occupation(s) During Past Five Years, Directorships and Other Information |
William C. Morris (69)* |
| Chairman and Director, J. & W. Seligman & Co. Incorporated; Chairman of the Board and Director or Trustee of each of the investment companies of the Seligman Group of Funds†; Chairman and Director, Seligman Advisors, Inc., Seligman Services, Inc. and Carbo Ceramics Inc. (manufacturer of ceramic proppants for oil and gas industry); Director, Seligman Data Corp.; and President and Chief Executive Officer of The Metropolitan Opera Association. Formerly, Director, Kerr-McGee Corporation (diversified energy and chemical company) and Chief Executive Officer of each of the investment companies of the Seligman Group of Funds. |
Brian T. Zino (55)* |
| Director and President, J. & W. Seligman & Co. Incorporated; President, Chief Executive Officer, and Director or Trustee of each of the investment companies of the Seligman Group of Funds†; Director, Seligman Advisors, Inc. and Seligman Services, Inc.; Chairman, Seligman Data Corp.; and Member of the Board of Governors of the Investment Company Institute. Formerly, Director, ICI Mutual Insurance Company. |
Eleanor T.M. Hoagland (56) |
| Managing Director, J. & W. Seligman & Co. Incorporated; Vice President and Chief Compliance Officer of each of the investment companies of the Seligman Group of Funds†. |
Paul A. Langlois (39) |
| Managing Director, J. & W. Seligman & Co. Incorporated. Formerly, Analyst, Triton Partners. |
J. Eric Misenheimer (45) |
| Managing Director, J. & W. Seligman & Co. Incorporated; Co-Portfolio Manager of Seligman Income and Growth Fund, Inc. Formerly, Senior Vice President, Director of Taxable High Yield Fixed Income Investing, Northern Trust Global Investments. |
Henry P. Rose (51) |
| Managing Director, J. & W. Seligman & Co. Incorporated. Formerly, Senior Credit Analyst, Northern Trust Global Investments. |
40
Trustees and Officers
Interested Trustees and Principal Officers (continued)
|
|
Name, (Age), Position(s) | Principal Occupation(s) During Past Five Years, Directorships and Other Information |
Thomas G. Rose (50) | Managing Director, Chief Financial Officer, and Treasurer, J. & W. Seligman & Co. Incorporated; Senior Vice President, Finance, Seligman Advisors, Inc. and Seligman Data Corp.; Vice President of each of the investment companies of the Seligman Group of Funds†, Seligman Services, Inc. and Seligman International, Inc. |
Lawrence P. Vogel (51) | Senior Vice President and Treasurer, Investment Companies, J. & W. Seligman & Co. Incorporated; Vice President and Treasurer of each of the investment companies of the Seligman Group of Funds† and Treasurer, Seligman Data Corp. |
Frank J. Nasta (43) | Director, Managing Director, General Counsel and Corporate Secretary, J. & W. Seligman & Co. Incorporated; Secretary of each of the investment companies of the Seligman Group of Funds†; Director and Corporate Secretary, Seligman Advisors, Inc. and Seligman Services, Inc.; and Corporate Secretary, Seligman International, Inc. and Seligman Data Corp. |
The Fund’s Statement of Additional Information (SAI) includes additional information about Fund trustees and is available, without charge, upon request. You may call toll-free (800) 221-2450 in the US or call collect (212) 682-7600 outside the US to request a copy of the SAI, to request other information about the Fund, or to make shareholder inquiries.
|
|
ø | The address for each of the trustees and officers is 100 Park Avenue, 8th Floor, New York, NY 10017. Each trustee serves for an indefinite term, until the election and qualification of a successor or until his or her earlier death, resignation, or removal. Each officer is elected annually by the Board of Trustees. |
† | The Seligman Group of Funds consists of 24 registered investment companies. |
* | Messrs. Morris and Zino are considered “interested persons” of the Fund, as defined in the Investment Company Act of 1940, as amended, by virtue of their positions with J. & W. Seligman & Co. Incorporated and its affiliates. |
|
|
Member: | 1 Audit Committee |
| 2 Trustee Nominating Committee |
| 3 Board Operations Committee |
41
Required Federal Income Tax Information
(unaudited)
Dividends paid for the year ended December 31, 2007, other than qualified dividend income, are subject to federal income tax as “ordinary income.” In order to claim the dividends received deduction for these distributions, corporate shareholders must have held their shares for 46 days or more during the 90-day period beginning 45 days before each ex-dividend date. Under the Internal Revenue Code, the dividends paid to corporate shareholders that qualify for the dividends received deduction were as follows:
|
|
|
|
|
| Dividends Received | |
Class A |
| 1.97 | % |
Class B |
| 2.23 |
|
Class C |
| 2.27 |
|
Class D |
| 2.19 |
|
Class I |
| 1.83 |
|
Class R |
| 1.86 |
|
For the year ended December 31, 2007, the Fund designates the following as qualified dividends to individual shareholders:
|
|
|
|
|
| Qualified Dividends | |
Class A |
| 1.92 | % |
Class B |
| 2.18 |
|
Class C |
| 2.21 |
|
Class D |
| 2.13 |
|
Class I |
| 1.78 |
|
Class R |
| 1.81 |
|
In order for an individual to claim dividends received as qualified dividends, individual shareholders must have held their shares for more than 60 days during the 121-day period beginning 60 days before each ex-dividend date.
42
Quarterly Schedule of Investments
A complete schedule of portfolio holdings owned by the Fund will be filed with the SEC for the first and third quarter of each fiscal year on Form N-Q, and will be available to shareholders (i) without charge, upon request, by calling toll-free (800) 221-2450 in the US or collect (212) 682-7600 outside the US or (ii) on the SEC’s website at www.sec.gov.1 In addition, the Form N-Q may be reviewed and copied at the SEC’s Public Reference Room in Washington, D.C. Information on the operation of the Public Reference Room may be obtained by calling (800) SEC-0330. Certain of the information contained in the Fund’s Form N-Q is also made available to shareholders on Seligman’s website at www.seligman.com.1
Proxy Voting
A description of the policies and procedures used by the Fund to determine how to vote proxies relating to portfolio securities as well as information regarding how the Fund voted proxies relating to portfolio securities during the 12-month period ended June 30 of each year will be available (i) without charge, upon request, by calling toll-free (800) 221-2450 in the US or collect (212) 682-7600 outside the US and (ii) on the SEC’s website at www.sec.gov.1 Information for each new 12-month period ending June 30 will be available no later than August 31 of that year.
|
|
1 | These website references are inactive textual references and information contained in or otherwise accessible through these websites does not form a part of this report or the Fund’s prospectuses or statement of additional information. |
43
[This Page Intentionally Left Blank.]
[This Page Intentionally Left Blank.]
Seligman
U.S. Government
Securities Fund
Annual Report
December 31, 2007
Seeking High Current
Income by Investing in
US Government Securities
J. & W. SELIGMAN & CO.
INCORPORATED
ESTABLISHED 1864
100 Park Avenue, New York, NY 10017
Experience
Seligman has been in business for more than 140 years, at times playing a central role in the financial development of the country and its markets. Over that time, the firm has managed clients’ wealth through dramatic market changes and has remained a consistent, reliable presence on Wall Street. Today, Seligman is drawing on its long history and long-term perspective as we focus on the future and on developing investment solutions that help clients arrive at their goals.
Insight
Asset management is driven by insight — into the direction of the economy, how companies will perform, how markets will behave, and how investors will respond. Portfolio managers at the firm have been in the investment business, on average, for more than 20 years. Over that time, they have refined their ability to assess a company’s prospects, management, and products, while also weighing the impact of economic and market cycles, new trends, and developing technologies.
Solutions
Seligman’s commitment to the development of innovative investment products — including the nation’s first growth mutual fund, pioneering single-state municipal funds, and one of the country’s premier technology funds — defines our past and informs our future. Our ongoing research into the nature of investment risk — begun in the early 1990s — has resulted in the Seligman Time Horizon Matrix® asset allocation strategy that redefines the relationship between risk and reward over time. The strategy offers investors a variety of investment solutions for goals ranging from college savings to retirement planning. Whether you select Seligman for one investment product, or as a comprehensive asset manager, we believe we can help you reach your goals.
|
|
Table of Contents |
|
|
|
1 | |
|
|
2 | |
|
|
4 | |
|
|
7 | |
|
|
8 | |
|
|
10 | |
|
|
11 | |
|
|
12 | |
|
|
13 | |
|
|
20 | |
|
|
25 | |
|
|
Matters Relating to the Trustees’ Consideration of the Continuance of the Management Agreement | 26 |
|
|
29 | |
|
|
33 |
Your annual shareholder report for Seligman U.S. Government Securities Fund follows this letter. The report contains an interview with your Portfolio Manager, as well as the Fund’s investment results, portfolio of investments, and financial statements as of December 31, 2007.
For the year ended December 31, 2007, Seligman U.S. Government Securities Fund delivered a total return of 6.1%, based on the net asset value of Class A shares (excluding sales charge). For the same period, the Lehman Brothers Government Bond Index returned 8.7%, and the Blended Index (which is comprised of an equal 50% weighting in the Lehman Brothers Government Bond Index and the Lehman Brothers Fixed-Rate Mortgage Backed Securities Index) returned 7.8%. The Fund’s peers, as measured by the Lipper General US Government Funds Average, returned 6.3%.
Thank you for your continued support of Seligman U.S. Government Securities Fund. We look forward to providing you with the investment experience, insight, and solutions you need to help you seek your financial goals for many years to come.
By order of the Board of Trustees,
|
|
|
|
William C. Morris | Brian T. Zino |
|
|
February 27, 2008 |
|
|
|
Manager | |
J. & W. Seligman & Co. Incorporated | |
100 Park Avenue | |
New York, NY 10017 | |
| |
General Distributor | |
Seligman Advisors, Inc. | |
100 Park Avenue | |
New York, NY 10017 | |
| |
General Counsel | |
Sullivan & Cromwell LLP | |
| |
Shareholder Service Agent | |
Seligman Data Corp. | |
100 Park Avenue | |
New York, NY 10017 | |
| |
Mail Inquiries to: | |
P.O. Box 9759 | |
Providence, RI 02940-9759 | |
| |
Independent Registered Public Accounting Firm | |
Deloitte & Touche LLP | |
| |
Important Telephone Numbers | |
(800) 221-2450 | Shareholder Services |
(800) 445-1777 | Retirement Plan Services |
(212) 682-7600 | Outside the United States |
(800) 622-4597 | 24-Hour Automated Telephone Access Service |
1
Interview With Your Portfolio Manager
Francis L. Mustaro
|
|
Q. | How did Seligman U.S. Government Securities Fund perform for the year ended December 31, 2007? |
|
|
A. | For the year ended December 31, 2007, Seligman U.S. Government Securities Fund posted a total return of 6.1%, based on the net asset value of Class A shares. During the same period, the Lehman Brothers Government Bond Index posted a total return of 8.7%, and the Blended Index, which is comprised of an equal 50% weighting in the Lehman Brothers Government Bond Index and the Lehman Brothers Fixed-Rate Mortgage Backed Securities Index, returned 7.8%. The Fund’s peers, as measured by the Lipper General US Government Funds Average, returned 6.3% for the same period. |
|
|
Q. | What market conditions and economic factors materially impacted the Fund’s investment results during the year? |
|
|
A. | The year 2007 was characterized by high volatility and a severe lack of liquidity as creditors tightened the reins amid subprime mortgage concerns. In response to a slowing US economy and dislocations in the credit markets, the US Federal Reserve began to ease monetary policy in August with the first in a series of decreases in the fed funds target rate (the rate banks charge one another on overnight loans). This influential short-term rate stood at 5.25% prior to Fed action and by year-end stood at 4.25%. (Subsequent to year-end, the federal funds target rate was lowered to 3.0%.) The yield curve moved from a moderately inverted shape to one that was fairly steep by year-end. |
|
|
| Prior to Fed easing, the inverted yield curve had offered little incentive for investors to extend maturities from money market funds. US Treasury securities outperformed agency securities, mortgage-backed securities, and other sectors for the year. |
|
|
| Expectations of slower economic growth and a further easing of monetary policy encouraged investors to extend maturities as the year came to a close. |
|
|
Q. | What investment strategies and techniques materially affected the Fund’s investment results during the year? |
|
|
A. | The Fund’s large weighting in mortgage-backed securities detracted from investment results as falling interest rates, a flight to quality, and high volatility led Treasury securities to outperform for much of the year. Our position was rewarded toward the end of the fourth quarter as volatility showed signs of moderating and the yield curve began to steepen — benefiting the Fund’s US government agency and mortgage-backed holdings. |
|
|
| In 2006, we introduced the use of Treasury inflation-protected securities, or TIPS. TIPS are special types of Treasury notes whose principal automatically increases at the same rate as the consumer price index. We continued to use TIPS in 2007, as the implied inflation rate, which is the difference in the yield of TIPS and comparable nominal Treasuries appeared to be low. Further, TIPS are not perfectly correlated with Treasury yields, so the use of TIPS added to the portfolio’s diversification. |
|
|
A TEAM APPROACH | |
|
|
Seligman U.S. Government Securities Fund is managed by the Seligman Investment Grade Team, headed by Francis L. Mustaro. The Team seeks to identify debt securities issued or guaranteed by the US government, its agencies or instrumentalities, or a government-sponsored enterprise in order to seek a high level of current income consistent with prudent investment risk. |
2
Interview With Your Portfolio Manager
Francis L. Mustaro
|
|
| The Fund seeks to maintain a very high quality portfolio of securities that is extremely sensitive to movements in longer-term interest rates and monetary policy. Duration is the sensitivity in bond prices to changes in interest rates, and we extend or shorten the portfolio’s duration in anticipation of a shift in the direction of interest rates. We brought the Fund’s duration in line with the Blended Index, and believe the Fund is well positioned, from a duration standpoint, with regard to moves in Treasury yields. |
|
|
The views and opinions expressed are those of the Portfolio Manager(s), are provided for general information only, and do not constitute specific tax, legal, or investment advice to, or recommendations for, any person. There can be no guarantee as to the accuracy of market forecasts. Opinions, estimates, and forecasts may be changed without notice. |
3
Performance and Portfolio Overview
This section of the report is intended to help you understand the performance of Seligman U.S. Government Securities Fund and to provide a summary of the Fund’s portfolio characteristics.
Performance data quoted in this report represents past performance and does not guarantee or indicate future investment results. The rates of return will vary and the principal value of an investment will fluctuate. Shares, if redeemed, may be worth more or less than their original cost. Current performance may be lower or higher than the performance data quoted. Total returns of the Fund as of the most recent month-end will be available at www.seligman.com1 by the seventh business day following that month-end. Calculations assume reinvestment of distributions, if any. Performance data quoted does not reflect the deduction of taxes that an investor may pay on distributions or the redemption of shares.
The chart on page 5 compares $10,000 hypothetical investments made in Class A shares, with and without the initial 4.5% maximum sales charge that became effective on January 7, 2008, and in Class B and Class D shares, without contingent deferred sales charge (“CDSC”), to $10,000 investments made in the Lehman Brothers Government Bond Index and the Blended Index for the ten-year period ended December 31, 2007. The ten-year return for Class B shares reflects automatic conversion to Class A shares approximately eight years after their date of purchase. The performance of Class C, Class I and Class R shares, which commenced on later dates, and of Class A, Class B and Class D shares for other periods, with and without applicable sales charges and CDSCs, is not shown in the chart but is included in the total returns table that follows the chart. The performance of Class C, Class I and Class R shares will differ from the performance shown for Class A, Class B, and Class D shares, based on the differences in sales charges and fees paid by shareholders.
Returns for Class A shares are calculated with and without the effect of the initial 4.5% maximum sales charge. Although for all periods presented the Fund’s Class A shares reflect the 4.5% maximum sales charge, the actual returns for periods prior to January 7, 2008 would have been lower if the 4.75% maximum sales charge then in effect was incurred. Returns for Class B shares are calculated with and without the effect of the maximum 5% CDSC, charged on redemptions made within one year of the date of purchase, declining to 1% in the sixth year and 0% thereafter. Returns for Class C, Class D and Class R shares are calculated with and without the effect of the 1% CDSC, charged on redemptions made within one year of purchase. Effective June 4, 2007, there is no initial sales charge on investments in Class C shares. Class C share returns are presented without an initial sales charge and would have been lower for periods prior to June 4, 2007 if the 1% initial sales charge then in effect was incurred. Class I shares do not have sales charges, and returns are calculated accordingly.
An investment in the Fund is not a deposit in a bank and is not insured or guaranteed by the Federal Deposit Insurance Corporation or any other government agency.
|
|
1 | The website reference is an inactive textual reference and information contained in or otherwise accessible through the website does not form a part of this report or the Fund’s prospectuses or statement of additional information. |
4
Performance and Portfolio Overview
Investment Results
|
Total Returns |
|
|
|
|
|
|
|
|
|
|
|
|
|
|
|
|
|
|
|
|
|
|
| Average Annual |
| |||||||||||||||
|
|
| |||||||||||||||||
|
| Six |
| One |
| Five |
| Ten |
| Class C |
| Class R |
| ||||||
Class A |
|
|
|
|
|
|
|
|
|
|
|
|
|
|
|
|
|
|
|
With Sales Charge |
|
| 0.82 | % |
| 1.33 | % |
| 1.05 | % |
| 3.77 | % |
| n/a |
|
| n/a |
|
Without Sales Charge |
|
| 5.64 |
|
| 6.10 |
|
| 1.99 |
|
| 4.25 |
|
| n/a |
|
| n/a |
|
Class B |
|
|
|
|
|
|
|
|
|
|
|
|
|
|
|
|
|
|
|
With CDSC† |
|
| 0.08 |
|
| 0.15 |
|
| 0.87 |
|
| n/a |
|
| n/a |
|
| n/a |
|
Without CDSC |
|
| 5.08 |
|
| 5.15 |
|
| 1.23 |
|
| 3.63 | ‡ |
| n/a |
|
| n/a |
|
Class C |
|
|
|
|
|
|
|
|
|
|
|
|
|
|
|
|
|
|
|
With 1% CDSC |
|
| 4.23 |
|
| 4.15 |
|
| n/a |
|
| n/a |
|
| n/a |
|
| n/a |
|
Without CDSC |
|
| 5.23 |
|
| 5.15 |
|
| 1.25 |
|
| n/a |
|
| 3.53% |
|
| n/a |
|
Class D |
|
|
|
|
|
|
|
|
|
|
|
|
|
|
|
|
|
|
|
With 1% CDSC |
|
| 4.23 |
|
| 4.15 |
|
| n/a |
|
| n/a |
|
| n/a |
|
| n/a |
|
Without CDSC |
|
| 5.23 |
|
| 5.15 |
|
| 1.23 |
|
| 3.47 |
|
| n/a |
|
| n/a |
|
Class R |
|
|
|
|
|
|
|
|
|
|
|
|
|
|
|
|
|
|
|
With 1% CDSC |
|
| 4.32 |
|
| 4.63 |
|
| n/a |
|
| n/a |
|
| n/a |
|
| n/a |
|
Without CDSC |
|
| 5.32 |
|
| 5.63 |
|
| n/a |
|
| n/a |
|
| n/a |
|
| 1.77% |
|
Benchmarks** |
|
|
|
|
|
|
|
|
|
|
|
|
|
|
|
|
|
|
|
Lehman Brothers Government Bond Index |
|
| 7.47 |
|
| 8.66 |
|
| 4.10 |
|
| 5.92 |
|
| 6.02 |
|
| 4.06 |
|
Blended Index |
|
| 6.73 |
|
| 7.81 |
|
| 4.30 |
|
| 5.92 |
|
| 6.00 |
|
| 4.30 |
|
Lipper General US Government Funds Average |
|
| 6.18 |
|
| 6.33 |
|
| 3.16 |
|
| 4.98 |
|
| 4.97 |
|
| 3.09 |
|
|
See footnotes on page 6. |
5
Performance and Portfolio Overview
Investment Results
Net Asset Value Per Share
|
|
|
|
|
|
|
|
|
|
|
|
|
| 12/31/07 |
|
| 6/30/07 |
|
| 12/31/06 |
|
Class A |
|
| $6.95 |
|
| $6.70 |
|
| $6.80 |
|
Class B |
|
| 6.96 |
|
| 6.72 |
|
| 6.82 |
|
Class C |
|
| 6.96 |
|
| 6.71 |
|
| 6.82 |
|
Class D |
|
| 6.96 |
|
| 6.71 |
|
| 6.82 |
|
Class R |
|
| 6.95 |
|
| 6.71 |
|
| 6.81 |
|
Durationøøø |
|
|
|
|
|
|
|
|
|
|
December 31, 2007 |
|
|
|
|
|
|
|
| 3.99 years |
|
|
|
|
|
|
|
Dividends Per Share and Yield Information | |||||
| |||||
For Periods Ended December 31, 2007 |
|
|
| ||
|
|
|
| ||
Dividends Paidø |
|
| SEC 30-Day Yieldsøø | ||
|
| ||||
$ | 0.256 |
|
| 2.98 | % |
|
| ||||
| 0.205 |
|
| 2.38 |
|
|
| ||||
| 0.205 |
|
| 2.38 |
|
|
| ||||
| 0.205 |
|
| 2.38 |
|
|
| ||||
| 0.239 |
|
| 2.88 |
|
|
|
|
|
* | Returns for periods of less than one year are not annualized. |
** | The Lehman Brothers Government Bond Index (the “Lehman Index”), the Blended Index, and the Lipper General US Government Funds Average (the “Lipper Average”) are unmanaged benchmarks that assume reinvestment of dividends and exclude the effect of taxes and sales charges. The Lehman Index and the Blended Index also exclude the effect of fees. The Lipper Average includes funds that invest at least 65% of their assets in US government and government agency issues. The Lehman Index is a benchmark index made up of the Treasury Bond Index and the Agency Bond Index as well as the 1-3 Year Government Index and 20+ Year Treasury Index. The Blended Index is an index created by J. & W. Seligman & Co. Incorporated, the Fund’s manager (the “Manager”). The Blended Index consists of a fifty percent equal weighting in the Lehman Index and the Lehman Brothers Fixed-Rate Mortgage Backed Securities Index (the “Lehman MBS Index”), which covers the fixed-rate agency mortgage-backed pass-through securities of the Government National Mortgage Association (Ginnie Mae), the Federal National Mortgage Association (Fannie Mae) and the Federal Home Loan Mortgage Corporation (Freddie Mac). In the Manager’s view, the Blended Index better represents the securities in which the Fund expects to invest since Fund shareholders approved amendments to the Fund’s principal investment strategies in October 2005. The Fund’s holdings, however, may not be evenly weighted among the securities covered by the Lehman Index and Lehman MBS Index, and the weighting of the Fund’s holdings may vary significantly among such securities. The Fund is actively managed and its holdings are subject to change. Investors cannot invest directly in an average or an index. |
† | The CDSC is 5% if you sell your shares within one year of purchase, and 2% for the five-year period. |
‡ | The ten-year return for Class B shares reflects automatic conversion to Class A shares approximately eight years after their date of purchase. |
ø | Represents per share amount paid or declared for the year ended December 31, 2007. |
øø | Current yield, representing the annualized yield for the 30-day period ended December 31, 2007, has been computed in accordance with SEC regulations and will vary. |
øøø | Duration is the average amount of time that it takes to receive the interest and principal of a bond or portfolio of bonds. The duration formula is based on a formula that calculates the weighted average of the cash flows (interest and principal payments) of the bond, discounted to present time. |
|
Composition of Net Assets |
|
|
|
|
|
|
|
|
| Percent of Net Assets | ||||
|
| |||||
|
| 12/31/07 |
| 12/31/06* | ||
US Treasury Securities |
| 21.2 |
|
| 21.4 |
|
Other US Full Faith and Credit Obligations |
| 3.1 |
|
| 8.5 |
|
US Government Agency Obligations |
| 14.0 |
|
| 34.3 |
|
Mortgage-Backed Securities |
| 61.7 |
|
| 31.4 |
|
Short-Term Holdings and Other Assets Less Liabilities |
| — |
|
| 4.4 |
|
Total |
| 100.0 |
|
| 100.0 |
|
|
|
* | Reclassified to conform to current year’s presentation. |
6
Understanding and Comparing
Your Fund’s Expenses
As a shareholder of the Fund, you incur ongoing expenses, such as management fees, distribution and/or service (12b-1) fees, and other Fund expenses. The information below is intended to help you understand your ongoing expenses (in dollars) of investing in the Fund and to compare them with the ongoing expenses of investing in other mutual funds. Please note that the expenses shown in the table are meant to highlight your ongoing expenses only and do not reflect any transactional costs, such as sales charges (also known as loads) on certain purchases or redemptions. Therefore, the table is useful in comparing ongoing expenses only, and will not help you to determine the relative total expenses of owning different funds. In addition, if transactional costs were included, your total expenses would have been higher.
The table is based on an investment of $1,000 invested at the beginning of July 1, 2007 and held for the entire six-month period ended December 31, 2007.
Actual Expenses
The table below provides information about actual expenses and actual account values. You may use the information, together with the amount you invested, to estimate the expenses that you paid over the period. Simply divide your account value at the beginning of the period by $1,000 (for example, an $8,600 account value divided by $1,000 = 8.6), then multiply the result by the number under the heading entitled “Expenses Paid During Period” for the Fund’s share class that you own to estimate the expenses that you paid on your account during the period.
Hypothetical Example for Comparison Purposes
The table below also provides information about hypothetical expenses and hypothetical account values based on the actual expense ratio of each class and an assumed rate of return of 5% per year before expenses, which is not the actual return of any class of the Fund. The hypothetical expenses and account values may not be used to estimate the ending account value or the actual expenses you paid for the period. You may use this information to compare the ongoing expenses of investing in the Fund and other mutual funds. To do so, compare this 5% hypothetical example with the 5% hypothetical examples that appear in the shareholder reports of the other mutual funds.
|
|
|
|
|
|
|
|
|
|
|
|
|
|
|
|
|
|
|
|
|
|
|
|
|
|
|
|
|
|
|
|
|
| Actual |
| Hypothetical |
| ||||||||||||
|
|
|
|
|
|
|
|
|
| |||||||||||||||
|
| Beginning |
| Annualized |
| Ending |
| Expenses Paid |
| Ending |
| Expenses Paid |
| |||||||||||
Class A |
| $ | 1,000.00 |
|
| 1.55 | % |
| $ | 1,056.40 |
|
| $ | 8.02 |
|
| $ | 1,017.40 |
|
| $ | 7.87 |
|
|
Class B |
|
| 1,000.00 |
|
| 2.31 |
|
|
| 1,050.80 |
|
|
| 11.92 |
|
|
| 1,013.58 |
|
|
| 11.70 |
|
|
Class C |
|
| 1,000.00 |
|
| 2.30 |
|
|
| 1,052.30 |
|
|
| 11.91 |
|
|
| 1,013.60 |
|
|
| 11.68 |
|
|
Class D |
|
| 1,000.00 |
|
| 2.30 |
|
|
| 1,052.30 |
|
|
| 11.89 |
|
|
| 1,013.62 |
|
|
| 11.67 |
|
|
Class R |
|
| 1,000.00 |
|
| 1.80 |
|
|
| 1,053.20 |
|
|
| 9.30 |
|
|
| 1,016.14 |
|
|
| 9.14 |
|
|
|
|
* | Expenses of Class B, Class C, Class D and Class R shares differ from the expenses of Class A shares due to the differences in 12b-1 fees paid by each share class. See the Fund’s prospectus for a description of each share class and its expenses and sales charges. |
** | Expenses are equal to the annualized expense ratio based on actual expenses for the period July 1, 2007 to December 31, 2007, multiplied by the average account value over the period, multiplied by 184/365 (number of days in the period). |
7
Portfolio of Investments
December 31, 2007
|
|
|
|
|
|
|
|
|
| Principal |
| Value |
| ||
|
|
|
|
|
| ||
US Full Faith and Credit Obligations 23.4% |
|
|
|
|
|
|
|
US Treasury Notes: |
|
|
|
|
|
|
|
4.125%, 8/31/2012 |
| $ | 2,330,000 |
| $ | 2,399,718 |
|
4.25%, 9/30/2012 |
|
| 1,260,000 |
|
| 1,304,593 |
|
3.875%, 10/31/2012 |
|
| 365,000 | † |
| 372,272 |
|
4%, 2/15/2014 |
|
| 455,000 |
|
| 464,989 |
|
2%, 1/15/2016 |
|
| 273,682 |
|
| 280,951 |
|
4.625%, 11/15/2016 |
|
| 1,000,000 |
|
| 1,047,579 |
|
4.75%, 8/15/2017 |
|
| 2,545,000 |
|
| 2,688,754 |
|
4.25% 11/15/2017 |
|
| 385,000 |
|
| 391,828 |
|
US Treasury Strip Bond 0%, 11/15/2024 |
|
| 2,725,000 |
|
| 1,246,448 |
|
US Treasury Bonds: |
|
|
|
|
|
|
|
8.875%, 2/15/2019 |
|
| 850,000 |
|
| 1,195,645 |
|
5.375%, 2/15/2031 |
|
| 615,000 |
|
| 693,077 |
|
4.5%, 2/15/2036 |
|
| 85,000 |
|
| 85,458 |
|
US Trade Funding 4.26%, 11/15/2014 |
|
| 1,292,748 |
|
| 1,312,411 |
|
Total US Full Faith and Credit Obligations (Cost $13,087,066) |
|
|
|
|
| 13,483,723 |
|
US Government Agency Obligations Ø 5.8% |
|
|
|
|
|
|
|
Fannie Mae: |
|
|
|
|
|
|
|
4.75%, 11/19/2012 |
|
| 930,000 |
|
| 963,470 |
|
5%, 7/9/2018 |
|
| 500,000 |
|
| 496,381 |
|
Freddie Mac: |
|
|
|
|
|
|
|
4.875%, 5/14/2010 |
|
| 650,000 |
|
| 669,033 |
|
5.5%, 8/20/2012 |
|
| 610,000 |
|
| 650,903 |
|
Tennessee Valley Authority 5.5%, 7/18/2017 |
|
| 500,000 |
|
| 537,659 |
|
Total US Government Agency Obligations (Cost $3,176,148) |
|
|
|
|
| 3,317,446 |
|
| |||||||
Mortgage-Backed Securities ØØ 70.8% |
|
|
|
|
|
|
|
Ginnie Mae: |
|
|
|
|
|
|
|
4%, 12/16/2028 |
|
| 389,572 | † |
| 387,832 |
|
5%, 5/20/2029 |
|
| 500,000 | † |
| 501,918 |
|
5.5%, 10/15/2035 |
|
| 1,865,990 |
|
| 1,880,489 |
|
Small Business Administration 5.199%, 8/10/2012 |
|
| 803,368 |
|
| 812,318 |
|
Fannie MaeØ: |
|
|
|
|
|
|
|
4%, 12/25/2017 |
|
| 2,857,027 |
|
| 2,811,147 |
|
5.5%, 11/1/2020 |
| �� | 1,036,056 |
|
| 1,050,042 |
|
4.5%, 12/1/2020 |
|
| 1,154,503 |
|
| 1,135,851 |
|
5.45%, 12/25/2020 |
|
| 897,880 |
|
| 906,705 |
|
5%, 6/25/2025 |
|
| 2,000,000 |
|
| 1,947,997 |
|
5%, 2/1/2035 |
|
| 4,018,537 |
|
| 3,925,998 |
|
4.738%, 8/1/2035# |
|
| 1,512,277 |
|
| 1,515,831 |
|
5.5%, 2/1/2036 |
|
| 2,413,109 |
|
| 2,412,015 |
|
5.349%, 4/1/2036# |
|
| 950,184 |
|
| 949,764 |
|
6.050%, 4/1/2036# |
|
| 1,377,074 |
|
| 1,420,910 |
|
6.035%, 7/1/2036# |
|
| 1,901,923 |
|
| 1,962,170 |
|
8
Portfolio of Investments
December 31, 2007
|
|
|
|
|
|
|
|
|
| Principal |
| Value |
| ||
|
|
|
|
|
|
|
|
Fannie Mae: (continued) |
|
|
|
|
|
|
|
5.983%, 8/1/2036# |
| $ | 824,356 |
| $ | 837,043 |
|
6.061%, 8/1/2036# |
|
| 782,422 |
|
| 796,724 |
|
5.861%, 6/1/2037# |
|
| 2,549,196 |
|
| 2,589,971 |
|
6.5%, 6/1/2037 |
|
| 1,465,190 |
|
| 1,506,350 |
|
6.5%, 9/1/2037 |
|
| 2,364,774 |
|
| 2,413,129 |
|
5.5%, TBA 1/2008 |
|
| 2,000,000 |
|
| 2,025,938 |
|
Freddie MacØ: |
|
|
|
|
|
|
|
5.5%, 10/1/2018 |
|
| 1,407,279 |
|
| 1,426,941 |
|
6.161%, 8/1/2036# |
|
| 919,961 | † |
| 941,845 |
|
6.114%, 12/1/2036# |
|
| 1,752,262 |
|
| 1,780,002 |
|
5.962%, 4/1/2037# |
|
| 2,721,849 |
|
| 2,754,985 |
|
Total Mortgage-Backed Securities (Cost $40,147,651) |
|
|
|
|
| 40,693,915 |
|
| |||||||
Short-Term Holding 2.9% |
|
|
|
|
|
|
|
| |||||||
Repurchase Agreement 2.9% |
|
|
|
|
|
|
|
Fixed Income Clearing Corporation 2.85%, dated 12/31/2007 maturing |
|
| 1,696,000 |
|
| 1,696,000 |
|
| |||||||
Total Investments (Cost $58,106,865) 102.9% |
|
|
|
|
| 59,191,084 |
|
| |||||||
Other Assets Less Liabilities (2.9%) |
|
|
|
|
| (1,672,176 | ) |
| |||||||
Net Assets 100.0% |
|
|
|
| $ | 57,518,908 |
|
|
|
|
| ø | Securities issued by these agencies are neither guaranteed nor issued by the United States Government. |
| øø | Investments in mortgage-backed securities are subject to principal paydowns. As a result of prepayments from refinancing or satisfaction of the underlying mortgage instruments, the average life may be less than the original maturity. This in turn may impact the ultimate yield realized from these investments. |
| # | Floating rate security, the interest rate is reset periodically. The interest rate disclosed reflects the rate in effect at December 31, 2007. |
| † | At December 31, 2007, these securities with a total value of $2,203,867 were held as collateral for the TBA securities. |
TBA—To be announced.
See Notes to Financial Statements.
9
Statement of Assets and Liabilities
December 31, 2007
|
|
|
|
|
Assets: |
|
|
|
|
Investments, at value: |
|
|
|
|
US Full Faith and Credit Obligations (cost $13,087,066) |
| $ | 13,483,723 |
|
US Government Agency Obligations (cost $3,176,148) |
|
| 3,317,446 |
|
Mortgage-Backed Securities (cost $40,147,651) |
|
| 40,693,915 |
|
Short-term holding (cost $1,696,000) |
|
| 1,696,000 |
|
Total investments (cost $58,106,865) |
|
| 59,191,084 |
|
Cash (including restricted cash of $10,000) |
|
| 10,376 |
|
Interest receivable |
|
| 425,134 |
|
Receivable for shares of Beneficial Interest sold |
|
| 155,958 |
|
Paydown receivable |
|
| 79,192 |
|
Expenses prepaid to shareholder service agent |
|
| 3,098 |
|
Other |
|
| 2,466 |
|
| ||||
Net Assets |
|
| 59,867,308 |
|
| ||||
Liabilities: |
|
|
|
|
Payable for securities purchased |
|
| 2,011,764 |
|
Payable for shares of Beneficial Interest repurchased |
|
| 175,527 |
|
Dividends payable |
|
| 62,071 |
|
Management fee payable |
|
| 24,355 |
|
Distribution and service fees (12b-1) payable |
|
| 23,285 |
|
Accrued expenses and other |
|
| 51,398 |
|
Total Liabilities |
|
| 2,348,400 |
|
Net Assets |
| $ | 57,518,908 |
|
Composition of Net Assets: |
|
|
|
|
Shares of Beneficial Interest, at par ($0.001 par value; unlimited shares authorized; 8,275,484 shares outstanding): |
|
|
|
|
Class A |
| $ | 5,231 |
|
Class B |
|
| 677 |
|
Class C |
|
| 561 |
|
Class D |
|
| 1,532 |
|
Class R |
|
| 274 |
|
Additional paid-in capital |
|
| 64,662,324 |
|
Dividends in excess of net investment income (Note 6) |
|
| (24,156 | ) |
Accumulated net realized loss (Note 6) |
|
| (8,211,754 | ) |
Net unrealized appreciation of investments |
|
| 1,084,219 |
|
Net Assets |
| $ | 57,518,908 |
|
Net Asset Value Per Share: |
|
|
|
|
Class A ($36,335,418 ÷ 5,231,048 shares) |
| $ | 6.95 |
|
Class B ($4,712,649 ÷ 676,942 shares) |
| $ | 6.96 |
|
Class C ($3,905,691 ÷ 561,272 shares) |
| $ | 6.96 |
|
Class D ($10,659,825 ÷ 1,532,018 shares) |
| $ | 6.96 |
|
Class R ($1,905,325 ÷ 274,204 shares) |
| $ | 6.95 |
|
|
See Notes to Financial Statements. |
10
Statement of Operations
For the Year Ended December 31, 2007
|
|
|
|
|
Investment Income: |
|
|
|
|
Interest |
| $ | 3,119,767 |
|
|
|
|
|
|
Expenses: |
|
|
|
|
Distribution and service (12b-1) fees |
|
| 301,550 |
|
Management fee |
|
| 292,788 |
|
Shareholder account services |
|
| 265,048 |
|
Registration |
|
| 88,447 |
|
Auditing and legal fees |
|
| 32,010 |
|
Shareholder reports and communications |
|
| 28,906 |
|
Custody and related services |
|
| 28,131 |
|
Trustees’ fees and expenses |
|
| 7,493 |
|
Miscellaneous |
|
| 8,623 |
|
Total Expenses |
|
| 1,052,996 |
|
Net Investment Income |
|
| 2,066,771 |
|
|
|
|
|
|
Net Realized and Unrealized Gain on Investments: |
|
|
|
|
Net realized gain on investments |
|
| 57,571 |
|
Net change in unrealized depreciation of investments |
|
| 1,091,242 |
|
Net Gain on Investments |
|
| 1,148,813 |
|
Increase in Net Assets from Operations |
| $ | 3,215,584 |
|
|
See Notes to Financial Statements. |
11
Statements of Changes In Net Assets
|
|
|
|
|
|
|
|
|
| Year Ended December 31, | |||||
|
| ||||||
|
| 2007 |
| 2006 |
| ||
Operations: |
|
|
|
|
|
|
|
Net investment income |
| $ | 2,066,771 |
| $ | 2,222,338 |
|
Net realized gain (loss) on investments |
|
| 57,571 |
|
| (1,724,726 | ) |
Net change in unrealized depreciation of investments |
|
| 1,091,242 |
|
| 739,246 |
|
Increase in Net Assets from Operations |
|
| 3,215,584 |
|
| 1,236,858 |
|
|
|
|
|
|
|
|
|
Distribution to Shareholders: |
|
|
|
|
|
|
|
Net investment income: |
|
|
|
|
|
|
|
Class A |
|
| (1,382,704 | ) |
| (1,457,958 | ) |
Class B |
|
| (181,998 | ) |
| (280,300 | ) |
Class C |
|
| (121,185 | ) |
| (144,245 | ) |
Class D |
|
| (321,812 | ) |
| (307,511 | ) |
Class R |
|
| (51,517 | ) |
| (27,892 | ) |
Decrease in Net Assets from Distributions |
|
| (2,059,216 | ) |
| (2,217,906 | ) |
| |||||||
Transactions in Shares of Beneficial Interest: |
|
|
|
|
|
|
|
Net proceeds from sales of shares |
|
| 6,212,172 |
|
| 8,537,742 |
|
Investment of dividends |
|
| 1,714,738 |
|
| 1,810,099 |
|
Exchanged from associated funds |
|
| 6,781,291 |
|
| 4,577,838 |
|
Total |
|
| 14,708,201 |
|
| 14,925,679 |
|
Cost of shares repurchased |
|
| (16,229,260 | ) |
| (23,507,778 | ) |
Exchanged into associated funds |
|
| (5,688,660 | ) |
| (2,931,358 | ) |
Total |
|
| (21,917,920 | ) |
| (26,439,136 | ) |
|
|
|
|
|
|
|
|
Decrease in Net Assets from Transactions in Shares of Beneficial Interest |
|
| (7,209,719 | ) |
| (11,513,457 | ) |
Decrease in Net Assets |
|
| (6,053,351 | ) |
| (12,494,505 | ) |
| |||||||
Net Assets: |
|
|
|
|
|
|
|
Beginning of year |
|
| 63,572,259 |
|
| 76,066,764 |
|
End of Year (net of dividends in excess of net investment income of $24,156 and $12,657, respectively) |
| $ | 57,518,908 |
| $ | 63,572,259 |
|
|
See Notes to Financial Statements. |
12
|
|
|
1. | Organization and Multiple Classes of Shares — Seligman U.S. Government Securities Fund (the “Fund”) is a series of Seligman High Income Fund Series (the “Series”), which is registered with the Securities and Exchange Commission under the Investment Company Act of 1940, as amended (the “1940 Act”), as an open-end diversified management investment company. The Fund offers the following five classes of shares: | |
|
|
|
| Class B shares are sold without an initial sales charge but are subject to a distribution fee of 0.75% and a service fee of up to 0.25% on an annual basis, and a CDSC, if applicable, of 5% on redemptions in the first year of purchase, declining to 1% in the sixth year and 0% thereafter. Class B shares will automatically convert to Class A shares approximately eight years after their date of purchase. If Class B shares of the Fund are exchanged for Class B shares of another Seligman mutual fund, the holding period of the shares exchanged will be added to the holding period of the shares acquired, both for determining the applicable CDSC and the conversion of Class B shares to Class A shares. | |
|
|
|
| Class C and Class D shares are sold without an initial sales charge but are subject to a distribution fee of up to 0.75% and a service fee of up to 0.25% on an annual basis, and a CDSC, if applicable, of 1% imposed on redemptions made within one year of purchase. | |
|
|
|
| Prior to June 4, 2007, Class C shares were sold primarily with an initial sales charge of up to 1%, and a CDSC, if applicable, of 1% imposed on redemptions made within 18 months of purchase; and shares purchased through certain financial intermediaries were bought without an initial sales charge and with a 1% CDSC on redemptions made within 12 months of purchase. | |
|
|
|
| The Board of Trustees of the Series has approved the automatic conversion of all of the Fund’s outstanding Class D shares to Class C shares at their relative net asset values on a future date to be determined. The conversion is currently expected to be implemented in the first half of 2008, although it may be delayed or terminated at any time prior to effectiveness. The conversion is not expected to affect individual shareholder account values. | |
|
|
|
| Class R shares are offered to certain employee benefit plans and are not available to all investors. They are sold without an initial sales charge, but are subject to a distribution fee of up to 0.25% and a service fee of up to 0.25% on an annual basis, and a CDSC, if applicable, of 1% on redemptions made within one year of a plan’s initial purchase of Class R shares. | |
|
|
|
| All classes of shares represent interests in the same portfolio of investments, have the same rights and are generally identical in all respects except that each class bears its separate distribution and certain other class-specific expenses, and has exclusive voting rights with respect to any matter on which a separate vote of any class is required. | |
|
|
|
2. | Significant Accounting Policies — The financial statements have been prepared in conformity with accounting principles generally accepted in the United States of America which require management to make certain estimates and assumptions at the date of the financial statements. Actual results may differ from these estimates. The following summarizes the significant accounting policies of the Fund: | |
|
|
|
| a. | Security Valuation and Risk — Investments in US Government and Government agency obligations are valued at current market values or, in their absence, at fair values determined in accordance with procedures approved by the trustees. Securities traded on an exchange are valued at last sales prices or, in their absence and in the case of over-the-counter securities, at the mean of bid and asked prices. |
13
Notes to Financial Statements
|
|
|
|
| The determination of fair value involves subjective judgments. As a result, using fair value to price a security may result in a price materially different from the prices used by other mutual funds to determine net asset value or the price that may be realized upon the actual sale of the security. Short-term holdings that mature in more than 60 days are valued at current market quotations. Short-term holdings maturing in 60 days or less are valued at current market quotations or amortized cost if the Fund’s investment manager believes it approximates fair value. |
|
|
|
|
| US government securities are subject to interest rate risk, prepayment risk, credit risk and market risk. Securities that are not guaranteed by the US Government may have increased credit risk, including, but not limited to, the risk of non-payment of principal or interest. |
|
|
|
| b. | Securities Purchased and Sold on a TBA Basis — The Fund may purchase or sell securities (typically mortgage-backed securities) on a to-be-announced (TBA) basis, with payment and delivery scheduled for a future date. These transactions are subject to market fluctuations and are subject to the risk that the value at delivery may be more or less than the trade date purchase price. Unsettled TBA commitments are valued at fair value in accordance with the procedures for security valuation described above. The Fund segregates securities as collateral for its obligations to purchase TBA mortgage securities. |
|
|
|
| c. | Mortgage Dollar Rolls — The Fund may enter into mortgage dollar roll transactions using TBAs in which the Fund sells a mortgage-backed security to a counterparty and simultaneously enters into an agreement with the same counterparty to buy back a similar security on a specific future date at a predetermined price. Each mortgage dollar roll is treated as a sale and purchase transaction, with any gain or loss recognized at the time of each sale. The Fund may be exposed to market or credit risk if the price of the security changes unfavorably or the counterparty fails to perform under the terms of the agreement. |
|
|
|
| d. | Repurchase Agreements — The Fund may enter into repurchase agreements. Generally, securities received as collateral subject to repurchase agreements are deposited with the Fund’s custodian and, pursuant to the terms of the repurchase agreements, must have an aggregate market value greater than or equal to the repurchase price plus accrued interest at all times. On a daily basis, the market value of securities held as collateral for repurchase agreements is monitored to ensure the existence of the proper level of collateral. |
|
|
|
| e. | Restricted Cash — Restricted cash represents deposits that are being held by banks as collateral for letters of credit issued in connection with the Fund’s insurance policies. |
|
|
|
| f. | Multiple Class Allocations — All income, expenses (other than class-specific expenses), and realized and unrealized gains or losses are allocated daily to each class of shares based upon the relative value of shares of each class. Class-specific expenses, which include distribution and service (12b-1) fees and any other items that are specifically attributable to a particular class, are charged directly to such class. For the year ended December 31, 2007, distribution and service (12b-1) fees were the only class-specific expenses. |
|
|
|
| g. | Security Transactions and Related Investment Income — Investment transactions are recorded on trade dates. Identified cost of investments sold is used for both financial reporting and federal income tax purposes. Interest income is recorded on an accrual basis. The Fund amortizes premiums and discounts on purchases of portfolio securities for financial reporting purposes. |
|
|
|
| h. | Distributions to Shareholders — Dividends and other distributions to shareholders are recorded on ex-dividend dates. |
|
|
|
| i. | Taxes — There is no provision for federal income tax. The Fund has elected to be taxed as a regulated investment company and intends to distribute substantially all taxable net income and net realized gain. |
|
|
|
|
| On January 1, 2007, the Fund adopted Financial Accounting Standards Board (“FASB”) Interpretation No. 48 (“FIN 48”), “Accounting for Uncertainty in Income Taxes — an interpretation of FASB Statement No. 109.” FIN 48 requires the Fund to measure and recognize in its financial statements the benefit of a tax position taken (or expected to be taken) on an income tax return if such position will more likely |
14
Notes to Financial Statements
|
|
|
|
| than not be sustained upon examination based on the technical merits of the position. The Fund files income tax returns in the US Federal jurisdiction, as well as the New York State and New York City jurisdictions. Based upon its review of tax positions for the Fund’s open tax years of 2004-2007 in these jurisdictions, the Fund has determined that FIN 48 did not have a material impact on the Fund’s financial statements for the year ended December 31, 2007. |
|
|
|
3. | Management Fee, Distribution Services, and Other Transactions — The Manager manages the affairs of the Fund and provides the necessary personnel and facilities. Compensation of all officers of the Fund, all trustees of the Fund who are employees of the Manager, and all personnel of the Fund and the Manager is paid by the Manager. The Manager receives a fee, calculated daily and payable monthly, equal to 0.50% per annum of the Fund’s average daily net assets. | |
|
|
|
| For the year ended December 31, 2007, Seligman Advisors, Inc. (the “Distributor”), agent for the distribution of the Fund’s shares and an affiliate of the Manager, received commissions and concessions of $1,466 from sales of Class A and (prior to June 4, 2007) Class C shares. Commissions of $4,644 and $129 were also paid to dealers for sales of Class A and Class C shares, respectively. | |
|
|
|
| The Fund has an Administration, Shareholder Services and Distribution Plan (the “Plan”) with respect to distribution of its shares. Under the Plan, with respect to Class A shares, service organizations can enter into agreements with the Distributor and receive a continuing fee of up to 0.25% on an annual basis, payable quarterly, of the average daily net assets of the Class A shares attributable to the particular service organizations for providing personal services and/or the maintenance of shareholder accounts. The Distributor charges such fees to the Fund pursuant to the Plan. For the year ended December 31, 2007, fees incurred under the Plan aggregated $88,631, or 0.25% per annum of the average daily net assets of Class A shares. | |
|
|
|
| Under the Plan, with respect to Class B shares, Class C shares, Class D shares, and Class R shares, service organizations can enter into agreements with the Distributor and receive a continuing fee for providing personal services and/or the maintenance of shareholder accounts of up to 0.25% on an annual basis of the average daily net assets of the Class B, Class C, Class D, and Class R shares for which the organizations are responsible; and, for Class C, Class D, and Class R shares, fees for providing other distribution assistance of up to 0.75% (0.25%, in the case of Class R shares) on an annual basis of such average daily net assets. Such fees are paid monthly by the Fund to the Distributor pursuant to the Plan. | |
|
|
|
| For the year ended December 31, 2007, fees incurred under the Plan, equivalent to 1% per annum of the average daily net assets of Class B, Class C, and Class D shares, and 0.50% per annum of average daily net assets of Class R shares amounted to $59,538, $39,929, $106,110, and $7,342, respectively. | |
|
|
|
| The Distributor and Seligman Services, Inc., also an affiliate of the Manager, are eligible to receive distribution and service (12b-1) fees pursuant to the Plan. For the year ended December 31, 2007, the Distributor and Seligman Services, Inc. received distribution and service (12b-1) fees of $8,880. | |
|
|
|
| The Distributor is entitled to retain any CDSC imposed on certain redemptions of Class A, Class C, Class D and Class R shares. For the year ended December 31, 2007, such charges amounted to $2,776. The Distributor has sold its rights to third parties to collect any CDSC imposed on redemptions of Class B shares. | |
|
|
|
| For the year ended December 31, 2007, Seligman Data Corp., which is owned by certain associated investment companies, charged the Fund at cost $265,048 for shareholder account services in accordance with a methodology approved by the Fund’s trustees. | |
|
|
|
| Costs of Seligman Data Corp. directly attributable to the Fund were charged to the Fund. The remaining charges were allocated to the Fund by Seligman Data Corp. pursuant to a formula based on the Fund’s net assets, shareholder transaction volume and number of shareholder accounts. | |
| ||
| The Series and certain other associated investment companies (together, the “Guarantors”) have severally but not jointly guaranteed the performance and observance of all the terms and conditions of two leases entered into by Seligman Data Corp., including the payment of rent by Seligman Data Corp. (the “Guaranties”). The leases and the related Guaranties expire in September 2008 and January 2019, respectively. The obligation of the Series to pay any amount due under the Guaranties is limited to a specified percentage of the full amount, |
15
Notes to Financial Statements
|
|
| which generally is based on the Series’ percentage of the expenses billed by Seligman Data Corp. to all Guarantors in the preceding calendar quarter. At December 31, 2007, the Series’ potential obligation under the Guaranties is $560,506. As of December 31, 2007, no event has occurred which would result in the Series becoming liable to make any payment under the Guaranties. The Fund would bear a portion of any payments made by the Series under the Guaranties. A portion of the rent paid by Seligman Data Corp. is charged to the Fund as part of Seligman Data Corp.’s shareholder account services cost. |
|
|
| Certain officers and trustees of the Series are officers or directors of the Manager, the Distributor, Seligman Services, Inc., and/or Seligman Data Corp. |
|
|
| The Series has a compensation arrangement under which trustees who receive fees may elect to defer receiving such fees. Trustees may elect to have their deferred fees accrue interest or earn a return based on the performance of the Fund or other funds in the Seligman Group of Investment Companies. The cost of such fees and earnings/losses accrued thereon is included in directors’ fees and expenses, and the accumulated balance thereof at December 31, 2007, of $792 is included in accrued expenses and other liabilities. Deferred fees and related accrued earnings are not deductible by the Fund for federal income tax purposes until such amounts are paid. |
|
|
4. | Committed Line of Credit — The Fund is a participant in a joint $375 million committed line of credit that is shared by substantially all open-end funds in the Seligman Group of Investment Companies. The trustees have currently limited the Fund’s borrowings to 10% of its net assets. Borrowings pursuant to the credit facility are subject to interest at a rate equal to the overnight federal funds rate plus 0.50%. The Fund incurs a commitment fee of 0.10% per annum on its share of the unused portion of the credit facility. The credit facility may be drawn upon only for temporary purposes and is subject to certain other customary restrictions. The credit facility commitment expires in June 2008, but is renewable annually with the consent of the participating banks. For the year ended December 31, 2007, the Fund did not borrow from the credit facility. |
|
|
5. | Purchases and Sales of Securities — Purchases and sales of portfolio securities, excluding short-term investments, for the year ended December 31, 2007, amounted to $119,334,482 and $121,761,151, respectively. |
|
|
6. | Federal Tax Information — Certain components of income, expense and realized capital gain and loss are recognized at different times or have a different character for federal income tax purposes and for financial reporting purposes. Where such differences are permanent in nature, they are reclassified in the components of net assets based on their characterization for federal income tax purposes. Any such reclassifications will have no effect on net assets, results of operations or net asset value per share of the Fund. As a result of the differences described above, the treatment for financial reporting purposes of distributions made during the year from net investment income or net realized gains may differ from their treatment for federal income tax purposes. Further, the cost of investments also can differ for federal income tax purposes. |
|
|
| At December 31, 2007, the cost of investments for federal income tax purposes was $58,188,358. The tax basis cost was greater than the cost for financial reporting purposes due to the deferral of losses on wash sales of $57,337 and the amortization of premium for financial reporting purposes of $24,156. |
|
|
| At December 31, 2007, the tax basis components of accumulated losses were as follows: |
|
|
|
|
|
|
| Gross unrealized appreciation of portfolio securities |
| $ | 1,073,345 |
|
| |||||
| Gross unrealized depreciation of portfolio securities |
|
| (70,619 | ) |
| |||||
| Net unrealized appreciation of portfolio securities |
|
| 1,002,726 |
|
| |||||
| Capital loss carryforwards |
|
| (8,151,784 | ) |
| |||||
| Timing differences (post-October losses) |
|
| (2,633 | ) |
| |||||
| Undistributed ordinary income |
|
| 792 |
|
| |||||
| Total accumulated losses |
| $ | (7,150,899 | ) |
|
|
|
| For the years ended December 31, 2007 and 2006, all of the distributions to shareholders were from ordinary income. |
16
Notes to Financial Statements
|
|
| At December 31, 2007, the Fund had net capital loss carryforwards for federal income tax purposes of $8,151,784, which are available for offset against future taxable net capital gains, with $1,438,163 expiring in 2008, $2,770,254 expiring in 2012, $1,912,635 expiring in 2013, and $2,030,732 expiring in 2014. Accordingly, no capital gain distributions are expected to be paid to shareholders until net capital gains have been realized in excess of the available capital loss carryforwards. There can be no assurance that the Fund will be able to utilize all of these capital loss carryforwards before they expire. During the year ended December 31, 2007, prior year’s capital loss carryforwards of $8,250 was utilized and $1,351,294 expired. |
|
|
| In addition, from November 1, 2007 through December 31, 2007, the Fund incurred $2,633 of net realized capital losses. As permitted by tax regulations, the Fund intends to elect to defer these losses and treat them as arising in the fiscal year ended December 31, 2008. These losses will be available to offset future taxable net gains. |
|
|
7. | Transactions in Shares of Beneficial Interest — The Fund has authorized unlimited shares of $0.001 par value Shares of Beneficial Interest. Transactions in Shares of Beneficial Interest were as follows: |
|
|
|
|
|
|
|
|
|
|
|
|
|
|
|
|
|
| Year Ended December 31, |
| ||||||||||
|
|
| ||||||||||||
|
|
| 2007 |
| 2006 |
| ||||||||
|
|
| ||||||||||||
| Class A |
| Shares |
| Amount |
| Shares |
| Amount |
| ||||
| ||||||||||||||
| Net proceeds from sales of shares |
|
| 330,169 |
| $ | 2,250,085 |
|
| 829,205 |
| $ | 5,626,573 |
|
| ||||||||||||||
| Investment of dividends |
|
| 164,842 |
|
| 1,120,783 |
|
| 173,438 |
|
| 1,173,460 |
|
| ||||||||||||||
| Exchanged from associated funds |
|
| 467,532 |
|
| 3,201,817 |
|
| 317,767 |
|
| 2,159,661 |
|
| ||||||||||||||
| Converted from Class B* |
|
| 204,624 |
|
| 1,390,068 |
|
| 346,675 |
|
| 2,344,995 |
|
| ||||||||||||||
| Total |
|
| 1,167,167 |
|
| 7,962,753 |
|
| 1,667,085 |
|
| 11,304,689 |
|
| ||||||||||||||
| Cost of shares repurchased |
|
| (1,329,688 | ) |
| (9,070,085 | ) |
| (1,912,212 | ) |
| (12,955,116 | ) |
| ||||||||||||||
| Exchanged into associated funds |
|
| (584,026 | ) |
| (3,980,147 | ) |
| (224,586 | ) |
| (1,524,151 | ) |
| ||||||||||||||
| Total |
|
| (1,913,714 | ) |
| (13,050,232 | ) |
| (2,136,798 | ) |
| (14,479,267 | ) |
| ||||||||||||||
| Decrease |
|
| (746,547 | ) | $ | (5,087,479 | ) |
| (469,713 | ) | $ | (3,174,578 | ) |
| ||||||||||||||
| Class B |
| Shares |
| Amount |
| Shares |
| Amount |
| ||||
| ||||||||||||||
| Net proceeds from sales of shares |
|
| 19,111 |
| $ | 130,412 |
|
| 46,485 |
| $ | 315,866 |
|
| ||||||||||||||
| Investment of dividends |
|
| 20,939 |
|
| 142,602 |
|
| 31,043 |
|
| 210,405 |
|
| ||||||||||||||
| Exchanged from associated funds |
|
| 131,564 |
|
| 901,715 |
|
| 174,836 |
|
| 1,185,809 |
|
| ||||||||||||||
| Total |
|
| 171,614 |
|
| 1,174,729 |
|
| 252,364 |
|
| 1,712,080 |
|
| ||||||||||||||
| Cost of shares repurchased |
|
| (334,128 | ) |
| (2,280,744 | ) |
| (740,034 | ) |
| (5,023,745 | ) |
| ||||||||||||||
| Exchanged into associated funds |
|
| (73,597 | ) |
| (500,718 | ) |
| (75,849 | ) |
| (514,462 | ) |
| ||||||||||||||
| Converted to Class A* |
|
| (204,103 | ) |
| (1,389,467 | ) |
| (345,743 | ) |
| (2,343,737 | ) |
| ||||||||||||||
| Total |
|
| (611,828 | ) |
| (4,170,929 | ) |
| (1,161,626 | ) |
| (7,881,944 | ) |
| ||||||||||||||
| Decrease |
|
| (440,214 | ) | $ | (2,996,200 | ) |
| (909,262 | ) | $ | (6,169,864 | ) |
| ||||||||||||||
| Class C |
| Shares |
| Amount |
| Shares |
| Amount |
| ||||
| ||||||||||||||
| Net proceeds from sales of shares |
|
| 20,200 |
| $ | 138,160 |
|
| 29,074 |
| $ | 197,032 |
|
| ||||||||||||||
| Investment of dividends |
|
| 14,063 |
|
| 95,830 |
|
| 16,801 |
|
| 113,857 |
|
| ||||||||||||||
| Exchanged from associated funds |
|
| 98,866 |
|
| 676,141 |
|
| 22,594 |
|
| 153,314 |
|
| ||||||||||||||
| Total |
|
| 133,129 |
|
| 910,131 |
|
| 68,469 |
|
| 464,203 |
|
| ||||||||||||||
| Cost of shares repurchased |
|
| (98,862 | ) |
| (673,174 | ) |
| (303,663 | ) |
| (2,064,426 | ) |
| ||||||||||||||
| Exchanged into associated funds |
|
| (86,768 | ) |
| (592,383 | ) |
| (22,852 | ) |
| (156,295 | ) |
| ||||||||||||||
| Total |
|
| (185,630 | ) |
| (1,265,557 | ) |
| (326,515 | ) |
| (2,220,721 | ) |
| ||||||||||||||
| Decrease |
|
| (52,501 | ) | $ | (355,426 | ) |
| (258,046 | ) | $ | (1,756,518 | ) |
|
|
|
|
|
| * | Automatic conversion of Class B shares to Class A shares approximately eight years after their initial purchase date. The amount of dividends accrued on Class B shares between the last dividend payment date and the conversion date is invested in Class A shares and is included in the conversion from Class B amount. |
17
Notes to Financial Statements
|
|
|
|
|
|
|
|
|
|
|
|
|
|
|
|
|
| Year Ended December 31, |
| ||||||||||
|
|
|
| |||||||||||
|
|
| 2007 |
| 2006 |
| ||||||||
|
|
|
|
| ||||||||||
| Class D |
| Shares |
| Amount |
| Shares |
| Amount |
| ||||
| ||||||||||||||
| Net proceeds from sales of shares |
|
| 327,306 |
| $ | 2,233,964 |
|
| 286,887 |
| $ | 1,948,945 |
|
| ||||||||||||||
| Investment of dividends |
|
| 44,836 |
|
| 305,278 |
|
| 42,074 |
|
| 285,013 |
|
| ||||||||||||||
| Exchanged from associated funds |
|
| 291,266 |
|
| 1,990,662 |
|
| 156,212 |
|
| 1,070,839 |
|
| ||||||||||||||
| Total |
|
| 663,408 |
|
| 4,529,904 |
|
| 485,173 |
|
| 3,304,797 |
|
| ||||||||||||||
| Cost of shares repurchased |
|
| (521,512 | ) |
| (3,550,798 | ) |
| (489,538 | ) |
| (3,321,339 | ) |
| ||||||||||||||
| Exchanged into associated funds |
|
| (90,173 | ) |
| (615,412 | ) |
| (108,395 | ) |
| (734,924 | ) |
| ||||||||||||||
| Total |
|
| (611,685 | ) |
| (4,166,210 | ) |
| (597,933 | ) |
| (4,056,263 | ) |
| ||||||||||||||
| Increase (decrease) |
|
| 51,723 |
| $ | 363,694 |
|
| (112,760 | ) | $ | (751,466 | ) |
| ||||||||||||||
| Class R |
| Shares |
| Amount |
| Shares |
| Amount |
| ||||
| ||||||||||||||
| Net proceeds from sales of shares |
|
| 214,181 |
| $ | 1,458,949 |
|
| 66,071 |
| $ | 448,068 |
|
| ||||||||||||||
| Investment of dividends |
|
| 7,386 |
|
| 50,247 |
|
| 4,044 |
|
| 27,364 |
|
| ||||||||||||||
| Exchanged from associated funds |
|
| 1,605 |
|
| 10,955 |
|
| 1,191 |
|
| 8,215 |
|
| ||||||||||||||
| Total |
|
| 223,172 |
|
| 1,520,151 |
|
| 71,306 |
|
| 483,647 |
|
| ||||||||||||||
| Cost of shares repurchased |
|
| (96,174 | ) |
| (654,459 | ) |
| (21,263 | ) |
| (143,152 | ) |
| ||||||||||||||
| Exchanged into associated funds |
|
| — |
|
| — |
|
| (224 | ) |
| (1,526 | ) |
| ||||||||||||||
| Total |
|
| (96,174 | ) |
| (654,459 | ) |
| (21,487 | ) |
| (144,678 | ) |
| ||||||||||||||
| Increase |
|
| 126,998 |
| $ | 865,692 |
|
| 49,819 |
| $ | 338,969 |
|
|
|
|
8. | Other Matters — In late 2003, the Manager conducted an extensive internal review concerning mutual fund trading practices. The Manager’s review, which covered the period 2001-2003, noted one arrangement that permitted frequent trading in certain open-end registered investment companies managed by the Manager (the “Seligman Funds”); this arrangement was in the process of being closed down by the Manager before September 2003. The Manager identified three other arrangements that permitted frequent trading, all of which had been terminated by September 2002. In January 2004, the Manager, on a voluntary basis, publicly disclosed these four arrangements to its clients and to shareholders of the Seligman Funds. The Manager also provided information concerning mutual fund trading practices to the Securities and Exchange Commission (the “SEC”) and the Office of the Attorney General of the State of New York (“NYAG”). |
|
|
| In September 2005, the New York staff of the SEC indicated that it was considering recommending to the Commissioners of the SEC the instituting of a formal action against the Manager and the Distributor relating to frequent trading in the Seligman Funds. The Manager responded to the staff in October 2005 that it believed that any action would be both inappropriate and unnecessary, especially in light of the fact that the Manager had previously resolved the underlying issue with the Independent Directors of the Seligman Funds and made recompense to the affected Seligman Funds. |
|
|
| In September 2006, the NYAG commenced a civil action in New York State Supreme Court against the Manager, the Distributor, Seligman Data Corp. and Brian T. Zino (collectively, the “Seligman Parties”), alleging, in substance, that, in addition to the four arrangements noted above, the Seligman Parties permitted other persons to engage in frequent trading and, as a result, the prospectus disclosure used by the registered investment companies managed by the Manager is and has been misleading. The NYAG included other related claims and also claimed that the fees charged by the Manager to the Seligman Funds were excessive. The NYAG is seeking damages of at least $80 million and restitution, disgorgement, penalties and costs and injunctive relief. The Seligman Parties answered the complaint in December 2006 and believe that the claims are without merit. |
|
|
| Any resolution of these matters may include the relief noted above or other sanctions or changes in procedures. Any damages would be paid by the Manager and not by the Seligman Funds. If the NYAG |
18
Notes to Financial Statements
|
|
| obtains injunctive relief, the Manager and its affiliates could, in the absence of the SEC in its discretion granting exemptive relief, be enjoined from providing advisory and underwriting services to the Seligman Funds and other registered investment companies. |
|
|
| The Manager does not believe that the foregoing legal action or other possible actions will have a material adverse impact on the Manager or its clients, including the Seligman Funds and other investment companies managed by it; however, there can be no assurance of this or that these matters and any related publicity will not affect demand for shares of the Seligman Funds and such other investment companies or have other adverse consequences. |
|
|
9. | Recently Issued Accounting Pronouncement — In September 2006, the FASB issued Statement of Financial Accounting Standards No. 157 (“SFAS No. 157”), “Fair Value Measurements.” SFAS No. 157 defines fair value, establishes a framework for measuring fair value of assets and liabilities and expands disclosure about fair value measurements. SFAS No. 157 is effective for fiscal years beginning after November 15, 2007. The Fund is currently evaluating the impact of the adoption of SFAS No. 157 but believes the impact will be limited to expanded disclosures in the Fund’s financial statements. |
19
The tables below are intended to help you understand each Class’s financial performance for the periods presented. Certain information reflects financial results for a single share of Beneficial Interest of a Class that was held throughout the periods shown. Per share amounts are calculated using average shares outstanding during the period. Total return shows the rate that you would have earned (or lost) on an investment in each Class, assuming you reinvested all your dividends and capital gain distributions, if any. Total returns do not reflect any taxes or sales charges and are not annualized for periods of less than one year.
|
Class A |
|
|
|
|
|
|
|
|
|
|
|
|
|
|
|
|
|
|
|
| Year Ended December 31, |
| |||||||||||||
|
| |||||||||||||||
|
| 2007 |
| 2006 |
| 2005 |
| 2004 |
| 2003 |
| |||||
Per Share Data: |
|
|
|
|
|
|
|
|
|
|
|
|
|
|
|
|
Net Asset Value, Beginning of Year |
| $ | 6.80 |
| $ | 6.89 |
| $ | 7.10 |
| $ | 7.23 |
| $ | 7.39 |
|
Income (Loss) from Investment Operations: |
|
|
|
|
|
|
|
|
|
|
|
|
|
|
|
|
Net investment income |
|
| 0.26 |
|
| 0.24 |
|
| 0.20 |
|
| 0.19 |
|
| 0.18 |
|
Net realized and unrealized gain (loss) on investments |
|
| 0.15 |
|
| (0.09 | ) |
| (0.20 | ) |
| (0.11 | ) |
| (0.14 | ) |
Total from Investment Operations |
|
| 0.41 |
|
| 0.15 |
|
| — |
|
| 0.08 |
|
| 0.04 |
|
Less Distributions: |
|
|
|
|
|
|
|
|
|
|
|
|
|
|
|
|
Dividends from net investment income |
|
| (0.26 | ) |
| (0.24 | ) |
| (0.20 | ) |
| (0.19 | ) |
| (0.18 | ) |
Dividends in excess of net investment income |
|
| — |
|
| — |
|
| (0.01 | ) |
| (0.02 | ) |
| (0.02 | ) |
Total Distributions |
|
| (0.26 | ) |
| (0.24 | ) |
| (0.21 | ) |
| (0.21 | ) |
| (0.20 | ) |
Net Asset Value, End of Year |
| $ | 6.95 |
| $ | 6.80 |
| $ | 6.89 |
| $ | 7.10 |
| $ | 7.23 |
|
|
|
|
|
|
|
|
|
|
|
|
|
|
|
|
|
|
Total Return |
|
| 6.10 | % |
| 2.33 | % |
| — | % |
| 1.09 | % |
| 0.55 | % |
|
|
|
|
|
|
|
|
|
|
|
|
|
|
|
|
|
Ratios/Supplemental Data: |
|
|
|
|
|
|
|
|
|
|
|
|
|
|
|
|
Net assets, end of year (000s omitted) |
| $ | 36,335 |
| $ | 40,676 |
| $ | 44,402 |
| $ | 47,553 |
| $ | 59,660 |
|
Ratio of expenses to average net assets |
|
| 1.52 | % |
| 1.42 | % |
| 1.50 | % |
| 1.31 | % |
| 1.27 | % |
Ratio of net investment income to average net assets |
|
| 3.80 | % |
| 3.55 | % |
| 2.90 | % |
| 2.66 | % |
| 2.38 | % |
Portfolio turnover rate |
|
| 204.04 | % |
| 347.09 | % |
| 286.60 | % |
| 133.02 | % |
| 250.49 | % |
| ||||||||||||||||
See footnotes on page 24. |
20
Financial Highlights
|
Class B |
|
|
|
|
|
|
|
|
|
|
|
|
|
|
|
|
|
|
| Year Ended December 31, |
| |||||||||||||
|
| |||||||||||||||
|
| 2007 |
| 2006 |
| 2005 |
| 2004 |
| 2003 |
| |||||
Per Share Data: |
|
|
|
|
|
|
|
|
|
|
|
|
|
|
|
|
Net Asset Value, Beginning of Year |
| $ | 6.82 |
| $ | 6.90 |
| $ | 7.12 |
| $ | 7.25 |
| $ | 7.40 |
|
Income (Loss) from Investment Operations: |
|
|
|
|
|
|
|
|
|
|
|
|
|
|
|
|
Net investment income |
|
| 0.21 |
|
| 0.19 |
|
| 0.15 |
|
| 0.14 |
|
| 0.12 |
|
Net realized and unrealized gain (loss) on investments |
|
| 0.14 |
|
| (0.08 | ) |
| (0.21 | ) |
| (0.11 | ) |
| (0.13 | ) |
Total from Investment Operations |
|
| 0.35 |
|
| 0.11 |
|
| (0.06 | ) |
| 0.03 |
|
| (0.01 | ) |
Less Distributions: |
|
|
|
|
|
|
|
|
|
|
|
|
|
|
|
|
Dividends from net investment income |
|
| (0.21 | ) |
| (0.19 | ) |
| (0.15 | ) |
| (0.14 | ) |
| (0.12 | ) |
Dividends in excess of net investment income |
|
| — |
|
| — |
|
| (0.01 | ) |
| (0.02 | ) |
| (0.02 | ) |
Total Distributions |
|
| (0.21 | ) |
| (0.19 | ) |
| (0.16 | ) |
| (0.16 | ) |
| (0.14 | ) |
Net Asset Value, End of Year |
| $ | 6.96 |
| $ | 6.82 |
| $ | 6.90 |
| $ | 7.12 |
| $ | 7.25 |
|
|
|
|
|
|
|
|
|
|
|
|
|
|
|
|
|
|
Total Return |
|
| 5.15 | % |
| 1.73 | % |
| (0.88 | )% |
| 0.34 | % |
| (0.08 | )% |
|
|
|
|
|
|
|
|
|
|
|
|
|
|
|
|
|
Ratios/Supplemental Data: |
|
|
|
|
|
|
|
|
|
|
|
|
|
|
|
|
Net assets, end of year (000s omitted) |
| $ | 4,713 |
| $ | 7,619 |
| $ | 13,986 |
| $ | 24,045 |
| $ | 40,659 |
|
Ratio of expenses to average net assets |
|
| 2.28 | % |
| 2.17 | % |
| 2.26 | % |
| 2.06 | % |
| 2.03 | % |
Ratio of net investment income to average net assets |
|
| 3.04 | % |
| 2.80 | % |
| 2.14 | % |
| 1.91 | % |
| 1.62 | % |
Portfolio turnover rate |
|
| 204.04 | % |
| 347.09 | % |
| 286.60 | % |
| 133.02 | % |
| 250.49 | % |
| ||||||||||||||||
See footnotes on page 24. |
21
Financial Highlights
|
Class C |
|
|
|
|
|
|
|
|
|
|
|
|
|
|
|
|
|
|
| Year Ended December 31, |
| |||||||||||||
|
| |||||||||||||||
|
| 2007 |
| 2006 |
| 2005 |
| 2004 |
| 2003 |
| |||||
Per Share Data: |
|
|
|
|
|
|
|
|
|
|
|
|
|
|
|
|
Net Asset Value, Beginning of Year |
| $ | 6.82 |
| $ | 6.90 |
| $ | 7.11 |
| $ | 7.25 |
| $ | 7.40 |
|
Income (Loss) from Investment Operations: |
|
|
|
|
|
|
|
|
|
|
|
|
|
|
|
|
Net investment income |
|
| 0.21 |
|
| 0.19 |
|
| 0.15 |
|
| 0.14 |
|
| 0.12 |
|
Net realized and unrealized gain (loss) on investments |
|
| 0.14 |
|
| (0.08 | ) |
| (0.20 | ) |
| (0.12 | ) |
| (0.13 | ) |
Total from Investment Operations |
|
| 0.35 |
|
| 0.11 |
|
| (0.05 | ) |
| 0.02 |
|
| (0.01 | ) |
Less Distributions: |
|
|
|
|
|
|
|
|
|
|
|
|
|
|
|
|
Dividends from net investment income |
|
| (0.21 | ) |
| (0.19 | ) |
| (0.15 | ) |
| (0.14 | ) |
| (0.12 | ) |
Dividends in excess of net investment income |
|
| — |
|
| — |
|
| (0.01 | ) |
| (0.02 | ) |
| (0.02 | ) |
Total Distributions |
|
| (0.21 | ) |
| (0.19 | ) |
| (0.16 | ) |
| (0.16 | ) |
| (0.14 | ) |
Net Asset Value, End of Year |
| $ | 6.96 |
| $ | 6.82 |
| $ | 6.90 |
| $ | 7.11 |
| $ | 7.25 |
|
|
|
|
|
|
|
|
|
|
|
|
|
|
|
|
|
|
Total Return |
|
| 5.15 | % |
| 1.84 | % |
| (0.74 | )% |
| 0.20 | % |
| (0.08 | )% |
|
|
|
|
|
|
|
|
|
|
|
|
|
|
|
|
|
Ratios/Supplemental Data: |
|
|
|
|
|
|
|
|
|
|
|
|
|
|
|
|
Net assets, end of year (000s omitted) |
| $ | 3,906 |
| $ | 4,185 |
| $ | 6,016 |
| $ | 9,764 |
| $ | 18,739 |
|
Ratio of expenses to average net assets |
|
| 2.28 | % |
| 2.17 | % |
| 2.26 | % |
| 2.06 | % |
| 2.03 | % |
Ratio of net investment income to average net assets |
|
| 3.04 | % |
| 2.80 | % |
| 2.14 | % |
| 1.91 | % |
| 1.62 | % |
Portfolio turnover rate |
|
| 204.04 | % |
| 347.09 | % |
| 286.60 | % |
| 133.02 | % |
| 250.49 | % |
| ||||||||||||||||
See footnotes on page 24. |
22
Financial Highlights
|
Class D |
|
|
|
|
|
|
|
|
|
|
|
|
|
|
|
|
|
|
| Year Ended December 31, |
| |||||||||||||
|
| |||||||||||||||
|
| 2007 |
| 2006 |
| 2005 |
| 2004 |
| 2003 |
| |||||
Per Share Data: |
|
|
|
|
|
|
|
|
|
|
|
|
|
|
|
|
Net Asset Value, Beginning of Year |
| $ | 6.82 |
| $ | 6.90 |
| $ | 7.11 |
| $ | 7.24 |
| $ | 7.40 |
|
Income (Loss) from Investment Operations: |
|
|
|
|
|
|
|
|
|
|
|
|
|
|
|
|
Net investment income |
|
| 0.21 |
|
| 0.19 |
|
| 0.15 |
|
| 0.14 |
|
| 0.12 |
|
Net realized and unrealized gain (loss) on investments |
|
| 0.14 |
|
| (0.08 | ) |
| (0.20 | ) |
| (0.11 | ) |
| (0.14 | ) |
Total from Investment Operations |
|
| 0.35 |
|
| 0.11 |
|
| (0.05 | ) |
| 0.03 |
|
| (0.02 | ) |
Less Distributions: |
|
|
|
|
|
|
|
|
|
|
|
|
|
|
|
|
Dividends from net investment income |
|
| (0.21 | ) |
| (0.19 | ) |
| (0.15 | ) |
| (0.14 | ) |
| (0.12 | ) |
Dividends in excess of net investment income |
|
| — |
|
| — |
|
| (0.01 | ) |
| (0.02 | ) |
| (0.02 | ) |
Total Distributions |
|
| (0.21 | ) |
| (0.19 | ) |
| (0.16 | ) |
| (0.16 | ) |
| (0.14 | ) |
Net Asset Value, End of Year |
| $ | 6.96 |
| $ | 6.82 |
| $ | 6.90 |
| $ | 7.11 |
| $ | 7.24 |
|
|
|
|
|
|
|
|
|
|
|
|
|
|
|
|
|
|
Total Return |
|
| 5.15 | % |
| 1.70 | % |
| (0.74 | )% |
| 0.34 | % |
| (0.22 | )% |
|
|
|
|
|
|
|
|
|
|
|
|
|
|
|
|
|
Ratios/Supplemental Data: |
|
|
|
|
|
|
|
|
|
|
|
|
|
|
|
|
Net assets, end of year (000s omitted) |
| $ | 10,660 |
| $ | 10,091 |
| $ | 10,992 |
| $ | 11,556 |
| $ | 14,789 |
|
Ratio of expenses to average net assets |
|
| 2.28 | % |
| 2.17 | % |
| 2.26 | % |
| 2.06 | % |
| 2.03 | % |
Ratio of net investment income to average net assets |
|
| 3.04 | % |
| 2.80 | % |
| 2.14 | % |
| 1.91 | % |
| 1.62 | % |
Portfolio turnover rate |
|
| 204.04 | % |
| 347.09 | % |
| 286.60 | % |
| 133.02 | % |
| 250.49 | % |
| ||||||||||||||||
See footnotes on page 24. |
23
Financial Highlights
|
|
|
|
|
|
|
|
|
|
|
|
|
|
|
|
|
Class R |
|
|
|
|
|
|
|
|
|
|
|
|
|
|
|
|
|
|
|
|
|
|
|
|
|
|
|
|
|
|
|
|
|
|
| Year Ended December 31, |
| 4/30/03* |
| |||||||||||
|
|
|
| |||||||||||||
|
| 2007 |
| 2006 |
| 2005 |
| 2004 |
|
| ||||||
Per Share Data: |
|
|
|
|
|
|
|
|
|
|
|
|
|
|
|
|
Net Asset Value, Beginning of Period |
| $ | 6.81 |
| $ | 6.89 |
| $ | 7.10 |
| $ | 7.23 |
| $ | 7.36 |
|
Income (Loss) from Investment Operations: |
|
|
|
|
|
|
|
|
|
|
|
|
|
|
|
|
Net investment income |
|
| 0.24 |
|
| 0.22 |
|
| 0.18 |
|
| 0.17 |
|
| 0.10 |
|
Net realized and unrealized loss on investments |
|
| 0.14 |
|
| (0.08 | ) |
| (0.20 | ) |
| (0.11 | ) |
| (0.10 | ) |
Total from Investment Operations |
|
| 0.38 |
|
| 0.14 |
|
| (0.02 | ) |
| 0.06 |
|
| — |
|
Less Distributions |
|
|
|
|
|
|
|
|
|
|
|
|
|
|
|
|
Dividends from net investment income |
|
| (0.24 | ) |
| (0.22 | ) |
| (0.18 | ) |
| (0.17 | ) |
| (0.10 | ) |
Dividends in excess of net investment income |
|
| — |
|
| — |
|
| (0.01 | ) |
| (0.02 | ) |
| (0.03 | ) |
Total Distributions |
|
| (0.24 | ) |
| (0.22 | ) |
| (0.19 | ) |
| (0.19 | ) |
| (0.13 | ) |
Net Asset Value, End of Period |
| $ | 6.95 |
| $ | 6.81 |
| $ | 6.89 |
| $ | 7.10 |
| $ | 7.23 |
|
| ||||||||||||||||
Total Return |
|
| 5.63 | % |
| 2.21 | % |
| (0.25 | )% |
| 0.82 | % |
| (0.05 | )% |
| ||||||||||||||||
Ratios/Supplemental Data: |
|
|
|
|
|
|
|
|
|
|
|
|
|
|
|
|
Net assets, end of period (000s omitted) |
| $ | 1,905 |
| $ | 1,002 |
| $ | 671 |
| $ | 440 |
| $ | 2 |
|
Ratio of expenses to average net assets |
|
| 1.78 | % |
| 1.67 | % |
| 1.76 | % |
| 1.56 | % |
| 1.57 | %† |
Ratio of net investment income to average net assets |
|
| 3.54 | % |
| 3.30 | % |
| 2.64 | % |
| 2.41 | % |
| 2.01 | %† |
Portfolio turnover rate |
|
| 204.04 | % |
| 347.09 | % |
| 286.60 | % |
| 133.02 | % |
| 250.49 | %†† |
|
|
* | Commencement of offering of shares. |
† | Annualized. |
†† | Computed at the Fund level for the year ended December 31, 2003. |
See Notes to Financial Statements.
24
Report of Independent Registered
Public Accounting Firm
The Trustees and Shareholders,
Seligman U.S. Government Securities Fund of
Seligman High Income Fund Series:
We have audited the accompanying statement of assets and liabilities of Seligman U.S. Government Securities Fund, one of the funds constituting Seligman High Income Fund Series (the “Fund”), including the portfolio of investments, as of December 31, 2007, and the related statement of operations for the year then ended, the statements of changes in net assets for each of the two years in the period then ended, and the financial highlights for each of the periods presented. These financial statements and financial highlights are the responsibility of the Fund’s management. Our responsibility is to express an opinion on these financial statements and financial highlights based on our audits.
We conducted our audits in accordance with the standards of the Public Company Accounting Oversight Board (United States). Those standards require that we plan and perform the audit to obtain reasonable assurance about whether the financial statements and financial highlights are free of material misstatement. The Fund is not required to have, nor were we engaged to perform, an audit of its control over financial reporting. Our audits included consideration of internal control over financial reporting as a basis for designing audit procedures that are appropriate in the circumstances, but not for the purpose of expressing an opinion on the effectiveness of the Fund’s internal control over financial reporting. Accordingly, we express no such opinion. An audit also includes examining, on a test basis, evidence supporting the amounts and disclosures in the financial statements, assessing the accounting principles used and significant estimates made by management, as well as evaluating the overall financial statement presentation. Our procedures included confirmation of securities owned as of December 31, 2007, by correspondence with the custodian and brokers; where replies were not received from brokers, we performed other auditing procedures. We believe that our audits provide a reasonable basis for our opinion.
In our opinion, the financial statements and financial highlights referred to above present fairly, in all material respects, the financial position of Seligman U.S. Government Securities Fund of Seligman High Income Fund Series as of December 31, 2007, the results of its operations for the year then ended, the changes in its net assets for each of the two years in the period then ended, and the financial highlights for the respective stated periods, in conformity with accounting principles generally accepted in the United States of America.
DELOITTE & TOUCHE LLP
New York, New York
February 27, 2008
25
Matters Relating to the Trustees’
Consideration of the Continuance of the
Management Agreement
The trustees of Seligman High Income Fund Series, of which Seligman U.S. Government Securities Fund is a separate series, unanimously approved the continuance of the Management Agreement with the Manager in respect of the Fund at a meeting held on November 15, 2007.
Prior to approval of the continuance of the Management Agreement, the trustees requested and evaluated extensive materials from the Manager. They reviewed the proposed continuance of the Management Agreement with the Manager and with experienced counsel who advised on the legal standards for their consideration. The independent trustees also discussed the proposed continuance in a private session with counsel.
The trustees considered their knowledge of the nature and quality of the services provided by the Manager gained from their experience as directors or trustees of each fund in the Seligman Group of Funds, their overall confidence in the Manager’s integrity and competence gained from that experience, the Manager’s initiative in identifying and raising potential issues with the trustees and its responsiveness, frankness and attention to concerns raised by the trustees in the past, including the Manager’s willingness to consider and implement organizational and operational changes designed to improve investment results and the services provided to the Seligman Group of Funds. The trustees noted that the Board has six regular meetings each year, at each of which they receive presentations from the Manager on the investment results of the Fund and review extensive materials and information presented by the Manager.
The trustees also considered all other factors they believed relevant, including the specific matters discussed below. In their deliberations, the trustees did not identify any particular information that was all-important or controlling, and trustees attributed different weights to the various factors. The trustees determined that the selection of the Manager to manage the Fund, and the overall arrangements between the Fund and the Manager as provided in the Management Agreement, including the management fee, were fair and reasonable in light of the services performed, expenses incurred and such other matters as the trustees considered relevant. The material factors and conclusions that formed the basis for the trustees’ determination included the following:
Nature, Extent and Quality of Services Provided
The trustees considered the scope and quality of services provided by the Manager under the Management Agreement. The trustees considered the quality of the investment research capabilities of the Manager and the other resources it has dedicated to performing services for the Fund. They also noted the professional experience and qualifications of the Fund’s portfolio management team and other senior personnel of the Manager. The trustees had also considered the Manager’s selection of brokers and dealers for portfolio transactions and noted that they receive regular reports from the Manager concerning such selection. The quality of administrative and other services, including the Manager’s role in coordinating the activities of the Fund’s other service providers, also was considered. The trustees concluded that, overall, they were satisfied with the nature, extent and quality of services provided to the Fund under the Management Agreement.
On an ongoing basis, the Manager reports to the trustees on the status of various matters described in the Fund’s prospectus relating to market timing activity, allegations of excessive fees and related matters for certain funds in the Seligman Group of Funds. In connection with the continuance review, the Manager provides an update on those matters. After discussion with the Manager, the Manager’s counsel, the trustees’ special counsel and other counsel independent of the Manager, and consideration of the potential consequences of the various matters, the independent trustees concluded that they retained confidence in the integrity of the Manager and its ability to provide management services to the Fund.
Costs of Services Provided and Profitability
The trustees reviewed information on profitability of the Manager’s investment advisory and investment company activities and its financial condition based on historical information and estimates for the current year, as well as historical and estimated profitability data for the Fund. The trustees reviewed with the Manager’s Chief Financial
26
Matters Relating to the Trustees’
Consideration of the Continuance of the
Management Agreement
Officer, the assumptions and methods of allocation used by the Manager in preparing the profitability data. The trustees recognized that it is difficult to make comparisons of profitability from fund management contracts because comparative information is not generally publicly available and is affected by numerous factors. In reviewing profitability information, the trustees considered the effect of fall-out benefits on the Manager’s expenses, as well as the “revenue sharing” arrangements the Manager has entered into with certain entities that distribute shares of the Seligman Group of Funds. The trustees focused on profitability of the Manager’s relationships with the Fund before taxes and distribution expenses. The trustees concluded that they were satisfied that the Manager’s level of profitability from the relationship with the Fund was not excessive.
Fall-Out Benefits
The trustees also considered that a broker-dealer affiliate of the Manager receives 12b-1 fees from the Fund in respect of shares held in certain accounts, and that the Fund’s distributor (another affiliate of the Manager) retains a portion of the 12b-1 fees from the Fund and receives a portion of the sales charges on sales or redemptions of certain classes of shares. The trustees recognized that the Manager’s profitability would be somewhat lower without these benefits. The trustees noted that the Manager may derive reputational and other benefits from its association with the Fund.
Investment Results
The trustees receive and review detailed performance information on the Fund at each regular Board meeting during the year in addition to the information received for the meeting regarding the continuance of the Management Agreement. The trustees reviewed performance information for the Fund for the first nine months of 2007, the preceding seven calendar years and annualized one-, three-, five- and ten-year rolling periods ending September 30, 2007. The trustees also reviewed information about the portfolio turnover rate of the Fund compared to other investment companies with similar investment objectives.
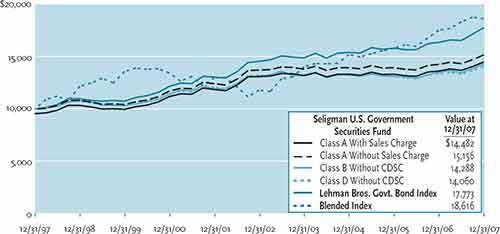
The trustees reviewed information comparing the Fund to the Lipper General U.S. Government Funds Average and the Lehman Brothers U.S. Government Bond Index, as well as performance relative to the other funds in the Lipper General U.S. Government Funds Average and to a group of competitor funds selected by the Manager. The trustees noted that the Fund has shown positive absolute performance over the periods presented, other than 2005, and that while from time to time exceeding certain benchmarks, the Fund’s results otherwise trailed its benchmarks in such periods. The Manager reminded the board that a new portfolio manager had been hired in 2006. Taking these and other factors into consideration, the trustees concluded that they were satisfied that the Manager was addressing their concerns and retained confidence in the Manager’s capabilities to manage the Fund.
Management Fees and Other Expenses
The trustees considered the management fee rate paid by the Fund to the Manager. The trustees recognized that it is difficult to make comparisons of management fees because there are variations in the services that are included in the fees paid by other funds. The Manager also manages accounts for institutional clients with investment objectives similar to those of the Fund. The fee rates payable by the Manager’s institutional clients are lower than the rates paid by the Fund. The Manager reviewed with the directors the significantly greater scope of the services it provides the Fund relative to institutional clients. The Manager also noted that since open-end funds, such as the Fund, are constantly issuing and redeeming shares, they are more difficult to manage than an institutional account, where the assets are relatively stable. The directors acknowledged and understood these considerations and accordingly gave appropriate weight to these fee comparisons.
The trustees also compared the Fund’s management fee rate to the rate paid by a subset of funds, with assets more clearly comparable to those of the Fund, in its Lipper category (the “peer group”). The information showed that the Fund’s current effective management fee rate was lower than the average and the median for the funds in the peer group.
27
Matters Relating to the Trustees’
Consideration of the Continuance of the
Management Agreement
The trustees also considered the total expense ratio of the Fund in comparison to the fees and expenses of funds within its peer group. In considering the expense ratio of the Fund, the trustees noted that it has elected to have shareholder services provided at cost by Seligman Data Corp. (“SDC”), a company owned by certain of the investment companies in the Seligman Group of Funds that provides shareholder services to the Fund and other investment companies in the Seligman Group of Funds at cost. SDC provides services exclusively to the Seligman Group of Funds, and the trustees believed that the arrangement with SDC has provided the Fund and its shareholders with a consistently high level of service.
The trustees noted that the Fund’s expense ratio was the highest in the peer group and was considerably higher than the median and the average for its peer group. The Manager noted that costs were somewhat high for the Fund as a result of the Fund’s small size relative to the funds in its peer group and a large number of small shareholder accounts due in part to the fact that the Fund is a core fund for many retirement plans. The trustees concluded that the Fund’s expense ratio was acceptable in light of the high quality of service that the Fund receives and the other factors considered.
Economies of Scale
The trustees noted that the management fee schedule for the Fund does not contain breakpoints that would reduce the fee rate on assets above specified levels. The trustees considered the Fund’s current asset levels and the Manager’s expectations for growth in asset levels during the next year. The trustees recognized that there is no direct relationship between the economies of scale realized by funds and those realized by their investment adviser as assets increase. The trustees do not believe that there is a uniform methodology for establishing breakpoints that give effect to fund specific services provided by the Manager. The trustees also observed that in the investment company industry as a whole, as well as among funds similar to the Fund, there is no uniformity or pattern in the fees and asset levels at which breakpoints (if any) apply, and that the advisory agreements for many competitor funds do not have breakpoints at all. Having taken these factors into account, the trustees concluded that the absence of breakpoints in the Fund’s fee rate schedule was acceptable under the Fund’s circumstances.
28
Information pertaining to the Trustees and Officers of Seligman U.S. Government Securities Fund is set forth below.
Independent Trustees
|
|
|
Name, (Age), Position(s) |
| Principal Occupation(s) During Past Five Years, Directorships |
Maureen Fonseca (52)3 |
| Head of School, The Masters School (educational training); Director or Trustee of each of the investment companies of the Seligman Group of Funds† (with the exception of Seligman New Technologies Fund, Inc. and Seligman New Technologies Fund II, Inc.); Trustee, New York State Association of Independent Schools and Greens Farms Academy (educational training); and Commissioner, Middle States Association (educational training). |
John R. Galvin (78)1,3 |
| Dean Emeritus, Fletcher School of Law and Diplomacy at Tufts University; Director or Trustee of each of the investment companies of the Seligman Group of Funds†; and Chairman Emeritus, American Council on Germany. Formerly, Director, Raytheon Co. (defense and commercial electronics), Governor of the Center for Creative Leadership, and Trustee, Institute for Defense Analyses. From February 1995 until June 1997, Director, USLIFE Corporation (life insurance). From June 1987 to June 1992, Supreme Allied Commander, NATO, and Commander-in-Chief, United States European Command. |
John F. Maher (64)1,3 |
| Retired President and Chief Executive Officer, and former Director, Great Western Financial Corporation (bank holding company) and its principal subsidiary, Great Western Bank (a federal savings bank); and Director or Trustee of each of the investment companies of the Seligman Group of Funds† (with the exception of Seligman New Technologies Fund, Inc. and Seligman New Technologies Fund II, Inc.). From 1989 to 1999, Director, Baker Hughes (energy products and services). |
Frank A. McPherson (74)2,3 |
| Retired Chairman of the Board and Chief Executive Officer of Kerr-McGee Corporation (diversified energy and chemical company); Director or Trustee of each of the investment companies of the Seligman Group of Funds†; and Director, DCP Midstream GP, LLP (natural gas processing and transporting), Integris Health (owner of various hospitals), Oklahoma Medical Research Foundation, Oklahoma Foundation for Excellence in Education, National Cowboy and Western Heritage Museum, and Oklahoma City Museum of Art. Formerly, Director, ConocoPhillips (integrated international oil corporation), Kimberly-Clark Corporation (consumer products), Oklahoma Chapter of the Nature Conservancy, Boys and Girls Clubs of Oklahoma, Oklahoma City Public Schools Foundation, Oklahoma City Chamber of Commerce and BOK Financial (bank holding company). From 1990 until 1994, Director, the Federal Reserve System’s Kansas City Reserve Bank. |
29
Trustees and Officers
Independent Trustees (continued)
|
|
|
Name, (Age), Position(s) |
| Principal Occupation(s) During Past Five Years, Directorships |
Betsy S. Michel (65)2,3 |
| Attorney; Director or Trustee of each of the investment companies of the Seligman Group of Funds†; and Trustee, The Geraldine R. Dodge Foundation (charitable foundation), and Drew University (Madison, NJ). Formerly, Chairman of the Board of Trustees of St. George’s School (Newport, RI); and Trustee, World Learning, Inc. (international educational training), and Council of New Jersey Grantmakers. |
Leroy C. Richie (66)1,3 |
| Counsel, Lewis & Munday, P.C. (law firm); Director or Trustee of each of the investment companies of the Seligman Group of Funds†; Director, Vibration Control Technologies, LLC (auto vibration technology) and OGE Energy Corp.; Lead Outside Director, Digital Ally Inc. (digital imaging) and Infinity, Inc. (oil and gas exploration and production); Director and Chairman, Highland Park Michigan Economic Development Corp.; and Chairman, Detroit Public Schools Foundation. Formerly, Chairman and Chief Executive Officer, Q Standards Worldwide, Inc. (library of technical standards); Director, Kerr-McGee Corporation (diversified energy and chemical company); Trustee, New York University Law Center Foundation; and Vice Chairman, Detroit Medical Center and Detroit Economic Growth Corp. From 1990 until 1997, Vice President and General Counsel, Automotive Legal Affairs, Chrysler Corporation. |
Robert L. Shafer (75)2,3 |
| Ambassador and Permanent Observer of the Sovereign Military Order of Malta to the United Nations; and Director or Trustee of each of the investment companies of the Seligman Group of Funds†. From May 1987 until June 1997, Director, USLIFE Corporation (life insurance) and from December 1973 until January 1996, Vice President, Pfizer Inc. (pharmaceuticals). |
James N. Whitson (72)1,3 |
| Retired Executive Vice President and Chief Operating Officer, Sammons Enterprises, Inc. (a diversified holding company); Director or Trustee of each of the investment companies of the Seligman Group of Funds†; and Director, CommScope, Inc. (manufacturer of coaxial cable). Formerly, Director and Consultant, Sammons Enterprises, Inc. and Director, C-SPAN (cable television networks). |
30
Trustees and Officers
Interested Trustees and Principal Officers
|
|
|
Name, (Age), Position(s) |
| Principal Occupation(s) During Past Five Years, Directorships |
William C. Morris (69)* |
| Chairman and Director, J. & W. Seligman & Co. Incorporated; Chairman of the Board and Director or Trustee of each of the investment companies of the Seligman Group of Funds†; Chairman and Director, Seligman Advisors, Inc., Seligman Services, Inc. and Carbo Ceramics Inc. (manufacturer of ceramic proppants for oil and gas industry); Director, Seligman Data Corp.; and President and Chief Executive Officer of The Metropolitan Opera Association. Formerly, Director, Kerr-McGee Corporation (diversified energy and chemical company) and Chief Executive Officer of each of the investment companies of the Seligman Group of Funds. |
Brian T. Zino (55)* |
| Director and President, J. & W. Seligman & Co. Incorporated; President, Chief Executive Officer, and Director or Trustee of each of the investment companies of the Seligman Group of Funds†; Director, Seligman Advisors, Inc. and Seligman Services, Inc.; Chairman, Seligman Data Corp.; and Member of the Board of Governors of the Investment Company Institute. Formerly, Director, ICI Mutual Insurance Company. |
Eleanor T.M. Hoagland (56) |
| Managing Director, J. & W. Seligman & Co. Incorporated; Vice President and Chief Compliance Officer of each of the investment companies of the Seligman Group of Funds†. |
Francis L. Mustaro (57) |
| Managing Director, J. & W. Seligman & Co. Incorporated; Vice President and Portfolio Manager of Seligman Cash Management Fund, Inc.; Vice President and Portfolio Manager of Seligman Core Fixed Income Fund, Inc.; Vice President and Co-Portfolio Manager of Seligman Income and Growth Fund, Inc.; Vice President, Seligman Portfolios, Inc. and Portfolio Manager of its Cash Management Portfolio and Investment Grade Fixed Income Portfolio. Formerly, Managing Director and Senior Portfolio Manager, Core Fixed Income Group, Citigroup Asset Management. |
Thomas G. Rose (50) |
| Managing Director, Chief Financial Officer, and Treasurer, J. & W. Seligman & Co. Incorporated; Senior Vice President, Finance, Seligman Advisors, Inc. and Seligman Data Corp.; Vice President of each of the investment companies of the Seligman Group of Funds†, Seligman Services, Inc. and Seligman International, Inc. |
31
Trustees and Officers
Interested Trustees and Principal Officers (continued)
|
|
|
Name, (Age), Position(s) |
| Principal Occupation(s) During Past Five Years, Directorships |
Lawrence P. Vogel (51) |
| Senior Vice President and Treasurer, Investment Companies, J. & W. Seligman & Co. Incorporated; Vice President and Treasurer of each of the investment companies of the Seligman Group of Funds† and Treasurer, Seligman Data Corp. |
Frank J. Nasta (43) |
| Director, Managing Director, General Counsel and Corporate Secretary, J. & W. Seligman & Co. Incorporated; Secretary of each of the investment companies of the Seligman Group of Funds†; Director and Corporate Secretary, Seligman Advisors, Inc. and Seligman Services, Inc.; and Corporate Secretary, Seligman International, Inc. and Seligman Data Corp. |
The Fund’s Statement of Additional Information (SAI) includes additional information about Fund trustees and is available, without charge, upon request. You may call toll-free (800) 221-2450 in the US or call collect (212) 682-7600 outside the US to request a copy of the SAI, to request other information about the Fund, or to make shareholder inquiries.
|
|
ø | The address for each of the trustees and officers is 100 Park Avenue, 8th Floor, New York, NY 10017. Each trustee serves for an indefinite term, until the election and qualification of a successor or until his or her earlier death, resignation, or removal. Each officer is elected annually by the Board of Trustees. |
† | The Seligman Group of Funds consists of 24 registered investment companies. |
* | Messrs. Morris and Zino are considered “interested persons” of the Fund, as defined in the Investment Company Act of 1940, as amended, by virtue of their positions with J. & W. Seligman & Co. Incorporated and its affiliates. |
|
|
Member: | 1 Audit Committee |
| 2 Trustee Nominating Committee |
| 3 Board Operations Committee |
32
Quarterly Schedule of Investments
A complete schedule of portfolio holdings owned by the Fund will be filed with the SEC for the first and third quarter of each fiscal year on Form N-Q, and will be available to shareholders (i) without charge, upon request, by calling toll-free (800) 221-2450 in the US or collect (212) 682-7600 outside the US or (ii) on the SEC’s website at www.sec.gov.1 In addition, the Form N-Q may be reviewed and copied at the SEC’s Public Reference Room in Washington, D.C. Information on the operation of the Public Reference Room may be obtained by calling (800) SEC-0330. Certain of the information contained in the Fund’s Form N-Q is also made available to shareholders on Seligman’s website at www.seligman.com.1
Proxy Voting
A description of the policies and procedures used by the Fund to determine how to vote proxies relating to portfolio securities as well as information regarding how the Fund voted proxies relating to portfolio securities during the 12-month period ended December 31 of each year will be available (i) without charge, upon request, by calling toll-free (800) 221-2450 in the US or collect (212) 682-7600 outside the US and (ii) on the SEC’s website at www.sec.gov.1 Information for each new 12-month period ending June 30 will be available no later than August 31 of that year.
|
|
1 | These website references are inactive textual references and information contained in or otherwise accessible through these websites does not form a part of this report or the Fund’s prospectuses or statement of additional information. |
33
ITEM 2. | CODE OF ETHICS. | |||||
ITEM 3. | AUDIT COMMITTEE FINANCIAL EXPERT. The registrant’s board of directors has determined that Mr. James N. Whitson, a member of its audit committee, is an audit committee financial expert. Mr. Whitson is “independent” as such term is defined in Form N-CSR. | |||||
ITEM 4. | PRINCIPAL ACCOUNTANT FEES AND SERVICES. | |||||
2007 | 2006 | |||||
Audit Fees | $86,938 | $81,360 | ||||
Audit-Related Fees | – | – | ||||
Tax Fees | 5,300 | 5,000 | ||||
All Other Fees | 2,334 | – | ||||
Audit fees include amounts related to the audit of the registrant’s annual financial statements and services normally provided by the accountant in connection with statutory and regulatory filings. Tax fees include amounts related to tax compliance, tax planning, and tax advice. Other fees include the registrant's pro-rata share of amounts for services related to the assessment of procedures for compliance with anti-money laundering regulations by the registrant and certain other associated investment companies. Aggregate fees billed by the registrant’s principal accountant for the last two fiscal years for non-audit services provided to the registrant’s investment adviser (not including a sub-adviser whose role is primarily portfolio management and is subcontracted or overseen by another investment adviser) and any entity controlling, controlled by, or under common control with the investment adviser that provides ongoing services to the registered investment company, where the engagement relates directly to the operations and financial reporting of the registrant, were as follows: | ||||||
2007 | 2006 | |||||
Audit-Related Fees | $141,440 | $141,710 | ||||
Tax Fees | 9,000 | 11,955 | ||||
All Other Fees | 15,000 | – | ||||
Audit-related fees include amounts for (i) attestation services for the registrant’s shareholder service agent and (ii) testing of the registrant’s shareholder service agent’s conversion to a new record-keeping system and (iii) performance of certain agreed-upon procedures relating to certain services performed by the registrant’s distributor. Tax fees include amounts related to tax compliance, tax planning, and tax |
advice for and an evaluation of certain tax reporting procedures of the registrant’s shareholder service agent. Other fees include the amounts for services related to the assessment of procedures for compliance with anti-money laundering regulations by certain of the registrant's affiliates. (e) (1) The Audit Committee is required to preapprove audit and non-audit services performed for the registrant by the principal accountant in order to assure that the provision of such services does not impair the principal accountant’s independence. The Audit Committee also is required to preapprove certain non-audit services performed by the registrant’s principal accountant for the registrant’s investment adviser (not including any sub-adviser whose role is primarily portfolio management and is subcontracted with or overseen by another investment adviser) and certain of the adviser’s affiliates that provide services directly related to the operations and financial reporting of the registrant. Unless a type of service to be provided by the principal accountant has received preapproval, it will require specific preapproval by the Audit Committee. The Audit Committee may delegate preapproval authority to one or more of its members. The member or members to whom such authority is delegated shall report any preapproval decisions to the Audit Committee at its next scheduled meeting. Notwithstanding the foregoing, under certain circumstances, preapproval of non-audit services of a de minimis amount is not required. (2) No services included in (b) – (d) above were approved pursuant to the waiver provisions of paragraphs (c)(7)(i)(C) or (c)(7)(ii) of Rule 2-01 of Regulation S-X. (f) Not applicable. (g) The aggregate fees billed for the most recent fiscal year and the preceding fiscal year by the registrant’s principal accountant for non-audit services rendered to the registrant, its investment adviser (not including any sub-adviser whose role is primarily portfolio management and is subcontracted with or overseen by another investment adviser), and any entity controlling, controlled by, or under common control with the investment adviser that provides ongoing services to the registrant were $173,074 and $158,665, respectively. (h) All non-audit services rendered in (g) above were pre-approved by the registrant’s audit committee. Accordingly, the audit committee considered whether these services were compatible with maintaining the principal accountant’s independence. | |
ITEM 5. | AUDIT COMMITTEE OF LISTED REGISTRANTS. |
Not applicable. |
ITEM 6. | SCHEDULE OF INVESTMENTS. | |
ITEM 7. | DISCLOSURE OF PROXY VOTING POLICIES AND PROCEDURES FOR | |
ITEM 8. | PORTFOLIO MANAGERS OF CLOSED-END MANAGEMENT INVESTMENT COMPANIES. | |
ITEM 9. | PURCHASES OF EQUITY SECURITIES BY CLOSED-END MANAGEMENT INVESTMENT COMPANY AND AFFILIATED PURCHASERS. Not applicable. | |
ITEM 10. | SUBMISSION OF MATTERS TO A VOTE OF SECURITY HOLDERS. | |
ITEM 11. | CONTROLS AND PROCEDURES. (b) The registrant’s principal executive officer and principal financial officer are aware of no changes in the registrant’s internal control over financial reporting that occurred during the second fiscal quarter of the period covered by this report that has materially affected, or is reasonably likely to materially affect, the registrant’s internal control over financial reporting. | |
ITEM 12. | EXHIBITS. | |
(a)(1) | Code of Ethics for Principal Executive and Principal Financial Officers. | |
(a)(2) | Certifications of principal executive officer and principal financial officer as required by Rule 30a-2(a) under the Investment Company Act of 1940. | |
(a)(3) | Not applicable. | |
(b) | Certifications of chief executive officer and chief financial officer as required by Rule 30a-2(b) under the Investment Company Act of 1940. |
SIGNATURES
Pursuant to the requirements of the Securities Exchange Act of 1934 and the Investment Company Act of 1940, the registrant has duly caused this report to be signed on its behalf by the undersigned, thereunto duly authorized.
SELIGMAN HIGH INCOME FUND SERIES
By: | ||
/S/ BRIAN T. ZINO | ||
Brian T. Zino | ||
President and Chief Executive Officer | ||
Date: | March 7, 2008 |
Pursuant to the requirements of the Securities Exchange Act of 1934 and the Investment Company Act of 1940, this report has been signed below by the following persons on behalf of the registrant and in the capacities and on the dates indicated.
By: | ||
/S/ BRIAN T. ZINO | ||
Brian T. Zino | ||
President and Chief Executive Officer | ||
Date: | March 7, 2008 | |
By: | ||
/S/ LAWRENCE P.VOGEL | ||
Lawrence P. Vogel | ||
Vice President, Treasurer and Chief Financial Officer | ||
Date: | March 7, 2008 |
SELIGMAN HIGH INCOME FUND SERIES
EXHIBIT INDEX
(a)(1) | Code of Ethics for Principal Executive and Principal Financial Officers. |
(a)(2) | Certifications of principal executive officer and principal financial officer as required by Rule 30a-2(a) under the Investment Company Act of 1940. |
(b) | Certification of chief executive officer and chief financial officer as required by Rule 30a-2(b) of the Investment Company Act of 1940. |