UNITED STATES
SECURITIES AND EXCHANGE COMMISSION
WASHINGTON, D.C. 20549
FORM N-CSR
CERTIFIED SHAREHOLDER REPORT OF REGISTERED MANAGEMENT
INVESTMENT COMPANIES
Investment Company Act file number 811-4108
Oppenheimer Variable Account Funds
(Exact name of registrant as specified in charter)
6803 South Tucson Way, Centennial, Colorado 80112-3924
(Address of principal executive offices) (Zip code)
Arthur S. Gabinet
OFI Global Asset Management, Inc.
Two World Financial Center, New York, New York 10281-1008
(Name and address of agent for service)
Registrant’s telephone number, including area code: (303) 768-3200
Date of fiscal year end: December 31
Date of reporting period: 12/31/2012
| Item 1. | Reports to Stockholders. |
| | | | |
| December 31, 2012 | | |
| | | Oppenheimer Small- & Mid-Cap Growth Fund/VA A Series of Oppenheimer Variable Account Funds | | Annual Report |
| | |
| | ANNUAL REPORT Listing of Top Holdings Fund Performance Discussion Financial Statements | | |

| | |
OPPENHEIMER SMALL- & MID-CAP GROWTH FUND/VA |
Portfolio Manager: Ronald J. Zibelli, Jr., CFA
Average Annual Total Returns
For the Periods Ended 12/31/12
| | | | | | | | | | | | |
| | | 1-Year | | | 5-Year | | | 10-Year | |
Non-Service Shares | | | 16.45 | % | | | 0.27% | | | | 6.49% | |
Service Shares | | | 16.17 | | | | 0.01 | | | | 6.22 | |
The performance data quoted represents past performance, which does not guarantee future results. The investment return and principal value of an investment in the Fund will fluctuate so that an investor’s shares, when redeemed, may be worth more or less than their original cost. Current performance may be lower or higher than the performance quoted. For performance data current to the most recent month end, call us at 1.800.988.8287. The Fund’s total returns should not be expected to be the same as the returns of other funds, whether or not both funds have the same portfolio managers and/or similar names. The Fund’s total returns include changes in share price and reinvested distributions but do not include the charges associated with the separate account products that offer this Fund. Such performance would have been lower if such charges were taken into account.
| | | | |
Top Ten Common Stock Holdings | | | | |
| |
Ulta Salon, Cosmetics & Fragrance, Inc. | | | 2.5 | % |
Equinix, Inc. | | | 2.1 | |
Alexion Pharmaceuticals, Inc. | | | 2.0 | |
Whole Foods Market, Inc. | | | 2.0 | |
SBA Communications Corp., Cl. A | | | 1.9 | |
TransDigm Group, Inc. | | | 1.9 | |
AMETEK, Inc. | | | 1.8 | |
Affiliated Managers Group, Inc. | | | 1.8 | |
Catamaran Corp. | | | 1.8 | |
Kansas City Southern | | | 1.7 | |
Portfolio holdings and allocations are subject to change. Percentages are as of December 31, 2012, and are based on net assets.
Sector Allocation
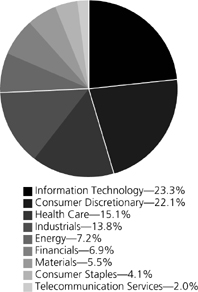
Portfolio holdings and allocations are subject to change. Percentages are as of December 31, 2012, and are based on the total market value of common stocks.
2 OPPENHEIMER SMALL- & MID-CAP GROWTH FUND/VA
| | |
FUND PERFORMANCE DISCUSSION |
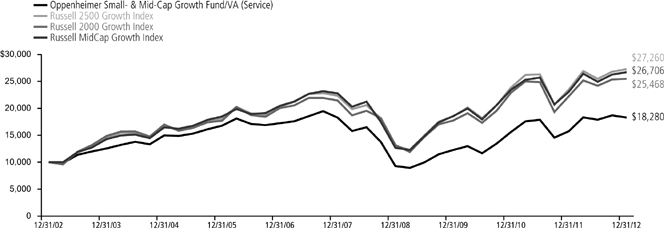
The Fund’s Non-Service shares produced a return of 16.45% during the one-year period ended December 31, 2012. On a relative basis, the Fund outperformed the Russell 2500 Growth Index (the “Index”), which returned 16.13% over the same period.
The Fund also outperformed the Russell 2000 Growth Index and the Russell MidCap Growth Index, which returned 14.59% and 15.81%, respectively, for the one-year period ended December 31, 2012, as well as its peers in the Lipper VA Mid-Cap Growth Funds Index, which returned 13.62% for the same period.
Economic and Market Environment
Domestic equities generally produced positive returns this period. The period began during a time of improved market sentiment in which the United States managed to avoid a return to recession and European policymakers appeared to take steps to address the region’s sovereign debt and banking sector crises. Renewed investor optimism helped produce gains in the U.S. equity market as well as across a number of international equity markets over the first three months of 2012. The rebound across equities gained momentum after the European Central Bank (the “ECB”) took steps to enhance liquidity for troubled banks and reduce rates on newly issued sovereign debt securities.
The second quarter was more volatile for the equity markets. In the U.S., slower than expected first quarter growth contributed to a sell-off in the stock market. Consumer confidence dropped as U.S. unemployment figures ticked slightly upwards after showing signs of improvement from the recession highs. The fear of contagion from the worsening European sovereign debt crisis and a recession across much of Europe drove negative market sentiment, particularly over May and June.
In the second half of the period, the global equity markets resumed an upward trend as certain events appeared to help calm market jitters. Investors had been deeply concerned about the possibility of Greece pulling out of the euro and its ramifications for the future of the Eurozone and its common currency. The results of elections in Greece and continued efforts by European policymakers to stabilize the situation in the region made far less likely the imminent fracturing of the Eurozone and the serious consequences that might have for the euro.
The markets responded positively to central banks’ continued efforts to stimulate economic growth. The ECB committed to potentially unlimited bond purchases to ease financing pressure on countries like Spain and Italy. Under the plan, these and other members of the European Union (excluding Greece) will be able to maintain access to funding at sustainable interest rates, on the condition that they continue with strict reform programs.
In the U.S., the Federal Reserve (the “Fed”) introduced a third round of quantitative easing (“QE3”), under which it announced plans to purchase Treasury and mortgage-backed bonds on a monthly basis until the labor market shows signs of substantial improvement. While these actions and a last minute temporary resolution of the so-called fiscal cliff enacted by the U.S. Congress largely prevented the markets from trading in negative territory in the final quarter, a number of concerns throughout the globe remained and presented the possibility for future market volatility.
Top Individual Contributors
The Fund outperformed the Index during the period due to positive stock selection in the information technology, consumer staples and health care sectors. An underweight position relative to the Index in the energy sector, particularly in the first half of 2012, also helped Fund performance. These positive results were partly offset by negative stock selection in the industrials and consumer discretionary sectors. The top performing stocks for the Fund this period were Equinix, Inc., Ulta Salon, Cosmetics & Fragrance, Inc., TransDigm Group, Inc., Alexion Pharmaceuticals, Inc. and Catamaran Corp. All of these holdings were among the top ten holdings of the Fund at period end. Equinix is an information technology company that provides a global platform of data centers and internet exchanges. The company benefited from higher demand for its data center services and also announced plans to expand in Brazil with the opening of a new data center. Equinix also announced plans to convert to a real estate investment trust (REIT) around 2015. Ulta Salon, one of our consumer discretionary positions, exceeded financial projections as it successfully implemented its plan to gain market share in the huge retail segment devoted to cosmetics and fragrances.
TransDigm, an industrials sector company, is a global designer, producer and supplier of aircraft components for use on commercial and military-aircraft. The company experienced more than 30% growth in revenue and earnings during the period driven partly by acquisitions. Alexion Pharmaceuticals and Catamaran were leading performers among our health care positions. Alexion is a global biopharmaceutical company that focuses on developing treatments for ultra-rare diseases. The company’s lead drug Soliris treats patients with rare, life-threatening blood disorders. In addition to growing quickly in its original indication, Soliris was approved for patients in a second indication. Catamaran Corp., a pharmacy benefit management (PBM) service provider, completed the acquisition of a large competitor, which we believe enhances its prospects for profitability and growth. Catamaran also reported strong quarterly financial results throughout the period.
Top Individual Detractors
While detractors from performance were limited this period, the most significant were Timken Co., HMS Holdings Corp. and Chipotle Mexican Grill, Inc. Timken Co. is an industrials sector company that manufactures bearings, high-performance steels and related components. The tumultuous economic environment in tandem with weak demand, particularly in Asia and Europe, weighed on the company’s stock. HMS Holdings provides specialized services to health care providers and payers. The company announced disappointing third quarter results and lowered guidance. Chipotle Mexican Grill, a consumer discretionary holding, is an operator of quick service Mexican restaurants that reported a slowdown in sales in the second quarter. We exited our positions in these three stocks during the period.
OPPENHEIMER SMALL- & MID-CAP GROWTH FUND/VA 3
Strategy & Outlook
Looking forward, we expect a challenging macroeconomic environment characterized by modest GDP growth, very low interest rates and anemic corporate profit growth. In addition, we believe the stock market will be influenced by uncertainty involving fiscal matters, including the debt ceiling in the U.S., difficult economic and sovereign debt challenges in Europe as well as questions about the growth prospects of China.
Despite these challenges, we are encouraged that the Small and Mid-Cap Growth segments of the market offer in our view reasonable valuations, above average growth prospects, relatively low exposure to the problems of Europe and possible mergers and acquisitions interest from large companies seeking new avenues of growth. We will continue to focus our efforts on seeking high-quality, faster growing small and mid-sized companies that we believe have the potential to generate positive returns.
Investors should consider the Fund’s investment objective, risks, charges and expenses carefully before investing. The Fund’s prospectus and summary prospectus contain this and other information about the Fund, and may be obtained by asking your financial advisor or calling us at 1.800.988.8287. Read prospectuses and summary prospectuses carefully before investing.
Total returns include changes in share price and reinvestment of dividends and capital gains distributions in a hypothetical investment for the periods shown.
The Fund’s investment strategy and focus can change over time. The mention of specific fund holdings does not constitute a recommendation by OppenheimerFunds, Inc. or its affiliates.
Shares of Oppenheimer funds are not deposits or obligations of any bank, are not guaranteed by any bank, are not insured by the FDIC or any other agency, and involve investment risks, including the possible loss of the principal amount invested.
Comparing the Fund’s Performance to the Market. The graphs that follow show the performance of a hypothetical $10,000 investment in each share class of the Fund held until December 31, 2012. Performance is measured over a ten-fiscal-year period for both Classes. Performance information does not reflect charges that apply to separate accounts investing in the Fund. If these charges were taken into account, performance would be lower. The graphs assume that all dividends and capital gains distributions were reinvested in additional shares. Past performance cannot guarantee future results.
The Fund’s performance is compared to the performance of the Russell 2500 Growth Index, the Russell 2000 Growth Index and the Russell MidCap Growth Index. The Russell 2500 Growth Index is an index of U.S. small-cap and mid-cap growth stocks. The Russell 2000 Growth Index measures the performance of the small-cap growth segment of the U.S. equity universe. It includes those Russell 2000 companies with higher price-to-book ratios and higher forecasted growth values. The Russell MidCap Growth Index is an index that measures the performance of those Russell mid-cap companies with higher price-to-book ratios and higher forecasted growth values. The indices are unmanaged and cannot be purchased directly by investors. Index performance is shown for illustrative purposes only and does not predict or depict the performance of the Fund. While index comparisons may be useful to provide a benchmark for the Fund’s performance, it must be noted that the Fund’s investments are not limited to the investments comprising the indices.
4 OPPENHEIMER SMALL- & MID-CAP GROWTH FUND/VA
Non-Service Shares
COMPARISON OF CHANGE IN VALUE OF $10,000 HYPOTHETICAL INVESTMENTS IN:

Average Annual Total Returns of Non-Service Shares of the Fund at 12/31/12
1-Year 16.45% 5-Year 0.27% 10-Year 6.49%
Service Shares
COMPARISON OF CHANGE IN VALUE OF $10,000 HYPOTHETICAL INVESTMENTS IN:
Average Annual Total Returns of Service Shares of the Fund at 12/31/12
1-Year 16.17% 5-Year 0.01% 10-Year 6.22%
The performance data quoted represents past performance, which does not guarantee future results. The investment return and principal value of an investment in the Fund will fluctuate so that an investor’s shares, when redeemed, may be worth more or less than their original cost. Current performance may be lower or higher than the performance quoted. For performance data current to the most recent month end, call us at 1.800.988.8287. The Fund’s total returns should not be expected to be the same as the returns of other funds, whether or not both funds have the same portfolio managers and/or similar names. The Fund’s total returns include changes in share price and reinvested distributions but do not include the charges associated with the separate account products that offer this Fund. Such performance would have been lower if such charges were taken into account.
OPPENHEIMER SMALL- & MID-CAP GROWTH FUND/VA 5
Fund Expenses. As a shareholder of the Fund, you incur two types of costs: (1) transaction costs and (2) ongoing costs, including management fees; distribution and service fees; and other Fund expenses. These examples are intended to help you understand your ongoing costs (in dollars) of investing in the Fund and to compare these costs with the ongoing costs of investing in other mutual funds.
The examples are based on an investment of $1,000.00 invested at the beginning of the period and held for the entire 6-month period ended December 31, 2012.
Actual Expenses. The first section of the table provides information about actual account values and actual expenses. You may use the information in this section for the class of shares you hold, together with the amount you invested, to estimate the expense that you paid over the period. Simply divide your account value by $1,000.00 (for example, an $8,600.00 account value divided by $1,000.00 = 8.60), then multiply the result by the number in the first section under the heading entitled “Expenses Paid During Period” to estimate the expenses you paid on your account during this period.
Hypothetical Example for Comparison Purposes.
The second section of the table provides information about hypothetical account values and hypothetical expenses based on the Fund’s actual expense ratio for each class of shares, and an assumed rate of return of 5% per year for each class before expenses, which is not the actual return. The hypothetical account values and expenses may not be used to estimate the actual ending account balance or expenses you paid for the period. You may use this information to compare the ongoing costs of investing in the Fund and other funds. To do so, compare this 5% hypothetical example for the class of shares you hold with the 5% hypothetical examples that appear in the shareholder reports of the other funds.
Please note that the expenses shown in the table are meant to highlight your ongoing costs only and do not reflect any charges associated with the separate accounts that offer this Fund. Therefore, the “hypothetical” lines of the table are useful in comparing ongoing costs only, and will not help you determine the relative total costs of owning different funds. In addition, if these separate account charges were included your costs would have been higher.
| | | | | | | | | | | | | | |
| Actual | | Beginning Account Value
July 1, 2012 | | | Ending Account Value
December 31, 2012 | | | Expenses
Paid During
6 Months Ended
December 31, 2012 | | | |
Non-Service shares | | $ | 1,000.00 | | | $ | 1,023.60 | | | $ | 4.08 | | | |
Service shares | | | 1,000.00 | | | | 1,022.50 | | | | 5.35 | | | |
| | | | |
Hypothetical | | | | | | | | | | | | | | |
(5% return before expenses) | | | | | | | | | | | | | | |
Non-Service shares | | | 1,000.00 | | | | 1,021.11 | | | | 4.07 | | | |
Service shares | | | 1,000.00 | | | | 1,019.86 | | | | 5.35 | | | |
Expenses are equal to the Fund’s annualized expense ratio for that class, multiplied by the average account value over the period, multiplied by 184/366 (to reflect the one-half year period). Those annualized expense ratios, excluding indirect expenses from affiliated funds, based on the 6-month period ended December 31, 2012 are as follows:
| | | | |
| Class | | Expense Ratios | | |
Class Non-Service | | 0.80% | | |
Class Service | | 1.05 | | |
The expense ratios reflect voluntary waivers and/or reimbursements of expenses by the Fund’s Manager. Some of these undertakings may be modified or terminated at any time, as indicated in the Fund’s prospectus. The “Financial Highlights” tables in the Fund’s financial statements, included in this report, also show the gross expense ratios, without such waivers or reimbursements and reduction to custodian expenses, if applicable.
6 OPPENHEIMER SMALL- & MID-CAP GROWTH FUND/VA
| | |
STATEMENT OF INVESTMENTS December 31, 2012 |
| | | | | | | | |
| | | Shares | | | Value | |
Common Stocks—97.3% | | | | | | | | |
Consumer Discretionary—21.2% | | | | | | | | |
Distributors—1.4% | | | | | | | | |
LKQ Corp.1 | | | 400,000 | | | $ | 8,440,000 | |
Hotels, Restaurants & Leisure—3.0% | | | | | | | | |
Dunkin’ Brands Group, Inc. | | | 150,900 | | | | 5,006,862 | |
Panera Bread Co., Cl. A1 | | | 62,140 | | | | 9,869,696 | |
Ryman Hospitality Properties | | | 81,349 | | | | 3,128,683 | |
| | | | | | | | 18,005,241 | |
Household Durables—1.8% | | | | | | | | |
Lennar Corp., Cl. A | | | 197,650 | | | | 7,643,125 | |
Toll Brothers, Inc.1 | | | 94,620 | | | | 3,059,065 | |
| | | | | | | | 10,702,190 | |
Leisure Equipment & Products—0.5% | | | | | | | | |
Polaris Industries, Inc. | | | 37,110 | | | | 3,122,806 | |
Multiline Retail—1.0% | | | | | | | | |
Nordstrom, Inc. | | | 112,060 | | | | 5,995,210 | |
Specialty Retail—9.2% | | | | | | | | |
Dick’s Sporting Goods, Inc. | | | 61,830 | | | | 2,812,647 | |
Foot Locker, Inc. | | | 176,170 | | | | 5,658,580 | |
Genesco, Inc.1 | | | 74,220 | | | | 4,082,100 | |
GNC Holdings, Inc., Cl. A | | | 84,550 | | | | 2,813,824 | |
PetSmart, Inc. | | | 117,180 | | | | 8,008,081 | |
Sally Beauty Holdings, Inc.1 | | | 183,480 | | | | 4,324,624 | |
Tractor Supply Co. | | | 102,160 | | | | 9,026,858 | |
Ulta Salon, Cosmetics & Fragrance, Inc. | | | 152,880 | | | | 15,021,989 | |
Urban Outfitters, Inc.1 | | | 85,080 | | | | 3,348,749 | |
| | | | | | | | 55,097,452 | |
Textiles, Apparel & Luxury Goods—4.3% | | | | | | | | |
lululemon athletica, Inc.1 | | | 54,670 | | | | 4,167,494 | |
Michael Kors Holdings Ltd.1 | | | 169,130 | | | | 8,630,704 | |
PVH Corp. | | | 55,680 | | | | 6,181,037 | |
Under Armour, Inc., Cl. A1 | | | 151,810 | | | | 7,367,339 | |
| | | | | | | | 26,346,574 | |
Consumer Staples—4.0% | | | | | | | | |
Food & Staples Retailing—3.0% | | | | | | | | |
Fresh Market, Inc. (The)1 | | | 121,650 | | | | 5,850,148 | |
Whole Foods Market, Inc. | | | 129,310 | | | | 11,809,882 | |
| | | | | | | | 17,660,030 | |
Food Products—0.1% | | | | | | | | |
WhiteWave Foods Co., Cl. A1 | | | 47,480 | | | | 737,839 | |
Personal Products—0.9% | | | | | | | | |
Estee Lauder Cos., Inc. (The), Cl. A | | | 94,770 | | | | 5,672,932 | |
Energy—7.0% | | | | | | | | |
Energy Equipment & Services—3.2% | | | | | | | | |
Atwood Oceanics, Inc.1 | | | 165,310 | | | | 7,569,545 | |
Dresser-Rand Group, Inc.1 | | | 82,590 | | | | 4,636,603 | |
Oceaneering International, Inc. | | | 124,270 | | | | 6,684,483 | |
| | | | | | | | 18,890,631 | |
Oil, Gas & Consumable Fuels—3.8% | | | | | | | | |
Cabot Oil & Gas Corp., Cl. A | | | 124,300 | | | | 6,182,682 | |
Concho Resources, Inc.1 | | | 108,530 | | | | 8,743,177 | |
Oasis Petroleum, Inc.1 | | | 235,510 | | | | 7,489,218 | |
| | | | | | | | 22,415,077 | |
Financials—6.8% | | | | | | | | |
Capital Markets—2.4% | | | | | | | | |
Affiliated Managers Group, Inc.1 | | | 80,690 | | | | 10,501,803 | |
Raymond James Financial, Inc. | | | 86,800 | | | | 3,344,404 | |
| | | | | | | | 13,846,207 | |
Commercial Banks—1.6% | | | | | | | | |
First Republic Bank | | | 149,720 | | | | 4,907,822 | |
Signature Bank1 | | | 70,820 | | | | 5,052,299 | |
| | | | | | | | 9,960,121 | |
Insurance—1.6% | | | | | | | | |
Arthur J. Gallagher & Co. | | | 86,800 | | | | 3,007,620 | |
ProAssurance Corp. | | | 149,560 | | | | 6,309,936 | |
| | | | | | | | 9,317,556 | |
Real Estate Management & Development—0.6% | |
Realogy Holdings Corp.1 | | | 80,670 | | | | 3,384,913 | |
Thrifts & Mortgage Finance—0.6% | | | | | | | | |
Ocwen Financial Corp.1 | | | 99,080 | | | | 3,427,177 | |
| | | | | | | | |
| | | Shares | | | Value | |
Health Care—14.9% | | | | | | | | |
Biotechnology—3.9% | | | | | | | | |
Alexion Pharmaceuticals, Inc.1 | | | 126,230 | | | $ | 11,841,636 | |
Medivation, Inc.1 | | | 74,140 | | | | 3,793,002 | |
Onyx Pharmaceuticals, Inc.1 | | | 60,620 | | | | 4,578,629 | |
Regeneron Pharmaceuticals, Inc.1 | | | 16,440 | | | | 2,812,391 | |
| | | | | | | | 23,025,658 | |
Health Care Equipment & Supplies—4.5% | | | | | | | | |
Cooper Cos., Inc. (The) | | | 99,960 | | | | 9,244,301 | |
Edwards Lifesciences Corp.1 | | | 36,270 | | | | 3,270,466 | |
IDEXX Laboratories, Inc.1 | | | 69,400 | | | | 6,440,320 | |
Sirona Dental Systems, Inc.1 | | | 120,010 | | | | 7,735,845 | |
| | | | | | | | 26,690,932 | |
Health Care Providers & Services—2.8% | | | | | | | | |
Catamaran Corp.1 | | | 222,464 | | | | 10,480,279 | |
DaVita HealthCare Partners, Inc.1 | | | 52,190 | | | | 5,768,561 | |
| | | | | | | | 16,248,840 | |
Health Care Technology—1.1% | | | | | | | | |
Cerner Corp.1 | | | 84,960 | | | | 6,596,294 | |
Life Sciences Tools & Services—0.6% | | | | | | | | |
Illumina, Inc.1 | | | 60,210 | | | | 3,347,074 | |
Pharmaceuticals—2.0% | | | | | | | | |
Perrigo Co. | | | 27,350 | | | | 2,845,220 | |
Watson Pharmaceuticals, Inc.1 | | | 102,850 | | | | 8,845,100 | |
| | | | | | | | 11,690,320 | |
Industrials—13.4% | | | | | | | | |
Aerospace & Defense—3.8% | | | | | | | | |
B/E Aerospace, Inc.1 | | | 121,590 | | | | 6,006,546 | |
Hexcel Corp.1 | | | 208,420 | | | | 5,619,003 | |
TransDigm Group, Inc. | | | 83,330 | | | | 11,362,879 | |
| | | | | | | | 22,988,428 | |
Building Products—0.9% | | | | | | | | |
Fortune Brands Home & Security, Inc.1 | | | 175,790 | | | | 5,136,584 | |
Commercial Services & Supplies—0.8% | | | | | | | | |
Stericycle, Inc.1 | | | 48,820 | | | | 4,553,441 | |
Electrical Equipment—3.1% | | | | | | | | |
AMETEK, Inc. | | | 291,102 | | | | 10,936,702 | |
Roper Industries, Inc. | | | 69,540 | | | | 7,752,319 | |
| | | | | | | | 18,689,021 | |
Machinery—1.7% | | | | | | | | |
Nordson Corp. | | | 53,680 | | | | 3,388,282 | |
Wabtec Corp. | | | 72,740 | | | | 6,367,660 | |
| | | | | | | | 9,755,942 | |
Road & Rail—1.7% | | | | | | | | |
Kansas City Southern | | | 121,720 | | | | 10,161,186 | |
Trading Companies & Distributors—1.4% | | | | | | | | |
United Rentals, Inc.1 | | | 178,150 | | | | 8,109,388 | |
Information Technology—22.8% | | | | | | | | |
Communications Equipment—1.0% | | | | | | | | |
Aruba Networks, Inc.1 | | | 195,980 | | | | 4,066,585 | |
Palo Alto Networks, Inc.1 | | | 30,300 | | | | 1,621,656 | |
| | | | | | | | 5,688,241 | |
Computers & Peripherals—0.1% | | | | | | | | |
Stratasys Ltd.1 | | | 7,459 | | | | 597,839 | |
Electronic Equipment, Instruments, & Components—1.5% | |
IPG Photonics Corp. | | | 56,250 | | | | 3,749,062 | |
Trimble Navigation Ltd.1 | | | 87,980 | | | | 5,259,444 | |
| | | | | | | | 9,008,506 | |
Internet Software & Services—6.7% | | | | | | | | |
CoStar Group, Inc.1 | | | 48,160 | | | | 4,304,059 | |
Equinix, Inc.1 | | | 60,440 | | | | 12,462,728 | |
IAC/InterActiveCorp | | | 102,280 | | | | 4,837,844 | |
LinkedIn Corp., Cl. A1 | | | 70,550 | | | | 8,100,551 | |
Rackspace Hosting, Inc.1 | | | 136,780 | | | | 10,158,651 | |
| | | | | | | | 39,863,833 | |
IT Services—3.0% | | | | | | | | |
Alliance Data Systems Corp.1 | | | 40,480 | | | | 5,859,885 | |
Teradata Corp.1 | | | 144,660 | | | | 8,953,007 | |
Vantiv, Inc., Cl. A1 | | | 142,270 | | | | 2,905,153 | |
| | | | | | | 17,718,045 | |
OPPENHEIMER SMALL- & MID-CAP GROWTH FUND/VA 7
| | |
STATEMENT OF INVESTMENTS / (Continued) |
| | | | | | | | |
| | | Shares | | | Value | |
Semiconductors & Semiconductor Equipment—1.8% | |
Avago Technologies Ltd. | | | 140,890 | | | $ | 4,460,577 | |
Cavium, Inc.1 | | | 88,470 | | | | 2,761,149 | |
NXP Semiconductors NV1 | | | 132,330 | | | | 3,489,542 | |
| | | | | | | | 10,711,268 | |
Software—8.7% | | | | | | | | |
Aspen Technology, Inc.1 | | | 174,190 | | | | 4,814,612 | |
CommVault Systems, Inc.1 | | | 85,470 | | | | 5,958,114 | |
Concur Technologies, Inc.1 | | | 95,458 | | | | 6,445,324 | |
Fortinet, Inc.1 | | | 168,510 | | | | 3,550,506 | |
NetSuite, Inc.1 | | | 108,032 | | | | 7,270,554 | |
Red Hat, Inc.1 | | | 109,010 | | | | 5,773,170 | |
ServiceNow, Inc.1 | | | 101,430 | | | | 3,045,943 | |
SolarWinds, Inc.1 | | | 142,370 | | | | 7,467,307 | |
Splunk, Inc.1 | | | 70,420 | | | | 2,043,588 | |
Ultimate Software Group, Inc. (The)1 | | | 48,110 | | | | 4,542,065 | |
Workday, Inc., Cl. A1 | | | 13,960 | | | | 760,820 | |
| | | | | | | | 51,672,003 | |
Materials—5.3% | | | | | | | | |
Chemicals—3.6% | | | | | | | | |
Airgas, Inc. | | | 48,830 | | | | 4,457,691 | |
| | | | | | | | |
| | | Shares | | | Value | |
Chemicals (Continued) | | | | | | | | |
CF Industries Holdings, Inc. | | | 36,780 | | | $ | 7,472,225 | |
Cytec Industries, Inc. | | | 62,080 | | | | 4,272,966 | |
Westlake Chemical Corp. | | | 66,040 | | | | 5,236,972 | |
| | | | | | | | 21,439,854 | |
Construction Materials—0.9% | | | | | | | | |
Eagle Materials, Inc. | | | 96,690 | | | | 5,656,365 | |
Containers & Packaging—0.8% | | | | | | | | |
Ball Corp. | | | 105,740 | | | | 4,731,865 | |
Telecommunication Services—1.9% | | | | | | | | |
Wireless Telecommunication Services—1.9% | |
SBA Communications Corp., Cl. A1 | | | 161,810 | | | | 11,491,746 | |
Total Common Stocks | | | | | | | | |
(Cost $412,677,963) | | | | | | | 578,594,629 | |
Investment Company—1.9% | | | | | | | | |
Oppenheimer Institutional Money Market | | | | | |
Fund, Cl. E, 0.15%2,3 | | | | | | | | |
(Cost $11,313,011) | | | 11,313,011 | | | | 11,313,011 | |
Total Investments, at Value (Cost $423,990,974) | | | 99.2% | | | | 589,907,640 | |
Assets in Excess of Other Liabilities | | | 0.8 | | | | 4,968,028 | |
Net Assets | | | 100.0% | | | $ | 594,875,668 | |
Footnotes to Statement of Investments
1. Non-income producing security.
2. Rate shown is the 7-day yield as of December 31, 2012.
3. Is or was an affiliate, as defined in the Investment Company Act of 1940, at or during the period ended December 31, 2012, by virtue of the Fund owning at least 5% of the voting securities of the issuer or as a result of the Fund and the issuer having the same investment adviser. Transactions during the period in which the issuer was an affiliate are as follows:
| | | | | | | | | | | | | | | | |
| | | Shares December 30, 2011a | | | Gross
Additions | | | Gross
Reductions | | | Shares
December 31,
2012 | |
Oppenheimer Institutional Money Market Fund, Cl. E | | | 14,138,260 | | | | 229,904,918 | | | | 232,730,167 | | | | 11,313,011 | |
| | | | |
| | | | | | | | | Value | | | Income | |
Oppenheimer Institutional Money Market Fund, Cl. E | | | | | | | | | | $ | 11,313,011 | | | $ | 18,398 | |
a. December 30, 2011 represents the last business day of the Fund’s 2011 fiscal year. See Note 1 of the accompanying Notes.
See accompanying Notes to Financial Statements.
8 OPPENHEIMER SMALL- & MID-CAP GROWTH FUND/VA
| | |
STATEMENT OF ASSETS AND LIABILITIES December 31, 2012 |
| | | | |
Assets | | | | |
Investments, at value—see accompanying statement of investments: | | | | |
Unaffiliated companies (cost $412,677,963) | | $ | 578,594,629 | |
Affiliated companies (cost $11,313,011) | | | 11,313,011 | |
| | | | 589,907,640 | |
Cash | | | 36,828 | |
Receivables and other assets: | | | | |
Shares of beneficial interest sold | | | 4,483,275 | |
Investments sold | | | 749,709 | |
Dividends | | | 32,091 | |
Other | | | 32,163 | |
Total assets | | | 595,241,706 | |
|
| |
Liabilities | | | | |
Payables and other liabilities: | | | | |
Shares of beneficial interest redeemed | | | 210,144 | |
Transfer and shareholder servicing agent fees | | | 51,519 | |
Shareholder communications | | | 36,821 | |
Trustees’ compensation | | | 29,951 | |
Legal, auditing and other professional fees | | | 28,542 | |
Distribution and service plan fees | | | 7,410 | |
Other | | | 1,651 | |
Total liabilities | | | 366,038 | |
|
| | |
Net Assets | | $ | 594,875,668 | |
|
| |
Composition of Net Assets | | | | |
Par value of shares of beneficial interest | | $ | 10,874 | |
Additional paid-in capital | | | 603,404,659 | |
Accumulated net investment income | | | 42,730 | |
Accumulated net realized loss on investments | | | (174,499,261 | ) |
Net unrealized appreciation on investments | | | 165,916,666 | |
Net Assets | | $ | 594,875,668 | |
|
| |
Net Asset Value Per Share | | | | |
Non-Service Shares: | | | | |
| Net asset value, redemption price per share and offering price per share (based on net assets of $558,934,198 and 10,198,959 shares of beneficial interest outstanding) | | | $54.80 | |
Service Shares: | | | | |
| Net asset value, redemption price per share and offering price per share (based on net assets of $35,941,470 and 674,992 shares of beneficial interest outstanding) | | | $53.25 | |
See accompanying Notes to Financial Statements.
OPPENHEIMER SMALL- & MID-CAP GROWTH FUND/VA 9
| | |
STATEMENT OF OPERATIONS For the Year Ended December 31, 2012 |
| | | | |
Investment Income | | | | |
Dividends: | | | | |
Unaffiliated companies (net of foreign withholding taxes of $12,294) | | $ | 5,033,509 | |
Affiliated companies | | | 18,398 | |
Interest | | | 295 | |
Total investment income | | | 5,052,202 | |
|
| | |
Expenses | | | | |
Management fees | | | 4,415,676 | |
Distribution and service plan fees-Service shares | | | 94,918 | |
Transfer and shareholder servicing agent fees: | | | | |
Non-Service shares | | | 576,569 | |
Service shares | | | 37,939 | |
Shareholder communications: | | | | |
Non-Service shares | | | 65,176 | |
Service shares | | | 4,312 | |
Trustees’ compensation | | | 38,063 | |
Custodian fees and expenses | | | 4,077 | |
Administration service fees | | | 1,500 | |
Other | | | 69,215 | |
Total expenses | | | 5,307,445 | |
Less waivers and reimbursements of expenses | | | (321,027 | ) |
Net expenses | | | 4,986,418 | |
|
| | |
Net Investment Income | | | 65,784 | |
|
| | |
Realized and Unrealized Gain | | | | |
Net realized gain on investments from unaffiliated companies | | | 50,857,244 | |
Net change in unrealized appreciation/depreciation on investments | | | 42,312,507 | |
|
| | |
Net Increase in Net Assets Resulting from Operations | | $ | 93,235,535 | |
See accompanying Notes to Financial Statements.
10 OPPENHEIMER SMALL- & MID-CAP GROWTH FUND/VA
| | |
STATEMENTS OF CHANGES IN NET ASSETS December 31, 2012 |
| | | | | | | | | | |
| | | Year Ended
December 31, 2012 | | | | | Year Ended
December 30, 20111 | |
Operations | | | | | | | | | | |
Net investment income (loss) | | $ | 65,784 | | | | | $ | (3,504,153) | |
Net realized gain | | | 50,857,244 | | | | | | 77,531,562 | |
Net change in unrealized appreciation/depreciation | | | 42,312,507 | | | | | | (62,965,525) | |
Net increase in net assets resulting from operations | | | 93,235,535 | | | | | | 11,061,884 | |
|
| |
Beneficial Interest Transactions | | | | | | | | | | |
Net increase (decrease) in net assets resulting from beneficial interest transactions: | | | | | | | | | | |
Non-Service shares | | | (71,703,483) | | | | | | (80,390,137) | |
Service shares | | | (5,448,961) | | | | | | 3,579,422 | |
| | | (77,152,444) | | | | | | (76,810,715) | |
|
| |
Net Assets | | | | | | | | | | |
Total increase (decrease) | | | 16,083,091 | | | | | | (65,748,831) | |
Beginning of period | | | 578,792,577 | | | | | | 644,541,408 | |
| | | |
End of period (including accumulated net investment income (loss) of $42,730 and $(23,054), respectively) | | $ | 594,875,668 | | | | | $ | 578,792,577 | |
1. December 30, 2011 represents the last business day of the Fund’s 2011 fiscal year. See Note 1 of the accompanying Notes.
See accompanying Notes to Financial Statements.
OPPENHEIMER SMALL- & MID-CAP GROWTH FUND/VA 11
| | | | | | | | | | | | | | | | | | | | |
Non-Service Shares | |
| Year Ended
December
31, 2012 |
| |
| Year Ended
December
30, 20111 |
| |
| Year Ended
December
31, 2010 |
| |
| Year Ended
December
31, 2009 |
| |
| Year Ended
December
31, 2008 |
|
Per Share Operating Data | | | | | | | | | | | | | | | | | | | | |
Net asset value, beginning of period | | $ | 47.06 | | | $ | 46.55 | | | $ | 36.52 | | | $ | 27.54 | | | $ | 54.07 | |
Income (loss) from investment operations: | | | | | | | | | | | | | | | | | | | | |
Net investment income (loss)2 | | | 0.01 | | | | (0.26) | | | | (0.11) | | | | (0.05) | | | | (0.13) | |
Net realized and unrealized gain (loss) | | | 7.73 | | | | 0.77 | | | | 10.14 | | | | 9.03 | | | | (26.40) | |
Total from investment operations | | | 7.74 | | | | 0.51 | | | | 10.03 | | | | 8.98 | | | | (26.53) | |
Dividends and/or distributions to shareholders: | | | | | | | | | | | | | | | | | | | | |
Net asset value, end of period | | $ | 54.80 | | | $ | 47.06 | | | $ | 46.55 | | | $ | 36.52 | | | $ | 27.54 | |
| | | | | | | | | | | | | | | | | | | | | |
Total Return, at Net Asset Value3 | | | 16.45% | | | | 1.09% | | | | 27.46% | | | | 32.61% | | | | (49.07)% | |
Ratios/Supplemental Data | | | | | | | | | | | | | | | | | | | | |
Net assets, end of period (in thousands) | | $ | 558,934 | | | $ | 543,020 | | | $ | 611,872 | | | $ | 547,683 | | | $ | 461,684 | |
Average net assets (in thousands) | | $ | 575,072 | | | $ | 605,083 | | | $ | 548,739 | | | $ | 478,968 | | | $ | 754,170 | |
Ratios to average net assets:4 | | | | | | | | | | | | | | | | | | | | |
Net investment income (loss) | | | 0.03% | | | | (0.53)% | | | | (0.29)% | | | | (0.17)% | | | | (0.30)% | |
Total expenses5 | | | 0.85% | | | | 0.84% | | | | 0.85% | | | | 0.86% | | | | 0.71% | |
Expenses after payments, waivers and/or reimbursements and reduction to custodian expenses | | | 0.80% | | | | 0.80% | | | | 0.76% | | | | 0.71% | | | | 0.68% | |
Portfolio turnover rate | | | 66% | | | | 91% | | | | 95% | | | | 102% | | | | 78% | |
1. December 30, 2011 represents the last business day of the Fund’s 2011 fiscal year. See Note 1 of the accompanying Notes.
2. Per share amounts calculated based on the average shares outstanding during the period.
3. Assumes an initial investment on the business day before the first day of the fiscal period, with all dividends and distributions reinvested in additional shares on the reinvestment date, and redemption at the net asset value calculated on the last business day of the fiscal period. Total returns are not annualized for periods less than one full year. Total return information does not reflect expenses that apply at the separate account level or to related insurance products. Inclusion of these charges would reduce the total return figures for all periods shown. Returns do not reflect the deduction of taxes that a shareholder would pay on fund distributions or the redemption of fund shares.
4. Annualized for periods less than one full year.
5. Total expenses including indirect expenses from affiliated fund were as follows:
| | | | |
Year Ended December 31, 2012 | | | 0.85 | % |
Year Ended December 30, 2011 | | | 0.84 | % |
Year Ended December 31, 2010 | | | 0.85 | % |
Year Ended December 31, 2009 | | | 0.86 | % |
Year Ended December 31, 2008 | | | 0.71 | % |
See accompanying Notes to Financial Statements.
12 OPPENHEIMER SMALL- & MID-CAP GROWTH FUND/VA
| | | | | | | | | | | | | | | | | | | | |
Service Shares | |
| Year Ended
December
31, 2012 |
| |
| Year Ended
December
30, 20111 |
| |
| Year Ended
December
31, 2010 |
| |
| Year Ended
December
31, 2009 |
| |
| Year Ended
December
31, 2008 |
|
Per Share Operating Data | | | | | | | | | | | | | | | | | | | | |
Net asset value, beginning of period | | $ | 45.84 | | | $ | 45.46 | | | $ | 35.75 | | | $ | 27.03 | | | $ | 53.22 | |
Income (loss) from investment operations: | | | | | | | | | | | | | | | | | | | | |
Net investment loss2 | | | (0.12) | | | | (0.37) | | | | (0.20) | | | | (0.13) | | | | (0.24) | |
Net realized and unrealized gain (loss) | | | 7.53 | | | | 0.75 | | | | 9.91 | | | | 8.85 | | | | (25.95) | |
Total from investment operations | | | 7.41 | | | | 0.38 | | | | 9.71 | | | | 8.72 | | | | (26.19) | |
Dividends and/or distributions to shareholders: | | | | | | | | | | | | | | | | | | | | |
Net asset value, end of period | | $ | 53.25 | | | $ | 45.84 | | | $ | 45.46 | | | $ | 35.75 | | | $ | 27.03 | |
| | | | | |
| | | | | | | | | | | | | | | | | | | | | |
Total Return, at Net Asset Value3 | | | 16.17% | | | | 0.83% | | | | 27.16% | | | | 32.26% | | | | (49.21)% | |
Ratios/Supplemental Data | | | | | | | | | | | | | | | | | | | | |
Net assets, end of period (in thousands) | | $ | 35,942 | | | $ | 35,773 | | | $ | 32,669 | | | $ | 26,098 | | | $ | 21,952 | |
Average net assets (in thousands) | | $ | 37,842 | | | $ | 37,775 | | | $ | 27,552 | | | $ | 22,605 | | | $ | 35,815 | |
Ratios to average net assets:4 | | | | | | | | | | | | | | | | | | | | |
Net investment loss | | | (0.22)% | | | | (0.78)% | | | | (0.53)% | | | | (0.44)% | | | | (0.57)% | |
Total expenses5 | | | 1.10% | | | | 1.09% | | | | 1.10% | | | | 1.12% | | | | 0.98% | |
Expenses after payments, waivers and/or reimbursements and reduction to custodian expenses | | | 1.05% | | | | 1.05% | | | | 1.01% | | | | 0.97% | | | | 0.95% | |
Portfolio turnover rate | | | 66% | | | | 91% | | | | 95% | | | | 102% | | | | 78% | |
1. December 30, 2011 represents the last business day of the Fund’s 2011 fiscal year. See Note 1 of the accompanying Notes.
2. Per share amounts calculated based on the average shares outstanding during the period.
3. Assumes an initial investment on the business day before the first day of the fiscal period, with all dividends and distributions reinvested in additional shares on the reinvestment date, and redemption at the net asset value calculated on the last business day of the fiscal period. Total returns are not annualized for periods less than one full year. Total return information does not reflect expenses that apply at the separate account level or to related insurance products. Inclusion of these charges would reduce the total return figures for all periods shown. Returns do not reflect the deduction of taxes that a shareholder would pay on fund distributions or the redemption of fund shares.
4. Annualized for periods less than one full year.
5. Total expenses including indirect expenses from affiliated fund were as follows:
| | | | |
Year Ended December 31, 2012 | | | 1.10 | % |
Year Ended December 30, 2011 | | | 1.09 | % |
Year Ended December 31, 2010 | | | 1.10 | % |
Year Ended December 31, 2009 | | | 1.12 | % |
Year Ended December 31, 2008 | | | 0.98 | % |
See accompanying Notes to Financial Statements.
OPPENHEIMER SMALL- & MID-CAP GROWTH FUND/VA 13
| | |
NOTES TO FINANCIAL STATEMENTS |
1. Significant Accounting Policies
Oppenheimer Small- & Mid-Cap Growth Fund/VA (the “Fund”) is a separate series of Oppenheimer Variable Account Funds, an open-end management investment company registered under the Investment Company Act of 1940, as amended. The Fund’s investment objective is to seek capital appreciation by investing in “growth type” companies. The Fund’s investment adviser is OppenheimerFunds, Inc. (the “Manager”).
The Fund offers two classes of shares. Both classes are sold at their offering price, which is the net asset value per share, to separate investment accounts of participating insurance companies as an underlying investment for variable life insurance policies, variable annuity contracts or other investment products. The class of shares designated as Service shares is subject to a distribution and service plan. Both classes of shares have identical rights and voting privileges with respect to the Fund in general and exclusive voting rights on matters that affect that class alone. Earnings, net assets and net asset value per share may differ due to each class having its own expenses, such as transfer and shareholder servicing agent fees and shareholder communications, directly attributable to that class.
The following is a summary of significant accounting policies consistently followed by the Fund.
Previous Annual Period. The last day of the Fund’s fiscal year was the last day the New York Stock Exchange was open for trading. The Fund’s financial statements have been presented through that date to maintain consistency with the Fund’s net asset value calculations used for shareholder transactions.
Investment in Oppenheimer Institutional Money Market Fund. The Fund is permitted to invest daily available cash balances in an affiliated money market fund. The Fund may invest the available cash in Class E shares of Oppenheimer Institutional Money Market Fund (“IMMF”) to seek current income while preserving liquidity. IMMF is a registered open-end management investment company, regulated as a money market fund under the Investment Company Act of 1940, as amended. The Manager is also the investment adviser of IMMF. When applicable, the Fund’s investment in IMMF is included in the Statement of Investments. Shares of IMMF are valued at their net asset value per share. As a shareholder, the Fund is subject to its proportional share of IMMF’s Class E expenses, including its management fee. The Manager will waive fees and/or reimburse Fund expenses in an amount equal to the indirect management fees incurred through the Fund’s investment in IMMF.
Allocation of Income, Expenses, Gains and Losses. Income, expenses (other than those attributable to a specific class), gains and losses are allocated on a daily basis to each class of shares based upon the relative proportion of net assets represented by such class. Operating expenses directly attributable to a specific class are charged against the operations of that class.
Federal Taxes. The Fund intends to comply with provisions of the Internal Revenue Code applicable to regulated investment companies and to distribute substantially all of its investment company taxable income, including any net realized gain on investments not offset by capital loss carryforwards, if any, to shareholders. Therefore, no federal income or excise tax provision is required. The Fund files income tax returns in U.S. federal and applicable state jurisdictions. The statute of limitations on the Fund’s tax return filings generally remain open for the three preceding fiscal reporting period ends.
The tax components of capital shown in the following table represent distribution requirements the Fund must satisfy under the income tax regulations, losses the Fund may be able to offset against income and gains realized in future years and unrealized appreciation or depreciation of securities and other investments for federal income tax purposes.
| | | | | | | | | | | | |
Undistributed Net Investment Income | | Undistributed
Long-Term
Gain | | | Accumulated
Loss
Carryforward1,2,3,4 | | | Net Unrealized
Appreciation
Based on cost of
Securities and
Other Investments
for Federal Income
Tax Purposes | |
$72,666 | | | $— | | | | $174,096,463 | | | | $165,513,859 | |
1. As of December 31, 2012, the Fund had $172,735,813 of net capital loss carryforwards available to offset future realized capital gains, if any, and thereby reduce future taxable gain distributions. Details of the capital loss carryforwards are included in the table below. Capital loss carryovers with no expiration, if any, must be utilized prior to those with expiration dates.
| | | | | | |
| Expiring | | | | | |
2017 | | $ | 172,735,813 | | | |
2. As of December 31, 2012, the Fund had $1,360,650 of post-October losses available to offset future realized capital gains, if any.
3. During the fiscal year ended December 31, 2012, the Fund utilized $44,334,654 of capital loss carryforward to offset capital gains realized in that fiscal year.
4. During the fiscal year ended December 30, 2011, the Fund utilized $83,964,525 of capital loss carryforward to offset capital gains realized in that fiscal year.
Net investment income (loss) and net realized gain (loss) may differ for financial statement and tax purposes. The character of dividends and distributions made during the fiscal year from net investment income or net realized gains may differ from their ultimate characterization for federal income tax purposes. Also, due to timing of dividends and distributions, the fiscal year in which amounts are distributed may differ from the fiscal year in which the income or net realized gain was recorded by the Fund.
14 OPPENHEIMER SMALL- & MID-CAP GROWTH FUND/VA
1. Significant Accounting Policies (Continued)
No distributions were paid during the years ended December 31, 2012 and December 31, 2011.
The aggregate cost of securities and other investments and the composition of unrealized appreciation and depreciation of securities and other investments for federal income tax purposes as of December 31, 2012 are noted in the following table. The primary difference between book and tax appreciation or depreciation of securities and other investments, if applicable, is attributable to the tax deferral of losses or tax realization of financial statement unrealized gain or loss.
| | | | |
Federal tax cost of securities | | $ | 424,393,781 | |
| | | | |
Gross unrealized appreciation | | $ | 168,886,438 | |
Gross unrealized depreciation | | | (3,372,579) | |
| | | | |
Net unrealized appreciation | | $ | 165,513,859 | |
| | | | |
Trustees’ Compensation. The Board of Trustees has adopted a compensation deferral plan for independent trustees that enables trustees to elect to defer receipt of all or a portion of the annual compensation they are entitled to receive from the Fund. For purposes of determining the amount owed to the Trustee under the plan, deferred amounts are treated as though equal dollar amounts had been invested in shares of the Fund or in other Oppenheimer funds selected by the Trustee. The Fund purchases shares of the funds selected for deferral by the Trustee in amounts equal to his or her deemed investment, resulting in a Fund asset equal to the deferred compensation liability. Such assets are included as a component of “Other” within the asset section of the Statement of Assets and Liabilities. Deferral of trustees’ fees under the plan will not affect the net assets of the Fund, and will not materially affect the Fund’s assets, liabilities or net investment income per share. Amounts will be deferred until distributed in accordance with the compensation deferral plan.
Dividends and Distributions to Shareholders. Dividends and distributions to shareholders, which are determined in accordance with income tax regulations and may differ from U.S. generally accepted accounting principles, are recorded on the ex-dividend date. Income and capital gain distributions, if any, are declared and paid annually or at other times as deemed necessary by the Manager.
Investment Income. Dividend income is recorded on the ex-dividend date or upon ex-dividend notification in the case of certain foreign dividends where the ex-dividend date may have passed. Non-cash dividends included in dividend income, if any, are recorded at the fair market value of the securities received. Interest income is recognized on an accrual basis. Discount and premium, which are included in interest income on the Statement of Operations, are amortized or accreted daily.
Custodian Fees. “Custodian fees and expenses” in the Statement of Operations may include interest expense incurred by the Fund on any cash overdrafts of its custodian account during the period. Such cash overdrafts may result from the effects of failed trades in portfolio securities and from cash outflows resulting from unanticipated shareholder redemption activity. The Fund pays interest to its custodian on such cash overdrafts, to the extent they are not offset by positive cash balances maintained by the Fund, at a rate equal to the Federal Funds Rate plus 0.50%. The “Reduction to custodian expenses” line item, if applicable, represents earnings on cash balances maintained by the Fund during the period. Such interest expense and other custodian fees may be paid with these earnings.
Security Transactions. Security transactions are recorded on the trade date. Realized gains and losses on securities sold are determined on the basis of identified cost.
Indemnifications. The Fund’s organizational documents provide current and former trustees and officers with a limited indemnification against liabilities arising in connection with the performance of their duties to the Fund. In the normal course of business, the Fund may also enter into contracts that provide general indemnifications. The Fund’s maximum exposure under these arrangements is unknown as this would be dependent on future claims that may be made against the Fund. The risk of material loss from such claims is considered remote.
Other. The preparation of financial statements in conformity with accounting principles generally accepted in the United States of America requires management to make estimates and assumptions that affect the reported amounts of assets and liabilities and disclosure of contingent assets and liabilities at the date of the financial statements and the reported amounts of increases and decreases in net assets from operations during the reporting period. Actual results could differ from those estimates.
2. Securities Valuation
The Fund calculates the net asset value of its shares as of the close of the New York Stock Exchange (the “Exchange”), normally 4:00 P.M. Eastern time, on each day the Exchange is open for trading.
The Fund’s Board has adopted procedures for the valuation of the Fund’s securities and has delegated the day-to-day responsibility for valuation determinations under those procedures to the Manager. The Manager has established a Valuation Committee which is responsible for determining a “fair valuation” for any security for which market quotations are not “readily available.” The Valuation Committee’s fair valuation determinations are subject to review, approval and ratification by the Fund’s Board at its next regularly scheduled meeting covering the calendar quarter in which the fair valuation was determined.
OPPENHEIMER SMALL- & MID-CAP GROWTH FUND/VA 15
| | |
NOTES TO FINANCIAL STATEMENTS / (Continued) |
2. Securities Valuation (Continued)
Valuation Methods and Inputs
Securities are valued using unadjusted quoted market prices, when available, as supplied primarily by third party pricing services or dealers.
The following methodologies are used to determine the market value or the fair value of the types of securities described below:
Securities traded on a registered U.S. securities exchange (including exchange-traded derivatives other than futures and futures options) are valued based on the last sale price of the security reported on the principal exchange on which it is traded, prior to the time when the Fund’s assets are valued. In the absence of a sale, the security is valued at the last sale price on the prior trading day, if it is within the spread of the current day’s closing “bid” and “asked” prices, and if not, at the current day’s closing bid price. A security of a foreign issuer traded on a foreign exchange but not listed on a registered U.S. securities exchange is valued based on the last sale price on the principal exchange on which the security is traded, as identified by the third party pricing service used by the Manager, prior to the time when the Fund’s assets are valued. If the last sale price is unavailable, the security is valued at the most recent official closing price on the principal exchange on which it is traded. If the last sales price or official closing price for a foreign security is not available, the security is valued at the mean between the bid and asked price per the exchange or, if not available from the exchange, obtained from two dealers. If bid and asked prices are not available from either the exchange or two dealers, the security is valued by using one of the following methodologies (listed in order of priority); (1) using a bid from the exchange, (2) the mean between the bid and asked price as provided by a single dealer, or (3) a bid from a single dealer.
Shares of a registered investment company that are not traded on an exchange are valued at that investment company’s net asset value per share.
Corporate and government debt securities (of U.S. or foreign issuers) and municipal debt securities, event-linked bonds, loans, mortgage-backed securities, collateralized mortgage obligations, and asset-backed securities are valued at the mean between the “bid” and “asked” prices utilizing evaluated prices obtained from third party pricing services or broker-dealers who may use matrix pricing methods to determine the evaluated prices.
Short-term money market type debt securities with a remaining maturity of sixty days or less are valued at cost adjusted by the amortization of discount or premium to maturity (amortized cost), which approximates market value. Short-term debt securities with a remaining maturity in excess of sixty days are valued at the mean between the “bid” and “asked” prices utilizing evaluated prices obtained from third party pricing services or broker-dealers.
A description of the standard inputs that may generally be considered by the third party pricing vendors in determining their evaluated prices is provided below.
| | |
| Security Type | | Standard inputs generally considered by third-party pricing vendors |
| Corporate debt, government debt, municipal, mortgage-backed and asset-backed securities | | Reported trade data, broker-dealer price quotations, benchmark yields, issuer spreads on comparable securities, the credit quality, yield, maturity, and other appropriate factors. |
| Loans | | Information obtained from market participants regarding reported trade data and broker-dealer price quotations. |
| Event-linked bonds | | Information obtained from market participants regarding reported trade data and broker-dealer price quotations. |
If a market value or price cannot be determined for a security using the methodologies described above, or if, in the “good faith” opinion of the Manager, the market value or price obtained does not constitute a “readily available market quotation,” or a significant event has occurred that would materially affect the value of the security the security is fair valued either (i) by a standardized fair valuation methodology applicable to the security type or the significant event as previously approved by the Valuation Committee and the Fund’s Board or (ii) as determined in good faith by the Manager’s Valuation Committee. The Valuation Committee considers all relevant facts that are reasonably available, through either public information or information available to the Manager, when determining the fair value of a security. Fair value determinations by the Manager are subject to review, approval and ratification by the Fund’s Board at its next regularly scheduled meeting covering the calendar quarter in which the fair valuation was determined. Those fair valuation standardized methodologies include, but are not limited to, valuing securities at the last sale price or initially at cost and subsequently adjusting the value based on: changes in company specific fundamentals, changes in an appropriate securities index, or changes in the value of similar securities which may be further adjusted for any discounts related to security-specific resale restrictions. When possible, such methodologies use observable market inputs such as unadjusted quoted prices of similar securities, observable interest rates, currency rates and yield curves. The methodologies used for valuing securities are not necessarily an indication of the risks associated with investing in those securities nor can it be assured that the Fund can obtain the fair value assigned to a security if it were to sell the security.
To assess the continuing appropriateness of security valuations, the Manager, or its third party service provider who is subject to oversight by the Manager, regularly compares prior day prices, prices on comparable securities, and sale prices to the current day prices and challenges those prices exceeding certain tolerance levels with the third party pricing service or broker source. For those securities valued by fair valuations, whether through a standardized fair valuation methodology or a fair valuation determination, the Valuation Committee reviews and affirms the reasonableness of the valuations based on such methodologies and fair valuation determinations on a regular basis after considering all relevant information that is reasonably available.
Classifications
Each investment asset or liability of the Fund is assigned a level at measurement date based on the significance and source of the inputs to its valuation. Various data inputs are used in determining the value of each of the Fund’s investments as of the reporting period end. These data inputs are categorized in the following hierarchy under applicable financial accounting standards:
16 OPPENHEIMER SMALL- & MID-CAP GROWTH FUND/VA
2. Securities Valuation (Continued)
1) Level 1-unadjusted quoted prices in active markets for identical assets or liabilities (including securities actively traded on a securities exchange)
2) Level 2-inputs other than unadjusted quoted prices that are observable for the asset or liability (such as unadjusted quoted prices for similar assets and market corroborated inputs such as interest rates, prepayment speeds, credit risks, etc.)
3) Level 3-significant unobservable inputs (including the Manager’s own judgments about assumptions that market participants would use in pricing the asset or liability).
The inputs used for valuing securities are not necessarily an indication of the risks associated with investing in those securities.
The table below categorizes amounts that are included in the Fund’s Statement of Assets and Liabilities as of December 31, 2012 based on valuation input level:
| | | | | | | | | | | | | | | | |
| | | Level 1—
Unadjusted
Quoted Prices | | | Level 2—
Other Significant
Observable Inputs | | | Level 3—
Significant
Unobservable
Inputs | | | Value | |
Assets Table | | | | | | | | | | | | | | | | |
Investments, at Value: | | | | | | | | | | | | | | | | |
Common Stocks | | | | | | | | | | | | | | | | |
Consumer Discretionary | | $ | 127,709,473 | | | $ | — | | | $ | — | | | $ | 127,709,473 | |
Consumer Staples | | | 24,070,801 | | | | — | | | | — | | | | 24,070,801 | |
Energy | | | 41,305,708 | | | | — | | | | — | | | | 41,305,708 | |
Financials | | | 39,935,974 | | | | — | | | | — | | | | 39,935,974 | |
Health Care | | | 87,599,118 | | | | — | | | | — | | | | 87,599,118 | |
Industrials | | | 79,393,990 | | | | — | | | | — | | | | 79,393,990 | |
Information Technology | | | 135,259,735 | | | | — | | | | — | | | | 135,259,735 | |
Materials | | | 31,828,084 | | | | — | | | | — | | | | 31,828,084 | |
Telecommunication Services | | | 11,491,746 | | | | — | | | | — | | | | 11,491,746 | |
Investment Company | | | 11,313,011 | | | | — | | | | — | | | | 11,313,011 | |
| | | | |
Total Assets | | $ | 589,907,640 | | | $ | — | | | $ | — | | | $ | 589,907,640 | |
| | | | |
Currency contracts and forwards, if any, are reported at their unrealized appreciation/ depreciation at measurement date, which represents the change in the contract’s value from trade date. Futures, if any, are reported at their variation margin at measurement date, which represents the amount due to/from the Fund at that date. All additional assets and liabilities included in the above table are reported at their market value at measurement date.
There have been no significant changes to the fair valuation methodologies of the Fund during the period.
3. Shares of Beneficial Interest
The Fund has authorized an unlimited number of $0.001 par value shares of beneficial interest of each class. Transactions in shares of beneficial interest were as follows:
| | | | | | | | | | | | | | | | | | |
| | | | | Year Ended December 31, 2012 | | | Year Ended December 30, 2011 | |
| | | | | Shares | | | Amount | | | Shares | | | Amount | |
Non-Service Shares | | | | | | | | | | | | | | | | | | |
Sold | | | | | 424,674 | | | $ | 22,730,798 | | | | 665,252 | | | $ | 32,309,437 | |
Redeemed | | | | | (1,765,118 | ) | | | (94,434,281 | ) | | | (2,270,275 | ) | | | (112,699,574 | ) |
| | | |
Net decrease | | | | | (1,340,444 | ) | | $ | (71,703,483 | ) | | | (1,605,023 | ) | | $ | (80,390,137 | ) |
| | | |
| | | | | |
| | | | | | | | | | | | | | | | | | | |
Service Shares | | | | | | | | | | | | | | | | | | |
Sold | | | | | 138,098 | | | $ | 7,173,273 | | | | 366,560 | | | $ | 18,018,685 | |
Redeemed | | | | | (243,546 | ) | | | (12,622,234 | ) | | | (304,822 | ) | | | (14,439,263 | ) |
| | | |
Net increase (decrease) | | | | | (105,448 | ) | | $ | (5,448,961 | ) | | | 61,738 | | | $ | 3,579,422 | |
| | | |
4. Purchases and Sales of Securities
The aggregate cost of purchases and proceeds from sales of securities, other than short-term obligations and investments in IMMF, for the year ended December 31, 2012, were as follows:
| | | | | | | | | | |
| | | Purchases | | | | | Sales | |
Investment securities | | $ | 394,290,066 | | | | | $ | 475,434,991 | |
5. Fees and Other Transactions with Affiliates
Management Fees. Under the investment advisory agreement, the Fund pays the Manager a management fee based on the daily net assets of the Fund at an annual rate as shown in the following table:
OPPENHEIMER SMALL- & MID-CAP GROWTH FUND/VA 17
| | |
NOTES TO FINANCIAL STATEMENTS / (Continued) |
5. Fees and Other Transactions with Affiliates (Continued)
| | | | |
| Fee Schedule | | | |
Up to $200 million | | | 0.75% | |
Next $200 million | | | 0.72 | |
Next $200 million | | | 0.69 | |
Next $200 million | | | 0.66 | |
Next $700 million | | | 0.60 | |
Over $1.5 billion | | | 0.58 | |
Administrative Service Fees. The Fund pays the Manager a fee of $1,500 per year for preparing and filing the Fund’s tax returns.
Transfer Agent Fees. OppenheimerFunds Services (“OFS”), a division of the Manager, acts as the transfer and shareholder servicing agent for the Fund. For the year ended December 31, 2012, the Fund paid $613,219 to OFS for services to the Fund.
Distribution and Service Plan for Service Shares. The Fund has adopted a Distribution and Service Plan (the “Plan”) in accordance with Rule 12b-1 under the Investment Company Act of 1940 for Service shares to pay OppenheimerFunds Distributor, Inc. (the “Distributor”), for distribution related services, personal service and account maintenance for the Fund’s Service shares. Under the Plan, payments are made periodically at an annual rate of 0.25% of the daily net assets of Service shares of the Fund. The Distributor currently uses all of those fees to compensate sponsors of the insurance product that offers Fund shares, for providing personal service and maintenance of accounts of their variable contract owners that hold Service shares. These fees are paid out of the Fund’s assets on an on-going basis and increase operating expenses of the Service shares, which results in lower performance compared to the Fund’s shares that are not subject to a service fee. Fees incurred by the Fund under the Plan are detailed in the Statement of Operations.
Waivers and Reimbursements of Expenses. The Manager has voluntarily agreed to limit the Fund’s expenses after payments, waivers and/or reimbursements and reduction to custodian expenses, excluding expenses incurred directly or indirectly by the Fund as a result of investments in other investment companies, wholly-owned subsidiaries and pooled investment vehicles; so that those expenses, as percentages of daily net assets, will not exceed the annual rate of 0.80% for Non-Service shares and 1.05% for Service shares. During the year ended December 31, 2012, the Manager waived fees and/or reimbursed the Fund $291,926 and $19,619 for Non-Service and Service shares, respectively.
The Manager will waive fees and/or reimburse Fund expenses in an amount equal to the indirect management fees incurred through the Fund’s investment in IMMF. During the year ended December 31, 2012, the Manager waived fees and/or reimbursed the Fund $9,482 for IMMF management fees.
Some of these undertakings may be modified or terminated at any time; some may not be modified or terminated until after one year from the date of the current prospectus, as indicated therein.
6. Subsequent Event
The Board of Trustees of the Fund recently approved a series of modifications to the Fund’s investment advisory and transfer agency arrangements in connection with internal corporate restructuring efforts at OppenheimerFunds, Inc. (“OFI”). As a result of these modifications, on January 1, 2013 (the “Effective Date”), OFI Global Asset Management, Inc. (“OFI Global”), a wholly-owned subsidiary of OFI, became the investment adviser and transfer agent to the Fund under the terms of the Fund’s advisory agreement and transfer agency agreement, respectively. OFI Global, in turn, entered into a new sub-advisory agreement for the Fund, on the Effective Date, whereby OFI Global will have oversight and supervisory responsibilities and OFI will choose the Fund’s investments and provide related advisory services to the Fund. In addition, on the Effective Date, OFI Global entered into a sub-transfer agency agreement with Shareholder Services, Inc. doing business as OppenheimerFunds Services, a wholly-owned subsidiary of OFI, under which it will be responsible for providing transfer agency services to the Fund.
The realignment of advisory service responsibility between OFI Global and OFI did not result in any change in the persons managing the assets of the Fund, the level or nature of the advisory services provided to the Fund, or the fees charged to the Fund.
7. Pending Litigation
Since 2009, a number of class action lawsuits have been pending in federal courts against OppenheimerFunds, Inc., the Fund’s Adviser through December 31, 2012 and Sub-Adviser effective January 1, 2013 (the “Manager”), OppenheimerFunds Distributor, Inc., the Fund’s principal underwriter and distributor (the “Distributor”), and certain funds (but not including the Fund) advised by the Manager and distributed by the Distributor (the “Defendant Funds”). Several of these lawsuits also name as defendants certain officers and current and former trustees of the respective Defendant Funds. The lawsuits raise claims under federal securities law and allege, among other things, that the disclosure documents of the respective Defendant Funds contained misrepresentations and omissions and that the respective Defendant Funds’ investment policies were not followed. The plaintiffs in these actions seek unspecified damages, equitable relief and awards of attorneys’ fees and litigation expenses. The Defendant Funds’ Boards of Trustees have also engaged counsel to represent the Funds and the present and former Independent Trustees named in those suits.
Other class action and individual lawsuits have been filed since 2008 in various state and federal courts against the Manager and certain of its affiliates by investors seeking to recover investments they allegedly lost as a result of the “Ponzi” scheme run by Bernard L. Madoff and his firm, Bernard L. Madoff Investment Securities, LLC (“BLMIS”). Plaintiffs in these suits allege that they suffered losses as a result of their investments in several funds
18 OPPENHEIMER SMALL- & MID-CAP GROWTH FUND/VA
7. Pending Litigation (Continued)
managed by an affiliate of the Manager and assert a variety of claims, including breach of fiduciary duty, fraud, negligent misrepresentation, unjust enrichment, and violation of federal and state securities laws and regulations, among others. They seek unspecified damages, equitable relief and awards of attorneys’ fees and litigation expenses. Neither the Distributor, nor any of the Oppenheimer mutual funds, their independent trustees or directors are named as defendants in these lawsuits. None of the Oppenheimer mutual funds invested in any funds or accounts managed by Madoff or BLMIS. On February 28, 2011, a stipulation of partial settlement of three groups of consolidated putative class action lawsuits relating to these matters was filed in the U.S. District Court for the Southern District of New York. On August 19, 2011, the court entered an order and final judgment approving the settlement as fair, reasonable and adequate. In September 2011, certain parties filed notices of appeal from the court’s order approving the settlement. The settlement does not resolve other outstanding lawsuits against the Manager and its affiliates relating to BLMIS.
On April 16, 2010, a lawsuit was filed in New York state court against the Manager, an affiliate of the Manager and AAArdvark IV Funding Limited (“AAArdvark IV”), an entity advised by the Manager’s affiliate, in connection with investments made by the plaintiffs in AAArdvark IV. Plaintiffs allege breach of contract against the defendants and seek compensatory damages, costs and disbursements, including attorney fees. On July 15, 2011, a lawsuit was filed in New York state court against the Manager, an affiliate of the Manager and AAArdvark Funding Limited (“AAArdvark I”), an entity advised by the Manager’s affiliate, in connection with investments made by the plaintiffs in AAArdvark I. The complaint alleges breach of contract against the defendants and seeks compensatory damages, costs and disbursements, including attorney fees. On November 9, 2011, a lawsuit was filed in New York state court against the Manager, an affiliate of the Manager and AAArdvark XS Funding Limited (“AAArdvark XS”), an entity advised by the Manager’s affiliate, in connection with investments made by the plaintiffs in AAArdvark XS. The complaint alleges breach of contract against the defendants and seeks compensatory damages, costs and disbursements, including attorney fees.
The Manager believes the lawsuits and appeals described above are without legal merit and, with the exception of actions it has settled, is defending against them vigorously. While it is premature to render any opinion as to the outcome in these lawsuits, or whether any costs that the Defendant Funds may bear in defending the suits might not be reimbursed by insurance, the Manager believes that these suits should not impair the ability of the Manager or the Distributor to perform their respective duties to the Fund, and that the outcome of all of the suits together should not have any material effect on the operations of any of the Oppenheimer mutual funds.
OPPENHEIMER SMALL- & MID-CAP GROWTH FUND/VA 19
| | |
REPORT OF INDEPENDENT REGISTERED PUBLIC ACCOUNTING FIRM |
The Board of Trustees and Shareholders of Oppenheimer Variable Account Funds:
We have audited the accompanying statement of assets and liabilities of Oppenheimer Small- & Mid-Cap Growth Fund/VA (a separate series of Oppenheimer Variable Account Funds), including the statement of investments, as of December 31, 2012, and the related statement of operations for the year then ended, the statements of changes in net assets for each of the years in the two-year period then ended and the financial highlights for each of the years in the four-year period then ended. These financial statements and financial highlights are the responsibility of the Fund’s management. Our responsibility is to express an opinion on these financial statements and financial highlights based on our audits. The accompanying financial highlights of Oppenheimer Small- & Mid-Cap Growth Fund/VA for the year ended December 31, 2008 were audited by other auditors whose report dated February 11, 2009 expressed an unqualified opinion on those financial highlights.
We conducted our audits in accordance with the standards of the Public Company Accounting Oversight Board (United States). Those standards require that we plan and perform the audit to obtain reasonable assurance about whether the financial statements and financial highlights are free of material misstatement. An audit includes examining, on a test basis, evidence supporting the amounts and disclosures in the financial statements. Our procedures included confirmation of securities owned as of December 31, 2012, by correspondence with the custodian and transfer agent. An audit also includes assessing the accounting principles used and significant estimates made by management, as well as evaluating the overall financial statement presentation. We believe that our audits provide a reasonable basis for our opinion.
In our opinion, the financial statements and financial highlights referred to above present fairly, in all material respects, the financial position of Oppenheimer Small- & Mid-Cap Growth Fund/VA as of December 31, 2012, the results of its operations for the year then ended, the changes in its net assets for each of the years in the two-year period then ended and the financial highlights for each of the years in the four-year period then ended, in conformity with U.S. generally accepted accounting principles.
KPMG LLP
Denver, Colorado
February 19, 2013
20 OPPENHEIMER SMALL- & MID-CAP GROWTH FUND/VA
| | |
FEDERAL INCOME TAX INFORMATION Unaudited |
In early 2013, if applicable, shareholders of record received information regarding all dividends and distributions paid to them by the Fund during calendar year 2012.
Dividends, if any, paid by the Fund during the fiscal year ended December 31, 2012 which are not designated as capital gain distributions should be multiplied by the maximum amount allowable but not less than 100% to arrive at the amount eligible for the corporate dividend-received deduction.
The foregoing information is presented to assist shareholders in reporting distributions received from the Fund to the Internal Revenue Service. Because of the complexity of the federal regulations which may affect your individual tax return and the many variations in state and local tax regulations, we recommend that you consult your tax advisor for specific guidance.
OPPENHEIMER SMALL- & MID-CAP GROWTH FUND/VA 21
| | |
BOARD APPROVAL OF THE FUND’S INVESTMENT ADVISORY AGREEMENT Unaudited |
Each year, the Board of Trustees (the “Board”), including a majority of the independent Trustees, is required to determine whether to renew the Fund’s investment advisory agreement (the “Agreement”). The Investment Company Act of 1940, as amended, requires that the Board request and evaluate, and that the Manager provide, such information as may be reasonably necessary to evaluate the terms of the Agreement. The Board employs an independent consultant to prepare a report that provides information, including comparative information that the Board requests for that purpose. In addition to in-person meetings focused on this evaluation, the Board receives information throughout the year regarding Fund services, fees, expenses and performance.
The Manager and the independent consultant provided information to the Board on the following factors: (i) the nature, quality and extent of the Manager’s services, (ii) the investment performance of the Fund and the Manager, (iii) the fees and expenses of the Fund, including comparative expense information, (iv) the profitability of the Manager and its affiliates, including an analysis of the cost of providing services, (v) whether economies of scale are realized as the Fund grows and whether fee levels reflect these economies of scale for Fund investors and (vi) other benefits to the Manager from its relationship with the Fund. The Board was aware that there are alternatives to retaining the Manager.
Outlined below is a summary of the principal information considered by the Board as well as the Board’s conclusions.
Nature, Quality and Extent of Services. The Board considered information about the nature, quality and extent of the services provided to the Fund and information regarding the Manager’s key personnel who provide such services. The Manager’s duties include providing the Fund with the services of the portfolio manager and the Manager’s investment team, who provide research, analysis and other advisory services in regard to the Fund’s investments; securities trading services; oversight of third-party service providers; monitoring compliance with applicable Fund policies and procedures and adherence to the Fund’s investment restrictions; and risk management. The Manager is responsible for providing certain administrative services to the Fund as well. Those services include providing and supervising all administrative and clerical personnel who are necessary in order to provide effective corporate administration for the Fund; compiling and maintaining records with respect to the Fund’s operations; preparing and filing reports required by the Securities and Exchange Commission; preparing periodic reports regarding the operations of the Fund for its shareholders; preparing proxy materials for shareholder meetings; and preparing the registration statements required by Federal and state securities laws for the sale of the Fund’s shares. The Manager also provides the Fund with office space, facilities and equipment.
The Board also considered the quality of the services provided and the quality of the Manager’s resources that are available to the Fund. The Board took account of the fact that the Manager has had over fifty years of experience as an investment adviser and that its assets under management rank it among the top mutual fund managers in the United States. The Board evaluated the Manager’s advisory, administrative, accounting, legal, compliance services and risk management, and information the Board has received regarding the experience and professional qualifications of the Manager’s key personnel and the size and functions of its staff. In its evaluation of the quality of the portfolio management services provided, the Board considered the experience of Ronald Zibelli, Jr., the portfolio manager for the Fund, and the Manager’s investment team and analysts. The Board members also considered the totality of their experiences with the Manager as directors or trustees of the Fund and other funds advised by the Manager. The Board considered information regarding the quality of services provided by affiliates of the Manager, which its members have become knowledgeable about in connection with the renewal of the Fund’s service agreements. The Board concluded, in light of the Manager’s experience, reputation, personnel, operations and resources that the Fund benefits from the services provided under the Agreement.
Investment Performance of the Manager and the Fund. Throughout the year, the Manager provided information on the investment performance of the Fund, including comparative performance information. The Board also reviewed information, prepared by the Manager and by the independent consultant, comparing the Fund’s historical performance to relevant market indices and to the performance of other mid-cap growth funds underlying variable insurance products. The Board considered that the Fund outperformed its performance universe median for the one-year period, slightly underperformed its performance universe median for the three-year period and underperformed its performance universe median during the five- and ten-year periods. The Board also considered, however, the Manager’s assertion that the portfolio manager’s high quality emphasis, which generally was out of favor in 2009, accounted for the Fund’s underperformance. The Board considered that the Manager changed the Fund’s name and investment policies on May 1, 2010 to reflect that the Fund could invest in small-cap stocks as well as mid-cap stocks. The Board also considered the Manager’s assertion that these changes have helped improve the Fund’s recent performance. The Board also considered the Fund’s recent improved performance, ranking in the top quintile of its performance for the one-year period.
Costs of Services by the Manager. The Board reviewed the fees paid to the Manager and the other expenses borne by the Fund. The Board also considered the comparability of the fees charged and the services provided to the Fund to the fees and services for other clients or accounts advised by the Manager. The independent consultant provided comparative data in regard to the fees and expenses of the Fund and other mid-cap growth funds underlying variable insurance products. In reviewing the fees and expenses charged to the VA funds, the Board considered the Manager’s assertion that, because there is much greater disparity in the fees and services that may be provided by a manager to a VA fund as opposed to a retail fund, when comparing the expenses of the various VA funds to those of retail funds, it is most appropriate to focus on total expenses (rather than on the management fees). Accordingly, while the Board reviewed and considered all expenses, it focused on total expenses. The Board also considered that the Fund’s actual management fees and total expenses were lower than the expense group median and average. The Board noted that the Manager has voluntarily agreed to waive fees and/or reimburse the Fund for certain expenses in order to limit “Total Annual Fund Operating Expenses After Fee Waivers and/or Expense Reimbursement” (excluding (i) interest, taxes, dividends tied to short sales, brokerage commissions, and other expenditures which are capitalized in accordance with generally accepted accounting principles; (ii) expenses incurred directly or indirectly by the Fund as a result of investments in other investment companies, wholly-owned subsidiaries and pooled investment vehicles; (iii) certain other expenses attributable to, and incurred as a result of, a Fund’s investments; and (iv) other extraordinary expenses (including litigation expenses) not incurred in the ordinary course of the Fund’s business) to the annual rates of 0.80% for Non-Service Shares and 1.05% for Service Shares as calculated on the daily net assets of the Fund. This waiver and/or reimbursement may not be amended or withdrawn until one year after the date of the Fund’s prospectus.
22 OPPENHEIMER SMALL- & MID-CAP GROWTH FUND/VA
Economies of Scale and Profits Realized by the Manager. The Board considered information regarding the Manager’s costs in serving as the Fund’s investment adviser, including the costs associated with the personnel and systems necessary to manage the Fund, and information regarding the Manager’s profitability from its relationship with the Fund. The Board reviewed whether the Manager may realize economies of scale in managing and supporting the Fund. The Board noted that the Fund currently has management fee breakpoints, which are intended to share with Fund shareholders economies of scale that may exist as the Fund’s assets grow.
Other Benefits to the Manager. In addition to considering the profits realized by the Manager, the Board considered information that was provided regarding the direct and indirect benefits the Manager receives as a result of its relationship with the Fund, including compensation paid to the Manager’s affiliates and research provided to the Manager in connection with permissible brokerage arrangements (soft dollar arrangements). The Board also considered that the Manager must be able to pay and retain experienced professional personnel at competitive rates to provide quality services to the Fund.
Conclusions. These factors were also considered by the independent Trustees meeting separately from the full Board, assisted by experienced counsel to the Fund and to the independent Trustees. Fund counsel and the independent Trustees’ counsel are independent of the Manager within the meaning and intent of the Securities and Exchange Commission Rules.
Based on its review of the information it received and its evaluations described above, the Board, including a majority of the independent Trustees, decided to continue the Agreement. In addition, the Board, including a majority of the Independent Trustees, approved the restructuring of the Fund’s investment advisory arrangement so that effective January 1, 2013, (i) OFI Global Asset Management, Inc. (“OFI Global”), a wholly owned subsidiary of the Manager, will serve as the investment adviser to the Fund in place of the Manager under a Restated Advisory Agreement (“Restated Advisory Agreement”), and (ii) OFI Global will enter into a Sub-Advisory Agreement (“Sub-Advisory Agreement”) with the Manager to provide investment sub-advisory services to the Fund. OFI Global will pay the Manager a percentage of the net investment advisory fee (after all applicable waivers have been deducted) that it receives from the Fund. The Agreement will continue until earlier of August 31, 2013 or the effective date of the Restated Advisory Agreement between the Fund and OFI Global. The Restated Advisory Agreement and Sub-Advisory Agreement will continue until August 31, 2013.
In arriving at its decisions, the Board did not single out any factor or factors as being more important than others, but considered all of the above information, and considered the terms and conditions of the Agreement, Restated Advisory Agreement and Sub-Advisory Agreement, including the management fees, in light of all the surrounding circumstances.
OPPENHEIMER SMALL- & MID-CAP GROWTH FUND/VA 23
| | |
PORTFOLIO PROXY VOTING POLICIES AND PROCEDURES; UPDATES TO STATEMENTS OF INVESTMENTS Unaudited |
The Fund has adopted Portfolio Proxy Voting Policies and Procedures under which the Fund votes proxies relating to securities (“portfolio proxies”) held by the Fund. A description of the Fund’s Portfolio Proxy Voting Policies and Procedures is available (i) without charge, upon request, by calling the Fund toll-free at 1.800.525.7048, (ii) on the Fund’s website at oppenheimerfunds.com, and (iii) on the SEC’s website at www.sec.gov. In addition, the Fund is required to file Form N-PX, with its complete proxy voting record for the 12 months ended June 30th, no later than August 31st of each year. The Fund’s voting record is available (i) without charge, upon request, by calling the Fund toll-free at 1.800.525.7048, and (ii) in the Form N-PX filing on the SEC’s website at www.sec.gov.
The Fund files its complete schedule of portfolio holdings with the SEC for the first quarter and the third quarter of each fiscal year on Form N-Q. The Fund’s Form N-Q filings are available on the SEC’s website at www.sec.gov. Those forms may be reviewed and copied at the SEC’s Public Reference Room in Washington, D.C. Information on the operation of the Public Reference Room may be obtained by calling 1-800-SEC-0330.
24 OPPENHEIMER SMALL- & MID-CAP GROWTH FUND/VA
| | |
TRUSTEES AND OFFICERS BIOS Unaudited |
| | |
Name, Position(s) Held with
the Fund, Length of Service,
Age | | Principal Occupation(s) During the Past 5 Years; Other Trusteeships/Directorships Held; Number of Portfolios in
the Fund Complex Currently Overseen |
| |
| INDEPENDENT TRUSTEES | | The address of each Trustee in the chart below is 6803 S. Tucson Way, Centennial, Colorado 80112-3924. Each Trustee serves for an indefinite term, or until his or her resignation, retirement, death or removal |
| |
Sam Freedman, Chairman of the Board of Trustees (since 2012) and Trustee (since 1996) Age: 72 | | Director of Colorado UpLIFT (charitable organization) (since September 1984). Mr. Freedman held several positions with the Sub-Adviser and with subsidiary or affiliated companies of the Sub-Adviser (until October 1994). Oversees 36 portfolios in the OppenheimerFunds complex. Mr. Freedman has served on the Boards of certain Oppenheimer funds since 1996, during which time he has become familiar with the Fund’s (and other Oppenheimer funds’) financial, accounting, regulatory and investment matters and has contributed to the Boards’ deliberations. |
| |
Edward L. Cameron, Trustee (since 1999) Age: 74 | | Member of The Life Guard of Mount Vernon (George Washington historical site) (June 2000 – June 2006); Partner of PricewaterhouseCoopers LLP (accounting firm) (July 1974-June 1999); Chairman of Price Waterhouse LLP Global Investment Management Industry Services Group (accounting firm) (July 1994-June 1998). Oversees 36 portfolios in the OppenheimerFunds complex. Mr. Cameron has served on the Boards of certain Oppenheimer funds since 1999, during which time he has become familiar with the Fund’s (and other Oppenheimer funds’) financial, accounting, regulatory and investment matters and has contributed to the Boards’ deliberations. |
| |
Jon S. Fossel, Trustee (since 1995) Age: 70 | | Chairman of the Board (2006-December 2011) and Director (June 2002-December 2011) of UNUMProvident (insurance company); Director of Northwestern Energy Corp. (public utility corporation) (November 2004-December 2009); Director of P.R. Pharmaceuticals (October 1999-October 2003); Director of Rocky Mountain Elk Foundation (non-profit organization) (February 1998-February 2003 and February 2005-February 2007); Chairman and Director (until October 1996) and President and Chief Executive Officer (until October 1995) of the Sub-Adviser; President, Chief Executive Officer and Director of the following: Oppenheimer Acquisition Corp. (“OAC”) (parent holding company of the Sub-Adviser), Shareholders Services, Inc. and Shareholder Financial Services, Inc. (until October 1995). Oversees 36 portfolios in the OppenheimerFunds complex. Mr. Fossel has served on the Boards of certain Oppenheimer funds since 1990, during which time he has become familiar with the Fund’s (and other Oppenheimer funds’) financial, accounting, regulatory and investment matters and has contributed to the Boards’ deliberations. |
| |
Richard F. Grabish, Trustee (since 2012) Age: 64 | | Formerly Senior Vice President and Assistant Director of Sales and Marketing (March 1997-December 2007), Director (March 1987-December 2007) and Manager of Private Client Services (June 1985-June 2005) of A.G. Edwards & Sons, Inc. (broker/dealer and investment firm); Chairman and Chief Executive Officer of A.G. Edwards Trust Company, FSB (March 2001-December 2007); President and Vice Chairman of A.G. Edwards Trust Company, FSB (investment adviser) (April 1987-March 2001); President of A.G. Edwards Trust Company, FSB (investment adviser) (June 2005-December 2007). Oversees 36 portfolios in the OppenheimerFunds complex. Mr. Grabish has served on the Boards of certain Oppenheimer funds since 2001, during which time he has become familiar with the Fund’s (and other Oppenheimer funds’) financial, accounting, regulatory and investment matters and has contributed to the Boards’ deliberations. |
| |
Beverly L. Hamilton, Trustee (since 2002) Age: 66 | | Trustee of Monterey Institute for International Studies (educational organization) (since February 2000); Board Member of Middlebury College (educational organization) (December 2005-June 2011); Chairman (since 2010) of American Funds’ Emerging Markets Growth Fund, Inc. (mutual fund); Director of The California Endowment (philanthropic organization) (April 2002-April 2008); Director (February 2002-2005) and Chairman of Trustees (2006-2007) of the Community Hospital of Monterey Peninsula; Director (October 1991-2005); Vice Chairman (2006-2009) of American Funds’ Emerging Markets Growth Fund, Inc. (mutual fund); President of ARCO Investment Management Company (February 1991-April 2000); Member of the investment committees of The Rockefeller Foundation (2001-2006) and The University of Michigan (since 2000); Advisor at Credit Suisse First Boston’s Sprout venture capital unit (venture capital fund) (1994-January 2005); Trustee of MassMutual Institutional Funds (investment company) (1996-June 2004); Trustee of MML Series Investment Fund (investment company) (April 1989-June 2004); Member of the investment committee of Hartford Hospital (2000-2003); and Advisor to Unilever (Holland) pension fund (2000-2003). Oversees 36 portfolios in the OppenheimerFunds complex. Ms. Hamilton has served on the Boards of certain Oppenheimer funds since 2002, during which time she has become familiar with the Fund’s (and other Oppenheimer funds’) financial, accounting, regulatory and investment matters and has contributed to the Boards’ deliberations. |
| |
Victoria J. Herget, Trustee (since 2012) Age: 61 | | Independent Director of the First American Funds (mutual fund family) (2003-2011); former Managing Director (1993-2001), Principal (1985-1993), Vice President (1978-1985) and Assistant Vice President (1973-1978) of Zurich Scudder Investments (and its predecessor firms); Board Chair (2008-Present) and Director (2004-Present), United Educators (insurance company); Trustee (1992-2007), Chair of the Board of Trustees (1999-2007), Investment Committee Chair (1994-1999) and Investment Committee member (2007-2010) of Wellesley College; Trustee (since 2000) and Chair (since 2010), Newberry Library; Trustee, Mather LifeWays (since 2001); Trustee, BoardSource (2006-2009) and Chicago City Day School (1994-2005). Oversees 36 portfolios in the OppenheimerFunds complex. Ms. Herget has served on the Boards of certain Oppenheimer funds since 2012, during which time she has become familiar with the Fund’s (and other Oppenheimer funds’) financial, accounting, regulatory and investment matters and has contributed to the Boards’ deliberations. |
| |
Robert J. Malone, Trustee (since 2002) Age: 68 | | Board of Directors of Opera Colorado Foundation (non-profit organization) (since March 2008); Director of Jones Knowledge, Inc. (2006-2010); Director of Jones International University (educational organization) (since August 2005); Chairman, Chief Executive Officer and Director of Steele Street Bank & Trust (commercial banking) (since August 2003); Director of Colorado UpLIFT (charitable organization) (1986-2010); Trustee of the Gallagher Family Foundation (non-profit organization) (since 2000); Former Chairman of U.S. Bank-Colorado (subsidiary of U.S. Bancorp and formerly Colorado National Bank) (July 1996-April 1999); Director of Commercial Assets, Inc. (real estate investment trust) (1993-2000); Director of Jones Knowledge, Inc. (2001-July 2004); Director of U.S. Exploration, Inc. (oil and gas exploration) (1997-February 2004); Chairman of the Board (1991-1994) and Trustee (1985-1994) of Regis University; and Chairman of the Board (1990-1991) and Trustee (1984-1999) of Young Presidents Organization. Oversees 36 portfolios in the OppenheimerFunds complex. Mr. Malone has served on the Boards of certain Oppenheimer funds since 2002, during which time he has become familiar with the Fund’s (and other Oppenheimer funds’) financial, accounting, regulatory and investment matters and has contributed to the Boards’ deliberations. |
| |
F. William Marshall, Jr., Trustee (since 2000) Age: 70 | | Trustee Emeritus of Worcester Polytech Institute (WPI) (private university) (since 2009); Trustee of MassMutual Select Funds (formerly MassMutual Institutional Funds) (investment company) (since 1996) and MML Series Investment Fund (investment company) (since 1996) and Mass Mutual Premier Funds (investment company) (since January 2012); President and Treasurer of the SIS Funds (private charitable fund) (January 1999 – March 2011); Former Trustee of WPI (1985-2008); Former Chairman of the Board (2004-2006) and Former Chairman of the Investment Committee of WPI (1994-2008); Chairman of SIS & Family Bank, F.S.B. (formerly SIS Bank) (commercial bank) (January 1999-July 1999); Executive Vice President of Peoples Heritage Financial Group, Inc. (commercial bank) (January 1999-July 1999); and Former President and Chief Executive Officer of SIS Bancorp. (1993-1999). Oversees 40 portfolios in the OppenheimerFunds complex. Mr. Marshall has served on the Boards of certain Oppenheimer funds since 2000, during which time he has become familiar with the Fund’s (and other Oppenheimer funds’) financial, accounting, regulatory and investment matters and has contributed to the Boards’ deliberations. |
OPPENHEIMER SMALL- & MID-CAP GROWTH FUND/VA 25
| | |
TRUSTEES AND OFFICERS BIOS Unaudited / Continued |
| | |
Karen L. Stuckey, Trustee (since 2012) Age: 59 | | Partner (1990-2012) of PricewaterhouseCoopers LLP (held various positions 1975-1990); Trustee (1992-2006) and member of Executive, Nominating and Audit Committees and Chair of Finance Committee of Lehigh University; and member, Women’s Investment Management Forum since inception. Oversees 36 portfolios in the OppenheimerFunds complex. Ms. Stuckey has served on the Boards of certain Oppenheimer funds since 2012, during which time she has become familiar with the Fund’s (and other Oppenheimer funds’) financial, accounting, regulatory and investment matters and has contributed to the Boards’ deliberations. |
| |
James D. Vaughn, Trustee (since 2012) Age: 67 | | Retired; former managing partner (1994-2001) of Denver office of Deloitte & Touche LLP, (held various positions 1969-1993); Trustee and Chairman of the Audit Committee of Schroder Funds (2003-2012); Board member and Chairman of Audit Committee of AMG National Trust Bank (since 2005); Trustee, Audit Committee member and Investment Committee member, University of South Dakota Foundation (since 1996); Board member, Executive Committee Member, Audit Committee Member and past Board Chair, Junior Achievement (since 1993); former Board member, Mile High United Way, Boys and Girls Clubs, Boy Scouts, Colorado Business Committee for the Arts, Economic Club of Colorado and Metro Denver Network. Oversees 36 portfolios in the OppenheimerFunds complex. Mr. Vaughn has served on the Boards of certain Oppenheimer funds since 2012, during which time he has become familiar with the Fund’s (and other Oppenheimer funds’) financial, accounting, regulatory and investment matters and has contributed to the Boards’ deliberations. |
| INTERESTED TRUSTEE AND OFFICER | | The address of Mr. Glavin is Two World Financial Center, 225 Liberty Street, 11th Floor, New York, New York 10281-1008. Mr. Glavin serves as a Trustee for an indefinite term, or until his resignation, retirement, death or removal and as an Officer for an indefinite term, or until his resignation, retirement, death or removal. Mr. Glavin is an Interested Trustee due to his positions with OppenheimerFunds, Inc. and its affiliates. |
| |
William F. Glavin, Jr., Trustee, President and Principal Executive Officer (since 2009) Age: 54 | | Chief Executive Officer of OppenheimerFunds (since January 2013); Director, Chief Executive Officer and President of the Manager (since January 2013); Chairman of the Sub-Adviser (December 2009-December 2012); Chief Executive Officer (January 2009-December 2012) and Director of the Sub-Adviser (since January 2009); President of the Sub-Adviser (May 2009-December 2012); Management Director (since June 2009), President (since December 2009) and Chief Executive Officer (since January 2011) of Oppenheimer Acquisition Corp. (“OAC”) (the Sub-Adviser’s parent holding company); Director of Oppenheimer Real Asset Management, Inc. (since March 2010); Executive Vice President (March 2006-February 2009) and Chief Operating Officer (July 2007-February 2009) of Massachusetts Mutual Life Insurance Company (OAC’s parent company); Director (May 2004-March 2006) and Chief Operating Officer and Chief Compliance Officer (May 2004-January 2005), President (January 2005-March 2006) and Chief Executive Officer (June 2005-March 2006) of Babson Capital Management LLC; Director (March 2005-March 2006), President (May 2003-March 2006) and Chief Compliance Officer (July 2005-March 2006) of Babson Capital Securities, Inc. (a broker-dealer); President (May 2003-March 2006) of Babson Investment Company, Inc.; Director (May 2004-August 2006) of Babson Capital Europe Limited; Director (May 2004-October 2006) of Babson Capital Guernsey Limited; Director (May 2004-March 2006) of Babson Capital Management LLC; Non-Executive Director (March 2005-March 2007) of Baring Asset Management Limited; Director (February 2005-June 2006) Baring Pension Trustees Limited; Director and Treasurer (December 2003-November 2006) of Charter Oak Capital Management, Inc.; Director (May 2006-September 2006) of C.M. Benefit Insurance Company; Director (May 2008-June 2009) and Executive Vice President (June 2007-July 2009) of C.M. Life Insurance Company; President (March 2006-May 2007) of MassMutual Assignment Company; Director (January 2005-December 2006), Deputy Chairman (March 2005-December 2006) and President (February 2005-March 2005) of MassMutual Holdings (Bermuda) Limited; Director (May 2008-June 2009) and Executive Vice President (June 2007-July 2009) of MML Bay State Life Insurance Company; Chief Executive Officer and President (April 2007-January 2009) of MML Distributors, LLC; and Chairman (March 2006-December 2008) and Chief Executive Officer (May 2007-December 2008) of MML Investors Services, Inc. An officer of 86 portfolios in the OppenheimerFunds complex. |
| OTHER OFFICERS OF THE FUND | | The addresses of the Officers in the chart below are as follows: for Messrs. Zibelli, Gabinet and Ms. Nasta, Two World Financial Center, 225 Liberty Street, New York, New York 10281-1008, for Messrs. Vandehey and Wixted, 6803 S. Tucson Way, Centennial, Colorado 80112-3924. Each Officer serves for an indefinite term or until his or her resignation, retirement, death or removal. |
| |
Ronald J. Zibelli, Jr., Vice President (since 2008) Age: 53 | | Vice President of the Sub-Adviser (since May 2006); a Chartered Financial Analyst. Prior to joining the Sub-Adviser, Managing Director and Small Cap Growth Team Leader at Merrill Lynch Investment Managers (January 2002-May 2006). A portfolio manager and officer of 3 portfolios in the OppenheimerFunds complex. |
| |
Arthur S. Gabinet, Secretary and Chief Legal Officer (since 2011) Age: 54 | | General Counsel of OppenheimerFunds (since January 2013); Executive Vice President, Secretary and General Counsel of the Manager (since January 2013); General Counsel OFI SteelPath, Inc. (since January 2013); Executive Vice President (May 2010-December 2012) and General Counsel (since January 2011) of the Sub-Adviser; General Counsel of the Distributor (since January 2011); General Counsel of Centennial Asset Management Corporation (January 2011-December 2012); Executive Vice President (January 2011-December 2012) and General Counsel of HarbourView Asset Management Corporation (since January 2011); Assistant Secretary (since January 2011) and Director (since January 2011) of OppenheimerFunds International Ltd. and OppenheimerFunds plc; Director of Oppenheimer Real Asset Management, Inc. (January 2011-December 2012) and General Counsel (since January 2011); Executive Vice President (January 2011-December 2011) and General Counsel of Shareholder Financial Services, Inc. and Shareholder Services, Inc. (since January 2011); Executive Vice President (January 2011-December 2012) and General Counsel of OFI Private Investments Inc. (since January 2011); Vice President of OppenheimerFunds Legacy Program (January 2011-December 2011); Executive Vice President (January 2011-December 2012) and General Counsel of OFI Institutional Asset Management, Inc. (since January 2011); General Counsel, Asset Management of the Sub-Adviser (May 2010-December 2010); Principal, The Vanguard Group (November 2005-April 2010); District Administrator, U.S. Securities and Exchange Commission (January 2003-October 2005). An officer of 86 portfolios in the OppenheimerFunds complex. |
| |
Christina M. Nasta, Vice President and Chief Business Officer (since 2011) Age: 39 | | Senior Vice President of OppenheimerFunds Distributor, Inc. (since January 2013); Senior Vice President of the Sub-Adviser (July 2010-December 2012); Vice President of the Sub-Adviser (January 2003-July 2010); Vice President of OppenheimerFunds Distributor, Inc. (January 2003-July 2010). An officer of 86 portfolios in the OppenheimerFunds complex. |
| |
Mark S. Vandehey, Vice President and Chief Compliance Officer (since 2004) Age: 62 | | Chief Compliance Officer of OppenheimerFunds (since January 2013); Senior Vice President and Chief Compliance Officer of the Manager (since January 2013); Chief Compliance Officer of OFI SteelPath, Inc. (since January 2013); Senior Vice President of the Sub-Adviser (March 2004-December 2012); Chief Compliance Officer of the Sub-Adviser, OppenheimerFunds Distributor, Inc., OFI Trust Company, OFI Institutional Asset Management, Inc., Oppenheimer Real Asset Management, Inc., OFI Private Investments, Inc., Harborview Asset Management Corporation, Trinity Investment Management Corporation, and Shareholder Services, Inc. (since March 2004); Vice President of OppenheimerFunds Distributor, Inc., Centennial Asset Management Corporation and Shareholder Services, Inc. (June 1983-December 2012). An officer of 86 portfolios in the OppenheimerFunds complex. |
26 OPPENHEIMER SMALL- & MID-CAP GROWTH FUND/VA
| | |
Brian W. Wixted, Treasurer and Principal Financial & Accounting Officer (since 1999) Age: 53 | | Senior Vice President of the Manager (since January 2013); Treasurer of the Sub-Adviser, HarbourView Asset Management Corporation, Shareholder Financial Services, Inc., Shareholder Services, Inc., and Oppenheimer Real Asset Management, Inc. (March 1999-June 2008), OFI Private Investments, Inc. (March 2000-June 2008), OppenheimerFunds International Ltd. and OppenheimerFunds plc (since May 2000), OFI Institutional Asset Management, Inc. (November 2000-June 2008), and OppenheimerFunds Legacy Program (charitable trust program established by the Sub-Adviser) (June 2003-December 2011); Treasurer and Chief Financial Officer of OFI Trust Company (since May 2000); Assistant Treasurer of Oppenheimer Acquisition Corporation (March 1999-June 2008). An officer of 86 portfolios in the OppenheimerFunds complex. |
The Fund’s Statement of Additional Information contains additional information about the Fund’s Trustees and Officers and is available without charge upon request, by calling 1.800.CALL OPP (225.5677).
OPPENHEIMER SMALL- & MID-CAP GROWTH FUND/VA 27
| | |
OPPENHEIMER SMALL & MID-CAP GROWTH FUND/VA |
| | |
| A Series of Oppenheimer Variable Account Funds |
| |
| Manager | | OFI Global Asset Management, Inc. |
| |
| Sub-Adviser | | OppenheimerFunds, Inc. |
| |
| Distributor | | OppenheimerFunds Distributor, Inc. |
| |
Transfer and Shareholder Servicing Agent | | OFI Global Asset Management, Inc. |
| |
Sub-Transfer Agent | | Shareholder Services, Inc. DBA OppenheimerFunds Services |
| |
Independent Registered Public Accounting Firm | | KPMG LLP |
| |
| Counsel | | K&L Gates LLP |
| |
| | Before investing, investors should carefully consider a fund’s investment objectives, risks, charges and expenses. Fund prospectuses and summary prospectuses contain this and other information about the funds, and may be obtained by asking your financial advisor, or calling us at 1.800.988.8287. Read prospectuses and summary prospectuses carefully before investing. |
© 2013 OppenheimerFunds, Inc. All rights reserved

December 31, 2012
| | | | |
| | | |
| | | Oppenheimer Balanced Fund/VA A Series of Oppenheimer Variable Account Funds | | Annual Report |
ANNUAL REPORT
Listing of Top Holdings
Fund Performance Discussion
Financial Statements

OPPENHEIMER BALANCED FUND/VA
Portfolio Managers: Mitch Williams, CFA, Krishna Memani and Peter A. Strzalkowski, CFA
| | | | | | |
Average Annual Total Returns
For the Periods Ended 12/31/12 | | |
| | | |
| | | 1-Year | | 5-Year | | 10-Year |
| Non-Service Shares | | 12.34% | | –2.52% | | 3.80% |
| Service Shares | | 12.11 | | –2.76 | | 3.54 |
The performance data quoted represents past performance, which does not guarantee future results. The investment return and principal value of an investment in the Fund will fluctuate so that an investor’s shares, when redeemed, may be worth more or less than their original cost. Current performance may be lower or higher than the performance quoted. For performance data current to the most recent month end, call us at 1.800.988.8287. The Fund’s total returns should not be expected to be the same as the returns of other funds, whether or not both funds have the same portfolio managers and/or similar names. The Fund’s total returns include changes in share price and reinvested distributions but do not include the charges associated with the separate account products that offer this Fund. Such performance would have been lower if such charges were taken into account.
Portfolio holdings and allocations are subject to change. Percentages are as of December 31, 2012, and are based on the total market value of investments.
| | | | |
| Top Ten Common Stock Holdings | | | |
| Chevron Corp. | | | 3.4 | % |
| Humana, Inc. | | | 3.0 | |
| Honeywell International, Inc. | | | 2.2 | |
| Merck & Co., Inc. | | | 2.1 | |
| Exxon Mobil Corp. | | | 2.0 | |
| Marsh & McLennan Cos., Inc. | | | 1.9 | |
| Wells Fargo & Co. | | | 1.9 | |
| Verizon Communications, Inc. | | | 1.9 | |
| Target Corp. | | | 1.7 | |
| Lowe’s Cos., Inc. | | | 1.7 | |
Portfolio holdings and allocations are subject to change. Percentages are as of December 31, 2012, and are based on net assets.
| | | | |
| 2 | | | | OPPENHEIMER BALANCED FUND/VA |
FUND PERFORMANCE DISCUSSION
The Fund’s Non-Service shares produced a total return of 12.34% during the one-year reporting period ended December 31, 2012. On a relative basis, the Fund outperformed the Barclays Capital U.S. Aggregate Bond Index, which returned 4.22%, and underperformed the Russell 1000 Value Index and the S&P 500 Index, which returned 17.51% and 16%, respectively. Measured separately, the Fund’s equity component underperformed the Russell 1000 Value Index and the S&P 500 Index, and its fixed-income component outperformed the Barclays Capital U.S. Aggregate Bond Index.
Economic and Market Environment
Higher-yielding fixed-income securities and domestic equities generally produced positive returns this period. The period began during a time of improved market sentiment in which the United States managed to avoid a return to recession and European policymakers appeared to take steps to address the region’s sovereign debt and banking sector crises. Renewed investor optimism helped produce gains in the U.S. risk markets as well as across a number of international markets over the first three months of 2012. The rebound gained momentum after the European Central Bank (the “ECB”) implemented dual Long-Term Refinancing Operations to enhance liquidity for troubled banks and reduce rates on newly issued sovereign debt securities.
The second quarter was more volatile for the markets. In the U.S., slower than expected first quarter growth contributed to a sell-off in the U.S. markets. Consumer confidence dropped as U.S. unemployment figures ticked slightly upwards after showing signs of improvement from the recession highs. In addition, uncertainty around the November 2012 elections and the potential elimination of a significant amount of government stimulus in the beginning of 2013, resulted in companies stalling spending and hiring, contributing to the economic slowdown. The reduction in growth outside of the U.S. also negatively impacted exports, which was exacerbated by a strengthening dollar. Outside of the U.S., the fear of contagion from the worsening European sovereign debt crisis and a recession across much of Europe also resulted in increased market volatility.
In the second half of the period, the markets generally resumed an upward trend despite ongoing concerns. In the U.S., the Federal Reserve (the “Fed”) introduced QE3, under which it announced plans to purchase mortgage-backed bonds on a monthly basis until the labor market shows signs of substantial improvement. Markets in the U.S. were also bolstered by the continued improvement of the housing market. However, there was volatility due to uncertainty over the outcome of the Presidential election. In addition, the lack of visibility about resolution of the “fiscal cliff” weighed further on both business and consumer spending. These concerns were not enough to offset earlier gains, and immediately following the close of the period, the U.S. Congress enacted a last minute temporary resolution to the fiscal cliff.
Outside of the U.S., the results of elections in Greece and continued efforts by European policymakers to stabilize the situation in the region made the imminent fracturing of the Eurozone and the serious consequences that might have for the euro far less likely. The ECB also increased its efforts to stimulate economic growth, as it committed to potentially unlimited bond purchases to ease financing pressure on countries like Spain and Italy. Under the plan, these and other members of the European Union (excluding Greece) would be able to maintain access to funding at sustainable interest rates, on the condition that they continue with strict reform programs.
Fund Review
The fixed-income component benefited from its exposure to spread products, particularly mortgage-backed obligations, over government debt. Among mortgage-backed obligations, the fixed-income component’s allocation to residential mortgage-backed securities, commercial mortgage-backed securities and asset-backed securities, all contributed positively to performance. These securities benefited from an ongoing recovery in housing in addition to the stabilization of commercial real estate. The fixed-income component also received positive contributions from investment grade corporate bonds and high yield debt. While the Fund’s emphasis on spread products over government debt benefited performance this period, U.S. Treasuries did produce positive returns, and so our limited exposure to them was the primary detractor from relative performance.
| | | | |
| 3 | | | | OPPENHEIMER BALANCED FUND/VA |
FUND PERFORMANCE DISCUSSION
The equity component’s underperformance relative to the Russell 1000 Value Index stemmed from weaker relative stock selection in the health care and energy sectors. Positive stock selection in the financials sector and an overweight position in the consumer discretionary sector, which was the strongest performing sector of the Russell 1000 Value Index, benefited performance.
During the period, four of the top five performing stocks for the Fund were within the financials sector. Following several moves by the Fed to help spur growth, bank stocks generally rallied during the period and financials was among the top performing sectors of the Russell 1000 Value Index. Bank stocks benefited as tier one capital ratios improved faster than expected, the housing market continued to improve and mortgage-related headline risk decreased. The Goldman Sachs Group, Inc., Wells Fargo & Co., JPMorgan Chase & Co. and U.S. Bancorp all were top performers for the Fund. We exited our position in U.S. Bancorp. Also contributing to performance was consumer discretionary stock Comcast Corp. The cable provider’s high-speed Internet subscriptions increased during the period, which contributed to a positive earnings surprise. Additionally, Comcast aggressively repurchased shares and substantially increased its dividend.
The two most significant detractors from the equity component’s performance were Navistar International Corp. and Humana, Inc. Navistar, which the Fund established a position in this period, is a manufacturer of commercial and military trucks. The stock was negatively impacted by higher costs and declining share in the Heavy Duty Class 8 truck market as it seeks to comply with new emissions rules for certain engines. Humana, Inc. detracted from results as the managed health care company reported a decrease in profit in its first quarter, breaking a streak of four straight profit increases.
Investors should consider the Fund’s investment objective, risks, charges and expenses carefully before investing. The Fund’s prospectus and summary prospectus contain this and other information about the Fund, and may be obtained by asking your financial advisor or calling us at 1.800.988.8287. Read prospectuses and summary prospectuses carefully before investing.
Total returns include changes in share price and reinvestment of dividends and capital gains distributions in a hypothetical investment for the periods shown.
The Fund’s investment strategy and focus can change over time. The mention of specific fund holdings does not constitute a recommendation by OppenheimerFunds, Inc. or its affiliates.
Shares of Oppenheimer funds are not deposits or obligations of any bank, are not guaranteed by any bank, are not insured by the FDIC or any other agency, and involve investment risks, including the possible loss of the principal amount invested.
Comparing the Fund’s Performance to the Market. The graphs that follow show the performance of a hypothetical $10,000 investment in each share class of the Fund held until December 31, 2012. Performance is measured over a ten-fiscal-year period for both Classes. Performance information does not reflect charges that apply to separate accounts investing in the Fund. If these charges were taken into account, performance would be lower. The graphs assume that all dividends and capital gains distributions were reinvested in additional shares.
The Fund’s performance is compared to the performance of the S&P 500 Index, the Barclays Capital U.S. Aggregate Bond Index and the Russell 1000 Value Index. The S&P 500 Index is an index of large-capitalization equity securities that is a measure of the general domestic stock market. The Barclays Capital U.S. Aggregate Bond Index is an index of U.S. corporate, government and mortgage-backed securities that is a measure of the domestic bond market. The Russell 1000 Value Index is an index that measures the performance of large-capitalization value stocks. The indices are unmanaged and cannot be purchased directly by investors. Index performance is shown for illustrative purposes only and does not predict or depict the performance of the Fund. While index comparisons may be useful to provide a benchmark for the Fund’s performance, it must be noted that the Fund’s investments are not limited to the investments comprising the indices.
| | | | |
| 4 | | | | OPPENHEIMER BALANCED FUND/VA |
FUND PERFORMANCE DISCUSSION
Non-Service Shares
Comparison of Change in Value of $10,000 Hypothetical Investments in:
Average Annual Total Returns of Non-Service Shares of the Fund at 12/31/12
1-Year 12.34% 5-Year -2.52% 10-Year 3.80%
Service Shares
Comparison of Change in Value of $10,000 Hypothetical Investments in:
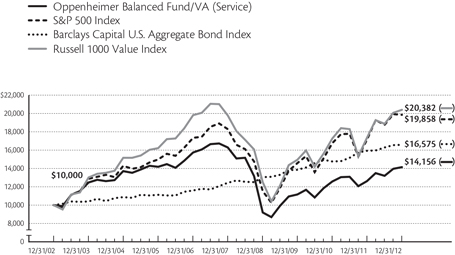
Average Annual Total Returns of Service Shares of the Fund at 12/31/12
1-Year 12.11% 5-Year -2.76% 10-Year 3.54%
The performance data quoted represents past performance, which does not guarantee future results. The investment return and principal value of an investment in the Fund will fluctuate so that an investor’s shares, when redeemed, may be worth more or less than their original cost. Current performance may be lower or higher than the performance quoted. For performance data current to the most recent month end, call us at 1.800.988.8287. The Fund’s total returns should not be expected to be the same as the returns of other funds, whether or not both funds have the same portfolio managers and/or similar names. The Fund’s total returns include changes in share price and reinvested distributions but do not include the charges associated with the separate account products that offer this Fund. Such performance would have been lower if such charges were taken into account.
| | | | |
| 5 | | | | OPPENHEIMER BALANCED FUND/VA |
FUND EXPENSES
Fund Expenses. As a shareholder of the Fund, you incur two types of costs: (1) transaction costs and (2) ongoing costs, including management fees; distribution and service fees; and other Fund expenses. These examples are intended to help you understand your ongoing costs (in dollars) of investing in the Fund and to compare these costs with the ongoing costs of investing in other mutual funds.
The examples are based on an investment of $1,000.00 invested at the beginning of the period and held for the entire 6-month period ended December 31, 2012.
Actual Expenses. The first section of the table provides information about actual account values and actual expenses. You may use the information in this section for the class of shares you hold, together with the amount you invested, to estimate the expense that you paid over the period. Simply divide your account value by $1,000.00 (for example, an $8,600.00 account value divided by $1,000.00 = 8.60), then multiply the result by the number in the first section under the heading entitled “Expenses Paid During Period” to estimate the expenses you paid on your account during this period.
Hypothetical Example for Comparison Purposes. The second section of the table provides information about hypothetical account values and hypothetical expenses based on the Fund’s actual expense ratio for each class of shares, and an assumed rate of return of 5% per year for each class before expenses, which is not the actual return. The hypothetical account values and expenses may not be used to estimate the actual ending account balance or expenses you paid for the period. You may use this information to compare the ongoing costs of investing in the Fund and other funds. To do so, compare this 5% hypothetical example for the class of shares you hold with the 5% hypothetical examples that appear in the shareholder reports of the other funds.
Please note that the expenses shown in the table are meant to highlight your ongoing costs only and do not reflect any charges associated with the separate accounts that offer this Fund. Therefore, the “hypothetical” lines of the table are useful in comparing ongoing costs only, and will not help you determine the relative total costs of owning different funds. In addition, if these separate account charges were included your costs would have been higher.
| | | | | | | | | | | | |
| Actual | | Beginning
Account
Value
July 1, 2012 | | | Ending
Account
Value
December 31, 2012 | | | Expenses
Paid During
6 Months Ended
December 31, 2012 | |
| Non-Service Shares | | $ | 1,000.00 | | | $ | 1,074.70 | | | $ | 3.50 | |
| Service Shares | | | 1,000.00 | | | | 1,073.80 | | | | 4.81 | |
| | | |
Hypothetical
(5% return before expenses) | | | | | | | | | |
| Non-Service Shares | | | 1,000.00 | | | | 1,021.77 | | | | 3.41 | |
| Service Shares | | | 1,000.00 | | | | 1,020.51 | | | | 4.68 | |
Expenses are equal to the Fund’s annualized expense ratio for that class, multiplied by the average account value over the period, multiplied by 184/366 (to reflect the one-half year period). Those annualized expense ratios, excluding indirect expenses from affiliated fund, based on the 6-month period ended December 31, 2012 are as follows:
| | | | |
| Class | | Expense Ratios | |
| Non-Service shares | | | 0.67 | % |
| Service shares | | | 0.92 | |
The expense ratios reflect voluntary waivers and/or reimbursements of expenses by the Fund’s Manager. Some of these undertakings may be modified or terminated at any time, as indicated in the Fund’s prospectus. The “Financial Highlights” tables in the Fund’s financial statements, included in this report, also show the gross expense ratios, without such waivers or reimbursements and reduction to custodian expenses, if applicable.
| | | | |
| 6 | | | | OPPENHEIMER BALANCED FUND/VA |
STATEMENT OF INVESTMENTS December 31, 2012
| | | | | | | | |
| | |
Shares | | | Value | |
| | | | | | | | | |
| Common Stocks—60.0% | |
| Consumer Discretionary—5.5% | |
| Automobiles—1.2% | | | | | | | | |
| Ford Motor Co. | | | 261,660 | | | $ | 3,388,497 | |
| Media—0.9% | | | | | | | | |
| Comcast Corp., Cl. A | | | 74,130 | | | | 2,770,979 | |
| Multiline Retail—1.7% | | | | | | | | |
| Target Corp. | | | 84,120 | | | | 4,977,380 | |
| Specialty Retail—1.7% | | | | | | | | |
| Lowe’s Cos., Inc. | | | 139,940 | | | | 4,970,669 | |
| Consumer Staples—5.9% | | | | | | | | |
| Beverages—2.2% | | | | | | | | |
| Coca-Cola Co. (The) | | | 49,070 | | | | 1,778,788 | |
| Molson Coors Brewing Co., Cl. B, Non-Vtg. | | | 63,160 | | | | 2,702,616 | |
| PepsiCo, Inc. | | | 26,080 | | | | 1,784,654 | |
| | | | | | |
|
|
|
| | | | | | | | 6,266,058 | |
| Food & Staples Retailing—1.5% | | | | | | | | |
| Walgreen Co. | | | 118,010 | | | | 4,367,550 | |
| Food Products—1.6% | | | | | | | | |
| Kellogg Co. | | | 82,740 | | | | 4,621,029 | |
| Household Products—0.6% | | | | | | | | |
| Procter & Gamble Co. | | | 28,000 | | | | 1,900,920 | |
| Energy—7.3% | | | | | | | | |
| Energy Equipment & Services—0.9% | | | | | |
| Baker Hughes, Inc. | | | 65,980 | | | | 2,694,623 | |
| Oil, Gas & Consumable Fuels—6.4% | | | | | |
| Apache Corp. | | | 18,420 | | | | 1,445,970 | |
| Chevron Corp. | | | 92,300 | | | | 9,981,322 | |
| Devon Energy Corp. | | | 24,090 | | | | 1,253,644 | |
| Exxon Mobil Corp. | | | 66,500 | | | | 5,755,575 | |
| | | | | | |
|
|
|
| | | | | | | | 18,436,511 | |
| Financials—14.1% | | | | | | | | |
| Capital Markets—1.5% | | | | | | | | |
| Goldman Sachs Group, Inc. (The) | | | 33,450 | | | | 4,266,882 | |
| Commercial Banks—5.5% | | | | | | | | |
| M&T Bank Corp. | | | 44,200 | | | | 4,352,374 | |
| PNC Financial Services Group, Inc. | | | 32,410 | | | | 1,889,827 | |
| SunTrust Banks, Inc. | | | 151,560 | | | | 4,296,726 | |
| Wells Fargo & Co. | | | 164,150 | | | | 5,610,647 | |
| | | | | | |
|
|
|
| | | | | | | | 16,149,574 | |
| Diversified Financial Services—2.0% | | | | | |
| Bank of America Corp. | | | 184,680 | | | | 2,142,288 | |
| Citigroup, Inc. | | | 23,650 | | | | 935,594 | |
| JPMorgan Chase & Co. | | | 64,110 | | | | 2,818,917 | |
| | | | | | |
|
|
|
| | | | | | | | 5,896,799 | |
| | | | | | | | |
| | |
Shares | | | Value | |
| | | | | | | | | |
| Insurance—5.1% | | | | | | | | |
| ACE Ltd. | | | 61,100 | | | $ | 4,875,780 | |
| Marsh & McLennan Cos., Inc. | | | 164,060 | | | | 5,655,148 | |
| MetLife, Inc. | | | 53,040 | | | | 1,747,138 | |
| Travelers Cos., Inc. (The) | | | 33,720 | | | | 2,421,770 | |
| | | | | | |
|
|
|
| | | | | | | | 14,699,836 | |
| Health Care—9.2% | | | | | | | | |
| Health Care Equipment & Supplies—1.3% | |
| Baxter International, Inc. | | | 54,390 | | | | 3,625,637 | |
| Health Care Providers & Services—4.6% | |
| Humana, Inc. | | | 125,430 | | | | 8,608,261 | |
| UnitedHealth Group, Inc. | | | 90,140 | | | | 4,889,194 | |
| | | | | | |
|
|
|
| | | | | | | | 13,497,455 | |
| Pharmaceuticals—3.3% | | | | | | | | |
| Merck & Co., Inc. | | | 146,100 | | | | 5,981,334 | |
| Teva Pharmaceutical Industries Ltd., Sponsored ADR | | | 94,290 | | | | 3,520,789 | |
| | | | | | |
|
|
|
| | | | | | | | 9,502,123 | |
| Industrials—5.9% | | | | | | | | |
| Aerospace & Defense—2.2% | | | | | | | | |
| Honeywell International, Inc. | | | 98,590 | | | | 6,257,507 | |
| Commercial Services & Supplies—0.7% | | | | | |
| Tyco International Ltd. | | | 69,760 | | | | 2,040,480 | |
| Construction & Engineering—0.9% | | | | | | | | |
| Quanta Services, Inc.1 | | | 100,780 | | | | 2,750,286 | |
| Machinery—1.6% | | | | | | | | |
| AGCO Corp.1 | | | 65,110 | | | | 3,198,203 | |
| Navistar International Corp.1 | | | 61,950 | | | | 1,348,652 | |
| | | | | | |
|
|
|
| | | | | | | | 4,546,855 | |
| Trading Companies & Distributors—0.5% | |
| AerCap Holdings NV1 | | | 111,480 | | | | 1,529,506 | |
| Information Technology—4.4% | | | | | | | | |
| Communications Equipment—1.5% | | | | | |
| Juniper Networks, Inc.1 | | | 217,940 | | | | 4,286,880 | |
| Computers & Peripherals—0.6% | | | | | | | | |
| Apple, Inc. | | | 3,550 | | | | 1,892,257 | |
| Electronic Equipment, Instruments & Components—0.7% | |
| TE Connectivity Ltd. | | | 55,780 | | | | 2,070,554 | |
| Semiconductors & Semiconductor Equipment—1.6% | |
| Analog Devices, Inc. | | | 50,760 | | | | 2,134,966 | |
| Xilinx, Inc. | | | 68,420 | | | | 2,456,278 | |
| | | | | | |
|
|
|
| | | | | | | | 4,591,244 | |
| Materials—3.4% | | | | | | | | |
| Chemicals—2.6% | | | | | | | | |
| LyondellBasell Industries NV, Cl. A | | | 54,181 | | | | 3,093,193 | |
| Mosaic Co. (The) | | | 78,080 | | | | 4,421,670 | |
| | | | | | |
|
|
|
| | | | | | | | 7,514,863 | |
| | | | |
| 7 | | | | OPPENHEIMER BALANCED FUND/VA |
STATEMENT OF INVESTMENTS Continued
| | | | | | | | |
| | |
Shares | | | Value | |
| Containers & Packaging—0.8% | | | | | |
| Rock-Tenn Co., Cl. A | | | 35,570 | | | $ | 2,486,699 | |
| Telecommunication Services—2.3% | |
| Diversified Telecommunication Services—2.3% | |
| AT&T, Inc. | | | 36,760 | | | | 1,239,180 | |
| Orbcomm, Inc.1 | | | 375 | | | | 1,470 | |
| Verizon Communications, Inc. | | | 127,370 | | | | 5,511,300 | |
| | | | | | |
|
|
|
| | | | | | | | 6,751,950 | |
| Utilities—2.0% | | | | | | | | |
| Electric Utilities—1.5% | | | | | | | | |
| American Electric Power Co., Inc. | | | 55,760 | | | | 2,379,837 | |
| Edison International | | | 42,120 | | | | 1,903,403 | |
| | | | | | |
|
|
|
| | | | | | | | 4,283,240 | |
| Multi-Utilities—0.5% | | | | | | | | |
| Public Service Enterprise Group, Inc. | | | 51,140 | | | | 1,564,884 | |
| | | | | | |
|
|
|
Total Common Stocks
(Cost $157,363,526) | | | | 174,599,727 | |
| | |
| | | Principal
Amount | | | | |
| Asset-Backed Securities—4.0% | |
AESOP Funding II LLC,
Automobile Receivables Nts.,
Series 2011-1A, Cl. A,
1.85%, 11/20/132 | | $ | 185,000 | | | | 186,867 | |
Ally Master Owner Trust,
Asset-Backed Nts.,
Series 2012-2, Cl. A, 0.709%, 3/15/163 | | | 350,000 | | | | 350,277 | |
American Credit Acceptance
Receivables Trust 2012-2,
Automobile Receivables-Backed Nts.,
Series 2012-2, Cl. A, 1.89%, 7/15/162 | | | 289,315 | | | | 290,665 | |
American Credit Acceptance
Receivables Trust 2012-3,
Automobile Receivable Nts.:
Series 2012-3, Cl. A, 1.64%, 11/15/162 | | | 115,000 | | | | 115,057 | |
| Series 2012-3, Cl. C, 2.78%, 9/17/182 | | | 55,000 | | | | 55,027 | |
AmeriCredit Automobile
Receivables Trust 2010-1,
Automobile Receivables-Backed Nts.,
Series 2010-1, Cl. D, 6.65%, 7/17/17 | | | 210,000 | | | | 223,428 | |
AmeriCredit Automobile
Receivables Trust 2010-2,
Automobile Receivables-Backed Nts.:
Series 2010-2, Cl. C, 4.52%, 10/8/15 | | | 290,000 | | | | 300,447 | |
| Series 2010-2, Cl. D, 6.24%, 6/8/16 | | | 40,000 | | | | 43,097 | |
AmeriCredit Automobile
Receivables Trust 2011-1,
Automobile Receivables-Backed Nts.,
Series 2011-1, Cl. D, 4.26%, 2/8/17 | | | 90,000 | | | | 95,771 | |
| | | | | | | | |
| | | Principal
Amount | | | Value | |
| Asset-Backed Securities Continued | |
AmeriCredit Automobile
Receivables Trust 2011-2,
Automobile Receivables-Backed Nts.:
Series 2011-2, Cl. B, 2.33%, 3/8/16 | | $ | 300,000 | | | $ | 305,269 | |
| Series 2011-2, Cl. D, 4%, 5/8/17 | | | 300,000 | | | | 316,145 | |
AmeriCredit Automobile
Receivables Trust 2011-4,
Automobile Receivables-Backed Nts.,
Series 2011-4, Cl. D, 4.08%, 7/10/17 | | | 500,000 | | | | 525,538 | |
AmeriCredit Automobile
Receivables Trust 2011-5,
Automobile Receivables-Backed Nts.,
Series 2011-5, Cl. D, 5.05%, 12/8/17 | | | 305,000 | | | | 330,091 | |
AmeriCredit Automobile
Receivables Trust 2012-1,
Automobile Receivables-Backed Nts.,
Series 2012-1, Cl. D, 4.72%, 3/8/18 | | | 270,000 | | | | 291,295 | |
AmeriCredit Automobile
Receivables Trust 2012-2,
Automobile Receivables-Backed Nts.,
Series 2012-2, Cl. D, 3.38%, 4/9/18 | | | 455,000 | | | | 471,339 | |
AmeriCredit Automobile
Receivables Trust 2012-5,
Automobile Receivables-Backed Nts.,
Series 2012-5, Cl. D, 3.27%, 12/10/18 | | | 225,000 | | | | 225,026 | |
Avis Budget Rental Car
Funding AESOP LLC,
Automobile Receivable Nts.:
Series 2010-3A, Cl. A, 4.64%, 5/20/162 | | | 20,000 | | | | 21,643 | |
| Series 2011-2A, Cl. A, 2.37%, 11/20/142 | | | 300,000 | | | | 307,687 | |
| Series 2012-1A, Cl. A, 2.054%, 8/20/162 | | | 235,000 | | | | 241,090 | |
Centre Point Funding LLC,
Asset-Backed Nts.,
Series 2010-1A, Cl. 1, 5.43%, 7/20/152 | | | 52,985 | | | | 57,092 | |
Citibank Credit Card Issuance Trust,
Credit Card Receivable Nts.,
Series 2003-C4, Cl. C4, 5%, 6/10/15 | | | 250,000 | | | | 254,576 | |
CPS Auto Trust,
Automobile Receivable Nts.:
Series 2012-B, Cl. A, 3.09%, 9/1/192 | | | 319,431 | | | | 320,738 | |
| Series 2012-C, Cl. A, 2.26%, 12/16/192 | | | 116,292 | | | | 116,381 | |
Credit Acceptance Auto Loan Trust, Automobile Receivable Nts.:
Series 2012-1A, Cl. A, 2.20%, 9/16/192 | | | 175,000 | | | | 176,089 | |
| Series 2012-2A, Cl. A, 1.52%, 3/15/202 | | | 100,000 | | | | 100,087 | |
| Series 2012-2A, Cl. B, 2.21%, 9/15/202 | | | 50,000 | | | | 50,584 | |
DSC Floorplan Master Owner Trust, Automobile Receivable Nts.,
Series 2011-1, Cl. A, 3.91%, 3/15/16 | | | 310,000 | | | | 316,253 | |
DT Auto Owner Trust 2010-1A,
Automobile Receivable Nts.,
Series 2010-1A, Cl. D, 5.92%, 9/15/162 | | | 190,000 | | | | 191,482 | |
| | | | |
| 8 | | | | OPPENHEIMER BALANCED FUND/VA |
| | | | | | | | |
| | | Principal
Amount | | | Value | |
| Asset-Backed Securities Continued | | | | | | | | |
DT Auto Owner Trust 2011-1A,
Automobile Receivable Nts.,
Series 2011-1A, Cl. C, 3.05%, 8/15/152 | | $ | 318,262 | | | $ | 319,250 | |
DT Auto Owner Trust 2011-2A,
Automobile Receivable Nts.,
Series 2011-2A, Cl. C, 3.05%, 7/15/132 | | | 105,000 | | | | 105,050 | |
DT Auto Owner Trust 2011-3A,
Automobile Receivable Nts.,
Series 2011-3A, Cl. C, 4.03%, 12/15/412 | | | 299,000 | | | | 302,542 | |
DT Auto Owner Trust 2012-1A,
Automobile Receivable Nts.,
Series 2012-1A, Cl. A, 1.05%, 1/15/152 | | | 132,322 | | | | 132,407 | |
DT Auto Owner Trust 2012-2,
Automobile Receivable Nts.:
Series 2012-2, Cl. C, 2.72%, 4/17/172 | | | 35,000 | | | | 35,094 | |
| Series 2012-2, Cl. D, 4.35%, 3/15/192 | | | 80,000 | | | | 81,206 | |
Enterprise Fleet Financing LLC,
Automobile Receivable Nts.,
Series 2012-2, Cl. A2, 0.72%, 11/20/172,3 | | | 40,000 | | | | 40,030 | |
Exeter Automobile Receivables Trust,
Automobile Receivable Nts.:
Series 2012-1A, Cl. A, 2.02%, 8/15/162 | | | 146,267 | | | | 147,374 | |
| Series 2012-2A, Cl. A, 1.30%, 6/15/172 | | | 143,651 | | | | 144,140 | |
| Series 2012-2A, Cl. B, 2.22%, 12/15/172 | | | 130,000 | | | | 131,919 | |
First Investors Auto Owner Trust 2011-1, Automobile Receivable Nts.,
Series 2011-1, Cl. A2, 1.47%, 3/16/15 | | | 45,000 | | | | 45,003 | |
Ford Credit Floorplan Master Owner Trust A, Automobile Receivable Nts.,
Series 2012-1, Cl. A, 0.679%, 1/15/163 | | | 155,000 | | | | 155,551 | |
MBNA Credit Card Master Note Trust,
Credit Card Receivables,
Series 2003-C7, Cl. C7, 1.559%, 3/15/163 | | | 375,000 | | | | 377,380 | |
Santander Drive Auto Receivables
Trust 2010-3, Automobile
Receivables Nts., Series 2010-3,
Cl. C, 3.06%, 11/15/17 | | | 350,000 | | | | 361,624 | |
Santander Drive Auto Receivables
Trust 2010-A, Automobile
Receivables Nts., Series 2010-A,
Cl. A3, 1.83%, 11/17/142 | | | 66,078 | | | | 66,508 | |
Santander Drive Auto Receivables
Trust 2010-B, Automobile
Receivables Nts., Series 2010-B,
Cl. C, 3.02%, 10/17/162 | | | 290,000 | | | | 295,447 | |
| Santander Drive Auto Receivables Trust 2011-1, Automobile Receivables Nts., Series 2011-1, Cl. D, 4.01%, 2/15/17 | | | 360,000 | | | | 376,237 | |
| | | | | | | | |
| | | Principal
Amount | | | Value | |
| | | | | | | | | |
| Asset-Backed Securities Continued | | | | | | | | |
Santander Drive Auto Receivables Trust 2011-4, Automobile Receivables Nts.,
Series 2011-4, Cl. B, 2.90%, 5/16/16 | | $ | 105,000 | | | $ | 107,715 | |
Santander Drive Auto Receivables
Trust 2011-S1A, Automobile Receivables Nts., Series 2011-S1A,
Cl. D, 3.10%, 5/15/172 | | | 205,511 | | | | 206,121 | |
Santander Drive Auto Receivables
Trust 2011-S2A, Automobile Receivables Nts., Series 2011-S2A,
Cl. D, 3.35%, 6/15/174 | | | 149,737 | | | | 150,541 | |
Santander Drive Auto Receivables Trust 2012-1, Automobile Receivables Nts.,
Series 2012-1, Cl. A2, 1.25%, 4/15/15 | | | 49,000 | | | | 49,198 | |
Santander Drive Auto Receivables Trust 2012-2, Automobile Receivables Nts.,
Series 2012-2, Cl. D, 3.87%, 2/15/18 | | | 375,000 | | | | 393,537 | |
Santander Drive Auto Receivables Trust 2012-4, Automobile Receivables Nts.,
Series 2012-4, Cl. D, 3.50%, 6/15/18 | | | 80,000 | | | | 83,284 | |
Santander Drive Auto Receivables Trust 2012-5, Automobile Receivables Nts.,
Series 2012-5, Cl. D, 3.30%, 9/17/18 | | | 140,000 | | | | 144,365 | |
Santander Drive Auto Receivables Trust 2012-6, Automobile Receivables Nts.,
Series 2012-6, Cl. D, 2.52%, 10/15/18 | | | 145,000 | | | | 145,053 | |
SNAAC Auto Receivables Trust,
Automobile Receivable Nts.,
Series 2012-1A, Cl. A, 1.78%, 6/15/162 | | | 136,902 | | | | 137,531 | |
United Auto Credit Securitization
Trust 2012-1, Automobile Receivables Nts.:
Series 2012-1, Cl. A2, 1.10%, 3/16/15 | | | 100,000 | | | | 100,050 | |
| Series 2012-1, Cl. B, 1.87%, 9/15/15 | | | 170,000 | | | | 170,143 | |
| Series 2012-1, Cl. C, 2.52%, 3/15/16 | | | 120,000 | | | | 120,097 | |
| Series 2012-1, Cl. D, 3.12%, 3/15/18 | | | 85,000 | | | | 85,085 | |
Westlake Automobile Receivables
Trust 2012-1, Automobile Receivable Nts., Series 2012-1, Cl. D, 1.03%, 6/16/143,4 | | | 100,000 | | | | 100,106 | |
Wheels SPV LLC,
Asset-Backed Nts., Series 2012-1,
Cl. A2, 1.19%, 3/20/212 | | | 170,000 | | | | 171,230 | |
World Financial Network
Credit Card Master
Note Trust, Credit Card Receivables,
Series 2012-B, Cl. A, 1.76%, 5/17/21 | | | 115,000 | | | | 116,409 | |
| | | | | | |
|
|
|
| Total Asset-Backed Securities (Cost $11,498,001) | | | | 11,676,268 | |
| | | | |
| 9 | | | | OPPENHEIMER BALANCED FUND/VA |
STATEMENT OF INVESTMENTS Continued
| | | | | | | | |
| | | Principal
Amount | | | Value | |
| | | | | | | | | |
| Mortgage-Backed Obligations—23.8% | |
| Government Agency—18.9% | | | | | | | | |
| FHLMC/FNMA/FHLB/Sponsored—18.6% | |
| Federal Home Loan Mortgage Corp.: 3.50%, 1/1/435 | | $ | 990,000 | | | $ | 1,053,035 | |
| 4.50%, 10/15/18 | | | 103,648 | | | | 110,508 | |
| 5%, 12/15/34 | | | 7,272 | | | | 7,899 | |
| 5.50%, 9/1/39 | | | 1,036,148 | | | | 1,131,213 | |
| 6.50%, 4/15/18-4/1/34 | | | 80,660 | | | | 91,061 | |
| 7%, 10/1/31-10/1/37 | | | 546,556 | | | | 633,111 | |
| 8%, 4/1/16 | | | 22,954 | | | | 24,553 | |
| 9%, 8/1/22-5/1/25 | | | 10,842 | | | | 12,507 | |
Federal Home Loan Mortgage Corp.,
Gtd. Real Estate Mtg. Investment
Conduit Multiclass
Pass-Through Certificates:
Series 2006-11, Cl. PS,
23.798%, 3/25/363 | | | 200,371 | | | | 293,924 | |
| Series 2426, Cl. BG, 6%, 3/15/17 | | | 195,382 | | | | 208,774 | |
| Series 2427, Cl. ZM, 6.50%, 3/15/32 | | | 278,148 | | | | 321,348 | |
| Series 2461, Cl. PZ, 6.50%, 6/15/32 | | | 140,286 | | | | 162,047 | |
| Series 2500, Cl. FD, 0.709%, 3/15/323 | | | 19,285 | | | | 19,522 | |
| Series 2526, Cl. FE, 0.609%, 6/15/293 | | | 25,038 | | | | 25,236 | |
| Series 2551, Cl. FD, 0.609%, 1/15/333 | | | 16,311 | | | | 16,452 | |
| Series 2626, Cl. TB, 5%, 6/1/33 | | | 352,821 | | | | 387,624 | |
| Series 3025, Cl. SJ, 23.984%, 8/15/353 | | | 55,606 | | | | 82,810 | |
| Series 3822, Cl. JA, 5%, 6/1/40 | | | 376,875 | | | | 393,185 | |
| Series 3848, Cl. WL, 4%, 4/1/40 | | | 368,643 | | | | 392,986 | |
Federal Home Loan Mortgage Corp.,
Interest-Only Stripped
Mtg.-Backed Security:
Series 183, Cl. IO, 16.341%, 4/1/276 | | | 174,043 | | | | 29,399 | |
| Series 192, Cl. IO, 11.644%, 2/1/286 | | | 45,732 | | | | 10,912 | |
| Series 2130, Cl. SC, 53.981%, 3/15/296 | | | 149,057 | | | | 35,762 | |
| Series 243, Cl. 6, 11.754%, 12/15/326 | | | 151,132 | | | | 32,458 | |
| Series 2796, Cl. SD, 65.931%, 7/15/266 | | | 213,146 | | | | 46,960 | |
| Series 2802, Cl. AS, 57.367%, 4/15/336 | | | 81,637 | | | | 3,492 | |
| Series 2920, Cl. S, 64.71%, 1/15/356 | | | 1,078,159 | | | | 218,200 | |
| Series 2922, Cl. SE, 11.219%, 2/15/356 | | | 65,266 | | | | 15,320 | |
| Series 3201, Cl. SG, 9.661%, 8/15/366 | | | 169,125 | | | | 29,121 | |
| Series 3450, Cl. BI, 14.904%, 5/15/386 | | | 203,990 | | | | 31,072 | |
| Series 3606, Cl. SN, 9.09%, 12/15/396 | | | 107,062 | | | | 16,440 | |
| Series 3662, Cl. SM, 27.267%, 10/15/326 | | | 174,998 | | | | 23,548 | |
| Series 3736, Cl. SN, 8.022%, 10/15/406 | | | 722,923 | | | | 123,147 | |
Federal Home Loan Mortgage Corp., Principal-Only Stripped Mtg.-Backed Security, Series 176, Cl. PO,
| | | | | | | | |
| 3.706%, 6/1/267 | | | 49,590 | | | | 43,494 | |
Federal National Mortgage Assn.:
2.50%, 1/1/285 | | | 16,470,000 | | | | 17,226,591 | |
| 3%, 1/1/28-1/1/435 | | | 4,610,000 | | | | 4,840,470 | |
| 3.50%, 1/1/28-1/1/435 | | | 4,355,000 | | | | 4,639,847 | |
| 4%, 1/1/435 | | | 4,995,000 | | | | 5,355,577 | |
| 4.50%, 1/1/28-1/1/435 | | | 6,624,000 | | | | 7,154,866 | |
| 5.50%, 9/25/20 | | | 7,289 | | | | 7,898 | |
| 6%, 11/25/17-3/1/37 | | | 692,902 | | | | 756,069 | |
| 6%, 1/1/435 | | | 425,000 | | | | 464,246 | |
| | | | | | | | |
| | | Principal
Amount | | | Value | |
| | | | | | | | | |
| FHLMC/FNMA/FHLB/Sponsored Continued | |
| Federal National Mortgage Assn.: Continued | |
| 6.50%, 5/25/17-10/25/19 | | $ | 162,765 | | | $ | 175,269 | |
| 7%, 11/1/17-10/25/35 | | | 79,934 | | | | 87,340 | |
| 7.50%, 1/1/33 | | | 147,186 | | | | 178,786 | |
| 8.50%, 7/1/32 | | | 6,933 | | | | 8,603 | |
Federal National Mortgage Assn.,
Gtd. Real Estate Mtg. Investment
Conduit Multiclass
Pass-Through Certificates:
Trust 1998-61, Cl. PL, 6%, 11/25/28 | | | 124,104 | | | | 140,113 | |
| Trust 2003-130, Cl. CS, 13.681%, 12/25/333 | | | 32,954 | | | | 40,752 | |
| Trust 2003-28, Cl. KG, 5.50%, 4/25/23 | | | 634,514 | | | | 697,994 | |
| Trust 2004-101, Cl. BG, 5%, 1/25/20 | | | 664,497 | | | | 707,165 | |
| Trust 2005-104, Cl. MC, 5.50%, 12/25/25 | | | 647,543 | | | | 712,899 | |
| Trust 2005-31, Cl. PB, 5.50%, 4/25/35 | | | 250,000 | | | | 308,092 | |
| Trust 2005-69, Cl. LE, 5.50%, 11/1/33 | | | 106,945 | | | | 109,429 | |
| Trust 2006-46, Cl. SW, 23.43%, 6/25/363 | | | 148,473 | | | | 216,964 | |
| Trust 2006-50, Cl. KS, 23.431%, 6/25/363 | | | 33,425 | | | | 49,684 | |
| Trust 2007-109, Cl. NF, 0.76%, 12/25/373 | | | 325,152 | | | | 329,635 | |
| Trust 2007-42, Cl. A, 6%, 2/1/33 | | | 231,815 | | | | 238,017 | |
| Trust 2009-36, Cl. FA, 1.15%, 6/25/373 | | | 375,347 | | | | 381,150 | |
| Trust 2009-37, Cl. HA, 4%, 4/1/19 | | | 280,615 | | | | 296,570 | |
| Trust 2009-70, Cl. PA, 5%, 8/1/35 | | | 156,139 | | | | 157,722 | |
| Trust 2011-15, Cl. DA, 4%, 3/1/41 | | | 168,496 | | | | 180,733 | |
| Trust 2011-3, Cl. KA, 5%, 4/1/40 | | | 356,551 | | | | 389,986 | |
Federal National Mortgage Assn.,
Interest-Only Stripped
Mtg.-Backed Security:
Trust 2001-65, Cl. S, 30.64%, 11/25/316 | | | 335,929 | | | | 74,397 | |
| Trust 2001-78, Cl. JS, 3.929%, 8/25/416 | | | 305,068 | | | | 45,370 | |
| Trust 2001-81, Cl. S, 23.86%, 1/25/326 | | | 81,488 | | | | 19,444 | |
| Trust 2002-47, Cl. NS, 34.595%, 4/25/326 | | | 218,836 | | | | 50,452 | |
| Trust 2002-51, Cl. S, 34.80%, 8/25/326 | | | 200,944 | | | | 46,325 | |
| Trust 2002-52, Cl. SD, 40.892%, 9/25/326 | | | 260,387 | | | | 60,513 | |
| Trust 2002-77, Cl. SH, 39.498%, 12/18/326 | | | 124,385 | | | | 28,774 | |
| Trust 2002-84, Cl. SA, 34.768%, 12/25/326 | | | 321,739 | | | | 63,138 | |
| Trust 2002-9, Cl. MS, 27.54%, 3/25/326 | | | 87,258 | | | | 19,760 | |
| Trust 2003-33, Cl. SP, 29.795%, 5/25/336 | | | 355,973 | | | | 58,869 | |
| Trust 2003-4, Cl. S, 29.532%, 2/25/336 | | | 201,552 | | | | 37,770 | |
| Trust 2003-46, Cl. IH, 19.006%, 6/1/236 | | | 738,159 | | | | 88,392 | |
| Trust 2003-89, Cl. XS, 64.382%, 11/25/326 | | | 26,266 | | | | 353 | |
| Trust 2004-54, Cl. DS, 49.314%, 11/25/306 | | | 213,977 | | | | 39,908 | |
| Trust 2004-56, Cl. SE, 13.077%, 10/25/336 | | | 66,171 | | | | 11,135 | |
| Trust 2005-12, Cl. SC, 14.172%, 3/25/356 | | | 33,087 | | | | 8,178 | |
| Trust 2005-14, Cl. SE, 44.962%, 3/25/356 | | | 108,383 | | | | 17,005 | |
| Trust 2005-40, Cl. SA, 55.075%, 5/25/356 | | | 557,674 | | | | 121,529 | |
| Trust 2005-5, Cl. SD, 11.888%, 1/25/356 | | | 149,458 | | | | 23,589 | |
| Trust 2005-71, Cl. SA, 60.11%, 8/25/256 | | | 572,476 | | | | 90,437 | |
| Trust 2005-93, Cl. SI, 20.233%, 10/25/356 | | | 159,318 | | | | 25,566 | |
| Trust 2007-75, Cl. BI, 7.66%, 8/25/376 | | | 1,095,988 | | | | 240,843 | |
| Trust 2007-88, Cl. XI, 42.848%, 6/25/376 | | | 445,298 | | | | 68,961 | |
| Trust 2008-46, Cl. EI, 17.091%, 6/25/386 | | | 210,626 | | | | 32,415 | |
| Trust 2008-55, Cl. SA, 13.442%, 7/25/386 | | | 403,895 | | | | 58,878 | |
| | | | |
| 10 | | | | OPPENHEIMER BALANCED FUND/VA |
| | | | | | | | |
| | | Principal
Amount | | | Value | |
| | | | | | | | | |
| FHLMC/FNMA/FHLB/Sponsored Continued | |
Federal National Mortgage Assn.,
Interest-Only Stripped
Mtg.-Backed Security: Continued | | | | | | | | |
| Trust 2009-8, Cl. BS, 22.691%, 2/25/246 | | $ | 119,695 | | | $ | 12,180 | |
| Trust 222, Cl. 2, 25.718%, 6/1/236 | | | 369,972 | | | | 74,690 | |
| Trust 233, Cl. 2, 46.611%, 8/1/236 | | | 250,194 | | | | 53,617 | |
| Trust 252, Cl. 2, 41.936%, 11/1/236 | | | 326,932 | | | | 69,700 | |
| Trust 319, Cl. 2, 3.124%, 2/1/326 | | | 83,303 | | | | 12,778 | |
| Trust 320, Cl. 2, 10.442%, 4/1/326 | | | 24,243 | | | | 4,450 | |
| Trust 321, Cl. 2, 0.955%, 4/1/326 | | | 288,087 | | | | 44,922 | |
| Trust 331, Cl. 9, 6.879%, 2/1/336 | | | 294,902 | | | | 46,196 | |
| Trust 334, Cl. 17, 13.938%, 2/1/336 | | | 177,842 | | | | 41,157 | |
| Trust 339, Cl. 12, 0.662%, 7/1/336 | | | 280,643 | | | | 49,745 | |
| Trust 339, Cl. 7, 0%, 7/1/336,8 | | | 825,561 | | | | 114,985 | |
| Trust 343, Cl. 13, 0.846%, 9/1/336 | | | 258,277 | | | | 35,785 | |
| Trust 345, Cl. 9, 0%, 1/1/346,8 | | | 269,831 | | | | 33,144 | |
| Trust 351, Cl. 10, 2.391%, 4/1/346 | | | 37,326 | | | | 5,218 | |
| Trust 351, Cl. 8, 0%, 4/1/346,8 | | | 122,787 | | | | 18,119 | |
| Trust 356, Cl. 10, 0%, 6/1/356,8 | | | 92,641 | | | | 13,079 | |
| Trust 356, Cl. 12, 0%, 2/1/356,8 | | | 49,609 | | | | 6,909 | |
| Trust 362, Cl. 13, 0%, 8/1/356,8 | | | 335,458 | | | | 50,431 | |
| Trust 364, Cl. 16, 0%, 9/1/356,8 | | | 249,160 | | | | 35,515 | |
| Federal National Mortgage Assn., | | | | | | | | |
| Principal-Only Stripped Mtg.-Backed | | | | | | | | |
| Security, Trust 1993-184, Cl. M, | | | | | | | | |
| 4.258%, 9/25/237 | | | 134,140 | | | | 122,854 | |
| | | | | | |
|
|
|
| | | | | | | | 54,057,062 | |
| GNMA/Guaranteed—0.3% | | | | | | | | |
| Government National Mortgage Assn.: | | | | | | | | |
| 7%, 1/30/24 | | | 69,440 | | | | 81,519 | |
| 7.50%, 1/30/23-6/30/24 | | | 58,303 | | | | 66,974 | |
| 8%, 5/30/17-4/15/23 | | | 46,369 | | | | 53,893 | |
| 8.50%, 8/1/17-12/15/17 | | | 14,359 | | | | 15,366 | |
| Government National Mortgage | | | | | | | | |
| Assn., Interest-Only Stripped | | | | | | | | |
| Mtg.-Backed Security: | | | | | | | | |
| Series 2001-21, Cl. SB, | | | | | | | | |
| 81.984%, 1/16/276 | | | 267,938 | | | | 52,771 | |
| Series 2002-15, Cl. SM, | | | | | | | | |
| 71.172%, 2/16/326 | | | 302,970 | | | | 67,863 | |
| Series 2002-76, Cl. SY, | | | | | | | | |
| 80.773%, 12/16/266 | | | 702,529 | | | | 160,602 | |
| Series 2004-11, Cl. SM, | | | | | | | | |
| 71.048%, 1/17/306 | | | 248,427 | | | | 65,134 | |
| Series 2007-17, Cl. AI, | | | | | | | | |
| 21.563%, 4/16/376 | | | 691,511 | | | | 173,839 | |
| Series 2011-52, Cl. HS, | | | | | | | | |
| 11.743%, 4/16/416 | | | 330,984 | | | | 92,456 | |
| | | | | | |
|
|
|
| | | | | | | | 830,417 | |
| Non-Agency—4.9% | | | | | | | | |
| Commercial—3.0% | | | | | | | | |
| Banc of America Commercial | | | | | | | | |
| Mortgage Trust 2006-6, | | | | | | | | |
| Commercial Mtg. Pass-Through | | | | | | | | |
Certificates, Series 2006-6, Cl. AM,
5.39%, 10/1/45 | | | 265,000 | | | | 289,257 | |
| | | | | | | | |
| | | Principal
Amount | | | Value | |
| | | | | | | | | |
| Commercial Continued | |
Bear Stearns ARM Trust 2007-4,
Mtg. Pass-Through Certificates,
Series 2007-4, Cl. 22A1,
5.434%, 6/1/473 | | $ | 191,344 | | | $ | 166,411 | |
Bear Stearns Commercial Mortgage Securities Trust 2007-PWR17, Commercial Mtg. Pass-Through
Certificates, Series 2007-PWR17, | | | | | | | | |
| Cl. AM, 5.89%, 6/1/503 | | | 305,000 | | | | 347,470 | |
CFCRE Commercial Mortgage Trust,
Commercial Mtg. Pass-Through
Certificates, Series 2011-C1,
| | | | | | | | |
| Cl. A1, 1.871%, 4/1/442 | | | 79,895 | | | | 81,364 | |
CHL Mortgage Pass-Through
Trust 2007-J3, Mtg. Pass-Through
Certificates, Series 2007-J3,
| | | | | | | | |
| Cl. A9, 6%, 7/1/37 | | | 38,546 | | | | 31,576 | |
Citigroup Commercial Mortgage
Trust 2008-C7, Commercial Mtg.
Pass-Through Certificates:
Series 2008-C7, Cl. AM, 6.06%, 12/1/493 | | | 90,000 | | | | 101,261 | |
| Series 2008-C7, Cl. A4, 6.06%, 12/1/493 | | | 460,000 | | | | 556,835 | |
Citigroup, Inc./Deutsche Bank
2007-CD4 Commercial
Mortgage Trust, Commercial
Mtg. Pass-Through Certificates,
Series 2007-CD4, Cl. A4,
| | | | | | | | |
| 5.322%, 12/1/49 | | | 425,000 | | | | 489,326 | |
CSMC Mortgage-Backed Trust
2006-C1, Mtg. Pass-Through Certificates, Series 2006-C1, Cl. AJ,
| | | | | | | | |
| 5.409%, 2/1/393 | | | 175,000 | | | | 186,230 | |
Deutsche Alt-B Securities, Inc.,
Mtg. Pass-Through Certificates,
Series 2006-AB4, Cl. A1A, | | | | | | | | |
| 6.005%, 10/25/36 | | | 296,269 | | | | 207,828 | |
Deutsche Mortgage & Asset Receiving, Commercial Mtg. Pass-Through
Certificates, Interest-Only
Stripped Mtg.-Backed Security:
Series 2012-CR5, Cl. XA, | | | | | | | | |
| 3.239%, 12/1/456 | | | 450,000 | | | | 55,655 | |
Series 2010-C1, Cl. XPA,
5.005%, 9/1/202,6 | | | 2,991,374 | | | | 176,066 | |
First Horizon Alternative
Mortgage Securities
Trust 2004-FA2, Mtg. Pass-Through
Certificates, Series 2004-FA2,
| | | | | | | | |
| Cl. 3A1, 6%, 1/25/35 | | | 294,453 | | | | 301,592 | |
First Horizon Alternative
Mortgage Securities Trust
2007-FA2, Mtg. Pass-Through
Certificates, Series 2007-FA2,
| | | | | | | | |
| Cl. 1A1, 5.50%, 4/25/37 | | | 517,624 | | | | 370,459 | |
| | | | |
| 11 | | | | OPPENHEIMER BALANCED FUND/VA |
STATEMENT OF INVESTMENTS Continued
| | | | | | | | |
| | | Principal
Amount | | | Value | |
| | | | | | | | | |
| Commercial Continued | |
Greenwich Capital Commercial
Funding Corp./Commercial
Mortgage Trust 2006-GG7,
Commercial Mtg. Pass-Through
Certificates, Series 2006-GG7,
| | | | | | | | |
| Cl. AM, 5.867%, 7/1/383 | | $ | 190,000 | | | $ | 214,459 | |
Greenwich Capital Commercial
Funding Corp./Commercial
Mortgage Trust 2007-GG9,
Commercial Mtg. Pass-Through
Certificates, Series 2007-GG9, | | | | | | | | |
| Cl. AM, 5.475%, 3/1/39 | | | 115,000 | | | | 125,597 | |
GS Mortgage Securities Corp. II,
Commercial Mtg. Obligations,
| | | | | | | | |
| Series 2011-GC3, Cl. A1, 2.331%, 3/1/44 | | | 209,029 | | | | 214,434 | |
GS Mortgage Securities Trust
2006-GG6, Commercial Mtg.
Pass-Through Certificates,
| | | | | | | | |
| Series 2006-GG6, Cl. AM, 5.622%, 4/1/38 | | | 286,699 | | | | 316,885 | |
GSR Mortgage Loan Trust 2005-AR4,
Mtg. Pass-Through Certificates,
| | | | | | | | |
| Series 2005-AR4, Cl. 6A1, 5.25%, 7/1/35 | | | 103,526 | | | | 102,728 | |
IndyMac Index Mortgage Loan
Trust 2005-AR23, Mtg.
Pass-Through Certificates,
Series 2005-AR23, Cl. 6A1,
| | | | | | | | |
| 4.931%, 11/1/353 | | | 276,059 | | | | 218,580 | |
JPMorgan Chase Commercial
Mortgage Securities Corp.,
Commercial Mtg.
Pass-Through Certificates:
Series 2011-C3, Cl. A1, 1.875%, 2/1/462 | | | 252,526 | | | | 257,005 | |
Series 2007-LDPX, Cl. A2S2,
5.187%, 1/1/492 | | | 125,589 | | | | 129,670 | |
Series 2007-LDP10, Cl. A3S,
5.317%, 1/1/49 | | | 520,000 | | | | 536,852 | |
| Series 2007-LDPX, Cl. A3, 5.42%, 1/15/49 | | | 60,000 | | | | 69,594 | |
JPMorgan Mortgage Trust 2007-S3,
Mtg. Pass-Through Certificates,
| | | | | | | | |
| Series 2007-S3, Cl. 1A90, 7%, 8/1/37 | | | 282,652 | | | | 261,499 | |
JPMorgan, Re-Securitized Real Estate Mtg. Investment Conduit Multiclass
Pass-Through Certificates,
| | | | | | | | |
| Series 2009-5, Cl. 1A2, 2.614%, 7/1/362,3 | | | 262,322 | | | | 184,673 | |
Mastr Adjustable Rate Mortgages
Trust 2004-13, Mtg. Pass-Through
Certificates, Series 2004-13,
| | | | | | | | |
| Cl. 2A2, 2.67%, 4/1/343 | | | 151,409 | | | | 155,600 | |
Merrill Lynch Mortgage Trust
2006-C2, Commercial Mtg.
Pass-Through Certificates, | | | | | | | | |
| Series 2006-C2, Cl. AM, 5.782%, 8/1/43 | | | 290,000 | | | | 325,813 | |
| | | | | | | | |
| | | Principal
Amount | | | Value | |
| | | | | | | | | |
| Commercial Continued | |
Morgan Stanley Capital I
Trust 2007-IQ13, Commercial Mtg.
Pass-Through Certificates,
Series 2007-IQ13, Cl. AM,
5.406%, 3/1/44 | | $ | 260,000 | | | $ | 281,816 | |
Morgan Stanley Capital I
Trust 2007-IQ15, Commercial Mtg.
Pass-Through Certificates,
Series 2007-IQ15, Cl. AM, 5.882%, 6/1/493 | | | 345,000 | | | | 381,327 | |
Morgan Stanley, Re-Securitized
Real Estate Mtg. Investment
Conduit Multiclass
Pass-Through Certificates,
Series 2012-R3, Cl. 1B, 2.298%, 11/1/363,4 | | | 281,486 | | | | 149,647 | |
Structured Adjustable Rate
Mortgage Loan Trust 2006-4,
Commercial Mtg. Pass-Through
Certificates, Series 2006-4, Cl. 6A,
5.333%, 5/1/363 | | | 181,976 | | | | 151,048 | |
Structured Adjustable Rate
Mortgage Loan Trust 2007-6, Mtg.
Pass-Through Certificates,
Series 2007-6, Cl. 3A1, 4.82%, 7/1/373 | | | 288,403 | | | | 223,200 | |
UBS-Barclays Commercial Mortgage
Trust 2012-C2, Commerical Mtg.
Pass-Through Certificates,
Series 2012-C2, Cl. E.,
4.893%, 5/1/632,3 | | | 25,000 | | | | 22,655 | |
Wachovia Bank Commercial
Mortgage Trust 2006-C28,
Commercial Mtg. Pass-Through
Certificates, Series 2006-C28,
Cl. A4, 5.572%, 10/1/48 | | | 40,000 | | | | 46,021 | |
Wachovia Bank Commercial
Mortgage Trust 2007-C34,
Commercial Mtg. Pass-Through
Certificates, Series 2007-C34,
Cl. A3, 5.678%, 5/1/46 | | | 380,000 | | | | 447,435 | |
WaMu Mortgage Pass-Through
Certificates 2005-AR14 Trust,
Mtg. Pass-Through Certificates,
Series 2005-AR14, Cl. 1A4,
2.536%, 12/1/353 | | | 136,730 | | | | 126,728 | |
Wells Fargo Mortgage-Backed
Securities 2005-AR1 Trust, Mtg.
Pass-Through Certificates,
Series 2005-AR1, Cl. 1A1, 2.613%, 2/1/353 | | | 58,342 | | | | 58,114 | |
Wells Fargo Mortgage-Backed
Securities 2007-AR8 Trust, Mtg.
Pass-Through Certificates,
Series 2007-AR8, Cl. A1, 5.988%, 11/1/373 | | | 169,295 | | | | 151,725 | |
| | | | |
| 12 | | | | OPPENHEIMER BALANCED FUND/VA |
| | | | | | | | |
| | | Principal
Amount | | | Value | |
| | | | | | | | | |
| Commercial Continued | |
WFRBS Commercial Mortgage
Trust 2011-C3, Interest-Only
Commercial Mtg. Pass-Through
Certificates, Series 2011-C3, Cl. XA,
11.241%, 3/1/446 | | $ | 4,075,564 | | | $ | 333,389 | |
| | | | | | |
|
|
|
| | | | | | | | 8,847,824 | |
| Multifamily—0.5% | | | | | | | | |
CHL Mortgage Pass-Through
Trust 2006-20, Mtg. Pass-Through
Certificates, Series 2006-20,
Cl. 1A17, 5.75%, 2/1/37 | | | 339,431 | | | | 308,058 | |
Citigroup Mortgage Loan
Trust, Inc. 2006-AR3, Mtg. Pass-Through Certificates,
Series 2006-AR3, Cl. 1 A2A, 5.596%, 6/1/363 | | | 169,700 | | | | 157,904 | |
Countrywide Alternative Loan
Trust 2005-86CB, Mtg. Pass-Through
Certificates, Series 2005-86CB,
Cl. A8, 5.50%, 2/1/36 | | | 56,473 | | | | 51,094 | |
Countrywide Alternative Loan
Trust 2005-J14, Mtg. Pass-Through
Certificates, Series 2005-J14,
Cl. A7, 5.50%, 12/1/35 | | | 116,409 | | | | 96,701 | |
Countrywide Alternative Loan
Trust 2006-24CB, Mtg. Pass-Through
Certificates, Series 2006-24CB,
Cl. A12, 5.75%, 6/1/36 | | | 107,301 | | | | 87,026 | |
JPMorgan Mortgage Trust 2007-A3,
Mtg. Pass-Through Certificates,
Series 2007-A3, Cl. 3A2M, 5.018%, 5/1/373 | | | 35,981 | | | | 34,564 | |
Wells Fargo Mortgage-Backed
Securities 2006-AR6 Trust, Mtg.
Pass-Through Certificates,
Series 2006-AR6, Cl. 3A1, 2.76%, 3/25/363 | | | 671,871 | | | | 649,999 | |
| | | | | | |
|
|
|
| | | | | | | | 1,385,346 | |
| Other—0.0% | | | | | | | | |
Greenwich Capital Commercial
Funding Corp./Commercial
Mortgage Trust 2007-GG9, Commercial Mtg. Pass-Through Certificates, Series 2007-GG9, Cl. A4, 5.444%, 3/1/39 | | | 60,000 | | | | 69,349 | |
| Residential—1.4% | | | | | | | | |
Argent Securities Trust 2004-W8,
Asset-Backed Pass-Through
Certificates, Series 2004-W8,
Cl. A2, 1.17%, 5/25/343 | | | 137,382 | | | | 127,841 | |
| | | | | | | | |
| | | Principal
Amount | | | Value | |
| | | | | | | | | |
| Residential Continued | | | | | | | | |
Banc of America Commercial
Mortgage, Inc., Commercial Mtg.
Pass-Through Certificates:
Series 2007-4, Cl. AM, 5.796%, 2/1/513 | | $ | 320,000 | | | $ | 361,289 | |
| Series 2007-1, Cl. 1A3, 6%, 1/1/37 | | | 184,040 | | | | 160,816 | |
Banc of America Funding
2007-C Trust, Mtg.
Pass-Through Certificates,
Series 2007-C, Cl. 1A4, 5.496%, 5/1/363 | | | 75,226 | | | | 73,832 | |
Banc of America Mortgage
2001-E Trust, Mtg.
Pass-Through Certificates,
Series 2004-E, Cl. 2A6, 3.102%, 6/1/343 | | | 204,440 | | | | 202,219 | |
Carrington Mortgage Loan Trust,
Asset-Backed Pass-Through
Certificates, Series 2006-FRE1,
Cl. A2, 0.32%, 7/25/363 | | | 143,701 | | | | 137,669 | |
CHL Mortgage Pass-Through
Trust 2005-29, Mtg. Pass-Through
Certificates, Series 2005-29, Cl. A1, 5.75%, 12/1/35 | | | 122,345 | | | | 113,543 | |
CHL Mortgage Pass-Through
Trust 2006-17, Mtg. Pass-Through
Certificates, Series 2006-17, Cl. A2, 6%, 12/1/36 | | | 287,225 | | | | 262,740 | |
CHL Mortgage Pass-Through
Trust 2006-6, Mtg. Pass-Through
Certificates, Series 2006-6, Cl. A3, 6%, 4/1/36 | | | 111,415 | | | | 103,051 | |
Countrywide Alternative Loan
Trust 2005-29CB, Mtg. Pass-Through
Certificates, Series 2005-29CB, Cl. A4, 5%, 7/1/35 | | | 686,685 | | | | 535,482 | |
Countrywide Alternative Loan
Trust 2007-19, Mtg. Pass-Through
Certificates, Series 2007-19,
Cl. 1A34, 6%, 8/1/37 | | | 367,465 | | | | 297,331 | |
Countrywide Home Loans,
Asset-Backed Certificates,
Series 2005-16, Cl. 2AF2, 5.227%, 5/1/363 | | | 305,324 | | | | 285,289 | |
CSMC Mortgage-Backed Trust 2007-3,
Mtg. Pass-Through Certificates,
Series 2007-3, Cl. 2A10, 6%, 4/1/37 | | | 174,779 | | | | 151,499 | |
| CWABS Asset-Backed Certificates Trust 2006-25, Asset-Backed Certificates, Series 2006-25, Cl. 2A2, 0.33%, 6/25/473 | | | 184,021 | | | | 181,733 | |
GSR Mortgage Loan Trust 2006-5F,
Mtg. Pass-Through Certificates,
Series 2006-5F, Cl. 2A1, 6%, 6/1/36 | | | 99,217 | | | | 95,852 | |
JPMorgan Alternative Loan
Trust 2006-S4, Mtg. Pass-Through
Certificates, Series 2006-S4,
Cl. A6, 5.71%, 12/1/36 | | | 109,508 | | | | 103,603 | |
| | | | |
| 13 | | | | OPPENHEIMER BALANCED FUND/VA |
STATEMENT OF INVESTMENTS Continued
| | | | | | | | |
| | | Principal
Amount | | | Value | |
| | | | | | | | | |
| Residential Continued | | | | | | | | |
RALI Series 2003-QS1 Trust,
Mtg. Asset-Backed Pass-Through
Certificates, Series 2003-QS1,
Cl. A2, 5.75%, 1/25/33 | | $ | 111,941 | | | $ | 115,578 | |
RALI Series 2006-QS13 Trust,
Mtg. Asset-Backed Pass-Through
Certificates, Series 2006-QS13,
Cl. 1A8, 6%, 9/25/36 | | | 20,940 | | | | 15,625 | |
Residential Asset Securitization
Trust 2005-A15, Mtg. Pass-Through Certificates, Series 2005-A15, | | | | | | | | |
| Cl. 1A4, 5.75%, 2/1/36 | | | 34,472 | | | | 31,022 | |
WaMu Mortgage Pass-Through
Certificates 2007-HY5 Trust, Mtg.
Pass-Through Certificates,
Series 2007-HY5, Cl. 3A1,
| | | | | | | | |
| 5.147%, 5/1/373 | | | 165,735 | | | | 160,566 | |
WaMu Mortgage Pass-Through
Certificates, Mtg.
Pass-Through Certificates,
Series 2006-AR18, Cl. 3A1, | | | | | | | | |
| 4.60%, 1/1/373 | | | 88,323 | | | | 77,633 | |
Wells Fargo Alternative Loan
2007-PA5 Trust, Mtg. Asset-Backed
Pass-Through Certificates,
Series 2007-PA5, Cl. 1A1, | | | | | | | | |
| 6.25%, 11/1/37 | | | 233,968 | | | | 221,642 | |
Wells Fargo Mortgage-Backed
Securities 2005-9 Trust,
Mtg. Pass-Through Certificates, | | | | | | | | |
| Series 2005-9, Cl. 2A6, 5.25%, 10/25/35 | | | 91,629 | | | | 97,488 | |
Wells Fargo Mortgage-Backed
Securities 2006-AR14 Trust,
Mtg. Pass-Through Certificates, | | | | | | | | |
Series 2006-AR14, Cl. 1A2,
5.632%, 10/1/363 | | | 165,341 | | | | 163,044 | |
| | | | | | |
|
|
|
| | | | | | | | 4,076,387 | |
| | | | | | |
|
|
|
Total Mortgage-Backed Obligations
(Cost $67,084,604) | | | | | | | 69,266,385 | |
| U.S. Government Obligations—0.8% | |
Federal Home Loan
Mortgage Corp. Nts.:
0.75%, 1/12/18 | | | 190,000 | | | | 188,946 | |
| 1.25%, 5/12/17-10/2/19 | | | 250,000 | | | | 251,115 | |
| 1.75%, 5/30/19 | | | 80,000 | | | | 82,862 | |
| 2.375%, 1/13/229 | | | 611,000 | | | | 638,868 | |
| 5.25%, 4/18/16 | | | 300,000 | | | | 347,267 | |
| 5.50%, 7/18/16 | | | 65,000 | | | | 76,414 | |
Federal National Mortgage Assn. Nts.:
0.875%, 12/20/17 | | | 416,000 | | | | 417,318 | |
| 1.125%, 4/27/17 | | | 191,000 | | | | 194,698 | |
| 5.375%, 6/12/17 | | | 75,000 | | | | 90,277 | |
| | | | | | | | |
| | | Principal
Amount | | | Value | |
| | | | | | | | | |
| U.S. Government Obligations Continued | |
U.S. Treasury Nts.,
1.75%, 5/15/22 | | $ | 82,000 | | | $ | 82,628 | |
| | | | | | |
|
|
|
Total U.S. Government Obligations
(Cost $2,293,307) | | | | | | | 2,370,393 | |
| Non-Convertible Corporate Bonds and Notes—18.6% | |
| Consumer Discretionary—3.2% | | | | | |
| Auto Components—0.1% | | | | | | | | |
Dana Holding Corp., 6.75% Sr. Unsec.
Nts., 2/15/21 | | | 289,000 | | | | 312,120 | |
| Automobiles—0.3% | | | | | | | | |
Daimler Finance North America LLC,
8.50% Sr. Unsec. Unsub. Nts., 1/18/31 | | | 164,000 | | | | 255,424 | |
Ford Motor Credit Co. LLC, 5.875%
Sr. Unsec. Nts., 8/2/21 | | | 648,000 | | | | 755,192 | |
| | | | | | |
|
|
|
| | | | | | | | 1,010,616 | |
| Diversified Consumer Services—0.1% | | | | | |
Service Corp. International,
| | | | | | | | |
| 7.625% Sr. Unsec. Nts., 10/1/18 | | | 251,000 | | | | 299,945 | |
| Hotels, Restaurants & Leisure—0.3% | | | | | |
| Darden Restaurants, Inc., 4.50% Sr. Unsec. | | | | | |
| Unsub. Nts., 10/15/21 | | | 78,000 | | | | 83,942 | |
Hyatt Hotels Corp., 5.75% Sr. Unsec.
| | | | | | | | |
| Unsub. Nts., 8/15/152 | | | 520,000 | | | | 571,151 | |
Starwood Hotels & Resorts Worldwide, Inc., 7.15% Sr. Unsec.
Unsub. Nts., 12/1/19 | | | 164,000 | | | | 202,899 | |
| | | | | | |
|
|
|
| | | | | | | | 857,992 | |
| Household Durables—0.2% | | | | | | | | |
| Jarden Corp., 6.125% Sr. Unsec. Nts., 11/15/22 | | | 323,000 | | | | 350,455 | |
Whirlpool Corp., 5.50% Sr. Unsec.
Unsub. Nts., 3/1/13 | | | 134,000 | | | | 135,082 | |
| | | | | | |
|
|
|
| | | | | | | | 485,537 | |
| Media—1.1% | | | | | | | | |
Comcast Cable Communications
Holdings, Inc., 9.455% Sr. Unsec.
Nts., 11/15/22 | | | 205,000 | | | | 310,175 | |
Comcast Corp., 4.65% Sr. Unsec.
Unsub. Nts., 7/15/42 | | | 70,000 | | | | 73,857 | |
CSC Holdings, Inc., 7.625%
Sr. Unsec. Debs., 7/15/18 | | | 298,000 | | | | 345,680 | |
DIRECTV Holdings LLC/DIRECTV
Financing Co., Inc., 5.15% Sr. Unsec. Nts., 3/15/42 | | | 80,000 | | | | 80,988 | |
DISH DBS Corp., 6.75%
Sr. Unsec. Nts., 6/1/21 | | | 317,000 | | | | 362,965 | |
Historic TW, Inc., 9.125%
Debs., 1/15/13 | | | 115,000 | | | | 115,316 | |
| | | | |
| 14 | | | | OPPENHEIMER BALANCED FUND/VA |
| | | | | | | | |
| | | Principal
Amount | | | Value | |
| | | | | | | | | |
| Media Continued | | | | | | | | |
Interpublic Group of Cos., Inc. (The):
6.25% Sr. Unsec. Nts., 11/15/14 | | $ | 155,000 | | | $ | 168,563 | |
| 10% Sr. Unsec. Nts., 7/15/17 | | | 324,000 | | | | 355,590 | |
Lamar Media Corp., 5% Sr. Sub.
Nts., 5/1/232 | | | 296,000 | | | | 305,620 | |
| News America, Inc., 6.15% Sr. Unsec. Nts., 2/15/41 | | | 109,000 | | | | 138,181 | |
Time Warner Entertainment Co.
LP, 8.375% Sr. Nts., 7/15/33 | | | 181,000 | | | | 264,348 | |
| Time Warner, Inc., 9.15% Debs., 2/1/23 | | | 38,000 | | | | 56,161 | |
Virgin Media Secured Finance plc:
5.25% Sr. Sec. Nts., 1/15/21 | | | 195,000 | | | | 227,856 | |
| 6.50% Sr. Sec. Nts., 1/15/18 | | | 417,000 | | | | 450,881 | |
| | | | | | |
|
|
|
| | | | | | | | 3,256,181 | |
| Multiline Retail—0.3% | | | | | | | | |
Dollar General Corp., 4.125%
Nts., 7/15/17 | | | 289,000 | | | | 304,895 | |
Macy’s Retail Holdings, Inc., 5.75%
Sr. Unsec. Nts., 7/15/14 | | | 414,000 | | | | 444,137 | |
| | | | | | |
|
|
|
| | | | | | | | 749,032 | |
| Specialty Retail—0.6% | | | | | | | | |
| Gap, Inc. (The), 5.95% Sr. Unsec. | | | | | | | | |
| Unsub. Nts., 4/12/21 | | | 332,000 | | | | 380,098 | |
| Limited Brands, Inc., | | | | | | | | |
| 6.625% Sr. Nts., 4/1/21 | | | 315,000 | | | | 362,250 | |
| Rent-A-Center, Inc., | | | | | | | | |
| 6.625% Sr. Unsec. Nts., 11/15/20 | | | 355,000 | | | | 388,725 | |
| Sally Holdings LLC/Sally Capital, Inc., | | | | | | | | |
| 6.875% Sr. Unsec. Nts., 11/15/19 | | | 323,000 | | | | 358,530 | |
| Staples, Inc., 9.75% Sr. Unsec. | | | | | | | | |
| Unsub. Nts., 1/15/14 | | | 273,000 | | | | 296,879 | |
| | | | | | |
|
|
|
| | | | | | | | 1,786,482 | |
| Textiles, Apparel & Luxury Goods—0.2% | |
| Hanesbrands, Inc., 6.375% Sr. Unsec. | | | | | | | | |
| Unsub. Nts., 12/15/20 | | | 271,000 | | | | 299,455 | |
Phillips-Van Heusen Corp.,
7.375% Sr. Unsec. | | | | | | | | |
| Unsub. Nts., 5/15/20 | | | 277,000 | | | | 311,971 | |
| | | | | | |
|
|
|
| | | | | | | | 611,426 | |
| Consumer Staples—1.2% | | | | | | | | |
| Beverages—0.4% | | | | | | | | |
Anheuser-Busch InBev Worldwide, Inc.,
| | | | | | | | |
8.20% Sr. Unsec. Unsub.
| | | | | | | | |
| Nts., 1/15/39 | | | 146,000 | | | | 239,971 | |
| Coca-Cola HBC Finance BV, 5.125% | | | | | | | | |
| Sr. Unsec. Unsub. Nts., 9/17/13 | | | 294,000 | | | | 301,327 | |
Fortune Brands, Inc., 6.375% Sr. Unsec.
| | | | | | | | |
| Unsub. Nts., 6/15/14 | | | 87,000 | | | | 93,812 | |
| | | | | | | | |
| | | Principal
Amount | | | Value | |
| | | | | | | | | |
| Beverages Continued | | | | | | | | |
Foster’s Finance Corp.,
| | | | | | | | |
| 4.875% Sr. Unsec. Nts., 10/1/142 | | $ | 270,000 | | | $ | 288,307 | |
Pernod-Ricard SA,
| | | | | | | | |
| 4.25% Sr. Unsec. Nts., 7/15/222 | | | 136,000 | | | | 149,589 | |
SABMiller Holdings, Inc.,
| | | | | | | | |
| 4.95% Sr. Unsec. Nts., 1/15/42 | | | 125,000 | | | | 141,828 | |
| | | | | | |
|
|
|
| | | | | | | | 1,214,834 | |
| Food & Staples Retailing—0.1% | | | | | |
Delhaize Group, 5.70%
| | | | | | | | |
| Sr. Unsec. Nts., 10/1/40 | | | 94,000 | | | | 88,180 | |
Safeway, Inc.:
3.95% Sr. Unsec. Unsub. Nts., 8/15/20 | | | 180,000 | | | | 180,170 | |
| 5.625% Sr. Unsec. Unsub. Nts., 8/15/14 | | | 104,000 | | | | 110,694 | |
| | | | | | |
|
|
|
| | | | | | | | 379,044 | |
| Food Products—0.5% | | | | | | | | |
Bunge Ltd. Finance Corp.:
5.35% Sr. Unsec. | | | | | | | | |
| Unsub. Nts., 4/15/14 | | | 236,000 | | | | 248,412 | |
| 8.50% Sr. Unsec. Nts., 6/15/19 | | | 207,000 | | | | 266,498 | |
| ConAgra Foods, Inc., 3.25% Sr. Unsec. | | | | | | | | |
| Unsub. Nts., 9/15/22 | | | 140,000 | | | | 140,750 | |
| Kraft Foods Group, Inc., | | | | | | | | |
| 6.50% Sr. Unsec. Unsub. Nts., 2/9/402 | | | 92,000 | | | | 121,026 | |
| TreeHouse Foods, Inc., | | | | | | | | |
| 7.75% Sr. Unsec. Nts., 3/1/18 | | | 353,000 | | | | 383,888 | |
| Tyson Foods, Inc., | | | | | | | | |
| 4.50% Sr. Unsec. Unsub. Nts., 6/15/22 | | | 150,000 | | | | 162,955 | |
| | | | | | |
|
|
|
| | | | | | | | 1,323,529 | |
| Tobacco—0.2% | | | | | | | | |
| Altria Group, Inc., 10.20% | | | | | | | | |
| Sr. Unsec. Nts., 2/6/39 | | | 143,000 | | | | 239,392 | |
| Lorillard Tobacco Co., 7% | | | | | | | | |
| Sr. Unsec. Nts., 8/4/41 | | | 221,000 | | | | 268,551 | |
| | | | | | |
|
|
|
| | | | | | | | 507,943 | |
| Energy—2.1% | | | | | | | | |
| Energy Equipment & Services—0.5% | | | | | |
| Ensco plc, 4.70% Sr. Unsec. | | | | | | | | |
| Nts., 3/15/21 | | | 322,000 | | | | 362,640 | |
| Noble Holding International Ltd., | | | | | | | | |
| 7.375% Sr. Unsec. Bonds, 3/15/14 | | | 276,000 | | | | 296,666 | |
| Precision Drilling Corp.: | | | | | | | | |
| 6.50% Sr. Unsec. Nts., 12/15/21 | | | 152,000 | | | | 162,640 | |
| 6.625% Sr. Unsec. Nts., 11/15/20 | | | 145,000 | | | | 156,600 | |
| Rowan Cos., Inc., | | | | | | | | |
| 4.875% Sr. Unsec. Nts., 6/1/22 | | | 216,000 | | | | 234,783 | |
| | | | |
| 15 | | | | OPPENHEIMER BALANCED FUND/VA |
STATEMENT OF INVESTMENTS Continued
| | | | | | | | |
| | | Principal
Amount | | | Value | |
| | | | | | | | | |
| Energy Equipment & Services Continued | |
| Weatherford International Ltd. | | | | | | | | |
| Bermuda, 5.125% Sr. Unsec. | | | | | | | | |
| Unsub. Nts., 9/15/20 | | $ | 181,000 | | | $ | 199,601 | |
| | | | | | |
|
|
|
| | | | | | | | 1,412,930 | |
| Oil, Gas & Consumable Fuels—1.6% | | | | | |
| Anadarko Petroleum Corp., | | | | | | | | |
| 6.20% Sr. Unsec. Nts., 3/15/40 | | | 117,000 | | | | 144,443 | |
| Canadian Oil Sands Ltd.: | | | | | | | | |
| 5.80% Sr. Unsec. Nts., 8/15/132 | | | 318,000 | | | | 328,271 | |
| 6% Sr. Unsec. Nts., 4/1/422 | | | 129,000 | | | | 151,637 | |
| DCP Midstream LLC, | | | | | | | | |
| 5.35% Sr. Unsec. Nts., 3/18/202 | | | 197,000 | | | | 217,566 | |
| DCP Midstream Operating LP, 2.50% | | | | | | | | |
| Sr. Unsec. Unsub. Nts., 12/1/17 | | | 250,000 | | | | 248,862 | |
| El Paso Pipeline Partners Operating Co. LLC, 4.70% Sr. Unsec. Nts., 11/1/42 | | | 200,000 | | | | 196,502 | |
| EnCana Holdings Finance Corp., | | | | | | | | |
| 5.80% Sr. Unsec. Unsub. Nts., 5/1/14 | | | 139,000 | | | | 147,803 | |
Energy Transfer Partners LP:
4.65% Sr. Unsec. Unsub. Nts., 6/1/21 | | | 256,000 | | | | 281,492 | |
| 5.20% Sr. Unsec. Unsub. Nts., 2/1/22 | | | 92,000 | | | | 105,029 | |
| 8.50% Sr. Unsec. Nts., 4/15/14 | | | 180,000 | | | | 195,789 | |
| Newfield Exploration Co., 6.875% | | | | | | | | |
| Sr. Unsec. Sub. Nts., 2/1/20 | | | 308,000 | | | | 331,100 | |
| Nexen, Inc., 6.40% Sr. Unsec. | | | | | | | | |
| Unsub. Bonds, 5/15/37 | | | 126,000 | | | | 163,027 | |
| NuStar Logistics LP, 4.75% Sr. Unsec. | | | | | | | | |
| Unsub. Nts., 2/1/22 | | | 291,000 | | | | 276,852 | |
| Phillips 66, 4.30% Unsec. Nts., 4/1/222 | | | 202,000 | | | | 225,910 | |
| Range Resources Corp., 8% | | | | | | | | |
| Sr. Unsec. Sub. Nts., 5/15/19 | | | 314,000 | | | | 349,325 | |
| Ras Laffan Liquefied Natural Gas Co. | | | | | | | | |
| Ltd. III, 5.50% Sr. Sec. Nts., 9/30/142 | | | 291,000 | | | | 314,353 | |
| Rockies Express Pipeline LLC, | | | | | | | | |
| 3.90% Sr. Unsec. Unsub. | | | | | | | | |
| Nts., 4/15/152 | | | 327,000 | | | | 327,000 | |
| Southwestern Energy Co., | | | | | | | | |
| 4.10% Sr. Unsec. Nts., 3/15/222 | | | 160,000 | | | | 172,251 | |
| Woodside Finance Ltd.: | | | | | | | | |
| 4.60% Sr. Unsec. Nts., 5/10/212 | | | 223,000 | | | | 245,974 | |
| 5% Sr. Unsec. Nts., 11/15/132 | | | 312,000 | | | | 322,391 | |
| | | | | | |
|
|
|
| | | | | | | | 4,745,577 | |
| Financials—5.9% | | | | | | | | |
| Capital Markets—1.5% | | | | | | | | |
| Blackstone Holdings Finance Co. LLC: | | | | | | | | |
| 4.75% Sr. Unsec. Nts., 2/15/232 | | | 85,000 | | | | 90,440 | |
| 6.625% Sr. Unsec. Nts., 8/15/192 | | | 364,000 | | | | 421,912 | |
| Goldman Sachs Capital, Inc. (The), | | | | | | | | |
| 6.345% Sub. Bonds, 2/15/34 | | | 340,000 | | | | 353,164 | |
| | | | | | | | |
| | | Principal
Amount | | | Value | |
| | | | | | | | | |
| Capital Markets Continued | |
| Goldman Sachs Group, Inc. (The): | | | | | | | | |
| 5.25% Sr. Unsec. Nts., 7/27/21 | | $ | 271,000 | | | $ | 309,172 | |
| 6.25% Sr. Nts., 2/1/41 | | | 307,000 | | | | 376,994 | |
| Macquarie Bank Ltd.: | | | | | | | | |
| 5% Sr. Nts., 2/22/172 | | | 101,000 | | | | 110,534 | |
| 6.625% Unsec. Sub. Nts., 4/7/212 | | | 466,000 | | | | 515,453 | |
| Morgan Stanley: | | | | | | | | |
| 4.875% Sub. Nts., 11/1/22 | | | 240,000 | | | | 248,708 | |
| 6.375% Sr. Unsec. Nts., 7/24/42 | | | 613,000 | | | | 719,245 | |
Nomura Holdings, Inc.:
4.125% Sr. Unsec. | | | | | | | | |
| Unsub. Nts., 1/19/16 | | | 330,000 | | | | 344,611 | |
| 6.70% Sr. Unsec. Nts., 3/4/20 | | | 28,000 | | | | 32,698 | |
| Raymond James Financial, Inc., | | | | | | | | |
| 5.625% Sr. Nts., 4/1/24 | | | 265,000 | | | | 296,907 | |
| UBS AG (Stamford CT), 2.25% | | | | | | | | |
| Sr. Unsec. Nts., 8/12/13 | | | 139,000 | | | | 140,353 | |
| UBS Preferred Funding Trust V, | | | | | | | | |
| 6.243% Jr. Sub. Perpetual Nts.10 | | | 310,000 | | | | 317,750 | |
| | | | | | |
|
|
|
| | | | | | | | 4,277,941 | |
| Commercial Banks—1.2% | | | | | | | | |
| Fifth Third Cap Trust IV, 6.50% | | | | | | | | |
| Jr. Unsec. Sub. Nts., 4/15/37 | | | 641,000 | | | | 643,404 | |
| HBOS plc, 6.75% Unsec. Sub. Nts., 5/21/182 | | | 293,000 | | | | 316,806 | |
| HSBC Finance Capital Trust IX, | | | | | | | | |
| 5.911% Nts., 11/30/353 | | | 720,000 | | | | 721,800 | |
| Lloyds TSB Bank plc, 6.50% Unsec. | | | | | | | | |
| Sub. Nts., 9/14/202 | | | 237,000 | | | | 262,054 | |
Mercantile Bankshares Corp., 4.625% Unsec. Sub. Nts.,
Series B, 4/15/13 | | | 218,000 | | | | 220,517 | |
| RBS Citizens Financial Group, Inc., 4.15% Sub. Nts., 9/28/222 | | | 558,000 | | | | 569,910 | |
| Wells Fargo & Co., 7.98% Jr. Sub. | | | | | | | | |
| Perpetual Bonds, Series K10 | | | 333,000 | | | | 383,783 | |
| Zions Bancorp, 4.50% Sr. Unsec. Unsub. | | | | | | | | |
| Nts., 3/27/17 | | | 487,000 | | | | 509,127 | |
| | | | | | |
|
|
|
| | | | | | | | 3,627,401 | |
| Consumer Finance—0.4% | | | | | | | | |
American Express Bank FSB,
5.50% Sr. Unsec. Nts., 4/16/13 | | | 329,000 | | | | 333,784 | |
Discover Financial Services,
3.85% Sr. Unsec. | | | | | | | | |
| Unsub. Nts., 11/21/222 | | | 457,000 | | | | 471,992 | |
SLM Corp., 4.625% Sr.
Unsec. Nts., 9/25/17 | | | 453,000 | | | | 464,093 | |
| | | | | | |
|
|
|
| | | | | | | | 1,269,869 | |
| | | | |
| 16 | | | | OPPENHEIMER BALANCED FUND/VA |
| | | | | | | | |
| | | Principal
Amount | | | Value | |
| Diversified Financial Services—0.9% | | | | | |
Citigroup, Inc.:
4.50% Sr. Unsec. Nts., 1/14/22 | | $ | 356,000 | | | $ | 397,519 | |
| 5.95% Sub. Nts., 12/31/49 | | | 301,000 | | | | 305,139 | |
| ING Bank NV, 3.75% Unsec. | | | | | | | | |
| Nts., 3/7/172 | | | 108,000 | | | | 114,855 | |
| JPMorgan Chase & Co., 7.90% | | | | | | | | |
| Perpetual Bonds, Series 110 | | | 1,037,000 | | | | 1,179,144 | |
| Merrill Lynch & Co., Inc., 7.75% | | | | | | | | |
| Jr. Sub. Bonds, 5/14/38 | | | 373,000 | | | | 485,904 | |
| | | | | | |
|
|
|
| | | | | | | | 2,482,561 | |
| Insurance—1.3% | | | | | | | | |
| American International Group, Inc., 6.25% Jr. Sub. Bonds, 3/15/37 | | | 147,000 | | | | 157,658 | |
| CNA Financial Corp.: | | | | | | | | |
| 5.75% Sr. Unsec. Unsub. Nts., 8/15/21 | | | 290,000 | | | | 340,403 | |
5.875% Sr. Unsec.
Unsub. Bonds, 8/15/20 | | | 169,000 | | | | 199,525 | |
| Gulf South Pipeline Co. LP, | | | | | | | | |
| 5.05% Sr. Unsec. Nts., 2/1/152 | | | 260,000 | | | | 280,875 | |
| Hartford Life, Inc., 7.375% Sr. Unsec. Unsub. Nts., 3/1/31 | | | 430,000 | | | | 542,662 | |
Irish Life & Permanent Group
Holdings plc, 3.60% Sr. Unsec. | | | | | | | | |
| Unsub. Nts., 1/14/132 | | | 170,000 | | | | 170,426 | |
Lincoln National Corp.,
| | | | | | | | |
| 6.05% Jr. Unsec. Sub. Bonds, 4/20/67 | | | 555,000 | | | | 555,694 | |
Marsh & McLennan Cos., Inc., 5.375%
Nts., 7/15/14 | | | 64,000 | | | | 68,345 | |
Prudential Financial, Inc., 5.625%
Unsec. Sub. Nts., 6/15/43 | | | 167,000 | | | | 173,897 | |
Swiss Re Capital I LP,
6.854% Perpetual Bonds2,10 | | | 554,000 | | | | 580,947 | |
Unum Group, 5.625% Sr. Unsec.
Unsub. Nts., 9/15/20 | | | 454,000 | | | | 519,094 | |
| Willis Group Holdings plc, 4.125% Sr. Unsec. Unsub. Nts., 3/15/16 | | | 116,000 | | | | 123,791 | |
| | | | | | |
|
|
|
| | | | | | | | 3,713,317 | |
| Real Estate Investment Trusts (REITs)—0.6% | |
American Tower Corp.:
5.05% Sr. Unsec.
Unsub. Nts., 9/1/20 | | | 75,000 | | | | 84,168 | |
| 7% Sr. Unsec. Nts., 10/15/17 | | | 294,000 | | | | 351,830 | |
CommonWealth REIT, 6.40% Sr. Unsec.
| | | | | | | | |
| Unsub. Nts., 2/15/15 | | | 265,000 | | | | 284,563 | |
| Duke Realty LP, 6.25% Sr. Unsec. Unsub. Nts., 5/15/13 | | | 322,000 | | | | 328,399 | |
Hospitality Properties Trust,
5.125% Sr. Unsec. Nts., 2/15/15 | | | 262,000 | | | | 275,678 | |
| | | | | | | | |
| | | Principal
Amount | | | Value | |
| Real Estate Investment Trusts (REITs) Continued | |
National Retail Properties, Inc.,
6.25% Sr. Unsec.
| | | | | | | | |
| Unsub. Nts., 6/15/14 | | $ | 211,000 | | | $ | 225,615 | |
| WEA Finance LLC/WT Finance Aust Pty Ltd., 7.50% Sr. Unsec. Nts., 6/2/142 | | | 283,000 | | | | 308,018 | |
| | | | | | |
|
|
|
| | | | | | | | 1,858,271 | |
| Health Care—0.8% | | | | | | | | |
| Biotechnology—0.3% | | | | | | | | |
Amgen, Inc., 3.625% Sr. Unsec. Unsub.
| | | | | | | | |
| Nts., 5/15/22 | | | 299,000 | | | | 321,595 | |
| Celgene Corp., 3.25% Sr. Unsec. | | | | | | | | |
| Nts., 8/15/22 | | | 322,000 | | | | 328,539 | |
| Gilead Sciences, Inc., 5.65% Sr. Unsec. | | | | | | | | |
| Nts., 12/1/41 | | | 167,000 | | | | 207,656 | |
| | | | | | |
|
|
|
| | | | | | | | 857,790 | |
| Health Care Providers & Services—0.3% | |
| Express Scripts Holding Co., 6.25% Sr. Unsec. Nts., 6/15/14 | | | 268,000 | | | | 288,705 | |
| McKesson Corp., 6% Sr. Unsec. | | | | | | | | |
| Unsub. Nts., 3/1/41 | | | 183,000 | | | | 241,939 | |
Quest Diagnostics, Inc.,
5.75% Sr. Unsec. Nts., 1/30/40 | | | 215,000 | | | | 246,549 | |
| | | | | | |
|
|
|
| | | | | | | | 777,193 | |
| Pharmaceuticals—0.2% | | | | | | | | |
| AbbVie, Inc., 2.90% Sr. Unsec. Nts., 11/6/222 | | | 207,000 | | | | 211,003 | |
| Mylan, Inc., 6% Sr. Nts., 11/15/182 | | | 365,000 | | | | 403,244 | |
| | | | | | |
|
|
|
| | | | | | | | 614,247 | |
| Industrials—1.4% | | | | | | | | |
| Aerospace & Defense—0.2% | | | | | | | | |
| BE Aerospace, Inc., 5.25% | | | | | | | | |
| Sr. Unsec. Unsub. Nts., 4/1/22 | | | 200,000 | | | | 213,000 | |
Huntington Ingalls Industries, Inc., 7.125% Sr. Unsec.
Unsub. Nts., 3/15/21 | | | 280,000 | | | | 305,900 | |
| | | | | | |
|
|
|
| | | | | | | | 518,900 | |
| Building Products—0.0% | | | | | | | | |
| Owens Corning, 4.20% Sr. Unsec. | | | | | | | | |
| Nts., 12/15/22 | | | 99,000 | | | | 100,769 | |
| Commercial Services & Supplies—0.1% | |
| Clean Harbors, Inc., 5.25% Sr. Unsec. | | | | | | | | |
| Unsub. Nts., 8/1/20 | | | 298,000 | | | | 312,155 | |
R.R. Donnelley & Sons Co., 8.60%
Sr. Unsec. Unsub. Nts., 8/15/16 | | | 50,000 | | | | 54,000 | |
| | | | | | |
|
|
|
| | | | | | | | 366,155 | |
| | | | |
| 17 | | | | OPPENHEIMER BALANCED FUND/VA |
STATEMENT OF INVESTMENTS Continued
| | | | | | | | |
| | | Principal
Amount | | | Value | |
| Electrical Equipment—0.0% | | | | | | | | |
Turlock Corp., 4.15% Sr. Unsec. Unsub.
Nts., 11/2/422 | | $ | 143,000 | | | $ | 144,765 | |
| Industrial Conglomerates—0.4% | | | | | |
General Electric Capital Corp.:
6.375% Unsec. Sub. Bonds, 11/15/67 | | | 644,000 | | | | 681,030 | |
| 7.125% Unsec. Sub. Nts., 12/15/49 | | | 300,000 | | | | 340,429 | |
| | | | | | |
|
|
|
| | | | | | | | 1,021,459 | |
| Machinery—0.4% | | | | | | | | |
CNH Capital LLC, 6.25% Sr. Unsec.
Nts., 11/1/16 | | | 338,000 | | | | 374,335 | |
| Joy Global, Inc., 5.125% Sr. Unsec. | | | | | | | | |
| Unsub. Nts., 10/15/21 | | | 208,000 | | | | 229,468 | |
| Kennametal, Inc., 3.875% Sr. Unsec. | | | | | | | | |
| Unsub. Nts., 2/15/22 | | | 234,000 | | | | 244,546 | |
SPX Corp., 6.875% Sr. Unsec.
Nts., 9/1/172 | | | 286,000 | | | | 320,320 | |
| | | | | | |
|
|
|
| | | | | | | | 1,168,669 | |
| Professional Services—0.1% | | | | | | | | |
FTI Consulting, Inc., 6.75% Sr. Unsec.
| | | | | | | | |
| Nts., 10/1/20 | | | 288,000 | | | | 308,880 | |
| Road & Rail—0.2% | | | | | | | | |
CSX Corp., 5.50% Sr. Unsec.
Nts., 4/15/41 | | | 118,000 | | | | 141,517 | |
Kansas City Southern de Mexico SA de CV, 6.625% Sr. Unsec.
Unsub. Nts., 12/15/20 | | | 255,000 | | | | 290,700 | |
| Penske Truck Leasing Co. LP/PTL Finance Corp., 2.50% Sr. Nts., 7/11/142 | | | 106,000 | | | | 107,147 | |
| | | | | | |
|
|
|
| | | | | | | | 539,364 | |
| Information Technology—0.9% | | | | | |
| Communications Equipment—0.1% | | | | | |
Juniper Networks, Inc., 5.95%
Sr. Unsec. Unsub. Nts., 3/15/41 | | | 138,000 | | | | 157,283 | |
| Computers & Peripherals—0.3% | | | | | |
Hewlett-Packard Co.:
2.65% Sr. Unsec. Unsub. Nts., 6/1/16 | | | 495,000 | | | | 494,208 | |
| 4.75% Sr. Unsec. Nts., 6/2/14 | | | 200,000 | | | | 208,552 | |
| | | | | | |
|
|
|
| | | | | | | | 702,760 | |
| Electronic Equipment, Instruments & Components—0.2% | |
| Amphenol Corp., 4.75% Sr. Unsec. Unsub. Nts., 11/15/14 | | | 79,000 | | | | 84,213 | |
| Arrow Electronics, Inc., 5.125% | | | | | | | | |
| Sr. Unsec. Unsub. Nts., 3/1/21 | | | 340,000 | | | | 366,760 | |
Corning, Inc., 4.75% Sr. Unsec. Unsub.
Nts., 3/15/42 | | | 125,000 | | | | 131,764 | |
| | | | | | |
|
|
|
| | | | | | | | 582,737 | |
| | | | | | | | |
| | | Principal
Amount | | | Value | |
| Internet Software & Services—0.0% | | | | | | | | |
eBay, Inc., 4% Sr. Unsec.
Unsub. Nts., 7/15/42 | | $ | 119,000 | | | $ | 116,016 | |
| Office Electronics—0.1% | | | | | | | | |
Xerox Corp., 5.65% Sr. Unsec.
Nts., 5/15/13 | | | 330,000 | | | | 335,688 | |
| Software—0.2% | | | | | | | | |
Autodesk, Inc.:
1.95% Sr. Unsec. Unsub. Nts., 12/15/17 | | | 138,000 | | | | 137,424 | |
| 3.60% Sr. Unsec. Unsub. Nts., 12/15/22 | | | 87,000 | | | | 87,462 | |
| Symantec Corp., 4.20% Sr. Unsec. Unsub. Nts., 9/15/20 | | | 391,000 | | | | 411,070 | |
| | | | | | |
|
|
|
| | | | | | | | 635,956 | |
| Materials—1.4% | | | | | | | | |
| Chemicals—0.3% | | | | | | | | |
Agrium, Inc., 6.125% Sr. Unsec.
Nts., 1/15/41 | | | 155,000 | | | | 186,518 | |
| CF Industries, Inc., 7.125% Sr. Unsec. | | | | | | | | |
| Unsub. Nts., 5/1/20 | | | 227,000 | | | | 285,874 | |
Eastman Chemical Co., 4.80%
Sr. Unsec. Nts., 9/1/42 | | | 145,000 | | | | 155,253 | |
RPM International, Inc., 3.45%
Sr. Unsec. Nts., 11/15/22 | | | 144,000 | | | | 141,213 | |
Sherwin-Williams Co. (The), 4%
Sr. Unsec. Unsub. Nts., 12/15/42 | | | 143,000 | | | | 143,045 | |
| | | | | | |
|
|
|
| | | | | | | | 911,903 | |
| Containers & Packaging—0.4% | | | | | |
Crown Americas LLC/Crown Americas Capital Corp. II I, 6.25% Sr. Unsec.
Nts., 2/1/21 | | | 308,000 | | | | 339,185 | |
| Greif, Inc., 7.75% Sr. Unsec. Nts., 8/1/19 | | | 261,000 | | | | 302,760 | |
Rock-Tenn Co.:
3.50% Sr. Nts., 3/1/202 | | | 62,000 | | | | 63,681 | |
| 4.90% Sr. Unsec. Nts., 3/1/222 | | | 112,000 | | | | 121,136 | |
| Sealed Air Corp., 8.375% Sr. Unsec. | | | | | | | | |
| Nts., 9/15/212 | | | 270,000 | | | | 309,825 | |
| | | | | | |
|
|
|
| | | | | | | | 1,136,587 | |
| Metals & Mining—0.5% | | | | | | | | |
Allegheny Technologies, Inc.,
5.95% Sr. Unsec. | | | | | | | | |
| Unsub. Nts., 1/15/21 | | | 150,000 | | | | 166,284 | |
Cliffs Natural Resources, Inc.,
6.25% Sr. Unsec. | | | | | | | | |
| Unsub. Nts., 10/1/40 | | | 86,000 | | | | 83,911 | |
| Freeport-McMoRan Copper & Gold, | | | | | | | | |
| Inc., 3.55% Sr. Unsec. Nts., 3/1/22 | | | 227,000 | | | | 225,325 | |
| Petrohawk Energy Corp., 6.25% Sr. | | | | | | | | |
| Unsec. Nts., 6/1/19 | | | 499,000 | | | | 568,544 | |
| | | | |
| 18 | | | | OPPENHEIMER BALANCED FUND/VA |
| | | | | | | | |
| | | Principal
Amount | | | Value | |
| Metals & Mining Continued | | | | | | | | |
Xstrata Canada Corp.:
5.375% Sr. Unsec. Unsub. Nts., 6/1/15 | | $ | 135,000 | | | $ | 146,807 | |
| 6% Sr. Unsec. Unsub. Nts., 10/15/15 | | | 264,000 | | | | 293,512 | |
Xstrata Finance Canada Ltd.,
5.80% Sr. Unsec. | | | | | | | | |
| Unsub. Bonds, 11/15/162 | | | 35,000 | | | | 39,535 | |
| | | | | | |
|
|
|
| | | | | | | | 1,523,918 | |
| Paper & Forest Products—0.2% | | | | | |
| International Paper Co., 6% Sr. Unsec. | | | | | | | | |
| Unsub. Nts., 11/15/41 | | | 139,000 | | | | 164,740 | |
| Westvaco Corp., 7.95% Sr. Unsec. | | | | | | | | |
| Unsub. Nts., 2/15/31 | | | 242,000 | | | | 316,477 | |
| | | | | | |
|
|
|
| | | | | | | | 481,217 | |
| Telecommunication Services—1.0% | | | | | |
| Diversified Telecommunication Services—0.9% | |
| AT&T, Inc., 6.30% Sr. Unsec. | | | | | | | | |
| Bonds, 1/15/38 | | | 329,000 | | | | 422,206 | |
| British Telecommunications plc, | | | | | | | | |
| 9.625% Bonds, 12/15/30 | | | 209,000 | | | | 332,242 | |
| CenturyLink, Inc., 7.65% Sr. Unsec. | | | | | | | | |
| Unsub. Nts., 3/15/42 | | | 244,000 | | | | 255,190 | |
| Frontier Communications Corp., | | | | | | | | |
| 8.50% Sr. Unsec. Nts., 4/15/20 | | | 267,000 | | | | 308,385 | |
Telecom Italia Capital SA,
7.721% Sr. Unsec. | | | | | | | | |
| Unsub. Nts., 6/4/38 | | | 346,000 | | | | 376,275 | |
Telefonica Emisiones SAU,
5.462% Sr. Unsec. | | | | | | | | |
| Unsub. Nts., 2/16/21 | | | 377,000 | | | | 402,919 | |
| Verizon Communications, Inc., | | | | | | | | |
| 6.40% Sr. Unsec. Nts., 2/15/38 | | | 199,000 | | | | 269,650 | |
| Windstream Corp., 7.50% Sr. Unsec. | | | | | | | | |
| Unsub. Nts., 4/1/23 | | | 280,000 | | | | 296,100 | |
| | | | | | |
|
|
|
| | | | | | | | 2,662,967 | |
| | | | | | | | |
| | | Principal
Amount | | | Value | |
| Wireless Telecommunication Services—0.1% | |
America Movil SAB de CV,
4.375% Sr. Unsec.
Unsub. Nts., 7/16/42 | | $ | 151,000 | | | $ | 157,165 | |
CC Holdings GS V LLC, 3.849% Sr. Sec.
Nts., 4/15/232 | | | 144,000 | | | | 146,629 | |
| | | | | | |
|
|
|
| | | | | | | | 303,794 | |
| Utilities—0.7% | | | | | | | | |
| Electric Utilities—0.5% | | | | | | | | |
| Edison International, 3.75% | | | | | | | | |
| Sr. Unsec. Unsub. Nts., 9/15/17 | | | 438,000 | | | | 475,308 | |
| Great Plains Energy, Inc., 2.75% | | | | | | | | |
| Sr. Unsec. Unsub. Nts., 8/15/13 | | | 354,000 | | | | 357,724 | |
| PPL WEM Holdings plc, 5.375% | | | | | | | | |
| Sr. Unsec. Nts., 5/1/212 | | | 492,000 | | | | 553,765 | |
| | | | | | |
|
|
|
| | | | | | | | 1,386,797 | |
| Energy Traders—0.1% | | | | | | | | |
TransAlta Corp., 5.75% Sr. Unsec.
Nts., 12/15/13 | | | 316,000 | | | | 329,176 | |
| Multi-Utilities—0.1% | | | | | | | | |
| CMS Energy Corp., 5.05% Sr. Unsec. Unsub. Nts., 3/15/22 | | | 270,000 | | | | 301,938 | |
| | | | | | |
|
|
|
| Total Non-Convertible Corporate Bonds and Notes (Cost $50,459,423) | | | | | | | 54,169,476 | |
| | |
| | | Shares | | | | |
| Investment Company—6.8% | |
Oppenheimer Institutional Money Market Fund, Cl. E, 0.15%11,12
(Cost $19,691,265) | | | 19,691,265 | | | | 19,691,265 | |
Total Investments, at Value
(Cost $308,390,126) | | | 114.0 | % | | | 331,773,514 | |
| Liabilities in Excess of Other Assets | |
| (14.0
| )
| |
| (40,869,163
| )
|
| Net Assets | |
| 100.0
| %
| | $
| 290,904,351
|
|
Footnotes to Statement of Investments
1. Non-income producing security.
2. Represents securities sold under Rule 144A, which are exempt from registration under the Securities Act of 1933, as amended. These securities have been determined to be liquid under guidelines established by the Board of Trustees. These securities amount to $15,774,089 or 5.42% of the Fund’s net assets as of December 31, 2012.
3. Represents the current interest rate for a variable or increasing rate security.
| | | | |
| 19 | | | | OPPENHEIMER BALANCED FUND/VA |
STATEMENT OF INVESTMENTS Continued
Footnotes to Statement of Investments Continued
4. Restricted security. The aggregate value of restricted securities as of December 31, 2012 was $400,294, which represents 0.14% of the Fund’s net assets. See Note 7 of the accompanying Notes. Information concerning restricted securities is as follows:
| | | | | | | | | | | | | | | | |
| Security | | Acquisition
Dates | | | Cost | | | Value | | | Unrealized
Appreciation | |
| Morgan Stanley, Re-Securitized Real Estate Mtg. Investment Conduit Multiclass Pass-Through Certificates, Series 2012-R3, Cl. 1B, 2.298%, 11/1/36 | | | 10/24/12 | | | $ | 135,433 | | | $ | 149,647 | | | $ | 14,214 | |
Santander Drive Auto Receivables Trust 2011-S2A, Automobile Receivables Nts., Series 2011-S2A,
Cl. D, 3.35%, 6/15/17 | | | 5/19/11-11/18/11 | | | | 149,499 | | | | 150,541 | | | | 1,042 | |
Westlake Automobile Receivables Trust 2012-1, Automobile Receivable Nts., Series 2012-1,
Cl. D, 1.03%, 6/16/14 | | | 9/19/12 | | | | 99,999 | | | | 100,106 | | | | 107 | |
| | | | | | |
|
|
| |
|
|
| |
|
|
|
| | | | | | | $ | 384,931 | | | $ | 400,294 | | | $ | 15,363 | |
| | | | | | |
|
|
| |
|
|
| |
|
|
|
5. All or a portion of the security position is when-issued or delayed delivery to be delivered and settled after December 31, 2012. See Note 1 of the accompanying Notes.
6. Interest-Only Strips represent the right to receive the monthly interest payments on an underlying pool of mortgage loans or other receivables. These securities typically decline in price as interest rates decline. Most other fixed income securities increase in price when interest rates decline. The principal amount of the underlying pool represents the notional amount on which current interest is calculated. The price of these securities is typically more sensitive to changes in prepayment rates than traditional mortgage or asset-backed securities (for example, GNMA pass-throughs). Interest rates disclosed represent current yields based upon the current cost basis and estimated timing and amount of future cash flows. These securities amount to $3,848,227 or 1.32% of the Fund’s net assets as of December 31, 2012.
7. Principal-Only Strips represent the right to receive the monthly principal payments on an underlying pool of mortgage loans. The value of these securities generally increases as interest rates decline and prepayment rates rise. The price of these securities is typically more volatile than that of coupon-bearing bonds of the same maturity. Interest rates disclosed represent current yields based upon the current cost basis and estimated timing of future cash flows. These securities amount to $166,348 or 0.06% of the Fund’s net assets as of December 31, 2012.
8. The current amortization rate of the security’s cost basis exceeds the future interest payments currently estimated to be received. Both the amortization rate and interest payments are contingent on future mortgage pre-payment speeds and are therefore subject to change.
9. All or a portion of the security position is held in accounts at a futures clearing merchant and pledged to cover margin requirements on open futures contracts and written options on futures, if applicable. The aggregate market value of such securities is $203,894. See Note 6 of the accompanying Notes.
10. This bond has no contractual maturity date, is not redeemable and contractually pays an indefinite stream of interest. Rate reported represents the current interest rate for this variable rate security.
11. Is or was an affiliate, as defined in the Investment Company Act of 1940, at or during the period ended December 31, 2012, by virtue of the Fund owning at least 5% of the voting securities of the issuer or as a result of the Fund and the issuer having the same investment adviser. Transactions during the period in which the issuer was an affiliate are as follows:
| | | | | | | | | | | | | | | | |
| | | Shares
December 30, 2011a | | | Gross
Additions | | | Gross
Reductions | | | Shares
December 31, 2012 | |
| Oppenheimer Institutional Money Market Fund, Cl. E | | | 32,784,414 | | | | 111,734,308 | | | | 124,827,457 | | | | 19,691,265 | |
| | | | |
| | | | | | | | | Value | | | Income | |
| Oppenheimer Institutional Money Market Fund, Cl. E | | | | | | | | | | $ | 19,691,265 | | | $ | 39,171 | |
a. December 30, 2011 represents the last business day of the Fund’s 2011 fiscal year. See Note 1 of the accompanying Notes.
12. Rate shown is the 7-day yield as of December 31, 2012.
| | | | |
| 20 | | | | OPPENHEIMER BALANCED FUND/VA |
| | | | | | | | | | | | | | | | | | | | |
| Futures Contracts as of December 31, 2012 are as follows: | | | | | | | | | | |
| | | | | |
| Contract Description | | Buy/Sell | | | Number
of
Contracts | | | Expiration
Date | | | Value | | | Unrealized
Appreciation
(Depreciation) | |
| U.S. Long Bonds | | | Sell | | | | 31 | | | | 3/19/13 | | | $ | 4,572,500 | | | $ | 61,900 | |
| U.S. Treasury Nts., 2 yr. | | | Sell | | | | 47 | | | | 3/28/13 | | | | 10,362,031 | | | | (148 | ) |
| U.S. Treasury Nts., 5 yr. | | | Sell | | | | 46 | | | | 3/28/13 | | | | 5,723,047 | | | | 1,160 | |
| U.S. Treasury Nts., 10 yr. | | | Sell | | | | 37 | | | | 3/19/13 | | | | 4,912,906 | | | | 25,817 | |
| U.S. Treasury Ultra Bonds | | | Buy | | | | 34 | | | | 3/19/13 | | | | 5,528,188 | | | | (88,073 | ) |
| | | | | | | | | | | | | | | | | | |
|
|
|
| | | | | | | | | | | | | | | | | | | $ | 656 | |
| | | | | | | | | | | | | | | | | | |
|
|
|
See accompanying Notes to Financial Statements.
| | | | |
| 21 | | | | OPPENHEIMER BALANCED FUND/VA |
STATEMENT OF ASSETS AND LIABILITIES
| | | | |
| December 31, 2012 | | | |
| Assets | | | |
| Investments, at value—see accompanying statement of investments: | | | | |
| Unaffiliated companies (cost $288,698,861) | | $ | 312,082,249 | |
| Affiliated companies (cost $19,691,265) | |
| 19,691,265
|
|
| | | | 331,773,514 | |
| Cash | | | 403,522 | |
| Receivables and other assets: | | | | |
| Investments sold on a when-issued or delayed delivery basis | | | 4,818,219 | |
| Interest, dividends and principal paydowns | | | 1,126,208 | |
| Shares of beneficial interest sold | | | 122,047 | |
| Futures margins | | | 33,484 | |
| Other | |
| 30,710
|
|
| Total assets | | | 338,307,704 | |
| Liabilities | | | | |
| Payables and other liabilities: | | | | |
| Investments purchased (including $45,488,388 purchased on a when-issued or delayed delivery basis) | | | 46,686,773 | |
| Shares of beneficial interest redeemed | | | 518,756 | |
| Futures margins | | | 44,281 | |
| Trustees’ compensation | | | 28,513 | |
| Transfer and shareholder servicing agent fees | | | 24,401 | |
| Shareholder communications | | | 21,641 | |
| Distribution and service plan fees | | | 15,554 | |
| Other | |
| 63,434
|
|
| Total liabilities | | | 47,403,353 | |
| Net Assets | | $
| 290,904,351
|
|
| Composition of Net Assets | | | |
| Par value of shares of beneficial interest | | $ | 23,309 | |
| Additional paid-in capital | | | 331,078,099 | |
| Accumulated net investment income | | | 6,595,479 | |
| Accumulated net realized loss on investments and foreign currency transactions | | | (70,176,401 | ) |
| Net unrealized appreciation on investments and translation of assets and liabilities denominated in foreign currencies | |
| 23,383,865
|
|
| Net Assets | | $
| 290,904,351
|
|
| Net Asset Value Per Share | | | |
| Non-Service Shares: | | | | |
Net asset value, redemption price per share and offering price per share (based on net assets of $218,032,062
and 17,416,805 shares of beneficial interest outstanding) | | | $12.52 | |
| Service Shares: | | | | |
Net asset value, redemption price per share and offering price per share (based on net assets of $72,872,289
and 5,892,240 shares of beneficial interest outstanding) | | | $12.37 | |
See accompanying Notes to Financial Statements.
| | | | |
| 22 | | | | OPPENHEIMER BALANCED FUND/VA |
STATEMENT OF OPERATIONS
| | | | |
| For the Year Ended December 31, 2012 | | | |
| Investment Income | | | |
| Interest | | $ | 4,567,455 | |
| Dividends: | | | | |
| Unaffiliated companies (net of foreign withholding taxes of $961) | | | 3,760,270 | |
| Affiliated companies | |
| 39,171
|
|
| Total investment income | | | 8,366,896 | |
| Expenses | | | |
| Management fees | | | 1,985,570 | |
| Distribution and service plan fees—Service shares | | | 192,074 | |
| Transfer and shareholder servicing agent fees: | | | | |
| Non-Service shares | | | 191,240 | |
| Service shares | | | 76,197 | |
| Shareholder communications: | | | | |
| Non-Service shares | | | 33,423 | |
| Service shares | | | 12,357 | |
| Custodian fees and expenses | | | 29,332 | |
| Trustees’ compensation | | | 14,249 | |
| Administration service fees | | | 1,500 | |
| Other | |
| 78,446
|
|
| Total expenses | | | 2,614,388 | |
| Less waivers and reimbursements of expenses | |
| (630,377
| )
|
| Net expenses | | | 1,984,011 | |
| Net Investment Income | | | 6,382,885 | |
| Realized and Unrealized Gain (Loss) | | | | |
| Net realized gain on: | | | | |
| Investments from unaffiliated companies | | | 9,774,881 | |
| Closing and expiration of futures contracts | | | 135,513 | |
| Foreign currency transactions | |
| 713,533
|
|
| Net realized gain | | | 10,623,927 | |
| Net change in unrealized appreciation/depreciation on: | | | | |
| Investments | | | 12,398,269 | |
| Translation of assets and liabilities denominated in foreign currencies | | | (684,589 | ) |
| Futures contracts | |
| (42,146
| )
|
| Net change in unrealized appreciation/depreciation | | | 11,671,534 | |
| Net Increase in Net Assets Resulting from Operations | | $
| 28,678,346
|
|
See accompanying Notes to Financial Statements.
| | | | |
| 23 | | | | OPPENHEIMER BALANCED FUND/VA |
STATEMENTS OF CHANGES IN NET ASSETS
| | | | | | | | |
| | | Year
Ended
December 31,
2012 | | | Year
Ended
December 30,
20111 | |
| Operations | | | | | | |
| Net investment income | | $ | 6,382,885 | | | $ | 3,643,156 | |
| Net realized gain | | | 10,623,927 | | | | 9,575,957 | |
| Net change in unrealized appreciation/depreciation | |
| 11,671,534
|
| |
| (11,457,323
| )
|
| Net increase in net assets resulting from operations | | | 28,678,346 | | | | 1,761,790 | |
| Dividends and/or Distributions to Shareholders | | | | | | |
| Dividends from net investment income: | | | | | | | | |
| Non-Service shares | | | (3,027,836 | ) | | | (3,355,682 | ) |
| Service shares | |
| (910,776
| )
| |
| (1,802,307
| )
|
| | | | (3,938,612 | ) | | | (5,157,989 | ) |
| Beneficial Interest Transactions | | | | | | |
| Net increase (decrease) in net assets resulting from beneficial interest transactions: | | | | | | | | |
| Non-Service shares | | | 72,773,444 | | | | (20,174,392 | ) |
| Service shares | |
| (12,542,888
| )
| |
| (10,697,145
| )
|
| | | | 60,230,556 | | | | (30,871,537 | ) |
| Net Assets | | | | | | |
| Total increase (decrease) | | | 84,970,290 | | | | (34,267,736 | ) |
| Beginning of period | |
| 205,934,061
|
| |
| 240,201,797
|
|
| End of period (including accumulated net investment income of $6,595,479 and $3,885,373, respectively) | | $
| 290,904,351
|
| | $
| 205,934,061
|
|
1. December 30, 2011 represents the last business day of the Fund’s 2011 fiscal year. See Note 1 of the accompanying Notes.
See accompanying Notes to Financial Statements.
| | | | |
| 24 | | | | OPPENHEIMER BALANCED FUND/VA |
FINANCIAL HIGHLIGHTS
| | | | | | | | | | | | | | | | | | | | |
| | | Year Ended
December 31, | | | Year Ended
December 30, | | | Year Ended December 31, | |
| Non-Service Shares | | 2012 | | | 20111 | | | 2010 | | | 2009 | | | 2008 | |
| | | | | | | | | | | | | | | | | | | | | |
| Per Share Operating Data | | | | | | | | | | | | | | | |
| Net asset value, beginning of period | | $ | 11.30 | | | $ | 11.47 | | | $ | 10.30 | | | $ | 8.45 | | | $ | 16.41 | |
| Income (loss) from investment operations: | | | | | | | | | | | | | | | | | | | | |
| Net investment income2 | | | .29 | | | | .20 | | | | .23 | | | | .25 | | | | .41 | |
| Net realized and unrealized gain (loss) | |
| 1.09
|
| |
| (.11
| )
| |
| 1.09
|
| |
| 1.60
|
| |
| (7.03
| )
|
| Total from investment operations | | | 1.38 | | | | .09 | | | | 1.32 | | | | 1.85 | | | | (6.62 | ) |
| Dividends and/or distributions to shareholders: | | | | | | | | | | | | | | | | | | | | |
| Dividends from net investment income | | | (.16 | ) | | | (.26 | ) | | | (.15 | ) | | | — | | | | (.39 | ) |
| Distributions from net realized gain | |
| —
|
| |
| —
|
| |
| —
|
| |
| —
|
| |
| (.95
| )
|
| Total dividends and/or distributions to shareholders | | | (.16 | ) | | | (.26 | ) | | | (.15 | ) | | | — | | | | (1.34 | ) |
| Net asset value, end of period | | $
| 12.52
|
| | $
| 11.30
|
| | $
| 11.47
|
| | $
| 10.30
|
| | $
| 8.45
|
|
| Total Return, at Net Asset Value3 | | | 12.34 | % | | | 0.72 | % | | | 12.91 | % | | | 21.89 | % | | | (43.47 | )% |
| | | | | | | | | | | | | | | | | | | | | |
| Ratios/Supplemental Data | | | | | | | | | | | | | | | |
| Net assets, end of period (in thousands) | | $ | 218,032 | | | $ | 128,383 | | | $ | 150,622 | | | $ | 159,797 | | | $ | 169,621 | |
| Average net assets (in thousands) | | $ | 191,416 | | | $ | 141,848 | | | $ | 151,620 | | | $ | 159,013 | | | $ | 295,669 | |
| Ratios to average net assets:4 | | | | | | | | | | | | | | | | | | | | |
| Net investment income | | | 2.46 | % | | | 1.70 | % | | | 2.13 | % | | | 2.71 | % | | | 3.14 | % |
| Total expenses5 | | | 0.90 | % | | | 0.91 | % | | | 0.91 | % | | | 0.89 | % | | | 0.76 | % |
| Expenses after payments, waivers and/or reimbursements and reduction to custodian expenses | | | 0.66 | % | | | 0.67 | % | | | 0.65 | % | | | 0.60 | % | | | 0.67 | % |
| Portfolio turnover rate6 | | | 110 | % | | | 102 | % | | | 54 | % | | | 87 | % | | | 67 | % |
1. December 30, 2011 represents the last business day of the Fund’s 2011 fiscal year. See Note 1 of the accompanying Notes.
2. Per share amounts calculated based on the average shares outstanding during the period.
3. Assumes an initial investment on the business day before the first day of the fiscal period, with all dividends and distributions reinvested in additional shares on the reinvestment date, and redemption at the net asset value calculated on the last business day of the fiscal period. Total returns are not annualized for periods less than one full year. Total return information does not reflect expenses that apply at the separate account level or to related insurance products. Inclusion of these charges would reduce the total return figures for all periods shown. Returns do not reflect the deduction of taxes that a shareholder would pay on fund distributions or the redemption of fund shares.
4. Annualized for periods less than one full year.
5. Total expenses including indirect expenses from affiliated fund were as follows:
| | | | |
| Year Ended December 31, 2012 | | | 0.91 | % |
| Year Ended December 30, 2011 | | | 0.93 | % |
| Year Ended December 31, 2010 | | | 0.92 | % |
| Year Ended December 31, 2009 | | | 0.91 | % |
| Year Ended December 31, 2008 | | | 0.76 | % |
6. The portfolio turnover rate excludes purchase and sale transactions of To Be Announced (TBA) mortgage-related securities as follows:
| | | | | | | | |
| | | Purchase Transactions | | | Sale Transactions | |
| Year Ended December 31, 2012 | | $ | 555,111,600 | | | $ | 549,805,766 | |
| Year Ended December 30, 2011 | | $ | 450,804,195 | | | $ | 453,759,282 | |
| Year Ended December 31, 2010 | | $ | 412,930,431 | | | $ | 414,511,903 | |
| Year Ended December 31, 2009 | | $ | 504,698,365 | | | $ | 520,212,670 | |
| Year Ended December 31, 2008 | | $ | 474,582,075 | | | $ | 434,587,487 | |
See accompanying Notes to Financial Statements.
| | | | |
| 25 | | | | OPPENHEIMER BALANCED FUND/VA |
FINANCIAL HIGHLIGHTS Continued
| | | | | | | | | | | | | | | | | | | | |
| | | Year Ended
December 31, | | | Year Ended
December 30, | | | Year Ended December 31, | |
| Service Shares | | 2012 | | | 20111 | | | 2010 | | | 2009 | | | 2008 | |
| | | | | | | | | | | | | | | | | | | | | |
| Per Share Operating Data | | | | | | | | | | | | | | | |
| Net asset value, beginning of period | | $ | 11.17 | | | $ | 11.35 | | | $ | 10.19 | | | $ | 8.38 | | | $ | 16.28 | |
| Income (loss) from investment operations: | | | | | | | | | | | | | | | | | | | | |
| Net investment income2 | | | .26 | | | | .16 | | | | .20 | | | | .22 | | | | .37 | |
| Net realized and unrealized gain (loss) | |
| 1.08
|
| |
| (.11
| )
| |
| 1.08
|
| |
| 1.59
|
| |
| (6.97
| )
|
| Total from investment operations | | | 1.34 | | | | .05 | | | | 1.28 | | | | 1.81 | | | | (6.60 | ) |
| Dividends and/or distributions to shareholders: | | | | | | | | | | | | | | | | | | | | |
| Dividends from net investment income | | | (.14 | ) | | | (.23 | ) | | | (.12 | ) | | | — | | | | (.35 | ) |
| Distributions from net realized gain | |
| —
|
| |
| —
|
| |
| —
|
| |
| —
|
| |
| (.95
| )
|
| Total dividends and/or distributions to shareholders | | | (.24 | ) | | | (.23 | ) | | | (.12 | ) | | | — | | | | (1.30 | ) |
| Net asset value, end of period | | $
| 12.37
|
| | $
| 11.17
|
| | $
| 11.35
|
| | $
| 10.19
|
| | $
| 8.38
|
|
| Total Return, at Net Asset Value3 | | | 12.11 | % | | | 0.38 | % | | | 12.68 | % | | | 21.60 | % | | | (43.62 | )% |
| | | | | | | | | | | | | | | | | | | | | |
| Ratios/Supplemental Data | | | | | | | | | | | | | | | |
| Net assets, end of period (in thousands) | | $ | 72,872 | | | $ | 77,551 | | | $ | 89,580 | | | $ | 88,746 | | | $ | 68,798 | |
| Average net assets (in thousands) | | $ | 76,257 | | | $ | 85,157 | | | $ | 87,280 | | | $ | 77,101 | | | $ | 100,164 | |
| Ratios to average net assets:4 | | | | | | | | | | | | | | | | | | | | |
| Net investment income | | | 2.18 | % | | | 1.45 | % | | | 1.87 | % | | | 2.42 | % | | | 2.90 | % |
| Total expenses5 | | | 1.16 | % | | | 1.16 | % | | | 1.16 | % | | | 1.15 | % | | | 1.01 | % |
| Expenses after payments, waivers and/or reimbursements and reduction to custodian expenses | | | 0.92 | % | | | 0.92 | % | | | 0.90 | % | | | 0.85 | % | | | 0.92 | % |
| Portfolio turnover rate6 | | | 110 | % | | | 102 | % | | | 54 | % | | | 87 | % | | | 67 | % |
1. December 30, 2011 represents the last business day of the Fund’s 2011 fiscal year. See Note 1 of the accompanying Notes.
2. Per share amounts calculated based on the average shares outstanding during the period.
3. Assumes an initial investment on the business day before the first day of the fiscal period, with all dividends and distributions reinvested in additional shares on the reinvestment date, and redemption at the net asset value calculated on the last business day of the fiscal period. Total returns are not annualized for periods less than one full year. Total return information does not reflect expenses that apply at the separate account level or to related insurance products. Inclusion of these charges would reduce the total return figures for all periods shown. Returns do not reflect the deduction of taxes that a shareholder would pay on fund distributions or the redemption of fund shares.
4. Annualized for periods less than one full year.
5. Total expenses including indirect expenses from affiliated fund were as follows:
| | | | |
| Year Ended December 31, 2012 | | | 1.17 | % |
| Year Ended December 30, 2011 | | | 1.18 | % |
| Year Ended December 31, 2010 | | | 1.17 | % |
| Year Ended December 31, 2009 | | | 1.17 | % |
| Year Ended December 31, 2008 | | | 1.01 | % |
6. The portfolio turnover rate excludes purchase and sale transactions of To Be Announced (TBA) mortgage-related securities as follows:
| | | | | | | | |
| | | Purchase Transactions | �� | | Sale Transactions | |
| Year Ended December 31, 2012 | | $ | 555,111,600 | | | $ | 549,805,766 | |
| Year Ended December 30, 2011 | | $ | 450,804,195 | | | $ | 453,759,282 | |
| Year Ended December 31, 2010 | | $ | 412,930,431 | | | $ | 414,511,903 | |
| Year Ended December 31, 2009 | | $ | 504,698,365 | | | $ | 520,212,670 | |
| Year Ended December 31, 2008 | | $ | 474,582,075 | | | $ | 434,587,487 | |
See accompanying Notes to Financial Statements.
| | | | |
| 26 | | | | OPPENHEIMER BALANCED FUND/VA |
NOTES TO FINANCIAL STATEMENTS
1. Significant Accounting Policies
Oppenheimer Balanced Fund/VA (the “Fund”) is a separate series of Oppenheimer Variable Account Funds, an open end management investment company registered under the Investment Company Act of 1940, as amended. The Fund’s investment objective is to seek high total investment return, which includes current income and capital appreciation. The Fund’s investment adviser is OppenheimerFunds, Inc. (the “Manager”).
The Fund offers two classes of shares. Both classes are sold at their offering price, which is the net asset value per share, to separate investment accounts of participating insurance companies as an underlying investment for variable life insurance policies, variable annuity contracts or other investment products. The class of shares designated as Service shares is subject to a distribution and service plan. Both classes of shares have identical rights and voting privileges with respect to the Fund in general and exclusive voting rights on matters that affect that class alone. Earnings, net assets and net asset value per share may differ due to each class having its own expenses, such as transfer and shareholder servicing agent fees and shareholder communications, directly attributable to that class.
The following is a summary of significant accounting policies consistently followed by the Fund.
Previous Annual Period. The last day of the Fund’s fiscal year was the last day the New York Stock Exchange was open for trading. The Fund’s financial statements have been presented through that date to maintain consistency with the Fund’s net asset value calculations used for shareholder transactions.
Securities on a When-Issued or Delayed Delivery Basis. The Fund may purchase securities on a “when-issued” basis, and may purchase or sell securities on a “delayed delivery” basis. “When-issued” or “delayed delivery” refers to securities whose terms and indenture are available and for which a market exists, but which are not available for immediate delivery. Delivery and payment for securities that have been purchased by the Fund on a when-issued basis normally takes place within six months and possibly as long as two years or more after the trade date. During this period, such securities do not earn interest, are subject to market fluctuation and may increase or decrease in value prior to their delivery. The purchase of securities on a when-issued basis may increase the volatility of the Fund’s net asset value to the extent the Fund executes such transactions while remaining substantially fully invested. When the Fund engages in when-issued or delayed delivery transactions, it relies on the buyer or seller, as the case may be, to complete the transaction. Their failure to do so may cause the Fund to lose the opportunity to obtain or dispose of the security at a price and yield it considers advantageous. The Fund may also sell securities that it purchased on a when-issued basis or forward commitment prior to settlement of the original purchase.
As of December 31, 2012, the Fund had purchased securities issued on a when-issued or delayed delivery basis and sold securities issued on a delayed delivery basis as follows:
| | | | |
| | | When-Issued or Delayed Delivery
Basis Transactions | |
| Purchased securities | | $ | 45,488,388 | |
| Sold securities | | | 4,818,219 | |
The Fund may enter into “forward roll” transactions with respect to mortgage-related securities. In this type of transaction, the Fund sells a mortgage-related security to a buyer and simultaneously agrees to repurchase a similar security (same type, coupon and maturity) at a later date at a set price. During the period between the sale and the repurchase, the Fund will not be entitled to receive interest and principal payments on the securities that have been sold. The Fund records the incremental difference between the forward purchase and sale of each forward roll as realized gain (loss) on investments or as fee income in the case of such transactions that have an associated fee in lieu of a difference in the forward purchase and sale price.
Forward roll transactions may be deemed to entail embedded leverage since the Fund purchases mortgage-related securities with extended settlement dates rather than paying for the securities under a normal settlement cycle. This
| | | | |
| 27 | | | | OPPENHEIMER BALANCED FUND/VA |
NOTES TO FINANCIAL STATEMENTS Continued
1. Significant Accounting Policies Continued
embedded leverage increases the Fund’s market value of investments relative to its net assets which can incrementally increase the volatility of the Fund’s performance. Forward roll transactions can be replicated over multiple settlement periods.
Risks of entering into forward roll transactions include the potential inability of the counterparty to meet the terms of the agreement; the potential of the Fund to receive inferior securities at redelivery as compared to the securities sold to the counterparty; and counterparty credit risk.
Investment in Oppenheimer Institutional Money Market Fund. The Fund is permitted to invest daily available cash balances in an affiliated money market fund. The Fund may invest the available cash in Class E shares of Oppenheimer Institutional Money Market Fund (“IMMF”) to seek current income while preserving liquidity. IMMF is a registered open-end management investment company, regulated as a money market fund under the Investment Company Act of 1940, as amended. The Manager is also the investment adviser of IMMF. When applicable, the Fund’s investment in IMMF is included in the Statement of Investments. Shares of IMMF are valued at their net asset value per share. As a shareholder, the Fund is subject to its proportional share of IMMF’s Class E expenses, including its management fee. The Manager will waive fees and/or reimburse Fund expenses in an amount equal to the indirect management fees incurred through the Fund’s investment in IMMF.
Foreign Currency Translation. The Fund’s accounting records are maintained in U.S. dollars. The values of securities denominated in foreign currencies and amounts related to the purchase and sale of foreign securities and foreign investment income are translated into U.S. dollars as of the close of the Exchange, normally 4:00 P.M. Eastern time, on each day the Exchange is open for trading. Foreign exchange rates may be valued primarily using a reliable bank, dealer or service authorized by the Board of Trustees.
Reported net realized gains and losses from foreign currency transactions arise from sales of portfolio securities, sales and maturities of short-term securities, sales of foreign currencies, exchange rate fluctuations between the trade and settlement dates on securities transactions, and the difference between the amounts of dividends, interest, and foreign withholding taxes recorded on the Fund’s books and the U.S. dollar equivalent of the amounts actually received or paid. Net unrealized appreciation and depreciation on the translation of assets and liabilities denominated in foreign currencies arise from changes in the values of assets and liabilities, including investments in securities at fiscal period end, resulting from changes in exchange rates.
The effect of changes in foreign currency exchange rates on investments is separately identified from the fluctuations arising from changes in market values of securities held and reported with all other foreign currency gains and losses in the Fund’s Statement of Operations.
Allocation of Income, Expenses, Gains and Losses. Income, expenses (other than those attributable to a specific class), gains and losses are allocated on a daily basis to each class of shares based upon the relative proportion of net assets represented by such class. Operating expenses directly attributable to a specific class are charged against the operations of that class.
Federal Taxes. The Fund intends to comply with provisions of the Internal Revenue Code applicable to regulated investment companies and to distribute substantially all of its investment company taxable income, including any net realized gain on investments not offset by capital loss carryforwards, if any, to shareholders. Therefore, no federal income or excise tax provision is required. The Fund files income tax returns in U.S. federal and applicable state jurisdictions. The statute of limitations on the Fund’s tax return filings generally remain open for the three preceding fiscal reporting period ends.
The tax components of capital shown in the following table represent distribution requirements the Fund must satisfy under the income tax regulations, losses the Fund may be able to offset against income and gains realized in future years and unrealized appreciation or depreciation of securities and other investments for federal income tax purposes.
| | | | |
| 28 | | | | OPPENHEIMER BALANCED FUND/VA |
| | | | | | | | | | | | |
Undistributed
Net Investment Income | | Undistributed
Long-Term
Gain | | | Accumulated
Loss
Carryforward1,2,3 | | | Net Unrealized
Appreciation
Based on Cost of
Securities and
Other Investments
for Federal Income
Tax Purposes | |
| $6,623,989 | | $ | — | | | $ | 69,128,196 | | | $ | 22,335,655 | |
1. As of December 31, 2012, the Fund had $69,128,196 of net capital loss carryforwards available to offset future realized capital gains, if any, and thereby reduce future taxable gain distributions. Details of the capital loss carryforwards are included in the table below. Capital loss carryovers with no expiration, if any, must be utilized prior to those with expiration dates.
| | | | |
| Expiring | | | |
| 2015 | | $ | 9,969,732 | |
| 2016 | | | 14,429,757 | |
| 2017 | | | 44,728,707 | |
| | |
|
|
|
| Total | | $ | 69,128,196 | |
| | |
|
|
|
Of these losses, $13,292,976 are subject to loss limitation rules resulting from merger activity. These limitations generally reduce the utilization of these losses to a maximum of $3,323,244 per year.
2. During the fiscal year ended December 31, 2012, the Fund utilized $4,188,448 of capital loss carryforward to offset capital gains realized in that fiscal year.
3. During the fiscal year ended December 30, 2011, the Fund utilized $15,143,099 of capital loss carryforward to offset capital gains realized in that fiscal year.
Net investment income (loss) and net realized gain (loss) may differ for financial statement and tax purposes. The character of dividends and distributions made during the fiscal year from net investment income or net realized gains may differ from their ultimate characterization for federal income tax purposes. Also, due to timing of dividends and distributions, the fiscal year in which amounts are distributed may differ from the fiscal year in which the income or net realized gain was recorded by the Fund.
Accordingly, the following amounts have been reclassified for December 31, 2012. Net assets of the Fund were unaffected by the reclassifications.
| | | | | | | | |
Increase to
Paid-in Capital | | Increase
to Accumulated
Net Investment
Income | | | Increase
to Accumulated Net
Realized Loss
on Investments | |
| $15,539,655 | | $ | 265,833 | | | $ | 15,805,488 | |
The tax character of distributions paid during the years ended December 31, 2012 and December 31, 2011 was as follows:
| | | | | | | | |
| | | Year Ended
December 31, 2012 | | | Year Ended
December 31, 2011 | |
| Distributions paid from: | | | | | | | | |
| Ordinary income | | $ | 3,938,612 | | | $ | 5,157,989 | |
The aggregate cost of securities and other investments and the composition of unrealized appreciation and depreciation of securities and other investments for federal income tax purposes as of December 31, 2012 are noted in the following table. The primary difference between book and tax appreciation or depreciation of securities and other investments, if applicable, is attributable to the tax deferral of losses or tax realization of financial statement unrealized gain or loss.
| | | | |
| Federal tax cost of securities | | $ | 309,437,680 | |
| Federal tax cost of other investments | | | (20,042,297) | |
| | |
|
|
|
| Total federal tax cost | | $ | 289,395,383 | |
| | |
|
|
|
| |
| Gross unrealized appreciation | | $ | 24,528,955 | |
| Gross unrealized depreciation | | | (2,193,300) | |
| | |
|
|
|
| Net unrealized appreciation | | $ | 22,335,655 | |
| | |
|
|
|
| | | | |
| 29 | | | | OPPENHEIMER BALANCED FUND/VA |
NOTES TO FINANCIAL STATEMENTS Continued
1. Significant Accounting Policies Continued
Trustees’ Compensation. The Board of Trustees has adopted a compensation deferral plan for independent trustees that enables trustees to elect to defer receipt of all or a portion of the annual compensation they are entitled to receive from the Fund. For purposes of determining the amount owed to the Trustee under the plan, deferred amounts are treated as though equal dollar amounts had been invested in shares of the Fund or in other Oppenheimer funds selected by the Trustee. The Fund purchases shares of the funds selected for deferral by the Trustee in amounts equal to his or her deemed investment, resulting in a Fund asset equal to the deferred compensation liability. Such assets are included as a component of “Other” within the asset section of the Statement of Assets and Liabilities. Deferral of trustees’ fees under the plan will not affect the net assets of the Fund, and will not materially affect the Fund’s assets, liabilities or net investment income per share. Amounts will be deferred until distributed in accordance with the compensation deferral plan.
Dividends and Distributions to Shareholders. Dividends and distributions to shareholders, which are determined in accordance with income tax regulations and may differ from U.S. generally accepted accounting principles, are recorded on the ex-dividend date. Income and capital gain distributions, if any, are declared and paid annually or at other times as deemed necessary by the Manager.
Investment Income. Dividend income is recorded on the ex-dividend date or upon ex-dividend notification in the case of certain foreign dividends where the ex-dividend date may have passed. Non-cash dividends included in dividend income, if any, are recorded at the fair market value of the securities received. Interest income is recognized on an accrual basis. Discount and premium, which are included in interest income on the Statement of Operations, are amortized or accreted daily.
Custodian Fees. “Custodian fees and expenses” in the Statement of Operations may include interest expense incurred by the Fund on any cash overdrafts of its custodian account during the period. Such cash overdrafts may result from the effects of failed trades in portfolio securities and from cash outflows resulting from unanticipated shareholder redemption activity. The Fund pays interest to its custodian on such cash overdrafts, to the extent they are not offset by positive cash balances maintained by the Fund, at a rate equal to the Federal Funds Rate plus 0.50%. The “Reduction to custodian expenses” line item, if applicable, represents earnings on cash balances maintained by the Fund during the period. Such interest expense and other custodian fees may be paid with these earnings.
Security Transactions. Security transactions are recorded on the trade date. Realized gains and losses on securities sold are determined on the basis of identified cost.
Indemnifications. The Fund’s organizational documents provide current and former trustees and officers with a limited indemnification against liabilities arising in connection with the performance of their duties to the Fund. In the normal course of business, the Fund may also enter into contracts that provide general indemnifications. The Fund’s maximum exposure under these arrangements is unknown as this would be dependent on future claims that may be made against the Fund. The risk of material loss from such claims is considered remote.
Other. The preparation of financial statements in conformity with accounting principles generally accepted in the United States of America requires management to make estimates and assumptions that affect the reported amounts of assets and liabilities and disclosure of contingent assets and liabilities at the date of the financial statements and the reported amounts of increases and decreases in net assets from operations during the reporting period. Actual results could differ from those estimates.
| | | | |
| 30 | | | | OPPENHEIMER BALANCED FUND/VA |
2. Securities Valuation
The Fund calculates the net asset value of its shares as of the close of the New York Stock Exchange (the “Exchange”), normally 4:00 P.M. Eastern time, on each day the Exchange is open for trading.
The Fund’s Board has adopted procedures for the valuation of the Fund’s securities and has delegated the day-to-day responsibility for valuation determinations under those procedures to the Manager. The Manager has established a Valuation Committee which is responsible for determining a “fair valuation” for any security for which market quotations are not “readily available.” The Valuation Committee’s fair valuation determinations are subject to review, approval and ratification by the Fund’s Board at its next regularly scheduled meeting covering the calendar quarter in which the fair valuation was determined.
Valuation Methods and Inputs
Securities are valued using unadjusted quoted market prices, when available, as supplied primarily by third party pricing services or dealers.
The following methodologies are used to determine the market value or the fair value of the types of securities described below:
Securities traded on a registered U.S. securities exchange (including exchange-traded derivatives other than futures and futures options) are valued based on the last sale price of the security reported on the principal exchange on which it is traded, prior to the time when the Fund’s assets are valued. In the absence of a sale, the security is valued at the last sale price on the prior trading day, if it is within the spread of the current day’s closing “bid” and “asked” prices, and if not, at the current day’s closing bid price. A security of a foreign issuer traded on a foreign exchange but not listed on a registered U.S. securities exchange is valued based on the last sale price on the principal exchange on which the security is traded, as identified by the third party pricing service used by the Manager, prior to the time when the Fund’s assets are valued. If the last sale price is unavailable, the security is valued at the most recent official closing price on the principal exchange on which it is traded. If the last sales price or official closing price for a foreign security is not available, the security is valued at the mean between the bid and asked price per the exchange or, if not available from the exchange, obtained from two dealers. If bid and asked prices are not available from either the exchange or two dealers, the security is valued by using one of the following methodologies (listed in order of priority); (1) using a bid from the exchange, (2) the mean between the bid and asked price as provided by a single dealer, or (3) a bid from a single dealer.
Shares of a registered investment company that are not traded on an exchange are valued at that investment company’s net asset value per share.
Corporate and government debt securities (of U.S. or foreign issuers) and municipal debt securities, event-linked bonds, loans, mortgage-backed securities, collateralized mortgage obligations, and asset-backed securities are valued at the mean between the “bid” and “asked” prices utilizing evaluated prices obtained from third party pricing services or broker-dealers who may use matrix pricing methods to determine the evaluated prices.
Short-term money market type debt securities with a remaining maturity of sixty days or less are valued at cost adjusted by the amortization of discount or premium to maturity (amortized cost), which approximates market value. Short-term debt securities with a remaining maturity in excess of sixty days are valued at the mean between the “bid” and “asked” prices utilizing evaluated prices obtained from third party pricing services or broker-dealers.
Futures contracts and futures options traded on a commodities or futures exchange will be valued at the final settlement price or official closing price on the principal exchange as reported by such principal exchange at its trading session ending at, or most recently prior to, the time when the Fund’s assets are valued.
| | | | |
| 31 | | | | OPPENHEIMER BALANCED FUND/VA |
NOTES TO FINANCIAL STATEMENTS Continued
2. Securities Valuation Continued
A description of the standard inputs that may generally be considered by the third party pricing vendors in determining their evaluated prices is provided below.
| | |
| Security Type | | Standard inputs generally considered by third-party
pricing vendors |
| Corporate debt, government debt, municipal, mortgage-backed and asset-backed securities | | Reported trade data, broker-dealer price quotations, benchmark yields, issuer spreads on comparable securities, the credit quality, yield, maturity, and other appropriate factors. |
| Loans | | Information obtained from market participants regarding reported trade data and broker-dealer price quotations. |
| Event-linked bonds | | Information obtained from market participants regarding reported trade data and broker-dealer price quotations. |
If a market value or price cannot be determined for a security using the methodologies described above, or if, in the “good faith” opinion of the Manager, the market value or price obtained does not constitute a “readily available market quotation,” or a significant event has occurred that would materially affect the value of the security the security is fair valued either (i) by a standardized fair valuation methodology applicable to the security type or the significant event as previously approved by the Valuation Committee and the Fund’s Board or (ii) as determined in good faith by the Manager’s Valuation Committee. The Valuation Committee considers all relevant facts that are reasonably available, through either public information or information available to the Manager, when determining the fair value of a security. Fair value determinations by the Manager are subject to review, approval and ratification by the Fund’s Board at its next regularly scheduled meeting covering the calendar quarter in which the fair valuation was determined. Those fair valuation standardized methodologies include, but are not limited to, valuing securities at the last sale price or initially at cost and subsequently adjusting the value based on: changes in company specific fundamentals, changes in an appropriate securities index, or changes in the value of similar securities which may be further adjusted for any discounts related to security-specific resale restrictions. When possible, such methodologies use observable market inputs such as unadjusted quoted prices of similar securities, observable interest rates, currency rates and yield curves. The methodologies used for valuing securities are not necessarily an indication of the risks associated with investing in those securities nor can it be assured that the Fund can obtain the fair value assigned to a security if it were to sell the security.
To assess the continuing appropriateness of security valuations, the Manager, or its third party service provider who is subject to oversight by the Manager, regularly compares prior day prices, prices on comparable securities, and sale prices to the current day prices and challenges those prices exceeding certain tolerance levels with the third party pricing service or broker source. For those securities valued by fair valuations, whether through a standardized fair valuation methodology or a fair valuation determination, the Valuation Committee reviews and affirms the reasonableness of the valuations based on such methodologies and fair valuation determinations on a regular basis after considering all relevant information that is reasonably available.
Classifications
Each investment asset or liability of the Fund is assigned a level at measurement date based on the significance and source of the inputs to its valuation. Various data inputs are used in determining the value of each of the Fund’s investments as of the reporting period end. These data inputs are categorized in the following hierarchy under applicable financial accounting standards:
| | 1) | Level 1—unadjusted quoted prices in active markets for identical assets or liabilities (including securities actively traded on a securities exchange) |
| | 2) | Level 2—inputs other than unadjusted quoted prices that are observable for the asset or liability (such as unadjusted quoted prices for similar assets and market corroborated inputs such as interest rates, prepayment speeds, credit risks, etc.) |
| | 3) | Level 3—significant unobservable inputs (including the Manager’s own judgments about assumptions that market participants would use in pricing the asset or liability). |
The inputs used for valuing securities are not necessarily an indication of the risks associated with investing in those securities.
| | | | |
| 32 | | | | OPPENHEIMER BALANCED FUND/VA |
The table below categorizes amounts that are included in the Fund’s Statement of Assets and Liabilities as of December 31, 2012 based on valuation input level:
| | | | | | | | | | | | | | | | |
| | | Level 1—
Unadjusted
Quoted
Prices | | | Level 2—
Other Significant
Observable Inputs | | | Level 3—
Significant
Unobservable
Inputs | | | Value | |
| Assets Table | | | | | | | | | | | | | | | | |
| Investments, at Value: | | | | | | | | | | | | | | | | |
| Common Stocks | | | | | | | | | | | | | | | | |
Consumer Discretionary | | $ | 16,107,525 | | | $ | — | | | $ | — | | | $ | 16,107,525 | |
Consumer Staples | | | 17,155,557 | | | | — | | | | — | | | | 17,155,557 | |
Energy | | | 21,131,134 | | | | — | | | | — | | | | 21,131,134 | |
Financials | | | 41,013,091 | | | | — | | | | — | | | | 41,013,091 | |
Health Care | | | 26,625,215 | | | | — | | | | — | | | | 26,625,215 | |
Industrials | | | 17,124,634 | | | | — | | | | — | | | | 17,124,634 | |
Information Technology | | | 12,840,935 | | | | — | | | | — | | | | 12,840,935 | |
Materials | | | 10,001,562 | | | | — | | | | — | | | | 10,001,562 | |
Telecommunication Services | | | 6,751,950 | | | | — | | | | — | | | | 6,751,950 | |
Utilities | | | 5,848,124 | | | | — | | | | — | | | | 5,848,124 | |
| Asset-Backed Securities | | | — | | | | 11,676,268 | | | | — | | | | 11,676,268 | |
| Mortgage-Backed Obligations | | | — | | | | 69,266,385 | | | | — | | | | 69,266,385 | |
| U.S. Government Obligations | | | — | | | | 2,370,393 | | | | — | | | | 2,370,393 | |
| Non-Convertible Corporate Bonds and Notes | | | — | | | | 54,169,476 | | | | — | | | | 54,169,476 | |
| Investment Company | | | 19,691,265 | | | | — | | | | — | | | | 19,691,265 | |
| | |
|
|
| |
|
|
| |
|
|
| |
|
|
|
| Total Investments, at Value | | | 194,290,992 | | | | 137,482,522 | | | | — | | | | 331,773,514 | |
| Other Financial Instruments: | | | | | | | | | | | | | | | | |
| Futures margins | | | 33,484 | | | | — | | | | — | | | | 33,484 | |
| | |
|
|
| |
|
|
| |
|
|
| |
|
|
|
| Total Assets | | $ | 194,324,476 | | | $ | 137,482,522 | | | $ | — | | | $ | 331,806,998 | |
| | |
|
|
| |
|
|
| |
|
|
| |
|
|
|
| Liabilities Table | | | | | | | | | | | | | | | | |
| Other Financial Instruments: | | | | | | | | | | | | | | | | |
| Futures margins | | $ | (44,281 | ) | | $ | — | | | $ | — | | | $ | (44,281 | ) |
| | |
|
|
| |
|
|
| |
|
|
| |
|
|
|
| Total Liabilities | | $ | (44,281 | ) | | $ | — | | | $ | — | | | $ | (44,281 | ) |
| | |
|
|
| |
|
|
| |
|
|
| |
|
|
|
Currency contracts and forwards, if any, are reported at their unrealized appreciation/depreciation at measurement date, which represents the change in the contract’s value from trade date. Futures, if any, are reported at their variation margin at measurement date, which represents the amount due to/from the Fund at that date. All additional assets and liabilities included in the above table are reported at their market value at measurement date.
There have been no significant changes to the fair valuation methodologies of the Fund during the period.
3. Shares of Beneficial Interest
The Fund has authorized an unlimited number of $0.001 par value shares of beneficial interest of each class. Transactions in shares of beneficial interest were as follows:
| | | | | | | | | | | | | | | | |
| | | Year Ended December 31, 2012 | | | Year Ended December 30, 2011 | |
| | | Shares | | | Amount | | | Shares | | | Amount | |
| Non-Service Shares | | | | | | | | | | | | | | | | |
| Sold | | | 245,214 | | | $ | 2,929,071 | | | | 252,001 | | | $ | 2,909,335 | |
| Dividends and/or distributions reinvested | | | 261,020 | | | | 3,027,836 | | | | 287,056 | | | | 3,355,682 | |
| Acquisition—Note 8 | | | 8,473,818 | | | | 101,940,025 | | | | — | | | | — | |
| Redeemed | | | (2,929,508 | ) | | | (35,123,488 | ) | | | (2,302,830 | ) | | | (26,439,409 | ) |
| | |
|
|
| |
|
|
| |
|
|
| |
|
|
|
| Net increase (decrease) | | | 6,050,544 | | | $ | 72,773,444 | | | | (1,763,773 | ) | | $ | (20,174,392 | ) |
| | |
|
|
| |
|
|
| |
|
|
| |
|
|
|
| | | | |
| 33 | | | | OPPENHEIMER BALANCED FUND/VA |
NOTES TO FINANCIAL STATEMENTS Continued
3. Shares of Beneficial Interest Continued
| | | | | | | | | | | | | | | | |
| | | Year Ended December 31, 2012 | | | Year Ended December 30, 2011 | |
| | | Shares | | | Amount | | | Shares | | | Amount | |
| Service Shares | | | | | | | | | | | | | | | | |
| Sold | | | 297,913 | | | $ | 3,538,468 | | | | 423,625 | | | $ | 4,837,026 | |
| Dividends and/or distributions reinvested | | | 79,405 | | | | 910,776 | | | | 155,505 | | | | 1,802,307 | |
| Redeemed | | | (1,428,994 | ) | | | (16,992,132 | ) | | | (1,531,184 | ) | | | (17,336,478 | ) |
| | |
|
|
| |
|
|
| |
|
|
| |
|
|
|
| Net decrease | | | (1,051,676 | ) | | $ | (12,542,888 | ) | | | (952,054 | ) | | $ | (10,697,145 | ) |
| | |
|
|
| |
|
|
| |
|
|
| |
|
|
|
4. Purchases and Sales of Securities
The aggregate cost of purchases and proceeds from sales of securities, other than short-term obligations and investments in IMMF, for the year ended December 31, 2012, were as follows:
| | | | | | | | |
| | | Purchases | | | Sales | |
| Investment securities | | $ | 336,094,424 | | | $ | 261,193,372 | |
| U.S. government and government agency obligations | | | 4,238,617 | | | | 3,129,169 | |
| To Be Announced (TBA) mortgage-related securities | | | 555,111,600 | | | | 549,805,766 | |
5. Fees and Other Transactions with Affiliates
Management Fees. Under the investment advisory agreement, the Fund pays the Manager a management fee based on the daily net assets of the Fund at an annual rate as shown in the following table:
| | | | |
| Fee Schedule | | | |
| Up to $200 million | | | 0.75 | % |
| Next $200 million | | | 0.72 | |
| Next $200 million | | | 0.69 | |
| Next $200 million | | | 0.66 | |
| Over $800 million | | | 0.60 | |
Administration Service Fees. The Fund pays the Manager a fee of $1,500 per year for preparing and filing the Fund’s tax returns.
Transfer Agent Fees. OppenheimerFunds Services (“OFS”), a division of the Manager, acts as the transfer and shareholder servicing agent for the Fund. For the year ended December 31, 2012, the Fund paid $260,642 to OFS for services to the Fund.
Distribution and Service Plan for Service Shares. The Fund has adopted a Distribution and Service Plan (the “Plan”) in accordance with Rule 12b-1 under the Investment Company Act of 1940 for Service shares to pay OppenheimerFunds Distributor, Inc. (the “Distributor”), for distribution related services, personal service and account maintenance for the Fund’s Service shares. Under the Plan, payments are made periodically at an annual rate of 0.25% of the daily net assets of Service shares of the Fund. The Distributor currently uses all of those fees to compensate sponsors of the insurance product that offers Fund shares, for providing personal service and maintenance of accounts of their variable contract owners that hold Service shares. These fees are paid out of the Fund’s assets on an on-going basis and increase operating expenses of the Service shares, which results in lower performance compared to the Fund’s shares that are not subject to a service fee. Fees incurred by the Fund under the Plan are detailed in the Statement of Operations.
Waivers and Reimbursements of Expenses. The Manager has voluntarily agreed to limit the Fund’s expenses after payments, waivers and/or reimbursements and reduction to custodian expenses, excluding expenses incurred directly or indirectly by the Fund as a result of investments in other investment companies, wholly-owned subsidiaries and pooled investment vehicles; so that those expenses, as percentages of daily net assets, will not exceed the annual rate of 0.67% for Non-Service shares and 0.92% for Service shares. During the year ended December 31, 2012, the Manager waived fees and/or reimbursed the Fund $433,630 and $177,156 for Non-Service and Service shares, respectively.
| | | | |
| 34 | | | | OPPENHEIMER BALANCED FUND/VA |
The Manager will waive fees and/or reimburse Fund expenses in an amount equal to the indirect management fees incurred through the Fund’s investment in IMMF. During the year ended December 31, 2012, the Manager waived fees and/or reimbursed the Fund $19,591 for IMMF management fees.
Some of these undertakings may be modified or terminated at any time; some may not be modified or terminated until after one year from the date of the current prospectus, as indicated therein.
6. Risk Exposures and the Use of Derivative Instruments
The Fund’s investment objectives not only permit the Fund to purchase investment securities, they also allow the Fund to enter into various types of derivatives contracts, including, but not limited to, futures contracts, forward foreign currency exchange contracts, credit default swaps, interest rate swaps, total return swaps, and purchased and written options. In doing so, the Fund will employ strategies in differing combinations to permit it to increase, decrease, or change the level or types of exposure to market risk factors. Central to those strategies are features inherent to derivatives that make them more attractive for this purpose than equity and debt securities: they require little or no initial cash investment, they can focus exposure on only certain selected risk factors, and they may not require the ultimate receipt or delivery of the underlying security (or securities) to the contract. This may allow the Fund to pursue its objectives more quickly and efficiently than if it were to make direct purchases or sales of securities capable of effecting a similar response to market factors.
Market Risk Factors. In accordance with its investment objectives, the Fund may use derivatives to increase or decrease its exposure to one or more of the following market risk factors:
Commodity Risk. Commodity risk relates to the change in value of commodities or commodity indexes as they relate to increases or decreases in the commodities market. Commodities are physical assets that have tangible properties. Examples of these types of assets are crude oil, heating oil, metals, livestock, and agricultural products.
Credit Risk. Credit risk relates to the ability of the issuer to meet interest and principal payments, or both, as they come due. In general, lower-grade, higher-yield bonds are subject to credit risk to a greater extent than lower-yield, higher-quality bonds.
Equity Risk. Equity risk relates to the change in value of equity securities as they relate to increases or decreases in the general market.
Foreign Exchange Rate Risk. Foreign exchange rate risk relates to the change in the U.S. dollar value of a security held that is denominated in a foreign currency. The U.S. dollar value of a foreign currency denominated security will decrease as the dollar appreciates against the currency, while the U.S. dollar value will increase as the dollar depreciates against the currency.
Interest Rate Risk. Interest rate risk refers to the fluctuations in value of fixed-income securities resulting from the inverse relationship between price and yield. For example, an increase in general interest rates will tend to reduce the market value of already issued fixed-income investments, and a decline in general interest rates will tend to increase their value. In addition, debt securities with longer maturities, which tend to have higher yields, are subject to potentially greater fluctuations in value from changes in interest rates than obligations with shorter maturities.
Volatility Risk. Volatility risk refers to the magnitude of the movement, but not the direction of the movement, in a financial instrument’s price over a defined time period. Large increases or decreases in a financial instrument’s price over a relative time period typically indicate greater volatility risk, while small increases or decreases in its price typically indicate lower volatility risk.
| | | | |
| 35 | | | | OPPENHEIMER BALANCED FUND/VA |
NOTES TO FINANCIAL STATEMENTS Continued
6. Risk Exposures and the Use of Derivative Instruments Continued
The Fund’s actual exposures to these market risk factors during the period are discussed in further detail, by derivative type, below.
Risks of Investing in Derivatives. The Fund’s use of derivatives can result in losses due to unanticipated changes in the market risk factors and the overall market. In instances where the Fund is using derivatives to decrease, or hedge, exposures to market risk factors for securities held by the Fund, there are also risks that those derivatives may not perform as expected resulting in losses for the combined or hedged positions.
Derivatives may have little or no initial cash investment relative to their market value exposure and therefore can produce significant gains or losses in excess of their cost. This use of embedded leverage allows the Fund to increase its market value exposure relative to its net assets and can substantially increase the volatility of the Fund’s performance.
Additional associated risks from investing in derivatives also exist and potentially could have significant effects on the valuation of the derivative and the Fund. Typically, the associated risks are not the risks that the Fund is attempting to increase or decrease exposure to, per its investment objectives, but are the additional risks from investing in derivatives. Examples of these associated risks are liquidity risk, which is the risk that the Fund will not be able to sell the derivative in the open market in a timely manner, and counterparty credit risk, which is the risk that the counterparty will not fulfill its obligation to the Fund. Associated risks can be different for each type of derivative and are discussed by each derivative type in the notes that follow.
Counterparty Credit Risk. Certain derivative positions are subject to counterparty credit risk, which is the risk that the counterparty will not fulfill its obligation to the Fund. The Fund’s derivative counterparties are financial institutions who are subject to market conditions that may weaken their financial position. The Fund intends to enter into financial transactions with counterparties that the Manager believes to be creditworthy at the time of the transaction.
Credit Related Contingent Features. The Fund’s agreements with derivative counterparties have several credit related contingent features that if triggered would allow its derivatives counterparties to close out and demand payment or additional collateral to cover their exposure from the Fund. Credit related contingent features are established between the Fund and its derivatives counterparties to reduce the risk that the Fund will not fulfill its payment obligations to its counterparties. These triggering features include, but are not limited to, a percentage decrease in the Fund’s net assets and or a percentage decrease in the Fund’s Net Asset Value or NAV. The contingent features are established within the Fund’s International Swap and Derivatives Association, Inc. master agreements which govern certain positions in swaps, over-the-counter options and swaptions, and forward currency exchange contracts for each individual counterparty.
Valuations of derivative instruments as of December 31, 2012 are as follows:
| | | | | | | | | | | | |
| | | Asset Derivatives
| | | Liability Derivatives
| |
Derivatives Not
Accounted for as
Hedging Instruments | | Statement of Assets
and Liabilities Location | | Value | | | Statement of Assets
and Liabilities Location | | Value | |
| Interest rate contracts | | Futures margins | | | $33,484 | * | | Futures margins | | | $44,281 | * |
*Includes only the current day’s variation margin. Prior variation margin movements have been reflected in cash on the Statement of Assets and Liabilities upon receipt or payment.
| | | | |
| 36 | | | | OPPENHEIMER BALANCED FUND/VA |
The effect of derivative instruments on the Statement of Operations is as follows:
| | | | | | | | | | | | | | | | |
| Amount of Realized Gain or (Loss) Recognized on Derivatives | |
Derivatives Not Accounted
for as Hedging Instruments | | Investments
from unaffiliated
companies* | | | Closing and
expiration
of futures
contracts | | | Foreign
currency
transactions | | | Total | |
| Equity contracts | | $ | 6,046 | | | $ | — | | | $ | — | | | $ | 6,046 | |
| Foreign exchange contracts | | | — | | | | — | | | | (19,339 | ) | | | (19,339 | ) |
| Interest rate contracts | | | (8,551 | ) | | | 135,513 | | | | — | | | | 126,962 | |
| | |
|
|
|
| Total | | $ | (2,505 | ) | | $ | 135,513 | | | $ | (19,339 | ) | | $ | 113,669 | |
| | |
|
|
|
*Includes purchased option contracts, purchased swaption contracts and written option contracts exercised, if any.
| | | | | | | | | | | | |
| Amount of Change in Unrealized Gain or (Loss) Recognized on Derivatives | |
Derivatives Not Accounted
for as Hedging Instruments | | Futures contracts | | | Translation of
assets and
liabilities
denominated in
foreign
currencies | | | Total | |
| Foreign exchange contracts | | $ | — | | | $ | (20,189 | ) | | $ | (20,189 | ) |
| Interest rate contracts | | | (42,146 | ) | | | — | | | | (42,146 | ) |
| | |
|
|
|
| Total | | $ | (42,146 | ) | | $ | (20,189 | ) | | $ | (62,335 | ) |
| | |
|
|
|
Foreign Currency Exchange Contracts
The Fund may enter into foreign currency exchange contracts (“forward contracts”) for the purchase or sale of a foreign currency at a negotiated rate at a future date.
Forward contracts are reported on a schedule following the Statement of Investments. The unrealized appreciation (depreciation) is reported in the Statement of Assets and Liabilities as a receivable or payable and in the Statement of Operations within the change in unrealized appreciation (depreciation). At contract close, the difference between the original cost of the contract and the value at the close date is recorded as a realized gain (loss) in the Statement of Operations.
The Fund has purchased and sold certain forward foreign currency exchange contracts of different currencies in order to acquire currencies to pay for or sell currencies to acquire related foreign securities purchase and sale transactions, respectively, or to convert foreign currencies to U.S. dollars from related foreign securities transactions. These foreign currency exchange contracts are negotiated at the current spot exchange rate with settlement typically within two business days thereafter.
During the year ended December 31, 2012, the Fund had daily average contract amounts on forward foreign currency contracts to sell of $55,897.
Additional associated risk to the Fund includes counterparty credit risk. Counterparty credit risk arises from the possibility that the counterparty will default.
As of December 31, 2012, the Fund had no outstanding forward contracts.
Futures Contracts
A futures contract is a commitment to buy or sell a specific amount of a financial instrument, or currency, at a negotiated price on a stipulated future date. The Fund may buy and sell futures contracts and may also buy or write put or call options on these futures contracts.
Futures contracts traded on a commodities or futures exchange will be valued at the final settlement price or official closing price on the principal exchange as reported by such principal exchange at its trading session ending at, or most recently prior to, the time when the Fund’s assets are valued.
| | | | |
| 37 | | | | OPPENHEIMER BALANCED FUND/VA |
NOTES TO FINANCIAL STATEMENTS Continued
6. Risk Exposures and the Use of Derivative Instruments Continued
Upon entering into a futures contract, the Fund is required to deposit either cash or securities (initial margin) in an amount equal to a certain percentage of the contract value. Subsequent payments (variation margin) are made or received by the Fund each day. The variation margin payments are equal to the daily changes in the contract value and are recorded as unrealized gains and losses.
Futures contracts are reported on a schedule following the Statement of Investments. Securities held in collateralized accounts to cover initial margin requirements on open futures contracts are noted in the Statement of Investments. Cash held by the broker to cover initial margin requirements on open futures contracts and the receivable and/or payable for the daily mark to market for the variation margin are noted in the Statement of Assets and Liabilities. The net change in unrealized appreciation and depreciation is reported in the Statement of Operations. Realized gains (losses) are reported in the Statement of Operations at the closing or expiration of futures contracts.
The Fund has purchased futures contracts on various bonds and notes to increase exposure to interest rate risk.
The Fund has sold futures contracts on various bonds and notes to decrease exposure to interest rate risk.
During the year ended December 31, 2012, the Fund had an ending monthly average market value of $6,346,474 and $23,492,249 on futures contracts purchased and sold, respectively.
Additional associated risks of entering into futures contracts (and related options) include the possibility that there may be an illiquid market where the Fund is unable to liquidate the contract or enter into an offsetting position and, if used for hedging purposes, the risk that the price of the contract will correlate imperfectly with the prices of the Fund’s securities.
Option Activity
The Fund may buy and sell put and call options, or write put and call options. When an option is written, the Fund receives a premium and becomes obligated to sell or purchase the underlying security at a fixed price, upon exercise of the option.
Options are valued daily based upon the last sale price on the principal exchange on which the option is traded. The difference between the premium received or paid, and market value of the option, is recorded as unrealized appreciation or depreciation. The net change in unrealized appreciation or depreciation is reported in the Statement of Operations. When an option is exercised, the cost of the security purchased or the proceeds of the security sale are adjusted by the amount of premium received or paid. Upon the expiration or closing of the option transaction, a gain or loss is reported in the Statement of Operations.
The Fund has purchased put options on individual equity securities and/or equity indexes to decrease exposure to equity risk. A purchased put option becomes more valuable as the price of the underlying financial instrument depreciates relative to the strike price.
The Fund has purchased call options on treasury and/or euro futures to increase exposure to interest rate risk. A purchased call option becomes more valuable as the price of the underlying financial instrument appreciates relative to the strike price.
During the year ended December 31, 2012, the Fund had an ending monthly average market value of $538 and $2,491 on purchased call options and purchased put options, respectively.
Options written, if any, are reported in a schedule following the Statement of Investments and as a liability in the Statement of Assets and Liabilities. Securities held in collateralized accounts to cover potential obligations with respect to outstanding written options are noted in the Statement of Investments.
The risk in writing a call option is that the Fund gives up the opportunity for profit if the market price of the security increases and the option is exercised. The risk in writing a put option is that the Fund may incur a loss if the market price of the security decreases and the option is exercised. The risk in buying an option is that the Fund pays a premium whether or not the option is exercised. The Fund also has the additional risk that there may be an illiquid market where the Fund is unable to close the contract.
| | | | |
| 38 | | | | OPPENHEIMER BALANCED FUND/VA |
Additional associated risks to the Fund include counterparty credit risk for over-the-counter options and liquidity risk.
As of December 31, 2012, the Fund had no outstanding written or purchased options.
7. Restricted Securities
As of December 31, 2012, investments in securities included issues that are restricted. A restricted security may have a contractual restriction on its resale and is valued under methods approved by the Board of Trustees as reflecting fair value. Securities that are restricted are marked with an applicable footnote on the Statement of Investments. Restricted securities are reported on a schedule following the Statement of Investments.
8. Acquisition of Total Return Portfolio
On April 26, 2012, the Fund acquired all of the net assets of Total Return Portfolio at fair market value, pursuant to an Agreement and Plan of Reorganization approved by the Total Return Portfolio shareholders on April 20, 2012. The purpose of this acquisition is to combine two funds with similar investment objectives, strategies and risks to allow shareholders to benefit from greater asset growth potential, as well as lowered total expenses.
The transaction qualified as a tax-free reorganization, (the “merger”) for federal income tax purposes allowing the Fund to use the original cost basis of the investments received to calculate subsequent gains and losses for tax reporting purposes.
Details of the merger are shown in the following table:
| | | | | | | | | | | | | | | | |
| | | Exchange
Ratio to
One Share
of the Total
Return
Portfolio | | | Shares of
Beneficial
Interest
Issued by
the Fund | | | Value of
Issued
Shares of
Beneficial
Interest | | | Combined
Net Assets on
April 26, 20121 | |
| Total Return Portfolio fund shares merged into the Non-Service Shares | | | 0.1049625104 | | | | 8,473,818 | | | $ | 101,940,025 | | | $ | 230,906,772 | |
1. The net assets acquired included net unrealized appreciation of $6,091,953 and an unused capital loss carryforward of $46,084,065, potential utilization subject to tax limitations.
Had the merger occurred at the beginning of the reporting period, the Fund’s Statement of Operations would have been adjusted to the following amounts:
| | | | |
Net investment income | | $ | 6,392,987 | |
Net gain on investments | | | 28,077,288 | |
Net increase in net assets resulting from operations | | | 34,470,275 | |
9. Subsequent Event
The Board of Trustees of the Fund recently approved a series of modifications to the Fund’s investment advisory and transfer agency arrangements in connection with internal corporate restructuring efforts at OppenheimerFunds, Inc. (“OFI”). As a result of these modifications, on January 1, 2013 (the “Effective Date”), OFI Global Asset Management, Inc. (“OFI Global”), a wholly-owned subsidiary of OFI, became the investment adviser and transfer agent to the Fund under the terms of the Fund’s advisory agreement and transfer agency agreement, respectively. OFI Global, in turn, entered into a new sub-advisory agreement for the Fund, on the Effective Date, whereby OFI Global will have oversight and supervisory responsibilities and OFI will choose the Fund’s investments and provide related advisory services to the Fund. In addition, on the Effective Date, OFI Global entered into a sub-transfer agency agreement with Shareholder Services, Inc. doing business as OppenheimerFunds Services, a wholly-owned subsidiary of OFI, under which it will be responsible for providing transfer agency services to the Fund.
| | | | |
| 39 | | | | OPPENHEIMER BALANCED FUND/VA |
NOTES TO FINANCIAL STATEMENTS Continued
9. Subsequent Event Continued
The realignment of advisory service responsibility between OFI Global and OFI did not result in any change in the persons managing the assets of the Fund, the level or nature of the advisory services provided to the Fund, or the fees charged to the Fund.
10. Pending Litigation
Since 2009, a number of class action lawsuits have been pending in federal courts against OppenheimerFunds, Inc., the Fund’s Adviser through December 31, 2012 and Sub-Advisor effective January 1, 2013 (the “Manager”), OppenheimerFunds Distributor, Inc., the Fund’s principal underwriter and distributor (the “Distributor”), and certain funds (but not including the Fund) advised by the Manager and distributed by the Distributor (the “Defendant Funds”). Several of these lawsuits also name as defendants certain officers and current and former trustees of the respective Defendant Funds. The lawsuits raise claims under federal securities law and allege, among other things, that the disclosure documents of the respective Defendant Funds contained misrepresentations and omissions and that the respective Defendant Funds’ investment policies were not followed. The plaintiffs in these actions seek unspecified damages, equitable relief and awards of attorneys’ fees and litigation expenses. The Defendant Funds’ Boards of Trustees have also engaged counsel to represent the Funds and the present and former Independent Trustees named in those suits.
Other class action and individual lawsuits have been filed since 2008 in various state and federal courts against the Manager and certain of its affiliates by investors seeking to recover investments they allegedly lost as a result of the “Ponzi” scheme run by Bernard L. Madoff and his firm, Bernard L. Madoff Investment Securities, LLC (“BLMIS”). Plaintiffs in these suits allege that they suffered losses as a result of their investments in several funds managed by an affiliate of the Manager and assert a variety of claims, including breach of fiduciary duty, fraud, negligent misrepresentation, unjust enrichment, and violation of federal and state securities laws and regulations, among others. They seek unspecified damages, equitable relief and awards of attorneys’ fees and litigation expenses. Neither the Distributor, nor any of the Oppenheimer mutual funds, their independent trustees or directors are named as defendants in these lawsuits. None of the Oppenheimer mutual funds invested in any funds or accounts managed by Madoff or BLMIS. On February 28, 2011, a stipulation of partial settlement of three groups of consolidated putative class action lawsuits relating to these matters was filed in the U.S. District Court for the Southern District of New York. On August 19, 2011, the court entered an order and final judgment approving the settlement as fair, reasonable and adequate. In September 2011, certain parties filed notices of appeal from the court’s order approving the settlement. The settlement does not resolve other outstanding lawsuits against the Manager and its affiliates relating to BLMIS.
On April 16, 2010, a lawsuit was filed in New York state court against the Manager, an affiliate of the Manager and AAArdvark IV Funding Limited (“AAArdvark IV”), an entity advised by the Manager’s affiliate, in connection with investments made by the plaintiffs in AAArdvark IV. Plaintiffs allege breach of contract against the defendants and seek compensatory damages, costs and disbursements, including attorney fees. On July 15, 2011, a lawsuit was filed in New York state court against the Manager, an affiliate of the Manager and AAArdvark Funding Limited (“AAArdvark I”), an entity advised by the Manager’s affiliate, in connection with investments made by the plaintiffs in AAArdvark I. The complaint alleges breach of contract against the defendants and seeks compensatory damages, costs and disbursements, including attorney fees. On November 9, 2011, a lawsuit was filed in New York state court against the Manager, an affiliate of the Manager and AAArdvark XS Funding Limited (“AAArdvark XS”), an entity advised by the Manager’s affiliate, in connection with investments made by the plaintiffs in AAArdvark XS. The complaint alleges breach of contract against the defendants and seeks compensatory damages, costs and disbursements, including attorney fees.
The Manager believes the lawsuits and appeals described above are without legal merit and, with the exception of actions it has settled, is defending against them vigorously. While it is premature to render any opinion as to the outcome in these lawsuits, or whether any costs that the Defendant Funds may bear in defending the suits might not be reimbursed by insurance, the Manager believes that these suits should not impair the ability of the Manager or the Distributor to perform their respective duties to the Fund, and that the outcome of all of the suits together should not have any material effect on the operations of any of the Oppenheimer mutual funds.
| | | | |
| 40 | | | | OPPENHEIMER BALANCED FUND/VA |
REPORT OF INDEPENDENT REGISTERED PUBLIC ACCOUNTING FIRM
The Board of Trustees and Shareholders of Oppenheimer Variable Account Funds:
We have audited the accompanying statement of assets and liabilities of Oppenheimer Balanced Fund/VA (a separate series of Oppenheimer Variable Account Funds), including the statement of investments, as of December 31, 2012, and the related statement of operations for the year then ended, the statements of changes in net assets for each of the years in the two-year period then ended and the financial highlights for each of the years in the four-year period then ended. These financial statements and financial highlights are the responsibility of the Fund’s management. Our responsibility is to express an opinion on these financial statements and financial highlights based on our audits. The accompanying financial highlights of Oppenheimer Balanced Fund/VA for the year ended December 31, 2008 were audited by other auditors whose report dated February 11, 2009 expressed an unqualified opinion on those financial highlights.
We conducted our audits in accordance with the standards of the Public Company Accounting Oversight Board (United States). Those standards require that we plan and perform the audit to obtain reasonable assurance about whether the financial statements and financial highlights are free of material misstatement. An audit includes examining, on a test basis, evidence supporting the amounts and disclosures in the financial statements. Our procedures included confirmation of securities owned as of December 31, 2012, by correspondence with the custodian, transfer agent and brokers, or by other appropriate auditing procedures where replies from brokers were not received. An audit also includes assessing the accounting principles used and significant estimates made by management, as well as evaluating the overall financial statement presentation. We believe that our audits provide a reasonable basis for our opinion.
In our opinion, the financial statements and financial highlights referred to above present fairly, in all material respects, the financial position of Oppenheimer Balanced Fund/VA as of December 31, 2012, the results of its operations for the year then ended, the changes in its net assets for each of the years in the two-year period then ended and the financial highlights for each of the years in the four-year period then ended, in conformity with U.S. generally accepted accounting principles.
KPMG LLP
Denver, Colorado
February 19, 2013
| | | | |
| 41 | | | | OPPENHEIMER BALANCED FUND/VA |
FEDERAL INCOME TAX INFORMATION Unaudited
In early 2013, if applicable, shareholders of record received information regarding all dividends and distributions paid to them by the Fund during calendar year 2012.
Dividends, if any, paid by the Fund during the fiscal year ended December 31, 2012 which are not designated as capital gain distributions should be multiplied by the maximum amount allowable but not less than 50.19% to arrive at the amount eligible for the corporate dividend-received deduction.
The foregoing information is presented to assist shareholders in reporting distributions received from the Fund to the Internal Revenue Service. Because of the complexity of the federal regulations which may affect your individual tax return and the many variations in state and local tax regulations, we recommend that you consult your tax advisor for specific guidance.
| | | | |
| 42 | | | | OPPENHEIMER BALANCED FUND/VA |
BOARD APPROVAL OF THE FUND’S INVESTMENT
ADVISORY AGREEMENT Unaudited
Each year, the Board of Trustees (the “Board”), including a majority of the independent Trustees, is required to determine whether to renew the Fund’s investment advisory agreement (the “Agreement”). The Investment Company Act of 1940, as amended, requires that the Board request and evaluate, and that the Manager provide, such information as may be reasonably necessary to evaluate the terms of the Agreement. The Board employs an independent consultant to prepare a report that provides information, including comparative information that the Board requests for that purpose. In addition to in-person meetings focused on this evaluation, the Board receives information throughout the year regarding Fund services, fees, expenses and performance.
The Manager and the independent consultant provided information to the Board on the following factors: (i) the nature, quality and extent of the Manager’s services, (ii) the investment performance of the Fund and the Manager, (iii) the fees and expenses of the Fund, including comparative expense information, (iv) the profitability of the Manager and its affiliates, including an analysis of the cost of providing services, (v) whether economies of scale are realized as the Fund grows and whether fee levels reflect these economies of scale for Fund investors and (vi) other benefits to the Manager from its relationship with the Fund. The Board was aware that there are alternatives to retaining the Manager.
Outlined below is a summary of the principal information considered by the Board as well as the Board’s conclusions.
Nature, Quality and Extent of Services. The Board considered information about the nature, quality and extent of the services provided to the Fund and information regarding the Manager’s key personnel who provide such services. The Manager’s duties include providing the Fund with the services of the portfolio managers and the Manager’s investment team, who provide research, analysis and other advisory services in regard to the Fund’s investments; securities trading services; oversight of third-party service providers; monitoring compliance with applicable Fund policies and procedures and adherence to the Fund’s investment restrictions; and risk management. The Manager is responsible for providing certain administrative services to the Fund as well. Those services include providing and supervising all administrative and clerical personnel who are necessary in order to provide effective corporate administration for the Fund; compiling and maintaining records with respect to the Fund’s operations; preparing and filing reports required by the Securities and Exchange Commission; preparing periodic reports regarding the operations of the Fund for its shareholders; preparing proxy materials for shareholder meetings; and preparing the registration statements required by Federal and state securities laws for the sale of the Fund’s shares. The Manager also provides the Fund with office space, facilities and equipment.
The Board also considered the quality of the services provided and the quality of the Manager’s resources that are available to the Fund. The Board took account of the fact that the Manager has had over fifty years of experience as an investment adviser and that its assets under management rank it among the top mutual fund managers in the United States. The Board evaluated the Manager’s advisory, administrative, accounting, legal, compliance services and risk management, and information the Board has received regarding the experience and professional qualifications of the Manager’s key personnel and the size and functions of its staff. In its evaluation of the quality of the portfolio management services provided, the Board considered the experience of Mitch Williams, Krishna Memani and Peter Strzalkowski, the portfolio managers for the Fund, and the Manager’s investment team and analysts. The Board members also considered the totality of their experiences with the Manager as directors or trustees of the Fund and other funds advised by the Manager. The Board considered information regarding the quality of services provided by affiliates of the Manager, which its members have become knowledgeable about in connection with the renewal of the Fund’s service agreements. The Board concluded, in light of the Manager’s experience, reputation, personnel, operations and resources that the Fund benefits from the services provided under the Agreement.
Investment Performance of the Manager and the Fund. Throughout the year, the Manager provided information on the investment performance of the Fund, including comparative performance information. The Board also reviewed information, prepared by the Manager and by the independent consultant, comparing the Fund’s historical performance to relevant market indices and to the performance of other mixed-asset target allocation moderate funds underlying
| | | | |
| 43 | | | | OPPENHEIMER BALANCED FUND/VA |
BOARD APPROVAL OF THE FUND’S INVESTMENT
ADVISORY AGREEMENT Unaudited / Continued
variable insurance products. The Board considered that the Fund outperformed its performance universe median during the one- and three-year periods, although it underperformed its performance universe median during the five- and ten-year periods. The Board noted the appointment on April 1, 2009 of a new portfolio manager for the Fund and of the head of the Investment Grade Fixed Income Team to oversee the Fund’s investments.
Costs of Services by the Manager. The Board reviewed the fees paid to the Manager and the other expenses borne by the Fund. The Board also considered the comparability of the fees charged and the services provided to the Fund to the fees and services for other clients or accounts advised by the Manager. The independent consultant provided comparative data in regard to the fees and expenses of the Fund and other mixed-asset target allocation moderate funds underlying variable insurance products. In reviewing the fees and expenses charged to the VA funds, the Board considered the Manager’s assertion that, because there is much greater disparity in the fees and services that may be provided by a manager to a VA fund as opposed to a retail fund, when comparing the expenses of the various VA funds to those of retail funds, it is most appropriate to focus on total expenses (rather than on the management fees). Accordingly, while the Board reviewed and considered all expenses, it focused on total expenses. The Board considered that the Fund’s actual management fees and total expenses were lower than its expense group median and average. The Board also considered that Manager has voluntarily agreed to waive fees and/or reimburse the Fund for certain expenses in order to limit total annual fund operating expenses after any fee waiver and/or expense reimbursement (excluding (i) interest, taxes, dividends tied to short sales, brokerage commissions, and other expenditures which are capitalized in accordance with generally accepted accounting principles; (ii) expenses incurred directly or indirectly by the Fund as a result of investments in other investment companies, wholly-owned subsidiaries and pooled investment vehicles; (iii) certain other expenses attributable to, and incurred as a result of, a Fund’s investments; and (iv) other extraordinary expenses (including litigation expenses) not incurred in the ordinary course of the Fund’s business) to annual rates of 0.67% of average annual net assets for Non-Service shares and 0.92% of average annual net assets for Service shares. This voluntary expense limitation may not be amended or withdrawn until one year after the date of the Fund’s prospectus.
Economies of Scale and Profits Realized by the Manager. The Board considered information regarding the Manager’s costs in serving as the Fund’s investment adviser, including the costs associated with the personnel and systems necessary to manage the Fund, and information regarding the Manager’s profitability from its relationship with the Fund. The Board reviewed whether the Manager may realize economies of scale in managing and supporting the Fund. The Board noted that the Fund currently has management fee breakpoints, which are intended to share with Fund shareholders economies of scale that may exist as the Fund’s assets grow.
Other Benefits to the Manager. In addition to considering the profits realized by the Manager, the Board considered information that was provided regarding the direct and indirect benefits the Manager receives as a result of its relationship with the Fund, including compensation paid to the Manager’s affiliates and research provided to the Manager in connection with permissible brokerage arrangements (soft dollar arrangements). The Board also considered that the Manager must be able to pay and retain experienced professional personnel at competitive rates to provide quality services to the Fund.
Conclusions. These factors were also considered by the independent Trustees meeting separately from the full Board, assisted by experienced counsel to the Fund and to the independent Trustees. Fund counsel and the independent Trustees’ counsel are independent of the Manager within the meaning and intent of the Securities and Exchange Commission Rules.
Based on its review of the information it received and its evaluations described above, the Board, including a majority of the independent Trustees, decided to continue the Agreement. In addition, the Board, including a majority of the Independent Trustees, approved the restructuring of the Fund’s investment advisory arrangement so that effective January 1, 2013, (i) OFI Global Asset Management, Inc. (“OFI Global”), a wholly owned subsidiary of the Manager, will serve as the investment adviser to the Fund in place of the Manager under a Restated Advisory Agreement (“Restated Advisory Agreement”), and (ii) OFI Global will enter into a Sub-Advisory Agreement (“Sub-Advisory Agreement”) with
| | | | |
| 44 | | | | OPPENHEIMER BALANCED FUND/VA |
the Manager to provide investment sub-advisory services to the Fund. OFI Global will pay the Manager a percentage of the net investment advisory fee (after all applicable waivers have been deducted) that it receives from the Fund. The Agreement will continue until earlier of August 31, 2013 or the effective date of the Restated Advisory Agreement between the Fund and OFI Global. The Restated Advisory Agreement and Sub-Advisory Agreement will continue until August 31, 2013.
In arriving at its decisions, the Board did not single out any factor or factors as being more important than others, but considered all of the above information, and considered the terms and conditions of the Agreement, Restated Advisory Agreement and Sub-Advisory Agreement, including the management fees, in light of all the surrounding circumstances.
| | | | |
| 45 | | | | OPPENHEIMER BALANCED FUND/VA |
PORTFOLIO PROXY VOTING POLICIES AND PROCEDURES;
UPDATES TO STATEMENTS OF INVESTMENTS Unaudited
The Fund has adopted Portfolio Proxy Voting Policies and Procedures under which the Fund votes proxies relating to securities (“portfolio proxies”) held by the Fund. A description of the Fund’s Portfolio Proxy Voting Policies and Procedures is available (i) without charge, upon request, by calling the Fund toll-free at 1.800.525.7048, (ii) on the Fund’s website at oppenheimerfunds.com, and (iii) on the SEC’s website at www.sec.gov. In addition, the Fund is required to file Form N-PX, with its complete proxy voting record for the 12 months ended June 30th, no later than August 31st of each year. The Fund’s voting record is available (i) without charge, upon request, by calling the Fund toll-free at 1.800.525.7048, and (ii) in the Form N-PX filing on the SEC’s website at www.sec.gov.
The Fund files its complete schedule of portfolio holdings with the SEC for the first quarter and the third quarter of each fiscal year on Form N-Q. The Fund’s Form N-Q filings are available on the SEC’s website at www.sec.gov. Those forms may be reviewed and copied at the SEC’s Public Reference Room in Washington, D.C. Information on the operation of the Public Reference Room may be obtained by calling 1-800-SEC-0330.
| | | | |
| 46 | | | | OPPENHEIMER BALANCED FUND/VA |
TRUSTEES AND OFFICERS Unaudited
| | |
| Name, Position(s) Held with the Fund, Length of Service, Age | | Principal Occupation(s) During the Past 5 Years; Other Trusteeships/Directorships Held; Number of Portfolios in the Fund Complex Currently Overseen |
| |
| INDEPENDENT TRUSTEES | | The address of each Trustee in the chart below is 6803 S. Tucson Way, Centennial, Colorado 80112-3924. Each Trustee serves for an indefinite term, or until his or her resignation, retirement, death or removal. |
| |
Sam Freedman,
Chairman of the Board of Trustees (since 2012) and Trustee (since 1996)
Age: 72 | | Director of Colorado UpLIFT (charitable organization) (since September 1984). Mr. Freedman held several positions with the Sub-Adviser and with subsidiary or affiliated companies of the Sub-Adviser (until October 1994). Oversees 36 portfolios in the OppenheimerFunds complex. Mr. Freedman has served on the Boards of certain Oppenheimer funds since 1996, during which time he has become familiar with the Fund’s (and other Oppenheimer funds’) financial, accounting, regulatory and investment matters and has contributed to the Boards’ deliberations. |
| |
Edward L. Cameron, Trustee (since 1999) Age: 74 | | Member of The Life Guard of Mount Vernon (George Washington historical site) (June 2000-June 2006); Partner of PricewaterhouseCoopers LLP (accounting firm) (July 1974-June 1999); Chairman of Price Waterhouse LLP Global Investment Management Industry Services Group (accounting firm) (July 1994-June 1998). Oversees 36 portfolios in the OppenheimerFunds complex. Mr. Cameron has served on the Boards of certain Oppenheimer funds since 1999, during which time he has become familiar with the Fund’s (and other Oppenheimer funds’) financial, accounting, regulatory and investment matters and has contributed to the Boards’ deliberations. |
| |
Jon S. Fossel, Trustee (since 1990) Age: 70 | | Chairman of the Board (2006-December 2011) and Director (June 2002-December 2011) of UNUMProvident (insurance company); Director of Northwestern Energy Corp. (public utility corporation) (November 2004-December 2009); Director of P.R. Pharmaceuticals (October 1999-October 2003); Director of Rocky Mountain Elk Foundation (non-profit organization) (February 1998-February 2003 and February 2005-February 2007); Chairman and Director (until October 1996) and President and Chief Executive Officer (until October 1995) of the Sub-Adviser; President, Chief Executive Officer and Director of the following: Oppenheimer Acquisition Corp. (“OAC”) (parent holding company of the Sub-Adviser), Shareholders Services, Inc. and Shareholder Financial Services, Inc. (until October 1995). Oversees 36 portfolios in the OppenheimerFunds complex. Mr. Fossel has served on the Boards of certain Oppenheimer funds since 1990, during which time he has become familiar with the Fund’s (and other Oppenheimer funds’) financial, accounting, regulatory and investment matters and has contributed to the Boards’ deliberations. |
| |
Richard F. Grabish, Trustee (since 2012) Age: 64 | | Formerly Senior Vice President and Assistant Director of Sales and Marketing (March 1997-December 2007), Director (March 1987-December 2007) and Manager of Private Client Services (June 1985-June 2005) of A.G. Edwards & Sons, Inc. (broker/dealer and investment firm); Chairman and Chief Executive Officer of A.G. Edwards Trust Company, FSB (March 2001-December 2007); President and Vice Chairman of A.G. Edwards Trust Company, FSB (investment adviser) (April 1987-March 2001); President of A.G. Edwards Trust Company, FSB (investment adviser) (June 2005-December 2007). Oversees 36 portfolios in the OppenheimerFunds complex. Mr. Grabish has served on the Boards of certain Oppenheimer funds since 2001, during which time he has become familiar with the Fund’s (and other Oppenheimer funds’) financial, accounting, regulatory and investment matters and has contributed to the Boards’ deliberations. |
| |
Beverly L. Hamilton, Trustee (since 2002) Age: 66 | | Trustee of Monterey Institute for International Studies (educational organization) (since February 2000); Board Member of Middlebury College (educational organization) (December 2005-June 2011); Chairman (since 2010) of American Funds’ Emerging Markets Growth Fund, Inc. (mutual fund); Director of The California Endowment (philanthropic organization) (April 2002-April 2008); Director (February 2002-2005) and Chairman of Trustees (2006-2007) of the Community Hospital of Monterey Peninsula; Director (October 1991-2005); Vice Chairman (2006-2009) of American Funds’ Emerging Markets Growth Fund, Inc. (mutual fund); President of ARCO Investment Management Company (February 1991-April 2000); Member of the investment committees of The Rockefeller Foundation (2001-2006) and The University of Michigan (since 2000); Advisor at Credit Suisse First Boston’s Sprout venture capital unit (venture capital fund) (1994-January 2005); Trustee of MassMutual Institutional Funds (investment company) (1996-June 2004); Trustee of MML Series Investment Fund (investment company) (April 1989-June 2004); Member of the investment committee of Hartford Hospital (2000-2003); and Advisor to Unilever (Holland) pension fund (2000-2003). Oversees 36 portfolios in the OppenheimerFunds complex. Ms. Hamilton has served on the Boards of certain Oppenheimer funds since 2002, during which time she has become familiar with the Fund’s (and other Oppenheimer funds’) financial, accounting, regulatory and investment matters and has contributed to the Boards’ deliberations. |
| | | | |
| 47 | | | | OPPENHEIMER BALANCED FUND/VA |
TRUSTEES AND OFFICERS Unaudited / Continued
| | |
Victoria J. Herget,
Trustee (since 2012)
Age: 61 | | Independent Director of the First American Funds (mutual fund family) (2003-2011); former Managing Director (1993-2001), Principal (1985-1993), Vice President (1978-1985) and Assistant Vice President (1973-1978) of Zurich Scudder Investments (and its predecessor firms); Board Chair (2008-Present) and Director (2004-Present), United Educators (insurance company); Trustee (1992-2007), Chair of the Board of Trustees (1999-2007), Investment Committee Chair (1994-1999) and Investment Committee member (2007-2010) of Wellesley College; Trustee (since 2000) and Chair (since 2010), Newberry Library; Trustee, Mather LifeWays (since 2001); Trustee, BoardSource (2006-2009) and Chicago City Day School (1994-2005). Oversees 36 portfolios in the OppenheimerFunds complex. Ms. Herget has served on the Boards of certain Oppenheimer funds since 2012, during which time she has become familiar with the Fund’s (and other Oppenheimer funds’) financial, accounting, regulatory and investment matters and has contributed to the Boards’ deliberations. |
| |
Robert J. Malone,
Trustee (since 2002)
Age: 68 | | Board of Directors of Opera Colorado Foundation (non-profit organization) (since March 2008); Director of Jones Knowledge, Inc. (2006-2010); Director of Jones International University (educational organization) (since August 2005); Chairman, Chief Executive Officer and Director of Steele Street Bank & Trust (commercial banking) (since August 2003); Director of Colorado UpLIFT (charitable organization) (1986-2010); Trustee of the Gallagher Family Foundation (non-profit organization) (since 2000); Former Chairman of U.S. Bank-Colorado (subsidiary of U.S. Bancorp and formerly Colorado National Bank) (July 1996-April 1999); Director of Commercial Assets, Inc. (real estate investment trust) (1993-2000); Director of Jones Knowledge, Inc. (2001-July 2004); Director of U.S. Exploration, Inc. (oil and gas exploration) (1997-February 2004); Chairman of the Board (1991-1994) and Trustee (1985-1994) of Regis University; and Chairman of the Board (1990-1991) and Trustee (1984-1999) of Young Presidents Organization. Oversees 36 portfolios in the OppenheimerFunds complex. Mr. Malone has served on the Boards of certain Oppenheimer funds since 2002, during which time he has become familiar with the Fund’s (and other Oppenheimer funds’) financial, accounting, regulatory and investment matters and has contributed to the Boards’ deliberations. |
| |
F. William Marshall, Jr.,
Trustee (since 2000)
Age: 70 | | Trustee Emeritus of Worcester Polytech Institute (WPI) (private university) (since 2009); Trustee of MassMutual Select Funds (formerly MassMutual Institutional Funds) (investment company) (since 1996) and MML Series Investment Fund (investment company) (since 1996) and Mass Mutual Premier Funds (investment company) (since January 2012); President and Treasurer of the SIS Funds (private charitable fund) (January 1999-March 2011); Former Trustee of WPI (1985-2008); Former Chairman of the Board (2004-2006) and Former Chairman of the Investment Committee of WPI (1994-2008); Chairman of SIS & Family Bank, F.S.B. (formerly SIS Bank) (commercial bank) (January 1999-July 1999); Executive Vice President of Peoples Heritage Financial Group, Inc. (commercial bank) (January 1999-July 1999); and Former President and Chief Executive Officer of SIS Bancorp. (1993-1999). Oversees 40 portfolios in the OppenheimerFunds complex. Mr. Marshall has served on the Boards of certain Oppenheimer funds since 2000, during which time he has become familiar with the Fund’s (and other Oppenheimer funds’) financial, accounting, regulatory and investment matters and has contributed to the Boards’ deliberations. |
| |
Karen L. Stuckey,
Trustee (since 2012)
Age: 59 | | Partner (1990-2012) of PricewaterhouseCoopers LLP (held various positions 1975-1990); Trustee (1992-2006) and member of Executive, Nominating and Audit Committees and Chair of Finance Committee of Lehigh University; and member, Women’s Investment Management Forum since inception. Oversees 36 portfolios in the OppenheimerFunds complex. Ms. Stuckey has served on the Boards of certain Oppenheimer funds since 2012, during which time she has become familiar with the Fund’s (and other Oppenheimer funds’) financial, accounting, regulatory and investment matters and has contributed to the Boards’ deliberations. |
| |
James D. Vaughn,
Trustee (since 2012)
Age: 67 | | Retired; former managing partner (1994-2001) of Denver office of Deloitte & Touche LLP, (held various positions 1969-1993); Trustee and Chairman of the Audit Committee of Schroder Funds (2003-2012); Board member and Chairman of Audit Committee of AMG National Trust Bank (since 2005); Trustee, Audit Committee member and Investment Committee member, University of South Dakota Foundation (since 1996); Board member, Executive Committee Member, Audit Committee Member and past Board Chair, Junior Achievement (since 1993); former Board member, Mile High United Way, Boys and Girls Clubs, Boy Scouts, Colorado Business Committee for the Arts, Economic Club of Colorado and Metro Denver Network. Oversees 36 portfolios in the OppenheimerFunds complex. Mr. Vaughn has served on the Boards of certain Oppenheimer funds since 2012, during which time he has become familiar with the Fund’s (and other Oppenheimer funds’) financial, accounting, regulatory and investment matters and has contributed to the Boards’ deliberations. |
| | | | |
| 48 | | | | OPPENHEIMER BALANCED FUND/VA |
| | |
| INTERESTED TRUSTEE AND OFFICER | | The address of Mr. Glavin is Two World Financial Center, 225 Liberty Street, 11th Floor, New York, New York 10281-1008. Mr. Glavin serves as a Trustee for an indefinite term, or until his resignation, retirement, death or removal and as an Officer for an indefinite term, or until his resignation, retirement, death or removal. Mr. Glavin is an Interested Trustee due to his positions with OppenheimerFunds, Inc. and its affiliates. |
| |
William F. Glavin, Jr., Trustee, President and Principal Executive Officer
(since 2009) Age: 54 | | Chief Executive Officer of OppenheimerFunds (since January 2013); Director, Chief Executive Officer and President of the Manager (since January 2013); Chairman of the Sub-Adviser (December 2009-December 2012); Chief Executive Officer (January 2009-December 2012) and Director of the Sub-Adviser (since January 2009); President of the Sub-Adviser (May 2009-December 2012); Management Director (since June 2009), President (since December 2009) and Chief Executive Officer (since January 2011) of Oppenheimer Acquisition Corp. (“OAC”) (the Sub-Adviser’s parent holding company); Director of Oppenheimer Real Asset Management, Inc. (since March 2010); Executive Vice President (March 2006-February 2009) and Chief Operating Officer (July 2007-February 2009) of Massachusetts Mutual Life Insurance Company (OAC’s parent company); Director (May 2004-March 2006) and Chief Operating Officer and Chief Compliance Officer (May 2004-January 2005), President (January 2005-March 2006) and Chief Executive Officer (June 2005-March 2006) of Babson Capital Management LLC; Director (March 2005-March 2006), President (May 2003-March 2006) and Chief Compliance Officer (July 2005-March 2006) of Babson Capital Securities, Inc. (a broker-dealer); President (May 2003-March 2006) of Babson Investment Company, Inc.; Director (May 2004-August 2006) of Babson Capital Europe Limited; Director (May 2004-October 2006) of Babson Capital Guernsey Limited; Director (May 2004-March 2006) of Babson Capital Management LLC; Non-Executive Director (March 2005-March 2007) of Baring Asset Management Limited; Director (February 2005-June 2006) Baring Pension Trustees Limited; Director and Treasurer (December 2003-November 2006) of Charter Oak Capital Management, Inc.; Director (May 2006-September 2006) of C.M. Benefit Insurance Company; Director (May 2008-June 2009) and Executive Vice President (June 2007-July 2009) of C.M. Life Insurance Company; President (March 2006-May 2007) of MassMutual Assignment Company; Director (January 2005-December 2006), Deputy Chairman (March 2005-December 2006) and President (February 2005-March 2005) of MassMutual Holdings (Bermuda) Limited; Director (May 2008-June 2009) and Executive Vice President (June 2007-July 2009) of MML Bay State Life Insurance Company; Chief Executive Officer and President (April 2007-January 2009) of MML Distributors, LLC; and Chairman (March 2006-December 2008) and Chief Executive Officer (May 2007-December 2008) of MML Investors Services, Inc. An officer of 86 portfolios in the OppenheimerFunds complex. |
| OTHER OFFICERS OF THE FUND | | The addresses of the Officers in the chart below are as follows: for Messrs. Memani, Strzalkowski, Williams, Gabinet and Ms. Nasta, Two World Financial Center, 225 Liberty Street, New York, New York 10281-1008, for Messrs. Vandehey and Wixted. Each Officer serves for an indefinite term or until his or her resignation, retirement, death or removal. |
| |
Krishna Memani, Vice President
(since 2009)
Age: 52 | | President of the Sub-Adviser (since January 2013); Chief Investment Officer, Fixed Income of the Sub-Adviser (since January 2013) and Head of the Investment Grade Fixed Income Team of the Sub-Adviser (since March 2009). Director of Fixed Income of the Sub-Adviser (October 2010-December 2012) and Senior Vice President (March 2009-December 2012). Mr. Memani was a Managing Director and Head of the U.S. and European Credit Analyst Team at Deutsche Bank Securities (June 2006-January 2009). He was the Chief Credit Strategist at Credit Suisse Securities (August 2002-March 2006). He was a Managing Director and Senior Portfolio Manager at Putnam Investments (September 1998-June 2002). A portfolio manager and an officer of 14 portfolios in the OppenheimerFunds complex. |
| |
Peter A. Strzalkowski, Vice President
(since 2009)
Age: 47 | | Vice President of the Sub-Adviser (since August 2007), CFA and a member of the Sub-Adviser’s Investment Grade Fixed Income Team (since April 2009). Prior to joining the Sub-Adviser, Managing Partner and Chief Investment Officer of Vector Capital Management, LLC, a structured products money management firm he founded, (July 2006-August 2007); a Senior Portfolio Manager at Highland Capital Management, L.P. (June 2005-July 2006) and a Senior Fixed Income Portfolio Manager at Microsoft Corp. (June 2003-June 2005); a Vice President and Senior Fixed Income Portfolio Manager at First Citizens Bank Trust, Capital Management Group (April 2000-June 2003); a Vice President and Fixed Income Portfolio Manager at Centura Banks (November 1998-April 2000). A portfolio manager and officer of 6 portfolios in the OppenheimerFunds complex. |
| |
Mitch Williams, Vice President
(since 2011) Age: 44 | | Vice President of the Sub-Adviser (since July 2006); CFA and a Senior Research Analyst of the Sub-Adviser (since April 2002). Prior to joining the Sub-Adviser, Vice President and Research Analyst for Evergreen Funds (October 2000-January 2002). A portfolio manager and officer of 5 portfolios in the OppenheimerFunds complex. |
| | | | |
| 49 | | | | OPPENHEIMER BALANCED FUND/VA |
TRUSTEES AND OFFICERS Unaudited / Continued
| | |
Arthur S. Gabinet, Secretary and Chief
Legal Officer
(since 2011) Age: 54 | | General Counsel of OppenheimerFunds (since January 2013); Executive Vice President, Secretary and General Counsel of the Manager (since January 2013); General Counsel OFI SteelPath, Inc. (since January 2013); Executive Vice President (May 2010-December 2012) and General Counsel (since January 2011) of the Sub-Adviser; General Counsel of the Distributor (since January 2011); General Counsel of Centennial Asset Management Corporation (January 2011-December 2012); Executive Vice President (January 2011-December 2012) and General Counsel of HarbourView Asset Management Corporation (since January 2011); Assistant Secretary (since January 2011) and Director (since January 2011) of OppenheimerFunds International Ltd. and OppenheimerFunds plc; Director of Oppenheimer Real Asset Management, Inc. (January 2011-December 2012) and General Counsel (since January 2011); Executive Vice President (January 2011-December 2011) and General Counsel of Shareholder Financial Services, Inc. and Shareholder Services, Inc. (since January 2011); Executive Vice President (January 2011-December 2012) and General Counsel of OFI Private Investments Inc. (since January 2011); Vice President of OppenheimerFunds Legacy Program (January 2011-December 2011); Executive Vice President (January 2011-December 2012) and General Counsel of OFI Institutional Asset Management, Inc. (since January 2011); General Counsel, Asset Management of the Sub-Adviser (May 2010-December 2010); Principal, The Vanguard Group (November 2005-April 2010); District Administrator, U.S. Securities and Exchange Commission (January 2003-October 2005). An officer of 86 portfolios in the OppenheimerFunds complex. |
| |
Christina M. Nasta, Vice President and Chief
Business Officer
(since 2011) Age: 39 | | Senior Vice President of OppenheimerFunds Distributor, Inc. (since January 2013); Senior Vice President of the Sub-Adviser (July 2010-December 2012); Vice President of the Sub-Adviser (January 2003-July 2010); Vice President of OppenheimerFunds Distributor, Inc. (January 2003-July 2010). An officer of 86 portfolios in the OppenheimerFunds complex. |
| |
Mark S. Vandehey,
Vice President and Chief Compliance Officer (since 2004)
Age: 62 | | Chief Compliance Officer of OppenheimerFunds (since January 2013); Senior Vice President and Chief Compliance Officer of the Manager (since January 2013); Chief Compliance Officer of OFI SteelPath, Inc. (since January 2013); Senior Vice President of the Sub-Adviser (March 2004-December 2012); Chief Compliance Officer of the Sub-Adviser, OppenheimerFunds Distributor, Inc., OFI Trust Company, OFI Institutional Asset Management, Inc., Oppenheimer Real Asset Management, Inc., OFI Private Investments, Inc., Harborview Asset Management Corporation, Trinity Investment Management Corporation, and Shareholder Services, Inc. (since March 2004); Vice President of OppenheimerFunds Distributor, Inc., Centennial Asset Management Corporation and Shareholder Services, Inc. (June 1983-December 2012). An officer of 86 portfolios in the OppenheimerFunds complex. |
| |
Brian W. Wixted,
Treasurer and Principal Financial & Accounting Officer
(since 1999)
Age: 53 | | Senior Vice President of the Manager (since January 2013); Treasurer of the Sub-Adviser, HarbourView Asset Management Corporation, Shareholder Financial Services, Inc., Shareholder Services, Inc., and Oppenheimer Real Asset Management, Inc. (March 1999-June 2008), OFI Private Investments, Inc. (March 2000-June 2008), OppenheimerFunds International Ltd. and OppenheimerFunds plc (since May 2000), OFI Institutional Asset Management, Inc. (November 2000-June 2008), and OppenheimerFunds Legacy Program (charitable trust program established by the Sub-Adviser) (June 2003-December 2011); Treasurer and Chief Financial Officer of OFI Trust Company (since May 2000); Assistant Treasurer of Oppenheimer Acquisition Corporation (March 1999-June 2008). An officer of 86 portfolios in the OppenheimerFunds complex. |
The Fund’s Statement of Additional Information contains additional information about the Fund’s Trustees and Officers and is available without charge, upon request, by calling 1.800.988.8287.
| | | | |
| 50 | | | | OPPENHEIMER BALANCED FUND/VA |
OPPENHEIMER BALANCED FUND/VA
| | |
| A Series of Oppenheimer Variable Account Funds |
| Manager | | OFI Global Asset Management, Inc. |
| Sub-Adviser | | OppenheimerFunds, Inc. |
| Distributor | | OppenheimerFunds Distributor, Inc. |
| Transfer and Shareholder Servicing Agent | | OFI Global Asset Management, Inc. |
| Sub-Transfer Agent | | Shareholder Services, Inc. DBA OppenheimerFunds Services |
Independent Registered Public Accounting Firm | | KPMG LLP |
| Counsel | | K&L Gates LLP |
Before investing, investors should carefully consider a fund’s investment objectives, risks, charges and expenses. Fund prospectuses and summary prospectuses contain this and other information about the funds, and may be obtained by asking your financial advisor, or calling us at 1.800.988.8287. Read prospectuses and summary prospectuses carefully before investing.
| | |
| ©2013 OppenheimerFunds, Inc. All rights reserved. | |  |
December 31, 2012
| | | | |
| | | Oppenheimer Capital Appreciation Fund/VA A Series of Oppenheimer Variable Account Funds | | Annual Report |
ANNUAL REPORT
Listing of Top Holdings
Fund Performance Discussion
Financial Statements
OPPENHEIMER CAPITAL APPRECIATION FUND/VA
Portfolio Managers: Julie Van Cleave, CFA, and Michael Kotlarz1
| | | | | | |
Average Annual Total Returns
For the Periods Ended 12/31/12 |
| | | |
| | | 1-Year | | 5-Year | | 10-Year |
| Non-Service Shares | | 14.12% | | -0.57% | | 5.83% |
| Service Shares | | 13.81 | | -0.82 | | 5.57 |
The performance data quoted represents past performance, which does not guarantee future results. The investment return and principal value of an investment in the Fund will fluctuate so that an investor’s shares, when redeemed, may be worth more or less than their original cost. Current performance may be lower or higher than the performance quoted. For performance data current to the most recent month end, call us at 1.800.988.8287. The Fund’s total returns should not be expected to be the same as the returns of other funds, whether or not both funds have the same portfolio managers and/or similar names. The Fund’s total returns include changes in share price and reinvested distributions but do not include the charges associated with the separate account products that offer this Fund. Such performance would have been lower if such charges were taken into account.
| | | | |
| Top Ten Common Stock Holdings | | | |
| Apple, Inc. | | | 7.4 | % |
| QUALCOMM, Inc. | | | 4.1 | |
| Google, Inc., Cl. A | | | 3.2 | |
| McDonald’s Corp. | | | 2.1 | |
| Costco Wholesale Corp. | | | 2.0 | |
| Walt Disney Co. (The) | | | 2.0 | |
| Monsanto Co. | | | 1.9 | |
| Novo Nordisk AS, Cl. B | | | 1.8 | |
| Schlumberger Ltd. | | | 1.8 | |
| Allergan, Inc. | | | 1.8 | |
Portfolio holdings and allocations are subject to change. Percentages are as of December 31, 2012, and are based on net assets.
1. Became a portfolio manager June 29, 2012.
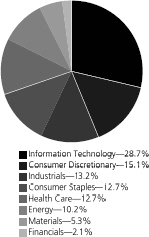
Portfolio holdings and allocations are subject to change. Percentages are as of December 31, 2012, and are based on the total market value of common stocks.
| | | | |
| 2 | | | | OPPENHEIMER CAPITAL APPRECIATION FUND/VA |
FUND PERFORMANCE DISCUSSION
The Fund’s Non-Service shares produced a total return of 14.12% during the one-year period ended December 31, 2012. In comparison, the Fund underperformed the Russell 1000 Growth Index (the “Index”), which returned 15.26%. The Fund’s underperformance stemmed from weaker relative stock selection in the consumer discretionary sector. The Fund outperformed the Index within consumer staples and information technology due to stronger relative stock selection. The Fund also underperformed the S&P 500 Index, which returned 16% this reporting period.
Economic and Market Environment
Domestic equities generally produced positive returns this period. The period began during a time of improved market sentiment in which the United States managed to avoid a return to recession and European policymakers appeared to take steps to address the region’s sovereign debt and banking sector crises. Renewed investor optimism helped produce gains in the U.S. equity market as well as across a number of international equity markets over the first three months of 2012. The rebound across equities gained momentum after the European Central Bank implemented dual Long-Term Refinancing Operations (“LTROs”) to enhance liquidity for troubled banks and reduce rates on newly issued sovereign debt securities.
The second quarter was more volatile for the equity markets. In the U.S., slower than expected first quarter growth contributed to a sell-off in the U.S. stock market. Consumer confidence dropped as U.S. unemployment figures ticked slightly upwards after showing signs of improvement from the recession highs. The fear of contagion from the worsening European sovereign debt crisis and a recession across much of Europe drove negative market sentiment, particularly over May and June.
In the second half of the period, the global equity markets resumed an upward trend as certain events appeared to help calm market jitters. Investors had been deeply concerned about the possibility of Greece pulling out of the euro and its ramifications for the future of the Eurozone and its common currency. The results of elections in Greece and continued efforts by European policymakers to stabilize the situation in the region made far less likely the imminent fracturing of the Eurozone and the serious consequences that might have for the euro.
The markets responded positively to Central Banks continued efforts to stimulate economic growth. Following the dual LTROs, further action was taken, as the ECB committed to potentially unlimited bond purchases to ease financing pressure on countries like Spain and Italy. Under the plan, these and other members of the European Union (excluding Greece) would be able to maintain access to funding at sustainable interest rates, on the condition that they continue with strict reform programs.
In the U.S., the Fed introduced QE3, under which it announced plans to purchase mortgage-backed bonds on a monthly basis until the labor market shows signs of substantial improvement. While these actions and a last minute temporary resolution of the so-called fiscal cliff enacted by the U.S. Congress largely prevented the markets from trading in negative territory in the final quarter, a number of concerns throughout the globe remained and presented the possibility for future market volatility.
Top Individual Contributors
Three of the top performing Fund holdings were in the information technology sector: Apple, Inc., eBay, Inc. and QUALCOMM, Inc. Apple and QUALCOMM were the first and second largest holdings of the Fund at period end, respectively. Apple continued to benefit from its success at innovation and its highly recognizable brand, leading to global growth and share gains across its top revenue producing products—iPhones, iPads and Mac PCs. eBay’s earnings beat expectations and management raised guidance for both 2012 revenues and profits. The company benefited from a turnaround in its Marketplace segment with improvements to the user experience leading to increased loyalty and great volumes of transactions. PayPal, eBay’s online payment service, continued to be a significant contributor to eBay’s growth with results that exceeded expectations. QUALCOMM, a manufacturer of digital wireless communication equipment, performed particularly well as its involvement in a new round of Apple products boosted its outlook.
Also benefiting the Fund’s performance were health care stock Novo Nordisk AS and consumer staples holding Costco Wholesale Corp. Novo Nordisk’s performance was driven largely by increased sales of Victoza, which is a diabetes drug. Costco experienced increased sales during the period. In a volatile market environment, many consumers decided to make bulk purchases and lower prices, which benefited Costco.
Top Individual Detractors
The most significant detractor from performance was consumer discretionary stock McDonald’s Corp. The fast food chain declined partly due to a decrease in sales in Asian markets, including Japan and China. The recession in Europe also negatively impacted McDonald’s, as did increased competition between fast food restaurants. Also detracting from performance were information technology stocks Facebook, Inc. and Juniper Neworks, Inc. Social media firm Facebook faced concerns around how best to deliver effective advertising to mobile devices and monetize its significant network of users. Juniper is a producer of computer networking gear that reduced gross margin targets as management reported newer products would need additional time to become profitable. We exited our positions in both Facebook and Juniper by period end.
| | | | |
| 3 | | | | OPPENHEIMER CAPITAL APPRECIATION FUND/VA |
FUND PERFORMANCE DISCUSSION Continued
Strategy & Outlook
Looking forward, we expect to see significantly greater differentiation in valuations to occur in the equity market with better valuations awarded to companies with high quality earnings. We employ a disciplined investment process that combines strategic, top-down sector analysis with bottom-up fundamental research. We continue to focus on companies with consistent revenue and earnings growth, which we believe will be beneficial as investors seek to invest in companies with the brightest prospects.
Investors should consider the Fund’s investment objective, risks, charges and expenses carefully before investing. The Fund’s prospectus and summary prospectus contain this and other information about the Fund, and may be obtained by asking your financial advisor or calling us at 1.800.988.8287. Read prospectuses and summary prospectuses carefully before investing.
Total returns include changes in share price and reinvestment of dividends and capital gains distributions in a hypothetical investment for the periods shown.
The Fund’s investment strategy and focus can change over time. The mention of specific fund holdings does not constitute a recommendation by OppenheimerFunds, Inc. or its affiliates.
Shares of Oppenheimer funds are not deposits or obligations of any bank, are not guaranteed by any bank, are not insured by the FDIC or any other agency, and involve investment risks, including the possible loss of the principal amount invested.
Comparing the Fund’s Performance to the Market. The graphs that follow show the performance of a hypothetical $10,000 investment in each share class of the Fund held until December 31, 2012. Performance is measured over a ten-fiscal-year period for both Classes. Performance information does not reflect charges that apply to separate accounts investing in the Fund. If these charges were taken into account, performance would be lower. The graphs assume that all dividends and capital gains distributions were reinvested in additional shares.
The Fund’s performance is compared to the performance of the S&P 500 Index, an index of large-capitalization equity securities that is a measure of the general domestic stock market, and the Russell 1000 Growth Index, an index of 1,000 U.S. large cap growth stocks. The indices are unmanaged and cannot be purchased directly by investors. Index performance is shown for illustrative purposes only and does not predict or depict the performance of the Fund. While index comparisons may be useful to provide a benchmark for the Fund’s performance, it must be noted that the Fund’s investments are not limited to the investments comprising the indices.
| | | | |
| 4 | | | | OPPENHEIMER CAPITAL APPRECIATION FUND/VA |
Non-Service Shares
Comparison of Change in Value of $10,000 Hypothetical Investments in:
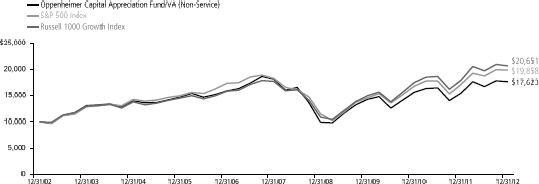
Average Annual Total Returns of Non-Service Shares of the Fund at 12/31/12
1-Year 14.12% 5-Year -0.57% 10-Year 5.83%
Service Shares
Comparison of Change in Value of $10,000 Hypothetical Investments in:
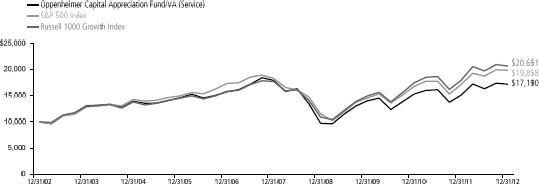
Average Annual Total Returns of Service Shares of the Fund at 12/31/12
1-Year 13.81% 5-Year -0.82% 10-Year 5.57%
The performance data quoted represents past performance, which does not guarantee future results. The investment return and principal value of an investment in the Fund will fluctuate so that an investor’s shares, when redeemed, may be worth more or less than their original cost. Current performance may be lower or higher than the performance quoted. For performance data current to the most recent month end, call us at 1.800.988.8287. The Fund’s total returns should not be expected to be the same as the returns of other funds, whether or not both funds have the same portfolio managers and/or similar names. The Fund’s total returns include changes in share price and reinvested distributions but do not include the charges associated with the separate account products that offer this Fund. Such performance would have been lower if such charges were taken into account.
| | | | |
| 5 | | | | OPPENHEIMER CAPITAL APPRECIATION FUND/VA |
FUND EXPENSES
Fund Expenses. As a shareholder of the Fund, you incur two types of costs: (1) transaction costs and (2) ongoing costs, including management fees; distribution and service fees; and other Fund expenses. These examples are intended to help you understand your ongoing costs (in dollars) of investing in the Fund and to compare these costs with the ongoing costs of investing in other mutual funds.
The examples are based on an investment of $1,000.00 invested at the beginning of the period and held for the entire 6-month period ended December 31, 2012.
Actual Expenses. The first section of the table provides information about actual account values and actual expenses. You may use the information in this section for the class of shares you hold, together with the amount you invested, to estimate the expense that you paid over the period. Simply divide your account value by $1,000.00 (for example, an $8,600.00 account value divided by $1,000.00 = 8.60), then multiply the result by the number in the first section under the heading entitled “Expenses Paid During Period” to estimate the expenses you paid on your account during this period.
Hypothetical Example for Comparison Purposes. The second section of the table provides information about hypothetical account values and hypothetical expenses based on the Fund’s actual expense ratio for each class of shares, and an assumed rate of return of 5% per year for each class before expenses, which is not the actual return. The hypothetical account values and expenses may not be used to estimate the actual ending account balance or expenses you paid for the period. You may use this information to compare the ongoing costs of investing in the Fund and other funds. To do so, compare this 5% hypothetical example for the class of shares you hold with the 5% hypothetical examples that appear in the shareholder reports of the other funds.
Please note that the expenses shown in the table are meant to highlight your ongoing costs only and do not reflect any charges associated with the separate accounts that offer this Fund. Therefore, the “hypothetical” lines of the table are useful in comparing ongoing costs only, and will not help you determine the relative total costs of owning different funds. In addition, if these separate account charges were included your costs would have been higher.
| | | | | | | | | | | | |
| Actual | | Beginning
Account
Value
July 1, 2012 | | | Ending Account Value
December 31, 2012 | | | Expenses Paid During 6 Months Ended
December 31, 2012 | |
| Non-Service shares | | $ | 1,000.00 | | | $ | 1,054.30 | | | $ | 4.14 | |
| Service shares | | | 1,000.00 | | | | 1,053.00 | | | | 5.43 | |
| | | |
Hypothetical (5% return before expenses) | | | | | | | | | |
| Non-Service shares | | | 1,000 .00 | | | | 1,021 .11 | | | | 4 .07 | |
| Service shares | | | 1,000 .00 | | | | 1,019 .86 | | | | 5 .35 | |
Expenses are equal to the Fund’s annualized expense ratio for that class, multiplied by the average account value over the period, multiplied by 184/366 (to reflect the one-half year period). Those annualized expense ratios, excluding indirect expenses from affiliated funds, based on the 6-month period ended December 31, 2012 are as follows:
| | | | |
| Class | | Expense Ratios | |
| Class Non-Service | | | 0.80 | % |
| Class Service | | | 1.05 | |
The expense ratios reflect voluntary waivers and/or reimbursements of expenses by the Fund’s Manager. Some of these undertakings may be modified or terminated at any time, as indicated in the Fund’s prospectus. The “Financial Highlights” tables in the Fund’s financial statements, included in this report, also show the gross expense ratios, without such waivers or reimbursements and reduction to custodian expenses, if applicable.
| | | | |
| 6 | | | | OPPENHEIMER CAPITAL APPRECIATION FUND/VA |
STATEMENT OF INVESTMENTS December 31, 2012
| | | | | | | | |
| | | Shares | | | Value | |
| Common Stocks—98.2% | | | | | | | | |
| Consumer Discretionary—14.9% | |
| Auto Components—0.9% | | | | | | | | |
| Johnson Controls, Inc. | | | 288,870 | | | $ | 8,868,309 | |
| Hotels, Restaurants & Leisure—3.2% | |
| McDonald’s Corp. | | | 224,160 | | | | 19,773,154 | |
| Yum! Brands, Inc. | | | 157,470 | | | | 10,456,008 | |
| | | | | | |
|
|
|
| | | | | | | | 30,229,162 | |
| Internet & Catalog Retail—1.4% | |
| Amazon.com, Inc.1 | | | 51,214 | | | | 12,861,884 | |
| Media—2.0% | | | | | | | | |
| Walt Disney Co. (The) | | | 368,580 | | | | 18,351,598 | |
| Specialty Retail—3.9% | | | | | | | | |
| O’Reilly Automotive, Inc.1 | | | 169,160 | | | | 15,126,287 | |
| Tiffany & Co. | | | 131,920 | | | | 7,564,293 | |
| TJX Cos., Inc. (The) | | | 327,010 | | | | 13,881,574 | |
| | | | | | |
|
|
|
| | | | | | | | 36,572,154 | |
| Textiles, Apparel & Luxury Goods—3.5% | |
| Coach, Inc. | | | 198,140 | | | | 10,998,751 | |
| Nike, Inc., Cl. B | | | 269,260 | | | | 13,893,816 | |
| Ralph Lauren Corp., Cl. A | | | 53,270 | | | | 7,986,238 | |
| | | | | | |
|
|
|
| | | | | | | | 32,878,805 | |
| Consumer Staples—12.4% | | | | | | | | |
| Beverages—4.4% | | | | | | | | |
| Brown-Forman Corp., Cl. B | | | 172,735 | | | | 10,925,489 | |
| Coca-Cola Co. (The) | | | 417,480 | | | | 15,133,650 | |
| SABMiller plc | | | 323,730 | | | | 15,237,351 | |
| | | | | | |
|
|
|
| | | | | | | | 41,296,490 | |
| Food & Staples Retailing—2.0% | |
| Costco Wholesale Corp. | | | 189,940 | | | | 18,760,374 | |
| Food Products—2.5% | |
| Mead Johnson Nutrition Co., Cl. A | | | 136,810 | | | | 9,014,411 | |
| Nestle SA | | | 221,324 | | | | 14,421,812 | |
| | | | | | |
|
|
|
| | | | | | | | 23,436,223 | |
| Household Products—1.3% | |
| Colgate-Palmolive Co. | | | 119,070 | | | | 12,447,578 | |
| Personal Products—1.1% | |
| Estee Lauder Cos., Inc. (The), Cl. A | | | 170,720 | | | | 10,219,299 | |
| Tobacco—1.1% | |
| Philip Morris International, Inc. | | | 124,170 | | | | 10,385,579 | |
| Energy—10.0% | |
| Energy Equipment & Services—6.5% | |
| Cameron International Corp.1 | | | 230,080 | | | | 12,990,317 | |
| Ensco plc, Cl. A | | | 220,810 | | | | 13,089,617 | |
| National Oilwell Varco, Inc. | | | 200,990 | | | | 13,737,666 | |
| Oceaneering International, Inc. | | | 77,520 | | | | 4,169,801 | |
| Schlumberger Ltd. | | | 246,280 | | | | 17,064,741 | |
| | | | | | |
|
|
|
| | | | | | | | 61,052,142 | |
| Oil, Gas & Consumable Fuels—3.5% | |
| Chevron Corp. | | | 97,550 | | | | 10,549,057 | |
| Concho Resources, Inc.1 | | | 48,720 | | | | 3,924,883 | |
| Noble Energy, Inc. | | | 124,250 | | | | 12,641,195 | |
| Phillips 66 | | | 129,040 | | | | 6,852,024 | |
| | | | | | |
|
|
|
| | | | | | | | 33,967,159 | |
| Financials—2.1% | |
| Capital Markets—0.2% | |
| Northern Trust Corp. | | | 28,700 | | | | 1,439,592 | |
| Commercial Banks—0.8% | |
| Standard Chartered plc | | | 301,926 | | | | 7,653,422 | |
| Consumer Finance—1.1% | |
| American Express Co. | | | 180,010 | | | | 10,346,975 | |
| Health Care—12.5% | |
| Biotechnology—2.4% | |
| Alexion Pharmaceuticals, Inc.1 | | | 65,120 | | | | 6,108,907 | |
| Biogen Idec, Inc.1 | | | 24,960 | | | | 3,660,883 | |
| Vertex Pharmaceuticals, Inc.1 | | | 296,630 | | | | 12,440,662 | |
| | | | | | |
|
|
|
| | | | | | | | 22,210,452 | |
| Health Care Equipment & Supplies—1.1% | |
| Baxter International, Inc. | | | 156,370 | | | | 10,423,624 | |
| Health Care Technology—1.0% | |
| Cerner Corp.1 | | | 118,860 | | | | 9,228,290 | |
| | | | | | | | |
| | | Shares | | | Value | |
| Life Sciences Tools & Services—0.9% | |
| Mettler-Toledo International, Inc.1 | | | 45,270 | | | $ | 8,750,691 | |
| Pharmaceuticals—7.1% | |
| Allergan, Inc. | | | 182,990 | | | | 16,785,673 | |
| Bristol-Myers Squibb Co. | | | 392,390 | | | | 12,787,990 | |
| Novo Nordisk AS, Cl. B | | | 105,556 | | | | 17,239,389 | |
| Perrigo Co. | | | 76,220 | | | | 7,929,167 | |
| Roche Holding AG | | | 60,926 | | | | 12,412,143 | |
| | | | | | |
|
|
|
| | | | | | | | 67,154,362 | |
| Industrials—12.9% | |
| Aerospace & Defense—4.0% | |
| Honeywell International, Inc. | | | 75,780 | | | | 4,809,757 | |
| Precision Castparts Corp. | | | 75,980 | | | | 14,392,132 | |
| TransDigm Group, Inc. | | | 55,580 | | | | 7,578,889 | |
| United Technologies Corp. | | | 137,360 | | | | 11,264,894 | |
| | | | | | |
|
|
|
| | | | | | | | 38,045,672 | |
| Electrical Equipment—1.7% | |
| AMETEK, Inc. | | | 63,220 | | | | 2,375,175 | |
| Eaton Corp. plc | | | 146,650 | | | | 7,948,430 | |
| Roper Industries, Inc. | | | 47,160 | | | | 5,257,397 | |
| | | | | | |
|
|
|
| | | | | | | | 15,581,002 | |
| Machinery—3.2% | |
| Cummins, Inc. | | | 95,520 | | | | 10,349,592 | |
| Joy Global, Inc. | | | 148,427 | | | | 9,466,674 | |
| Parker Hannifin Corp. | | | 119,570 | | | | 10,170,624 | |
| | | | | | |
|
|
|
| | | | | | | | 29,986,890 | |
| Road & Rail—3.4% | |
| J.B. Hunt Transport Services, Inc. | | | 118,710 | | | | 7,088,174 | |
| Kansas City Southern | | | 122,070 | | | | 10,190,404 | |
| Union Pacific Corp. | | | 115,330 | | | | 14,499,288 | |
| | | | | | |
|
|
|
| | | | | | | | 31,777,866 | |
| Trading Companies & Distributors—0.6% | |
| W.W. Grainger, Inc. | | | 27,270 | | | | 5,518,630 | |
| Information Technology—28.2% | |
| Communications Equipment—4.1% | |
| QUALCOMM, Inc. | | | 617,890 | | | | 38,321,538 | |
| Computers & Peripherals—7.9% | |
| Apple, Inc. | | | 131,380 | | | | 70,029,481 | |
| SanDisk Corp.1 | | | 109,010 | | | | 4,748,476 | |
| | | | | | |
|
|
|
| | | | | | | | 74,777,957 | |
| Electronic Equipment, Instruments, & Components—0.9% | |
| Corning, Inc. | | | 663,490 | | | | 8,373,244 | |
| Internet Software & Services—5.0% | | | | | | | | |
| eBay, Inc.1 | | | 328,530 | | | | 16,761,601 | |
| Google, Inc., Cl. A1 | | | 42,850 | | | | 30,396,504 | |
| | | | | | |
|
|
|
| | | | | | | | 47,158,105 | |
| IT Services—3.7% | |
| Fiserv, Inc.1 | | | 92,030 | | | | 7,273,131 | |
| Teradata Corp.1 | | | 214,240 | | | | 13,259,314 | |
| Visa, Inc., Cl. A | | | 93,187 | | | | 14,125,285 | |
| | | | | | |
|
|
|
| | | | | | | | 34,657,730 | |
| Semiconductors & Semiconductor Equipment—2.8% | |
| Avago Technologies Ltd. | | | 240,420 | | | | 7,611,697 | |
| Broadcom Corp., Cl. A | | | 332,400 | | | | 11,039,004 | |
| Texas Instruments, Inc. | | | 227,960 | | | | 7,053,082 | |
| | | | | | |
|
|
|
| | | | | | | | 25,703,783 | |
| Software—3.8% | |
| Intuit, Inc. | | | 180,950 | | | | 10,766,525 | |
| Salesforce.com, Inc.1 | | | 90,050 | | | | 15,137,405 | |
| VMware, Inc., Cl. A1 | | | 107,320 | | | | 10,103,105 | |
| | | | | | |
|
|
|
| | | | | | | | 36,007,035 | |
| Materials—5.2% | |
| Chemicals—4.9% | |
| Ecolab, Inc. | | | 176,320 | | | | 12,677,408 | |
| Monsanto Co. | | | 187,850 | | | | 17,780,002 | |
| PPG Industries, Inc. | | | 83,540 | | | | 11,307,139 | |
| Praxair, Inc. | | | 42,342 | | | | 4,634,332 | |
| | | | | | |
|
|
|
| | | | | | | | 46,398,881 | |
| | | | |
| 7 | | | | OPPENHEIMER CAPITAL APPRECIATION FUND/VA |
STATEMENT OF INVESTMENTS Continued
| | | | | | | | |
| | | Shares | | | Value | |
| | | | | | | | | |
| Containers & Packaging—0.3% | | | | | |
| Crown Holdings, Inc.1 | | | 76,200 | | | $ | 2,804,922 | |
| Total Common Stocks (Cost $628,117,884) | | | | | | | 923,647,419 | |
| Investment Company—1.2% | |
| Oppenheimer Institutional Money Market Fund, Cl. E, 0.15%2,3 | | | | | | | | |
| (Cost $11,345,499) | | | 11,345,499 | | | | 11,345,499 | |
Total Investments, at Value
(Cost $639,463,383) | | | 99.4 | % | | | 934,992,918 | |
| Assets in Excess of Other Liabilities | |
| 0.6
|
| |
| 5,355,099
|
|
| Net Assets | |
| 100.0
| %
| | $
| 940,348,017
|
|
Footnotes to Statement of Investments
1. Non-income producing security.
2. Rate shown is the 7-day yield as of December 31, 2012.
3. Is or was an affiliate, as defined in the Investment Company Act of 1940, at or during the period ended December 31, 2012, by virtue of the Fund owning at least 5% of the voting securities of the issuer or as a result of the Fund and the issuer having the same investment adviser. Transactions during the period in which the issuer was an affiliate are as follows:
| | | | | | | | | | | | | | | | |
| | | Shares
December 30, 2011a | | | Gross
Additions | | | Gross
Reductions | | | Shares
December 31, 2012 | |
Oppenheimer Institutional Money Market
Fund, Cl. E | | | 8,136,365 | | | | 146,820,862 | | | | 143,611,728 | | | | 11,345,499 | |
| | | | |
| | | | | | | | | Value | | | Income | |
Oppenheimer Institutional Money Market
Fund, Cl. E | | | | | | | | | | $ | 11,345,499 | | | $ | 10,570 | |
a. December 30, 2011 represents the last business day for the Fund’s 2011 fiscal year. See Note 1 of the accompanying Notes.
See accompanying Notes to Financial Statements.
| | | | |
| 8 | | | | OPPENHEIMER CAPITAL APPRECIATION FUND/VA |
STATEMENT OF ASSETS AND LIABILITIES
| | | | |
| December 31, 2012 | | | |
| Assets | | | | |
| Investments, at value—see accompanying statement of investments: | | | | |
| Unaffiliated companies (cost $628,117,884) | | $ | 923,647,419 | |
| Affiliated companies (cost $11,345,499) | |
| 11,345,499
|
|
| | | | 934,992,918 | |
| Cash | | | 6,000 | |
| Receivables and other assets: | | | | |
| Shares of beneficial interest sold | | | 5,408,949 | |
| Dividends | | | 637,794 | |
| Other | |
| 52,081
|
|
| Total assets | | | 941,097,742 | |
| Liabilities | | | |
| Payables and other liabilities: | | | | |
| Shares of beneficial interest redeemed | | | 428,334 | |
| Transfer and shareholder servicing agent fees | | | 81,946 | |
| Distribution and service plan fees | | | 74,790 | |
| Shareholder communications | | | 69,909 | |
| Trustees’ compensation | | | 50,124 | |
| Legal, auditing and other professional fees | | | 38,402 | |
| Other | |
| 6,220
|
|
| Total liabilities | | | 749,725 | |
| Net Assets | | $
| 940,348,017
|
|
| Composition of Net Assets | | | |
| Par value of shares of beneficial interest | | $ | 20,942 | |
| Additional paid-in capital | | | 838,216,465 | |
| Accumulated net investment income | | | 7,239,493 | |
| Accumulated net realized loss on investments and foreign currency transactions | | | (200,674,766 | ) |
| Net unrealized appreciation on investments and translation of assets and liabilities denominated in foreign currencies | |
| 295,545,883
|
|
| Net Assets | | $
| 940,348,017
|
|
| Net Asset Value Per Share | | | | |
| Non-Service Shares: | | | | |
| Net asset value, redemption price per share and offering price per share (based on net assets of $573,684,032 and 12,732,316 shares of beneficial interest outstanding) | | | $45.06 | |
| Service Shares: | | | | |
| Net asset value, redemption price per share and offering price per share (based on net assets of $366,663,985 and 8,209,628 shares of beneficial interest outstanding) | | | $44.66 | |
See accompanying Notes to Financial Statements.
| | | | |
| 9 | | | | OPPENHEIMER CAPITAL APPRECIATION FUND/VA |
STATEMENT OF OPERATIONS
| | | | |
| For the Year Ended December 31, 2012 | | | |
| Investment Income | | | |
| Dividends: | | | | |
| Unaffiliated companies (net of foreign withholding taxes of $229,184) | | $ | 17,224,327 | |
| Affiliated companies | | | 10,570 | |
| Interest | |
| 456
|
|
| Total investment income | | | 17,235,353 | |
| Expenses | | | |
| Management fees | | | 6,753,708 | |
| Distribution and service plan fees—Service shares | | | 959,337 | |
| Transfer and shareholder servicing agent fees: | | | | |
| Non-Service shares | | | 601,887 | |
| Service shares | | | 383,338 | |
| Shareholder communications: | | | | |
| Non-Service shares | | | 37,691 | |
| Service shares | | | 23,707 | |
| Custodian fees and expenses | | | 23,966 | |
| Trustees’ compensation | | | 58,058 | |
| Administration service fees | | | 1,500 | |
| Other | |
| 98,134
|
|
| Total expenses | | | 8,941,326 | |
| Less waivers and reimbursements of expenses | |
| (146,459
| )
|
| Net expenses | | | 8,794,867 | |
| Net Investment Income | | | 8,440,486 | |
| Realized and Unrealized Gain | | | |
| Net realized gain on: | | | | |
| Investments from unaffiliated companies | | | 97,129,580 | |
| Foreign currency transactions | |
| 983,328
|
|
| Total net realized gain | | | 98,112,908 | |
| Net change in unrealized appreciation/depreciation on: | | | | |
| Investments | | | 27,340,044 | |
| Translation of assets and liabilities denominated in foreign currencies | |
| 820,831
|
|
| Total net change in unrealized appreciation/depreciation | | | 28,160,875 | |
| Net Increase in Net Assets Resulting from Operations | | $
| 134,714,269
|
|
See accompanying Notes to Financial Statements.
| | | | |
| 10 | | | | OPPENHEIMER CAPITAL APPRECIATION FUND/VA |
STATEMENT OF CHANGES IN NET ASSETS
| | | | | | | | |
| | | Year Ended
December 31,
2012 | | | Year Ended
December 30,
20111 | |
| Operations | | | | | | |
| Net investment income | | $ | 8,440,486 | | | $ | 5,322,690 | |
| Net realized gain | | | 98,112,908 | | | | 59,047,435 | |
| Net change in unrealized appreciation/depreciation | |
| 28,160,875
|
| |
| (73,931,651
| )
|
| Net increase (decrease) in net assets resulting from operations | | | 134,714,269 | | | | (9,561,526 | ) |
| Dividends and/or Distributions to Shareholders | | | | | | |
| Dividends from net investment income: | | | | | | | | |
| Non-Service shares | | | (3,878,051 | ) | | | (2,685,368 | ) |
| Service shares | |
| (1,503,957
| )
| |
| (448,818
| )
|
| | | | (5,382,008 | ) | | | (3,134,186 | ) |
| Beneficial Interest Transactions | | | | | | | | |
| Net decrease in net assets resulting from beneficial interest transactions: | | | | | | | | |
| Non-Service shares | | | (144,652,286 | ) | | | (125,913,455 | ) |
| Service shares | |
| (57,530,166
| )
| |
| (43,268,026
| )
|
| | | | (202,182,452 | ) | | | (169,181,481 | ) |
| Net Assets | | | | | | | | |
| Total decrease | | | (72,850,191 | ) | | | (181,877,193 | ) |
| Beginning of period | |
| 1,013,198,208
|
| |
| 1,195,075,401
|
|
| End of period (including accumulated net investment income of $7,239,493 and $3,993,822, respectively) | | $
| 940,348,017
|
| | $
| 1,013,198,208
|
|
1. December 30, 2011 represents the last business day of the Fund’s 2011 fiscal year. See Note 1 of the accompanying Notes.
See accompanying Notes to Financial Statements.
| | | | |
| 11 | | | | OPPENHEIMER CAPITAL APPRECIATION FUND/VA |
FINANCIAL HIGHLIGHTS
| | | | | | | | | | | | | | | | | | | | |
| Non-Service Shares | | Year Ended
December 31, 2012 | | | Year Ended
December 30,
20111 | | | Year Ended
December 31,
2010 | | | Year Ended
December 31,
2009 | | | Year Ended
December 31,
2008 | |
| Per Share Operating Data | | | | | | | | | | | | | | | |
| Net asset value, beginning of period | | $ | 39.75 | | | $ | 40.35 | | | $ | 36.94 | | | $ | 25.67 | | | $ | 47.18 | |
| Income (loss) from investment operations: | | | | | | | | | | | | | | | | | | | | |
| Net investment income2 | | | .42 | | | | .23 | | | | .11 | | | | .09 | | | | .10 | |
| Net realized and unrealized gain (loss) | |
| 5.18
|
| |
| (.69
| )
| |
| 3.36
|
| |
| 11.27
|
| |
| (21.55
| )
|
| Total from investment operations | | | 5 .60 | | | | (.46 | ) | | | 3.47 | | | | 11.36 | | | | (21.45 | ) |
| Dividends and/or distributions to shareholders: | | | | | | | | | | | | | | | | | | | | |
| Dividends from net investment income | | | (.29 | ) | | | (.14 | ) | | | (.06 | ) | | | (.09 | ) | | | (.06 | ) |
| Net asset value, end of period | | $
| 45.06
|
| | $
| 39.75
|
| | $
| 40.35
|
| | $
| 36.94
|
| | $
| 25.67
|
|
| Total Return, at Net Asset Value3 | | | 14.12 | % | | | (1.15 | )% | | | 9.42 | % | | | 44.52 | % | | | (45.52 | )% |
| | | | | | | | | | | | | | | | | | | | | |
| Ratios/Supplemental Data | | | | | | | | | | | | | | | |
| Net assets, end of period (in thousands) | | $ | 573,684 | | | $ | 637,868 | | | $ | 771,086 | | | $ | 1,074,190 | | | $ | 829,931 | |
| Average net assets (in thousands) | | $ | 600,121 | | | $ | 713,770 | | | $ | 976,242 | | | $ | 927,670 | | | $ | 1,256,525 | |
| Ratios to average net assets:4 | | | | | | | | | | | | | | | | | | | | |
| Net investment income | | | 0.95 | % | | | 0.57 | % | | | 0.31 | % | | | 0.29 | % | | | 0.25 | % |
| Total expenses5 | | | 0.81 | % | | | 0.80 | % | | | 0.79 | % | | | 0.78 | % | | | 0.66 | % |
Expenses after payments, waivers and/or
reimbursements and reduction to custodian expenses | | | 0.80 | % | | | 0.80 | % | | | 0.79 | % | | | 0.78 | % | | | 0.66 | % |
| Portfolio turnover rate | | | 28 | % | | | 27 | % | | | 58 | % | | | 46 | % | | | 67 | % |
1. December 30, 2011 represents the last business day of the Fund’s 2011 fiscal year. See Note 1 of the accompanying Notes.
2. Per share amounts calculated based on the average shares outstanding during the period.
3. Assumes an initial investment on the business day before the first day of the fiscal period, with all dividends and distributions reinvested in additional shares on the reinvestment date, and redemption at the net asset value calculated on the last business day of the fiscal period. Total returns are not annualized for periods less than one full year. Total return information does not reflect expenses that apply at the separate account level or to related insurance products. Inclusion of these charges would reduce the total return figures for all periods shown. Returns do not reflect the deduction of taxes that a shareholder would pay on fund distributions or the redemption of fund shares.
4. Annualized for periods less than one full year.
5. Total expenses including indirect expenses from affiliated fund were as follows:
| | | | |
| Year Ended December 31, 2012 | | | 0.81 | % |
| Year Ended December 30, 2011 | | | 0.80 | % |
| Year Ended December 31, 2010 | | | 0.79 | % |
| Year Ended December 31, 2009 | | | 0.78 | % |
| Year Ended December 31, 2008 | | | 0.66 | % |
See accompanying Notes to Financial Statements.
| | | | |
| 12 | | | | OPPENHEIMER CAPITAL APPRECIATION FUND/VA |
| | | | | | | | | | | | | | | | | | | | |
| Service Shares | | Year Ended
December 31,
2012 | | | Year Ended
December 30,
20111 | | | Year Ended
December 31,
2010 | | | Year Ended
December 31,
2009 | | | Year Ended
December 31,
2008 | |
| Per Share Operating Data | | | | | | | | | | | | | | | | | | | | |
| Net asset value, beginning of period | | $ | 39.40 | | | $ | 39.99 | | | $ | 36.64 | | | $ | 25.42 | | | $ | 46.78 | |
| Income (loss) from investment operations: | | | | | | | | | | | | | | | | | | | | |
| Net investment income2 | | | 0 .31 | | | | 0 .13 | | | | 0 .02 | | | | 0 .01 | | | | 0.003 | |
| Net realized and unrealized gain (loss) | |
| 5 .12
|
| |
| (0 .68
| )
| |
| 3 .33
|
| |
| 11 .21
|
| |
| (21.36
| )
|
| Total from investment operations | | | 5 .43 | | | | (0 .55 | ) | | | 3 .35 | | | | 11 .22 | | | | (21.36 | ) |
| Dividends and/or distributions to shareholders: | | | | | | | | | | | | | | | | | | | | |
| Dividends from net investment income | | | (0 .17 | ) | | | (0 .04 | ) | | | 0 .00 | | | | 0 .003 | | | | 0 .00 | |
| Net asset value, end of period | | $
| 44.66
|
| | $
| 39.40
|
| | $
| 39.99
|
| | $
| 36.64
|
| | $
| 25.42
|
|
| Total Return, at Net Asset Value4 | | | 13.81 | % | | | (1.37 | )% | | | 9 .15 | % | | | 44.15 | % | | | (45.66 | )% |
| | | | | | | | | | | | | | | | | | | | | |
| Ratios/Supplemental Data | | | | | | | | | | | | | | | | | | | | |
| Net assets, end of period (in thousands) | | $ | 366,664 | | | $ | 375,330 | | | $ | 423,989 | | | $ | 444,170 | | | $ | 313,931 | |
| Average net assets (in thousands) | | $ | 382,196 | | | $ | 407,413 | | | $ | 427,640 | | | $ | 368,634 | | | $ | 454,558 | |
| Ratios to average net assets:5 | | | | | | | | | | | | | | | | | | | | |
| Net investment income | | | 0.71 | % | | | 0 .32 | % | | | 0 .06 | % | | | 0 .03 | % | | | 0.00 | %6 |
| Total expenses7 | | | 1 .06 | % | | | 1 .05 | % | | | 1 .04 | % | | | 1 .04 | % | | | 0.91 | % |
Expenses after payments, waivers and/or
reimbursements and reduction to custodian expenses | | | 1 .05 | % | | | 1 .05 | % | | | 1 .04 | % | | | 1 .03 | % | | | 0.91 | % |
| Portfolio turnover rate | | | 28 | % | | | 27 | % | | | 58 | % | | | 46 | % | | | 67 | % |
1. December 30, 2011 represents the last business day of the Fund’s 2011 fiscal year. See Note 1 of the accompanying Notes.
2. Per share amounts calculated based on the average shares outstanding during the period.
3. Less than $0.005 per share.
4. Assumes an initial investment on the business day before the first day of the fiscal period, with all dividends and distributions reinvested in additional shares on the reinvestment date, and redemption at the net asset value calculated on the last business day of the fiscal period. Total returns are not annualized for periods less than one full year. Total return information does not reflect expenses that apply at the separate account level or to related insurance products. Inclusion of these charges would reduce the total return figures for all periods shown. Returns do not reflect the deduction of taxes that a shareholder would pay on fund distributions or the redemption of fund shares.
5. Annualized for periods less than one full year.
6. Less than 0.005%.
7. Total expenses including indirect expenses from affiliated fund were as follows:
| | | | |
| Year Ended December 31, 2012 | | | 1.06 | % |
| Year Ended December 30, 2011 | | | 1.05 | % |
| Year Ended December 31, 2010 | | | 1.04 | % |
| Year Ended December 31, 2009 | | | 1.04 | % |
| Year Ended December 31, 2008 | | | 0.91 | % |
See accompanying Notes to Financial Statements.
| | | | |
| 13 | | | | OPPENHEIMER CAPITAL APPRECIATION FUND/VA |
NOTES TO FINANCIAL STATEMENTS
1. Significant Accounting Policies
Oppenheimer Capital Appreciation Fund/VA (the “Fund”) is a separate series of Oppenheimer Variable Account Funds, an open-end management investment company registered under the Investment Company Act of 1940, as amended. The Fund’s investment objective is to seek capital appreciation by investing in securities of well-known, established companies. The Fund’s investment adviser is OppenheimerFunds, Inc. (the “Manager”).
The Fund offers two classes of shares. Both classes are sold at their offering price, which is the net asset value per share, to separate investment accounts of participating insurance companies as an underlying investment for variable life insurance policies, variable annuity contracts or other investment products. The class of shares designated as Service shares is subject to a distribution and service plan. Both classes of shares have identical rights and voting privileges with respect to the Fund in general and exclusive voting rights on matters that affect that class alone. Earnings, net assets and net asset value per share may differ due to each class having its own expenses, such as transfer and shareholder servicing agent fees and shareholder communications, directly attributable to that class.
The following is a summary of significant accounting policies consistently followed by the Fund.
Previous Annual Period. The last day of the Fund’s fiscal year was the last day the New York Stock Exchange was open for trading. The Fund’s financial statements have been presented through that date to maintain consistency with the Fund’s net asset value calculations used for shareholder transactions.
Investment in Oppenheimer Institutional Money Market Fund. The Fund is permitted to invest daily available cash balances in an affiliated money market fund. The Fund may invest the available cash in Class E shares of Oppenheimer Institutional Money Market Fund (“IMMF”) to seek current income while preserving liquidity. IMMF is a registered open-end management investment company, regulated as a money market fund under the Investment Company Act of 1940, as amended. The Manager is also the investment adviser of IMMF. When applicable, the Fund’s investment in IMMF is included in the Statement of Investments. Shares of IMMF are valued at their net asset value per share. As a shareholder, the Fund is subject to its proportional share of IMMF’s Class E expenses, including its management fee. The Manager will waive fees and/or reimburse Fund expenses in an amount equal to the indirect management fees incurred through the Fund’s investment in IMMF.
Foreign Currency Translation. The Fund’s accounting records are maintained in U.S. dollars. The values of securities denominated in foreign currencies and amounts related to the purchase and sale of foreign securities and foreign investment income are translated into U.S. dollars as of the close of the Exchange, normally 4:00 P.M. Eastern time, on each day the Exchange is open for trading. Foreign exchange rates may be valued primarily using a reliable bank, dealer or service authorized by the Board of Trustees.
Reported net realized gains and losses from foreign currency transactions arise from sales of portfolio securities, sales and maturities of short-term securities, sales of foreign currencies, exchange rate fluctuations between the trade and settlement dates on securities transactions, and the difference between the amounts of dividends, interest, and foreign withholding taxes recorded on the Fund’s books and the U.S. dollar equivalent of the amounts actually received or paid. Net unrealized appreciation and depreciation on the translation of assets and liabilities denominated in foreign currencies arise from changes in the values of assets and liabilities, including investments in securities at fiscal period end, resulting from changes in exchange rates.
The effect of changes in foreign currency exchange rates on investments is separately identified from the fluctuations arising from changes in market values of securities held and reported with all other foreign currency gains and losses in the Fund’s Statement of Operations.
Allocation of Income, Expenses, Gains and Losses. Income, expenses (other than those attributable to a specific class), gains and losses are allocated on a daily basis to each class of shares based upon the relative proportion of net assets represented by such class. Operating expenses directly attributable to a specific class are charged against the operations of that class.
Federal Taxes. The Fund intends to comply with provisions of the Internal Revenue Code applicable to regulated investment companies and to distribute substantially all of its investment company taxable income, including any net realized gain on investments not offset by capital loss carryforwards, if any, to shareholders. Therefore, no federal income or excise tax provision is required. The Fund files income tax returns in U.S. federal and applicable state jurisdictions. The statute of limitations on the Fund’s tax return filings generally remain open for the three preceding fiscal reporting period ends.
The tax components of capital shown in the following table represent distribution requirements the Fund must satisfy under the income tax regulations, losses the Fund may be able to offset against income and gains realized in future years and unrealized appreciation or depreciation of securities and other investments for federal income tax purposes.
| | | | | | | | | | | | |
Undistributed
Net Investment
Income | | Undistributed
Long-Term
Gain | | | Accumulated
Loss
Carryforward1,2,3,4 | | | Net Unrealized
Appreciation
Based on cost of
Securities and
Other Investments
for Federal Income
Tax Purposes | |
$8,611,856 | | $ | — | | | $ | 197,991,210 | | | $ | 292,722,690 | |
1. As of December 31, 2012, the Fund had $197,794,392 of net capital loss carryforwards available to offset future realized capital gains, if any, and thereby reduce future taxable gain distributions. Details of the capital loss carryforwards are included in the table below. Capital loss carryovers with no expiration, if any, must be utilized prior to those with expiration dates.
| | | | |
| 14 | | | | OPPENHEIMER CAPITAL APPRECIATION FUND/VA |
| | | | |
| Expiring | | | |
| 2016 | | $ | 17,161,220 | |
| 2017 | | | 180,633,172 | |
| | |
|
|
|
| Total | | $ | 197,794,392 | |
| | |
|
|
|
2. As of December 31, 2012, the Fund had $196,818 of post-October losses available to offset future realized capital gains, if any.
3. During the fiscal year ended December 31, 2012, the Fund utilized $92,201,391 of capital loss carryforward to offset capital gains realized in that fiscal year.
4. During the fiscal year ended December 30, 2011, the Fund utilized $62,322,990 of capital loss carryforward to offset capital gains realized in that fiscal year.
Net investment income (loss) and net realized gain (loss) may differ for financial statement and tax purposes. The character of dividends and distributions made during the fiscal year from net investment income or net realized gains may differ from their ultimate characterization for federal income tax purposes. Also, due to timing of dividends and distributions, the fiscal year in which amounts are distributed may differ from the fiscal year in which the income or net realized gain was recorded by the Fund.
Accordingly, the following amounts have been reclassified for December 31, 2012. Net assets of the Fund were unaffected by the reclassifications.
| | | | |
Increase to
Accumulated
Net Investment
Income | | Increase to
Accumulated Net Realized Loss
on Investments | |
| $187,193 | | $ | 187,193 | |
The tax character of distributions paid during the years ended December 31, 2012 and December 31, 2011 was as follows:
| | | | | | | | |
| | | Year Ended
December 31, 2012 | | | Year Ended
December 31, 2011 | |
Distributions paid from: | | | | | | | | |
| Ordinary income | | $ | 5,382,008 | | | $ | 3,134,186 | |
The aggregate cost of securities and other investments and the composition of unrealized appreciation and depreciation of securities and other investments for federal income tax purposes as of December 31, 2012 are noted in the following table. The primary difference between book and tax appreciation or depreciation of securities and other investments, if applicable, is attributable to the tax deferral of losses or tax realization of financial statement unrealized gain or loss.
| | | | |
| Federal tax cost of securities | | $ | 642,286,576 | |
| | |
|
|
|
| Gross unrealized appreciation | | $ | 302,720,369 | |
| Gross unrealized depreciation | | | (9,997,679) | |
| | |
|
|
|
| Net unrealized appreciation | | $ | 292,722,690 | |
| | |
|
|
|
Trustees’ Compensation. The Board of Trustees has adopted a compensation deferral plan for independent trustees that enables trustees to elect to defer receipt of all or a portion of the annual compensation they are entitled to receive from the Fund. For purposes of determining the amount owed to the Trustee under the plan, deferred amounts are treated as though equal dollar amounts had been invested in shares of the Fund or in other Oppenheimer funds selected by the Trustee. The Fund purchases shares of the funds selected for deferral by the Trustee in amounts equal to his or her deemed investment, resulting in a Fund asset equal to the deferred compensation liability. Such assets are included as a component of “Other” within the asset section of the Statement of Assets and Liabilities. Deferral of trustees’ fees under the plan will not affect the net assets of the Fund, and will not materially affect the Fund’s assets, liabilities or net investment income per share. Amounts will be deferred until distributed in accordance with the compensation deferral plan.
Dividends and Distributions to Shareholders. Dividends and distributions to shareholders, which are determined in accordance with income tax regulations and may differ from U.S. generally accepted accounting principles, are recorded on the ex-dividend date. Income and capital gain distributions, if any, are declared and paid annually or at other times as deemed necessary by the Manager.
Investment Income. Dividend income is recorded on the ex-dividend date or upon ex-dividend notification in the case of certain foreign dividends where the ex-dividend date may have passed. Non-cash dividends included in dividend income, if any, are recorded at the fair market value of the securities received. Interest income is recognized on an accrual basis. Discount and premium, which are included in interest income on the Statement of Operations, are amortized or accreted daily.
Custodian Fees. “Custodian fees and expenses” in the Statement of Operations may include interest expense incurred by the Fund on any cash overdrafts of its custodian account during the period. Such cash overdrafts may result from the effects of failed trades in portfolio securities and from cash outflows resulting from unanticipated shareholder redemption activity. The Fund pays interest to its custodian on such cash overdrafts, to the extent they are not offset by positive cash balances maintained by the Fund, at a rate equal to the Federal Funds Rate plus 0.50%. The “Reduction to custodian expenses” line item, if applicable, represents earnings on cash balances maintained by the Fund during the period. Such interest expense and other custodian fees may be paid with these earnings.
| | | | |
| 15 | | | | OPPENHEIMER CAPITAL APPRECIATION FUND/VA |
NOTES TO FINANCIAL STATEMENTS Continued
1. Significant Accounting Policies Continued
Security Transactions. Security transactions are recorded on the trade date. Realized gains and losses on securities sold are determined on the basis of identified cost.
Indemnifications. The Fund’s organizational documents provide current and former trustees and officers with a limited indemnification against liabilities arising in connection with the performance of their duties to the Fund. In the normal course of business, the Fund may also enter into contracts that provide general indemnifications. The Fund’s maximum exposure under these arrangements is unknown as this would be dependent on future claims that may be made against the Fund. The risk of material loss from such claims is considered remote.
Other. The preparation of financial statements in conformity with accounting principles generally accepted in the United States of America requires management to make estimates and assumptions that affect the reported amounts of assets and liabilities and disclosure of contingent assets and liabilities at the date of the financial statements and the reported amounts of increases and decreases in net assets from operations during the reporting period. Actual results could differ from those estimates.
2. Securities Valuation
The Fund calculates the net asset value of its shares as of the close of the New York Stock Exchange (the “Exchange”), normally 4:00 P.M. Eastern time, on each day the Exchange is open for trading.
The Fund’s Board has adopted procedures for the valuation of the Fund’s securities and has delegated the day-to-day responsibility for valuation determinations under those procedures to the Manager. The Manager has established a Valuation Committee which is responsible for determining a “fair valuation” for any security for which market quotations are not “readily available.” The Valuation Committee’s fair valuation determinations are subject to review, approval and ratification by the Fund’s Board at its next regularly scheduled meeting covering the calendar quarter in which the fair valuation was determined.
Valuation Methods and Inputs
Securities are valued using unadjusted quoted market prices, when available, as supplied primarily by third party pricing services or dealers.
The following methodologies are used to determine the market value or the fair value of the types of securities described below:
Securities traded on a registered U.S. securities exchange (including exchange-traded derivatives other than futures and futures options) are valued based on the last sale price of the security reported on the principal exchange on which it is traded, prior to the time when the Fund’s assets are valued. In the absence of a sale, the security is valued at the last sale price on the prior trading day, if it is within the spread of the current day’s closing “bid” and “asked” prices, and if not, at the current day’s closing bid price. A security of a foreign issuer traded on a foreign exchange but not listed on a registered U.S. securities exchange is valued based on the last sale price on the principal exchange on which the security is traded, as identified by the third party pricing service used by the Manager, prior to the time when the Fund’s assets are valued. If the last sale price is unavailable, the security is valued at the most recent official closing price on the principal exchange on which it is traded. If the last sales price or official closing price for a foreign security is not available, the security is valued at the mean between the bid and asked price per the exchange or, if not available from the exchange, obtained from two dealers. If bid and asked prices are not available from either the exchange or two dealers, the security is valued by using one of the following methodologies (listed in order of priority); (1) using a bid from the exchange, (2) the mean between the bid and asked price as provided by a single dealer, or (3) a bid from a single dealer.
Shares of a registered investment company that are not traded on an exchange are valued at that investment company’s net asset value per share.
Corporate and government debt securities (of U.S. or foreign issuers) and municipal debt securities, event-linked bonds, loans, mortgage-backed securities, collateralized mortgage obligations, and asset-backed securities are valued at the mean between the “bid” and “asked” prices utilizing evaluated prices obtained from third party pricing services or broker-dealers who may use matrix pricing methods to determine the evaluated prices.
Short-term money market type debt securities with a remaining maturity of sixty days or less are valued at cost adjusted by the amortization of discount or premium to maturity (amortized cost), which approximates market value. Short-term debt securities with a remaining maturity in excess of sixty days are valued at the mean between the “bid” and “asked” prices utilizing evaluated prices obtained from third party pricing services or broker-dealers.
Forward foreign currency exchange contracts are valued utilizing current and forward currency rates obtained from third party pricing services. When the settlement date of a contract is an interim date for which a quotation is not available, interpolated values are derived using the nearest dated forward currency rate.
A description of the standard inputs that may generally be considered by the third party pricing vendors in determining their evaluated prices is provided below.
| | | | |
| 16 | | | | OPPENHEIMER CAPITAL APPRECIATION FUND/VA |
| | |
| Security Type | | Standard inputs generally considered by third-party pricing vendors |
| Corporate debt, government debt, municipal, mortgage-backed and asset-backed securities | | Reported trade data, broker-dealer price quotations, benchmark yields, issuer spreads on comparable securities, the credit quality, yield, maturity, and other appropriate factors. |
| Loans | | Information obtained from market participants regarding reported trade data and broker-dealer price quotations. |
| Event-linked bonds | | Information obtained from market participants regarding reported trade data and broker-dealer price quotations. |
If a market value or price cannot be determined for a security using the methodologies described above, or if, in the “good faith” opinion of the Manager, the market value or price obtained does not constitute a “readily available market quotation,” or a significant event has occurred that would materially affect the value of the security the security is fair valued either (i) by a standardized fair valuation methodology applicable to the security type or the significant event as previously approved by the Valuation Committee and the Fund’s Board or (ii) as determined in good faith by the Manager’s Valuation Committee. The Valuation Committee considers all relevant facts that are reasonably available, through either public information or information available to the Manager, when determining the fair value of a security. Fair value determinations by the Manager are subject to review, approval and ratification by the Fund’s Board at its next regularly scheduled meeting covering the calendar quarter in which the fair valuation was determined. Those fair valuation standardized methodologies include, but are not limited to, valuing securities at the last sale price or initially at cost and subsequently adjusting the value based on: changes in company specific fundamentals, changes in an appropriate securities index, or changes in the value of similar securities which may be further adjusted for any discounts related to security-specific resale restrictions. When possible, such methodologies use observable market inputs such as unadjusted quoted prices of similar securities, observable interest rates, currency rates and yield curves. The methodologies used for valuing securities are not necessarily an indication of the risks associated with investing in those securities nor can it be assured that the Fund can obtain the fair value assigned to a security if it were to sell the security.
To assess the continuing appropriateness of security valuations, the Manager, or its third party service provider who is subject to oversight by the Manager, regularly compares prior day prices, prices on comparable securities, and sale prices to the current day prices and challenges those prices exceeding certain tolerance levels with the third party pricing service or broker source. For those securities valued by fair valuations, whether through a standardized fair valuation methodology or a fair valuation determination, the Valuation Committee reviews and affirms the reasonableness of the valuations based on such methodologies and fair valuation determinations on a regular basis after considering all relevant information that is reasonably available.
Classifications
Each investment asset or liability of the Fund is assigned a level at measurement date based on the significance and source of the inputs to its valuation. Various data inputs are used in determining the value of each of the Fund’s investments as of the reporting period end. These data inputs are categorized in the following hierarchy under applicable financial accounting standards:
| | 1) | Level 1—unadjusted quoted prices in active markets for identical assets or liabilities (including securities actively traded on a securities exchange) |
| | 2) | Level 2—inputs other than unadjusted quoted prices that are observable for the asset or liability (such as unadjusted quoted prices for similar assets and market corroborated inputs such as interest rates, prepayment speeds, credit risks, etc.) |
| | 3) | Level 3—significant unobservable inputs (including the Manager’s own judgments about assumptions that market participants would use in pricing the asset or liability). |
The inputs used for valuing securities are not necessarily an indication of the risks associated with investing in those securities.
The table below categorizes amounts that are included in the Fund’s Statement of Assets and Liabilities as of December 31, 2012 based on valuation input level:
| | | | | | | | | | | | | | | | |
| | | Level 1—
Unadjusted
Quoted Prices | | | Level 2—
Other Significant
Observable Inputs | | | Level 3—
Significant
Unobservable
Inputs | | | Value | |
| Assets Table | | | | | | | | | | | | | | | | |
| Investments, at Value: | | | | | | | | | | | | | | | | |
| Common Stocks | | | | | | | | | | | | | | | | |
Consumer Discretionary | | $ | 139,761,912 | | | $ | — | | | $ | — | | | $ | 139,761,912 | |
Consumer Staples | | | 101,308,192 | | | | 15,237,351 | | | | — | | | | 116,545,543 | |
Energy | | | 95,019,301 | | | | — | | | | — | | | | 95,019,301 | |
Financials | | | 11,786,567 | | | | 7,653,422 | | | | — | | | | 19,439,989 | |
Health Care | | | 88,115,887 | | | | 29,651,532 | | | | — | | | | 117,767,419 | |
Industrials | | | 120,910,060 | | | | — | | | | — | | | | 120,910,060 | |
Information Technology | | | 264,999,392 | | | | — | | | | — | | | | 264,999,392 | |
Materials | | | 49,203,803 | | | | — | | | | — | | | | 49,203,803 | |
Investment Company | | | 11,345,499 | | | | — | | | | — | | | | 11,345,499 | |
Total Assets | | $ | 882,450,613 | | | $ | 52,542,305 | | | $ | — | | | $ | 934,992,918 | |
| | | | |
| 17 | | | | OPPENHEIMER CAPITAL APPRECIATION FUND/VA |
NOTES TO FINANCIAL STATEMENTS Continued
2. Securities Valuation (Continued)
Currency contracts and forwards, if any, are reported at their unrealized appreciation/ depreciation at measurement date, which represents the change in the contract’s value from trade date. Futures, if any, are reported at their variation margin at measurement date, which represents the amount due to/from the Fund at that date. All additional assets and liabilities included in the above table are reported at their market value at measurement date.
The table below shows the transfers between Level 1 and Level 2. The Fund’s policy is to recognize transfers in and transfers out as of the beginning of the reporting period.
| | | | | | | | |
| | | Transfers out of Level 1* | | | Transfers into
Level 2* | |
| Assets Table | | | | | | | | |
| Investments, at Value: | | | | | | | | |
| Common Stocks | | | | | | | | |
Health Care | | $ | (31,671,984 | ) | | | 31,671,984 | |
| | |
|
|
| |
|
|
|
| Total Assets | | $ | (31,671,984 | ) | | $ | 31,671,984 | |
| | |
|
|
| |
|
|
|
*Transferred from Level 1 to Level 2 because of the absence of a readily available unadjusted quoted market price due to a significant event occurring before the Fund’s assets were valued but after the close of the securities’ respective exchanges
There have been no significant changes to the fair valuation methodologies of the Fund during the period.
3. Shares of Beneficial Interest
The Fund has authorized an unlimited number of $0.001 par value shares of beneficial interest of each class. Transactions in shares of beneficial interest were as follows:
| | | | | | | | | | | | | | | | |
| | | Year Ended December 31, 2012 | | | Year Ended December 30, 2011 | |
| | | Shares | | | Amount | | | Shares | | | Amount | |
| Non-Service Shares | | | | | | | | | | | | | | | | |
| Sold | | | 816,576 | | | $ | 35,841,126 | | | | 1,249,985 | | | $ | 50,511,923 | |
| Dividends and/or distributions reinvested | | | 89,832 | | | | 3,878,051 | | | | 63,634 | | | | 2,685,368 | |
| Redeemed | | | (4,220,005 | ) | | | (184,371,463 | ) | | | (4,379,711 | ) | | | (179,110,746 | ) |
| | |
|
|
| |
|
|
| |
|
|
| |
|
|
|
| Net decrease | | | (3,313,597 | ) | | $ | (144,652,286 | ) | | | (3,066,092 | ) | | $ | (125,913,455 | ) |
| | |
|
|
| |
|
|
| |
|
|
| |
|
|
|
| | | | | | | | | | | | | |
| Service Shares | | | | | | | | | | | | | | | | |
| Sold | | | 333,716 | | | $ | 14,458,725 | | | | 696,209 | | | $ | 28,336,802 | |
| Dividends and/or distributions reinvested | | | 35,098 | | | | 1,503,957 | | | | 10,709 | | | | 448,818 | |
| Redeemed | | | (1,685,918 | ) | | | (73,492,848 | ) | | | (1,782,789 | ) | | | (72,053,646 | ) |
| | |
|
|
| |
|
|
| |
|
|
| |
|
|
|
| Net decrease | | | (1,317,104 | ) | | $ | (57,530,166 | ) | | | (1,075,871 | ) | | $ | (43,268,026 | ) |
| | |
|
|
| |
|
|
| |
|
|
| |
|
|
|
4. Purchases and Sales of Securities
The aggregate cost of purchases and proceeds from sales of securities, other than short-term obligations and investments in IMMF, for the year ended December 31, 2012, were as follows:
| | | | | | | | |
| | | Purchases | | | Sales | |
| Investment securities | | $ | 270,674,126 | | | $ | 475,599,143 | |
5. Fees and Other Transactions with Affiliates
Management Fees. Under the investment advisory agreement, the Fund pays the Manager a management fee based on the daily net assets of the Fund at an annual rate as shown in the following table:
| | | | |
| Fee Schedule | | | |
| Up to $200 million | | | 0.75 | % |
| Next $200 million | | | 0.72 | |
| Next $200 million | | | 0.69 | |
| Next $200 million | | | 0.66 | |
| Over $800 million | | | 0.60 | |
Administrative Service Fees. The Fund pays the Manager a fee of $1,500 per year for preparing and filing the Fund’s tax returns.
Transfer Agent Fees. OppenheimerFunds Services (“OFS”), a division of the Manager, acts as the transfer and shareholder servicing agent for the Fund. For the year ended December 31, 2012, the Fund paid $990,201 to OFS for services to the Fund.
| | | | |
| 18 | | | | OPPENHEIMER CAPITAL APPRECIATION FUND/VA |
Distribution and Service Plan for Service Shares. The Fund has adopted a Distribution and Service Plan (the “Plan”) in accordance with Rule 12b-1 under the Investment Company Act of 1940 for Service shares to pay OppenheimerFunds Distributor, Inc. (the “Distributor”), for distribution related services, personal service and account maintenance for the Fund’s Service shares. Under the Plan, payments are made periodically at an annual rate of 0.25% of the daily net assets of Service shares of the Fund. The Distributor currently uses all of those fees to compensate sponsors of the insurance product that offers Fund shares, for providing personal service and maintenance of accounts of their variable contract owners that hold Service shares. These fees are paid out of the Fund’s assets on an on-going basis and increase operating expenses of the Service shares, which results in lower performance compared to the Fund’s shares that are not subject to a service fee. Fees incurred by the Fund under the Plan are detailed in the Statement of Operations.
Waivers and Reimbursements of Expenses. The Manager has voluntarily agreed to limit the Fund’s expenses after payments, waivers and/or reimbursements and reduction to custodian expenses, excluding expenses incurred directly or indirectly by the Fund as a result of investments in other investment companies, wholly-owned subsidiaries and pooled investment vehicles; so that those expenses, as percentages of daily net assets, will not exceed the annual rate of 0.80% for Non-Service shares and 1.05% for Service shares. During the year ended December 31, 2012, the Manager waived fees and/or reimbursed the Fund $82,427 and $58,608 for Non-Service and Service shares, respectively.
The Manager will waive fees and/or reimburse Fund expenses in an amount equal to the indirect management fees incurred through the Fund’s investment in IMMF. During the year ended December 31, 2012, the Manager waived fees and/or reimbursed the Fund $5,424 for IMMF management fees.
Some of these undertakings may be modified or terminated at any time; some may not be modified or terminated until after one year from the date of the current prospectus, as indicated therein.
6. Risk Exposures and the Use of Derivative Instruments
The Fund’s investment objectives not only permit the Fund to purchase investment securities, they also allow the Fund to enter into various types of derivatives contracts, including, but not limited to, futures contracts, forward foreign currency exchange contracts, credit default swaps, interest rate swaps, total return swaps, and purchased and written options. In doing so, the Fund will employ strategies in differing combinations to permit it to increase, decrease, or change the level or types of exposure to market risk factors. Central to those strategies are features inherent to derivatives that make them more attractive for this purpose than equity and debt securities: they require little or no initial cash investment, they can focus exposure on only certain selected risk factors, and they may not require the ultimate receipt or delivery of the underlying security (or securities) to the contract. This may allow the Fund to pursue its objectives more quickly and efficiently than if it were to make direct purchases or sales of securities capable of effecting a similar response to market factors.
Market Risk Factors. In accordance with its investment objectives, the Fund may use derivatives to increase or decrease its exposure to one or more of the following market risk factors:
Commodity Risk. Commodity risk relates to the change in value of commodities or commodity indexes as they relate to increases or decreases in the commodities market. Commodities are physical assets that have tangible properties. Examples of these types of assets are crude oil, heating oil, metals, livestock, and agricultural products.
Credit Risk. Credit risk relates to the ability of the issuer to meet interest and principal payments, or both, as they come due. In general, lower-grade, higher-yield bonds are subject to credit risk to a greater extent than lower-yield, higher-quality bonds.
Equity Risk. Equity risk relates to the change in value of equity securities as they relate to increases or decreases in the general market.
Foreign Exchange Rate Risk. Foreign exchange rate risk relates to the change in the U.S. dollar value of a security held that is denominated in a foreign currency. The U.S. dollar value of a foreign currency denominated security will decrease as the dollar appreciates against the currency, while the U.S. dollar value will increase as the dollar depreciates against the currency.
Interest Rate Risk. Interest rate risk refers to the fluctuations in value of fixed-income securities resulting from the inverse relationship between price and yield. For example, an increase in general interest rates will tend to reduce the market value of already issued fixed-income investments, and a decline in general interest rates will tend to increase their value. In addition, debt securities with longer maturities, which tend to have higher yields, are subject to potentially greater fluctuations in value from changes in interest rates than obligations with shorter maturities.
Volatility Risk. Volatility risk refers to the magnitude of the movement, but not the direction of the movement, in a financial instrument’s price over a defined time period. Large increases or decreases in a financial instrument’s price over a relative time period typically indicate greater volatility risk, while small increases or decreases in its price typically indicate lower volatility risk.
The Fund’s actual exposures to these market risk factors during the period are discussed in further detail, by derivative type, below.
Risks of Investing in Derivatives. The Fund’s use of derivatives can result in losses due to unanticipated changes in the market risk factors and the overall market. In instances where the Fund is using derivatives to decrease, or hedge, exposures to market risk factors for securities held by the Fund, there are also risks that those derivatives may not perform as expected resulting in losses for the combined or hedged positions.
Derivatives may have little or no initial cash investment relative to their market value exposure and therefore can produce significant gains or losses in excess of their cost. This use of embedded leverage allows the Fund to increase its market value exposure relative to its net assets and can substantially increase the volatility of the Fund’s performance.
| | | | |
| 19 | | | | OPPENHEIMER CAPITAL APPRECIATION FUND/VA |
NOTES TO FINANCIAL STATEMENTS Continued
6. Risk Exposures and the Use of Derivative Instruments Continued
Additional associated risks from investing in derivatives also exist and potentially could have significant effects on the valuation of the derivative and the Fund. Typically, the associated risks are not the risks that the Fund is attempting to increase or decrease exposure to, per its investment objectives, but are the additional risks from investing in derivatives. Examples of these associated risks are liquidity risk, which is the risk that the Fund will not be able to sell the derivative in the open market in a timely manner, and counterparty credit risk, which is the risk that the counterparty will not fulfill its obligation to the Fund. Associated risks can be different for each type of derivative and are discussed by each derivative type in the notes that follow.
Counterparty Credit Risk. Certain derivative positions are subject to counterparty credit risk, which is the risk that the counterparty will not fulfill its obligation to the Fund. The Fund’s derivative counterparties are financial institutions who are subject to market conditions that may weaken their financial position. The Fund intends to enter into financial transactions with counterparties that the Manager believes to be creditworthy at the time of the transaction.
Credit Related Contingent Features. The Fund’s agreements with derivative counterparties have several credit related contingent features that if triggered would allow its derivatives counterparties to close out and demand payment or additional collateral to cover their exposure from the Fund. Credit related contingent features are established between the Fund and its derivatives counterparties to reduce the risk that the Fund will not fulfill its payment obligations to its counterparties. These triggering features include, but are not limited to, a percentage decrease in the Fund’s net assets and or a percentage decrease in the Fund’s Net Asset Value or NAV. The contingent features are established within the Fund’s International Swap and Derivatives Association, Inc. master agreements which govern certain positions in swaps, over-the-counter options and swaptions, and forward currency exchange contracts for each individual counterparty.
The effect of derivative instruments on the Statement of Operations is as follows:
| | | | | | |
| Amounts of Realized Gain or (Loss) Recognized on Derivatives | |
Derivatives Not Accounted
for as Hedging Instruments | | Foreign currency transactions | |
| Foreign exchange contracts | | | $44,941 | |
Foreign Currency Exchange Contracts
The Fund may enter into foreign currency exchange contracts (“forward contracts”) for the purchase or sale of a foreign currency at a negotiated rate at a future date.
Forward contracts are reported on a schedule following the Statement of Investments. The unrealized appreciation (depreciation) is reported in the Statement of Assets and Liabilities as a receivable or payable and in the Statement of Operations within the change in unrealized appreciation (depreciation). At contract close, the difference between the original cost of the contract and the value at the close date is recorded as a realized gain (loss) in the Statement of Operations.
The Fund has purchased and sold certain forward foreign currency exchange contracts of different currencies in order to acquire currencies to pay for or sell currencies to acquire related foreign securities purchase and sale transactions, respectively, or to convert foreign currencies to U.S. dollars from related foreign securities transactions. These foreign currency exchange contracts are negotiated at the current spot exchange rate with settlement typically within two business days thereafter.
During the year ended December 31, 2012, the Fund had daily average contract amounts on forward foreign currency contracts to buy and sell of $28,870 and $482,486, respectively.
Additional associated risk to the Fund includes counterparty credit risk. Counterparty credit risk arises from the possibility that the counterparty will default.
As of December 31, 2012, the Fund had no outstanding forward contracts.
7. Subsequent Event
The Board of Trustees of the Fund recently approved a series of modifications to the Fund’s investment advisory and transfer agency arrangements in connection with internal corporate restructuring efforts at OppenheimerFunds, Inc. (“OFI”). As a result of these modifications, on January 1, 2013 (the “Effective Date”), OFI Global Asset Management, Inc. (“OFI Global”), a wholly-owned subsidiary of OFI, became the investment adviser and transfer agent to the Fund under the terms of the Fund’s advisory agreement and transfer agency agreement, respectively. OFI Global, in turn, entered into a new sub-advisory agreement for the Fund, on the Effective Date, whereby OFI Global will have oversight and supervisory responsibilities and OFI will choose the Fund’s investments and provide related advisory services to the Fund. In addition, on the Effective Date, OFI Global entered into a sub-transfer agency agreement with Shareholder Services, Inc. doing business as OppenheimerFunds Services, a wholly-owned subsidiary of OFI, under which it will be responsible for providing transfer agency services to the Fund.
The realignment of advisory service responsibility between OFI Global and OFI did not result in any change in the persons managing the assets of the Fund, the level or nature of the advisory services provided to the Fund, or the fees charged to the Fund.
8. Pending Litigation
Since 2009, a number of class action lawsuits have been pending in federal courts against OppenheimerFunds, Inc., the Fund’s Adviser through December 31, 2012 and Sub-Adviser effective January 1, 2013 (the “Manager”), OppenheimerFunds Distributor, Inc., the Fund’s principal underwriter and distributor (the “Distributor”), and certain funds (but not including the Fund) advised by the Manager and distributed by the Distributor (the “Defendant Funds”). Several of these lawsuits also name as defendants certain officers and current and former trustees of the respective Defendant
| | | | |
| 20 | | | | OPPENHEIMER CAPITAL APPRECIATION FUND/VA |
Funds. The lawsuits raise claims under federal securities law and allege, among other things, that the disclosure documents of the respective Defendant Funds contained misrepresentations and omissions and that the respective Defendant Funds’ investment policies were not followed. The plaintiffs in these actions seek unspecified damages, equitable relief and awards of attorneys’ fees and litigation expenses. The Defendant Funds’ Boards of Trustees have also engaged counsel to represent the Funds and the present and former Independent Trustees named in those suits.
Other class action and individual lawsuits have been filed since 2008 in various state and federal courts against the Manager and certain of its affiliates by investors seeking to recover investments they allegedly lost as a result of the “Ponzi” scheme run by Bernard L. Madoff and his firm, Bernard L. Madoff Investment Securities, LLC (“BLMIS”). Plaintiffs in these suits allege that they suffered losses as a result of their investments in several funds managed by an affiliate of the Manager and assert a variety of claims, including breach of fiduciary duty, fraud, negligent misrepresentation, unjust enrichment, and violation of federal and state securities laws and regulations, among others. They seek unspecified damages, equitable relief and awards of attorneys’ fees and litigation expenses. Neither the Distributor, nor any of the Oppenheimer mutual funds, their independent trustees or directors are named as defendants in these lawsuits. None of the Oppenheimer mutual funds invested in any funds or accounts managed by Madoff or BLMIS. On February 28, 2011, a stipulation of partial settlement of three groups of consolidated putative class action lawsuits relating to these matters was filed in the U.S. District Court for the Southern District of New York. On August 19, 2011, the court entered an order and final judgment approving the settlement as fair, reasonable and adequate. In September 2011, certain parties filed notices of appeal from the court’s order approving the settlement. The settlement does not resolve other outstanding lawsuits against the Manager and its affiliates relating to BLMIS.
On April 16, 2010, a lawsuit was filed in New York state court against the Manager, an affiliate of the Manager and AAArdvark IV Funding Limited (“AAArdvark IV”), an entity advised by the Manager’s affiliate, in connection with investments made by the plaintiffs in AAArdvark IV. Plaintiffs allege breach of contract against the defendants and seek compensatory damages, costs and disbursements, including attorney fees. On July 15, 2011, a lawsuit was filed in New York state court against the Manager, an affiliate of the Manager and AAArdvark Funding Limited (“AAArdvark I”), an entity advised by the Manager’s affiliate, in connection with investments made by the plaintiffs in AAArdvark I. The complaint alleges breach of contract against the defendants and seeks compensatory damages, costs and disbursements, including attorney fees. On November 9, 2011, a lawsuit was filed in New York state court against the Manager, an affiliate of the Manager and AAArdvark XS Funding Limited (“AAArdvark XS”), an entity advised by the Manager’s affiliate, in connection with investments made by the plaintiffs in AAArdvark XS. The complaint alleges breach of contract against the defendants and seeks compensatory damages, costs and disbursements, including attorney fees.
The Manager believes the lawsuits and appeals described above are without legal merit and, with the exception of actions it has settled, is defending against them vigorously. While it is premature to render any opinion as to the outcome in these lawsuits, or whether any costs that the Defendant Funds may bear in defending the suits might not be reimbursed by insurance, the Manager believes that these suits should not impair the ability of the Manager or the Distributor to perform their respective duties to the Fund, and that the outcome of all of the suits together should not have any material effect on the operations of any of the Oppenheimer mutual funds.
| | | | |
| 21 | | | | OPPENHEIMER CAPITAL APPRECIATION FUND/VA |
REPORT OF INDEPENDENT REGISTERED PUBLIC ACCOUNTING FIRM
The Board of Trustees and Shareholders of Oppenheimer Variable Account Funds:
We have audited the accompanying statement of assets and liabilities of Oppenheimer Capital Appreciation Securities Fund/VA (a separate series of Oppenheimer Variable Account Funds), including the statement of investments, as of December 31, 2012, and the related statement of operations for the year then ended, the statements of changes in net assets for each of the years in the two-year period then ended and the financial highlights for each of the years in the four-year period then ended. These financial statements and financial highlights are the responsibility of the Fund’s management. Our responsibility is to express an opinion on these financial statements and financial highlights based on our audits. The accompanying financial highlights of Oppenheimer Capital Appreciation Fund/VA for the year ended December 31, 2008 were audited by other auditors whose report dated February 11, 2009 expressed an unqualified opinion on those financial highlights.
We conducted our audits in accordance with the standards of the Public Company Accounting Oversight Board (United States). Those standards require that we plan and perform the audit to obtain reasonable assurance about whether the financial statements and financial highlights are free of material misstatement. An audit includes examining, on a test basis, evidence supporting the amounts and disclosures in the financial statements. Our procedures included confirmation of securities owned as of December 31, 2012, by correspondence with the custodian and transfer agent. An audit also includes assessing the accounting principles used and significant estimates made by management, as well as evaluating the overall financial statement presentation. We believe that our audits provide a reasonable basis for our opinion.
In our opinion, the financial statements and financial highlights referred to above present fairly, in all material respects, the financial position of Oppenheimer Capital Appreciation Fund/VA as of December 31, 2012, the results of its operations for the year then ended, the changes in its net assets for each of the years in the two-year period then ended and the financial highlights for each of the years in the four-year period then ended, in conformity with U.S. generally accepted accounting principles.
KPMG LLP
Denver, Colorado
February 19, 2013
| | | | |
| 22 | | | | OPPENHEIMER CAPITAL APPRECIATION FUND/VA |
FEDERAL INCOME TAX INFORMATION Unaudited
In early 2013, if applicable, shareholders of record received information regarding all dividends and distributions paid to them by the Fund during calendar year 2012.
Dividends, if any, paid by the Fund during the fiscal year ended December 31, 2012 which are not designated as capital gain distributions should be multiplied by the maximum amount allowable but not less than 100% to arrive at the amount eligible for the corporate dividend-received deduction.
The foregoing information is presented to assist shareholders in reporting distributions received from the Fund to the Internal Revenue Service. Because of the complexity of the federal regulations which may affect your individual tax return and the many variations in state and local tax regulations, we recommend that you consult your tax advisor for specific guidance.
| | | | |
| 23 | | | | OPPENHEIMER CAPITAL APPRECIATION FUND/VA |
BOARD APPROVAL OF THE FUND’S INVESTMENT
ADVISORY AGREEMENT Unaudited
Each year, the Board of Trustees (the “Board”), including a majority of the independent Trustees, is required to determine whether to renew the Fund’s investment advisory agreement (the “Agreement”). The Investment Company Act of 1940, as amended, requires that the Board request and evaluate, and that the Manager provide, such information as may be reasonably necessary to evaluate the terms of the Agreement. The Board employs an independent consultant to prepare a report that provides information, including comparative information that the Board requests for that purpose. In addition to in-person meetings focused on this evaluation, the Board receives information throughout the year regarding Fund services, fees, expenses and performance.
The Manager and the independent consultant provided information to the Board on the following factors: (i) the nature, quality and extent of the Manager’s services, (ii) the investment performance of the Fund and the Manager, (iii) the fees and expenses of the Fund, including comparative expense information, (iv) the profitability of the Manager and its affiliates, including an analysis of the cost of providing services, (v) whether economies of scale are realized as the Fund grows and whether fee levels reflect these economies of scale for Fund investors and (vi) other benefits to the Manager from its relationship with the Fund. The Board was aware that there are alternatives to retaining the Manager.
Outlined below is a summary of the principal information considered by the Board as well as the Board’s conclusions.
Nature, Quality and Extent of Services. The Board considered information about the nature, quality and extent of the services provided to the Fund and information regarding the Manager’s key personnel who provide such services. The Manager’s duties include providing the Fund with the services of the portfolio manager and the Manager’s investment team, who provide research, analysis and other advisory services in regard to the Fund’s investments; securities trading services; oversight of third-party service providers; monitoring compliance with applicable Fund policies and procedures and adherence to the Fund’s investment restrictions; and risk management. The Manager is responsible for providing certain administrative services to the Fund as well. Those services include providing and supervising all administrative and clerical personnel who are necessary in order to provide effective corporate administration for the Fund; compiling and maintaining records with respect to the Fund’s operations; preparing and filing reports required by the Securities and Exchange Commission; preparing periodic reports regarding the operations of the Fund for its shareholders; preparing proxy materials for shareholder meetings; and preparing the registration statements required by Federal and state securities laws for the sale of the Fund’s shares. The Manager also provides the Fund with office space, facilities and equipment.
The Board also considered the quality of the services provided and the quality of the Manager’s resources that are available to the Fund. The Board took account of the fact that the Manager has had over fifty years of experience as an investment adviser and that its assets under management rank it among the top mutual fund managers in the United States. The Board evaluated the Manager’s advisory, administrative, accounting, legal, compliance services and risk management, and information the Board has received regarding the experience and professional qualifications of the Manager’s key personnel and the size and functions of its staff. In its evaluation of the quality of the portfolio management services provided, the Board considered the experience of Julie Van Cleave, the portfolio manager for the Fund, and the Manager’s investment team and analysts. The Board members also considered the totality of their experiences with the Manager as directors or trustees of the Fund and other funds advised by the Manager. The Board considered information regarding the quality of services provided by affiliates of the Manager, which its members have become knowledgeable about in connection with the renewal of the Fund’s service agreements. The Board concluded, in light of the Manager’s experience, reputation, personnel, operations and resources that the Fund benefits from the services provided under the Agreement.
Investment Performance of the Manager and the Fund. Throughout the year, the Manager provided information on the investment performance of the Fund, including comparative performance information. The Board also reviewed information, prepared by the Manager and by the independent consultant, comparing the Fund’s historical performance to relevant market indices and to the performance of other large-cap growth funds underlying variable insurance products. The Board noted that the Fund outperformed its performance universe median during the one-year period, performed in line with its performance universe median during the three-year period but underperformed its performance universe median during the five- and ten-year periods. The Board noted the change in portfolio management of the Fund effective April 26, 2010 and considered the Fund’s recent improved performance.
Costs of Services by the Manager. The Board reviewed the fees paid to the Manager and the other expenses borne by the Fund. The Board also considered the comparability of the fees charged and the services provided to the Fund to the fees and services for other clients or accounts advised by the Manager. The independent consultant provided comparative data in regard to the fees and expenses of the Fund and other large-cap growth funds underlying variable insurance products. In reviewing the fees and expenses charged to the VA funds, the Board considered the Manager’s assertion that, because there is much greater disparity in the fees and services that may be provided by a manager to a VA fund as opposed to a retail fund, when comparing the expenses of the various VA funds to those of retail funds, it is most appropriate to focus on total expenses (rather than on the management fees). Accordingly, while the Board reviewed and considered all expenses, it focused on total expenses. The Board considered that the Fund’s actual management fees and total expenses were higher than its expense group median and expense group average. The Board also considered that the Manager has voluntarily agreed to waive fees and/or reimburse the Fund for certain expenses in order to limit total annual fund operating expenses after any fee waiver and/or expense reimbursement (excluding (i) interest, taxes, dividends tied to short sales, brokerage commissions, and other expenditures which are capitalized in accordance with generally accepted accounting principles; (ii) expenses incurred directly or indirectly by the Fund as a result of investments in other investment companies, wholly-owned subsidiaries and pooled investment vehicles; (iii) certain other expenses attributable to, and incurred as a result of, a Fund’s investments; and (iv) other extraordinary expenses (including litigation expenses) not incurred in the ordinary course of the Fund’s business) to annual rates of 0.80% for Non-Service Shares and 1.05% for Service Shares as calculated on the daily net assets of the Fund. This waiver and/or reimbursement may be amended or withdrawn at any time without prior notice to shareholders.
Economies of Scale and Profits Realized by the Manager. The Board considered information regarding the Manager’s costs in serving as the Fund’s investment adviser, including the costs associated with the personnel and systems necessary to manage the Fund, and information regarding the Manager’s profitability from its relationship with the Fund. The Board reviewed whether the Manager may realize economies of scale in managing and supporting the Fund. The Board noted that the Fund currently has management fee breakpoints, which are intended to share with Fund shareholders economies of scale that may exist as the Fund’s assets grow.
| | | | |
| 24 | | | | OPPENHEIMER CAPITAL APPRECIATION FUND/VA |
Other Benefits to the Manager. In addition to considering the profits realized by the Manager, the Board considered information that was provided regarding the direct and indirect benefits the Manager receives as a result of its relationship with the Fund, including compensation paid to the Manager’s affiliates and research provided to the Manager in connection with permissible brokerage arrangements (soft dollar arrangements). The Board also considered that the Manager must be able to pay and retain experienced professional personnel at competitive rates to provide quality services to the Fund.
Conclusions. These factors were also considered by the independent Trustees meeting separately from the full Board, assisted by experienced counsel to the Fund and to the independent Trustees. Fund counsel and the independent Trustees’ counsel are independent of the Manager within the meaning and intent of the Securities and Exchange Commission Rules.
Based on its review of the information it received and its evaluations described above, the Board, including a majority of the independent Trustees, decided to continue the Agreement. In addition, the Board, including a majority of the Independent Trustees, approved the restructuring of the Fund’s investment advisory arrangement so that effective January 1, 2013, (i) OFI Global Asset Management, Inc. (“OFI Global”), a wholly owned subsidiary of the Manager, will serve as the investment adviser to the Fund in place of the Manager under a Restated Advisory Agreement (“Restated Advisory Agreement”), and (ii) OFI Global will enter into a Sub-Advisory Agreement (“Sub-Advisory Agreement”) with the Manager to provide investment sub-advisory services to the Fund. OFI Global will pay the Manager a percentage of the net investment advisory fee (after all applicable waivers have been deducted) that it receives from the Fund. The Agreement will continue until earlier of August 31, 2013 or the effective date of the Restated Advisory Agreement between the Fund and OFI Global. The Restated Advisory Agreement and Sub-Advisory Agreement will continue until August 31, 2013.
In arriving at its decisions, the Board did not single out any factor or factors as being more important than others, but considered all of the above information, and considered the terms and conditions of the Agreement, Restated Advisory Agreement and Sub-Advisory Agreement, including the management fees, in light of all the surrounding circumstances.
| | | | |
| 25 | | | | OPPENHEIMER CAPITAL APPRECIATION FUND/VA |
PORTFOLIO PROXY VOTING POLICIES AND PROCEDURES;
UPDATES TO STATEMENTS OF INVESTMENTS Unaudited
The Fund has adopted Portfolio Proxy Voting Policies and Procedures under which the Fund votes proxies relating to securities (“portfolio proxies”) held by the Fund. A description of the Fund’s Portfolio Proxy Voting Policies and Procedures is available (i) without charge, upon request, by calling the Fund toll-free at 1.800.525.7048, (ii) on the Fund’s website at oppenheimerfunds.com, and (iii) on the SEC’s website at www.sec.gov. In addition, the Fund is required to file Form N-PX, with its complete proxy voting record for the 12 months ended June 30th, no later than August 31st of each year. The Fund’s voting record is available (i) without charge, upon request, by calling the Fund toll-free at 1.800.525.7048, and (ii) in the Form N-PX filing on the SEC’s website at www.sec.gov.
The Fund files its complete schedule of portfolio holdings with the SEC for the first quarter and the third quarter of each fiscal year on Form N-Q. The Fund’s Form N-Q filings are available on the SEC’s website at www.sec.gov. Those forms may be reviewed and copied at the SEC’s Public Reference Room in Washington, D.C. Information on the operation of the Public Reference Room may be obtained by calling 1-800-SEC-0330.
| | | | |
| 26 | | | | OPPENHEIMER CAPITAL APPRECIATION FUND/VA |
TRUSTEES AND OFFICERS BIOS Unaudited
| | |
| Name, Position(s) Held with the Fund, Length of Service, Age | | Principal Occupation(s) During the Past 5 Years; Other Trusteeships/Directorships Held; Number of Portfolios in the Fund Complex Currently Overseen |
| |
INDEPENDENT TRUSTEES | | The address of each Trustee in the chart below is 6803 S. Tucson Way, Centennial, Colorado 80112-3924. Each Trustee serves for an indefinite term, or until his or her resignation, retirement, death or removal |
| |
Sam Freedman, Chairman of the Board of Trustees (since 2012) and Trustee (since 1996) Age: 72 | | Director of Colorado UpLIFT (charitable organization) (since September 1984). Mr. Freedman held several positions with the Sub-Adviser and with subsidiary or affiliated companies of the Sub-Adviser (until October 1994). Oversees 36 portfolios in the OppenheimerFunds complex. Mr. Freedman has served on the Boards of certain Oppenheimer funds since 1996, during which time he has become familiar with the Fund’s (and other Oppenheimer funds’) financial, accounting, regulatory and investment matters and has contributed to the Boards’ deliberations. |
| |
Edward L. Cameron, Trustee (since 1999) Age: 74 | | Member of The Life Guard of Mount Vernon (George Washington historical site) (June 2000 – June 2006); Partner of PricewaterhouseCoopers LLP (accounting firm) (July 1974-June 1999); Chairman of Price Waterhouse LLP Global Investment Management Industry Services Group (accounting firm) (July 1994-June 1998). Oversees 36 portfolios in the OppenheimerFunds complex. Mr. Cameron has served on the Boards of certain Oppenheimer funds since 1999, during which time he has become familiar with the Fund’s (and other Oppenheimer funds’) financial, accounting, regulatory and investment matters and has contributed to the Boards’ deliberations. |
| |
Jon S. Fossel, Trustee (since 1995) Age: 70 | | Chairman of the Board (2006-December 2011) and Director (June 2002-December 2011) of UNUMProvident (insurance company); Director of Northwestern Energy Corp. (public utility corporation) (November 2004-December 2009); Director of P.R. Pharmaceuticals (October 1999-October 2003); Director of Rocky Mountain Elk Foundation (non-profit organization) (February 1998-February 2003 and February 2005-February 2007); Chairman and Director (until October 1996) and President and Chief Executive Officer (until October 1995) of the Sub-Adviser; President, Chief Executive Officer and Director of the following: Oppenheimer Acquisition Corp. (“OAC”) (parent holding company of the Sub-Adviser), Shareholders Services, Inc. and Shareholder Financial Services, Inc. (until October 1995). Oversees 36 portfolios in the OppenheimerFunds complex. Mr. Fossel has served on the Boards of certain Oppenheimer funds since 1990, during which time he has become familiar with the Fund’s (and other Oppenheimer funds’) financial, accounting, regulatory and investment matters and has contributed to the Boards’ deliberations. |
| |
Richard F. Grabish, Trustee (since 2012) Age: 64 | | Formerly Senior Vice President and Assistant Director of Sales and Marketing (March 1997-December 2007), Director (March 1987-December 2007) and Manager of Private Client Services (June 1985-June 2005) of A.G. Edwards & Sons, Inc. (broker/dealer and investment firm); Chairman and Chief Executive Officer of A.G. Edwards Trust Company, FSB (March 2001-December 2007); President and Vice Chairman of A.G. Edwards Trust Company, FSB (investment adviser) (April 1987-March 2001); President of A.G. Edwards Trust Company, FSB (investment adviser) (June 2005-December 2007). Oversees 36 portfolios in the OppenheimerFunds complex. Mr. Grabish has served on the Boards of certain Oppenheimer funds since 2001, during which time he has become familiar with the Fund’s (and other Oppenheimer funds’) financial, accounting, regulatory and investment matters and has contributed to the Boards’ deliberations. |
| |
Beverly L. Hamilton, Trustee (since 2002) Age: 66 | | Trustee of Monterey Institute for International Studies (educational organization) (since February 2000); Board Member of Middlebury College (educational organization) (December 2005-June 2011); Chairman (since 2010) of American Funds’ Emerging Markets Growth Fund, Inc. (mutual fund); Director of The California Endowment (philanthropic organization) (April 2002-April 2008); Director (February 2002-2005) and Chairman of Trustees (2006-2007) of the Community Hospital of Monterey Peninsula; Director (October 1991-2005); Vice Chairman (2006-2009) of American Funds’ Emerging Markets Growth Fund, Inc. (mutual fund); President of ARCO Investment Management Company (February 1991-April 2000); Member of the investment committees of The Rockefeller Foundation (2001-2006) and The University of Michigan (since 2000); Advisor at Credit Suisse First Boston’s Sprout venture capital unit (venture capital fund) (1994-January 2005); Trustee of MassMutual Institutional Funds (investment company) (1996-June 2004); Trustee of MML Series Investment Fund (investment company) (April 1989-June 2004); Member of the investment committee of Hartford Hospital (2000-2003); and Advisor to Unilever (Holland) pension fund (2000-2003). Oversees 36 portfolios in the OppenheimerFunds complex. Ms. Hamilton has served on the Boards of certain Oppenheimer funds since 2002, during which time she has become familiar with the Fund’s (and other Oppenheimer funds’) financial, accounting, regulatory and investment matters and has contributed to the Boards’ deliberations. |
| |
Victoria J. Herget, Trustee (since 2012) Age: 61 | | Independent Director of the First American Funds (mutual fund family) (2003-2011); former Managing Director (1993-2001), Principal (1985-1993), Vice President (1978-1985) and Assistant Vice President (1973-1978) of Zurich Scudder Investments (and its predecessor firms); Board Chair (2008-Present) and Director (2004-Present), United Educators (insurance company); Trustee (1992-2007), Chair of the Board of Trustees (1999-2007), Investment Committee Chair (1994-1999) and Investment Committee member (2007-2010) of Wellesley College; Trustee (since 2000) and Chair (since 2010), Newberry Library; Trustee, Mather LifeWays (since 2001); Trustee, BoardSource (2006-2009) and Chicago City Day School (1994-2005). Oversees 36 portfolios in the OppenheimerFunds complex. Ms. Herget has served on the Boards of certain Oppenheimer funds since 2012, during which time she has become familiar with the Fund’s (and other Oppenheimer funds’) financial, accounting, regulatory and investment matters and has contributed to the Boards’ deliberations. |
| |
Robert J. Malone, Trustee (since 2002) Age: 68 | | Board of Directors of Opera Colorado Foundation (non-profit organization) (since March 2008); Director of Jones Knowledge, Inc. (2006-2010); Director of Jones International University (educational organization) (since August 2005); Chairman, Chief Executive Officer and Director of Steele Street Bank & Trust (commercial banking) (since August 2003); Director of Colorado UpLIFT (charitable organization) (1986-2010); Trustee of the Gallagher Family Foundation (non-profit organization) (since 2000); Former Chairman of U.S. Bank-Colorado (subsidiary of U.S. Bancorp and formerly Colorado National Bank) (July 1996-April 1999); Director of Commercial Assets, Inc. (real estate investment trust) (1993-2000); Director of Jones Knowledge, Inc. (2001-July 2004); Director of U.S. Exploration, Inc. (oil and gas exploration) (1997-February 2004); Chairman of the Board (1991-1994) and Trustee (1985-1994) of Regis University; and Chairman of the Board (1990-1991) and Trustee (1984-1999) of Young Presidents Organization. Oversees 36 portfolios in the OppenheimerFunds complex. Mr. Malone has served on the Boards of certain Oppenheimer funds since 2002, during which time he has become familiar with the Fund’s (and other Oppenheimer funds’) financial, accounting, regulatory and investment matters and has contributed to the Boards’ deliberations. |
| |
F. William Marshall, Jr., Trustee (since 2000) Age: 70 | | Trustee Emeritus of Worcester Polytech Institute (WPI) (private university) (since 2009); Trustee of MassMutual Select Funds (formerly MassMutual Institutional Funds) (investment company) (since 1996) and MML Series Investment Fund (investment company) (since 1996) and Mass Mutual Premier Funds (investment company) (since January 2012); President and Treasurer of the SIS Funds (private charitable fund) (January 1999 – March 2011); Former Trustee of WPI (1985-2008); Former Chairman of the Board (2004-2006) and Former Chairman of the Investment Committee of WPI (1994-2008); Chairman of SIS & Family Bank, F.S.B. (formerly SIS Bank) (commercial bank) (January 1999-July 1999); Executive Vice President of Peoples Heritage Financial Group, Inc. (commercial bank) (January 1999-July 1999); and Former President and Chief Executive Officer of SIS Bancorp. (1993-1999). Oversees 40 portfolios in the OppenheimerFunds complex. Mr. Marshall has served on the Boards of certain Oppenheimer funds since 2000, during which time he has become familiar with the Fund’s (and other Oppenheimer funds’) financial, accounting, regulatory and investment matters and has contributed to the Boards’ deliberations. |
| | | | |
| 27 | | | | OPPENHEIMER CAPITAL APPRECIATION FUND/VA |
TRUSTEES AND OFFICERS BIOS Unaudited / Continued
| | |
Karen L. Stuckey,
Trustee (since 2012) Age: 59 | | Partner (1990-2012) of PricewaterhouseCoopers LLP (held various positions 1975-1990); Trustee (1992-2006) and member of Executive, Nominating and Audit Committees and Chair of Finance Committee of Lehigh University; and member, Women’s Investment Management Forum since inception. Oversees 36 portfolios in the OppenheimerFunds complex. Ms. Stuckey has served on the Boards of certain Oppenheimer funds since 2012, during which time she has become familiar with the Fund’s (and other Oppenheimer funds’) financial, accounting, regulatory and investment matters and has contributed to the Boards’ deliberations. |
| |
James D. Vaughn,
Trustee (since 2012) Age: 67 | | Retired; former managing partner (1994-2001) of Denver office of Deloitte & Touche LLP, (held various positions 1969-1993); Trustee and Chairman of the Audit Committee of Schroder Funds (2003-2012); Board member and Chairman of Audit Committee of AMG National Trust Bank (since 2005); Trustee, Audit Committee member and Investment Committee member, University of South Dakota Foundation (since 1996); Board member, Executive Committee Member, Audit Committee Member and past Board Chair, Junior Achievement (since 1993); former Board member, Mile High United Way, Boys and Girls Clubs, Boy Scouts, Colorado Business Committee for the Arts, Economic Club of Colorado and Metro Denver Network. Oversees 36 portfolios in the OppenheimerFunds complex. Mr. Vaughn has served on the Boards of certain Oppenheimer funds since 2012, during which time he has become familiar with the Fund’s (and other Oppenheimer funds’) financial, accounting, regulatory and investment matters and has contributed to the Boards’ deliberations. |
| INTERESTED TRUSTEE AND OFFICER | | The address of Mr. Glavin is Two World Financial Center, 225 Liberty Street, 11th Floor, New York, New York 10281-1008. Mr. Glavin serves as a Trustee for an indefinite term, or until his resignation, retirement, death or removal and as an Officer for an indefinite term, or until his resignation, retirement, death or removal. Mr. Glavin is an Interested Trustee due to his positions with OppenheimerFunds, Inc. and its affiliates. |
| |
William F. Glavin, Jr., Trustee, President and Principal Executive Officer (since 2009) Age: 54 | | Chief Executive Officer of OppenheimerFunds (since January 2013); Director, Chief Executive Officer and President of the Manager (since January 2013); Chairman of the Sub-Adviser (December 2009-December 2012); Chief Executive Officer (January 2009-December 2012) and Director of the Sub-Adviser (since January 2009); President of the Sub-Adviser (May 2009-December 2012); Management Director (since June 2009), President (since December 2009) and Chief Executive Officer (since January 2011) of Oppenheimer Acquisition Corp. (“OAC”) (the Sub-Adviser’s parent holding company); Director of Oppenheimer Real Asset Management, Inc. (since March 2010); Executive Vice President (March 2006-February 2009) and Chief Operating Officer (July 2007-February 2009) of Massachusetts Mutual Life Insurance Company (OAC’s parent company); Director (May 2004-March 2006) and Chief Operating Officer and Chief Compliance Officer (May 2004-January 2005), President (January 2005-March 2006) and Chief Executive Officer (June 2005-March 2006) of Babson Capital Management LLC; Director (March 2005-March 2006), President (May 2003-March 2006) and Chief Compliance Officer (July 2005-March 2006) of Babson Capital Securities, Inc. (a broker-dealer); President (May 2003-March 2006) of Babson Investment Company, Inc.; Director (May 2004-August 2006) of Babson Capital Europe Limited; Director (May 2004-October 2006) of Babson Capital Guernsey Limited; Director (May 2004-March 2006) of Babson Capital Management LLC; Non-Executive Director (March 2005-March 2007) of Baring Asset Management Limited; Director (February 2005-June 2006) Baring Pension Trustees Limited; Director and Treasurer (December 2003-November 2006) of Charter Oak Capital Management, Inc.; Director (May 2006-September 2006) of C.M. Benefit Insurance Company; Director (May 2008-June 2009) and Executive Vice President (June 2007-July 2009) of C.M. Life Insurance Company; President (March 2006-May 2007) of MassMutual Assignment Company; Director (January 2005-December 2006), Deputy Chairman (March 2005-December 2006) and President (February 2005-March 2005) of MassMutual Holdings (Bermuda) Limited; Director (May 2008-June 2009) and Executive Vice President (June 2007-July 2009) of MML Bay State Life Insurance Company; Chief Executive Officer and President (April 2007-January 2009) of MML Distributors, LLC; and Chairman (March 2006-December 2008) and Chief Executive Officer (May 2007-December 2008) of MML Investors Services, Inc. An officer of 86 portfolios in the OppenheimerFunds complex. |
| OTHER OFFICERS OF THE FUND | | The addresses of the Officers in the chart below are as follows: for Messrs. Kotlarz and Gabinet and Mss. Van Cleave and Nasta, Two World Financial Center, 225 Liberty Street, New York, New York 10281-1008, for Messrs. Vandehey and Wixted, 6803 S. Tucson Way, Centennial, Colorado 80112-3924. Each Officer serves for an indefinite term or until his or her resignation, retirement, death or removal. |
| |
Julie Van Cleave, Vice President (since 2010) Age: 53 | | Vice President of the Sub-Adviser (since April 2010); a Chartered Financial Analyst. Prior to joining the Sub-Adviser, a Managing Director, U.S. Large-Cap Growth Equity, and lead portfolio manager at Deutsche Asset Management (December 2002-February 2009). Prior to 2002, a Managing Director, a portfolio manager and a team leader with Mason Street Advisors, a wholly owned subsidiary of Northwestern Mutual Life. A portfolio manager and officer of 3 portfolios in the OppenheimerFunds complex. |
| |
Michael Kotlarz, Vice President (since 2012) Age: 40 | | Vice President and Senior Research Analyst of the Sub-Adviser (since March 2008). Prior to joining the Sub-Adviser, a Managing Director of Equity Research at Ark Asset Management (March 2000-March 2008). Mr. Kotlarz is a portfolio manager and officer of 3 portfolios in the OppenheimerFunds complex. |
| |
Arthur S. Gabinet, Secretary and Chief Legal Officer (since 2011) Age: 54 | | General Counsel of OppenheimerFunds (since January 2013); Executive Vice President, Secretary and General Counsel of the Manager (since January 2013); General Counsel OFI SteelPath, Inc. (since January 2013); Executive Vice President (May 2010-December 2012) and General Counsel (since January 2011) of the Sub-Adviser; General Counsel of the Distributor (since January 2011); General Counsel of Centennial Asset Management Corporation (January 2011-December 2012); Executive Vice President (January 2011-December 2012) and General Counsel of HarbourView Asset Management Corporation (since January 2011); Assistant Secretary (since January 2011) and Director (since January 2011) of OppenheimerFunds International Ltd. and OppenheimerFunds plc; Director of Oppenheimer Real Asset Management, Inc. (January 2011-December 2012) and General Counsel (since January 2011); Executive Vice President (January 2011-December 2011) and General Counsel of Shareholder Financial Services, Inc. and Shareholder Services, Inc. (since January 2011); Executive Vice President (January 2011-December 2012) and General Counsel of OFI Private Investments Inc. (since January 2011); Vice President of OppenheimerFunds Legacy Program (January 2011-December 2011); Executive Vice President (January 2011-December 2012) and General Counsel of OFI Institutional Asset Management, Inc. (since January 2011); General Counsel, Asset Management of the Sub-Adviser (May 2010-December 2010); Principal, The Vanguard Group (November 2005-April 2010); District Administrator, U.S. Securities and Exchange Commission (January 2003-October 2005). An officer of 86 portfolios in the OppenheimerFunds complex. |
| |
Christina M. Nasta, Vice President and Chief Business Officer
(since 2011) Age: 39 | | Senior Vice President of OppenheimerFunds Distributor, Inc. (since January 2013); Senior Vice President of the Sub-Adviser (July 2010-December 2012); Vice President of the Sub-Adviser (January 2003-July 2010); Vice President of OppenheimerFunds Distributor, Inc. (January 2003-July 2010). An officer of 86 portfolios in the OppenheimerFunds complex. |
| |
Mark S. Vandehey, Vice President and Chief Compliance Officer
(since 2004) Age: 62 | | Chief Compliance Officer of OppenheimerFunds (since January 2013); Senior Vice President and Chief Compliance Officer of the Manager (since January 2013); Chief Compliance Officer of OFI SteelPath, Inc. (since January 2013); Senior Vice President of the Sub-Adviser (March 2004-December 2012); Chief Compliance Officer of the Sub-Adviser, OppenheimerFunds Distributor, Inc., OFI Trust Company, OFI Institutional Asset Management, Inc., Oppenheimer Real Asset Management, Inc., OFI Private Investments, Inc., Harborview Asset Management Corporation, Trinity Investment Management Corporation, and Shareholder Services, Inc. (since March 2004); Vice President of OppenheimerFunds Distributor, Inc., Centennial Asset Management Corporation and Shareholder Services, Inc. (June 1983-December 2012). An officer of 86 portfolios in the OppenheimerFunds complex. |
| | | | |
| 28 | | | | OPPENHEIMER CAPITAL APPRECIATION FUND/VA |
TRUSTEES AND OFFICERS BIOS Unaudited
| | |
Brian W. Wixted, Treasurer and Principal Financial & Accounting Officer
(since 1999) Age: 53 | | Senior Vice President of the Manager (since January 2013); Treasurer of the Sub-Adviser, HarbourView Asset Management Corporation, Shareholder Financial Services, Inc., Shareholder Services, Inc., and Oppenheimer Real Asset Management, Inc. (March 1999-June 2008), OFI Private Investments, Inc. (March 2000-June 2008), OppenheimerFunds International Ltd. and OppenheimerFunds plc (since May 2000), OFI Institutional Asset Management, Inc. (November 2000-June 2008), and OppenheimerFunds Legacy Program (charitable trust program established by the Sub-Adviser) (June 2003-December 2011); Treasurer and Chief Financial Officer of OFI Trust Company (since May 2000); Assistant Treasurer of Oppenheimer Acquisition Corporation (March 1999-June 2008). An officer of 86 portfolios in the OppenheimerFunds complex. |
The Fund’s Statement of Additional Information contains additional information about the Fund’s Trustees and Officers and is available without charge, upon request, by calling 1.800.988.8287.
| | | | |
| 29 | | | | OPPENHEIMER CAPITAL APPRECIATION FUND/VA |
THIS PAGE INTENTIONALLY LEFT BLANK.
THIS PAGE INTENTIONALLY LEFT BLANK.
OPPENHEIMER CAPITAL APPRECIATION FUND/VA
| | |
| A Series of Oppenheimer Variable Account Funds |
| Manager | | OFI Global Asset Management, Inc |
| Sub-Adviser | | OppenheimerFunds, Inc. |
| Distributor | | OppenheimerFunds Distributor, Inc. |
| Transfer and Shareholder Servicing Agent | | OFI Global Asset Management, Inc. |
| Sub-Transfer Agent | | Shareholder Services, Inc. DBA OppenheimerFunds Services |
| Independent Registered Public Accounting Firm | | KPMGLLP |
| Counsel | | K&L Gates LLP |
Before investing, investors should carefully consider a fund’s investment objectives, risks, charges and expenses. Fund prospectuses and summary prospectuses contain this and other information about the funds, and may be obtained by asking your financial advisor, or calling us at 1.800.988.8287. Read prospectuses and summary prospectuses carefully before investing.
| | |
| ©2013 OppenheimerFunds, Inc. All rights reserved. | | |
December 31, 2012
| | | | |
| | | |
| | | Oppenheimer Core Bond Fund/VA A Series of Oppenheimer Variable Account Funds | | Annual Report |
ANNUAL REPORT
Fund Allocations
Fund Performance Discussion
Financial Statements

OPPENHEIMER CORE BOND FUND/VA
Portfolio Managers: Krishna Memani and Peter A. Strzalkowski, CFA
| | | | | | |
Average Annual Total Returns For the Periods Ended 12/31/12 |
| | | |
| | | 1-Year | | 5-Year | | 10-Year |
| Non-Service Shares | | 10.29% | | –2.33% | | 1.22% |
| Service Shares | | 10.17 | | –2.54 | | 0.97 |
The performance data quoted represents past performance, which does not guarantee future results. The investment return and principal value of an investment in the Fund will fluctuate so that an investor’s shares, when redeemed, may be worth more or less than their original cost. Current performance may be lower or higher than the performance quoted. For performance data current to the most recent month end, call us at 1.800.988.8287. The Fund’s total returns should not be expected to be the same as the returns of other funds, whether or not both funds have the same portfolio managers and/or similar names. The Fund’s total returns include changes in share price and reinvested distributions but do not include the charges associated with the separate account products that offer this Fund. Such performance would have been lower if such charges were taken into account.
| | |
| Corporate Bonds & Notes—Top Ten Industries | | |
| Oil, Gas & Consumable Fuels | | 4.0% |
| Capital Markets | | 3.5 |
| Insurance | | 3.1 |
| Commercial Banks | | 3.1 |
| Media | | 2.6 |
| Diversified Telecommunication Services | | 2.2 |
| Diversified Financial Services | | 2.0 |
| Real Estate Investment Trusts (REITs) | | 1.6 |
| Specialty Retail | | 1.4 |
| Metals & Mining | | 1.3 |
Portfolio holdings and allocations are subject to change. Percentages are as of December 31, 2012, and are based on net assets.
| | | | |
| Credit Rating Breakdown | | NRSRO Only Total | |
| AAA | | | 54.7 | % |
| AA | | | 2.6 | |
| A | | | 7.7 | |
| BBB | | | 24.3 | |
| BB | | | 6.1 | |
| B | | | 0.3 | |
| CCC | | | 2.7 | |
| CC | | | 0.5 | |
| D | | | 0.8 | |
| Unrated | | | 0.1 | |
| Other Securities | | | 0.2 | |
| Total | | | 100.0 | % |
The percentages above are based on the market value of the Fund’s securities as of December 31, 2012, and are subject to change. Except for securities labeled “Unrated” and except for certain securities issued or guaranteed by a foreign sovereign, all securities have been rated by at least one Nationally Recognized Statistical Rating Organization (“NRSRO”), such as Standard & Poor’s (“S&P”). For securities rated only by an NRSRO other than S&P, OppenheimerFunds, Inc. converts that rating to the equivalent S&P rating. If two or more NRSROs have assigned a rating to a security, the highest S&P equivalent rating is used. Unrated securities issued or guaranteed by a foreign sovereign are assigned a credit rating equal to the highest NRSRO rating assigned to that foreign sovereign. Fund assets invested in Oppenheimer Institutional Money Market Fund are assigned that fund’s S&P rating, which is currently AAA. For the purposes of this table, “investment-grade” securities are securities rated within the NRSROs’ four highest rating categories (AAA, AA, A and BBB). Unrated securities do not necessarily indicate low credit quality, and may or may not be the equivalent of investment-grade. Please consult the Fund’s prospectus and Statement of Additional Information for further information.
| | | | |
| 2 | | | | OPPENHEIMER CORE BOND FUND/VA |
FUND PERFORMANCE DISCUSSION
The Fund’s Non-Service shares produced a total return of 10.29% during the one-year period ended December 31, 2012. On a relative basis, the Fund outperformed the Barclays Capital U.S. Aggregate Bond Index, the Barclays Capital Credit Index and the Citigroup Broad Investment Grade Bond Index, which returned 4.22%, 9.37% and 4.23%, respectively. The Fund’s focus on positions that can potentially boost income above that of the benchmarks benefited performance this period.
Economic and Market Environment
Higher-yielding fixed-income securities and domestic equities generally produced positive returns this period. The period began during a time of improved market sentiment in which the United States managed to avoid a return to recession and European policymakers appeared to take steps to address the region’s sovereign debt and banking sector crises. Renewed investor optimism helped produce gains in the U.S. risk markets as well as across a number of international markets over the first three months of 2012. The rebound gained momentum after the European Central Bank (the “ECB”) implemented dual Long-Term Refinancing Operations (“LTROs”) to enhance liquidity for troubled banks and reduce rates on newly issued sovereign debt securities.
The second quarter was more volatile for the markets. In the U.S., slower than expected first quarter growth contributed to a sell-off in the U.S. markets. Consumer confidence dropped as U.S. unemployment figures ticked slightly upwards after showing signs of improvement from the recession highs. The fear of contagion from the worsening European sovereign debt crisis and a recession across much of Europe drove negative market sentiment, particularly over May and June.
In the second half of the period, the risk markets resumed an upward trend as certain events appeared to help calm market jitters. Investors had been deeply concerned about the possibility of Greece pulling out of the euro and its ramifications for the future of the Eurozone and its common currency. The results of elections in Greece and continued efforts by European policymakers to stabilize the situation in the region made far less likely the imminent fracturing of the Eurozone and the serious consequences that might have for the euro.
The markets responded positively to Central Banks continued efforts to stimulate economic growth. Following the dual LTROs, further action was taken, as the ECB committed to potentially unlimited bond purchases to ease financing pressure on countries like Spain and Italy. Under the plan, these and other members of the European Union (excluding Greece) would be able to maintain access to funding at sustainable interest rates, on the condition that they continue with strict reform programs.
In the U.S., the Federal Reserve (the “Fed”) introduced a third round of quantitative easing (“QE3”), under which it announced plans to purchase mortgage-backed bonds on a monthly basis until the labor market shows signs of substantial improvement. While these actions and a last minute temporary resolution of the so-called fiscal cliff enacted by the U.S. Congress largely prevented the markets from trading in negative territory in the final quarter, a number of concerns throughout the globe remained and presented the possibility for future market volatility.
Fund Review
The Fund’s continued favoring of spread products, particularly mortgage-backed obligations, over government debt contributed to its positive performance this period. Among mortgage-backed obligations, the Fund’s allocation to residential mortgage-backed securities, commercial mortgage-backed securities and asset-backed securities, all contributed positively to performance. These securities benefited from an ongoing recovery in housing in addition to the stabilization of commercial real estate. The Fund also received positive contributions from investment grade corporate bonds and high yield debt.
While our focus on spread products over government debt benefited Fund performance this period, U.S. Treasuries did produce positive returns, and so our limited exposure to them was the primary detractor from relative performance. Separately, the Fund held a neutral view of interest rates relative to the Barclays Capital U.S. Aggregate Bond Index.
| | | | |
| 3 | | | | OPPENHEIMER CORE BOND FUND/VA |
FUND PERFORMANCE DISCUSSION
Outlook
The markets in the U.S. may continue to see some volatility given the ongoing debate on the deficit, spending and taxes. However, markets seemed to welcome the actions taken by the Fed and other Central Banks this period and we believe that the Fed will continue to respond to any downdraft in the domestic economy. We believe these stimulative measures have the potential to have a positive effect on economies and animal spirits globally, and look for the U.S. to continue to grow at a slow to moderate rate. Such a macro environment is behind our bias to overweight domestic spread product at the expense of low-yielding U.S. Treasuries.
Investors should consider the Fund’s investment objective, risks, charges and expenses carefully before investing. The Fund’s prospectus and summary prospectus contain this and other information about the Fund, and may be obtained by asking your financial advisor or calling us at 1.800.988.8287. Read prospectuses and summary prospectuses carefully before investing.
Total returns include changes in share price and reinvestment of dividends and capital gains distributions in a hypothetical investment for the periods shown.
The Fund’s investment strategy and focus can change over time. The mention of specific fund holdings does not constitute a recommendation by OppenheimerFunds, Inc. or its affiliates.
Shares of Oppenheimer funds are not deposits or obligations of any bank, are not guaranteed by any bank, are not insured by the FDIC or any other agency, and involve investment risks, including the possible loss of the principal amount invested.
Comparing the Fund’s Performance to the Market. The graphs that follow show the performance of a hypothetical $10,000 investment in each share class of the Fund held until December 31, 2012. Performance is measured over a ten-fiscal-year period for both Classes. Performance information does not reflect charges that apply to separate accounts investing in the Fund. If these charges were taken into account, performance would be lower. The graphs assume that all dividends and capital gains distributions were reinvested in additional shares.
The Fund’s performance is compared to the performance of the Citigroup Broad Investment Grade Bond Index, an index of institutionally traded U.S. Treasury Bonds, government-sponsored bonds, mortgage-backed securities and corporate securities; the Barclays Capital U.S. Aggregate Bond Index, an index of U.S. corporate and government bonds, and the Barclays Capital Credit Index, an index of non-convertible U.S. investment grade corporate bonds. The indices are unmanaged and cannot be purchased directly by investors. Index performance is shown for illustrative purposes only and does not predict or depict the performance of the Fund. While index comparisons may be useful to provide a benchmark for the Fund’s performance, it must be noted that the Fund’s investments are not limited to the investments comprising the indices.
| | | | |
| 4 | | | | OPPENHEIMER CORE BOND FUND/VA |
FUND PERFORMANCE DISCUSSION
Non-Service Shares
Comparison of Change in Value of $10,000 Hypothetical Investments in:
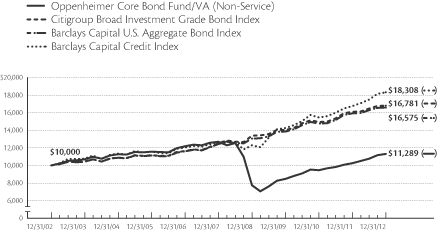
Average Annual Total Returns of Non-Service Shares of the Fund at 12/31/12
1-Year 10.29% 5-Year –2.33% 10-Year 1.22%
Service Shares
Comparison of Change in Value of $10,000 Hypothetical Investments in:
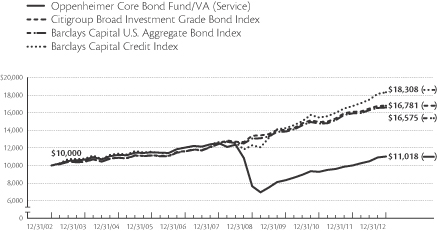
Average Annual Total Returns of Service Shares of the Fund at 12/31/12
1-Year 10.17% 5-Year –2.54% 10-Year 0.97%
The performance data quoted represents past performance, which does not guarantee future results. The investment return and principal value of an investment in the Fund will fluctuate so that an investor’s shares, when redeemed, may be worth more or less than their original cost. Current performance may be lower or higher than the performance quoted. For performance data current to the most recent month end, call us at 1.800.988.8287. The Fund’s total returns should not be expected to be the same as the returns of other funds, whether or not both funds have the same portfolio managers and/or similar names. The Fund’s total returns include changes in share price and reinvested distributions but do not include the charges associated with the separate account products that offer this Fund. Such performance would have been lower if such charges were taken into account.
| | | | |
| 5 | | | | OPPENHEIMER CORE BOND FUND/VA |
FUND EXPENSES
Fund Expenses. As a shareholder of the Fund, you incur two types of costs: (1) transaction costs and (2) ongoing costs, including management fees; distribution and service fees; and other Fund expenses. These examples are intended to help you understand your ongoing costs (in dollars) of investing in the Fund and to compare these costs with the ongoing costs of investing in other mutual funds.
The examples are based on an investment of $1,000.00 invested at the beginning of the period and held for the entire 6-month period ended December 31, 2012.
Actual Expenses. The first section of the table provides information about actual account values and actual expenses. You may use the information in this section for the class of shares you hold, together with the amount you invested, to estimate the expense that you paid over the period. Simply divide your account value by $1,000.00 (for example, an $8,600.00 account value divided by $1,000.00 = 8.60), then multiply the result by the number in the first section under the heading entitled “Expenses Paid During Period” to estimate the expenses you paid on your account during this period.
Hypothetical Example for Comparison Purposes. The second section of the table provides information about hypothetical account values and hypothetical expenses based on the Fund’s actual expense ratio for each class of shares, and an assumed rate of return of 5% per year for each class before expenses, which is not the actual return. The hypothetical account values and expenses may not be used to estimate the actual ending account balance or expenses you paid for the period. You may use this information to compare the ongoing costs of investing in the Fund and other funds. To do so, compare this 5% hypothetical example for the class of shares you hold with the 5% hypothetical examples that appear in the shareholder reports of the other funds.
Please note that the expenses shown in the table are meant to highlight your ongoing costs only and do not reflect any charges associated with the separate accounts that offer this Fund. Therefore, the “hypothetical” lines of the table are useful in comparing ongoing costs only, and will not help you determine the relative total costs of owning different funds. In addition, if these separate account charges were included your costs would have been higher.
| | | | | | | | | | | | |
| Actual | | Beginning
Account
Value
July 1, 2012 | | | Ending
Account
Value
December 31, 2012 | | | Expenses
Paid During
6 Months Ended
December 31, 2012 | |
| Non-Service Shares | | $ | 1,000.00 | | | $ | 1,050.90 | | | $ | 3.93 | |
| Service Shares | | | 1,000.00 | | | | 1,051.50 | | | | 5.22 | |
| | | |
Hypothetical
(5% return before expenses) | | | | | | | | | |
| Non-Service Shares | | | 1,000.00 | | | | 1,021.32 | | | | 3.87 | |
| Service Shares | | | 1,000.00 | | | | 1,020.06 | | | | 5.14 | |
Expenses are equal to the Fund’s annualized expense ratio for that class, multiplied by the average account value over the period, multiplied by 184/366 (to reflect the one-half year period). Those annualized expense ratios, excluding indirect expenses from affiliated fund, based on the 6-month period ended December 31, 2012 are as follows:
| | | | |
| Class | | Expense Ratios | |
| Non-Service shares | | | 0.76 | % |
| Service shares | | | 1.01 | |
The expense ratios reflect voluntary waivers and/or reimbursements of expenses by the Fund’s Manager. Some of these undertakings may be modified or terminated at any time, as indicated in the Fund’s prospectus. The “Financial Highlights” tables in the Fund’s financial statements, included in this report, also show the gross expense ratios, without such waivers or reimbursements and reduction to custodian expenses, if applicable.
| | | | |
| 6 | | | | OPPENHEIMER CORE BOND FUND/VA |
STATEMENT OF INVESTMENTS December 31, 2012
| | | | | | | | |
| | | Principal
Amount | | | Value | |
| | | | | | | | | |
| Asset-Backed Securities—10.5% | | | | | | | | |
AESOP Funding II LLC,
Automobile Receivables Nts.,
Series 2011-1A, Cl. A,
1.85%, 11/20/131 | | $ | 235,000 | | | $ | 237,372 | |
Ally Master Owner Trust,
Asset-Backed Nts.,
Series 2012-2, Cl. A, 0.709%, 3/15/162 | | | 515,000 | | | | 515,408 | |
American Credit Acceptance Receivables Trust 2012-2,
Automobile Receivables-Backed Nts.,
Series 2012-2, Cl. A, 1.89%, 7/15/161 | | | 462,904 | | | | 465,064 | |
American Credit Acceptance Receivables Trust 2012-3,
Automobile Receivable Nts.:
Series 2012-3, Cl. A, 1.64%, 11/15/161 | | | 185,000 | | | | 185,091 | |
| Series 2012-3, Cl. C, 2.78%, 9/17/181 | | | 90,000 | | | | 90,045 | |
AmeriCredit Automobile
Receivables Trust 2010-1,
Automobile Receivables-Backed Nts.,
Series 2010-1, Cl. D, 6.65%, 7/17/17 | | | 300,000 | | | | 319,183 | |
AmeriCredit Automobile
Receivables Trust 2010-2,
Automobile Receivables-Backed Nts.:
Series 2010-2, Cl. C, 4.52%, 10/8/15 | | | 430,000 | | | | 445,490 | |
| Series 2010-2, Cl. D, 6.24%, 6/8/16 | | | 275,000 | | | | 296,289 | |
AmeriCredit Automobile
Receivables Trust 2011-1,
Automobile Receivables-Backed Nts.,
Series 2011-1, Cl. D, 4.26%, 2/8/17 | | | 120,000 | | | | 127,695 | |
AmeriCredit Automobile
Receivables Trust 2011-2,
Automobile Receivables-Backed Nts.:
Series 2011-2, Cl. B, 2.33%, 3/8/16 | | | 440,000 | | | | 447,728 | |
| Series 2011-2, Cl. D, 4%, 5/8/17 | | | 525,000 | | | | 553,254 | |
AmeriCredit Automobile
Receivables Trust 2011-4,
Automobile Receivables-Backed Nts.,
Series 2011-4, Cl. D, 4.08%, 7/10/17 | | | 650,000 | | | | 683,199 | |
AmeriCredit Automobile
Receivables Trust 2011-5,
Automobile Receivables-Backed Nts.,
Series 2011-5, Cl. D, 5.05%, 12/8/17 | | | 435,000 | | | | 470,785 | |
AmeriCredit Automobile
Receivables Trust 2012-1,
Automobile Receivables-Backed Nts.,
Series 2012-1, Cl. D, 4.72%, 3/8/18 | | | 425,000 | | | | 458,520 | |
AmeriCredit Automobile
Receivables Trust 2012-2,
Automobile Receivables-Backed Nts.,
Series 2012-2, Cl. D, 3.38%, 4/9/18 | | | 695,000 | | | | 719,957 | |
AmeriCredit Automobile
Receivables Trust 2012-5,
Automobile Receivables-Backed Nts.,
Series 2012-5, Cl. D, 2.35%, 12/10/18 | | | 365,000 | | | | 365,043 | |
| | | | | | | | |
| | | Principal
Amount | | | Value | |
| | | | | | | | | |
| Asset-Backed Securities Continued | | | | | | | | |
Avis Budget Rental Car
Funding AESOP LLC,
Automobile Receivable Nts.:
Series 2010-3A, Cl. A, 4.64%, 5/20/161 | | $ | 240,000 | | | $ | 259,710 | |
| Series 2011-2A, Cl. A, 2.37%, 11/20/141 | | | 455,000 | | | | 466,658 | |
| Series 2012-1A, Cl. A, 2.054%, 8/20/161 | | | 765,000 | | | | 784,825 | |
Centre Point Funding LLC,
Asset-Backed Nts.,
Series 2010-1A, Cl. 1, 5.43%, 7/20/151 | | | 71,415 | | | | 76,950 | |
Citibank Credit Card Issuance Trust,
Credit Card Receivable Nts.,
Series 2003-C4, Cl. C4, 5%, 6/10/15 | | | 310,000 | | | | 315,674 | |
Citibank Omni Master Trust,
Credit Card Receivables Nts.,
Series 2009-A17, Cl. A17,
4.90%, 11/15/181 | | | 365,000 | | | | 393,910 | |
CPS Auto Trust,
Automobile Receivable Nts.:
Series 2012-B, Cl. A, 3.09%, 9/1/191 | | | 516,975 | | | | 519,089 | |
| Series 2012-C, Cl. A, 1.82%, 12/16/191 | | | 178,911 | | | | 179,048 | |
Credit Acceptance Auto Loan Trust,
Automobile Receivable Nts.:
Series 2012-1A, Cl. A, 2.20%, 9/16/191 | | | 260,000 | | | | 261,617 | |
| Series 2012-2A, Cl. A, 1.52%, 3/15/201 | | | 155,000 | | | | 155,135 | |
| Series 2012-2A, Cl. B, 2.21%, 9/15/201 | | | 80,000 | | | | 80,934 | |
DSC Floorplan Master Owner Trust,
Automobile Receivable Nts.,
Series 2011-1, Cl. A, 3.91%, 3/15/16 | | | 400,000 | | | | 408,068 | |
DT Auto Owner Trust 2010-1A,
Automobile Receivable Nts.,
Series 2010-1A, Cl. D, 5.92%, 9/15/161 | | | 310,000 | | | | 312,418 | |
DT Auto Owner Trust 2011-1A,
Automobile Receivable Nts.,
Series 2011-1A, Cl. C, 3.05%, 8/15/151 | | | 421,882 | | | | 423,192 | |
DT Auto Owner Trust 2011-2A,
Automobile Receivable Nts.,
Series 2011-2A, Cl. C, 3.05%, 7/15/131 | | | 134,000 | | | | 134,064 | |
DT Auto Owner Trust 2011-3A,
Automobile Receivable Nts.,
Series 2011-3A, Cl. C, 4.03%, 12/15/411 | | | 435,000 | | | | 440,153 | |
DT Auto Owner Trust 2012-1A,
Automobile Receivable Nts.,
Series 2012-1A, Cl. A, 1.05%, 1/15/151 | | | 199,644 | | | | 199,771 | |
DT Auto Owner Trust 2012-2,
Automobile Receivable Nts.:
Series 2012-2, Cl. C, 2.72%, 4/17/171 | | | 55,000 | | | | 55,147 | |
| Series 2012-2, Cl. D, 4.35%, 3/15/191 | | | 130,000 | | | | 131,959 | |
Enterprise Fleet Financing LLC,
Automobile Receivable Nts.,
Series 2012-2, Cl. A2,
0.72%, 11/20/171,2 | | | 60,000 | | | | 60,045 | |
Exeter Automobile Receivables Trust,
Automobile Receivable Nts.:
Series 2012-1A, Cl. A, 2.02%, 8/15/161 | | | 208,149 | | | | 209,725 | |
| | | | |
| 7 | | | | OPPENHEIMER CORE BOND FUND/VA |
| | | | | | | | |
| | | Principal
Amount | | | Value | |
| | | | | | | | | |
| Asset-Backed Securities Continued | | | | | | | | |
Exeter Automobile Receivables Trust,
Automobile Receivable Nts.: Continued | | | | | |
| Series 2012-2A, Cl. A, 1.30%, 6/15/171 | | $ | 224,455 | | | $ | 225,218 | |
| Series 2012-2A, Cl. B, 2.22%, 12/15/171 | | | 205,000 | | | | 208,026 | |
First Investors Auto
Owner Trust 2011-1,
Automobile Receivable Nts.,
Series 2011-1, Cl. A2, 1.47%, 3/16/15 | | | 59,178 | | | | 59,183 | |
Ford Credit Floorplan Master
Owner Trust,
Automobile Receivable Nts.,
Series 2012-1, Cl. C, 1.709%, 1/15/162 | | | 200,000 | | | | 201,106 | |
Hertz Vehicle Financing LLC,
Automobile Receivable Nts.,
Series 2010-1A, Cl. A1, 2.60%, 2/25/151 | | | 1,015,000 | | | | 1,034,693 | |
Santander Drive
Auto Receivables Trust 2010-3,
Automobile Receivables Nts.,
Series 2010-3, Cl. C, 3.06%, 11/15/17 | | | 485,000 | | | | 501,107 | |
Santander Drive
Auto Receivables Trust 2010-B,
Automobile Receivables Nts.,
Series 2010-B, Cl. C, 3.02%, 10/17/161 | | | 470,000 | | | | 478,828 | |
Santander Drive
Auto Receivables Trust 2011-1,
Automobile Receivables Nts.,
Series 2011-1, Cl. D, 4.01%, 2/15/17 | | | 465,000 | | | | 485,973 | |
Santander Drive
Auto Receivables Trust 2011-4,
Automobile Receivables Nts.,
Series 2011-4, Cl. B, 2.90%, 5/16/16 | | | 180,000 | | | | 184,654 | |
Santander Drive
Auto Receivables Trust 2011-S1A,
Automobile Receivables Nts.,
Series 2011-S1A, Cl. D, 3.10%, 5/15/171 | | | 269,032 | | | | 269,831 | |
Santander Drive
Auto Receivables Trust 2011-S2A,
Automobile Receivables Nts.,
Series 2011-S2A, Cl. D, 3.35%, 6/15/173 | | | 217,426 | | | | 218,594 | |
Santander Drive
Auto Receivables Trust 2012-2,
Automobile Receivables Nts.,
Series 2012-2, Cl. D, 3.87%, 2/15/18 | | | 545,000 | | | | 571,941 | |
Santander Drive
Auto Receivables Trust 2012-4,
Automobile Receivables Nts.:
Series 2012-4, Cl. A3, 1.04%, 8/15/16 | | | 330,000 | | | | 332,274 | |
| Series 2012-4, Cl. D, 3.50%, 6/15/18 | | | 120,000 | | | | 124,926 | |
Santander Drive
Auto Receivables Trust 2012-5,
Automobile Receivables Nts.,
Series 2012-5, Cl. D, 3.30%, 9/17/18 | | | 235,000 | | | | 242,327 | |
| | | | | | | | |
| | | Principal
Amount | | | Value | |
| | | | | | | | | |
| Asset-Backed Securities Continued | | | | | | | | |
Santander Drive
Auto Receivables Trust 2012-6,
Automobile Receivables Nts.,
Series 2012-6, Cl. D, 2.52%, 10/15/18 | | $ | 230,000 | | | $ | 230,084 | |
SNAAC Auto Receivables Trust,
Automobile Receivable Nts.,
Series 2012-1A, Cl. A, 1.78%, 6/15/161 | | | 222,863 | | | | 223,888 | |
United Auto Credit
Securitization Trust 2012-1,
Automobile Receivables Nts.:
Series 2012-1, Cl. A2, 1.10%, 3/16/15 | | | 155,000 | | | | 155,078 | |
| Series 2012-1, Cl. B, 1.87%, 9/15/15 | | | 265,000 | | | | 265,222 | |
| Series 2012-1, Cl. C, 2.52%, 3/15/16 | | | 190,000 | | | | 190,154 | |
| Series 2012-1, Cl. D, 3.12%, 3/15/18 | | | 135,000 | | | | 135,134 | |
Westlake Automobile
Receivables Trust 2012-1,
Automobile Receivable Nts.,
Series 2012-1, Cl. D, 1.03%, 6/16/142,3 | | | 155,000 | | | | 155,164 | |
Wheels SPV LLC,
Asset-Backed Nts.,
Series 2012-1, Cl. A2, 1.19%, 3/20/211 | | | 260,000 | | | | 261,881 | |
World Financial Network Credit
Card Master Note Trust,
Credit Card Receivables,
Series 2012-B, Cl. A, 1.76%, 5/17/21 | | | 185,000 | | |
| 187,267
|
|
Total Asset-Backed Securities
(Cost $18,921,903) | | | | | | | 19,190,768 | |
| Mortgage-Backed Obligations—60.5% | |
| Government Agency—48.5% | | | | | | | | |
| FHLMC/FNMA/FHLB/Sponsored—48.0% | |
| Federal Home Loan Mortgage Corp.: 3.50%, 1/1/434 | | | 1,430,000 | | | | 1,521,051 | |
| 5%, 12/15/34 | | | 12,363 | | | | 13,428 | |
| 5.50%, 9/1/39 | | | 1,009,850 | | | | 1,102,502 | |
| 6%, 5/15/18-10/15/29 | | | 1,833,415 | | | | 1,999,694 | |
| 6.50%, 4/15/18-4/1/34 | | | 439,010 | | | | 499,005 | |
| 7%, 8/15/16-10/1/37 | | | 498,922 | | | | 584,503 | |
| 8%, 4/1/16 | | | 106,908 | | | | 114,355 | |
| 9%, 8/1/22-5/1/25 | | | 47,794 | | | | 55,138 | |
| 10.50%, 11/14/20 | | | 2,344 | | | | 2,842 | |
Federal Home Loan Mortgage Corp.,
Gtd. Real Estate Mtg. Investment Conduit Multiclass
Pass-Through Certificates:
Series 151, Cl. F, 9%, 5/15/21 | | | 12,115 | | | | 13,904 | |
| Series 1674, Cl. Z, 6.75%, 2/15/24 | | | 37,686 | | | | 42,843 | |
Series 2006-11, Cl. PS,
23.798%, 3/25/362 | | | 267,794 | | | | 392,828 | |
| Series 2034, Cl. Z, 6.50%, 2/15/28 | | | 4,564 | | | | 5,233 | |
| Series 2042, Cl. N, 6.50%, 3/15/28 | | | 11,759 | | | | 13,476 | |
| Series 2043, Cl. ZP, 6.50%, 4/15/28 | | | 531,612 | | | | 612,942 | |
| Series 2046, Cl. G, 6.50%, 4/15/28 | | | 32,782 | | | | 37,575 | |
| Series 2053, Cl. Z, 6.50%, 4/15/28 | | | 5,589 | | | | 6,406 | |
| Series 2066, Cl. Z, 6.50%, 6/15/28 | | | 589,967 | | | | 676,978 | |
| Series 2195, Cl. LH, 6.50%, 10/15/29 | | | 444,805 | | | | 510,934 | |
| | | | |
| 8 | | | | OPPENHEIMER CORE BOND FUND/VA |
STATEMENT OF INVESTMENTS Continued
| | | | | | | | |
| | | Principal
Amount | | | Value | |
| | | | | | | | | |
| FHLMC/FNMA/FHLB/Sponsored Continued | |
Federal Home Loan Mortgage Corp.,
Gtd. Real Estate Mtg. Investment Conduit Multiclass
Pass-Through Certificates: Continued | | | | | | | | |
| Series 2220, Cl. PD, 8%, 3/15/30 | | $ | 2,280 | | | $ | 2,711 | |
| Series 2326, Cl. ZP, 6.50%, 6/15/31 | | | 121,775 | | | | 140,428 | |
| Series 2461, Cl. PZ, 6.50%, 6/15/32 | | | 592,522 | | | | 684,434 | |
| Series 2470, Cl. LF, 1.209%, 2/15/322 | | | 4,919 | | | | 5,035 | |
| Series 2500, Cl. FD, 0.709%, 3/15/322 | | | 121,827 | | | | 123,319 | |
| Series 2526, Cl. FE, 0.609%, 6/15/292 | | | 170,589 | | | | 171,939 | |
| Series 2538, Cl. F, 0.809%, 12/15/322 | | | 555,308 | | | | 561,434 | |
| Series 2551, Cl. FD, 0.609%, 1/15/332 | | | 108,574 | | | | 109,515 | |
| Series 2936, Cl. PE, 5%, 2/1/35 | | | 69,000 | | | | 77,185 | |
| Series 3025, Cl. SJ, 23.984%, 8/15/352 | | | 55,606 | | | | 82,810 | |
| Series 3822, Cl. JA, 5%, 6/1/40 | | | 37,116 | | | | 38,723 | |
| Series 3848, Cl. WL, 4%, 4/1/40 | | | 56,098 | | | | 59,802 | |
Federal Home Loan Mortgage Corp., Interest-Only Stripped
Mtg.-Backed Security:
Series 205, Cl. IO, 14.786%, 9/1/295 | | | 15,750 | | | | 3,587 | |
| Series 206, Cl. IO, 0%, 12/1/295,6 | | | 202,796 | | | | 39,408 | |
| Series 2074, Cl. S, 57.131%, 7/17/285 | | | 3,296 | | | | 787 | |
| Series 2079, Cl. S, 67.651%, 7/17/285 | | | 5,861 | | | | 1,406 | |
| Series 2130, Cl. SC, 54.08%, 3/15/295 | | | 230,074 | | | | 55,200 | |
| Series 243, Cl. 6, 11.754%, 12/15/325 | | | 204,759 | | | | 43,976 | |
| Series 2526, Cl. SE, 39.344%, 6/15/295 | | | 7,704 | | | | 1,837 | |
| Series 2796, Cl. SD, 63.242%, 7/15/265 | | | 362,050 | | | | 79,765 | |
| Series 2802, Cl. AS, 60.762%, 4/15/335 | | | 111,324 | | | | 4,762 | |
| Series 2819, Cl. S, 54.715%, 6/15/345 | | | 74,113 | | | | 16,611 | |
| Series 2920, Cl. S, 64.688%, 1/15/355 | | | 1,368,786 | | | | 277,018 | |
| Series 2922, Cl. SE, 11.235%, 2/15/355 | | | 166,371 | | | | 39,051 | |
| Series 3004, Cl. SB, 99.999%, 7/15/355 | | | 74,433 | | | | 14,576 | |
| Series 3201, Cl. SG, 9.837%, 8/15/365 | | | 391,208 | | | | 67,361 | |
| Series 3450, Cl. BI, 14.914%, 5/15/385 | | | 890,589 | | | | 135,655 | |
| Series 3606, Cl. SN, 9.09%, 12/15/395 | | | 231,968 | | | | 35,620 | |
| Series 3662, Cl. SM, 27.282%, 10/15/325 | | | 734,994 | | | | 98,901 | |
| Series 3736, Cl. SN, 8.022%, 10/15/405 | | | 1,843,128 | | | | 313,969 | |
Federal Home Loan Mortgage Corp., Principal-Only Stripped Mtg.-Backed Security, Series 176, Cl. PO,
3.697%, 6/1/267 | | | 82,651 | | | | 72,490 | |
Federal National Mortgage Assn.:
2.50%, 1/1/284 | | | 25,510,000 | | | | 26,681,866 | |
| 2.833%, 10/1/362 | | | 156,261 | | | | 166,800 | |
| 3%, 1/1/28-1/1/434 | | | 7,305,000 | | | | 7,670,680 | |
| 3.50%, 1/1/28-1/1/434 | | | 6,960,000 | | | | 7,415,315 | |
| 4%, 1/1/434 | | | 7,770,000 | | | | 8,330,897 | |
| 4.50%, 1/1/28-1/1/434 | | | 10,510,000 | | | | 11,351,475 | |
| 5%, 2/25/22-7/25/22 | | | 10,652 | | | | 11,548 | |
| 5.50%, 2/1/35-5/1/36 | | | 505,966 | | | | 556,149 | |
| 6%, 1/1/434 | | | 160,000 | | | | 174,775 | |
| 6.50%, 5/25/17-1/1/34 | | | 739,880 | | | | 798,057 | |
| 7%, 11/1/17-7/25/35 | | | 343,124 | | | | 390,528 | |
| 7.50%, 1/1/33 | | | 9,406 | | | | 11,425 | |
| 8.50%, 7/1/32 | | | 16,341 | | | | 20,279 | |
| | | | | | | | |
| | | Principal
Amount | | | Value | |
| | | | | | | | | |
| FHLMC/FNMA/FHLB/Sponsored Continued | |
Federal National Mortgage Assn.,
Gtd. Real Estate Mtg. Investment
Conduit Multiclass
Pass-Through Certificates:
Trust 1989-17, Cl. E, 10.40%, 4/25/19 | | $ | 3,455 | | | $ | 3,617 | |
| Trust 1993-87, Cl. Z, 6.50%, 6/25/23 | | | 429,778 | | | | 489,466 | |
| Trust 1998-58, Cl. PC, 6.50%, 10/25/28 | | | 343,666 | | | | 394,155 | |
| Trust 1998-61, Cl. PL, 6%, 11/25/28 | | | 161,000 | | | | 181,768 | |
| Trust 1999-54, Cl. LH, 6.50%, 11/25/29 | | | 269,608 | | | | 308,834 | |
| Trust 2001-44, Cl. QC, 6%, 9/25/16 | | | 13,035 | | | | 13,826 | |
| Trust 2001-51, Cl. OD, 6.50%, 10/25/31 | | | 22,135 | | | | 25,590 | |
| Trust 2001-74, Cl. QE, 6%, 12/25/31 | | | 468,678 | | | | 531,162 | |
| Trust 2002-12, Cl. PG, 6%, 3/25/17 | | | 6,861 | | | | 7,376 | |
| Trust 2003-28, Cl. KG, 5.50%, 4/25/23 | | | 3,799,417 | | | | 4,179,528 | |
| Trust 2004-101, Cl. BG, 5%, 1/25/20 | | | 903,844 | | | | 961,881 | |
Trust 2006-46, Cl. SW,
23.43%, 6/25/362 | | | 198,616 | | | | 290,237 | |
Trust 2006-50, Cl. KS,
23.431%, 6/25/362 | | | 290,994 | | | | 432,540 | |
Trust 2007-109, Cl. NF,
0.76%, 12/25/372 | | | 119,223 | | | | 120,866 | |
| Trust 2007-42, Cl. A, 6%, 2/1/33 | | | 320,145 | | | | 328,710 | |
| Trust 2009-36, Cl. FA, 1.15%, 6/25/372 | | | 397,258 | | | | 403,400 | |
Federal National Mortgage Assn.,
Interest-Only Stripped
Mtg.-Backed Security:
Trust 2001-61, Cl. SH,
31.679%, 11/18/315 | | | 17,841 | | | | 3,919 | |
Trust 2001-63, Cl. SD,
31.866%, 12/18/315 | | | 5,910 | | | | 1,237 | |
Trust 2001-65, Cl. S,
30.677%, 11/25/315 | | | 447,621 | | | | 99,133 | |
Trust 2001-68, Cl. SC,
21.759%, 11/25/315 | | | 3,798 | | | | 797 | |
| Trust 2001-78, Cl. JS, 3.929%, 8/25/415 | | | 586,967 | | | | 87,295 | |
| Trust 2001-81, Cl. S, 23.898%, 1/25/325 | | | 123,610 | | | | 29,494 | |
| Trust 2002-28, Cl. SA, 38.42%, 4/25/325 | | | 3,737 | | | | 836 | |
Trust 2002-38, Cl. SO,
52.174%, 4/25/325 | | | 9,479 | | | | 2,107 | |
Trust 2002-39, Cl. SD,
43.104%, 3/18/325 | | | 6,268 | | | | 1,461 | |
| Trust 2002-47, Cl. NS, 34.61%, 4/25/325 | | | 371,887 | | | | 85,737 | |
| Trust 2002-48, Cl. S, 33%, 7/25/325 | | | 6,015 | | | | 1,359 | |
| Trust 2002-51, Cl. S, 34.839%, 8/25/325 | | | 341,394 | | | | 78,704 | |
Trust 2002-52, Cl. SD,
40.622%, 9/25/325 | | | 441,148 | | | | 102,521 | |
Trust 2002-52, Cl. SL,
36.506%, 9/25/325 | | | 3,863 | | | | 891 | |
Trust 2002-53, Cl. SK,
37.621%, 4/25/325 | | | 21,839 | | | | 5,146 | |
Trust 2002-56, Cl. SN,
34.829%, 7/25/325 | | | 8,201 | | | | 1,854 | |
Trust 2002-60, Cl. SM,
28.56%, 8/25/325 | | | 60,226 | | | | 9,866 | |
| Trust 2002-7, Cl. SK, 27.733%, 1/25/325 | | | 26,916 | | | | 4,432 | |
Trust 2002-77, Cl. BS,
22.50%, 12/18/325 | | | 36,020 | | | | 7,412 | |
| | | | |
| 9 | | | | OPPENHEIMER CORE BOND FUND/VA |
| | | | | | | | |
| | | Principal
Amount | | | Value | |
| | | | | | | | | |
| FHLMC/FNMA/FHLB/Sponsored Continued | |
Federal National Mortgage Assn.,
Interest-Only Stripped
Mtg.-Backed Security: Continued | | | | | | | | |
Trust 2002-77, Cl. IS,
47.917%, 12/18/325 | | $ | 16,150 | | | $ | 3,854 | |
Trust 2002-77, Cl. JS,
19.338%, 12/18/325 | | | 58,085 | | | | 10,742 | |
Trust 2002-77, Cl. SA,
23.182%, 12/18/325 | | | 57,592 | | | | 10,583 | |
Trust 2002-77, Cl. SH,
35.98%, 12/18/325 | | | 178,096 | | | | 41,199 | |
Trust 2002-84, Cl. SA,
34.794%, 12/25/325 | | | 429,047 | | | | 84,196 | |
Trust 2002-9, Cl. MS,
27.815%, 3/25/325 | | | 6,483 | | | | 1,468 | |
| Trust 2002-90, Cl. SN, 29.67%, 8/25/325 | | | 30,983 | | | | 5,071 | |
Trust 2002-90, Cl. SY,
37.055%, 9/25/325 | | | 21,473 | | | | 4,007 | |
| Trust 2003-26, Cl. DI, 9.821%, 4/25/335 | | | 15,162 | | | | 3,276 | |
Trust 2003-33, Cl. SP,
29.836%, 5/25/335 | | | 449,445 | | | | 74,327 | |
| Trust 2003-4, Cl. S, 29.597%, 2/25/335 | | | 288,622 | | | | 54,086 | |
Trust 2003-89, Cl. XS,
64.179%, 11/25/325 | | | 65,942 | | | | 886 | |
Trust 2004-54, Cl. DS,
49.427%, 11/25/305 | | | 314,704 | | | | 58,695 | |
Trust 2005-12, Cl. SC,
14.172%, 3/25/355 | | | 84,527 | | | | 20,891 | |
| Trust 2005-14, Cl. SE, 45.134%, 3/25/355 | | | 258,514 | | | | 40,559 | |
Trust 2005-40, Cl. SA,
55.214%, 5/25/355 | | | 711,320 | | | | 155,012 | |
| Trust 2005-40, Cl. SB, 64.711%, 5/25/355 | | | 33,292 | | | | 7,699 | |
| Trust 2005-5, Cl. SD, 11.673%, 1/25/355 | | | 338,846 | | | | 53,480 | |
Trust 2005-71, Cl. SA,
60.391%, 8/25/255 | | | 806,103 | | | | 127,344 | |
Trust 2005-93, Cl. SI,
13.557%, 10/25/355 | | | 655,338 | | | | 105,162 | |
| Trust 2007-75, Cl. BI, 7.66%, 8/25/375 | | | 1,476,015 | | | | 324,353 | |
| Trust 2008-46, Cl. EI, 17.096%, 6/25/385 | | | 919,562 | | | | 141,521 | |
Trust 2008-55, Cl. SA,
12.786%, 7/25/385 | | | 107,229 | | | | 15,631 | |
| Trust 2009-8, Cl. BS, 22.648%, 2/25/245 | | | 386,600 | | | | 39,340 | |
| Trust 221, Cl. 2, 44.378%, 5/1/235 | | | 5,748 | | | | 1,213 | |
| Trust 222, Cl. 2, 26.449%, 6/1/235 | | | 614,472 | | | | 124,050 | |
| Trust 252, Cl. 2, 42.023%, 11/1/235 | | | 557,481 | | | | 118,852 | |
| Trust 294, Cl. 2, 16.77%, 2/1/285 | | | 63,248 | | | | 10,955 | |
| Trust 301, Cl. 2, 1.394%, 4/1/295 | | | 6,326 | | | | 1,477 | |
| Trust 303, Cl. IO, 9.147%, 11/1/295 | | | 100,047 | | | | 19,683 | |
| Trust 320, Cl. 2, 10.454%, 4/1/325 | | | 426,996 | | | | 78,382 | |
| Trust 321, Cl. 2, 1.186%, 4/1/325 | | | 1,283,582 | | | | 200,151 | |
| Trust 324, Cl. 2, 0%, 7/1/325,6 | | | 13,111 | | | | 2,011 | |
| Trust 331, Cl. 5, 0%, 2/1/335,6 | | | 18,558 | | | | 3,636 | |
| Trust 331, Cl. 9, 6.955%, 2/1/335 | | | 365,614 | | | | 57,273 | |
| Trust 334, Cl. 12, 0%, 2/1/335,6 | | | 32,437 | | | | 6,023 | |
| Trust 334, Cl. 17, 14.051%, 2/1/335 | | | 253,879 | | | | 58,753 | |
| Trust 339, Cl. 12, 0.605%, 7/1/335 | | | 474,012 | | | | 84,021 | |
| Trust 339, Cl. 7, 0%, 7/1/335,6 | | | 1,032,580 | | | | 143,819 | |
| Trust 343, Cl. 13, 0.847%, 9/1/335 | | | 433,651 | | | | 60,084 | |
| Trust 343, Cl. 18, 0%, 5/1/345,6 | | | 120,065 | | | | 16,907 | |
| | | | | | | | |
| | | Principal
Amount | | | Value | |
| | | | | | | | | |
| FHLMC/FNMA/FHLB/Sponsored Continued | |
Federal National Mortgage Assn.,
Interest-Only Stripped
Mtg.-Backed Security: Continued | | | | | | | | |
| Trust 345, Cl. 9, 0%, 1/1/345,6 | | $ | 358,493 | | | $ | 44,035 | |
| Trust 351, Cl. 10, 2.407%, 4/1/345 | | | 162,743 | | | | 22,750 | |
| Trust 351, Cl. 8, 0%, 4/1/345,6 | | | 262,352 | | | | 38,715 | |
| Trust 356, Cl. 10, 0%, 6/1/355,6 | | | 202,709 | | | | 28,617 | |
| Trust 356, Cl. 12, 0%, 2/1/355,6 | | | 99,217 | | | | 13,818 | |
| Trust 362, Cl. 13, 0%, 8/1/355,6 | | | 370,494 | | | | 55,698 | |
| Trust 364, Cl. 15, 0%, 9/1/355,6 | | | 21,303 | | | | 3,022 | |
| Trust 364, Cl. 16, 0%, 9/1/355,6 | | | 421,735 | | | | 60,114 | |
| Trust 365, Cl. 16, 15.886%, 3/1/365 | | | 676,810 | | | | 98,010 | |
| Federal National Mortgage Assn., | | | | | | | | |
| Principal-Only Stripped | | | | | | | | |
| Mtg.-Backed Security, | | | | | | | | |
| Trust 1993-184, Cl. M, 4.236%, 9/25/237 | | | 192,219 | | | | 176,047 | |
| | | | | | |
|
|
|
| | | | | | | | 87,253,401 | |
| GNMA/Guaranteed—0.5% | | | | | | | | |
Government National
Mortgage Assn.:
7%, 12/29/23-3/15/26 | | | 17,300 | | | | 20,422 | |
| 8.50%, 8/1/17-12/15/17 | | | 66,720 | | | | 71,403 | |
Government National
| | | | | | | | |
Mortgage Assn., Gtd. Real Estate
Mtg. Investment Conduit
Pass-Through Certificates:
Series 1999-32, Cl. ZB, 8%, 9/16/29 | | | 63,370 | | | | 77,394 | |
| Series 2000-7, Cl. Z, 8%, 1/16/30 | | | 25,228 | | | | 30,481 | |
| Government National Mortgage | | | | | | | | |
Assn., Interest-Only Stripped
Mtg.-Backed Security:
Series 1998-19, Cl. SB,
67.193%, 7/16/285 | | | 12,803 | | | | 3,207 | |
Series 2001-21, Cl. SB,
82.28%, 1/16/275 | | | 456,401 | | | | 89,890 | |
Series 2002-15, Cl. SM,
71.344%, 2/16/325 | | | 465,687 | | | | 104,310 | |
Series 2004-11, Cl. SM,
71.621%, 1/17/305 | | | 376,783 | | | | 98,788 | |
Series 2007-17, Cl. AI,
21.583%, 4/16/375 | | | 144,735 | | | | 36,385 | |
Series 2011-52, Cl. HS,
11.748%, 4/16/415 | | | 942,919 | | | | 263,392 | |
| | | | | | |
|
|
|
| | | | | | | | 795,672 | |
| Non-Agency—12.0% | | | | | | | | |
| Commercial—7.3% | | | | | | | | |
Asset Securitization Corp., Commercial Interest-Only Stripped
Mtg.-Backed Security,
Series 1997-D4, Cl. PS1,
| | | | | | | | |
| 4.432%, 4/14/295 | | | 2,668,456 | | | | 107,469 | |
| | | | |
| 10 | | | | OPPENHEIMER CORE BOND FUND/VA |
STATEMENT OF INVESTMENTS Continued
| | | | | | | | |
| | | Principal
Amount | | | Value | |
| | | | | | | | | |
| Commercial Continued | | | | | | | | |
Banc of America Commercial
Mortgage Trust 2006-6, | | | | | | | | |
Commercial Mtg.
Pass-Through Certificates,
Series 2006-6, Cl. AM, | | | | | | | | |
| 5.39%, 10/1/45 | | $ | 425,000 | | | $ | 463,902 | |
Bear Stearns Commercial Mortgage
Securities Trust 2007-PWR17, | | | | | | | | |
Commercial Mtg.
Pass-Through Certificates,
Series 2007-PWR17, Cl. AM, | | | | | | | | |
| 5.89%, 6/1/502 | | | 440,000 | | | | 501,268 | |
Capital Lease Funding Securitization
LP, Interest-Only Corporate-Backed
Pass-Through Certificates,
Series 1997-CTL1, 99.999%, 6/15/241,5 | | | 2,358,651 | | | | 112,612 | |
CFCRE Commercial Mortgage Trust,
Commercial Mtg. Pass-Through
Certificates, Series 2011-C1, Cl. A1,
1.871%, 4/1/441 | | | 108,948 | | | | 110,951 | |
CHL Mortgage Pass-Through
Trust 2005-17, Mtg. Pass-Through
Certificates, Series 2005-17, Cl. 1A8,
5.50%, 9/1/35 | | | 54,476 | | | | 55,635 | |
CHL Mortgage Pass-Through
Trust 2007-J3, Mtg. Pass-Through
Certificates, Series 2007-J3, Cl. A9,
6%, 7/1/37 | | | 240,346 | | | | 196,884 | |
Citigroup Commercial Mortgage
Trust 2008-C7, Commercial Mtg.
Pass-Through Certificates,
Series 2008-C7, Cl. AM,
6.06%, 12/1/492 | | | 410,000 | | | | 461,298 | |
Citigroup, Inc./Deutsche Bank
2007-CD4 Commercial Mortgage
Trust, Commercial Mtg. Pass-Through
Certificates: Series 2007-CD4, Cl. A2B,
5.205%, 12/11/49 | | | 80,713 | | | | 81,915 | |
Series 2007-CD4, Cl. A4,
5.322%, 12/1/49 | | | 875,000 | | | | 1,007,437 | |
CSMC Mortgage-Backed Trust
2006-C1, Mtg. Pass-Through Certificates, Series 2006-C1, Cl. AJ,
5.409%, 2/1/392 | | | 275,000 | | | | 292,648 | |
Deutsche Mortgage & Asset Receiving,
Commercial Mtg. Pass-Through
Certificates, Interest-Only Stripped
Mtg.-Backed Security:
Series 2012-CR5, Cl. XA,
3.239%, 12/1/455 | | | 2,840,000 | | | | 351,242 | |
Series 2010-C1, Cl. XPA,
5.006%, 9/1/201,5 | | | 4,210,900 | | | | 247,845 | |
| | | | | | | | |
| | | Principal
Amount | | | Value | |
| | | | | | | | | |
| Commercial Continued | | | | | | | | |
First Horizon Alternative Mortgage
Securities Trust 2004-FA2, Mtg.
Pass-Through Certificates,
Series 2004-FA2, Cl. 3A1, 6%, 1/25/35 | | $ | 426,544 | | | $ | 436,886 | |
First Horizon Alternative Mortgage
Securities Trust 2007-FA2, Mtg.
Pass-Through Certificates,
Series 2007-FA2, Cl. 1A1,
5.50%, 4/25/37 | | | 268,339 | | | | 192,048 | |
GS Mortgage Securities Corp. II,
Commercial Mtg. Obligations,
Series 2011-GC3, Cl. A1,
2.331%, 3/1/44 | | | 273,087 | | | | 280,147 | |
GS Mortgage Securities Trust
2006-GG6, Commercial Mtg.
Pass-Through Certificates,
Series 2006-GG6, Cl. AM,
5.622%, 4/1/38 | | | 420,274 | | | | 464,523 | |
GSR Mortgage Loan Trust 2005-AR4,
Mtg. Pass-Through Certificates,
Series 2005-AR4, Cl. 6A1, 5.25%, 7/1/35 | | | 292,522 | | | | 290,266 | |
IndyMac Index Mortgage Loan
Trust 2005-AR23, Mtg.
Pass-Through Certificates,
Series 2005-AR23, Cl. 6A1,
4.931%, 11/1/352 | | | 573,655 | | | | 454,212 | |
JPMorgan Chase Commercial
Mortgage Securities Corp.,
Commercial Mtg.
Pass-Through Certificates:
Series 2011-C3, Cl. A1, 1.875%, 2/1/461 | | | 321,069 | | | | 326,763 | |
Series 2007-LDPX, Cl. A2S2,
5.187%, 1/1/491 | | | 898,443 | | | | 927,638 | |
JPMorgan Mortgage Trust 2007-S3,
Mtg. Pass-Through Certificates,
Series 2007-S3, Cl. 1A90, 7%, 8/1/37 | | | 549,602 | | | | 508,470 | |
JPMorgan, Re-Securitized Real Estate
Mtg. Investment Conduit Multiclass
Pass-Through Certificates,
Series 2009-5, Cl. 1A2, 2.614%, 7/1/361,2 | | | 419,715 | | | | 295,476 | |
Lehman Brothers Commercial Conduit
Mortgage Trust, Interest-Only
Stripped Mtg.-Backed Security,
Series 1998-C1, Cl. IO,
67.486%, 2/18/305 | | | 1,613,888 | | | | 29,667 | |
Lehman Structured Securities Corp.,
Commercial Mtg. Pass-Through
Certificates, Series 2002-GE1, Cl. A,
2.514%, 7/1/241 | | | 106,391 | | | | 93,919 | |
Merrill Lynch Mortgage Trust 2006-C2,
Commercial Mtg. Pass-Through Certificates, Series 2006-C2, Cl. AM,
5.782%, 8/1/43 | | | 425,000 | | | | 477,484 | |
| | | | |
| 11 | | | | OPPENHEIMER CORE BOND FUND/VA |
| | | | | | | | |
| | | Principal
Amount | | | Value | |
| | | | | | | | | |
| Commercial Continued | | | | | | | | |
Morgan Stanley Capital I
Trust 2007-IQ13, Commercial Mtg.
Pass-Through Certificates,
Series 2007-IQ13, Cl. AM,
5.406%, 3/1/44 | | $ | 415,000 | | | $ | 449,822 | |
Morgan Stanley Capital I
Trust 2007-IQ15, Commercial Mtg.
Pass-Through Certificates:
Series 2007-IQ15, Cl. A4,
5.882%, 6/1/492 | | | 400,000 | | | | 473,290 | |
Series 2007-IQ15, Cl. AM,
5.882%, 6/1/492 | | | 490,000 | | | | 541,595 | |
Morgan Stanley, Re-Securitized
Real Estate Mtg. Investment Conduit
Multiclass Pass-Through Certificates,
Series 2012-R3, Cl. 1B,
2.298%, 11/1/362,3 | | | 508,649 | | | | 270,415 | |
Salomon Brothers Mortgage
Securities VII, Inc., Interest-Only
Commercial Mtg. Pass-Through
Certificates, Series 1999-C1, Cl. X,
99.999%, 5/18/325 | | | 31,252,562 | | | | 27,534 | |
Structured Adjustable Rate
Mortgage Loan Trust 2006-4,
Commercial Mtg. Pass-Through Certificates, Series 2006-4, Cl. 6A,
5.333%, 5/1/362 | | | 340,720 | | | | 282,814 | |
Structured Adjustable Rate Mortgage
Loan Trust 2007-6, Mtg. Pass-Through
Certificates, Series 2007-6, Cl. 3A1,
4.82%, 7/1/372 | | | 559,842 | | | | 433,270 | |
UBS-Barclays Commercial Mortgage Trust 2012-C2, Commerical
Mtg. Pass-Through
Certificates, Series 2012-C2, Cl. E,
4.893%, 5/1/631,2 | | | 35,000 | | | | 31,717 | |
Wachovia Bank Commercial Mortgage
Trust 2003-C5, Commercial Mtg.
Pass-Through Certificates,
Series 2003-C5, Cl. A2, 3.989%, 6/1/35 | | | 107,437 | | | | 108,199 | |
Wachovia Bank Commercial Mortgage
Trust 2006-C28, Commercial Mtg.
Pass-Through Certificates,
Series 2006-C28, Cl. AM,
5.603%, 10/1/482 | | | 450,000 | | | | 494,346 | |
Wachovia Bank Commercial Mortgage
Trust 2007-C34, Commercial Mtg.
Pass-Through Certificates,
Series 2007-C34, Cl. A3, 5.678%, 5/1/46 | | | 520,000 | | | | 612,280 | |
WaMu Mortgage Pass-Through Certificates 2005-AR14 Trust,
Mtg. Pass-Through Certificates,
Series 2005-AR14, Cl. 1A4,
2.536%, 12/1/352 | | | 320,340 | | | | 296,906 | |
| | | | | | | | |
| | | Principal
Amount | | | Value | |
| | | | | | | | | |
| Commercial Continued | | | | | | | | |
Wells Fargo Mortgage-Backed Securities 2007-AR3 Trust,
Mtg. Pass-Through Certificates,
Series 2007-AR3, Cl. A4,
5.716%, 4/1/372 | | $ | 142,910 | | | $ | 131,252 | |
Wells Fargo Mortgage-Backed Securities 2007-AR8 Trust,
Mtg. Pass-Through Certificates,
Series 2007-AR8, Cl. A1,
5.988%, 11/1/372 | | | 361,028 | | | | 323,559 | |
| | | | | | |
|
|
|
| | | | | | | | 13,245,604 | |
| Multifamily—1.0% | | | | | | | | |
CHL Mortgage Pass-Through Trust 2006-20, Mtg. Pass-Through Certificates, Series 2006-20,
Cl. 1A17, 5.75%, 2/1/37 | | | 553,146 | | | | 502,020 | |
Citigroup Mortgage Loan Trust, Inc.
2006-AR3, Mtg. Pass-Through
Certificates, Series 2006-AR3,
Cl. 1A2A, 5.596%, 6/1/362 | | | 347,028 | | | | 322,904 | |
Countrywide Alternative Loan Trust
2005-86CB, Mtg. Pass-Through
Certificates, Series 2005-86CB,
Cl. A8, 5.50%, 2/1/36 | | | 90,004 | | | | 81,431 | |
Countrywide Alternative Loan Trust
2005-J14, Mtg. Pass-Through
Certificates, Series 2005-J14,
Cl. A7, 5.50%, 12/1/35 | | | 89,545 | | | | 74,385 | |
Countrywide Alternative Loan Trust
2006-24CB, Mtg. Pass-Through
Certificates, Series 2006-24CB,
Cl. A12, 5.75%, 6/1/36 | | | 111,133 | | | | 90,134 | |
JPMorgan Mortgage Trust 2007-A3,
Mtg. Pass-Through
Certificates, Series 2007-A3,
Cl. 3A2M, 5.018%, 5/1/372 | | | 131,930 | | | | 126,734 | |
Wells Fargo Mortgage-Backed
Securities 2006-AR2 Trust,
Mtg. Pass-Through Certificates,
Series 2006-AR2, Cl. 2A3,
2.627%, 3/1/362 | | | 207,480 | | | | 202,580 | |
Wells Fargo Mortgage-Backed
Securities 2006-AR6 Trust,
Mtg. Pass-Through Certificates,
Series 2006-AR6, Cl. 3A1,
2.76%, 3/25/362 | | | 456,796 | | | | 441,926 | |
| | | | | | |
|
|
|
| | | | | | | | 1,842,114 | |
| Other—0.0% | | | | | | | | |
Salomon Brothers Mortgage
Securities VI, Inc., Interest-Only Stripped Mtg.-Backed Security,
Series 1987-3, Cl. B, 20%, 10/23/175 | | | 221 | | | | 9 | |
| | | | |
| 12 | | | | OPPENHEIMER CORE BOND FUND/VA |
STATEMENT OF INVESTMENTS Continued
| | | | | | | | |
| | | Principal
Amount | | | Value | |
| | | | | | | | | |
| Other Continued | | | | | | | | |
Salomon Brothers Mortgage
Securities VI, Inc., Principal-Only Stripped Mtg.-Backed Security,
Series 1987-3, Cl. A, 3.72%, 10/23/177 | | $ | 338 | | | $ | 335 | |
| | | | | | |
|
|
|
| | | | | | | | 344 | |
| Residential—3.7% | | | | | | | | |
Banc of America Commercial Mortgage, Inc., Commercial
Mtg. Pass-Through Certificates:
Series 2007-4, Cl. AM, 5.796%, 2/1/512 | | | 470,000 | | | | 530,643 | |
| Series 2007-1, Cl. 1A3, 6%, 1/1/37 | | | 343,541 | | | | 300,190 | |
Banc of America Funding
2007-C Trust, Mtg.
Pass-Through Certificates,
Series 2007-C, Cl. 1A4,
5.496%, 5/1/362 | | | 145,750 | | | | 143,050 | |
Banc of America Mortgage
2007-1 Trust, Mtg. Pass-Through
Certificates, Series 2007-1,
Cl. 1A24, 6%, 3/1/37 | | | 258,916 | | | | 254,496 | |
Carrington Mortgage Loan Trust,
Asset-Backed Pass-Through
Certificates, Series 2006-FRE1,
Cl. A2, 0.32%, 7/25/362 | | | 278,514 | | | | 266,822 | |
CHL Mortgage Pass-Through
Trust 2005-29, Mtg. Pass-Through
Certificates, Series 2005-29,
Cl. A1, 5.75%, 12/1/35 | | | 290,765 | | | | 269,845 | |
CHL Mortgage Pass-Through
Trust 2005-30, Mtg. Pass-Through
Certificates, Series 2005-30,
Cl. A5, 5.50%, 1/1/36 | | | 206,547 | | | | 201,463 | |
CHL Mortgage Pass-Through
Trust 2005-J4, Mtg. Pass-Through
Certificates, Series 2005-J4,
Cl. A7, 5.50%, 11/1/35 | | | 32,895 | | | | 34,569 | |
CHL Mortgage Pass-Through
Trust 2006-17, Mtg. Pass-Through
Certificates, Series 2006-17,
Cl. A2, 6%, 12/1/36 | | | 451,957 | | | | 413,430 | |
Countrywide Alternative Loan
Trust 2007-19, Mtg. Pass-Through
Certificates, Series 2007-19,
Cl. 1A34, 6%, 8/1/37 | | | 561,325 | | | | 454,191 | |
Countrywide Home Loans,
Asset-Backed Certificates,
Series 2005-16, Cl. 2AF2,
5.227%, 5/1/362 | | | 281,219 | | | | 262,766 | |
CSMC Mortgage-Backed Trust
2007-3, Mtg. Pass-Through
Certificates, Series 2007-3,
Cl. 2A10, 6%, 4/1/37 | | | 325,801 | | | | 282,405 | |
| | | | | | | | |
| | | Principal
Amount | | | Value | |
| | | | | | | | | |
| Residential Continued | | | | | | | | |
CWABS Asset-Backed Certificates
Trust 2006-25, Asset-Backed
Certificates, Series 2006-25,
Cl. 2A2, 0.33%, 6/25/472 | | $ | 15,335 | | | $ | 15,144 | |
GSR Mortgage Loan Trust 2006-5F,
Mtg. Pass-Through Certificates,
Series 2006-5F, Cl. 2A1, 6%, 6/1/36 | | | 222,916 | | | | 215,355 | |
JPMorgan Alternative Loan
Trust 2006-S4, Mtg. Pass-Through
Certificates, Series 2006-S4,
Cl. A6, 5.71%, 12/1/36 | | | 478,592 | | | | 452,782 | |
Mastr Asset-Backed Securities Trust
2006-WMC3, Mtg. Pass-Through
Certificates, Series 2006-WMC3,
Cl. A3, 0.31%, 8/25/362 | | | 60,484 | | | | 22,428 | |
Merrill Lynch Mortgage Investors Trust
2006-3, Mtg. Pass-Through
Certificates, Series MLCC 2006-3,
Cl. 2A1, 2.677%, 10/25/362 | | | 39,752 | | | | 38,262 | |
NC Finance Trust, Collateralized Mtg.
Obligation Pass-Through
Certificates, Series 1999-I,
Cl. ECFD, 3.405%, 1/25/293,8 | | | 3,370,016 | | | | 269,601 | |
RALI Series 2003-QS1 Trust,
Mtg. Asset-Backed Pass-Through
Certificates, Series 2003-QS1,
Cl. A2, 5.75%, 1/25/33 | | | 152,061 | | | | 157,002 | |
RALI Series 2006-QS13 Trust,
Mtg. Asset-Backed
Pass-Through Certificates:
Series 2006-QS13, Cl. 1A5, 6%, 9/25/36 | | | 47,284 | | | | 35,283 | |
| Series 2006-QS13, Cl. 1A8, 6%, 9/25/36 | | | 1,657 | | | | 1,237 | |
RALI Series 2007-QS6 Trust, Mtg.
Asset-Backed Pass-Through
Certificates, Series 2007-QS6,
Cl. A28, 5.75%, 4/25/37 | | | 20,640 | | | | 15,480 | |
Residential Asset Securitization
Trust 2005-A15, Mtg. Pass-Through
Certificates, Series 2005-A15,
Cl. 1A4, 5.75%, 2/1/36 | | | 134,057 | | | | 120,641 | |
WaMu Mortgage Pass-Through Certificates 2007-HY1 Trust, Mtg.
Pass-Through Certificates,
Series 2007-HY1, Cl. 4A1,
2.685%, 2/1/372 | | | 52,466 | | | | 42,112 | |
WaMu Mortgage Pass-Through
Certificates 2007-HY5 Trust, Mtg.
Pass-Through Certificates,
Series 2007-HY5, Cl. 3A1,
5.147%, 5/1/372 | | | 688,770 | | | | 667,288 | |
| | | | |
| 13 | | | | OPPENHEIMER CORE BOND FUND/VA |
| | | | | | | | |
| | | Principal
Amount | | | Value | |
| | | | | | | | | |
| Residential Continued | | | | | | | | |
WaMu Mortgage Pass-Through
Certificates, Mtg. Pass-Through
Certificates, Series 2006-AR18,
Cl. 3A1, 4.60%, 1/1/372 | | $ | 225,617 | | | $ | 198,310 | |
Wells Fargo Alternative Loan
2007-PA5 Trust, Mtg. Asset-Backed
Pass-Through Certificates,
Series 2007-PA5, Cl. 1A1,
6.25%, 11/1/37 | | | 394,645 | | | | 373,854 | |
Wells Fargo Mortgage-Backed Securities 2005-9 Trust, Mtg.
Pass-Through Certificates,
Series 2005-9, Cl. 2A6, 5.25%, 10/25/35 | | | 400,876 | | | | 426,511 | |
Wells Fargo Mortgage-Backed Securities 2006-AR14 Trust, Mtg.
Pass-Through Certificates,
Series 2006-AR14, Cl. 1A2,
5.632%, 10/1/362 | | | 323,365 | | | | 318,873 | |
| | | | | | |
|
|
|
| | | | | | | | 6,784,033 | |
| | | | | | |
|
|
|
| Total Mortgage-Backed Obligations (Cost $110,358,177) | | | | | | | 109,921,168 | |
| U.S. Government Obligations—2.1% | | | | | | | | |
Federal Home Loan
Mortgage Corp. Nts.:
0.75%, 1/12/18 | | | 503,000 | | | | 500,208 | |
| 1.25%, 8/1/19-10/2/19 | | | 510,000 | | | | 509,412 | |
| 2.375%, 1/13/229 | | | 894,000 | | | | 934,775 | |
| 5.25%, 4/18/16 | | | 515,000 | | | | 596,142 | |
Federal National Mortgage Assn. Nts.,
0.875%, 12/20/17 | | | 1,075,000 | | | | 1,078,407 | |
| U.S. Treasury Nts., 1.75%, 5/15/22 | | | 140,000 | | | | 141,072 | |
| | | | | | |
|
|
|
| Total U.S. Government Obligations (Cost $3,657,927) | | | | | | | 3,760,016 | |
| Corporate Bonds and Notes—45.1% | |
| Consumer Discretionary—7.7% | | | | | | | | |
| Auto Components—0.2% | | | | | | | | |
Dana Holding Corp.,
6.75% Sr. Unsec. Nts., 2/15/21 | | | 420,000 | | | | 453,600 | |
| Automobiles—0.9% | | | | | | | | |
Daimler Finance North America LLC,
8.50% Sr. Unsec. Unsub. Nts., 1/18/31 | | | 237,000 | | | | 369,118 | |
Ford Motor Credit Co. LLC,
5.875% Sr. Unsec. Nts., 8/2/21 | | | 1,024,000 | | | | 1,193,390 | |
| | | | | | |
|
|
|
| | | | | | | | 1,562,508 | |
| Diversified Consumer Services—0.3% | | | | | |
Service Corp. International,
7.625% Sr. Unsec. Nts., 10/1/18 | | | 394,000 | | | | 470,830 | |
| Hotels, Restaurants & Leisure—0.7% | | | | | | | | |
Darden Restaurants, Inc.,
4.50% Sr. Unsec. Unsub. Nts., 10/15/21 | | | 124,000 | | | | 133,447 | |
| | | | | | | | |
| | | Principal
Amount | | | Value | |
| | | | | | | | | |
| Hotels, Restaurants & Leisure Continued | | | | | |
Hyatt Hotels Corp., 5.75% Sr. Unsec.
Unsub. Nts., 8/15/151 | | $ | 773,000 | | | $ | 849,038 | |
Starwood Hotels & Resorts
Worldwide, Inc., 7.15% Sr. Unsec. Unsub. Nts., 12/1/19 | | | 261,000 | | | | 322,907 | |
| | | | | | |
|
|
|
| | | | | | | | 1,305,392 | |
| Household Durables—0.4% | | | | | | | | |
Jarden Corp., 6.125% Sr. Unsec.
Nts., 11/15/22 | | | 467,000 | | | | 506,695 | |
Whirlpool Corp., 5.50% Sr. Unsec.
Unsub. Nts., 3/1/13 | | | 168,000 | | | | 169,356 | |
| �� | | | | | |
|
|
|
| | | | | | | | 676,051 | |
| Media—2.6% | | | | | | | | |
Comcast Cable Communications Holdings, Inc., 9.455% Sr. Unsec.
Nts., 11/15/22 | | | 292,000 | | | | 441,811 | |
Comcast Corp., 4.65% Sr. Unsec.
Unsub. Nts., 7/15/42 | | | 111,000 | | | | 117,116 | |
CSC Holdings, Inc., 7.625%
Sr. Unsec. Debs., 7/15/18 | | | 430,000 | | | | 498,800 | |
DIRECTV Holdings LLC/DIRECTV Financing Co., Inc., 5.15% Sr. Unsec.
Nts., 3/15/42 | | | 133,000 | | | | 134,643 | |
DISH DBS Corp., 6.75%
Sr. Unsec. Nts., 6/1/21 | | | 459,000 | | | | 525,555 | |
Historic TW, Inc., 9.125%
Debs., 1/15/13 | | | 149,000 | | | | 149,409 | |
Interpublic Group of Cos., Inc. (The):
6.25% Sr. Unsec. Nts., 11/15/14 | | | 297,000 | | | | 322,988 | |
| 10% Sr. Unsec. Nts., 7/15/17 | | | 458,000 | | | | 502,655 | |
Lamar Media Corp., 5% Sr. Sub.
Nts., 5/1/231 | | | 473,000 | | | | 488,373 | |
News America, Inc., 6.15% Sr. Unsec.
Nts., 2/15/41 | | | 162,000 | | | | 205,370 | |
Time Warner Entertainment Co. LP,
8.375% Sr. Nts., 7/15/33 | | | 257,000 | | | | 375,345 | |
| Time Warner, Inc., 9.15% Debs., 2/1/23 | | | 61,000 | | | | 90,152 | |
Virgin Media Secured Finance plc:
5.25% Sr. Sec. Nts., 1/15/21 | | | 254,000 | | | | 296,796 | |
| 6.50% Sr. Sec. Nts., 1/15/18 | | | 555,000 | | | | 600,094 | |
| | | | | | |
|
|
|
| | | | | | | | 4,749,107 | |
| Multiline Retail—0.7% | | | | | | | | |
Dollar General Corp., 4.125%
Nts., 7/15/17 | | | 469,000 | | | | 494,795 | |
Macy’s Retail Holdings, Inc., 5.75%
Sr. Unsec. Nts., 7/15/14 | | | 650,000 | | | | 697,317 | |
| | | | | | |
|
|
|
| | | | | | | | 1,192,112 | |
| | | | |
| 14 | | | | OPPENHEIMER CORE BOND FUND/VA |
STATEMENT OF INVESTMENTS Continued
| | | | | | | | |
| | | Principal
Amount | | | Value | |
| | | | | | | | | |
| Specialty Retail—1.4% | | | | | | | | |
Gap, Inc. (The), 5.95% Sr. Unsec.
Unsub. Nts., 4/12/21 | | $ | 522,000 | | | $ | 597,623 | |
Limited Brands, Inc.,
6.625% Sr. Nts., 4/1/21 | | | 455,000 | | | | 523,250 | |
Rent-A-Center, Inc.,
6.625% Sr. Unsec. Nts., 11/15/20 | | | 508,000 | | | | 556,260 | |
Sally Holdings LLC/Sally Capital, Inc.,
6.875% Sr. Unsec. Nts., 11/15/19 | | | 467,000 | | | | 518,370 | |
Staples, Inc., 9.75% Sr. Unsec.
Unsub. Nts., 1/15/14 | | | 398,000 | | | | 432,813 | |
| | | | | | |
|
|
|
| | | | | | | | 2,628,316 | |
| Textiles, Apparel & Luxury Goods—0.5% | | | | | |
Hanesbrands, Inc., 6.375% Sr. Unsec.
Unsub. Nts., 12/15/20 | | | 428,000 | | | | 472,940 | |
Phillips-Van Heusen Corp.,
7.375% Sr. Unsec.
Unsub. Nts., 5/15/20 | | | 400,000 | | | | 450,500 | |
| | | | | | |
|
|
|
| | | | | | | | 923,440 | |
| Consumer Staples—2.9% | | | | | |
| Beverages—1.1% | | | | | | | | |
Anheuser-Busch InBev Worldwide, Inc.,
8.20% Sr. Unsec. Unsub.
Nts., 1/15/39 | | | 232,000 | | | | 381,324 | |
Coca-Cola HBC Finance BV, 5.125%
Sr. Unsec. Unsub. Nts., 9/17/13 | | | 469,000 | | | | 480,689 | |
Fortune Brands, Inc., 6.375% Sr. Unsec.
Unsub. Nts., 6/15/14 | | | 126,000 | | | | 135,865 | |
Foster’s Finance Corp.,
4.875% Sr. Unsec. Nts., 10/1/141 | | | 433,000 | | | | 462,359 | |
Pernod-Ricard SA,
4.25% Sr. Unsec. Nts., 7/15/221 | | | 222,000 | | | | 244,182 | |
SABMiller Holdings, Inc.,
4.95% Sr. Unsec. Nts., 1/15/42 | | | 198,000 | | | | 224,656 | |
| | | | | | |
|
|
|
| | | | | | | | 1,929,075 | |
| Food & Staples Retailing—0.3% | | | | | | | | |
Delhaize Group, 5.70%
Sr. Unsec. Nts., 10/1/40 | | | 133,000 | | | | 124,765 | |
Safeway, Inc.:
3.95% Sr. Unsec. Unsub. Nts., 8/15/20 | | | 284,000 | | | | 284,268 | |
| 5.625% Sr. Unsec. Unsub. Nts., 8/15/14 | | | 170,000 | | | | 180,942 | |
| | | | | | |
|
|
|
| | | | | | | | 589,975 | |
| Food Products—1.1% | | | | | | | | |
Bunge Ltd. Finance Corp.:
5.35% Sr. Unsec.
Unsub. Nts., 4/15/14 | | | 434,000 | | | | 456,826 | |
| 8.50% Sr. Unsec. Nts., 6/15/19 | | | 289,000 | | | | 372,067 | |
| | | | | | | | |
| | | Principal
Amount | | | Value | |
| | | | | | | | | |
| Food Products Continued | | | | | | | | |
ConAgra Foods, Inc.,
3.25% Sr. Unsec. Unsub. Nts., 9/15/22 | | $ | 230,000 | | | $ | 231,232 | |
Kraft Foods Group, Inc.,
6.50% Sr. Unsec. Unsub. Nts., 2/9/401 | | | 146,000 | | | | 192,063 | |
TreeHouse Foods, Inc.,
7.75% Sr. Unsec. Nts., 3/1/18 | | | 485,000 | | | | 527,438 | |
Tyson Foods, Inc.,
4.50% Sr. Unsec. Unsub. Nts., 6/15/22 | | | 244,000 | | | | 265,074 | |
| | | | | | |
|
|
|
| | | | | | | | 2,044,700 | |
| Tobacco—0.4% | | | | | | | | |
Altria Group, Inc., 10.20%
Sr. Unsec. Nts., 2/6/39 | | | 227,000 | | | | 380,014 | |
Lorillard Tobacco Co., 7%
Sr. Unsec. Nts., 8/4/41 | | | 311,000 | | | | 377,916 | |
| | | | | | |
|
|
|
| | | | | | | | 757,930 | |
| Energy—5.2% | | | | | |
| Energy Equipment & Services—1.2% | | | | | | | | |
Ensco plc, 4.70% Sr. Unsec.
Nts., 3/15/21 | | | 510,000 | | | | 574,367 | |
Noble Holding International Ltd.,
7.375% Sr. Unsec. Bonds, 3/15/14 | | | 403,000 | | | | 433,176 | |
Precision Drilling Corp.:
6.50% Sr. Unsec. Nts., 12/15/21 | | | 217,000 | | | | 232,190 | |
| 6.625% Sr. Unsec. Nts., 11/15/20 | | | 208,000 | | | | 224,640 | |
Rowan Cos., Inc.,
4.875% Sr. Unsec. Nts., 6/1/22 | | | 342,000 | | | | 371,739 | |
Weatherford International Ltd. Bermuda, 5.125% Sr. Unsec.
Unsub. Nts., 9/15/20 | | | 284,000 | | | | 313,186 | |
| | | | | | |
|
|
|
| | | | | | | | 2,149,298 | |
| Oil, Gas & Consumable Fuels—4.0% | | | | | | | | |
Anadarko Petroleum Corp.,
6.20% Sr. Unsec. Nts., 3/15/40 | | | 178,000 | | | | 219,751 | |
Canadian Oil Sands Ltd.:
5.80% Sr. Unsec. Nts., 8/15/131 | | | 457,000 | | | | 471,761 | |
| 6% Sr. Unsec. Nts., 4/1/421 | | | 203,000 | | | | 238,623 | |
DCP Midstream LLC,
5.35% Sr. Unsec. Nts., 3/18/201 | | | 312,000 | | | | 344,572 | |
DCP Midstream Operating LP,
2.50% Sr. Unsec. Unsub. Nts., 12/1/17 | | | 415,000 | | | | 413,111 | |
| El Paso Pipeline Partners Operating Co. LLC, 4.70% Sr. Unsec. Nts., 11/1/42 | | | 318,000 | | | | 312,438 | |
EnCana Holdings Finance Corp.,
5.80% Sr. Unsec. Unsub. Nts., 5/1/14 | | | 219,000 | | | | 232,870 | |
Energy Transfer Partners LP:
4.65% Sr. Unsec. Unsub. Nts., 6/1/21 | | | 374,000 | | | | 411,243 | |
| 5.20% Sr. Unsec. Unsub. Nts., 2/1/22 | | | 136,000 | | | | 155,260 | |
| 8.50% Sr. Unsec. Nts., 4/15/14 | | | 324,000 | | | | 352,421 | |
| | | | |
| 15 | | | | OPPENHEIMER CORE BOND FUND/VA |
| | | | | | | | |
| | | Principal
Amount | | | Value | |
| | | | | | | | | |
| Oil, Gas & Consumable Fuels Continued | | | | | |
Newfield Exploration Co., 6.875%
Sr. Unsec. Sub. Nts., 2/1/20 | | $ | 446,000 | | | $ | 479,450 | |
Nexen, Inc., 6.40%
Sr. Unsec. Unsub. Bonds, 5/15/37 | | | 201,000 | | | | 260,068 | |
NuStar Logistics LP, 4.75%
Sr. Unsec. Unsub. Nts., 2/1/22 | | | 468,000 | | | | 445,247 | |
| Phillips 66, 4.30% Unsec. Nts., 4/1/221 | | | 316,000 | | | | 353,404 | |
Range Resources Corp., 8%
Sr. Unsec. Sub. Nts., 5/15/19 | | | 451,000 | | | | 501,738 | |
| Ras Laffan Liquefied Natural Gas Co. Ltd. III, 5.50% Sr. Sec. Nts., 9/30/141 | | | 420,000 | | | | 453,705 | |
Rockies Express Pipeline LLC, 3.90%
Sr. Unsec. Unsub. Nts., 4/15/151 | | | 471,000 | | | | 471,000 | |
Southwestern Energy Co.,
4.10% Sr. Unsec. Nts., 3/15/221 | | | 232,000 | | | | 249,764 | |
Woodside Finance Ltd.:
4.60% Sr. Unsec. Nts., 5/10/211 | | | 354,000 | | | | 390,471 | |
| 5% Sr. Unsec. Nts., 11/15/131 | | | 455,000 | | | | 470,154 | |
| | | | | | |
|
|
|
| | | | | | | | 7,227,051 | |
| Financials—14.3% | | | | | | | | |
| Capital Markets—3.5% | | | | | | | | |
Blackstone Holdings Finance Co. LLC:
4.75% Sr. Unsec. Nts., 2/15/231 | | | 135,000 | | | | 143,640 | |
| 6.625% Sr. Unsec. Nts., 8/15/191 | | | 575,000 | | | | 666,481 | |
Goldman Sachs Capital, Inc. (The),
6.345% Sub. Bonds, 2/15/34 | | | 477,000 | | | | 495,468 | |
Goldman Sachs Group, Inc. (The):
5.25% Sr. Unsec. Nts., 7/27/21 | | | 396,000 | | | | 451,779 | |
| 6.25% Sr. Nts., 2/1/41 | | | 443,000 | | | | 544,001 | |
Macquarie Bank Ltd.:
5% Sr. Nts., 2/22/171 | | | 146,000 | | | | 159,782 | |
| 6.625% Unsec. Sub. Nts., 4/7/211 | | | 672,000 | | | | 743,315 | |
| Morgan Stanley: | | | | | | | | |
| 4.875% Sub. Nts., 11/1/22 | | | 375,000 | | | | 388,606 | |
| 6.375% Sr. Unsec. Nts., 7/24/42 | | | 960,000 | | | | 1,126,386 | |
Nomura Holdings, Inc.:
4.125% Sr. Unsec.
Unsub. Nts., 1/19/16 | | | 433,000 | | | | 452,172 | |
| 6.70% Sr. Unsec. Nts., 3/4/20 | | | 42,000 | | | | 49,048 | |
Raymond James Financial, Inc.,
5.625% Sr. Nts., 4/1/24 | | | 417,000 | | | | 467,209 | |
| UBS AG (Stamford CT), 2.25% | | | | | | | | |
| Sr. Unsec. Nts., 8/12/13 | | | 188,000 | | | | 189,829 | |
UBS Preferred Funding Trust V,
6.243% Jr. Sub. Perpetual Nts.10 | | | 488,000 | | | | 500,200 | |
| | | | | | |
|
|
|
| | | | | | | | 6,377,916 | |
| Commercial Banks—3.1% | | | | | | | | |
| Fifth Third Cap Trust IV, | | | | | | | | |
| 6.50% Jr. Unsec. Sub. Nts., 4/15/37 | | | 845,000 | | | | 848,169 | |
HBOS plc, 6.75% Unsec. Sub.
Nts., 5/21/181 | | | 451,000 | | | | 487,644 | |
| | | | | | | | |
| | | Principal
Amount | | | Value | |
| | | | | | | | | |
| Commercial Banks Continued | | | | | | | | |
| HSBC Finance Capital Trust IX, | | | | | | | | |
| 5.911% Nts., 11/30/352 | | $ | 1,190,000 | | | $ | 1,192,975 | |
| Lloyds TSB Bank plc, 6.50% | | | | | | | | |
| Unsec. Sub. Nts., 9/14/201 | | | 377,000 | | | | 416,854 | |
Mercantile Bankshares Corp.,
4.625% Unsec. Sub. Nts.,
Series B, 4/15/13 | | | 308,000 | | | | 311,556 | |
RBS Citizens Financial Group, Inc.,
4.15% Sub. Nts., 9/28/221 | | | 909,000 | | | | 928,402 | |
Wells Fargo & Co., 7.98% Jr. Sub.
Perpetual Bonds, Series K10 | | | 528,000 | | | | 608,520 | |
| Zions Bancorp, 4.50% Sr. Unsec. Unsub. Nts., 3/27/17 | | | 795,000 | | | | 831,121 | |
| | | | | | |
|
|
|
| | | | | | | | 5,625,241 | |
| Consumer Finance—1.0% | | | | | | | | |
| American Express Bank FSB, 5.50% | | | | | | | | |
| Sr. Unsec. Nts., 4/16/13 | | | 441,000 | | | | 447,413 | |
| Discover Financial Services, 3.85% | | | | | | | | |
| Sr. Unsec. Unsub. Nts., 11/21/221 | | | 681,000 | | | | 703,340 | |
SLM Corp., 4.625%
Sr. Unsec. Nts., 9/25/17 | | | 711,000 | | | | 728,410 | |
| | | | | | |
|
|
|
| | | | | | | | 1,879,163 | |
| Diversified Financial Services—2.0% | | | | | | | | |
Citigroup, Inc.:
4.50% Sr. Unsec. Nts., 1/14/22 | | | 559,000 | | | | 624,193 | |
| 5.95% Sub. Nts., 12/31/49 | | | 476,000 | | | | 482,545 | |
| JPMorgan Chase & Co., 7.90% | | | | | | | | |
| Perpetual Bonds, Series 110 | | | 1,494,000 | | | | 1,698,786 | |
| Merrill Lynch & Co., Inc., 7.75% | | | | | | | | |
| Jr. Sub. Bonds, 5/14/38 | | | 629,000 | | | | 819,393 | |
| | | | | | |
|
|
|
| | | | | | | | 3,624,917 | |
| Insurance—3.1% | | | | | | | | |
| American International Group, Inc., | | | | | | | | |
| 6.25% Jr. Sub. Bonds, 3/15/37 | | | 225,000 | | | | 241,313 | |
| CNA Financial Corp.: | | | | | | | | |
| 5.75% Sr. Unsec. Unsub. Nts., 8/15/21 | | | 368,000 | | | | 431,960 | |
| 5.875% Sr. Unsec. Unsub. Bonds, 8/15/20 | | | 260,000 | | | | 306,961 | |
| Gulf South Pipeline Co. LP, | | | | | | | | |
| 5.05% Sr. Unsec. Nts., 2/1/151 | | | 425,000 | | | | 459,122 | |
| Hartford Life, Inc., 7.375% Sr. Unsec. | | | | | | | | |
| Unsub. Nts., 3/1/31 | | | 683,000 | | | | 861,949 | |
Irish Life & Permanent Group
Holdings plc, 3.60% Sr. Unsec. | | | | | | | | |
| Unsub. Nts., 1/14/131 | | | 320,000 | | | | 320,802 | |
| Lincoln National Corp., | | | | | | | | |
| 6.05% Jr. Unsec. Sub. Bonds, 4/20/67 | | | 911,000 | | | | 912,139 | |
| Marsh & McLennan Cos., Inc., | | | | | | | | |
| 5.375% Nts., 7/15/14 | | | 101,000 | | | | 107,857 | |
| | | | |
| 16 | | | | OPPENHEIMER CORE BOND FUND/VA |
STATEMENT OF INVESTMENTS Continued
| | | | | | | | |
| | | Principal
Amount | | | Value | |
| | | | | | | | | |
| Insurance Continued | | | | | | | | |
| Prudential Financial, Inc., | | | | | | | | |
| 5.625% Unsec. Sub. Nts., 6/15/43 | | $ | 272,000 | | | $ | 283,234 | |
| Swiss Re Capital I LP, | | | | | | | | |
| 6.854% Perpetual Bonds1,10 | | | 877,000 | | | | 919,657 | |
| Unum Group, 5.625% Sr. Unsec. | | | | | | | | |
| Unsub. Nts., 9/15/20 | | | 729,000 | | | | 833,523 | |
| | | | | | |
|
|
|
| | | | | | | | 5,678,517 | |
| Real Estate Investment Trusts (REITs)—1.6% | |
| American Tower Corp.: | | | | | | | | |
| 5.05% Sr. Unsec. Unsub. Nts., 9/1/20 | | | 130,000 | | | | 145,892 | |
| 7% Sr. Unsec. Nts., 10/15/17 | | | 413,000 | | | | 494,238 | |
| CommonWealth REIT, 6.40% Sr. Unsec. | | | | | | | | |
| Unsub. Nts., 2/15/15 | | | 421,000 | | | | 452,079 | |
| Duke Realty LP, 6.25% Sr. Unsec. | | | | | | | | |
| Unsub. Nts., 5/15/13 | | | 476,000 | | | | 485,460 | |
| Hospitality Properties Trust, | | | | | | | | |
| 5.125% Sr. Unsec. Nts., 2/15/15 | | | 411,000 | | | | 432,456 | |
| National Retail Properties, Inc., | | | | | | | | |
| 6.25% Sr. Unsec. Unsub. Nts., 6/15/14 | | | 332,000 | | | | 354,997 | |
| WEA Finance LLC/WT Finance Aust Pty Ltd., 7.50% Sr. Unsec. Nts., 6/2/141 | | | 408,000 | | | | 444,068 | |
| | | | | | |
|
|
|
| | | | | | | | 2,809,190 | |
| Health Care—1.9% | | | | | | | | |
| Biotechnology—0.8% | | | | | | | | |
| Amgen, Inc., 3.625% Sr. Unsec. | | | | | | | | |
| Unsub. Nts., 5/15/22 | | | 467,000 | | | | 502,290 | |
Celgene Corp., 3.25% Sr. Unsec.
Nts., 8/15/22 | | | 504,000 | | | | 514,235 | |
| Gilead Sciences, Inc., 5.65% Sr. Unsec. | | | | | | | | |
| Nts., 12/1/41 | | | 243,000 | | | | 302,159 | |
| | | | | | |
|
|
|
| | | | | | | | 1,318,684 | |
| Health Care Providers & Services—0.6% | |
| Express Scripts Holding Co., | | | | | | | | |
| 6.25% Sr. Unsec. Nts., 6/15/14 | | | 423,000 | | | | 455,679 | |
| McKesson Corp., 6% Sr. Unsec. | | | | | | | | |
| Unsub. Nts., 3/1/41 | | | 237,000 | | | | 313,331 | |
| Quest Diagnostics, Inc., | | | | | | | | |
| 5.75% Sr. Unsec. Nts., 1/30/40 | | | 310,000 | | | | 355,489 | |
| | | | | | |
|
|
|
| | | | | | | | 1,124,499 | |
| Pharmaceuticals—0.5% | |
AbbVie, Inc., 2.90% Sr. Unsec.
Nts., 11/6/221 | | | 329,000 | | | | 335,362 | |
| Mylan, Inc., 6% Sr. Nts., 11/15/181 | | | 511,000 | | | | 564,542 | |
| | | | | | |
|
|
|
| | | | | | | | 899,904 | |
| Industrials—3.4% | |
| Aerospace & Defense—0.4% | | | | | | | | |
| BE Aerospace, Inc., 5.25% Sr. Unsec. | | | | | | | | |
| Unsub. Nts., 4/1/22 | | | 319,000 | | | | 339,735 | |
| | | | | | | | |
| | | Principal
Amount | | | Value | |
| | | | | | | | | |
| Aerospace & Defense Continued | |
| Huntington Ingalls Industries, Inc., | | | | | | | | |
| 7.125% Sr. Unsec. Unsub. Nts., 3/15/21 | | $ | 448,000 | | | $ | 489,440 | |
| | | | | | |
|
|
|
| | | | | | | | 829,175 | |
| Building Products—0.1% | | | | | | | | |
| Owens Corning, 4.20% Sr. Unsec. | | | | | | | | |
| Nts., 12/15/22 | | | 156,000 | | | | 158,788 | |
| Commercial Services & Supplies—0.3% | |
| Clean Harbors, Inc., 5.25% Sr. Unsec. | | | | | | | | |
| Unsub. Nts., 8/1/20 | | | 475,000 | | | | 497,563 | |
| Electrical Equipment—0.1% | | | | | | | | |
| Turlock Corp., 4.15% Sr. Unsec. | | | | | | | | |
| Unsub. Nts., 11/2/421 | | | 235,000 | | | | 237,900 | |
| Industrial Conglomerates—0.8% | | | | | | | | |
| General Electric Capital Corp.: | | | | | | | | |
| 6.375% Unsec. Sub. Bonds, 11/15/67 | | | 934,000 | | | | 987,705 | |
| 7.125% Unsec. Sub. Nts., 12/15/49 | | | 400,000 | | | | 453,905 | |
| | | | | | |
|
|
|
| | | | | | | | 1,441,610 | |
| Machinery—0.9% | | | | | | | | |
| CNH Capital LLC, 6.25% Sr. Unsec. | | | | | | | | |
| Nts., 11/1/16 | | | 489,000 | | | | 541,568 | |
| Joy Global, Inc., 5.125% Sr. Unsec. Unsub. Nts., 10/15/21 | | | 335,000 | | | | 369,576 | |
| Kennametal, Inc., 3.875% Sr. Unsec. Unsub. Nts., 2/15/22 | | | 342,000 | | | | 357,413 | |
SPX Corp., 6.875% Sr. Unsec.
Nts., 9/1/171 | | | 412,000 | | | | 461,440 | |
| | | | | | |
|
|
|
| | | | | | | | 1,729,997 | |
| Professional Services—0.3% | | | | | | | | |
FTI Consulting, Inc., 6.75% Sr. Unsec.
Nts., 10/1/20 | | | 436,000 | | | | 467,610 | |
| Road & Rail—0.5% | | | | | | | | |
CSX Corp., 5.50% Sr. Unsec.
Nts., 4/15/41 | | | 187,000 | | | | 224,269 | |
Kansas City Southern de Mexico SA de CV, 6.625% Sr. Unsec. Unsub.
Nts., 12/15/20 | | | 400,000 | | | | 456,000 | |
| Penske Truck Leasing Co. LP/PTL Finance Corp., 2.50% Sr. Nts., 7/11/141 | | | 169,000 | | | | 170,829 | |
| | | | | | |
|
|
|
| | | | | | | | 851,098 | |
| Information Technology—2.1% | | | | | | | | |
| Communications Equipment—0.1% | | | | | | | | |
| Juniper Networks, Inc., 5.95% Sr. Unsec. Unsub. Nts., 3/15/41 | | | 201,000 | | | | 229,086 | |
| Computers & Peripherals—0.6% | | | | | | | | |
Hewlett-Packard Co.:
2.65% Sr. Unsec. Unsub. Nts., 6/1/16 | | | 809,000 | | | | 807,706 | |
| 4.75% Sr. Unsec. Nts., 6/2/14 | | | 297,000 | | | | 309,700 | |
| | | | | | |
|
|
|
| | | | | | | | 1,117,406 | |
| Electronic Equipment, Instruments & Components—0.5% | |
Amphenol Corp., 4.75% Sr. Unsec.
Unsub. Nts., 11/15/14 | | | 124,000 | | | | 132,183 | |
| | | | |
| 17 | | | | OPPENHEIMER CORE BOND FUND/VA |
| | | | | | | | |
| | | Principal
Amount | | | Value | |
| | | | | | | | | |
| Electronic Equipment, Instruments & Components Continued | |
Arrow Electronics, Inc., 5.125%
Sr. Unsec. Unsub. Nts., 3/1/21 | | $ | 527,000 | | | $ | 568,478 | |
Corning, Inc., 4.75% Sr. Unsec.
Unsub. Nts., 3/15/42 | | | 182,000 | | | | 191,848 | |
| | | | | | |
|
|
|
| | | | | | | | 892,509 | |
| Internet Software & Services—0.1% | | | | | | | | |
eBay, Inc., 4% Sr. Unsec.
Unsub. Nts., 7/15/42 | | | 187,000 | | | | 182,310 | |
| Office Electronics—0.3% | | | | | | | | |
Xerox Corp., 5.65% Sr. Unsec.
Nts., 5/15/13 | | | 435,000 | | | | 442,498 | |
| Software—0.5% | | | | | | | | |
Autodesk, Inc.:
1.95% Sr. Unsec. Unsub. Nts., 12/15/17 | | | 218,000 | | | | 217,090 | |
| 3.60% Sr. Unsec. Unsub. Nts., 12/15/22 | | | 138,000 | | | | 138,733 | |
Symantec Corp., 4.20% Sr. Unsec.
Unsub. Nts., 9/15/20 | | | 585,000 | | | | 615,029 | |
| | | | | | |
|
|
|
| | | | | | | | 970,852 | |
| Materials—3.4% | | | | | | | | |
| Chemicals—0.8% | | | | | | | | |
Agrium, Inc., 6.125% Sr. Unsec.
Nts., 1/15/41 | | | 230,000 | | | | 276,769 | |
| CF Industries, Inc., 7.125% Sr. Unsec. Unsub. Nts., 5/1/20 | | | 358,000 | | | | 450,851 | |
Eastman Chemical Co., 4.80%
Sr. Unsec. Nts., 9/1/42 | | | 230,000 | | | | 246,264 | |
RPM International, Inc., 3.45%
Sr. Unsec. Nts., 11/15/22 | | | 227,000 | | | | 222,607 | |
Sherwin-Williams Co. (The), 4%
Sr. Unsec. Unsub. Nts., 12/15/42 | | | 226,000 | | | | 226,071 | |
| | | | | | |
|
|
|
| | | | | | | | 1,422,562 | |
| Containers & Packaging—0.9% | |
Crown Americas LLC/Crown Americas Capital Corp. II I, 6.25% Sr. Unsec.
Nts., 2/1/21 | | | 446,000 | | | | 491,158 | |
| Greif, Inc., 7.75% Sr. Unsec. Nts., 8/1/19 | | | 413,000 | | | | 479,080 | |
Rock-Tenn Co.:
3.50% Sr. Nts., 3/1/201 | | | 132,000 | | | | 135,578 | |
| 4.90% Sr. Unsec. Nts., 3/1/221 | | | 162,000 | | | | 175,214 | |
Sealed Air Corp., 8.375% Sr. Unsec.
Nts., 9/15/211 | | | 388,000 | | | | 445,230 | |
| | | | | | |
|
|
|
| | | | | | | | 1,726,260 | |
| Metals & Mining—1.3% | | | | | | | | |
Allegheny Technologies, Inc.,
5.95% Sr. Unsec. Unsub. Nts., 1/15/21 | | | 235,000 | | | | 260,511 | |
Cliffs Natural Resources, Inc.,
6.25% Sr. Unsec. Unsub. Nts., 10/1/40 | | | 124,000 | | | | 120,988 | |
| | | | | | | | |
| | | Principal
Amount | | | Value | |
| | | | | | | | | |
| Metals & Mining Continued | | | | | | | | |
Freeport-McMoRan
Copper & Gold, Inc., 3.55% Sr. Unsec. Nts., 3/1/22 | | $ | 331,000 | | | $ | 328,558 | |
Petrohawk Energy Corp.,
6.25% Sr. Unsec. Nts., 6/1/19 | | | 743,000 | | | | 846,550 | |
Xstrata Canada Corp.:
5.375% Sr. Unsec. Unsub. Nts., 6/1/15 | | | 245,000 | | | | 266,427 | |
| 6% Sr. Unsec. Unsub. Nts., 10/15/15 | | | 463,000 | | | | 514,757 | |
| | | | | | |
|
|
|
| | | | | | | | 2,337,791 | |
| Paper & Forest Products—0.4% | |
International Paper Co.,
6% Sr. Unsec. Unsub. Nts., 11/15/41 | | | 202,000 | | | | 239,406 | |
Westvaco Corp.,
7.95% Sr. Unsec. Unsub. Nts., 2/15/31 | | | 388,000 | | | | 507,410 | |
| | | | | | |
|
|
|
| | | | | | | | 746,816 | |
| Telecommunication Services—2.5% | | | | | | | | |
| Diversified Telecommunication Services—2.2% | |
AT&T, Inc., 6.30% Sr. Unsec.
Bonds, 1/15/38 | | | 519,000 | | | | 666,034 | |
British Telecommunications plc,
9.625% Bonds, 12/15/30 | | | 298,000 | | | | 473,723 | |
CenturyLink, Inc., 7.65% Sr. Unsec.
Unsub. Nts., 3/15/42 | | | 365,000 | | | | 381,739 | |
Frontier Communications Corp.,
8.50% Sr. Unsec. Nts., 4/15/20 | | | 429,000 | | | | 495,495 | |
Telecom Italia Capital SA,
7.721% Sr. Unsec. Unsub. Nts., 6/4/38 | | | 553,000 | | | | 601,388 | |
Telefonica Emisiones SAU,
5.462% Sr. Unsec. Unsub. Nts., 2/16/21 | | | 603,000 | | | | 644,456 | |
Verizon Communications, Inc.,
6.40% Sr. Unsec. Nts., 2/15/38 | | | 286,000 | | | | 387,538 | |
Windstream Corp.,
7.50% Sr. Unsec. Unsub. Nts., 4/1/23 | | | 443,000 | | | | 468,473 | |
| | | | | | |
|
|
|
| | | | | | | | 4,118,846 | |
| Wireless Telecommunication Services—0.3% | |
America Movil SAB de CV,
4.375% Sr. Unsec. Unsub. Nts., 7/16/42 | | | 248,000 | | | | 258,126 | |
CC Holdings GS V LLC,
3.849% Sr. Sec. Nts., 4/15/231 | | | 227,000 | | | | 231,144 | |
| | | | | | |
|
|
|
| | | | | | | | 489,270 | |
| Utilities—1.7% | | | | | | | | |
| Electric Utilities—1.1% | | | | | | | | |
Edison International, 3.75%
Sr. Unsec. Unsub. Nts., 9/15/17 | | | 663,000 | | | | 719,473 | |
Great Plains Energy, Inc., 2.75%
Sr. Unsec. Unsub. Nts., 8/15/13 | | | 464,000 | | | | 468,882 | |
PPL WEM Holdings plc, 5.375%
Sr. Unsec. Nts., 5/1/211 | | | 761,000 | | | | 856,535 | |
| | | | | | |
|
|
|
| | | | | | | | 2,044,890 | |
| | | | |
| 18 | | | | OPPENHEIMER CORE BOND FUND/VA |
STATEMENT OF INVESTMENTS Continued
| | | | | | | | |
| | | Principal
Amount | | | Value | |
| | | | | | | | | |
| Energy Traders—0.3% | | | | | | | | |
TransAlta Corp., 5.75% Sr. Unsec.
Nts., 12/15/13 | | $ | 455,000 | | | $ | 473,972 | |
| Multi-Utilities—0.3% | | | | | | | | |
CMS Energy Corp., 5.05% Sr. Unsec.
Unsub. Nts., 3/15/22 | | | 431,000 | | | | 481,991 | |
| | | | | | |
|
|
|
Total Corporate Bonds and Notes
(Cost $76,579,987) | | | | | | | 81,888,216 | |
| | | | | | | | |
| | | Shares | | | Value | |
| Investment Company—15.5% | | | | | | | | |
Oppenheimer Institutional Money
Market Fund, Cl. E, 0.15%11,12
(Cost $28,238,653) | | | 28,238,653 | | | $ | 28,238,653 | |
Total Investments, at Value
(Cost $237,756,647) | | | 133.7 | % | | | 242,998,821 | |
| Liabilities in Excess of Other Assets | |
| (33.7
| )
| |
| (61,315,398
| )
|
| Net Assets | |
| 100.0
| %
| | $
| 181,683,423
|
|
Footnotes to Statement of Investments
1. Represents securities sold under Rule 144A, which are exempt from registration under the Securities Act of 1933, as amended. These securities have been determined to be liquid under guidelines established by the Board of Trustees. These securities amount to $26,657,558 or 14.67% of the Fund’s net assets as of December 31, 2012.
2. Represents the current interest rate for a variable or increasing rate security.
3. Restricted security. The aggregate value of restricted securities as of December 31, 2012 was $913,774, which represents 0.50% of the Fund’s net assets. See Note 7 of the accompanying Notes. Information concerning restricted securities is as follows:
| | | | | | | | | | | | | | | | |
| Security | | Acquisition
Dates | | | Cost | | | Value | | | Unrealized
Appreciation
(Depreciation) | |
Morgan Stanley, Re-Securitized Real Estate Mtg.
Investment Conduit Multiclass Pass-Through Certificates,
Series 2012-R3, Cl. 1B, 2.298%, 11/1/36 | | | 10/24/12 | | | $ | 244,730 | | | $ | 270,415 | | | $ | 25,685 | |
NC Finance Trust, Collateralized Mtg.
Obligation Pass-Through Certificates,
Series 1999-I, Cl. ECFD, 3.405%, 1/25/29 | | | 8/10/10 | | | | 3,281,116 | | | | 269,601 | | | | (3,011,515 | ) |
Santander Drive Auto Receivables Trust 2011-S2A,
Automobile Receivables Nts., Series 2011-S2A,
Cl. D, 3.35%, 6/15/17 | | | 5/19/11-1/19/12 | | | | 216,999 | | | | 218,594 | | | | 1,595 | |
Westlake Automobile Receivables Trust 2012-1,
Automobile Receivable Nts., Series 2012-1,
Cl. D, 1.03%, 6/16/14 | | | 9/19/12 | | | | 154,999 | | | | 155,164 | | | | 165 | |
| | | | | | |
|
|
| |
|
|
| |
|
|
|
| | | | | | | $ | 3,897,844 | | | $ | 913,774 | | | $ | (2,984,070 | ) |
| | | | | | |
|
|
| |
|
|
| |
|
|
|
4. All or a portion of the security position is when-issued or delayed delivery to be delivered and settled after December 31, 2012. See Note 1 of the accompanying Notes.
5. Interest-Only Strips represent the right to receive the monthly interest payments on an underlying pool of mortgage loans or other receivables. These securities typically decline in price as interest rates decline. Most other fixed income securities increase in price when interest rates decline. The principal amount of the underlying pool represents the notional amount on which current interest is calculated. The price of these securities is typically more sensitive to changes in prepayment rates than traditional mortgage or asset-backed securities (for example, GNMA pass-throughs). Interest rates disclosed represent current yields based upon the current cost basis and estimated timing and amount of future cash flows. These securities amount to $5,961,492 or 3.28% of the Fund’s net assets as of December 31, 2012.
6. The current amortization rate of the security’s cost basis exceeds the future interest payments currently estimated to be received. Both the amortization rate and interest payments are contingent on future mortgage pre-payment speeds and are therefore subject to change.
7. Principal-Only Strips represent the right to receive the monthly principal payments on an underlying pool of mortgage loans. The value of these securities generally increases as interest rates decline and prepayment rates rise. The price of these securities is typically more volatile than that of coupon-bearing bonds of the same maturity. Interest rates disclosed represent current yields based upon the current cost basis and estimated timing of future cash flows. These securities amount to $248,872 or 0.14% of the Fund’s net assets as of December 31, 2012.
8. This security is not accruing income because the issuer has missed an interest payment on it and/or is not anticipated to make future interest and/or principal payments. The rate shown is the original contractual interest rate. See Note 1 of the accompanying Notes.
9. All or a portion of the security position is held in accounts at a futures clearing merchant and pledged to cover margin requirements on open futures contracts and written options on futures, if applicable. The aggregate market value of such securities is $237,353. See Note 6 of the accompanying Notes.
| | | | |
| 19 | | | | OPPENHEIMER CORE BOND FUND/VA |
10. This bond has no contractual maturity date, is not redeemable and contractually pays an indefinite stream of interest. Rate reported represents the current interest rate for this variable rate security.
11. Is or was an affiliate, as defined in the Investment Company Act of 1940, at or during the period ended December 31, 2012, by virtue of the Fund owning at least 5% of the voting securities of the issuer or as a result of the Fund and the issuer having the same investment adviser. Transactions during the period in which the issuer was an affiliate are as follows:
| | | | | | | | | | | | | | | | |
| | | Shares
December 30, 2011a | | | Gross
Additions | | | Gross
Reductions | | | Shares
December 31, 2012 | |
| Oppenheimer Institutional Money Market Fund, Cl. E | | | 28,319,973 | | | | 85,154,758 | | | | 85,236,078 | | | | 28,238,653 | |
| | | | |
| | | | | | | | | Value | | | Income | |
| Oppenheimer Institutional Money Market Fund, Cl. E | | | | | | | | | | $ | 28,238,653 | | | $ | 60,056 | |
a. December 30, 2011 represents the last business day of the Fund’s 2011 fiscal year. See Note 1 of the accompanying Notes.
12. Rate shown is the 7-day yield as of December 31, 2012.
| | | | | | | | | | | | | | | | | | | | |
| Futures Contracts as of December 31, 2012 are as follows: | | | | | | | |
| | | | | |
| Contract Description | | Buy/Sell | | | Number
of
Contracts | | | Expiration
Date | | | Value | | | Unrealized
Appreciation
(Depreciation) | |
| U.S. Long Bonds | | | Sell | | | | 45 | | | | 3/19/13 | | | $ | 6,637,500 | | | $ | 72,944 | |
| U.S. Treasury Nts., 2 yr. | | | Sell | | | | 79 | | | | 3/28/13 | | | | 17,417,031 | | | | (1,294 | ) |
| U.S. Treasury Nts., 5 yr. | | | Sell | | | | 73 | | | | 3/28/13 | | | | 9,082,227 | | | | 2,533 | |
| U.S. Treasury Nts., 10 yr. | | | Sell | | | | 61 | | | | 3/19/13 | | | | 8,099,656 | | | | 20,990 | |
| U.S. Treasury Ultra Bonds | | | Buy | | | | 54 | | | | 3/19/13 | | | | 8,780,063 | | | | (140,677 | ) |
| | | | | | | | | | | | | | | | | | |
|
|
|
| | | | | | | | | | | | | | | | | | | $ | (45,504 | ) |
| | | | | | | | | | | | | | | | | | |
|
|
|
See accompanying Notes to Financial Statements.
| | | | |
| 20 | | | | OPPENHEIMER CORE BOND FUND/VA |
STATEMENT OF ASSETS AND LIABILITIES
| | | | |
| December 31, 2012 | | | |
| Assets | | | |
| Investments, at value—see accompanying statement of investments: | | | | |
| Unaffiliated companies (cost $209,517,994) | | $ | 214,760,168 | |
| Affiliated companies (cost $28,238,653) | |
| 28,238,653
|
|
| | | | 242,998,821 | |
| Cash | | | 455,544 | |
| Receivables and other assets: | | | | |
| Investments sold on a when-issued or delayed delivery basis | | | 9,019,441 | |
| Dividends, interest and principal paydowns | | | 1,460,957 | |
| Shares of beneficial interest sold | | | 90,464 | |
| Futures margins | | | 51,071 | |
| Other | |
| 26,599
|
|
| Total assets | | | 254,102,897 | |
| Liabilities | | | |
| Payables and other liabilities: | | | | |
| Investments purchased on a when-issued or delayed delivery basis | | | 72,062,118 | |
| Shares of beneficial interest redeemed | | | 161,082 | |
| Futures margins | | | 70,344 | |
| Trustees’ compensation | | | 20,905 | |
| Shareholder communications | | | 20,068 | |
| Transfer and shareholder servicing agent fees | | | 15,414 | |
| Distribution and service plan fees | | | 13,846 | |
| Other | |
| 55,697
|
|
| Total liabilities | | | 72,419,474 | |
| Net Assets | | $
| 181,683,423
|
|
| Composition of Net Assets | | | |
| Par value of shares of beneficial interest | | $ | 22,084 | |
| Additional paid-in capital | | | 252,383,669 | |
| Accumulated net investment income | | | 7,838,245 | |
| Accumulated net realized loss on investments | | | (83,757,245 | ) |
| Net unrealized appreciation on investments | |
| 5,196,670
|
|
| Net Assets | | $
| 181,683,423
|
|
| Net Asset Value Per Share | | | |
| Non-Service Shares: | | | | |
Net asset value, redemption price per share and offering price per share (based on net assets of $116,988,941
and 14,160,649 shares of beneficial interest outstanding) | | | $8.26 | |
| Service Shares: | | | | |
Net asset value, redemption price per share and offering price per share (based on net assets of $64,694,482
and 7,922,860 shares of beneficial interest outstanding) | | | $8.17 | |
See accompanying Notes to Financial Statements.
| | | | |
| 21 | | | | OPPENHEIMER CORE BOND FUND/VA |
STATEMENT OF OPERATIONS
| | | | |
| For the Year Ended December 31, 2012 | | | |
| Investment Income | | | |
| Interest | | $ | 8,267,734 | |
| Dividends from affiliated companies | | | 60,056 | |
| Fee income on when-issued securities | |
| 1,157,464
|
|
| Total investment income | | | 9,485,254 | |
| Expenses | | | |
| Management fees | | | 1,120,003 | |
| Distribution and service plan fees—Service shares | | | 168,000 | |
| Transfer and shareholder servicing agent fees: | | | | |
| Non-Service shares | | | 119,549 | |
| Service shares | | | 67,116 | |
| Shareholder communications: | | | | |
| Non-Service shares | | | 18,654 | |
| Service shares | | | 10,378 | |
| Custodian fees and expenses | | | 27,888 | |
| Trustees’ compensation | | | 18,285 | |
| Administration service fees | | | 1,500 | |
| Other | |
| 60,466
|
|
| Total expenses | | | 1,611,839 | |
| Less waivers and reimbursements of expenses | |
| (44,069
| )
|
| Net expenses | | | 1,567,770 | |
| Net Investment Income | | | 7,917,484 | |
| Realized and Unrealized Gain (Loss) | | | |
| Net realized gain on: | | | | |
| Investments from unaffiliated companies | | | 6,018,773 | |
| Closing and expiration of futures contracts | |
| 303,962
|
|
| Net realized gain | | | 6,322,735 | |
| Net change in unrealized appreciation/depreciation on: | | | | |
| Investments | | | 4,085,618 | |
| Futures contracts | |
| (131,720
| )
|
| Net change in unrealized appreciation/depreciation | | | 3,953,898 | |
| Net Increase in Net Assets Resulting from Operations | | $
| 18,194,117
|
|
See accompanying Notes to Financial Statements.
| | | | |
| 22 | | | | OPPENHEIMER CORE BOND FUND/VA |
STATEMENTS OF CHANGES IN NET ASSETS
| | | | | | | | |
| | | Year
Ended
December 31,
2012 | | | Year
Ended
December 30,
20111 | |
| Operations | | | | | | | | |
| Net investment income | | $ | 7,917,484 | | | $ | 8,584,025 | |
| Net realized gain | | | 6,322,735 | | | | 7,156,870 | |
| Net change in unrealized appreciation/depreciation | |
| 3,953,898
|
| |
| (1,111,204
| )
|
| Net increase in net assets resulting from operations | | | 18,194,117 | | | | 14,629,691 | |
| Dividends and/or Distributions to Shareholders | | | | | | |
| Dividends from net investment income: | | | | | | | | |
| Non-Service shares | | | (5,870,393 | ) | | | (7,632,636 | ) |
| Service shares | |
| (3,356,788
| )
| |
| (3,102,242
| )
|
| | | | (9,227,181 | ) | | | (10,734,878 | ) |
| Beneficial Interest Transactions | | | | | | |
| Net increase (decrease) in net assets resulting from beneficial interest transactions: | | | | | | | | |
| Non-Service shares | | | (11,196,132 | ) | | | (12,784,495 | ) |
| Service shares | |
| (652,679
| )
| |
| 4,335,577
|
|
| | | | (11,848,811 | ) | | | (8,448,918 | ) |
| Net Assets | | | | | | |
| Total decrease | | | (2,881,875 | ) | | | (4,554,105 | ) |
| Beginning of period | |
| 184,565,298
|
| |
| 189,119,403
|
|
| End of period (including accumulated net investment income of $7,838,245 and $8,902,644, respectively) | | $
| 181,683,423
|
| | $
| 184,565,298
|
|
1. December 30, 2011 represents the last business day of the Fund’s 2011 fiscal year. See Note 1 of the accompanying Notes.
See accompanying Notes to Financial Statements.
| | | | |
| 23 | | | | OPPENHEIMER CORE BOND FUND/VA |
FINANCIAL HIGHLIGHTS
| | | | | | | | | | | | | | | | | | | | |
| | | Year Ended
December 31, | | | Year Ended
December 30, | | | Year Ended December 31, | |
| Non-Service Shares | | 2012 | | | 20111 | | | 2010 | | | 2009 | | | 2008 | |
| | | | | | | | | | | | | | | | | | | | | |
| Per Share Operating Data | | | | | | | | | | | | | | | |
| Net asset value, beginning of period | | $ | 7.88 | | | $ | 7.73 | | | $ | 7.07 | | | $ | 6.45 | | | $ | 11.06 | |
| Income (loss) from investment operations: | | | | | | | | | | | | | | | | | | | | |
| Net investment income2 | | | .35 | | | | .36 | | | | .40 | | | | .48 | | | | .66 | |
| Net realized and unrealized gain (loss) | |
| .44
|
| |
| .25
|
| |
| .40
|
| |
| .14
|
| |
| (4.82
| )
|
| Total from investment operations | | | .79 | | | | .61 | | | | .80 | | | | .62 | | | | (4.16 | ) |
| Dividends and/or distributions to shareholders: | | | | | | | | | | | | | | | | | | | | |
| Dividends from net investment income | | | (.41 | ) | | | (.46 | ) | | | (.14 | ) | | | — | | | | (.45 | ) |
| Net asset value, end of period | | $
| 8.26
|
| | $
| 7.88
|
| | $
| 7.73
|
| | $
| 7.07
|
| | $
| 6.45
|
|
| Total Return, at Net Asset Value3 | | | 10.29 | % | | | 8.27 | % | | | 11.42 | % | | | 9.61 | % | | | (39.05 | )% |
| | | | | | | | | | | | | | | | | | | | | |
| Ratios/Supplemental Data | | | | | | | | | | | | | | | |
| Net assets, end of period (in thousands) | | $ | 116,989 | | | $ | 122,271 | | | $ | 132,557 | | | $ | 137,597 | | | $ | 156,339 | |
| Average net assets (in thousands) | | $ | 119,547 | | | $ | 127,341 | | | $ | 136,333 | | | $ | 137,631 | | | $ | 271,355 | |
| Ratios to average net assets:4 | | | | | | | | | | | | | | | | | | | | |
| Net investment income | | | 4.34 | % | | | 4.71 | % | | | 5.32 | % | | | 7.40 | % | | | 6.76 | % |
| Total expenses5 | | | 0.77 | % | | | 0.77 | % | | | 0.79 | % | | | 0.75 | % | | | 0.63 | % |
Expenses after payments, waivers and/or reimbursements and
reduction to custodian expenses | | | 0.75 | % | | | 0.75 | % | | | 0.70 | % | | | 0.61 | % | | | 0.62 | % |
| Portfolio turnover rate6 | | | 140 | % | | | 99 | % | | | 98 | % | | | 143 | % | | | 51 | % |
1. December 30, 2011 represents the last business day of the Fund’s 2011 fiscal year. See Note 1 of the accompanying Notes.
2. Per share amounts calculated based on the average shares outstanding during the period.
3. Assumes an initial investment on the business day before the first day of the fiscal period, with all dividends and distributions reinvested in additional shares on the reinvestment date, and redemption at the net asset value calculated on the last business day of the fiscal period. Total returns are not annualized for periods less than one full year. Total return information does not reflect expenses that apply at the separate account level or to related insurance products. Inclusion of these charges would reduce the total return figures for all periods shown. Returns do not reflect the deduction of taxes that a shareholder would pay on fund distributions or the redemption of fund shares.
4. Annualized for periods less than one full year.
5. Total expenses including indirect expenses from affiliated fund were as follows:
| | | | |
| Year Ended December 31, 2012 | | | 0.79 | % |
| Year Ended December 30, 2011 | | | 0.79 | % |
| Year Ended December 31, 2010 | | | 0.80 | % |
| Year Ended December 31, 2009 | | | 0.76 | % |
| Year Ended December 31, 2008 | | | 0.63 | % |
6. The portfolio turnover rate excludes purchase and sale transactions of To Be Announced (TBA) mortgage-related securities as follows:
| | | | | | | | |
| | | Purchase Transactions | | | Sale Transactions | |
| Year Ended December 31, 2012 | | $ | 930,202,858 | | | $ | 942,406,652 | |
| Year Ended December 30, 2011 | | $ | 911,850,847 | | | $ | 909,531,196 | |
| Year Ended December 31, 2010 | | $ | 775,240,942 | | | $ | 766,486,357 | |
| Year Ended December 31, 2009 | | $ | 977,840,247 | | | $ | 1,009,549,121 | |
| Year Ended December 31, 2008 | | $ | 1,019,711,829 | | | $ | 963,377,934 | |
See accompanying Notes to Financial Statements.
| | | | |
| 24 | | | | OPPENHEIMER CORE BOND FUND/VA |
FINANCIAL HIGHLIGHTS Continued
| | | | | | | | | | | | | | | | | | | | |
| | | Year Ended
December 31, | | | Year Ended
December 30, | | | Year Ended December 31, | |
| Service Shares | | 2012 | | | 20111 | | | 2010 | | | 2009 | | | 2008 | |
| | | | | | | | | | | | | | | | | | | | | |
| Per Share Operating Data | | | | | | | | | | | | | | | |
| Net asset value, beginning of period | | $ | 7.79 | | | $ | 7.65 | | | $ | 6.99 | | | $ | 6.41 | | | $ | 10.98 | |
| Income (loss) from investment operations: | | | | | | | | | | | | | | | | | | | | |
| Net investment income2 | | | .33 | | | | .34 | | | | .37 | | | | .46 | | | | .63 | |
| Net realized and unrealized gain (loss) | |
| .44
|
| |
| .24
|
| |
| .41
|
| |
| .12
|
| |
| (4.77
| )
|
| Total from investment operations | | | .77 | | | | .58 | | | | .78 | | | | .58 | | | | (4.14 | ) |
| Dividends and/or distributions to shareholders: | | | | | | | | | | | | | | | | | | | | |
| Dividends from net investment income | | | (.39 | ) | | | (.44 | ) | | | (.12 | ) | | | — | | | | (.43 | ) |
| Net asset value, end of period | | $
| 8.17
|
| | $
| 7.79
|
| | $
| 7.65
|
| | $
| 6.99
|
| | $
| 6.41
|
|
| Total Return, at Net Asset Value3 | | | 10.17 | % | | | 7.93 | % | | | 11.28 | % | | | 9.05 | % | | | (39.07 | )% |
| | | | | | | | | | | | | | | | | | | | | |
| Ratios/Supplemental Data | | | | | | | | | | | | | | | |
| Net assets, end of period (in thousands) | | $ | 64,694 | | | $ | 62,294 | | | $ | 56,562 | | | $ | 56,717 | | | $ | 63,093 | |
| Average net assets (in thousands) | | $ | 67,116 | | | $ | 58,629 | | | $ | 57,313 | | | $ | 52,648 | | | $ | 101,597 | |
| Ratios to average net assets:4 | | | | | | | | | | | | | | | | | | | | |
| Net investment income | | | 4.07 | % | | | 4.42 | % | | | 5.06 | % | | | 7.16 | % | | | 6.55 | % |
| Total expenses5 | | | 1.02 | % | | | 1.02 | % | | | 1.04 | % | | | 1.01 | % | | | 0.88 | % |
Expenses after payments, waivers and/or reimbursements and
reduction to custodian expenses | | | 1.00 | % | | | 1.00 | % | | | 0.95 | % | | | 0.86 | % | | | 0.87 | % |
| Portfolio turnover rate6 | | | 140 | % | | | 99 | % | | | 98 | % | | | 143 | % | | | 51 | % |
1. December 30, 2011 represents the last business day of the Fund’s 2011 fiscal year. See Note 1 of the accompanying Notes.
2. Per share amounts calculated based on the average shares outstanding during the period.
3. Assumes an initial investment on the business day before the first day of the fiscal period, with all dividends and distributions reinvested in additional shares on the reinvestment date, and redemption at the net asset value calculated on the last business day of the fiscal period. Total returns are not annualized for periods less than one full year. Total return information does not reflect expenses that apply at the separate account level or to related insurance products. Inclusion of these charges would reduce the total return figures for all periods shown. Returns do not reflect the deduction of taxes that a shareholder would pay on fund distributions or the redemption of fund shares.
4. Annualized for periods less than one full year.
5. Total expenses including indirect expenses from affiliated fund were as follows:
| | | | |
| Year Ended December 31, 2012 | | | 1.04 | % |
| Year Ended December 30, 2011 | | | 1.04 | % |
| Year Ended December 31, 2010 | | | 1.05 | % |
| Year Ended December 31, 2009 | | | 1.02 | % |
| Year Ended December 31, 2008 | | | 0.88 | % |
6. The portfolio turnover rate excludes purchase and sale transactions of To Be Announced (TBA) mortgage-related securities as follows:
| | | | | | | | |
| | | Purchase Transactions | | | Sale Transactions | |
| Year Ended December 31, 2012 | | $ | 930,202,858 | | | $ | 942,406,652 | |
| Year Ended December 30, 2011 | | $ | 911,850,847 | | | $ | 909,531,196 | |
| Year Ended December 31, 2010 | | $ | 775,240,942 | | | $ | 766,486,357 | |
| Year Ended December 31, 2009 | | $ | 977,840,247 | | | $ | 1,009,549,121 | |
| Year Ended December 31, 2008 | | $ | 1,019,711,829 | | | $ | 963,377,934 | |
See accompanying Notes to Financial Statements.
| | | | |
| 25 | | | | OPPENHEIMER CORE BOND FUND/VA |
NOTES TO FINANCIAL STATEMENTS
1. Significant Accounting Policies
Oppenheimer Core Bond Fund/VA (the “Fund”) is a separate series of Oppenheimer Variable Account Funds, a diversified open-end management investment company registered under the Investment Company Act of 1940, as amended. The Fund’s main investment objective is to seek a high level of current income. As a secondary objective, the Fund seeks capital appreciation when consistent with its primary objective. The Fund’s investment adviser is OppenheimerFunds, Inc. (the “Manager”).
The Fund offers two classes of shares. Both classes are sold at their offering price, which is the net asset value per share, to separate investment accounts of participating insurance companies as an underlying investment for variable life insurance policies, variable annuity contracts or other investment products. The class of shares designated as Service shares is subject to a distribution and service plan. Both classes of shares have identical rights and voting privileges with respect to the Fund in general and exclusive voting rights on matters that affect that class alone. Earnings, net assets and net asset value per share may differ due to each class having its own expenses, such as transfer and shareholder servicing agent fees and shareholder communications, directly attributable to that class.
The following is a summary of significant accounting policies consistently followed by the Fund.
Previous Annual Period. The last day of the Fund’s fiscal year was the last day the New York Stock Exchange was open for trading. The Fund’s financial statements have been presented through that date to maintain consistency with the Fund’s net asset value calculations used for shareholder transactions.
Securities on a When-Issued or Delayed Delivery Basis. The Fund may purchase securities on a “when-issued” basis, and may purchase or sell securities on a “delayed delivery” basis. “When-issued” or “delayed delivery” refers to securities whose terms and indenture are available and for which a market exists, but which are not available for immediate delivery. Delivery and payment for securities that have been purchased by the Fund on a when-issued basis normally takes place within six months and possibly as long as two years or more after the trade date. During this period, such securities do not earn interest, are subject to market fluctuation and may increase or decrease in value prior to their delivery. The purchase of securities on a when-issued basis may increase the volatility of the Fund’s net asset value to the extent the Fund executes such transactions while remaining substantially fully invested. When the Fund engages in when-issued or delayed delivery transactions, it relies on the buyer or seller, as the case may be, to complete the transaction. Their failure to do so may cause the Fund to lose the opportunity to obtain or dispose of the security at a price and yield it considers advantageous. The Fund may also sell securities that it purchased on a when-issued basis or forward commitment prior to settlement of the original purchase.
As of December 31, 2012, the Fund had purchased securities issued on a when-issued or delayed delivery basis and sold securities issued on a delayed delivery basis as follows:
| | | | |
| | | When-Issued or Delayed Delivery
Basis Transactions | |
| Purchased securities | | $ | 72,062,118 | |
| Sold securities | | | 9,019,441 | |
The Fund may enter into “forward roll” transactions with respect to mortgage-related securities. In this type of transaction, the Fund sells a mortgage-related security to a buyer and simultaneously agrees to repurchase a similar security (same type, coupon and maturity) at a later date at a set price. During the period between the sale and the repurchase, the Fund will not be entitled to receive interest and principal payments on the securities that have been sold. The Fund records the incremental difference between the forward purchase and sale of each forward roll as realized gain (loss) on investments or as fee income in the case of such transactions that have an associated fee in lieu of a difference in the forward purchase and sale price.
| | | | |
| 26 | | | | OPPENHEIMER CORE BOND FUND/VA |
NOTES TO FINANCIAL STATEMENTS Continued
1. Significant Accounting Policies Continued
Forward roll transactions may be deemed to entail embedded leverage since the Fund purchases mortgage-related securities with extended settlement dates rather than paying for the securities under a normal settlement cycle. This embedded leverage increases the Fund’s market value of investments relative to its net assets which can incrementally increase the volatility of the Fund’s performance. Forward roll transactions can be replicated over multiple settlement periods.
Risks of entering into forward roll transactions include the potential inability of the counterparty to meet the terms of the agreement; the potential of the Fund to receive inferior securities at redelivery as compared to the securities sold to the counterparty; and counterparty credit risk.
Credit Risk. The Fund invests in high-yield, non-investment-grade bonds, which may be subject to a greater degree of credit risk. Credit risk relates to the ability of the issuer to meet interest or principal payments or both as they become due. The Fund may acquire securities that have missed an interest payment, and is not obligated to dispose of securities whose issuers or underlying obligors subsequently miss an interest payment. Information concerning securities not accruing interest as of December 31, 2012 is as follows:
| | | | |
| Cost | | $ | 3,281,116 | |
| Market Value | | $ | 269,601 | |
| Market Value as a % of Net Assets | | | 0.15 | % |
Investment in Oppenheimer Institutional Money Market Fund. The Fund is permitted to invest daily available cash balances in an affiliated money market fund. The Fund may invest the available cash in Class E shares of Oppenheimer Institutional Money Market Fund (“IMMF”) to seek current income while preserving liquidity. IMMF is a registered open-end management investment company, regulated as a money market fund under the Investment Company Act of 1940, as amended. The Manager is also the investment adviser of IMMF. When applicable, the Fund’s investment in IMMF is included in the Statement of Investments. Shares of IMMF are valued at their net asset value per share. As a shareholder, the Fund is subject to its proportional share of IMMF’s Class E expenses, including its management fee. The Manager will waive fees and/or reimburse Fund expenses in an amount equal to the indirect management fees incurred through the Fund’s investment in IMMF.
Allocation of Income, Expenses, Gains and Losses. Income, expenses (other than those attributable to a specific class), gains and losses are allocated on a daily basis to each class of shares based upon the relative proportion of net assets represented by such class. Operating expenses directly attributable to a specific class are charged against the operations of that class.
Federal Taxes. The Fund intends to comply with provisions of the Internal Revenue Code applicable to regulated investment companies and to distribute substantially all of its investment company taxable income, including any net realized gain on investments not offset by capital loss carryforwards, if any, to shareholders. Therefore, no federal income or excise tax provision is required. The Fund files income tax returns in U.S. federal and applicable state jurisdictions. The statute of limitations on the Fund’s tax return filings generally remain open for the three preceding fiscal reporting period ends.
The tax components of capital shown in the following table represent distribution requirements the Fund must satisfy under the income tax regulations, losses the Fund may be able to offset against income and gains realized in future years and unrealized appreciation or depreciation of securities and other investments for federal income tax purposes.
| | | | | | | | | | | | |
Undistributed
Net Investment
Income | | Undistributed
Long-Term Gain | | | Accumulated Loss
Carryforward1,2,3 | | | Net Unrealized Appreciation Based on
Cost of Securities and
Other Investments for
Federal Income Tax Purposes | |
| $8,296,716 | | $ | — | | | $ | 83,757,741 | | | $ | 5,184,025 | |
| | | | |
| 27 | | | | OPPENHEIMER CORE BOND FUND/VA |
1. As of December 31, 2012, the Fund had $83,757,741 of net capital loss carryforwards available to offset future realized capital gains, if any, and thereby reduce future taxable gain distributions. Details of the capital loss carryforwards are included in the table below. Capital loss carryovers with no expiration, if any, must be utilized prior to those with expiration dates.
| | | | |
| Expiring | | | |
| 2016 | | $ | 8,687,891 | |
| 2017 | | | 75,069,850 | |
| | |
|
|
|
| Total | | $ | 83,757,741 | |
| | |
|
|
|
2. During the fiscal year ended December 31, 2012, the Fund utilized $5,945,207 of capital loss carryforward to offset capital gains realized in that fiscal year.
3. During the fiscal year ended December 30, 2011, the Fund utilized $5,723,749 of capital loss carryforward to offset capital gains realized in that fiscal year.
Net investment income (loss) and net realized gain (loss) may differ for financial statement and tax purposes. The character of dividends and distributions made during the fiscal year from net investment income or net realized gains may differ from their ultimate characterization for federal income tax purposes. Also, due to timing of dividends and distributions, the fiscal year in which amounts are distributed may differ from the fiscal year in which the income or net realized gain was recorded by the Fund.
Accordingly, the following amounts have been reclassified for December 31, 2012. Net assets of the Fund were unaffected by the reclassifications.
| | | | |
Increase to
Accumulated
Net Investment
Income | | Increase to
Accumulated
Net Realized
Loss on
Investments | |
| $245,298 | | $ | 245,298 | |
The tax character of distributions paid during the years ended December 31, 2012 and December 31, 2011 was as follows:
| | | | | | | | |
| | | Year Ended
December 31, 2012 | | | Year Ended
December 31, 2011 | |
Distributions paid from: | | | | | | | | |
| Ordinary income | | $ | 9,227,181 | | | $ | 10,734,878 | |
| | | | |
| 28 | | | | OPPENHEIMER CORE BOND FUND/VA |
NOTES TO FINANCIAL STATEMENTS Continued
1. Significant Accounting Policies Continued
The aggregate cost of securities and other investments and the composition of unrealized appreciation and depreciation of securities and other investments for federal income tax purposes as of December 31, 2012 are noted in the following table. The primary difference between book and tax appreciation or depreciation of securities and other investments, if applicable, is attributable to the tax deferral of losses or tax realization of financial statement unrealized gain or loss.
| | | | |
| Federal tax cost of securities | | $ | 237,814,796 | |
Federal tax cost of other investments | | | (32,456,351) | |
| | |
|
|
|
| Total federal tax cost | | $ | 205,358,445 | |
| | |
|
|
|
| |
| Gross unrealized appreciation | | $ | 10,088,129 | |
Gross unrealized depreciation | | | (4,904,104) | |
| | |
|
|
|
| Net unrealized appreciation | | $ | 5,184,025 | |
| | |
|
|
|
Trustees’ Compensation. The Board of Trustees has adopted a compensation deferral plan for independent trustees that enables trustees to elect to defer receipt of all or a portion of the annual compensation they are entitled to receive from the Fund. For purposes of determining the amount owed to the Trustee under the plan, deferred amounts are treated as though equal dollar amounts had been invested in shares of the Fund or in other Oppenheimer funds selected by the Trustee. The Fund purchases shares of the funds selected for deferral by the Trustee in amounts equal to his or her deemed investment, resulting in a Fund asset equal to the deferred compensation liability. Such assets are included as a component of “Other” within the asset section of the Statement of Assets and Liabilities. Deferral of trustees’ fees under the plan will not affect the net assets of the Fund, and will not materially affect the Fund’s assets, liabilities or net investment income per share. Amounts will be deferred until distributed in accordance with the compensation deferral plan.
Dividends and Distributions to Shareholders. Dividends and distributions to shareholders, which are determined in accordance with income tax regulations and may differ from U.S. generally accepted accounting principles, are recorded on the ex-dividend date. Income and capital gain distributions, if any, are declared and paid annually or at other times as deemed necessary by the Manager.
Investment Income. Dividend income is recorded on the ex-dividend date or upon ex-dividend notification in the case of certain foreign dividends where the ex-dividend date may have passed. Non-cash dividends included in dividend income, if any, are recorded at the fair market value of the securities received. Interest income is recognized on an accrual basis. Discount and premium, which are included in interest income on the Statement of Operations, are amortized or accreted daily.
Custodian Fees. “Custodian fees and expenses” in the Statement of Operations may include interest expense incurred by the Fund on any cash overdrafts of its custodian account during the period. Such cash overdrafts may result from the effects of failed trades in portfolio securities and from cash outflows resulting from unanticipated shareholder redemption activity. The Fund pays interest to its custodian on such cash overdrafts, to the extent they are not offset by positive cash balances maintained by the Fund, at a rate equal to the Federal Funds Rate plus 0.50%. The “Reduction to custodian expenses” line item, if applicable, represents earnings on cash balances maintained by the Fund during the period. Such interest expense and other custodian fees may be paid with these earnings.
Security Transactions. Security transactions are recorded on the trade date. Realized gains and losses on securities sold are determined on the basis of identified cost.
Indemnifications. The Fund’s organizational documents provide current and former trustees and officers with a limited indemnification against liabilities arising in connection with the performance of their duties to the Fund. In the normal
| | | | |
| 29 | | | | OPPENHEIMER CORE BOND FUND/VA |
course of business, the Fund may also enter into contracts that provide general indemnifications. The Fund’s maximum exposure under these arrangements is unknown as this would be dependent on future claims that may be made against the Fund. The risk of material loss from such claims is considered remote.
Other. The preparation of financial statements in conformity with accounting principles generally accepted in the United States of America requires management to make estimates and assumptions that affect the reported amounts of assets and liabilities and disclosure of contingent assets and liabilities at the date of the financial statements and the reported amounts of increases and decreases in net assets from operations during the reporting period. Actual results could differ from those estimates.
2. Securities Valuation
The Fund calculates the net asset value of its shares as of the close of the New York Stock Exchange (the “Exchange”), normally 4:00 P.M. Eastern time, on each day the Exchange is open for trading.
The Fund’s Board has adopted procedures for the valuation of the Fund’s securities and has delegated the day-to-day responsibility for valuation determinations under those procedures to the Manager. The Manager has established a Valuation Committee which is responsible for determining a “fair valuation” for any security for which market quotations are not “readily available.” The Valuation Committee’s fair valuation determinations are subject to review, approval and ratification by the Fund’s Board at its next regularly scheduled meeting covering the calendar quarter in which the fair valuation was determined.
Valuation Methods and Inputs
Securities are valued using unadjusted quoted market prices, when available, as supplied primarily by third party pricing services or dealers.
The following methodologies are used to determine the market value or the fair value of the types of securities described below:
Securities traded on a registered U.S. securities exchange (including exchange-traded derivatives other than futures and futures options) are valued based on the last sale price of the security reported on the principal exchange on which it is traded, prior to the time when the Fund’s assets are valued. In the absence of a sale, the security is valued at the last sale price on the prior trading day, if it is within the spread of the current day’s closing “bid” and “asked” prices, and if not, at the current day’s closing bid price. A security of a foreign issuer traded on a foreign exchange but not listed on a registered U.S. securities exchange is valued based on the last sale price on the principal exchange on which the security is traded, as identified by the third party pricing service used by the Manager, prior to the time when the Fund’s assets are valued. If the last sale price is unavailable, the security is valued at the most recent official closing price on the principal exchange on which it is traded. If the last sales price or official closing price for a foreign security is not available, the security is valued at the mean between the bid and asked price per the exchange or, if not available from the exchange, obtained from two dealers. If bid and asked prices are not available from either the exchange or two dealers, the security is valued by using one of the following methodologies (listed in order of priority); (1) using a bid from the exchange, (2) the mean between the bid and asked price as provided by a single dealer, or (3) a bid from a single dealer.
Shares of a registered investment company that are not traded on an exchange are valued at that investment company’s net asset value per share.
Corporate and government debt securities (of U.S. or foreign issuers) and municipal debt securities, event-linked bonds, loans, mortgage-backed securities, collateralized mortgage obligations, and asset-backed securities are valued at the mean between the “bid” and “asked” prices utilizing evaluated prices obtained from third party pricing services or broker-dealers who may use matrix pricing methods to determine the evaluated prices.
| | | | |
| 30 | | | | OPPENHEIMER CORE BOND FUND/VA |
NOTES TO FINANCIAL STATEMENTS Continued
2. Securities Valuation Continued
Short-term money market type debt securities with a remaining maturity of sixty days or less are valued at cost adjusted by the amortization of discount or premium to maturity (amortized cost), which approximates market value. Short-term debt securities with a remaining maturity in excess of sixty days are valued at the mean between the “bid” and “asked” prices utilizing evaluated prices obtained from third party pricing services or broker-dealers.
Futures contracts and futures options traded on a commodities or futures exchange will be valued at the final settlement price or official closing price on the principal exchange as reported by such principal exchange at its trading session ending at, or most recently prior to, the time when the Fund’s assets are valued.
A description of the standard inputs that may generally be considered by the third party pricing vendors in determining their evaluated prices is provided below.
| | |
| Security Type | | Standard inputs generally considered by third-party
pricing vendors |
| Corporate debt, government debt, municipal, mortgage-backed and asset-backed securities | | Reported trade data, broker-dealer price quotations, benchmark yields, issuer spreads on comparable securities, the credit quality, yield, maturity, and other appropriate factors. |
| Loans | | Information obtained from market participants regarding reported trade data and broker-dealer price quotations. |
| Event-linked bonds | | Information obtained from market participants regarding reported trade data and broker-dealer price quotations. |
If a market value or price cannot be determined for a security using the methodologies described above, or if, in the “good faith” opinion of the Manager, the market value or price obtained does not constitute a “readily available market quotation,” or a significant event has occurred that would materially affect the value of the security the security is fair valued either (i) by a standardized fair valuation methodology applicable to the security type or the significant event as previously approved by the Valuation Committee and the Fund’s Board or (ii) as determined in good faith by the Manager’s Valuation Committee. The Valuation Committee considers all relevant facts that are reasonably available, through either public information or information available to the Manager, when determining the fair value of a security. Fair value determinations by the Manager are subject to review, approval and ratification by the Fund’s Board at its next regularly scheduled meeting covering the calendar quarter in which the fair valuation was determined. Those fair valuation standardized methodologies include, but are not limited to, valuing securities at the last sale price or initially at cost and subsequently adjusting the value based on: changes in company specific fundamentals, changes in an appropriate securities index, or changes in the value of similar securities which may be further adjusted for any discounts related to security-specific resale restrictions. When possible, such methodologies use observable market inputs such as unadjusted quoted prices of similar securities, observable interest rates, currency rates and yield curves. The methodologies used for valuing securities are not necessarily an indication of the risks associated with investing in those securities nor can it be assured that the Fund can obtain the fair value assigned to a security if it were to sell the security.
To assess the continuing appropriateness of security valuations, the Manager, or its third party service provider who is subject to oversight by the Manager, regularly compares prior day prices, prices on comparable securities, and sale prices to the current day prices and challenges those prices exceeding certain tolerance levels with the third party pricing service or broker source. For those securities valued by fair valuations, whether through a standardized fair valuation methodology or a fair valuation determination, the Valuation Committee reviews and affirms the reasonableness of the valuations based on such methodologies and fair valuation determinations on a regular basis after considering all relevant information that is reasonably available.
| | | | |
| 31 | | | | OPPENHEIMER CORE BOND FUND/VA |
Classifications
Each investment asset or liability of the Fund is assigned a level at measurement date based on the significance and source of the inputs to its valuation. Various data inputs are used in determining the value of each of the Fund’s investments as of the reporting period end. These data inputs are categorized in the following hierarchy under applicable financial accounting standards:
1) Level 1—unadjusted quoted prices in active markets for identical assets or liabilities (including securities actively traded on a securities exchange)
2) Level 2—inputs other than unadjusted quoted prices that are observable for the asset or liability (such as unadjusted quoted prices for similar assets and market corroborated inputs such as interest rates, prepayment speeds, credit risks, etc.)
3) Level 3—significant unobservable inputs (including the Manager’s own judgments about assumptions that market participants would use in pricing the asset or liability).
The inputs used for valuing securities are not necessarily an indication of the risks associated with investing in those securities.
The table below categorizes amounts that are included in the Fund’s Statement of Assets and Liabilities as of December 31, 2012 based on valuation input level:
| | | | | | | | | | | | | | | | |
| | | Level 1—
Unadjusted
Quoted
Prices | | | Level 2—
Other Significant
Observable Inputs | | | Level 3—
Significant
Unobservable
Inputs | | | Value | |
| Assets Table | | | | | | | | | | | | | | | | |
| Investments, at Value: | | | | | | | | | | | | | | | | |
| Asset-Backed Securities | | $ | — | | | $ | 19,190,768 | | | $ | — | | | $ | 19,190,768 | |
| Mortgage-Backed Obligations | | | — | | | | 109,557,648 | | | | 363,520 | | | | 109,921,168 | |
| U.S. Government Obligations | | | — | | | | 3,760,016 | | | | — | | | | 3,760,016 | |
| Corporate Bonds and Notes | | | — | | | | 81,888,216 | | | | — | | | | 81,888,216 | |
| Investment Company | | | 28,238,653 | | | | — | | | | — | | | | 28,238,653 | |
| | |
|
|
| |
|
|
| |
|
|
| |
|
|
|
| Total Investments, at Value | | | 28,238,653 | | | | 214,396,648 | | | | 363,520 | | | | 242,998,821 | |
| Other Financial Instruments: | | | | | | | | | | | | | | | | |
| Futures margins | | | 51,071 | | | | — | | | | — | | | | 51,071 | |
| | |
|
|
| |
|
|
| |
|
|
| |
|
|
|
| Total Assets | | $ | 28,289,724 | | | $ | 214,396,648 | | | $ | 363,520 | | | $ | 243,049,892 | |
| | |
|
|
| |
|
|
| |
|
|
| |
|
|
|
| Liabilities Table | | | | | | | | | | | | | | | | |
| Other Financial Instruments: | | | | | | | | | | | | | | | | |
| Futures margins | | $ | (70,344 | ) | | $ | — | | | $ | — | | | $ | (70,344 | ) |
| | |
|
|
| |
|
|
| |
|
|
| |
|
|
|
| Total Liabilities | | $ | (70,344 | ) | | $ | — | | | $ | — | | | $ | (70,344 | ) |
| | |
|
|
| |
|
|
| |
|
|
| |
|
|
|
Currency contracts and forwards, if any, are reported at their unrealized appreciation/depreciation at measurement date, which represents the change in the contract’s value from trade date. Futures, if any, are reported at their variation margin at measurement date, which represents the amount due to/from the Fund at that date. All additional assets and liabilities included in the above table are reported at their market value at measurement date.
The table below shows the transfers between Level 2 and Level 3. The Fund’s policy is to recognize transfers in and transfers out as of the beginning of the reporting period.
| | | | | | | | |
| | | Transfers out of
Level 2* | | | Transfers into
Level 3* | |
| Assets Table | | | | | | | | |
| Investments, at Value: | | | | | | | | |
| Mortgage-Backed Obligations | | $ | (411,628 | ) | | $ | 411,628 | |
* Transferred from Level 2 to Level 3 because of the lack of observable market data.
There have been no significant changes to the fair valuation methodologies of the Fund during the period.
| | | | |
| 32 | | | | OPPENHEIMER CORE BOND FUND/VA |
NOTES TO FINANCIAL STATEMENTS Continued
3. Shares of Beneficial Interest
The Fund has authorized an unlimited number of $0.001 par value shares of beneficial interest of each class. Transactions in shares of beneficial interest were as follows:
| | | | | | | | | | | | | | | | |
| | | Year Ended December 31, 2012 | | | Year Ended December 30, 2011 | |
| | | Shares | | | Amount | | | Shares | | | Amount | |
| Non-Service Shares | | | | | | | | | | | | | | | | |
| Sold | | | 1,396,350 | | | $ | 11,307,630 | | | | 1,525,561 | | | $ | 11,724,677 | |
| Dividends and/or distributions reinvested | | | 749,731 | | | | 5,870,393 | | | | 1,028,657 | | | | 7,632,636 | |
| Redeemed | | | (3,505,581 | ) | | | (28,374,155 | ) | | | (4,179,877 | ) | | | (32,141,808 | ) |
| | |
|
|
| |
|
|
| |
|
|
| |
|
|
|
| Net decrease | | | (1,359,500 | ) | | $ | (11,196,132 | ) | | | (1,625,659 | ) | | $ | (12,784,495 | ) |
| | |
|
|
| |
|
|
| |
|
|
| |
|
|
|
| | | | | | | | | | | | | |
| Service Shares | | | | | | | | | | | | | | | | |
| Sold | | | 3,789,524 | | | $ | 30,414,887 | | | | 2,658,754 | | | $ | 20,149,296 | |
| Dividends and/or distributions reinvested | | | 433,134 | | | | 3,356,788 | | | | 422,074 | | | | 3,102,242 | |
| Redeemed | | | (4,293,364 | ) | | | (34,424,354 | ) | | | (2,480,364 | ) | | | (18,915,961 | ) |
| | |
|
|
| |
|
|
| |
|
|
| |
|
|
|
| Net increase (decrease) | | | (70,706 | ) | | $ | (652,679 | ) | | | 600,464 | | | $ | 4,335,577 | |
| | |
|
|
| |
|
|
| |
|
|
| |
|
|
|
4. Purchases and Sales of Securities
The aggregate cost of purchases and proceeds from sales of securities, other than short-term obligations and investments in IMMF, for the year ended December 31, 2012, were as follows:
| | | | | | | | |
| | | Purchases | | | Sales | |
| Investment securities | | $ | 200,301,668 | | | $ | 205,258,236 | |
| U.S. government and government agency obligations | | | 8,683,246 | | | | 8,152,683 | |
| To Be Announced (TBA) mortgage-related securities | | | 930,202,858 | | | | 942,406,652 | |
5. Fees and Other Transactions with Affiliates
Management Fees. Under the investment advisory agreement, the Fund pays the Manager a management fee based on the daily net assets of the Fund at an annual rate as shown in the following table:
| | | | |
| Fee Schedule | | | |
| Up to $1 billion | | | 0.60 | % |
| Over $1 billion | | | 0.50 | |
Administration Service Fees. The Fund pays the Manager a fee of $1,500 per year for preparing and filing the Fund’s tax returns.
Transfer Agent Fees. OppenheimerFunds Services (“OFS”), a division of the Manager, acts as the transfer and shareholder servicing agent for the Fund. For the year ended December 31, 2012, the Fund paid $186,704 to OFS for services to the Fund.
Distribution and Service Plan for Service Shares. The Fund has adopted a Distribution and Service Plan (the “Plan”) in accordance with Rule 12b-1 under the Investment Company Act of 1940 for Service shares to pay OppenheimerFunds Distributor, Inc. (the “Distributor”), for distribution related services, personal service and account maintenance for the Fund’s Service shares. Under the Plan, payments are made periodically at an annual rate of 0.25% of the daily net assets of Service shares of the Fund. The Distributor currently uses all of those fees to compensate sponsors of the insurance product that offers Fund shares, for providing personal service and maintenance of accounts of their variable contract owners that hold Service shares. These fees are paid out of the Fund’s assets on an on-going basis and increase operating
| | | | |
| 33 | | | | OPPENHEIMER CORE BOND FUND/VA |
expenses of the Service shares, which results in lower performance compared to the Fund’s shares that are not subject to a service fee. Fees incurred by the Fund under the Plan are detailed in the Statement of Operations.
Waivers and Reimbursements of Expenses. The Manager has voluntarily agreed to limit the Fund’s expenses after payments, waivers and/or reimbursements and reduction to custodian expenses, excluding expenses incurred directly or indirectly by the Fund as a result of investments in other investment companies, wholly-owned subsidiaries and pooled investment vehicles; so that those expenses, as percentages of daily net assets, will not exceed the annual rate of 0.75% for Non-Service shares and 1.00% for Service shares. During the year ended December 31, 2012, the Manager waived fees and/or reimbursed the Fund $9,006 and $5,208 for Non-Service and Service shares, respectively.
The Manager will waive fees and/or reimburse Fund expenses in an amount equal to the indirect management fees incurred through the Fund’s investment in IMMF. During the year ended December 31, 2012, the Manager waived fees and/or reimbursed the Fund $29,855 for IMMF management fees.
Some of these undertakings may be modified or terminated at any time; some may not be modified or terminated until after one year from the date of the current prospectus, as indicated therein.
6. Risk Exposures and the Use of Derivative Instruments
The Fund’s investment objectives not only permit the Fund to purchase investment securities, they also allow the Fund to enter into various types of derivatives contracts, including, but not limited to, futures contracts, forward foreign currency exchange contracts, credit default swaps, interest rate swaps, total return swaps, and purchased and written options. In doing so, the Fund will employ strategies in differing combinations to permit it to increase, decrease, or change the level or types of exposure to market risk factors. Central to those strategies are features inherent to derivatives that make them more attractive for this purpose than equity and debt securities: they require little or no initial cash investment, they can focus exposure on only certain selected risk factors, and they may not require the ultimate receipt or delivery of the underlying security (or securities) to the contract. This may allow the Fund to pursue its objectives more quickly and efficiently than if it were to make direct purchases or sales of securities capable of effecting a similar response to market factors.
Market Risk Factors. In accordance with its investment objectives, the Fund may use derivatives to increase or decrease its exposure to one or more of the following market risk factors:
Commodity Risk. Commodity risk relates to the change in value of commodities or commodity indexes as they relate to increases or decreases in the commodities market. Commodities are physical assets that have tangible properties. Examples of these types of assets are crude oil, heating oil, metals, livestock, and agricultural products.
Credit Risk. Credit risk relates to the ability of the issuer to meet interest and principal payments, or both, as they come due. In general, lower-grade, higher-yield bonds are subject to credit risk to a greater extent than lower-yield, higher-quality bonds.
Equity Risk. Equity risk relates to the change in value of equity securities as they relate to increases or decreases in the general market.
Foreign Exchange Rate Risk. Foreign exchange rate risk relates to the change in the U.S. dollar value of a security held that is denominated in a foreign currency. The U.S. dollar value of a foreign currency denominated security will decrease as the dollar appreciates against the currency, while the U.S. dollar value will increase as the dollar depreciates against the currency.
Interest Rate Risk. Interest rate risk refers to the fluctuations in value of fixed-income securities resulting from the inverse relationship between price and yield. For example, an increase in general interest rates will tend to reduce the market value of already issued fixed-income investments, and a decline in general interest rates will tend to increase their value. In addition, debt securities with longer maturities, which tend to have higher yields, are subject to potentially greater fluctuations in value from changes in interest rates than obligations with shorter maturities.
| | | | |
| 34 | | | | OPPENHEIMER CORE BOND FUND/VA |
NOTES TO FINANCIAL STATEMENTS Continued
6. Risk Exposures and the Use of Derivative Instruments Continued
Volatility Risk. Volatility risk refers to the magnitude of the movement, but not the direction of the movement, in a financial instrument’s price over a defined time period. Large increases or decreases in a financial instrument’s price over a relative time period typically indicate greater volatility risk, while small increases or decreases in its price typically indicate lower volatility risk.
The Fund’s actual exposures to these market risk factors during the period are discussed in further detail, by derivative type, below.
Risks of Investing in Derivatives. The Fund’s use of derivatives can result in losses due to unanticipated changes in the market risk factors and the overall market. In instances where the Fund is using derivatives to decrease, or hedge, exposures to market risk factors for securities held by the Fund, there are also risks that those derivatives may not perform as expected resulting in losses for the combined or hedged positions.
Derivatives may have little or no initial cash investment relative to their market value exposure and therefore can produce significant gains or losses in excess of their cost. This use of embedded leverage allows the Fund to increase its market value exposure relative to its net assets and can substantially increase the volatility of the Fund’s performance.
Additional associated risks from investing in derivatives also exist and potentially could have significant effects on the valuation of the derivative and the Fund. Typically, the associated risks are not the risks that the Fund is attempting to increase or decrease exposure to, per its investment objectives, but are the additional risks from investing in derivatives. Examples of these associated risks are liquidity risk, which is the risk that the Fund will not be able to sell the derivative in the open market in a timely manner, and counterparty credit risk, which is the risk that the counterparty will not fulfill its obligation to the Fund. Associated risks can be different for each type of derivative and are discussed by each derivative type in the notes that follow.
Counterparty Credit Risk. Certain derivative positions are subject to counterparty credit risk, which is the risk that the counterparty will not fulfill its obligation to the Fund. The Fund’s derivative counterparties are financial institutions who are subject to market conditions that may weaken their financial position. The Fund intends to enter into financial transactions with counterparties that the Manager believes to be creditworthy at the time of the transaction.
Credit Related Contingent Features. The Fund’s agreements with derivative counterparties have several credit related contingent features that if triggered would allow its derivatives counterparties to close out and demand payment or additional collateral to cover their exposure from the Fund. Credit related contingent features are established between the Fund and its derivatives counterparties to reduce the risk that the Fund will not fulfill its payment obligations to its counterparties. These triggering features include, but are not limited to, a percentage decrease in the Fund’s net assets and or a percentage decrease in the Fund’s Net Asset Value or NAV. The contingent features are established within the Fund’s International Swap and Derivatives Association, Inc. master agreements which govern certain positions in swaps, over-the-counter options and swaptions, and forward currency exchange contracts for each individual counterparty.
Valuations of derivative instruments as of December 31, 2012 are as follows:
| | | | | | | | | | | | |
| | | Asset Derivatives
| | | Liability Derivatives
| |
Derivatives Not Accounted for as Hedging Instruments | | Statement of Assets
and Liabilities Location | | Value | | | Statement of Assets
and Liabilities Location | | Value | |
| Interest rate contracts | | Futures margins | | | $51,071 | * | | Futures margins | | | $70,344 | * |
*Includes only the current day’s variation margin. Prior variation margin movements have been reflected in cash on the Statement of Assets and Liabilities upon receipt or payment.
| | | | |
| 35 | | | | OPPENHEIMER CORE BOND FUND/VA |
The effect of derivative instruments on the Statement of Operations is as follows:
| | | | | | |
| Amount of Realized Gain or (Loss) Recognized on Derivatives |
Derivatives Not Accounted
for as Hedging Instruments | | Investments from
unaffiliated companies* | | Closing and expiration
of futures contracts | | Total |
| Interest rate contracts | | $(13,437) | | $303,962 | | $290,525 |
*Includes purchased option contracts, purchased swaption contracts and written option contracts exercised, if any.
| | | | |
| Amount of Change in Unrealized Gain or (Loss) Recognized on Derivatives | |
Derivatives Not Accounted for as Hedging Instruments | | Futures contracts | |
| Interest rate contracts | | | $(131,720 | ) |
Futures Contracts
A futures contract is a commitment to buy or sell a specific amount of a financial instrument, or currency, at a negotiated price on a stipulated future date. The Fund may buy and sell futures contracts and may also buy or write put or call options on these futures contracts.
Futures contracts traded on a commodities or futures exchange will be valued at the final settlement price or official closing price on the principal exchange as reported by such principal exchange at its trading session ending at, or most recently prior to, the time when the Fund’s assets are valued.
Upon entering into a futures contract, the Fund is required to deposit either cash or securities (initial margin) in an amount equal to a certain percentage of the contract value. Subsequent payments (variation margin) are made or received by the Fund each day. The variation margin payments are equal to the daily changes in the contract value and are recorded as unrealized gains and losses.
Futures contracts are reported on a schedule following the Statement of Investments. Securities held in collateralized accounts to cover initial margin requirements on open futures contracts are noted in the Statement of Investments. Cash held by the broker to cover initial margin requirements on open futures contracts and the receivable and/or payable for the daily mark to market for the variation margin are noted in the Statement of Assets and Liabilities. The net change in unrealized appreciation and depreciation is reported in the Statement of Operations. Realized gains (losses) are reported in the Statement of Operations at the closing or expiration of futures contracts.
The Fund has purchased futures contracts on various bonds and notes to increase exposure to interest rate risk.
The Fund has sold futures contracts on various bonds and notes to decrease exposure to interest rate risk.
During the year ended December 31, 2012, the Fund had an ending monthly average market value of $11,695,712 and $36,753,528 on futures contracts purchased and sold, respectively.
Additional associated risks of entering into futures contracts (and related options) include the possibility that there may be an illiquid market where the Fund is unable to liquidate the contract or enter into an offsetting position and, if used for hedging purposes, the risk that the price of the contract will correlate imperfectly with the prices of the Fund’s securities.
Option Activity
The Fund may buy and sell put and call options, or write put and call options. When an option is written, the Fund receives a premium and becomes obligated to sell or purchase the underlying security at a fixed price, upon exercise of the option.
Options are valued daily based upon the last sale price on the principal exchange on which the option is traded. The difference between the premium received or paid, and market value of the option, is recorded as unrealized appreciation or depreciation. The net change in unrealized appreciation or depreciation is reported in the Statement of Operations. When an option is exercised, the cost of the security purchased or the proceeds of the security sale
| | | | |
| 36 | | | | OPPENHEIMER CORE BOND FUND/VA |
NOTES TO FINANCIAL STATEMENTS Continued
6. Risk Exposures and the Use of Derivative Instruments Continued
are adjusted by the amount of premium received or paid. Upon the expiration or closing of the option transaction, a gain or loss is reported in the Statement of Operations.
The Fund has purchased call options on treasury and/or euro futures to increase exposure to interest rate risk. A purchased call option becomes more valuable as the price of the underlying financial instrument appreciates relative to the strike price.
During the year ended December 31, 2012, the Fund had an ending monthly average market value of $846 on purchased call options.
As of December 31, 2012, the Fund had no outstanding purchased options.
7. Restricted Securities
As of December 31, 2012, investments in securities included issues that are restricted. A restricted security may have a contractual restriction on its resale and is valued under methods approved by the Board of Trustees as reflecting fair value. Securities that are restricted are marked with an applicable footnote on the Statement of Investments. Restricted securities are reported on a schedule following the Statement of Investments.
8. Subsequent Event
The Board of Trustees of the Fund recently approved a series of modifications to the Fund’s investment advisory and transfer agency arrangements in connection with internal corporate restructuring efforts at OppenheimerFunds, Inc. (“OFI”). As a result of these modifications, on January 1, 2013 (the “Effective Date”), OFI Global Asset Management, Inc. (“OFI Global”), a wholly-owned subsidiary of OFI, became the investment adviser and transfer agent to the Fund under the terms of the Fund’s advisory agreement and transfer agency agreement, respectively. OFI Global, in turn, entered into a new sub-advisory agreement for the Fund, on the Effective Date, whereby OFI Global will have oversight and supervisory responsibilities and OFI will choose the Fund’s investments and provide related advisory services to the Fund. In addition, on the Effective Date, OFI Global entered into a sub-transfer agency agreement with Shareholder Services, Inc. doing business as OppenheimerFunds Services, a wholly-owned subsidiary of OFI, under which it will be responsible for providing transfer agency services to the Fund.
The realignment of advisory service responsibility between OFI Global and OFI did not result in any change in the persons managing the assets of the Fund, the level or nature of the advisory services provided to the Fund, or the fees charged to the Fund.
9. Pending Litigation
Since 2009, a number of class action lawsuits have been pending in federal courts against OppenheimerFunds, Inc., the Fund’s Adviser through December 31, 2012 and Sub-Adivser effective January 1, 2013 (the “Manager”), OppenheimerFunds Distributor, Inc., the Fund’s principal underwriter and distributor (the “Distributor”), and certain funds (but not including the Fund) advised by the Manager and distributed by the Distributor (the “Defendant Funds”). Several of these lawsuits also name as defendants certain officers and current and former trustees of the respective Defendant Funds. The lawsuits raise claims under federal securities law and allege, among other things, that the disclosure documents of the respective Defendant Funds contained misrepresentations and omissions and that the respective Defendant Funds’ investment policies were not followed. The plaintiffs in these actions seek unspecified damages, equitable relief and awards of attorneys’ fees and litigation expenses. The Defendant Funds’ Boards of Trustees have also engaged counsel to represent the Funds and the present and former Independent Trustees named in those suits.
Other class action and individual lawsuits have been filed since 2008 in various state and federal courts against the Manager and certain of its affiliates by investors seeking to recover investments they allegedly lost as a result of the “Ponzi” scheme run by Bernard L. Madoff and his firm, Bernard L. Madoff Investment Securities, LLC (“BLMIS”). Plaintiffs
| | | | |
| 37 | | | | OPPENHEIMER CORE BOND FUND/VA |
in these suits allege that they suffered losses as a result of their investments in several funds managed by an affiliate of the Manager and assert a variety of claims, including breach of fiduciary duty, fraud, negligent misrepresentation, unjust enrichment, and violation of federal and state securities laws and regulations, among others. They seek unspecified damages, equitable relief and awards of attorneys’ fees and litigation expenses. Neither the Distributor, nor any of the Oppenheimer mutual funds, their independent trustees or directors are named as defendants in these lawsuits. None of the Oppenheimer mutual funds invested in any funds or accounts managed by Madoff or BLMIS. On February 28, 2011, a stipulation of partial settlement of three groups of consolidated putative class action lawsuits relating to these matters was filed in the U.S. District Court for the Southern District of New York. On August 19, 2011, the court entered an order and final judgment approving the settlement as fair, reasonable and adequate. In September 2011, certain parties filed notices of appeal from the court’s order approving the settlement. The settlement does not resolve other outstanding lawsuits against the Manager and its affiliates relating to BLMIS.
On April 16, 2010, a lawsuit was filed in New York state court against the Manager, an affiliate of the Manager and AAArdvark IV Funding Limited (“AAArdvark IV”), an entity advised by the Manager’s affiliate, in connection with investments made by the plaintiffs in AAArdvark IV. Plaintiffs allege breach of contract against the defendants and seek compensatory damages, costs and disbursements, including attorney fees. On July 15, 2011, a lawsuit was filed in New York state court against the Manager, an affiliate of the Manager and AAArdvark Funding Limited (“AAArdvark I”), an entity advised by the Manager’s affiliate, in connection with investments made by the plaintiffs in AAArdvark I. The complaint alleges breach of contract against the defendants and seeks compensatory damages, costs and disbursements, including attorney fees. On November 9, 2011, a lawsuit was filed in New York state court against the Manager, an affiliate of the Manager and AAArdvark XS Funding Limited (“AAArdvark XS”), an entity advised by the Manager’s affiliate, in connection with investments made by the plaintiffs in AAArdvark XS. The complaint alleges breach of contract against the defendants and seeks compensatory damages, costs and disbursements, including attorney fees.
The Manager believes the lawsuits and appeals described above are without legal merit and, with the exception of actions it has settled, is defending against them vigorously. While it is premature to render any opinion as to the outcome in these lawsuits, or whether any costs that the Defendant Funds may bear in defending the suits might not be reimbursed by insurance, the Manager believes that these suits should not impair the ability of the Manager or the Distributor to perform their respective duties to the Fund, and that the outcome of all of the suits together should not have any material effect on the operations of any of the Oppenheimer mutual funds.
| | | | |
| 38 | | | | OPPENHEIMER CORE BOND FUND/VA |
REPORT OF INDEPENDENT REGISTERED PUBLIC ACCOUNTING FIRM
The Board of Trustees and Shareholders of Oppenheimer Variable Account Funds:
We have audited the accompanying statement of assets and liabilities of Oppenheimer Core Bond Fund/VA (a separate series of Oppenheimer Variable Account Funds), including the statement of investments, as of December 31, 2012, and the related statement of operations for the year then ended, the statements of changes in net assets for each of the years in the two-year period then ended and the financial highlights for each of the years in the four-year period then ended. These financial statements and financial highlights are the responsibility of the Fund’s management. Our responsibility is to express an opinion on these financial statements and financial highlights based on our audits. The accompanying financial highlights of Oppenheimer Core Bond Fund/VA for the year ended December 31, 2008 were audited by other auditors whose report dated February 11, 2009 expressed an unqualified opinion on those financial highlights.
We conducted our audits in accordance with the standards of the Public Company Accounting Oversight Board (United States). Those standards require that we plan and perform the audit to obtain reasonable assurance about whether the financial statements and financial highlights are free of material misstatement. An audit includes examining, on a test basis, evidence supporting the amounts and disclosures in the financial statements. Our procedures included confirmation of securities owned as of December 31, 2012, by correspondence with the custodian, transfer agent and brokers, or by other appropriate auditing procedures where replies from brokers were not received. An audit also includes assessing the accounting principles used and significant estimates made by management, as well as evaluating the overall financial statement presentation. We believe that our audits provide a reasonable basis for our opinion.
In our opinion, the financial statements and financial highlights referred to above present fairly, in all material respects, the financial position of Oppenheimer Core Bond Fund/VA as of December 31, 2012, the results of its operations for the year then ended, the changes in its net assets for each of the years in the two-year period then ended and the financial highlights for each of the years in the four-year period then ended, in conformity with U.S. generally accepted accounting principles.
KPMGLLP
Denver, Colorado
February 19, 2013
| | | | |
| 39 | | | | OPPENHEIMER CORE BOND FUND/VA |
FEDERAL INCOME TAX INFORMATION Unaudited
In early 2013, if applicable, shareholders of record received information regarding all dividends and distributions paid to them by the Fund during calendar year 2012.
The foregoing information is presented to assist shareholders in reporting distributions received from the Fund to the Internal Revenue Service. Because of the complexity of the federal regulations which may affect your individual tax return and the many variations in state and local tax regulations, we recommend that you consult your tax advisor for specific guidance.
| | | | |
| 40 | | | | OPPENHEIMER CORE BOND FUND/VA |
BOARD APPROVAL OF THE FUND’S INVESTMENT
ADVISORY AGREEMENT Unaudited
Each year, the Board of Trustees (the “Board”), including a majority of the independent Trustees, is required to determine whether to renew the Fund’s investment advisory agreement (the “Agreement”). The Investment Company Act of 1940, as amended, requires that the Board request and evaluate, and that the Manager provide, such information as may be reasonably necessary to evaluate the terms of the Agreement. The Board employs an independent consultant to prepare a report that provides information, including comparative information that the Board requests for that purpose. In addition to in-person meetings focused on this evaluation, the Board receives information throughout the year regarding Fund services, fees, expenses and performance.
The Manager and the independent consultant provided information to the Board on the following factors: (i) the nature, quality and extent of the Manager’s services, (ii) the investment performance of the Fund and the Manager, (iii) the fees and expenses of the Fund, including comparative expense information, (iv) the profitability of the Manager and its affiliates, including an analysis of the cost of providing services, (v) whether economies of scale are realized as the Fund grows and whether fee levels reflect these economies of scale for Fund investors and (vi) other benefits to the Manager from its relationship with the Fund. The Board was aware that there are alternatives to retaining the Manager.
Outlined below is a summary of the principal information considered by the Board as well as the Board’s conclusions.
Nature, Quality and Extent of Services. The Board considered information about the nature, quality and extent of the services provided to the Fund and information regarding the Manager’s key personnel who provide such services. The Manager’s duties include providing the Fund with the services of the portfolio managers and the Manager’s investment team, who provide research, analysis and other advisory services in regard to the Fund’s investments; securities trading services; oversight of third-party service providers; monitoring compliance with applicable Fund policies and procedures and adherence to the Fund’s investment restrictions; and risk management. The Manager is responsible for providing certain administrative services to the Fund as well. Those services include providing and supervising all administrative and clerical personnel who are necessary in order to provide effective corporate administration for the Fund; compiling and maintaining records with respect to the Fund’s operations; preparing and filing reports required by the Securities and Exchange Commission; preparing periodic reports regarding the operations of the Fund for its shareholders; preparing proxy materials for shareholder meetings; and preparing the registration statements required by Federal and state securities laws for the sale of the Fund’s shares. The Manager also provides the Fund with office space, facilities and equipment.
The Board also considered the quality of the services provided and the quality of the Manager’s resources that are available to the Fund. The Board took account of the fact that the Manager has had over fifty years of experience as an investment adviser and that its assets under management rank it among the top mutual fund managers in the United States. The Board evaluated the Manager’s advisory, administrative, accounting, legal, compliance services and risk management, and information the Board has received regarding the experience and professional qualifications of the Manager’s key personnel and the size and functions of its staff. In its evaluation of the quality of the portfolio management services provided, the Board considered the experience of Krishna Memani and Peter Strzalkowski, the portfolio managers for the Fund, and the Manager’s investment team and analysts. The Board members also considered the totality of their experiences with the Manager as directors or trustees of the Fund and other funds advised by the Manager. The Board considered information regarding the quality of services provided by affiliates of the Manager, which its members have become knowledgeable about in connection with the renewal of the Fund’s service agreements. The Board concluded, in light of the Manager’s experience, reputation, personnel, operations and resources that the Fund benefits from the services provided under the Agreement.
Investment Performance of the Manager and the Fund. Throughout the year, the Manager provided information on the investment performance of the Fund, including comparative performance information. The Board also reviewed information, prepared by the Manager and by the independent consultant, comparing the Fund’s historical performance to relevant market indices and to the performance of other intermediate investment-grade debt funds underlying variable insurance products. The Board considered that the Fund outperformed its performance universe median during
| | | | |
| 41 | | | | OPPENHEIMER CORE BOND FUND/VA |
the one-year and three-year periods, although it underperformed its performance universe median during the five- and ten-year periods. The Board also considered the appointment of a new portfolio manager on April 1, 2009, and it considered the Manager’s assertion that the Investment Grade Fixed Income Team has been repositioning the portfolio gradually to better take advantage of changing market conditions. The Board considered the Fund’s recent improved performance in light of those changes, ranking in the first quintile for the one-year period.
Costs of Services by the Manager. The Board reviewed the fees paid to the Manager and the other expenses borne by the Fund. The Board also considered the comparability of the fees charged and the services provided to the Fund to the fees and services for other clients or accounts advised by the Manager. The independent consultant provided comparative data in regard to the fees and expenses of the Fund and other intermediate investment-grade debt funds underlying variable insurance products. In reviewing the fees and expenses charged to the VA funds, the Board considered the Manager’s assertion that, because there is much greater disparity in the fees and services that may be provided by a manager to a VA fund as opposed to a retail fund, when comparing the expenses of the various VA funds to those of retail funds, it is most appropriate to focus on total expenses (rather than on the management fees). Accordingly, while the Board reviewed and considered all expenses, it focused on total expenses. The Board considered that the Fund’s total expenses were above its expense group median and average, and that its actual management fees were lower than its expense group median but higher than its expense group average. The Board considered that the Manager has voluntarily agreed to waive fees and/or reimburse the Fund for certain expenses in order to limit “Total Annual Fund Operating Expenses After Fee Waivers and/or Expense Reimbursement” (excluding (i) interest, taxes, dividends tied to short sales, brokerage commissions, and other expenditures which are capitalized in accordance with generally accepted accounting principles; (ii) expenses incurred directly or indirectly by the Fund as a result of investments in other investment companies, wholly-owned subsidiaries and pooled investment vehicles; (iii) certain other expenses attributable to, and incurred as a result of, a Fund’s investments; and (iv) other extraordinary expenses (including litigation expenses) not incurred in the ordinary course of the Fund’s business) to annual rates of 0.75% for Non-Service shares and 1.00% for Service shares as calculated on the daily net assets of the Fund. This waiver and/or reimbursement may be amended or withdrawn at any time without prior notice to shareholders.
Economies of Scale and Profits Realized by the Manager. The Board considered information regarding the Manager’s costs in serving as the Fund’s investment adviser, including the costs associated with the personnel and systems necessary to manage the Fund, and information regarding the Manager’s profitability from its relationship with the Fund. The Board reviewed whether the Manager may realize economies of scale in managing and supporting the Fund. The Board noted that the Fund currently has management fee breakpoints, which are intended to share with Fund shareholders economies of scale that may exist as the Fund’s assets grow.
Other Benefits to the Manager. In addition to considering the profits realized by the Manager, the Board considered information that was provided regarding the direct and indirect benefits the Manager receives as a result of its relationship with the Fund, including compensation paid to the Manager’s affiliates. The Board also considered that the Manager must be able to pay and retain experienced professional personnel at competitive rates to provide quality services to the Fund.
Conclusions. These factors were also considered by the independent Trustees meeting separately from the full Board, assisted by experienced counsel to the Fund and to the independent Trustees. Fund counsel and the independent Trustees’ counsel are independent of the Manager within the meaning and intent of the Securities and Exchange Commission Rules.
Based on its review of the information it received and its evaluations described above, the Board, including a majority of the independent Trustees, decided to continue the Agreement. In addition, the Board, including a majority of the Independent Trustees, approved the restructuring of the Fund’s investment advisory arrangement so that effective January 1, 2013, (i) OFI Global Asset Management, Inc. (“OFI Global”), a wholly owned subsidiary of the Manager, will serve as the investment adviser to the Fund in place of the Manager under a Restated Advisory Agreement (“Restated
| | | | |
| 42 | | | | OPPENHEIMER CORE BOND FUND/VA |
BOARD APPROVAL OF THE FUND’S INVESTMENT
ADVISORY AGREEMENT Unaudited / Continued
Advisory Agreement”), and (ii) OFI Global will enter into a Sub-Advisory Agreement (“Sub-Advisory Agreement”) with the Manager to provide investment sub-advisory services to the Fund. OFI Global will pay the Manager a percentage of the net investment advisory fee (after all applicable waivers have been deducted) that it receives from the Fund. The Agreement will continue until earlier of August 31, 2013 or the effective date of the Restated Advisory Agreement between the Fund and OFI Global. The Restated Advisory Agreement and Sub-Advisory Agreement will continue until August 31, 2013.
In arriving at its decisions, the Board did not single out any factor or factors as being more important than others, but considered all of the above information, and considered the terms and conditions of the Agreement, Restated Advisory Agreement and Sub-Advisory Agreement, including the management fees, in light of all the surrounding circumstances.
| | | | |
| 43 | | | | OPPENHEIMER CORE BOND FUND/VA |
PORTFOLIO PROXY VOTING POLICIES AND PROCEDURES;
UPDATES TO STATEMENTS OF INVESTMENTS Unaudited
The Fund has adopted Portfolio Proxy Voting Policies and Procedures under which the Fund votes proxies (“portfolio proxies”) relating to securities held by the Fund. A description of the Fund’s Portfolio Proxy Voting Policies and Procedures is available (i) without charge, upon request, by calling the Fund toll-free at 1.800.525.7048, (ii) on the Fund’s website at oppenheimerfunds.com, and (iii) on the SEC’s website at www.sec.gov. In addition, the Fund is required to file Form N-PX, with its complete proxy voting record for the 12 months ended June 30th, no later than August 31st of each year. The Fund’s voting record is available (i) without charge, upon request, by calling the Fund toll-free at 1.800.525.7048, and (ii) in the Fund’s Form N-PX filing on the SEC’s website at www.sec.gov.
The Fund files its complete schedule of portfolio holdings with the SEC for the first quarter and the third quarter of each fiscal year on Form N-Q. The Fund’s Form N-Q filings are available on the SEC’s website at www.sec.gov. Those forms may be reviewed and copied at the SEC’s Public Reference Room in Washington, D.C. Information on the operation of the Public Reference Room may be obtained by calling 1-800-SEC-0330.
| | | | |
| 44 | | | | OPPENHEIMER CORE BOND FUND/VA |
TRUSTEES AND OFFICERS Unaudited
| | |
| Name, Position(s) Held with the Fund, Length of Service, Age | | Principal Occupation(s) During the Past 5 Years; Other Trusteeships/Directorships Held; Number of Portfolios in the Fund Complex Currently Overseen |
| |
| INDEPENDENT TRUSTEES | | The address of each Trustee in the chart below is 6803 S. Tucson Way, Centennial, Colorado 80112-3924. Each Trustee serves for an indefinite term, or until his or her resignation, retirement, death or removal. |
| |
Sam Freedman,
Chairman of the Board of Trustees (since 2012) and Trustee (since 1996)
Age: 72 | | Director of Colorado UpLIFT (charitable organization) (since September 1984). Mr. Freedman held several positions with the Sub-Adviser and with subsidiary or affiliated companies of the Sub-Adviser (until October 1994). Oversees 36 portfolios in the OppenheimerFunds complex. Mr. Freedman has served on the Boards of certain Oppenheimer funds since 1996, during which time he has become familiar with the Fund’s (and other Oppenheimer funds’) financial, accounting, regulatory and investment matters and has contributed to the Boards’ deliberations. |
| |
Edward L. Cameron,
Trustee (since 1999)
Age: 74 | | Member of The Life Guard of Mount Vernon (George Washington historical site) (June 2000-June 2006); Partner of PricewaterhouseCoopers LLP (accounting firm) (July 1974-June 1999); Chairman of Price Waterhouse LLP Global Investment Management Industry Services Group (accounting firm) (July 1994-June 1998). Oversees 36 portfolios in the OppenheimerFunds complex. Mr. Cameron has served on the Boards of certain Oppenheimer funds since 1999, during which time he has become familiar with the Fund’s (and other Oppenheimer funds’) financial, accounting, regulatory and investment matters and has contributed to the Boards’ deliberations. |
| |
Jon S. Fossel,
Trustee (since 1990)
Age: 70 | | Chairman of the Board (2006-December 2011) and Director (June 2002-December 2011) of UNUMProvident (insurance company); Director of Northwestern Energy Corp. (public utility corporation) (November 2004-December 2009); Director of P.R. Pharmaceuticals (October 1999-October 2003); Director of Rocky Mountain Elk Foundation (non-profit organization) (February 1998-February 2003 and February 2005-February 2007); Chairman and Director (until October 1996) and President and Chief Executive Officer (until October 1995) of the Sub-Adviser; President, Chief Executive Officer and Director of the following: Oppenheimer Acquisition Corp. (“OAC”) (parent holding company of the Sub-Adviser), Shareholders Services, Inc. and Shareholder Financial Services, Inc. (until October 1995). Oversees 36 portfolios in the OppenheimerFunds complex. Mr. Fossel has served on the Boards of certain Oppenheimer funds since 1990, during which time he has become familiar with the Fund’s (and other Oppenheimer funds’) financial, accounting, regulatory and investment matters and has contributed to the Boards’ deliberations. |
| |
Richard Grabish,
Trustee (since 2012)
Age: 64 | | Formerly Senior Vice President and Assistant Director of Sales and Marketing (March 1997-December 2007), Director (March 1987-December 2007) and Manager of Private Client Services (June 1985-June 2005) of A.G. Edwards & Sons, Inc. (broker/dealer and investment firm); Chairman and Chief Executive Officer of A.G. Edwards Trust Company, FSB (March 2001-December 2007); President and Vice Chairman of A.G. Edwards Trust Company, FSB (investment adviser) (April 1987-March 2001); President of A.G. Edwards Trust Company, FSB (investment adviser) (June 2005-December 2007). Oversees 36 portfolios in the OppenheimerFunds complex. Mr. Grabish has served on the Boards of certain Oppenheimer funds since 2001, during which time he has become familiar with the Fund’s (and other Oppenheimer funds’) financial, accounting, regulatory and investment matters and has contributed to the Boards’ deliberations. |
| |
Beverly L. Hamilton,
Trustee (since 2002)
Age: 66 | | Trustee of Monterey Institute for International Studies (educational organization) (since February 2000); Board Member of Middlebury College (educational organization) (December 2005-June 2011); Chairman (since 2010) of American Funds’ Emerging Markets Growth Fund, Inc. (mutual fund); Director of The California Endowment (philanthropic organization) (April 2002-April 2008); Director (February 2002-2005) and Chairman of Trustees (2006-2007) of the Community Hospital of Monterey Peninsula; Director (October 1991-2005); Vice Chairman (2006-2009) of American Funds’ Emerging Markets Growth Fund, Inc. (mutual fund); President of ARCO Investment Management Company (February 1991-April 2000); Member of the investment committees of The Rockefeller Foundation (2001-2006) and The University of Michigan (since 2000); Advisor at Credit Suisse First Boston’s Sprout venture capital unit (venture capital fund) (1994-January 2005); Trustee of MassMutual Institutional Funds (investment company) (1996-June 2004); Trustee of MML Series Investment Fund (investment company) (April 1989-June 2004); Member of the investment committee of Hartford Hospital (2000-2003); and Advisor to Unilever (Holland) pension fund (2000-2003). Oversees 36 portfolios in the OppenheimerFunds complex. Ms. Hamilton has served on the Boards of certain Oppenheimer funds since 2002, during which time she has become familiar with the Fund’s (and other Oppenheimer funds’) financial, accounting, regulatory and investment matters and has contributed to the Boards’ deliberations. |
| | | | |
| 45 | | | | OPPENHEIMER CORE BOND FUND/VA |
| | |
Victoria J. Herget,
Trustee (since 2012)
Age: 61 | | Independent Director of the First American Funds (mutual fund family) (2003-2011); former Managing Director (1993-2001), Principal (1985-1993), Vice President (1978-1985) and Assistant Vice President (1973-1978) of Zurich Scudder Investments (and its predecessor firms); Board Chair (2008-Present) and Director (2004-Present), United Educators (insurance company); Trustee (1992-2007), Chair of the Board of Trustees (1999-2007), Investment Committee Chair (1994-1999) and Investment Committee member (2007-2010) of Wellesley College; Trustee (since 2000) and Chair (since 2010), Newberry Library; Trustee, Mather LifeWays (since 2001); Trustee, BoardSource (2006-2009) and Chicago City Day School (1994-2005). Oversees 36 portfolios in the OppenheimerFunds complex. Ms. Herget has served on the Boards of certain Oppenheimer funds since 2012, during which time she has become familiar with the Fund’s (and other Oppenheimer funds’) financial, accounting, regulatory and investment matters and has contributed to the Boards’ deliberations. |
| |
Robert J. Malone,
Trustee (since 2002)
Age: 68 | | Board of Directors of Opera Colorado Foundation (non-profit organization) (since March 2008); Director of Jones Knowledge, Inc. (2006-2010); Director of Jones International University (educational organization) (since August 2005); Chairman, Chief Executive Officer and Director of Steele Street Bank & Trust (commercial banking) (since August 2003); Director of Colorado UpLIFT (charitable organization) (1986-2010); Trustee of the Gallagher Family Foundation (non-profit organization) (since 2000); Former Chairman of U.S. Bank-Colorado (subsidiary of U.S. Bancorp and formerly Colorado National Bank) (July 1996-April 1999); Director of Commercial Assets, Inc. (real estate investment trust) (1993-2000); Director of Jones Knowledge, Inc. (2001-July 2004); Director of U.S. Exploration, Inc. (oil and gas exploration) (1997-February 2004); Chairman of the Board (1991-1994) and Trustee (1985-1994) of Regis University; and Chairman of the Board (1990-1991) and Trustee (1984-1999) of Young Presidents Organization. Oversees 36 portfolios in the OppenheimerFunds complex. Mr. Malone has served on the Boards of certain Oppenheimer funds since 2002, during which time he has become familiar with the Fund’s (and other Oppenheimer funds’) financial, accounting, regulatory and investment matters and has contributed to the Boards’ deliberations. |
| |
F. William Marshall, Jr.,
Trustee (since 2000)
Age: 69 | | Trustee Emeritus of Worcester Polytech Institute (WPI) (private university) (since 2009); Trustee of MassMutual Select Funds (formerly MassMutual Institutional Funds) (investment company) (since 1996) and MML Series Investment Fund (investment company) (since 1996) and Mass Mutual Premier Funds (investment company) (since January 2012); President and Treasurer of the SIS Funds (private charitable fund) (January 1999-March 2011); Former Trustee of WPI (1985-2008); Former Chairman of the Board (2004-2006) and Former Chairman of the Investment Committee of WPI (1994-2008); Chairman of SIS & Family Bank, F.S.B. (formerly SIS Bank) (commercial bank) (January 1999-July 1999); Executive Vice President of Peoples Heritage Financial Group, Inc. (commercial bank) (January 1999-July 1999); and Former President and Chief Executive Officer of SIS Bancorp. (1993-1999). Oversees 40 portfolios in the OppenheimerFunds complex. Mr. Marshall has served on the Boards of certain Oppenheimer funds since 2000, during which time he has become familiar with the Fund’s (and other Oppenheimer funds’) financial, accounting, regulatory and investment matters and has contributed to the Boards’ deliberations. |
| |
Karen L. Stuckey,
Trustee (since 2012)
Age: 59 | | Partner (1990-2012) of PricewaterhouseCoopers LLP (held various positions 1975-1990); Trustee (1992-2006) and member of Executive, Nominating and Audit Committees and Chair of Finance Committee of Lehigh University; and member, Women’s Investment Management Forum since inception. Oversees 36 portfolios in the OppenheimerFunds complex. Ms. Stuckey has served on the Boards of certain Oppenheimer funds since 2012, during which time she has become familiar with the Fund’s (and other Oppenheimer funds’) financial, accounting, regulatory and investment matters and has contributed to the Boards’ deliberations. |
| |
James D. Vaughn,
Trustee (since 2012)
Age: 67 | | Retired; former managing partner (1994-2001) of Denver office of Deloitte & Touche LLP, (held various positions 1969-1993); Trustee and Chairman of the Audit Committee of Schroder Funds (2003-2012); Board member and Chairman of Audit Committee of AMG National Trust Bank (since 2005); Trustee, Audit Committee member and Investment Committee member, University of South Dakota Foundation (since 1996); Board member, Executive Committee Member, Audit Committee Member and past Board Chair, Junior Achievement (since 1993); former Board member, Mile High United Way, Boys and Girls Clubs, Boy Scouts, Colorado Business Committee for the Arts, Economic Club of Colorado and Metro Denver Network. Oversees 36 portfolios in the OppenheimerFunds complex. Mr. Vaughn has served on the Boards of certain Oppenheimer funds since 2012, during which time he has become familiar with the Fund’s (and other Oppenheimer funds’) financial, accounting, regulatory and investment matters and has contributed to the Boards’ deliberations. |
| | | | |
| 46 | | | | OPPENHEIMER CORE BOND FUND/VA |
TRUSTEES AND OFFICERS Unaudited / Continued
| | |
| INTERESTED TRUSTEE AND OFFICER | | The address of Mr. Glavin is Two World Financial Center, 225 Liberty Street, 11th Floor, New York, New York 10281-1008. Mr. Glavin serves as a Trustee for an indefinite term, or until his resignation, retirement, death or removal and as an Officer for an indefinite term, or until his resignation, retirement, death or removal. Mr. Glavin is an Interested Trustee due to his positions with OppenheimerFunds, Inc. and its affiliates. |
| |
William F. Glavin, Jr.,
Trustee, President and Principal Executive Officer (since 2009)
Age: 54 | | Chief Executive Officer of OppenheimerFunds (since January 2013); Director, Chief Executive Officer and President of the Manager (since January 2013); Chairman of the Sub-Adviser (December 2009-December 2012); Chief Executive Officer (January 2009-December 2012) and Director of the Sub-Adviser (since January 2009); President of the Sub-Adviser (May 2009-December 2012); Management Director (since June 2009), President (since December 2009) and Chief Executive Officer (since January 2011) of Oppenheimer Acquisition Corp. (“OAC”) (the Sub-Adviser’s parent holding company); Director of Oppenheimer Real Asset Management, Inc. (since March 2010); Executive Vice President (March 2006-February 2009) and Chief Operating Officer (July 2007-February 2009) of Massachusetts Mutual Life Insurance Company (OAC’s parent company); Director (May 2004-March 2006) and Chief Operating Officer and Chief Compliance Officer (May 2004-January 2005), President (January 2005-March 2006) and Chief Executive Officer (June 2005-March 2006) of Babson Capital Management LLC; Director (March 2005-March 2006), President (May 2003-March 2006) and Chief Compliance Officer (July 2005-March 2006) of Babson Capital Securities, Inc. (a broker-dealer); President (May 2003-March 2006) of Babson Investment Company, Inc.; Director (May 2004-August 2006) of Babson Capital Europe Limited; Director (May 2004-October 2006) of Babson Capital Guernsey Limited; Director (May 2004-March 2006) of Babson Capital Management LLC; Non-Executive Director (March 2005-March 2007) of Baring Asset Management Limited; Director (February 2005-June 2006) Baring Pension Trustees Limited; Director and Treasurer (December 2003-November 2006) of Charter Oak Capital Management, Inc.; Director (May 2006-September 2006) of C.M. Benefit Insurance Company; Director (May 2008-June 2009) and Executive Vice President (June 2007-July 2009) of C.M. Life Insurance Company; President (March 2006-May 2007) of MassMutual Assignment Company; Director (January 2005-December 2006), Deputy Chairman (March 2005-December 2006) and President (February 2005-March 2005) of MassMutual Holdings (Bermuda) Limited; Director (May 2008-June 2009) and Executive Vice President (June 2007-July 2009) of MML Bay State Life Insurance Company; Chief Executive Officer and President (April 2007-January 2009) of MML Distributors, LLC; and Chairman (March 2006-December 2008) and Chief Executive Officer (May 2007-December 2008) of MML Investors Services, Inc. An officer of 86 portfolios in the OppenheimerFunds complex. |
| OTHER OFFICERS OF THE FUND | | The addresses of the Officers in the chart below are as follows: for Messrs. Memani, Strzalkowski, Gabinet and Ms. Nasta, Two World Financial Center, 225 Liberty Street, New York, New York 10281-1008, for Messrs. Vandehey and Wixted. Each Officer serves for an indefinite term or until his or her resignation, retirement, death or removal. |
| |
Krishna Memani,
Vice President
(since 2009)
Age: 52 | | President of the Sub-Adviser (since January 2013); Chief Investment Officer, Fixed Income of the Sub-Adviser (since January 2013) and Head of the Investment Grade Fixed Income Team of the Sub-Adviser (since March 2009). Director of Fixed Income of the Sub-Adviser (October 2010-December 2012) and Senior Vice President (March 2009-December 2012). Mr. Memani was a Managing Director and Head of the U.S. and European Credit Analyst Team at Deutsche Bank Securities (June 2006-January 2009). He was the Chief Credit Strategist at Credit Suisse Securities (August 2002-March 2006). He was a Managing Director and Senior Portfolio Manager at Putnam Investments (September 1998-June 2002). A portfolio manager and an officer of 14 portfolios in the OppenheimerFunds complex. |
| |
Peter A. Strzalkowski,
Vice President
(since 2009)
Age: 47 | | Vice President of the Sub-Adviser (since August 2007), CFA and a member of the Sub-Adviser’s Investment Grade Fixed Income Team (since April 2009). Prior to joining the Sub-Adviser, Managing Partner and Chief Investment Officer of Vector Capital Management, LLC, a structured products money management firm he founded, (July 2006-August 2007); a Senior Portfolio Manager at Highland Capital Management, L.P. (June 2005-July 2006) and a Senior Fixed Income Portfolio Manager at Microsoft Corp. (June 2003-June 2005); a Vice President and Senior Fixed Income Portfolio Manager at First Citizens Bank Trust, Capital Management Group (April 2000-June 2003); a Vice President and Fixed Income Portfolio Manager at Centura Banks (November 1998-April 2000). A portfolio manager and officer of 6 portfolios in the OppenheimerFunds complex. |
| | | | |
| 47 | | | | OPPENHEIMER CORE BOND FUND/VA |
| | |
Arthur S. Gabinet,
Secretary and Chief Legal Officer
(since 2011)
Age: 54 | | General Counsel of OppenheimerFunds (since January 2013); Executive Vice President, Secretary and General Counsel of the Manager (since January 2013); General Counsel OFI SteelPath, Inc. (since January 2013); Executive Vice President (May 2010-December 2012) and General Counsel (since January 2011) of the Sub-Adviser; General Counsel of the Distributor (since January 2011); General Counsel of Centennial Asset Management Corporation (January 2011-December 2012); Executive Vice President (January 2011-December 2012) and General Counsel of HarbourView Asset Management Corporation (since January 2011); Assistant Secretary (since January 2011) and Director (since January 2011) of OppenheimerFunds International Ltd. and OppenheimerFunds plc; Director of Oppenheimer Real Asset Management, Inc. (January 2011-December 2012) and General Counsel (since January 2011); Executive Vice President (January 2011-December 2011) and General Counsel of Shareholder Financial Services, Inc. and Shareholder Services, Inc. (since January 2011); Executive Vice President (January 2011-December 2012) and General Counsel of OFI Private Investments Inc. (since January 2011); Vice President of OppenheimerFunds Legacy Program (January 2011-December 2011); Executive Vice President (January 2011-December 2012) and General Counsel of OFI Institutional Asset Management, Inc. (since January 2011); General Counsel, Asset Management of the Sub-Adviser (May 2010-December 2010); Principal, The Vanguard Group (November 2005-April 2010); District Administrator, U.S. Securities and Exchange Commission (January 2003-October 2005). An officer of 86 portfolios in the OppenheimerFunds complex. |
| |
Christina M. Nasta,
Vice President and Chief Business Officer
(since 2011)
Age: 39 | | Senior Vice President of OppenheimerFunds Distributor, Inc. (since January 2013); Senior Vice President of the Sub-Adviser (July 2010-December 2012); Vice President of the Sub-Adviser (January 2003-July 2010); Vice President of OppenheimerFunds Distributor, Inc. (January 2003-July 2010). An officer of 86 portfolios in the OppenheimerFunds complex. |
| |
Mark S. Vandehey,
Vice President and Chief Compliance Officer
(since 2004)
Age: 62 | | Chief Compliance Officer of OppenheimerFunds (since January 2013); Senior Vice President and Chief Compliance Officer of the Manager (since January 2013); Chief Compliance Officer of OFI SteelPath, Inc. (since January 2013); Senior Vice President of the Sub-Adviser (March 2004-December 2012); Chief Compliance Officer of the Sub-Adviser, OppenheimerFunds Distributor, Inc., OFI Trust Company, OFI Institutional Asset Management, Inc., Oppenheimer Real Asset Management, Inc., OFI Private Investments, Inc., Harborview Asset Management Corporation, Trinity Investment Management Corporation, and Shareholder Services, Inc. (since March 2004); Vice President of OppenheimerFunds Distributor, Inc., Centennial Asset Management Corporation and Shareholder Services, Inc. (June 1983-December 2012). An officer of 86 portfolios in the OppenheimerFunds complex. |
| |
Brian W. Wixted,
Treasurer and Principal Financial & Accounting Officer
(since 1999)
Age: 53 | | Senior Vice President of the Manager (since January 2013); Treasurer of the Sub-Adviser, HarbourView Asset Management Corporation, Shareholder Financial Services, Inc., Shareholder Services, Inc., and Oppenheimer Real Asset Management, Inc. (March 1999-June 2008), OFI Private Investments, Inc. (March 2000-June 2008), OppenheimerFunds International Ltd. and OppenheimerFunds plc (since May 2000), OFI Institutional Asset Management, Inc. (November 2000-June 2008), and OppenheimerFunds Legacy Program (charitable trust program established by the Sub-Adviser) (June 2003-December 2011); Treasurer and Chief Financial Officer of OFI Trust Company (since May 2000); Assistant Treasurer of Oppenheimer Acquisition Corporation (March 1999-June 2008). An officer of 86 portfolios in the OppenheimerFunds complex. |
The Fund’s Statement of Additional Information contains additional information about the Fund’s Trustees and Officers and is available without charge, upon request, by calling 1.800.988.8287.
| | | | |
| 48 | | | | OPPENHEIMER CORE BOND FUND/VA |
OPPENHEIMER CORE BOND FUND/VA
| | |
| A Series of Oppenheimer Variable Account Funds |
| Manager | | OFI Global Asset Management, Inc. |
| Sub-Adviser | | OppenheimerFunds, Inc. |
| Distributor | | OppenheimerFunds Distributor, Inc. |
| Transfer and Shareholder Servicing Agent | | OFI Global Asset Management, Inc. |
| Sub-Transfer Agent | | Shareholder Services, Inc. DBA OppenheimerFunds Services |
| Independent Registered Public Accounting Firm | | KPMGLLP |
| Counsel | | K&L Gates LLP |
Before investing, investors should carefully consider a fund’s investment objectives, risks, charges and expenses. Fund prospectuses and summary prospectuses contain this and other information about the funds, and may be obtained by asking your financial advisor, or calling us at 1.800.988.8287. Read prospectuses and summary prospectuses carefully before investing.
| | |
| ©2013 OppenheimerFunds, Inc. All rights reserved. | |  |
December 31, 2012
| | | | |
| | | Oppenheimer Global Securities Fund/VA A Series of Oppenheimer Variable Account Funds | | Annual Report |

ANNUAL REPORT
Listing of Top Holdings
Fund Performance Discussion
Financial Statements
OPPENHEIMER GLOBAL SECURITIES FUND/VA
Portfolio Manager: Rajeev Bhaman, CFA
| | | | | | |
Average Annual Total Returns For the Periods Ended 12/31/12 | | |
| | | |
| | | 1-Year | | 5-Year | | 10-Year |
| Non-Service Shares | | 21.27% | | 1.52% | | 10.15% |
| Service Shares | | 20.95 | | 1.26 | | 9.89 |
| | | |
| | | 1-Year | | 5-Year | | Since
Inception
(5/1/03) |
| Class 3 Shares | | 21.23% | | 1.50% | | 10.55% |
| | | |
| | | 1-Year | | 5-Year | | Since
Inception
(5/3/04) |
| Class 4 Shares | | 20.95% | | 1.26% | | 6.74% |
The performance data quoted represents past performance, which does not guarantee future results. The investment return and principal value of an investment in the Fund will fluctuate so that an investor’s shares, when redeemed, may be worth more or less than their original cost. Current performance may be lower or higher than the performance quoted. For performance data current to the most recent month end, call us at 1.800.988.8287. The Fund’s total returns should not be expected to be the same as the returns of other funds, whether or not both funds have the same portfolio managers and/or similar names. The Fund’s total returns include changes in share price and reinvested distributions but do not include the charges associated with the separate account products that offer this Fund. Such performance would have been lower if such charges were taken into account.
| | | | |
| Top Ten Common Stock Holdings | | | |
| Telefonaktiebolaget LM Ericsson, Cl. B | | | 3.2 | % |
| eBay, Inc. | | | 2.9 | |
| SAP AG | | | 2.5 | |
| Siemens AG | | | 2.2 | |
| UBS AG | | | 2.2 | |
| LVMH Moet Hennessy Louis Vuitton SA | | | 2.0 | |
| Google, Inc., Cl. A | | | 2.0 | |
| European Aeronautic Defence & Space Co. NV | | | 2.0 | |
| Industria de Diseno Textil SA (Inditex) | | | 1.9 | |
| Colgate-Palmolive Co. | | | 1.9 | |
Portfolio holdings and allocations are subject to change. Percentages are as of December 31, 2012, and are based on net assets.
Regional Allocation
Portfolio holdings and allocations are subject to change. Percentages are as of December 31, 2012, and are based on the total market value of investments.
| | | | |
| 2 | | | | OPPENHEIMER GLOBAL SECURITIES FUND/VA |
FUND PERFORMANCE DISCUSSION
The Fund’s Non-Service shares returned 21.27% over the one-year period ended December 31, 2012, outperforming its benchmark, the MSCI World Index (the “Index”), which returned 15.83%. The Fund’s performance was led by contributions from its holdings in its two largest sector weights—information technology and consumer discretionary.
Global Market and Economic Environment
The reporting period was characterized by volatility in the markets, with global equities generally producing gains despite sustained macroeconomic concerns. The early part of the year was one of improved market sentiment in which the United States managed to avoid a return to recession and European policymakers appeared to take steps to address the region’s sovereign debt and banking sector crises especially with the implementation of the dual Long-Term Refinancing Operations by the European Central Bank (the “ECB”), which provided sorely needed liquidity.
The second quarter, on the other hand, saw a reversal of sentiment. Fears of policy paralysis and a perceived lack of consensus for action on the part of governments, combined with further evidence of a shrinking Europe with rampant unemployment, led to borrowing costs rising meaningfully for peripheral Europe. Consequent worries about the sustainability of the euro-arrangement led to broad market declines. Slower than expected U.S. and Chinese Gross Domestic Product (“GDP”) growth and seemingly intractably high unemployment rates hurt consumer confidence and contributed to these declines.
The period ended on a positive note for the markets as increased stimulus measures taken by the ECB and the U.S. Federal Reserve (the “Fed”) helped boost global equity markets during the third quarter. The ECB committed to potentially unlimited bond purchases to ease financing pressure on countries like Spain and Italy. Under the plan, these and other members of the European Union (excluding Greece) will be able to maintain access to funding at sustainable interest rates, on the condition that they continue with strict reform programs. In the U.S., the Fed introduced a third round of quantitative easing (“QE3”), under which it announced plans to purchase mortgage-backed bonds on a monthly basis until the labor market shows signs of substantial improvement. While these actions and a last minute temporary resolution of the so-called fiscal cliff enacted by the U.S. Congress largely prevented the markets from trading in negative territory in the final quarter, a number of concerns throughout the globe remained and presented the possibility for future market volatility.
Top Individual Contributors
eBay, Inc. made the most meaningful contribution to the Fund’s performance. eBay is a leading global e-commerce company with a significant payments business in PayPal. Improvements in the navigability and functionality of the company’s site led to better completion rates on transactions and hence higher sales. The take-up of PayPal in both on-line and off-line environments continued strongly, helping drive both revenues and profits above expectations. We believe that eBay’s success may continue as the value proposition of all its offerings, both in the shopping and payments arenas, continues to find increased traction among buyers and sellers alike.
Industria de Diseno Textil SA (“Inditex”), SAP AG, Amylin Pharmaceuticals, Inc. and Assa Abloy AB also had a strong positive impact on performance. Inditex is a global fast fashion designer, manufacturer and retailer of clothing headquartered in Spain, whose best known brand is Zara. Despite the gloomy economic environment plaguing Spain and Europe generally, Inditex continued to grow profitably worldwide, becoming a reference for consumers everywhere. We believe the company’s product strategy, centralized design and distribution, and prime store locations give it an advantage that is hard to replicate, thus allowing it to continue to grow steadily for the foreseeable future.
Germany-based SAP is the business software that many significant businesses in the world use to run their enterprises. Whether it is Enterprise Resource Planning or Business Intelligence or Analytics or Governance, SAP is ubiquitous. We believe the company can continue to grow its lead over the competition through new drivers, such as its launch of HANA (High-Performance Analytical Appliance), a product which enables businesses to process and analyze data faster and more cost effectively in-memory, and its acquisitions of SuccessFactors and Ariba, both cloud-based business models. Our position in Amylin Pharmaceuticals was acquired by Bristol Myers Squibb and AstraZeneca at a substantial premium.
Assa Abloy, a Swedish lock manufacturer, continued to consolidate local lock manufacturing throughout the world and grow earnings in a low growth environment. In addition to steady demand for its mechanical locks and security products, we believe Assa Abloy should benefit from the shift to electromechanically driven locksets, which may increase the cadence of sales growth as those types of locks need more frequent replacement.
Top Individual Detractors
The most significant detractors from performance this period were Iluka Resources Ltd., Credit Suisse Group AG and Facebook, Inc. Iluka Resources is an Australian low-cost producer of zircon and titanium dioxide (TiO2). The roiling of the commodities markets on the back of China’s slowdown in growth hit Iluka doubly hard as China is its most significant market. Iluka’s products are used primarily in paint and glazed tiles. Improving home quality demands, particularly in emerging markets, is the driver of our investment thesis for Iluka. As a top three producer of both high quality TiO2 and zircon, we believe the opportunity for meaningful growth in the future from people’s increased use of glazed tiles and better paint in floors and walls in warmer climate countries remains despite the current slowdown in housing development in India and China.
Difficult financial market circumstances with low risk taking and low volumes hurt revenues at both the investment bank and the private bank of Credit Suisse. More stringent capital demands from the Swiss regulator added to its woes. Facebook is the world’s largest social networking site, with one billion users. Its stock was negatively impacted by concerns that the company’s revenues will be hurt by users’ shift to mobile devices, where the assumption is that ad revenue per user will be lower than it is for desktop users. We believe that the market has underestimated Facebook’s ability to monetize the transition to mobile and that the company is putting the right resources in place to capture this large opportunity.
| | | | |
| 3 | | | | OPPENHEIMER GLOBAL SECURITIES FUND/VA |
FUND PERFORMANCE DISCUSSION
Strategy & Outlook
The Fund seeks to invest in high quality, global market leaders that have the potential to grow faster than the general global economy over the long term. We focus on companies within industries that are being driven by secular growth trends and that have the financial strength to fund their own growth, producing positive returns on invested capital and demonstrating good cash flow generation characteristics. We are also disciplined about the price we pay for these securities, as this is a crucial component to outperforming the broad global equity market over a three- to five-year investment horizon. We prefer to purchase securities when others believe the companies are structurally disadvantaged.
While we are cognizant of shorter-term gyrations in the market due to macroeconomic headwinds, we remain focused on our long-term investment strategy, which does not attempt to optimize the portfolio for a particular market environment.
We believe that lingering concerns about the global macroeconomic environment will result in continued market volatility, and remain focused on our investment strategy. We focus on purchasing high quality growth companies at attractive prices and that have what we consider significant growth opportunities over a five-year investment horizon. Currently, that has led us to heavy concentrations in information technology and consumer discretionary stocks.
Investors should consider the Fund’s investment objective, risks, charges and expenses carefully before investing. The Fund’s prospectus and summary prospectus contain this and other information about the Fund, and may be obtained by asking your financial advisor or calling us at 1.800.988.8287. Read prospectuses and summary prospectuses carefully before investing.
Total returns include changes in share price and reinvestment of dividends and capital gains distributions in a hypothetical investment for the periods shown.
The Fund’s investment strategy and focus can change over time. The mention of specific fund holdings does not constitute a recommendation by OppenheimerFunds, Inc. or it affiliates.
Shares of Oppenheimer funds are not deposits or obligations of any bank, are not guaranteed by any bank, are not insured by the FDIC or any other agency, and involve investment risks, including the possible loss of the principal amount invested.
Comparing the Fund’s Performance to the Market. The graphs that follow show the performance of a hypothetical $10,000 investment in each share class of the Fund held until December 31, 2012. In the case of Non-Service shares and Service shares, performance is measured over a ten-fiscal-year period. In the case of Class 3 shares, performance is measured from inception of the class on May 1, 2003. In the case of Class 4 shares, performance is measured from inception of the class on May 3, 2004. Performance information does not reflect charges that apply to separate accounts investing in the Fund. If these charges were taken into account, performance would be lower. The graphs assume that all dividends and capital gains distributions were reinvested in additional shares.
The Fund’s performance is compared to the performance of the MSCI World Index, an index of issuers listed on stock exchanges of foreign countries and the United States. It is widely recognized as a measure of global stock market performance. Index performance includes reinvestment of income but does not reflect transaction costs, fees or expenses. The Index is unmanaged and cannot be purchased directly by investors. Index performance is shown for illustrative purposes only and does not predict or depict the performance of the Fund. While index comparisons may be useful to provide a benchmark for the Fund’s performance, it must be noted that the Fund’s investments are not limited to the investments comprising the Index.
| | | | |
| 4 | | | | OPPENHEIMER GLOBAL SECURITIES FUND/VA |
FUND PERFORMANCE DISCUSSION
Non-Service Shares
Comparison of Change in Value of $10,000 Hypothetical Investments in:
| | | | | | | | | | | | | | | | | | | | | | |
| Average Annual Total Returns of Non-Service Shares of the Fund at 12/31/12 |
| 1-Year | | | 21.27% | | | | 5-Year | | | | 1.52% | | | | 10-Year | | | | 10.15% | | | |
Service Shares
Comparison of Change in Value of $10,000 Hypothetical Investments in:
| | | | | | | | | | | | | | | | | | | | | | |
| Average Annual Total Returns of Service Shares of the Fund at 12/31/12 |
| 1-Year | | | 20.95% | | | | 5-Year | | | | 1.26% | | | | 10-Year | | | | 9.89% | | | |
The performance data quoted represents past performance, which does not guarantee future results. The investment return and principal value of an investment in the Fund will fluctuate so that an investor’s shares, when redeemed, may be worth more or less than their original cost. Current performance may be lower or higher than the performance quoted. For performance data current to the most recent month end, call us at 1.800.988.8287. The Fund’s total returns should not be expected to be the same as the returns of other funds, whether or not both funds have the same portfolio managers and/or similar names. The Fund’s total returns include changes in share price and reinvested distributions but do not include the charges associated with the separate account products that offer this Fund. Such performance would have been lower if such charges were taken into account.
| | | | |
| 5 | | | | OPPENHEIMER GLOBAL SECURITIES FUND/VA |
FUND PERFORMANCE DISCUSSION
Class 3 Shares
Comparison of Change in Value of $10,000 Hypothetical Investments in:
| | | | | | | | | | | | | | | | | | | | | | |
| Average Annual Total Returns of Class 3 Shares of the Fund at 12/31/12 |
| 1-Year | | | 21.23% | | | | 5-Year | | | | 1.50% | | | | Since Inception (5/1/03) | | | | 10.55% | | | |
Class 4 Shares
Comparison of Change in Value of $10,000 Hypothetical Investments in:
| | | | | | | | | | | | | | | | | | |
| Average Annual Total Returns of Class 4 Shares of the Fund at 12/31/12 |
| 1-Year | | | 20.95% | | | | 5-Year | | | | 1.26% | | | Since Inception (5/3/04) | | 6.74% | | |
The performance data quoted represents past performance, which does not guarantee future results. The investment return and principal value of an investment in the Fund will fluctuate so that an investor’s shares, when redeemed, may be worth more or less than their original cost. Current performance may be lower or higher than the performance quoted. For performance data current to the most recent month end, call us at 1.800.988.8287. The Fund’s total returns should not be expected to be the same as the returns of other funds, whether or not both funds have the same portfolio managers and/or similar names. The Fund’s total returns include changes in share price and reinvested distributions but do not include the charges associated with the separate account products that offer this Fund. Such performance would have been lower if such charges were taken into account.
| | | | |
| 6 | | | | OPPENHEIMER GLOBAL SECURITIES FUND/VA |
FUND EXPENSES
Fund Expenses. As a shareholder of the Fund, you incur two types of costs: (1) transaction costs and (2) ongoing costs, including management fees; distribution and service fees; and other Fund expenses. These examples are intended to help you understand your ongoing costs (in dollars) of investing in the Fund and to compare these costs with the ongoing costs of investing in other mutual funds.
The examples are based on an investment of $1,000.00 invested at the beginning of the period and held for the entire 6-month period ended December 31, 2012.
Actual Expenses. The first section of the table provides information about actual account values and actual expenses. You may use the information in this section for the class of shares you hold, together with the amount you invested, to estimate the expense that you paid over the period. Simply divide your account value by $1,000.00 (for example, an $8,600.00 account value divided by $1,000.00 = 8.60), then multiply the result by the number in the first section under the heading entitled “Expenses Paid During Period” to estimate the expenses you paid on your account during this period.
Hypothetical Example for Comparison Purposes. The second section of the table provides information about hypothetical account values and hypothetical expenses based on the Fund’s actual expense ratio for each class of shares, and an assumed rate of return of 5% per year for each class before expenses, which is not the actual return. The hypothetical account values and expenses may not be used to estimate the actual ending account balance or expenses you paid for the period. You may use this information to compare the ongoing costs of investing in the Fund and other funds. To do so, compare this 5% hypothetical example for the class of shares you hold with the 5% hypothetical examples that appear in the shareholder reports of the other funds.
Please note that the expenses shown in the table are meant to highlight your ongoing costs only and do not reflect any charges associated with the separate accounts that offer this Fund. Therefore, the “hypothetical” lines of the table are useful in comparing ongoing costs only, and will not help you determine the relative total costs of owning different funds. In addition, if these separate account charges were included your costs would have been higher.
| | | | | | | | | | | | |
| Actual | | Beginning
Account
Value
July 1, 2012 | | | Ending Account Value
December 31, 2012 | | | Expenses
Paid During
6 Months Ended
December 31, 2012 | |
| Non-Service shares | | $ | 1,000.00 | | | $ | 1,156.30 | | | $ | 4.07 | |
| Service shares | | | 1,000 .00 | | | | 1,154 .70 | | | | 5 .43 | |
| Class 3 shares | | | 1,000 .00 | | | | 1,155 .90 | | | | 4 .07 | |
| Class 4 shares | | | 1,000 .00 | | | | 1,154 .70 | | | | 5 .43 | |
| | | |
Hypothetical
(5% return before expenses) | | | | | | | | | |
| Non-Service shares | | | 1,000 .00 | | | | 1,021 .37 | | | | 3 .82 | |
| Service shares | | | 1,000 .00 | | | | 1,020 .11 | | | | 5 .09 | |
| Class 3 shares | | | 1,000 .00 | | | | 1,021 .37 | | | | 3 .82 | |
| Class 4 shares | | | 1,000 .00 | | | | 1,020 .11 | | | | 5 .09 | |
Expenses are equal to the Fund’s annualized expense ratio for that class, multiplied by the average account value over the period, multiplied by 184/366 (to reflect the one-half year period). Those annualized expense ratios, excluding indirect expenses from affiliated funds, based on the 6-month period ended December 31, 2012 are as follows:
| | | | |
| Class | | Expense Ratios | |
| Class Non-Service | | | 0.75 | % |
| Class Service | | | 1.00 | |
| Class Class 3 | | | 0.75 | |
| Class Class 4 | | | 1.00 | |
The expense ratios reflect voluntary waivers and/or reimbursements of expenses by the Fund’s Manager. Some of these undertakings may be modified or terminated at any time, as indicated in the Fund’s prospectus. The “Financial Highlights” tables in the Fund’s financial statements, included in this report, also show the gross expense ratios, without such waivers or reimbursements and reduction to custodian expenses, if applicable.
| | | | |
| 7 | | | | OPPENHEIMER GLOBAL SECURITIES FUND/VA |
STATEMENT OF INVESTMENTS December 31, 2012
| | | | | | | | |
| | |
Shares | | | Value | |
| Common Stocks—99.1% | | | | | | | | |
| Consumer Discretionary—18.8% | | | | | | | | |
| Automobiles—1.9% | | | | | | | | |
| Bayerische Motoren Werke (BMW) AG, Preference | | | 777,404 | | | $ | 50,237,354 | |
| Hotels, Restaurants & Leisure—3.6% | | | | | | | | |
| Carnival Corp. | | | 1,091,706 | | | | 40,142,030 | |
| Lottomatica Group SpA | | | 454,833 | | | | 10,326,137 | |
| McDonald’s Corp. | | | 507,220 | | | | 44,741,876 | |
| | | | | | |
|
|
|
| | | | | | | | 95,210,043 | |
| Media—4.9% | | | | | | | | |
| Grupo Televisa SAB, Sponsored ADR | | | 969,376 | | | | 25,766,014 | |
| McGraw-Hill Cos., Inc. (The) | | | 651,140 | | | | 35,597,824 | |
| Walt Disney Co. (The) | | | 980,760 | | | | 48,832,040 | |
| Zee Entertainment Enterprises Ltd. | | | 4,094,715 | | | | 16,536,283 | |
| | | | | | |
|
|
|
| | | | | | | | 126,732,161 | |
| Multiline Retail—1.8% | | | | | | | | |
| PPR | | | 247,690 | | | | 46,049,275 | |
| Specialty Retail—3.5% | | | | | | | | |
| Industria de Diseno Textil SA (Inditex) | | | 364,621 | | | | 51,082,590 | |
| Kingfisher plc | | | 1,968,942 | | | | 9,086,790 | |
| Tiffany & Co. | | | 609,290 | | | | 34,936,689 | |
| | | | | | |
|
|
|
| | | | | | | | 95,106,069 | |
| Textiles, Apparel & Luxury Goods—3.1% | | | | | | | | |
| Brunello Cucinelli SpA1 | | | 143,920 | | | | 2,548,015 | |
| LVMH Moet Hennessy Louis Vuitton SA | | | 285,360 | | | | 53,175,998 | |
| Tod’s SpA | | | 209,868 | | | | 26,757,951 | |
| | | | | | |
|
|
|
| | | | | | | | 82,481,964 | |
| Consumer Staples—8.7% | | | | | | | | |
| Beverages—3.4% | | | | | | | | |
| Carlsberg AS, Cl. B | | | 203,544 | | | | 20,011,345 | |
| Compania de Bebidas das Americas, Preference, Sponsored ADR | | | 595,675 | | | | 25,012,393 | |
| Fomento Economico Mexicano SAB de CV, UBD | | | 4,406,450 | | | | 44,124,838 | |
| | | | | | |
|
|
|
| | | | | | | | 89,148,576 | |
| Food & Staples Retailing—0.4% | | | | | | | | |
| E-Mart Co. Ltd.1 | | | 41,610 | | | | 9,250,337 | |
| Food Products—3.0% | | | | | | | | |
| Nestle SA | | | 456,400 | | | | 29,739,726 | |
| Unilever plc | | | 1,304,503 | | | | 49,516,093 | |
| | | | | | |
|
|
|
| | | | | | | | 79,255,819 | |
| Household Products—1.9% | | | | | | | | |
| Colgate-Palmolive Co. | | | 481,880 | | | | 50,375,735 | |
| Energy—4.0% | | | | | | | | |
| Energy Equipment & Services—2.8% | | | | | | | | |
| Technip SA | | | 425,350 | | | | 48,970,183 | |
| Transocean Ltd. | | | 505,762 | | | | 22,582,273 | |
| | | | | | |
|
|
|
| | | | | | | | 71,552,456 | |
| Oil, Gas & Consumable Fuels—1.2% | | | | | | | | |
| Repsol SA | | | 941,660 | | | | 19,338,546 | |
| Total SA | | | 246,440 | | | | 12,755,121 | |
| | | | | | |
|
|
|
| | | | | | | | 32,093,667 | |
| Financials—15.3% | | | | | | | | |
| Capital Markets—3.3% | | | | | | | | |
| Credit Suisse Group AG1 | | | 413,898 | | | | 10,385,255 | |
| Goldman Sachs Group, Inc. (The) | | | 168,630 | | | | 21,510,443 | |
| UBS AG1 | | | 3,587,133 | | | | 56,411,881 | |
| | | | | | |
|
|
|
| | | | | | | | 88,307,579 | |
| Commercial Banks—5.2% | | | | | | | | |
| Banco Bilbao Vizcaya Argentaria SA | | | 3,714,134 | | | | 34,121,199 | |
| ICICI Bank Ltd., Sponsored ADR | | | 974,400 | | | | 42,493,584 | |
| Itau Unibanco Holding SA, Preference, ADR | | | 1,642,800 | | | | 27,040,488 | |
| Societe Generale1 | | | 265,409 | | | | 9,983,149 | |
| Sumitomo Mitsui Financial Group, Inc. | | | 636,000 | | | | 23,105,258 | |
| | | | | | |
|
|
|
| | | | | | | | 136,743,678 | |
| Diversified Financial Services—1.4% | | | | | | | | |
| BM&FBovespa SA | | | 4,194,900 | | | | 29,281,807 | |
| Citigroup, Inc. | | | 172,710 | | | | 6,832,408 | |
| | | | | | | | 36,114,215 | |
| | | | | | |
|
|
|
| | | | | | | | |
| | |
Shares | | | Value | |
| Insurance—4.9% | | | | | | | | |
| Allianz SE | | | 328,539 | | | $ | 45,447,049 | |
| Dai-ichi Life Insurance Co. Ltd. (The) | | | 21,622 | | | | 30,423,124 | |
| Fidelity National Financial, Inc., Cl. A | | | 687,020 | | | | 16,179,321 | |
| Prudential plc | | | 2,685,537 | | | | 37,472,053 | |
| | | | | | |
|
|
|
| | | | | | | | 129,521,547 | |
| Real Estate Management & Development—0.5% | |
| DLF Ltd. | | | 3,100,027 | | | | 13,186,751 | |
| Health Care—9.8% | | | | | | | | |
| Biotechnology—2.3% | | | | | | | | |
| Amgen, Inc. | | | 174,970 | | | | 15,103,410 | |
| Gilead Sciences, Inc.1 | | | 292,370 | | | | 21,474,577 | |
| Theravance, Inc.1 | | | 598,130 | | | | 13,320,355 | |
| ThromboGenics NV1 | | | 173,111 | | | | 9,565,809 | |
| | | | | | |
|
|
|
| | | | | | | | 59,464,151 | |
| Health Care Equipment & Supplies—1.4% | |
| Zimmer Holdings, Inc. | | | 538,630 | | | | 35,905,076 | |
| Health Care Providers & Services—3.3% | | | | | | | | |
| Aetna, Inc. | | | 856,390 | | | | 39,650,857 | |
| WellPoint, Inc. | | | 760,435 | | | | 46,325,700 | |
| | | | | | |
|
|
|
| | | | | | | | 85,976,557 | |
| Pharmaceuticals—2.8% | | | | | | | | |
| Allergan, Inc. | | | 93,810 | | | | 8,605,191 | |
| Bayer AG | | | 453,800 | | | | 43,061,629 | |
| Roche Holding AG | | | 115,713 | | | | 23,573,620 | |
| | | | | | |
|
|
|
| | | | | | | | 75,240,440 | |
| Industrials—13.1% | | | | | | | | |
| Aerospace & Defense—3.0% | | | | | | | | |
| Embraer SA, ADR | | | 867,823 | | | | 24,741,634 | |
| European Aeronautic Defence & Space Co. NV | | | 1,311,650 | | | | 51,407,892 | |
| | | | | | |
|
|
|
| | | | | | | | 76,149,526 | |
| Air Freight & Couriers—1.0% | | | | | | | | |
| United Parcel Service, Inc., Cl. B | | | 349,160 | | | | 25,743,567 | |
| Building Products—1.9% | | | | | | | | |
| Assa Abloy AB, Cl. B | | | 1,328,498 | | | | 50,025,212 | |
| Construction & Engineering—0.7% | | | | | | | | |
| FLSmidth & Co. AS | | | 333,542 | | | | 19,484,940 | |
| Electrical Equipment—2.0% | | | | | | | | |
| Emerson Electric Co. | | | 445,690 | | | | 23,603,742 | |
| Nidec Corp. | | | 253,000 | | | | 14,794,136 | |
| Prysmian SpA | | | 708,371 | | | | 14,331,831 | |
| | | | | | |
|
|
|
| | | | | | | | 52,729,709 | |
| Industrial Conglomerates—3.6% | | | | | | | | |
| 3M Co. | | | 402,670 | | | | 37,387,910 | |
| Siemens AG | | | 526,478 | | | | 57,122,804 | |
| | | | | | | | 94,510,714 | |
| Machinery—0.8% | | | | | | | | |
| FANUC Corp. | | | 118,800 | | | | 22,092,503 | |
| Road & Rail—0.1% | | | | | | | | |
| All America Latina Logistica | | | 744,700 | | | | 3,051,845 | |
| Information Technology—26.3% | | | | | | | | |
| Communications Equipment—4.3% | | | | | | | | |
| Juniper Networks, Inc.1 | | | 1,426,760 | | | | 28,064,369 | |
| Telefonaktiebolaget LM Ericsson, Cl. B | | | 8,278,064 | | | | 83,262,950 | |
| | | | | | |
|
|
|
| | | | | | | | 111,327,319 | |
| Computers & Peripherals—0.5% | | | | | | | | |
| Fusion-io, Inc.1 | | | 551,160 | | | | 12,638,099 | |
| Electronic Equipment, Instruments, & Components—3.6% | |
| Hoya Corp. | | | 647,000 | | | | 12,738,751 | |
| Keyence Corp. | | | 110,711 | | | | 30,503,510 | |
| Kyocera Corp. | | | 172,300 | | | | 15,624,362 | |
| Murata Manufacturing Co. Ltd. | | | 560,500 | | | | 33,057,598 | |
| | | | | | |
|
|
|
| | | | | | | | 91,924,221 | |
| Internet Software & Services—5.6% | | | | | | | | |
| eBay, Inc.1 | | | 1,499,210 | | | | 76,489,694 | |
| Facebook, Inc., Cl. A1 | | | 685,770 | | | | 18,262,055 | |
| Google, Inc., Cl. A1 | | | 72,900 | | | | 51,713,073 | |
| | | | | | |
|
|
|
| | | | | | | | 146,464,822 | |
| IT Services—0.9% | | | | | | | | |
| Infosys Ltd. | | | 548,218 | | | | 23,363,117 | |
| | | | |
| 8 | | | | OPPENHEIMER GLOBAL SECURITIES FUND/VA |
| | | | | | | | |
| | |
Shares | | | Value | |
| Semiconductors & Semiconductor Equipment—4.5% | |
| Altera Corp. | | | 1,405,440 | | | $ | 48,403,354 | |
| Maxim Integrated Products, Inc. | | | 1,494,095 | | | | 43,926,393 | |
| Taiwan Semiconductor Manufacturing Co. Ltd. | | | 7,876,184 | | | | 26,309,096 | |
| | | | | | |
|
|
|
| | | | | | | | 118,638,843 | |
| Software—6.9% | | | | | | | | |
| Adobe Systems, Inc.1 | | | 1,027,043 | | | | 38,698,980 | |
| Intuit, Inc. | | | 708,360 | | | | 42,147,420 | |
| Microsoft Corp. | | | 1,323,540 | | | | 35,378,224 | |
| SAP AG | | | 812,212 | | | | 65,064,488 | |
| | | | | | |
|
|
|
| | | | | | | | 181,289,112 | |
| Materials—1.3% | | | | | | | | |
| Chemicals—1.0% | | | | | | | | |
| Linde AG | | | 145,840 | | | | 25,410,199 | |
| Metals & Mining—0.3% | | | | | | | | |
| Iluka Resources Ltd. | | | 864,100 | | | | 8,373,778 | |
| Telecommunication Services—1.3% | | | | | | | | |
| Wireless Telecommunication Services—1.3% | |
| KDDI Corp. | | | 477,100 | | | | 33,699,960 | |
| | | | | | | | |
| | |
Shares | | | Value | |
| Utilities—0.5% | | | | | | | | |
| Electric Utilities—0.5% | | | | | | | | |
| Fortum OYJ | | | 739,751 | | | $ | 13,911,396 | |
Total Common Stocks
(Cost $1,750,649,998) | | | | | | | 2,598,782,332 | |
| | |
| | | Units | | | | |
| Rights, Warrants and Certificates—0.0% | |
| Repsol SA Rts., Strike Price 0.001EUR, Exp. 1/10/131 (Cost $—) | | | 941,660 | | | | 574,240 | |
| | |
| | | Shares | | | | |
| Investment Company—1.2% | |
| Oppenheimer Institutional Money Market Fund, Cl. E, 0.15%2,3 | | | | | | | | |
| (Cost $30,612,139) | | | 30,612,139 | | | | 30,612,139 | |
Total Investments, at Value
(Cost $1,781,262,137) | | | 100.3 | % | | | 2,629,968,711 | |
| Liabilities in Excess of Other Assets | |
| (0.3
| )
| |
| (7,600,245
| )
|
| Net Assets | |
| 100.0
| %
| | $
| 2,622,368,466
|
|
Footnotes to Statement of Investments
1. Non-income producing security.
2. Is or was an affiliate, as defined in the Investment Company Act of 1940, at or during the period ended December 31, 2012, by virtue of the Fund owning at least 5% of the voting securities of the issuer or as a result of the Fund and the issuer having the same investment adviser. Transactions during the period in which the issuer was an affiliate are as follows:
| | | | | | | | | | | | | | | | |
| | | Shares
December 30, 2011a | | | Gross
Additions | | | Gross
Reductions | | | Shares
December 31, 2012 | |
| Oppenheimer Institutional Money Market Fund, Cl. E | | | 36,459,796 | | | | 263,526,960 | | | | 269,374,617 | | | | 30,612,139 | |
| | | | |
| | | | | | | | | Value | | | Income | |
| Oppenheimer Institutional Money Market Fund, Cl. E | | | | | | $ | | | | | 30,612,139 | | | $ | 51,653 | |
a. December 30, 2011 represents the last business day of the Fund’s 2011 fiscal year. See Note 1 of the accompanying Notes.
3. Rate shown is the 7-day yield as of December 31, 2012.
Distribution of investments representing geographic holdings, as a percentage of total investments at value, is as follows:
| | | | | | | | |
| Geographic Holdings | | Value | | | Percent | |
| United States | | $ | 1,015,184,824 | | | | 38.7 | % |
| Germany | | | 286,343,523 | | | | 10.9 | |
| Japan | | | 216,039,202 | | | | 8.4 | |
| France | | | 170,933,726 | | | | 6.5 | |
| Sweden | | | 133,288,162 | | | | 5.1 | |
| Switzerland | | | 120,110,482 | | | | 4.5 | |
| Brazil | | | 109,128,167 | | | | 4.1 | |
| Spain | | | 105,116,575 | | | | 3.9 | |
| United Kingdom | | | 96,074,936 | | | | 3.6 | |
| India | | | 95,579,735 | | | | 3.6 | |
| Mexico | | | 69,890,852 | | | | 2.7 | |
| Italy | | | 53,963,934 | | | | 2.0 | |
| Netherlands | | | 51,407,892 | | | | 2.0 | |
| Denmark | | | 39,496,285 | | | | 1.5 | |
| Taiwan | | | 26,309,096 | | | | 1.0 | |
| Finland | | | 13,911,396 | | | | 0.5 | |
| Belgium | | | 9,565,809 | | | | 0.4 | |
| South Korea | | | 9,250,337 | | | | 0.3 | |
| Australia | | | 8,373,778 | | | | 0.3 | |
| | |
|
|
| |
|
|
|
| Total | | $ | 2,629,968,711 | | | | 100.0 | % |
| | |
|
|
| |
|
|
|
| | | | | | | | | | | | | | | | | | | | |
| Spot Currency Exchange Contracts as of December 31, 2012 are as follows: | | | | | | | | | | |
| Broker/Contract Description | | Buy/Sell | | | Contract Amount
(000’s) | | | Expiration
Date | | | Value | | | Unrealized
Depreciation | |
| Goldman Sachs & Co.: | | | | | | | | | | | | | | | | | | | | |
| Swedish Krona (SEK) | | | Sell | | | | 6,668 SEK | | | | 1/4/13 | | | $ | 1,025,402 | | | $ | 1,877 | |
See accompanying Notes to Financial Statements.
| | | | |
| 9 | | | | OPPENHEIMER GLOBAL SECURITIES FUND/VA |
STATEMENT OF ASSETS AND LIABILITIES December 31, 2012
| | | | |
| Assets | | | |
| Investments, at value—see accompanying statement of investments: | | | | |
| Unaffiliated companies (cost $1,750,649,998) | | $ | 2,599,356,572 | |
| Affiliated companies (cost $30,612,139) | |
| 30,612,139
|
|
| | | | 2,629,968,711 | |
| Cash | | | 451 | |
| Receivables and other assets: | | | | |
| Dividends | | | 1,304,659 | |
| Investments sold | | | 1,025,402 | |
| Other | |
| 214,041
|
|
| Total assets | | | 2,632,513,264 | |
| Liabilities | | | |
| Unrealized depreciation on foreign currency exchange contracts | | | 1,877 | |
| Payables and other liabilities: | | | | |
| Shares of beneficial interest redeemed | | | 9,264,860 | |
| Distribution and service plan fees | | | 245,291 | |
| Transfer and shareholder servicing agent fees | | | 228,362 | |
| Shareholder communications | | | 124,695 | |
| Foreign capital gains tax | | | 84,673 | |
| Trustees’ compensation | | | 68,522 | |
| Other | |
| 126,518
|
|
| Total liabilities | | | 10,144,798 | |
| Net Assets | | $
| 2,622,368,466
|
|
| Composition of Net Assets | | | |
| Par value of shares of beneficial interest | | $ | 80,869 | |
| Additional paid-in capital | | | 1,776,217,398 | |
| Accumulated net investment income | | | 35,518,126 | |
| Accumulated net realized loss on investments and foreign currency transactions | | | (38,064,869 | ) |
| Net unrealized appreciation on investments and translation of assets and liabilities denominated in foreign currencies | |
| 848,616,942
|
|
| Net Assets | | $
| 2,622,368,466
|
|
| Net Asset Value Per Share | | | |
| Non-Service Shares: | | | | |
| Net asset value, redemption price per share and offering price per share (based on net assets of $1,252,127,508 and 38,470,124 shares of beneficial interest outstanding) | | | $32.55 | |
| Service Shares: | | | | |
| Net asset value, redemption price per share and offering price per share (based on net assets of $1,130,387,544 and 35,048,218 shares of beneficial interest outstanding) | | | $32.25 | |
| Class 3 Shares: | | | | |
| Net asset value, redemption price per share and offering price per share (based on net assets of $164,477,199 and 5,018,452 shares of beneficial interest outstanding) | | | $32.77 | |
| Class 4 Shares: | | | | |
| Net asset value, redemption price per share and offering price per share (based on net assets of $75,376,215 and 2,332,401 shares of beneficial interest outstanding) | | | $32.32 | |
See accompanying Notes to Financial Statements.
| | | | |
| 10 | | | | OPPENHEIMER GLOBAL SECURITIES FUND/VA |
STATEMENT OF OPERATIONS For the Year Ended December 31, 2012
| | | | |
| Investment Income | | | |
| Dividends: | | | | |
| Unaffiliated companies (net of foreign withholding taxes of $4,305,852) | | $ | 56,028,560 | |
| Affiliated companies | | | 51,653 | |
| Interest | |
| 1,134
|
|
| Total investment income | | | 56,081,347 | |
| Expenses | | | |
| Management fees | | | 15,919,693 | |
| Distribution and service plan fees: | | | | |
| Service shares | | | 2,674,031 | |
| Class 4 shares | | | 175,308 | |
| Transfer and shareholder servicing agent fees: | | | | |
| Non-Service shares | | | 1,209,507 | |
| Service shares | | | 1,072,229 | |
| Class 3 shares | | | 161,178 | |
| Class 4 shares | | | 69,959 | |
| Shareholder communications: | | | | |
| Non-Service shares | | | 129,302 | |
| Service shares | | | 115,680 | |
| Class 3 shares | | | 17,104 | |
| Class 4 shares | | | 7,447 | |
| Custodian fees and expenses | | | 240,736 | |
| Trustees’ compensation | | | 63,404 | |
| Administration service fees | | | 1,500 | |
| Other | |
| 25,644
|
|
| Total expenses | | | 21,882,722 | |
| Less waivers and reimbursements of expenses | |
| (26,084
| )
|
| Net expenses | | | 21,856,638 | |
| Net Investment Income | | | 34,224,709 | |
| Realized and Unrealized Gain (Loss) | | | |
| Net realized gain (loss) on: | | | | |
| Investments from unaffiliated companies | | | (2,371,370 | ) |
| Foreign currency transactions | |
| 23,158,513
|
|
| Total net realized gain | | | 20,787,143 | |
| Net change in unrealized appreciation/depreciation on: | | | | |
| Investments (net of foreign capital gains tax of $84,673) | | | 455,217,036 | |
| Translation of assets and liabilities denominated in foreign currencies | |
| (27,975,117
| )
|
| Total net change in unrealized appreciation/depreciation | | | 427,241,919 | |
| Net Increase in Net Assets Resulting from Operations | | $
| 482,253,771
|
|
See accompanying Notes to Financial Statements.
| | | | |
| 11 | | | | OPPENHEIMER GLOBAL SECURITIES FUND/VA |
STATEMENTS OF CHANGES IN NET ASSETS
| | | | | | | | |
| | | Year Ended
December 31,
2012 | | | Year Ended
December 30,
20111 | |
| Operations | | | | | | |
| Net investment income | | $ | 34,224,709 | | | $ | 55,375,926 | |
| Net realized gain (loss) | | | 20,787,143 | | | | (4,932,906 | ) |
| Net change in unrealized appreciation/depreciation | |
| 427,241,919
|
| |
| (266,645,479
| )
|
| Net increase (decrease) in net assets resulting from operations | | | 482,253,771 | | | | (216,202,459 | ) |
| Dividends and/or Distributions to Shareholders | | | | | | |
| Dividends from net investment income: | | | | | | | | |
| Non-Service shares | | | (25,848,197 | ) | | | (17,234,287 | ) |
| Service shares | | | (20,625,132 | ) | | | (11,357,368 | ) |
| Class 3 shares | | | (3,444,499 | ) | | | (2,447,497 | ) |
| Class 4 shares | |
| (1,338,372
| )
| |
| (819,361
| )
|
| | | | (51,256,200 | ) | | | (31,858,513 | ) |
| Beneficial Interest Transactions | | | | | | |
| Net increase (decrease) in net assets resulting from beneficial interest transactions: | | | | | | | | |
| Non-Service shares | | | (120,462,188 | ) | | | (124,782,917 | ) |
| Service shares | | | (57,616,385 | ) | | | 5,153,335 | |
| Class 3 shares | | | (21,486,893 | ) | | | (27,368,355 | ) |
| Class 4 shares | |
| (4,855,491
| )
| |
| (5,984,377
| )
|
| | | | (204,420,957 | ) | | | (152,982,314 | ) |
| Net Assets | | | | | | |
| Total increase (decrease) | | | 226,576,614 | | | | (401,043,286 | ) |
| Beginning of period | |
| 2,395,791,852
|
| |
| 2,796,835,138
|
|
| End of period (including accumulated net investment income of $35,518,126 and $46,346,747, respectively) | | $
| 2,622,368,466
|
| | $
| 2,395,791,852
|
|
1. December 30, 2011 represents the last business day of the Fund’s 2011 fiscal year. See Note 1 of the accompanying Notes.
See accompanying Notes to Financial Statements.
| | | | |
| 12 | | | | OPPENHEIMER GLOBAL SECURITIES FUND/VA |
FINANCIAL HIGHLIGHTS
| | | | | | | | | | | | | | | | | | | | |
| Non-Service Shares | | Year Ended
December 31,
2012 | | | Year Ended
December 30,
20111 | | | Year Ended
December 31,
2010 | | | Year Ended
December 31,
2009 | | | Year Ended
December 31,
2008 | |
| | | | | | | | | | | | | | | | | | | | | |
| Per Share Operating Data | | | | | | | | | | | | | | | |
| Net asset value, beginning of period | | $ | 27.46 | | | $ | 30.30 | | | $ | 26.50 | | | $ | 20.21 | | | $ | 36.60 | |
| Income (loss) from investment operations: | | | | | | | | | | | | | | | |
| Net investment income2 | | | 0.44 | | | | 0.65 | | | | 0.33 | | | | 0.33 | | | | 0.55 | |
| Net realized and unrealized gain (loss) | |
| 5.29
|
| |
| (3.11
| )
| |
| 3.85
|
| |
| 6.94
|
| |
| (14.46
| )
|
| Total from investment operations | | | 5.73 | | | | (2.46 | ) | | | 4.18 | | | | 7.27 | | | | (13.91 | ) |
| Dividends and/or distributions to shareholders: | | | | | | | | | | | | | | | | | | | | |
| Dividends from net investment income | | | (0.64 | ) | | | (0.38 | ) | | | (0.38 | ) | | | (0.50 | ) | | | (0.46 | ) |
| Distributions from net realized gain | |
| 0.00
|
| |
| 0.00
|
| |
| 0.00
|
| |
| (0.48
| )
| |
| (2.02
| )
|
| Total dividends and/or distributions to shareholders | | | (0.64 | ) | | | (0.38 | ) | | | (0.38 | ) | | | (0.98 | ) | | | (2.48 | ) |
| Net asset value, end of period | | $
| 32.55
|
| | $
| 27.46
|
| | $
| 30.30
|
| | $
| 26.50
|
| | $
| 20.21
|
|
| Total Return, at Net Asset Value3 | | | 21.27 | % | | | (8.29 | )% | | | 15.96 | % | | | 39.77 | % | | | (40.19 | )% |
| | | | | | | | | | | | | | | | | | | | | |
| Ratios/Supplemental Data | | | | | | | | | | | | | | | | | | | | |
| Net assets, end of period (in thousands) | | $ | 1,252,127 | | | $ | 1,165,141 | | | $ | 1,410,764 | | | $ | 1,364,597 | | | $ | 1,150,113 | |
| Average net assets (in thousands) | | $ | 1,206,244 | | | $ | 1,335,403 | | | $ | 1,336,110 | | | $ | 1,206,240 | | | $ | 1,679,720 | |
| Ratios to average net assets:4 | | | | | | | | | | | | | | | | | | | | |
| Net investment income | | | 1.48 | % | | | 2.17 | % | | | 1.22 | % | | | 1.51 | % | | | 1.95 | % |
| Total expenses5 | | | 0.76 | % | | | 0.76 | % | | | 0.76 | % | | | 0.75 | % | | | 0.65 | % |
| Expenses after payments, waivers and/or reimbursements and reduction to custodian expenses | | | 0.76 | % | | | 0.76 | % | | | 0.76 | % | | | 0.75 | % | | | 0.65 | % |
| Portfolio turnover rate | | | 14 | % | | | 13 | % | | | 15 | % | | | 11 | % | | | 19 | % |
1. December 30, 2011 represents the last business day of the Fund’s 2011 fiscal year. See Note 1 of the accompanying Notes.
2. Per share amounts calculated based on the average shares outstanding during the period.
3. Assumes an initial investment on the business day before the first day of the fiscal period, with all dividends and distributions reinvested in additional shares on the reinvestment date, and redemption at the net asset value calculated on the last business day of the fiscal period. Total returns are not annualized for periods less than one full year. Total return information does not reflect expenses that apply at the separate account level or to related insurance products. Inclusion of these charges would reduce the total return figures for all periods shown. Returns do not reflect the deduction of taxes that a shareholder would pay on fund distributions or the redemption of fund shares.
4. Annualized for periods less than one full year.
5. Total expenses including indirect expenses from affiliated fund were as follows:
| | | | |
| Year Ended December 31, 2012 | | | 0.76 | % |
| Year Ended December 30, 2011 | | | 0.76 | % |
| Year Ended December 31, 2010 | | | 0.76 | % |
| Year Ended December 31, 2009 | | | 0.75 | % |
| Year Ended December 31, 2008 | | | 0.65 | % |
See accompanying Notes to Financial Statements.
| | | | |
| 13 | | | | OPPENHEIMER GLOBAL SECURITIES FUND/VA |
FINANCIAL HIGHLIGHTS / (Continued)
| | | | | | | | | | | | | | | | | | | | |
| Service Shares | | Year Ended
December 31,
2012 | | | Year Ended
December 30,
20111 | | | Year Ended
December 31,
2010 | | | Year Ended
December 31,
2009 | | | Year Ended
December 31,
2008 | |
| | | | | | | | | | | | | | | | | | | | | |
| Per Share Operating Data | | | | | | | | | | | | | | | |
| Net asset value, beginning of period | | $ | 27.21 | | | $ | 30.04 | | | $ | 26.28 | | | $ | 20.02 | | | $ | 36.27 | |
| Income (loss) from investment operations: | | | | | | | | | | | | | | | |
| Net investment income2 | | | 0.36 | | | | 0.56 | | | | 0.26 | | | | 0.27 | | | | 0.47 | |
| Net realized and unrealized gain (loss) | |
| 5.25
|
| |
| (3.08
| )
| |
| 3.82
|
| |
| 6.90
|
| |
| (14.32
| )
|
| Total from investment operations | | | 5.61 | | | | (2.52 | ) | | | 4.08 | | | | 7.17 | | | | (13.85 | ) |
| Dividends and/or distributions to shareholders: | | | | | | | | | | | | | | | | | | | | |
| Dividends from net investment income | | | (0.57 | ) | | | (0.31 | ) | | | (0.32 | ) | | | (0.43 | ) | | | (0.38 | ) |
| Distributions from net realized gain | |
| 0.00
|
| |
| 0.00
|
| |
| 0.00
|
| |
| (0.48
| )
| |
| (2.02
| )
|
| Total dividends and/or distributions to shareholders | | | (0.57 | ) | | | (0.31 | ) | | | (0.32 | ) | | | (0.91 | ) | | | (2.40 | ) |
| Net asset value, end of period | | $
| 32.25
|
| | $
| 27.21
|
| | $
| 30.04
|
| | $
| 26.28
|
| | $
| 20.02
|
|
| Total Return, at Net Asset Value3 | | | 20.95 | % | | | (8.53 | )% | | | 15.70 | % | | | 39.36 | % | | | (40.33 | )% |
| | | | | | | | | | | | | | | | | | | | | |
| Ratios/Supplemental Data | | | | | | | | | | | | | | | | | | | | |
| Net assets, end of period (in thousands) | | $ | 1,130,388 | | | $ | 1,003,839 | | | $ | 1,101,584 | | | $ | 980,485 | | | $ | 772,107 | |
| Average net assets (in thousands) | | $ | 1,069,295 | | | $ | 1,091,128 | | | $ | 997,627 | | | $ | 830,887 | | | $ | 1,051,239 | |
| Ratios to average net assets:4 | | | | | | | | | | | | | | | | | | | | |
| Net investment income | | | 1.23 | % | | | 1.90 | % | | | 0.96 | % | | | 1.23 | % | | | 1.70 | % |
| Total expenses5 | | | 1.01 | % | | | 1.01 | % | | | 1.01 | % | | | 1.00 | % | | | 0.90 | % |
| Expenses after payments, waivers and/or reimbursements and reduction to custodian expenses | | | 1.01 | % | | | 1.01 | % | | | 1.01 | % | | | 1.00 | % | | | 0.90 | % |
| Portfolio turnover rate | | | 14 | % | | | 13 | % | | | 15 | % | | | 11 | % | | | 19 | % |
1. December 30, 2011 represents the last business day of the Fund’s 2011 fiscal year. See Note 1 of the accompanying Notes.
2. Per share amounts calculated based on the average shares outstanding during the period.
3. Assumes an initial investment on the business day before the first day of the fiscal period, with all dividends and distributions reinvested in additional shares on the reinvestment date, and redemption at the net asset value calculated on the last business day of the fiscal period. Total returns are not annualized for periods less than one full year. Total return information does not reflect expenses that apply at the separate account level or to related insurance products. Inclusion of these charges would reduce the total return figures for all periods shown. Returns do not reflect the deduction of taxes that a shareholder would pay on fund distributions or the redemption of fund shares.
4. Annualized for periods less than one full year.
5. Total expenses including indirect expenses from affiliated fund were as follows:
| | | | |
| Year Ended December 31, 2012 | | | 1.01 | % |
| Year Ended December 30, 2011 | | | 1.01 | % |
| Year Ended December 31, 2010 | | | 1.01 | % |
| Year Ended December 31, 2009 | | | 1.00 | % |
| Year Ended December 31, 2008 | | | 0.90 | % |
See accompanying Notes to Financial Statements.
| | | | |
| 14 | | | | OPPENHEIMER GLOBAL SECURITIES FUND/VA |
FINANCIAL HIGHLIGHTS / (Continued)
| | | | | | | | | | | | | | | | | | | | |
| Class 3 Shares | | Year Ended
December 31,
2012 | | | Year Ended
December 30,
20111 | | | Year Ended
December 31,
2010 | | | Year Ended
December 31,
2009 | | | Year Ended
December 31,
2008 | |
| | | | | | | | | | | | | | | | | | | | | |
| Per Share Operating Data | | | | | | | | | | | | | | | |
| Net asset value, beginning of period | | $ | 27.65 | | | $ | 30.50 | | | $ | 26.67 | | | $ | 20.34 | | | $ | 36.82 | |
| Income (loss) from investment operations: | | | | | | | | | | | | | | | |
| Net investment income2 | | | 0.44 | | | | 0.66 | | | | 0.33 | | | | 0.33 | | | | 0.56 | |
| Net realized and unrealized gain (loss) | |
| 5.32
|
| |
| (3.13
| )
| |
| 3.88
|
| |
| 6.98
|
| |
| (14.56
| )
|
| Total from investment operations | | | 5.76 | | | | (2.47 | ) | | | 4.21 | | | | 7.31 | | | | (14.00 | ) |
| Dividends and/or distributions to shareholders: | | | | | | | | | | | | | | | | | | | | |
| Dividends from net investment income | | | (0.64 | ) | | | (0.38 | ) | | | (0.38 | ) | | | (0.50 | ) | | | (0.46 | ) |
| Distributions from net realized gain | |
| 0.00
|
| |
| 0.00
|
| |
| 0.00
|
| |
| (0.48
| )
| |
| (2.02
| )
|
| Total dividends and/or distributions to shareholders | | | (0.64 | ) | | | (0.38 | ) | | | (0.38 | ) | | | (0.98 | ) | | | (2.48 | ) |
| Net asset value, end of period | | $
| 32.77
|
| | $
| 27.65
|
| | $
| 30.50
|
| | $
| 26.67
|
| | $
| 20.34
|
|
| Total Return, at Net Asset Value3 | | | 21.23 | % | | | (8.27 | )% | | | 15.97 | % | | | 39.70 | % | | | (40.19 | )% |
| | | | | | | | | | | | | | | | | | | | | |
| Ratios/Supplemental Data | | | | | | | | | | | | | | | | | | | | |
| Net assets, end of period (in thousands) | | $ | 164,477 | | | $ | 158,343 | | | $ | 202,621 | | | $ | 206,356 | | | $ | 175,971 | |
| Average net assets (in thousands) | | $ | 160,752 | | | $ | 187,804 | | | $ | 196,495 | | | $ | 182,553 | | | $ | 269,650 | |
| Ratios to average net assets:4 | | | | | | | | | | | | | | | | | | | | |
| Net investment income | | | 1.49 | % | | | 2.17 | % | | | 1.22 | % | | | 1.49 | % | | | 1.95 | % |
| Total expenses5 | | | 0.76 | % | | | 0.76 | % | | | 0.76 | % | | | 0.75 | % | | | 0.65 | % |
| Expenses after payments, waivers and/or reimbursements and reduction to custodian expenses | | | 0.76 | % | | | 0.76 | % | | | 0.76 | % | | | 0.75 | % | | | 0.65 | % |
| Portfolio turnover rate | | | 14 | % | | | 13 | % | | | 15 | % | | | 11 | % | | | 19 | % |
1. December 30, 2011 represents the last business day of the Fund’s 2011 fiscal year. See Note 1 of the accompanying Notes.
2. Per share amounts calculated based on the average shares outstanding during the period.
3. Assumes an initial investment on the business day before the first day of the fiscal period, with all dividends and distributions reinvested in additional shares on the reinvestment date, and redemption at the net asset value calculated on the last business day of the fiscal period. Total returns are not annualized for periods less than one full year. Total return information does not reflect expenses that apply at the separate account level or to related insurance products. Inclusion of these charges would reduce the total return figures for all periods shown. Returns do not reflect the deduction of taxes that a shareholder would pay on fund distributions or the redemption of fund shares.
4. Annualized for periods less than one full year.
5. Total expenses including indirect expenses from affiliated fund were as follows:
| | | | |
| Year Ended December 31, 2012 | | | 0.76 | % |
| Year Ended December 30, 2011 | | | 0.76 | % |
| Year Ended December 31, 2010 | | | 0.76 | % |
| Year Ended December 31, 2009 | | | 0.75 | % |
| Year Ended December 31, 2008 | | | 0.65 | % |
See accompanying Notes to Financial Statements.
| | | | |
| 15 | | | | OPPENHEIMER GLOBAL SECURITIES FUND/VA |
FINANCIAL HIGHLIGHTS / (Continued)
| | | | | | | | | | | | | | | | | | | | |
| Class 4 Shares | | Year Ended
December 31,
2012 | | | Year Ended
December 30,
20111 | | | Year Ended
December 31,
2010 | | | Year Ended
December 31,
2009 | | | Year Ended
December 31,
2008 | |
| | | | | | | | | | | | | | | | | | | | | |
| Per Share Operating Data | | | | | | | | | | | | | | | |
| Net asset value, beginning of period | | $ | 27.26 | | | $ | 30.08 | | | $ | 26.32 | | | $ | 20.03 | | | $ | 36.28 | |
| Income (loss) from investment operations: | | | | | | | | | | | | | | | |
| Net investment income2 | | | 0.37 | | | | 0.57 | | | | 0.26 | | | | 0.27 | | | | 0.47 | |
| Net realized and unrealized gain (loss) | |
| 5.25
|
| |
| (3.08
| )
| |
| 3.82
|
| |
| 6.92
|
| |
| (14.34
| )
|
| Total from investment operations | | | 5.62 | | | | (2.51 | ) | | | 4.08 | | | | 7.19 | | | | (13.87 | ) |
| Dividends and/or distributions to shareholders: | | | | | | | | | | | | | | | | | | | | |
| Dividends from net investment income | | | (0.56 | ) | | | (0.31 | ) | | | (0.32 | ) | | | (0.42 | ) | | | (0.36 | ) |
| Distributions from net realized gain | |
| 0.00
|
| |
| 0.00
|
| |
| 0.00
|
| |
| (0.48
| )
| |
| (2.02
| )
|
| Total dividends and/or distributions to shareholders | | | (0.56 | ) | | | (0.31 | ) | | | (0.32 | ) | | | (0.90 | ) | | | (2.38 | ) |
| Net asset value, end of period | | $
| 32.32
|
| | $
| 27.26
|
| | $
| 30.08
|
| | $
| 26.32
|
| | $
| 20.03
|
|
| Total Return, at Net Asset Value3 | | | 20.95 | % | | | (8.49 | )% | | | 15.67 | % | | | 39.38 | % | | | (40.35 | )% |
| | | | | | | | | | | | | | | | | | | | | |
| Ratios/Supplemental Data | | | | | | | | | | | | | | | | | | | | |
| Net assets, end of period (in thousands) | | $ | 75,376 | | | $ | 68,469 | | | $ | 81,866 | | | $ | 78,043 | | | $ | 63,099 | |
| Average net assets (in thousands) | | $ | 69,764 | | | $ | 78,655 | | | $ | 76,519 | | | $ | 66,965 | | | $ | 93,909 | |
| Ratios to average net assets:4 | | | | | | | | | | | | | | | | | | | | |
| Net investment income | | | 1.25 | % | | | 1.93 | % | | | 0.97 | % | | | 1.22 | % | | | 1.69 | % |
| Total expenses5 | | | 1.01 | % | | | 1.01 | % | | | 1.01 | % | | | 1.00 | % | | | 0.91 | % |
| Expenses after payments, waivers and/or reimbursements and reduction to custodian expenses | | | 1.01 | % | | | 1.01 | % | | | 1.01 | % | | | 1.00 | % | | | 0.91 | % |
| Portfolio turnover rate | | | 14 | % | | | 13 | % | | | 15 | % | | | 11 | % | | | 19 | % |
1. December 30, 2011 represents the last business day of the Fund’s 2011 fiscal year. See Note 1 of the accompanying Notes.
2. Per share amounts calculated based on the average shares outstanding during the period.
3. Assumes an initial investment on the business day before the first day of the fiscal period, with all dividends and distributions reinvested in additional shares on the reinvestment date, and redemption at the net asset value calculated on the last business day of the fiscal period. Total returns are not annualized for periods less than one full year. Total return information does not reflect expenses that apply at the separate account level or to related insurance products. Inclusion of these charges would reduce the total return figures for all periods shown. Returns do not reflect the deduction of taxes that a shareholder would pay on fund distributions or the redemption of fund shares.
4. Annualized for periods less than one full year.
5. Total expenses including indirect expenses from affiliated fund were as follows:
| | | | |
| Year Ended December 31, 2012 | | | 1.01 | % |
| Year Ended December 30, 2011 | | | 1.01 | % |
| Year Ended December 31, 2010 | | | 1.01 | % |
| Year Ended December 31, 2009 | | | 1.00 | % |
| Year Ended December 31, 2008 | | | 0.91 | % |
See accompanying Notes to Financial Statements.
| | | | |
| 16 | | | | OPPENHEIMER GLOBAL SECURITIES FUND/VA |
NOTES TO FINANCIAL STATEMENTS
1. Significant Accounting Policies
Oppenheimer Global Securities Fund/VA (the “Fund”) is a separate series of Oppenheimer Variable Account Funds, an open-end management investment company registered under the Investment Company Act of 1940, as amended. The Fund’s investment objective is to seek long-term capital appreciation by investing a substantial portion of its assets in securities of foreign issuers, “growth-type” companies, cyclical industries and special situations that are considered to have appreciation possibilities. The Fund’s investment adviser is OppenheimerFunds, Inc. (the “Manager”).
The Fund offers Non-Service, Service, Class 3 and Class 4 shares. All classes are sold at their offering price, which is the net asset value per share, to separate investment accounts of participating insurance companies as an underlying investment for variable life insurance policies, variable annuity contracts or other investment products. The classes of shares being designated as Service shares and Class 4 shares are subject to a distribution and service plan. All classes of shares have identical rights and voting privileges with respect to the Fund in general and exclusive voting rights on matters that affect that class alone. Earnings, net assets and net asset value per share may differ due to each class having its own expenses, such as transfer and shareholder servicing agent fees and shareholder communications, directly attributable to that class. The Fund assesses a 1% fee on the proceeds of Class 3 and Class 4 shares that are redeemed (either by selling or exchanging to another Oppenheimer fund or other investment option offered through your variable life insurance or variable annuity contract) within 60 days of their purchase. The fee, which is retained by the Fund, is accounted for as an addition to paid-in capital.
The following is a summary of significant accounting policies consistently followed by the Fund.
Previous Annual Period. The last day of the Fund’s fiscal year was the last day the New York Stock Exchange was open for trading. The Fund’s financial statements have been presented through that date to maintain consistency with the Fund’s net asset value calculations used for shareholder transactions.
Investment in Oppenheimer Institutional Money Market Fund. The Fund is permitted to invest daily available cash balances in an affiliated money market fund. The Fund may invest the available cash in Class E shares of Oppenheimer Institutional Money Market Fund (“IMMF”) to seek current income while preserving liquidity. IMMF is a registered open-end management investment company, regulated as a money market fund under the Investment Company Act of 1940, as amended. The Manager is also the investment adviser of IMMF. When applicable, the Fund’s investment in IMMF is included in the Statement of Investments. Shares of IMMF are valued at their net asset value per share. As a shareholder, the Fund is subject to its proportional share of IMMF’s Class E expenses, including its management fee. The Manager will waive fees and/or reimburse Fund expenses in an amount equal to the indirect management fees incurred through the Fund’s investment in IMMF.
Foreign Currency Translation. The Fund’s accounting records are maintained in U.S. dollars. The values of securities denominated in foreign currencies and amounts related to the purchase and sale of foreign securities and foreign investment income are translated into U.S. dollars as of the close of the Exchange, normally 4:00 P.M. Eastern time, on each day the Exchange is open for trading. Foreign exchange rates may be valued primarily using a reliable bank, dealer or service authorized by the Board of Trustees.
Reported net realized gains and losses from foreign currency transactions arise from sales of portfolio securities, sales and maturities of short-term securities, sales of foreign currencies, exchange rate fluctuations between the trade and settlement dates on securities transactions, and the difference between the amounts of dividends, interest, and foreign withholding taxes recorded on the Fund’s books and the U.S. dollar equivalent of the amounts actually received or paid. Net unrealized appreciation and depreciation on the translation of assets and liabilities denominated in foreign currencies arise from changes in the values of assets and liabilities, including investments in securities at fiscal period end, resulting from changes in exchange rates.
The effect of changes in foreign currency exchange rates on investments is separately identified from the fluctuations arising from changes in market values of securities held and reported with all other foreign currency gains and losses in the Fund’s Statement of Operations.
Allocation of Income, Expenses, Gains and Losses. Income, expenses (other than those attributable to a specific class), gains and losses are allocated on a daily basis to each class of shares based upon the relative proportion of net assets represented by such class. Operating expenses directly attributable to a specific class are charged against the operations of that class.
Federal Taxes. The Fund intends to comply with provisions of the Internal Revenue Code applicable to regulated investment companies and to distribute substantially all of its investment company taxable income, including any net realized gain on investments not offset by capital loss carryforwards, if any, to shareholders. Therefore, no federal income or excise tax provision is required. The Fund files income tax returns in U.S. federal and applicable state jurisdictions. The statute of limitations on the Fund’s tax return filings generally remain open for the three preceding fiscal reporting period ends.
The tax components of capital shown in the following table represent distribution requirements the Fund must satisfy under the income tax regulations, losses the Fund may be able to offset against income and gains realized in future years and unrealized appreciation or depreciation of securities and other investments for federal income tax purposes.
| | | | |
| 17 | | | | OPPENHEIMER GLOBAL SECURITIES FUND/VA |
NOTES TO FINANCIAL STATEMENTS / Continued
1. Significant Accounting Policies (Continued)
| | | | | | | | | | | | |
Undistributed Net Investment
Income | | Undistributed
Long-Term
Gain | | | Accumulated
Loss
Carryforward1,2,3,4 | | | Net Unrealized
Appreciation
Based on cost of
Securities and
Other Investments
for Federal Income
Tax Purposes | |
| $35,648,892 | | $ | — | | | $ | 12,170,660 | | | $ | 822,724,454 | |
1. As of December 31, 2012, the Fund had $9,934,353 of net capital loss carryforwards available to offset future realized capital gains, if any, and thereby reduce future taxable gain distributions. Details of the capital loss carryforwards are included in the table below. Capital loss carryovers with no expiration, if any, must be utilized prior to those with expiration dates.
2. As of December 31, 2012, the Fund had $2,236,307 of post-October losses available to offset future realized capital gains, if any.
3. During the fiscal year ended December 31, 2012, the Fund utilized $9,221,730 of capital loss carryforward to offset capital gains realized in that fiscal year.
4. During the fiscal year ended December 30, 2011, the Fund did not utilize any capital loss carryforward.
Net investment income (loss) and net realized gain (loss) may differ for financial statement and tax purposes. The character of dividends and distributions made during the fiscal year from net investment income or net realized gains may differ from their ultimate characterization for federal income tax purposes. Also, due to timing of dividends and distributions, the fiscal year in which amounts are distributed may differ from the fiscal year in which the income or net realized gain was recorded by the Fund.
Accordingly, the following amounts have been reclassified for December 31, 2012. Net assets of the Fund were unaffected by the reclassifications.
| | | | |
Increase to Accumulated Net Investment Income | | Increase to
Accumulated
Net Realized
Loss on
Investments | |
| $6,202,870 | | $ | 6,202,870 | |
The tax character of distributions paid during the years ended December 31, 2012 and December 31, 2011 was as follows:
| | | | | | | | |
| | | Year Ended
December 31, 2012 | | | Year Ended
December 31, 2011 | |
Distributions paid from: | | | | | | | | |
| Ordinary income | | $ | 51,256,200 | | | $ | 31,858,513 | |
The aggregate cost of securities and other investments and the composition of unrealized appreciation and depreciation of securities and other investments for federal income tax purposes as of December 31, 2012 are noted in the following table. The primary difference between book and tax appreciation or depreciation of securities and other investments, if applicable, is attributable to the tax deferral of losses or tax realization of financial statement unrealized gain or loss.
| | | | |
| Federal tax cost of securities | | $ | 1,807,156,502 | |
| Federal tax cost of other investments | | | (1,877) | |
| | |
|
|
|
| Total federal tax cost | | $ | 1,807,154,625 | |
| | |
|
|
|
| Gross unrealized appreciation | | $ | 855,860,486 | |
| Gross unrealized depreciation | | | (33,136,032) | |
| | |
|
|
|
| Net unrealized appreciation | | $ | 822,724,454 | |
| | |
|
|
|
Trustees’ Compensation. The Board of Trustees has adopted a compensation deferral plan for independent trustees that enables trustees to elect to defer receipt of all or a portion of the annual compensation they are entitled to receive from the Fund. For purposes of determining the amount owed to the Trustee under the plan, deferred amounts are treated as though equal dollar amounts had been invested in shares of the Fund or in other Oppenheimer funds selected by the Trustee. The Fund purchases shares of the funds selected for deferral by the Trustee in amounts equal to his or her deemed investment, resulting in a Fund asset equal to the deferred compensation liability. Such assets are included as a component of “Other” within the asset section of the Statement of Assets and Liabilities. Deferral of trustees’ fees under the plan will not affect the net assets of the Fund, and will not materially affect the Fund’s assets, liabilities or net investment income per share. Amounts will be deferred until distributed in accordance with the compensation deferral plan.
Dividends and Distributions to Shareholders. Dividends and distributions to shareholders, which are determined in accordance with income tax regulations and may differ from U.S. generally accepted accounting principles, are recorded on the ex-dividend date. Income and capital gain distributions, if any, are declared and paid annually or at other times as deemed necessary by the Manager.
| | | | |
| 18 | | | | OPPENHEIMER GLOBAL SECURITIES FUND/VA |
NOTES TO FINANCIAL STATEMENTS / Continued
1. Significant Accounting Policies (Continued)
Investment Income. Dividend income is recorded on the ex-dividend date or upon ex-dividend notification in the case of certain foreign dividends where the ex-dividend date may have passed. Non-cash dividends included in dividend income, if any, are recorded at the fair market value of the securities received. Interest income is recognized on an accrual basis. Discount and premium, which are included in interest income on the Statement of Operations, are amortized or accreted daily.
Custodian Fees. “Custodian fees and expenses” in the Statement of Operations may include interest expense incurred by the Fund on any cash overdrafts of its custodian account during the period. Such cash overdrafts may result from the effects of failed trades in portfolio securities and from cash outflows resulting from unanticipated shareholder redemption activity. The Fund pays interest to its custodian on such cash overdrafts, to the extent they are not offset by positive cash balances maintained by the Fund, at a rate equal to the Federal Funds Rate plus 0.50%. The “Reduction to custodian expenses” line item, if applicable, represents earnings on cash balances maintained by the Fund during the period. Such interest expense and other custodian fees may be paid with these earnings.
Security Transactions. Security transactions are recorded on the trade date. Realized gains and losses on securities sold are determined on the basis of identified cost.
Indemnifications. The Fund’s organizational documents provide current and former trustees and officers with a limited indemnification against liabilities arising in connection with the performance of their duties to the Fund. In the normal course of business, the Fund may also enter into contracts that provide general indemnifications. The Fund’s maximum exposure under these arrangements is unknown as this would be dependent on future claims that may be made against the Fund. The risk of material loss from such claims is considered remote.
Other. The preparation of financial statements in conformity with accounting principles generally accepted in the United States of America requires management to make estimates and assumptions that affect the reported amounts of assets and liabilities and disclosure of contingent assets and liabilities at the date of the financial statements and the reported amounts of increases and decreases in net assets from operations during the reporting period. Actual results could differ from those estimates.
2. Securities Valuation
The Fund calculates the net asset value of its shares as of the close of the New York Stock Exchange (the “Exchange”), normally 4:00 P.M. Eastern time, on each day the Exchange is open for trading.
The Fund’s Board has adopted procedures for the valuation of the Fund’s securities and has delegated the day-to-day responsibility for valuation determinations under those procedures to the Manager. The Manager has established a Valuation Committee which is responsible for determining a “fair valuation” for any security for which market quotations are not “readily available.” The Valuation Committee’s fair valuation determinations are subject to review, approval and ratification by the Fund’s Board at its next regularly scheduled meeting covering the calendar quarter in which the fair valuation was determined.
Valuation Methods and Inputs
Securities are valued using unadjusted quoted market prices, when available, as supplied primarily by third party pricing services or dealers.
The following methodologies are used to determine the market value or the fair value of the types of securities described below:
Securities traded on a registered U.S. securities exchange (including exchange-traded derivatives other than futures and futures options) are valued based on the last sale price of the security reported on the principal exchange on which it is traded, prior to the time when the Fund’s assets are valued. In the absence of a sale, the security is valued at the last sale price on the prior trading day, if it is within the spread of the current day’s closing “bid” and “asked” prices, and if not, at the current day’s closing bid price. A security of a foreign issuer traded on a foreign exchange but not listed on a registered U.S. securities exchange is valued based on the last sale price on the principal exchange on which the security is traded, as identified by the third party pricing service used by the Manager, prior to the time when the Fund’s assets are valued. If the last sale price is unavailable, the security is valued at the most recent official closing price on the principal exchange on which it is traded. If the last sales price or official closing price for a foreign security is not available, the security is valued at the mean between the bid and asked price per the exchange or, if not available from the exchange, obtained from two dealers. If bid and asked prices are not available from either the exchange or two dealers, the security is valued by using one of the following methodologies (listed in order of priority); (1) using a bid from the exchange, (2) the mean between the bid and asked price as provided by a single dealer, or (3) a bid from a single dealer.
Shares of a registered investment company that are not traded on an exchange are valued at that investment company’s net asset value per share.
Corporate and government debt securities (of U.S. or foreign issuers) and municipal debt securities, event-linked bonds, loans, mortgage-backed securities, collateralized mortgage obligations, and asset-backed securities are valued at the mean between the “bid” and “asked” prices utilizing evaluated prices obtained from third party pricing services or broker-dealers who may use matrix pricing methods to determine the evaluated prices.
Short-term money market type debt securities with a remaining maturity of sixty days or less are valued at cost adjusted by the amortization of discount or premium to maturity (amortized cost), which approximates market value. Short-term debt securities with a remaining maturity in excess of sixty days are valued at the mean between the “bid” and “asked” prices utilizing evaluated prices obtained from third party pricing services or broker-dealers.
| | | | |
| 19 | | | | OPPENHEIMER GLOBAL SECURITIES FUND/VA |
NOTES TO FINANCIAL STATEMENTS / Continued
2. Securities Valuation (Continued)
Forward foreign currency exchange contracts are valued utilizing current and forward currency rates obtained from third party pricing services. When the settlement date of a contract is an interim date for which a quotation is not available, interpolated values are derived using the nearest dated forward currency rate.
A description of the standard inputs that may generally be considered by the third party pricing vendors in determining their evaluated prices is provided below.
| | |
| Security Type | | Standard inputs generally considered by third-party pricing vendors |
| Corporate debt, government debt, municipal, mortgage-backed and asset-backed securities | | Reported trade data, broker-dealer price quotations, benchmark yields, issuer spreads on comparable securities, the credit quality, yield, maturity, and other appropriate factors. |
| Loans | | Information obtained from market participants regarding reported trade data and broker-dealer price quotations. |
| Event-linked bonds | | Information obtained from market participants regarding reported trade data and broker-dealer price quotations. |
If a market value or price cannot be determined for a security using the methodologies described above, or if, in the “good faith” opinion of the Manager, the market value or price obtained does not constitute a “readily available market quotation,” or a significant event has occurred that would materially affect the value of the security the security is fair valued either (i) by a standardized fair valuation methodology applicable to the security type or the significant event as previously approved by the Valuation Committee and the Fund’s Board or (ii) as determined in good faith by the Manager’s Valuation Committee. The Valuation Committee considers all relevant facts that are reasonably available, through either public information or information available to the Manager, when determining the fair value of a security. Fair value determinations by the Manager are subject to review, approval and ratification by the Fund’s Board at its next regularly scheduled meeting covering the calendar quarter in which the fair valuation was determined. Those fair valuation standardized methodologies include, but are not limited to, valuing securities at the last sale price or initially at cost and subsequently adjusting the value based on: changes in company specific fundamentals, changes in an appropriate securities index, or changes in the value of similar securities which may be further adjusted for any discounts related to security-specific resale restrictions. When possible, such methodologies use observable market inputs such as unadjusted quoted prices of similar securities, observable interest rates, currency rates and yield curves. The methodologies used for valuing securities are not necessarily an indication of the risks associated with investing in those securities nor can it be assured that the Fund can obtain the fair value assigned to a security if it were to sell the security.
To assess the continuing appropriateness of security valuations, the Manager, or its third party service provider who is subject to oversight by the Manager, regularly compares prior day prices, prices on comparable securities, and sale prices to the current day prices and challenges those prices exceeding certain tolerance levels with the third party pricing service or broker source. For those securities valued by fair valuations, whether through a standardized fair valuation methodology or a fair valuation determination, the Valuation Committee reviews and affirms the reasonableness of the valuations based on such methodologies and fair valuation determinations on a regular basis after considering all relevant information that is reasonably available.
Classifications
Each investment asset or liability of the Fund is assigned a level at measurement date based on the significance and source of the inputs to its valuation. Various data inputs are used in determining the value of each of the Fund’s investments as of the reporting period end. These data inputs are categorized in the following hierarchy under applicable financial accounting standards:
1) Level 1-unadjusted quoted prices in active markets for identical assets or liabilities (including securities actively traded on a securities exchange)
2) Level 2-inputs other than unadjusted quoted prices that are observable for the asset or liability (such as unadjusted quoted prices for similar assets and market corroborated inputs such as interest rates, prepayment speeds, credit risks, etc.)
3) Level 3-significant unobservable inputs (including the Manager’s own judgments about assumptions that market participants would use in pricing the asset or liability).
The inputs used for valuing securities are not necessarily an indication of the risks associated with investing in those securities.
The table below categorizes amounts that are included in the Fund’s Statement of Assets and Liabilities as of December 31, 2012 based on valuation input level:
| | | | | | | | | | | | | | | | |
| | | Level 1—
Unadjusted
Quoted Prices | | | Level 2—
Other Significant
Observable Inputs | | | Level 3—
Significant
Unobservable
Inputs | | | Value | |
| Assets Table | | | | | | | | | | | | | | | | |
| Investments, at Value: | | | | | | | | | | | | | | | | |
Common Stocks | | | | | | | | | | | | | | | | |
Consumer Discretionary | | $ | 295,478,675 | | | $ | 200,338,191 | | | $ | — | | | $ | 495,816,866 | |
Consumer Staples | | | 158,503,029 | | | | 69,527,438 | | | | — | | | | 228,030,467 | |
Energy | | | 22,582,273 | | | | 81,063,850 | | | | — | | | | 103,646,123 | |
Financials | | | 193,624,492 | | | | 210,249,278 | | | | — | | | | 403,873,770 | |
| | | | |
| 20 | | | | OPPENHEIMER GLOBAL SECURITIES FUND/VA |
NOTES TO FINANCIAL STATEMENTS / Continued
2. Securities Valuation (Continued)
| | | | | | | | | | | | | | | | |
| | | Level 1—
Unadjusted
Quoted Prices | | | Level 2— Other Significant
Observable Inputs | | | Level 3—
Significant
Unobservable
Inputs | | | Value | |
| Assets Table (Continued) | | | | | | | | | | | | | | | | |
| Investments, at Value: | | | | | | | | | | | | | | | | |
| Common Stocks | | | | | | | | | | | | | | | | |
Health Care | | $ | 223,446,795 | | | $ | 33,139,429 | | | $ | — | | | $ | 256,586,224 | |
Industrials | | | 168,599,657 | | | | 175,188,359 | | | | — | | | | 343,788,016 | |
Information Technology | | | 517,598,755 | | | | 168,046,778 | | | | — | | | | 685,645,533 | |
Materials | | | 25,410,199 | | | | 8,373,778 | | | | — | | | | 33,783,977 | |
Telecommunication Services | | | — | | | | 33,699,960 | | | | — | | | | 33,699,960 | |
Utilities | | | — | | | | 13,911,396 | | | | — | | | | 13,911,396 | |
Rights, Warrants and Certificates | | | 574,240 | | | | — | | | | — | | | | 574,240 | |
| Investment Company | | | 30,612,139 | | | | — | | | | — | | | | 30,612,139 | |
| | |
|
|
| |
|
|
| |
|
|
| |
|
|
|
Total Assets | | $ | 1,636,430,254 | | | $ | 993,538,457 | | | $ | — | | | $ | 2,629,968,711 | |
| | |
|
|
| |
|
|
| |
|
|
| |
|
|
|
| Liabilities Table | | | | | | | | | | | | | | | | |
| Other Financial Instruments: | | | | | | | | | | | | | | | | |
| Foreign currency exchange contracts | | $ | — | | | $ | (1,877 | ) | | $ | — | | | $ | (1,877 | ) |
| | |
|
|
| |
|
|
| |
|
|
| |
|
|
|
| Total Liabilities | | $ | — | | | $ | (1,877 | ) | | $ | — | | | $ | (1,877 | ) |
| | |
|
|
| |
|
|
| |
|
|
| |
|
|
|
Currency contracts and forwards, if any, are reported at their unrealized appreciation/ depreciation at measurement date, which represents the change in the contract’s value from trade date. Futures, if any, are reported at their variation margin at measurement date, which represents the amount due to/from the Fund at that date. All additional assets and liabilities included in the above table are reported at their market value at measurement date.
There have been no significant changes to the fair valuation methodologies of the Fund during the period.
The table below shows the transfers between Level 1 and Level 2. The Fund’s policy is to recognize transfers in and out as of the beginning of the reporting period.
| | | | | | | | | | | | | | | | |
| | | Transfers into
Level 1* | | | Transfer out
of Level 1** | | | Transfers into
Level 2** | | | Transfers out
of Level 2* | |
| Assets Table | | | | | | | | | | | | | | | | |
| Investments, at Value: | | | | | | | | | | | | | | | | |
| Common Stocks | | | | | | | | | | | | | | | | |
Consumer Discretionary | | $ | 8,273,787 | | | $ | (81,637,843 | ) | | $ | 81,637,843 | | | $ | (8,273,787 | ) |
Consumer Staples | | | — | | | | (53,017,708 | ) | | | 53,017,708 | | | | — | |
Energy | | | — | | | | (28,057,704 | ) | | | 28,057,704 | | | | — | |
Financials | | | 28,945,218 | | | | (124,154,951 | ) | | | 124,154,951 | | | | — | |
Health Care | | | — | | | | (17,665,048 | ) | | | 17,665,048 | | | | (28,945,218 | ) |
Industrials | | | — | | | | (77,394,146 | ) | | | 77,394,146 | | | | — | |
Information Technology | | | — | | | | (86,148,922 | ) | | | 86,148,922 | | | | — | |
Telecommunication Services | | | — | | | | (31,261,466 | ) | | | 31,261,466 | | | | — | |
| | |
|
|
| |
|
|
| |
|
|
| |
|
|
|
| Total Assets | | $ | 37,219,005 | | | $ | (499,337,788 | ) | | $ | 499,337,788 | | | $ | (37,219,005 | ) |
| | |
|
|
| |
|
|
| |
|
|
| |
|
|
|
* Transferred from Level 2 to Level 1 due to the presence of a readily available unadjusted quoted market price.
** Transferred from Level 1 to Level 2 because of the absence of a readily available unadjusted quoted market price due to a significant event occurring before the Fund’s assets were valued but after the close of the securities’ respective exchanges.
3. Shares of Beneficial Interest
The Fund has authorized an unlimited number of $0.001 par value shares of beneficial interest of each class. Transactions in shares of beneficial interest were as follows:
| | | | | | | | | | | | | | | | |
| | | Year Ended December 31, 2012 | | | Year Ended December 30, 2011 | |
| | | Shares | | | Amount | | | Shares | | | Amount | |
| Non-Service Shares | | | | | | | | | | | | | | | | |
| Sold | | | 2,022,136 | | | $ | 59,619,398 | | | | 2,898,558 | | | $ | 85,697,523 | |
| Dividends and/or distributions reinvested | | | 923,150 | | | | 25,848,197 | | | | 544,183 | | | | 17,234,287 | |
| Redeemed | | | (6,899,218 | ) | | | (205,929,783 | ) | | | (7,582,244 | ) | | | (227,714,727 | ) |
| | |
|
|
| |
|
|
| |
|
|
| |
|
|
|
| Net decrease | | | (3,953,932 | ) | | $ | (120,462,188 | ) | | | (4,139,503 | ) | | $ | (124,782,917 | ) |
| | |
|
|
| |
|
|
| |
|
|
| |
|
|
|
| | | | | | | | | | | | | | | | | |
| Service Shares | | | | | | | | | | | | | | | | |
| Sold | | | 3,066,046 | | | $ | 88,602,553 | | | | 5,113,489 | | | $ | 150,060,254 | |
| Dividends and/or distributions reinvested | | | 742,178 | | | | 20,625,132 | | | | 361,125 | | | | 11,357,368 | |
| Redeemed | | | (5,645,732 | ) | | | (166,844,070 | ) | | | (5,264,551 | ) | | | (156,264,287 | ) |
| | |
|
|
| |
|
|
| |
|
|
| |
|
|
|
| Net increase (decrease) | | | (1,837,508 | ) | | $ | (57,616,385 | ) | | | 210,063 | | | $ | 5,153,335 | |
| | |
|
|
| |
|
|
| |
|
|
| |
|
|
|
| | | | |
| 21 | | | | OPPENHEIMER GLOBAL SECURITIES FUND/VA |
NOTES TO FINANCIAL STATEMENTS / Continued
3. Shares of Beneficial Interest
| | | | | | | | | | | | | | | | |
| | | Year Ended December 31, 2012 | �� | | Year Ended December 30, 2011 | |
| | | Shares | | | Amount | | | Shares | | | Amount | |
| Class 3 Shares | | | | | | | | | | | | | | | | |
| Sold | | | 174,260 | | | $ | 5,155,447 | | | | 210,150 | | | $ | 6,434,653 | |
| Dividends and/or distributions reinvested | | | 122,145 | | | | 3,444,499 | | | | 76,748 | | | | 2,447,497 | |
| Redeemed | | | (1,004,527 | ) | | | (30,086,839 | )1 | | | (1,203,693 | ) | | | (36,250,505 | )2 |
| | |
|
|
| |
|
|
| |
|
|
| |
|
|
|
| Net decrease | | | (708,122 | ) | | $ | (21,486,893 | ) | | | (916,795 | ) | | $ | (27,368,355 | ) |
| | |
|
|
| |
|
|
| |
|
|
| |
|
|
|
| | | | | | | | | | | | | |
| Class 4 Shares | | | | | | | | | | | | | | | | |
| Sold | | | 242,463 | | | $ | 7,528,786 | | | | 153,872 | | | $ | 4,648,188 | |
| Dividends and/or distributions reinvested | | | 48,074 | | | | 1,338,372 | | | | 26,011 | | | | 819,361 | |
| Redeemed | | | (469,722 | ) | | | (13,722,649 | )1 | | | (389,690 | ) | | | (11,451,926 | )2 |
| | |
|
|
| |
|
|
| |
|
|
| |
|
|
|
| Net decrease | | | (179,185 | ) | | $ | (4,855,491 | ) | | | (209,807 | ) | | $ | (5,984,377 | ) |
| | |
|
|
| |
|
|
| |
|
|
| |
|
|
|
1. Net of redemption fees of $7,643 and $1,566 for Class 3 and Class 4, respectively.
2. Net of redemption fees of $1,073 and $1,794 for Class 3 and Class 4, respectively.
4. Purchases and sales of Securities
The aggregate cost of purchases and proceeds from sales of securities, other than short-term obligations and investments in IMMF, for the year ended December 31, 2012, were as follows:
| | | | | | | | |
| | | Purchases | | | Sales | |
| Investment securities | | $ | 340,156,668 | | | $ | 544,526,264 | |
5. Fees and Other Transactions with Affiliates
Management Fees. Under the investment advisory agreement, the Fund pays the Manager a management fee based on the daily net assets of the Fund at an annual rate as shown in the following table:
| | | | |
Fee Schedule
| |
| |
| Up to $200 million | | | 0.75 | % |
| Next $200 million | | | 0.72 | |
| Next $200 million | | | 0.69 | |
| Next $200 million | | | 0.66 | |
| Over $800 million | | | 0.60 | |
Administrative Service Fees. The Fund pays the Manager a fee of $1,500 per year for preparing and filing the Fund’s tax returns.
Transfer Agent Fees. OppenheimerFunds Services (“OFS”), a division of the Manager, acts as the transfer and shareholder servicing agent for the Fund. For the year ended December 31, 2012, the Fund paid $2,489,387 to OFS for services to the Fund.
Distribution and Service Plan for Service Shares and Class 4 Shares. The Fund has adopted a Distribution and Service Plan (the “Plan”) in accordance with Rule 12b-1 under the Investment Company Act of 1940 for Service shares and Class 4 shares to pay OppenheimerFunds Distributor, Inc. (the “Distributor”), for distribution related services, personal service and account maintenance for the Fund’s Service shares and Class 4 shares. Under the Plan, payments are made periodically at an annual rate of 0.25% of the daily net assets of Service shares and Class 4 shares of the Fund. The Distributor currently uses all of those fees to compensate sponsors of the insurance product that offers Fund shares, for providing personal service and maintenance of accounts of their variable contract owners that hold Service shares and Class 4 shares. These fees are paid out of the Fund’s assets on an on-going basis and increase operating expenses of the Service shares and Class 4 shares, which results in lower performance compared to the Fund’s shares that are not subject to a service fee. Fees incurred by the Fund under the Plan are detailed in the Statement of Operations.
Waivers and Reimbursements of Expenses. The Manager has voluntarily agreed to limit the Fund’s expenses after payments, waivers and/or reimbursements and reduction to custodian expenses, excluding expenses incurred directly or indirectly by the Fund as a result of investments in other investment companies, wholly-owned subsidiaries and pooled investment vehicles; so that those expenses, as percentages of daily net assets, will not exceed the annual rate of 1.00% for Non-Service and Class 3 shares and 1.25% for Service and Class 4 shares.
The Manager will waive fees and/or reimburse Fund expenses in an amount equal to the indirect management fees incurred through the Fund’s investment in IMMF. During the year ended December 31, 2012, the Manager waived fees and/or reimbursed the Fund $26,084 for IMMF management fees.
Some of these undertakings may be modified or terminated at any time; some may not be modified or terminated until after one year from the date of the current prospectus, as indicated therein.
| | | | |
| 22 | | | | OPPENHEIMER GLOBAL SECURITIES FUND/VA |
NOTES TO FINANCIAL STATEMENTS / Continued
6. Risk Exposures and the Use of Derivative Instruments
The Fund’s investment objectives not only permit the Fund to purchase investment securities, they also allow the Fund to enter into various types of derivatives contracts, including, but not limited to, futures contracts, forward foreign currency exchange contracts, credit default swaps, interest rate swaps, total return swaps, and purchased and written options. In doing so, the Fund will employ strategies in differing combinations to permit it to increase, decrease, or change the level or types of exposure to market risk factors. Central to those strategies are features inherent to derivatives that make them more attractive for this purpose than equity and debt securities: they require little or no initial cash investment, they can focus exposure on only certain selected risk factors, and they may not require the ultimate receipt or delivery of the underlying security (or securities) to the contract. This may allow the Fund to pursue its objectives more quickly and efficiently than if it were to make direct purchases or sales of securities capable of effecting a similar response to market factors.
Market Risk Factors. In accordance with its investment objectives, the Fund may use derivatives to increase or decrease its exposure to one or more of the following market risk factors:
Commodity Risk. Commodity risk relates to the change in value of commodities or commodity indexes as they relate to increases or decreases in the commodities market. Commodities are physical assets that have tangible properties. Examples of these types of assets are crude oil, heating oil, metals, livestock, and agricultural products.
Credit Risk. Credit risk relates to the ability of the issuer to meet interest and principal payments, or both, as they come due. In general, lower-grade, higher-yield bonds are subject to credit risk to a greater extent than lower-yield, higher-quality bonds.
Equity Risk. Equity risk relates to the change in value of equity securities as they relate to increases or decreases in the general market.
Foreign Exchange Rate Risk. Foreign exchange rate risk relates to the change in the U.S. dollar value of a security held that is denominated in a foreign currency. The U.S. dollar value of a foreign currency denominated security will decrease as the dollar appreciates against the currency, while the U.S. dollar value will increase as the dollar depreciates against the currency.
Interest Rate Risk. Interest rate risk refers to the fluctuations in value of fixed-income securities resulting from the inverse relationship between price and yield. For example, an increase in general interest rates will tend to reduce the market value of already issued fixed-income investments, and a decline in general interest rates will tend to increase their value. In addition, debt securities with longer maturities, which tend to have higher yields, are subject to potentially greater fluctuations in value from changes in interest rates than obligations with shorter maturities.
Volatility Risk. Volatility risk refers to the magnitude of the movement, but not the direction of the movement, in a financial instrument’s price over a defined time period. Large increases or decreases in a financial instrument’s price over a relative time period typically indicate greater volatility risk, while small increases or decreases in its price typically indicate lower volatility risk.
The Fund’s actual exposures to these market risk factors during the period are discussed in further detail, by derivative type, below.
Risks of Investing in Derivatives. The Fund’s use of derivatives can result in losses due to unanticipated changes in the market risk factors and the overall market. In instances where the Fund is using derivatives to decrease, or hedge, exposures to market risk factors for securities held by the Fund, there are also risks that those derivatives may not perform as expected resulting in losses for the combined or hedged positions.
Derivatives may have little or no initial cash investment relative to their market value exposure and therefore can produce significant gains or losses in excess of their cost. This use of embedded leverage allows the Fund to increase its market value exposure relative to its net assets and can substantially increase the volatility of the Fund’s performance.
Additional associated risks from investing in derivatives also exist and potentially could have significant effects on the valuation of the derivative and the Fund. Typically, the associated risks are not the risks that the Fund is attempting to increase or decrease exposure to, per its investment objectives, but are the additional risks from investing in derivatives. Examples of these associated risks are liquidity risk, which is the risk that the Fund will not be able to sell the derivative in the open market in a timely manner, and counterparty credit risk, which is the risk that the counterparty will not fulfill its obligation to the Fund. Associated risks can be different for each type of derivative and are discussed by each derivative type in the notes that follow.
Counterparty Credit Risk. Certain derivative positions are subject to counterparty credit risk, which is the risk that the counterparty will not fulfill its obligation to the Fund. The Fund’s derivative counterparties are financial institutions who are subject to market conditions that may weaken their financial position. The Fund intends to enter into financial transactions with counterparties that the Manager believes to be creditworthy at the time of the transaction.
Credit Related Contingent Features. The Fund’s agreements with derivative counterparties have several credit related contingent features that if triggered would allow its derivatives counterparties to close out and demand payment or additional collateral to cover their exposure from the Fund. Credit related contingent features are established between the Fund and its derivatives counterparties to reduce the risk that the Fund will not fulfill its payment obligations to its counterparties. These triggering features include, but are not limited to, a percentage decrease in the Fund’s net assets and or a percentage decrease in the Fund’s Net Asset Value or NAV. The contingent features are established within the Fund’s International Swap and Derivatives Association, Inc. master agreements which govern certain positions in swaps, over-the-counter options and swaptions, and forward currency exchange contracts for each individual counterparty.
| | | | |
| 23 | | | | OPPENHEIMER GLOBAL SECURITIES FUND/VA |
NOTES TO FINANCIAL STATEMENTS / Continued
6. Risk Exposures and the Use of Derivative Instruments (Continued)
Valuations of derivative instruments as of December 31, 2012 are as follows:
| | | | | | | | | | |
| | | Liability Derivatives
| | | |
Derivatives Not
Accounted for as
Hedging Instruments | | Statement of Assets
and Liabilities Location | | Value | | | | | |
| Foreign exchange contracts | | Unrealized depreciation on foreign currency exchange contracts | | | $1,877 | | | | | |
The effect of derivative instruments on the Statement of Operations is as follows:
| | | | |
| Amount of Realized Gain or (Loss) Recognized on Derivatives | |
Derivatives Not Accounted
for as Hedging Instruments | | Foreign currency
transactions | |
| Foreign exchange contracts | | | $28,515 | |
| | | | |
| Amount of Change in Unrealized Gain or (Loss) Recognized on Derivatives | |
Derivatives Not Accounted
for as Hedging Instruments | | Translation of assets and liabilities
denominated in foreign currencies | |
| Foreign exchange contracts | | | $(1,877 | ) |
Foreign Currency Exchange Contracts
The Fund may enter into foreign currency exchange contracts (“forward contracts”) for the purchase or sale of a foreign currency at a negotiated rate at a future date.
Forward contracts are reported on a schedule following the Statement of Investments. The unrealized appreciation (depreciation) is reported in the Statement of Assets and Liabilities as a receivable or payable and in the Statement of Operations within the change in unrealized appreciation (depreciation). At contract close, the difference between the original cost of the contract and the value at the close date is recorded as a realized gain (loss) in the Statement of Operations.
The Fund has purchased and sold certain forward foreign currency exchange contracts of different currencies in order to acquire currencies to pay for or sell currencies to acquire related foreign securities purchase and sale transactions, respectively, or to convert foreign currencies to U.S. dollars from related foreign securities transactions. These foreign currency exchange contracts are negotiated at the current spot exchange rate with settlement typically within two business days thereafter.
During the year ended December 31, 2012, the Fund had daily average contract amounts on forward foreign currency contracts to buy and sell of $1,435,163 and $2,833,446, respectively.
Additional associated risk to the Fund includes counterparty credit risk. Counterparty credit risk arises from the possibility that the counterparty will default.
7. Subsequent Event
The Board of Trustees of the Fund recently approved a series of modifications to the Fund’s investment advisory and transfer agency arrangements in connection with internal corporate restructuring efforts at OppenheimerFunds, Inc. (“OFI”). As a result of these modifications, on January 1, 2013 (the “Effective Date”), OFI Global Asset Management, Inc. (“OFI Global”), a wholly-owned subsidiary of OFI, became the investment adviser and transfer agent to the Fund under the terms of the Fund’s advisory agreement and transfer agency agreement, respectively. OFI Global, in turn, entered into a new sub-advisory agreement for the Fund, on the Effective Date, whereby OFI Global will have oversight and supervisory responsibilities and OFI will choose the Fund’s investments and provide related advisory services to the Fund. In addition, on the Effective Date, OFI Global entered into a sub-transfer agency agreement with Shareholder Services, Inc. doing business as OppenheimerFunds Services, a wholly-owned subsidiary of OFI, under which it will be responsible for providing transfer agency services to the Fund.
The realignment of advisory service responsibility between OFI Global and OFI did not result in any change in the persons managing the assets of the Fund, the level or nature of the advisory services provided to the Fund, or the fees charged to the Fund.
8. Pending Litigation
Since 2009, a number of class action lawsuits have been pending in federal courts against OppenheimerFunds, Inc., the Fund’s Adviser through December 31, 2012 and Sub-Adviser effective January 1, 2013 (the “Manager”), OppenheimerFunds Distributor, Inc., the Fund’s principal underwriter and distributor (the “Distributor”), and certain funds (but not including the Fund) advised by the Manager and distributed by the Distributor (the “Defendant Funds”). Several of these lawsuits also name as defendants certain officers and current and former trustees of the respective Defendant Funds. The lawsuits raise claims under federal securities law and allege, among other things, that the disclosure documents of the respective Defendant Funds contained misrepresentations and omissions and that the respective Defendant Funds’ investment policies were not followed. The plaintiffs in these actions seek unspecified damages, equitable relief and awards of attorneys’ fees and litigation expenses. The Defendant Funds’ Boards of Trustees have also engaged counsel to represent the Funds and the present and former Independent Trustees named in those suits.
Other class action and individual lawsuits have been filed since 2008 in various state and federal courts against the Manager and certain of its affiliates by investors seeking to recover investments they allegedly lost as a result of the “Ponzi” scheme run by Bernard L. Madoff and his firm, Bernard L. Madoff
| | | | |
| 24 | | | | OPPENHEIMER GLOBAL SECURITIES FUND/VA |
NOTES TO FINANCIAL STATEMENTS / Continued
Investment Securities, LLC (“BLMIS”). Plaintiffs in these suits allege that they suffered losses as a result of their investments in several funds managed by an affiliate of the Manager and assert a variety of claims, including breach of fiduciary duty, fraud, negligent misrepresentation, unjust enrichment, and violation of federal and state securities laws and regulations, among others. They seek unspecified damages, equitable relief and awards of attorneys’ fees and litigation expenses. Neither the Distributor, nor any of the Oppenheimer mutual funds, their independent trustees or directors are named as defendants in these lawsuits. None of the Oppenheimer mutual funds invested in any funds or accounts managed by Madoff or BLMIS. On February 28, 2011, a stipulation of partial settlement of three groups of consolidated putative class action lawsuits relating to these matters was filed in the U.S. District Court for the Southern District of New York. On August 19, 2011, the court entered an order and final judgment approving the settlement as fair, reasonable and adequate. In September 2011, certain parties filed notices of appeal from the court’s order approving the settlement. The settlement does not resolve other outstanding lawsuits against the Manager and its affiliates relating to BLMIS.
On April 16, 2010, a lawsuit was filed in New York state court against the Manager, an affiliate of the Manager and AAArdvark IV Funding Limited (“AAArdvark IV”), an entity advised by the Manager’s affiliate, in connection with investments made by the plaintiffs in AAArdvark IV. Plaintiffs allege breach of contract against the defendants and seek compensatory damages, costs and disbursements, including attorney fees. On July 15, 2011, a lawsuit was filed in New York state court against the Manager, an affiliate of the Manager and AAArdvark Funding Limited (“AAArdvark I”), an entity advised by the Manager’s affiliate, in connection with investments made by the plaintiffs in AAArdvark I. The complaint alleges breach of contract against the defendants and seeks compensatory damages, costs and disbursements, including attorney fees. On November 9, 2011, a lawsuit was filed in New York state court against the Manager, an affiliate of the Manager and AAArdvark XS Funding Limited (“AAArdvark XS”), an entity advised by the Manager’s affiliate, in connection with investments made by the plaintiffs in AAArdvark XS. The complaint alleges breach of contract against the defendants and seeks compensatory damages, costs and disbursements, including attorney fees.
The Manager believes the lawsuits and appeals described above are without legal merit and, with the exception of actions it has settled, is defending against them vigorously. While it is premature to render any opinion as to the outcome in these lawsuits, or whether any costs that the Defendant Funds may bear in defending the suits might not be reimbursed by insurance, the Manager believes that these suits should not impair the ability of the Manager or the Distributor to perform their respective duties to the Fund, and that the outcome of all of the suits together should not have any material effect on the operations of any of the Oppenheimer mutual funds.
| | | | |
| 25 | | | | OPPENHEIMER GLOBAL SECURITIES FUND/VA |
REPORT OF INDEPENDENT REGISTERED PUBLIC ACCOUNTING FIRM
The Board of Trustees and Shareholders of Oppenheimer Variable Account Funds:
We have audited the accompanying statement of assets and liabilities of Oppenheimer Global Securities Fund/VA (a separate series of Oppenheimer Variable Account Funds), including the statement of investments, as of December 31, 2012, and the related statement of operations for the year then ended, the statements of changes in net assets for each of the years in the two-year period then ended and the financial highlights for each of the years in the four-year period then ended. These financial statements and financial highlights are the responsibility of the Fund’s management. Our responsibility is to express an opinion on these financial statements and financial highlights based on our audits. The accompanying financial highlights of Oppenheimer Global Securities Fund/VA for the year ended December 31, 2008 were audited by other auditors whose report dated February 11, 2009 expressed an unqualified opinion on those financial highlights.
We conducted our audits in accordance with the standards of the Public Company Accounting Oversight Board (United States). Those standards require that we plan and perform the audit to obtain reasonable assurance about whether the financial statements and financial highlights are free of material misstatement. An audit includes examining, on a test basis, evidence supporting the amounts and disclosures in the financial statements. Our procedures included confirmation of securities owned as of December 31, 2012, by correspondence with the custodian and transfer agent. An audit also includes assessing the accounting principles used and significant estimates made by management, as well as evaluating the overall financial statement presentation. We believe that our audits provide a reasonable basis for our opinion.
In our opinion, the financial statements and financial highlights referred to above present fairly, in all material respects, the financial position of Oppenheimer Global Securities Fund/VA as of December 31, 2012, the results of its operations for the year then ended, the changes in its net assets for each of the years in the two-year period then ended and the financial highlights for each of the years in the four-year period then ended, in conformity with U.S. generally accepted accounting principles.
KPMGLLP
Denver, Colorado
February 19, 2013
| | | | |
| 26 | | | | OPPENHEIMER GLOBAL SECURITIES FUND/VA |
FEDERAL INCOME TAX INFORMATION Unaudited
In early 2013, if applicable, shareholders of record received information regarding all dividends and distributions paid to them by the Fund during calendar year 2012.
Dividends, if any, paid by the Fund during the fiscal year ended December 31, 2012 which are not designated as capital gain distributions should be multiplied by the maximum amount allowable but not less than 39.88% to arrive at the amount eligible for the corporate dividend-received deduction.
The Fund has elected the application of Section 853 of the Internal Revenue Code to permit shareholders to take a federal income tax credit or deduction, at their option, on a per share basis. The maximum amount allowable but not less than $3,001,364 of foreign income taxes were paid by the Fund during the fiscal year ended December 31, 2012. A separate notice will be mailed to each shareholder, which will reflect the proportionate share of such foreign taxes which must be treated by shareholders as gross income for federal income tax purposes.
Gross income of the maximum amount allowable but not less than $30,082,001 was derived from sources within foreign countries or possessions of the United States.
The foregoing information is presented to assist shareholders in reporting distributions received from the Fund to the Internal Revenue Service. Because of the complexity of the federal regulations which may affect your individual tax return and the many variations in state and local tax regulations, we recommend that you consult your tax advisor for specific guidance.
| | | | |
| 27 | | | | OPPENHEIMER GLOBAL SECURITIES FUND/VA |
BOARD APPROVAL OF THE FUND’S INVESTMENT ADVISORY AGREEMENT Unaudited
Each year, the Board of Trustees (the “Board”), including a majority of the independent Trustees, is required to determine whether to renew the Fund’s investment advisory agreement (the “Agreement”). The Investment Company Act of 1940, as amended, requires that the Board request and evaluate, and that the Manager provide, such information as may be reasonably necessary to evaluate the terms of the Agreement. The Board employs an independent consultant to prepare a report that provides information, including comparative information that the Board requests for that purpose. In addition to in-person meetings focused on this evaluation, the Board receives information throughout the year regarding Fund services, fees, expenses and performance.
The Manager and the independent consultant provided information to the Board on the following factors: (i) the nature, quality and extent of the Manager’s services, (ii) the investment performance of the Fund and the Manager, (iii) the fees and expenses of the Fund, including comparative expense information, (iv) the profitability of the Manager and its affiliates, including an analysis of the cost of providing services, (v) whether economies of scale are realized as the Fund grows and whether fee levels reflect these economies of scale for Fund investors and (vi) other benefits to the Manager from its relationship with the Fund. The Board was aware that there are alternatives to retaining the Manager.
Outlined below is a summary of the principal information considered by the Board as well as the Board’s conclusions.
Nature, Quality and Extent of Services. The Board considered information about the nature, quality and extent of the services provided to the Fund and information regarding the Manager’s key personnel who provide such services. The Manager’s duties include providing the Fund with the services of the portfolio manager and the Manager’s investment team, who provide research, analysis and other advisory services in regard to the Fund’s investments; securities trading services; oversight of third-party service providers; monitoring compliance with applicable Fund policies and procedures and adherence to the Fund’s investment restrictions; and risk management. The Manager is responsible for providing certain administrative services to the Fund as well. Those services include providing and supervising all administrative and clerical personnel who are necessary in order to provide effective corporate administration for the Fund; compiling and maintaining records with respect to the Fund’s operations; preparing and filing reports required by the Securities and Exchange Commission; preparing periodic reports regarding the operations of the Fund for its shareholders; preparing proxy materials for shareholder meetings; and preparing the registration statements required by Federal and state securities laws for the sale of the Fund’s shares. The Manager also provides the Fund with office space, facilities and equipment.
The Board also considered the quality of the services provided and the quality of the Manager’s resources that are available to the Fund. The Board took account of the fact that the Manager has had over fifty years of experience as an investment adviser and that its assets under management rank it among the top mutual fund managers in the United States. The Board evaluated the Manager’s advisory, administrative, accounting, legal, compliance services and risk management, and information the Board has received regarding the experience and professional qualifications of the Manager’s key personnel and the size and functions of its staff. In its evaluation of the quality of the portfolio management services provided, the Board considered the experience of Rajeev Bhaman, the portfolio manager for the Fund, and the Manager’s investment team and analysts. The Board members also considered the totality of their experiences with the Manager as directors or trustees of the Fund and other funds advised by the Manager. The Board considered information regarding the quality of services provided by affiliates of the Manager, which its members have become knowledgeable about in connection with the renewal of the Fund’s service agreements. The Board concluded, in light of the Manager’s experience, reputation, personnel, operations and resources that the Fund benefits from the services provided under the Agreement.
Investment Performance of the Manager and the Fund. Throughout the year, the Manager provided information on the investment performance of the Fund, including comparative performance information. The Board also reviewed information, prepared by the Manager and by the independent consultant, comparing the Fund’s historical performance to relevant market indices and to the performance of other global core funds underlying variable insurance products. The Board considered that the Fund outperformed its performance universe median during the three-, five- and ten year periods but slightly underperformed its performance universe median during the one-year period.
Costs of Services by the Manager. The Board reviewed the fees paid to the Manager and the other expenses borne by the Fund. The Board also considered the comparability of the fees charged and the services provided to the Fund to the fees and services for other clients or accounts advised by the Manager. The independent consultant provided comparative data in regard to the fees and expenses of the Fund and other global core funds underlying variable insurance products. In reviewing the fees and expenses charged to the VA funds, the Board considered the Manager’s assertion that, because there is much greater disparity in the fees and services that may be provided by a manager to a VA fund as opposed to a retail fund, when comparing the expenses of the various VA funds to those of retail funds, it is most appropriate to focus on total expenses (rather than on the management fees). Accordingly, while the Board reviewed and considered all expenses, it focused on total expenses. The Board also considered that the Fund’s total expenses were equal to its expense group median but slightly higher than its expense group average. The Board also considered that the Fund’s actual management fees were lower than its expense group median and average. The Manager has voluntarily agreed to waive fees and/or reimburse the Fund for certain expenses in order to limit total annual fund operating expenses after any fee waiver and/or expense reimbursement (excluding (i) interest, taxes, dividends tied to short sales, brokerage commissions, and other expenditures which are capitalized in accordance with generally accepted accounting principles; (ii) expenses incurred directly or indirectly by the Fund as a result of investments in other investment companies, wholly-owned subsidiaries and pooled investment vehicles; (iii) certain other expenses attributable to, and incurred as a result of, a Fund’s investments; and (iv) other extraordinary expenses (including litigation expenses) not incurred in the ordinary course of the Fund’s business) to annual rates of 1.00% for Non-Service and Class 3 shares and 1.25% for Service and Class 4 shares. This voluntary expense limitation may be amended or withdrawn at any time without prior notice to shareholders.
Economies of Scale and Profits Realized by the Manager. The Board considered information regarding the Manager’s costs in serving as the Fund’s investment adviser, including the costs associated with the personnel and systems necessary to manage the Fund, and information regarding the Manager’s profitability from its relationship with the Fund. The Board reviewed whether the Manager may realize economies of scale in managing and supporting the Fund. The Board noted that the Fund currently has management fee breakpoints, which are intended to share with Fund shareholders economies of scale that may exist as the Fund’s assets grow.
| | | | |
| 28 | | | | OPPENHEIMER GLOBAL SECURITIES FUND/VA |
Other Benefits to the Manager. In addition to considering the profits realized by the Manager, the Board considered information that was provided regarding the direct and indirect benefits the Manager receives as a result of its relationship with the Fund, including compensation paid to the Manager’s affiliates and research provided to the Manager in connection with permissible brokerage arrangements (soft dollar arrangements). The Board also considered that the Manager must be able to pay and retain experienced professional personnel at competitive rates to provide quality services to the Fund.
Conclusions. These factors were also considered by the independent Trustees meeting separately from the full Board, assisted by experienced counsel to the Fund and to the independent Trustees. Fund counsel and the independent Trustees’ counsel are independent of the Manager within the meaning and intent of the Securities and Exchange Commission Rules.
Based on its review of the information it received and its evaluations described above, the Board, including a majority of the independent Trustees, decided to continue the Agreement. In addition, the Board, including a majority of the Independent Trustees, approved the restructuring of the Fund’s investment advisory arrangement so that effective January 1, 2013, (i) OFI Global Asset Management, Inc. (“OFI Global”), a wholly owned subsidiary of the Manager, will serve as the investment adviser to the Fund in place of the Manager under a Restated Advisory Agreement (“Restated Advisory Agreement”), and (ii) OFI Global will enter into a Sub-Advisory Agreement (“Sub-Advisory Agreement”) with the Manager to provide investment sub-advisory services to the Fund. OFI Global will pay the Manager a percentage of the net investment advisory fee (after all applicable waivers have been deducted) that it receives from the Fund. The Agreement will continue until earlier of August 31, 2013 or the effective date of the Restated Advisory Agreement between the Fund and OFI Global. The Restated Advisory Agreement and Sub-Advisory Agreement will continue until August 31, 2013.
In arriving at its decisions, the Board did not single out any factor or factors as being more important than others, but considered all of the above information, and considered the terms and conditions of the Agreement, Restated Advisory Agreement and Sub-Advisory Agreement, including the management fees, in light of all the surrounding circumstances.
| | | | |
| 29 | | | | OPPENHEIMER GLOBAL SECURITIES FUND/VA |
PORTFOLIO PROXY VOTING POLICIES AND PROCEDURES; UPDATES TO STATEMENTS OF INVESTMENTS Unaudited
The Fund has adopted Portfolio Proxy Voting Policies and Procedures under which the Fund votes proxies relating to securities (“portfolio proxies”) held by the Fund. A description of the Fund’s Portfolio Proxy Voting Policies and Procedures is available (i) without charge, upon request, by calling the Fund toll-free at 1.800.525.7048, (ii) on the Fund’s website at oppenheimerfunds.com, and (iii) on the SEC’s website at www.sec.gov. In addition, the Fund is required to file Form N-PX, with its complete proxy voting record for the 12 months ended June 30th, no later than August 31st of each year. The Fund’s voting record is available (i) without charge, upon request, by calling the Fund toll-free at 1.800.525.7048, and (ii) in the Form N-PX filing on the SEC’s website at www.sec.gov.
The Fund files its complete schedule of portfolio holdings with the SEC for the first quarter and the third quarter of each fiscal year on Form N-Q. The Fund’s Form N-Q filings are available on the SEC’s website at www.sec.gov. Those forms may be reviewed and copied at the SEC’s Public Reference Room in Washington, D.C. Information on the operation of the Public Reference Room may be obtained by calling 1-800-SEC-0330.
| | | | |
| 30 | | | | OPPENHEIMER GLOBAL SECURITIES FUND/VA |
TRUSTEES AND OFFICERS BIOS Unaudited
| | |
| Name, Position(s) Held with the Fund, Length of Service, Age | | Principal Occupation(s) During the Past 5 Years; Other Trusteeships/Directorships Held; Number of Portfolios in the Fund Complex Currently Overseen |
| |
| INDEPENDENT TRUSTEES | | The address of each Trustee in the chart below is 6803 S. Tucson Way, Centennial, Colorado 80112-3924. Each Trustee serves for an indefinite term, or until his or her resignation, retirement, death or removal |
| |
Sam Freedman, Chairman of the Board of Trustees (since 2012) and Trustee (since 1996) Age: 72 | | Director of Colorado UpLIFT (charitable organization) (since September 1984). Mr. Freedman held several positions with the Sub-Adviser and with subsidiary or affiliated companies of the Sub-Adviser (until October 1994). Oversees 36 portfolios in the OppenheimerFunds complex. Mr. Freedman has served on the Boards of certain Oppenheimer funds since 1996, during which time he has become familiar with the Fund’s (and other Oppenheimer funds’) financial, accounting, regulatory and investment matters and has contributed to the Boards’ deliberations. |
| |
Edward L. Cameron, Trustee (since 1999) Age: 74 | | Member of The Life Guard of Mount Vernon (George Washington historical site) (June 2000 – June 2006); Partner of PricewaterhouseCoopers LLP (accounting firm) (July 1974-June 1999); Chairman of Price Waterhouse LLP Global Investment Management Industry Services Group (accounting firm) (July 1994-June 1998). Oversees 36 portfolios in the OppenheimerFunds complex. Mr. Cameron has served on the Boards of certain Oppenheimer funds since 1999, during which time he has become familiar with the Fund’s (and other Oppenheimer funds’) financial, accounting, regulatory and investment matters and has contributed to the Boards’ deliberations. |
| |
Jon S. Fossel, Trustee (since 1995) Age: 70 | | Chairman of the Board (2006-December 2011) and Director (June 2002-December 2011) of UNUMProvident (insurance company); Director of Northwestern Energy Corp. (public utility corporation) (November 2004-December 2009); Director of P.R. Pharmaceuticals (October 1999-October 2003); Director of Rocky Mountain Elk Foundation (non-profit organization) (February 1998-February 2003 and February 2005-February 2007); Chairman and Director (until October 1996) and President and Chief Executive Officer (until October 1995) of the Sub-Adviser; President, Chief Executive Officer and Director of the following: Oppenheimer Acquisition Corp. (“OAC”) (parent holding company of the Sub-Adviser), Shareholders Services, Inc. and Shareholder Financial Services, Inc. (until October 1995). Oversees 36 portfolios in the OppenheimerFunds complex. Mr. Fossel has served on the Boards of certain Oppenheimer funds since 1990, during which time he has become familiar with the Fund’s (and other Oppenheimer funds’) financial, accounting, regulatory and investment matters and has contributed to the Boards’ deliberations. |
| |
Richard F. Grabish, Trustee (since 2012) Age: 64 | | Formerly Senior Vice President and Assistant Director of Sales and Marketing (March 1997-December 2007), Director (March 1987-December 2007) and Manager of Private Client Services (June 1985-June 2005) of A.G. Edwards & Sons, Inc. (broker/dealer and investment firm); Chairman and Chief Executive Officer of A.G. Edwards Trust Company, FSB (March 2001-December 2007); President and Vice Chairman of A.G. Edwards Trust Company, FSB (investment adviser) (April 1987-March 2001); President of A.G. Edwards Trust Company, FSB (investment adviser) (June 2005-December 2007). Oversees 36 portfolios in the OppenheimerFunds complex. Mr. Grabish has served on the Boards of certain Oppenheimer funds since 2001, during which time he has become familiar with the Fund’s (and other Oppenheimer funds’) financial, accounting, regulatory and investment matters and has contributed to the Boards’ deliberations. |
| |
Beverly L. Hamilton, Trustee (since 2002) Age: 66 | | Trustee of Monterey Institute for International Studies (educational organization) (since February 2000); Board Member of Middlebury College (educational organization) (December 2005-June 2011); Chairman (since 2010) of American Funds’ Emerging Markets Growth Fund, Inc. (mutual fund); Director of The California Endowment (philanthropic organization) (April 2002-April 2008); Director (February 2002-2005) and Chairman of Trustees (2006-2007) of the Community Hospital of Monterey Peninsula; Director (October 1991-2005); Vice Chairman (2006-2009) of American Funds’ Emerging Markets Growth Fund, Inc. (mutual fund); President of ARCO Investment Management Company (February 1991-April 2000); Member of the investment committees of The Rockefeller Foundation (2001-2006) and The University of Michigan (since 2000); Advisor at Credit Suisse First Boston’s Sprout venture capital unit (venture capital fund) (1994-January 2005); Trustee of MassMutual Institutional Funds (investment company) (1996-June 2004); Trustee of MML Series Investment Fund (investment company) (April 1989-June 2004); Member of the investment committee of Hartford Hospital (2000-2003); and Advisor to Unilever (Holland) pension fund (2000-2003). Oversees 36 portfolios in the OppenheimerFunds complex. Ms. Hamilton has served on the Boards of certain Oppenheimer funds since 2002, during which time she has become familiar with the Fund’s (and other Oppenheimer funds’) financial, accounting, regulatory and investment matters and has contributed to the Boards’ deliberations. |
| |
Victoria J. Herget, Trustee (since 2012) Age: 61 | | Independent Director of the First American Funds (mutual fund family) (2003-2011); former Managing Director (1993-2001), Principal (1985-1993), Vice President (1978-1985) and Assistant Vice President (1973-1978) of Zurich Scudder Investments (and its predecessor firms); Board Chair (2008-Present) and Director (2004-Present), United Educators (insurance company); Trustee (1992-2007), Chair of the Board of Trustees (1999-2007), Investment Committee Chair (1994-1999) and Investment Committee member (2007-2010) of Wellesley College; Trustee (since 2000) and Chair (since 2010), Newberry Library; Trustee, Mather LifeWays (since 2001); Trustee, BoardSource (2006-2009) and Chicago City Day School (1994-2005). Oversees 36 portfolios in the OppenheimerFunds complex. Ms. Herget has served on the Boards of certain Oppenheimer funds since 2012, during which time she has become familiar with the Fund’s (and other Oppenheimer funds’) financial, accounting, regulatory and investment matters and has contributed to the Boards’ deliberations. |
| |
Robert J. Malone, Trustee (since 2002) Age: 68 | | Board of Directors of Opera Colorado Foundation (non-profit organization) (since March 2008); Director of Jones Knowledge, Inc. (2006-2010); Director of Jones International University (educational organization) (since August 2005); Chairman, Chief Executive Officer and Director of Steele Street Bank & Trust (commercial banking) (since August 2003); Director of Colorado UpLIFT (charitable organization) (1986-2010); Trustee of the Gallagher Family Foundation (non-profit organization) (since 2000); Former Chairman of U.S. Bank-Colorado (subsidiary of U.S. Bancorp and formerly Colorado National Bank) (July 1996-April 1999); Director of Commercial Assets, Inc. (real estate investment trust) (1993-2000); Director of Jones Knowledge, Inc. (2001-July 2004); Director of U.S. Exploration, Inc. (oil and gas exploration) (1997-February 2004); Chairman of the Board (1991-1994) and Trustee (1985-1994) of Regis University; and Chairman of the Board (1990-1991) and Trustee (1984-1999) of Young Presidents Organization. Oversees 36 portfolios in the OppenheimerFunds complex. Mr. Malone has served on the Boards of certain Oppenheimer funds since 2002, during which time he has become familiar with the Fund’s (and other Oppenheimer funds’) financial, accounting, regulatory and investment matters and has contributed to the Boards’ deliberations. |
| |
F. William Marshall, Jr., Trustee (since 2000) Age: 70 | | Trustee Emeritus of Worcester Polytech Institute (WPI) (private university) (since 2009); Trustee of MassMutual Select Funds (formerly MassMutual Institutional Funds) (investment company) (since 1996) and MML Series Investment Fund (investment company) (since 1996) and Mass Mutual Premier Funds (investment company) (since January 2012); President and Treasurer of the SIS Funds (private charitable fund) (January 1999 – March 2011); Former Trustee of WPI (1985-2008); Former Chairman of the Board (2004-2006) and Former Chairman of the Investment Committee of WPI (1994-2008); Chairman of SIS & Family Bank, F.S.B. (formerly SIS Bank) (commercial bank) (January 1999-July 1999); Executive Vice President of Peoples Heritage Financial Group, Inc. (commercial bank) (January 1999-July 1999); and Former President and Chief Executive Officer of SIS Bancorp. (1993-1999). Oversees 40 portfolios in the OppenheimerFunds complex. Mr. Marshall has served on the Boards of certain Oppenheimer funds since 2000, during which time he has become familiar with the Fund’s (and other Oppenheimer funds’) financial, accounting, regulatory and investment matters and has contributed to the Boards’ deliberations. |
| | | | |
| 31 | | | | OPPENHEIMER GLOBAL SECURITIES FUND/VA |
TRUSTEES AND OFFICERS BIOS Unaudited / Continued
| | |
Karen L. Stuckey, Trustee (since 2012) Age: 59 | | Partner (1990-2012) of PricewaterhouseCoopers LLP (held various positions 1975-1990); Trustee (1992-2006) and member of Executive, Nominating and Audit Committees and Chair of Finance Committee of Lehigh University; and member, Women’s Investment Management Forum since inception. Oversees 36 portfolios in the OppenheimerFunds complex. Ms. Stuckey has served on the Boards of certain Oppenheimer funds since 2012, during which time she has become familiar with the Fund’s (and other Oppenheimer funds’) financial, accounting, regulatory and investment matters and has contributed to the Boards’ deliberations. |
| |
James D. Vaughn, Trustee (since 2012) Age: 67 | | Retired; former managing partner (1994-2001) of Denver office of Deloitte & Touche LLP, (held various positions 1969-1993); Trustee and Chairman of the Audit Committee of Schroder Funds (2003-2012); Board member and Chairman of Audit Committee of AMG National Trust Bank (since 2005); Trustee, Audit Committee member and Investment Committee member, University of South Dakota Foundation (since 1996); Board member, Executive Committee Member, Audit Committee Member and past Board Chair, Junior Achievement (since 1993); former Board member, Mile High United Way, Boys and Girls Clubs, Boy Scouts, Colorado Business Committee for the Arts, Economic Club of Colorado and Metro Denver Network. Oversees 36 portfolios in the OppenheimerFunds complex. Mr. Vaughn has served on the Boards of certain Oppenheimer funds since 2012, during which time he has become familiar with the Fund’s (and other Oppenheimer funds’) financial, accounting, regulatory and investment matters and has contributed to the Boards’ deliberations. |
| INTERESTED TRUSTEE AND OFFICER | | The address of Mr. Glavin is Two World Financial Center, 225 Liberty Street, 11th Floor, New York, New York 10281-1008. Mr. Glavin serves as a Trustee for an indefinite term, or until his resignation, retirement, death or removal and as an Officer for an indefinite term, or until his resignation, retirement, death or removal. Mr. Glavin is an Interested Trustee due to his positions with OppenheimerFunds, Inc. and its affiliates. |
| |
William F. Glavin, Jr., Trustee, President and Principal Executive Officer (since 2009) Age: 54 | | Chief Executive Officer of OppenheimerFunds (since January 2013); Director, Chief Executive Officer and President of the Manager (since January 2013); Chairman of the Sub-Adviser (December 2009-December 2012); Chief Executive Officer (January 2009-December 2012) and Director of the Sub-Adviser (since January 2009); President of the Sub-Adviser (May 2009-December 2012); Management Director (since June 2009), President (since December 2009) and Chief Executive Officer (since January 2011) of Oppenheimer Acquisition Corp. (“OAC”) (the Sub-Adviser’s parent holding company); Director of Oppenheimer Real Asset Management, Inc. (since March 2010); Executive Vice President (March 2006-February 2009) and Chief Operating Officer (July 2007-February 2009) of Massachusetts Mutual Life Insurance Company (OAC’s parent company); Director (May 2004-March 2006) and Chief Operating Officer and Chief Compliance Officer (May 2004-January 2005), President (January 2005-March 2006) and Chief Executive Officer (June 2005-March 2006) of Babson Capital Management LLC; Director (March 2005-March 2006), President (May 2003-March 2006) and Chief Compliance Officer (July 2005-March 2006) of Babson Capital Securities, Inc. (a broker-dealer); President (May 2003-March 2006) of Babson Investment Company, Inc.; Director (May 2004-August 2006) of Babson Capital Europe Limited; Director (May 2004-October 2006) of Babson Capital Guernsey Limited; Director (May 2004-March 2006) of Babson Capital Management LLC; Non-Executive Director (March 2005-March 2007) of Baring Asset Management Limited; Director (February 2005-June 2006) Baring Pension Trustees Limited; Director and Treasurer (December 2003-November 2006) of Charter Oak Capital Management, Inc.; Director (May 2006-September 2006) of C.M. Benefit Insurance Company; Director (May 2008-June 2009) and Executive Vice President (June 2007-July 2009) of C.M. Life Insurance Company; President (March 2006-May 2007) of MassMutual Assignment Company; Director (January 2005-December 2006), Deputy Chairman (March 2005-December 2006) and President (February 2005-March 2005) of MassMutual Holdings (Bermuda) Limited; Director (May 2008-June 2009) and Executive Vice President (June 2007-July 2009) of MML Bay State Life Insurance Company; Chief Executive Officer and President (April 2007-January 2009) of MML Distributors, LLC; and Chairman (March 2006-December 2008) and Chief Executive Officer (May 2007-December 2008) of MML Investors Services, Inc. An officer of 86 portfolios in the OppenheimerFunds complex. |
| OTHER OFFICERS OF THE FUND | | The addresses of the Officers in the chart below are as follows: for Messrs. Bhaman, Gabinet and Ms. Nasta, Two World Financial Center, 225 Liberty Street, New York, New York 10281-1008, for Messrs. Vandehey and Wixted, 6803 S. Tucson Way, Centennial, Colorado 80112-3924. Each Officer serves for an indefinite term or until his or her resignation, retirement, death or removal. |
| |
Rajeev Bhaman, Vice President (since 2004) Age: 48 | | Director of Global Equities of the Sub-Adviser (since January 2013); Senior Vice President of the Sub-Adviser (since May 2006); Vice President of the Sub-Adviser (January 1997-May 2006). An officer of 3 portfolios in the OppenheimerFunds complex. |
| |
Arthur S. Gabinet, Secretary and Chief Legal Officer (since 2011) Age: 54 | | General Counsel of OppenheimerFunds (since January 2013); Executive Vice President, Secretary and General Counsel of the Manager (since January 2013); General Counsel OFI SteelPath, Inc. (since January 2013); Executive Vice President (May 2010-December 2012) and General Counsel (since January 2011) of the Sub-Adviser; General Counsel of the Distributor (since January 2011); General Counsel of Centennial Asset Management Corporation (January 2011-December 2012); Executive Vice President (January 2011-December 2012) and General Counsel of HarbourView Asset Management Corporation (since January 2011); Assistant Secretary (since January 2011) and Director (since January 2011) of OppenheimerFunds International Ltd. and OppenheimerFunds plc; Director of Oppenheimer Real Asset Management, Inc. (January 2011-December 2012) and General Counsel (since January 2011); Executive Vice President (January 2011-December 2011) and General Counsel of Shareholder Financial Services, Inc. and Shareholder Services, Inc. (since January 2011); Executive Vice President (January 2011-December 2012) and General Counsel of OFI Private Investments Inc. (since January 2011); Vice President of OppenheimerFunds Legacy Program (January 2011-December 2011); Executive Vice President (January 2011-December 2012) and General Counsel of OFI Institutional Asset Management, Inc. (since January 2011); General Counsel, Asset Management of the Sub-Adviser (May 2010-December 2010); Principal, The Vanguard Group (November 2005-April 2010); District Administrator, U.S. Securities and Exchange Commission (January 2003-October 2005). An officer of 86 portfolios in the OppenheimerFunds complex. |
| |
Christina M. Nasta, Vice President and Chief Business Officer (since 2011) Age: 39 | | Senior Vice President of OppenheimerFunds Distributor, Inc. (since January 2013); Senior Vice President of the Sub-Adviser (July 2010-December 2012); Vice President of the Sub-Adviser (January 2003-July 2010); Vice President of OppenheimerFunds Distributor, Inc. (January 2003-July 2010). An officer of 86 portfolios in the OppenheimerFunds complex. |
| |
Mark S. Vandehey, Vice President and Chief Compliance Officer (since 2004) Age: 62 | | Chief Compliance Officer of OppenheimerFunds (since January 2013); Senior Vice President and Chief Compliance Officer of the Manager (since January 2013); Chief Compliance Officer of OFI SteelPath, Inc. (since January 2013); Senior Vice President of the Sub-Adviser (March 2004-December 2012); Chief Compliance Officer of the Sub-Adviser, OppenheimerFunds Distributor, Inc., OFI Trust Company, OFI Institutional Asset Management, Inc., Oppenheimer Real Asset Management, Inc., OFI Private Investments, Inc., Harborview Asset Management Corporation, Trinity Investment Management Corporation, and Shareholder Services, Inc. (since March 2004); Vice President of OppenheimerFunds Distributor, Inc., Centennial Asset Management Corporation and Shareholder Services, Inc. (June 1983-December 2012). An officer of 86 portfolios in the OppenheimerFunds complex. |
| | | | |
| 32 | | | | OPPENHEIMER GLOBAL SECURITIES FUND/VA |
TRUSTEES AND OFFICERS Unaudited
| | |
Brian W. Wixted, Treasurer and Principal Financial & Accounting Officer (since 1999) Age: 53 | | Senior Vice President of the Manager (since January 2013); Treasurer of the Sub-Adviser, HarbourView Asset Management Corporation, Shareholder Financial Services, Inc., Shareholder Services, Inc., and Oppenheimer Real Asset Management, Inc. (March 1999-June 2008), OFI Private Investments, Inc. (March 2000-June 2008), OppenheimerFunds International Ltd. and OppenheimerFunds plc (since May 2000), OFI Institutional Asset Management, Inc. (November 2000-June 2008), and OppenheimerFunds Legacy Program (charitable trust program established by the Sub-Adviser) (June 2003-December 2011); Treasurer and Chief Financial Officer of OFI Trust Company (since May 2000); Assistant Treasurer of Oppenheimer Acquisition Corporation (March 1999-June 2008). An officer of 86 portfolios in the OppenheimerFunds complex. |
The Fund’s Statement of Additional Information contains additional information about the Fund’s Trustees and Officers and is available without charge, upon request, by calling 1.800.988.8287.
| | | | |
| 33 | | | | OPPENHEIMER GLOBAL SECURITIES FUND/VA |
THIS PAGE INTENTIONALLY LEFT BLANK.
| | | | |
| 34 | | | | OPPENHEIMER GLOBAL SECURITIES FUND/VA |
THIS PAGE INTENTIONALLY LEFT BLANK.
| | | | |
| 35 | | | | OPPENHEIMER GLOBAL SECURITIES FUND/VA |
OPPENHEIMER GLOBAL SECURITIES FUND/VA
A Series of Oppenheimer Variable Account Funds
| | |
| Manager | | OFI Global Asset Management, Inc |
| Sub-Adviser | | OppenheimerFunds, Inc. |
| Distributor | | OppenheimerFunds Distributor, Inc. |
| Transfer and Shareholder Servicing Agent | | OFI Global Asset Management, Inc. |
| Sub-Transfer Agent | | Shareholder Services, Inc. DBA OppenheimerFunds Services |
Independent Registered Public
Accounting Firm | | KPMG LLP |
| Counsel | | K&L Gates LLP |
Before investing, investors should carefully consider a fund’s investment objectives, risks, charges and expenses. Fund prospectuses and summary prospectuses contain this and other information about the funds, and may be obtained by asking your financial advisor, or calling us at 1.800.988.8287. Read prospectuses and summary prospectuses carefully before investing.
| | |
| © 2013 OppenheimerFunds, Inc. All rights reserved. | | |
December 31, 2012
| | | | |
| | | Oppenheimer Main Street Fund®/VA A Series of Oppenheimer Variable Account Funds | | Annual Report |
ANNUAL REPORT
Listing of Top Holdings
Fund Performance Discussion
Financial Statements
OPPENHEIMER MAIN STREET FUND®/VA
Portfolio Managers: Manind (“Mani”) Govil, CFA and Benjamin Ram
| | | | | | |
Average Annual Total Returns For the Periods Ended 12/31/12 | | |
| | | |
| | | 1-Year | | 5-Year | | 10-Year |
| Non-Service Shares | | 16.87% | | 1.38% | | 6.58% |
| Service Shares | | 16.61 | | 1.13 | | 6.31 |
The performance data quoted represents past performance, which does not guarantee future results. The investment return and principal value of an investment in the Fund will fluctuate so that an investor’s shares, when redeemed, may be worth more or less than their original cost. Current performance may be lower or higher than the performance quoted. For performance data current to the most recent month end, call us at 1.800.988.8287. The Fund’s total returns should not be expected to be the same as the returns of other funds, whether or not both funds have the same portfolio managers and/or similar names. The Fund’s total returns include changes in share price and reinvested distributions but do not include the charges associated with the separate account products that offer this Fund. Such performance would have been lower if such charges were taken into account.
| | | | |
| Top Ten Common Stock Holdings | | | |
| Apple, Inc. | | | 6.6 | % |
| Citigroup, Inc. | | | 5.0 | |
| Philip Morris International, Inc. | | | 4.6 | |
| International Business Machines Corp. | | | 4.6 | |
| JPMorgan Chase & Co. | | | 4.4 | |
| eBay, Inc. | | | 3.7 | |
| CIT Group, Inc. | | | 3.5 | |
| Chevron Corp. | | | 3.5 | |
| National Oilwell Varco, Inc. | | | 3.1 | |
| Covidien plc | | | 3.0 | |
Portfolio holdings and allocations are subject to change. Percentages are as of December 31, 2012, and are based on net assets.
Sector Allocation
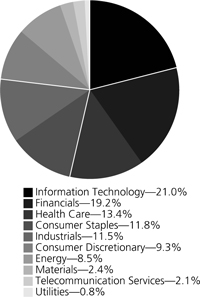
Portfolio holdings and allocations are subject to change. Percentages are as of December 31, 2012, and are based on the total market value of common stocks.
| | | | |
| 2 | | | | OPPENHEIMER MAIN STREET FUND/VA |
FUND PERFORMANCE DISCUSSION
During the reporting period, the Fund’s Non-Service shares produced a return of 16.87%. In comparison, the Fund outperformed the S&P 500 Index (the “Index”), which returned 16%. The Fund outperformed the Index primarily in the information technology sector due to better relative stock selection. The Fund underperformed the Index in consumer discretionary and industrials.
Economic and Market Environment
Domestic equities generally produced positive returns this period. The period began during a time of improved market sentiment in which the United States managed to avoid a return to recession and European policymakers appeared to take steps to address the region’s sovereign debt and banking sector crises. Renewed investor optimism helped produce gains in the U.S. equity market as well as across a number of international equity markets over the first three months of 2012. The rebound across equities gained momentum after the European Central Bank (the “ECB”) implemented dual Long-Term Refinancing Operations (“LTRO”) to enhance liquidity for troubled banks and reduce rates on newly issued sovereign debt securities.
The second quarter was more volatile for the equity markets. In the U.S., slower than expected first quarter growth contributed to a sell-off in the U.S. stock market. Consumer confidence dropped as U.S. unemployment figures ticked slightly upwards after showing signs of improvement from the recession highs. In addition, uncertainty around the November 2012 elections and the potential removal of a significant amount of government stimulus in the beginning of 2013, resulted in companies stalling spending and hiring, contributing to the economic slowdown. The reduction in growth outside of the U.S. also negatively impacted exports, which was exacerbated by a strengthening dollar. Outside of the U.S., the fear of contagion from the worsening European sovereign debt crisis and a recession across much of Europe also resulted in increased market volatility.
In the second half of the period, the equity markets generally resumed an upward trend despite ongoing concerns. In the U.S., the Fed introduced a third round of quantitative easing (“QE3”), under which it announced plans to purchase mortgage-backed bonds on a monthly basis until the labor market shows signs of substantial improvement. Equities in the U.S. were also bolstered by the continued improvement of the housing market. However, the market did experience volatility due to uncertainty over the outcome of the Presidential election. In addition, the lack of visibility about resolution of the “fiscal cliff” weighed further on both business and consumer spending. These concerns were not enough to offset earlier gains, and immediately following the close of the period, the U.S. Congress enacted a last minute temporary resolution to the fiscal cliff.
Outside of the U.S., the results of elections in Greece and continued efforts by European policymakers to stabilize the situation in the region made far less likely the imminent fracturing of the Eurozone and the serious consequences that might have for the euro. The ECB also increased its efforts to stimulate economic growth, as it committed to potentially unlimited bond purchases to ease financing pressure on countries like Spain and Italy. Under the plan, these and other members of the European Union (excluding Greece) would be able to maintain access to funding at sustainable interest rates, on the condition that they continue with strict reform programs.
Top Individual Contributors
During the reporting period, information technology stock Apple, Inc., was the Fund’s strongest performing holding. Apple benefited from its success at innovation and its highly recognizable brand, leading to global growth and share gains across its top revenue producing products—iPhones, iPads and Mac PCs. Also contributing to performance within information technology was eBay, Inc. The company’s earnings beat expectations and management raised guidance for both 2012 revenues and profits. eBay benefited from a turnaround in its Marketplace segment with improvements to the user experience leading to increased loyalty and great volumes of transactions. PayPal, eBay’s online payment service, continued to be a significant contributor to eBay’s growth with results that exceeded expectations.
Also contributing to performance this period were financials stocks Citigroup, Inc., JPMorgan Chase & Co. and Discover Financial Services. Discover Financial Services, which operates one of the two closed-loop credit card networks in the United States, enjoyed healthy revenue growth and its stock performed well. Citigroup’s stock performed positively as both a newly appointed CEO and announced cost restructurings, including headcount reductions, resulted in a boost to earnings expectations. Additionally, the market viewed an improving housing market as favorable to Citigroup’s book of existing home mortgages, potentially resulting in growing future profit for Citigroup, in addition to an improving housing market creating demand for new mortgage loans.
Similar to Citigroup, the market viewed favorably JPMorgan’s potential for future rising profitability as a result of the general rise in home prices and increases in both existing home sales and new housing starts. Also, management reinstated its aggressive share repurchase program after it was suspended in response to the trading debacle earlier in the year. As a consequence, earnings revisions have been on an upward trajectory, helping to buoy the stock price higher.
Top Individual Detractors
A few detractors from Fund performance this period included Facebook, Inc. in information technology, energy stock Occidental Petroleum Corp. and Towers Watson & Co. in industrials. Social media firm Facebook faced concerns around how best to deliver effective advertising to mobile devices and monetize its significant network of users. General Motors’ announcement to pull its advertising from Facebook highlighted these concerns. Occidental Petroleum Corp.’s stock performance was hurt by volatile oil and gas prices, which at times dropped sharply during the period amid global macroeconomic market fears. We exited our position in Occidental. We established a position in global employee-benefits consulting company Towers Watson & Co. during the period. The company reported a quarterly miss in revenue, which it attributed to a delay in billing due to glitches in its new internally used software platform. This issue seems to have been resolved by period end.
| | | | |
| 3 | | | | OPPENHEIMER MAIN STREET FUND/VA |
FUND PERFORMANCE DISCUSSION
Strategy & Outlook
Despite macroeconomic headwinds, we believe that many U.S. corporations have continued to build balance sheet strength and have generally made effective capital allocation decisions. While profit growth may remain slow, we believe balance sheets are likely to remain healthy and returns on capital should remain stable. While we expect market volatility to continue through 2013, we believe that even in an uncertain macroeconomic environment, there exist solid investment opportunities.
Our long-term investment process remains the same. We seek companies with sustainable competitive advantages, with the management skill and financial resources to generate stronger profit margins, take market share from weaker players, and/or return significant capital to shareholders. We focus on leading firms in structurally attractive industries with committed management teams that have proven records of performance. We seek to invest in such companies when their valuations are attractive, and believe that this disciplined approach is the key to generating positive long-term returns. We believe our investment strategy has the potential to provide both upside participation and a degree of downside protection.
Investors should consider the Fund’s investment objective, risks, charges and expenses carefully before investing. The Fund’s prospectus and summary prospectus contain this and other information about the Fund, and may be obtained by asking your financial advisor or calling us at 1.800.988.8287. Read prospectuses and summary prospectuses carefully before investing.
Total returns include changes in share price and reinvestment of dividends and capital gains distributions in a hypothetical investment for the periods shown.
The Fund’s investment strategy and focus can change over time. The mention of specific fund holdings does not constitute a recommendation by OppenheimerFunds, Inc. or its affiliates.
Shares of Oppenheimer funds are not deposits or obligations of any bank, are not guaranteed by any bank, are not insured by the FDIC or any other agency, and involve investment risks, including the possible loss of the principal amount invested.
Comparing the Fund’s Performance to the Market. The graphs that follow show the performance of a hypothetical $10,000 investment in each share class of the Fund held until December 31, 2012. Performance is measured over a ten-fiscal-year period for both Classes. Performance information does not reflect charges that apply to separate accounts investing in the Fund. If these charges were taken into account, performance would be lower. The graphs assume that all dividends and capital gains distributions were reinvested in additional shares.
The Fund’s performance is compared to the performance of the S&P 500 Index, an index of large-capitalization equity securities that is a measure of the general domestic stock market. The Index is unmanaged and cannot be purchased directly by investors. Index performance is shown for illustrative purposes only and does not predict or depict the performance of the Fund. While index comparisons may be useful to provide a benchmark for the Fund’s performance, it must be noted that the Fund’s investments are not limited to the investments comprising the Index.
| | | | |
| 4 | | | | OPPENHEIMER MAIN STREET FUND/VA |
FUND PERFORMANCE DISCUSSION
Non-Service Shares
COMPARISON OF CHANGE IN VALUE OF $10,000 HYPOTHETICAL INVESTMENTS IN:
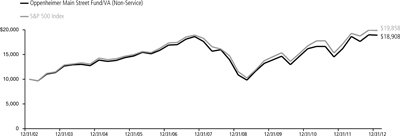
Average Annual Total Returns of Non-Service Shares of the Fund at 12/31/12
1-Year 16.87% 5-Year 1.38% 10-Year 6.58%
Service Shares
COMPARISON OF CHANGE IN VALUE OF $10,000 HYPOTHETICAL INVESTMENTS IN:
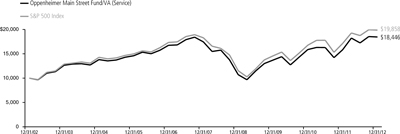
Average Annual Total Returns of Service Shares of the Fund at 12/31/12
1-Year 16.61% 5-Year 1.13% 10-Year 6.31%
The performance data quoted represents past performance, which does not guarantee future results. The investment return and principal value of an investment in the Fund will fluctuate so that an investor’s shares, when redeemed, may be worth more or less than their original cost. Current performance may be lower or higher than the performance quoted. For performance data current to the most recent month end, call us at 1.800.988.8287. The Fund’s total returns should not be expected to be the same as the returns of other funds, whether or not both funds have the same portfolio managers and/or similar names. The Fund’s total returns include changes in share price and reinvested distributions but do not include the charges associated with the separate account products that offer this Fund. Such performance would have been lower if such charges were taken into account.
| | | | |
| 5 | | | | OPPENHEIMER MAIN STREET FUND/VA |
FUND EXPENSES
Fund Expenses. As a shareholder of the Fund, you incur two types of costs: (1) transaction costs and (2) ongoing costs, including management fees; distribution and service fees; and other Fund expenses. These examples are intended to help you understand your ongoing costs (in dollars) of investing in the Fund and to compare these costs with the ongoing costs of investing in other mutual funds.
The examples are based on an investment of $1,000.00 invested at the beginning of the period and held for the entire 6-month period ended December 31, 2012.
Actual Expenses. The first section of the table provides information about actual account values and actual expenses. You may use the information in this section for the class of shares you hold, together with the amount you invested, to estimate the expense that you paid over the period. Simply divide your account value by $1,000.00 (for example, an $8,600.00 account value divided by $1,000.00 = 8.60), then multiply the result by the number in the first section under the heading entitled “Expenses Paid During Period” to estimate the expenses you paid on your account during this period.
Hypothetical Example for Comparison Purposes. The second section of the table provides information about hypothetical account values and hypothetical expenses based on the Fund’s actual expense ratio for each class of shares, and an assumed rate of return of 5% per year for each class before expenses, which is not the actual return. The hypothetical account values and expenses may not be used to estimate the actual ending account balance or expenses you paid for the period. You may use this information to compare the ongoing costs of investing in the Fund and other funds. To do so, compare this 5% hypothetical example for the class of shares you hold with the 5% hypothetical examples that appear in the shareholder reports of the other funds.
Please note that the expenses shown in the table are meant to highlight your ongoing costs only and do not reflect any charges associated with the separate accounts that offer this Fund. Therefore, the “hypothetical” lines of the table are useful in comparing ongoing costs only, and will not help you determine the relative total costs of owning different funds. In addition, if these separate account charges were included your costs would have been higher.
| | | | | | | | | | | | |
| Actual | | Beginning
Account
Value
July 1, 2012 | | | Ending Account Value
December 31, 2012 | | | Expenses
Paid During
6 Months Ended
December 31, 2012 | |
| Non-Service shares | | $ | 1,000.00 | | | $ | 1,072.00 | | | $ | 4.07 | |
| Service shares | | | 1,000.00 | | | | 1,070.70 | | | | 5.37 | |
| | | |
Hypothetical
(5% return before expenses) | | | | | | | | | | | | |
| Non-Service shares | | | 1,000.00 | | | | 1,021.22 | | | | 3.97 | |
| Service shares | | | 1,000.00 | | | | 1,019.96 | | | | 5.24 | |
Expenses are equal to the Fund’s annualized expense ratio for that class, multiplied by the average account value over the period, multiplied by 184/366 (to reflect the one-half year period). Those annualized expense ratios, excluding indirect expenses from affiliated funds, based on the 6-month period ended December 31, 2012 are as follows:
| | | | |
| Class | | Expense Ratios | |
| Class Non-Service | | | 0.78 | % |
| Class Service | | | 1.03 | |
The expense ratios reflect voluntary waivers and/or reimbursements of expenses by the Fund’s Manager. Some of these undertakings may be modified or terminated at any time, as indicated in the Fund’s prospectus. The “Financial Highlights” tables in the Fund’s financial statements, included in this report, also show the gross expense ratios, without such waivers or reimbursements and reduction to custodian expenses, if applicable.
| | | | |
| 6 | | | | OPPENHEIMER MAIN STREET FUND/VA |
STATEMENT OF INVESTMENTS December 31, 2012
| | | | | | | | |
| | |
Shares | | | Value | |
| Common Stocks—98.6% | | | | | | | | |
| Consumer Discretionary—9.1% | | | | | | | | |
| Automobiles—2.8% | | | | | | | | |
| Ford Motor Co. | | | 2,965,260 | | | $ | 38,400,117 | |
| Hotels, Restaurants & Leisure—0.5% | |
| Yum! Brands, Inc. | | | 102,290 | | | | 6,792,056 | |
| Media—2.4% | | | | | | | | |
| McGraw-Hill Cos., Inc. (The) | | | 602,701 | | | | 32,949,664 | |
| Specialty Retail—3.4% | | | | | | | | |
| AutoZone, Inc.1 | | | 66,900 | | | | 23,711,367 | |
| CarMax, Inc.1 | | | 175,410 | | | | 6,584,891 | |
| TJX Cos., Inc. (The) | | | 348,320 | | | | 14,786,184 | |
| | | | | | |
|
|
|
| | | | | | | | 45,082,442 | |
| Consumer Staples—11.7% | | | | | | | | |
| Beverages—2.3% | | | | | | | | |
| Dr Pepper Snapple Group, Inc. | | | 706,470 | | | | 31,211,845 | |
| Food Products—4.4% | | | | | | | | |
| J.M. Smucker Co. (The) | | | 333,710 | | | | 28,779,150 | |
| Kraft Foods Group, Inc. | | | 410,586 | | | | 18,669,345 | |
| Mondelez International, Inc., Cl. A | | | 469,810 | | | | 11,966,061 | |
| | | | | | |
|
|
|
| | | | | | | | 59,414,556 | |
| Household Products—0.4% | | | | | | | | |
| Henkel AG & Co. KGaA, Preference | | | 65,339 | | | | 5,364,390 | |
| Tobacco—4.6% | | | | | | | | |
| Philip Morris International, Inc. | | | 739,219 | | | | 61,828,277 | |
| Energy—8.4% | | | | | | | | |
| Energy Equipment & Services—3.1% | |
| National Oilwell Varco, Inc. | | | 619,550 | | | | 42,346,243 | |
| Oil, Gas & Consumable Fuels—5.3% | |
| Chevron Corp. | | | 432,620 | | | | 46,783,527 | |
| Noble Energy, Inc. | | | 235,480 | | | | 23,957,735 | |
| | | | | | |
|
|
|
| | | | | | | | 70,741,262 | |
| Financials—18.8% | | | | | | | | |
| Commercial Banks—3.8% | | | | | | | | |
| CIT Group, Inc.1 | | | 1,233,720 | | | | 47,670,941 | |
| M&T Bank Corp. | | | 41,220 | | | | 4,058,933 | |
| | | | | | |
|
|
|
| | | | | | | | 51,729,874 | |
| Consumer Finance—1.4% | | | | | | | | |
| Discover Financial Services | | | 498,310 | | | | 19,209,850 | |
| Diversified Financial Services—11.4% | |
| Citigroup, Inc. | | | 1,722,248 | | | | 68,132,131 | |
| CME Group, Inc., Cl. A | | | 378,520 | | | | 19,194,749 | |
| JPMorgan Chase & Co. | | | 1,361,620 | | | | 59,870,431 | |
| MSCI, Inc.1 | | | 280,920 | | | | 8,705,711 | |
| | | | | | |
|
|
|
| | | | | | | | 155,903,022 | |
| Insurance—2.2% | | | | | | | | |
| Lincoln National Corp. | | | 266,400 | | | | 6,899,760 | |
| Marsh & McLennan Cos., Inc. | | | 655,650 | | | | 22,600,256 | |
| | | | | | |
|
|
|
| | | | | | | | 29,500,016 | |
| Health Care—13.3% | | | | | | | | |
| Health Care Equipment & Supplies—3.0% | |
| Covidien plc | | | 696,000 | | | | 40,187,040 | |
| Health Care Providers & Services—2.3% | |
| Express Scripts Holding Co.1 | | | 444,147 | | | | 23,983,938 | |
| UnitedHealth Group, Inc. | | | 112,010 | | | | 6,075,422 | |
| | | | | | |
|
|
|
| | | | | | | | 30,059,360 | |
| Pharmaceuticals—8.0% | | | | | | | | |
| Abbott Laboratories | | | 467,980 | | | | 30,652,690 | |
| Bristol-Myers Squibb Co. | | | 556,200 | | | | 18,126,558 | |
| Pfizer, Inc. | | | 893,450 | | | | 22,407,726 | |
| Sanofi | | | 156,210 | | | | 14,814,200 | |
| Watson Pharmaceuticals, Inc.1 | | | 254,150 | | | | 21,856,900 | |
| | | | | | |
|
|
|
| | | | | | | | 107,858,074 | |
| | | | | | | | |
| | |
Shares | | | Value | |
| Industrials—11.2% | | | | | | | | |
| Aerospace & Defense—2.9% | | | | | | | | |
| Boeing Co. (The) | | | 377,870 | | | $ | 28,476,283 | |
| L-3 Communications Holdings, Inc. | | | 137,610 | | | | 10,543,678 | |
| | | | | | |
|
|
|
| | | | | | | | 39,019,961 | |
| Air Freight & Couriers—2.3% | |
| United Parcel Service, Inc., Cl. B | | | 425,010 | | | | 31,335,987 | |
| Commercial Services & Supplies—2.9% | |
| ADT Corp. (The) | | | 379,392 | | | | 17,637,934 | |
| Tyco International Ltd. | | | 758,785 | | | | 22,194,461 | |
| | | | | | |
|
|
|
| | | | | | | | 39,832,395 | |
| Professional Services—1.1% | | | | | | | | |
| Towers Watson & Co., Cl. A | | | 275,240 | | | | 15,471,240 | |
| Road & Rail—2.0% | | | | | | | | |
| CSX Corp. | | | 1,396,770 | | | | 27,558,272 | |
| Information Technology—20.8% | |
| Communications Equipment—1.4% | |
| QUALCOMM, Inc. | | | 306,041 | | | | 18,980,663 | |
| Computers & Peripherals—7.9% | |
| Apple, Inc. | | | 166,222 | | | | 88,601,313 | |
| Western Digital Corp. | | | 408,760 | | | | 17,368,212 | |
| | | | | | |
|
|
|
| | | | | | | | 105,969,525 | |
| Electronic Equipment, Instruments, & Components—1.0% | |
| Corning, Inc. | | | 1,036,060 | | | | 13,075,077 | |
| Internet Software & Services—5.6% | | | | | |
| eBay, Inc.1 | | | 986,235 | | | | 50,317,710 | |
| Facebook, Inc., Cl. A1 | | | 173,090 | | | | 4,609,387 | |
| Google, Inc., Cl. A1 | | | 29,830 | | | | 21,160,507 | |
| | | | | | |
|
|
|
| | | | | | | | 76,087,604 | |
| IT Services—4.9% | | | | | | | | |
| Amdocs Ltd. | | | 108,140 | | | | 3,675,679 | |
| International Business Machines Corp. | | | 321,210 | | | | 61,527,776 | |
| | | | | | |
|
|
|
| | | | | | | | 65,203,455 | |
| Materials—2.4% | | | | | | | | |
| Chemicals—0.4% | | | | | | | | |
| PPG Industries, Inc. | | | 35,670 | | | | 4,827,935 | |
| Construction Materials—2.0% | |
| Vulcan Materials Co. | | | 507,780 | | | | 26,429,949 | |
| Telecommunication Services—2.1% | |
| Wireless Telecommunication Services—2.1% | |
America Movil SAB de CV, Series L, ADR | | | 1,213,612 | | | | 28,082,982 | |
| Utilities—0.8% | | | | | | | | |
| Energy Traders—0.8% | | | | | | | | |
| AES Corp. (The) | | | 1,010,520 | | | | 10,812,564 | |
Total Common Stocks (Cost $990,633,537) | | | | | | | 1,331,265,697 | |
| Investment Company—1.8% | |
| Oppenheimer Institutional Money Market Fund, Cl. E, 0.15%2,3 | | | | | | | | |
| (Cost $24,937,150) | | | 24,937,150 | | | | 24,937,150 | |
| Total Investments, at Value (Cost $1,015,570,687) | | | 100.4 | % | | | 1,356,202,847 | |
| Liabilities in Excess of Other Assets | | | (0.4 | ) | | | (5,741,639 | ) |
| | |
|
|
| |
|
|
|
| Net Assets | | | 100.0 | % | | $ | 1,350,461,208 | |
| | |
|
|
| |
|
|
|
| | | | |
| 7 | | | | OPPENHEIMER MAIN STREET FUND/VA |
STATEMENT OF INVESTMENTS (Continued)
Footnotes to Statement of Investments
1. Non-income producing security.
2. Is or was an affiliate, as defined in the Investment Company Act of 1940, at or during the period ended December 31, 2012, by virtue of the Fund owning at least 5% of the voting securities of the issuer or as a result of the Fund and the issuer having the same investment adviser. Transactions during the period in which the issuer was an affiliate are as follows:
| | | | | | | | | | | | | | | | |
| | | Shares
December 30, 2011a | | | Gross
Additions | | | Gross
Reductions | | | Shares
December 31, 2012 | |
| Oppenheimer Institutional Money Market Fund, Cl. E | | | — | | | | 326,897,828 | | | | 301,960,678 | | | | 24,937,150 | |
| | | | |
| | | | | | | | | Value | | | Income | |
| Oppenheimer Institutional Money Market Fund, Cl. E | | | | | | | | | | $ | 24,937,150 | | | $ | 31,153 | |
a. December 30, 2011 represents the last business day of the Fund’s 2011 fiscal year. See Note 1 of the accompanying Notes.
3. Rate shown is the 7-day yield as of December 31, 2012.
Spot Currency Exchange Contracts as of December 31, 2012 are as follows:
| | | | | | | | | | | | | | | | | | | | |
| Broker/Contract Description | | Buy/Sell | | | Contract Amount
(000’s) | | | Expiration
Date | | | Value | | | Unrealized
Depreciation | |
| Barclay’s Capital | | | | | | | | | | | | | | | | | | | | |
| Euro (EUR) | | | Buy | | | | 1,116 EUR | | | | 1/2/13 | | | $ | 1,473,540 | | | $ | 2,121 | |
See accompanying Notes to Financial Statements.
| | | | |
| 8 | | | | OPPENHEIMER MAIN STREET FUND/VA |
STATEMENT OF ASSETS AND LIABILITIES
| | | | |
| December 31, 2012 | | | |
| Assets | | | |
| Investments, at value—see accompanying statement of investments: | | | | |
| Unaffiliated companies (cost $990,633,537) | | | $1,331,265,697 | |
| Affiliated companies (cost $24,937,150) | |
| 24,937,150
|
|
| | | | 1,356,202,847 | |
| Cash | | | 1,503 | |
| Receivables and other assets: | | | | |
| Investments sold | | | 11,474,846 | |
| Dividends | | | 1,183,626 | |
| Other | |
| 66,284
|
|
| Total assets | | | 1,368,929,106 | |
| Liabilities | | | |
| Unrealized depreciation on foreign currency exchange contracts | | | 2,121 | |
| Payables and other liabilities: | | | | |
| Investments purchased | | | 16,018,966 | |
| Shares of beneficial interest redeemed | | | 1,952,937 | |
| Distribution and service plan fees | | | 177,441 | |
| Transfer and shareholder servicing agent fees | | | 117,995 | |
| Shareholder communications | | | 75,947 | |
| Trustees’ compensation | | | 61,223 | |
| Other | |
| 61,268
|
|
| Total liabilities | | | 18,467,898 | |
| Net Assets | |
| $1,350,461,208
|
|
| Composition of Net Assets | | | |
| Par value of shares of beneficial interest | | | $ 56,638 | |
| Additional paid-in capital | | | 1,207,077,841 | |
| Accumulated net investment income | | | 12,733,895 | |
| Accumulated net realized loss on investments and foreign currency transactions | | | (210,039,605 | ) |
| Net unrealized appreciation on investments and translation of assets and liabilities denominated in foreign currencies | |
| 340,632,439
|
|
| Net Assets | |
| $1,350,461,208
|
|
| Net Asset Value Per Share | | | |
| Non-Service Shares: | | | | |
| Net asset value, redemption price per share and offering price per share (based on net assets of $481,088,951 and 20,073,681 shares of beneficial interest outstanding) | | | $23.97 | |
| Service Shares: | | | | |
| Net asset value, redemption price per share and offering price per share (based on net assets of $869,372,257 and 36,564,482 shares of beneficial interest outstanding) | | | $23.78 | |
See accompanying Notes to Financial Statements.
| | | | |
| 9 | | | | OPPENHEIMER MAIN STREET FUND/VA |
STATEMENT OF OPERATIONS
| | | | |
| For the Year Ended December 31, 2012 | | | |
| Investment Income | | | |
| Dividends: | | | | |
| Unaffiliated companies | | $ | 26,047,142 | |
| Affiliated companies | | | 31,153 | |
| Interest | |
| 583
|
|
| Total investment income | | | 26,078,878 | |
| Expenses | | | |
| Management fees | | | 9,147,166 | |
| Distribution and service plan fees—Service shares | | | 2,303,240 | |
| Transfer and shareholder servicing agent fees: | | | | |
| Non-Service shares | | | 467,671 | |
| Service shares | | | 916,460 | |
| Shareholder communications: | | | | |
| Non-Service shares | | | 27,779 | |
| Service shares | | | 53,883 | |
| Trustees’ compensation | | | 75,511 | |
| Custodian fees and expenses | | | 14,373 | |
| Administration service fees | | | 1,500 | |
| Other | |
| 62,581
|
|
| Total expenses | | | 13,070,164 | |
| Less waivers and reimbursements of expenses | |
| (15,882
| )
|
| Net expenses | | | 13,054,282 | |
| Net Investment Income | | | 13,024,596 | |
| Realized and Unrealized Gain (Loss) | | | |
| Net realized gain (loss) on: | | | | |
| Investments from unaffiliated companies | | | 176,688,715 | |
| Foreign currency transactions | |
| (1,336
| )
|
| Total net realized gain | | | 176,687,379 | |
| Net change in unrealized appreciation/depreciation on: | | | | |
| Investments | | | 22,408,890 | |
| Translation of assets and liabilities denominated in foreign currencies | |
| 428,237
|
|
| Total net change in unrealized appreciation/depreciation | | | 22,837,127 | |
| Net Increase in Net Assets Resulting from Operations | | $
| 212,549,102
|
|
See accompanying Notes to Financial Statements.
| | | | |
| 10 | | | | OPPENHEIMER MAIN STREET FUND/VA |
STATEMENTS OF CHANGES IN NET ASSETS
| | | | | | | | |
| | | Year Ended
December 31,
2012 | | | Year Ended
December 30,
20111 | |
| Operations | | | | | | |
| Net investment income | | $ | 13,024,596 | | | $ | 9,303,117 | |
| Net realized gain | | | 176,687,379 | | | | 60,012,332 | |
| Net change in unrealized appreciation/depreciation | |
| 22,837,127
|
| |
| (72,180,291
| )
|
| Net increase (decrease) in net assets resulting from operations | | | 212,549,102 | | | | (2,864,842 | ) |
| Dividends and/or Distributions to Shareholders | | | | | | |
| Dividends from net investment income: | | | | | | | | |
| Non-Service shares | | | (4,702,221 | ) | | | (3,755,987 | ) |
| Service shares | |
| (5,916,709
| )
| |
| (6,566,777
| )
|
| | | | (10,618,930 | ) | | | (10,322,764 | ) |
| Beneficial Interest Transactions | | | | | | |
| Net increase (decrease) in net assets resulting from beneficial interest transactions: | | | | | | | | |
| Non-Service shares | | | 27,414,824 | | | | (73,098,026 | ) |
| Service shares | |
| (274,928,927
| )
| |
| (172,844,897
| )
|
| | | | (247,514,103 | ) | | | (245,942,923 | ) |
| Net Assets | | | | | | |
| Total decrease | | | (45,583,931 | ) | | | (259,130,529 | ) |
| Beginning of period | |
| 1,396,045,139
|
| |
| 1,655,175,668
|
|
| End of period (including accumulated net investment income of $12,733,895 and $4,690,401, respectively) | | $
| 1,350,461,208
|
| | $
| 1,396,045,139
|
|
1. December 30, 2011 represents the last business day of the Fund’s 2011 fiscal year. See Note 1 of the accompanying Notes.
See accompanying Notes to Financial Statements.
| | | | |
| 11 | | | | OPPENHEIMER MAIN STREET FUND/VA |
FINANCIAL HIGHLIGHTS
| | | | | | | | | | | | | | | | | | | | |
| Non-Service Shares | | Year Ended
December 31,
2012 | | | Year Ended
December 30,
20111 | | | Year Ended
December 31,
2010 | | | Year Ended
December 31,
2009 | | | Year Ended
December 31,
2008 | |
| Per Share Operating Data | | | | | | | | | | | | | | | |
| Net asset value, beginning of period | | $ | 20.71 | | | $ | 20.88 | | | $ | 18.18 | | | $ | 14.56 | | | $ | 25.61 | |
| Income (loss) from investment operations: | | | | | | | | | | | | | | | | | | | | |
| Net investment income2 | | | 0.26 | | | | 0.16 | | | | 0.17 | | | | 0.21 | | | | 0.29 | |
| Net realized and unrealized gain (loss) | |
| 3.22
|
| |
| (0.16
| )
| |
| 2.73
|
| |
| 3.71
|
| |
| (9.64
| )
|
| Total from investment operations | | | 3.48 | | | | 0.00 | | | | 2.90 | | | | 3.92 | | | | (9.35 | ) |
| Dividends and/or distributions to shareholders: | | | | | | | | | | | | | | | | | | | | |
| Dividends from net investment income | | | (0.22 | ) | | | (0.17 | ) | | | (0.20 | ) | | | (0.30 | ) | | | (0.32 | ) |
| Distributions from net realized gain | |
| 0.00
|
| |
| 0.00
|
| |
| 0.00
|
| |
| 0.00
|
| |
| (1.38
| )
|
| Total dividends and/or distributions to shareholders | | | (0.22 | ) | | | (0.17 | ) | | | (0.20 | ) | | | (0.30 | ) | | | (1.70 | ) |
| Net asset value, end of period | | $
| 23.97
|
| | $
| 20.71
|
| | $
| 20.88
|
| | $
| 18.18
|
| | $
| 14.56
|
|
| Total Return, at Net Asset Value3 | | | 16.87 | % | | | (0.01 | )% | | | 16.11 | % | | | 28.29 | % | | | (38.47 | )% |
| | | | | | | | | | | | | | | | | | | | | |
| Ratios/Supplemental Data | | | | | | | | | | | | | | | | | | | | |
Net assets, end of period (in thousands) | | $ | 481,089 | | | $ | 392,861 | | | $ | 469,720 | | | $ | 474,637 | | | $ | 432,360 | |
Average net assets (in thousands) | | $ | 466,231 | | | $ | 426,354 | | | $ | 454,937 | | | $ | 430,517 | | | $ | 670,994 | |
| Ratios to average net assets:4 | | | | | | | | | | | | | | | | | | | | |
Net investment income | | | 1.12 | % | | | 0.79 | % | | | 0.93 | % | | | 1.35 | % | | | 1.42 | % |
Total expenses5 | | | 0.78 | % | | | 0.78 | % | | | 0.78 | % | | | 0.78 | % | | | 0.66 | % |
Expenses after payments, waivers and/or
reimbursements and reduction to custodian expenses | | | 0.78 | % | | | 0.78 | % | | | 0.78 | % | | | 0.78 | % | | | 0.66 | % |
| Portfolio turnover rate | | | 37 | % | | | 38 | % | | | 45 | % | | | 128 | % | | | 132 | % |
1. December 30, 2011 represents the last business day of the Fund’s 2011 fiscal year. See Note 1 of the accompanying Notes.
2. Per share amounts calculated based on the average shares outstanding during the period.
3. Assumes an initial investment on the business day before the first day of the fiscal period, with all dividends and distributions reinvested in additional shares on the reinvestment date, and redemption at the net asset value calculated on the last business day of the fiscal period. Total returns are not annualized for periods less than one full year. Total return information does not reflect expenses that apply at the separate account level or to related insurance products. Inclusion of these charges would reduce the total return figures for all periods shown. Returns do not reflect the deduction of taxes that a shareholder would pay on fund distributions or the redemption of fund shares.
4. Annualized for periods less than one full year.
5. Total expenses including indirect expenses from affiliated fund were as follows:
| | | | |
| Year Ended December 31, 2012 | | | 0.78 | % |
| Year Ended December 30, 2011 | | | 0.78 | % |
| Year Ended December 31, 2010 | | | 0.78 | % |
| Year Ended December 31, 2009 | | | 0.78 | % |
| Year Ended December 31, 2008 | | | 0.66 | % |
See accompanying Notes to Financial Statement.
| | | | |
| 12 | | | | OPPENHEIMER MAIN STREET FUND/VA |
| | | | | | | | | | | | | | | | | | | | |
| Service Shares | | Year Ended
December 31,
2012 | | | Year Ended
December 30,
20111 | | | Year Ended
December 31,
2010 | | | Year Ended
December 31,
2009 | | | Year Ended
December 31,
2008 | |
| Per Share Operating Data | | | | | | | | | | | | | | | |
| Net asset value, beginning of period | | $ | 20.53 | | | $ | 20.71 | | | $ | 18.04 | | | $ | 14.42 | | | $ | 25.38 | |
| Income (loss) from investment operations: | | | | | | | | | | | | | | | | | | | | |
| Net investment income2 | | | 0.20 | | | | 0.11 | | | | 0.13 | | | | 0.17 | | | | 0.24 | |
| Net realized and unrealized gain (loss) | |
| 3.20
|
| |
| (0.17
| )
| |
| 2.70
|
| |
| 3.70
|
| |
| (9.56
| )
|
| Total from investment operations | | | 3.40 | | | | (0.06 | ) | | | 2.83 | | | | 3.87 | | | | (9.32 | ) |
| Dividends and/or distributions to shareholders: | | | | | | | | | | | | | | | | | | | | |
| Dividends from net investment income | | | (0.15 | ) | | | (0.12 | ) | | | (0.16 | ) | | | (0.25 | ) | | | (0.26 | ) |
| Distributions from net realized gain | |
| 0.00
|
| |
| 0.00
|
| |
| 0.00
|
| |
| 0.00
|
| |
| (1.38
| )
|
| Total dividends and/or distributions to shareholders | | | (0.15 | ) | | | (0.12 | ) | | | (0.16 | ) | | | (0.25 | ) | | | (1.64 | ) |
| Net asset value, end of period | | $
| 23.78
|
| | $
| 20.53
|
| | $
| 20.71
|
| | $
| 18.04
|
| | $
| 14.42
|
|
| Total Return, at Net Asset Value3 | | | 16.61 | % | | | (0.32 | )% | | | 15.83 | % | | | 27.99 | % | | | (38.63 | )% |
| | | | | | | | | | | | | | | | | | | | | |
| Ratios/Supplemental Data | | | | | | | | | | | | | | | | | | | | |
Net assets, end of period (in thousands) | | $ | 869,372 | | | $ | 1,003,184 | | | $ | 1,185,456 | | | $ | 1,154,210 | | | $ | 1,020,103 | |
| Average net assets (in thousands) | | $ | 913,871 | | | $ | 1,094,254 | | | $ | 1,193,630 | | | $ | 1,029,909 | | | $ | 1,268,430 | |
| Ratios to average net assets:4 | | | | | | | | | | | | | | | | | | | | |
Net investment income | | | 0.85 | % | | | 0.54 | % | | | 0.68 | % | | | 1.10 | % | | | 1.20 | % |
Total expenses5 | | | 1.03 | % | | | 1.03 | % | | | 1.03 | % | | | 1.03 | % | | | 0.91 | % |
| Expenses after payments, waivers and/or reimbursements and reduction to custodian expenses | | | 1.03 | % | | | 1.03 | % | | | 1.03 | % | | | 1.03 | % | | | 0.91 | % |
| Portfolio turnover rate | | | 37 | % | | | 38 | % | | | 45 | % | | | 128 | % | | | 132 | % |
1. December 30, 2011 represents the last business day of the Fund’s 2011 fiscal year. See Note 1 of the accompanying Notes.
2. Per share amounts calculated based on the average shares outstanding during the period.
3. Assumes an initial investment on the business day before the first day of the fiscal period, with all dividends and distributions reinvested in additional shares on the reinvestment date, and redemption at the net asset value calculated on the last business day of the fiscal period. Total returns are not annualized for periods less than one full year. Total return information does not reflect expenses that apply at the separate account level or to related insurance products. Inclusion of these charges would reduce the total return figures for all periods shown. Returns do not reflect the deduction of taxes that a shareholder would pay on fund distributions or the redemption of fund shares.
4. Annualized for periods less than one full year.
5. Total expenses including indirect expenses from affiliated fund were as follows:
| | | | |
| Year Ended December 31, 2012 | | | 1.03 | % |
| Year Ended December 30, 2011 | | | 1.03 | % |
| Year Ended December 31, 2010 | | | 1.03 | % |
| Year Ended December 31, 2009 | | | 1.03 | % |
| Year Ended December 31, 2008 | | | 0.91 | % |
See accompanying Notes to Financial Statement.
| | | | |
| 13 | | | | OPPENHEIMER MAIN STREET FUND/VA |
NOTES TO FINANCIAL STATEMENTS
1. Significant Accounting Policies
Oppenheimer Main Street Fund/VA (the “Fund”) is a separate series of Oppenheimer Variable Account Funds, a diversified open-end management investment company registered under the Investment Company Act of 1940, as amended. The Fund’s investment objective is to seek high total return. The Fund’s investment adviser is OppenheimerFunds, Inc. (the “Manager”).
The Fund offers two classes of shares. Both classes are sold at their offering price, which is the net asset value per share, to separate investment accounts of participating insurance companies as an underlying investment for variable life insurance policies, variable annuity contracts or other investment products. The class of shares designated as Service shares is subject to a distribution and service plan. Both classes of shares have identical rights and voting privileges with respect to the Fund in general and exclusive voting rights on matters that affect that class alone. Earnings, net assets and net asset value per share may differ due to each class having its own expenses, such as transfer and shareholder servicing agent fees and shareholder communications, directly attributable to that class.
The following is a summary of significant accounting policies consistently followed by the Fund.
Previous Annual Period. The last day of the Fund’s fiscal year was the last day the New York Stock Exchange was open for trading. The Fund’s financial statements have been presented through that date to maintain consistency with the Fund’s net asset value calculations used for shareholder transactions.
Investment in Oppenheimer Institutional Money Market Fund. The Fund is permitted to invest daily available cash balances in an affiliated money market fund. The Fund may invest the available cash in Class E shares of Oppenheimer Institutional Money Market Fund (“IMMF”) to seek current income while preserving liquidity. IMMF is a registered open-end management investment company, regulated as a money market fund under the Investment Company Act of 1940, as amended. The Manager is also the investment adviser of IMMF. When applicable, the Fund’s investment in IMMF is included in the Statement of Investments. Shares of IMMF are valued at their net asset value per share. As a shareholder, the Fund is subject to its proportional share of IMMF’s Class E expenses, including its management fee. The Manager will waive fees and/or reimburse Fund expenses in an amount equal to the indirect management fees incurred through the Fund’s investment in IMMF.
Foreign Currency Translation. The Fund’s accounting records are maintained in U.S. dollars. The values of securities denominated in foreign currencies and amounts related to the purchase and sale of foreign securities and foreign investment income are translated into U.S. dollars as of the close of the Exchange, normally 4:00 P.M. Eastern time, on each day the Exchange is open for trading. Foreign exchange rates may be valued primarily using a reliable bank, dealer or service authorized by the Board of Trustees.
Reported net realized gains and losses from foreign currency transactions arise from sales of portfolio securities, sales and maturities of short-term securities, sales of foreign currencies, exchange rate fluctuations between the trade and settlement dates on securities transactions, and the difference between the amounts of dividends, interest, and foreign withholding taxes recorded on the Fund’s books and the U.S. dollar equivalent of the amounts actually received or paid. Net unrealized appreciation and depreciation on the translation of assets and liabilities denominated in foreign currencies arise from changes in the values of assets and liabilities, including investments in securities at fiscal period end, resulting from changes in exchange rates.
The effect of changes in foreign currency exchange rates on investments is separately identified from the fluctuations arising from changes in market values of securities held and reported with all other foreign currency gains and losses in the Fund’s Statement of Operations.
Allocation of Income, Expenses, Gains and Losses. Income, expenses (other than those attributable to a specific class), gains and losses are allocated on a daily basis to each class of shares based upon the relative proportion of net assets represented by such class. Operating expenses directly attributable to a specific class are charged against the operations of that class.
Federal Taxes. The Fund intends to comply with provisions of the Internal Revenue Code applicable to regulated investment companies and to distribute substantially all of its investment company taxable income, including any net realized gain on investments not offset by capital loss carryforwards, if any, to shareholders. Therefore, no federal income or excise tax provision is required. The Fund files income tax returns in U.S. federal and applicable state jurisdictions. The statute of limitations on the Fund’s tax return filings generally remain open for the three preceding fiscal reporting period ends.
The tax components of capital shown in the following table represent distribution requirements the Fund must satisfy under the income tax regulations, losses the Fund may be able to offset against income and gains realized in future years and unrealized appreciation or depreciation of securities and other investments for federal income tax purposes.
| | | | | | | | | | | | |
Undistributed Net Investment Income | | Undistributed
Long-Term
Gain | | | Accumulated
Loss
Carryforward1,2,3,4 | | | Net Unrealized
Appreciation
Based on cost of
Securities and
Other Investments
for Federal Income
Tax Purposes | |
| $12,795,086 | | $ | — | | | $ | 207,597,819 | | | $ | 338,190,651 | |
1. As of December 31, 2012, the Fund had $206,513,730 of net capital loss carryforwards available to offset future realized capital gains, if any, and thereby reduce future taxable gain distributions. Details of the capital loss carryforwards are included in the table below. Capital loss carryovers with no expiration, if any, must be utilized prior to those with expiration dates.
| | | | |
| 14 | | | | OPPENHEIMER MAIN STREET FUND/VA |
1. Significant Accounting Policies (Continued)
| | | | |
| Expiring | | | |
| 2015 | | $ | 7,541,964 | |
| 2016 | | | 2,513,988 | |
| 2017 | | | 196,457,778 | |
| | |
|
|
|
| Total | | $ | 206,513,730 | |
| | |
|
|
|
Of these losses, $10,055,952 are subject to loss limitation rules resulting from merger activity. These limitations generally reduce the utilization of these losses to a maximum of $2,513,988 per year.
2. As of December 31, 2012, the Fund had $1,084,089 of post-October losses available to offset future realized capital gains, if any.
3. During the fiscal year ended December 31, 2012, the Fund utilized $171,704,991 of capital loss carryforward to offset capital gains realized in that fiscal year.
4. During the fiscal year ended December 30, 2011, the Fund utilized $65,914,487 of capital loss carryforward to offset capital gains realized in that fiscal year.
Net investment income (loss) and net realized gain (loss) may differ for financial statement and tax purposes. The character of dividends and distributions made during the fiscal year from net investment income or net realized gains may differ from their ultimate characterization for federal income tax purposes. Also, due to timing of dividends and distributions, the fiscal year in which amounts are distributed may differ from the fiscal year in which the income or net realized gain was recorded by the Fund.
Accordingly, the following amounts have been reclassified for December 31, 2012. Net assets of the Fund were unaffected by the reclassifications.
| | | | | | | | |
Increase to Paid-in Capital | | Increase to
Accumulated Net Investment
Income | | | Increase to
Accumulated Net
Realized Loss on
Investments | |
| $11,758,601 | | $ | 5,637,828 | | | $ | 17,396,429 | |
The tax character of distributions paid during the years ended December 31, 2012 and December 31, 2011 was as follows:
| | | | | | | | |
| | | Year Ended
December 31, 2012 | | | Year Ended
December 31, 2011 | |
Distributions paid from: | | | | | | | | |
| Ordinary income | | $ | 10,618,930 | | | $ | 10,322,764 | |
The aggregate cost of securities and other investments and the composition of unrealized appreciation and depreciation of securities and other investments for federal income tax purposes as of December 31, 2012 are noted in the following table. The primary difference between book and tax appreciation or depreciation of securities and other investments, if applicable, is attributable to the tax deferral of losses or tax realization of financial statement unrealized gain or loss.
| | | | |
| Federal tax cost of securities | | $ | 1,018,012,475 | |
| | |
|
|
|
| Gross unrealized appreciation | | $ | 348,761,640 | |
| Gross unrealized depreciation | | | (10,570,989) | |
| | |
|
|
|
| Net unrealized appreciation | | $ | 338,190,651 | |
| | |
|
|
|
Trustees’ Compensation. The Board of Trustees has adopted a compensation deferral plan for independent trustees that enables trustees to elect to defer receipt of all or a portion of the annual compensation they are entitled to receive from the Fund. For purposes of determining the amount owed to the Trustee under the plan, deferred amounts are treated as though equal dollar amounts had been invested in shares of the Fund or in other Oppenheimer funds selected by the Trustee. The Fund purchases shares of the funds selected for deferral by the Trustee in amounts equal to his or her deemed investment, resulting in a Fund asset equal to the deferred compensation liability. Such assets are included as a component of “Other” within the asset section of the Statement of Assets and Liabilities. Deferral of trustees’ fees under the plan will not affect the net assets of the Fund, and will not materially affect the Fund’s assets, liabilities or net investment income per share. Amounts will be deferred until distributed in accordance with the compensation deferral plan.
Dividends and Distributions to Shareholders. Dividends and distributions to shareholders, which are determined in accordance with income tax regulations and may differ from U.S. generally accepted accounting principles, are recorded on the ex-dividend date. Income and capital gain distributions, if any, are declared and paid annually or at other times as deemed necessary by the Manager.
Investment Income. Dividend income is recorded on the ex-dividend date or upon ex-dividend notification in the case of certain foreign dividends where the ex-dividend date may have passed. Non-cash dividends included in dividend income, if any, are recorded at the fair market value of the securities received. Interest income is recognized on an accrual basis. Discount and premium, which are included in interest income on the Statement of Operations, are amortized or accreted daily.
| | | | |
| 15 | | | | OPPENHEIMER MAIN STREET FUND/VA |
NOTES TO FINANCIAL STATEMENTS / (Continued)
1. Significant Accounting Policies (Continued)
Custodian Fees. “Custodian fees and expenses” in the Statement of Operations may include interest expense incurred by the Fund on any cash overdrafts of its custodian account during the period. Such cash overdrafts may result from the effects of failed trades in portfolio securities and from cash outflows resulting from unanticipated shareholder redemption activity. The Fund pays interest to its custodian on such cash overdrafts, to the extent they are not offset by positive cash balances maintained by the Fund, at a rate equal to the Federal Funds Rate plus 0.50%. The “Reduction to custodian expenses” line item, if applicable, represents earnings on cash balances maintained by the Fund during the period. Such interest expense and other custodian fees may be paid with these earnings.
Security Transactions. Security transactions are recorded on the trade date. Realized gains and losses on securities sold are determined on the basis of identified cost.
Indemnifications. The Fund’s organizational documents provide current and former trustees and officers with a limited indemnification against liabilities arising in connection with the performance of their duties to the Fund. In the normal course of business, the Fund may also enter into contracts that provide general indemnifications. The Fund’s maximum exposure under these arrangements is unknown as this would be dependent on future claims that may be made against the Fund. The risk of material loss from such claims is considered remote.
Other. The preparation of financial statements in conformity with accounting principles generally accepted in the United States of America requires management to make estimates and assumptions that affect the reported amounts of assets and liabilities and disclosure of contingent assets and liabilities at the date of the financial statements and the reported amounts of increases and decreases in net assets from operations during the reporting period. Actual results could differ from those estimates.
2. Securities Valuation
The Fund calculates the net asset value of its shares as of the close of the New York Stock Exchange (the “Exchange”), normally 4:00 P.M. Eastern time, on each day the Exchange is open for trading.
The Fund’s Board has adopted procedures for the valuation of the Fund’s securities and has delegated the day-to-day responsibility for valuation determinations under those procedures to the Manager. The Manager has established a Valuation Committee which is responsible for determining a “fair valuation” for any security for which market quotations are not “readily available.” The Valuation Committee’s fair valuation determinations are subject to review, approval and ratification by the Fund’s Board at its next regularly scheduled meeting covering the calendar quarter in which the fair valuation was determined.
Valuation Methods and Inputs
Securities are valued using unadjusted quoted market prices, when available, as supplied primarily by third party pricing services or dealers.
The following methodologies are used to determine the market value or the fair value of the types of securities described below:
Securities traded on a registered U.S. securities exchange (including exchange-traded derivatives other than futures and futures options) are valued based on the last sale price of the security reported on the principal exchange on which it is traded, prior to the time when the Fund’s assets are valued. In the absence of a sale, the security is valued at the last sale price on the prior trading day, if it is within the spread of the current day’s closing “bid” and “asked” prices, and if not, at the current day’s closing bid price. A security of a foreign issuer traded on a foreign exchange but not listed on a registered U.S. securities exchange is valued based on the last sale price on the principal exchange on which the security
is traded, as identified by the third party pricing service used by the Manager, prior to the time when the Fund’s assets are valued. If the last sale price is unavailable, the security is valued at the most recent official closing price on the principal exchange on which it is traded. If the last sales price or official closing price for a foreign security is not available, the security is valued at the mean between the bid and asked price per the exchange or, if not available from the exchange, obtained from two dealers. If bid and asked prices are not available from either the exchange or two dealers, the security is valued by using one of the following methodologies (listed in order of priority); (1) using a bid from the exchange, (2) the mean between the bid and asked price as provided by a single dealer, or (3) a bid from a single dealer.
Shares of a registered investment company that are not traded on an exchange are valued at that investment company’s net asset value per share.
Corporate and government debt securities (of U.S. or foreign issuers) and municipal debt securities, event-linked bonds, loans, mortgage-backed securities, collateralized mortgage obligations, and asset-backed securities are valued at the mean between the “bid” and “asked” prices utilizing evaluated prices obtained from third party pricing services or broker-dealers who may use matrix pricing methods to determine the evaluated prices.
Short-term money market type debt securities with a remaining maturity of sixty days or less are valued at cost adjusted by the amortization of discount or premium to maturity (amortized cost), which approximates market value. Short-term debt securities with a remaining maturity in excess of sixty days are valued at the mean between the “bid” and “asked” prices utilizing evaluated prices obtained from third party pricing services or broker-dealers.
Forward foreign currency exchange contracts are valued utilizing current and forward currency rates obtained from third party pricing services. When the settlement date of a contract is an interim date for which a quotation is not available, interpolated values are derived using the nearest dated forward currency rate.
| | | | |
| 16 | | | | OPPENHEIMER MAIN STREET FUND/VA |
2. Securities Valuation (Continued)
A description of the standard inputs that may generally be considered by the third party pricing vendors in determining their evaluated prices is provided below.
| | |
| Security Type | | Standard inputs generally considered by third-party pricing vendors |
| Corporate debt, government debt, municipal, mortgage-backed and asset-backed securities | | Reported trade data, broker-dealer price quotations, benchmark yields, issuer spreads on comparable securities, the credit quality, yield, maturity, and other appropriate factors. |
| Loans | | Information obtained from market participants regarding reported trade data and broker-dealer price quotations. |
| Event-linked bonds | | Information obtained from market participants regarding reported trade data and broker-dealer price quotations. |
If a market value or price cannot be determined for a security using the methodologies described above, or if, in the “good faith” opinion of the Manager, the market value or price obtained does not constitute a “readily available market quotation,” or a significant event has occurred that would materially affect the value of the security the security is fair valued either (i) by a standardized fair valuation methodology applicable to the security type or the significant event as previously approved by the Valuation Committee and the Fund’s Board or (ii) as determined in good faith by the Manager’s Valuation Committee. The Valuation Committee considers all relevant facts that are reasonably available, through either public information or information available to the Manager, when determining the fair value of a security. Fair value determinations by the Manager are subject to review, approval and ratification by the Fund’s Board at its next regularly scheduled meeting covering the calendar quarter in which the fair valuation was determined. Those fair valuation standardized methodologies include, but are not limited to, valuing securities at the last sale price or initially at cost and subsequently adjusting the value based on: changes in company specific fundamentals, changes in an appropriate securities index, or changes in the value of similar securities which may be further adjusted for any discounts related to security-specific resale restrictions. When possible, such methodologies use observable market inputs such as unadjusted quoted prices of similar securities, observable interest rates, currency rates and yield curves. The methodologies used for valuing securities are not necessarily an indication of the risks associated with investing in those securities nor can it be assured that the Fund can obtain the fair value assigned to a security if it were to sell the security.
To assess the continuing appropriateness of security valuations, the Manager, or its third party service provider who is subject to oversight by the Manager, regularly compares prior day prices, prices on comparable securities, and sale prices to the current day prices and challenges those prices exceeding certain tolerance levels with the third party pricing service or broker source. For those securities valued by fair valuations, whether through a standardized fair valuation methodology or a fair valuation determination, the Valuation Committee reviews and affirms the reasonableness of the valuations based on such methodologies and fair valuation determinations on a regular basis after considering all relevant information that is reasonably available.
Classifications
Each investment asset or liability of the Fund is assigned a level at measurement date based on the significance and source of the inputs to its valuation. Various data inputs are used in determining the value of each of the Fund’s investments as of the reporting period end. These data inputs are categorized in the following hierarchy under applicable financial accounting standards:
| | 1) | Level 1—unadjusted quoted prices in active markets for identical assets or liabilities (including securities actively traded on a securities exchange) |
| | 2) | Level 2—inputs other than unadjusted quoted prices that are observable for the asset or liability (such as unadjusted quoted prices for similar assets and market corroborated inputs such as interest rates, prepayment speeds, credit risks, etc.) |
| | 3) | Level 3—significant unobservable inputs (including the Manager’s own judgments about assumptions that market participants would use in pricing the asset or liability). |
The inputs used for valuing securities are not necessarily an indication of the risks associated with investing in those securities.
The table below categorizes amounts that are included in the Fund’s Statement of Assets and Liabilities as of December 31, 2012 based on valuation input level:
| | | | | | | | | | | | | | | | |
| | | Level 1—
Unadjusted
Quoted Prices | | | Level 2—
Other Significant
Observable Inputs | | | Level 3—
Significant
Unobservable
Inputs | | | Value | |
| Assets Table | | | | | | | | | | | | | | | | |
| Investments, at Value: | | | | | | | | | | | | | | | | |
| Common Stocks | | | | | | | | | | | | | | | | |
Consumer Discretionary | | $ | 123,224,279 | | | $ | — | | | $ | — | | | $ | 123,224,279 | |
Consumer Staples | | | 157,819,068 | | | | — | | | | — | | | | 157,819,068 | |
Energy | | | 113,087,505 | | | | — | | | | — | | | | 113,087,505 | |
Financials | | | 256,342,762 | | | | — | | | | — | | | | 256,342,762 | |
Health Care | | | 163,290,274 | | | | 14,814,200 | | | | — | | | | 178,104,474 | |
Industrials | | | 153,217,855 | | | | — | | | | — | | | | 153,217,855 | |
Information Technology | | | 279,316,324 | | | | — | | | | — | | | | 279,316,324 | |
Materials | | | 31,257,884 | | | | — | | | | — | | | | 31,257,884 | |
Telecommunication Services | | | 28,082,982 | | | | — | | | | — | | | | 28,082,982 | |
Utilities | | | 10,812,564 | | | | — | | | | — | | | | 10,812,564 | |
| Investment Company | | | 24,937,150 | | | | — | | | | — | | | | 24,937,150 | |
| | |
|
|
| |
|
|
| |
|
|
| |
|
|
|
| Total Assets | | $ | 1,341,388,647 | | | $ | 14,814,200 | | | $ | — | | | $ | 1,356,202,847 | |
| | |
|
|
| |
|
|
| |
|
|
| |
|
|
|
| Liabilities Table | | | | | | | | | | | | | | | | |
| Other Financial Instruments: | | | | | | | | | | | | | | | | |
| Foreign Currency Contracts | | $ | — | | | $ | (2,121 | ) | | $ | — | | | $ | (2,121 | ) |
| | |
|
|
| |
|
|
| |
|
|
| |
|
|
|
| Total Liabilities | | $ | — | | | $ | (2,121 | ) | | $ | — | | | $ | (2,121 | ) |
| | |
|
|
| |
|
|
| |
|
|
| |
|
|
|
| | | | |
| 17 | | | | OPPENHEIMER MAIN STREET FUND/VA |
NOTES TO FINANCIAL STATEMENTS / (Continued)
2. Securities Valuation (Continued)
Currency contracts and forwards, if any, are reported at their unrealized appreciation/ depreciation at measurement date, which represents the change in the contract’s value from trade date. Futures, if any, are reported at their variation margin at measurement date, which represents the amount due to/from the Fund at that date. All additional assets and liabilities included in the above table are reported at their market value at measurement date.
There have been no significant changes to the fair valuation methodologies of the Fund during the period.
3. Shares of Beneficial Interest
The Fund has authorized an unlimited number of $0.001 par value shares of beneficial interest of each class. Transactions in shares of beneficial interest were as follows:
| | | | | | | | | | | | | | | | |
| | | Year Ended December 31, 2012 | | | Year Ended December 30, 2011 | |
| | | Shares | | | Amount | | | Shares | | | Amount | |
| Non-Service Shares | | | | | | | | | | | | | | | | |
| Sold | | | 1,232,469 | | | $ | 28,052,495 | | | | 2,028,214 | | | $ | 41,337,389 | |
| Dividends and/or distributions reinvested | | | 209,174 | | | | 4,702,221 | | | | 176,503 | | | | 3,755,987 | |
| Acquisition—Note 7 | | | 3,253,848 | | | | 77,116,190 | | | | — | | | | — | |
| Redeemed | | | (3,592,251 | ) | | | (82,456,082 | ) | | | (5,726,116 | ) | | | (118,191,402 | ) |
| | |
|
|
| |
|
|
| |
|
|
| |
|
|
|
| Net increase (decrease) | | | 1,103,240 | | | $ | 27,414,824 | | | | (3,521,399 | ) | | $ | (73,098,026 | ) |
| | |
|
|
| |
|
|
| |
|
|
| |
|
|
|
| | | | | | | | | | | | | |
| Service Shares | | | | | | | | | | | | | | | | |
| Sold | | | 1,461,740 | | | $ | 33,302,188 | | | | 2,150,725 | | | $ | 42,852,883 | |
| Dividends and/or distributions reinvested | | | 264,967 | | | | 5,916,709 | | | | 310,633 | | | | 6,566,777 | |
| Redeemed | | | (14,016,400 | ) | | | (314,147,824 | ) | | | (10,851,128 | ) | | | (222,264,557 | ) |
| | |
|
|
| |
|
|
| |
|
|
| |
|
|
|
| Net decrease | | | (12,289,693 | ) | | $ | (274,928,927 | ) | | | (8,389,770 | ) | | $ | (172,844,897 | ) |
| | |
|
|
| |
|
|
| |
|
|
| |
|
|
|
4. Purchases and Sales of Securities
The aggregate cost of purchases and proceeds from sales of securities, other than short-term obligations and investments in IMMF, for the year ended December 31, 2012, were as follows:
| | | | | | | | |
| | | Purchases | | | Sales | |
| Investment securities | | $ | 501,540,610 | | | $ | 842,860,107 | |
5. Fees and Other Transactions with Affiliates
Management Fees. Under the investment advisory agreement, the Fund pays the Manager a management fee based on the daily net assets of the Fund at an annual rate as shown in the following table:
| | | | |
| Fee Schedule | | | |
| Up to $200 million | | | 0.75 | % |
| Next $200 million | | | 0.72 | |
| Next $200 million | | | 0.69 | |
| Next $200 million | | | 0.66 | |
| Over $800 million | | | 0.60 | |
Administrative Service Fees. The Fund pays the Manager a fee of $1,500 per year for preparing and filing the Fund’s tax returns.
Transfer Agent Fees. OppenheimerFunds Services (“OFS”), a division of the Manager, acts as the transfer and shareholder servicing agent for the Fund. For the year ended December 31, 2012, the Fund paid $1,385,301 to OFS for services to the Fund.
Distribution and Service Plan for Service Shares. The Fund has adopted a Distribution and Service Plan (the “Plan”) in accordance with Rule 12b-1 under the Investment Company Act of 1940 for Service shares to pay OppenheimerFunds Distributor, Inc. (the “Distributor”), for distribution related services, personal service and account maintenance for the Fund’s Service shares. Under the Plan, payments are made periodically at an annual rate of 0.25% of the daily net assets of Service shares of the Fund. The Distributor currently uses all of those fees to compensate sponsors of the insurance product that offers Fund shares, for providing personal service and maintenance of accounts of their variable contract owners that hold Service shares. These fees are paid out of the Fund’s assets on an on-going basis and increase operating expenses of the Service shares, which results in lower performance compared to the Fund’s shares that are not subject to a service fee. Fees incurred by the Fund under the Plan are detailed in the Statement of Operations.
| | | | |
| 18 | | | | OPPENHEIMER MAIN STREET FUND/VA |
5. Fees and Other Transactions with Affiliates (Continued)
Waivers and Reimbursements of Expenses. The Manager has voluntarily agreed to limit the Fund’s expenses after payments, waivers and/or reimbursements and reduction to custodian expenses, excluding expenses incurred directly or indirectly by the Fund as a result of investments in other investment companies, wholly-owned subsidiaries and pooled investment vehicles; so that those expenses, as percentages of daily net assets, will not exceed the annual rate of 0.80% for Non-Service shares and 1.05% for Service shares.
The Manager will waive fees and/or reimburse Fund expenses in an amount equal to the indirect management fees incurred through the Fund’s investment in IMMF. During the year ended December 31, 2012, the Manager waived fees and/or reimbursed the Fund $15,882 for IMMF management fees.
Some of these undertakings may be modified or terminated at any time; some may not be modified or terminated until after one year from the date of the current prospectus, as indicated therein.
6. Risk Exposures and the Use of Derivative Instruments
The Fund’s investment objectives not only permit the Fund to purchase investment securities, they also allow the Fund to enter into various types of derivatives contracts, including, but not limited to, futures contracts, forward foreign currency exchange contracts, credit default swaps, interest rate swaps, total return swaps, and purchased and written options. In doing so, the Fund will employ strategies in differing combinations to permit it to increase, decrease, or change the level or types of exposure to market risk factors. Central to those strategies are features inherent to derivatives that make them more attractive for this purpose than equity and debt securities: they require little or no initial cash investment, they can focus exposure on only certain selected risk factors, and they may not require the ultimate receipt or delivery of the underlying security (or securities) to the contract. This may allow the Fund to pursue its objectives more quickly and efficiently than if it were to make direct purchases or sales of securities capable of effecting a similar response to market factors.
Market Risk Factors. In accordance with its investment objectives, the Fund may use derivatives to increase or decrease its exposure to one or more of the following market risk factors:
Commodity Risk. Commodity risk relates to the change in value of commodities or commodity indexes as they relate to increases or decreases in the commodities market. Commodities are physical assets that have tangible properties. Examples of these types of assets are crude oil, heating oil, metals, livestock, and agricultural products.
Credit Risk. Credit risk relates to the ability of the issuer to meet interest and principal payments, or both, as they come due. In general, lower-grade, higher-yield bonds are subject to credit risk to a greater extent than lower-yield, higher-quality bonds.
Equity Risk. Equity risk relates to the change in value of equity securities as they relate to increases or decreases in the general market.
Foreign Exchange Rate Risk. Foreign exchange rate risk relates to the change in the U.S. dollar value of a security held that is denominated in a foreign currency. The U.S. dollar value of a foreign currency denominated security will decrease as the dollar appreciates against the currency, while the U.S. dollar value will increase as the dollar depreciates against the currency.
Interest Rate Risk. Interest rate risk refers to the fluctuations in value of fixed-income securities resulting from the inverse relationship between price and yield. For example, an increase in general interest rates will tend to reduce the market value of already issued fixed-income investments, and a decline in general interest rates will tend to increase their value. In addition, debt securities with longer maturities, which tend to have higher yields, are subject to potentially greater fluctuations in value from changes in interest rates than obligations with shorter maturities.
Volatility Risk. Volatility risk refers to the magnitude of the movement, but not the direction of the movement, in a financial instrument’s price over a defined time period. Large increases or decreases in a financial instrument’s price over a relative time period typically indicate greater volatility risk, while small increases or decreases in its price typically indicate lower volatility risk.
The Fund’s actual exposures to these market risk factors during the period are discussed in further detail, by derivative type, below.
Risks of Investing in Derivatives. The Fund’s use of derivatives can result in losses due to unanticipated changes in the market risk factors and the overall market. In instances where the Fund is using derivatives to decrease, or hedge, exposures to market risk factors for securities held by the Fund, there are also risks that those derivatives may not perform as expected resulting in losses for the combined or hedged positions.
Derivatives may have little or no initial cash investment relative to their market value exposure and therefore can produce significant gains or losses in excess of their cost. This use of embedded leverage allows the Fund to increase its market value exposure relative to its net assets and can substantially increase the volatility of the Fund’s performance.
Additional associated risks from investing in derivatives also exist and potentially could have significant effects on the valuation of the derivative and the Fund. Typically, the associated risks are not the risks that the Fund is attempting to increase or decrease exposure to, per its investment objectives, but are the additional risks from investing in derivatives. Examples of these associated risks are liquidity risk, which is the risk that the Fund will not be able to sell the derivative in the open market in a timely manner, and counterparty credit risk, which is the risk that the counterparty will not fulfill its obligation to the Fund. Associated risks can be different for each type of derivative and are discussed by each derivative type in the notes that follow.
Counterparty Credit Risk. Certain derivative positions are subject to counterparty credit risk, which is the risk that the counterparty will not fulfill its obligation to the Fund. The Fund’s derivative counterparties are financial institutions who are subject to market conditions that may weaken their financial position. The Fund intends to enter into financial transactions with counterparties that the Manager believes to be creditworthy at the time of the transaction.
| | | | |
| 19 | | | | OPPENHEIMER MAIN STREET FUND/VA |
NOTES TO FINANCIAL STATEMENTS / (Continued)
6. Risk Exposures and the Use of Derivative Instruments (Continued)
Credit Related Contingent Features. The Fund’s agreements with derivative counterparties have several credit related contingent features that if triggered would allow its derivatives counterparties to close out and demand payment or additional collateral to cover their exposure from the Fund. Credit related contingent features are established between the Fund and its derivatives counterparties to reduce the risk that the Fund will not fulfill its payment obligations to its counterparties. These triggering features include, but are not limited to, a percentage decrease in the Fund’s net assets and or a percentage decrease in the Fund’s Net Asset Value or NAV. The contingent features are established within the Fund’s International Swap and Derivatives Association, Inc. master agreements which govern certain positions in swaps, over-the-counter options and swaptions, and forward currency exchange contracts for each individual counterparty.
Valuations of derivative instruments as of December 31, 2012 are as follows:
| | | | | | |
| | | Liability Derivatives
| |
Derivatives Not Accounted for as Hedging Instruments | | Statement of Assets and Liabilities Location | | Value | |
Foreign exchange contracts | | Unrealized depreciation on foreign currency exchange contracts | | $ | 2,121 | |
The effect of derivative instruments on the Statement of Operations is as follows:
| | |
| Amounts of Realized Gain or (Loss) Recognized on Derivatives |
Derivatives Not Accounted for as Hedging Instruments | | Foreign currency transactions |
| Foreign exchange contracts | | $15,438 |
|
| Amount of Change in Unrealized Gain or (Loss) Recognized on Derivatives |
Derivatives Not Accounted
for as Hedging Instruments | | Translation of assets and liabilities denominated in foreign currencies |
| Foreign exchange contracts | | $(2,121) |
Foreign Currency Exchange Contracts
The Fund may enter into foreign currency exchange contracts (“forward contracts”) for the purchase or sale of a foreign currency at a negotiated rate at a future date.
Forward contracts are reported on a schedule following the Statement of Investments. The unrealized appreciation (depreciation) is reported in the Statement of Assets and Liabilities as a receivable or payable and in the Statement of Operations within the change in unrealized appreciation (depreciation). At contract close, the difference between the original cost of the contract and the value at the close date is recorded as a realized gain (loss) in the Statement of Operations.
The Fund has purchased and sold certain forward foreign currency exchange contracts of different currencies in order to acquire currencies to pay for or sell currencies to acquire related foreign securities purchase and sale transactions, respectively, or to convert foreign currencies to U.S. dollars from related foreign securities transactions. These foreign currency exchange contracts are negotiated at the current spot exchange rate with settlement typically within two business days thereafter.
During the year ended December 31, 2012, the Fund had daily average contract amounts on forward foreign currency contracts to buy and sell of $234,354 and $27,065, respectively.
Additional associated risk to the Fund includes counterparty credit risk. Counterparty credit risk arises from the possibility that the counterparty will default.
7. Acquisition of Growth Portfolio
On April 26, 2012, the Fund acquired all of the net assets of Growth Portfolio, pursuant to an Agreement and Plan of Reorganization approved by the Growth Portfolio shareholders on April 20, 2012. The purpose of this acquisition is to combine two funds with similar investment objectives, strategies and risks to allow shareholders to benefit from greater asset growth potential, as well as lowered total expenses. The transaction qualified as a tax-free reorganization, (the “merger”) for federal income tax purposes allowing the Fund to use the original cost basis of the investments received to calculate subsequent gains and losses for tax reporting purposes. Details of the merger are shown in the following table:
| | | | | | | | | | | | | | | | |
| | | Exchange
Ratio to One Share of the Growth
Portfolio | | | Shares of
Beneficial
Interest
Issued by
the Fund | | | Value of
Issued
Shares of
Beneficial
Interest | | | Combined
Net Assets on
April 26, 20121 | |
| Non-Service Shares | | | 0.0953467932 | | | | 3,253,848 | | | $ | 77,116,190 | | | $ | 517,094,352 | |
1. The net assets acquired included net unrealized appreciation of $18,020,315 and an unused capital loss carryforward of $35,875,587, potential utilization subject to tax limitations.
| | | | |
| 20 | | | | OPPENHEIMER MAIN STREET FUND/VA |
7. Acquisition of Growth Portfolio (Continued)
Had the merger occurred at the beginning of the reporting period, the Fund’s Statement of Operations would have been adjusted to the following amounts:
| | | | |
Net investment income | | $ | 13,227,862 | |
Net loss on investments | | | 209,238,968 | |
Net increase in net assets resulting from operations | | | 222,466,830 | |
8. Subsequent Event
The Board of Trustees of the Fund recently approved a series of modifications to the Fund’s investment advisory and transfer agency arrangements in connection with internal corporate restructuring efforts at OppenheimerFunds, Inc. (“OFI”). As a result of these modifications, on January 1, 2013 (the “Effective Date”), OFI Global Asset Management, Inc. (“OFI Global”), a wholly-owned subsidiary of OFI, became the investment adviser and transfer agent to the Fund under the terms of the Fund’s advisory agreement and transfer agency agreement, respectively. OFI Global, in turn, entered into a new sub-advisory agreement for the Fund, on the Effective Date, whereby OFI Global will have oversight and supervisory responsibilities and OFI will choose the Fund’s investments and provide related advisory services to the Fund. In addition, on the Effective Date, OFI Global entered into a sub-transfer agency agreement with Shareholder Services, Inc. doing business as OppenheimerFunds Services, a wholly-owned subsidiary of OFI, under which it will be responsible for providing transfer agency services to the Fund.
The realignment of advisory service responsibility between OFI Global and OFI did not result in any change in the persons managing the assets of the Fund, the level or nature of the advisory services provided to the Fund, or the fees charged to the Fund.
9. Pending Litigation
Since 2009, a number of class action lawsuits have been pending in federal courts against OppenheimerFunds, Inc., the Fund’s Adviser through December 31, 2012 and Sub-Adviser effective January 1, 2013 (the “Manager”), OppenheimerFunds Distributor, Inc., the Fund’s principal underwriter and distributor (the “Distributor”), and certain funds (but not including the Fund) advised by the Manager and distributed by the Distributor (the “Defendant Funds”). Several of these lawsuits also name as defendants certain officers and current and former trustees of the respective Defendant Funds. The lawsuits raise claims under federal securities law and allege, among other things, that the disclosure documents of the respective Defendant Funds contained misrepresentations and omissions and that the respective Defendant Funds’ investment policies were not followed. The plaintiffs in these actions seek unspecified damages, equitable relief and awards of attorneys’ fees and litigation expenses. The Defendant Funds’ Boards of Trustees have also engaged counsel to represent the Funds and the present and former Independent Trustees named in those suits.
Other class action and individual lawsuits have been filed since 2008 in various state and federal courts against the Manager and certain of its affiliates by investors seeking to recover investments they allegedly lost as a result of the “Ponzi” scheme run by Bernard L. Madoff and his firm, Bernard L. Madoff Investment Securities, LLC (“BLMIS”). Plaintiffs in these suits allege that they suffered losses as a result of their investments in several funds managed by an affiliate of the Manager and assert a variety of claims, including breach of fiduciary duty, fraud, negligent misrepresentation, unjust enrichment, and violation of federal and state securities laws and regulations, among others. They seek unspecified damages, equitable relief and awards of attorneys’ fees and litigation expenses. Neither the Distributor, nor any of the Oppenheimer mutual funds, their independent trustees or directors are named as defendants in these lawsuits. None of the Oppenheimer mutual funds invested in any funds or accounts managed by Madoff or BLMIS. On February 28, 2011, a stipulation of partial settlement of three groups of consolidated putative class action lawsuits relating to these matters was filed in the U.S. District Court for the Southern District of New York. On August 19, 2011, the court entered an order and final judgment approving the settlement as fair, reasonable and adequate. In September 2011, certain parties filed notices of appeal from the court’s order approving the settlement. The settlement does not resolve other outstanding lawsuits against the Manager and its affiliates relating to BLMIS.
On April 16, 2010, a lawsuit was filed in New York state court against the Manager, an affiliate of the Manager and AAArdvark IV Funding Limited (“AAArdvark IV”), an entity advised by the Manager’s affiliate, in connection with investments made by the plaintiffs in AAArdvark IV. Plaintiffs allege breach of contract against the defendants and seek compensatory damages, costs and disbursements, including attorney fees. On July 15, 2011, a lawsuit was filed in New York state court against the Manager, an affiliate of the Manager and AAArdvark Funding Limited (“AAArdvark I”), an entity advised by the Manager’s affiliate, in connection with investments made by the plaintiffs in AAArdvark I. The complaint alleges breach of contract against the defendants and seeks compensatory damages, costs and disbursements, including attorney fees. On November 9, 2011, a lawsuit was filed in New York state court against the Manager, an affiliate of the Manager and AAArdvark XS Funding Limited (“AAArdvark XS”), an entity advised by the Manager’s affiliate, in connection with investments made by the plaintiffs in AAArdvark XS. The complaint alleges breach of contract against the defendants and seeks compensatory damages, costs and disbursements, including attorney fees.
The Manager believes the lawsuits and appeals described above are without legal merit and, with the exception of actions it has settled, is defending against them vigorously. While it is premature to render any opinion as to the outcome in these lawsuits, or whether any costs that the Defendant Funds may bear in defending the suits might not be reimbursed by insurance, the Manager believes that these suits should not impair the ability of the Manager or the Distributor to perform their respective duties to the Fund, and that the outcome of all of the suits together should not have any material effect on the operations of any of the Oppenheimer mutual funds.
| | | | |
| 21 | | | | OPPENHEIMER MAIN STREET FUND/VA |
REPORT OF INDEPENDENT REGISTERED PUBLIC ACCOUNTING FIRM
The Board of Trustees and Shareholders of Oppenheimer Variable Account Funds:
We have audited the accompanying statement of assets and liabilities of Oppenheimer Main Street Fund/VA (a separate series of Oppenheimer Variable Account Funds), including the statement of investments, as of December 31, 2012, and the related statement of operations for the year then ended, the statements of changes in net assets for each of the years in the two-year period then ended and the financial highlights for each of the years in the four-year period then ended. These financial statements and financial highlights are the responsibility of the Fund’s management. Our responsibility is to express an opinion on these financial statements and financial highlights based on our audits. The accompanying financial highlights of Oppenheimer Main Street Fund/VA for the year ended December 31, 2008 were audited by other auditors whose report dated February 11, 2009 expressed an unqualified opinion on those financial highlights.
We conducted our audits in accordance with the standards of the Public Company Accounting Oversight Board (United States). Those standards require that we plan and perform the audit to obtain reasonable assurance about whether the financial statements and financial highlights are free of material misstatement. An audit includes examining, on a test basis, evidence supporting the amounts and disclosures in the financial statements. Our procedures included confirmation of securities owned as of December 31, 2012, by correspondence with the custodian, transfer agent and brokers, or by other appropriate auditing procedures where replies from brokers were not received. An audit also includes assessing the accounting principles used and significant estimates made by management, as well as evaluating the overall financial statement presentation. We believe that our audits provide a reasonable basis for our opinion.
In our opinion, the financial statements and financial highlights referred to above present fairly, in all material respects, the financial position of Oppenheimer Main Street Fund/VA as of December 31, 2012, the results of its operations for the year then ended, the changes in its net assets for each of the years in the two-year period then ended and the financial highlights for each of the years in the four-year period then ended, in conformity with U.S. generally accepted accounting principles.
KPMGLLP
Denver, Colorado
February 19, 2013
| | | | |
| 22 | | | | OPPENHEIMER MAIN STREET FUND/VA |
FEDERAL INCOME TAX INFORMATION Unaudited
In early 2013, if applicable, shareholders of record received information regarding all dividends and distributions paid to them by the Fund during calendar year 2012.
Dividends, if any, paid by the Fund during the fiscal year ended December 31, 2012 which are not designated as capital gain distributions should be multiplied by the maximum amount allowable but not less than 100% to arrive at the amount eligible for the corporate dividend-received deduction.
The foregoing information is presented to assist shareholders in reporting distributions received from the Fund to the Internal Revenue Service. Because of the complexity of the federal regulations which may affect your individual tax return and the many variations in state and local tax regulations, we recommend that you consult your tax advisor for specific guidance.
| | | | |
| 23 | | | | OPPENHEIMER MAIN STREET FUND/VA |
BOARD APPROVAL OF THE FUND’S INVESTMENT
ADVISORY AGREEMENT Unaudited
Each year, the Board of Trustees (the “Board”), including a majority of the independent Trustees, is required to determine whether to renew the Fund’s investment advisory agreement (the “Agreement”). The Investment Company Act of 1940, as amended, requires that the Board request and evaluate, and that the Manager provide, such information as may be reasonably necessary to evaluate the terms of the Agreement. The Board employs an independent consultant to prepare a report that provides information, including comparative information that the Board requests for that purpose. In addition to in-person meetings focused on this evaluation, the Board receives information throughout the year regarding Fund services, fees, expenses and performance.
The Manager and the independent consultant provided information to the Board on the following factors: (i) the nature, quality and extent of the Manager’s services, (ii) the investment performance of the Fund and the Manager, (iii) the fees and expenses of the Fund, including comparative expense information, (iv) the profitability of the Manager and its affiliates, including an analysis of the cost of providing services, (v) whether economies of scale are realized as the Fund grows and whether fee levels reflect these economies of scale for Fund investors and (vi) other benefits to the Manager from its relationship with the Fund. The Board was aware that there are alternatives to retaining the Manager.
Outlined below is a summary of the principal information considered by the Board as well as the Board’s conclusions.
Nature, Quality and Extent of Services. The Board considered information about the nature, quality and extent of the services provided to the Fund and information regarding the Manager’s key personnel who provide such services. The Manager’s duties include providing the Fund with the services of the portfolio managers and the Manager’s investment team, who provide research, analysis and other advisory services in regard to the Fund’s investments; securities trading services; oversight of third-party service providers; monitoring compliance with applicable Fund policies and procedures and adherence to the Fund’s investment restrictions; and risk management. The Manager is responsible for providing certain administrative services to the Fund as well. Those services include providing and supervising all administrative and clerical personnel who are necessary in order to provide effective corporate administration for the Fund; compiling and maintaining records with respect to the Fund’s operations; preparing and filing reports required by the Securities and Exchange Commission; preparing periodic reports regarding the operations of the Fund for its shareholders; preparing proxy materials for shareholder meetings; and preparing the registration statements required by Federal and state securities laws for the sale of the Fund’s shares. The Manager also provides the Fund with office space, facilities and equipment.
The Board also considered the quality of the services provided and the quality of the Manager’s resources that are available to the Fund. The Board took account of the fact that the Manager has had over fifty years of experience as an investment adviser and that its assets under management rank it among the top mutual fund managers in the United States. The Board evaluated the Manager’s advisory, administrative, accounting, legal, compliance services and risk management, and information the Board has received regarding the experience and professional qualifications of the Manager’s key personnel and the size and functions of its staff. In its evaluation of the quality of the portfolio management services provided, the Board considered the experience of Manind Govil and Benjamin Ram, the portfolio managers for the Fund, and the Manager’s investment team and analysts. The Board members also considered the totality of their experiences with the Manager as directors or trustees of the Fund and other funds advised by the Manager. The Board considered information regarding the quality of services provided by affiliates of the Manager, which its members have become knowledgeable about in connection with the renewal of the Fund’s service agreements. The Board concluded, in light of the Manager’s experience, reputation, personnel, operations and resources that the Fund benefits from the services provided under the Agreement.
Investment Performance of the Manager and the Fund. Throughout the year, the Manager provided information on the investment performance of the Fund, including comparative performance information. The Board also reviewed information, prepared by the Manager and by the independent consultant, comparing the Fund’s historical performance to relevant market indices and to the performance of other large-cap core funds underlying variable insurance products. The Board considered that the Fund outperformed its performance universe median during the one-, three-, five-, and ten-year periods.
Costs of Services by the Manager. The Board reviewed the fees paid to the Manager and the other expenses borne by the Fund. The Board also considered the comparability of the fees charged and the services provided to the Fund to the fees and services for other clients or accounts advised by the Manager. The independent consultant provided comparative data in regard to the fees and expenses of the Fund and other large-cap core funds underlying variable insurance products. In reviewing the fees and expenses charged to the VA funds, the Board considered the Manager’s assertion that, because there is much greater disparity in the fees and services that may be provided by a manager to a VA fund as opposed to a retail fund, when comparing the expenses of the various VA funds to those of retail funds, it is most appropriate to focus on total expenses (rather than on the management fees). Accordingly, while the Board reviewed and considered all expenses, it focused on total expenses. The Board considered that the Fund’s actual management fees were lower than its expense group median and average, although its total expenses were higher than its expense group median and average. The Board considered that the Manager has voluntarily agreed to waive fees and/or reimburse the Fund for certain expenses in order to limit total annual fund operating expenses after any fee waiver and/or expense reimbursement (excluding (i) interest, taxes, dividends tied to short sales, brokerage commissions, and other expenditures which are capitalized in accordance with generally accepted accounting principles; (ii) expenses incurred directly or indirectly by the Fund as a result of investments in other investment companies, wholly-owned subsidiaries and pooled investment vehicles; (iii) certain other expenses attributable to, and incurred as a result of, a Fund’s investments; and (iv) other extraordinary expenses (including litigation expenses) not incurred in the ordinary course of the Fund’s business) to annual rates of 0.80% for Non-Service shares and 1.05% for Service shares as calculated on the daily net assets of the fund. This waiver and/or reimbursement may be amended or withdrawn at any time without prior notice to shareholders.
Economies of Scale and Profits Realized by the Manager. The Board considered information regarding the Manager’s costs in serving as the Fund’s investment adviser, including the costs associated with the personnel and systems necessary to manage the Fund, and information regarding the Manager’s profitability from its relationship with the Fund. The Board reviewed whether the Manager may realize economies of scale in managing and supporting the Fund. The Board noted that the Fund currently has management fee breakpoints, which are intended to share with Fund shareholders economies of scale that may exist as the Fund’s assets grow.
| | | | |
| 24 | | | | OPPENHEIMER MAIN STREET FUND/VA |
Other Benefits to the Manager. In addition to considering the profits realized by the Manager, the Board considered information that was provided regarding the direct and indirect benefits the Manager receives as a result of its relationship with the Fund, including compensation paid to the Manager’s affiliates and research provided to the Manager in connection with permissible brokerage arrangements (soft dollar arrangements). The Board also considered that the Manager must be able to pay and retain experienced professional personnel at competitive rates to provide quality services to the Fund.
Conclusions. These factors were also considered by the independent Trustees meeting separately from the full Board, assisted by experienced counsel to the Fund and to the independent Trustees. Fund counsel and the independent Trustees’ counsel are independent of the Manager within the meaning and intent of the Securities and Exchange Commission Rules.
Based on its review of the information it received and its evaluations described above, the Board, including a majority of the independent Trustees, decided to continue the Agreement. In addition, the Board, including a majority of the Independent Trustees, approved the restructuring of the Fund’s investment advisory arrangement so that effective January 1, 2013, (i) OFI Global Asset Management, Inc. (“OFI Global”), a wholly owned subsidiary of the Manager, will serve as the investment adviser to the Fund in place of the Manager under a Restated Advisory Agreement (“Restated Advisory Agreement”), and (ii) OFI Global will enter into a Sub-Advisory Agreement (“Sub-Advisory Agreement”) with the Manager to provide investment sub-advisory services to the Fund. OFI Global will pay the Manager a percentage of the net investment advisory fee (after all applicable waivers have been deducted) that it receives from the Fund. The Agreement will continue until earlier of August 31, 2013 or the effective date of the Restated Advisory Agreement between the Fund and OFI Global. The Restated Advisory Agreement and Sub-Advisory Agreement will continue until August 31, 2013.
In arriving at its decisions, the Board did not single out any factor or factors as being more important than others, but considered all of the above information, and considered the terms and conditions of the Agreement, Restated Advisory Agreement and Sub-Advisory Agreement, including the management fees, in light of all the surrounding circumstances.
| | | | |
| 25 | | | | OPPENHEIMER MAIN STREET FUND/VA |
PORTFOLIO PROXY VOTING POLICIES AND PROCEDURES;
UPDATES TO STATEMENTS OF INVESTMENTS Unaudited
The Fund has adopted Portfolio Proxy Voting Policies and Procedures under which the Fund votes proxies relating to securities (“portfolio proxies”) held by the Fund. A description of the Fund’s Portfolio Proxy Voting Policies and Procedures is available (i) without charge, upon request, by calling the Fund toll-free at 1.800.525.7048, (ii) on the Fund’s website at oppenheimerfunds.com, and (iii) on the SEC’s website at www.sec.gov. In addition, the Fund is required to file Form N-PX, with its complete proxy voting record for the 12 months ended June 30th, no later than August 31st of each year. The Fund’s voting record is available (i) without charge, upon request, by calling the Fund toll-free at 1.800.525.7048, and (ii) in the Form N-PX filing on the SEC’s website at www.sec.gov.
The Fund files its complete schedule of portfolio holdings with the SEC for the first quarter and the third quarter of each fiscal year on Form N-Q. The Fund’s Form N-Q filings are available on the SEC’s website at www.sec.gov. Those forms may be reviewed and copied at the SEC’s Public Reference Room in Washington, D.C. Information on the operation of the Public Reference Room may be obtained by calling 1-800-SEC-0330.
| | | | |
| 26 | | | | OPPENHEIMER MAIN STREET FUND/VA |
TRUSTEES AND OFFICERS BIOS Unaudited
| | |
| Name, Position(s) Held with the Fund, Length of Service, Age | | Principal Occupation(s) During the Past 5 Years; Other Trusteeships/Directorships Held; Number of Portfolios in the Fund Complex Currently Overseen |
| |
INDEPENDENT TRUSTEES | | The address of each Trustee in the chart below is 6803 S. Tucson Way, Centennial, Colorado 80112-3924. Each Trustee serves for an indefinite term, or until his or her resignation, retirement, death or removal |
| |
Sam Freedman, Chairman of the Board of Trustees (since 2012) and Trustee (since 1996) Age: 72 | | Director of Colorado UpLIFT (charitable organization) (since September 1984). Mr. Freedman held several positions with the Sub-Adviser and with subsidiary or affiliated companies of the Sub-Adviser (until October 1994). Oversees 36 portfolios in the OppenheimerFunds complex. Mr. Freedman has served on the Boards of certain Oppenheimer funds since 1996, during which time he has become familiar with the Fund’s (and other Oppenheimer funds’) financial, accounting, regulatory and investment matters and has contributed to the Boards’ deliberations. |
| |
Edward L. Cameron, Trustee (since 1999) Age: 74 | | Member of The Life Guard of Mount Vernon (George Washington historical site) (June 2000-June 2006); Partner of PricewaterhouseCoopers LLP (accounting firm) (July 1974-June 1999); Chairman of Price Waterhouse LLP Global Investment Management Industry Services Group (accounting firm) (July 1994-June 1998). Oversees 36 portfolios in the OppenheimerFunds complex. Mr. Cameron has served on the Boards of certain Oppenheimer funds since 1999, during which time he has become familiar with the Fund’s (and other Oppenheimer funds’) financial, accounting, regulatory and investment matters and has contributed to the Boards’ deliberations. |
| |
Jon S. Fossel, Trustee (since 1995) Age: 70 | | Chairman of the Board (2006-December 2011) and Director (June 2002-December 2011) of UNUMProvident (insurance company); Director of Northwestern Energy Corp. (public utility corporation) (November 2004-December 2009); Director of P.R. Pharmaceuticals (October 1999-October 2003); Director of Rocky Mountain Elk Foundation (non-profit organization) (February 1998-February 2003 and February 2005-February 2007); Chairman and Director (until October 1996) and President and Chief Executive Officer (until October 1995) of the Sub-Adviser; President, Chief Executive Officer and Director of the following: Oppenheimer Acquisition Corp. (“OAC”) (parent holding company of the Sub-Adviser), Shareholders Services, Inc. and Shareholder Financial Services, Inc. (until October 1995). Oversees 36 portfolios in the OppenheimerFunds complex. Mr. Fossel has served on the Boards of certain Oppenheimer funds since 1990, during which time he has become familiar with the Fund’s (and other Oppenheimer funds’) financial, accounting, regulatory and investment matters and has contributed to the Boards’ deliberations. |
| |
Richard F. Grabish, Trustee (since 2012) Age: 64 | | Formerly Senior Vice President and Assistant Director of Sales and Marketing (March 1997-December 2007), Director (March 1987-December 2007) and Manager of Private Client Services (June 1985-June 2005) of A.G. Edwards & Sons, Inc. (broker/dealer and investment firm); Chairman and Chief Executive Officer of A.G. Edwards Trust Company, FSB (March 2001-December 2007); President and Vice Chairman of A.G. Edwards Trust Company, FSB (investment adviser) (April 1987-March 2001); President of A.G. Edwards Trust Company, FSB (investment adviser) (June 2005-December 2007). Oversees 36 portfolios in the OppenheimerFunds complex. Mr. Grabish has served on the Boards of certain Oppenheimer funds since 2001, during which time he has become familiar with the Fund’s (and other Oppenheimer funds’) financial, accounting, regulatory and investment matters and has contributed to the Boards’ deliberations. |
| |
Beverly L. Hamilton, Trustee (since 2002) Age: 66 | | Trustee of Monterey Institute for International Studies (educational organization) (since February 2000); Board Member of Middlebury College (educational organization) (December 2005-June 2011); Chairman (since 2010) of American Funds’ Emerging Markets Growth Fund, Inc. (mutual fund); Director of The California Endowment (philanthropic organization) (April 2002-April 2008); Director (February 2002-2005) and Chairman of Trustees (2006-2007) of the Community Hospital of Monterey Peninsula; Director (October 1991-2005); Vice Chairman (2006-2009) of American Funds’ Emerging Markets Growth Fund, Inc. (mutual fund); President of ARCO Investment Management Company (February 1991-April 2000); Member of the investment committees of The Rockefeller Foundation (2001-2006) and The University of Michigan (since 2000); Advisor at Credit Suisse First Boston’s Sprout venture capital unit (venture capital fund) (1994-January 2005); Trustee of MassMutual Institutional Funds (investment company) (1996-June 2004); Trustee of MML Series Investment Fund (investment company) (April 1989-June 2004); Member of the investment committee of Hartford Hospital (2000-2003); and Advisor to Unilever (Holland) pension fund (2000-2003). Oversees 36 portfolios in the OppenheimerFunds complex. Ms. Hamilton has served on the Boards of certain Oppenheimer funds since 2002, during which time she has become familiar with the Fund’s (and other Oppenheimer funds’) financial, accounting, regulatory and investment matters and has contributed to the Boards’ deliberations. |
| |
Victoria J. Herget, Trustee (since 2012) Age: 61 | | Independent Director of the First American Funds (mutual fund family) (2003-2011); former Managing Director (1993-2001), Principal (1985-1993), Vice President (1978-1985) and Assistant Vice President (1973-1978) of Zurich Scudder Investments (and its predecessor firms); Board Chair (2008-Present) and Director (2004-Present), United Educators (insurance company); Trustee (1992-2007), Chair of the Board of Trustees (1999-2007), Investment Committee Chair (1994-1999) and Investment Committee member (2007-2010) of Wellesley College; Trustee (since 2000) and Chair (since 2010), Newberry Library; Trustee, Mather LifeWays (since 2001); Trustee, BoardSource (2006-2009) and Chicago City Day School (1994-2005). Oversees 36 portfolios in the OppenheimerFunds complex. Ms. Herget has served on the Boards of certain Oppenheimer funds since 2012, during which time she has become familiar with the Fund’s (and other Oppenheimer funds’) financial, accounting, regulatory and investment matters and has contributed to the Boards’ deliberations. |
| |
Robert J. Malone, Trustee (since 2002) Age: 68 | | Board of Directors of Opera Colorado Foundation (non-profit organization) (since March 2008); Director of Jones Knowledge, Inc. (2006-2010); Director of Jones International University (educational organization) (since August 2005); Chairman, Chief Executive Officer and Director of Steele Street Bank & Trust (commercial banking) (since August 2003); Director of Colorado UpLIFT (charitable organization) (1986-2010); Trustee of the Gallagher Family Foundation (non-profit organization) (since 2000); Former Chairman of U.S. Bank-Colorado (subsidiary of U.S. Bancorp and formerly Colorado National Bank) (July 1996-April 1999); Director of Commercial Assets, Inc. (real estate investment trust) (1993-2000); Director of Jones Knowledge, Inc. (2001-July 2004); Director of U.S. Exploration, Inc. (oil and gas exploration) (1997-February 2004); Chairman of the Board (1991-1994) and Trustee (1985-1994) of Regis University; and Chairman of the Board (1990-1991) and Trustee (1984-1999) of Young Presidents Organization. Oversees 36 portfolios in the OppenheimerFunds complex. Mr. Malone has served on the Boards of certain Oppenheimer funds since 2002, during which time he has become familiar with the Fund’s (and other Oppenheimer funds’) financial, accounting, regulatory and investment matters and has contributed to the Boards’ deliberations. |
| |
F. William Marshall, Jr., Trustee (since 2000) Age: 70 | | Trustee Emeritus of Worcester Polytech Institute (WPI) (private university) (since 2009); Trustee of MassMutual Select Funds (formerly MassMutual Institutional Funds) (investment company) (since 1996) and MML Series Investment Fund (investment company) (since 1996) and Mass Mutual Premier Funds (investment company) (since January 2012); President and Treasurer of the SIS Funds (private charitable fund) (January 1999 – March 2011); Former Trustee of WPI (1985-2008); Former Chairman of the Board (2004-2006) and Former Chairman of the Investment Committee of WPI (1994-2008); Chairman of SIS & Family Bank, F.S.B. (formerly SIS Bank) (commercial bank) (January 1999-July 1999); Executive Vice President of Peoples Heritage Financial Group, Inc. (commercial bank) (January 1999-July 1999); and Former President and Chief Executive Officer of SIS Bancorp. (1993-1999). Oversees 40 portfolios in the OppenheimerFunds complex. Mr. Marshall has served on the Boards of certain Oppenheimer funds since 2000, during which time he has become familiar with the Fund’s (and other Oppenheimer funds’) financial, accounting, regulatory and investment matters and has contributed to the Boards’ deliberations. |
| | | | |
| 27 | | | | OPPENHEIMER MAIN STREET FUND/VA |
TRUSTEES AND OFFICERS BIOS Unaudited / Continued
| | |
Karen L. Stuckey, Trustee (since 2012) Age: 59 | | Partner (1990-2012) of PricewaterhouseCoopers LLP (held various positions 1975-1990); Trustee (1992-2006) and member of Executive, Nominating and Audit Committees and Chair of Finance Committee of Lehigh University; and member, Women’s Investment Management Forum since inception. Oversees 36 portfolios in the OppenheimerFunds complex. Ms. Stuckey has served on the Boards of certain Oppenheimer funds since 2012, during which time she has become familiar with the Fund’s (and other Oppenheimer funds’) financial, accounting, regulatory and investment matters and has contributed to the Boards’ deliberations. |
| |
James D. Vaughn, Trustee (since 2012) Age: 67 | | Retired; former managing partner (1994-2001) of Denver office of Deloitte & Touche LLP, (held various positions 1969-1993); Trustee and Chairman of the Audit Committee of Schroder Funds (2003-2012); Board member and Chairman of Audit Committee of AMG National Trust Bank (since 2005); Trustee, Audit Committee member and Investment Committee member, University of South Dakota Foundation (since 1996); Board member, Executive Committee Member, Audit Committee Member and past Board Chair, Junior Achievement (since 1993); former Board member, Mile High United Way, Boys and Girls Clubs, Boy Scouts, Colorado Business Committee for the Arts, Economic Club of Colorado and Metro Denver Network. Oversees 36 portfolios in the OppenheimerFunds complex. Mr. Vaughn has served on the Boards of certain Oppenheimer funds since 2012, during which time he has become familiar with the Fund’s (and other Oppenheimer funds’) financial, accounting, regulatory and investment matters and has contributed to the Boards’ deliberations. |
| INTERESTED TRUSTEE AND OFFICER | | The address of Mr. Glavin is Two World Financial Center, 225 Liberty Street, 11th Floor, New York, New York 10281-1008. Mr. Glavin serves as a Trustee for an indefinite term, or until his resignation, retirement, death or removal and as an Officer for an indefinite term, or until his resignation, retirement, death or removal. Mr. Glavin is an Interested Trustee due to his positions with OppenheimerFunds, Inc. and its affiliates. |
| |
William F. Glavin, Jr., Trustee, President and Principal Executive Officer (since 2009) Age: 54 | | Chief Executive Officer of OppenheimerFunds (since January 2013); Director, Chief Executive Officer and President of the Manager (since January 2013); Chairman of the Sub-Adviser (December 2009-December 2012); Chief Executive Officer (January 2009-December 2012) and Director of the Sub-Adviser (since January 2009); President of the Sub-Adviser (May 2009-December 2012); Management Director (since June 2009), President (since December 2009) and Chief Executive Officer (since January 2011) of Oppenheimer Acquisition Corp. (“OAC”) (the Sub-Adviser’s parent holding company); Director of Oppenheimer Real Asset Management, Inc. (since March 2010); Executive Vice President (March 2006-February 2009) and Chief Operating Officer (July 2007-February 2009) of Massachusetts Mutual Life Insurance Company (OAC’s parent company); Director (May 2004-March 2006) and Chief Operating Officer and Chief Compliance Officer (May 2004-January 2005), President (January 2005-March 2006) and Chief Executive Officer (June 2005-March 2006) of Babson Capital Management LLC; Director (March 2005-March 2006), President (May 2003-March 2006) and Chief Compliance Officer (July 2005-March 2006) of Babson Capital Securities, Inc. (a broker-dealer); President (May 2003-March 2006) of Babson Investment Company, Inc.; Director (May 2004-August 2006) of Babson Capital Europe Limited; Director (May 2004-October 2006) of Babson Capital Guernsey Limited; Director (May 2004-March 2006) of Babson Capital Management LLC; Non-Executive Director (March 2005-March 2007) of Baring Asset Management Limited; Director (February 2005-June 2006) Baring Pension Trustees Limited; Director and Treasurer (December 2003-November 2006) of Charter Oak Capital Management, Inc.; Director (May 2006-September 2006) of C.M. Benefit Insurance Company; Director (May 2008-June 2009) and Executive Vice President (June 2007-July 2009) of C.M. Life Insurance Company; President (March 2006-May 2007) of MassMutual Assignment Company; Director (January 2005-December 2006), Deputy Chairman (March 2005-December 2006) and President (February 2005-March 2005) of MassMutual Holdings (Bermuda) Limited; Director (May 2008-June 2009) and Executive Vice President (June 2007-July 2009) of MML Bay State Life Insurance Company; Chief Executive Officer and President (April 2007-January 2009) of MML Distributors, LLC; and Chairman (March 2006-December 2008) and Chief Executive Officer (May 2007-December 2008) of MML Investors Services, Inc. An officer of 86 portfolios in the OppenheimerFunds complex. |
| OTHER OFFICERS OF THE FUND | | The addresses of the Officers in the chart below are as follows: for Messrs. Govil, Ram, Gabinet and Ms. Nasta, Two World Financial Center, 225 Liberty Street, New York, New York 10281-1008, for Messrs. Vandehey and Wixted, 6803 S. Tucson Way, Centennial, Colorado 80112-3924. Each Officer serves for an indefinite term or until his or her resignation, retirement, death or removal. |
| |
Manind Govil, Vice President (since 2009) Age: 43 | | Mr. Govil, CFA, has been a Senior Vice President and the Main Street Team Leader of the Sub-Adviser (since May 2009). Prior to joining the Sub-Adviser, managed the RS Largecap Alpha fund (August 2005-March 2009) first with Guardian Life Insurance Company of America then with RS Investment Management Co. LLC, subsequent to their merger; head of equity investments at The Guardian Life Insurance Company of America (August 2005-October 2006) when Guardian Life Insurance acquired an interest in RS Investment Management Co. LLC; lead portfolio manager—large cap blend/core equity, co-head of equities and head of equity research (2001-July 2005); lead portfolio manager—core equity (April 1996-July 2005), at Mercantile Capital Advisers, Inc. A portfolio manager and officer of 4 portfolios in the OppenheimerFunds complex. |
| |
Benjamin Ram, Vice President (since 2009) Age: 40 | | Vice President of the Sub-Adviser (since May 2009). Prior to joining the Sub-Adviser, a sector manager for financial investments and a co-portfolio manager for mid-cap portfolios with the RS Core Equity Team of RS Investment Management Co. LLC (January 2006-May 2009) first with Guardian Life Insurance Company of America then with RS Investment Management Co. LLC, subsequent to their merger; a financials analyst (2003-2005) and co-portfolio manager (2005-2006) at Mercantile Capital Advisers, Inc; a bank analyst at Legg Mason Securities (2000-2003); a senior financial analyst at the CitiFinancial division of Citigroup, Inc. (1997-2000). A portfolio manager and officer of 3 portfolios in the OppenheimerFunds complex. |
| |
Arthur S. Gabinet, Secretary and Chief Legal Officer (since 2011) Age: 54 | | General Counsel of OppenheimerFunds (since January 2013); Executive Vice President, Secretary and General Counsel of the Manager (since January 2013); General Counsel OFI SteelPath, Inc. (since January 2013); Executive Vice President (May 2010-December 2012) and General Counsel (since January 2011) of the Sub-Adviser; General Counsel of the Distributor (since January 2011); General Counsel of Centennial Asset Management Corporation (January 2011-December 2012); Executive Vice President (January 2011-December 2012) and General Counsel of HarbourView Asset Management Corporation (since January 2011); Assistant Secretary (since January 2011) and Director (since January 2011) of OppenheimerFunds International Ltd. and OppenheimerFunds plc; Director of Oppenheimer Real Asset Management, Inc. (January 2011-December 2012) and General Counsel (since January 2011); Executive Vice President (January 2011-December 2011) and General Counsel of Shareholder Financial Services, Inc. and Shareholder Services, Inc. (since January 2011); Executive Vice President (January 2011-December 2012) and General Counsel of OFI Private Investments Inc. (since January 2011); Vice President of OppenheimerFunds Legacy Program (January 2011-December 2011); Executive Vice President (January 2011-December 2012) and General Counsel of OFI Institutional Asset Management, Inc. (since January 2011); General Counsel, Asset Management of the Sub-Adviser (May 2010-December 2010); Principal, The Vanguard Group (November 2005-April 2010); District Administrator, U.S. Securities and Exchange Commission (January 2003-October 2005). An officer of 86 portfolios in the OppenheimerFunds complex. |
| |
Christina M. Nasta, Vice President and Chief Business Officer (since 2011) Age: 39 | | Senior Vice President of OppenheimerFunds Distributor, Inc. (since January 2013); Senior Vice President of the Sub-Adviser (July 2010-December 2012); Vice President of the Sub-Adviser (January 2003-July 2010); Vice President of OppenheimerFunds Distributor, Inc. (January 2003-July 2010). An officer of 86 portfolios in the OppenheimerFunds complex. |
| | | | |
| 28 | | | | OPPENHEIMER MAIN STREET FUND/VA |
| | |
| |
Mark S. Vandehey, Vice President and Chief Compliance Officer (since 2004) Age: 62 | | Chief Compliance Officer of OppenheimerFunds (since January 2013); Senior Vice President and Chief Compliance Officer of the Manager (since January 2013); Chief Compliance Officer of OFI SteelPath, Inc. (since January 2013); Senior Vice President of the Sub-Adviser (March 2004-December 2012); Chief Compliance Officer of the Sub-Adviser, OppenheimerFunds Distributor, Inc., OFI Trust Company, OFI Institutional Asset Management, Inc., Oppenheimer Real Asset Management, Inc., OFI Private Investments, Inc., Harborview Asset Management Corporation, Trinity Investment Management Corporation, and Shareholder Services, Inc. (since March 2004); Vice President of OppenheimerFunds Distributor, Inc., Centennial Asset Management Corporation and Shareholder Services, Inc. (June 1983-December 2012). An officer of 86 portfolios in the OppenheimerFunds complex. |
| |
Brian W. Wixted, Treasurer and Principal Financial & Accounting Officer (since 1999) Age: 53 | | Senior Vice President of the Manager (since January 2013); Treasurer of the Sub-Adviser, HarbourView Asset Management Corporation, Shareholder Financial Services, Inc., Shareholder Services, Inc., and Oppenheimer Real Asset Management, Inc. (March 1999-June 2008), OFI Private Investments, Inc. (March 2000-June 2008), OppenheimerFunds International Ltd. and OppenheimerFunds plc (since May 2000), OFI Institutional Asset Management, Inc. (November 2000-June 2008), and OppenheimerFunds Legacy Program (charitable trust program established by the Sub-Adviser) (June 2003-December 2011); Treasurer and Chief Financial Officer of OFI Trust Company (since May 2000); Assistant Treasurer of Oppenheimer Acquisition Corporation (March 1999-June 2008). An officer of 86 portfolios in the OppenheimerFunds complex. |
The Fund’s Statement of Additional Information contains additional information about the Fund’s Trustees and Officers and is available without charge, upon request, by calling 1.800.988.8287.
| | | | |
| 29 | | | | OPPENHEIMER MAIN STREET FUND/VA |
THIS PAGE INTENTIONALLY LEFT BLANK.
| | | | |
| 30 | | | | OPPENHEIMER MAIN STREET FUND/VA |
THIS PAGE INTENTIONALLY LEFT BLANK.
| | | | |
| 31 | | | | OPPENHEIMER MAIN STREET FUND/VA |
OPPENHEIMER MAIN STREET FUND®/VA
A Series of Oppenheimer Variable Account Funds
| | |
| Manager | | OFI Global Asset Management, Inc |
| Sub-Adviser | | OppenheimerFunds, Inc. |
| Distributor | | OppenheimerFunds Distributor, Inc. |
Transfer and Shareholder Servicing Agent | | OFI Global Asset Management, Inc. |
| Sub-Transfer Agent | | Shareholder Services, Inc. DBA OppenheimerFunds Services |
| Independent Registered Public Accounting Firm | | KPMG LLP |
| Counsel | | K&L Gates LLP |
Before investing, investors should carefully consider a fund’s investment objectives, risks, charges and expenses. Fund prospectuses and summary prospectuses contain this and other information about the funds, and may be obtained by asking your financial advisor, or calling us at 1.800.988.8287. Read prospectuses and summary prospectuses carefully before investing.
| | |
| ©2013 OppenheimerFunds, Inc. All rights reserved. | | |
December 31, 2012
| | | | |
| | | |
| | | Oppenheimer Main Street Small-& Mid-Cap Fund®/VA A Series of Oppenheimer Variable Account Funds | | Annual Report |
ANNUAL REPORT
Listing of Top Holdings
Fund Performance Discussion
Financial Statements
OPPENHEIMER MAIN STREET SMALL- & MID-CAP FUND®/VA
Portfolio Managers: Matthew P. Ziehl, CFA, Raymond Anello, CFA, and Raman Vardharaj, CFA
| | | | | | |
Average Annual Total Returns
For the Periods Ended 12/31/12 | | |
| | | |
| | | 1-Year | | 5-Year | | 10-Year |
| Non-Service Shares | | 17.99% | | 3.96% | | 10.09% |
| Service Shares | | 17.67 | | 3.71 | | 9.85 |
The performance data quoted represents past performance, which does not guarantee future results. The investment return and principal value of an investment in the Fund will fluctuate so that an investor’s shares, when redeemed, may be worth more or less than their original cost. Current performance may be lower or higher than the performance quoted. For performance data current to the most recent month end, call us at 1.800.988.8287. The Fund’s total returns should not be expected to be the same as the returns of other funds, whether or not both funds have the same portfolio managers and/or similar names. The Fund’s total returns include changes in share price and reinvested distributions but do not include the charges associated with the separate account products that offer this Fund. Such performance would have been lower if such charges were taken into account.
| | | | |
| Top Ten Common Stock Holdings | | | |
| EPL Oil & Gas, Inc. | | | 2.2 | % |
| LaSalle Hotel Properties | | | 2.1 | |
| Robert Half International, Inc. | | | 2.1 | |
| WellCare Health Plans, Inc. | | | 2.1 | |
| CapitalSource, Inc. | | | 2.0 | |
Hub Group, Inc., Cl. A
| | | 1.9 | |
| Dunkin’ Brands Group, Inc. | | | 1.8 | |
| CYS Investments, Inc. | | | 1.7 | |
| Hatteras Financial Corp. | | | 1.7 | |
| Aruba Networks, Inc. | | | 1.6 | |
Portfolio holdings and allocations are subject to change. Percentages are as of December 31, 2012, and are based on net assets.
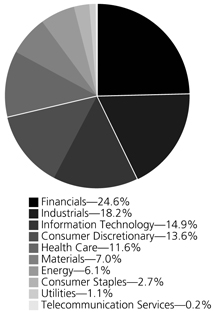
Portfolio holdings and allocations are subject to change. Percentages are as of December 31, 2012, and are based on the total market value of common stocks.
| | | | |
| 2 | | | | OPPENHEIMER MAIN STREET SMALL- & MID-CAP FUND/VA |
FUND PERFORMANCE DISCUSSION
During the reporting period, the Fund’s Non-Service shares produced a return of 17.99%. In comparison, the Fund outperformed the Russell 2500 Index (the “Index”), which returned 17.88%. The Fund outperformed the Index primarily in the energy and consumer discretionary sectors due to better positive relative stock selection. The Fund underperformed the Index primarily in industrials and consumer staples.
Economic and Market Environment
Domestic equities generally produced positive returns this period. The period began during a time of improved market sentiment in which the United States managed to avoid a return to recession and European policymakers appeared to take steps to address the region’s sovereign debt and banking sector crises. Renewed investor optimism helped produce gains in the U.S. equity market as well as across a number of international equity markets over the first three months of 2012. The rebound across equities gained momentum after the European Central Bank (the “ECB”) implemented dual Long-Term Refinancing Operations (“LTROs”) to enhance liquidity for troubled banks and reduce rates on newly issued sovereign debt securities.
The second quarter was more volatile for the equity markets. In the U.S., slower than expected first quarter growth contributed to a sell-off in the U.S. stock market. Consumer confidence dropped as U.S. unemployment figures ticked slightly upwards after showing signs of improvement from the recession highs. In addition, uncertainty around the November 2012 elections and the potential elimination of a significant amount of government stimulus in the beginning of 2013, resulted in companies stalling spending and hiring, contributing to the economic slowdown. The reduction in growth outside of the U.S. also negatively impacted exports, which was exacerbated by a strengthening dollar. Outside of the U.S., the fear of contagion from the worsening European sovereign debt crisis and a recession across much of Europe also resulted in increased market volatility.
In the second half of the period, the equity markets generally resumed an upward trend despite ongoing concerns. In the U.S., the Fed introduced QE3, under which it announced plans to purchase mortgage-backed bonds on a monthly basis until the labor market shows signs of substantial improvement. Equities in the U.S. were also bolstered by the continued improvement of the housing market. However, the market did experience volatility due to uncertainty over the outcome of the Presidential election. In addition, the lack of visibility about resolution of the “fiscal cliff” weighed further on both business and consumer spending. These concerns were not enough to offset earlier gains, and immediately following the close of the period, the U.S. Congress enacted a last minute temporary resolution to the fiscal cliff.
Outside of the U.S., the results of elections in Greece and continued efforts by European policymakers to stabilize the situation in the region made the imminent fracturing of the Eurozone and the serious consequences that might have for the euro far less likely. The ECB also increased its efforts to stimulate economic growth, as it committed to potentially unlimited bond purchases to ease financing pressure on countries like Spain and Italy. Under the plan, these and other members of the European Union (excluding Greece) would be able to maintain access to funding at sustainable interest rates, on the condition that they continue with strict reform programs.
Top Individual Contributors
The top contributors to Fund performance this period included energy company HollyFrontier Corp., financials holding Ocwen Financial Corp., materials stock Packaging Corp. of America, and consumer discretionary stocks Toll Brothers, Inc. and PVH Corp.
After completing a merger in 2011 with oil refiner Frontier Oil, making the firm one of the largest oil refiners in the Western U.S., HollyFrontier Corp.’s stock enjoyed strong performance this reporting period. Cash generation by the company exceeded expectations and the company used a substantial portion of its cash to pay special dividends and aggressively repurchase shares. The stock also benefitted from the widening spread between West Texas Intermediate (WTI) and Brent Crude (Brent) prices. HollyFrontier sources most of its feedstock based on domestic oil prices, as represented by WTI, and sells its refined products based on global oil prices, represented by Brent.
Financial Services firm Ocwen primarily specializes in the acquisition and resolution of non-performing or underperforming loans. The company’s revenues and earnings increased as it continued to acquire books of underperforming loans for servicing and modification. Packaging Corp. of America had higher year-over-year gross margins, gross profits and net sales as well as record earnings. Shipments of corrugated products surged and the company reported improved mill operations and reduced expenses. Showing signs of a potential housing recovery in the U.S., luxury homebuilder Toll Brothers had solid gains, announcing new plans for expansion. The company retained its advantageous position as the largest luxury home builder in the United States. PVH is a large global branded lifestyle apparel company that reported robust profits during the period. It also announced the acquisition of Warnaco, which would bring all Calvin Klein-branded apparel under one company. We exited our position.
Top Individual Detractors
The most significant detractors from performance this period were health care stocks WellCare Health Plans, Inc. and Questcor Pharmaceuticals, Inc., and financials company MSCI, Inc. WellCare, a managed care provider to both Medicare and Medicaid recipients, posted disappointing results partially due to unfavorable medical cost trends which negatively impacted profitability and caused management to lower earnings guidance. The results were also affected by an unexpected adverse CMS (Centers for Medicare & Medicaid Services) ruling related to a reimbursement dispute in Georgia. We continue to believe that WellCare is favorably positioned and that it has the potential to benefit from growth stemming from the aging population trends and opportunities arising from
| | | | |
| 3 | | | | OPPENHEIMER MAIN STREET SMALL- & MID-CAP FUND/VA |
Medicaid expansion. After a positive first half of 2012, biopharmaceutical firm Questcor Pharmaceuticals traded lower as a result of market concerns involving Aetna, Inc.’s reimbursement criteria for Questcor’s drug Acthar and a probe into Questcor’s promotional practices. Shares of MSCI, a global leader in providing investment tools to investment institutions, fell after a large client announced plans to adopt benchmarks with another firm in lieu of MSCI. We exited our position.
Strategy & Outlook
Despite macroeconomic headwinds, we believe that many U.S. corporations have continued to build balance sheet strength and have generally made effective capital allocation decisions. While profit growth may remain slow, we believe balance sheets are likely to remain healthy and returns on capital should remain stable. Our long-term investment process remains the same. We seek companies that we believe have sustainable competitive advantages, with the management skill and financial resources to generate stronger profit margins, take market share from weaker players, and/or return significant capital to shareholders. We focus on leading firms in structurally attractive industries with committed management teams that have proven records of performance. We seek to invest in such companies when their valuations are attractive, and believe that this disciplined approach is the key to generating positive long-term returns. We believe our investment strategy has the potential to provide both upside participation and downside protection.
Investors should consider the Fund’s investment objective, risks, charges and expenses carefully before investing. The Fund’s prospectus and summary prospectus contain this and other information about the Fund, and may be obtained by asking your financial advisor or calling us at 1.800.988.8287. Read prospectuses and summary prospectuses carefully before investing.
Total returns include changes in share price and reinvestment of dividends and capital gains distributions in a hypothetical investment for the periods shown.
The Fund’s investment strategy and focus can change over time. The mention of specific fund holdings does not constitute a recommendation by OppenheimerFunds, Inc. or its affiliates.
Shares of Oppenheimer funds are not deposits or obligations of any bank, are not guaranteed by any bank, are not insured by the FDIC or any other agency, and involve investment risks, including the possible loss of the principal amount invested.
Comparing the Fund’s Performance to the Market. The graphs that follow show the performance of a hypothetical $10,000 investment in each share class of the Fund held until December 31, 2012. Performance is measured over a ten-fiscal-year period for both Classes. Performance information does not reflect charges that apply to separate accounts investing in the Fund. If these charges were taken into account, performance would be lower. The graphs assume that all dividends and capital gains distributions were reinvested in additional shares.
The Fund’s performance is compared to the performance of the Russell 2500 Index, a broad-based index featuring 2,500 stocks of companies with small- and mid-cap market capitalizations, and the Russell 2000 Index, an unmanaged index of equity securities of small capitalization companies that is a measure of the small company market. The indices are unmanaged and cannot be purchased directly by investors. Index performance is shown for illustrative purposes only and does not predict or depict the performance of the Fund. While index comparisons may be useful to provide a benchmark for the Fund’s performance, it must be noted that the Fund’s investments are not limited to the investments comprising the indices.
| | | | |
| 4 | | | | OPPENHEIMER MAIN STREET SMALL- & MID-CAP FUND/VA |
Non-Service Shares
COMPARISON OF CHANGE IN VALUE OF $10,000 HYPOTHETICAL INVESTMENTS IN:
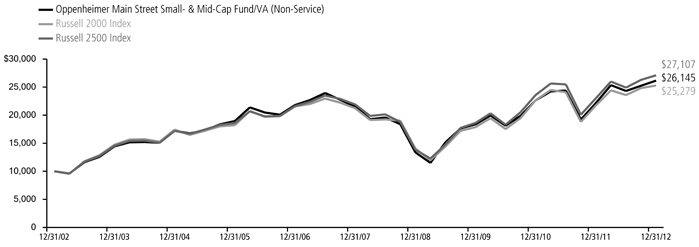
| | | | | | | | | | | | |
| | | Average Annual Total Returns of Non-Service Shares of the Fund at 12/31/12 |
| | | 1-Year | | 17.99% | | 5-Year | | 3.96% | | 10-Year | | 10.09% |
Service Shares
COMPARISON OF CHANGE IN VALUE OF $10,000 HYPOTHETICAL INVESTMENTS IN:
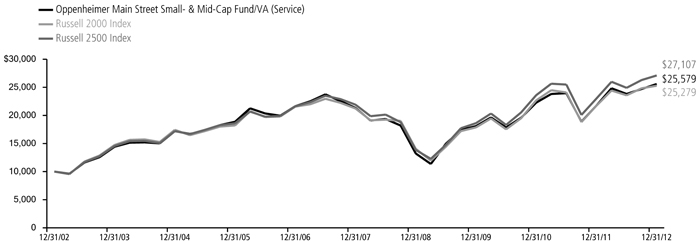
| | | | | | | | | | | | |
| | | Average Annual Total Returns of Service Shares of the Fund at 12/31/12 |
| | | 1-Year | | 17.67% | | 5-Year | | 3.71% | | 10-Year | | 9.85% |
The performance data quoted represents past performance, which does not guarantee future results. The investment return and principal value of an investment in the Fund will fluctuate so that an investor’s shares, when redeemed, may be worth more or less than their original cost. Current performance may be lower or higher than the performance quoted. For performance data current to the most recent month end, call us at 1.800.988.8287. The Fund’s total returns should not be expected to be the same as the returns of other funds, whether or not both funds have the same portfolio managers and/or similar names. The Fund’s total returns include changes in share price and reinvested distributions but do not include the charges associated with the separate account products that offer this Fund. Such performance would have been lower if such charges were taken into account.
| | | | |
| 5 | | | | OPPENHEIMER MAIN STREET SMALL- & MID-CAP FUND/VA |
FUND EXPENSES
Fund Expenses. As a shareholder of the Fund, you incur two types of costs: (1) transaction costs and (2) ongoing costs, including management fees; distribution and service fees; and other Fund expenses. These examples are intended to help you understand your ongoing costs (in dollars) of investing in the Fund and to compare these costs with the ongoing costs of investing in other mutual funds.
The examples are based on an investment of $1,000.00 invested at the beginning of the period and held for the entire 6-month period ended December 31, 2012.
Actual Expenses. The first section of the table provides information about actual account values and actual expenses. You may use the information in this section for the class of shares you hold, together with the amount you invested, to estimate the expense that you paid over the period. Simply divide your account value by $1,000.00 (for example, an $8,600.00 account value divided by $1,000.00 = 8.60), then multiply the result by the number in the first section under the heading entitled “Expenses Paid During Period” to estimate the expenses you paid on your account during this period.
Hypothetical Example for Comparison Purposes.
The second section of the table provides information about hypothetical account values and hypothetical expenses based on the Fund’s actual expense ratio for each class of shares, and an assumed rate of return of 5% per year for each class before expenses, which is not the actual return. The hypothetical account values and expenses may not be used to estimate the actual ending account balance or expenses you paid for the period. You may use this information to compare the ongoing costs of investing in the Fund and other funds. To do so, compare this 5% hypothetical example for the class of shares you hold with the 5% hypothetical examples that appear in the shareholder reports of the other funds.
Please note that the expenses shown in the table are meant to highlight your ongoing costs only and do not reflect any charges associated with the separate accounts that offer this Fund. Therefore, the “hypothetical” lines of the table are useful in comparing ongoing costs only, and will not help you determine the relative total costs of owning different funds. In addition, if these separate account charges were included your costs would have been higher.
| | | | | | | | | | | | |
| Actual | | Beginning
Account Value
July 1, 2012 | | | Ending Account Value
December 31, 2012 | | | Expenses
Paid During 6 Months Ended
December 31, 2012 | |
| Non-Service shares | | $ | 1,000.00 | | | $ | 1,075.30 | | | $ | 4.18 | |
| Service shares | | | 1,000.00 | | | | 1,074.30 | | | | 5.44 | |
| | | |
Hypothetical (5% return before expenses) | | | | | | | | | |
| Non-Service shares | | | 1,000.00 | | | | 1,021.11 | | | | 4.07 | |
| Service shares | | | 1,000.00 | | | | 1,019.91 | | | | 5.29 | |
Expenses are equal to the Fund’s annualized expense ratio for that class, multiplied by the average account value over the period, multiplied by 184/366 (to reflect the one-half year period). Those annualized expense ratios, excluding indirect expenses from affiliated funds, based on the 6-month period ended December 31, 2012 are as follows:
| | | | |
| Class | | Expense Ratios | |
| Class Non-Service | | | 0.80 | % |
| Class Service | | | 1.04 | |
The expense ratios reflect voluntary waivers and/or reimbursements of expenses by the Fund’s Manager. Some of these undertakings may be modified or terminated at any time, as indicated in the Fund’s prospectus. The “Financial Highlights” tables in the Fund’s financial statements, included in this report, also show the gross expense ratios, without such waivers or reimbursements and reduction to custodian expenses, if applicable.
| | | | |
| 6 | | | | OPPENHEIMER MAIN STREET SMALL- & MID-CAP FUND/VA |
STATEMENT OF INVESTMENTS December 31, 2012
| | | | | | | | |
| | | Shares | | | Value | |
| Common Stocks—98.9% | | | | | | | | |
| Consumer Discretionary—13.5% | | | | | | | | |
| Auto Components—1.8% | | | | | | | | |
| Cooper Tire & Rubber Co. | | | 61,770 | | | $ | 1,566,487 | |
| Dana Holding Corp. | | | 898,954 | | | | 14,032,672 | |
| Standard Motor Products, Inc. | | | 22,572 | | | | 501,550 | |
| | | | | | |
|
|
|
| | | | | | | | 16,100,709 | |
| Distributors—0.8% | | | | | | | | |
| Pool Corp. | | | 177,239 | | | | 7,500,754 | |
| VOXX International Corp.1 | | | 70,450 | | | | 474,128 | |
| | | | | | |
|
|
|
| | | | | | | | 7,974,882 | |
| Diversified Consumer Services—0.1% | | | | | |
| Coinstar, Inc.1 | | | 26,439 | | | | 1,375,092 | |
| Hotels, Restaurants & Leisure—2.4% | | | | | | | | |
| Bob Evans Farms, Inc. | | | 41,296 | | | | 1,660,099 | |
| Brinker International, Inc. | | | 63,954 | | | | 1,981,934 | |
| Dunkin’ Brands Group, Inc. | | | 509,023 | | | | 16,889,383 | |
| Papa John’s International, Inc.1 | | | 22,183 | | | | 1,218,734 | |
| Red Robin Gourmet Burgers, Inc.1 | | | 28,610 | | | | 1,009,647 | |
| Texas Roadhouse, Inc. | | | 15,340 | | | | 257,712 | |
| Town Sports International Holdings, Inc. | | | 14,610 | | | | 155,596 | |
| | | | | | |
|
|
|
| | | | | | | | 23,173,105 | |
| Household Durables—0.6% | | | | | | | | |
| CSS Industries, Inc. | | | 12,958 | | | | 283,651 | |
| NACCO Industries, Inc., Cl. A | | | 6,860 | | | | 416,333 | |
| Toll Brothers, Inc.1 | | | 166,460 | | | | 5,381,652 | |
| | | | | | |
|
|
|
| | | | | | | | 6,081,636 | |
| Media—1.9% | | | | | | | | |
| Imax Corp.1 | | | 639,186 | | | | 14,368,901 | |
| Scholastic Corp. | | | 48,345 | | | | 1,429,078 | |
| Valassis Communications, Inc. | | | 55,341 | | | | 1,426,691 | |
| | | | | | |
|
|
|
| | | | | | | | 17,224,670 | |
| Multiline Retail—0.3% | | | | | | | | |
| Fred’s, Inc., Cl. A | | | 43,081 | | | | 573,408 | |
| Saks, Inc.1 | | | 168,972 | | | | 1,775,896 | |
| | | | | | |
|
|
|
| | | | | | | | 2,349,304 | |
| Specialty Retail—4.3% | | | | | | | | |
| ANN, Inc.1 | | | 72,413 | | | | 2,450,456 | |
| CarMax, Inc.1 | | | 195,510 | | | | 7,339,445 | |
| Cato Corp., Cl. A | | | 78,197 | | | | 2,144,944 | |
| Express, Inc.1 | | | 92,016 | | | | 1,388,521 | |
| Finish Line, Inc. (The), Cl. A | | | 99,273 | | | | 1,879,238 | |
| Hot Topic, Inc. | | | 131,770 | | | | 1,271,580 | |
| Monro Muffler Brake, Inc. | | | 282,209 | | | | 9,868,849 | |
| Pier 1 Imports, Inc. | | | 594,210 | | | | 11,884,200 | |
| Rent-A-Center, Inc. | | | 12,790 | | | | 439,464 | |
| Stage Stores, Inc. | | | 22,990 | | | | 569,692 | |
| Williams-Sonoma, Inc. | | | 25,980 | | | | 1,137,145 | |
| | | | | | |
|
|
|
| | | | | | | | 40,373,534 | |
| Textiles, Apparel & Luxury Goods—1.3% | | | | | | | | |
| Fossil, Inc.1 | | | 57,712 | | | | 5,372,987 | |
| Jones Group, Inc. (The) | | | 54,400 | | | | 601,664 | |
| Warnaco Group, Inc. (The)1 | | | 84,150 | | | | 6,022,616 | |
| | | | | | |
|
|
|
| | | | | | | | 11,997,267 | |
| Consumer Staples—2.6% | | | | | | | | |
| Beverages—0.1% | | | | | | | | |
| Cott Corp. | | | 78,596 | | | | 631,126 | |
| Food & Staples Retailing—0.1% | | | | | | | | |
| Safeway, Inc. | | | 42,590 | | | | 770,453 | |
| Spartan Stores, Inc. | | | 21,677 | | | | 332,959 | |
| Village Super Market, Inc., Cl. A | | | 6,555 | | | | 215,397 | |
| Weis Markets, Inc. | | | 12,292 | | | | 481,478 | |
| | | | | | |
|
|
|
| | | | | | | | 1,800,287 | |
| Food Products—2.3% | | | | | | | | |
| Dean Foods Co.1 | | | 100,660 | | | | 1,661,897 | |
| Flowers Foods, Inc. | | | 402,780 | | | | 9,372,691 | |
| Ingredion, Inc. | | | 7,960 | | | | 512,863 | |
| TreeHouse Foods, Inc.1 | | | 175,212 | | | | 9,133,802 | |
| | | | | | |
|
|
|
| | | | | | | | 20,681,253 | |
| | | | | | | | |
| | | Shares | | | Value | |
| Household Products—0.0% | | | | | | | | |
| Harbinger Group, Inc.1 | | | 29,650 | | | $ | 228,008 | |
| Personal Products—0.1% | | | | | | | | |
| USANA Health Sciences, Inc.1 | | | 30,950 | | | | 1,019,183 | |
| Tobacco—0.0% | | | | | | | | |
| Universal Corp. | | | 3,297 | | | | 164,553 | |
| Energy—6.1% | | | | | | | | |
| Energy Equipment & Services—0.8% | | | | | |
| Basic Energy Services, Inc.1 | | | 41,222 | | | | 470,343 | |
| Helix Energy Solutions Group, Inc.1 | | | 95,388 | | | | 1,968,808 | |
| Matrix Service Co.1 | | | 49,436 | | | | 568,514 | |
| Parker Drilling Co.1 | | | 276,223 | | | | 1,270,626 | |
| Patterson-UTI Energy, Inc. | | | 94,820 | | | | 1,766,497 | |
| RPC, Inc. | | | 164,357 | | | | 2,011,730 | |
| | | | | | |
|
|
|
| | | | | | | | 8,056,518 | |
| Oil, Gas & Consumable Fuels—5.3% | | | | | |
| Alon USA Energy, Inc. | | | 71,990 | | | | 1,302,299 | |
| CVR Energy, Inc.1,2 | | | 43,316 | | | | — | |
| Delek US Holdings, Inc. | | | 47,590 | | | | 1,204,979 | |
| EPL Oil & Gas, Inc.1 | | | 913,827 | | | | 20,606,800 | |
| HollyFrontier Corp. | | | 124,273 | | | | 5,784,908 | |
| MPLX LP1 | | | 163,960 | | | | 5,113,912 | |
| PAA Natural Gas Storage LP | | | 263,933 | | | | 5,027,924 | |
| Renewable Energy Group, Inc.1 | | | 860,998 | | | | 5,045,448 | |
| REX American Resources Corp.1 | | | 6,520 | | | | 125,771 | |
| VAALCO Energy, Inc.1 | | | 233,417 | | | | 2,019,057 | |
| Western Refining, Inc. | | | 165,701 | | | | 4,671,111 | |
| | | | | | |
|
|
|
| | | | | | | | 50,902,209 | |
| Financials—24.3% | | | | | | | | |
| Capital Markets—1.7% | | | | | | | | |
| Federated Investors, Inc., Cl. B | | | 51,317 | | | | 1,038,143 | |
| Financial Engines, Inc.1 | | | 452,213 | | | | 12,548,911 | |
| WisdomTree Investments, Inc.1 | | | 472,530 | | | | 2,891,884 | |
| | | | | | |
|
|
|
| | | | | | | | 16,478,938 | |
| Commercial Banks—3.6% | | | | | | | | |
| Associated Banc-Corp. | | | 27,720 | | | | 363,686 | |
| BankUnited, Inc. | | | 335,484 | | | | 8,199,229 | |
| CapitalSource, Inc. | | | 2,480,349 | | | | 18,801,045 | |
| Citizens & Northern Corp. | | | 9,086 | | | | 171,725 | |
| CVB Financial Corp. | | | 104,440 | | | | 1,086,176 | |
| Eagle Bancorp, Inc.1 | | | 24,173 | | | | 482,735 | |
| FirstMerit Corp. | | | 232,736 | | | | 3,302,524 | |
| Old National Bancorp | | | 67,910 | | | | 806,092 | |
| Univest Corp. of Pennsylvania | | | 20,380 | | | | 348,498 | |
| WesBanco, Inc. | | | 25,159 | | | | 559,033 | |
| | | | | | |
|
|
|
| | | | | | | | 34,120,743 | |
| Consumer Finance—0.1% | | | | | | | | |
| EZCORP, Inc., Cl. A1 | | | 29,074 | | | | 577,410 | |
| Diversified Financial Services—0.9% | | | | | | | | |
| Moody’s Corp. | | | 153,940 | | | | 7,746,261 | |
| NASDAQ OMX Group, Inc. (The) | | | 39,220 | | | | 980,892 | |
| | | | | | |
|
|
|
| | | | | | | | 8,727,153 | |
| Insurance—3.9% | | | | | | | | |
| Alterra Capital Holdings Ltd. | | | 148,043 | | | | 4,173,332 | |
| American Financial Group, Inc. | | | 62,628 | | | | 2,475,059 | |
| AmTrust Financial Services, Inc. | | | 326,406 | | | | 9,364,588 | |
| Assurant, Inc. | | | 41,570 | | | | 1,442,479 | |
| First American Financial Corp. | | | 35,960 | | | | 866,276 | |
| Greenlight Capital Re Ltd., Cl. A1 | | | 23,120 | | | | 533,610 | |
| HCC Insurance Holdings, Inc. | | | 69,070 | | | | 2,570,095 | |
| Horace Mann Educators Corp. | | | 78,134 | | | | 1,559,555 | |
| Maiden Holdings Ltd. | | | 33,010 | | | | 303,362 | |
| Montpelier Re Holdings Ltd. | | | 39,670 | | | | 906,856 | |
| PartnerRe Ltd. | | | 9,710 | | | | 781,558 | |
| Primerica, Inc. | | | 81,795 | | | | 2,454,668 | |
| Protective Life Corp. | | | 52,402 | | | | 1,497,649 | |
| RenaissanceRe Holdings Ltd. | | | 9,360 | | | | 760,594 | |
| Symetra Financial Corp. | | | 175,173 | | | | 2,273,746 | |
| Torchmark Corp. | | | 35,297 | | | | 1,823,796 | |
| | | | |
| 7 | | | | OPPENHEIMER MAIN STREET SMALL- & MID-CAP FUND/VA |
STATEMENT OF INVESTMENTS / (Continued)
| | | | | | | | |
| | | Shares | | | Value | |
| Insurance (Continued) | | | | | | | | |
| Validus Holdings Ltd. | | | 25,100 | | | $ | 867,958 | |
| | | | | | |
|
|
|
| | | | | | | | 34,655,181 | |
| Real Estate Investment Trusts (REITs)—11.1% | |
| Ares Commercial Real Estate Corp. | | | 283,429 | | | | 4,653,904 | |
| Brandywine Realty Trust | | | 49,140 | | | | 599,017 | |
| CapLease, Inc. | | | 544,720 | | | | 3,034,090 | |
| CBL & Associates Properties, Inc. | | | 49,870 | | | | 1,057,743 | |
| Chatham Lodging Trust | | | 377,600 | | | | 5,807,488 | |
| Coresite Realty Corp. | | | 29,210 | | | | 807,949 | |
| CubeSmart | | | 79,741 | | | | 1,161,826 | |
| CYS Investments, Inc. | | | 1,372,189 | | | | 16,205,552 | |
| EastGroup Properties, Inc. | | | 38,133 | | | | 2,051,937 | |
| First Industrial Realty Trust, Inc.1 | | | 69,390 | | | | 977,011 | |
| Hatteras Financial Corp. | | | 653,060 | | | | 16,202,419 | |
| Healthcare Realty Trust, Inc. | | | 52,580 | | | | 1,262,446 | |
| LaSalle Hotel Properties | | | 771,996 | | | | 19,600,978 | |
| Lexington Realty Trust | | | 71,360 | | | | 745,712 | |
| Mid-America Apartment Communities, Inc. | | | 169,955 | | | | 11,004,586 | |
| Ramco-Gershenson Properties Trust | | | 58,990 | | | | 785,157 | |
| Sovran Self Storage, Inc. | | | 30,329 | | | | 1,883,431 | |
| Starwood Property Trust, Inc. | | | 625,282 | | | | 14,356,475 | |
| Sunstone Hotel Investors, Inc.1 | | | 64,507 | | | | 690,870 | |
| Weingarten Realty Investors | | | 25,520 | | | | 683,170 | |
| | | | | | |
|
|
|
| | | | | | | | 103,571,761 | |
| Thrifts & Mortgage Finance—3.0% | | | | | |
| Home Loan Servicing Solutions Ltd. | | | 605,410 | | | | 11,442,249 | |
| Ocwen Financial Corp.1 | | | 234,940 | | | | 8,126,575 | |
| Oritani Financial Corp. | | | 465,750 | | | | 7,135,290 | |
| Washington Federal, Inc. | | | 78,750 | | | | 1,328,513 | |
| | | | | | |
|
|
|
| | | | | | | | 28,032,627 | |
| Health Care—11.5% | | | | | | | | |
| Biotechnology—2.3% | | | | | | | | |
| Achillion Pharmaceuticals, Inc.1 | | | 397,929 | | | | 3,191,391 | |
| Cepheid, Inc.1 | | | 295,130 | | | | 9,978,345 | |
| Indevus Pharmaceuticals, Inc.1 | | | 2,500 | | | | 25 | |
| Medivation, Inc.1 | | | 69,742 | | | | 3,568,001 | |
| PDL BioPharma, Inc. | | | 317,159 | | | | 2,235,971 | |
| Sarepta Therapeutics, Inc.1 | | | 107,640 | | | | 2,777,112 | |
| | | | | | |
|
|
|
| | | | | | | | 21,750,845 | |
| Health Care Equipment & Supplies—2.7% | | | | | |
| CONMED Corp. | | | 55,554 | | | | 1,552,734 | |
| DexCom, Inc.1 | | | 482,570 | | | | 6,567,778 | |
| Greatbatch, Inc.1 | | | 309,851 | | | | 7,200,937 | |
| Orthofix International NV1 | | | 181,970 | | | | 7,156,880 | |
| RTI Biologics, Inc.1 | | | 116,755 | | | | 498,544 | |
| STERIS Corp. | | | 20,420 | | | | 709,187 | |
| | | | | | |
|
|
|
| | | | | | | | 23,686,060 | |
| Health Care Providers & Services—4.7% | | | | | |
| AmSurg Corp.1 | | | 55,101 | | | | 1,653,581 | |
| Chemed Corp. | | | 25,470 | | | | 1,746,987 | |
| Community Health Systems, Inc. | | | 227,340 | | | | 6,988,432 | |
| Ensign Group, Inc. (The) | | | 51,250 | | | | 1,393,487 | |
| Hanger, Inc.1 | | | 43,260 | | | | 1,183,594 | |
| HealthSouth Corp.1 | | | 440,570 | | | | 9,300,433 | |
| Omnicare, Inc. | | | 32,320 | | | | 1,166,752 | |
| Owens & Minor, Inc. | | | 26,460 | | | | 754,375 | |
| PharMerica Corp.1 | | | 27,560 | | | | 392,454 | |
| Select Medical Holdings Corp. | | | 144,502 | | | | 1,362,654 | |
| WellCare Health Plans, Inc.1 | | | 396,610 | | | | 19,310,941 | |
| | | | | | |
|
|
|
| | | | | | | | 45,253,690 | |
| Life Sciences Tools & Services—0.3% | |
| Cambrex Corp.1 | | | 26,836 | | | | 305,394 | |
| Charles River Laboratories International, Inc.1 | | | 32,080 | | | | 1,202,038 | |
| PerkinElmer, Inc. | | | 48,966 | | | | 1,554,181 | |
| | | | | | |
|
|
|
| | | | | | | | 3,061,613 | |
| Pharmaceuticals—1.5% | | | | | | | | |
| Endo Health Solutions, Inc.1 | | | 22,240 | | | | 584,245 | |
| MAP Pharmaceuticals, Inc.1 | | | 288,060 | | | | 4,525,423 | |
| Questcor Pharmaceuticals, Inc. | | | 249,300 | | | | 6,661,296 | |
| | | | | | | | |
| | | Shares | | | Value | |
| Pharmaceuticals (Continued) | | | | | | | | |
| Santarus, Inc.1 | | | 122,060 | | | $ | 1,340,219 | |
| SciClone Pharmaceuticals, Inc.1 | | | 197,700 | | | | 852,087 | |
| | | | | | |
|
|
|
| | | | | | | | 13,963,270 | |
| Industrials—18.0% | | | | | | | | |
| Aerospace & Defense—1.7% | | | | | | | | |
| B/E Aerospace, Inc.1 | | | 188,760 | | | | 9,324,744 | |
| Moog, Inc., Cl. A1 | | | 36,139 | | | | 1,482,783 | |
| Triumph Group, Inc. | | | 66,920 | | | | 4,369,876 | |
| | | | | | |
|
|
|
| | | | | | | | 15,177,403 | |
| Air Freight & Couriers—2.4% | | | | | | | | |
| Atlas Air Worldwide Holdings, Inc.1 | | | 113,120 | | | | 5,012,347 | |
| Hub Group, Inc., Cl. A1 | | | 517,658 | | | | 17,393,309 | |
| Park-Ohio Holdings Corp.1 | | | 17,372 | | | | 370,197 | |
| | | | | | |
|
|
|
| | | | | | | | 22,775,853 | |
| Airlines—0.1% | | | | | | | | |
| US Airways Group, Inc.1 | | | 69,330 | | | | 935,955 | |
| Commercial Services & Supplies—2.7% | | | | | |
| Deluxe Corp. | | | 54,617 | | | | 1,760,852 | |
| Intersections, Inc. | | | 32,880 | | | | 311,702 | |
| KAR Auction Services, Inc. | | | 275,520 | | | | 5,576,525 | |
| Knoll, Inc. | | | 16,198 | | | | 248,801 | |
| Mine Safety Appliances Co. | | | 17,730 | | | | 757,248 | |
| Steelcase, Inc., Cl. A | | | 138,280 | | | | 1,761,687 | |
| Sykes Enterprises, Inc.1 | | | 50,726 | | | | 772,050 | |
| Waste Connections, Inc. | | | 418,990 | | | | 14,157,672 | |
| | | | | | |
|
|
|
| | | | | | | | 25,346,537 | |
| Construction & Engineering—1.2% | | | | | | | | |
| AECOM Technology Corp.1 | | | 54,160 | | | | 1,289,008 | |
| KBR, Inc. | | | 357,011 | | | | 10,681,769 | |
| | | | | | |
|
|
|
| | | | | | | | 11,970,777 | |
| Electrical Equipment—2.2% | | | | | | | | |
| EnerSys1 | | | 56,580 | | | | 2,129,105 | |
| General Cable Corp.1 | | | 326,823 | | | | 9,938,687 | |
| Regal-Beloit Corp. | | | 126,029 | | | | 8,881,264 | |
| | | | | | |
|
|
|
| | | | | | | | 20,949,056 | |
| Industrial Conglomerates—0.1% | | | | | | | | |
| Standex International Corp. | | | 20,416 | | | | 1,047,137 | |
| Machinery—1.5% | | | | | | | | |
| Altra Holdings, Inc. | | | 22,870 | | | | 504,283 | |
| Barnes Group, Inc. | | | 40,370 | | | | 906,710 | |
| Columbus McKinnon Corp.1 | | | 21,290 | | | | 351,711 | |
| FreightCar America, Inc. | | | 22,970 | | | | 514,987 | |
| Hyster-Yale Materials Handling, Inc., Cl. B | | | 6,860 | | | | 334,768 | |
| Kadant, Inc.1 | | | 31,660 | | | | 839,307 | |
| Miller Industries, Inc. | | | 30,706 | | | | 468,266 | |
| Wabtec Corp. | | | 105,949 | | | | 9,274,775 | |
| Watts Water Technologies, Inc., Cl. A | | | 18,940 | | | | 814,231 | |
| | | | | | |
|
|
|
| | | | | | | | 14,009,038 | |
| Professional Services—3.7% | | | | | | | | |
| ICF International, Inc.1 | | | 54,031 | | | | 1,266,487 | |
| Korn/Ferry International1 | | | 757,161 | | | | 12,008,573 | |
| Navigant Consulting, Inc.1 | | | 75,402 | | | | 841,486 | |
| Resources Connection, Inc. | | | 49,920 | | | | 596,045 | |
| Robert Half International, Inc. | | | 611,815 | | | | 19,467,953 | |
| | | | | | |
|
|
|
| | | | | | | | 34,180,544 | |
| Road & Rail—2.4% | | | | | | | | |
| Genesee & Wyoming, Inc., Cl. A1 | | | 85,691 | | | | 6,519,371 | |
| Old Dominion Freight Line, Inc.1 | | | 402,921 | | | | 13,812,132 | |
| Swift Transportation Co.1 | | | 157,910 | | | | 1,440,139 | |
| | | | | | |
|
|
|
| | | | | | | | 21,771,642 | |
| Information Technology—14.7% | | | | | | | | |
| Communications Equipment—3.2% | | | | | | | | |
| Arris Group, Inc.1 | | | 117,830 | | | | 1,760,380 | |
| Aruba Networks, Inc.1 | | | 701,456 | | | | 14,555,212 | |
| Brocade Communications Systems, Inc.1 | | | 318,192 | | | | 1,695,963 | |
| Finisar Corp.1 | | | 611,271 | | | | 9,963,717 | |
| Harris Corp. | | | 13,270 | | | | 649,699 | |
| | | | | | |
|
|
|
| | | | | | | | 28,624,971 | |
| Computers & Peripherals—1.4% | | | | | | | | |
| Diebold, Inc. | | | 41,140 | | | | 1,259,295 | |
| | | | |
| 8 | | | | OPPENHEIMER MAIN STREET SMALL- & MID-CAP FUND/VA |
| | | | | | | | |
| | | Shares | | | Value | |
| Computers & Peripherals (Continued) | |
| Western Digital Corp. | | | 277,293 | | | $ | 11,782,180 | |
| | | | | | |
|
|
|
| | | | | | | | 13,041,475 | |
| Electronic Equipment, Instruments, & Components—0.0% | |
| Celestica, Inc.1 | | | 8,576 | | | | 69,894 | |
| SYNNEX Corp.1 | | | 8,760 | | | | 301,169 | |
| | | | | | |
|
|
|
| | | | | | | | 371,063 | |
| Internet Software & Services—1.0% | | | | | | | | |
| j2 Global, Inc. | | | 297,373 | | | | 9,093,666 | |
| Perficient, Inc.1 | | | 19,170 | | | | 225,823 | |
| | | | | | |
|
|
|
| | | | | | | | 9,319,489 | |
| IT Services—2.1% | | | | | | | | |
| Acxiom Corp.1 | | | 137,092 | | | | 2,393,626 | |
| Booz Allen Hamilton Holding Corp. | | | 93,885 | | | | 1,306,879 | |
| Broadridge Financial Solutions, Inc. | | | 73,625 | | | | 1,684,540 | |
| CACI International, Inc., Cl. A1 | | | 209,744 | | | | 11,542,212 | |
| CSG Systems International, Inc.1 | | | 65,516 | | | | 1,191,081 | |
| Global Cash Access Holdings, Inc.1 | | | 110,040 | | | | 862,714 | |
| MAXIMUS, Inc. | | | 6,495 | | | | 410,614 | |
| SAIC, Inc. | | | 69,940 | | | | 791,721 | |
| | | | | | |
|
|
|
| | | | | | | | 20,183,387 | |
| Semiconductors & Semiconductor Equipment—3.1% | |
| Cavium, Inc.1 | | | 207,630 | | | | 6,480,132 | |
| IXYS Corp. | | | 52,059 | | | | 475,819 | |
| Semtech Corp.1 | | | 496,798 | | | | 14,382,302 | |
| Skyworks Solutions, Inc.1 | | | 430,359 | | | | 8,736,288 | |
| | | | | | |
|
|
|
| | | | | | | | 30,074,541 | |
| Software—3.9% | | | | | | | | |
| Fortinet, Inc.1 | | | 669,171 | | | | 14,099,433 | |
| Mentor Graphics Corp.1 | | | 90,310 | | | | 1,537,076 | |
| ServiceNow, Inc.1 | | | 119,470 | | | | 3,587,684 | |
| Splunk, Inc.1 | | | 133,170 | | | | 3,864,593 | |
| TIBCO Software, Inc.1 | | | 549,386 | | | | 12,091,986 | |
| Websense, Inc.1 | | | 87,206 | | | | 1,311,578 | |
| | | | | | |
|
|
|
| | | | | | | | 36,492,350 | |
| Materials—7.0% | | | | | | | | |
| Chemicals—3.2% | | | | | | | | |
| A. Schulman, Inc. | | | 65,818 | | | | 1,904,115 | |
| Cytec Industries, Inc. | | | 200,478 | | | | 13,798,901 | |
| H.B. Fuller Co. | | | 58,813 | | | | 2,047,869 | |
| Huntsman Corp. | | | 120,652 | | | | 1,918,367 | |
| Innospec, Inc. | | | 22,870 | | | | 788,786 | |
| Omnova Solutions, Inc.1 | | | 35,040 | | | | 245,630 | |
| W.R. Grace & Co.1 | | | 134,900 | | | | 9,069,327 | |
| | | | | | |
|
|
|
| | | | | | | | 29,772,995 | |
| | | | | | | | |
| | | Shares | | | Value | |
| Containers & Packaging—1.4% | |
| Bemis Co., Inc. | | | 28,300 | | | $ | 946,918 | |
| Graphic Packaging Holding Co.1 | | | 145,097 | | | | 937,327 | |
| Myers Industries, Inc. | | | 52,675 | | | | 798,026 | |
| Packaging Corp. of America | | | 263,930 | | | | 10,153,387 | |
| | | | | | |
|
|
|
| | | | | | | | 12,835,658 | |
| Metals & Mining—1.9% | | | | | | | | |
| Commercial Metals Co. | | | 24,580 | | | | 365,259 | |
| Compass Minerals International, Inc. | | | 121,574 | | | | 9,082,794 | |
| Kaiser Aluminum Corp. | | | 79,740 | | | | 4,919,161 | |
| Metals USA Holdings Corp. | | | 33,160 | | | | 579,968 | |
| Worthington Industries, Inc. | | | 105,097 | | | | 2,731,471 | |
| | | | | | |
|
|
|
| | | | | | | | 17,678,653 | |
| Paper & Forest Products—0.5% | |
| KapStone Paper & Packaging Corp. | | | 77,740 | | | | 1,725,051 | |
| Neenah Paper, Inc. | | | 2,500 | | | | 71,175 | |
| P.H. Glatfelter Co. | | | 118,450 | | | | 2,070,506 | |
| Schweitzer-Mauduit International, Inc. | | | 29,120 | | | | 1,136,554 | |
| | | | | | |
|
|
|
| | | | | | | | 5,003,286 | |
| Telecommunication Services—0.1% | |
| Diversified Telecommunication Services—0.1% | |
| Vonage Holdings Corp.1 | | | 599,108 | | | | 1,419,886 | |
| Utilities—1.1% | | | | | | | | |
| Electric Utilities—0.3% | | | | | | | | |
| El Paso Electric Co. | | | 23,440 | | | | 747,970 | |
| NV Energy, Inc. | | | 72,300 | | | | 1,311,522 | |
| Portland General Electric Co. | | | 23,022 | | | | 629,882 | |
| | | | | | |
|
|
|
| | | | | | | | 2,689,374 | |
| Gas Utilities—0.1% | | | | | | | | |
| UGI Corp. | | | 36,620 | | | | 1,197,840 | |
| Multi-Utilities—0.4% | | | | | | | | |
| TECO Energy, Inc. | | | 97,583 | | | | 1,635,491 | |
| Vectren Corp. | | | 52,719 | | | | 1,549,939 | |
| | | | | | |
|
|
|
| | | | | | | | 3,185,430 | |
| Water Utilities—0.3% | | | | | | | | |
| Aqua America, Inc. | | | 103,203 | | | | 2,623,420 | |
| | | | | | |
|
|
|
Total Common Stocks
(Cost $795,151,749) | | | | | | | 926,690,387 | |
| Investment Company—1.4% | | | | | | | | |
| Oppenheimer Institutional Money Market Fund, Cl. E, 0.15%3,4 | | | | | | | | |
| (Cost $13,103,742) | | | 13,103,742 | | | | 13,103,742 | |
Total Investments, at Value
(Cost $808,255,491) | | | 100.3 | % | | | 939,794,129 | |
| Liabilities in Excess of Other Assets | |
| (0.3)
|
| |
| (2,606,798 )
|
|
| Net Assets | |
| 100.0
| %
| | $
| 937,187,331
|
|
Footnotes to Statement of Investments
1. Non-income producing security.
2. Escrow shares received as a result of issuer reorganization.
3. Rate shown is the 7-day yield as of December 31, 2012.
4. Is or was an affiliate, as defined in the Investment Company Act of 1940, at or during the period ended December 31, 2012, by virtue of the Fund owning at least 5% of the voting securities of the issuer or as a result of the Fund and the issuer having the same investment adviser. Transactions during the period in which the issuer was an affiliate are as follows:
| | | | | | | | | | | | | | | | | | | | |
| | | Shares
December 30, 2011a | | | Gross
Additions | | | Gross
Reductions | | | | | | Shares
December 31, 2012 | |
| Oppenheimer Institutional Money Market Fund, Cl. E | | | 17,286,356 | | | | 298,134,785 | | | | 302,317,399 | | | | | | | | 13,103,742 | |
| | | | | |
| | | | | | | | | | | | Value | | | Income | |
| Oppenheimer Institutional Money Market Fund, Cl. E | | | | | | | | | | | | | | $ | 13,103,742 | | | $ | 47,686 | |
a. December 30, 2011 represents the last business day of the Fund’s 2011 fiscal year. See Note 1 of the accompanying Notes.
See accompanying Notes to Financial Statements.
| | | | |
| 9 | | | | OPPENHEIMER MAIN STREET SMALL- & MID-CAP FUND/VA |
STATEMENT OF ASSETS AND LIABILITIES December 31, 2012
| | | | |
| Assets | | | |
| Investments, at value—see accompanying statement of investments: | | | | |
| Unaffiliated companies (cost $795,151,749) | | $ | 926,690,387 | |
| Affiliated companies (cost $13,103,742) | |
| 13,103,742
|
|
| | | | 939,794,129 | |
| Cash | | | 877 | |
| Receivables and other assets: | | | | |
| Investments sold | | | 7,315,241 | |
| Dividends | | | 1,232,849 | |
| Shares of beneficial interest sold | | | 63,818 | |
| Other | |
| 26,025
|
|
| Total assets | | | 948,432,939 | |
| Liabilities | | | |
| Payables and other liabilities: | | | | |
| Investments purchased | | | 9,647,584 | |
| Shares of beneficial interest redeemed | | | 1,173,197 | |
| Distribution and service plan fees | | | 183,747 | |
| Shareholder communications | | | 95,039 | |
| Transfer and shareholder servicing agent fees | | | 80,732 | |
| Trustees’ compensation | | | 24,502 | |
| Other | |
| 40,807
|
|
| Total liabilities | | | 11,245,608 | |
| Net Assets | | $
| 937,187,331
|
|
| Composition of Net Assets | | | |
| Par value of shares of beneficial interest | | $ | 46,924 | |
| Additional paid-in capital | | | 787,319,303 | |
| Accumulated net investment income | | | 7,663,759 | |
| Accumulated net realized gain on investments | | | 10,618,707 | |
| Net unrealized appreciation on investments | |
| 131,538,638
|
|
| Net Assets | | $
| 937,187,331
|
|
| Net Asset Value Per Share | | | |
| Non-Service Shares: | | | | |
| Net asset value, redemption price per share and offering price per share (based on net assets of $87,266,923 and 4,332,954 shares of beneficial interest outstanding) | | | $20.14 | |
| Service Shares: | | | | |
| Net asset value, redemption price per share and offering price per share (based on net assets of $849,920,408 and 42,591,043 shares of beneficial interest outstanding) | | | $19.96 | |
See accompanying Notes to Financial Statements.
.
| | | | |
| 10 | | | | OPPENHEIMER MAIN STREET SMALL- & MID-CAP FUND/VA |
STATEMENT OF OPERATIONS For the Year Ended December 31, 2012
| | | | |
| Investment Income | | | |
| Dividends: | | | | |
| Unaffiliated companies (net of foreign withholding taxes of $18,401) | | $ | 17,142,033 | |
| Affiliated companies | | | 47,686 | |
| Interest | |
| 462
|
|
| Total investment income | | | 17,190,181 | |
| Expenses | | | |
| Management fees | | | 6,378,552 | |
| Distribution and service plan fees—Service shares | | | 2,100,177 | |
| Transfer and shareholder servicing agent fees: | | | | |
| Non-Service shares | | | 83,943 | |
| Service shares | | | 838,752 | |
| Shareholder communications: | | | | |
| Non-Service shares | | | 13,101 | |
| Service shares | | | 128,282 | |
| Custodian fees and expenses | | | 5,167 | |
| Trustees’ compensation | | | 50,601 | |
| Administration service fees | | | 1,500 | |
| Other | |
| 116,757
|
|
| Total expenses | | | 9,716,832 | |
| Less waivers and reimbursements of expenses | |
| (290,043
| )
|
| Net expenses | | | 9,426,789 | |
| Net Investment Income | | | 7,763,392 | |
| Realized and Unrealized Gain | | | |
| Net realized gain on investments from unaffiliated companies | | | 96,274,108 | |
| Net change in unrealized appreciation/depreciation on investments | | | 44,253,351 | |
| Net Increase in Net Assets Resulting from Operations | | $
| 148,290,851
|
|
See accompanying Notes to Financial Statements.
| | | | |
| 11 | | | | OPPENHEIMER MAIN STREET SMALL- & MID-CAP FUND/VA |
STATEMENTSOF CHANGES IN NET ASSETS
| | | | | | | | |
| | | Year Ended
December 31,
2012 | | | Year Ended
December 30,
20111 | |
| Operations | | | | | | |
| Net investment income | | $ | 7,763,392 | | | $ | 3,290,932 | |
| Net realized gain | | | 96,274,108 | | | | 130,521,268 | |
| Net change in unrealized appreciation/depreciation | |
| 44,253,351
|
| |
| (149,938,873
| )
|
| Net increase (decrease) in net assets resulting from operations | | | 148,290,851 | | | | (16,126,673 | ) |
| Dividends and/or Distributions to Shareholders | | | | | | |
| Dividends from net investment income: | | | | | | | | |
| Non-Service shares | | | (465,213 | ) | | | (569,104 | ) |
| Service shares | |
| (2,756,105
| )
| |
| (3,235,789
| )
|
| | | | (3,221,318 | ) | | | (3,804,893 | ) |
| Beneficial Interest Transactions | | | | | | |
| Net decrease in net assets resulting from beneficial interest transactions: | | | | | | | | |
| Non-Service shares | | | (5,485,155 | ) | | | (13,898,613 | ) |
| Service shares | | | (72,871,133 | ) | | | (50,982,214 | ) |
| | | | (78,356,288 | ) | | | (64,880,827 | ) |
| Net Assets | | | | | | |
| Total increase (decrease) | | | 66,713,245 | | | | (84,812,393 | ) |
| Beginning of period | |
| 870,474,086
|
| |
| 955,286,479
|
|
| End of period (including accumulated net investment income of $7,663,759 and $3,886,759, respectively) | | $
| 937,187,331
|
| | $
| 870,474,086
|
|
1. December 30, 2011 represents the last business day of the Fund’s 2011 fiscal year. See Note 1 of accompanying Notes.
See accompanying Notes to Financial Statements.
| | | | |
| 12 | | | | OPPENHEIMER MAIN STREET SMALL- & MID-CAP FUND/VA |
FINANCIAL HIGHLIGHTS
| | | | | | | | | | | | | | | | | | | | |
| Non-Service Shares | | Year Ended
December 31,
2012 | | | Year Ended
December 30,
20111 | | | Year Ended
December 31,
2010 | | | Year Ended
December 31,
2009 | | | Year Ended
December 31,
2008 | |
| Per Share Operating Data | | | | | | | | | | | | | | | |
| Net asset value, beginning of period | | $ | 17 .17 | | | $ | 17 .66 | | | $ | 14 .40 | | | $ | 10 .65 | | | $ | 18 .20 | |
| Income (loss) from investment operations: | | | | | | | | | | | | | | | | | | | | |
| Net investment income2 | | | 0 .21 | | | | 0 .10 | | | | 0 .10 | | | | 0 .08 | | | | 0 .12 | |
| Net realized and unrealized gain (loss) | |
| 2 .87
|
| |
| (0 .48
| )
| |
| 3 .25
|
| |
| 3 .78
|
| |
| (6 .73
| )
|
| Total from investment operations | | | 3 .08 | | | | (0 .38 | ) | | | 3 .35 | | | | 3 .86 | | | | (6 .61 | ) |
| Dividends and/or distributions to shareholders: | | | | | | | | | | | | | | | | | | | | |
| Dividends from net investment income | | | (0 .11 | ) | | | (0 .11 | ) | | | (0 .09 | ) | | | (0 .11 | ) | | | (0 .08 | ) |
| Distributions from net realized gain | |
| 0 .00
|
| |
| 0 .00
|
| |
| 0 .00
|
| |
| 0 .00
|
| |
| (0 .86
| )
|
| Total dividends and/or distributions to shareholders | | | (0 .11 | ) | | | (0 .11 | ) | | | (0 .09 | ) | | | (0 .11 | ) | | | (0 .94 | ) |
| Net asset value, end of period | | $
| 20.14
|
| | $
| 17.17
|
| | $
| 17.66
|
| | $
| 14.40
|
| | $
| 10.65
|
|
| Total Return, at Net Asset Value3 | | | 17.99 | % | | | (2.21 | )% | | | 23.41 | % | | | 37.20 | % | | | (37.83 | )% |
| | | | | | | | | | | | | | | | | | | | | |
| Ratios/Supplemental Data | | | | | | | | | | | | | | | |
| Net assets, end of period (in thousands) | | $ | 87,267 | | | $ | 79,722 | | | $ | 95,576 | | | $ | 81,814 | | | $ | 58,478 | |
| Average net assets (in thousands) | | $ | 83,790 | | | $ | 86,796 | | | $ | 88,063 | | | $ | 69,585 | | | $ | 80,406 | |
| Ratios to average net assets:4 | | | | | | | | | | | | | | | | | | | | |
| Net investment income | | | 1 .09 | % | | | 0 .58 | % | | | 0 .68 | % | | | 0 .71 | % | | | 0 .80 | % |
| Total expenses5 | | | 0 .83 | % | | | 0 .83 | % | | | 0 .85 | % | | | 0 .91 | % | | | 0 .75 | % |
| Expenses after payments, waivers and/or reimbursements and reduction to custodian expenses | | | 0 .80 | % | | | 0 .80 | % | | | 0 .80 | % | | | 0 .82 | % | | | 0 .75 | % |
| Portfolio turnover rate | | | 92 | % | | | 108 | % | | | 73 | % | | | 140 | % | | | 130 | % |
1. December 30, 2011 represents the last business day of the Fund’s 2011 fiscal year. See Note 1 of the accompanying Notes.
2. Per share amounts calculated based on the average shares outstanding during the period.
3. Assumes an initial investment on the business day before the first day of the fiscal period, with all dividends and distributions reinvested in additional shares on the reinvestment date, and redemption at the net asset value calculated on the last business day of the fiscal period. Total returns are not annualized for periods less than one full year. Total return information does not reflect expenses that apply at the separate account level or to related insurance products. Inclusion of these charges would reduce the total return figures for all periods shown. Returns do not reflect the deduction of taxes that a shareholder would pay on fund distributions or the redemption of fund shares.
4. Annualized for periods less than one full year.
5. Total expenses including indirect expenses from affiliated fund were as follows:
| | | | |
| Year Ended December 31, 2012 | | | 0.83 | % |
| Year Ended December 30, 2011 | | | 0.83 | % |
| Year Ended December 31, 2010 | | | 0.85 | % |
| Year Ended December 31, 2009 | | | 0.91 | % |
| Year Ended December 31, 2008 | | | 0.75 | % |
See accompanying Notes to Financial Statements.
| | | | |
| 13 | | | | OPPENHEIMER MAIN STREET SMALL- & MID-CAP FUND/VA |
FINANCIAL HIGHLIGHTS (Continued)
| | | | | | | | | | | | | | | | | | | | |
| Service Shares | | Year Ended
December 31,
2012 | | | Year Ended
December 30,
20111 | | | Year Ended
December 31,
2010 | | | Year Ended
December 31,
2009 | | | Year Ended
December 31,
2008 | |
| Per Share Operating Data | | | | | | | | | | | | | | | | | | | | |
| Net asset value, beginning of period | | $ | 17 .02 | | | $ | 17 .50 | | | $ | 14 .28 | | | $ | 10 .54 | | | $ | 18 .03 | |
| Income (loss) from investment operations: | | | | | | | | | | | | | | | | | | | | |
| Net investment income2 | | | 0 .15 | | | | 0 .06 | | | | 0 .07 | | | | 0 .05 | | | | 0 .08 | |
| Net realized and unrealized gain (loss) | |
| 2 .85
|
| |
| (0 .47
| )
| |
| 3 .21
|
| |
| 3 .76
|
| |
| (6 .67
| )
|
| Total from investment operations | | | 3 .00 | | | | (0 .41 | ) | | | 3 .28 | | | | 3 .81 | | | | (6 .59 | ) |
| Dividends and/or distributions to shareholders: | | | | | | | | | | | | | | | | | | | | |
| Dividends from net investment income | | | (0 .06 | ) | | | (0 .07 | ) | | | (0 .06 | ) | | | (0 .07 | ) | | | (0 .04 | ) |
| Distributions from net realized gain | |
| 0 .00
|
| |
| 0 .00
|
| |
| 0 .00
|
| |
| 0 .00
|
| |
| (0 .86
| )
|
| Total dividends and/or distributions to shareholders | | | (0 .06 | ) | | | (0 .07 | ) | | | (0 .06 | ) | | | (0 .07 | ) | | | (0 .90 | ) |
| Net asset value, end of period | | $
| 19 .96
|
| | $
| 17 .02
|
| | $
| 17 .50
|
| | $
| 14 .28
|
| | $
| 10 .54
|
|
| Total Return, at Net Asset Value3 | | | 17 .67 | % | | | (2 .38 | )% | | | 23 .06 | % | | | 36 .88 | % | | | (38 .00 | )% |
| | | | | | | | | | | | | | | | | | | | | |
| Ratios/Supplemental Data | | | | | | | | | | | | | | | | | | | | |
| Net assets, end of period (in thousands) | | $ | 849,920 | | | $ | 790,752 | | | $ | 859,710 | | | $ | 662,347 | | | $ | 551,644 | |
| Average net assets (in thousands) | | $ | 836,487 | | | $ | 823,201 | | | $ | 730,069 | | | $ | 612,651 | | | $ | 769,150 | |
| Ratios to average net assets:4 | | | | | | | | | | | | | | | | | | | | |
| Net investment income | | | 0 .82 | % | | | 0 .34 | % | | | 0 .45 | % | | | 0 .47 | % | | | 0 .52 | % |
| Total expenses5 | | | 1 .08 | % | | | 1 .08 | % | | | 1 .10 | % | | | 1 .15 | % | | | 0 .99 | % |
| Expenses after payments, waivers and/or reimbursements and reduction to custodian expenses | | | 1 .05 | % | | | 1 .05 | % | | | 1 .05 | % | | | 1 .07 | % | | | 0 .99 | % |
| Portfolio turnover rate | | | 92 | % | | | 108 | % | | | 73 | % | | | 140 | % | | | 130 | % |
1. December 30, 2011 represents the last business day of the Fund’s 2011 fiscal year. See Note 1 of the accompanying Notes.
2. Per share amounts calculated based on the average shares outstanding during the period.
3. Assumes an initial investment on the business day before the first day of the fiscal period, with all dividends and distributions reinvested in additional shares on the reinvestment date, and redemption at the net asset value calculated on the last business day of the fiscal period. Total returns are not annualized for periods less than one full year. Total return information does not reflect expenses that apply at the separate account level or to related insurance products. Inclusion of these charges would reduce the total return figures for all periods shown. Returns do not reflect the deduction of taxes that a shareholder would pay on fund distributions or the redemption of fund shares.
4. Annualized for periods less than one full year.
5. Total expenses including indirect expenses from affiliated fund were as follows:
| | | | |
| Year Ended December 31, 2012 | | | 1 .08 | % |
| Year Ended December 30, 2011 | | | 1 .08 | % |
| Year Ended December 31, 2010 | | | 1 .10 | % |
| Year Ended December 31, 2009 | | | 1 .15 | % |
| Year Ended December 31, 2008 | | | 0 .99 | % |
See accompanying Notes to Financial Statements.
| | | | |
| 14 | | | | OPPENHEIMER MAIN STREET SMALL- & MID-CAP FUND/VA |
NOTES TO FINANCIAL STATEMENTS
1. Significant Accounting Policies
Oppenheimer Main Street Small- & Mid-Cap Fund/VA (the “Fund”) is a separate series of Oppenheimer Variable Account Funds, a diversified open-end management investment company registered under the Investment Company Act of 1940, as amended. The Fund’s investment objective is to seek capital appreciation. The Fund’s investment adviser is OppenheimerFunds, Inc. (the “Manager”).
The Fund offers two classes of shares. Both classes are sold at their offering price, which is the net asset value per share, to separate investment accounts of participating insurance companies as an underlying investment for variable life insurance policies, variable annuity contracts or other investment products. The class of shares designated as Service shares is subject to a distribution and service plan. Both classes of shares have identical rights and voting privileges with respect to the Fund in general and exclusive voting rights on matters that affect that class alone. Earnings, net assets and net asset value per share may differ due to each class having its own expenses, such as transfer and shareholder servicing agent fees and shareholder communications, directly attributable to that class.
The following is a summary of significant accounting policies consistently followed by the Fund.
Previous Annual Period. The last day of the Fund’s fiscal year was the last day the New York Stock Exchange was open for trading. The Fund’s financial statements have been presented through that date to maintain consistency with the Fund’s net asset value calculations used for shareholder transactions.
Investment in Oppenheimer Institutional Money Market Fund. The Fund is permitted to invest daily available cash balances in an affiliated money market fund. The Fund may invest the available cash in Class E shares of Oppenheimer Institutional Money Market Fund (“IMMF”) to seek current income while preserving liquidity. IMMF is a registered open-end management investment company, regulated as a money market fund under the Investment Company Act of 1940, as amended. The Manager is also the investment adviser of IMMF. When applicable, the Fund’s investment in IMMF is included in the Statement of Investments. Shares of IMMF are valued at their net asset value per share. As a shareholder, the Fund is subject to its proportional share of IMMF’s Class E expenses, including its management fee. The Manager will waive fees and/or reimburse Fund expenses in an amount equal to the indirect management fees incurred through the Fund’s investment in IMMF.
Allocation of Income, Expenses, Gains and Losses. Income, expenses (other than those attributable to a specific class), gains and losses are allocated on a daily basis to each class of shares based upon the relative proportion of net assets represented by such class. Operating expenses directly attributable to a specific class are charged against the operations of that class.
Federal Taxes. The Fund intends to comply with provisions of the Internal Revenue Code applicable to regulated investment companies and to distribute substantially all of its investment company taxable income, including any net realized gain on investments not offset by capital loss carryforwards, if any, to shareholders. Therefore, no federal income or excise tax provision is required. The Fund files income tax returns in U.S. federal and applicable state jurisdictions. The statute of limitations on the Fund’s tax return filings generally remain open for the three preceding fiscal reporting period ends.
The tax components of capital shown in the following table represent distribution requirements the Fund must satisfy under the income tax regulations, losses the Fund may be able to offset against income and gains realized in future years and unrealized appreciation or depreciation of securities and other investments for federal income tax purposes.
| | | | | | | | | | | | |
Undistributed
Net
Investment
Income | | Undistributed
Long-Term
Gain | | | Accumulated
Loss
Carryforward1,2 | | | Net Unrealized
Appreciation
Based on cost of
Securities and Other Investments
for Federal Income
Tax Purposes | |
| $6,965,083 | | $ | 13,168,987 | | | $ | — | | | $ | 129,711,542 | |
1. During the fiscal year ended December 31, 2012, the Fund utilized $81,263,761 of capital loss carryforward to offset capital gains realized in that fiscal year.
2. During the fiscal year ended December 30, 2011, the Fund utilized $125,951,235 of capital loss carryforward to offset capital gains realized in that fiscal year.
Net investment income (loss) and net realized gain (loss) may differ for financial statement and tax purposes. The character of dividends and distributions made during the fiscal year from net investment income or net realized gains may differ from their ultimate characterization for federal income tax purposes. Also, due to timing of dividends and distributions, the fiscal year in which amounts are distributed may differ from the fiscal year in which the income or net realized gain was recorded by the Fund.
Accordingly, the following amounts have been reclassified for December 31, 2012. Net assets of the Fund were unaffected by the reclassifications.
| | | | | | | | |
| Increase to Paid-in Capital | | Reduction to
Accumulated
Net Investment
Income | | | Reduction to
Accumulated Net
Realized Gain on
Investments3 | |
| $1,324,294 | | $ | 765,074 | | | $ | 559,220 | |
| | | | |
| 15 | | | | OPPENHEIMER MAIN STREET SMALL- & MID-CAP FUND/VA |
NOTES TO FINANCIAL STATEMENTS / (Continued)
1. Significant Accounting Policies (Continued)
3. $1,326,288, all of which was long-term capital gain, was distributed in connection with Fund share redemptions.
The tax character of distributions paid during the years ended December 31, 2012 and December 31, 2011 was as follows:
| | | | | | | | |
| | | Year Ended
December 31, 2012 | | | Year Ended
December 31,
2011 | |
Distributions paid from: | | | | | | | | |
| Ordinary income | | $ | 3,221,318 | | | $ | 3,804,893 | |
The aggregate cost of securities and other investments and the composition of unrealized appreciation and depreciation of securities and other investments for federal income tax purposes as of December 31, 2012 are noted in the following table. The primary difference between book and tax appreciation or depreciation of securities and other investments, if applicable, is attributable to the tax deferral of losses or tax realization of financial statement unrealized gain or loss.
| | | | |
| Federal tax cost of securities | | $ | 810,082,587 | |
| | |
|
|
|
| Gross unrealized appreciation | | $ | 147,183,695 | |
| Gross unrealized depreciation | | | (17,472,153) | |
| | |
|
|
|
| Net unrealized appreciation | | $ | 129,711,542 | |
| | |
|
|
|
Trustees’ Compensation. The Board of Trustees has adopted a compensation deferral plan for independent trustees that enables trustees to elect to defer receipt of all or a portion of the annual compensation they are entitled to receive from the Fund. For purposes of determining the amount owed to the Trustee under the plan, deferred amounts are treated as though equal dollar amounts had been invested in shares of the Fund or in other Oppenheimer funds selected by the Trustee. The Fund purchases shares of the funds selected for deferral by the Trustee in amounts equal to his or her deemed investment, resulting in a Fund asset equal to the deferred compensation liability. Such assets are included as a component of “Other” within the asset section of the Statement of Assets and Liabilities. Deferral of trustees’ fees under the plan will not affect the net assets of the Fund, and will not materially affect the Fund’s assets, liabilities or net investment income per share. Amounts will be deferred until distributed in accordance with the compensation deferral plan.
Dividends and Distributions to Shareholders. Dividends and distributions to shareholders, which are determined in accordance with income tax regulations and may differ from U.S. generally accepted accounting principles, are recorded on the ex-dividend date. Income and capital gain distributions, if any, are declared and paid annually or at other times as deemed necessary by the Manager.
Investment Income. Dividend income is recorded on the ex-dividend date or upon ex-dividend notification in the case of certain foreign dividends where the ex-dividend date may have passed. Non-cash dividends included in dividend income, if any, are recorded at the fair market value of the securities received. Interest income is recognized on an accrual basis. Discount and premium, which are included in interest income on the Statement of Operations, are amortized or accreted daily.
Custodian Fees. “Custodian fees and expenses” in the Statement of Operations may include interest expense incurred by the Fund on any cash overdrafts of its custodian account during the period. Such cash overdrafts may result from the effects of failed trades in portfolio securities and from cash outflows resulting from unanticipated shareholder redemption activity. The Fund pays interest to its custodian on such cash overdrafts, to the extent they are not offset by positive cash balances maintained by the Fund, at a rate equal to the Federal Funds Rate plus 0.50%. The “Reduction to custodian expenses” line item, if applicable, represents earnings on cash balances maintained by the Fund during the period. Such interest expense and other custodian fees may be paid with these earnings.
Security Transactions. Security transactions are recorded on the trade date. Realized gains and losses on securities sold are determined on the basis of identified cost.
Indemnifications. The Fund’s organizational documents provide current and former trustees and officers with a limited indemnification against liabilities arising in connection with the performance of their duties to the Fund. In the normal course of business, the Fund may also enter into contracts that provide general indemnifications. The Fund’s maximum exposure under these arrangements is unknown as this would be dependent on future claims that may be made against the Fund. The risk of material loss from such claims is considered remote.
Other. The preparation of financial statements in conformity with accounting principles generally accepted in the United States of America requires management to make estimates and assumptions that affect the reported amounts of assets and liabilities and disclosure of contingent assets and liabilities at the date of the financial statements and the reported amounts of increases and decreases in net assets from operations during the reporting period. Actual results could differ from those estimates.
| | | | |
| 16 | | | | OPPENHEIMER MAIN STREET SMALL- & MID-CAP FUND/VA |
2. Securities Valuation
The Fund calculates the net asset value of its shares as of the close of the New York Stock Exchange (the “Exchange”), normally 4:00 P.M. Eastern time, on each day the Exchange is open for trading.
The Fund’s Board has adopted procedures for the valuation of the Fund’s securities and has delegated the day-to-day responsibility for valuation determinations under those procedures to the Manager. The Manager has established a Valuation Committee which is responsible for determining a “fair valuation” for any security for which market quotations are not “readily available.” The Valuation Committee’s fair valuation determinations are subject to review, approval and ratification by the Fund’s Board at its next regularly scheduled meeting covering the calendar quarter in which the fair valuation was determined.
Valuation Methods and Inputs
Securities are valued using unadjusted quoted market prices, when available, as supplied primarily by third party pricing services or dealers.
The following methodologies are used to determine the market value or the fair value of the types of securities described below:
Securities traded on a registered U.S. securities exchange (including exchange-traded derivatives other than futures and futures options) are valued based on the last sale price of the security reported on the principal exchange on which it is traded, prior to the time when the Fund’s assets are valued. In the absence of a sale, the security is valued at the last sale price on the prior trading day, if it is within the spread of the current day’s closing “bid” and “asked” prices, and if not, at the current day’s closing bid price. A security of a foreign issuer traded on a foreign exchange but not listed on a registered U.S. securities exchange is valued based on the last sale price on the principal exchange on which the security is traded, as identified by the third party pricing service used by the Manager, prior to the time when the Fund’s assets are valued. If the last sale price is unavailable, the security is valued at the most recent official closing price on the principal exchange on which it is traded. If the last sales price or official closing price for a foreign security is not available, the security is valued at the mean between the bid and asked price per the exchange or, if not available from the exchange, obtained from two dealers. If bid and asked prices are not available from either the exchange or two dealers, the security is valued by using one of the following methodologies (listed in order of priority); (1) using a bid from the exchange, (2) the mean between the bid and asked price as provided by a single dealer, or (3) a bid from a single dealer.
Shares of a registered investment company that are not traded on an exchange are valued at that investment company’s net asset value per share.
Corporate and government debt securities (of U.S. or foreign issuers) and municipal debt securities, event-linked bonds, loans, mortgage-backed securities, collateralized mortgage obligations, and asset-backed securities are valued at the mean between the “bid” and “asked” prices utilizing evaluated prices obtained from third party pricing services or broker-dealers who may use matrix pricing methods to determine the evaluated prices.
Short-term money market type debt securities with a remaining maturity of sixty days or less are valued at cost adjusted by the amortization of discount or premium to maturity (amortized cost), which approximates market value. Short-term debt securities with a remaining maturity in excess of sixty days are valued at the mean between the “bid” and “asked” prices utilizing evaluated prices obtained from third party pricing services or broker-dealers.
A description of the standard inputs that may generally be considered by the third party pricing vendors in determining their evaluated prices is provided below.
| | |
| Security Type | | Standard inputs generally considered by third-party pricing
vendors |
Corporate debt, government debt, municipal, mortgage-backed and asset-backed securities | | Reported trade data, broker-dealer price quotations, benchmark yields, issuer spreads on comparable securities, the credit quality, yield, maturity, and other appropriate factors. |
| Loans | | Information obtained from market participants regarding reported trade data and broker-dealer price quotations. |
| Event-linked bonds | | Information obtained from market participants regarding reported trade data and broker-dealer price quotations. |
If a market value or price cannot be determined for a security using the methodologies described above, or if, in the “good faith” opinion of the Manager, the market value or price obtained does not constitute a “readily available market quotation,” or a significant event has occurred that would materially affect the value of the security the security is fair valued either (i) by a standardized fair valuation methodology applicable to the security type or the significant event as previously approved by the Valuation Committee and the Fund’s Board or (ii) as determined in good faith by the Manager’s Valuation Committee. The Valuation Committee considers all relevant facts that are reasonably available, through either public information or information available to the Manager, when determining the fair value of a security. Fair value determinations by the Manager are subject to review, approval and ratification by the Fund’s Board at its next regularly scheduled meeting covering the calendar quarter in which the fair valuation was determined. Those fair valuation standardized methodologies include, but are not limited to, valuing securities at the last sale price or initially at cost and subsequently adjusting the value based on: changes in company specific fundamentals, changes in an appropriate securities index, or changes in the value of similar securities which may be further adjusted for any discounts related to security-specific resale restrictions. When possible, such methodologies use observable market inputs such as unadjusted quoted prices of similar securities, observable interest rates, currency rates and yield curves. The methodologies used for valuing securities are not necessarily an indication of the risks associated with investing in those securities nor can it be assured that the Fund can obtain the fair value assigned to a security if it were to sell the security.
To assess the continuing appropriateness of security valuations, the Manager, or its third party service provider who is subject to oversight by the Manager, regularly compares prior day prices, prices on comparable securities, and sale prices to the current day prices and challenges those prices exceeding certain tolerance levels with the third party pricing service or broker source. For those securities valued by fair valuations, whether through a standardized fair valuation methodology or a fair valuation determination, the Valuation Committee reviews and affirms the reasonableness of the valuations based on such methodologies and fair valuation determinations on a regular basis after considering all relevant information that is reasonably available.
| | | | |
| 17 | | | | OPPENHEIMER MAIN STREET SMALL- & MID-CAP FUND/VA |
NOTES TO FINANCIAL STATEMENTS / (Continued)
2. Securities Valuation (Continued)
Classifications
Each investment asset or liability of the Fund is assigned a level at measurement date based on the significance and source of the inputs to its valuation. Various data inputs are used in determining the value of each of the Fund’s investments as of the reporting period end. These data inputs are categorized in the following hierarchy under applicable financial accounting standards:
| | 1) | Level 1-unadjusted quoted prices in active markets for identical assets or liabilities (including securities actively traded on a securities exchange) |
| | 2) | Level 2-inputs other than unadjusted quoted prices that are observable for the asset or liability (such as unadjusted quoted prices for similar assets and market corroborated inputs such as interest rates, prepayment speeds, credit risks, etc.) |
| | 3) | Level 3-significant unobservable inputs (including the Manager’s own judgments about assumptions that market participants would use in pricing the asset or liability). |
The inputs used for valuing securities are not necessarily an indication of the risks associated with investing in those securities.
The table below categorizes amounts that are included in the Fund’s Statement of Assets and Liabilities as of December 31, 2012 based on valuation input level:
| | | | | | | | | | | | | | | | |
| | | Level 1—
Unadjusted Quoted Prices | | | Level 2—
Other Significant Observable Inputs | | | Level 3—
Significant
Unobservable
Inputs | | | Value | |
| Assets Table | | | | | | | | | | | | | | | | |
| Investments, at Value: | | | | | | | | | | | | | | | | |
| Common Stocks | | | | | | | | | | | | | | | | |
Consumer Discretionary | | $ | 126,650,199 | | | $ | — | | | $ | — | | | $ | 126,650,199 | |
Consumer Staples | | | 24,524,410 | | | | — | | | | — | | | | 24,524,410 | |
Energy | | | 58,958,727 | | | | — | | | | — | | | | 58,958,727 | |
Financials | | | 226,163,813 | | | | — | | | | — | | | | 226,163,813 | |
Health Care | | | 107,715,453 | | | | — | | | | 25 | | | | 107,715,478 | |
Industrials | | | 167,829,174 | | | | 334,768 | | | | — | | | | 168,163,942 | |
Information Technology | | | 138,107,276 | | | | — | | | | — | | | | 138,107,276 | |
Materials | | | 65,290,592 | | | | — | | | | — | | | | 65,290,592 | |
Telecommunication Services | | | 1,419,886 | | | | — | | | | — | | | | 1,419,886 | |
Utilities | | | 9,696,064 | | | | — | | | | — | | | | 9,696,064 | |
Investment Company | | | 13,103,742 | | | | — | | | | — | | | | 13,103,742 | |
| | |
|
|
| |
|
|
| |
|
|
| |
|
|
|
| Total Assets | | $ | 939,459,336 | | | $ | 334,768 | | | $ | 25 | | | $ | 939,794,129 | |
| | |
|
|
| |
|
|
| |
|
|
| |
|
|
|
Currency contracts and forwards, if any, are reported at their unrealized appreciation/ depreciation at measurement date, which represents the change in the contract’s value from trade date. Futures, if any, are reported at their variation margin at measurement date, which represents the amount due to/from the Fund at that date. All additional assets and liabilities included in the above table are reported at their market value at measurement date.
There have been no significant changes to the fair valuation methodologies of the Fund during the period.
3. Shares of Beneficial Interest
The Fund has authorized an unlimited number of $0.001 par value shares of beneficial interest of each class. Transactions in shares of beneficial interest were as follows:
| | | | | | | | | | | | | | | | |
| | | Year Ended December 31, 2012 | | | Year Ended December 30, 2011 | |
| | | Shares | | | Amount | | | Shares | | | Amount | |
| Non-Service Shares | | | | | | | | | | | | | | | | |
| Sold | | | 1,076,459 | | | | $20,632,430 | | | | 1,642,399 | | | | $27,944,106 | |
| Dividends and/or distributions reinvested | | | 25,160 | | | | 465,213 | | | | 30,896 | | | | 569,104 | |
| Redeemed | | | (1,410,970 | ) | | | (26,582,798 | ) | | | (2,443,618 | ) | | | (42,411,823 | ) |
| | |
|
|
| |
|
|
| |
|
|
| |
|
|
|
| Net decrease | | | (309,351 | ) | | | $(5,485,155 | ) | | | (770,323 | ) | | | $(13,898,613 | ) |
| | |
|
|
| |
|
|
| |
|
|
| |
|
|
|
| | | | | | | | | | | | | |
| Service Shares | | | | | | | | | | | | | | | | |
| Sold | | | 4,633,662 | | | | $87,048,768 | | | | 6,217,855 | | | | $105,066,282 | |
| Dividends and/or distributions reinvested | | | 150,278 | | | | 2,756,105 | | | | 176,916 | | | | 3,235,789 | |
| Redeemed | | | (8,665,817 | ) | | | (162,676,006 | ) | | | (9,038,872 | ) | | | (159,284,285 | ) |
| | |
|
|
| |
|
|
| |
|
|
| |
|
|
|
| Net decrease | | | (3,881,877 | ) | | | $(72,871,133 | ) | | | (2,644,101 | ) | | | $(50,982,214 | ) |
| | |
|
|
| |
|
|
| |
|
|
| |
|
|
|
| | | | |
| 18 | | | | OPPENHEIMER MAIN STREET SMALL- & MID-CAP FUND/VA |
4. Purchases and Sales of Securities
The aggregate cost of purchases and proceeds from sales of securities, other than short-term obligations and investments in IMMF, for the year ended December 31, 2012, were as follows:
| | | | | | | | |
| | | Purchases | | | Sales | |
| Investment securities | | $ | 823,140,575 | | | $ | 894,755,148 | |
5. Fees and Other Transactions with Affiliates
Management Fees. Under the investment advisory agreement, the Fund pays the Manager a management fee based on the daily net assets of the Fund at an annual rate as shown in the following table:
| | | | |
| Fee Schedule | | | |
| Up to $200 million | | | 0.75 | % |
| Next $200 million | | | 0.72 | |
| Next $200 million | | | 0.69 | |
| Next $200 million | | | 0.66 | |
| Over $800 million | | | 0.60 | |
Administrative Service Fees. The Fund pays the Manager a fee of $1,500 per year for preparing and filing the Fund’s tax returns.
Transfer Agent Fees. OppenheimerFunds Services (“OFS”), a division of the Manager, acts as the transfer and shareholder servicing agent for the Fund. For the year ended December 31, 2012, the Fund paid $915,933 to OFS for services to the Fund.
Distribution and Service Plan for Service Shares. The Fund has adopted a Distribution and Service Plan (the “Plan”) in accordance with Rule 12b-1 under the Investment Company Act of 1940 for Service shares to pay OppenheimerFunds Distributor, Inc. (the “Distributor”), for distribution related services, personal service and account maintenance for the Fund’s Service shares. Under the Plan, payments are made periodically at an annual rate of 0.25% of the daily net assets of Service shares of the Fund. The Distributor currently uses all of those fees to compensate sponsors of the insurance product that offers Fund shares, for providing personal service and maintenance of accounts of their variable contract owners that hold Service shares. These fees are paid out of the Fund’s assets on an on-going basis and increase operating expenses of the Service shares, which results in lower performance compared to the Fund’s shares that are not subject to a service fee. Fees incurred by the Fund under the Plan are detailed in the Statement of Operations.
Waivers and Reimbursements of Expenses. The Manager has voluntarily agreed to limit the Fund’s expenses after payments, waivers and/or reimbursements and reduction to custodian expenses, excluding expenses incurred directly or indirectly by the Fund as a result of investments in other investment companies, wholly-owned subsidiaries and pooled investment vehicles; so that those expenses, as percentages of daily net assets, will not exceed the annual rate of 0.80% for Non-Service shares and 1.05% for Service shares. During the year ended December 31, 2012, the Manager waived fees and/or reimbursed the Fund $22,632 and $243,697 for Non-Service and Service shares, respectively.
The Manager will waive fees and/or reimburse Fund expenses in an amount equal to the indirect management fees incurred through the Fund’s investment in IMMF. During the year ended December 31, 2012, the Manager waived fees and/or reimbursed the Fund $23,714 for IMMF management fees.
Some of these undertakings may be modified or terminated at any time; some may not be modified or terminated until after one year from the date of the current prospectus, as indicated therein.
6. Subsequent Event
The Board of Trustees of the Fund recently approved a series of modifications to the Fund’s investment advisory and transfer agency arrangements in connection with internal corporate restructuring efforts at OppenheimerFunds, Inc. (“OFI”). As a result of these modifications, on January 1, 2013 (the “Effective Date”), OFI Global Asset Management, Inc. (“OFI Global”), a wholly-owned subsidiary of OFI, became the investment adviser and transfer agent to the Fund under the terms of the Fund’s advisory agreement and transfer agency agreement, respectively. OFI Global, in turn, entered into a new sub-advisory agreement for the Fund, on the Effective Date, whereby OFI Global will have oversight and supervisory responsibilities and OFI will choose the Fund’s investments and provide related advisory services to the Fund. In addition, on the Effective Date, OFI Global entered into a sub-transfer agency agreement with Shareholder Services, Inc. doing business as OppenheimerFunds Services, a wholly-owned subsidiary of OFI, under which it will be responsible for providing transfer agency services to the Fund.
The realignment of advisory service responsibility between OFI Global and OFI did not result in any change in the persons managing the assets of the Fund, the level or nature of the advisory services provided to the Fund, or the fees charged to the Fund.
7. Pending Litigation
Since 2009, a number of class action lawsuits have been pending in federal courts against OppenheimerFunds, Inc., the Fund’s Adviser through December 31, 2012 and Sub-Adviser effective January 1, 2013 (the “Manager”), OppenheimerFunds Distributor, Inc., the Fund’s principal underwriter and distributor (the “Distributor”), and certain funds (but not including the Fund) advised by the Manager and distributed by the Distributor (the
| | | | |
| 19 | | | | OPPENHEIMER MAIN STREET SMALL- & MID-CAP FUND/VA |
NOTES TO FINANCIAL STATEMENTS / (Continued)
7. Pending Litigation (Continued)
“Defendant Funds”). Several of these lawsuits also name as defendants certain officers and current and former trustees of the respective Defendant Funds. The lawsuits raise claims under federal securities law and allege, among other things, that the disclosure documents of the respective Defendant Funds contained misrepresentations and omissions and that the respective Defendant Funds’ investment policies were not followed. The plaintiffs in these actions seek unspecified damages, equitable relief and awards of attorneys’ fees and litigation expenses. The Defendant Funds’ Boards of Trustees have also engaged counsel to represent the Funds and the present and former Independent Trustees named in those suits.
Other class action and individual lawsuits have been filed since 2008 in various state and federal courts against the Manager and certain of its affiliates by investors seeking to recover investments they allegedly lost as a result of the “Ponzi” scheme run by Bernard L. Madoff and his firm, Bernard L. Madoff Investment Securities, LLC (“BLMIS”). Plaintiffs in these suits allege that they suffered losses as a result of their investments in several funds managed by an affiliate of the Manager and assert a variety of claims, including breach of fiduciary duty, fraud, negligent misrepresentation, unjust enrichment, and violation of federal and state securities laws and regulations, among others. They seek unspecified damages, equitable relief and awards of attorneys’ fees and litigation expenses. Neither the Distributor, nor any of the Oppenheimer mutual funds, their independent trustees or directors are named as defendants in these lawsuits. None of the Oppenheimer mutual funds invested in any funds or accounts managed by Madoff or BLMIS. On February 28, 2011, a stipulation of partial settlement of three groups of consolidated putative class action lawsuits relating to these matters was filed in the U.S. District Court for the Southern District of New York. On August 19, 2011, the court entered an order and final judgment approving the settlement as fair, reasonable and adequate. In September 2011, certain parties filed notices of appeal from the court’s order approving the settlement. The settlement does not resolve other outstanding lawsuits against the Manager and its affiliates relating to BLMIS.
On April 16, 2010, a lawsuit was filed in New York state court against the Manager, an affiliate of the Manager and AAArdvark IV Funding Limited (“AAArdvark IV”), an entity advised by the Manager’s affiliate, in connection with investments made by the plaintiffs in AAArdvark IV. Plaintiffs allege breach of contract against the defendants and seek compensatory damages, costs and disbursements, including attorney fees. On July 15, 2011, a lawsuit was filed in New York state court against the Manager, an affiliate of the Manager and AAArdvark Funding Limited (“AAArdvark I”), an entity advised by the Manager’s affiliate, in connection with investments made by the plaintiffs in AAArdvark I. The complaint alleges breach of contract against the defendants and seeks compensatory damages, costs and disbursements, including attorney fees. On November 9, 2011, a lawsuit was filed in New York state court against the Manager, an affiliate of the Manager and AAArdvark XS Funding Limited (“AAArdvark XS”), an entity advised by the Manager’s affiliate, in connection with investments made by the plaintiffs in AAArdvark XS. The complaint alleges breach of contract against the defendants and seeks compensatory damages, costs and disbursements, including attorney fees.
The Manager believes the lawsuits and appeals described above are without legal merit and, with the exception of actions it has settled, is defending against them vigorously. While it is premature to render any opinion as to the outcome in these lawsuits, or whether any costs that the Defendant Funds may bear in defending the suits might not be reimbursed by insurance, the Manager believes that these suits should not impair the ability of the Manager or the Distributor to perform their respective duties to the Fund, and that the outcome of all of the suits together should not have any material effect on the operations of any of the Oppenheimer mutual funds.
| | | | |
| 20 | | | | OPPENHEIMER MAIN STREET SMALL- & MID-CAP FUND/VA |
REPORT OF INDEPENDENT REGISTERED PUBLIC ACCOUNTING FIRM
The Board of Trustees and Shareholders of Oppenheimer Variable Account Funds:
We have audited the accompanying statement of assets and liabilities of Oppenheimer Main Street Small- & Mid-Cap Fund/VA (a separate series of Oppenheimer Variable Account Funds), including the statement of investments, as of December 31, 2012, and the related statement of operations for the year then ended, the statements of changes in net assets for each of the years in the two-year period then ended and the financial highlights for each of the years in the four-year period then ended. These financial statements and financial highlights are the responsibility of the Fund’s management. Our responsibility is to express an opinion on these financial statements and financial highlights based on our audits. The accompanying financial highlights of Oppenheimer Main Street Small- & Mid-Cap Fund/VA for the year ended December 31, 2008 were audited by other auditors whose report dated February 11, 2009 expressed an unqualified opinion on those financial highlights.
We conducted our audits in accordance with the standards of the Public Company Accounting Oversight Board (United States). Those standards require that we plan and perform the audit to obtain reasonable assurance about whether the financial statements and financial highlights are free of material misstatement. An audit includes examining, on a test basis, evidence supporting the amounts and disclosures in the financial statements. Our procedures included confirmation of securities owned as of December 31, 2012, by correspondence with the custodian, transfer agent and brokers, or by other appropriate auditing procedures where replies from brokers were not received. An audit also includes assessing the accounting principles used and significant estimates made by management, as well as evaluating the overall financial statement presentation. We believe that our audits provide a reasonable basis for our opinion.
In our opinion, the financial statements and financial highlights referred to above present fairly, in all material respects, the financial position of Oppenheimer Main Street Small- & Mid-Cap Fund/VA as of December 31, 2012, the results of its operations for the year then ended, the changes in its net assets for each of the years in the two-year period then ended and the financial highlights for each of the years in the four-year period then ended, in conformity with U.S. generally accepted accounting principles.
KPMG LLP
Denver, Colorado
February 19, 2013
| | | | |
| 21 | | | | OPPENHEIMER MAIN STREET SMALL- & MID-CAP FUND/VA |
FEDERAL INCOME TAX INFORMATION Unaudited
In early 2013, if applicable, shareholders of record received information regarding all dividends and distributions paid to them by the Fund during calendar year 2012.
Dividends, if any, paid by the Fund during the fiscal year ended December 31, 2012 which are not designated as capital gain distributions should be multiplied by the maximum amount allowable but not less than 100% to arrive at the amount eligible for the corporate dividend-received deduction.
The foregoing information is presented to assist shareholders in reporting distributions received from the Fund to the Internal Revenue Service. Because of the complexity of the federal regulations which may affect your individual tax return and the many variations in state and local tax regulations, we recommend that you consult your tax advisor for specific guidance.
| | | | |
| 22 | | | | OPPENHEIMER MAIN STREET SMALL- & MID-CAP FUND/VA |
BOARD APPROVAL OF THE FUND’S INVESTMENT
ADVISORY AGREEMENT Unaudited
Each year, the Board of Trustees (the “Board”), including a majority of the independent Trustees, is required to determine whether to renew the Fund’s investment advisory agreement (the “Agreement”). The Investment Company Act of 1940, as amended, requires that the Board request and evaluate, and that the Manager provide, such information as may be reasonably necessary to evaluate the terms of the Agreement. The Board employs an independent consultant to prepare a report that provides information, including comparative information that the Board requests for that purpose. In addition to in-person meetings focused on this evaluation, the Board receives information throughout the year regarding Fund services, fees, expenses and performance.
The Manager and the independent consultant provided information to the Board on the following factors: (i) the nature, quality and extent of the Manager’s services, (ii) the investment performance of the Fund and the Manager, (iii) the fees and expenses of the Fund, including comparative expense information, (iv) the profitability of the Manager and its affiliates, including an analysis of the cost of providing services, (v) whether economies of scale are realized as the Fund grows and whether fee levels reflect these economies of scale for Fund investors and (vi) other benefits to the Manager from its relationship with the Fund. The Board was aware that there are alternatives to retaining the Manager.
Outlined below is a summary of the principal information considered by the Board as well as the Board’s conclusions.
Nature, Quality and Extent of Services. The Board considered information about the nature, quality and extent of the services provided to the Fund and information regarding the Manager’s key personnel who provide such services. The Manager’s duties include providing the Fund with the services of the portfolio managers and the Manager’s investment team, who provide research, analysis and other advisory services in regard to the Fund’s investments; securities trading services; oversight of third-party service providers; monitoring compliance with applicable Fund policies and procedures and adherence to the Fund’s investment restrictions; and risk management. The Manager is responsible for providing certain administrative services to the Fund as well. Those services include providing and supervising all administrative and clerical personnel who are necessary in order to provide effective corporate administration for the Fund; compiling and maintaining records with respect to the Fund’s operations; preparing and filing reports required by the Securities and Exchange Commission; preparing periodic reports regarding the operations of the Fund for its shareholders; preparing proxy materials for shareholder meetings; and preparing the registration statements required by Federal and state securities laws for the sale of the Fund’s shares. The Manager also provides the Fund with office space, facilities and equipment.
The Board also considered the quality of the services provided and the quality of the Manager’s resources that are available to the Fund. The Board took account of the fact that the Manager has had over fifty years of experience as an investment adviser and that its assets under management rank it among the top mutual fund managers in the United States. The Board evaluated the Manager’s advisory, administrative, accounting, legal, compliance services and risk management, and information the Board has received regarding the experience and professional qualifications of the Manager’s key personnel and the size and functions of its staff. In its evaluation of the quality of the portfolio management services provided, the Board considered the experience of Matthew Ziehl, Raymond Anello, and Raman Vardharaj, the portfolio managers for the Fund, and the Manager’s investment team and analysts. The Board members also considered the totality of their experiences with the Manager as directors or trustees of the Fund and other funds advised by the Manager. The Board considered information regarding the quality of services provided by affiliates of the Manager, which its members have become knowledgeable about in connection with the renewal of the Fund’s service agreements. The Board concluded, in light of the Manager’s experience, reputation, personnel, operations and resources that the Fund benefits from the services provided under the Agreement.
Investment Performance of the Manager and the Fund. Throughout the year, the Manager provided information on the investment performance of the Fund, including comparative performance information. The Board also reviewed information, prepared by the Manager and by the independent consultant, comparing the Fund’s historical performance to relevant market indices and to the performance of other small-cap core funds underlying variable insurance products. The Board noted that the Fund outperformed its performance universe median for the one-, three-, five- and ten-year periods.
Costs of Services by the Manager. The Board reviewed the fees paid to the Manager and the other expenses borne by the Fund. The Board also considered the comparability of the fees charged and the services provided to the Fund to the fees and services for other clients or accounts advised by the Manager. The independent consultant provided comparative data in regard to the fees and expenses of the Fund and other small-cap core funds underlying variable insurance products. In reviewing the fees and expenses charged to the VA funds, the Board considered the Manager’s assertion that, because there is much greater disparity in the fees and services that may be provided by a manager to a VA fund as opposed to a retail fund, when comparing the expenses of the various VA funds to those of retail funds, it is most appropriate to focus on total expenses (rather than on the management fees). Accordingly, while the Board reviewed and considered all expenses, it focused on total expenses. The Board considered that the Fund’s actual management fees and total expenses were lower than its expense group median and average. The Board also considered that the Manager has voluntarily agreed to waive fees and/or reimburse the Fund for certain expenses in order to limit total annual fund operating expenses after any fee waiver and/or expense reimbursement (excluding (i) interest, taxes, dividends tied to short sales, brokerage commissions, and other expenditures which are capitalized in accordance with generally accepted accounting principles; (ii) expenses incurred directly or indirectly by the Fund as a result of investments in other investment companies, wholly-owned subsidiaries and pooled investment vehicles; (iii) certain other expenses attributable to, and incurred as a result of, a Fund’s investments; and (iv) other extraordinary expenses (including litigation expenses) not incurred in the ordinary course of the Fund’s business) to annual rates of 0.80% for Non-Service shares and 1.05% for Service shares. This voluntary expense limitation may not be amended or withdrawn until one year after the date of the Fund’s prospectus.
Economies of Scale and Profits Realized by the Manager. The Board considered information regarding the Manager’s costs in serving as the Fund’s investment adviser, including the costs associated with the personnel and systems necessary to manage the Fund, and information regarding the Manager’s profitability from its relationship with the Fund. The Board reviewed whether the Manager may realize economies of scale in managing and supporting the Fund. The Board noted that the Fund currently has management fee breakpoints, which are intended to share with Fund shareholders economies of scale that may exist as the Fund’s assets grow.
Other Benefits to the Manager. In addition to considering the profits realized by the Manager, the Board considered information that was provided regarding the direct and indirect benefits the Manager receives as a result of its relationship with the Fund, including compensation paid to the
| | | | |
| 23 | | | | OPPENHEIMER MAIN STREET SMALL- & MID-CAP FUND/VA |
BOARD APPROVAL OF THE FUND’S INVESTMENT
ADVISORY AGREEMENT Unaudited/Continued
Manager’s affiliates and research provided to the Manager in connection with permissible brokerage arrangements (soft dollar arrangements). The Board also considered that the Manager must be able to pay and retain experienced professional personnel at competitive rates to provide quality services to the Fund.
Conclusions. These factors were also considered by the independent Trustees meeting separately from the full Board, assisted by experienced counsel to the Fund and to the independent Trustees. Fund counsel and the independent Trustees’ counsel are independent of the Manager within the meaning and intent of the Securities and Exchange Commission Rules.
Based on its review of the information it received and its evaluations described above, the Board, including a majority of the independent Trustees, decided to continue the Agreement. In addition, the Board, including a majority of the Independent Trustees, approved the restructuring of the Fund’s investment advisory arrangement so that effective January 1, 2013, (i) OFI Global Asset Management, Inc. (“OFI Global”), a wholly owned subsidiary of the Manager, will serve as the investment adviser to the Fund in place of the Manager under a Restated Advisory Agreement (“Restated Advisory Agreement”), and (ii) OFI Global will enter into a Sub-Advisory Agreement (“Sub-Advisory Agreement”) with the Manager to provide investment sub-advisory services to the Fund. OFI Global will pay the Manager a percentage of the net investment advisory fee (after all applicable waivers have been deducted) that it receives from the Fund. The Agreement will continue until earlier of August 31, 2013 or the effective date of the Restated Advisory Agreement between the Fund and OFI Global. The Restated Advisory Agreement and Sub-Advisory Agreement will continue until August 31, 2013.
In arriving at its decisions, the Board did not single out any factor or factors as being more important than others, but considered all of the above information, and considered the terms and conditions of the Agreement, Restated Advisory Agreement and Sub-Advisory Agreement, including the management fees, in light of all the surrounding circumstances.
| | | | |
| 24 | | | | OPPENHEIMER MAIN STREET SMALL- & MID-CAP FUND/VA |
PORTFOLIO PROXY VOTING POLICIES AND PROCEDURES;
UPDATES TO THE STATEMENTS OF INVESTMENTS Unaudited/
The Fund has adopted Portfolio Proxy Voting Policies and Procedures under which the Fund votes proxies relating to securities (“portfolio proxies”) held by the Fund. A description of the Fund’s Portfolio Proxy Voting Policies and Procedures is available (i) without charge, upon request, by calling the Fund toll-free at 1.800.525.7048, (ii) on the Fund’s website at oppenheimerfunds.com, and (iii) on the SEC’s website at www.sec.gov. In addition, the Fund is required to file Form N-PX, with its complete proxy voting record for the 12 months ended June 30th, no later than August 31st of each year. The Fund’s voting record is available (i) without charge, upon request, by calling the Fund toll-free at 1.800.525.7048, and (ii) in the Form N-PX filing on the SEC’s website at www.sec.gov.
The Fund files its complete schedule of portfolio holdings with the SEC for the first quarter and the third quarter of each fiscal year on Form N-Q. The Fund’s Form N-Q filings are available on the SEC’s website at www.sec.gov. Those forms may be reviewed and copied at the SEC’s Public Reference Room in Washington, D.C. Information on the operation of the Public Reference Room may be obtained by calling 1-800-SEC-0330.
| | | | |
| 25 | | | | OPPENHEIMER MAIN STREET SMALL- & MID-CAP FUND/VA |
TRUSTEES AND OFFICERS BIOS Unaudited
| | |
| Name, Position(s) Held with the Fund, Length of Service, Age | | Principal Occupation(s) During the Past 5 Years; Other Trusteeships/Directorships Held; Number of Portfolios in the Fund Complex Currently Overseen |
| |
INDEPENDENT
TRUSTEES | | The address of each Trustee in the chart below is 6803 S. Tucson Way, Centennial, Colorado 80112-3924. Each Trustee serves for an indefinite term, or until his or her resignation, retirement, death or removal |
| |
Sam Freedman, Chairman of the Board of Trustees (since 2012) and Trustee (since 1996) Age: 72 | | Director of Colorado UpLIFT (charitable organization) (since September 1984). Mr. Freedman held several positions with the Sub-Adviser and with subsidiary or affiliated companies of the Sub-Adviser (until October 1994). Oversees 36 portfolios in the OppenheimerFunds complex. Mr. Freedman has served on the Boards of certain Oppenheimer funds since 1996, during which time he has become familiar with the Fund’s (and other Oppenheimer funds’) financial, accounting, regulatory and investment matters and has contributed to the Boards’ deliberations. |
| |
Edward L. Cameron, Trustee (since 1999) Age: 74 | | Member of The Life Guard of Mount Vernon (George Washington historical site) (June 2000 – June 2006); Partner of PricewaterhouseCoopers LLP (accounting firm) (July 1974-June 1999); Chairman of Price Waterhouse LLP Global Investment Management Industry Services Group (accounting firm) (July 1994-June 1998). Oversees 36 portfolios in the OppenheimerFunds complex. Mr. Cameron has served on the Boards of certain Oppenheimer funds since 1999, during which time he has become familiar with the Fund’s (and other Oppenheimer funds’) financial, accounting, regulatory and investment matters and has contributed to the Boards’ deliberations. |
| |
Jon S. Fossel, Trustee (since 1995) Age: 70 | | Chairman of the Board (2006-December 2011) and Director (June 2002-December 2011) of UNUMProvident (insurance company); Director of Northwestern Energy Corp. (public utility corporation) (November 2004-December 2009); Director of P.R. Pharmaceuticals (October 1999-October 2003); Director of Rocky Mountain Elk Foundation (non-profit organization) (February 1998-February 2003 and February 2005-February 2007); Chairman and Director (until October 1996) and President and Chief Executive Officer (until October 1995) of the Sub-Adviser; President, Chief Executive Officer and Director of the following: Oppenheimer Acquisition Corp. (“OAC”) (parent holding company of the Sub-Adviser), Shareholders Services, Inc. and Shareholder Financial Services, Inc. (until October 1995). Oversees 36 portfolios in the OppenheimerFunds complex. Mr. Fossel has served on the Boards of certain Oppenheimer funds since 1990, during which time he has become familiar with the Fund’s (and other Oppenheimer funds’) financial, accounting, regulatory and investment matters and has contributed to the Boards’ deliberations. |
| |
Richard F. Grabish, Trustee (since 2012) Age: 64 | | Formerly Senior Vice President and Assistant Director of Sales and Marketing (March 1997-December 2007), Director (March 1987-December 2007) and Manager of Private Client Services (June 1985-June 2005) of A.G. Edwards & Sons, Inc. (broker/dealer and investment firm); Chairman and Chief Executive Officer of A.G. Edwards Trust Company, FSB (March 2001-December 2007); President and Vice Chairman of A.G. Edwards Trust Company, FSB (investment adviser) (April 1987-March 2001); President of A.G. Edwards Trust Company, FSB (investment adviser) (June 2005-December 2007). Oversees 36 portfolios in the OppenheimerFunds complex. Mr. Grabish has served on the Boards of certain Oppenheimer funds since 2001, during which time he has become familiar with the Fund’s (and other Oppenheimer funds’) financial, accounting, regulatory and investment matters and has contributed to the Boards’ deliberations. |
| |
Beverly L. Hamilton, Trustee (since 2002) Age: 66 | | Trustee of Monterey Institute for International Studies (educational organization) (since February 2000); Board Member of Middlebury College (educational organization) (December 2005-June 2011); Chairman (since 2010) of American Funds’ Emerging Markets Growth Fund, Inc. (mutual fund); Director of The California Endowment (philanthropic organization) (April 2002-April 2008); Director (February 2002-2005) and Chairman of Trustees (2006-2007) of the Community Hospital of Monterey Peninsula; Director (October 1991-2005); Vice Chairman (2006-2009) of American Funds’ Emerging Markets Growth Fund, Inc. (mutual fund); President of ARCO Investment Management Company (February 1991-April 2000); Member of the investment committees of The Rockefeller Foundation (2001-2006) and The University of Michigan (since 2000); Advisor at Credit Suisse First Boston’s Sprout venture capital unit (venture capital fund) (1994-January 2005); Trustee of MassMutual Institutional Funds (investment company) (1996-June 2004); Trustee of MML Series Investment Fund (investment company) (April 1989-June 2004); Member of the investment committee of Hartford Hospital (2000-2003); and Advisor to Unilever (Holland) pension fund (2000-2003). Oversees 36 portfolios in the OppenheimerFunds complex. Ms. Hamilton has served on the Boards of certain Oppenheimer funds since 2002, during which time she has become familiar with the Fund’s (and other Oppenheimer funds’) financial, accounting, regulatory and investment matters and has contributed to the Boards’ deliberations. |
| |
Victoria J. Herget, Trustee (since 2012) Age: 61 | | Independent Director of the First American Funds (mutual fund family) (2003-2011); former Managing Director (1993-2001), Principal (1985-1993), Vice President (1978-1985) and Assistant Vice President (1973-1978) of Zurich Scudder Investments (and its predecessor firms); Board Chair (2008-Present) and Director (2004-Present), United Educators (insurance company); Trustee (1992-2007), Chair of the Board of Trustees (1999-2007), Investment Committee Chair (1994-1999) and Investment Committee member (2007-2010) of Wellesley College; Trustee (since 2000) and Chair (since 2010), Newberry Library; Trustee, Mather LifeWays (since 2001); Trustee, BoardSource (2006-2009) and Chicago City Day School (1994-2005). Oversees 36 portfolios in the OppenheimerFunds complex. Ms. Herget has served on the Boards of certain Oppenheimer funds since 2012, during which time she has become familiar with the Fund’s (and other Oppenheimer funds’) financial, accounting, regulatory and investment matters and has contributed to the Boards’ deliberations. |
| |
Robert J. Malone, Trustee (since 2002) Age: 68 | | Board of Directors of Opera Colorado Foundation (non-profit organization) (since March 2008); Director of Jones Knowledge, Inc. (2006-2010); Director of Jones International University (educational organization) (since August 2005); Chairman, Chief Executive Officer and Director of Steele Street Bank & Trust (commercial banking) (since August 2003); Director of Colorado UpLIFT (charitable organization) (1986-2010); Trustee of the Gallagher Family Foundation (non-profit organization) (since 2000); Former Chairman of U.S. Bank-Colorado (subsidiary of U.S. Bancorp and formerly Colorado National Bank) (July 1996-April 1999); Director of Commercial Assets, Inc. (real estate investment trust) (1993-2000); Director of Jones Knowledge, Inc. (2001-July 2004); Director of U.S. Exploration, Inc. (oil and gas exploration) (1997-February 2004); Chairman of the Board (1991-1994) and Trustee (1985-1994) of Regis University; and Chairman of the Board (1990-1991) and Trustee (1984-1999) of Young Presidents Organization. Oversees 36 portfolios in the OppenheimerFunds complex. Mr. Malone has served on the Boards of certain Oppenheimer funds since 2002, during which time he has become familiar with the Fund’s (and other Oppenheimer funds’) financial, accounting, regulatory and investment matters and has contributed to the Boards’ deliberations. |
| |
F. William Marshall, Jr., Trustee (since 2000) Age: 70 | | Trustee Emeritus of Worcester Polytech Institute (WPI) (private university) (since 2009); Trustee of MassMutual Select Funds (formerly MassMutual Institutional Funds) (investment company) (since 1996) and MML Series Investment Fund (investment company) (since 1996) and Mass Mutual Premier Funds (investment company) (since January 2012); President and Treasurer of the SIS Funds (private charitable fund) (January 1999 – March 2011); Former Trustee of WPI (1985-2008); Former Chairman of the Board (2004-2006) and Former Chairman of the Investment Committee of WPI (1994-2008); Chairman of SIS & Family Bank, F.S.B. (formerly SIS Bank) (commercial bank) (January 1999-July 1999); Executive Vice President of Peoples Heritage Financial Group, Inc. (commercial bank) (January 1999-July 1999); and Former President and Chief Executive Officer of SIS Bancorp. (1993-1999). Oversees 40 portfolios in the OppenheimerFunds complex. Mr. Marshall has served on the Boards of certain Oppenheimer funds since 2000, during which time he has become familiar with the Fund’s (and other Oppenheimer funds’) financial, accounting, regulatory and investment matters and has contributed to the Boards’ deliberations. |
| | | | |
| 26 | | | | OPPENHEIMER MAIN STREET SMALL- & MID-CAP FUND/VA |
| | |
| |
Karen L. Stuckey, Trustee (since 2012) Age: 59 | | Partner (1990-2012) of PricewaterhouseCoopers LLP (held various positions 1975-1990); Trustee (1992-2006) and member of Executive, Nominating and Audit Committees and Chair of Finance Committee of Lehigh University; and member, Women’s Investment Management Forum since inception. Oversees 36 portfolios in the OppenheimerFunds complex. Ms. Stuckey has served on the Boards of certain Oppenheimer funds since 2012, during which time she has become familiar with the Fund’s (and other Oppenheimer funds’) financial, accounting, regulatory and investment matters and has contributed to the Boards’ deliberations. |
| |
James D. Vaughn, Trustee (since 2012) Age: 67 | | Retired; former managing partner (1994-2001) of Denver office of Deloitte & Touche LLP, (held various positions 1969-1993); Trustee and Chairman of the Audit Committee of Schroder Funds (2003-2012); Board member and Chairman of Audit Committee of AMG National Trust Bank (since 2005); Trustee, Audit Committee member and Investment Committee member, University of South Dakota Foundation (since 1996); Board member, Executive Committee Member, Audit Committee Member and past Board Chair, Junior Achievement (since 1993); former Board member, Mile High United Way, Boys and Girls Clubs, Boy Scouts, Colorado Business Committee for the Arts, Economic Club of Colorado and Metro Denver Network. Oversees 36 portfolios in the OppenheimerFunds complex. Mr. Vaughn has served on the Boards of certain Oppenheimer funds since 2012, during which time he has become familiar with the Fund’s (and other Oppenheimer funds’) financial, accounting, regulatory and investment matters and has contributed to the Boards’ deliberations. |
| INTERESTED TRUSTEE AND OFFICER | | The address of Mr. Glavin is Two World Financial Center, 225 Liberty Street, 11th Floor, New York, New York 10281-1008. Mr. Glavin serves as a Trustee for an indefinite term, or until his resignation, retirement, death or removal and as an Officer for an indefinite term, or until his resignation, retirement, death or removal. Mr. Glavin is an Interested Trustee due to his positions with OppenheimerFunds, Inc. and its affiliates. |
| |
William F. Glavin, Jr., Trustee, President and Principal Executive Officer (since 2009) Age: 54 | | Chief Executive Officer of OppenheimerFunds (since January 2013); Director, Chief Executive Officer and President of the Manager (since January 2013); Chairman of the Sub-Adviser (December 2009-December 2012); Chief Executive Officer (January 2009-December 2012) and Director of the Sub-Adviser (since January 2009); President of the Sub-Adviser (May 2009-December 2012); Management Director (since June 2009), President (since December 2009) and Chief Executive Officer (since January 2011) of Oppenheimer Acquisition Corp. (“OAC”) (the Sub-Adviser’s parent holding company); Director of Oppenheimer Real Asset Management, Inc. (since March 2010); Executive Vice President (March 2006-February 2009) and Chief Operating Officer (July 2007-February 2009) of Massachusetts Mutual Life Insurance Company (OAC’s parent company); Director (May 2004-March 2006) and Chief Operating Officer and Chief Compliance Officer (May 2004-January 2005), President (January 2005-March 2006) and Chief Executive Officer (June 2005-March 2006) of Babson Capital Management LLC; Director (March 2005-March 2006), President (May 2003-March 2006) and Chief Compliance Officer (July 2005-March 2006) of Babson Capital Securities, Inc. (a broker-dealer); President (May 2003-March 2006) of Babson Investment Company, Inc.; Director (May 2004-August 2006) of Babson Capital Europe Limited; Director (May 2004-October 2006) of Babson Capital Guernsey Limited; Director (May 2004-March 2006) of Babson Capital Management LLC; Non-Executive Director (March 2005-March 2007) of Baring Asset Management Limited; Director (February 2005-June 2006) Baring Pension Trustees Limited; Director and Treasurer (December 2003-November 2006) of Charter Oak Capital Management, Inc.; Director (May 2006-September 2006) of C.M. Benefit Insurance Company; Director (May 2008-June 2009) and Executive Vice President (June 2007-July 2009) of C.M. Life Insurance Company; President (March 2006-May 2007) of MassMutual Assignment Company; Director (January 2005-December 2006), Deputy Chairman (March 2005-December 2006) and President (February 2005-March 2005) of MassMutual Holdings (Bermuda) Limited; Director (May 2008-June 2009) and Executive Vice President (June 2007-July 2009) of MML Bay State Life Insurance Company; Chief Executive Officer and President (April 2007-January 2009) of MML Distributors, LLC; and Chairman (March 2006-December 2008) and Chief Executive Officer (May 2007-December 2008) of MML Investors Services, Inc. An officer of 86 portfolios in the OppenheimerFunds complex. |
| OTHER OFFICERS OF THE FUND | | The addresses of the Officers in the chart below are as follows: for Messrs. Ziehl, Vardharaj, Anello, Gabinet and Ms. Nasta, Two World Financial Center, 225 Liberty Street, New York, New York 10281-1008, for Messrs. Vandehey and Wixted, 6803 S. Tucson Way, Centennial, Colorado 80112-3924. Each Officer serves for an indefinite or until his or her resignation, retirement, death or removal. |
| |
Matthew P. Ziehl, Vice President (since 2009) Age: 45 | | Vice President of the Sub-Adviser (since May 2009). Prior to joining the Sub-Adviser, a portfolio manager with RS Investment Management Co. LLC (October 2006-May 2009); a managing director at The Guardian Life Insurance Company of America (December 2001-October 2006) when Guardian Life Insurance acquired an interest in RS Investment Management Co. LLC; a team leader and co-portfolio manager with Salomon Brothers Asset Management, Inc. for small growth portfolios (January 2001-December 2001). A portfolio manager and officer of 2 portfolios in the OppenheimerFunds complex. |
| |
Raman Vardharaj, Vice President (since 2009) Age: 41 | | Vice President of the Sub-Adviser (since May 2009). Prior to joining the Sub-Adviser, a sector manager and a senior quantitative analyst creating stock selection models, monitoring portfolio risks and analyzing portfolio performance across the RS Core Equity Team of RS Investment Management Co. LLC (October 2006-May 2009); a quantitative analyst at The Guardian Life Insurance Company of America (1998-October 2006) when Guardian Life Insurance acquired an interest in RS Investment Management Co. LLC. A portfolio manager and officer of 2 portfolios in the OppenheimerFunds complex. |
| |
Raymond Anello, Vice President (since 2011) Age: 48 | | Vice President of the Sub-Adviser and sector manager for energy and utilities for the Sub-Adviser’s Main Street Investment Team (since May 2009). Prior to joining the Sub-Adviser, a portfolio manager of the RS All Cap Dividend product (July 2007-April 2009) and a sector manager for energy and utilities for various other RS Investments products; joined Guardian Life Insurance Company in October 1999 and transitioned to RS Investments in October 2006 in connection with Guardian Life Insurance Company’s acquisition of an interest in RS Investments. A portfolio manager and officer of 2 portfolios in the OppenheimerFunds complex. |
| |
Arthur S. Gabinet, Secretary and Chief Legal Officer (since 2011) Age: 54 | | General Counsel of OppenheimerFunds (since January 2013); Executive Vice President, Secretary and General Counsel of the Manager (since January 2013); General Counsel OFI SteelPath, Inc. (since January 2013); Executive Vice President (May 2010-December 2012) and General Counsel (since January 2011) of the Sub-Adviser; General Counsel of the Distributor (since January 2011); General Counsel of Centennial Asset Management Corporation (January 2011-December 2012); Executive Vice President (January 2011-December 2012) and General Counsel of HarbourView Asset Management Corporation (since January 2011); Assistant Secretary (since January 2011) and Director (since January 2011) of OppenheimerFunds International Ltd. and OppenheimerFunds plc; Director of Oppenheimer Real Asset Management, Inc. (January 2011-December 2012) and General Counsel (since January 2011); Executive Vice President (January 2011-December 2011) and General Counsel of Shareholder Financial Services, Inc. and Shareholder Services, Inc. (since January 2011); Executive Vice President (January 2011-December 2012) and General Counsel of OFI Private Investments Inc. (since January 2011); Vice President of OppenheimerFunds Legacy Program (January 2011-December 2011); Executive Vice President (January 2011-December 2012) and General Counsel of OFI Institutional Asset Management, Inc. (since January 2011); General Counsel, Asset Management of the Sub-Adviser (May 2010-December 2010); Principal, The Vanguard Group (November 2005-April 2010); District Administrator, U.S. Securities and Exchange Commission (January 2003-October 2005). An officer of 86 portfolios in the OppenheimerFunds complex. |
| |
Christina M. Nasta, Vice President and Chief Business Officer (since 2011) Age: 39 | | Senior Vice President of OppenheimerFunds Distributor, Inc. (since January 2013); Senior Vice President of the Sub-Adviser (July 2010-December 2012); Vice President of the Sub-Adviser (January 2003-July 2010); Vice President of OppenheimerFunds Distributor, Inc. (January 2003-July 2010). An officer of 86 portfolios in the OppenheimerFunds complex. |
| | | | |
| 27 | | | | OPPENHEIMER MAIN STREET SMALL- & MID-CAP FUND/VA |
TRUSTEES AND OFFICERS BIOS Unaudited / Continued
| | |
Mark S. Vandehey, Vice President and Chief Compliance Officer (since 2004) Age: 62 | | Chief Compliance Officer of OppenheimerFunds (since January 2013); Senior Vice President and Chief Compliance Officer of the Manager (since January 2013); Chief Compliance Officer of OFI SteelPath, Inc. (since January 2013); Senior Vice President of the Sub-Adviser (March 2004-December 2012); Chief Compliance Officer of the Sub-Adviser, OppenheimerFunds Distributor, Inc., OFI Trust Company, OFI Institutional Asset Management, Inc., Oppenheimer Real Asset Management, Inc., OFI Private Investments, Inc., Harborview Asset Management Corporation, Trinity Investment Management Corporation, and Shareholder Services, Inc. (since March 2004); Vice President of OppenheimerFunds Distributor, Inc., Centennial Asset Management Corporation and Shareholder Services, Inc. (June 1983-December 2012). An officer of 86 portfolios in the OppenheimerFunds complex. |
| |
Brian W. Wixted, Treasurer and Principal Financial & Accounting Officer (since 1999) Age: 53 | | Senior Vice President of the Manager (since January 2013); Treasurer of the Sub-Adviser, HarbourView Asset Management Corporation, Shareholder Financial Services, Inc., Shareholder Services, Inc., and Oppenheimer Real Asset Management, Inc. (March 1999-June 2008), OFI Private Investments, Inc. (March 2000-June 2008), OppenheimerFunds International Ltd. and OppenheimerFunds plc (since May 2000), OFI Institutional Asset Management, Inc. (November 2000-June 2008), and OppenheimerFunds Legacy Program (charitable trust program established by the Sub-Adviser) (June 2003-December 2011); Treasurer and Chief Financial Officer of OFI Trust Company (since May 2000); Assistant Treasurer of Oppenheimer Acquisition Corporation (March 1999-June 2008). An officer of 86 portfolios in the OppenheimerFunds complex. |
The Fund’s Statement of Additional Information contains additional information about the Fund’s Trustees and Officers and is available without charge, upon request, by calling 1.800.988.8287.
| | | | |
| 28 | | | | OPPENHEIMER MAIN STREET SMALL- & MID-CAP FUND/VA |
THIS PAGE INTENTIONALLY LEFT BLANK.
| | | | |
| 29 | | | | OPPENHEIMER MAIN STREET SMALL- & MID-CAP FUND/VA |
THIS PAGE INTENTIONALLY LEFT BLANK.
| | | | |
| 30 | | | | OPPENHEIMER MAIN STREET SMALL- & MID-CAP FUND/VA |
THIS PAGE INTENTIONALLY LEFT BLANK.
| | | | |
| 31 | | | | OPPENHEIMER MAIN STREET SMALL- & MID-CAP FUND/VA |
OPPENHEIMER MAIN STREET SMALL- & MID-CAP FUND®/VA
| | |
| A Series of Oppenheimer Variable Account Funds |
| Manager | | OFI Global Asset Management, Inc. |
| Sub-Adviser | | OppenheimerFunds, Inc. |
| Distributor | | OppenheimerFunds Distributor, Inc. |
| Transfer and Shareholder Servicing Agent | | OFI Global Asset Management, Inc. |
| Sub-Transfer Agent | | Shareholder Services, Inc. DBA OppenheimerFunds Services |
| Independent Registered Public Accounting Firm | | KPMG LLP |
| Counsel | | K&L Gates LLP |
Before investing, investors should carefully consider a fund’s investment objectives, risks, charges and expenses. Fund prospectuses and summary prospectuses contain this and other information about the funds, and may be obtained by asking your financial advisor, or calling us at 1.800.988.8287. Read prospectuses and summary prospectuses carefully before investing.
| | |
| ©2013 OppenheimerFunds, Inc. All rights reserved. | |
|
December 31, 2012
| | | | |
| | | |
| | | Oppenheimer Money Fund/VA A Series of Oppenheimer Variable Account Funds | | Annual Report |
ANNUAL REPORT
Investment Strategy Discussion
Financial Statements
OPPENHEIMER MONEY FUND/VA
Portfolio Managers: Carol Wolf and
Christopher Proctor, CFA
| | | | | | |
Current Yield
For the 7-Day Period Ended 12/31/12 | | |
| With Compounding | | 0.01% | | | | |
| Without Compounding | | 0.01 | | | | |
| For the 12-Month Period Ended 12/31/12 |
| With Compounding | | 0.01% | | | | |
| Without Compounding | | 0.01 | | | | |
The performance data quoted represents past performance, which does not guarantee future results. Yields include dividends in a hypothetical investment for the periods shown. Current performance may be lower or higher than the performance quoted. For performance data current to the most recent month end, call us at 1.800.988.8287. The yields take into account voluntary fee waivers and/or expense reimbursements, without which yields would have been lower. Some of these undertakings may be modified at any time, as indicated in the prospectus. There is no guarantee that the Fund will maintain a positive yield. The Fund’s performance should not be expected to be the same as the returns of other funds, whether or not both funds have the same portfolio managers and/or similar names. The Fund’s performance does not include the charges associated with the separate account products that offer this Fund. Such performance would have been lower if such charges were taken into account.
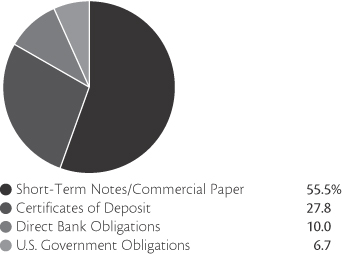
Portfolio holdings and allocations are subject to change. Percentages are as of December 31, 2012, and are based on the total market value of investments.
| | | | |
| 2 | | | | OPPENHEIMER MONEY FUND/VA |
FUND PERFORMANCE DISCUSSION
As they have for the past several years, short-term interest rates and money market yields remained near historical lows over the reporting period. Nonetheless, the Fund continued to produce competitive and consistent levels of current income while maintaining liquidity and a stable net asset value.
Economic and Market Overview
The Federal Reserve’s (the “Fed’s”) target for short-term interest rates remained in a range between 0% and 0.25%, which effectively anchored yields of short-term debt instruments near historical lows. In addition, the Fed announced additional measures during the reporting period as part of an aggressively accommodative monetary policy designed to stimulate greater economic growth. In June, the Fed extended Operation Twist, a program involving massive purchases of longer term bonds and sales of short-term debt obligations, through the end of 2012. In September, the Fed launched a third round of quantitative easing to buy U.S. government securities from financial institutions, in an attempt to spur lending to consumers and businesses. At the same time, the Fed stated its intention to maintain low short-term interest rates through mid-2015, an extension of its previous 2014 time frame. In addition to the measures taken by the Fed, the U.S. Congress enacted a last minute temporary resolution of the so-called fiscal cliff at the end of the period.
The Fed’s policies appeared to be gaining a degree of traction, as a variety of U.S. economic data showed improvement during the reporting period. The unemployment rate, which had remained stubbornly high in the wake of the 2008 financial crisis, fell from 8.3% at the start of the reporting period to 7.8% at the end. The rate of economic growth climbed from an annualized 1.3% rate in the second quarter of 2012 to 3.1% in the third quarter. Although U.S. GDP contracted by an estimated 0.1% during the fourth quarter due to a sharp decline in federal government spending, other economic indicators continued to post gains, including personal consumption, durable goods purchases and housing market activity.
Economic conditions in the rest of the world also seemed to be on the mend. While Europe continued to struggle with its sovereign debt crisis, analysts were encouraged when the head of the European Central Bank publicly stated its intent to support the euro as the European Union’s common currency. Concerns regarding an economic slowdown in the emerging markets also eased, as many global economists expected new leadership of the Chinese government to adopt more stimulative fiscal policies that their predecessors.
Against this backdrop, U.S. interest rates fell across the board immediately after the Fed announced its third round of quantitative easing in September, effectively narrowing yield differences along the market’s maturity spectrum. Interest rates from overseas instruments also fell.
Portfolio Strategy
During the period, we emphasized liquidity and safety in the reporting period’s low interest rate environment. We continued to maintain a cautious approach to credit selection, favoring banks in the United States, Canada and Australia, while avoiding some of the European banks that we felt may be affected by the region’s financial crisis. We also found opportunities for incrementally higher yields from commercial paper issued by financially stable corporations, as well as asset-backed commercial paper.
In addition, we increased the Fund’s weighted average maturity toward the longer end of its range in an effort to capture higher yields from longer dated instruments and to prepare the Fund for pressures that typically affect the money markets at year end. Consequently, as of the end of the reporting period, the Fund’s weighted average maturity was modestly longer than industry averages.
Outlook
Although we have been encouraged by recently improved U.S. and global economic data, a number of headwinds and risks remain. In the United States, we remain concerned as of this writing about ongoing discussions regarding the U.S. debt ceiling and other fiscal matters. We also are carefully monitoring U.S. regulatory actions that have the potential to affect money market funds. Overseas, Europe remains in fragile financial condition, and we expect to continue to avoid troubled members of the region’s banking system.
| | | | |
| 3 | | | | OPPENHEIMER MONEY FUND/VA |
FUND PERFORMANCE DISCUSSION
An investment in the Fund is not insured or guaranteed by the Federal Deposit Insurance Corporation or any other government agency. Although the Fund seeks to preserve the value of your investment at $1.00 per share, it is possible to lose money by investing in the Fund.
Investors should consider the Fund’s investment objective, risks, charges and expenses carefully before investing. The Fund’s prospectus and summary prospectus contain this and other information about the Fund, and may be obtained by asking your financial advisor or calling us at 1.800.988.8287. Read prospectuses and summary prospectuses carefully before investing.
Shares of Oppenheimer funds are not deposits or obligations of any bank, are not guaranteed by any bank, are not insured by the FDIC or any other agency, and involve investment risks, including the possible loss of the principal amount invested.
| | | | |
| 4 | | | | OPPENHEIMER MONEY FUND/VA |
FUND EXPENSES
Fund Expenses. As a shareholder of the Fund, you incur ongoing costs, including management fees; service fees; and other Fund expenses. These examples are intended to help you understand your ongoing costs (in dollars) of investing in the Fund and to compare these costs with the ongoing costs of investing in other mutual funds.
The examples are based on an investment of $1,000.00 invested at the beginning of the period and held for the entire 6-month period ended December 31, 2012.
Actual Expenses. The first section of the table provides information about actual account values and actual expenses. You may use the information in this section, together with the amount you invested, to estimate the expense that you paid over the period. Simply divide your account value by $1,000.00 (for example, an $8,600.00 account value divided by $1,000.00 = 8.60), then multiply the result by the number in the first section under the heading entitled “Expenses Paid During Period” to estimate the expenses you paid on your account during this period.
Hypothetical Example for Comparison Purposes. The second section of the table provides information about hypothetical account values and hypothetical expenses based on the Fund’s actual expense ratio, and an assumed rate of return of 5% per year before expenses, which is not the actual return. The hypothetical account values and expenses may not be used to estimate the actual ending account balance or expenses you paid for the period. You may use this information to compare the ongoing costs of investing in the Fund and other funds. To do so, compare this 5% hypothetical example with the 5% hypothetical examples that appear in the shareholder reports of the other funds.
Please note that the expenses shown in the table are meant to highlight your ongoing costs only and do not reflect any charges associated with the separate accounts that offer this Fund. Therefore, the “hypothetical” lines of the table are useful in comparing ongoing costs only, and will not help you determine the relative total costs of owning different funds. In addition, if these separate account charges were included your costs would have been higher.
| | | | | | | | | | | | |
| Actual | | Beginning Account Value July 1, 2012 | | | Ending Account Value December 31, 2012 | | | Expenses Paid During 6 Months Ended December 31, 2012 | |
| | | $ | 1,000.00 | | | $ | 1,000.10 | | | $ | 1.41 | |
| | | |
Hypothetical (5% return before expenses) | | | | | | | | | |
| | | | 1,000.00 | | | | 1,023.73 | | | | 1.43 | |
Expenses are equal to the Fund’s annualized expense ratio, multiplied by the average account value over the period, multiplied by 184/366 (to reflect the one-half year period). The annualized expense ratio based on the 6-month period ended December 31, 2012 is as follows:
The expense ratio reflects reduction to voluntary waivers and/or reimbursements of expenses by the Fund’s Manager. Some of these undertakings may be modified or terminated at any time, as indicated in the Fund’s prospectus. The “Financial Highlights” table in the Fund’s financial statements, included in this report, also show the gross expense ratio, without such waivers or reimbursements and reduction to custodian expenses, if applicable.
| | | | |
| 5 | | | | OPPENHEIMER MONEY FUND/VA |
STATEMENT OF INVESTMENTS December 31, 2012
| | | | | | | | | | | | | | | | |
| | | Maturity
Date* | | | Final Legal
Maturity Date** | | | Principal
Amount | | | Value | |
| Certificates of Deposit—26.5% | | | | | | | | | | | | | | | | |
| Domestic Certificates of Deposit—4.6% | | | | | | | | | | | | | | | | |
| JPMorgan Chase Bank NA, 0.22% | | | 3/18/13 | | | | 3/18/13 | | | $ | 8,061,000 | | | $ | 8,061,000 | |
| Yankee Certificates of Deposit—21.9% | | | | | | | | | | | | | | | | |
Bank of Montreal, Chicago:
0.08% | | | 1/4/13 | | | | 1/4/13 | | | | 6,000,000 | | | | 6,000,000 | |
| 0.22% | | | 2/8/13 | | | | 2/8/13 | | | | 2,000,000 | | | | 2,000,000 | |
Bank of Nova Scotia, Houston TX:
0.23% | | | 4/8/13 | | | | 4/8/13 | | | | 1,000,000 | | | | 1,000,000 | |
| 0.25% | | | 1/2/13 | | | | 5/24/13 | | | | 5,000,000 | | | | 5,000,000 | |
DnB Bank ASA NY:
0.23% | | | 3/14/13 | | | | 3/14/13 | | | | 1,000,000 | | | | 1,000,000 | |
| 0.24% | | | 2/7/13 | | | | 2/7/13 | | | | 2,000,000 | | | | 1,999,990 | |
| National Australia Bank, New York, 0.22% | | | 2/6/13 | | | | 2/6/13 | | | | 1,000,000 | | | | 1,000,000 | |
| Nordea Bank Finland plc, New York, 0.25% | | | 4/3/13 | | | | 4/3/13 | | | | 7,000,000 | | | | 7,000,000 | |
| Royal Bank of Canada, New York, 0.49%1 | | | 1/1/13 | | | | 6/7/13 | | | | 3,500,000 | | | | 3,500,000 | |
| Swedbank AB, New York, 0.20% | | | 2/11/13 | | | | 2/11/13 | | | | 3,450,000 | | | | 3,450,000 | |
Toronto Dominion Bank, New York:
0.24% | | | 3/19/13 | | | | 3/19/13 | | | | 2,300,000 | | | | 2,300,000 | |
| 0.24% | | | 3/27/13 | | | | 3/27/13 | | | | 2,500,000 | | | | 2,500,000 | |
| 0.24% | | | 4/18/13 | | | | 4/18/13 | | | | 1,500,000 | | |
| 1,500,000
|
|
| | | | | | | | | | | | | | |
| 38,249,990
|
|
| Total Certificates of Deposit (Cost $46,310,990) | | | | | | | | | | | | | | | 46,310,990 | |
| Direct Bank Obligations—9.6% | | | | | | | | | | | | | | | | |
| Bank of Nova Scotia, New York, 0.21% | | | 1/16/13 | | | | 1/16/13 | | | | 1,200,000 | | | | 1,199,898 | |
Commonwealth Bank of Australia:
0.23%2 | | | 1/8/13 | | | | 1/8/13 | | | | 4,400,000 | | | | 4,399,803 | |
| 0.23%2 | | | 1/30/13 | | | | 1/30/13 | | | | 2,000,000 | | | | 1,999,629 | |
| Nordea North America, Inc., 0.24% | | | 2/8/13 | | | | 2/8/13 | | | | 1,300,000 | | | | 1,299,678 | |
| Societe Generale North America, Inc., 0.16% | | | 1/2/13 | | | | 1/2/13 | | | | 3,700,000 | | | | 3,699,979 | |
| Svenska Handelsbanken, Inc., 0.24%2 | | | 2/5/13 | | | | 2/5/13 | | | | 3,100,000 | | | | 3,099,277 | |
| Swedbank AB, 0.21% | | | 1/22/13 | | | | 1/22/13 | | | | 1,000,000 | | |
| 999,878
|
|
| Total Direct Bank Obligations (Cost $16,698,142) | | | | | | | | | | | | | | | 16,698,142 | |
| Short-Term Notes/Commercial Paper—52.9% | | | | | | | | | | | | | | | | |
| Capital Markets—2.8% | | | | | | | | | | | | | | | | |
| BNP Paribas Finance, Inc., 0.67% | | | 4/2/13 | | | | 4/2/13 | | | | 5,000,000 | | | | 4,991,406 | |
| Diversified Financial Services—2.3% | | | | | | | | | | | | | | | | |
General Electric Capital Corp.:
0.32% | | | 1/22/13 | | | | 1/22/13 | | | | 3,000,000 | | | | 2,999,440 | |
| 0.32% | | | 2/11/13 | | | | 2/11/13 | | | | 1,000,000 | | |
| 999,636
|
|
| | | | | | | | | | | | | | | | 3,999,076 | |
| Leasing & Factoring—6.9% | | | | | | | | | | | | | | | | |
American Honda Finance Corp.:
0.33%1,3 | | | 3/12/13 | | | | 12/5/13 | | | | 1,000,000 | | | | 1,000,000 | |
| 0.34%1 | | | 2/8/13 | | | | 11/8/13 | | | | 1,500,000 | | | | 1,500,000 | |
| 0.39%1 | | | 2/2/13 | | | | 8/2/13 | | | | 1,500,000 | | | | 1,500,000 | |
| 2.38%3 | | | 3/18/13 | | | | 3/18/13 | | | | 2,000,000 | | | | 2,008,480 | |
Toyota Motor Credit Corp.:
0.31% | | | 7/17/13 | | | | 7/17/13 | | | | 3,300,000 | | | | 3,294,402 | |
| 0.63% | | | 2/6/13 | | | | 2/6/13 | | | | 2,700,000 | | |
| 2,698,299
|
|
| | | | | | | | | | | | | | | | 12,001,181 | |
| | | | |
| 6 | | | | OPPENHEIMER MONEY FUND/VA |
| | | | | | | | | | | | | | | | |
| | | Maturity
Date* | | | Final Legal
Maturity Date** | | | Principal
Amount | | | Value | |
| Municipal—8.9% | | | | | | | | | | | | | | | | |
| Carroll Cnty., KY Solid Waste Disposal Revenue Bonds, North American Stainless Project, Series 2006, 0.14%1 | | | 1/7/13 | | | | 1/7/13 | | | $ | 6,600,000 | | | $ | 6,600,000 | |
| NC Capital Facilities Finance Agency Revenue Bonds, Pfeiffer University, Series 2006, 0.14%1 | | | 1/7/13 | | | | 1/7/13 | | | | 6,390,000 | | | | 6,390,000 | |
| San Antonio, TX Industrial Development Authority Revenue Bonds, Tindall Corp. Project, 0.26%1 | | | 1/7/13 | | | | 1/7/13 | | | | 2,500,000 | | |
| 2,500,000
|
|
| | | | | | | | | | | | | | | | 15,490,000 | |
| Receivables Finance—18.1% | | | | | | | | | | | | | | | | |
| Alpine Securitization Corp., 0.20% | | | 1/3/13 | | | | 1/3/13 | | | | 4,100,000 | | | | 4,099,953 | |
Barton Capital Corp.:
0.20%2 | | | 1/3/13 | | | | 1/3/13 | | | | 1,000,000 | | | | 999,989 | |
| 0.34%2 | | | 3/4/13 | | | | 3/4/13 | | | | 4,500,000 | | | | 4,500,000 | |
| Chariot Funding LLC, 0.25%2 | | | 4/2/13 | | | | 4/2/13 | | | | 2,000,000 | | | | 1,998,736 | |
| Gemini Securitization Corp., 0.22%2 | | | 1/18/13 | | | | 1/18/13 | | | | 1,000,000 | | | | 999,896 | |
Gotham Funding Corp.:
0.21%2 | | | 1/22/13 | | | | 1/22/13 | | | | 400,000 | | | | 399,951 | |
| 0.22%2 | | | 1/17/13 | | | | 1/17/13 | | | | 3,700,000 | | | | 3,699,638 | |
Jupiter Securitization Co. LLC:
0.24%2 | | | 3/5/13 | | | | 3/5/13 | | | | 1,000,000 | | | | 999,580 | |
| 0.25%2 | | | 3/6/13 | | | | 3/6/13 | | | | 1,250,000 | | | | 1,249,444 | |
| Market Street Funding LLC, 0.19%2 | | | 1/22/13 | | | | 1/22/13 | | | | 1,600,000 | | | | 1,599,804 | |
| Mont Blanc Capital Corp., 0.20%2 | | | 1/3/13 | | | | 1/3/13 | | | | 3,000,000 | | | | 2,999,967 | |
Old Line Funding Corp.:
0.13%2 | | | 1/4/13 | | | | 1/4/13 | | | | 6,600,000 | | | | 6,599,929 | |
| 0.30%2 | | | 2/1/13 | | | | 2/1/13 | | | | 1,500,000 | | |
| 1,499,613
|
|
| | | | | | | | | | | | | | | | 31,646,500 | |
| Special Purpose Financial—13.9% | | | | | | | | | | | | | | | | |
Concord Minutemen Cap. Corp. LLC:
0.30% | | | 1/8/13 | | | | 1/8/13 | | | | 3,400,000 | | | | 3,399,802 | |
| 0.30% | | | 2/13/13 | | | | 2/13/13 | | | | 4,665,000 | | | | 4,663,328 | |
| FCAR Owner Trust I, 0.24% | | | 3/5/13 | | | | 3/5/13 | | | | 6,000,000 | | | | 5,997,480 | |
| FCAR Owner Trust II, 0.19% | | | 1/7/13 | | | | 1/7/13 | | | | 1,800,000 | | | | 1,799,943 | |
| Legacy Capital LLC, 0.30% | | | 2/4/13 | | | | 2/4/13 | | | | 1,900,000 | | | | 1,899,462 | |
| Lexington Parker Capital Co. LLC, 0.30%2 | | | 2/12/13 | | | | 2/12/13 | | | | 5,700,000 | | | | 5,698,005 | |
| Ridgefield Funding Co. LLC, 0.46% | | | 2/4/13 | | | | 2/4/13 | | | | 770,000 | | |
| 769,665
|
|
| | | | | | | | | | | | | | |
| 24,227,685
|
|
| Total Short-Term Notes/Commercial Paper (Cost $92,355,848) | | | | | | | | | | | | | | | 92,355,848 | |
| U.S. Government Obligations—6.4% | | | | | | | | | | | | | | | | |
U.S. Treasury Nts.:
0.38% | | | 6/30/13 | | | | 6/30/13 | | | | 2,000,000 | | | | 2,001,485 | |
| 0.50% | | | 10/15/13 | | | | 10/15/13 | | | | 2,500,000 | | | | 2,505,861 | |
| 0.75% | | | 9/15/13 | | | | 9/15/13 | | | | 1,000,000 | | | | 1,003,651 | |
| 1.00% | | | 7/15/13 | | | | 7/15/13 | | | | 1,000,000 | | | | 1,004,063 | |
| 1.00% | | | 1/15/14 | | | | 1/15/14 | | | | 1,500,000 | | | | 1,512,634 | |
| 1.75% | | | 1/31/14 | | | | 1/31/14 | | | | 1,000,000 | | | | 1,016,794 | |
| | | | |
| 7 | | | | OPPENHEIMER MONEY FUND/VA |
STATEMENT OF INVESTMENTS Continued
| | | | | | | | | | | | | | | | |
| | | Maturity
Date* | | | Final Legal
Maturity Date** | | | Principal
Amount | | | Value | |
| U.S. Government Obligations Continued | | | | | | | | | | | | | | | | |
U.S. Treasury Nts.: Continued
3.38% | | | 7/31/13 | | | | 7/31/13 | | | $ | 1,000,000 | | | $ | 1,018,244 | |
| 4.25% | | | 8/15/13 | | | | 8/15/13 | | | | 1,000,000 | | |
| 1,024,985
|
|
| Total U.S. Government Obligations (Cost $11,087,717) | | | | | | | | | | | | | | | 11,087,717 | |
Total Investments, at Value
(Cost $166,452,697) | | | | | | | | | | | 95.4 | % | | | 166,452,697 | |
| Other Assets Net of Liabilities | |
|
|
| | | | | |
| 4.6
|
| |
| 7,975,628
|
|
| Net Assets | |
|
|
| | | | | |
| 100.0
| %
| | $
| 174,428,325
|
|
Footnotes to Statement of Investments
Short-term notes and direct bank obligations are generally traded on a discount basis; the interest rate shown is the discount rate received by the Fund at the time of purchase. Other securities normally bear interest at the rates shown.
* The Maturity Date represents the date used to calculate the Fund’s weighted average maturity as determined under Rule 2a-7.
** If different from the Maturity Date, the Final Legal Maturity Date includes any maturity date extensions which may be affected at the option of the issuer or unconditional payments of principal by the issuer which may be affected at the option of the Fund, and represents the date used to calculate the Fund’s weighted average life as determined under Rule 2a-7.
1. Represents the current interest rate for a variable or increasing rate security.
2. Security issued in an exempt transaction without registration under the Securities Act of 1933. Such securities amount to $42,743,261 or 24.50% of the Fund’s net assets, and have been determined to be liquid pursuant to guidelines adopted by the Board of Trustees.
3. Represents securities sold under Rule 144A, which are exempt from registration under the Securities Act of 1933, as amended. These securities have been determined to be liquid under guidelines established by the Board of Trustees. These securities amount to $3,008,480 or 1.72% of the Fund’s net assets as of December 31, 2012.
See accompanying Notes to Financial Statements
| | | | |
| 8 | | | | OPPENHEIMER MONEY FUND/VA |
STATEMENT OF ASSETS AND LIABILITIES
| | | | |
| December 31, 2012 | | | |
| Assets | | | |
| Investments, at value (cost $166,452,697)—see accompanying statement of investments | | $ | 166,452,697 | |
| Cash | | | 5,919,257 | |
| Receivables and other assets: | | | | |
| Shares of beneficial interest sold | | | 2,043,120 | |
| Interest | | | 81,188 | |
| Other | |
| 15,926
|
|
| Total assets | | | 174,512,188 | |
| Liabilities | | | |
| Payables and other liabilities: | | | | |
| Legal, auditing and other professional fees | | | 24,544 | |
| Shares of beneficial interest redeemed | | | 15,799 | |
| Transfer and shareholder servicing agent fees | | | 14,375 | |
| Shareholder communications | | | 14,232 | |
| Trustees’ compensation | | | 11,767 | |
| Dividends | | | 375 | |
| Other | |
| 2,771
|
|
| Total liabilities | | | 83,863 | |
| Net Assets | | $
| 174,428,325
|
|
| Composition of Net Assets | | | |
| Par value of shares of beneficial interest | | $ | 174,420 | |
| Additional paid-in capital | | | 174,249,829 | |
| Accumulated net investment income | | | 4,076 | |
| Net Assets—applicable to 174,419,634 shares of beneficial interest outstanding | | $
| 174,428,325
|
|
| Net Asset Value, Redemption Price Per Share and Offering Price Per Share | | | $1.00 | |
See accompanying Notes to Financial Statements.
| | | | |
| 9 | | | | OPPENHEIMER MONEY FUND/VA |
STATEMENT OF OPERATIONS
| | | | |
| For the Year Ended December 31, 2012 | | | |
| Investment Income | | | |
| Interest | | $ | 508,796 | |
| Expenses | | | |
| Management fees | | | 739,124 | |
| Transfer and shareholder servicing agent fees | | | 164,247 | |
| Shareholder communications | | | 40,001 | |
| Trustees’ compensation | | | 21,957 | |
| Administration service fees | | | 1,500 | |
| Custodian fees and expenses | | | 1,202 | |
| Other | |
| 48,901
|
|
| Total expenses | | | 1,016,932 | |
| Less waivers and reimbursements of expenses | |
| (525,238
| )
|
| Net expenses | | | 491,694 | |
| Net Investment Income | | | 17,102 | |
| Net Realized Gain on Investments | | | 6,472 | |
| Net Increase in Net Assets Resulting from Operations | | $
| 23,574
|
|
See accompanying Notes to Financial Statements.
| | | | |
| 10 | | | | OPPENHEIMER MONEY FUND/VA |
STATEMENTS OF CHANGES IN NET ASSETS
| | | | | | | | |
| | | Year
Ended
December 31,
2012 | | | Year
Ended
December 30,
20111 | |
| Operations | | | | | | |
| Net investment income | | | $ 17,102 | | | $ | 16,277 | |
| Net realized gain | |
| 6,472
|
| |
| 2,219
|
|
| Net increase in net assets resulting from operations | | | 23,574 | | | | 18,496 | |
| Dividends and/or Distributions to Shareholders | | | | | | |
| Dividends from net investment income | | | (17,102 | ) | | | (16,277 | ) |
| Beneficial Interest Transactions | | | | | | |
| Net increase in net assets resulting from beneficial interest transactions | | | 10,448,459 | | | | 14,274,020 | |
| Net Assets | | | | | | |
| Total increase | | | 10,454,931 | | | | 14,276,239 | |
| Beginning of period | |
| 163,973,394
|
| |
| 149,697,155
|
|
| End of period (including accumulated net investment income of $4,076 and $2,303, respectively) | |
| $174,428,325
|
| | $
| 163,973,394
|
|
1. December 30, 2011 represents the last business day of the Fund’s 2011 fiscal year. See Note 1 of the accompanying Notes.
See accompanying Notes to Financial Statements.
| | | | |
| 11 | | | | OPPENHEIMER MONEY FUND/VA |
FINANCIAL HIGHLIGHTS
| | | | | | | | | | | | | | | | | | | | |
| | | Year
Ended
December 31, | | | Year
Ended
December 30, | | | Year Ended December 31, | |
| | | 2012 | | | 20111 | | | 2010 | | | 2009 | | | 2008 | |
| | | | | | | | | | | | | | | | | | | | | |
| Per Share Operating Data | | | | | | | | | | | | | | | |
| Net asset value, beginning of period | | $ | 1.00 | | | $ | 1.00 | | | $ | 1.00 | | | $ | 1.00 | | | $ | 1.00 | |
| Income from investment operations-net investment income and net realized gain2 | | | — | 3 | | | — | 3 | | | — | 3 | | | — | 3 | | | .03 | |
| Dividends and/or distributions to shareholders: | | | | | | | | | | | | | | | | | | | | |
| Dividends from net investment income | | | — | 3 | | | — | 3 | | | — | 3 | | | — | 3 | | | (.03 | ) |
| Net asset value, end of period | | $
| 1.00
|
| | $
| 1.00
|
| | $
| 1.00
|
| | $
| 1.00
|
| | $
| 1.00
|
|
| Total Return4 | | | 0.01 | % | | | 0.01 | % | | | 0.03 | % | | | 0.32 | % | | | 2.78 | % |
| | | | | | | | | | | | | | | | | | | | | |
| Ratios/Supplemental Data | | | | | | | | | | | | | | | |
| Net assets, end of period (in thousands) | | $ | 174,428 | | | $ | 163,973 | | | $ | 149,697 | | | $ | 180,955 | | | $ | 243,356 | |
| Average net assets (in thousands) | | $ | 164,276 | | | $ | 156,127 | | | $ | 164,258 | | | $ | 218,079 | | | $ | 212,564 | |
| Ratios to average net assets:5 | | | | | | | | | | | | | | | | | | | | |
| Net investment income | | | 0.01 | % | | | 0.01 | % | | | 0.01 | % | | | 0.35 | % | | | 2.72 | % |
| Total expenses | | | 0.62 | % | | | 0.61 | % | | | 0.61 | % | | | 0.57 | % | | | 0.50 | % |
Expenses after payments, waivers and/or
reimbursements and reduction to custodian expenses | | | 0.30 | % | | | 0.29 | % | | | 0.35 | % | | | 0.48 | % | | | 0.50 | % |
1. December 30, 2011 represents the last business day of the Fund’s 2011 fiscal year. See Note 1 of the accompanying Notes.
2. Per share amounts calculated based on the average shares outstanding during the period.
3. Less than $0.005 per share.
4. Assumes an initial investment on the business day before the first day of the fiscal period, with all dividends and distributions reinvested in additional shares on the reinvestment date, and redemption at the net asset value calculated on the last business day of the fiscal period. Total returns are not annualized for periods less than one full year. Total return information does not reflect expenses that apply at the separate account level or to related insurance products. Inclusion of these charges would reduce the total return figures for all periods shown. Returns do not reflect the deduction of taxes that a shareholder would pay on fund distributions or the redemption of fund shares.
5. Annualized for periods less than one full year.
See accompanying Notes to Financial Statements.
| | | | |
| 12 | | | | OPPENHEIMER MONEY FUND/VA |
NOTES TO FINANCIAL STATEMENTS December 31, 2012
1. Significant Accounting Policies
Oppenheimer Money Fund/VA (the “Fund”) is a separate series of Oppenheimer Variable Account Funds, an open-end management investment company registered under the Investment Company Act of 1940, as amended. The Fund’s investment objective is to seek maximum current income from investments in “money market” securities consistent with low capital risk and the maintenance of liquidity. The Fund’s investment adviser is OppenheimerFunds, Inc. (the “Manager”).
The following is a summary of significant accounting policies consistently followed by the Fund.
Previous Annual Period. The last day of the Fund’s fiscal year was the last day the New York Stock Exchange was open for trading. The Fund’s financial statements have been presented through that date to maintain consistency with the Fund’s net asset value calculations used for shareholder transactions.
Federal Taxes. The Fund intends to comply with provisions of the Internal Revenue Code applicable to regulated investment companies and to distribute substantially all of its investment company taxable income to shareholders. Therefore, no federal income or excise tax provision is required. The Fund files income tax returns in U.S. federal and applicable state jurisdictions. The statute of limitations on the Fund’s tax return filings generally remain open for the three preceding fiscal reporting period ends.
The tax components of capital shown in the following table represent distribution requirements the Fund must satisfy under the income tax regulations, losses the Fund may be able to offset against income and gains realized in future years for federal income tax purposes.
| | | | | | | | |
Undistributed
Net Investment
Income | | Undistributed
Long-Term
Gains | | | Accumulated
Loss
Carryforward | |
| $18,850 | | $ | — | | | $ | — | |
Net investment income (loss) and net realized gain (loss) may differ for financial statement and tax purposes. The character of dividends and distributions made during the fiscal year from net investment income or net realized gains may differ from their ultimate characterization for federal income tax purposes. Also, due to timing of dividends and distributions, the fiscal year in which amounts are distributed may differ from the fiscal year in which the income or net realized gain was recorded by the Fund.
Accordingly, the following amounts have been reclassified for December 31, 2012. Net assets of the Fund were unaffected by the reclassifications.
| | | | | | | | |
Increase to
Paid-in Capital | | Increase
to Accumulated
Net Investment
Income | | | Reduction
Accumulated Net
Realized Gain
on Investments | |
| $4,699 | | $ | 1,773 | | | $ | 6,472 | |
The tax character of distributions paid during the years ended December 31, 2012 and December 31, 2011 was as follows:
| | | | | | | | |
| | | Year Ended
December 31,
2012 | | | Year Ended
December 31,
2011 | |
| Distributions paid from: | | | | | | | | |
| Ordinary income | | $ | 17,102 | | | $ | 16,277 | |
| | | | |
| 13 | | | | OPPENHEIMER MONEY FUND/VA |
NOTES TO FINANCIAL STATEMENTS Continued
1. Significant Accounting Policies Continued
Trustees’ Compensation. The Board of Trustees has adopted a compensation deferral plan for independent trustees that enables trustees to elect to defer receipt of all or a portion of the annual compensation they are entitled to receive from the Fund. For purposes of determining the amount owed to the Trustee under the plan, deferred amounts are treated as though equal dollar amounts had been invested in shares of the Fund or in other Oppenheimer funds selected by the Trustee. The Fund purchases shares of the funds selected for deferral by the Trustee in amounts equal to his or her deemed investment, resulting in a Fund asset equal to the deferred compensation liability. Such assets are included as a component of “Other” within the asset section of the Statement of Assets and Liabilities. Deferral of trustees’ fees under the plan will not affect the net assets of the Fund, and will not materially affect the Fund’s assets, liabilities or net investment income per share. Amounts will be deferred until distributed in accordance with the compensation deferral plan.
Dividends and Distributions to Shareholders. Dividends and distributions to shareholders, which are determined in accordance with income tax regulations and may differ from U.S. generally accepted accounting principles, are recorded on the ex-dividend date. Income distributions, if any, are declared daily and paid monthly. Capital gain distributions, if any, are declared and paid annually but may be paid at other times to maintain the net asset value per share at $1.00.
Investment Income. Interest income is recognized on an accrual basis. Discount and premium, which are included in interest income on the Statement of Operations, are amortized or accreted daily.
Custodian Fees. “Custodian fees and expenses” in the Statement of Operations may include interest expense incurred by the Fund on any cash overdrafts of its custodian account during the period. Such cash overdrafts may result from the effects of failed trades in portfolio securities and from cash outflows resulting from unanticipated shareholder redemption activity. The Fund pays interest to its custodian on such cash overdrafts, to the extent they are not offset by positive cash balances maintained by the Fund, at a rate equal to the Federal Funds Rate plus 0.50%. The “Reduction to custodian expenses” line item, if applicable, represents earnings on cash balances maintained by the Fund during the period. Such interest expense and other custodian fees may be paid with these earnings.
Security Transactions. Security transactions are recorded on the trade date. Realized gains and losses on securities sold are determined on the basis of identified cost.
Indemnifications. The Fund’s organizational documents provide current and former trustees and officers with a limited indemnification against liabilities arising in connection with the performance of their duties to the Fund. In the normal course of business, the Fund may also enter into contracts that provide general indemnifications. The Fund’s maximum exposure under these arrangements is unknown as this would be dependent on future claims that may be made against the Fund. The risk of material loss from such claims is considered remote.
Other. The preparation of financial statements in conformity with accounting principles generally accepted in the United States of America requires management to make estimates and assumptions that affect the reported amounts of assets and liabilities and disclosure of contingent assets and liabilities at the date of the financial statements and the reported amounts of increases and decreases in net assets from operations during the reporting period. Actual results could differ from those estimates.
| | | | |
| 14 | | | | OPPENHEIMER MONEY FUND/VA |
2. Securities Valuation
The Fund calculates the net asset value of its shares as of the close of the New York Stock Exchange (the “Exchange”), normally 4:00 P.M. Eastern time, on each day the Exchange is open for trading.
The Fund’s Board has adopted procedures for the valuation of the Fund’s securities and has delegated the day-to-day responsibility for valuation determinations under those procedures to the Manager. The Manager has established a Valuation Committee which is responsible for determining a “fair valuation” for any security for which market quotations are not “readily available.” The Valuation Committee’s fair valuation determinations are subject to review, approval and ratification by the Fund’s Board at its next regularly scheduled meeting covering the calendar quarter in which the fair valuation was determined.
Valuation Methods and Inputs
Securities are valued at cost adjusted by the amortization of discount or premium to maturity (amortized cost), which approximates market value. If amortized cost is determined not to approximate market value, the fair value of the portfolio securities will be determined under procedures approved by the Fund’s Board of Trustees.
If a market value or price cannot be determined for a security using the methodologies described above, or if, in the “good faith” opinion of the Manager, the market value or price obtained does not constitute a “readily available market quotation,” or a significant event has occurred that would materially affect the value of the security the security is fair valued either (i) by a standardized fair valuation methodology applicable to the security type or the significant event as previously approved by the Valuation Committee and the Fund’s Board or (ii) as determined in good faith by the Manager’s Valuation Committee. The Valuation Committee considers all relevant facts that are reasonably available, through either public information or information available to the Manager, when determining the fair value of a security. Fair value determinations by the Manager are subject to review, approval and ratification by the Fund’s Board at its next regularly scheduled meeting covering the calendar quarter in which the fair valuation was determined. Those fair valuation standardized methodologies include, but are not limited to, valuing securities at the last sale price or initially at cost and subsequently adjusting the value based on: changes in company specific fundamentals, changes in an appropriate securities index, or changes in the value of similar securities which may be further adjusted for any discounts related to security-specific resale restrictions. When possible, such methodologies use observable market inputs such as unadjusted quoted prices of similar securities, observable interest rates, currency rates and yield curves. The methodologies used for valuing securities are not necessarily an indication of the risks associated with investing in those securities nor can it be assured that the Fund can obtain the fair value assigned to a security if it were to sell the security.
To assess the continuing appropriateness of security valuations, the Manager, or its third party service provider who is subject to oversight by the Manager, regularly compares prior day prices, prices on comparable securities, and sale prices to the current day prices and challenges those prices exceeding certain tolerance levels with the third party pricing service or broker source. For those securities valued by fair valuations, whether through a standardized fair valuation methodology or a fair valuation determination, the Valuation Committee reviews and affirms the reasonableness of the valuations based on such methodologies and fair valuation determinations on a regular basis after considering all relevant information that is reasonably available.
Classifications
Each investment asset or liability of the Fund is assigned a level at measurement date based on the significance and source of the inputs to its valuation. Various data inputs are used in determining the value of each of the Fund’s investments as of the reporting period end. These data inputs are categorized in the following hierarchy under applicable financial accounting standards:
| | 1) | Level 1—unadjusted quoted prices in active markets for identical assets or liabilities (including securities actively traded on a securities exchange) |
| | | | |
| 15 | | | | OPPENHEIMER MONEY FUND/VA |
NOTES TO FINANCIAL STATEMENTS Continued
2. Securities Valuation Continued
| | 2) | Level 2—inputs other than unadjusted quoted prices that are observable for the asset or liability (such as unadjusted quoted prices for similar assets and market corroborated inputs such as interest rates, prepayment speeds, credit risks, etc.) |
| | 3) | Level 3—significant unobservable inputs (including the Manager’s own judgments about assumptions that market participants would use in pricing the asset or liability). |
The inputs used for valuing securities are not necessarily an indication of the risks associated with investing in those securities.
The table below categorizes amounts that are included in the Fund’s Statement of Assets and Liabilities as of December 31, 2012 based on valuation input level:
| | | | | | | | | | | | | | | | |
| | | Level 1—
Unadjusted
Quoted Prices | | | Level 2—
Other Significant
Observable Inputs | | | Level 3—
Significant
Unobservable Inputs | | | Value | |
| Assets Table | | | | | | | | | | | | | | | | |
| Investments, at Value: | | | | | | | | | | | | | | | | |
| Certificates of Deposit | | $ | — | | | $ | 46,310,990 | | | $ | — | | | $ | 46,310,990 | |
| Direct Bank Obligations | | | — | | | | 16,698,142 | | | | — | | | | 16,698,142 | |
| Short-Term Notes/Commercial Paper | | | — | | | | 92,355,848 | | | | — | | | | 92,355,848 | |
| U.S. Government Obligations | | | — | | | | 11,087,717 | | | | — | | | | 11,087,717 | |
| | |
|
|
| |
|
|
| |
|
|
| |
|
|
|
| Total Assets | | $ | — | | | $ | 166,452,697 | | | $ | — | | | $ | 166,452,697 | |
| | |
|
|
| |
|
|
| |
|
|
| |
|
|
|
There have been no significant changes to the fair valuation methodologies of the Fund during the period.
3. Shares of Beneficial Interest
The Fund has authorized an unlimited number of $0.001 par value shares of beneficial interest. Transactions in shares of beneficial interest were as follows:
| | | | | | | | | | | | | | | | |
| | | Year Ended December 31, 2012 | | | Year Ended December 30, 2011 | |
| | | Shares | | | Amount | | | Shares | | | Amount | |
| Sold | | | 75,194,128 | | | | $ 75,194,128 | | | | 112,694,489 | | | | $ 112,694,489 | |
| Dividends and/or distributions reinvested | | | 17,102 | | | | 17,102 | | | | 16,277 | | | | 16,277 | |
| Redeemed | | | (64,762,771 | ) | | | (64,762,771 | ) | | | (98,436,746 | ) | | | (98,436,746 | ) |
| | |
|
|
| |
|
|
| |
|
|
| |
|
|
|
| Net increase | | | 10,448,459 | | | | $10,448,459 | | | | 14,274,020 | | | | $14,274,020 | |
| | |
|
|
| |
|
|
| |
|
|
| |
|
|
|
4. Fees and Other Transactions with Affiliates
Management Fees. Under the investment advisory agreement, the Fund pays the Manager a management fee based on the daily net assets of the Fund at an annual rate as shown in the following table:
| | | | |
| Fee Schedule | | | |
| Up to $500 million | | | 0.450 | % |
| Next $500 million | | | 0.425 | |
| Next $500 million | | | 0.400 | |
| Over $1.5 billion | | | 0.375 | |
Administration Service Fees. The Fund pays the Manager a fee of $1,500 per year for preparing and filing the Fund’s tax returns.
Transfer Agent Fees. OppenheimerFunds Services (“OFS”), a division of the Manager, acts as the transfer and shareholder servicing agent for the Fund. For the year ended December 31, 2012, the Fund paid $164,087 to OFS for services to the Fund.
| | | | |
| 16 | | | | OPPENHEIMER MONEY FUND/VA |
Waivers and Reimbursements of Expenses. The Manager has voluntarily undertaken to waive fees and/or reimburse expenses to the extent necessary to assist the Fund in attempting to maintain a positive yield. There is no guarantee that the Fund will maintain a positive yield. During the year ended December 31, 2012, the Manager waived fees and/or reimbursed the Fund $525,238.
The Manager has voluntarily agreed to limit the Fund’s expenses after payments, waivers and/or reimbursements and reduction to custodian expenses, excluding expenses incurred directly or indirectly by the Fund as a result of investments in other investment companies, wholly-owned subsidiaries and pooled investment vehicles; so that those expenses, as percentages of daily net assets, will not exceed the annual rate of 0.50%.
Some of these undertakings may be modified or terminated at any time; some may not be modified or terminated until after one year from the date of the current prospectus, as indicated therein.
5. Subsequent Event
The Board of Trustees of the Fund recently approved a series of modifications to the Fund’s investment advisory and transfer agency arrangements in connection with internal corporate restructuring efforts at OppenheimerFunds, Inc. (“OFI”). As a result of these modifications, on January 1, 2013 (the “Effective Date”), OFI Global Asset Management, Inc. (“OFI Global”), a wholly-owned subsidiary of OFI, became the investment adviser and transfer agent to the Fund under the terms of the Fund’s advisory agreement and transfer agency agreement, respectively. OFI Global, in turn, entered into a new sub-advisory agreement for the Fund, on the Effective Date, whereby OFI Global will have oversight and supervisory responsibilities and OFI will choose the Fund’s investments and provide related advisory services to the Fund. In addition, on the Effective Date, OFI Global entered into a sub-transfer agency agreement with Shareholder Services, Inc. doing business as OppenheimerFunds Services, a wholly-owned subsidiary of OFI, under which it will be responsible for providing transfer agency services to the Fund.
The realignment of advisory service responsibility between OFI Global and OFI did not result in any change in the persons managing the assets of the Fund, the level or nature of the advisory services provided to the Fund, or the fees charged to the Fund.
6. Pending Litigation
Since 2009, a number of class action lawsuits have been pending in federal courts against OppenheimerFunds, Inc., the Fund’s Adviser through December 31, 2012 and Sub-Adviser effective January 1, 2013 (the “Manager”), OppenheimerFunds Distributor, Inc., the Fund’s principal underwriter and distributor (the “Distributor”), and certain funds (but not including the Fund) advised by the Manager and distributed by the Distributor (the “Defendant Funds”). Several of these lawsuits also name as defendants certain officers and current and former trustees of the respective Defendant Funds. The lawsuits raise claims under federal securities law and allege, among other things, that the disclosure documents of the respective Defendant Funds contained misrepresentations and omissions and that the respective Defendant Funds’ investment policies were not followed. The plaintiffs in these actions seek unspecified damages, equitable relief and awards of attorneys’ fees and litigation expenses. The Defendant Funds’ Boards of Trustees have also engaged counsel to represent the Funds and the present and former Independent Trustees named in those suits.
Other class action and individual lawsuits have been filed since 2008 in various state and federal courts against the Manager and certain of its affiliates by investors seeking to recover investments they allegedly lost as a result of the “Ponzi” scheme run by Bernard L. Madoff and his firm, Bernard L. Madoff Investment Securities, LLC (“BLMIS”). Plaintiffs in these suits allege that they suffered losses as a result of their investments in several funds managed by an affiliate of the Manager and assert a variety of claims, including breach of fiduciary duty, fraud, negligent misrepresentation, unjust enrichment, and violation of federal and state securities laws and regulations, among others. They seek unspecified damages, equitable relief and awards of attorneys’ fees and litigation expenses. Neither the Distributor, nor any of the
| | | | |
| 17 | | | | OPPENHEIMER MONEY FUND/VA |
NOTES TO FINANCIAL STATEMENTS Continued
6. Pending Litigation Continued
Oppenheimer mutual funds, their independent trustees or directors are named as defendants in these lawsuits. None of the Oppenheimer mutual funds invested in any funds or accounts managed by Madoff or BLMIS. On February 28, 2011, a stipulation of partial settlement of three groups of consolidated putative class action lawsuits relating to these matters was filed in the U.S. District Court for the Southern District of New York. On August 19, 2011, the court entered an order and final judgment approving the settlement as fair, reasonable and adequate. In September 2011, certain parties filed notices of appeal from the court’s order approving the settlement. The settlement does not resolve other outstanding lawsuits against the Manager and its affiliates relating to BLMIS.
On April 16, 2010, a lawsuit was filed in New York state court against the Manager, an affiliate of the Manager and AAArdvark IV Funding Limited (“AAArdvark IV”), an entity advised by the Manager’s affiliate, in connection with investments made by the plaintiffs in AAArdvark IV. Plaintiffs allege breach of contract against the defendants and seek compensatory damages, costs and disbursements, including attorney fees. On July 15, 2011, a lawsuit was filed in New York state court against the Manager, an affiliate of the Manager and AAArdvark Funding Limited (“AAArdvark I”), an entity advised by the Manager’s affiliate, in connection with investments made by the plaintiffs in AAArdvark I. The complaint alleges breach of contract against the defendants and seeks compensatory damages, costs and disbursements, including attorney fees. On November 9, 2011, a lawsuit was filed in New York state court against the Manager, an affiliate of the Manager and AAArdvark XS Funding Limited (“AAArdvark XS”), an entity advised by the Manager’s affiliate, in connection with investments made by the plaintiffs in AAArdvark XS. The complaint alleges breach of contract against the defendants and seeks compensatory damages, costs and disbursements, including attorney fees.
The Manager believes the lawsuits and appeals described above are without legal merit and, with the exception of actions it has settled, is defending against them vigorously. While it is premature to render any opinion as to the outcome in these lawsuits, or whether any costs that the Defendant Funds may bear in defending the suits might not be reimbursed by insurance, the Manager believes that these suits should not impair the ability of the Manager or the Distributor to perform their respective duties to the Fund, and that the outcome of all of the suits together should not have any material effect on the operations of any of the Oppenheimer mutual funds.
| | | | |
| 18 | | | | OPPENHEIMER MONEY FUND/VA |
REPORT OF INDEPENDENT REGISTERED PUBLIC ACCOUNTING FIRM
The Board of Trustees and Shareholders of Oppenheimer Variable Account Funds:
We have audited the accompanying statement of assets and liabilities of Oppenheimer Money Fund/VA (a separate series of Oppenheimer Variable Account Funds), including the statement of investments, as of December 31, 2012, and the related statement of operations for the year then ended, the statements of changes in net assets for each of the years in the two-year period then ended and the financial highlights for each of the years in the four-year period then ended. These financial statements and financial highlights are the responsibility of the Fund’s management. Our responsibility is to express an opinion on these financial statements and financial highlights based on our audits. The accompanying financial highlights of Oppenheimer Money Fund/VA for the year ended December 31, 2008 were audited by other auditors whose report dated February 11, 2009 expressed an unqualified opinion on those financial highlights.
We conducted our audits in accordance with the standards of the Public Company Accounting Oversight Board (United States). Those standards require that we plan and perform the audit to obtain reasonable assurance about whether the financial statements and financial highlights are free of material misstatement. An audit includes examining, on a test basis, evidence supporting the amounts and disclosures in the financial statements. Our procedures included confirmation of securities owned as of December 31, 2012, by correspondence with the custodian. An audit also includes assessing the accounting principles used and significant estimates made by management, as well as evaluating the overall financial statement presentation. We believe that our audits provide a reasonable basis for our opinion.
In our opinion, the financial statements and financial highlights referred to above present fairly, in all material respects, the financial position of Oppenheimer Money Fund/VA as of December 31, 2012, the results of its operations for the year then ended, the changes in its net assets for each of the years in the two-year period then ended and the financial highlights for each of the years in the four-year period then ended, in conformity with U.S. generally accepted accounting principles.
KPMGLLP
Denver, Colorado
February 19, 2013
| | | | |
| 19 | | | | OPPENHEIMER MONEY FUND/VA |
FEDERAL INCOME TAX INFORMATION Unaudited
In early 2013, if applicable, shareholders of record received information regarding all dividends and distributions paid to them by the Fund during calendar year 2012.
The foregoing information is presented to assist shareholders in reporting distributions received from the Fund to the Internal Revenue Service. Because of the complexity of the federal regulations which may affect your individual tax return and the many variations in state and local tax regulations, we recommend that you consult your tax advisor for specific guidance.
| | | | |
| 20 | | | | OPPENHEIMER MONEY FUND/VA |
BOARD APPROVAL OF THE FUND’S INVESTMENT
ADVISORY AGREEMENT Unaudited
Each year, the Board of Trustees (the “Board”), including a majority of the independent Trustees, is required to determine whether to renew the Fund’s investment advisory agreement (the “Agreement”). The Investment Company Act of 1940, as amended, requires that the Board request and evaluate, and that the Manager provide, such information as may be reasonably necessary to evaluate the terms of the Agreement. The Board employs an independent consultant to prepare a report that provides information, including comparative information that the Board requests for that purpose. In addition to in-person meetings focused on this evaluation, the Board receives information throughout the year regarding Fund services, fees, expenses and performance.
The Manager and the independent consultant provided information to the Board on the following factors: (i) the nature, quality and extent of the Manager’s services, (ii) the investment performance of the Fund and the Manager, (iii) the fees and expenses of the Fund, including comparative expense information, (iv) the profitability of the Manager and its affiliates, including an analysis of the cost of providing services, (v) whether economies of scale are realized as the Fund grows and whether fee levels reflect these economies of scale for Fund investors and (vi) other benefits to the Manager from its relationship with the Fund. The Board was aware that there are alternatives to retaining the Manager.
Outlined below is a summary of the principal information considered by the Board as well as the Board’s conclusions.
Nature, Quality and Extent of Services. The Board considered information about the nature, quality and extent of the services provided to the Fund and information regarding the Manager’s key personnel who provide such services. The Manager’s duties include providing the Fund with the services of the portfolio managers and the Manager’s investment team, who provide research, analysis and other advisory services in regard to the Fund’s investments; securities trading services; oversight of third-party service providers; monitoring compliance with applicable Fund policies and procedures and adherence to the Fund’s investment restrictions; and risk management. The Manager is responsible for providing certain administrative services to the Fund as well. Those services include providing and supervising all administrative and clerical personnel who are necessary in order to provide effective corporate administration for the Fund; compiling and maintaining records with respect to the Fund’s operations; preparing and filing reports required by the Securities and Exchange Commission; preparing periodic reports regarding the operations of the Fund for its shareholders; preparing proxy materials for shareholder meetings; and preparing the registration statements required by Federal and state securities laws for the sale of the Fund’s shares. The Manager also provides the Fund with office space, facilities and equipment.
The Board also considered the quality of the services provided and the quality of the Manager’s resources that are available to the Fund. The Board took account of the fact that the Manager has had over fifty years of experience as an investment adviser and that its assets under management rank it among the top mutual fund managers in the United States. The Board evaluated the Manager’s advisory, administrative, accounting, legal, compliance services and risk management, and information the Board has received regarding the experience and professional qualifications of the Manager’s key personnel and the size and functions of its staff. In its evaluation of the quality of the portfolio management services provided, the Board considered the experience of Carol Wolf and Christopher Proctor, the portfolio managers for the Fund, and the Manager’s investment team and analysts. The Board members also considered the totality of their experiences with the Manager as directors or trustees of the Fund and other funds advised by the Manager. The Board considered information regarding the quality of services provided by affiliates of the Manager, which its members have become knowledgeable about in connection with the renewal of the Fund’s service agreements. The Board concluded, in light of the Manager’s experience, reputation, personnel, operations and resources that the Fund benefits from the services provided under the Agreement.
Investment Performance of the Manager and the Fund. Throughout the year, the Manager provided information on the investment performance of the Fund, including comparative performance information. The Board also reviewed information, prepared by the Manager and by the independent consultant, comparing the Fund’s historical performance to relevant market indices and to the performance of other money market instrument funds underlying variable
| | | | |
| 21 | | | | OPPENHEIMER MONEY FUND/VA |
BOARD APPROVAL OF THE FUND’S INVESTMENT
ADVISORY AGREEMENT Unaudited / Continued
insurance products. The Board considered that the Fund’s performance was equal to that of its performance universe median for the one-year period and exceeded the performance universe median during the three-, five-, and ten-year periods.
Costs of Services by the Manager. The Board reviewed the fees paid to the Manager and the other expenses borne by the Fund. The Board also considered the comparability of the fees charged and the services provided to the Fund to the fees and services for other clients or accounts advised by the Manager. The independent consultant provided comparative data in regard to the fees and expenses of the Fund and other money market instrument funds underlying variable insurance products. In reviewing the fees and expenses charged to the VA funds, the Board considered the Manager’s assertion that, because there is much greater disparity in the fees and services that may be provided by a manager to a VA fund as opposed to a retail fund, when comparing the expenses of the various VA funds to those of retail funds, it is most appropriate to focus on total expenses (rather than on the management fees). Accordingly, while the Board reviewed and considered all expenses, it focused on total expenses. The Board considered that the Fund’s actual management fees were lower than its expense group median and average. The Board considered that the Fund’s total expenses were higher than its expense group median but lower than its expense group average. The Board noted that the Manager has voluntarily agreed to waive fees and/or reimburse the Fund for certain expenses in order to limit “Total Annual Fund Operating Expenses After Fee Waivers and/or Expense Reimbursement” (excluding (i) interest, taxes, dividends tied to short sales, brokerage commissions, and other expenditures which are capitalized in accordance with generally accepted accounting principles; (ii) expenses incurred directly or indirectly by the Fund as a result of investments in other investment companies, wholly-owned subsidiaries and pooled investment vehicles; (iii) certain other expenses attributable to, and incurred as a result of, a Fund’s investments; and (iv) other extraordinary expenses (including litigation expenses) not incurred in the ordinary course of the Fund’s business) to the annual rate of 0.50% as calculated on the daily net assets of the Fund. This waiver and/or reimbursement may be amended or withdrawn at any time without prior notice to shareholders. The Board also considered that the Manager voluntarily agreed to waive and/or reimburse fees to the extent necessary to help to attempt to maintain a positive yield although there is no guarantee that the Fund will maintain a positive yield. This voluntary fee waiver and/or reimbursement may not be amended or withdrawn until one year after the date of the Fund’s prospectus.
Economies of Scale and Profits Realized by the Manager. The Board considered information regarding the Manager’s costs in serving as the Fund’s investment adviser, including the costs associated with the personnel and systems necessary to manage the Fund, and information regarding the Manager’s profitability from its relationship with the Fund. The Board reviewed whether the Manager may realize economies of scale in managing and supporting the Fund. The Board noted that the Fund currently has management fee breakpoints, which are intended to share with Fund shareholders economies of scale that may exist as the Fund’s assets grow.
Other Benefits to the Manager. In addition to considering the profits realized by the Manager, the Board considered information that was provided regarding the direct and indirect benefits the Manager receives as a result of its relationship with the Fund, including compensation paid to the Manager’s affiliates. The Board also considered that the Manager must be able to pay and retain experienced professional personnel at competitive rates to provide quality services to the Fund.
Conclusions. These factors were also considered by the independent Trustees meeting separately from the full Board, assisted by experienced counsel to the Fund and to the independent Trustees. Fund counsel and the independent Trustees’ counsel are independent of the Manager within the meaning and intent of the Securities and Exchange Commission Rules.
Based on its review of the information it received and its evaluations described above, the Board, including a majority of the independent Trustees, decided to continue the Agreement. In addition, the Board, including a majority of the Independent Trustees, approved the restructuring of the Fund’s investment advisory arrangement so that effective January 1, 2013, (i) OFI Global Asset Management, Inc. (“OFI Global”), a wholly owned subsidiary of the Manager, will
| | | | |
| 22 | | | | OPPENHEIMER MONEY FUND/VA |
serve as the investment adviser to the Fund in place of the Manager under a Restated Advisory Agreement (“Restated Advisory Agreement”), and (ii) OFI Global will enter into a Sub-Advisory Agreement (“Sub-Advisory Agreement”) with the Manager to provide investment sub-advisory services to the Fund. OFI Global will pay the Manager a percentage of the net investment advisory fee (after all applicable waivers have been deducted) that it receives from the Fund. The Agreement will continue until earlier of August 31, 2013 or the effective date of the Restated Advisory Agreement between the Fund and OFI Global. The Restated Advisory Agreement and Sub-Advisory Agreement will continue until August 31, 2013.
In arriving at its decisions, the Board did not single out any factor or factors as being more important than others, but considered all of the above information, and considered the terms and conditions of the Agreement, Restated Advisory Agreement and Sub-Advisory Agreement, including the management fees, in light of all the surrounding circumstances.
| | | | |
| 23 | | | | OPPENHEIMER MONEY FUND/VA |
PORTFOLIO PROXY VOTING POLICIES AND PROCEDURES;
UPDATES TO STATEMENTS OF INVESTMENTS Unaudited
The Fund has adopted Portfolio Proxy Voting Policies and Procedures under which the Fund votes proxies relating to securities (“portfolio proxies”) held by the Fund. A description of the Fund’s Portfolio Proxy Voting Policies and Procedures is available (i) without charge, upon request, by calling the Fund toll-free at 1.800.525.7048, (ii) on the Fund’s website at oppenheimerfunds.com, and (iii) on the SEC’s website at www.sec.gov. In addition, the Fund is required to file Form N-PX, with its complete proxy voting record for the 12 months ended June 30th, no later than August 31st of each year. The Fund’s voting record is available (i) without charge, upon request, by calling the Fund toll-free at 1.800.525.7048, and (ii) in the Form N-PX filing on the SEC’s website at www.sec.gov.
The Fund files its complete schedule of portfolio holdings with the SEC for the first quarter and the third quarter of each fiscal year on Form N-Q. The Fund’s Form N-Q filings are available on the SEC’s website at www.sec.gov. Those forms may be reviewed and copied at the SEC’s Public Reference Room in Washington, D.C. Information on the operation of the Public Reference Room may be obtained by calling 1-800-SEC-0330.
| | | | |
| 24 | | | | OPPENHEIMER MONEY FUND/VA |
TRUSTEES AND OFFICERS Unaudited
| | |
| Name, Position(s) Held with the Fund, Length of Service, Age | | Principal Occupation(s) During the Past 5 Years; Other Trusteeships/Directorships Held; Number of Portfolios in the Fund Complex Currently Overseen |
| |
| INDEPENDENT TRUSTEES | | The address of each Trustee in the chart below is 6803 S. Tucson Way, Centennial, Colorado 80112-3924. Each Trustee serves for an indefinite term, or until his or her resignation, retirement, death or removal. |
| |
Sam Freedman, Chairman of the Board of Trustees (since 2012) and Trustee (since 1996) Age: 72 | | Director of Colorado UpLIFT (charitable organization) (since September 1984). Mr. Freedman held several positions with the Sub-Adviser and with subsidiary or affiliated companies of the Sub-Adviser (until October 1994). Oversees 36 portfolios in the OppenheimerFunds complex. Mr. Freedman has served on the Boards of certain Oppenheimer funds since 1996, during which time he has become familiar with the Fund’s (and other Oppenheimer funds’) financial, accounting, regulatory and investment matters and has contributed to the Boards’ deliberations. |
| |
Edward L. Cameron, Trustee (since 1999) Age: 74 | | Member of The Life Guard of Mount Vernon (George Washington historical site) (June 2000 – June 2006); Partner of PricewaterhouseCoopers LLP (accounting firm) (July 1974-June 1999); Chairman of Price Waterhouse LLP Global Investment Management Industry Services Group (accounting firm) (July 1994-June 1998). Oversees 36 portfolios in the OppenheimerFunds complex. Mr. Cameron has served on the Boards of certain Oppenheimer funds since 1999, during which time he has become familiar with the Fund’s (and other Oppenheimer funds’) financial, accounting, regulatory and investment matters and has contributed to the Boards’ deliberations. |
| |
Jon S. Fossel, Trustee (since 1990) Age: 70 | | Chairman of the Board (2006-December 2011) and Director (June 2002-December 2011) of UNUMProvident (insurance company); Director of Northwestern Energy Corp. (public utility corporation) (November 2004-December 2009); Director of P.R. Pharmaceuticals (October 1999-October 2003); Director of Rocky Mountain Elk Foundation (non-profit organization) (February 1998-February 2003 and February 2005-February 2007); Chairman and Director (until October 1996) and President and Chief Executive Officer (until October 1995) of the Sub-Adviser; President, Chief Executive Officer and Director of the following: Oppenheimer Acquisition Corp. (“OAC”) (parent holding company of the Sub-Adviser), Shareholders Services, Inc. and Shareholder Financial Services, Inc. (until October 1995). Oversees 36 portfolios in the OppenheimerFunds complex. Mr. Fossel has served on the Boards of certain Oppenheimer funds since 1990, during which time he has become familiar with the Fund’s (and other Oppenheimer funds’) financial, accounting, regulatory and investment matters and has contributed to the Boards’ deliberations. |
| |
Richard F. Grabish, Trustee (since 2012) Age: 64 | | Formerly Senior Vice President and Assistant Director of Sales and Marketing (March 1997-December 2007), Director (March 1987-December 2007) and Manager of Private Client Services (June 1985-June 2005) of A.G. Edwards & Sons, Inc. (broker/dealer and investment firm); Chairman and Chief Executive Officer of A.G. Edwards Trust Company, FSB (March 2001-December 2007); President and Vice Chairman of A.G. Edwards Trust Company, FSB (investment adviser) (April 1987-March 2001); President of A.G. Edwards Trust Company, FSB (investment adviser) (June 2005-December 2007). Oversees 36 portfolios in the OppenheimerFunds complex. Mr. Grabish has served on the Boards of certain Oppenheimer funds since 2001, during which time he has become familiar with the Fund’s (and other Oppenheimer funds’) financial, accounting, regulatory and investment matters and has contributed to the Boards’ deliberations. |
| |
Beverly L. Hamilton, Trustee (since 2002) Age: 66 | | Trustee of Monterey Institute for International Studies (educational organization) (since February 2000); Board Member of Middlebury College (educational organization) (December 2005-June 2011); Chairman (since 2010) of American Funds’ Emerging Markets Growth Fund, Inc. (mutual fund); Director of The California Endowment (philanthropic organization) (April 2002-April 2008); Director (February 2002-2005) and Chairman of Trustees (2006-2007) of the Community Hospital of Monterey Peninsula; Director (October 1991-2005); Vice Chairman (2006-2009) of American Funds’ Emerging Markets Growth Fund, Inc. (mutual fund); President of ARCO Investment Management Company (February 1991-April 2000); Member of the investment committees of The Rockefeller Foundation (2001-2006) and The University of Michigan (since 2000); Advisor at Credit Suisse First Boston’s Sprout venture capital unit (venture capital fund) (1994-January 2005); Trustee of MassMutual Institutional Funds (investment company) (1996-June 2004); Trustee of MML Series Investment Fund (investment company) (April 1989-June 2004); Member of the investment committee of Hartford Hospital (2000-2003); and Advisor to Unilever (Holland) pension fund (2000-2003). Oversees 36 portfolios in the OppenheimerFunds complex. Ms. Hamilton has served on the Boards of certain Oppenheimer funds since 2002, during which time she has become familiar with the Fund’s (and other Oppenheimer funds’) financial, accounting, regulatory and investment matters and has contributed to the Boards’ deliberations. |
| | | | |
| 25 | | | | OPPENHEIMER MONEY FUND/VA |
TRUSTEES AND OFFICERS Unaudited / Continued
| | |
Victoria J. Herget, Trustee (since 2012) Age: 61 | | Independent Director of the First American Funds (mutual fund family) (2003-2011); former Managing Director (1993-2001), Principal (1985-1993), Vice President (1978-1985) and Assistant Vice President (1973-1978) of Zurich Scudder Investments (and its predecessor firms); Board Chair (2008-Present) and Director (2004-Present), United Educators (insurance company); Trustee (1992-2007), Chair of the Board of Trustees (1999-2007), Investment Committee Chair (1994-1999) and Investment Committee member (2007-2010) of Wellesley College; Trustee (since 2000) and Chair (since 2010), Newberry Library; Trustee, Mather LifeWays (since 2001); Trustee, BoardSource (2006-2009) and Chicago City Day School (1994-2005). Oversees 36 portfolios in the OppenheimerFunds complex. Ms. Herget has served on the Boards of certain Oppenheimer funds since 2012, during which time she has become familiar with the Fund’s (and other Oppenheimer funds’) financial, accounting, regulatory and investment matters and has contributed to the Boards’ deliberations. |
| |
Robert J. Malone, Trustee (since 2002) Age: 68 | | Board of Directors of Opera Colorado Foundation (non-profit organization) (since March 2008); Director of Jones Knowledge, Inc. (2006-2010); Director of Jones International University (educational organization) (since August 2005); Chairman, Chief Executive Officer and Director of Steele Street Bank & Trust (commercial banking) (since August 2003); Director of Colorado UpLIFT (charitable organization) (1986-2010); Trustee of the Gallagher Family Foundation (non-profit organization) (since 2000); Former Chairman of U.S. Bank-Colorado (subsidiary of U.S. Bancorp and formerly Colorado National Bank) (July 1996-April 1999); Director of Commercial Assets, Inc. (real estate investment trust) (1993-2000); Director of Jones Knowledge, Inc. (2001-July 2004); Director of U.S. Exploration, Inc. (oil and gas exploration) (1997-February 2004); Chairman of the Board (1991-1994) and Trustee (1985-1994) of Regis University; and Chairman of the Board (1990-1991) and Trustee (1984-1999) of Young Presidents Organization. Oversees 36 portfolios in the OppenheimerFunds complex. Mr. Malone has served on the Boards of certain Oppenheimer funds since 2002, during which time he has become familiar with the Fund’s (and other Oppenheimer funds’) financial, accounting, regulatory and investment matters and has contributed to the Boards’ deliberations. |
| |
F. William Marshall, Jr., Trustee (since 2000) Age: 70 | | Trustee Emeritus of Worcester Polytech Institute (WPI) (private university) (since 2009); Trustee of MassMutual Select Funds (formerly MassMutual Institutional Funds) (investment company) (since 1996) and MML Series Investment Fund (investment company) (since 1996) and Mass Mutual Premier Funds (investment company) (since January 2012); President and Treasurer of the SIS Funds (private charitable fund) (January 1999 – March 2011); Former Trustee of WPI (1985-2008); Former Chairman of the Board (2004-2006) and Former Chairman of the Investment Committee of WPI (1994-2008); Chairman of SIS & Family Bank, F.S.B. (formerly SIS Bank) (commercial bank) (January 1999-July 1999); Executive Vice President of Peoples Heritage Financial Group, Inc. (commercial bank) (January 1999-July 1999); and Former President and Chief Executive Officer of SIS Bancorp. (1993-1999). Oversees 40 portfolios in the OppenheimerFunds complex. Mr. Marshall has served on the Boards of certain Oppenheimer funds since 2000, during which time he has become familiar with the Fund’s (and other Oppenheimer funds’) financial, accounting, regulatory and investment matters and has contributed to the Boards’ deliberations. |
| |
Karen L. Stuckey, Trustee (since 2012) Age: 59 | | Partner (1990-2012) of PricewaterhouseCoopers LLP (held various positions 1975-1990); Trustee (1992-2006) and member of Executive, Nominating and Audit Committees and Chair of Finance Committee of Lehigh University; and member, Women’s Investment Management Forum since inception. Oversees 36 portfolios in the OppenheimerFunds complex. Ms. Stuckey has served on the Boards of certain Oppenheimer funds since 2012, during which time she has become familiar with the Fund’s (and other Oppenheimer funds’) financial, accounting, regulatory and investment matters and has contributed to the Boards’ deliberations. |
| |
James D. Vaughn, Trustee (since 2012) Age: 67 | | Retired; former managing partner (1994-2001) of Denver office of Deloitte & Touche LLP, (held various positions 1969-1993); Trustee and Chairman of the Audit Committee of Schroder Funds (2003-2012); Board member and Chairman of Audit Committee of AMG National Trust Bank (since 2005); Trustee, Audit Committee member and Investment Committee member, University of South Dakota Foundation (since 1996); Board member, Executive Committee Member, Audit Committee Member and past Board Chair, Junior Achievement (since 1993); former Board member, Mile High United Way, Boys and Girls Clubs, Boy Scouts, Colorado Business Committee for the Arts, Economic Club of Colorado and Metro Denver Network. Oversees 36 portfolios in the OppenheimerFunds complex. Mr. Vaughn has served on the Boards of certain Oppenheimer funds since 2012, during which time he has become familiar with the Fund’s (and other Oppenheimer funds’) financial, accounting, regulatory and investment matters and has contributed to the Boards’ deliberations. |
| | | | |
| 26 | | | | OPPENHEIMER MONEY FUND/VA |
| | |
| INTERESTED TRUSTEE AND OFFICER | | The address of Mr. Glavin is Two World Financial Center, 225 Liberty Street, 11th Floor, New York, New York 10281-1008. Mr. Glavin serves as a Trustee for an indefinite term, or until his resignation, retirement, death or removal and as an Officer for an indefinite term, or until his resignation, retirement, death or removal. Mr. Glavin is an Interested Trustee due to his positions with OppenheimerFunds, Inc. and its affiliates. |
| |
William F. Glavin, Jr., Trustee, President and Principal Executive Officer (since 2009) Age: 54 | | Chief Executive Officer of OppenheimerFunds (since January 2013); Director, Chief Executive Officer and President of the Manager (since January 2013); Chairman of the Sub-Adviser (December 2009-December 2012); Chief Executive Officer (January 2009-December 2012) and Director of the Sub-Adviser (since January 2009); President of the Sub-Adviser (May 2009-December 2012); Management Director (since June 2009), President (since December 2009) and Chief Executive Officer (since January 2011) of Oppenheimer Acquisition Corp. (“OAC”) (the Sub-Adviser’s parent holding company); Director of Oppenheimer Real Asset Management, Inc. (since March 2010); Executive Vice President (March 2006-February 2009) and Chief Operating Officer (July 2007-February 2009) of Massachusetts Mutual Life Insurance Company (OAC’s parent company); Director (May 2004-March 2006) and Chief Operating Officer and Chief Compliance Officer (May 2004-January 2005), President (January 2005-March 2006) and Chief Executive Officer (June 2005-March 2006) of Babson Capital Management LLC; Director (March 2005-March 2006), President (May 2003-March 2006) and Chief Compliance Officer (July 2005-March 2006) of Babson Capital Securities, Inc. (a broker-dealer); President (May 2003-March 2006) of Babson Investment Company, Inc.; Director (May 2004-August 2006) of Babson Capital Europe Limited; Director (May 2004-October 2006) of Babson Capital Guernsey Limited; Director (May 2004-March 2006) of Babson Capital Management LLC; Non-Executive Director (March 2005-March 2007) of Baring Asset Management Limited; Director (February 2005-June 2006) Baring Pension Trustees Limited; Director and Treasurer (December 2003-November 2006) of Charter Oak Capital Management, Inc.; Director (May 2006-September 2006) of C.M. Benefit Insurance Company; Director (May 2008-June 2009) and Executive Vice President (June 2007-July 2009) of C.M. Life Insurance Company; President (March 2006-May 2007) of MassMutual Assignment Company; Director (January 2005-December 2006), Deputy Chairman (March 2005-December 2006) and President (February 2005-March 2005) of MassMutual Holdings (Bermuda) Limited; Director (May 2008-June 2009) and Executive Vice President (June 2007-July 2009) of MML Bay State Life Insurance Company; Chief Executive Officer and President (April 2007-January 2009) of MML Distributors, LLC; and Chairman (March 2006-December 2008) and Chief Executive Officer (May 2007-December 2008) of MML Investors Services, Inc. An officer of 86 portfolios in the OppenheimerFunds complex. |
| OTHER OFFICERS OF THE FUND | | The addresses of the Officers in the chart below are as follows: for Mr. Gabinet and Ms. Nasta, Two World Financial Center, 225 Liberty Street, New York, New York 10281-1008, for Messrs. Proctor, Vandehey, Wixted, and Ms. Wolf, 6803 S. Tucson Way, Centennial, Colorado 80112-3924. Each Officer serves for an indefinite term or until his or her resignation, retirement, death or removal. |
| |
Carol E. Wolf, Vice President
(since 1998) Age: 61 | | Senior Vice President of the Sub-Adviser (since September 2000). Senior Vice President of HarbourView Asset Management Corporation (June 2003-December 2012) and Vice President of the Sub-Adviser (June 1990-June 2000). A portfolio manager and officer of 6 portfolios in the OppenheimerFunds complex. |
| |
Christopher Proctor, Vice President
(since 2010) Age: 44 | | Vice President of the Sub-Adviser (since August 2008) and a Senior Analyst in the Money Market Fund Group responsible for leading the money market research team. A CFA and CTP with 20 years of credit research, trading and portfolio management experience in the money fund industry. Prior to joining the Sub-Adviser, a Vice President at Calamos Asset Management (January 2007-March 2008) and Scudder-Kemper Investments (1999-2002), where he managed over $15 billion in institutional and retail money market products. A Managing Director and Co-Founder of Elmhurst Capital Management (June 2004-January 2007) and a Senior Manager of Research for Etrade Global Asset Management (2002-2004). A portfolio manager and officer of 5 portfolios in the OppenheimerFunds complex. |
| | | | |
| 27 | | | | OPPENHEIMER MONEY FUND/VA |
TRUSTEES AND OFFICERS Unaudited / Continued
| | |
Arthur S. Gabinet, Secretary and Chief Legal Officer (since 2011) Age: 54 | | General Counsel of OppenheimerFunds (since January 2013); Executive Vice President, Secretary and General Counsel of the Manager (since January 2013); General Counsel OFI SteelPath, Inc. (since January 2013); Executive Vice President (May 2010-December 2012) and General Counsel (since January 2011) of the Sub-Adviser; General Counsel of the Distributor (since January 2011); General Counsel of Centennial Asset Management Corporation (January 2011-December 2012); Executive Vice President (January 2011-December 2012) and General Counsel of HarbourView Asset Management Corporation (since January 2011); Assistant Secretary (since January 2011) and Director (since January 2011) of OppenheimerFunds International Ltd. and OppenheimerFunds plc; Director of Oppenheimer Real Asset Management, Inc. (January 2011-December 2012) and General Counsel (since January 2011); Executive Vice President (January 2011-December 2011) and General Counsel of Shareholder Financial Services, Inc. and Shareholder Services, Inc. (since January 2011); Executive Vice President (January 2011-December 2012) and General Counsel of OFI Private Investments Inc. (since January 2011); Vice President of OppenheimerFunds Legacy Program (January 2011-December 2011); Executive Vice President (January 2011-December 2012) and General Counsel of OFI Institutional Asset Management, Inc. (since January 2011); General Counsel, Asset Management of the Sub-Adviser (May 2010-December 2010); Principal, The Vanguard Group (November 2005-April 2010); District Administrator, U.S. Securities and Exchange Commission (January 2003-October 2005). An officer of 86 portfolios in the OppenheimerFunds complex. |
| |
Christina M. Nasta, Vice President and Chief Business Officer (since 2011) Age: 39 | | Senior Vice President of OppenheimerFunds Distributor, Inc. (since January 2013); Senior Vice President of the Sub-Adviser (July 2010-December 2012); Vice President of the Sub-Adviser (January 2003-July 2010); Vice President of OppenheimerFunds Distributor, Inc. (January 2003-July 2010). An officer of 86 portfolios in the OppenheimerFunds complex. |
| |
Mark S. Vandehey, Vice President and Chief Compliance Officer (since 2004) Age: 62 | | Chief Compliance Officer of OppenheimerFunds (since January 2013); Senior Vice President and Chief Compliance Officer of the Manager (since January 2013); Chief Compliance Officer of OFI SteelPath, Inc. (since January 2013); Senior Vice President of the Sub-Adviser (March 2004-December 2012); Chief Compliance Officer of the Sub-Adviser, OppenheimerFunds Distributor, Inc., OFI Trust Company, OFI Institutional Asset Management, Inc., Oppenheimer Real Asset Management, Inc., OFI Private Investments, Inc., Harborview Asset Management Corporation, Trinity Investment Management Corporation, and Shareholder Services, Inc. (since March 2004); Vice President of OppenheimerFunds Distributor, Inc., Centennial Asset Management Corporation and Shareholder Services, Inc. (June 1983-December 2012). An officer of 86 portfolios in the OppenheimerFunds complex. |
| |
Brian W. Wixted, Treasurer and Principal Financial & Accounting Officer (since 1999) Age: 53 | | Senior Vice President of the Manager (since January 2013); Treasurer of the Sub-Adviser, HarbourView Asset Management Corporation, Shareholder Financial Services, Inc., Shareholder Services, Inc., and Oppenheimer Real Asset Management, Inc. (March 1999-June 2008), OFI Private Investments, Inc. (March 2000-June 2008), OppenheimerFunds International Ltd. and OppenheimerFunds plc (since May 2000), OFI Institutional Asset Management, Inc. (November 2000-June 2008), and OppenheimerFunds Legacy Program (charitable trust program established by the Sub-Adviser) (June 2003-December 2011); Treasurer and Chief Financial Officer of OFI Trust Company (since May 2000); Assistant Treasurer of Oppenheimer Acquisition Corporation (March 1999-June 2008). An officer of 86 portfolios in the OppenheimerFunds complex. |
The Fund’s Statement of Additional Information contains additional information about the Fund’s Trustees and Officers and is available without charge, upon request, by calling 1.800.988.8287.
| | | | |
| 28 | | | | OPPENHEIMER MONEY FUND/VA |
OPPENHEIMER MONEY FUND/VA
| | |
| A Series of Oppenheimer Variable Account Funds |
| Manager | | OFI Global Asset Management, Inc. |
| Sub-Adviser | | OppenheimerFunds, Inc. |
| Distributor | | OppenheimerFunds Distributor, Inc. |
Transfer and Shareholder Servicing Agent | | OFI Global Asset Management, Inc. |
| Sub-Transfer Agent | | Shareholder Services, Inc. DBA OppenheimerFunds Services |
Independent Registered Public Accounting Firm | | KPMGLLP |
| Counsel | | K&L Gates LLP |
Before investing, investors should carefully consider a fund’s investment objectives, risks, charges and expenses. Fund prospectuses and summary prospectuses contain this and other information about the funds, and may be obtained by asking your financial advisor, or calling us at 1.800.988.8287. Read prospectuses and summary prospectuses carefully before investing.
| | |
| ©2013 OppenheimerFunds, Inc. All rights reserved. | | |
December 31, 2012
| | | | |
| | | Oppenheimer Global Strategic Income Fund/VA A Series of Oppenheimer Variable Account Funds | | Annual Report |
ANNUAL REPORT
Listing of Top Holdings
Fund Performance Discussion
Financial Statements
OPPENHEIMER GLOBAL STRATEGIC INCOME FUND/VA
Portfolio Managers: Arthur P. Steinmetz, Krishna Memani, Joseph Welsh, CFA, and Sara J. Zervos, Ph.D.
| | | | | | |
Average Annual Total Returns
For the Periods Ended 12/31/12 |
| | | |
| | | 1-Year | | 5-Year | | 10-Year |
| Non-Service Shares | | 13.53% | | 6.06% | | 7.62% |
| Service Shares | | 13.15 | | 5.77 | | 7.31 |
The performance data quoted represents past performance, which does not guarantee future results. The investment return and principal value of an investment in the Fund will fluctuate so that an investor’s shares, when redeemed, may be worth more or less than their original cost. Current performance may be lower or higher than the performance quoted. For performance data current to the most recent month end, call us at 1.800.988.8287. The Fund’s total returns should not be expected to be the same as the returns of other funds, whether or not both funds have the same portfolio managers and/or similar names. The Fund’s total returns include changes in share price and reinvested distributions but do not include the charges associated with the separate account products that offer this Fund. Such performance would have been lower if such charges were taken into account.
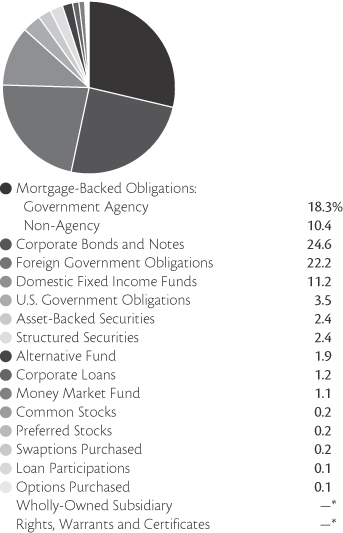
* Represents a value of less than 0.05%.
Portfolio holdings and allocations are subject to change. Percentages are as of December 31, 2012, and are based on the total market value of investments.
| | | | |
| Corporate Bonds & Notes—Top Ten Industries | |
| Oil, Gas & Consumable Fuels | | | 5.1 | % |
| Commercial Banks | | | 3.1 | |
| Media | | | 1.7 | |
| Wireless Telecommunication Services | | | 1.4 | |
| Electric Utilities | | | 1.3 | |
| Diversified Telecommunication Services | | | 1.3 | |
| Hotels, Restaurants & Leisure | | | 1.3 | |
| Metals & Mining | | | 0.9 | |
| Capital Markets | | | 0.8 | |
| Diversified Financial Services | | | 0.7 | |
Portfolio holdings and allocations are subject to change. Percentages are as of December 31, 2012, and are based on net assets.
| | | | |
| 2 | | | | OPPENHEIMER GLOBAL STRATEGIC INCOME FUND/VA |
FUND PERFORMANCE DISCUSSION
The Fund’s Non-Service shares returned 13.53% during the one-year reporting period, outperforming its benchmarks, the Barclays Capital U.S. Aggregate Bond Index and the Citigroup World Government Bond Index, which returned 4.22% and 1.65%, respectively. We attribute these results to the success of our asset allocation and security selection strategies, the latter of which produced higher returns than their respective market averages in all of the various global fixed-income sectors that comprise the Fund’s portfolio. The Fund achieved especially strong relative results from its investments in high yield bonds, U.S. mortgage-backed securities and emerging-markets debt securities denominated in U.S. dollars.
Economic and Market Environment
2012 began on a positive note when an economic recovery gained traction. During the first quarter of the year, the U.S. economy began to produce impressive numbers of new jobs, and the European Central Bank (the “ECB”) launched dual Long Term Refinancing Operations to shore up the region’s banking system. Meanwhile, China appeared ready to relax some of its restrictive policies as inflationary pressures waned. However, these hopeful developments suffered a setback in the spring, when U.S. employment gains moderated and some European nations resisted austerity measures. Consequently, riskier parts of the U.S. and international bond markets gave back many of their previous gains over the second quarter of the year.
In an attempt to stimulate growth, central banks in the United States and Europe announced new accommodative policy measures over the summer. The Federal Reserve (the “Fed”) extended Operation Twist in June, and in September it embarked on a new round of open-ended quantitative easing. Meanwhile, the head of the ECB reassured investors that his institution was committed to supporting the euro, and the ECB signaled its intention to purchase massive amounts of debt from troubled members of the European Union. In China, a new government was widely expected to adopt more stimulative monetary and fiscal policies. Even Japan, which has been mired in economic weakness for years, looked forward to new economic policies from new government leadership. Consequently, higher yielding bonds rallied over the second half of 2012.
High yield bonds led the U.S. bond market’s advance in 2012, as they benefited from income-oriented investors’ willingness to reach for higher yields in a low interest rate environment, issuers continued to report strong earnings, and default rates remained low. U.S. government securities also fared well when the Fed’s aggressively accommodative policies drove interest rates lower. However, residential mortgage-backed securities generally lagged broader U.S. market averages when prepayment risks increased. In contrast, commercial mortgage-backed securities and asset-backed securities continued to respond well to robust investor demand and improving business conditions.
In international markets, sovereign bonds from the emerging markets rebounded as economic concerns eased in China, Brazil and elsewhere, and an improved economic outlook buoyed corporate bonds in markets such as Russia and China. With a few exceptions, currency investments generally produced flat to negative returns for U.S. residents.
Fund Review
The Fund’s strong performance in 2012 was driven, in part, by our asset allocation strategy, which emphasized U.S. dollar-denominated bonds from the emerging markets, U.S. high yield securities, mortgage-backed securities, and senior floating-rate bank loans. All of these tilts, with the notable exception of bank loans, supported the Fund’s results.
Our security selection strategies also produced positive results. Among high yield bonds, the Fund benefited from our focus on securities with credit ratings in the middle of the below-investment-grade range. The Fund scored particular success with high yield bonds from the housing, telecommunications and transportation industries, but bonds from the diversified media and utility industries fared less well.
In the high-grade portfolio, our selections among AAA-rated residential mortgage-backed securities from U.S. government agencies boosted relative returns, as did lower rated, non-agency mortgages. Commercial mortgage-backed securities, including those with ratings toward the bottom of the investment-grade spectrum, produced especially strong results when commercial real estate prices stabilized during the year. However, senior floating rate loans trailed market averages.
| | | | |
| 3 | | | | OPPENHEIMER GLOBAL STRATEGIC INCOME FUND/VA |
FUND PERFORMANCE DISCUSSION
The Fund’s relative value-oriented approach to security selection in international bond markets also proved beneficial. We generally positioned the Fund to participate in gains stemming from falling interest rates, and we de-emphasized currency-related strategies. In developed bond markets, we focused on some of the more fiscally healthy nations, such as Australia, Canada and the United Kingdom, and we generally avoided more troubled countries, including Portugal, Greece and Spain. In the emerging markets, we increased the Fund’s exposure to corporate bonds issued by multinational companies, including those with investment-grade and high yield credit ratings. Positions in the sovereign bonds of Mexico and Turkey also helped bolster the Fund’s returns.
Our interest-rate strategies produced more mixed results, as we maintained the Fund’s average duration in a range we considered modestly shorter than market averages. This position was designed to protect the Fund from the risk of rising interest rates. We also purchased call options on U.S. Treasury securities as a hedge against potentially adverse interest rate movements.
Outlook
We have been encouraged by improving fundamentals in domestic and international economies, and we believe that massive and coordinated stimulus programs from central banks worldwide are likely to support credit markets in 2013. However, we are watchful for signs that coordinated central bank policies may spark an acceleration of inflation, as we already are seeing greater inflationary pressures in countries such as Brazil.
In light of these factors, we have maintained a generally constructive investment posture, including an emphasis on markets where, in our judgment, relative values remain attractive. We have retained underweight exposure to foreign currencies, and we have kept the Fund’s average duration in the short to neutral range as interest rates appear more likely to stay near current levels or rise from current levels than to decline.
Investors should consider the Fund’s investment objective, risks, charges and expenses carefully before investing. The Fund’s prospectus and summary prospectus contain this and other information about the Fund, and may be obtained by asking your financial advisor or calling us at 1.800.988.8287. Read prospectuses and summary prospectuses carefully before investing.
Total returns include changes in share price and reinvestment of dividends and capital gains distributions in a hypothetical investment for the periods shown.
The Fund’s investment strategy and focus can change over time. The mention of specific fund holdings does not constitute a recommendation by OppenheimerFunds, Inc. or its affiliates.
Shares of Oppenheimer funds are not deposits or obligations of any bank, are not guaranteed by any bank, are not insured by the FDIC or any other agency, and involve investment risks, including the possible loss of the principal amount invested.
Comparing the Fund’s Performance to the Market. The graphs that follow show the performance of a hypothetical $10,000 investment in each share class of the Fund held until December 31, 2012. Performance is measured over a ten-fiscal-year period for both Classes. Performance information does not reflect charges that apply to separate accounts investing in the Fund. If these charges were taken into account, performance would be lower. The graphs assume that all dividends and capital gains distributions were reinvested in additional shares.
The Fund’s performance is compared to the performance of the Barclays Capital U.S. Aggregate Bond Index, an index of U.S. corporate and government bonds, and to the Citigroup World Government Bond Index, an index of debt securities of major foreign governments. The indices are unmanaged and cannot be purchased directly by investors. Index performance is shown for illustrative purposes only and does not predict or depict the performance of the Fund. While index comparisons may be useful to provide a benchmark for the Fund’s performance, it must be noted that the Fund’s investments are not limited to the investments comprising the indices.
| | | | |
| 4 | | | | OPPENHEIMER GLOBAL STRATEGIC INCOME FUND/VA |
FUND PERFORMANCE DISCUSSION
Non-Service Shares
Comparison of Change in Value of $10,000 Hypothetical Investments in:
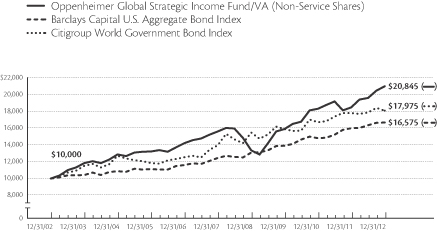
Average Annual Total Returns of Non-Service Shares of the Fund at 12/31/12
1-Year 13.53% 5-Year 6.06% 10-Year 7.62%
Service Shares
Comparison of Change in Value of $10,000 Hypothetical Investments in:
Average Annual Total Returns of Service Shares of the Fund at 12/31/12
1-Year 13.15% 5-Year 5.77% 10-Year 7.31%
The performance data quoted represents past performance, which does not guarantee future results. The investment return and principal value of an investment in the Fund will fluctuate so that an investor’s shares, when redeemed, may be worth more or less than their original cost. Current performance may be lower or higher than the performance quoted. For performance data current to the most recent month end, call us at 1.800.988.8287. The Fund’s total returns should not be expected to be the same as the returns of other funds, whether or not both funds have the same portfolio managers and/or similar names. The Fund’s total returns include changes in share price and reinvested distributions but do not include the charges associated with the separate account products that offer this Fund. Such performance would have been lower if such charges were taken into account.
| | | | |
| 5 | | | | OPPENHEIMER GLOBAL STRATEGIC INCOME FUND/VA |
FUND EXPENSES
Fund Expenses. As a shareholder of the Fund, you incur two types of costs: (1) transaction costs and (2) ongoing costs, including management fees; distribution and service fees; and other Fund expenses. These examples are intended to help you understand your ongoing costs (in dollars) of investing in the Fund and to compare these costs with the ongoing costs of investing in other mutual funds.
The examples are based on an investment of $1,000.00 invested at the beginning of the period and held for the entire 6-month period ended December 31, 2012.
Actual Expenses. The first section of the table provides information about actual account values and actual expenses. You may use the information in this section for the class of shares you hold, together with the amount you invested, to estimate the expense that you paid over the period. Simply divide your account value by $1,000.00 (for example, an $8,600.00 account value divided by $1,000.00 = 8.60), then multiply the result by the number in the first section under the heading entitled “Expenses Paid During Period” to estimate the expenses you paid on your account during this period.
Hypothetical Example for Comparison Purposes. The second section of the table provides information about hypothetical account values and hypothetical expenses based on the Fund’s actual expense ratio for each class of shares, and an assumed rate of return of 5% per year for each class before expenses, which is not the actual return. The hypothetical account values and expenses may not be used to estimate the actual ending account balance or expenses you paid for the period. You may use this information to compare the ongoing costs of investing in the Fund and other funds. To do so, compare this 5% hypothetical example for the class of shares you hold with the 5% hypothetical examples that appear in the shareholder reports of the other funds.
Please note that the expenses shown in the table are meant to highlight your ongoing costs only and do not reflect any charges associated with the separate accounts that offer this Fund. Therefore, the “hypothetical” lines of the table are useful in comparing ongoing costs only, and will not help you determine the relative total costs of owning different funds. In addition, if these separate account charges were included your costs would have been higher.
| | | | | | | | | | | | |
| Actual | | Beginning
Account
Value
July 1, 2012 | | | Ending
Account
Value
December 31, 2012 | | | Expenses
Paid During
6 Months Ended
December 31, 2012 | |
| Non-Service Shares | | $ | 1,000.00 | | | $ | 1,069.80 | | | $ | 3.80 | |
| Service Shares | | | 1,000.00 | | | | 1,068.30 | | | | 5.11 | |
| | | |
Hypothetical
(5% return before expenses) | | | | | | | | | |
| Non-Service Shares | | | 1,000.00 | | | | 1,021.47 | | | | 3.72 | |
| Service Shares | | | 1,000.00 | | | | 1,020.21 | | | | 4.99 | |
Expenses are equal to the Fund’s annualized expense ratio for that class, multiplied by the average account value over the period, multiplied by 184/366 (to reflect the one-half year period). Those annualized expense ratios, excluding indirect expenses from affiliated funds, based on the 6-month period ended December 31, 2012 are as follows:
| | | | |
| Class | | Expense Ratios | |
| Non-Service shares | | | 0.73 | % |
| Service shares | | | 0.98 | |
The expense ratios reflect voluntary waivers and/or reimbursements of expenses by the Fund’s Manager. Some of these undertakings may be modified or terminated at any time, as indicated in the Fund’s prospectus. The “Financial Highlights” tables in the Fund’s financial statements, included in this report, also show the gross expense ratios, without such waivers or reimbursements and reduction to custodian expenses, if applicable.
| | | | |
| 6 | | | | OPPENHEIMER GLOBAL STRATEGIC INCOME FUND/VA |
STATEMENT OF INVESTMENTS December 31, 2012
| | | | | | | | |
| | |
Shares | | | Value | |
| | | | | | | | | |
| Wholly-Owned Subsidiary—0.1% | | | | | |
| Oppenheimer Global Strategic Income Fund/VA (Cayman) Ltd.1,2 (Cost $1,500,000) | | | 15,000 | | | $ | 1,434,967 | |
| | |
| | | Principal
Amount | | | | |
| | | | | | | | | |
| Asset-Backed Securities—2.8% | | | | | |
Ally Auto Receviables Trust, Automobile Receivables Nts.:
Series 2012-2, Cl. C, 2.26%, 7/16/183 | | $ | 865,000 | | | | 876,854 | |
| Series 2012-A, Cl. D, 3.15%, 10/15/183 | | | 2,125,000 | | | | 2,188,250 | |
| Ally Master Owner Trust, Automobile Receivable Nts., Series 2012-3, Cl. D, 2.559%, 7/15/174 | | | 1,200,000 | | | | 1,200,871 | |
American Credit Acceptance Receivables Trust 2012-3, Automobile Receivable Nts.:
Series 2012-3, Cl. A, 1.64%, 11/15/163 | | | 250,000 | | | | 250,124 | |
| Series 2012-3, Cl. C, 2.78%, 9/17/183 | | | 125,000 | | | | 125,062 | |
AmeriCredit Automobile Receivables Trust 2012-1, Automobile Receivables-Backed Nts.:
Series 2012-1, Cl. C, 2.67%, 1/8/18 | | | 150,000 | | | | 154,314 | |
| Series 2012-1, Cl. D, 4.72%, 3/8/18 | | | 8,055,000 | | | | 8,690,310 | |
| AmeriCredit Automobile Receivables Trust 2012-3, Automobile Receivables-Backed Nts., Series 2012-3, Cl. D, 3.03%, 7/9/18 | | | 2,625,000 | | | | 2,688,559 | |
| AmeriCredit Automobile Receivables Trust 2012-4, Automobile Receivables-Backed Nts., Series 2012-4, Cl. D, 2.68%, 10/9/18 | | | 1,190,000 | | | | 1,203,691 | |
| AmeriCredit Automobile Receivables Trust 2012-5, Automobile Receivables-Backed Nts., Series 2012-5, Cl. D, 2.35%, 12/10/18 | | | 500,000 | | | | 500,059 | |
| Bank of America Auto Trust 2012-1, Automobile Receivable Nts., Series 2012-1, Cl. D., 2.99%, 3/15/19 | | | 625,000 | | | | 638,735 | |
| CarMax Auto Owner Trust 2012-2, Automobile Receivables Nts., Series 2012-2, Cl. D, 3.02%, 11/15/18 | | | 1,200,000 | | | | 1,230,101 | |
| CPS Auto Trust, Automobile Receivable Nts., Series 2012-C, Cl. A, 1.82%, 12/16/193 | | | 228,111 | | | | 228,286 | |
Credit Acceptance Auto Loan Trust, Automobile Receivable Nts.:
Series 2012-2A, Cl. A, 1.52%, 3/15/203 | | | 200,000 | | | | 200,175 | |
| Series 2012-2A, Cl. B, 2.21%, 9/15/203 | | | 100,000 | | | | 101,168 | |
| DSC Floorplan Master Owner Trust, Automobile Receivable Nts., Series 2011-1, Cl. A, 3.91%, 3/15/16 | | | 520,000 | | | | 530,488 | |
| | | | | | | | |
| | | Principal
Amount | | | Value | |
| | | | | | | | | |
| Asset-Backed Securities Continued | | | | | |
| DT Auto Owner Trust 2010-1A, Automobile Receivable Nts., Series 2010-1A, Cl. D, 5.92%, 9/15/163 | | $ | 415,000 | | | $ | 418,237 | |
| DT Auto Owner Trust 2012-2, Automobile Receivable Nts.: | | | | | | | | |
| Series 2012-2, Cl. C, 2.72%, 4/17/173 | | | 690,000 | | | | 691,844 | |
| Series 2012-2, Cl. D, 4.35%, 3/15/193 | | | 1,640,000 | | | | 1,664,716 | |
| Enterprise Fleet Financing LLC, Automobile Receivable Nts., Series 2012-2, Cl. A2, 0.72%, 11/20/173,4 | | | 80,000 | | | | 80,060 | |
| Exeter Automobile Receivables Trust, Automobile Receivable Nts.: | | | | | | | | |
| Series 2012-2A, Cl. B, 2.22%, 12/15/173 | | | 875,000 | | | | 887,916 | |
| Series 2012-2A, Cl. C, 3.06%, 7/15/183 | | | 1,035,000 | | | | 1,052,041 | |
| Ice 1 Em CLO Ltd./Ice 1 Em CLO Corp., Sr. Sec. Sub. Term Nts.: | | | | | | | | |
| Series 2007-1A, Cl. B, 2.419%, 8/15/224,5 | | | 7,870,000 | | | | 5,981,200 | |
| Series 2007-1A, Cl. C, 3.719%, 8/15/224,5 | | | 5,270,000 | | | | 3,899,800 | |
| Series 2007-1A, Cl. D, 5.719%, 8/15/224,5 | | | 5,270,000 | | | | 3,952,500 | |
| Santander Drive Auto Receivables Trust 2011-1, Automobile Receivables Nts., Series 2011-1, Cl. D, 4.01%, 2/15/17 | | | 2,590,000 | | | | 2,706,819 | |
| Santander Drive Auto Receivables Trust 2011-S1A, Automobile Receivables Nts., Series 2011-S1A, Cl. D, 3.10%, 5/15/173 | | | 123,306 | | | | 123,673 | |
| Santander Drive Auto Receivables Trust 2012-2, Automobile Receivables Nts., Series 2012-2, Cl. D, 3.87%, 2/15/18 | | | 545,000 | | | | 571,941 | |
| Santander Drive Auto Receivables Trust 2012-3, Automobile Receivables Nts.: | | | | | | | | |
| Series 2012-3, Cl. C, 3.01%, 4/16/18 | | | 5,830,000 | | | | 6,015,799 | |
| Series 2012-3, Cl. D, 3.64%, 5/15/18 | | | 6,890,000 | | | | 7,165,407 | |
| Santander Drive Auto Receivables Trust 2012-4, Automobile Receivables Nts., Series 2012-4, Cl. D, 3.50%, 6/15/18 | | | 3,510,000 | | | | 3,654,094 | |
| Santander Drive Auto Receivables Trust 2012-5, Automobile Receivables Nts.: | | | | | | | | |
| Series 2012-5, Cl. C, 2.70%, 8/15/18 | | | 2,725,000 | | | | 2,818,094 | |
| Series 2012-5, Cl. D, 3.30%, 9/17/18 | | | 2,935,000 | | | | 3,026,505 | |
| Santander Drive Auto Receivables Trust 2012-6, Automobile Receivables Nts., Series 2012-6, Cl. D, 2.52%, 10/15/18 | | | 295,000 | | | | 295,108 | |
| | | | |
| 7 | | | | OPPENHEIMER GLOBAL STRATEGIC INCOME FUND/VA |
STATEMENT OF INVESTMENTS Continued
| | | | | | | | |
| | | Principal
Amount | | | Value | |
| | | | | | | | | |
| Asset-Backed Securities Continued | | | | | |
SLM Student Loan Trust, Student Loan Receivables, Series 2005-B, Cl. B,
0.708%, 6/15/394 | | $ | 2,487,000 | | | $ | 1,622,807 | |
| SNAAC Auto Receivables Trust, Automobile Receivable Nts.: | | | | | | | | |
| Series 2012-1A, Cl. B, 3.11%, 6/15/173 | | | 525,000 | | | | 527,930 | |
| Series 2012-1A, Cl. C, 4.38%, 6/15/173 | | | 545,000 | | | | 548,448 | |
| United Auto Credit Securitization Trust 2012-1, Automobile Receivables Nts.: | | | | | | | | |
| Series 2012-1, Cl. A2, 1.10%, 3/16/15 | | | 195,000 | | | | 195,098 | |
| Series 2012-1, Cl. B, 1.87%, 9/15/15 | | | 335,000 | | | | 335,281 | |
| Series 2012-1, Cl. C, 2.52%, 3/15/16 | | | 2,665,000 | | | | 2,667,153 | |
| Series 2012-1, Cl. D, 3.12%, 3/15/18 | | | 1,690,000 | | | | 1,691,681 | |
| | | | | | |
|
|
|
Total Asset-Backed Securities
(Cost $75,670,030) | | | | | | | 73,401,199 | |
| Corporate Loans—1.4% | | | | | | | | |
| Affinion Group, Inc., Sr. Sec. Credit Facilities 1st Lien Term Loan, Tranche B, 5%, 10/9/164 | | | 1,132,102 | | | | 1,038,501 | |
| ATP Oil & Gas Corp., Sr. Sec. Credit Facilities 1st Lien Term Loan, Debtor in Possession, Tranche NM, 4.25%, 2/23/144,6 | | | 49,804 | | | | 48,435 | |
| ATP Oil & Gas Corp., Sr. Sec. Credit Facilities 1st Lien Term Loan, Debtor in Possession, Delayed Draw, 10%, 3/3/144,6 | | | 746,677 | | | | 636,169 | |
| ATP Oil & Gas Corp., Sr. Sec. Credit Facilities 1st Lien Term Loan, Debtor in Possession, 4.25%-10%, 2/23/144,6 | | | 436,540 | | | | 371,932 | |
| Autoparts Holdings Ltd., Sr. Sec. Credit Facilities 1st Lien Term Loan, 6.50%, 7/29/174 | | | 1,050,000 | | | | 1,053,281 | |
BJ’S Wholesale Club, Inc., Sr. Sec. Credit Facilities 2nd Lien Term Loan,
9.75%, 3/29/194 | | | 895,000 | | | | 925,206 | |
Brock Holdings III, Inc., Sr. Sec. Credit Facilities 2nd Lien Term Loan,
10%, 3/16/184 | | | 775,000 | | | | 780,813 | |
| Chesapeake Energy Corp., Sr. Sec. Credit Facilities Term Loan, Tranche B, 5.75%, 12/2/174 | | | 1,130,000 | | | | 1,133,609 | |
| Clear Channel Communications, Inc., Sr. Sec. Credit Facilities 1st Lien Term Loan, Tranche B, 3.862%, 1/29/164 | | | 4,065,019 | | | | 3,379,047 | |
| Crestwood Holdings LLC, Sr. Sec. Credit Facilities1st Lien Term Loan, Tranche B, 9.75%, 3/26/184 | | | 1,231,673 | | | | 1,252,201 | |
| Deltek, Inc., Sr. Sec. Credit Facilities 2nd Lien Term Loan, 10%, 10/10/194 | | | 460,000 | | | | 467,858 | |
| | | | | | | | |
| | | Principal
Amount | | | Value | |
| | | | | | | | | |
| Corporate Loans Continued | | | | | |
| Entegra Holdings LLC, Sr. Sec. Credit Facilities 3rd Lien Term Loan, Tranche B, 3.743%, 10/19/154,6,7 | | $ | 6,943,099 | | | $ | 3,876,561 | |
| Hallertau SPC, Sr. Sec. Credit Facilities Term Loan, 7.94%, 9/17/138 | | | 12,143,750 | | | | 4,212,575 | |
| iStar Financial, Inc., Sr. Sec. Credit Facilities 1st Lien Term Loan, Tranche A2, 7%, 3/19/174 | | | 2,575,000 | | | | 2,700,531 | |
| Lonestar Intermediate Super Holdings LLC, Sr. Sec. Credit Facilities Term Loan, 11%, 9/2/194 | | | 1,555,000 | | | | 1,654,131 | |
Navistar, Inc., Sr. Sec. Credit Facilities 1st Lien Term Loan, Tranche B,
7%, 8/17/174 | | | 645,000 | | | | 649,838 | |
NTELOS, Inc., Sr. Sec. Credit Facilities 1st Lien Term Loan, Tranche B,
5.75%, 10/11/194,6 | | | 1,223,375 | | | | 1,178,969 | |
| Nuveen Investments, Inc., Sr. Sec. Credit Facilities 2nd Lien Term Loan, 8.25%, 2/28/194 | | | 2,915,000 | | | | 2,973,300 | |
| OneLink Communications/San Juan Cable LLC, Sr. Sec. Credit Facilities 2nd Lien Term Loan, 10%, 6/9/184,6 | | | 1,885,000 | | | | 1,920,344 | |
Revel Entertainment LLC, Sr. Sec. Credit Facilities 1st Lien Term Loan:
9%, 2/17/174 | | | 2,187,626 | | | | 1,139,173 | |
| 9%, 2/17/174,6 | | | 101,750 | | | | 52,985 | |
| Springleaf Financial Funding Co., Sr. Sec. Credit Facilities 1st Lien Term Loan, 5.50%, 5/10/174 | | | 1,390,000 | | | | 1,384,354 | |
| SUPERVALU, Inc., Sr. Sec. Credit Facilities 1st Lien Term Loan, Tranche B, 8%, 8/30/184 | | | 2,596,950 | | | | 2,641,969 | |
TransFirst Holdings, Inc., Sr. Sec. Credit Facilities 2nd Lien Term Loan,
11%, 12/20/184,6 | | | 30,000 | | | | 29,700 | |
| | | | | | |
|
|
|
Total Corporate Loans
(Cost $36,818,116) | | | | | | | 35,501,482 | |
| Mortgage-Backed Obligations—34.0% | |
| Government Agency—21.6% | | | | | |
| FHLMC/FNMA/FHLB/Sponsored—21.3% | |
Federal Home Loan Mortgage Corp.:
3.50%, 1/1/436 | | | 36,335,000 | | | | 38,648,518 | |
| 5%, 9/15/33 | | | 1,029,265 | | | | 1,118,005 | |
| 5.50%, 9/1/39 | | | 1,099,263 | | | | 1,200,119 | |
| 6%, 5/15/18-11/15/21 | | | 329,346 | | | | 356,257 | |
| 6.50%, 3/15/18-8/15/32 | | | 1,261,752 | | | | 1,431,947 | |
| 7%, 10/1/31-10/1/37 | | | 297,193 | | | | 346,337 | |
| 7.50%, 1/1/32 | | | 583,063 | | | | 712,341 | |
| | | | |
| 8 | | | | OPPENHEIMER GLOBAL STRATEGIC INCOME FUND/VA |
| | | | | | | | |
| | | Principal
Amount | | | Value | |
| | | | | | | | | |
| FHLMC/FNMA/FHLB/Sponsored Continued | |
Federal Home Loan Mortgage Corp., Gtd. Real Estate Mtg. Investment Conduit Multiclass
Pass-Through Certificates:
Series 1360, Cl. PZ, 7.50%, 9/15/22 | | $ | 655,496 | | | $ | 754,371 | |
| Series 151, Cl. F, 9%, 5/15/21 | | | 18,173 | | | | 20,856 | |
| Series 1674, Cl. Z, 6.75%, 2/15/24 | | | 508,767 | | | | 578,378 | |
| Series 1897, Cl. K, 7%, 9/15/26 | | | 1,217,495 | | | | 1,417,057 | |
Series 2006-11, Cl. PS,
23.798%, 3/25/364 | | | 310,211 | | | | 455,049 | |
| Series 2043, Cl. ZP, 6.50%, 4/15/28 | | | 472,544 | | | | 544,838 | |
| Series 2106, Cl. FG, 0.659%, 12/15/284 | | | 804,996 | | | | 813,003 | |
| Series 2122, Cl. F, 0.659%, 2/15/294 | | | 22,880 | | | | 23,109 | |
| Series 2148, Cl. ZA, 6%, 4/15/29 | | | 612,241 | | | | 691,154 | |
| Series 2195, Cl. LH, 6.50%, 10/15/29 | | | 355,607 | | | | 408,475 | |
| Series 2326, Cl. ZP, 6.50%, 6/15/31 | | | 46,837 | | | | 54,011 | |
| Series 2344, Cl. FP, 1.159%, 8/15/314 | | | 241,811 | | | | 248,073 | |
| Series 2368, Cl. PR, 6.50%, 10/15/31 | | | 187,237 | | | | 216,135 | |
| Series 2412, Cl. GF, 1.159%, 2/15/324 | | | 436,243 | | | | 447,531 | |
| Series 2449, Cl. FL, 0.759%, 1/15/324 | | | 294,394 | | | | 298,661 | |
| Series 2451, Cl. FD, 1.209%, 3/15/324 | | | 153,792 | | | | 158,018 | |
| Series 2453, Cl. BD, 6%, 5/15/17 | | | 57,571 | | | | 61,638 | |
| Series 2461, Cl. PZ, 6.50%, 6/15/32 | | | 713,733 | | | | 824,448 | |
| Series 2464, Cl. FI, 1.209%, 2/15/324 | | | 136,084 | | | | 139,293 | |
| Series 2470, Cl. AF, 1.209%, 3/15/324 | | | 263,869 | | | | 271,121 | |
| Series 2470, Cl. LF, 1.209%, 2/15/324 | | | 139,262 | | | | 142,547 | |
| Series 2471, Cl. FD, 1.209%, 3/15/324 | | | 200,368 | | | | 205,108 | |
| Series 2477, Cl. FZ, 0.759%, 6/15/314 | | | 556,779 | | | | 563,993 | |
| Series 2500, Cl. FD, 0.709%, 3/15/324 | | | 20,461 | | | | 20,712 | |
| Series 2517, Cl. GF, 1.209%, 2/15/324 | | | 121,081 | | | | 123,937 | |
| Series 2526, Cl. FE, 0.609%, 6/15/294 | | | 37,695 | | | | 37,993 | |
| Series 2551, Cl. FD, 0.609%, 1/15/334 | | | 16,797 | | | | 16,943 | |
| Series 2668, Cl. AZ, 4%, 9/1/18 | | | 111,561 | | | | 117,456 | |
| Series 2676, Cl. KY, 5%, 9/15/23 | | | 2,390,821 | | | | 2,624,603 | |
| Series 3025, Cl. SJ, 23.984%, 8/15/354 | | | 371,683 | | | | 553,520 | |
| Series 3465, Cl. HA, 4%, 7/1/17 | | | 70,759 | | | | 72,674 | |
| Series 3617, Cl. DC, 4%, 7/1/27 | | | 271,309 | | | | 277,499 | |
| Series 3676, Cl. DA, 4%, 4/1/22 | | | 41,255 | | | | 41,296 | |
| Series 3822, Cl. JA, 5%, 6/1/40 | | | 108,494 | | | | 113,190 | |
| Series 3848, Cl. WL, 4%, 4/1/40 | | | 661,154 | | | | 704,811 | |
| Series 3917, Cl. BA, 4%, 6/1/38 | | | 726,074 | | | | 768,681 | |
Federal Home Loan Mortgage Corp., Interest-Only Stripped Mtg.-Backed Security:
Series 192, Cl. IO, 11.616%, 2/1/289 | | | 16,369 | | | | 3,906 | |
| Series 205, Cl. IO, 14.771%, 9/1/299 | | | 97,301 | | | | 22,161 | |
| Series 2074, Cl. S, 56.884%, 7/17/289 | | | 25,271 | | | | 6,035 | |
| Series 2079, Cl. S, 67.017%, 7/17/289 | | | 44,069 | | | | 10,572 | |
| Series 2136, Cl. SG, 73.237%, 3/15/299 | | | 1,180,868 | | | | 268,743 | |
| Series 2399, Cl. SG, 66.075%, 12/15/269 | | | 656,596 | | | | 148,230 | |
| Series 243, Cl. 6, 11.769%, 12/15/329 | | | 248,636 | | | | 53,399 | |
| Series 2437, Cl. SB, 77.115%, 4/15/329 | | | 2,070,914 | | | | 503,266 | |
| Series 2526, Cl. SE, 39.285%, 6/15/299 | | | 47,325 | | | | 11,287 | |
| Series 2795, Cl. SH, 20.869%, 3/15/249 | | | 987,272 | | | | 155,958 | |
| Series 2802, Cl. AS, 57.972%, 4/15/339 | | | 145,781 | | | | 6,237 | |
| Series 2920, Cl. S, 64.71%, 1/15/359 | | | 446,076 | | | | 90,278 | |
| Series 2922, Cl. SE, 11.235%, 2/15/359 | | | 77,067 | | | | 18,089 | |
| | | | | | | | |
| | | Principal
Amount | | | Value | |
| | | | | | | | | |
| FHLMC/FNMA/FHLB/Sponsored Continued | |
| Federal Home Loan Mortgage Corp., Interest-Only Stripped Mtg.-Backed Security: Continued | | | | | | | | |
| Series 3201, Cl. SG, 9.837%, 8/15/369 | | $ | 396,333 | | | $ | 68,243 | |
| Series 3450, Cl. BI, 14.914%, 5/15/389 | | | 529,875 | | | | 80,711 | |
| Series 3606, Cl. SN, 9.09%, 12/15/399 | | | 158,044 | | | | 24,269 | |
| Series 3659, Cl. IE, 8.981%, 3/1/199 | | | 1,018,561 | | | | 88,070 | |
| Series 3662, Cl. SM, 27.282%, 10/15/329 | | | 379,997 | | | | 51,133 | |
| Series 3685, Cl. EI, 12.747%, 3/1/199 | | | 884,435 | | | | 66,589 | |
| Series 3736, Cl. SN, 8.071%, 10/15/409 | | | 853,179 | | | | 145,335 | |
| Federal Home Loan Mortgage Corp., Mtg.-Linked Global Debt Securities, 2.06%, 1/15/22 | | | 1,513,784 | | | | 1,554,233 | |
Federal National Mortgage Assn.:
2.50%, 1/1/286 | | | 256,885,000 | | | | 268,685,655 | |
| 2.833%, 10/1/364 | | | 3,617,802 | | | | 3,861,804 | |
| 3%, 1/1/28-1/1/436 | | | 15,120,000 | | | | 15,866,752 | |
| 3.50%, 1/1/28-1/1/436 | | | 120,410,000 | | | | 128,400,538 | |
| 4%, 9/1/18-10/1/18 | | | 1,412,580 | | | | 1,516,565 | |
| 4%, 1/1/436 | | | 11,195,000 | | | | 12,003,139 | |
| 4.50%, 1/1/28-1/1/436 | | | 15,870,000 | | | | 17,137,467 | |
| 5%, 2/25/18-7/25/33 | | | 4,355,336 | | | | 4,737,379 | |
| 5%, 1/1/436 | | | 490,000 | | | | 530,808 | |
| 5.50%, 4/25/21-5/1/36 | | | 1,042,783 | | | | 1,141,862 | |
| 6%, 10/25/16-1/25/19 | | | 289,338 | | | | 309,622 | |
| 6%, 1/1/436 | | | 4,305,000 | | | | 4,702,541 | |
| 6.50%, 4/25/17-1/1/34 | | | 1,668,387 | | | | 1,923,573 | |
| 7%, 11/1/17-6/25/34 | | | 1,857,030 | | | | 2,200,213 | |
| 7.50%, 2/25/27-3/25/33 | | | 2,100,279 | | | | 2,552,618 | |
| 8.50%, 7/1/32 | | | 2,393 | | | | 2,970 | |
Federal National Mortgage Assn., Gtd. Real Estate Mtg. Investment Conduit Multiclass
Pass-Through Certificates:
Trust 1999-54, Cl. LH, 6.50%, 11/25/29 | | | 324,630 | | | | 371,862 | |
| Trust 2001-51, Cl. OD, 6.50%, 10/25/31 | | | 188,145 | | | | 217,512 | |
| Trust 2001-69, Cl. PF, 1.21%, 12/25/314 | | | 301,564 | | | | 308,710 | |
| Trust 2001-80, Cl. ZB, 6%, 1/25/32 | | | 368,570 | | | | 416,557 | |
| Trust 2002-12, Cl. PG, 6%, 3/25/17 | | | 185,926 | | | | 199,879 | |
| Trust 2002-29, Cl. F, 1.21%, 4/25/324 | | | 141,502 | | | | 144,892 | |
| Trust 2002-60, Cl. FH, 1.21%, 8/25/324 | | | 295,143 | | | | 302,191 | |
| Trust 2002-64, Cl. FJ, 1.21%, 4/25/324 | | | 43,573 | | | | 44,617 | |
| Trust 2002-68, Cl. FH, 0.709%, 10/18/324 | | | 100,532 | | | | 101,677 | |
| Trust 2002-84, Cl. FB, 1.21%, 12/25/324 | | | 639,648 | | | | 655,028 | |
| Trust 2002-9, Cl. PC, 6%, 3/25/17 | | | 188,068 | | | | 200,841 | |
| Trust 2002-9, Cl. PR, 6%, 3/25/17 | | | 230,281 | | | | 245,470 | |
| Trust 2002-90, Cl. FH, 0.71%, 9/25/324 | | | 357,884 | | | | 362,050 | |
| | | | |
| 9 | | | | OPPENHEIMER GLOBAL STRATEGIC INCOME FUND/VA |
STATEMENT OF INVESTMENTS Continued
| | | | | | | | |
| | | Principal
Amount | | | Value | |
| | | | | | | | | |
| FHLMC/FNMA/FHLB/Sponsored Continued | |
| Federal National Mortgage Assn., Gtd. Real Estate Mtg. Investment Conduit Multiclass Pass-Through Certificates: Continued | | | | | | | | |
| Trust 2003-11, Cl. FA, 1.21%, 9/25/324 | | $ | 639,662 | | | $ | 655,044 | |
| Trust 2003-112, Cl. AN, 4%, 11/1/18 | | | 236,485 | | | | 249,084 | |
Trust 2003-116, Cl. FA,
0.61%, 11/25/334 | | | 55,973 | | | | 56,406 | |
| Trust 2003-119, Cl. FK, 0.71%, 5/25/184 | | | 1,407,345 | | | | 1,416,731 | |
| Trust 2004-101, Cl. BG, 5%, 1/25/20 | | | 835,197 | | | | 888,827 | |
Trust 2005-109, Cl. AH,
5.50%, 12/25/25 | | | 2,160,000 | | | | 2,437,029 | |
Trust 2005-25, Cl. PS,
27.237%, 4/25/354 | | | 416,993 | | | | 726,810 | |
| Trust 2005-31, Cl. PB, 5.50%, 4/25/35 | | | 560,000 | | | | 690,125 | |
| Trust 2005-71, Cl. DB, 4.50%, 8/25/25 | | | 410,898 | | | | 447,606 | |
Trust 2006-46, Cl. SW,
23.43%, 6/25/364 | | | 523,564 | | | | 765,084 | |
Trust 2007-109, Cl. NF,
0.76%, 12/25/374 | | | 593,945 | | | | 602,134 | |
| Trust 2007-42, Cl. A, 6%, 2/1/33 | | | 409,719 | | | | 420,681 | |
| Trust 2008-14, Cl. BA, 4.25%, 3/1/23 | | | 112,807 | | | | 119,590 | |
| Trust 2009-114, Cl. AC, 2.50%, 12/1/23 | | | 207,363 | | | | 213,029 | |
| Trust 2009-36, Cl. FA, 1.15%, 6/25/374 | | | 271,508 | | | | 275,705 | |
| Trust 2011-122, Cl. EA, 3%, 11/1/29 | | | 619,155 | | | | 633,035 | |
| Trust 2011-122, Cl. EC, 1.50%, 1/1/20 | | | 567,187 | | | | 575,304 | |
| Trust 2011-15, Cl. DA, 4%, 3/1/41 | | | 559,314 | | | | 599,934 | |
| Trust 2011-3, Cl. KA, 5%, 4/1/40 | | | 493,686 | | | | 539,980 | |
| Trust 2011-6, Cl. BA, 2.75%, 6/1/20 | | | 610,093 | | | | 634,428 | |
Federal National Mortgage Assn., Interest-Only Stripped Mtg.-Backed Security:
Trust 2001-61, Cl. SH,
31.132%, 11/18/319 | | | 163,913 | | | | 36,008 | |
Trust 2001-63, Cl. SD,
31.307%, 12/18/319 | | | 42,444 | | | | 8,885 | |
Trust 2001-68, Cl. SC,
21.587%, 11/25/319 | | | 27,222 | | | | 5,709 | |
| Trust 2001-78, Cl. JS, 3.929%, 8/25/419 | | | 436,364 | | | | 64,897 | |
| Trust 2001-81, Cl. S, 23.932%, 1/25/329 | | | 33,628 | | | | 8,024 | |
Trust 2002-28, Cl. SA,
38.174%, 4/25/329 | | | 23,742 | | | | 5,314 | |
Trust 2002-38, Cl. SO,
51.982%, 4/25/329 | | | 133,439 | | | | 29,655 | |
| Trust 2002-48, Cl. S, 32.837%, 7/25/329 | | | 36,319 | | | | 8,204 | |
Trust 2002-52, Cl. SL,
36.399%, 9/25/329 | | | 23,857 | | | | 5,504 | |
Trust 2002-56, Cl. SN,
34.699%, 7/25/329 | | | 49,907 | | | | 11,283 | |
Trust 2002-77, Cl. IS,
47.326%, 12/18/329 | | | 227,340 | | | | 54,248 | |
Trust 2002-77, Cl. SH,
38.892%, 12/18/329 | | | 51,142 | | | | 11,831 | |
Trust 2002-9, Cl. MS,
27.865%, 3/25/329 | | | 45,557 | | | | 10,317 | |
Trust 2003-13, Cl. IO,
13.318%, 3/25/339 | | | 419,169 | | | | 76,491 | |
| | | | | | | | |
| | | Principal
Amount | | | Value | |
| | | | | | | | | |
| FHLMC/FNMA/FHLB/Sponsored Continued | |
| Federal National Mortgage Assn., Interest-Only Stripped Mtg.-Backed Security: Continued | | | | | | | | |
| Trust 2003-26, Cl. DI, 9.984%, 4/25/339 | | $ | 307,488 | | | $ | 66,440 | |
Trust 2003-33, Cl. SP,
30.304%, 5/25/339 | | | 292,879 | | | | 48,435 | |
| Trust 2003-38, Cl. SA, 29.21%, 3/25/239 | | | 371,572 | | | | 36,022 | |
| Trust 2003-4, Cl. S, 29.634%, 2/25/339 | | | 86,264 | | | | 16,166 | |
Trust 2004-56, Cl. SE,
13.043%, 10/25/339 | | | 1,348,451 | | | | 226,922 | |
Trust 2005-12, Cl. SC,
14.162%, 3/25/359 | | | 39,162 | | | | 9,679 | |
Trust 2005-14, Cl. SE,
45.043%, 3/25/359 | | | 1,399,346 | | | | 219,549 | |
Trust 2005-40, Cl. SA,
52.732%, 5/25/359 | | | 1,158,501 | | | | 252,463 | |
Trust 2005-40, Cl. SB,
85.362%, 5/25/359 | | | 1,902,093 | | | | 439,877 | |
Trust 2005-5, Cl. SD,
11.674%, 1/25/359 | | | 79,863 | | | | 12,605 | |
Trust 2005-63, Cl. SA,
52.774%, 10/25/319 | | | 73,650 | | | | 13,534 | |
Trust 2005-71, Cl. SA,
60.281%, 8/25/259 | | | 256,811 | | | | 40,570 | |
Trust 2006-51, Cl. SA,
10.361%, 6/25/369 | | | 5,762,321 | | | | 883,863 | |
Trust 2006-90, Cl. SX,
99.999%, 9/25/369 | | | 1,326,474 | | | | 367,790 | |
| Trust 2007-75, Cl. BI, 7.66%, 8/25/379 | | | 1,956,822 | | | | 430,010 | |
| Trust 2007-77, Cl. SB, 0%, 12/25/319,10 | | | 40,505 | | | | 375 | |
Trust 2007-88, Cl. XI,
42.812%, 6/25/379 | | | 2,024,715 | | | | 313,556 | |
Trust 2008-46, Cl. EI,
17.096%, 6/25/389 | | | 547,114 | | | | 84,201 | |
Trust 2008-55, Cl. SA,
13.217%, 7/25/389 | | | 327,941 | | | | 47,806 | |
| Trust 2009-8, Cl. BS, 22.702%, 2/25/249 | | | 382,473 | | | | 38,920 | |
| Trust 2010-95, Cl. DI, 9.139%, 11/1/209 | | | 1,325,661 | | | | 100,286 | |
| Trust 2011-84, Cl. IG, 4.159%, 8/1/139 | | | 4,553,793 | | | | 49,198 | |
| Trust 214, Cl. 2, 43.309%, 3/1/239 | | | 285,952 | | | | 59,933 | |
| Trust 221, Cl. 2, 44.266%, 5/1/239 | | | 34,438 | | | | 7,265 | |
| Trust 254, Cl. 2, 35.738%, 1/1/249 | | | 561,702 | | | | 117,964 | |
| Trust 2682, Cl. TQ, 99.999%, 10/15/339 | | | 460,398 | | | | 96,034 | |
| Trust 2981, Cl. BS, 99.999%, 5/15/359 | | | 836,437 | | | | 187,759 | |
| Trust 301, Cl. 2, 1.355%, 4/1/299 | | | 115,865 | | | | 27,058 | |
| Trust 313, Cl. 2, 20.785%, 6/1/319 | | | 1,132,033 | | | | 204,989 | |
| Trust 319, Cl. 2, 0.488%, 2/1/329 | | | 545,072 | | | | 83,612 | |
| Trust 321, Cl. 2, 6.403%, 4/1/329 | | | 156,151 | | | | 24,349 | |
| Trust 324, Cl. 2, 0%, 7/1/329,10 | | | 160,062 | | | | 24,550 | |
| Trust 328, Cl. 2, 0%, 12/1/329,10 | | | 358,980 | | | | 65,652 | |
| Trust 331, Cl. 5, 0%, 2/1/339,10 | | | 607,047 | | | | 118,929 | |
| Trust 332, Cl. 2, 0%, 3/1/339,10 | | | 2,984,386 | | | | 509,272 | |
| Trust 334, Cl. 12, 0%, 2/1/339,10 | | | 521,083 | | | | 96,763 | |
| Trust 339, Cl. 15, 1.65%, 7/1/339 | | | 1,608,902 | | | | 295,666 | |
| Trust 345, Cl. 9, 0%, 1/1/349,10 | | | 501,932 | | | | 61,654 | |
| Trust 351, Cl. 10, 2.509%, 4/1/349 | | | 319,514 | | | | 44,666 | |
| Trust 351, Cl. 8, 0%, 4/1/349,10 | | | 534,618 | | | | 78,892 | |
| | | | |
| 10 | | | | OPPENHEIMER GLOBAL STRATEGIC INCOME FUND/VA |
| | | | | | | | |
| | | Principal
Amount | | | Value | |
| | | | | | | | | |
| FHLMC/FNMA/FHLB/Sponsored Continued | |
| Federal National Mortgage Assn., Interest-Only Stripped Mtg.-Backed Security: Continued | | | | | | | | |
| Trust 356, Cl. 10, 0%, 6/1/359,10 | | $ | 414,590 | | | $ | 58,530 | |
| Trust 356, Cl. 12, 0%, 2/1/359,10 | | | 203,396 | | | | 28,327 | |
| Trust 362, Cl. 13, 0%, 8/1/359,10 | | | 256,066 | | | | 38,495 | |
| | | | | | |
|
|
|
| | | | | | | | 550,356,804 | |
| GNMA/Guaranteed—0.1% | | | | | |
Government National Mortgage Assn.:
1.625%, 12/9/254 | | | 4,674 | | | | 4,824 | |
| 7%, 3/29/28-7/29/28 | | | 188,707 | | | | 225,290 | |
| 7.50%, 3/1/27 | | | 11,341 | | | | 12,327 | |
| 8%, 11/29/25-5/29/26 | | | 36,098 | | | | 36,557 | |
Government National Mortgage Assn., Gtd. Real Estate Mtg. Investment Conduit Pass-Through Certificates:
Series 1999-32, Cl. ZB, 8%, 9/16/29 | | | 800,041 | | | | 977,103 | |
| Series 2000-12, Cl. ZA, 8%, 2/16/30 | | | 1,807,335 | | | | 2,183,118 | |
Government National Mortgage Assn., Interest-Only Stripped Mtg.-Backed Security:
Series 1998-19, Cl. SB,
66.87%, 7/16/289 | | | 96,129 | | | | 24,079 | |
Series 1998-6, Cl. SA,
82.073%, 3/16/289 | | | 58,699 | | | | 14,422 | |
Series 2001-21, Cl. SB,
82.688%, 1/16/279 | | | 427,280 | | | | 84,154 | |
Series 2007-17, Cl. AI,
21.583%, 4/16/379 | | | 516,400 | | | | 129,817 | |
Series 2010-111, Cl. GI,
40.376%, 9/1/139 | | | 9,505,423 | | | | 111,869 | |
Series 2011-52, Cl. HS,
11.748%, 4/16/419 | | | 858,249 | | | | 239,741 | |
| | | | | | |
|
|
|
| | | | | | | | 4,043,301 | |
| Other Agency—0.2% | | | | | | | | |
NCUA Guaranteed Notes Trust 2010-C1, Gtd. Nts.:
Series 2010-C1, Cl. A1,
1.60%, 10/29/20 | | | 441,624 | | | | 449,663 | |
Series 2010-C1, Cl. A2,
2.90%, 10/29/20 | | | 1,015,000 | | | | 1,085,876 | |
Series 2010-C1, Cl. APT,
2.65%, 10/29/20 | | | 1,113,533 | | | | 1,178,934 | |
| NCUA Guaranteed Notes Trust 2010-R1, Gtd. Nts., Series 2010-R1, Cl. 1A, 0.663%, 10/7/204 | | | 829,612 | | | | 832,723 | |
| NCUA Guaranteed Notes Trust 2010-R3, Gtd. Nts., Series 2010-R3, Cl. 3A, 2.40%, 12/8/20 | | | 704,629 | | |
| 731,603
|
|
| | | | | | | | 4,278,799 | |
| | | | | | | | |
| | | Principal
Amount | | | Value | |
| | | | | | | | | |
| Non-Agency—12.4% | | | | | | | | |
| Commercial—7.8% | | | | | | | | |
Banc of America Commercial Mortgage Trust 2006-1, Commercial Mtg. Pass-Through Certificates,
Series 2006-1, Cl. AJ, 5.46%, 9/1/45 | | $ | 2,200,000 | | | $ | 2,310,888 | |
Banc of America Commercial Mortgage Trust 2006-3, Commercial Mtg. Pass-Through Certificates,
Series 2006-3, Cl. AM,
5.857%, 7/10/444 | | | 4,242,000 | | | | 4,380,817 | |
Banc of America Commercial Mortgage Trust 2006-5, Commercial Mtg. Pass-Through Certificates,
Series 2006-5, Cl. AM,
5.448%, 9/1/47 | | | 6,055,000 | | | | 6,481,884 | |
Banc of America Commercial Mortgage Trust 2007-1, Commercial Mtg. Pass-Through Certificates,
Series 2007-1, Cl. AMFX,
5.482%, 1/1/49 | | | 6,734,386 | | | | 7,293,333 | |
Banc of America Commercial Mortgage Trust 2007-5, Commercial Mtg. Pass-Through Certificates,
Series 2007-5, Cl. AM,
5.772%, 2/1/51 | | | 8,090,000 | | | | 9,066,293 | |
Banc of America Commercial Mortgage, Inc., Commercial Mtg. Pass-Through Certificates,
Series 2008-1, Cl. AM,
6.248%, 2/10/514 | | | 3,415,000 | | | | 3,921,820 | |
BCAP LLC Trust, Mtg. Pass-Through Certificates:
Series 2012-RR2, Cl. 6A3,
3.114%, 9/1/353,4 | | | 843,606 | | | | 854,766 | |
Series 2012-RR6, Cl. 1A5,
2.243%, 11/1/365 | | | 503,876 | | | | 501,705 | |
Bear Stearns ARM Trust 2007-4, Mtg. Pass-Through Certificates, Series 2007-4, Cl. 22A1,
5.434%, 6/1/474 | | | 858,529 | | | | 746,661 | |
| Bear Stearns Commercial Mortgage Securities Trust 2007-PWR17, Commercial Mtg. Pass-Through Certificates, Series 2007-PWR17, Cl. AM, 5.89%, 6/1/504 | | | 2,330,000 | | | | 2,654,444 | |
| Bear Stearns Commercial Mortgage Securities Trust 2006-PWR13, Commercial Mtg. Pass-Through Certificates, Series 2006-PWR13, Cl. AJ, 5.611%, 9/1/41 | | | 6,630,000 | | | | 6,481,982 | |
| Bear Stearns Commercial Mortgage Securities Trust 2007-PWR17, Commercial Mtg. Pass-Through Certificates, Series 2007-PWR17, Cl. AJ, 5.89%, 6/1/504 | | | 7,400,000 | | | | 6,203,587 | |
| | | | |
| 11 | | | | OPPENHEIMER GLOBAL STRATEGIC INCOME FUND/VA |
STATEMENT OF INVESTMENTS Continued
| | | | | | | | |
| | | Principal
Amount | | | Value | |
| | | | | | | | | |
| Commercial Continued | | | | | | | | |
| CHL Mortgage Pass-Through Trust 2005-17, Mtg. Pass-Through Certificates, Series 2005-17, Cl. 1A8, 5.50%, 9/1/35 | | $ | 2,546,745 | | | $ | 2,600,929 | |
| CHL Mortgage Pass-Through Trust 2005-HYB8, Mtg. Pass-Through Certificates, Series 2005-HYB8, Cl. 4A1, 4.713%, 12/20/354 | | | 143,934 | | | | 108,703 | |
CHL Mortgage Pass-Through Trust 2007-J3, Mtg. Pass-Through Certificates, Series 2007-J3, Cl. A9,
6%, 7/1/37 | | | 6,822,642 | | | | 5,588,904 | |
| Citigroup Commercial Mortgage Trust 2008-C7, Commercial Mtg. Pass-Through Certificates, Series 2008-C7, Cl. AM, 6.06%, 12/1/494 | | | 4,270,000 | | | | 4,804,254 | |
| Citigroup Mortgage Loan Trust, Inc. 2012-8, Mtg. Pass-Through Certificates, Series 2012-8, Cl. 1A1, 2.661%, 10/1/353,4 | | | 1,102,291 | | | | 1,057,848 | |
| CSMC Mortgage-Backed Trust 2006-C1, Mtg. Pass-Through Certificates, Series 2006-C1, Cl. AJ, 5.409%, 2/1/394 | | | 9,025,000 | | | | 9,604,161 | |
| DBUBS Mortgage Trust, Commercial Mtg. Pass-Through Certificates, Series 2011-LC1, Cl. E, 5.557%, 11/1/463,4 | | | 2,515,000 | | | | 2,633,919 | |
Deutsche Alt-B Securities, Inc., Mtg. Pass-Through Certificates:
Series 2006-AB2, Cl. A1,
5.885%, 6/25/36 | | | 117,457 | | | | 87,686 | |
Series 2006-AB4, Cl. A1A,
6.005%, 10/25/36 | | | 568,609 | | | | 398,869 | |
Deutsche Mortgage & Asset Receiving, Commercial Mtg. Pass-Through Certificates, Interest-Only Stripped Mtg.-Backed Security:
Series 2010-C1, Cl. XPA,
5.007%, 9/1/203,9 | | | 5,147,637 | | | | 302,980 | |
Series 2012-CR5, Cl. XA,
3.239%, 12/1/459 | | | 3,580,000 | | | | 442,762 | |
| FDIC Trust, Commerical Mtg. Pass-Through Certificates, Series 2012-C1, Cl. A, 0.841%, 5/1/355 | | | 1,260,138 | | | | 1,263,641 | |
| First Horizon Alternative Mortgage Securities Trust 2007-FA2, Mtg. Pass-Through Certificates, Series 2007-FA2, Cl. 1A1, 5.50%, 4/25/37 | | | 1,440,139 | | | | 1,030,696 | |
| GMAC Commercial Mortgage Securities, Inc., Commercial Mtg. Pass-Through Certificates, Series 1998-C1, Cl. F, 6.894%, 5/15/304 | | | 615,900 | | | | 617,142 | |
| | | | | | | | |
| | | Principal
Amount | | | Value | |
| | | | | | | | | |
| Commercial Continued | | | | | | | | |
| Greenwich Capital Commercial Funding Corp./Commercial Mortgage Trust 2006-GG7, Commercial Mtg. Pass-Through Certificates, Series 2006-GG7, Cl. AJ, 5.867%, 7/10/384 | | $ | 6,150,000 | | | $ | 5,984,851 | |
Greenwich Capital Commercial Funding Corp./Commercial Mortgage Trust 2007-GG11, Commercial Mtg. Pass-Through Certificates:
Series 2007-GG11, Cl. A4,
5.736%, 12/1/49 | | | 1,060,000 | | | | 1,255,877 | |
Series 2007-GG11, Cl. AM,
5.867%, 12/1/49 | | | 5,550,000 | | | | 6,226,761 | |
Greenwich Capital Commercial Funding Corp./Commercial Mortgage Trust 2007-GG9, Commercial Mtg. Pass-Through Certificates, Series 2007-GG9, Cl. AM,
5.475%, 3/1/39 | | | 5,035,000 | | | | 5,498,963 | |
GS Mortgage Securities Corp. II, Commercial Mtg. Obligations,
Series 2011-GC3, Cl. D,
5.543%, 3/1/443,4 | | | 3,130,000 | | | | 3,164,834 | |
GSR Mortgage Loan Trust 2005-AR4, Mtg. Pass-Through Certificates,
Series 2005-AR4, Cl. 6A1,
5.25%, 7/1/35 | | | 61,394 | | | | 60,920 | |
IndyMac Index Mortgage Loan Trust 2005-AR23, Mtg. Pass-Through Certificates, Series 2005-AR23,
Cl. 6A1, 4.931%, 11/1/354 | | | 1,405,750 | | | | 1,113,051 | |
JPMorgan Chase Commercial Mortgage Securities Corp., Commercial Mtg. Pass-Through Certificates:
Series 2007-CB15, Cl. AJ,
5.502%, 6/1/47 | | | 8,281,000 | | | | 6,486,747 | |
Series 2007-CB18, Cl. AM,
5.466%, 6/1/47 | | | 6,400,000 | | | | 7,097,021 | |
JPMorgan Chase Commercial Mortgage Securities Trust 2006-CIBC16, Commercial Mtg. Pass-Through Certificates, Series 2006-CIBC16, Cl. AJ,
5.623%, 5/1/45 | | | 2,175,000 | | | | 1,955,246 | |
JPMorgan Chase Commercial Mortgage Securities Trust 2007-CB19, Commercial Mtg. Pass-Through Certificates,
Series 2007-CB19, Cl. AM,
5.728%, 2/1/494 | | | 5,850,000 | | | | 6,381,581 | |
| | | | |
| 12 | | | | OPPENHEIMER GLOBAL STRATEGIC INCOME FUND/VA |
| | | | | | | | |
| | | Principal
Amount | | | Value | |
| | | | | | | | | |
| Commercial Continued | | | | | | | | |
JPMorgan Chase Commercial Mortgage Securities Trust 2007-LDP11, Commercial Mtg. Pass-Through Certificates,
Series 2007-LDP11, Cl. ASB, 5.812%, 6/1/494 | | $ | 477,030 | | | $ | 521,780 | |
JPMorgan Mortgage Trust 2006-A7, Mtg. Pass-Through Certificates,
Series 2006-A7, Cl. 2A2,
2.904%, 1/1/374 | | | 269,627 | | | | 208,647 | |
JPMorgan, Re-Securitized Real Estate Mtg. Investment Conduit Multiclass Pass-Through Certificates,
Series 2009-5, Cl. 1A2, 2.614%, 7/1/363,4 | | | 5,313,214 | | | | 3,740,460 | |
| LB-UBS Commercial Mortgage Trust 2006-C3, Commercial Mtg. Pass-Through Certificates, Series 2006-C3, Cl. AJ, 5.72%, 3/11/39 | | | 1,325,000 | | | | 1,260,170 | |
LB-UBS Commercial Mortgage Trust 2007-C6, Commercial Mtg. Pass-Through Certificates,
Series 2007-C6, Cl. AM, 6.114%, 7/11/40 | | | 5,855,000 | | | | 6,654,213 | |
LB-UBS Commercial Mortgage Trust 2008-C1, Commercial Mtg. Pass-Through Certificates,
Series 2008-C1, Cl. AM,
6.157%, 4/11/414 | | | 2,610,000 | | | | 3,016,579 | |
| Lehman Structured Securities Corp., Mtg.-Backed Security, 6%, 5/1/29 | | | 52,415 | | | | 10,151 | |
Merrill Lynch Mortgage Trust 2006-C1, Commercial Mtg. Pass-Through Certificates,
Series 2006-C1, Cl. AJ,
5.684%, 5/1/394 | | | 6,125,000 | | | | 5,923,497 | |
ML-CFC Commercial Mortgage Trust 2006-3, Commercial Mtg. Pass-Through Certificates,
Series 2006-3, Cl. AJ, 5.485%, 7/1/46 | | | 5,820,000 | | | | 5,302,608 | |
Morgan Stanley Capital I Trust 2007-IQ15, Commercial Mtg. Pass-Through Certificates,
Series 2007-IQ15, Cl. AM,
5.882%, 6/1/494 | | | 5,875,000 | | | | 6,493,608 | |
Morgan Stanley Capital I Trust, Commercial Mtg. Pass-Through Certificates, Series 2006-HQ10,
Cl. AM, 5.36%, 11/1/41 | | | 8,500,000 | | | | 9,516,439 | |
Morgan Stanley, Re-Securitized Real Estate Mtg. Investment Conduit Multiclass Pass-Through Certificates,
Series 2012-R3, Cl. 1A,
2.298%, 11/1/364,5 | | | 48,951 | | | | 48,567 | |
| | | | | | | | |
| | | Principal
Amount | | | Value | |
| | | | | | | | | |
| Commercial Continued | | | | | | | | |
| RALI Series 2005-QA4 Trust, Mtg. Asset-Backed Pass-Through Certificates, Series 2005-QA4, Cl. A32, 3.48%, 4/25/354 | | $ | 109,766 | | | $ | 20,638 | |
| Residential Asset Securitization Trust 2006-A12, Mtg. Pass-Through Certificates, Series 2006-A12, Cl. 1A, 6.25%, 11/1/36 | | | 635,888 | | | | 481,122 | |
Sequoia Mortgage Trust, Mtg. Pass-Through Certificates,
Series 2012-2, Cl. A2, 3.50%, 3/1/42 | | | 428,932 | | | | 437,898 | |
STARM Mortgage Loan Trust 2007-1, Mtg. Pass-Through Certificates, Series 2007-1, Cl. 2A1,
5.808%, 2/1/374 | | | 7,933,710 | | | | 6,493,976 | |
| Structured Adjustable Rate Mortgage Loan Trust 2006-4, Commercial Mtg. Pass-Through Certificates, Series 2006-4, Cl. 6A, 5.333%, 5/1/364 | | | 2,286,309 | | | | 1,897,743 | |
| Structured Adjustable Rate Mortgage Loan Trust 2007-6, Mtg. Pass-Through Certificates, Series 2007-6, Cl. 3A1, 4.82%, 7/1/374 | | | 6,616,313 | | | | 5,120,464 | |
| UBS-Barclays Commercial Mortgage Trust 2012-C2, Commercial Mtg. Pass-Through Certificates, Series 2012-C2, Cl. E, 4.893%, 5/1/633,4 | | | 560,000 | | | | 507,476 | |
| Wachovia Bank Commercial Mortgage Trust 2006-C23, Commercial Mtg. Pass-Through Certificates, Series 2006-C23, Cl. AJ, 5.515%, 1/1/45 | | | 4,510,000 | | | | 4,734,217 | |
| Wachovia Bank Commercial Mortgage Trust 2006-C25, Commercial Mtg. Pass-Through Certificates, Series 2006-C25, Cl. AJ, 5.736%, 5/1/434 | | | 5,315,000 | | | | 5,413,915 | |
| WaMu Mortgage Pass-Through Certificates 2007-OA3 Trust, Mtg. Pass-Through Certificates, Series 2007-OA3, Cl. 5A, 2.288%, 4/1/474 | | | 704,578 | | | | 477,312 | |
| Wells Fargo Mortgage-Backed Securities 2004-W Trust, Mtg. Pass-Through Certificates, Series 2004-W, Cl. B2, 2.696%, 11/1/344 | | | 342,149 | | | | 10,164 | |
| Wells Fargo Mortgage-Backed Securities 2005-AR1 Trust, Mtg. Pass-Through Certificates, Series 2005-AR1, Cl. 1A1, 2.613%, 2/1/354 | | | 3,321,204 | | | | 3,308,250 | |
| | | | |
| 13 | | | | OPPENHEIMER GLOBAL STRATEGIC INCOME FUND/VA |
STATEMENT OF INVESTMENTS Continued
| | | | | | | | |
| | | Principal
Amount | | | Value | |
| | | | | | | | | |
| Commercial Continued | | | | | | | | |
| Wells Fargo Mortgage-Backed Securities 2007-AR3 Trust, Mtg. Pass-Through Certificates, Series 2007-AR3, Cl. A4, 5.716%, 4/1/374 | | $ | 1,908,151 | | | $ | 1,752,498 | |
| WFRBS Commercial Mortgage Trust 2011-C3, Interest-Only Commercial Mtg. Pass-Through Certificates, Series 2011-C3, Cl. XA, 11.401%, 3/1/449 | | | 6,008,406 | | |
| 491,500
|
|
| | | | | | | | 200,510,418 | |
| Multifamily—0.9% | | | | | | | | |
| Banc of America Commercial Mortgage, Inc., Commercial Mtg. Pass-Through Certificates, Series 2006-2, Cl. AJ, 5.762%, 5/1/454 | | | 4,295,000 | | | | 4,397,532 | |
| CHL Mortgage Pass-Through Trust 2006-20, Mtg. Pass-Through Certificates, Series 2006-20, Cl. 1A17, 5.75%, 2/1/37 | | | 2,376,015 | | | | 2,156,404 | |
Citigroup Mortgage Loan Trust, Inc. 2006-AR3, Mtg. Pass-Through Certificates, Series 2006-AR3,
Cl. 1A2A, 5.596%, 6/1/364 | | | 5,094,828 | | | | 4,740,661 | |
Countrywide Alternative Loan Trust 2006-24CB, Mtg. Pass-Through Certificates, Series 2006-24CB,
Cl. A12, 5.75%, 6/1/36 | | | 1,893,094 | | | | 1,535,379 | |
| JPMorgan Mortgage Trust 2007-A3, Mtg. Pass-Through Certificates, Series 2007-A3, Cl. 3A2M, 5.018%, 5/1/374 | | | 3,993,892 | | | | 3,836,589 | |
| Wells Fargo Mortgage-Backed Securities 2005-AR15 Trust, Mtg. Pass-Through Certificates, Series 2005-AR15, Cl. 1A2, 2.617%, 9/1/354 | | | 366,454 | | | | 357,829 | |
| Wells Fargo Mortgage-Backed Securities 2006-AR2 Trust, Mtg. Pass-Through Certificates, Series 2006-AR2, Cl. 2A3, 2.627%, 3/1/364 | | | 3,317,708 | | | | 3,239,354 | |
| Wells Fargo Mortgage-Backed Securities 2006-AR6 Trust, Mtg. Pass-Through Certificates, Series 2006-AR6, Cl. 3A1, 2.76%, 3/25/364 | | | 2,980,594 | | |
| 2,883,565
|
|
| | | | | | | | 23,147,313 | |
| Residential—3.7% | | | | | | | | |
| Argent Securities Trust 2004-W8, Asset-Backed Pass-Through Certificates, Series 2004-W8, Cl. A2, 1.17%, 5/25/344 | | | 897,561 | | | | 835,225 | |
Banc of America Commercial Mortgage, Inc., Commercial Mtg. Pass-Through Certificates:
Series 2007-1, Cl. 1A3, 6%, 1/1/37 | | | 2,081,695 | | | | 1,819,009 | |
| | | | | | | | |
| | | Principal
Amount | | | Value | |
| | | | | | | | | |
| Residential Continued | | | | | | | | |
| Banc of America Commercial Mortgage, Inc., Commercial Mtg. Pass-Through Certificates: Continued Series 2007-4, Cl. AM, 5.796%, 2/1/514 | | $ | 3,960,000 | | | $ | 4,470,947 | |
| Banc of America Funding 2007-C Trust, Mtg. Pass-Through Certificates, Series 2007-C, Cl. 1A4, 5.496%, 5/1/364 | | | 1,904,149 | | | | 1,868,882 | |
| Bear Stearns ARM Trust 2004-2, Mtg. Pass-Through Certificates, Series 2004-2, Cl. 12A2, 2.906%, 5/1/344 | | | 2,452,549 | | | | 2,385,725 | |
| CHL Mortgage Pass-Through Trust 2005-29, Mtg. Pass-Through Certificates, Series 2005-29, Cl. A1, 5.75%, 12/1/35 | | | 5,014,227 | | | | 4,653,463 | |
| CHL Mortgage Pass-Through Trust 2005-J4, Mtg. Pass-Through Certificates, Series 2005-J4, Cl. A7, 5.50%, 11/1/35 | | | 1,735,199 | | | | 1,823,498 | |
| CHL Mortgage Pass-Through Trust 2006-6, Mtg. Pass-Through Certificates, Series 2006-6, Cl. A3, 6%, 4/1/36 | | | 435,662 | | | | 402,957 | |
| CHL Mortgage Pass-Through Trust 2007-HY3, Mtg. Pass-Through Certificates, Series 2007-HY3, Cl. 1A1, 3.054%, 6/1/474 | | | 1,997,408 | | | | 1,703,798 | |
Citigroup Mortgage Loan Trust, Inc. 2005-2, Mtg. Pass-Through Certificates, Series 2005-2,
Cl. 1A3, 2.672%, 5/1/354 | | | 2,183,498 | | | | 2,142,292 | |
Citigroup Mortgage Loan Trust, Inc. 2005-3, Mtg. Pass-Through Certificates, Series 2005-3,
Cl. 2A4, 2.888%, 8/1/354 | | | 4,318,181 | | | | 3,440,351 | |
Citigroup, Inc./Deutsche Bank 2007-CD4 Commercial Mortgage Trust, Commercial Mtg. Pass-Through Certificates, Series 2007-CD4,
Cl. AMFX, 5.366%, 12/1/49 | | | 6,060,000 | | | | 6,506,676 | |
| Countrywide Alternative Loan Trust 2006-43CB, Mtg. Pass-Through Certificates, Series 2006-43CB, Cl.1A10, 6%, 2/1/37 | | | 8,535,489 | | | | 6,738,107 | |
| Countrywide Alternative Loan Trust 2007-19, Mtg. Pass-Through Certificates, Series 2007-19, Cl. 1A4, 6%, 8/1/37 | | | 2,360,333 | | | | 1,909,843 | |
Countrywide Home Loans,
Asset-Backed Certificates, Series 2005-16, Cl. 2AF2, 5.227%, 5/1/364 | | | 614,665 | | | | 574,332 | |
| | | | |
| 14 | | | | OPPENHEIMER GLOBAL STRATEGIC INCOME FUND/VA |
| | | | | | | | |
| | | Principal
Amount | | | Value | |
| | | | | | | | | |
| Residential Continued | | | | | | | | |
CSMC Mortgage-Backed Trust
2007-3, Mtg. Pass-Through Certificates, Series 2007-3, Cl. 2A10, 6%, 4/1/37 | | $ | 2,226,305 | | | $ | 1,929,768 | |
| CWABS Asset-Backed Certificates Trust 2006-25, Asset-Backed Certificates, Series 2006-25, Cl. 2A2, 0.33%, 6/25/474 | | | 2,039,567 | | | | 2,014,205 | |
| CWHEQ Revolving Home Equity Loan Trust, Asset-Backed Certificates: Series 2005-G, Cl. 2A, 0.439%, 12/15/354 | | | 147,619 | | | | 81,781 | |
Series 2006-H, Cl. 2A1A,
0.359%, 11/15/364 | | | 62,461 | | | | 27,716 | |
| GSR Mortgage Loan Trust 2006-5F, Mtg. Pass-Through Certificates, Series 2006-5F, Cl. 2A1, 6%, 6/1/36 | | | 619,783 | | | | 598,762 | |
| Home Equity Mortgage Trust 2005-1, Mtg. Pass-Through Certificates, Series 2005-1, Cl. M6, 5.863%, 6/1/35 | | | 1,046,000 | | | | 763,393 | |
| JPMorgan Alternative Loan Trust 2006-S4, Mtg. Pass-Through Certificates, Series 2006-S4, Cl. A6, 5.71%, 12/1/36 | | | 279,855 | | | | 264,762 | |
| LB-UBS Commercial Mortgage Trust 2007-C7, Commercial Mtg. Pass-Through Certificates, Series 2007-C7, Cl. AM, 6.185%, 9/11/454 | | | 10,430,000 | | | | 11,795,506 | |
Mastr Asset-Backed Securities Trust 2006-WMC3, Mtg. Pass-Through Certificates, Series 2006-WMC3,
Cl. A3, 0.31%, 8/25/364 | | | 1,131,922 | | | | 419,718 | |
Merrill Lynch Mortgage Investors Trust 2006-3, Mtg. Pass-Through Certificates, Series MLCC 2006-3,
Cl. 2A1, 2.677%, 10/25/364 | | | 1,487,698 | | | | 1,431,933 | |
| NC Finance Trust, Collateralized Mtg. Obligation Pass-Through Certificates, Series 1999-I, Cl. ECFD, 3.405%, 1/25/295,8 | | | 66,744 | | | | 5,340 | |
| Popular ABS Mortgage Pass-Through Trust 2005-6, Mtg. Pass-Through Certificates, Series 2005-6, Cl. A3, 5.504%, 1/1/364 | | | 168,024 | | | | 150,768 | |
RALI Series 2006-QS13 Trust, Mtg. Asset-Backed Pass-Through Certificates:
Series 2006-QS13, Cl. 1A5, 6%, 9/25/36 | | | 1,658,091 | | | | 1,237,248 | |
| Series 2006-QS13, Cl. 1A8, 6%, 9/25/36 | | | 33,143 | | | | 24,731 | |
| RALI Series 2007-QS6 Trust, Mtg. Asset-Backed Pass-Through Certificates, Series 2007-QS6, Cl. A28, 5.75%, 4/25/37 | | | 804,959 | | | | 603,730 | |
| | | | | | | | |
| | | Principal
Amount | | | Value | |
| | | | | | | | | |
| Residential Continued | | | | | | | | |
| Residential Asset Securitization Trust 2005-A14, Mtg. Pass-Through Certificates, Series 2005-A14, Cl. A1, 5.50%, 12/1/35 | | $ | 3,225,958 | | | $ | 2,841,190 | |
Residential Asset Securitization Trust 2005-A15, Mtg. Pass-Through Certificates, Series 2005-A15,
Cl. 1A4, 5.75%, 2/1/36 | | | 3,558,247 | | | | 3,202,166 | |
| Residential Asset Securitization Trust 2005-A6CB, Mtg. Pass-Through Certificates, Series 2005-A6CB, Cl. A7, 6%, 6/1/35 | | | 4,117,929 | | | | 4,095,563 | |
Terwin Mortgage Trust, Home Equity Asset-Backed Securities, Series 2006-4SL, Cl. A1,
2.601%, 5/1/373,4,11 | | | 160,197 | | | | 73,378 | |
| WaMu Mortgage Pass-Through Certificates 2005-AR12 Trust, Mtg. Pass-Through Certificates, Series 2007-AR12, Cl. 1A8, 2.472%, 10/1/354 | | | 2,123,364 | | | | 1,979,286 | |
| WaMu Mortgage Pass-Through Certificates 2006-AR10 Trust, Mtg. Pass-Through Certificates, Series 2006-AR10, Cl. 1A2, 2.697%, 9/1/364 | | | 830,000 | | | | 673,055 | |
WaMu Mortgage Pass-Through Certificates 2007-HY1 Trust, Mtg. Pass-Through Certificates:
Series 2007-HY1, Cl. 4A1,
2.685%, 2/1/374 | | | 12,235,046 | | | | 9,820,484 | |
Series 2007-HY1, Cl. 5A1,
4.711%, 2/1/374 | | | 7,402,375 | | | | 6,056,175 | |
| WaMu Mortgage Pass-Through Certificates 2007-HY5 Trust, Mtg. Pass-Through Certificates, Series 2007-HY5, Cl. 3A1, 5.147%, 5/1/374 | | | 893,249 | | | | 865,389 | |
| Wells Fargo Mortgage-Backed Securities 2005-9 Trust, Mtg. Pass-Through Certificates, Series 2005-9, Cl. 2A6, 5.25%, 10/25/35 | | | 355,061 | | | | 377,767 | |
| Wells Fargo Mortgage-Backed Securities 2006-AR14 Trust, Mtg. Pass-Through Certificates, Series 2006-AR14, Cl. 1A2, 5.632%, 10/1/364 | | | 2,942,478 | | | | 2,901,601 | |
| | | | | | |
|
|
|
| | | | | | | | 95,510,520 | |
| | | | | | |
|
|
|
| Total Mortgage-Backed Obligations (Cost $851,316,273) | | | | | | | 877,847,155 | |
| U.S. Government Obligations—4.2% | |
Federal Home Loan Mortgage Corp. Nts.:
0.75%, 1/12/18 | | | 5,149,000 | | | | 5,120,423 | |
| 1.25%, 8/1/19-10/2/19 | | | 9,465,000 | | | | 9,454,196 | |
| 2.375%, 1/13/22 | | | 1,113,000 | | | | 1,163,764 | |
| | | | |
| 15 | | | | OPPENHEIMER GLOBAL STRATEGIC INCOME FUND/VA |
STATEMENT OF INVESTMENTS Continued
| | | | | | | | |
| | | Principal
Amount | | | Value | |
| | | | | | | | | |
| U.S. Government Obligations Continued | |
Federal National Mortgage Assn. Nts.:
0.875%, 12/20/17 | | $ | 14,800,000 | | | $ | 14,846,901 | |
| 4.375%, 10/15/15 | | | 4,000,000 | | | | 4,444,356 | |
U.S. Treasury Bonds, STRIPS,
4.833%, 2/15/1612 | | | 2,116,000 | | | | 2,089,146 | |
| U.S. Treasury Nts., 1.625%, 11/15/2213,14 | | | 71,200,000 | | | | 70,343,393 | |
| | | | | | |
|
|
|
| Total U.S. Government Obligations (Cost $107,469,902) | | | | | | | 107,462,179 | |
| Foreign Government Obligations—26.2% | |
| Australia—0.4% | | | | | | | | |
New South Wales Treasury Corp. Bonds:
Series 14, 5.50%, 8/1/14 | | | 935,000 | AUD | | | 1,010,595 | |
| Series 15, 6%, 4/1/25 | | | 680,000 | AUD | | | 751,750 | |
| Series 17, 5.50%, 3/1/17 | | | 665,000 | AUD | | | 751,763 | |
Queensland Treasury Corp. Nts.:
Series 15, 6%, 10/14/15 | | | 1,370,000 | AUD | | | 1,535,303 | |
| Series 17, 6%, 9/14/17 | | | 1,100,000 | AUD | | | 1,274,499 | |
| Series 21, 6%, 6/14/21 | | | 1,345,000 | AUD | | | 1,614,737 | |
| Series 24, 5.75%, 7/22/24 | | | 1,140,000 | AUD | | | 1,320,113 | |
| Victoria Treasury Corp. Nts., Series 1116, 5.75%, 11/15/16 | | | 1,665,000 | AUD | | | 1,887,304 | |
| Western Australia Treasury Corp. Nts., Series 15, 7%, 4/15/15 | | | 690,000 | AUD | | | 779,198 | |
| | | | | | |
|
|
|
| | | | | | | | 10,925,262 | |
| Belgium—0.2% | | | | | | | | |
| Belgium (Kingdom of) Bonds, Series 58, 3.75%, 9/28/20 | | | 2,730,000 | EUR | | | 4,171,214 | |
| Bolivia—0.0% | | | | | | | | |
| Bolivia (Plurinational State of) Unsec. Bonds, 4.875%, 10/31/22 | | | 845,000 | | | | 825,988 | |
| Brazil—2.8% | | | | | | | | |
Brazil (Federative Republic of) Nota Do Tesouro Nacional Nts.:
9.762%, 1/1/14 | | | 25,275,000 | BRR | | | 12,659,651 | |
| 9.762%, 1/1/17 | | | 23,655,000 | BRR | | | 12,169,081 | |
| 9.762%, 1/1/21 | | | 49,670,000 | BRR | | | 25,599,980 | |
| 12.994%, 5/15/4515 | | | 3,820,000 | BRR | | | 5,707,681 | |
| Series NTNF, 10%, 1/1/23 | | | 8,790,000 | BRR | | | 4,518,821 | |
| Series NTNB, 12.792%, 8/15/5015 | | | 3,505,000 | BRR | | | 5,353,434 | |
| Brazil (Federative Republic of) Nota Do Tesouro Nacional Unsec. Bonds, 10%, 1/1/18 | | | 11,645,000 | BRR | | | 6,013,002 | |
| | | | | | |
|
|
|
| | | | | | | | 72,021,650 | |
| Canada—0.2% | | | | | | | | |
| Canada (Government of) Nts., 3.75%, 6/1/19 | | | 2,010,000 | CAD | | | 2,291,343 | |
| | | | | | | | |
| | | Principal
Amount | | | Value | |
| | | | | | | | | |
| Canada Continued | | | | | | | | |
| Canada (Government of) Treasury Bills, 1.021%, 3/28/1312 | | | 1,810,000 | CAD | | $ | 1,815,650 | |
| | | | | | |
|
|
|
| | | | | | | | 4,106,993 | |
| Colombia—0.3% | | | | | | | | |
| Colombia (Republic of) Sr. Unsec. Bonds, 6.125%, 1/18/41 | | | 6,260,000 | | | | 8,626,280 | |
| Costa Rica—0.1% | | | | | | | | |
| Costa Rica (Republic of) Sr. Unsec. Unsub. Nts., 4.25%, 1/26/233 | | | 2,675,000 | | | | 2,712,450 | |
| Croatia—0.2% | | | | | | | | |
Croatia (Republic of) Unsec. Nts.:
6.25%, 4/27/173 | | | 2,250,000 | | | | 2,472,750 | |
| 6.375%, 3/24/213 | | | 1,190,000 | | | | 1,359,575 | |
| 6.75%, 11/5/193 | | | 1,140,000 | | | | 1,312,425 | |
| | | | | | |
|
|
|
| | | | | | | | 5,144,750 | |
| Denmark—0.1% | | | | | | | | |
| Denmark (Kingdom of) Bonds, 4%, 11/15/19 | | | 6,060,000 | DKK | | | 1,315,416 | |
| Finland—0.0% | | | | | | | | |
| Finland (Repulic of) Unsec. Bonds, 1.625%, 9/15/22 | | | 555,000 | EUR | | | 739,702 | |
| France—0.5% | | | | | | | | |
France (Republic of) Bonds:
3.25%, 10/25/21 | | | 1,125,000 | EUR | | | 1,665,555 | |
| 3.75% 10/25/19 | | | 2,390,000 | EUR | | | 3,674,647 | |
| 4%, 4/25/60 | | | 545,000 | EUR | | | 864,247 | |
| 4.50%, 4/25/41 | | | 1,115,000 | EUR | | | 1,901,094 | |
| France (Republic of) Treasury Nts., 1%, 7/25/17 | | | 3,880,000 | EUR | |
| 5,211,205
|
|
| | | | | | | | 13,316,748 | |
| Germany—0.2% | | | | | | | | |
| Germany (Federal Republic of) Bonds, 2.50%, 7/4/44 | | | 860,000 | EUR | | | 1,226,256 | |
| Germany (Federal Republic of) Sec. Bonds, Series 164, 0.50%, 10/13/17 | | | 2,590,000 | EUR | | | 3,452,276 | |
| Germany (Federal Republic of) Unsec. Bonds, 1.50%, 9/4/22 | | | 1,275,000 | EUR | |
| 1,712,586
|
|
| | | | | | | | 6,391,118 | |
| Hungary—2.0% | | | | | | | | |
| Hungary (Republic of) Bonds: 6.75%, 11/24/17 | | | 850,000,000 | HUF | | | 4,005,286 | |
| Series 13/D, 6.75%, 2/12/13 | | | 3,277,000,000 | HUF | | | 14,866,519 | |
| Series 14/D, 6.75%, 8/22/14 | | | 451,000,000 | HUF | | | 2,092,986 | |
| Series 15C, 7.75%, 8/24/15 | | | 1,312,000,000 | HUF | | | 6,255,302 | |
| Series 15/A, 8%, 2/12/15 | | | 238,000,000 | HUF | | | 1,137,731 | |
| Series 16/C, 5.50%, 2/12/16 | | | 315,000,000 | HUF | | | 1,423,263 | |
| Series 17/B, 6.75%, 2/24/17 | | | 724,000,000 | HUF | | | 3,397,058 | |
| Series 19/A, 6.50%, 6/24/19 | | | 514,000,000 | HUF | | | 2,410,890 | |
| Series 20/A, 7.50%, 11/12/20 | | | 455,000,000 | HUF | | | 2,266,148 | |
| Series 22A, 7%, 6/24/22 | | | 348,000,000 | HUF | | | 1,691,267 | |
| Series 23A, 6%, 11/24/23 | | | 230,000,000 | HUF | | | 1,036,000 | |
��
| | | | |
| 16 | | | | OPPENHEIMER GLOBAL STRATEGIC INCOME FUND/VA |
| | | | | | | | |
| | | Principal
Amount | | | Value | |
| | | | | | | | | |
| Hungary Continued | | | | | | | | |
| Hungary (Republic of) Sr. Unsec. Bonds, 7.625%, 3/29/41 | | $ | 135,000 | | | $ | 156,600 | |
| Hungary (Republic of) Sr. Unsec. Nts., 5.75%, 6/11/18 | | | 365,000 | EUR | | | 501,875 | |
| Hungary (Republic of) Sr. Unsec. Unsub. Nts., 6.375%, 3/29/21 | | | 585,000 | | | | 648,765 | |
Hungary (Republic of) Treasury Bills:
6.051%, 2/20/1312 | | | 1,420,000,000 | HUF | | | 6,393,534 | |
| 6.073%, 5/29/1312 | | | 550,000,000 | HUF | | | 2,444,498 | |
| 6.258%, 4/17/1312 | | | 366,000,000 | HUF | |
| 1,636,536
|
|
| | | | | | | | 52,364,258 | |
| Indonesia—0.2% | | | | | | | | |
| Indonesia (Republic of) Nts., 5.25%, 1/17/423 | | | 955,000 | | | | 1,113,769 | |
| Indonesia (Republic of) Sr. Unsec. Bonds, 4.875%, 5/5/213 | | | 1,020,000 | | | | 1,176,825 | |
| Indonesia (Republic of) Sr. Unsec. Nts., 7.75%, 1/17/383 | | | 515,000 | | | | 780,225 | |
| Indonesia (Republic of) Unsec. Nts., 3.75%, 4/25/223 | | | 2,120,000 | | |
| 2,265,750
|
|
| | | | | | | | 5,336,569 | |
| Ireland—0.1% | | | | | | | | |
| Ireland (Republic of) Treasury Bonds, 4.40%, 6/18/19 | | | 990,000 | EUR | | | 1,321,221 | |
| Israel—0.1% | | | | | | | | |
| Israel (State of) Sr. Unsec. Bonds, 4%, 6/30/22 | | | 3,070,000 | | | | 3,345,385 | |
| Italy—0.6% | | | | | | | | |
Italy (Republic of) Bonds:
4%, 9/1/20 | | | 985,000 | EUR | | | 1,310,300 | |
| 4.50%, 3/1/19 | | | 2,845,000 | EUR | | | 3,936,367 | |
| 5%, 3/1/22 | | | 520,000 | EUR | | | 723,923 | |
| 5%, 9/1/40 | | | 1,080,000 | EUR | | | 1,428,373 | |
| Series EU, 1.216%, 10/15/174 | | | 680,000 | EUR | | | 827,293 | |
| Italy (Republic of) Sr. Unsec. Nts., 4.50%, 6/8/15 | | | 132,000,000 | JPY | | | 1,580,558 | |
| Italy (Republic of) Treasury Bills, 1.529%, 1/31/1312 | | | 2,260,000 | EUR | | | 2,982,054 | |
Italy (Republic of) Treasury Bonds:
3.50%, 11/1/17 | | | 575,000 | EUR | | | 766,942 | |
| 5.75%, 2/1/33 | | | 465,000 | EUR | |
| 669,509
|
|
| | | | | | | | 14,225,319 | |
| Ivory Coast—0.1% | | | | | | | | |
| Ivory Coast Bonds, 3.75%, 12/31/32 | | | 2,675,000 | | | | 2,514,500 | |
| Japan—1.9% | | | | | | | | |
Japan Bonds:
2 yr., 0.10%, 5/15/14 | | | 988,000,000 | JPY | | | 11,404,452 | |
| 5 yr., 0.30%, 3/20/17 | | | 606,000,000 | JPY | | | 7,042,813 | |
| | | | | | | | |
| | | Principal
Amount | | | Value | |
| | | | | | | | | |
| Japan Continued | | | | | | | | |
| Japan Bonds: Continued | | | | | | | | |
| 10 yr., Series 301, 1.50%, 6/20/19 | | | 604,000,000 | JPY | | $ | 7,490,667 | |
| 10 yr., 1.10%, 3/20/21 | | | 251,000,000 | JPY | | | 3,016,859 | |
| 20 yr., Series 112, 2.10%, 6/20/29 | | | 763,000,000 | JPY | | | 9,575,225 | |
| 30 yr., 2%, 3/20/42 | | | 463,000,000 | JPY | | | 5,401,551 | |
| Japan Sr. Unsec. Bonds, Series 134, 1.80%, 3/20/32 | | | 369,000,000 | JPY | |
| 4,323,661
|
|
| | | | | | | | 48,255,228 | |
| Kazakhstan—0.1% | | | | | | | | |
| Development Bank of Kazakhstan Sr. Unsec. Bonds, 4.125%, 12/10/223 | | | 1,445,000 | | | | 1,463,063 | |
| Latvia—0.1% | | | | | | | | |
| Latvia (Republic of) Nts., 5.25%, 2/22/173 | | | 2,090,000 | | | | 2,348,115 | |
| Lithuanua—0.1% | | | | | | | | |
| Lithuania (Republic of) Sr. Unsec. Bonds, 6.625%, 2/1/223 | | | 2,190,000 | | | | 2,808,785 | |
| Malaysia—0.6% | | | | | | | | |
| Central Bank of Malaysia Treasury Bills: | | | | | | | | |
| Series 5312, 2.984%, 1/22/1312 | | | 14,620,000 | MYR | | | 4,773,005 | |
| Series 5612, 3%, 2/7/1312 | | | 14,620,000 | MYR | | | 4,766,311 | |
| Series 6212 2.968%, 2/28/1312 | | | 7,310,000 | MYR | | | 2,379,207 | |
| Malaysia (Government of) Sr. Unsec. Bonds: | | | | | | | | |
| Series 1/06, 4.262%, 9/15/16 | | | 2,400,000 | MYR | | | 815,962 | |
| Series 0210, 4.012%, 9/15/17 | | | 1,915,000 | MYR | | | 647,412 | |
| Wakala Global Sukuk Bhd Bonds, 4.646%, 7/6/213 | | | 2,105,000 | | |
| 2,434,788
|
|
| | | | | | | | 15,816,685 | |
| Mexico—1.6% | | | | | | | | |
| United Mexican States Bonds: | | | | | | | | |
| Series M, 6.50%, 6/10/214 | | | 62,985,000 | MXN | | | 5,290,276 | |
| Series M20, 7.50%, 6/3/274 | | | 101,400,000 | MXN | | | 9,145,823 | |
| Series M10, 7.75%, 12/14/17 | | | 23,505,000 | MXN | | | 2,028,595 | |
| Series M, 8%, 6/11/20 | | | 48,820,000 | MXN | | | 4,450,969 | |
| Series M20, 8.50%, 5/31/294 | | | 54,140,000 | MXN | | | 5,281,928 | |
| United Mexican States Treasury Bills: | | | | | | | | |
| 4.552%, 4/4/1312 | | | 58,000,000 | MXN | | | 4,437,575 | |
| 4.623%, 4/18/1312 | | | 65,300,000 | MXN | | | 4,987,509 | |
| 4.668%, 5/16/1312 | | | 65,300,000 | MXN | |
| 4,968,919
|
|
| | | | | | | | 40,591,594 | |
| Mongolia—0.0% | | | | | | | | |
| Mongolia (Government of) Sr. Unsec. Bonds, 5.125%, 12/5/22 | | | 435,000 | | | | 428,475 | |
| Nigeria—0.5% | | | | | | | | |
| Nigeria (Federal Republic of) Treasury Bills: | | | | | | | | |
| 13.662%, 9/5/1312 | | | 329,000,000 | NGN | | | 1,942,954 | |
| 13.779%, 9/26/1312 | | | 164,000,000 | NGN | | | 963,782 | |
| | | | |
| 17 | | | | OPPENHEIMER GLOBAL STRATEGIC INCOME FUND/VA |
STATEMENT OF INVESTMENTS Continued
| | | | | | | | |
| | | Principal
Amount | | | Value | |
| | | | | | | | | |
| Nigeria Continued | | | | | | | | |
| Nigeria (Federal Republic of) Treasury Bills: Continued | | | | | | | | |
| 14.326%, 6/6/1312 | | | 73,000,000 | NGN | | $ | 444,683 | |
| 15.149%, 3/7/1312 | | | 38,000,000 | NGN | | | 237,989 | |
| 15.205%, 3/28/1312 | | | 145,000,000 | NGN | | | 900,999 | |
| Series 364, 15.572%, 4/25/1312 | | | 109,000,000 | NGN | | | 670,562 | |
| Series 364, 16.895%, 2/7/1312 | | | 146,000,000 | NGN | | | 922,424 | |
| Nigeria (Federal Republic of) Treasury Bonds: | | | | | | | | |
| 7%, 10/23/19 | | | 302,000,000 | NGN | | | 1,508,743 | |
| 16%, 6/29/19 | | | 314,000,000 | NGN | | | 2,371,439 | |
| 16.39%, 1/27/22 | | | 492,000,000 | NGN | |
| 3,916,465
|
|
| | | | | | | | 13,880,040 | |
| Peru—1.1% | | | | | | | | |
| Peru (Republic of) Bonds, 7.35%, 7/21/25 | | | 3,295,000 | | | | 4,790,930 | |
| Peru (Republic of) Sr. Unsec. Bonds: | | | | | | | | |
| 6.95%, 8/12/313 | | | 15,395,000 | PEN | | | 7,601,903 | |
| 8.20%, 8/12/263 | | | 10,000,000 | PEN | | | 5,505,779 | |
| Peru (Republic of) Sr. Unsec. Nts., 7.84%, 8/12/203 | | | 14,085,000 | PEN | | | 6,968,281 | |
| Peru (Republic of) Sr. Unsec. Unsub. Bonds, 5.625%, 11/18/50 | | | 2,250,000 | | |
| 2,928,375
|
|
| | | | | | | | 27,795,268 | |
| Philippines—0.1% | | | | | | | | |
| Philippines (Republic of the) Sr. Unsec. Bonds, 5%, 1/13/37 | | | 885,000 | | | | 1,078,594 | |
| Philippines (Republic of the) Sr. Unsec. Unsub. Bonds, 6.375%, 10/23/34 | | | 925,000 | | |
| 1,301,938
|
|
| | | | | | | | 2,380,532 | |
| Poland—0.5% | | | | | | | | |
| Poland (Republic of) Bonds: | | | | | | | | |
| 5.25%, 10/25/20 | | | 16,410,000 | PLZ | | | 5,957,337 | |
| Series WS0922, 5.75%, 9/23/22 | | | 13,810,000 | PLZ | | | 5,234,397 | |
| Series 0415, 5.50%, 4/25/15 | | | 2,355,000 | PLZ | | | 801,082 | |
| Series 1017, 5.25%, 10/25/17 | | | 3,265,000 | PLZ | |
| 1,150,635
|
|
| | | | | | | | 13,143,451 | |
| Portugal—0.0% | | | | | | | | |
| Portuguese (Republic) Sr. Unsec. Bonds: | | | | | | | | |
| 4.10%, 4/15/37 | | | 340,000 | EUR | | | 301,413 | |
| 4.95%, 10/25/23 | | | 260,000 | EUR | |
| 293,821
|
|
| | | | | | | | 595,234 | |
| Qatar—0.2% | | | | | | | | |
| Qatar (State of) Sr. Nts., 5.25%, 1/20/203 | | | 1,005,000 | | | | 1,203,488 | |
| | | | | | | | |
| | | Principal
Amount | | | Value | |
| | | | | | | | | |
| Qatar Continued | | | | | | | | |
| Qatar (State of) Sr. Unsec. Nts.: | | | | | | | | |
| 5.75%, 1/20/423 | | $ | 1,125,000 | | | $ | 1,468,125 | |
| 6.40%, 1/20/403 | | | 860,000 | | |
| 1,206,752
|
|
| | | | | | | | 3,878,365 | |
| Romania—0.2% | | | | | | | | |
| Romania Sr. Unsec. Bonds, 6.75%, 2/7/223 | | | 4,285,000 | | | | 5,222,344 | |
| Russia—1.9% | | | | | | | | |
| Russian Federation Bonds: | | | | | | | | |
| 7.50%, 3/15/184 | | | 192,100,000 | RUR | | | 6,597,665 | |
| 7.50%, 2/27/194 | | | 236,200,000 | RUR | | | 8,152,425 | |
| 7.60%, 4/14/214 | | | 258,000,000 | RUR | | | 8,946,204 | |
| Series 6206, 7.40%, 6/14/174 | | | 419,200,000 | RUR | | | 14,259,070 | |
Russian Federation Unsec. Bonds:
5.625%, 4/4/423 | | | 1,490,000 | | | | 1,855,050 | |
| Series 9, 7.90%, 3/18/214 | | | 43,800,000 | RUR | | | 1,432,188 | |
| Vnesheconombank Sr. Unsec. Bonds, Series 18, 8.693%, 9/17/324 | | | 45,500,000 | RUR | | | 1,504,678 | |
| Vnesheconombank Via VEB Finance plc Sr. Unsec. Nts., 6.025%, 7/5/223 | | | 2,005,000 | | | | 2,340,838 | |
Vnesheconombank Via VEB Finance plc Sr. Unsec. Unsub. Nts.:
6.80%, 11/22/253 | | | 2,370,000 | | | | 2,915,100 | |
| 6.902%, 7/9/203 | | | 1,445,000 | | |
| 1,766,585
|
|
| | | | | | | | 49,769,803 | |
| Serbia—0.1% | | | | | | | | |
| Serbia (Republic of) Sr. Unsec. Nts., 5.25%, 11/21/173 | | | 1,760,000 | | | | 1,834,800 | |
| Slovakia—0.1% | | | | | | | | |
| Slovakia (Republic of) Bonds, 4.375%, 5/21/223 | | | 2,995,000 | | | | 3,277,488 | |
| Slovenia—0.0% | | | | | | | | |
| Slovenia (Republic of) Sr. Unsec. Bonds, 5.50%, 10/26/223 | | | 1,140,000 | | | | 1,199,850 | |
| South Africa—1.3% | | | | | | | | |
South Africa (Republic of) Bonds:
Series R208, 6.75%, 3/31/21 | | | 140,980,000 | ZAR | | | 17,035,257 | |
| Series R207, 7.25%, 1/15/20 | | | 125,160,000 | ZAR | |
| 15,586,041
|
|
| | | | | | | | 32,621,298 | |
| Spain—0.3% | | | | | | | | |
| Comunidad De Madrid Sr. Unsec. Nts., 4.30%, 9/15/26 | | | 765,000 | EUR | | | 713,333 | |
| Instituto de Credito Oficial Sr. Unsec. Nts., 5%, 5/15/15 | | | 2,200,000 | NOK | | | 377,899 | |
Spain (Kingdom of) Bonds:
5.50%, 7/30/17 | | | 1,440,000 | EUR | | | 2,015,544 | |
| 5.85%, 1/31/22 | | | 1,560,000 | EUR | | | 2,151,692 | |
| Spain (Kingdom of) Sr. Unsec. Bonds, 4.30%, 10/31/19 | | | 795,000 | EUR | | | 1,032,052 | |
| | | | |
| 18 | | | | OPPENHEIMER GLOBAL STRATEGIC INCOME FUND/VA |
| | | | | | | | |
| | | Principal
Amount | | | Value | |
| | | | | | | | | |
| Spain Continued | | | | | | | | |
| Spain (Kingdom of) Unsec. Bonds, 3.30%, 10/31/14 | | | 390,000 | EUR | | $
| 518,809
|
|
| | | | | | | | 6,809,329 | |
| Sri Lanka—0.1% | | | | | | | | |
Sri Lanka (Democratic Socialist Republic of) Sr. Unsec. Nts.:
6.25%, 10/4/203 | | | 1,265,000 | | | | 1,382,013 | |
| 6.25% 7/27/213 | | | 1,565,000 | | |
| 1,712,938
|
|
| | | | | | | | 3,094,951 | |
| The Netherlands—0.2% | | | | | | | | |
| Netherlands (Kingdom of the) Bonds, 4%, 7/15/19 | | | 2,725,000 | EUR | | | 4,299,698 | |
| Turkey—5.2% | | | | | | | | |
Turkey (Republic of) Bonds:
6.875%, 3/17/36 | | | 2,735,000 | | | | 3,702,506 | |
| 7%, 3/11/19 | | | 1,285,000 | | | | 1,602,716 | |
| 9%, 3/5/14 | | | 23,725,000 | TRY | | | 13,797,857 | |
| 9%, 3/8/17 | | | 43,500,000 | TRY | | | 26,785,924 | |
| 9.50%, 1/12/224 | | | 24,875,000 | TRY | | | 16,753,447 | |
| 9.683%, 7/17/1312 | | | 22,235,000 | TRY | | | 12,073,669 | |
| 10.50%, 1/15/204 | | | 1,120,000 | TRY | | | 769,457 | |
| 15.959%, 8/14/1315 | | | 2,310,000 | TRY | | | 1,910,617 | |
Turkey (Republic of) Nts.,
7.50%, 7/14/17 | | | 1,640,000 | | | | 2,002,358 | |
Turkey (Republic of) Unsec. Bonds:
5.396%, 2/11/154,15 | | | 2,305,000 | TRY | | | 1,738,677 | |
| 5.99%, 5/15/1312 | | | 80,400,000 | TRY | | | 44,120,286 | |
| 6.25%, 9/26/22 | | | 3,110,000 | | | | 3,884,390 | |
Turkey (Republic of) Unsec. Nts.:
5.125%, 3/25/22 | | | 1,150,000 | | | | 1,325,375 | |
| 6%, 1/14/41 | | | 3,805,000 | | |
| 4,761,006
|
|
| | | | | | | | 135,228,285 | |
| Ukraine—0.1% | | | | | | | | |
Ukraine (Republic of) Bonds,
7.75%, 9/23/203 | | | 860,000 | | | | 887,950 | |
| Ukraine (Republic of) Sr. Unsec. Nts., 7.95%, 2/23/213 | | | 1,195,000 | | |
| 1,242,800
|
|
| | | | | | | | 2,130,750 | |
| United Arab Emirates—0.2% | | | | | | | | |
Emirates of Dubai Sr. Unsec. International Bonds:
5.591%, 6/22/21 | | | 2,085,000 | | | | 2,285,160 | |
| 6.45%, 5/2/22 | | | 730,000 | | | | 855,925 | |
| 7.75%, 10/5/20 | | | 2,325,000 | | |
| 2,941,125
|
|
| | | | | | | | 6,082,210 | |
| United Kingdom—0.4% | | | | | | | | |
United Kingdom Treasury Bonds:
3.75%, 9/7/21 | | | 875,000 | GBP | | | 1,670,065 | |
| 4%, 9/7/16 | | | 1,745,000 | GBP | | | 3,191,522 | |
| | | | | | | | |
| | | Principal
Amount | | | Value | |
| | | | | | | | | |
| United Kingdom Continued | | | | | | | | |
United Kingdom Treasury
Bonds: Continued | | | | | | | | |
| 4.75%, 12/7/38 | | | 2,420,000 | GBP | | $
| 5,189,176
|
|
| | | | | | | | 10,050,763 | |
| Uruguay—0.3% | | | | | | | | |
| Uruguay (Oriental Republic of) Bonds, 7.625%, 3/21/36 | | | 2,310,000 | | | | 3,589,740 | |
| Uruguay (Oriental Republic of) Sr. Unsec. Bonds, 4.702%, 12/15/2815 | | | 57,600,000 | UYU | | | 3,943,663 | |
| Uruguay (Oriental Republic of) Unsec. Bonds, 8%, 11/18/22 | | | 991,741 | | |
| 1,444,967
|
|
| | | | | | | | 8,978,370 | |
| Venezuela—0.9% | | | | | | | | |
Venezuela (Republic of) Bonds:
9%, 5/7/23 | | | 4,090,000 | | | | 3,987,750 | |
| 11.95%, 8/5/31 | | | 3,585,000 | | | | 4,095,863 | |
Venezuela (Republic of) Nts.,
8.25%, 10/13/24 | | | 2,290,000 | | | | 2,118,250 | |
| Venezuela (Republic of) Sr. Unsec. Bonds, 11.75%, 10/21/26 | | | 1,000,000 | | | | 1,132,500 | |
| Venezuela (Republic of) Sr. Unsec. Unsub. Nts., 12.75%, 8/23/22 | | | 1,190,000 | | | | 1,392,300 | |
Venezuela (Republic of) Unsec. Bonds:
7%, 3/31/38 | | | 2,365,000 | | | | 1,903,825 | |
| 7.65%, 4/21/25 | | | 3,870,000 | | | | 3,424,950 | |
| Venezuela (Republic of) Unsec. Nts., 13.625%, 8/15/183 | | | 5,465,000 | | |
| 6,202,775
|
|
| | | | | | |
| 24,258,213
|
|
| Total Foreign Government Obligations (Cost $636,251,018) | | | | | | | 677,647,810 | |
| Loan Participations—0.1% | | | | | | | | |
Angola (Republic of) Sr. Unsec. Nts., 7%, 8/16/19
(Cost $2,260,491) | | | 2,060,000 | | | | 2,286,600 | |
| Corporate Bonds and Notes—29.0% | |
| Consumer Discretionary—4.4% | |
| Auto Components—0.6% | | | | | | | | |
| Continental Rubber of America Corp., 4.50% Sr. Sec. Nts., 9/15/193 | | | 510,000 | | | | 524,481 | |
| Goodyear Tire & Rubber Co. (The), 8.25% Sr. Unsec. Unsub. Nts., 8/15/20 | | | 2,800,000 | | | | 3,087,000 | |
| Tower Automotive Holdings USA LLC/TA Holdings Finance, Inc., 10.625% Sr. Sec. Nts., 9/1/173 | | | 5,987,000 | | | | 6,585,700 | |
| UCI International, Inc., 8.625% Sr. Unsec. Nts., 2/15/19 | | | 775,000 | | | | 772,094 | |
| | | | |
| 19 | | | | OPPENHEIMER GLOBAL STRATEGIC INCOME FUND/VA |
STATEMENT OF INVESTMENTS Continued
| | | | | | | | |
| | | Principal
Amount | | | Value | |
| | | | | | | | | |
| Auto Components Continued | | | | | | | | |
| Visteon Corp., 6.75% Sr. Unsec. Nts., 4/15/19 | | $ | 2,844,000 | | | $ | 3,043,080 | |
| | | | | | |
|
|
|
| | | | | | | | 14,012,355 | |
| Automobiles—0.0% | | | | | | | | |
Jaguar Land Rover plc:
7.75% Sr. Unsec. Bonds, 5/15/183 | | | 500,000 | | | | 547,500 | |
| 8.25% Sr. Nts., 3/15/203 | | | 245,000 | GBP | |
| 443,513
|
|
| | | | | | | | 991,013 | |
| Diversified Consumer Services—0.1% | |
| Monitronics International, Inc., 9.125% Sr. Unsec. Nts., 4/1/20 | | | 1,285,000 | | | | 1,329,975 | |
ServiceMaster Co.:
7% Sr. Nts., 8/15/203 | | | 1,220,000 | | | | 1,229,150 | |
| 8% Sr. Unsec. Unsub. Nts., 2/15/20 | | | 775,000 | | |
| 811,813
|
|
| | | | | 3,370,938 | |
| Hotels, Restaurants & Leisure—1.3% | |
| Boyd Gaming Corp., 9.125% Sr. Unsec. Nts., 12/1/18 | | | 2,405,000 | | | | 2,465,125 | |
| Burger King Corp., 9.875% Sr. Unsec. Unsub. Nts., 10/15/18 | | | 1,105,000 | | | | 1,270,750 | |
| Caesars Entertainment Operating Co., Inc., 10% Sr. Sec. Nts., 12/15/18 | | | 12,225,000 | | | | 8,160,188 | |
| CKE Restaurants, Inc., 11.375% Sec. Nts., 7/15/18 | | | 985,000 | | | | 1,137,675 | |
| Equinox Holdings, Inc., 9.50% Sr. Sec. Nts., 2/1/163 | | | 2,290,000 | | | | 2,418,526 | |
| HOA Restaurants Group LLC/HOA Finance Corp., 11.25% Sr. Sec. Nts., 4/1/173 | | | 2,920,000 | | | | 2,657,200 | |
| Isle of Capri Casinos, Inc., 7.75% Sr. Unsec. Unsub. Nts., 3/15/19 | | | 2,615,000 | | | | 2,830,738 | |
| Landry’s, Inc., 9.375% Sr. Unsec. Nts., 5/1/203 | | | 2,560,000 | | | | 2,713,600 | |
| MGM Mirage, Inc., 6.625% Sr. Unsec. Nts., 7/15/15 | | | 3,365,000 | | | | 3,625,788 | |
MGM Resorts International:
6.625% Sr. Unsec. Unsub. Nts., 12/15/21 | | | 410,000 | | | | 410,513 | |
| 6.75% Sr. Unsec. Nts., 10/1/203 | | | 750,000 | | | | 767,813 | |
| MTR Gaming Group, Inc., 11.50% Sec. Nts., 8/1/19 | | | 1,170,825 | | | | 1,246,929 | |
| Penn National Gaming, Inc., 8.75% Sr. Unsec. Sub. Nts., 8/15/19 | | | 1,985,000 | | | | 2,272,825 | |
| Premier Cruise Ltd., 11% Sr. Nts., 3/15/085,8 | | | 250,000 | | | | — | |
| Viking Cruises Ltd., 8.50% Sr. Nts., 10/15/223 | | | 930,000 | | |
| 1,009,050
|
|
| | | | | 32,986,720 | |
| | | | | | | | |
| | | Principal
Amount | | | Value | |
| | | | | | | | | |
| Household Durables—0.2% | | | | | | | | |
Beazer Homes USA, Inc.:
6.875% Sr. Unsec. Nts., 7/15/15 | | $ | 280,000 | | | $ | 282,100 | |
| 9.125% Sr. Unsec. Nts., 5/15/19 | | | 3,615,000 | | | | 3,800,269 | |
| Jarden Corp., 6.125% Sr. Unsec. Nts., 11/15/22 | | | 290,000 | | | | 314,650 | |
| K Hovnanian Enterprises, Inc., 9.125% Sec. Nts., 11/15/203 | | | 610,000 | | | | 649,650 | |
| Libbey Glass, Inc., 6.875% Sr. Sec. Nts., 5/15/20 | | | 980,000 | | |
| 1,058,400
|
|
| | | | | 6,105,069 | |
| Leisure Equipment & Products—0.1% | |
| FGI Operating Co. LLC/FGI Finance, Inc., 7.875% Sr. Sec. Nts., 5/1/203 | | | 2,560,000 | | | | 2,649,600 | |
| Media—1.7% | | | | | | | | |
| Affinion Group Holdings, Inc., 11.625% Sr. Unsec. Nts., 11/15/15 | | | 1,465,000 | | | | 952,250 | |
| Affinion Group, Inc., 7.875% Sr. Unsec. Nts., 12/15/18 | | | 3,815,000 | | | | 2,928,013 | |
| AMC Entertainment, Inc., 8.75% Sr. Unsec. Nts., 6/1/19 | | | 1,205,000 | | | | 1,340,563 | |
| Belo (A.H.) Corp., 7.75% Sr. Unsec. Unsub. Debs., 6/1/27 | | | 3,702,000 | | | | 3,836,198 | |
| Cinemark USA, Inc., 5.125% Sr. Unsec. Nts., 12/15/223 | | | 615,000 | | | | 625,763 | |
| Clear Channel Communications, Inc., 5.75% Sr. Unsec. Unsub. Nts., 1/15/13 | | | 340,000 | | | | 340,850 | |
| Cumulus Media Holdings, Inc., 7.75% Sr. Unsec. Unsub. Nts., 5/1/19 | | | 1,580,000 | | | | 1,560,250 | |
DISH DBS Corp.:
5.875% Sr. Unsec. Nts., 7/15/22 | | | 1,675,000 | | | | 1,809,000 | |
| 7.875% Sr. Unsec. Nts., 9/1/19 | | | 2,820,000 | | | | 3,355,800 | |
| Entravision Communications Corp., 8.75% Sr. Sec. Nts., 8/1/17 | | | 2,059,000 | | | | 2,244,310 | |
| Getty Images, Inc., 7% Sr. Nts., 10/15/203,6 | | | 1,165,000 | | | | 1,197,038 | |
| Gray Television, Inc., 7.50% Sr. Unsec. Nts., 10/1/203 | | | 2,650,000 | | | | 2,722,875 | |
| Igloo Holdings Corp., 8.25% Sr. Unsec. Nts., 12/15/175,7 | | | 2,879,000 | | | | 2,861,006 | |
| LIN Television Corp., 6.375% Sr. Nts., 1/15/213 | | | 465,000 | | | | 490,575 | |
| Newport Television LLC/NTV Finance Corp., 13% Sr. Nts., 3/15/175,7 | | | 1,860,260 | | | | 1,981,177 | |
| Nexstar Broadcasting, Inc., 6.875% Sr. Unsec. Nts., 11/15/203 | | | 1,030,000 | | | | 1,062,188 | |
| Nexstar Broadcasting, Inc./Mission Broadcasting, Inc., 8.875% Sec. Nts., 4/15/17 | | | 2,295,000 | | | | 2,530,238 | |
| | | | |
| 20 | | | | OPPENHEIMER GLOBAL STRATEGIC INCOME FUND/VA |
| | | | | | | | |
| | | Principal
Amount | | | Value | |
| | | | | | | | | |
| Media Continued | | | | | | | | |
Sinclair Television Group, Inc.:
6.125% Sr. Nts., 10/1/223 | | $ | 2,980,000 | | | $ | 3,177,425 | |
| 8.375% Sr. Unsec. Nts., 10/15/18 | | | 235,000 | | | | 263,788 | |
Unitymedia Hessen GmbH & Co. KG/Unitymedia NRW GmbH,
7.50% Sr. Sec. Nts., 3/15/19 | | | 830,000 | | | | 917,150 | |
| Univision Communications, Inc., 7.875% Sr. Sec. Nts., 11/1/203 | | | 2,215,000 | | | | 2,408,813 | |
| UPCB Finance V Ltd., 7.25% Sr. Sec. Nts., 11/15/213 | | | 1,575,000 | | | | 1,740,375 | |
| UPCB Finance VI Ltd., 6.875% Sr. Sec. Nts., 1/15/223 | | | 2,525,000 | | |
| 2,745,938
|
|
| | | | | | | | 43,091,583 | |
| Specialty Retail—0.3% | | | | | | | | |
| Burlington Coat Factory Warehouse Corp., 10% Sr. Unsec. Nts., 2/15/19 | | | 640,000 | | | | 694,400 | |
| J. Crew Group, Inc., 8.125% Sr. Unsec. Nts., 3/1/19 | | | 1,255,000 | | | | 1,333,438 | |
| Limited Brands, Inc., 5.625% Sr. Nts., 2/15/22 | | | 2,535,000 | | | | 2,769,488 | |
| Michaels Stores, Inc., 7.75% Sr. Unsec. Nts., 11/1/18 | | | 200,000 | | | | 220,500 | |
| Petco Holdings, Inc., 8.50% Sr. Nts., 10/15/173,7 | | | 1,165,000 | | | | 1,202,863 | |
| Sally Holdings LLC/Sally Capital, Inc., 6.875% Sr. Unsec. Nts., 11/15/19 | | | 1,880,000 | | |
| 2,086,800
|
|
| | | | | | | | 8,307,489 | |
| Textiles, Apparel & Luxury Goods—0.1% | |
| Levi Strauss & Co., 7.625% Sr. Unsec. Unsub. Nts., 5/15/20 | | | 1,205,000 | | | | 1,319,475 | |
| Quiksilver, Inc., 6.875% Sr. Unsec. Nts., 4/15/15 | | | 935,000 | | |
| 923,313
|
|
| | | | | | | | 2,242,788 | |
| Consumer Staples—0.8% | | | | | | | | |
| Beverages—0.0% | | | | | | | | |
| AmBev International Finance Co. Ltd., 9.50% Sr. Unsec. Unsub. Nts., 7/24/174 | | | 2,080,000 | BRR | | | 1,149,206 | |
| Food & Staples Retailing—0.0% | | | | | | | | |
| Rite Aid Corp., 7.50% Sr. Sec. Nts., 3/1/17 | | | 720,000 | | | | 743,400 | |
| Food Products—0.5% | | | | | | | | |
| American Seafoods Group LLC, 10.75% Sr. Sub. Nts., 5/15/163 | | | 2,770,000 | | | | 2,853,100 | |
| ASG Consolidated LLC, 13.80% Sr. Nts., 5/15/173,7 | | | 2,418,372 | | | | 2,224,902 | |
| Bumble Bee Acquisition Corp., 9% Sr. Sec. Nts., 12/15/173 | | | 2,077,000 | | | | 2,243,160 | |
| | | | | | | | |
| | | Principal
Amount | | | Value | |
| | | | | | | | | |
| Food Products Continued | | | | | | | | |
| MHP SA, 10.25% Sr. Unsec. Nts., 4/29/153 | | $ | 3,255,000 | | | $ | 3,458,438 | |
| Southern States Cooperative, Inc., 11.25% Sr. Nts., 5/15/153 | | | 3,155,000 | | |
| 3,289,088
|
|
| | | | | | | | 14,068,688 | |
| Household Products—0.2% | | | | | | | | |
Reynolds Group Issuer, Inc./Reynolds Group Issuer LLC/Reynolds Group Issuer Luxembourg SA:
5.75% Sr. Sec. Nts., 10/15/203 | | | 1,295,000 | | | | 1,340,325 | |
| 9% Sr. Unsec. Unsub. Nts., 4/15/19 | | | 1,285,000 | | | | 1,342,825 | |
| Spectrum Brands Holdings, Inc., 9.50% Sr. Sec. Nts., 6/15/18 | | | 1,120,000 | | |
| 1,276,800
|
|
| | | | | | | | 3,959,950 | |
| Tobacco—0.1% | | | | | | | | |
| Alliance One International, Inc., 10% Sr. Unsec. Nts., 7/15/16 | | | 1,240,000 | | | | 1,311,300 | |
| Energy—5.6% | | | | | | | | |
| Energy Equipment & Services—0.5% | |
| Forbes Energy Services Ltd., 9% Sr. Unsec. Nts., 6/15/19 | | | 1,020,000 | | | | 912,900 | |
| Hercules Offshore, Inc., 7.125% Sr. Sec. Nts., 4/1/173 | | | 1,285,000 | | | | 1,352,463 | |
| Hornbeck Offshore Services, Inc., 5.875% Sr. Unsec. Nts., 4/1/20 | | | 2,575,000 | | | | 2,703,750 | |
Offshore Group Investment Ltd.:
7.50% Sr. Sec. Nts., 11/1/193 | | | 2,990,000 | | | | 3,034,850 | |
| 11.50% Sr. Sec. Nts., 8/1/15 | | | 1,271,000 | | | | 1,388,568 | |
| Precision Drilling Corp., 6.625% Sr. Unsec. Nts., 11/15/20 | | | 2,375,000 | | | | 2,565,000 | |
| QGOG Constellation SA, 6.25% Sr. Unsec. Nts., 11/9/193 | | | 1,325,000 | | | | 1,384,625 | |
| SESI LLC, 6.375% Sr. Unsec. Nts., 5/1/19 | | | 905,000 | | |
| 972,875
|
|
| | | | | | | | 14,315,031 | |
| Oil, Gas & Consumable Fuels—5.1% | |
Access Midstream Partners
LP/ACMP Finance Corp., 4.875% Sr. Unsec. Unsub. Nts., 5/15/23 | | | 1,650,000 | | | | 1,676,813 | |
| Alliance Oil Co. Ltd., 9.875% Sr. Unsec. Nts., 3/11/153 | | | 2,115,000 | | | | 2,327,240 | |
| Alpha Natural Resources, Inc., 6% Sr. Unsec. Unsub. Nts., 6/1/19 | | | 2,020,000 | | | | 1,868,500 | |
Antero Resources Finance Corp.:
6% Sr. Unsec. Nts., 12/1/203 | | | 1,025,000 | | | | 1,042,938 | |
| 9.375% Sr. Unsec. Nts., 12/1/17 | | | 217,500 | | | | 239,794 | |
| Arch Coal, Inc., 7.25% Sr. Unsec. Unsub. Nts., 6/15/21 | | | 1,435,000 | | | | 1,330,963 | |
| | | | |
| 21 | | | | OPPENHEIMER GLOBAL STRATEGIC INCOME FUND/VA |
STATEMENT OF INVESTMENTS Continued
| | | | | | | | |
| | | Principal
Amount | | | Value | |
| | | | | | | | | |
| Oil, Gas & Consumable Fuels Continued | |
Atlas Pipeline Partners LP/Atlas Pipeline Finance Corp.:
6.625% Sr. Nts., 10/1/203 | | $ | 930,000 | | | $ | 967,200 | |
| 8.75% Sr. Unsec. Sub. Nts., 6/15/18 | | | 1,250,000 | | | | 1,337,500 | |
| Bill Barrett Corp., 7.625% Sr. Unsec. Unsub. Nts., 10/1/19 | | | 1,015,000 | | | | 1,075,900 | |
| BreitBurn Energy Partners LP/BreitBurn Finance Corp., 8.625% Sr. Unsec. Nts., 10/15/20 | | | 3,470,000 | | | | 3,799,650 | |
| Chaparral Energy, Inc., 9.875% Sr. Unsec. Nts., 10/1/20 | | | 2,270,000 | | | | 2,593,475 | |
| Chesapeake Midstream Partners LP/CHKM Finance Corp., 6.125% Sr. Unsec. Unsub. Nts., 7/15/22 | | | 2,420,000 | | | | 2,619,650 | |
| Cimarex Energy Co., 5.875% Sr. Unsec. Unsub. Nts., 5/1/22 | | | 2,375,000 | | | | 2,612,500 | |
| Cloud Peak Energy Resources LLC/Cloud Peak Energy Finance Corp., 8.50% Sr. Unsec. Unsub. Nts., 12/15/19 | | | 485,000 | | | | 534,713 | |
| Continental Resources, Inc., 5% Sr. Unsec. Nts., 9/15/22 | | | 1,555,000 | | | | 1,683,288 | |
| Empresa Nacional del Petroleo, 4.75% Sr. Unsec. Unsub. Nts., 12/6/213 | | | 150,000 | | | | 161,329 | |
| EP Energy LLC/Everest Acquisition Finance, Inc., 7.75% Sr. Unsec. Nts., 9/1/22 | | | 1,010,000 | | | | 1,075,650 | |
Gaz Capital SA:
7.288% Sr. Sec. Nts., 8/16/373 | | | 4,930,000 | | | | 6,444,989 | |
| 8.146% Sr. Sec. Nts., 4/11/183 | | | 4,755,000 | | | | 5,889,068 | |
| 8.625% Sr. Sec. Nts., 4/28/343 | | | 3,025,000 | | | | 4,368,614 | |
| 9.25% Sr. Unsec. Unsub. Nts., 4/23/193 | | | 6,550,000 | | | | 8,703,313 | |
| Gazprom OAO Via Gaz Capital SA, 4.95% Sr. Unsec. Nts., 7/19/223 | | | 2,655,000 | | | | 2,862,090 | |
| Halcon Resources Corp., 8.875% Sr. Unsec. Nts., 5/15/213 | | | 825,000 | | | | 878,625 | |
| Hiland Partners LP/Hiland Partners Finance Corp., 7.25% Sr. Nts., 10/1/203 | | | 365,000 | | | | 392,375 | |
| Inergy Midstream LP/Finance Corp., 6% Sr. Unsec. Nts., 12/15/203 | | | 820,000 | | | | 848,700 | |
| KazMunayGaz National Co., 6.375% Sr. Unsec. Bonds, 4/9/213 | | | 1,645,000 | | | | 2,021,294 | |
| KMG Finance Sub BV, 9.125% Sr. Unsec. Unsub. Nts., 7/2/183 | | | 2,965,000 | | | | 3,932,331 | |
| Linn Energy LLC/Linn Energy Finance Corp., 8.625% Sr. Unsec. Nts., 4/15/20 | | | 4,355,000 | | | | 4,768,725 | |
Lukoil International Finance BV:
6.125% Sr. Unsec. Nts., 11/9/203 | | | 4,720,000 | | | | 5,481,100 | |
| 7.25% Sr. Unsec. Unsub. Nts., 11/5/193 | | | 1,100,000 | | | | 1,350,250 | |
| | | | | | | | |
| | | Principal
Amount | | | Value | |
| | | | | | | | | |
| Oil, Gas & Consumable Fuels Continued | |
| MEG Energy Corp., 6.50% Sr. Unsec. Nts., 3/15/213 | | $ | 3,990,000 | | | $ | 4,219,425 | |
| Murray Energy Corp., 10.25% Sr. Sec. Nts., 10/15/153 | | | 1,890,000 | | | | 1,842,750 | |
| Navios Maritime Acquisition Corp., 8.625% Sr. Sec. Nts., 11/1/17 | | | 890,000 | | | | 838,825 | |
| Novatek OAO via Novatek Finance Ltd., 4.422% Sr. Unsec. Nts., 12/13/223 | | | 2,335,000 | | | | 2,351,597 | |
| Oasis Petroleum, Inc., 6.875% Sr. Unsec. Nts., 1/15/23 | | | 670,000 | | | | 721,925 | |
| Odebrecht Drilling Norbe VIII/IX Ltd., 6.35% Sr. Sec. Nts., 6/30/213 | | | 797,050 | | | | 898,674 | |
| Pemex Project Funding Master Trust, 6.625% Unsec. Unsub. Bonds, 6/15/35 | | | 3,825,000 | | | | 4,876,875 | |
Pertamina Persero PT:
5.25% Nts., 5/23/213 | | | 1,395,000 | | | | 1,569,375 | |
| 6% Sr. Unsec. Nts., 5/3/423 | | | 1,335,000 | | | | 1,510,219 | |
| 6.50% Sr. Unsec. Nts., 5/27/413 | | | 1,035,000 | | | | 1,236,825 | |
Petroleos de Venezuela SA:
5.125% Sr. Unsec. Nts., 10/28/16 | | | 790,000 | | | | 695,200 | |
| 8.50% Sr. Nts., 11/2/173 | | | 3,685,000 | | | | 3,648,150 | |
| 12.75% Sr. Unsec. Nts., 2/17/223 | | | 2,165,000 | | | | 2,438,873 | |
Petroleos Mexicanos:
1.95% Sr. Unsec. Nts., 12/20/22 | | | 185,000 | | | | 188,808 | |
| 2% Sr. Unsec. Nts., 12/20/22 | | | 915,000 | | | | 936,119 | |
| 5.50% Sr. Unsec. Unsub. Nts., 1/21/21 | | | 1,740,000 | | | | 2,041,890 | |
| 5.50% Sr. Unsec. Unsub. Nts., 6/27/44 | | | 3,825,000 | | | | 4,217,063 | |
| 6% Sr. Unsec. Unsub. Nts., 3/5/20 | | | 2,115,000 | | | | 2,538,000 | |
| Petroleum Co. of Trinidad & Tobago Ltd., 9.75% Sr. Unsec. Nts., 8/14/193 | | | 2,500,000 | | | | 3,347,500 | |
Quicksilver Resources, Inc.:
8.25% Sr. Unsec. Nts., 8/1/15 | | | 1,265,000 | | | | 1,176,450 | |
| 11.75% Sr. Nts., 1/1/16 | | | 1,065,000 | | | | 1,057,013 | |
| Range Resources Corp., 8% Sr. Unsec. Sub. Nts., 5/15/19 | | | 875,000 | | | | 973,438 | |
| Rosneft Oil Co. via Rosneft International Finance Ltd., 4.199% Sr. Unsec. Nts., 3/6/223 | | | 1,865,000 | | | | 1,902,300 | |
| Samson Investment Co., 9.75% Sr. Unsec. Nts., 2/15/203 | | | 1,935,000 | | | | 2,055,938 | |
SandRidge Energy, Inc.:
7.50% Sr. Unsec. Unsub. Nts., 2/15/23 | | | 1,625,000 | | | | 1,746,875 | |
| 8.75% Sr. Unsec. Nts., 1/15/20 | | | 1,130,000 | | | | 1,243,000 | |
| Schahin II Finance Co. SPV Ltd., 5.875% Sr. Sec. Unsub. Nts., 9/25/223 | | | 2,990,000 | | | | 3,199,300 | |
| SM Energy Co., 6.50% Sr. Unsec. Unsub. Nts., 1/1/23 | | | 1,285,000 | | | | 1,381,375 | |
| Tengizchevroil LLP, 6.124% Nts., 11/15/143 | | | 529,200 | | | | 550,754 | |
| | | | |
| 22 | | | | OPPENHEIMER GLOBAL STRATEGIC INCOME FUND/VA |
| | | | | | | | |
| | | Principal
Amount | | | Value | |
| | | | | | | | | |
| Oil, Gas & Consumable Fuels Continued | |
| Tesoro Logistics LP/Tesoro Logistics Finance Corp., 5.875% Sr. Nts., 10/1/203 | | $ | 735,000 | | | $
| 766,238
|
|
| | | | | | | | 131,059,351 | |
| Financials—5.3% | | | | | | | | |
| Capital Markets—0.8% | | | | | |
| Banco BTG Pactual SA (Cayman), 5.75% Unsec. Sub. Nts., 9/28/223 | | | 1,810,000 | | | | 1,859,775 | |
| Berry Plastics Corp., 9.75% Sec. Nts., 1/15/21 | | | 1,580,000 | | | | 1,828,850 | |
| Deutsche Bank Capital Funding Trust IV, 5.33% Unsec. Sub. Nts., 9/19/494 | | | 330,000 | EUR | | | 350,682 | |
Nationstar Mortgage LLC/Nationstar Capital Corp.:
7.875% Sr. Unsec. Nts., 10/1/203 | | | 735,000 | | | | 779,100 | |
| 10.875% Sr. Unsec. Nts., 4/1/15 | | | 3,820,000 | | | | 4,106,500 | |
| Nuveen Investments, Inc., 9.50% Sr. Unsec. Nts., 10/15/203 | | | 1,290,000 | | | | 1,290,000 | |
| Pinafore LLC/Pinafore, Inc., 9% Sec. Nts., 10/1/18 | | | 2,872,000 | | | | 3,231,000 | |
| Springleaf Finance Corp., 6.90% Nts., Series J, 12/15/17 | | | 1,670,000 | | | | 1,503,000 | |
UBS AG (Jersey Branch):
4.28% Unsec. Sub. Nts., 4/29/49 | | | 185,000 | EUR | | | 234,414 | |
| 7.152% Unsec. Sub. Nts., 12/29/49 | | | 125,000 | EUR | | | 180,239 | |
| UBS Capital Securities Jersey Ltd., 8.836% Sub. Nts., 4/29/49 | | | 260,000 | EUR | | | 348,337 | |
Verso Paper Holdings LLC/Verso Paper, Inc.:
8.75% Sr. Sec. Nts., 2/1/19 | | | 2,530,000 | | | | 986,700 | |
| 11.75% Sr. Sec. Nts., 1/15/19 | | | 4,354,000 | | |
| 3,113,110
|
|
| | | | | | | | 19,811,707 | |
| Commercial Banks—3.1% | | | | | | | | |
| Alfa Bank/Alfa Bond Issuance plc, 7.875% Nts., 9/25/173 | | | 2,235,000 | | | | 2,503,200 | |
| Banco Bilbao Vizcaya Argentaria SA, 4% Sec. Nts., 2/25/25 | | | 180,000 | EUR | | | 229,556 | |
Banco BMG SA:
8.875% Unsec. Sub. Nts., 8/5/203 | | | 445,000 | | | | 344,875 | |
| 9.15% Nts., 1/15/163 | | | 1,304,000 | | | | 1,284,440 | |
| 9.95% Unsec. Unsub. Nts., 11/5/193 | | | 1,360,000 | | | | 1,135,600 | |
Banco do Brasil SA (Cayman):
3.875% Sr. Unsec. Nts., 10/10/22 | | | 1,890,000 | | | | 1,908,900 | |
| 9.25% Perpetual Jr. Sub. Bonds3,16 | | | 6,630,000 | | | | 8,237,775 | |
| Banco do Estado do Rio Grande do Sul SA, 7.375% Sub Nts., 2/2/223 | | | 3,915,000 | | | | 4,306,500 | |
| Banco Santander Mexico SA, 4.125% Sr. Unsec. Nts., 11/9/223 | | | 1,665,000 | | | | 1,698,300 | |
| Bancolombia SA, 5.125% Unsec. Sub. Nts., 9/11/22 | | | 1,930,000 | | | | 2,016,850 | |
| | | | | | | | |
| | | Principal
Amount | | | Value | |
| | | | | | | | | |
| Commercial Banks Continued | | | | | | | | |
Bank of Scotland plc:
4.875% Sr. Sec. Nts., 12/20/24 | | | 220,000 | GBP | | $ | 427,189 | |
| 4.875% Sr. Sec. Unsub. Nts., 11/8/16 | | | 140,000 | GBP | | | 258,236 | |
Barclays Bank plc:
4.75% Sub. Nts., 3/15/49 | | | 370,000 | EUR | | | 375,309 | |
| 6% Sr. Unsec. Sub. Nts., 1/14/21 | | | 100,000 | EUR | | | 149,720 | |
| BBVA Banco Continental SA, 5% Sr. Unsec. Nts., 8/26/223 | | | 1,445,000 | | | | 1,546,150 | |
| BBVA US Senior SAU, 4.664% Sr. Unsec. Nts., 10/9/15 | | | 630,000 | | | | 646,317 | |
| BOM Capital plc, 6.699% Sr. Unsec. Nts., 3/11/153 | | | 4,905,000 | | | | 5,211,563 | |
| Caixa Economica Federal, 2.375% Sr. Unsec. Nts., 11/6/173 | | | 1,975,000 | | | | 1,965,125 | |
CIT Group, Inc.:
4.25% Sr. Unsec. Nts., 8/15/17 | | | 405,000 | | | | 418,804 | |
| 5% Sr. Unsec. Nts., 8/15/22 | | | 1,625,000 | | | | 1,739,114 | |
| Corp Andina de Fomento, 4.375% Sr. Unsec. Unsub. Nts., 6/15/22 | | | 1,470,000 | | | | 1,597,278 | |
| Corp Financiera de Desarrollo SA, 4.75% Sr. Unsec. Nts., 2/8/223 | | | 2,295,000 | | | | 2,530,238 | |
| EUROFIMA Bonds, 6.25%, 12/28/18 | | | 935,000 | AUD | | | 1,072,653 | |
| Grupo Aval Ltd., 4.75% Sr. Unsec. Nts., 9/26/223 | | | 1,915,000 | | | | 1,943,725 | |
| Halyk Savings Bank of Kazakhstan JSC, 7.25% Unsec. Unsub. Nts., 5/3/173 | | | 680,000 | | | | 747,320 | |
| ICICI Bank Ltd., 6.375% Bonds, 4/30/223,4 | | | 1,850,000 | | | | 1,875,438 | |
Lloyds TSB Bank plc:
6% Sr. Sec. Nts., 2/8/29 | | | 385,000 | GBP | | | 826,567 | |
| 11.875% Unsec. Sub. Nts., 12/16/21 | | | 665,000 | EUR | | | 1,105,984 | |
| Norddeutsche Landesbank Girozentrale, 0.875% Sec. Nts., 10/16/153 | | | 505,000 | | | | 506,383 | |
| Royal Bank of Scotland NV, 6.50% Unsec. Sub. Nts., 5/17/184 | | | 255,000 | AUD | | | 230,639 | |
Royal Bank of Scotland plc (The):
2.375% Sr. Unsec. Sub. Nts., 11/2/15 | | | 80,000 | CHF | | | 83,908 | |
| 13.125% Unsec. Sub. Nts., 3/19/22 | | | 320,000 | AUD | | | 397,729 | |
Sberbank of Russia Via SB
Capital SA:
5.125% Sub. Nts., 10/29/223 | | | 3,760,000 | | | | 3,849,300 | |
| 5.40% Sr. Unsec. Nts., 3/24/17 | | | 1,075,000 | | | | 1,177,824 | |
| 6.125% Sr. Nts., 2/7/223 | | | 3,750,000 | | | | 4,293,750 | |
| Societe Generale SA, 2.75% Sr. Unsec. Nts., 10/12/17 | | | 505,000 | | | | 514,086 | |
| Sparebank 1 Boligkreditt AS, 1.75% Sec. Nts., 11/15/193 | | | 660,000 | | | | 652,410 | |
| | | | |
| 23 | | | | OPPENHEIMER GLOBAL STRATEGIC INCOME FUND/VA |
STATEMENT OF INVESTMENTS Continued
| | | | | | | | |
| | | Principal
Amount | | | Value | |
| | | | | | | | | |
| Commercial Banks Continued | | | | | | | | |
Stadshypotek AB:
1.875% Sec. Nts., 10/2/193 | | $ | 630,000 | | | $ | 630,185 | |
| 6% Sec. Unsub. Bonds, 6/21/17 | | | 5,385,000 | SEK | | | 975,789 | |
| State Bank of India (London), 4.125% Sr. Unsec. Unsub. Nts., 8/1/173 | | | 3,430,000 | | | | 3,534,711 | |
| Sumitomo Mitsui Banking Corp., 1.80% Sr. Unsec. Nts., 7/18/17 | | | 385,000 | | | | 392,623 | |
| Toronto-Dominion Bank (The), 1.50% Sec. Bonds, 3/13/173 | | | 510,000 | | | | 522,346 | |
| Turkiye Halk Bankasi AS, 4.875% Sr. Unsec. Nts., 7/19/173 | | | 1,630,000 | | | | 1,744,100 | |
Turkiye Is Bankasi:
3.875% Sr. Unsec. Nts., 11/7/173 | | | 2,335,000 | | | | 2,389,873 | |
| 6% Sub. Nts., 10/24/223 | | | 1,270,000 | | | | 1,344,613 | |
| VTB Bank OJSC Via VTB Capital SA, 6.95% Sub. Nts., 10/17/223 | | | 1,445,000 | | | | 1,560,600 | |
VTB Capital SA:
6.315% Nts., 2/22/183 | | | 1,135,000 | | | | 1,249,976 | |
| 6.465% Sr. Sec. Unsub. Nts., 3/4/153 | | | 1,100,000 | | | | 1,183,600 | |
| Westpac Banking Corp., 1.25% Sec. Nts., 12/15/173 | | | 530,000 | | | | 529,742 | |
Yapi ve Kredi Bankasi AS:
5.50% Unsec. Sub. Nts., 12/6/223 | | | 1,495,000 | | | | 1,509,950 | |
| 6.75% Sr. Unsec. Nts., 2/8/173 | | | 1,625,000 | | |
| 1,828,125
|
|
| | | | | | | | 79,204,988 | |
| Consumer Finance—0.2% | | | | | |
| Community Choice Financial, Inc., 10.75% Sr. Sec. Nts., 5/1/19 | | | 1,250,000 | | | | 1,209,375 | |
| JSC Astana Finance, 9.16% Nts., 3/14/128 | | | 7,200,000 | | | | 540,000 | |
| Milestone Aviation Group LLC, 8.625% Sr. Unsec. Nts., 12/15/173 | | | 1,645,000 | | | | 1,657,338 | |
| Speedy Cash, Inc., 10.75% Sr. Sec. Nts., 5/15/183 | | | 1,510,000 | | | | 1,615,700 | |
| TMX Finance LLC/TitleMax Finance Corp., 13.25% Sr. Sec. Nts., 7/15/15 | | | 1,155,000 | | |
| 1,287,825
|
|
| | | | | | | | 6,310,238 | |
| Diversified Financial Services—0.7% | |
| Autopistas del Nordeste Cayman Ltd., 9.39% Nts., 1/15/263 | | | 2,472,556 | | | | 2,598,409 | |
| Banco Invex SA, 31.938% Mtg.-Backed Certificates, Series 062U, 3/13/348,15 | | | 4,830,734 | MXN | | | 241,273 | |
| Caisse Centrale Desjardins du Quebec, 1.60% Sec. Bonds, 3/6/173 | | | 510,000 | | | | 523,517 | |
| Caixa Economica Federal, 3.50% Sr. Unsec. Nts., 11/7/223 | | | 1,460,000 | | | | 1,485,550 | |
| Export Credit Bank of Turkey, 5.875% Sr. Unsec. Nts., 4/24/193 | | | 2,715,000 | | | | 3,099,173 | |
| | | | | | | | |
| | | Principal
Amount | | | Value | |
| | | | | | | | | |
| Diversified Financial Services Continued | |
| GMAC LLC, 8% Sr. Unsec. Nts., 11/1/31 | | $ | 2,380,000 | | | $ | 3,025,575 | |
| ING Bank NV, 2.625% Sr. Sec. Nts., 12/5/223 | | | 1,065,000 | | | | 1,057,460 | |
Instituto de Credito Oficial:
5% Sr. Unsec. Unsub. Nts., 11/14/16 | | | 680,000 | | | | 690,061 | |
| 5% Sr. Unsec. Unsub. Nts., 4/10/17 | | | 1,335,000 | | | | 1,351,995 | |
JPMorgan Hipotecaria su Casita:
8.293% Sec. Nts., 8/26/355,15 | | | 5,808,600 | MXN | | | 44,936 | |
| 29.71% Mtg.-Backed Certificates, Series 06U, 9/25/354,15 | | | 1,491,837 | MXN | | | 219,554 | |
| Magyar Export-Import Bank RT, 5.50% Sr. Unsec. Nts., 2/12/183 | | | 1,315,000 | | | | 1,331,438 | |
| PHH Corp., 9.25% Sr. Unsec. Unsub. Nts., 3/1/16 | | | 2,615,000 | | | | 3,066,088 | |
| Rabobank Capital Funding Trust IV, 5.556% Unsec. Sub. Nts., 10/29/493 | | | 205,000 | GBP | |
| 335,389
|
|
| | | | | | | | 19,070,418 | |
| Insurance—0.0% | | | | | | | | |
| Swiss Reinsurance Co. via ELM BV, 4.455% Sr. Sec. Sub. Nts., 5/25/494 | | | 125,000 | AUD | | | 113,505 | |
| Real Estate Investment Trusts (REITs)—0.2% | |
| FelCor Escrow Holdings LLC, 6.75% Sr. Sec. Nts., 6/1/19 | | | 1,585,000 | | | | 1,691,988 | |
| Felcor Lodging LP, 5.625% Sr. Sec. Nts., 3/1/233 | | | 1,025,000 | | | | 1,022,438 | |
| OMEGA Healthcare Investors, Inc., 6.75% Sr. Unsec. Nts., 10/15/22 | | | 3,165,000 | | |
| 3,457,763
|
|
| | | | | | | | 6,172,189 | |
| Real Estate Management & Development—0.3% | |
| BR Malls International Finance Ltd., 8.50% Sr. Unsec. Unsub. Nts., 1/29/493 | | | 850,000 | | | | 939,250 | |
Realogy Corp.:
7.625% Sr. Sec. Nts., 1/15/203 | | | 2,535,000 | | | | 2,883,563 | |
| 9% Sr. Sec. Nts., 1/15/203 | | | 1,295,000 | | | | 1,495,725 | |
| Wallace Theater Holdings, Inc., 12.50% Sr. Sec. Nts., 6/15/133,4 | | | 1,525,000 | | |
| 1,517,375
|
|
| | | | | | | | 6,835,913 | |
| Thrifts & Mortgage Finance—0.0% | | | | | |
| Credit Mutuel/CIC Home Loan SFH, 1.50% Sec. Nts., 11/16/173 | | | 395,000 | | | | 391,846 | |
| Health Care—1.1% | | | | | | | | |
| Biotechnology—0.1% | | | | | | | | |
| Grifols SA, 8.25% Sr. Sec. Nts., 2/1/18 | | | 995,000 | | | | 1,100,719 | |
| Universal Hospital Services, Inc., 7.625% Sr. Sec. Nts., 8/15/203 | | | 590,000 | | |
| 623,188
|
|
| | | | | | | | 1,723,907 | |
| | | | |
| 24 | | | | OPPENHEIMER GLOBAL STRATEGIC INCOME FUND/VA |
| | | | | | | | |
| | | Principal
Amount | | | Value | |
| | | | | | | | | |
| Health Care Equipment & Supplies—0.2% | |
| Accellent, Inc., 10% Sr. Unsec. Sub. Nts., 11/1/17 | | $ | 1,470,000 | | | $ | 1,216,425 | |
Alere, Inc.:
7.25% Sr. Unsec. Nts., 7/1/183 | | | 510,000 | | | | 513,825 | |
| 8.625% Sr. Unsec. Sub. Nts., 10/1/18 | | | 541,147 | | | | 546,558 | |
| Biomet, Inc., 6.50% Sr. Unsec. Nts., 8/1/203 | | | 1,445,000 | | | | 1,540,731 | |
| Chiron Merger Sub, Inc., 10.50% Sec. Nts., 11/1/183 | | | 910,000 | | | | 958,913 | |
| Hologic, Inc., 6.25% Sr. Unsec. Nts., 8/1/203 | | | 185,000 | | |
| 200,263
|
|
| | | | | | | | 4,976,715 | |
| Health Care Providers & Services—0.6% | |
| Catalent Pharma Solutions, Inc., 9.50% Sr. Unsec. Nts., 4/15/15 | | | 551 | | | | 565 | |
| CHS/Community Health Systems, Inc., 7.125% Sr. Unsec. Unsub. Nts., 7/15/20 | | | 990,000 | | | | 1,058,063 | |
Fresenius Medical Care US Finance II, Inc.:
5.625% Sr. Unsec. Nts., 7/31/193 | | | 805,000 | | | | 868,394 | |
| 5.875% Sr. Unsec. Nts., 1/31/223 | | | 405,000 | | | | 441,450 | |
| Gentiva Health Services, Inc., 11.50% Sr. Unsec. Unsub. Nts., 9/1/18 | | | 1,510,000 | | | | 1,434,500 | |
| HCA, Inc., 7.50% Sr. Unsec. Unsub. Nts., 2/15/22 | | | 1,095,000 | | | | 1,259,250 | |
| HealthSouth Corp., 8.125% Sr. Unsec. Unsub. Nts., 2/15/20 | | | 514,000 | | | | 568,613 | |
| Kindred Healthcare, Inc., 8.25% Sr. Unsec. Nts., 6/1/19 | | | 2,765,000 | | | | 2,702,788 | |
| Multiplan, Inc., 9.875% Sr. Nts., 9/1/183 | | | 1,390,000 | | | | 1,556,800 | |
| PSS World Medical, Inc., 6.375% Sr. Unsec. Unsub. Nts., 3/1/22 | | | 585,000 | | | | 693,225 | |
Radiation Therapy Services, Inc.:
8.875% Sr. Sec. Nts., 1/15/17 | | | 1,375,000 | | | | 1,354,375 | |
| 9.875% Sr. Unsec. Sub. Nts., 4/15/17 | | | 125,000 | | | | 88,750 | |
| US Oncology, Inc., Escrow Shares (related to 9.125% Sr. Sec. Nts., 8/15/17)8 | | | 2,165,000 | | | | 46,006 | |
| Vanguard Health Holding Co. II LLC/Vanguard Holding Co. II, Inc., 8% Sr. Nts., 2/1/18 | | | 1,970,000 | | |
| 2,048,800
|
|
| | | | | | | | 14,121,579 | |
| Health Care Technology—0.0% | | | | | |
| MedAssets, Inc., 8% Sr. Unsec. Nts., 11/15/18 | | | 380,000 | | | | 414,200 | |
| Life Sciences Tools & Services—0.0% | |
| Jaguar Holding Co./Jaguar Merger Sub, Inc., 9.50% Sr. Unsec. Nts., 12/1/193 | | | 990,000 | | | | 1,128,600 | |
| | | | | | | | |
| | | Principal
Amount | | | Value | |
| | | | | | | | | |
| Pharmaceuticals—0.2% | | | | | | | | |
| Mylan, Inc., 6% Sr. Nts., 11/15/183 | | $ | 810,000 | | | $ | 894,871 | |
| Valeant Pharmaceuticals International, Inc., 6.875% Sr. Unsec. Nts., 12/1/183 | | | 955,000 | | | | 1,033,788 | |
| Warner Chilcott Co. LLC/Warner Chilcott Finance LLC, 7.75% Sr. Unsec. Nts., 9/15/18 | | | 2,465,000 | | |
| 2,637,550
|
|
| | | | | | | | 4,566,209 | |
| Industrials—3.5% | | | | | | | | |
| Aerospace & Defense—0.7% | |
| BE Aerospace, Inc., 6.875% Sr. Nts., 10/1/20 | | | 1,080,000 | | | | 1,206,900 | |
| DynCorp International, Inc., 10.375% Sr. Unsec. Nts., 7/1/17 | | | 5,090,000 | | | | 4,682,800 | |
| Embraer SA, 5.15% Sr. Unsec. Unsub. Nts., 6/15/22 | | | 1,655,000 | | | | 1,816,363 | |
| Huntington Ingalls Industries, Inc., 7.125% Sr. Unsec. Unsub. Nts., 3/15/21 | | | 2,215,000 | | | | 2,419,888 | |
| Kratos Defense & Security Solutions, Inc., 10% Sr. Sec. Nts., 6/1/17 | | | 1,307,000 | | | | 1,440,968 | |
| Schaeffler Finance BV, 8.50% Sr. Sec. Nts., 2/15/193 | | | 1,400,000 | | | | 1,589,000 | |
| TransDigm, Inc., 7.75% Sr. Unsec. Sub. Nts., 12/15/18 | | | 3,140,000 | | | | 3,489,325 | |
| Triumph Group, Inc., 8.625% Sr. Unsec. Nts., 7/15/18 | | | 650,000 | | |
| 724,750
|
|
| | | | | | | | 17,369,994 | |
| Air Freight & Logistics—0.2% | | | | | |
| Air Medical Group Holdings, Inc., 9.25% Sr. Sec. Nts., 11/1/18 | | | 1,485,000 | | | | 1,648,350 | |
| SPL Logistics Escrow LLC/SPL Logistics Finance Corp., 8.875% Sr. Sec. Nts., 8/1/203 | | | 2,560,000 | | |
| 2,726,400
|
|
| | | | | | | | 4,374,750 | |
| Airlines—0.0% | | | | | | | | |
| American Airlines 2011-2 Class A Pass-Through Trust, 8.625% Sec. Certificates, 4/15/23 | | | 921,329 | | | | 955,879 | |
| Building Products—0.2% | | | | | | | | |
| Nortek, Inc., 8.50% Sr. Unsec. Nts., 4/15/213 | | | 2,315,000 | | | | 2,575,438 | |
| Ply Gem Industries, Inc., 9.375% Sr. Nts., 4/15/173 | | | 1,895,000 | | |
| 2,022,913
|
|
| | | | | | | | 4,598,351 | |
| Commercial Services & Supplies—0.3% | |
| Cenveo Corp., 8.875% Sec. Nts., 2/1/18 | | | 975,000 | | | | 931,125 | |
| | | | |
| 25 | | | | OPPENHEIMER GLOBAL STRATEGIC INCOME FUND/VA |
STATEMENT OF INVESTMENTS Continued
| | | | | | | | |
| | | Principal
Amount | | | Value | |
| | | | | | | | | |
| Commercial Services & Supplies Continued | |
| First Data Corp., 6.75% Sr. Sec. Nts., 11/1/203 | | $ | 1,630,000 | | | $ | 1,654,450 | |
| R.R. Donnelley & Sons Co., 7.25% Sr. Nts., 5/15/18 | | | 3,130,000 | | | | 3,036,100 | |
| STHI Holding Corp., 8% Sec. Nts., 3/15/183 | | | 995,000 | | | | 1,082,063 | |
| West Corp., 8.625% Sr. Unsec. Nts., 10/1/18 | | | 2,285,000 | | |
| 2,404,963
|
|
| | | | | | | | 9,108,701 | |
| Construction & Engineering—0.3% | |
| IIRSA Norte Finance Ltd., 8.75% Sr. Nts., 5/30/245 | | | 3,511,757 | | | | 4,332,806 | |
| OAS Investments GmbH, 8.25% Sr. Nts., 10/19/193 | | | 1,020,000 | | | | 1,083,750 | |
| Odebrecht Finance Ltd., 7.125% Sr. Nts., 6/26/423 | | | 2,100,000 | | |
| 2,446,500
|
|
| | | | | | | | 7,863,056 | |
| Electrical Equipment—0.1% | |
| General Cable Corp., 5.75% Sr. Unsec. Unsub. Nts., 10/1/223 | | | 975,000 | | | | 1,014,000 | |
| Thermon Industries, Inc., 9.50% Sr. Sec. Nts., 5/1/17 | | | 1,397,000 | | |
| 1,557,655
|
|
| | | | | | | | 2,571,655 | |
| Industrial Conglomerates—0.0% | |
| GE Capital Australia Funding Pty Ltd., 7% Bonds, 10/8/15 | | | 625,000 | AUD | | | 702,360 | |
| Machinery—0.7% | | | | | | | | |
| Actuant Corp., 5.625% Sr. Unsec. Unsub. Nts., 6/15/22 | | | 1,560,000 | | | | 1,622,400 | |
| Cleaver-Brooks, Inc., 8.75% Sr. Sec. Nts., 12/15/193 | | | 1,440,000 | | | | 1,490,400 | |
| CNH Capital LLC, 6.25% Sr. Unsec. Nts., 11/1/16 | | | 670,000 | | | | 742,025 | |
| HD Supply, Inc., 13.50% Sr. Unsec. Sub. Nts., 9/1/157 | | | 1,215,000 | | | | 1,251,450 | |
| Manitowoc Co., Inc. (The), 8.50% Sr. Unsec. Nts., 11/1/20 | | | 3,410,000 | | | | 3,844,775 | |
| Navistar International Corp., 3% Cv. Sr. Sub. Nts., 10/15/14 | | | 1,390,000 | | | | 1,276,194 | |
| Terex Corp., 6% Sr. Unsec. Nts., 5/15/21 | | | 3,100,000 | | | | 3,278,250 | |
| Thermadyne Holdings Corp., 9% Sr. Sec. Nts., 12/15/17 | | | 2,435,000 | | | | 2,605,450 | |
| Xerium Technologies, Inc., 8.875% Sr. Unsec. Nts., 6/15/18 | | | 1,580,000 | | |
| 1,429,900
|
|
| | | | | | | | 17,540,844 | |
| | | | | | | | |
| | | Principal
Amount | | | Value | |
| | | | | | | | | |
| Marine—0.2% | | | | | | | | |
| Drill Rigs Holdings, Inc., 6.50% Sr. Sec. Nts., 10/1/173 | | $ | 255,000 | | | $ | 255,000 | |
| Marquette Transportation Co./Marquette Transportation Finance Corp., 10.875% Sec. Nts., 1/15/17 | | | 3,570,000 | | | | 3,730,650 | |
| Navios Maritime Holdings, Inc./Navios Maritime Finance U.S., Inc., 8.875% Sr. Sec. Nts., 11/1/17 | | | 725,000 | | |
| 726,813
|
|
| | | | | | | | 4,712,463 | |
| Professional Services—0.1% | |
| Altegrity, Inc., 10.50% Sr. Unsec. Sub. Nts., 11/1/155 | | | 1,275,000 | | | | 1,122,000 | |
| FTI Consulting, Inc., 6% Sr. Unsec. Unsub. Nts., 11/15/223 | | | 2,565,000 | | |
| 2,667,600
|
|
| | | | | | | | 3,789,600 | |
| Road & Rail—0.4% | | | | | | | | |
| Avis Budget Car Rental LLC/Avis Budget Finance, Inc., 8.25% Sr. Unsec. Unsub. Nts., 1/15/19 | | | 1,150,000 | | | | 1,276,500 | |
| Hertz Corp. (The), 7.50% Sr. Unsec. Nts., 10/15/18 | | | 3,080,000 | | | | 3,418,800 | |
| Kazakhstan Temir Zholy Finance BV, 6.375% Sr. Unsec. Nts., 10/6/203 | | | 810,000 | | | | 984,150 | |
| Kenan Advantage Group, Inc. (The), 8.375% Sr. Unsec. Nts., 12/15/183 | | | 1,025,000 | | | | 1,050,625 | |
| Western Express, Inc., 12.50% Sr. Sec. Nts., 4/15/153 | | | 4,775,000 | | |
| 2,960,500
|
|
| | | | | | | | 9,690,575 | |
| Trading Companies & Distributors—0.3% | |
| Aircastle Ltd., 6.25% Sr. Unsec. Nts., 12/1/193 | | | 820,000 | | | | 858,950 | |
| International Lease Finance Corp.: | | | | | | | | |
| 8.625% Sr. Unsec. Unsub. Nts., 9/15/15 | | | 410,000 | | | | 462,275 | |
| 8.75% Sr. Unsec. Unsub. Nts., 3/15/17 | | | 2,097,000 | | | | 2,432,520 | |
| UR Financing Escrow Corp.: | | | | | | | | |
| 7.375% Sr. Unsec. Nts., 5/15/203 | | | 3,115,000 | | | | 3,434,288 | |
| 7.625% Sr. Unsec. Nts., 4/15/223 | | | 775,000 | | |
| 869,938
|
|
| | | | | | | | 8,057,971 | |
| Information Technology—1.1% | |
| Communications Equipment—0.2% | |
| Avaya, Inc., 7% Sr. Sec. Nts., 4/1/193 | | | 1,400,000 | | | | 1,316,000 | |
| ViaSat, Inc., 6.875% Sr. Unsec. Unsub. Nts., 6/15/20 | | | 1,166,000 | | | | 1,224,300 | |
| Zayo Group LLC/Zayo Capital, Inc.: | | | | | | | | |
| 8.125% Sr. Sec. Nts., 1/1/20 | | | 590,000 | | | | 659,325 | |
| 10.125% Sr. Sec. Nts., 7/1/20 | | | 390,000 | | |
| 445,575
|
|
| | | | | | | | 3,645,200 | |
| | | | |
| 26 | | | | OPPENHEIMER GLOBAL STRATEGIC INCOME FUND/VA |
| | | | | | | | |
| | | Principal
Amount | | | Value | |
| | | | | | | | | |
| Computers & Peripherals—0.1% | |
| Seagate HDD (Cayman), 7% Sr. Unsec. Nts., 11/1/21 | | $ | 2,135,000 | | | $ | 2,300,463 | |
| Electronic Equipment, Instruments & Components—0.0% | |
| Anixter, Inc., 5.625% Sr. Unsec. Nts., 5/1/19 | | | 980,000 | | | | 1,036,350 | |
| Internet Software & Services—0.2% | |
| IAC/InterActiveCorp, 4.75% Sr. Unsec. Nts., 12/15/223 | | | 725,000 | | | | 725,000 | |
| ITC DeltaCom, Inc., 10.50% Sr. Sec. Nts., 4/1/16 | | | 4,216,000 | | |
| 4,532,200
|
|
| | | | | | | | 5,257,200 | |
| IT Services—0.3% | | | | | | | | |
| Ceridian Corp., 11.25% Sr. Unsec. Nts., 11/15/15 | | | 1,260,000 | | | | 1,266,300 | |
| First Data Corp.: | | | | | | | | |
| 9.875% Sr. Unsec. Nts., 9/24/15 | | | 1,220,000 | | | | 1,250,500 | |
| 12.625% Sr. Unsec. Nts., 1/15/21 | | | 2,145,000 | | | | 2,268,338 | |
| iPayment, Inc., 10.25% Sr. Unsec. Nts., 5/15/18 | | | 4,190,000 | | |
| 3,383,425
|
|
| | | | | | | | 8,168,563 | |
| Semiconductors & Semiconductor Equipment—0.2% | |
| Advanced Micro Devices, Inc., 7.50% Sr. Unsec. Nts., 8/15/223 | | | 930,000 | | | | 769,575 | |
| Freescale Semiconductor, Inc.: | | | | | | | | |
| 9.25% Sr. Sec. Nts., 4/15/183 | | | 1,935,000 | | | | 2,123,663 | |
| 10.75% Sr. Unsec. Nts., 8/1/20 | | | 1,463,000 | | |
| 1,576,383
|
|
| | | | | | | | 4,469,621 | |
| Software—0.1% | | | | | | | | |
| Infor US, Inc., 9.375% Sr. Unsec. Nts., 4/1/19 | | | 485,000 | | | | 546,838 | |
| SunGard Data Systems, Inc.: | | | | | | | | |
| 7.375% Sr. Unsec. Nts., 11/15/18 | | | 720,000 | | | | 774,900 | |
| 7.625% Sr. Unsec. Nts., 11/15/20 | | | 765,000 | | |
| 839,588
|
|
| | | | | | | | 2,161,326 | |
| Materials—2.1% | | | | | | | | |
| Chemicals—0.4% | | | | | | | | |
| ADS Waste Holdings, Inc., 8.25% Sr. Nts., 10/1/203 | | | 465,000 | | | | 490,575 | |
| Alphabet Holding Co., Inc., 7.75% Sr. Unsec. Nts., 11/1/173,7 | | | 1,160,000 | | | | 1,197,700 | |
| Braskem Finance Ltd., 5.375% Sr. Unsec. Nts., 5/2/223 | | | 1,560,000 | | | | 1,618,500 | |
| Hexion U.S. Finance Corp./Hexion Nova Scotia Finance ULC, 8.875% Sr. Sec. Nts., 2/1/18 | | | 1,260,000 | | | | 1,300,950 | |
| Ineos Finance plc, 8.375% Sr. Sec. Bonds, 2/15/193 | | | 1,920,000 | | | | 2,076,000 | |
| LyondellBasell Industries NV, 6% Sr. Unsec. Nts., 11/15/21 | | | 670,000 | | | | 788,925 | |
| | | | | | | | |
| | | Principal
Amount | | | Value | |
| | | | | | | | | |
| Chemicals Continued | | | | | | | | |
| Mexichem SAB de CV: | | | | | | | | |
| 4.875% Sr. Unsec. Nts., 9/19/223 | | $ | 905,000 | | | $ | 977,400 | |
| 6.75% Sr. Unsec. Nts., 9/19/423 | | | 760,000 | | | | 855,000 | |
| MPM Escrow LLC/MPM Finance Escrow Corp., 8.875% Sr. Sec. Nts., 10/15/203 | | | 930,000 | | | | 942,788 | |
| PQ Corp., 8.75% Sr. Sec. Nts., 5/1/183 | | | 1,050,000 | | | | 1,107,750 | |
| Scotts Miracle-Gro Co. (The), 6.625% Sr. Unsec. Unsub. Nts., 12/15/20 | | | 320,000 | | |
| 352,800
|
|
| | | | | | | | 11,708,388 | |
| Construction Materials—0.4% | |
| Building Materials Corp. of America, 6.75% Sr. Nts., 5/1/213 | | | 1,975,000 | | | | 2,187,313 | |
| CEMEX Espana Luxembourg, 9.875% Sr. Sec. Nts., 4/30/193 | | | 2,080,000 | | | | 2,329,600 | |
| CEMEX Finance LLC, 9.375% Sr. Sec. Nts., 10/12/223 | | | 1,805,000 | | | | 2,039,650 | |
| CEMEX SAB de CV, 9% Sr. Sec. Nts., 1/11/183 | | | 1,360,000 | | | | 1,479,000 | |
| Ply Gem Industries, Inc., 8.25% Sr. Sec. Nts., 2/15/18 | | | 1,685,000 | | |
| 1,828,225
|
|
| | | | | | | | 9,863,788 | |
| Containers & Packaging—0.1% | |
| Consolidated Container Co. LLC/Consolidated Container Capital, Inc., 10.125% Sr. Unsec. Nts., 7/15/203 | | | 590,000 | | | | 634,250 | |
| Polymer Group, Inc., 7.75% Sr. Sec. Nts., 2/1/19 | | | 2,725,000 | | | | 2,936,188 | |
| Sealed Air Corp., 6.50% Sr. Unsec. Nts., 12/1/203 | | | 410,000 | | |
| 444,850
|
|
| | | | | | | | 4,015,288 | |
| Metals & Mining—0.9% | |
Aleris International, Inc.:
7.625% Sr. Unsec. Nts., 2/15/18 | | | 2,655,000 | | | | 2,714,738 | |
| 7.875% Sr. Unsec. Nts., 11/1/203 | | | 1,160,000 | | | | 1,164,350 | |
| Alrosa Co. Ltd., 8.25% Sr. Unsec. Nts., 6/23/154 | | | 19,220,000 | RUR | | | 631,922 | |
| Alrosa Finance SA, 7.75% Nts., 11/3/203 | | | 3,240,000 | | | | 3,774,600 | |
| Consolidated Minerals Ltd., 8.875% Sr. Sec. Nts., 5/1/163 | | | 1,245,000 | | | | 1,076,925 | |
| CSN Islands XI Corp., 6.875% Sr. Unsec. Nts., 9/21/193 | | | 1,445,000 | | | | 1,625,625 | |
| CSN Resources SA, 6.50% Sr. Unsec. Unsub. Nts., 7/21/203 | | | 1,585,000 | | | | 1,727,650 | |
| | | | |
| 27 | | | | OPPENHEIMER GLOBAL STRATEGIC INCOME FUND/VA |
STATEMENT OF INVESTMENTS Continued
| | | | | | | | |
| | | Principal
Amount | | | Value | |
| | | | | | | | | |
| Metals & Mining Continued | | | | | | | | |
| Ferrexpo Finance plc, 7.875% Sr. Unsec. Bonds, 4/7/163 | | $ | 1,435,000 | | | $ | 1,399,125 | |
| JMC Steel Group, Inc., 8.25% Sr. Unsec. Nts., 3/15/183 | | | 205,000 | | | | 215,250 | |
| Mexico Generadora de Energia S de RL, 5.50% Sr. Sec. Nts., 12/6/323 | | | 1,120,000 | | | | 1,184,400 | |
| Novelis, Inc., 8.75% Sr. Unsec. Nts., 12/15/20 | | | 600,000 | | | | 672,000 | |
| Novolipetsk Steel OJSC, 4.95% Nts., 9/26/193 | | | 2,005,000 | | | | 2,038,253 | |
| Samarco Mineracao SA, 4.125% Sr. Unsec. Nts., 11/1/223 | | | 1,865,000 | | | | 1,902,300 | |
| Severstal OAO Via Steel Capital SA, 5.90% Sr. Unsec. Nts., 10/17/223 | | | 2,230,000 | | |
| 2,260,663
|
|
| | | | | | | | 22,387,801 | |
| Paper & Forest Products—0.3% | |
| Appleton Papers, Inc., 10.50% Sr. Sec. Nts., 6/15/153 | | | 170,000 | | | | 181,050 | |
Catalyst Paper Corp.:
11.79% Sr. Sec. Nts., 12/15/167 | | | 3,308,571 | | | | 2,531,057 | |
| 13% Sec. Nts., 12/15/164,5 | | | 842,338 | | | | 817,068 | |
| NewPage Corp., 11.375% Sr. Sec. Nts., 12/31/148 | | | 3,653,581 | | | | 1,524,269 | |
| Norske Skogindustrier ASA, 6.125% Unsec. Bonds, 10/15/153 | | | 1,875,000 | | |
| 1,584,375
|
|
| | | | | | | | 6,637,819 | |
| Telecommunication Services—2.7% | |
| Diversified Telecommunication Services—1.3% | |
| Brasil Telecom SA, 9.75% Sr. Unsec. Nts., 9/15/163 | | | 2,990,000 | BRR | | | 1,540,635 | |
| Cequel Communications Escrow 1 LLC/Cequel Escrow Capital Corp., 6.375% Sr. Nts., 9/15/203 | | | 4,245,000 | | | | 4,441,331 | |
Cincinnati Bell, Inc.:
8.25% Sr. Nts., 10/15/17 | | | 1,750,000 | | | | 1,894,375 | |
| 8.75% Sr. Unsec. Sub. Nts., 3/15/18 | | | 1,330,000 | | | | 1,379,875 | |
| Colombia Telecomunicaciones SA ESP, 5.375% Sr. Unsec. Nts., 9/27/223 | | | 1,295,000 | | | | 1,319,281 | |
Frontier Communications Corp.:
8.25% Sr. Unsec. Nts., 4/15/17 | | | 1,220,000 | | | | 1,415,200 | |
| 8.50% Sr. Unsec. Nts., 4/15/20 | | | 815,000 | | | | 941,325 | |
Intelsat Bermuda Ltd.:
11.25% Sr. Unsec. Nts., 2/4/17 | | | 2,435,000 | | | | 2,584,144 | |
| 11.50% Sr. Unsec. Nts., 2/4/177 | | | 1,425,124 | | | | 1,519,538 | |
| Intelsat Jackson Holdings SA, 7.25% Sr. Unsec. Nts., 10/15/20 | | | 755,000 | | | | 823,894 | |
| Level 3 Communications, Inc., 8.875% Sr. Unsec. Nts., 6/1/193 | | | 2,125,000 | | | | 2,271,094 | |
| | | | | | | | |
| | | Principal
Amount | | | Value | |
| | | | | | | | | |
| Diversified Telecommunication Services Continued | |
| Level 3 Financing, Inc., 9.375% Sr. Unsec. Unsub. Nts., 4/1/19 | | $ | 765,000 | | | $ | 858,713 | |
| Telefonica Chile SA, 3.875% Sr. Unsec. Nts., 10/12/223 | | | 1,620,000 | | | | 1,623,455 | |
| Telemar Norte Leste SA, 5.50% Sr. Unsec. Nts., 10/23/203 | | | 6,640,000 | | | | 6,938,800 | |
| Wind Acquisition Finance SA, 7.25% Sr. Sec. Nts., 2/15/183 | | | 2,535,000 | | | | 2,579,363 | |
| Windstream Corp., 7.50% Sr. Unsec. Unsub. Nts., 6/1/223 | | | 1,215,000 | | |
| 1,293,975
|
|
| | | | | | | | 33,424,998 | |
| Wireless Telecommunication Services—1.4% | |
America Movil SAB de CV:
6.45% Sr. Unsec. Nts., 12/5/22 | | | 30,350,000 | MXN | | | 2,421,776 | |
| 8.46% Sr. Unsec. Unsub. Bonds, 12/18/36 | | | 14,700,000 | MXN | | | 1,257,769 | |
| Cricket Communications, Inc., 7.75% Sr. Unsec. Nts., 10/15/20 | | | 1,960,000 | | | | 2,009,000 | |
| Crown Castle International Corp., 5.25% Sr. Unsec. Nts., 1/15/233 | | | 1,165,000 | | | | 1,250,919 | |
| Digicel Group Ltd., 8.25% Sr. Unsec. Nts., 9/30/203 | | | 1,355,000 | | | | 1,497,275 | |
| Leap Wireless International, Inc., 4.50% Cv. Sr. Unsec. Nts., 7/15/14 | | | 1,540,000 | | | | 1,476,475 | |
| MetroPCS Wireless, Inc., 6.625% Sr. Unsec. Nts., 11/15/20 | | | 2,490,000 | | | | 2,654,963 | |
| MTS International Funding Ltd., 8.625% Sr. Unsec. Nts., 6/22/203 | | | 2,485,000 | | | | 3,146,631 | |
| SBA Telecommunications, Inc., 5.75% Sr. Unsec. Unsub. Nts., 7/15/203 | | | 785,000 | | | | 837,006 | |
| Sprint Capital Corp., 6.875% Sr. Unsec. Nts., 11/15/28 | | | 1,445,000 | | | | 1,510,025 | |
| Sprint Nextel Corp., 9% Sr. Unsec. Nts., 11/15/183 | | | 1,400,000 | | | | 1,732,500 | |
Vimpel Communications:
8.85% Sr. Unsec. Nts., 3/8/224 | | | 21,900,000 | RUR | | | 719,857 | |
| 8.85% Sr. Unsec. Nts., 3/8/224 | | | 21,900,000 | RUR | | | 719,499 | |
Vimpel Communications/VIP Finance Ireland Ltd. OJSC:
7.748% Sec. Nts., 2/2/213 | | | 1,695,000 | | | | 1,961,963 | |
| 9.125% Sr. Unsec. Nts., 4/30/183 | | | 6,045,000 | | | | 7,352,231 | |
| VimpelCom, 7.504% Sr. Unsec. Unsub. Nts., 3/1/223 | | | 3,760,000 | | | | 4,319,300 | |
| Wind Acquisition Finance SA, 11.75% Sr. Sec. Nts., 7/15/173 | | | 905,000 | | |
| 952,513
|
|
| | | | | | | | 35,819,702 | |
| | | | |
| 28 | | | | OPPENHEIMER GLOBAL STRATEGIC INCOME FUND/VA |
| | | | | | | | |
| | | Principal
Amount | | | Value | |
| | | | | | | | | |
| Utilities—2.4% | | | | | | | | |
| Electric Utilities—1.3% | |
| Dubai Electricity & Water Authority, 7.375% Sr. Unsec. Unsub. Nts., 10/21/203 | | $ | 2,115,000 | | | $ | 2,612,025 | |
| Empresa Distribuidora y Comercializadora Norte SA, 9.75% Nts., 10/25/223 | | | 910,000 | | | | 409,500 | |
| Empresas Publicas de Medellin ESP, 7.625% Sr. Unsec. Nts., 7/29/193 | | | 1,495,000 | | | | 1,883,700 | |
Eskom Holdings Ltd.:
7.85% Sr. Unsec. Unsub. Nts., Series ES26, 4/2/26 | | | 35,000,000 | ZAR | | | 4,141,283 | |
| 10% Nts., Series ES23, 1/25/23 | | | 44,000,000 | ZAR | | | 6,234,277 | |
Israel Electric Corp. Ltd.:
6.70% Sr. Unsec. Nts., 2/10/173 | | | 1,870,000 | | | | 2,020,834 | |
| 7.25% Nts., 1/15/193 | | | 8,075,000 | | | | 8,778,228 | |
Majapahit Holding BV:
7.75% Nts., 10/17/163 | | | 1,630,000 | | | | 1,933,588 | |
| 8% Sr. Unsec. Nts., 8/7/193 | | | 1,245,000 | | | | 1,581,150 | |
| National Power Corp., 5.875% Unsec. Unsub. Bonds, 12/19/16 | | | 109,600,000 | PHP | | | 2,866,373 | |
| Perusahaan Listrik Negara PT, 5.50% Sr. Unsec. Nts., 11/22/213 | | | 2,095,000 | | |
| 2,377,825
|
|
| | | | | | | | 34,838,783 | |
| Energy Traders—0.7% | |
AES Corp. (The):
7.375% Sr. Unsec. Unsub. Nts., 7/1/21 | | | 525,000 | | | | 585,375 | |
| 8% Sr. Unsec. Unsub. Nts., 10/15/17 | | | 1,100,000 | | | | 1,276,000 | |
Calpine Corp.:
7.50% Sr. Sec. Nts., 2/15/213 | | | 1,026,000 | | | | 1,138,860 | |
| 7.875% Sr. Sec. Nts., 1/15/233 | | | 500,000 | | | | 567,500 | |
| Colbun SA, 6% Sr. Unsec. Nts., 1/21/203 | | | 3,320,000 | | | | 3,706,471 | |
| Comision Federal de Electricidad, 4.875% Sr. Nts., 5/26/213 | | | 1,775,000 | | | | 2,027,938 | |
| Energy Future Holdings Corp., 10% Sr. Sec. Nts., 1/15/20 | | | 2,370,000 | | | | 2,660,325 | |
| Energy Future Intermediate Holding Co. LLC/EFIH Fiance, Inc., 11.75% Sec. Nts., 3/1/223 | | | 2,605,000 | | | | 2,904,575 | |
| First Wind Capital LLC, 10.25% Sr. Sec. Nts., 6/1/183 | | | 345,000 | | | | 356,213 | |
| Foresight Energy LLC, 9.625% Sr. Unsec. Nts., 8/15/173 | | | 1,640,000 | | | | 1,763,000 | |
| NRG Energy, Inc., 6.625% Sr. Unsec. Nts., 3/15/233 | | | 490,000 | | | | 526,750 | |
| Perusahaan Listrik Negara PT, 5.25% Sr. Unsec. Nts., 10/24/423 | | | 1,500,000 | | |
| 1,552,500
|
|
| | | | | | | | 19,065,507 | |
| | | | | | | | |
| | | Principal
Amount | | | Value | |
| | | | | | | | | |
| Gas Utilities—0.3% | | | | | | | | |
| AmeriGas Finance LLC/AmeriGas Finance Corp., 6.75% Sr. Unsec. Nts., 5/20/20 | | $ | 2,455,000 | | | $ | 2,706,638 | |
| Empresa de Energia de Bogota SA ESP, 6.125% Sr. Unsec. Unsub. Nts., 11/10/213 | | | 1,460,000 | | | | 1,646,150 | |
| Transportadora de Gas Internacional SA ESP, 5.70% Sr. Unsec. Nts., 3/20/223 | | | 2,130,000 | | |
| 2,364,300
|
|
| | | | | | | | 6,717,088 | |
| Multi-Utilities—0.1% | |
| Abu Dhabi National Energy Co., 3.625% Sr. Unsec. Unsub. Nts., 1/12/233 | | | 1,400,000 | | |
| 1,449,000
|
|
| Total Corporate Bonds and Notes (Cost $726,097,562) | | | | | | | 749,509,579 | |
| | | Shares | | | | |
| Preferred Stocks—0.2% | |
| Ally Financial, Inc., 7% Cum., Series G, Non-Vtg. | | | 2,624 | | | | 2,577,342 | |
| Greektown Superholdings, Inc., Cv., Series A-12 | | | 37,051 | | |
| 2,778,825
|
|
Total Preferred Stocks
(Cost $6,101,898) | | | | | | | 5,356,167 | |
| Common Stocks—0.2% | |
| American Media Operations, Inc.2 | | | 219,796 | | | | 2,527,654 | |
| Arco Capital Corp. Ltd.2,5 | | | 690,638 | | | | 1,035,957 | |
| Catalyst Paper Corp.2 | | | 190,921 | | | | 143,954 | |
| Global Aviation Holdings, Inc.2 | | | 400 | | | | — | |
| Greektown Superholdings, Inc., Series A-12 | | | 4,324 | | | | 268,088 | |
| Nortek, Inc.2 | | | 21,483 | | | | 1,423,249 | |
| Premier Holdings Ltd.2 | | | 18,514 | | |
| —
|
|
Total Common Stocks
(Cost $21,368,102) | | | | | | | 5,398,902 | |
| | | Units | | | | |
| Rights, Warrants and Certificates—0.0% | |
| MediaNews Group, Inc. Wts., Strike Price $0.001, Exp. 3/19/172 (Cost $6,331,150) | | | 22,685 | | | | 816 | |
| | |
| | | Principal
Amount | | | | |
| Structured Securities—2.8% | |
| Citigroup Funding, Inc., Colombia (Republic of) Credit Linked Nts., 11%, 7/27/205 | | | 2,500,000,000 | COP | | | 1,909,363 | |
| | | | |
| 29 | | | | OPPENHEIMER GLOBAL STRATEGIC INCOME FUND/VA |
STATEMENT OF INVESTMENTS Continued
| | | | | | | | |
| | | Principal
Amount | | | Value | |
| | | | | | | | | |
| Structured Securities Continued | | | | | | | | |
Citigroup Global Markets Holdings, Inc.:
Colombia (Republic of) Credit Linked Bonds, 11.25%, 10/25/185 | | | 3,255,000,000 | COP | | $ | 2,394,468 | |
| Colombia (Republic of) Credit Linked Nts., Series 2, 10%, 7/25/24 | | | 10,368,000,000 | COP | | | 7,983,260 | |
| Colombia (Republic of) Credit Linked Nts., Series 2, 10%, 7/25/245 | | | 3,660,000,000 | COP | | | 2,818,165 | |
| Colombia (Republic of) Total Return Linked Bonds, Series 2, 11%, 7/27/20 | | | 2,665,000,000 | COP | | | 2,035,381 | |
| Credit Suisse First Boston International, Moitk Total Return Linked Nts., 21%, 3/30/118 | | | 53,910,000 | RUR | | | — | |
| Credit Suisse First Boston, Inc. (Nassau Branch), Russian Specialized Construction & Installation Administration Total Return Linked Nts., 13%, 5/24/108 | | | 97,250,000 | RUR | | | — | |
Deutsche Bank AG:
Coriolanus Ltd. Sec. Credit Linked Bonds, Series 128, 3.006%, 5/6/255,12 | | | 1,695,673 | | | | 1,226,357 | |
| Coriolanus Ltd. Sec. Credit Linked Bonds, 3.061%, 5/6/255,12 | | | 2,160,549 | | | | 1,562,568 | |
| Coriolanus Ltd. Sec. Credit Linked Bonds, 3.10%, 5/6/255,12 | | | 1,865,288 | | | | 1,349,027 | |
| Coriolanus Ltd. Sec. Credit Linked Bonds, 3.134%, 5/6/255,12 | | | 1,667,333 | | | | 1,205,860 | |
| Coriolanus Ltd. Sec. Credit Linked Bonds, 3.187%, 5/6/255,12 | | | 2,075,964 | | | | 1,501,393 | |
| Coriolanus Ltd. Sec. Credit Linked Bonds, 3.239%, 5/6/255,12 | | | 2,369,398 | | | | 1,713,612 | |
| Coriolanus Ltd. Sec. Credit Linked Bonds, 3.266%, 5/6/255,12 | | | 1,892,872 | | | | 1,368,976 | |
| Coriolanus Ltd. Sec. Credit Linked Bonds, 3.343%, 5/6/255,12 | | | 1,779,219 | | | | 1,286,780 | |
| Coriolanus Ltd. Sec. Credit Linked Nts., 16.457%, 12/31/175,15 | | | 12,850,000 | BRR | | | 8,108,523 | |
| Opic Reforma I Credit Linked Nts., Cl. 2A, 8.34%, 5/22/154,5 | | | 697,693 | MXN | | | 50,860 | |
| Opic Reforma I Credit Linked Nts., Cl. 2B, 8.34%, 5/22/154,5 | | | 1,220,632 | MXN | | | 88,981 | |
| Opic Reforma I Credit Linked Nts., Cl. 2C, 8.34%, 5/22/154,5 | | | 18,404,162 | MXN | | | 1,341,625 | |
| Opic Reforma I Credit Linked Nts., Cl. 2D, 8.34%, 5/22/154,5 | | | 1,341,270 | MXN | | | 97,776 | |
| Opic Reforma I Credit Linked Nts., Cl. 2E, 8.34%, 5/22/154,5 | | | 974,458 | MXN | | | 71,036 | |
| | | | | | | | |
| | | Principal
Amount | | | Value | |
| | | | | | | | | |
| Structured Securities Continued | | | | | | | | |
| Opic Reforma I Credit Linked Nts., Cl. 2F, 8.34%, 5/22/154,5 | | | 622,337 | MXN | | $ | 45,367 | |
| Opic Reforma I Credit Linked Nts., Cl. 2G, 8.34%, 5/22/154,5 | | | 114,609 | MXN | | | 8,355 | |
| Goldman Sachs Capital Markets LP, Colombia (Republic of) Credit Linked Nts., Cl. B, 10%, 7/30/245 | | | 16,210,000,000 | COP | | | 12,480,874 | |
| Goldman Sachs Group, Inc. (The), United Mexican States Credit Linked Nts., 9.05%, 2/8/375,12 | | | 315,000,000 | MXN | | | 2,441,766 | |
| Hallertau SPC Credit Linked Nts.: | | | | | | | | |
| Series 2007-01, 2.559%, 12/20/174,5 | | | 6,250,000 | | | | 5,750,000 | |
| Series 2008-01, 9.878%, 8/2/105,8,12 | | | 14,337,604 | BRR | | | — | |
| HSBC Bank plc, Serbia (Republic of) Credit Linked Nts., 12.168%, 6/16/143,12 | | | 151,000,000 | RSD | | | 1,485,626 | |
JPMorgan Chase & Co., Colombia (Republic of) Credit Linked Nts.,
11%, 7/28/205 | | | 1,315,000,000 | COP | | | 1,004,297 | |
| LB Peru Trust II Certificates, Series 1998-A, 3.796%, 2/28/168,12 | | | 363,871 | | | | 36,387 | |
| Merrill Lynch, Colombia (Republic of) Credit Linked Nts., 10%, 11/17/165 | | | 1,784,000,000 | COP | | | 1,136,833 | |
Morgan Stanley: Peru (Republic of) Credit Linked Nts., 6.25%, 3/23/175 | | | 4,885,000 | PEN | | | 1,892,949 | |
| Russian Federation Total Return Linked Bonds, Series 007, Cl. VR, 5%, 8/22/34 | | | 53,238,768 | RUR | | | 832,443 | |
Morgan Stanley Capital Services, Inc.:
Brazil (Federative Republic of) Credit Linked Nts., 12.551%, 1/5/225,12 | | | 28,914,000 | BRR | | | 4,095,267 | |
| United Mexican States Credit Linked Nts., 5.64%, 11/20/155 | | | 2,000,000 | | | | 1,909,600 | |
Standard Bank plc:
Serbia (Republic of) Credit Linked Nts., 11.30%, 1/7/145,6,12 | | | 38,000,000 | RSD | | | 398,366 | |
| Serbia (Republic of) Credit Linked Nts., 12.405%, 2/3/145,12 | | | 38,000,000 | RSD | |
| 394,835
|
|
Total Structured Securities
(Cost $83,436,911) | | | | | | | 72,026,976 | |
| | | | | | | | | | | | | | | | |
| | | Expiration
Date | | | Strike
Price | | | Contracts | | | Value | |
| | | | | | | | | | | | | | | | | |
| Options Purchased—0.1% | | | | | | | | | | | | | | | | |
| Brazilian Real (BRR) Call2 | | | 2/7/13 | | | | 1 USD per 2.021 BRR | | | | 15,310,000 | | | $ | 36,958 | |
| Euro (EUR) Call2 | | | 1/18/13 | | | | 1 EUR per 1.330 USD | | | | 6,600,000 | | | | 35,118 | |
| | | | |
| 30 | | | | OPPENHEIMER GLOBAL STRATEGIC INCOME FUND/VA |
| | | | | | | | | | | | | | | | |
| | | Expiration
Date | | | Strike
Price | | | Contracts | | | Value | |
| | | | | | | | | | | | | | | | | |
| Options Purchased Continued | | | | | | | | | | | | | | | | |
| Euro (EUR) Call2 | | | 2/28/13 | | | | 1 EUR per 1.254 AUD | | | | 2,650,000 | | | $ | 33,265 | |
| Euro (EUR) FX Futures, 3/18/13 Call2 | | | 1/7/13 | | | | 1.340 | | | | 58 | | | | 10,150 | |
| Euro (EUR) FX Futures, 3/18/13 Call2 | | | 1/7/13 | | | | 1.350 | | | | 34 | | | | 1,913 | |
| Euro (EUR) FX Futures, 3/18/13 Call2 | | | 1/7/13 | | | | 1.370 | | | | 34 | | | | 213 | |
| Euro (EUR) Put2 | | | 2/5/13 | | | | 1 EUR per 2.287 TRY | | | | 16,270,000 | | | | 1,537 | |
| Euro (EUR) Put2 | | | 2/21/13 | | | | 1 EUR per 1.555 SGD | | | | 1,000,000 | | | | 1,890 | |
| Indian Rupee (INR) Call2 | | | 1/3/13 | | | | 1 USD per 51.850 INR | | | | 628,500,000 | | | | — | |
| Indian Rupee (INR) Call2 | | | 1/10/13 | | | | 1 USD per 53.000 INR | | | | 265,717,656 | | | | 351 | |
| Indian Rupee (INR) Call2 | | | 4/18/13 | | | | 1 USD per 53.500 INR | | | | 268,080,000 | | | | 29,668 | |
| Japan Bonds Futures, 10 yr., 3/11/13 Put2 | | | 3/1/13 | | | | 144.000 JPY | | | | 7 | | | | 53,327 | |
| Japanese Yen (JPY) Call2 | | | 1/25/13 | | | | 1 USD per 79.500 JPY | | | | 101,000,000 | | | | 1 | |
| Japanese Yen (JPY) Call2 | | | 2/5/13 | | | | 1 USD per 80.000 JPY | | | | 81,000,000 | | | | 20 | |
| Japanese Yen (JPY) Call2 | | | 2/15/13 | | | | 1 USD per 83.000 JPY | | | | 439,000,000 | | | | 6,585 | |
| Japanese Yen (JPY) Call2 | | | 2/22/13 | | | | 1 USD per 84.000 JPY | | | | 222,185,000 | | | | 8,665 | |
| Japanese Yen (JPY) Futures, 3/18/13 Call2 | | | 1/7/13 | | | | 121.000 | | | | 97 | | | | 606 | |
| Japanese Yen (JPY) Futures, 3/18/13 Call2 | | | 1/7/13 | | | | 121.500 | | | | 49 | | | | 306 | |
| Japanese Yen (JPY) Futures, 3/18/13 Call2 | | | 1/7/13 | | | | 123.500 | | | | 49 | | | | 306 | |
| Japanese Yen (JPY) Futures, 3/18/13 Put2 | | | 1/7/13 | | | | 113.500 | | | | 36 | | | | 2,700 | |
| Japanese Yen (JPY) Futures, 3/18/13 Put2 | | | 1/7/13 | | | | 115.000 | | | | 94 | | | | 37,600 | |
| Japanese Yen (JPY) Futures, 3/18/13 Put2 | | | 1/7/13 | | | | 116.500 | | | | 14 | | | | 20,475 | |
| Japanese Yen (JPY) Futures, 3/18/13 Put2 | | | 1/7/13 | | | | 117.500 | | | | 1 | | | | 2,550 | |
| Japanese Yen (JPY) Futures, 3/18/13 Put2 | | | 1/7/13 | | | | 118.500 | | | | 10 | | | | 37,625 | |
| Japanese Yen (JPY) Futures, 3/18/13 Put2 | | | 1/7/13 | | | | 119.000 | | | | 10 | | | | 43,875 | |
| Japanese Yen (JPY) Put2 | | | 3/18/13 | | | | 1 USD per 85.000 JPY | | | | 505,000,000 | | | | 168,115 | |
| Japanese Yen (JPY) Put2 | | | 3/29/13 | | | | 1 USD per 85.000 JPY | | | | 204,000,000 | | | | 70,411 | |
| Japanese Yen (JPY) Put2 | | | 5/31/13 | | | | 1 USD per 82.000 JPY | | | | 416,833,857 | | | | 303,518 | |
| Mexican Nuevo Peso (MXN) Call2 | | | 1/10/13 | | | | 1 USD per 12.550 MXN | | | | 189,900,000 | | | | 11,354 | |
| Mexican Nuevo Peso (MXN) Call2 | | | 1/10/13 | | | | 1 USD per 12.550 MXN | | | | 94,950,000 | | | | 5,677 | |
| New Turkish Lira (TRY) Call2 | | | 2/4/13 | | | | 1 USD per 1.790 TRY | | | | 40,740,000 | | | | 234,333 | |
| Norwegian Krone (NOK) Put2 | | | 1/4/13 | | | | 1 USD per 5.900 NOK | | | | 11,800,000 | | | | — | |
| Russian Ruble (RUR) Call2 | | | 1/18/13 | | | | 1 USD per 30.350 RUR | | | | 1,275,000,000 | | | | 163,047 | |
| South African Rand (ZAR) Call2 | | | 3/18/13 | | | | 1 USD per 8.500 ZAR | | | | 96,650,000 | | | | 248,612 | |
| South African Rand (ZAR) Call2 | | | 3/18/13 | | | | 1 USD per 8.500 ZAR | | | | 96,650,000 | | | | 248,612 | |
| South African Rand (ZAR) Call2 | | | 3/18/13 | | | | 1 USD per 8.450 ZAR | | | | 80,100,000 | | | | 179,667 | |
| Swedish Krona (SEK) Call2 | | | 3/18/13 | | | | 1 SEK per 13.629 JPY | | | | 15,880,000 | | | | 33,830 | |
| U.S. Long Bonds Futures, 3/19/13 Put2 | | | 1/28/13 | | | | 145.000 | | | | 87 | | | | 47,578 | |
| U.S. Treasury Long Bonds Futures, 3/19/13 Put2 | | | 1/2/13 | | | | 145.000 | | | | 38 | | | | 594 | |
| U.S. Treasury Long Bonds Futures, 3/19/13 Put2 | | | 1/7/13 | | | | 145.000 | | | | 137 | | | | 17,125 | |
| U.S. Treasury Long Bonds Futures, 3/19/13 Put2 | | | 1/7/13 | | | | 147.000 | | | | 31 | | | | 18,406 | |
| U.S. Treasury Nts., 10 yr. Futures, 3/19/13 Put2 | | | 1/28/13 | | | | 128.500 | | | | 370 | | | | 5,781 | |
| U.S. Treasury Nts., 10 yr. Futures, 3/19/13 Put2 | | | 1/28/13 | | | | 130.500 | | | | 422 | | | | 39,563 | |
| U.S. Treasury Nts., 10 yr. Futures, 3/19/13 Put2 | | | 1/28/13 | | | | 131.000 | | | | 1 | | | | 141 | |
| U.S. Treasury Nts., 10 yr. Futures, 3/19/13 Put2 | | | 1/28/13 | | | | 131.500 | | | | 74 | | | | 16,188 | |
| | | | |
| 31 | | | | OPPENHEIMER GLOBAL STRATEGIC INCOME FUND/VA |
STATEMENT OF INVESTMENTS Continued
| | | | | | | | | | | | | | | | |
| | | Expiration
Date | | | Strike
Price | | | Contracts | | | Value | |
| | | | | | | | | | | | | | | | | |
| Options Purchased Continued | | | | | | | | | | | | | | | | |
| U.S. Treasury Nts., 10 yr. Futures, 3/19/13 Put2 | | | 1/28/13 | | | $ | 132.000 | | | | 107 | | | $ | 35,109 | |
| U.S. Treasury Nts., 10 yr. Futures, 3/19/13 Put2 | | | 1/28/13 | | | | 132.500 | | | | 58 | | |
| 29,000
|
|
| Total Options Purchased (Cost $2,557,557) | | | | | | | | | | | | | | | 2,242,365 | |
| | | | | | | | | | | | |
| | | |
| | | Swaption
Expiration
Date | | | Notional
Amount | | | | |
| Swaptions Purchased—0.2% | | | | | | | | | | | | |
| Bank of America NA; Interest Rate Swaption (European); Swap Terms: Paid: 1.7225%; Received: Three-Month USD BBA LIBOR; Termination Date: 2/13/232 | | | 2/12/13 | | | $ | 15,670,000 | | | $ | 239,751 | |
| Bank of America NA; Interest Rate Swaption (European); Swap Terms: Paid: 2%; Received: Three-Month USD BBA LIBOR; Termination Date: 9/3/232 | | | 9/3/13 | | | | 20,395,000 | | | | 472,186 | |
| Bank of America NA; Interest Rate Swaption (European); Swap Terms: Paid: Three-Month CAD BA CDOR; Received: 2.254%; Termination Date: 1/15/232 | | | 1/16/13 | | | | 2,530,000 | CAD | | | 9,189 | |
| Bank of America NA; Interest Rate Swaption (European); Swap Terms: Paid: Three-Month USD BBA LIBOR; Received: 1.78%; Termination Date: 2/7/232 | | | 2/6/13 | | | | 15,700,000 | | | | 79,445 | |
| Bank of America NA; Interest Rate Swaption (European); Swap Terms: Paid: Three-Month USD BBA LIBOR; Received: 1.83%; Termination Date: 2/5/232 | | | 2/4/13 | | | | 10,500,000 | | | | 71,631 | |
| Bank of America NA; Interest Rate Swaption (European); Swap Terms: Paid: Three-Month USD BBA LIBOR; Received: 2.66%; Termination Date: 2/5/432 | | | 2/4/13 | | | | 10,500,000 | | | | 78,249 | |
| Barclays Bank plc; Interest Rate Swaption (European); Swap Terms: Paid: 1.25%; Received: Three-Month USD BBA LIBOR; Termination Date: 11/22/182 | | | 11/21/13 | | | | 26,150,000 | | | | 225,003 | |
| Barclays Bank plc; Interest Rate Swaption (European); Swap Terms: Paid: 1.3725%; Received: Three-Month USD BBA LIBOR; Termination Date: 12/16/172 | | | 12/15/15 | | | | 47,030,000 | | | | 407,259 | |
| Barclays Bank plc; Interest Rate Swaption (European); Swap Terms: Paid: 1.765%; Received: Three-Month USD BBA LIBOR; Termination Date: 7/12/182 | | | 7/11/13 | | | | 51,200,000 | | | | 183,294 | |
| Barclays Bank plc; Interest Rate Swaption (European); Swap Terms: Paid: 2.695%; Received: Three-Month USD BBA LIBOR; Termination Date: 5/15/232 | | | 4/12/13 | | | | 25,100,000 | | | | 21,439 | |
| Barclays Bank plc; Interest Rate Swaption (European); Swap Terms: Paid: 2.905%; Received: Three-Month USD BBA LIBOR; Termination Date: 9/30/452 | | | 9/29/15 | | | | 4,655,206 | | | | 583,114 | |
| Barclays Bank plc; Interest Rate Swaption (European); Swap Terms: Paid: 3.48%; Received: Three-Month USD BBA LIBOR; Termination Date: 4/27/472 | | | 4/26/17 | | | | 5,040,000 | | | | 545,107 | |
| Barclays Bank plc; Interest Rate Swaption (European); Swap Terms: Paid: Three-Month USD BBA LIBOR; Received: 2.50%; Termination Date: 2/21/432 | | | 2/20/13 | | | | 10,500,000 | | | | 39,048 | |
| Barclays Bank plc; Interest Rate Swaption (European); Swap Terms: Paid: Three-Month USD BBA LIBOR; Received: 3.26%; Termination Date: 5/4/332 | | | 5/3/13 | | | | 20,800,000 | | | | 111,843 | |
| Barclays Bank plc; Interest Rate Swaption (European); Swap Terms: Paid: Three-Month USD BBA LIBOR; Received: 3.37%; Termination Date: 4/14/332 | | | 4/15/13 | | | | 21,000,000 | | | | 135,752 | |
| Goldman Sachs Bank USA; Interest Rate Swaption (European); Swap Terms: Paid: 3.275%; Received: Six-Month GBP BBA LIBOR; Termination Date: 12/4/452 | | | 12/7/15 | | | | 1,320,000 | GBP | | | 198,004 | |
| Goldman Sachs International; Interest Rate Swaption (European); Swap Terms: Paid: 1.4825%; Received: Three-Month USD BBA LIBOR; Termination Date: 5/13/182 | | | 5/10/13 | | | | 52,220,000 | | | | 255,610 | |
| Goldman Sachs International; Interest Rate Swaption (European); Swap Terms: Paid: 1.99%; Received: Three-Month USD BBA LIBOR; Termination Date: 6/20/182 | | | 6/17/13 | | | | 52,255,000 | | | | 133,965 | |
| Goldman Sachs International; Interest Rate Swaption (European); Swap Terms: Paid: 3.20%; Received: Three-Month USD BBA LIBOR; Termination Date: 9/24/442 | | | 9/23/14 | | | | 10,200,000 | | | | 680,245 | |
| Goldman Sachs International; Interest Rate Swaption (European); Swap Terms: Paid: Three Month USD BBA LIBOR; Received: 3.36%; Termination Date: 2/7/332 | | | 2/6/13 | | | | 26,100,000 | | | | 57,684 | |
| | | | |
| 32 | | | | OPPENHEIMER GLOBAL STRATEGIC INCOME FUND/VA |
| | | | | | | | | | | | |
| | | Swaption
Expiration
Date | | | Notional
Amount | | | Value | |
| Swaptions Purchased Continued | | | | | | | | | | | | |
| Goldman Sachs International; Interest Rate Swaption (European); Swap Terms: Paid: Three-Month USD BBA LIBOR; Received: 2.48%; Termination Date: 4/15/432 | | | 4/12/13 | | | $ | 20,980,000 | | | $ | 174,108 | |
| Goldman Sachs International; Interest Rate Swaption (European); Swap Terms: Paid: Three-Month USD BBA LIBOR; Received: 3.165%; Termination Date: 5/15/332 | | | 5/14/13 | | | | 21,700,000 | | | | 107,648 | |
| Goldman Sachs International; Interest Rate Swaption (European); Swap Terms: Paid: Three-Month USD BBA LIBOR; Received: 3.17%; Termination Date: 2/15/332 | | | 2/14/13 | | | | 26,100,000 | | | | 24,782 | |
| JPMorgan Chase Bank NA; Interest Rate Swaption (European); Swap Terms: Paid: 1.65%; Received: Three-Month USD BBA LIBOR; Termination Date: 2/25/182 | | | 2/22/13 | | | | 24,810,000 | | | | 306 | |
| UBS AG; Interest Rate Swaption (European); Swap Terms: Paid: 2.98%; Received: Six-Month EUR EURIBOR; Termination Date: 3/4/232 | | | 3/1/13 | | | | 24,830,000 | EUR | | | 4 | |
| UBS AG; Interest Rate Swaption (European); Swap Terms: Paid: 3.025%; Received: Six-Month EUR EURIBOR; Termination Date: 2/27/232 | | | 2/26/13 | | | | 24,845,000 | EUR | | | — | |
| UBS AG; Interest Rate Swaption (European); Swap Terms: Paid: 3.15%; Received: Three-Month AUD BBR BBSW; Termination Date: 1/25/162 | | | 1/25/13 | | | | 3,810,000 | AUD | | | 1,566 | |
| UBS AG; Interest Rate Swaption (European); Swap Terms: Paid: Three-Month AUD BBR BBSW; Received: 3.01%; Termination Date: 4/2/162 | | | 3/29/13 | | | | 3,785,000 | AUD | | | 22,312 | |
| UBS AG; Interest Rate Swaption (European); Swap Terms: Paid: Three-Month USD BBA LIBOR; Received: 1.78%; Termination Date: 2/7/232 | | | 2/6/13 | | | | 15,600,000 | | | | 78,939 | |
| UBS AG; Interest Rate Swaption (European); Swap Terms: Paid: Three-Month USD BBA LIBOR; Received: 2.625%; Termination Date: 2/7/432 | | | 2/6/13 | | | | 10,400,000 | | |
| 66,821
|
|
| Total Swaptions Purchased (Cost $11,065,346) | | | | | | | | | | | 5,004,304 | |
| | | |
| | | | | | Shares | | | | |
| Investment Companies—16.9% | | | | | | | | | | | | |
| Oppenheimer Institutional Money Market Fund, Cl. E, 0.15%1,17 | | | | | | | 34,093,630 | | | | 34,093,630 | |
| Oppenheimer Master Event-Linked Bond Fund, LLC1 | | | | | | | 4,827,322 | | | | 59,573,516 | |
| Oppenheimer Master Loan Fund, LLC1 | | | | | | | 25,357,850 | | | | 332,755,166 | |
| Oppenheimer Short Duration Fund, Cl. Y1 | | | | | | | 1,010,027 | | |
| 10,120,474
|
|
| Total Investment Companies (Cost $432,931,400) | | | | | | | | | | | 436,542,786 | |
| Total Investments, at Value (Cost $3,001,175,756) | | | | | | | 118.2 | % | | | 3,051,663,287 | |
| Liabilities in Excess of Other Assets | |
|
|
| |
| (18.2
| )
| |
| (468,946,131
| )
|
| Net Assets | |
|
|
| |
| 100.0
| %
| | $
| 2,582,717,156
|
|
Footnotes to Statement of Investments
Principal amount and strike price are reported in U.S. Dollars, except for those denoted in the following currencies:
| | |
| AUD | | Australian Dollar |
| BRR | | Brazilian Real |
| CAD | | Canadian Dollar |
| CHF | | Swiss Franc |
| COP | | Colombian Peso |
| DKK | | Danish Krone |
| EUR | | Euro |
| GBP | | British Pound Sterling |
| HUF | | Hungarian Forint |
| JPY | | Japanese Yen |
| MXN | | Mexican Nuevo Peso |
| | | | |
| 33 | | | | OPPENHEIMER GLOBAL STRATEGIC INCOME FUND/VA |
STATEMENT OF INVESTMENTS Continued
Footnotes to Statement of Investments Continued
| | |
| MYR | | Malaysian Ringgit |
| NGN | | Nigeria Naira |
| NOK | | Norwegian Krone |
| PEN | | Peruvian New Sol |
| PHP | | Philippines Peso |
| PLZ | | Polish Zloty |
| RSD | | Serbian Dinar |
| RUR | | Russian Ruble |
| SEK | | Swedish Krona |
| SGD | | Singapore Dollar |
| TRY | | New Turkish Lira |
| UYU | | Uruguay Peso |
| ZAR | | South African Rand |
1. Is or was an affiliate, as defined in the Investment Company Act of 1940, at or during the period ended December 31, 2012, by virtue of the Fund owning at least 5% of the voting securities of the issuer or as a result of the Fund and the issuer having the same investment adviser. Transactions during the period in which the issuer was an affiliate are as follows:
| | | | | | | | | | | | | | | | |
| | | Shares
December 30, 2011a | | | Gross
Additions | | | Gross
Reductions | | | Shares
December 31, 2012 | |
| Oppenheimer Global Strategic Income Fund/VA (Cayman) Ltd.b | | | 15,000 | | | | — | | | | — | | | | 15,000 | |
| Oppenheimer Institutional Money Market Fund, Cl. E | | | 27,393,119 | | | | 834,952,254 | | | | 828,251,743 | | | | 34,093,630 | |
| Oppenheimer Master Event-Linked Bond Fund, LLC | | | 4,827,322 | | | | — | | | | — | | | | 4,827,322 | |
| Oppenheimer Master Loan Fund, LLC | | | 29,466,809 | | | | 919,552 | | | | 5,028,511 | | | | 25,357,850 | |
| Oppenheimer Short Duration Fund, Cl. Y | | | 1,001,329 | | | | 8,698 | | | | — | | | | 1,010,027 | |
| | | | |
| | | | | | Value | | | Income | | | Realized
Loss | |
| Oppenheimer Global Strategic Income Fund/VA (Cayman) Ltd.b | | | | | | $ | 1,434,967 | | | $ | — | | | $ | — | |
| Oppenheimer Institutional Money Market Fund, Cl. E | | | | | | | 34,093,630 | | | | 77,015 | | | | — | |
| Oppenheimer Master Event-Linked Bond Fund, LLC | | | | | | | 59,573,516 | | | | 5,061,418 | c | | | 2,117,483 | c |
| Oppenheimer Master Loan Fund, LLC | | | | | | | 332,755,166 | | | | 23,316,037 | d | | | 2,074,299 | d |
| Oppenheimer Short Duration Fund, Cl. Y | | | | | | | 10,120,474 | | | | 65,519 | | | | — | |
| | | | | | |
|
|
| |
|
|
| |
|
|
|
| | | | | | | $ | 437,977,753 | | | $ | 28,519,989 | | | $ | 4,191,782 | |
| | | | | | |
|
|
| |
|
|
| |
|
|
|
a. December 30, 2011 represents the last business day of the Fund’s 2011 fiscal year. See Note 1 of the accompanying Notes.
b. Investment in a wholly-owned subsidiary. See Note 1 of the accompanying Notes and individual financial statements of the entity included herein.
c. Represents the amount allocated to the Fund from Oppenheimer Master Event-Linked Bond Fund, LLC.
d. Represents the amount allocated to the Fund from Oppenheimer Master Loan Fund, LLC.
2. Non-income producing security.
3. Represents securities sold under Rule 144A, which are exempt from registration under the Securities Act of 1933, as amended. These securities have been determined to be liquid under guidelines established by the Board of Trustees. These securities amount to $500,966,717 or 19.40% of the Fund’s net assets as of December 31, 2012.
4. Represents the current interest rate for a variable or increasing rate security.
5. Restricted security. The aggregate value of restricted securities as of December 31, 2012 was $87,501,582, which represents 3.39% of the Fund’s net assets. See Note 7 of the accompanying Notes. Information concerning restricted securities is as follows:
| | | | | | | | | | | | | | | | |
| Security | | Acquisition
Dates | | | Cost | | | Value | | | Unrealized
Appreciation
(Depreciation) | |
| Altegrity, Inc., 10.50% Sr. Unsec. Sub. Nts., 11/1/15 | | | 5/14/09-2/17/10 | | | $ | 1,204,691 | | | $ | 1,122,000 | | | $ | (82,691 | ) |
| Arco Capital Corp. Ltd. | | | 2/27/07 | | | | 10,359,570 | | | | 1,035,957 | | | | (9,323,613 | ) |
| | | | |
| 34 | | | | OPPENHEIMER GLOBAL STRATEGIC INCOME FUND/VA |
| | | | | | | | | | | | | | | | |
| Security | | Acquisition
Dates | | | Cost | | | Value | | | Unrealized
Appreciation
(Depreciation) | |
BCAP LLC Trust, Mtg. Pass-Through Certificates,
Series 2012-RR6, Cl. 1A5,
2.243%, 11/1/36 | | | 6/14/12 | | | $ | 496,852 | | | $ | 501,705 | | | $ | 4,853 | |
| Catalyst Paper Corp., 13% Sec. Nts., 12/15/16 | | | 9/6/12 | | | | 764,049 | | | | 817,068 | | | | 53,019 | |
Citigroup Funding, Inc., Colombia (Republic of) Credit Linked Nts.,
11%, 7/27/20 | | | 11/27/12 | | | | 1,840,947 | | | | 1,909,363 | | | | 68,416 | |
| Citigroup Global Markets Holdings, Inc., Colombia (Republic of) Credit Linked Bonds, 11.25%, 10/25/18 | | | 12/9/08 | | | | 1,381,300 | | | | 2,394,468 | | | | 1,013,168 | |
| Citigroup Global Markets Holdings, Inc., Colombia (Republic of) Credit Linked Nts., Series 2, 10%, 7/25/24 | | | 3/28/12 | | | | 2,567,585 | | | | 2,818,165 | | | | 250,580 | |
| Deutsche Bank AG, Coriolanus Ltd. Sec. Credit Linked Bonds, Series 128, 3.006%, 5/6/25 | | | 10/8/10 | | | | 1,189,050 | | | | 1,226,357 | | | | 37,307 | |
| Deutsche Bank AG, Coriolanus Ltd. Sec. Credit Linked Bonds, 3.343%, 5/6/25 | | | 4/16/09 | | | | 1,214,678 | | | | 1,286,780 | | | | 72,102 | |
| Deutsche Bank AG, Coriolanus Ltd. Sec. Credit Linked Bonds, 3.266%, 5/6/25 | | | 8/18/09 | | | | 1,299,568 | | | | 1,368,976 | | | | 69,408 | |
| Deutsche Bank AG, Coriolanus Ltd. Sec. Credit Linked Bonds, 3.239%, 5/6/25 | | | 9/25/09 | | | | 1,629,932 | | | | 1,713,612 | | | | 83,680 | |
| Deutsche Bank AG, Coriolanus Ltd. Sec. Credit Linked Bonds, 3.187%, 5/6/25 | | | 12/17/09 | | | | 1,433,756 | | | | 1,501,393 | | | | 67,637 | |
| Deutsche Bank AG, Coriolanus Ltd. Sec. Credit Linked Bonds, 3.134%, 5/6/25 | | | 3/30/10 | | | | 1,156,371 | | | | 1,205,860 | | | | 49,489 | |
| Deutsche Bank AG, Coriolanus Ltd. Sec. Credit Linked Bonds, 3.10%, 5/6/25 | | | 5/18/10 | | | | 1,297,603 | | | | 1,349,027 | | | | 51,424 | |
| Deutsche Bank AG, Coriolanus Ltd. Sec. Credit Linked Bonds, 3.061%, 5/6/25 | | | 7/16/10 | | | | 1,507,723 | | | | 1,562,568 | | | | 54,845 | |
| Deutsche Bank AG, Coriolanus Ltd. Sec. Credit Linked Nts., 16.457%, 12/31/17 | | | 9/19/07 | | | | 5,839,208 | | | | 8,108,523 | | | | 2,269,315 | |
| Deutsche Bank AG, Opic Reforma I Credit Linked Nts., Cl. 2A, 8.34%, 5/22/15 | | | 5/21/08 | | | | 67,269 | | | | 50,860 | | | | (16,409 | ) |
| Deutsche Bank AG, Opic Reforma I Credit Linked Nts., Cl. 2B, 8.34%, 5/22/15 | | | 6/12/08 | | | | 117,680 | | | | 88,981 | | | | (28,699 | ) |
| Deutsche Bank AG, Opic Reforma I Credit Linked Nts., Cl. 2C, 8.34%, 5/22/15 | | | 6/18/08 | | | | 1,785,486 | | | | 1,341,625 | | | | (443,861 | ) |
| Deutsche Bank AG, Opic Reforma I Credit Linked Nts., Cl. 2D, 8.34%, 5/22/15 | | | 7/8/08 | | | | 130,028 | | | | 97,776 | | | | (32,252 | ) |
| Deutsche Bank AG, Opic Reforma I Credit Linked Nts., Cl. 2E, 8.34%, 5/22/15 | | | 7/15/08 | | | | 94,626 | | | | 71,036 | | | | (23,590 | ) |
| Deutsche Bank AG, Opic Reforma I Credit Linked Nts., Cl. 2F, 8.34%, 5/22/15 | | | 8/8/08 | | | | 61,263 | | | | 45,367 | | | | (15,896 | ) |
| Deutsche Bank AG, Opic Reforma I Credit Linked Nts., Cl. 2G, 8.34%, 5/22/15 | | | 8/22/08 | | | | 11,304 | | | | 8,355 | | | | (2,949 | ) |
| FDIC Trust, Commerical Mtg. Pass-Through Certificates, Series 2012-C1, Cl. A, 0.841%, 5/1/35 | | | 5/10/12 | | | | 1,260,138 | | | | 1,263,641 | | | | 3,503 | |
| Goldman Sachs Capital Markets LP, Colombia (Republic of) Credit Linked Nts., Cl. B, 10%, 7/30/24 | | | 9/12/12 | | | | 11,477,850 | | | | 12,480,874 | | | | 1,003,024 | |
| Goldman Sachs Group, Inc. (The), United Mexican States Credit Linked Nts., 9.05%, 2/8/37 | | | 9/12/12 | | | | 3,019,941 | | | | 2,441,766 | | | | (578,175 | ) |
| Hallertau SPC Credit Linked Nts., Series 2007-01, 2.559%, 12/20/17 | | | 12/13/07 | | | | 6,250,000 | | | | 5,750,000 | | | | (500,000 | ) |
| | | | |
| 35 | | | | OPPENHEIMER GLOBAL STRATEGIC INCOME FUND/VA |
STATEMENT OF INVESTMENTS Continued
Footnotes to Statement of Investments Continued
| | | | | | | | | | | | | | | | |
| Security | | Acquisition
Dates | | | Cost | | | Value | | | Unrealized
Appreciation
(Depreciation) | |
| Hallertau SPC Credit Linked Nts., Series 2008-01, 9.878%, 8/2/10 | | | 5/6/08 | | | $ | 7,188,001 | | | $ | — | | | $ | (7,188,001 | ) |
| Ice 1 Em CLO Ltd./Ice 1 Em CLO Corp., Sr. Sec. Sub. Term Nts., Series 2007-1A, Cl. B, 2.419%, 8/15/22 | | | 11/6/07 | | | | 7,053,572 | | | | 5,981,200 | | | | (1,072,372 | ) |
| Ice 1 Em CLO Ltd./Ice 1 Em CLO Corp., Sr. Sec. Sub. Term Nts., Series 2007-1A, Cl. C, 3.719%, 8/15/22 | | | 6/8/07 | | | | 5,270,000 | | | | 3,899,800 | | | | (1,370,200 | ) |
| Ice 1 Em CLO Ltd./Ice 1 Em CLO Corp., Sr. Sec. Sub. Term Nts., Series 2007-1A, Cl. D, 5.719%, 8/15/22 | | | 6/8/07 | | | | 5,270,000 | | | | 3,952,500 | | | | (1,317,500 | ) |
| Igloo Holdings Corp., 8.25% Sr. Unsec. Nts., 12/15/17 | | | 12/13/12-12/14/12 | | | | 2,870,788 | | | | 2,861,006 | | | | (9,782 | ) |
| IIRSA Norte Finance Ltd., 8.75% Sr. Nts., 5/30/24 | | | 8/3/06-7/24/07 | | | | 3,739,943 | | | | 4,332,806 | | | | 592,863 | |
JPMorgan Chase & Co., Colombia (Republic of) Credit Linked Nts.,
11%, 7/28/20 | | | 8/24/10 | | | | 886,181 | | | | 1,004,297 | | | | 118,116 | |
| JPMorgan Hipotecaria su Casita, 8.293% Sec. Nts., 8/26/35 | | | 3/21/07 | | | | 526,714 | | | | 44,936 | | | | (481,778 | ) |
| Merrill Lynch, Colombia (Republic of) Credit Linked Nts., 10%, 11/17/16 | | | 10/20/06 | | | | 762,393 | | | | 1,136,833 | | | | 374,440 | |
| Morgan Stanley Capital Services, Inc., Brazil (Federative Republic of) Credit Linked Nts., 12.551%, 1/5/22 | | | 1/4/07 | | | | 7,422,779 | | | | 4,095,267 | | | | (3,327,512 | ) |
| Morgan Stanley Capital Services, Inc., United Mexican States Credit Linked Nts., 5.64%, 11/20/15 | | | 11/3/05 | | | | 2,000,000 | | | | 1,909,600 | | | | (90,400 | ) |
| Morgan Stanley, Peru (Republic of) Credit Linked Nts., 6.25%, 3/23/17 | | | 7/10/07 | | | | 1,527,062 | | | | 1,892,949 | | | | 365,887 | |
Morgan Stanley, Re-Securitized Real Estate Mtg. Investment Conduit
Multiclass Pass-Through Certificates, Series 2012-R3, Cl. 1A, 2.298%, 11/1/36 | | | 10/24/12 | | | | 49,075 | | | | 48,567 | | | | (508 | ) |
| NC Finance Trust, Collateralized Mtg. Obligation Pass-Through Certificates, Series 1999-I, Cl. ECFD, 3.405%, 1/25/29 | | | 8/10/10 | | | | 66,025 | | | | 5,340 | | | | (60,685 | ) |
| Newport Television LLC/NTV Finance Corp., 13% Sr. Nts., 3/15/17 | | | 11/2/10-3/15/12 | | | | 1,779,559 | | | | 1,981,177 | | | | 201,618 | |
| Premier Cruise Ltd., 11% Sr. Nts., 3/15/08 | | | 3/6/98 | | | | 242,675 | | | | — | | | | (242,675 | ) |
| Standard Bank plc, Serbia (Republic of) Credit Linked Nts., 11.30%, 1/7/14 | | | 12/27/12 | | | | 396,422 | | | | 398,366 | | | | 1,944 | |
| Standard Bank plc, Serbia (Republic of) Credit Linked Nts., 12.405%, 2/3/14 | | | 12/5/12 | | | | 382,148 | | | | 394,835 | | | | 12,687 | |
| | | | | | |
|
|
| |
|
|
| |
|
|
|
| | | | | | | $ | 106,891,805 | | | $ | 87,501,582 | | | $ | (19,390,223 | ) |
| | | | | | |
|
|
| |
|
|
| |
|
|
|
6. All or a portion of the security position is when-issued or delayed delivery to be delivered and settled after December 31, 2012. See Note 1 of the accompanying Notes.
7. Interest or dividend is paid-in-kind, when applicable.
8. This security is not accruing income because the issuer has missed an interest payment on it and/or is not anticipated to make future interest and/or principal payments. The rate shown is the original contractual interest rate. See Note 1 of the accompanying Notes.
| | | | |
| 36 | | | | OPPENHEIMER GLOBAL STRATEGIC INCOME FUND/VA |
9. Interest-Only Strips represent the right to receive the monthly interest payments on an underlying pool of mortgage loans or other receivables. These securities typically decline in price as interest rates decline. Most other fixed income securities increase in price when interest rates decline. The principal amount of the underlying pool represents the notional amount on which current interest is calculated. The price of these securities is typically more sensitive to changes in prepayment rates than traditional mortgage or asset-backed securities (for example, GNMA pass-throughs). Interest rates disclosed represent current yields based upon the current cost basis and estimated timing and amount of future cash flows. These securities amount to $9,928,831 or 0.38% of the Fund’s net assets as of December 31, 2012.
10. The current amortization rate of the security’s cost basis exceeds the future interest payments currently estimated to be received. Both the amortization rate and interest payments are contingent on future mortgage pre-payment speeds and are therefore subject to change.
11. This security is accruing partial income at an anticipated effective rate based on expected interest and/or principal payments. The rate shown is the original contractual interest rate.
12. Zero coupon bond reflects effective yield on the date of purchase.
13. All or a portion of the security position is held in accounts at a futures clearing merchant and pledged to cover margin requirements on open futures contracts and written options on futures, if applicable. The aggregate market value of such securities is $6,224,205. See Note 6 of the accompanying Notes.
14. All or a portion of the security position is held in segregated accounts and pledged to cover margin requirements under certain derivative contracts. The aggregate market value of such securities is $9,223,679. See Note 6 of the accompanying Notes.
15. Denotes an inflation-indexed security: coupon or principal are indexed to a consumer price index.
16. This bond has no contractual maturity date, is not redeemable and contractually pays an indefinite stream of interest. Rate reported represents the current interest rate for this variable rate security.
17. Rate shown is the 7-day yield as of December 31, 2012.
Distribution of investments representing geographic holdings, as a percentage of total investments at value, is as follows:
| | | | | | | | |
| Geographic Holdings | | Value | | | Percent | |
| United States | | $ | 1,941,346,487 | | | | 63.6 | % |
| Turkey | | | 147,378,452 | | | | 4.8 | |
| Russia | | | 140,400,586 | | | | 4.6 | |
| Brazil | | | 139,274,691 | | | | 4.6 | |
| Mexico | | | 78,239,342 | | | | 2.6 | |
| Hungary | | | 53,695,696 | | | | 1.8 | |
| Colombia | | | 51,562,927 | | | | 1.7 | |
| Japan | | | 49,404,536 | | | | 1.6 | |
| Peru | | | 49,348,371 | | | | 1.6 | |
| South Africa | | | 43,673,749 | | | | 1.4 | |
| Venezuela | | | 31,040,436 | | | | 1.0 | |
| Italy | | | 17,757,195 | | | | 0.6 | |
| Indonesia | | | 17,098,051 | | | | 0.6 | |
| United Kingdom | | | 16,940,422 | | | | 0.6 | |
| Supranational | | | 16,503,431 | | | | 0.5 | |
| Canada | | | 16,472,337 | | | | 0.5 | |
| Malaysia | | | 15,816,685 | | | | 0.5 | |
| France | | | 14,222,680 | | | | 0.5 | |
| Israel | | | 14,144,447 | | | | 0.5 | |
| Nigeria | | | 13,880,040 | | | | 0.5 | |
| Poland | | | 13,143,451 | | | | 0.4 | |
| Australia | | | 12,555,807 | | | | 0.4 | |
| The Netherlands | | | 11,605,060 | | | | 0.4 | |
| Germany | | | 11,588,658 | | | | 0.4 | |
| Philippines | | | 10,996,905 | | | | 0.4 | |
| Spain | | | 10,827,977 | | | | 0.4 | |
| Kazakhstan | | | 10,238,912 | | | | 0.3 | |
| United Arab Emirates | | | 10,143,235 | | | | 0.3 | |
| Uruguay | | | 8,978,370 | | | | 0.3 | |
| Ukraine | | | 6,988,313 | | | | 0.2 | |
| India | | | 6,112,168 | | | | 0.2 | |
| Chile | | | 5,491,255 | | | | 0.2 | |
| | | | |
| 37 | | | | OPPENHEIMER GLOBAL STRATEGIC INCOME FUND/VA |
STATEMENT OF INVESTMENTS Continued
Footnotes to Statement of Investments Continued
| | | | | | | | |
| Geographic Holdings | | Value | | | Percent | |
| Romania | | $ | 5,222,344 | | | | 0.2 | % |
| Croatia | | | 5,144,750 | | | | 0.2 | |
| Belgium | | | 4,171,214 | | | | 0.1 | |
| Serbia | | | 4,113,627 | | | | 0.1 | |
| Luxembourg | | | 4,103,682 | | | | 0.1 | |
| Qatar | | | 3,878,365 | | | | 0.1 | |
| Trinidad & Tobago | | | 3,347,500 | | | | 0.1 | |
| Slovakia | | | 3,277,488 | | | | 0.1 | |
| Sri Lanka | | | 3,094,951 | | | | 0.1 | |
| Lithuanua | | | 2,808,785 | | | | 0.1 | |
| Costa Rica | | | 2,712,450 | | | | 0.1 | |
| Dominican Republic | | | 2,598,409 | | | | 0.1 | |
| Ivory Coast | | | 2,514,500 | | | | 0.1 | |
| Latvia | | | 2,348,115 | | | | 0.1 | |
| Angola | | | 2,286,600 | | | | 0.1 | |
| Norway | | | 2,236,785 | | | | 0.1 | |
| Sweden | | | 1,639,804 | | | | 0.1 | |
| Jamaica | | | 1,497,275 | | | | 0.1 | |
| Ireland | | | 1,321,221 | | | | — | |
| Denmark | | | 1,315,416 | | | | — | |
| Slovenia | | | 1,199,850 | | | | — | |
| Switzerland | | | 876,495 | | | | — | |
| Bolivia | | | 825,988 | | | | — | |
| Finland | | | 739,702 | | | | — | |
| Portugal | | | 595,234 | | | | — | |
| Mongolia | | | 428,475 | | | | — | |
| Argentina | | | 409,500 | | | | — | |
| European Union | | | 84,090 | | | | — | |
| | |
|
|
| |
|
|
|
| Total | | $ | 3,051,663,287 | | | | 100.0 | % |
| | |
|
|
| |
|
|
|
| | | | | | | | | | | | | | | | | | | | | | | | |
| Forward Currency Exchange Contracts as of December 31, 2012 are as follows: | |
Counterparty/
Contract Description | | Buy/Sell | | | Contract Amount
(000’s) | | | Expiration
Dates | | | Value | | | Unrealized
Appreciation | | | Unrealized
Depreciation | |
| Bank of America NA: | | | | | | | | | | | | | | | | | | | | | | | | |
| Australian Dollar (AUD) | | | Buy | | | | 1,070 | AUD | | | 1/15/13 | | | $ | 1,109,828 | | | $ | — | | | $ | 15,984 | |
| Canadian Dollar (CAD) | | | Buy | | | | 510 | CAD | | | 2/12/13 | | | | 512,249 | | | | — | | | | 4,806 | |
| Chilean Peso (CLP) | | | Buy | | | | 284,000 | CLP | | | 1/11/13 | | | | 592,262 | | | | 410 | | | | — | |
| Euro (EUR) | | | Buy | | | | 1,830 | EUR | | | 2/6/13 | | | | 2,416,302 | | | | 41,308 | | | | — | |
| Hungarian Forint (HUF) | | | Buy | | | | 250,000 | HUF | | | 2/6/13 | | | | 1,127,431 | | | | 10 | | | | 27,305 | |
| Indonesia Rupiah (IDR) | | | Buy | | | | 60,061,000 | IDR | | | 1/16/13 | | | | 6,170,247 | | | | — | | | | 50,468 | |
| Japanese Yen (JPY) | | | Buy | | | | 42,000 | JPY | | | 1/25/13 | | | | 484,896 | | | | — | | | | 24,337 | |
| Malaysian Ringgit (MYR) | | | Buy | | | | 124,820 | MYR | | | 1/29/13-4/2/13 | | | | 40,740,694 | | | | 226,489 | | | | — | |
| Malaysian Ringgit (MYR) | | | Sell | | | | 39,700 | MYR | | | 3/20/13-4/2/13 | | | | 12,945,991 | | | | — | | | | 115,504 | |
| Mexican Nuevo Peso (MXN) | | | Sell | | | | 58,000 | MXN | | | 4/4/13 | | | | 4,447,705 | | | | — | | | | 19,446 | |
| Peruvian New Sol (PEN) | | | Sell | | | | 1,440 | PEN | | | 1/16/13 | | | | 563,565 | | | | — | | | | 8,116 | |
| Philippines Peso (PHP) | | | Sell | | | | 113,000 | PHP | | | 1/14/13 | | | | 2,757,163 | | | | — | | | | 74,352 | |
| South African Rand (ZAR) | | | Buy | | | | 370 | ZAR | | | 5/31/13 | | | | 42,755 | | | | 1,943 | | | | — | |
| South African Rand (ZAR) | | | Sell | | | | 245,690 | ZAR | | | 2/12/13-4/5/13 | | | | 28,642,008 | | | | — | | | | 289,395 | |
| South Korean Won (KRW) | | | Buy | | | | 3,649,000 | KRW | | | 2/12/13 | | | | 3,416,048 | | | | 47,017 | | | | — | |
| | | | | | | | | | | | | | | | | | |
|
|
|
| | | | | | | | | | | | | | | | | | | | 317,177 | | | | 629,713 | |
| | | | |
| 38 | | | | OPPENHEIMER GLOBAL STRATEGIC INCOME FUND/VA |
| | | | | | | | | | | | | | | | | | | | | | | | |
| Forward Currency Exchange Contracts Continued | |
Counterparty/
Contract Description | | Buy/Sell | | | Contract Amount
(000’s) | | | Expiration
Dates | | | Value | | | Unrealized
Appreciation | | | Unrealized
Depreciation | |
| Barclays Bank plc: | | | | | | | | | | | | | | | | | | | | | | | | |
| Brazilian Real (BRR) | | | Sell | | | | 60,920 | BRR | | | 2/4/13 | | | $ | 29,611,792 | | | $ | — | | | $ | 326,810 | |
| Euro (EUR) | | | Sell | | | | 3,960 | EUR | | | 1/23/13-2/6/13 | | | | 5,228,656 | | | | — | | | | 150,569 | |
| Hungarian Forint (HUF) | | | Sell | | | | 3,091,000 | HUF | | | 2/6/13-5/29/13 | | | | 13,917,055 | | | | 9,097 | | | | 67,851 | |
| Israeli Shekel (ILS) | | | Buy | | | | 2,030 | ILS | | | 4/2/13 | | | | 542,049 | | | | 12,438 | | | | — | |
| Israeli Shekel (ILS) | | | Sell | | | | 2,030 | ILS | | | 4/2/13 | | | | 542,049 | | | | — | | | | 6,132 | |
| Mexican Nuevo Peso (MXN) | | | Buy | | | | 185,900 | MXN | | | 2/14/13 | | | | 14,321,313 | | | | — | | | | 185,125 | |
| Polish Zloty (PLZ) | | | Buy | | | | 49,100 | PLZ | | | 2/6/13 | | | | 15,800,105 | | | | 341,927 | | | | 43,208 | |
| Polish Zloty (PLZ) | | | Sell | | | | 25,470 | PLZ | | | 2/6/13-5/31/13 | | | | 8,187,993 | | | | — | | | | 300,920 | |
| Russian Ruble (RUR) | | | Buy | | | | 234,100 | RUR | | | 1/11/13-1/28/13 | | | | 7,648,297 | | | | 66,424 | | | | — | |
| South African Rand (ZAR) | | | Sell | | | | 33,610 | ZAR | | | 2/15/13 | | | | 3,939,025 | | | | 3,404 | | | | — | |
| | | | | | | | | | | | | | | | | | |
|
|
| |
|
|
|
| | | | | | | | | | | | | | | | | | | | 433,290 | | | | 1,080,615 | |
| BNP Paribas: | | | | | | | | | | | | | | | | | | | | | | | | |
| Australian Dollar (AUD) | | | Sell | | | | 6,230 | AUD | | | 1/22/13 | | | | 6,458,313 | | | | — | | | | 15,870 | |
| Colombian Peso (COP) | | | Sell | | | | 1,214,000 | COP | | | 2/28/13 | | | | 683,437 | | | | — | | | | 24,550 | |
| Euro (EUR) | | | Buy | | | | 7,260 | EUR | | | 5/31/13 | | | | 9,596,288 | | | | 197,703 | | | | 631 | |
| Euro (EUR) | | | Sell | | | | 13,940 | EUR | | | 5/31/13 | | | | 18,425,930 | | | | 42 | | | | 414,444 | |
| | | | | | | | | | | | | | | | | | |
|
|
| |
|
|
|
| | | | | | | | | | | | | | | | | | | | 197,745 | | | | 455,495 | |
| Citibank NA: | | | | | | | | | | | | | | | | | | | | | | | | |
| Australian Dollar (AUD) | | | Sell | | | | 10,790 | AUD | | | 5/31/13 | | | | 11,084,452 | | | | 17,099 | | | | — | |
| Colombian Peso (COP) | | | Sell | | | | 29,357,000 | COP | | | 1/11/13 | | | | 16,600,268 | | | | — | | | | 464,247 | |
| Hong Kong Dollar (HKD) | | | Buy | | | | 2,970 | HKD | | | 3/20/13 | | | | 383,285 | | | | — | | | | 15 | |
| Indonesia Rupiah (IDR) | | | Buy | | | | 90,433,000 | IDR | | | 1/16/13 | | | | 9,290,453 | | | | — | | | | 23,894 | |
| Mexican Nuevo Peso (MXN) | | | Buy | | | | 193,810 | MXN | | | 1/16/13-3/4/13 | | | | 14,918,726 | | | | 470 | | | | 209,621 | |
| Mexican Nuevo Peso (MXN) | | | Sell | | | | 65,300 | MXN | | | 5/16/13 | | | | 4,986,794 | | | | — | | | | 50,713 | |
| New Turkish Lira (TRY) | | | Sell | | | | 12,845 | TRY | | | 1/28/13 | | | | 7,171,245 | | | | — | | | | 67,020 | |
| Peruvian New Sol (PEN) | | | Buy | | | | 3,280 | PEN | | | 1/16/13 | | | | 1,283,675 | | | | 6,963 | | | | — | |
| Peruvian New Sol (PEN) | | | Sell | | | | 14,100 | PEN | | | 1/16/13 | | | | 5,518,236 | | | | — | | | | 101,629 | |
| Polish Zloty (PLZ) | | | Buy | | | | 7,000 | PLZ | | | 2/6/13 | | | | 2,252,561 | | | | 44,049 | | | | — | |
| | | | | | | | | | | | | | | | | | |
|
|
| |
|
|
|
| | | | | | | | | | | | | | | | | | | | 68,581 | | | | 917,139 | |
| Credit Suisse International: | | | | | | | | | | | | | | | | | | | | | | | | |
| British Pound Sterling (GBP) | | | Sell | | | | 2,040 | GBP | | | 2/28/13-5/31/13 | | | | 3,313,173 | | | | — | | | | 51,905 | |
| Canadian Dollar (CAD) | | | Buy | | | | 4,455 | CAD | | | 1/15/13 | | | | 4,477,275 | | | | — | | | | 44,466 | |
| Chilean Peso (CLP) | | | Buy | | | | 126,000 | CLP | | | 1/11/13 | | | | 262,764 | | | | — | | | | 1,925 | |
| Chilean Peso (CLP) | | | Sell | | | | 126,000 | CLP | | | 1/11/13 | | | | 262,764 | | | | — | | | | 510 | |
| Euro (EUR) | | | Sell | | | | 17,510 | EUR | | | 2/12/13 | | | | 23,121,077 | | | | — | | | | 376,184 | |
| Japanese Yen (JPY) | | | Sell | | | | 406,000 | JPY | | | 1/25/13 | | | | 4,687,326 | | | | 402,376 | | | | — | |
| New Turkish Lira (TRY) | | | Sell | | | | 14,210 | TRY | | | 1/28/13-7/17/13 | | | | 7,895,047 | | | | — | | | | 229,392 | |
| Peruvian New Sol (PEN) | | | Sell | | | | 13,170 | PEN | | | 1/16/13 | | | | 5,154,268 | | | | — | | | | 95,887 | |
| Swiss Franc (CHF) | | | Buy | | | | 1,555 | CHF | | | 1/15/13-5/31/13 | | | | 1,702,120 | | | | 15,095 | | | | — | |
| | | | | | | | | | | | | | | | | | |
|
|
| |
|
|
|
| | | | | | | | | | | | | | | | | | | | 417,471 | | | | 800,269 | |
| Deutsche Bank AG: | | | | | | | | | | | | | | | | | | | | | | | | |
| Euro (EUR) | | | Buy | | | | 6,445 | EUR | | | 1/31/13-2/6/13 | | | | 8,509,560 | | | | 231,255 | | | | — | |
| Euro (EUR) | | | Sell | | | | 18,465 | EUR | | | 1/31/13-4/25/13 | | | | 24,393,744 | | | | — | | | | 458,966 | |
| Hungarian Forint (HUF) | | | Sell | | | | 256,000 | HUF | | | 4/17/13-5/29/13 | | | | 1,144,769 | | | | — | | | | 15,367 | |
| Mexican Nuevo Peso (MXN) | | | Sell | | | | 9,300 | MXN | | | 5/31/13 | | | | 709,164 | | | | — | | | | 8,150 | |
| New Turkish Lira (TRY) | | | Sell | | | | 29,620 | TRY | | | 1/15/13 | | | | 16,567,695 | | | | — | | | | 389,789 | |
| Polish Zloty (PLZ) | | | Buy | | | | 5,850 | PLZ | | | 2/6/13 | | | | 1,882,497 | | | | — | | | | 7,099 | |
| | | | | | | | | | | | | | | | | | |
|
|
| |
|
|
|
| | | | | | | | | | | | | | | | | | | | 231,255 | | | | 879,371 | |
| | | | |
| 39 | | | | OPPENHEIMER GLOBAL STRATEGIC INCOME FUND/VA |
STATEMENT OF INVESTMENTS Continued
Footnotes to Statement of Investments Continued
| | | | | | | | | | | | | | | | | | | | | | | | |
| Forward Currency Exchange Contracts Continued | |
Counterparty/
Contract Description | | Buy/Sell | | | Contract Amount
(000’s) | | | Expiration
Dates | | | Value | | | Unrealized
Appreciation | | | Unrealized
Depreciation | |
| Goldman Sachs Bank USA: | | | | | | | | | | | | | | | | | | | | | | | | |
| Brazilian Real (BRR) | | | Sell | | | | 68,130 | BRR | | | 1/3/13-2/4/13 | | | $ | 33,182,561 | | | $ | — | | | $ | 170,221 | |
| British Pound Sterling (GBP) | | | Buy | | | | 2,795 | GBP | | | 1/15/13 | | | | 4,540,138 | | | | 10,928 | | | | — | |
| Euro (EUR) | | | Buy | | | | 1,305 | EUR | | | 1/9/13 | | | | 1,722,681 | | | | 26,488 | | | | — | |
| Euro (EUR) | | | Sell | | | | 2,610 | EUR | | | 1/9/13 | | | | 3,445,363 | | | | — | | | | 61,225 | |
| Hungarian Forint (HUF) | | | Sell | | | | 870,000 | HUF | | | 2/20/13-4/17/13 | | | | 3,912,738 | | | | — | | | | 81,188 | |
| Indian Rupee (INR) | | | Buy | | | | 190,000 | INR | | | 1/9/13 | | | | 3,461,839 | | | | 72,009 | | | | — | |
| Indian Rupee (INR) | | | Sell | | | | 95,000 | INR | | | 1/9/13 | | | | 1,730,920 | | | | — | | | | 10,217 | |
| Japanese Yen (JPY) | | | Buy | | | | 1,399,000 | JPY | | | 1/25/13-5/31/13 | | | | 16,166,605 | | | | — | | | | 850,734 | |
| New Turkish Lira (TRY) | | | Buy | | | | 12,750 | TRY | | | 1/28/13 | | | | 7,118,208 | | | | 2,020 | | | | 4,639 | |
| New Turkish Lira (TRY) | | | Sell | | | | 48,800 | TRY | | | 3/29/13-5/15/13 | | | | 26,957,472 | | | | — | | | | 345,612 | |
| South African Rand (ZAR) | | | Buy | | | | 18,060 | ZAR | | | 2/15/13 | | | | 2,116,596 | | | | — | | | | 1,829 | |
| | | | | | | | | | | | | | | | | | |
|
|
| |
|
|
|
| | | | | | | | | | | | | | | | | | | | 111,445 | | | | 1,525,665 | |
| HSBC Bank USA NA: | | | | | | | | | | | | | | | | | | | | | | | | |
| Mexican Nuevo Peso (MXN) | | | Sell | | | | 83,600 | MXN | | | 1/22/13 | | | | 6,453,715 | | | | — | | | | 34,303 | |
| New Turkish Lira (TRY) | | | Buy | | | | 3,240 | TRY | | | 7/17/13 | | | | 1,770,597 | | | | 106,925 | | | | — | |
| New Turkish Lira (TRY) | | | Sell | | | | 54,300 | TRY | | | 5/15/13 | | | | 29,912,569 | | | | — | | | | 189,193 | |
| | | | | | | | | | | | | | | | | | |
|
|
| |
|
|
|
| | | | | | | | | | | | | | | | | | | | 106,925 | | | | 223,496 | |
| JPMorgan Chase Bank NA: | | | | | | | | | | | | | | | | | | | | | | | | |
| Euro (EUR) | | | Buy | | | | 25,535 | EUR | | | 1/7/13-1/15/13 | | | | 33,709,113 | | | | 148,313 | | | | — | |
| Hungarian Forint (HUF) | | | Sell | | | | 3,827,000 | HUF | | | 2/12/13-2/20/13 | | | | 17,246,575 | | | | 31,336 | | | | 1,331,356 | |
| Indian Rupee (INR) | | | Buy | | | | 282,200 | INR | | | 1/22/13-1/28/13 | | | | 5,125,948 | | | | 42,027 | | | | — | |
| Indonesia Rupiah (IDR) | | | Sell | | | | 42,379,000 | IDR | | | 1/16/13 | | | | 4,353,722 | | | | — | | | | 460 | |
| Mexican Nuevo Peso (MXN) | | | Sell | | | | 308,900 | MXN | | | 1/16/13-4/18/13 | | | | 23,812,980 | | | | 23,799 | | | | 114,983 | |
| New Turkish Lira (TRY) | | | Sell | | | | 20,570 | TRY | | | 2/28/13 | | | | 11,439,739 | | | | — | | | | 104,533 | |
| New Zealand Dollar (NZD) | | | Sell | | | | 7,855 | NZD | | | 1/22/13 | | | | 6,481,820 | | | | — | | | | 69,783 | |
| Polish Zloty (PLZ) | | | Buy | | | | 4,680 | PLZ | | | 2/6/13 | | | | 1,505,998 | | | | — | | | | 5,386 | |
| Russian Ruble (RUR) | | | Sell | | | | 441,500 | RUR | | | 1/11/13-1/28/13 | | | | 14,437,492 | | | | — | | | | 430,720 | |
| South African Rand (ZAR) | | | Sell | | | | 136,990 | ZAR | | | 2/15/13 | | | | 16,054,955 | | | | — | | | | 450,251 | |
| South Korean Won (KRW) | | | Buy | | | | 11,837,000 | KRW | | | 3/18/13 | | | | 11,063,724 | | | | 213,548 | | | | — | |
| | | | | | | | | | | | | | | | | | |
|
|
| |
|
|
|
| | | | | | | | | | | | | | | | | | | | 459,023 | | | | 2,507,472 | |
| Morgan Stanley Capital Services, Inc.: | | | | | | | | | | | | | | | | | | | | | | | | |
| Canadian Dollar (CAD) | | | Sell | | | | 1,530 | CAD | | | 2/12/13 | | | | 1,536,746 | | | | 20,918 | | | | — | |
| Indonesia Rupiah (IDR) | | | Sell | | | | 48,054,000 | IDR | | | 1/16/13 | | | | 4,936,732 | | | | 2,015 | | | | — | |
| South Korean Won (KRW) | | | Buy | | | | 13,539,000 | KRW | | | 2/12/13 | | | | 12,674,670 | | | | 463,705 | | | | — | |
| South Korean Won (KRW) | | | Sell | | | | 9,528,000 | KRW | | | 2/12/13 | | | | 8,919,732 | | | | — | | | | 396,990 | |
| | | | | | | | | | | | | | | | | | |
|
|
| |
|
|
|
| | | | | | | | | | | | | | | | | | | | 486,638 | | | | 396,990 | |
| Nomura International plc: | | | | | | | | | | | | | | | | | | | | | | | | |
| Euro (EUR) | | | Sell | | | | 165 | EUR | | | 5/31/13 | | | | 218,097 | | | | — | | | | 2,022 | |
| Indonesia Rupiah (IDR) | | | Sell | | | | 60,061,000 | IDR | | | 1/16/13 | | | | 6,170,247 | | | | 10,776 | | | | — | |
| Japanese Yen (JPY) | | | Sell | | | | 5,160,000 | JPY | | | 1/15/13 | | | | 59,567,840 | | | | 6,164,644 | | | | — | |
| Malaysian Ringgit (MYR) | | | Sell | | | | 11,205 | MYR | | | 4/2/13 | | | | 3,653,880 | | | | — | | | | 44,952 | |
| | | | | | | | | | | | | | | | | | |
|
|
| |
|
|
|
| | | | | | | | | | | | | | | | | | | | 6,175,420 | | | | 46,974 | |
| The Royal Bank of Scotland plc: | | | | | | | | | | | | | | | | | | | | | | | | |
| Japanese Yen (JPY) | | | Buy | | | | 570,000 | JPY | | | 1/15/13 | | | | 6,580,168 | | | | — | | | | 219,631 | |
| New Turkish Lira (TRY) | | | Buy | | | | 4,520 | TRY | | | 1/15/13 | | | | 2,528,224 | | | | — | | | | 7,153 | |
| Russian Ruble (RUR) | | | Buy | | | | 65,980 | RUR | | | 1/28/13 | | | | 2,154,792 | | | | 50,089 | | | | — | |
| | | | | | | | | | | | | | | | | | |
|
|
| |
|
|
|
| | | | | | | | | | | | | | | | | | | | 50,089 | | | | 226,784 | |
| | | | | | | | | | | | | | | | | | |
|
|
| |
|
|
|
| Total unrealized appreciation and depreciation | | | | | | | | | | | | | | | | | | $ | 9,055,059 | | | $ | 9,689,983 | |
| | | | | | | | | | | | | | | | | | |
|
|
| |
|
|
|
| | | | |
| 40 | | | | OPPENHEIMER GLOBAL STRATEGIC INCOME FUND/VA |
| | | | | | | | | | | | | | | | | | | | | | | | |
| Spot Currency Exchange Contracts as of December 31, 2012 are as follows: | |
Counterparty/
Contract Description | | Buy/Sell | | | Contract Amount
(000’s) | | | Expiration
Date | | | Value | | | Unrealized
Appreciation | | | Unrealized
Depreciation | |
| Credit Suisse | | | | | | | | | | | | | | | | | | | | | | | | |
| Hong Kong Dollar (HKD) | | | Buy | | | | 736 | HKD | | | 1/7/13 | | | $ | 94,975 | | | $ | 14 | | | $ | — | |
| Goldman Sachs & Co. | | | | | | | | | | | | | | | | | | | | | | | | |
| Swedish Krona (SEK) | | | Sell | | | | 244 | SEK | | | 1/4/13 | | | | 37,496 | | | | — | | | | 36 | |
| Standard New York Securities, Inc. | | | | | | | | | | | | | | | | | | | | | | | | |
| Serbian Dinar (RSD) | | | Buy | | | | 34,013 | RSD | | | 1/4/13 | | | | 399,589 | | | | 1,543 | | | | — | |
| | | | | | | | | | | | | | | | | | |
|
|
| |
|
|
|
| Total unrealized appreciation and depreciation | | | | | | | | | | | | | | | | | | $ | 1,557 | | | $ | 36 | |
| | | | | | | | | | | | | | | | | | |
|
|
| |
|
|
|
| | | | | | | | | | | | | | | | | | | | |
| Futures Contracts as of December 31, 2012 are as follows: | | | | | | | | | | |
| | | | | |
| Contract Description | | Buy/Sell | | | Number
of
Contracts | | | Expiration
Date | | | Value | | | Unrealized
Appreciation
(Depreciation) | |
| Australian Treasury Bonds, 3 yr. | | | Sell | | | | 117 | | | | 3/15/13 | | | $ | 13,308,934 | | | $ | 20,799 | |
| Australian Treasury Bonds, 10 yr. | | | Sell | | | | 16 | | | | 3/15/13 | | | | 2,048,970 | | | | 16,511 | |
| Euro-Bundesobligation | | | Sell | | | | 27 | | | | 3/7/13 | | | | 5,190,444 | | | | (2,970 | ) |
| FTSE 100 Index | | | Sell | | | | 21 | | | | 3/15/13 | | | | 1,994,964 | | | | 3,501 | |
| Japan Bonds, 10 yr. | | | Sell | | | | 6 | | | | 3/11/13 | | | | 9,948,635 | | | | 70,456 | |
| Japanese Yen (JPY) | | | Buy | | | | 18 | | | | 3/18/13 | | | | 2,598,750 | | | | (51,728 | ) |
| SPI 200 Index | | | Sell | | | | 22 | | | | 3/21/13 | | | | 2,636,427 | | | | (32,832 | ) |
| Standard & Poor’s 500 E-Mini Index | | | Sell | | | | 640 | | | | 3/15/13 | | | | 45,443,200 | | | | (584,527 | ) |
| Standard & Poor’s/Toronto Stock Exchange 60 Index | | | Sell | | | | 10 | | | | 3/14/13 | | | | 1,430,381 | | | | (20,370 | ) |
| U.S. Long Bonds | | | Buy | | | | 399 | | | | 3/19/13 | | | | 58,852,500 | | | | (530,816 | ) |
| U.S. Long Bonds, 20 yr. | | | Sell | | | | 138 | | | | 3/19/13 | | | | 20,355,000 | | | | 154,198 | |
| U.S. Treasury Nts., 2 yr. | | | Sell | | | | 1,142 | | | | 3/28/13 | | | | 251,775,313 | | | | (61,541 | ) |
| U.S. Treasury Nts., 2 yr. | | | Buy | | | | 45 | | | | 3/28/13 | | | | 9,921,094 | | | | (701 | ) |
| U.S. Treasury Nts., 5 yr. | �� | | Sell | | | | 126 | | | | 3/28/13 | | | | 15,676,172 | | | | (1,328 | ) |
| U.S. Treasury Nts., 5 yr. | | | Buy | | | | 470 | | | | 3/28/13 | | | | 58,474,610 | | | | (40,921 | ) |
| U.S. Treasury Nts., 10 yr. | | | Sell | | | | 1,293 | | | | 3/19/13 | | | | 171,686,156 | | | | 480,222 | |
| U.S. Treasury Nts., 10 yr. | | | Buy | | | | 439 | | | | 3/19/13 | | | | 58,290,969 | | | | (256,330 | ) |
| U.S. Treasury Ultra Bonds | | | Buy | | | | 197 | | | | 3/19/13 | | | | 32,030,969 | | | | (514,037 | ) |
| | | | | | | | | | | | | | | | | | |
|
|
|
| | | | | | | | | | | | | | | | | | | $ | (1,352,414 | ) |
| | | | | | | | | | | | | | | | | | |
|
|
|
| | | | | | | | | | | | | | | | | | | | | | | | | | | | |
| Written Options as of December 31, 2012 are as follows: | | | | | | | | | | |
| Description | | Type | | | Number of
Contracts | | | Exercise
Price | | | Expiration
Date | | | Premiums
Received | | | Value | | | Unrealized
Appreciation/
(Depreciation) | |
| Euro (EUR) | | | Put | | | | 1,000,000 | | | | 1EUR per 1.535 SGD | | | | 2/21/13 | | | $ | 5,360 | | | $ | (894 | ) | | $ | 4,466 | |
| Euro (EUR) | | | Call | | | | 9,370,000 | | | | 1EUR per 285.000 HUF | | | | 1/16/13 | | | | 128,406 | | | | (292,517 | ) | | | (164,111 | ) |
| Euro (EUR) FX Futures, 3/18/13 | | | Call | | | | 117 | | | | 1.350 | | | | 1/7/13 | | | | 7,508 | | | | (3,656 | ) | | | 3,852 | |
| Euro (EUR) FX Futures, 3/18/13 | | | Call | | | | 67 | | | | 1.355 | | | | 1/7/13 | | | | 2,380 | | | | (1,256 | ) | | | 1,124 | |
| Indian Rupee (INR) | | | Call | | | | 471,015,000 | | | | 1USD per 47.000 INR | | | | 4/18/13 | | | | 6,013 | | | | (137 | ) | | | 5,876 | |
| Indian Rupee (INR) | | | Put | | | | 300,650,000 | | | | 1USD per 60.000 INR | | | | 4/18/13 | | | | 50,108 | | | | (24,256 | ) | | | 25,852 | |
| Japan Bonds Futures, 10 yr., 3/11/13 | | | Put | | | | 18 | | | | 141.000 | JPY | | | 3/1/13 | | | | 17,423 | | | | (20,777 | ) | | | (3,354 | ) |
| Japanese Yen (JPY) | | | Call | | | | 366,000,460 | | | | 1USD per 72.000 JPY | | | | 5/31/13 | | | | 85,817 | | | | (88 | ) | | | 85,729 | |
| Japanese Yen (JPY) | | | Put | | | | 526,000,000 | | | | 1USD per 88.500 JPY | | | | 3/18/13 | | | | 22,823 | | | | (57,518 | ) | | | (34,695 | ) |
| Japanese Yen (JPY) | | | Put | | | | 482,917,273 | | | | 1USD per 95.000 JPY | | | | 5/31/13 | | | | 22,217 | | | | (21,437 | ) | | | 780 | |
| Japanese Yen (JPY) Futures, 3/18/13 | | | Call | | | | 156 | | | | 122.500 | | | | 1/7/13 | | | | 7,507 | | | | (975 | ) | | | 6,532 | |
| Japanese Yen (JPY) Futures, 3/18/13 | | | Call | | | | 98 | | | | 125.000 | | | | 1/7/13 | | | | 12,206 | | | | (613 | ) | | | 11,593 | |
| Japanese Yen (JPY) Futures, 3/18/13 | | | Call | | | | 44 | | | | 122.000 | | | | 1/7/13 | | | | 2,681 | | | | (275 | ) | | | 2,406 | |
| Japanese Yen (JPY) Futures, 3/18/13 | | | Put | | | | 134 | | | | 114.500 | | | | 1/7/13 | | | | 17,622 | | | | (31,825 | ) | | | (14,203 | ) |
| | | | |
| 41 | | | | OPPENHEIMER GLOBAL STRATEGIC INCOME FUND/VA |
STATEMENT OF INVESTMENTS Continued
Footnotes to Statement of Investments Continued
| | | | | | | | | | | | | | | | | | | | | | | | | | | | |
| Written Options Continued | | | | | | | | | | |
| Description | | Type | | | Number of
Contracts | | | Exercise
Price | | | Expiration
Date | | | Premiums
Received | | | Value | | | Unrealized
Appreciation/
(Depreciation) | |
| Japanese Yen (JPY) Futures, 3/18/13 | | | Put | | | | 46 | | | | $113.000 | | | | 1/7/13 | | | $ | 553 | | | $ | (2,013 | ) | | $ | (1,460 | ) |
| Japanese Yen (JPY) Futures, 3/18/13 | | | Put | | | | 1 | | | | 118.000 | | | | 1/7/13 | | | | 1,598 | | | | (3,150 | ) | | | (1,552 | ) |
| Mexican Nuevo Peso (MXN) | | | Call | | | | 180,550,000 | | | | 1USD per 12.450 MXN | | | | 1/2/13 | | | | 67,724 | | | | (83 | ) | | | 67,641 | |
| Mexican Nuevo Peso (MXN) | | | Call | | | | 117,500,000 | | | | 1USD per 12.450 MXN | | | | 1/3/13 | | | | 45,679 | | | | (276 | ) | | | 45,403 | |
| Mexican Nuevo Peso (MXN) | | | Call | | | | 112,950,000 | | | | 1USD per 12.450 MXN | | | | 1/3/13 | | | | 43,320 | | | | (265 | ) | | | 43,055 | |
| Mexican Nuevo Peso (MXN) | | | Call | | | | 112,850,000 | | | | 1USD per 12.450 MXN | | | | 1/2/13 | | | | 44,933 | | | | (52 | ) | | | 44,881 | |
| Mexican Nuevo Peso (MXN) | | | Put | | | | 195,800,000 | | | | 1USD per 13.500 MXN | | | | 1/2/13 | | | | 137,495 | | | | (4 | ) | | | 137,491 | |
| Mexican Nuevo Peso (MXN) | | | Put | | | | 127,400,000 | | | | 1USD per 13.500 MXN | | | | 1/3/13 | | | | 87,198 | | | | (37 | ) | | | 87,161 | |
| Mexican Nuevo Peso (MXN) | | | Put | | | | 122,450,000 | | | | 1USD per 13.500 MXN | | | | 1/3/13 | | | | 75,511 | | | | (36 | ) | | | 75,475 | |
| Mexican Nuevo Peso (MXN) | | | Put | | | | 97,900,000 | | | | 1USD per 13.500 MXN | | | | 1/2/13 | | | | 69,051 | | | | (2 | ) | | | 69,049 | |
| South African Rand (ZAR) | | | Call | | | | 93,800,000 | | | | 1USD per 8.250 ZAR | | | | 3/18/13 | | | | 102,441 | | | | (113,608 | ) | | | (11,167 | ) |
| South African Rand (ZAR) | | | Call | | | | 93,800,000 | | | | 1USD per 8.250 ZAR | | | | 3/18/13 | | | | 105,170 | | | | (113,608 | ) | | | (8,438 | ) |
| South African Rand (ZAR) | | | Call | | | | 77,700,000 | | | | 1USD per 8.200 ZAR | | | | 3/18/13 | | | | 83,385 | | | | (79,436 | ) | | | 3,949 | |
| South African Rand (ZAR) | | | Put | | | | 102,950,000 | | | | 1USD per 9.055 ZAR | | | | 3/18/13 | | | | 131,544 | | | | (95,036 | ) | | | 36,508 | |
| South African Rand (ZAR) | | | Put | | | | 102,950,000 | | | | 1USD per 9.055 ZAR | | | | 3/18/13 | | | | 126,200 | | | | (95,036 | ) | | | 31,164 | |
| South African Rand (ZAR) | | | Put | | | | 85,300,000 | | | | 1USD per 9.000 ZAR | | | | 3/18/13 | | | | 107,194 | | | | (88,231 | ) | | | 18,963 | |
| U.S. Long Bonds Futures, 3/19/13 | | | Put | | | | 173 | | | | 143.000 | | | | 1/28/13 | | | | 28,277 | | | | (37,844 | ) | | | (9,567 | ) |
| U.S. Treasury Long Bonds Futures, 3/19/13 | | | Put | | | | 374 | | | | 143.000 | | | | 1/7/13 | | | | 5,150 | | | | (11,688 | ) | | | (6,538 | ) |
| U.S. Treasury Long Bonds Futures, 3/19/13 | | | Put | | | | 2 | | | | 146.000 | | | | 1/7/13 | | | | 371 | | | | (563 | ) | | | (192 | ) |
| U.S. Treasury Nts., 10 yr. Futures, 3/19/13 | | | Put | | | | 890 | | | | 129.500 | | | | 1/28/13 | | | | 47,245 | | | | (41,719 | ) | | | 5,526 | |
| U.S. Treasury Nts., 10 yr. Futures, 3/19/13 | | | Put | | | | 383 | | | | 130.000 | | | | 1/28/13 | | | | 23,409 | | | | (23,938 | ) | | | (529 | ) |
| U.S. Treasury Nts., 10 yr. Futures, 3/19/13 | | | Put | | | | 105 | | | | 129.000 | | | | 1/28/13 | | | | 3,136 | | | | (3,281 | ) | | | (145 | ) |
| | | | | | | | | | | | | | | | | | |
|
|
| |
|
|
| |
|
|
|
| | | | | | | | | | | | | | | | | | | $ | 1,724,655 | | | $ | (1,166,130 | ) | | $ | 558,525 | |
| | | | | | | | | | | | | | | | | | |
|
|
| |
|
|
| |
|
|
|
Exercise price is reported in U.S. Dollars (USD), except for those denoted in the following currency:
| | | | | | | | | | | | | | | | | | | | | | | | | | | | |
| Credit Default Swap Contracts as of December 31, 2012 are as follows: | | | | | | | | | | |
| Reference Entity/ Swap Counterparty | | Buy/Sell
Credit
Protection | | | Notional
Amount
(000’s) | | | Pay/
Receive
Fixed
Rate | | | Termination
Date | | | Upfront
Payment
Received/
(Paid) | | | Value | | | Unrealized
Appreciation
(Depreciation) | |
| Banco Bilbao Vizcaya Argentaria Senior Finance SAU: | | | | | | | | | | | | | | | | | | | | | | | | | |
| UBS AG | | | Sell | | | | 125 | EUR | | | 3.0 | % | | | 12/20/17 | | | $ | 4,874 | | | $ | 1,319 | | | $ | 6,193 | |
| UBS AG | | | Sell | | | | 125 | EUR | | | 3.0 | | | | 12/20/17 | | | | 5,012 | | | | 1,319 | | | | 6,331 | |
| | | | | | |
|
|
| | | | | | | | | |
|
|
| |
|
|
| |
|
|
|
| Total | | | | | | | 250 | EUR | | | | | | | | | | | 9,886 | | | | 2,638 | | | | 12,524 | |
| Banco Santander SA | | | | | | | | | | | | | | | | | | | | | | | | | | | | |
| UBS AG | | | Sell | | | | 250 | EUR | | | 3.0 | | | | 9/20/17 | | | | (901 | ) | | | 5,048 | | | | 4,147 | |
| | | | | | |
|
|
| | | | | | | | | |
|
|
| |
|
|
| |
|
|
|
| Total | | | | | | | 250 | EUR | | | | | | | | | | | (901 | ) | | | 5,048 | | | | 4,147 | |
| Barrick Gold Corp. | | | | | | | | | | | | | | | | | | | | | | | | | | | | |
| Deutsche Bank AG | | | Buy | | | | 5,140 | | | | 1.0 | | | | 3/20/18 | | | | (95,886 | ) | | | 87,731 | | | | (8,155 | ) |
| | | | | | |
|
|
| | | | | | | | | |
|
|
| |
|
|
| |
|
|
|
| Total | | | | | | | 5,140 | | | | | | | | | | | | (95,886 | ) | | | 87,731 | | | | (8,155 | ) |
| CDX Emerging Market Index, Series 18 | | | | | | | | | | | | | | | | | | | | | | | | | | | | |
| Barclays Bank plc | | | Buy | | | | 5,700 | | | | 5.0 | | | | 12/20/17 | | | | 739,448 | | | | (772,640 | ) | | | (33,192 | ) |
| | | | | | |
|
|
| | | | | | | | | |
|
|
| |
|
|
| |
|
|
|
| Total | | | | | | | 5,700 | | | | | | | | | | | | 739,448 | | | | (772,640 | ) | | | (33,192 | ) |
| Computer Sciences Corp. | | | | | | | | | | | | | | | | | | | | | | | | | | | | |
| Credit Suisse International | | | Sell | | | | 5,140 | | | | 1.0 | | | | 3/20/18 | | | | 98,547 | | | | (134,031 | ) | | | (35,484 | ) |
| | | | | | |
|
|
| | | | | | | | | |
|
|
| |
|
|
| |
|
|
|
| Total | | | | | | | 5,140 | | | | | | | | | | | | 98,547 | | | | (134,031 | ) | | | (35,484 | ) |
| | | | |
| 42 | | | | OPPENHEIMER GLOBAL STRATEGIC INCOME FUND/VA |
| | | | | | | | | | | | | | | | | | | | | | | | | | | | |
| Credit Default Swap Contracts: Continued | | | | | | | | | | |
| Reference Entity/ Swap Counterparty | | Buy/Sell
Credit
Protection | | | Notional
Amount
(000’s) | | | Pay/
Receive
Fixed
Rate | | | Termination
Date | | | Upfront
Payment
Received/
(Paid) | | | Value | | | Unrealized
Appreciation
(Depreciation) | |
| Constellation Energy Group, Inc. | | | | | | | | | | | | | | | | | | | | | | | | | | | | |
| Goldman Sachs International | | | Buy | | | | 5,140 | | | | 1.0% | | | | 3/20/18 | | | $ | 46,379 | | | $ | (50,555 | ) | | $ | (4,176 | ) |
| | | | | | |
|
|
| | | | | | | | | |
|
|
| |
|
|
| |
|
|
|
| Total | | | | | | | 5,140 | | | | | | | | | | | | 46,379 | | | | (50,555 | ) | | | (4,176 | ) |
| Dell, Inc. | | | | | | | | | | | | | | | | | | | | | | | | | | | | |
| Goldman Sachs International | | | Buy | | | | 4,800 | | | | 1.0 | | | | 12/20/17 | | | | (361,560 | ) | | | 284,477 | | | | (77,083 | ) |
| | | | | | |
|
|
| | | | | | | | | |
|
|
| |
|
|
| |
|
|
|
| Total | | | | | | | 4,800 | | | | | | | | | | | | (361,560 | ) | | | 284,477 | | | | (77,083 | ) |
| Devon Energy Corp. | | | | | | | | | | | | | | | | | | | | | | | | | | | | |
| Deutsche Bank AG | | | Buy | | | | 5,140 | | | | 1.0 | | | | 3/20/18 | | | | 21,536 | | | | (20,826 | ) | | | 710 | |
| | | | | | |
|
|
| | | | | | | | | |
|
|
| |
|
|
| |
|
|
|
| Total | | | | | | | 5,140 | | | | | | | | | | | | 21,536 | | | | (20,826 | ) | | | 710 | |
| Expedia, Inc. | | | | | | | | | | | | | | | | | | | | | | | | | | | | |
| Credit Suisse International | | | Sell | | | | 4,860 | | | | 1.0 | | | | 12/20/17 | | | | 135,108 | | | | (174,364 | ) | | | (39,256 | ) |
| | | | | | |
|
|
| | | | | | | | | |
|
|
| |
|
|
| |
|
|
|
| Total | | | | | | | 4,860 | | | | | | | | | | | | 135,108 | | | | (174,364 | ) | | | (39,256 | ) |
| Hewlett-Packard Co. | | | | | | | | | | | | | | | | | | | | | | | | | | | | |
| Barclays Bank plc | | | Buy | | | | 5,110 | | | | 1.0 | | | | 12/20/17 | | | | (519,382 | ) | | | 482,477 | | | | (36,905 | ) |
| | | | | | |
|
|
| | | | | | | | | |
|
|
| |
|
|
| |
|
|
|
| Total | | | | | | | 5,110 | | | | | | | | | | | | (519,382 | ) | | | 482,477 | | | | (36,905 | ) |
| Istanbul Bond Co. SA for Finansbank AS | | | | | | | | | | | | | | | | | | | | | | | | | | | | |
| Morgan Stanley Capital Services, Inc. | | | Sell | | | | 3,100 | | | | 1.3 | | | | 3/24/13 | | | | — | | | | (3,670 | ) | | | (3,670 | ) |
| | | | | | |
|
|
| | | | | | | | | |
|
|
| |
|
|
| |
|
|
|
| Total | | | | | | | 3,100 | | | | | | | | | | | | — | | | | (3,670 | ) | | | (3,670 | ) |
| Peru (Republic of) | | | | | | | | | | | | | | | | | | | | | | | | | | | | |
| Deutsche Bank AG | | | Buy | | | | 2,885 | | | | 1.0 | | | | 3/20/18 | | | | 10,130 | | | | (529 | ) | | | 9,601 | |
| | | | | | |
|
|
| | | | | | | | | |
|
|
| |
|
|
| |
|
|
|
| Total | | | | | | | 2,885 | | | | | | | | | | | | 10,130 | | | | (529 | ) | | | 9,601 | |
| Portuguese Republic: | | | | | | | | | | | | | | | | | | | | | | | | | | | | |
| Deutsche Bank AG | | | Sell | | | | 4,860 | | | | 5.0 | | | | 12/20/17 | | | | (400,100 | ) | | | 338,979 | | | | (61,121 | ) |
| JPMorgan Chase Bank NA | | | Sell | | | | 130 | | | | 1.0 | | | | 12/20/22 | | | | 33,204 | | | | (31,419 | ) | | | 1,785 | |
| JPMorgan Chase Bank NA | | | Sell | | | | 130 | | | | 1.0 | | | | 12/20/22 | | | | 33,526 | | | | (31,419 | ) | | | 2,107 | |
| UBS AG | | | Buy | | | | 395 | | | | 1.0 | | | | 12/20/17 | | | | (60,358 | ) | | | 53,756 | | | | (6,602 | ) |
| UBS AG | | | Sell | | | | 135 | | | | 1.0 | | | | 12/20/22 | | | | 36,525 | | | | (32,628 | ) | | | 3,897 | |
| UBS AG | | | Sell | | | | 395 | | | | 1.0 | | | | 12/20/22 | | | | 102,821 | | | | (95,466 | ) | | | 7,355 | |
| | | | | | |
|
|
| | | | | | | | | |
|
|
| |
|
|
| |
|
|
|
| Total | | | | | | | 6,045 | | | | | | | | | | | | (254,382 | ) | | | 201,803 | | | | (52,579 | ) |
| SLM Corp. | | | | | | | | | | | | | | | | | | | | | | | | | | | | |
| Goldman Sachs International | | | Buy | | | | 1,295 | EUR | | | 1.0 | | | | 3/20/18 | | | | (113,707 | ) | | | 117,077 | | | | 3,370 | |
| | | | | | |
|
|
| | | | | | | | | |
|
|
| |
|
|
| |
|
|
|
| Total | | | | | | | 1,295 | EUR | | | | | | | | | | | (113,707 | ) | | | 117,077 | | | | 3,370 | |
| Spain (Kingdom of): | | | | | | | | | | | | | | | | | | | | | | | | | | | | |
| Goldman Sachs International | | | Buy | | | | 1,655 | EUR | | | 1.0 | | | | 3/20/23 | | | | (285,515 | ) | | | 282,318 | | | | (3,197 | ) |
| UBS AG | | | Buy | | | | 250 | EUR | | | 1.0 | | | | 9/20/17 | | | | (19,067 | ) | | | 19,901 | | | | 834 | |
| | | | | | |
|
|
| | | | | | | | | |
|
|
| |
|
|
| |
|
|
|
| Total | | | | | | | 1,905 | EUR | | | | | | | | | | | (304,582 | ) | | | 302,219 | | | | (2,363 | ) |
| Valero Energy Corp. | | | | | | | | | | | | | | | | | | | | | | | | | | | | |
| Morgan Stanley Capital Services, Inc. | | | Sell | | | | 5,140 | | | | 1.0 | | | | 3/20/18 | | | | 73,691 | | | | (79,093 | ) | | | (5,402 | ) |
| | | | | | |
|
|
| | | | | | | | | |
|
|
| |
|
|
| |
|
|
|
| Total | | | | | | | 5,140 | | | | | | | | | | | | 73,691 | | | | (79,093 | ) | | | (5,402 | ) |
| Whirlpool Corp. | | | | | | | | | | | | | | | | | | | | | | | | | | | | |
| Bank of America NA | | | Sell | | | | 5,110 | | | | 1.0 | | | | 12/20/17 | | | | 68,453 | | | | (66,055 | ) | | | 2,398 | |
| | | | | | |
|
|
| | | | | | | | | |
|
|
| |
|
|
| |
|
|
|
| Total | | | | | | | 5,110 | | | | | | | | | | | | 68,453 | | | | (66,055 | ) | | | 2,398 | |
| | | | | | | | | | | | | | | | | | |
|
|
| |
|
|
| |
|
|
|
| | | | | | | | Grand Total Buys | | | | (637,982 | ) | | | 483,187 | | | | (154,795 | ) |
| | | | | | | | Grand Total Sells | | | | 190,760 | | | | (301,480 | ) | | | (110,720 | ) |
| | | | | | | | | | | | | | | | | | |
|
|
| |
|
|
| |
|
|
|
| | | | | | | | Total Credit Default Swaps | | | $ | (447,222 | ) | | $ | 181,707 | | | $ | (265,515 | ) |
| | | | | | | | | | | | | | | | | | |
|
|
| |
|
|
| |
|
|
|
| | | | |
| 43 | | | | OPPENHEIMER GLOBAL STRATEGIC INCOME FUND/VA |
STATEMENT OF INVESTMENTS Continued
Footnotes to Statement of Investments Continued
Notional amount is reported in U.S. Dollars (USD), except for those denoted in the following currency:
The table that follows shows the undiscounted maximum potential payment by the Fund related to selling credit protection in credit default swaps:
| | | | | | | | | | | | |
Type of Reference Asset on which the
Fund Sold Protection | | Total Maximum Potential
Payments for Selling
Credit Protection
(Undiscounted) | | | Amount Recoverable* | | | Reference
Asset Rating
Range**
(Unaudited) | |
| Investment Grade Single Name Corporate Debt | | | 500,000 | EUR | | $ | — | | | | BBB to BBB- | |
| Investment Grade Single Name Corporate Debt | | | 25,110,000 | USD | | | — | | | | BBB to BBB- | |
| Non-Investment Grade Single Name Corporate Debt | | | 3,100,000 | USD | | | — | | | | BB+ | |
| Non-Investment Grade Sovereign Debt | | | 790,000 | USD | | | 395,000 | | | | BB | |
| | |
|
|
| | | | |
| Total USD | | $ | 29,000,000 | | | $ | 395,000 | | | | | |
| | |
|
|
| | | | |
| Total EUR | | | 500,000 | EUR | | | — | | | | | |
| | |
|
|
| | | | |
* Amounts recoverable includes potential payments from related purchased protection for instances where the Fund is the seller of protection. In addition, the Fund has no recourse provisions under the credit derivatives and holds no collateral which can offset or reduce potential payments under a triggering event.
** The period end reference asset security ratings, as rated by any rating organization, are included in the equivalent Standard & Poor’s rating category. The reference asset rating represents the likelihood of a potential credit event on the reference asset which would result in a related payment by the Fund.
| | | | | | | | | | | | | | | | | | | | |
| Interest Rate Swap Contracts as of December 31, 2012 are as follows: | | | | | | | | | | |
Interest Rate/
Swap Counterparty | | Notional
Amount
(000’s) | | | Paid by
the Fund | | | Received by
the Fund | | | Termination
Date | | | Value | |
| BZDI: | | | | | | | | | | | | | | | | | | | | |
| Bank of America NA | | | 10,140 | BRR | | | BZDI | | | | 8.090 | % | | | 1/2/15 | | | $ | 48,861 | |
| Deutsche Bank AG | | | 17,370 | BRR | | | BZDI | | | | 8.080 | | | | 1/2/15 | | | | 93,083 | |
| Goldman Sachs International | | | 21,700 | BRR | | | BZDI | | | | 8.640 | | | | 1/2/17 | | | | 150,887 | |
| Goldman Sachs International | | | 11,550 | BRR | | | BZDI | | | | 8.080 | | | | 1/2/15 | | | | 54,724 | |
| Goldman Sachs International | | | 17,430 | BRR | | | BZDI | | | | 7.785 | | | | 1/2/15 | | | | 23,562 | |
| | |
|
|
| | | | | | | | | | | | | |
|
|
|
| Total | | | 78,190 | BRR | | | | | | | | | | | | | | | 371,117 | |
| Six-Month AUD BBR BBSW: | | | | | | | | | | | | | | | | | | | | |
| Bank of America NA | | | 6,175 | AUD | | | 3.823 | % | | | Six-Month AUD BBR BBSW | | | | 12/4/22 | | | | (821 | ) |
| | |
|
|
| | | | | | | | | | | | | |
|
|
|
| Total where Fund pays a fixed rate | | | 6,175 | AUD | | | | | | | | | | | | | | | (821 | ) |
| | |
|
|
| | | | | | | | | | | | | |
|
|
|
| Bank of America NA | | | 1,895 | AUD | | | Six-Month AUD BBR BBSW | | | | 3.680 | | | | 9/28/22 | | | | (18,731 | ) |
| Bank of America NA | | | 315 | AUD | | | Six-Month AUD BBR BBSW | | | | 4.403 | | | | 12/21/42 | | | | 4,127 | |
| | |
|
|
| | | | | | | | | | | | | |
|
|
|
| Total where Fund pays a variable rate | | | 2,210 | AUD | | | | | | | | | | | | | | | (14,604 | ) |
| | |
|
|
| | | | | | | | | | | | | |
|
|
|
| Total | | | 8,385 | AUD | | | | | | | | | | | | | | | (15,425 | ) |
| Six-Month EUR EURIBOR | | | | | | | | | | | | | | | | | | | | |
| Bank of America NA | | | 4,710 | EUR | | | Six-Month EUR EURIBOR | | | | 1.734 | | | | 10/2/22 | | | | 134,885 | |
| Six-Month JPY BBA LIBOR | | | | | | | | | | | | | | | | | | | | |
| Barclays Bank plc | | | 529,000 | JPY | | | 0.760 | | | | Six-Month JPY BBA LIBOR | | | | 12/5/22 | | | | 40,167 | |
| Three-Month CAD BA CDOR: | | | | | | | | | | | | | | | | | | | | |
| Bank of America NA | | | 6,220 | CAD | | | 1.538 | | | | Three-Month CAD BA CDOR | | | | 8/13/13 | | | | (18,136 | ) |
| Bank of America NA | | | 2,485 | CAD | | | 1.590 | | | | Three-Month CAD BA CDOR | | | | 8/7/14 | | | | (12,248 | ) |
| | |
|
|
| | | | | | | | | | | | | |
|
|
|
| Total where Fund pays a fixed rate | | | 8,705 | CAD | | | | | | | | | | | | | | | (30,384 | ) |
| | |
|
|
| | | | | | | | | | | | | |
|
|
|
| Bank of America NA | | | 1,275 | CAD | | | Three-Month CAD BA CDOR | | | | 2.079 | | | | 7/11/22 | | | | (6,958 | ) |
| Bank of America NA | | | 1,275 | CAD | | | Three-Month CAD BA CDOR | | | | 2.010 | | | | 7/25/22 | | | | (15,914 | ) |
| | |
|
|
| | | | | | | | | | | | | |
|
|
|
| Total where Fund pays a variable rate | | | 2,550 | CAD | | | | | | | | | | | | | | | (22,872 | ) |
| | |
|
|
| | | | | | | | | | | | | |
|
|
|
| Total | | | 11,255 | CAD | | | | | | | | | | | | | | | (53,256 | ) |
| | | | |
| 44 | | | | OPPENHEIMER GLOBAL STRATEGIC INCOME FUND/VA |
| | | | | | | | | | | | | | | | | | | | |
| Interest Rate Swap Contracts Continued | | | | | | | | | | |
Interest Rate/
Swap Counterparty | | Notional
Amount
(000’s) | | | Paid by
the Fund | | | Received by
the Fund | | | Termination
Date | | | Value | |
| Three-Month USD BBA LIBOR: | | | | | | | | | | | | | | | | | | | | |
| Bank of America NA | | $ | 1,200 | | | | 1.550 | % | | | Three-Month USD BBA
LIBOR | | | | 7/27/22 | | | $ | 13,776 | |
| Bank of America NA | | | 1,225 | | | | 1.621 | | | | Three-Month USD BBA
LIBOR | | | | 7/13/22 | | | | 4,534 | |
| Citibank NA | | | 5,140 | | | | 0.813 | | | | Three-Month USD BBA
LIBOR | | | | 10/18/17 | | | | (10,347 | ) |
| Citibank NA | | | 5,060 | | | | 0.819 | | | | Three-Month USD BBA
LIBOR | | | | 9/17/17 | | | | (21,459 | ) |
| | |
|
|
| | | | | | | | | | | | | |
|
|
|
| Total where Fund pays a fixed rate | | | 12,625 | | | | | | | | | | | | | | | | (13,496 | ) |
| | |
|
|
| | | | | | | | | | | | | |
|
|
|
| Barclays Bank plc | | | 6,425 | | |
| Three-Month USD
BBA LIBOR |
| | | 1.681 | % | | | 12/5/22 | | | | (65,212 | ) |
| | |
|
|
| | | | | | | | | | | | | |
|
|
|
| Total where Fund pays a variable rate | | | 6,425 | | | | | | | | | | | | | | | | (65,212 | ) |
| | |
|
|
| | | | | | | | | | | | | |
|
|
|
| Total | | | 19,050 | | | | | | | | | | | | | | | | (78,708 | ) |
| | | | | | | | | | | | | | | | | | |
|
|
|
| | | | | | | | Total Interest Rate Swaps | | | $ | 398,780 | |
| | | | | | | | | | | | | | | | | | |
|
|
|
Notional amount is reported in U.S. Dollars (USD), except for those denoted in the following currencies:
| | |
| AUD | | Australian Dollar |
| BRR | | Brazilian Real |
| CAD | | Canadian Dollar |
| EUR | | Euro |
| JPY | | Japanese Yen |
Abbreviations/Definitions are as follows:
| | |
| BA CDOR | | Canada Bankers Acceptances Deposit Offering Rate |
| BBA LIBOR | | British Bankers’ Association London-Interbank Offered Rate |
| BBR BBSW | | Bank Bill Swap Reference Rate (Australian Financial Market) |
| BZDI | | Brazil Interbank Deposit Rate |
| EURIBOR | | Euro Interbank Offered Rate |
| | | | | | | | | | | | | | | | |
| Total Return Swap Contracts as of December 31, 2012 are as follows: | | | | | | | | |
Reference Entity/
Swap Counterparty | | Notional
Amount
(000’s) | | | Paid by
the Fund | | Received by
the Fund | | Termination
Date | | | Value | |
| BOVESPA Futures Contract expiring 2/13/13 | | | | | | | | | | |
| Goldman Sachs International | | $ | 1,641 | | | If positive, Total Return of the BOVESPA Futures Contract expiring 2/13/13 | | If negative, the absolute value of the Total Return of the BOVESPA Futures Contract expiring 2/13/13 | | | 2/14/13 | | | $ | (88,566 | ) |
| Custom Basket of Securities: | | | | | | | | | | |
| Citibank NA | | | 4,441 | AUD | | One-Month AUD BBA LIBOR plus 50 basis points and if negative, the absolute value of the Total Return of a Custom Basket of Securities | | If positive, the Total Return of a Custom Basket of Securities | | | 3/8/13 | | | | 77,356 | |
| Citibank NA | | | 4,601 | CAD | | One-Month CAD BA CDOR plus 30 basis points and if negative, the absolute value of the Total Return of a Custom Basket of Securities | | If positive, the Total Return of a Custom Basket of Securities | | | 3/6/13 | | | | 51,567 | |
| Goldman Sachs International | | | 36,547 | HKD | | One-Month HKD HIBOR HKAB plus 40 basis points and if negative, the absolute value of the Total Return of a Custom Basket of Securities | | If positive, the Total Return of a Custom Basket of Securities | | | 12/12/13 | | | | 183,542 | |
| Goldman Sachs International | | | 3,558 | | | One-Month USD BBA LIBOR plus 25 basis points and if negative, the absolute value of the Total Return of a Custom Basket of Securities | | If positive, the Total Return of a Custom Basket of Securities | | | 12/6/13 | | | | 194,551 | |
| | | | |
| 45 | | | | OPPENHEIMER GLOBAL STRATEGIC INCOME FUND/VA |
STATEMENT OF INVESTMENTS Continued
Footnotes to Statement of Investments Continued
| | | | | | | | | | | | | | | | |
| Total Return Swap Contracts: Continued | | | | | | |
Reference Entity/
Swap Counterparty | | Notional
Amount
(000’s) | | | Paid by
the Fund | | Received by
the Fund | | Termination
Date | | | Value | |
| Custom Basket of Securities: Continued | | | | | | | | | | |
| Goldman Sachs International | | $ | 25,680 | | | One-Month USD BBA LIBOR plus 18 basis points and if negative, the absolute value of the Total Return of a Custom Basket of Securities | | If positive, the Total Return of a Custom Basket of Securities | | | 12/6/13 | | | $ | 6,686 | |
| Morgan Stanley Capital Services, Inc. | | | 1,483 | GBP | | One-Month GBP BBA LIBOR plus 50 basis points and if negative, the absolute value of the Total Return of a Custom Basket of Securities | | If positive, the Total Return of a Custom Basket of Securities | | | 7/10/13 | | | | (8,309 | ) |
| | | | | | | | | | | | | | |
|
|
|
| | | | | | | | | Reference Entity Total | | | | 505,393 | |
| | | | | | | | | | | | | | |
|
|
|
| HANG SENG Index futures contract expiring 1/30/13 | | | | | | | | | | |
| Goldman Sachs International | | | 26,101 | HKD | | If positive, Total Return of the HANG SENG Index Futures Contract expiring 1/30/13 | | If negative, the absolute value of the Total Return of the HANG SENG Index Futures Contract expiring 1/30/13 | | | 2/6/13 | | | | 3,377 | |
| | | | | | | | | | | | | | |
|
|
|
| | | | | | | | | Total of Total Return Swaps | | | $ | 420,204 | |
| | | | | | | | | | | | | | |
|
|
|
Notional amount is reported in U.S. Dollars (USD), except for those denoted in the following currencies:
| | |
| AUD | | Australian Dollar |
| CAD | | Canadian Dollar |
| GBP | | British Pounds Sterling |
| HKD | | Hong Kong Dollar |
Abbreviations are as follows:
| | |
| BA CDOR | | Canada Bankers Acceptances Deposit offering Rate |
| BBA LIBOR | | British Bankers’ Association London-Interbank Offered Rate |
| BOVESPA | | Bovespa Index that trades on the Sao Paulo Stock Exchange |
| HANG SENG | | Hang Seng Bank |
| HIBOR | | Hong Kong Interbank Offered Rate |
| HKAB | | Hong Kong Association of Banks |
| | | | | | | | | | | | | | | | | | | | |
| Volatility Swaps as of December 31, 2012 are as follows: | | | | | | | |
Reference Entity/
Swap Counterparty | | Notional
Amount
(000’s) | | | Paid by
the Fund | | | Received by
the Fund | | | Termination
Date | | | Value | |
| AUD/CAD spot exchange rate | | | | | | | | | | | | | |
| Credit Suisse International | | | 52 | AUD | |
| The Historic Volatility of the mid
AUD/CAD spot exchange rate
during the period 12/21/12 to
1/24/13 |
| | | 4.800 | % | | | 1/29/13 | | | $ | (54,259 | ) |
| CHF/NOK spot exchange rate | | | | | | | | | | | | | |
| JPMorgan Chase Bank NA | | | 48 | CHF | |
| The Historic Volatility of the mid
CHF/NOK spot exchange rate
during the period 11/30/12 to
1/3/13 |
| | | 3.950 | | | | 1/7/13 | | | | (90,224 | ) |
| CHF/SEK spot exchange rate: | | | | | | | | | | | | | |
| Bank of America NA | | | 48 | CHF | | | 7.100 | % | |
| The Historic Volatility of the mid
CHF/SEK spot exchange rate
during the period 12/13/12 to
1/15/13 |
| | | 1/15/13 | | | | (38,316 | ) |
| | | | |
| 46 | | | | OPPENHEIMER GLOBAL STRATEGIC INCOME FUND/VA |
| | | | | | | | | | | | | | | | | | | | |
| Volatility Swaps: Continued | | | | | | | |
Reference Entity/
Swap Counterparty | | Notional
Amount
(000’s) | | | Paid by
the Fund | | | Received by
the Fund | | | Termination
Date | | | Value | |
| CHF/SEK spot exchange rate: Continued | | | | | | | | | | | | | |
| Credit Suisse International | | | 47 | CHF | | | 7.250 | % | |
| The Historic Volatility of the
mid CHF/SEK spot exchange
rate during the period
12/19/12 to 1/18/13 |
| | | 1/22/13 | | | $ | (51,834 | ) |
| Morgan Stanley Capital Services, Inc. | | | 47 | CHF | | | 7.300 | | |
| The Historic Volatility of the
mid CHF/SEK spot exchange
rate during the period
12/14/12 to 1/16/13 |
| | | 1/18/13 | | | | (48,001 | ) |
| | | | | | | | | | | | | | | | | | |
|
|
|
| Reference Entity Total | | | | | | | | | | | | | | | | | | | (138,151 | ) |
| EUR/NZD spot exchange rate: | | | | | | | | | | | | | |
| Credit Suisse International | | | 33 | EUR | | | 7.400 | | |
| The Historic Volatility of the
mid EUR/NZD spot exchange
rate during the period
12/7/12 to 1/9/13 |
| | | 1/11/13 | | | | 48,335 | |
| Goldman Sachs Bank USA | | | 33 | EUR | | | 7.750 | | |
| The Historic Volatility of the
mid EUR/NZD spot exchange
rate during the period
12/10/12 to 1/10/13 |
| | | 1/14/13 | | | | 44,467 | |
| | | | | | | | | | | | | | | | | | |
|
|
|
| Reference Entity Total | | | | | | | | | | | | | | | | | | | 92,802 | |
| EUR/USD spot exchange rate | | | | | | | | | | | | | |
| Morgan Stanley Capital Services, Inc. | | | 56 | | |
| The Historic Volatility of the
mid EUR/USD spot exchange
rate during the period
12/26/12 to 1/24/13 |
| | | 7.500 | % | | | 1/28/13 | | | | 5,291 | |
| NZD/EUR spot exchange rate | | | | | | | | | | | | | | | | | | | | |
| Deutsche Bank AG | | | 33 | EUR | | | 7.350 | | |
| The Historic Volatility of the
mid NZD/EUR spot exchange
rate during the period
12/6/12 to 1/8/13 |
| | | 1/10/13 | | | | 41,909 | |
| NZD/JPY spot exchange rate | | | | | | | | | | | | | | | | | | | | |
| Goldman Sachs Bank USA | | | 82 | NZD | |
| The Historic Volatility of the
mid NZD/JPY spot exchange
rate during the period
12/3/12 to 1/3/13 |
| | | 10.200 | | | | 1/7/13 | | | | (118,406 | ) |
| NZD/JPY spot exchange rate | | | | | | | | | | | | | | | | | | | | |
| Bank of America NA | | | 82 | NZD | |
| The Historic Volatility of the
mid NZD/JPY spot exchange
rate during the period
12/4/12 to 1/3/13 |
| | | 9.400 | | | | 1/7/13 | | | | (189,473 | ) |
| USD/AUD spot exchange rate: | | | | | | | | | | | | | | | | | | | | |
| Goldman Sachs Bank USA | | | 56 | | |
| The Historic Volatility of the
mid USD/AUD spot
exchange rate during the
period 12/20/12 to 1/22/13 |
| | | 6.125 | | | | 1/24/13 | | | | (19,062 | ) |
| JPMorgan Chase Bank NA | | | 56 | | |
| The Historic Volatility of the
mid USD/AUD spot
exchange rate during the
period 12/18/12 to 1/18/13 |
| | | 5.600 | | | | 1/22/13 | | | | (40,096 | ) |
| | | | |
| 47 | | | | OPPENHEIMER GLOBAL STRATEGIC INCOME FUND/VA |
STATEMENT OF INVESTMENTS Continued
Footnotes to Statement of Investments Continued
| | | | | | | | | | | | | | | | | | |
| Volatility Swaps: Continued | | | | | | | |
Reference Entity/
Swap Counterparty | | Notional
Amount
(000’s) | | | Paid by
the Fund | | Received by
the Fund | | | Termination
Date | | | Value | |
| USD/AUD spot exchange rate: Continued | | | | | | | | | | | | |
| Royal Bank of Scotland plc (The) | | $ | 56 | | | The Historic Volatility of the mid USD/AUD spot exchange rate during the period 12/17/12 to 1/18/13 | | | 5.750 | % | | | 1/22/13 | | | $ | (25,976 | ) |
| | | | | | | | | | | | | | | | |
|
|
|
| Reference Entity Total | | | | | | | | | | | | | | | | | (85,134 | ) |
| USD/CAD spot exchange rate | | | | | | | | | | | | |
| Royal Bank of Scotland plc (The) | | | 56 | | | The Historic Volatility of the mid USD/CAD spot exchange rate during the period 12/12/12 to 1/11/13 | | | 7.950 | | | | 1/14/13 | | | | 1,766 | |
| USD/EUR spot exchange rate: | | | | | | | | | | | | |
| Goldman Sachs Bank USA | | | 56 | | | The Historic Volatility of the mid USD/EUR spot exchange rate during the period 12/27/12 to 1/29/13 | | | 7.825 | | | | 1/31/13 | | | | 8,773 | |
| Goldman Sachs Bank USA | | | 56 | | | The Historic Volatility of the mid USD/EUR spot exchange rate during the period 12/31/12 to 1/31/13 | | | 7.450 | | | | 2/4/13 | | | | — | |
| Royal Bank of Scotland plc (The) | | | 56 | | | The Historic Volatility of the mid USD/EUR spot exchange rate during the period 12/28/12 to 1/31/13 | | | 7.950 | | | | 2/4/13 | | | | 7,035 | |
| | | | | | | | | | | | | | | | |
|
|
|
| Reference Entity Total | | | | | | | | | | | | | | | | | 15,808 | |
| USD/EUR spot exchange rate | | | | | | | | | | | | |
| Deutsche Bank AG | | | 56 | | | The Historic Volatility of the mid USD/EUR spot exchange rate during the period 12/24/12 to 1/24/13 | | | 7.550 | | | | 1/28/13 | | | | 14,373 | |
| USD/JPY spot exchange rate | | | | | | | | | | | | |
| Credit Suisse International | | | 56 | | | The Historic Volatility of the mid USD/JPY spot exchange rate during the period 12/11/12 to 1/10/13 | | | 7.860 | | | | 1/15/13 | | | | (58,817 | ) |
| | | | | | | | | | | | | | | | |
|
|
|
| Total Volatility Swaps | | | | | | | | | | | | | | | | $ | (562,515 | ) |
| | | | | | | | | | | | | | | | |
|
|
|
Notional amount is reported in U.S. Dollars (USD), except for those denoted in the following currencies:
| | |
| AUD | | Australian Dollar |
| CHF | | Swiss Franc |
| EUR | | Euro |
| NZD | | New Zealand Dollar |
Abbreviations/Definitions are as follows:
| | |
| CAD | | Canadian Dollar |
| JPY | | Japanese Yen |
| NOK | | Norwegian Krone |
| SEK | | Swedish Krona |
| | | | |
| 48 | | | | OPPENHEIMER GLOBAL STRATEGIC INCOME FUND/VA |
The following table aggregates, as of period end, the amount receivable from/(payable to) each counterparty with whom the Fund has entered into a swap agreement. Swaps are individually disclosed in the preceding tables.
| | | | | | | | | | |
| Swap Summary as of December 31, 2012 is as follows: | | | | |
| Swap Counterparty | | Swap Type from
Fund Perspective | | Notional
Amount
(000’s) | | | Value | |
| Bank of America NA: | | | | | | | | | | |
| | | Credit Default Sell Protection | | $ | 5,110 | | | $ | (66,055 | ) |
| | | Interest Rate | | | 8,385 | AUD | | | (15,425 | ) |
| | | Interest Rate | | | 10,140 | BRR | | | 48,861 | |
| | | Interest Rate | | | 11,255 | CAD | | | (53,256 | ) |
| | | Interest Rate | | | 4,710 | EUR | | | 134,885 | |
| | | Interest Rate | | | 2,425 | | | | 18,310 | |
| | | Volatility | | | 48 | CHF | | | (38,316 | ) |
| | | Volatility | | | 82 | NZD | | | (189,473 | ) |
| | | | | | | | |
|
|
|
| | | | | | | | | | (160,469 | ) |
| Barclays Bank plc: | | | | | | | | | | |
| | | Credit Default Buy Protection | | | 10,810 | | | | (290,163 | ) |
| | | Interest Rate | | | 529,000 | JPY | | | 40,167 | |
| | | Interest Rate | | | 6,425 | | | | (65,212 | ) |
| | | | | | | | |
|
|
|
| | | | | | | | | | (315,208 | ) |
| Citibank NA: | | | | | | | | | | |
| | | Interest Rate | | | 10,200 | | | | (31,806 | ) |
| | | Total Return | | | 4,441 | AUD | | | 77,356 | |
| | | Total Return | | | 4,601 | CAD | | | 51,567 | |
| | | | | | | | |
|
|
|
| | | | | | | | | | 97,117 | |
| Credit Suisse International: | | | | | | | | | | |
| | | Credit Default Sell Protection | | | 10,000 | | | | (308,395 | ) |
| | | Volatility | | | 52 | AUD | | | (54,259 | ) |
| | | Volatility | | | 47 | CHF | | | (51,834 | ) |
| | | Volatility | | | 33 | EUR | | | 48,335 | |
| | | Volatility | | | 56 | | | | (58,817 | ) |
| | | | | | | | |
|
|
|
| | | | | | | | | | (424,970 | ) |
| Deutsche Bank AG: | | | | | | | | | | |
| | | Credit Default Buy Protection | | | 13,165 | | | | 66,376 | |
| | | Credit Default Sell Protection | | | 4,860 | | | | 338,979 | |
| | | Interest Rate | | | 17,370 | BRR | | | 93,083 | |
| | | Volatility | | | 33 | EUR | | | 41,909 | |
| | | Volatility | | | 56 | | | | 14,373 | |
| | | | | | | | |
|
|
|
| | | | | | | | | | 554,720 | |
| Goldman Sachs Bank USA: | | | | | | | | | | |
| | | Volatility | | | 33 | EUR | | | 44,467 | |
| | | Volatility | | | 82 | NZD | | | (118,406 | ) |
| | | Volatility | | | 168 | | | | (10,289 | ) |
| | | | | | | | |
|
|
|
| | | | | | | | | | (84,228 | ) |
| Goldman Sachs International: | | | | | | | | | | |
| | | Credit Default Buy Protection | | | 2,950 | EUR | | | 399,395 | |
| | | Credit Default Buy Protection | | | 9,940 | | | | 233,922 | |
| | | Interest Rate | | | 50,680 | BRR | | | 229,173 | |
| | | Total Return | | | 62,648 | HKD | | | 186,919 | |
| | | Total Return | | | 30,879 | | | | 112,671 | |
| | | | | | | | |
|
|
|
| | | | | | | | | | 1,162,080 | |
| | | | |
| 49 | | | | OPPENHEIMER GLOBAL STRATEGIC INCOME FUND/VA |
STATEMENT OF INVESTMENTS Continued
Footnotes to Statement of Investments Continued
| | | | | | | | | | |
| Swap Summary: Continued | | | | |
| Swap Counterparty | | Swap Type from
Fund Perspective | | Notional
Amount
(000’s) | | | Value | |
| JPMorgan Chase Bank NA: | | | | | | | | | | |
| | | Credit Default Sell Protection | | $ | 260 | | | $ | (62,838 | ) |
| | | Volatility | | | 48 | CHF | | | (90,224 | ) |
| | | Volatility | | | 56 | | | | (40,096 | ) |
| | | | | | | | |
|
|
|
| | | | | | | | | | (193,158 | ) |
| Morgan Stanley Capital Services, Inc.: | | | | | | | | | | |
| | | Credit Default Sell Protection | | | 8,240 | | | | (82,763 | ) |
| | | Total Return | | | 1,483 | GBP | | | (8,309 | ) |
| | | Volatility | | | 47 | CHF | | | (48,001 | ) |
| | | Volatility | | | 56 | | | | 5,291 | |
| | | | | | | | |
|
|
|
| | | | | | | | | | (133,782 | ) |
| Royal Bank of Scotland plc (The) | | Volatility | | | 168 | | | | (17,175 | ) |
| UBS AG: | | | | | | | | | | |
| | | Credit Default Buy Protection | | | 250 | EUR | | | 19,901 | |
| | | Credit Default Buy Protection | | | 395 | | | | 53,756 | |
| | | Credit Default Sell Protection | | | 500 | EUR | | | 7,686 | |
| | | Credit Default Sell Protection | | | 530 | | | | (128,094 | ) |
| | | | | | | | |
|
|
|
| | | | | | | | | | (46,751 | ) |
| | | | | | | | |
|
|
|
| | | Total Swaps | | | $ | 438,176 | |
| | | | | | | | |
|
|
|
Notional amount is reported in U.S.Dollars (USD), except for those denoted in the following currencies:
| | |
| AUD | | Australian Dollar |
| BRR | | Brazilian Real |
| CAD | | Canadian Dollar |
| CHF | | Swiss Franc |
| EUR | | Euro |
| GBP | | British Pounds Sterling |
| HKD | | Hong Kong Dollar |
| JPY | | Japanese Yen |
| NZD | | New Zealand Dollar |
| | | | | | | | | | | | | | | | | | | | | | | | | | |
| As of December 31, 2012, the Fund had entered into the following written swaption contracts: | | | | | | | | | | |
Reference Entity/
Swaption Counterparty | | Swaption Description | | Underlying Swap
Type from Fund
Perspective | | | Notional
Amount
(000’s) | | | Expiration
Date | | | Premium
Received | | | Value | | | Unrealized
Appreciation
(Depreciation) | |
| Six-Month AUD BBR BBSW: | | | | | | | | | | | | | | | | | | | | | | | | |
| UBS AG | | Interest Rate Swaption (European); Swap Terms: Paid: 3.80%; Received: Six-Month AUD BBR BBSW; Termination Date: 2/7/23 | |
| Interest Rate
Swap; Pay Fixed |
| | | 15,660 | AUD | | | 2/7/13 | | | $ | 232,885 | | | $ | (156,371 | ) | | $ | 76,514 | |
| | | | | | | | | | | | | | | | |
|
|
| |
|
|
| |
|
|
|
| | | | | | Total where Fund pays a fixed rate | | | | 232,885 | | | | (156,371 | ) | | | 76,514 | |
| | | | | | | | | | | | | | | | |
|
|
| |
|
|
| |
|
|
|
| UBS AG | | Interest Rate Swaption (European); Swap Terms: Paid: Six-Month AUD BBR BBSW; Received: 3.88%; Termination Date: 1/25/23 | |
| Interest Rate
Swap; Pay Floating |
| | | 1,270 | AUD | | | 1/25/13 | | | | 15,754 | | | | (5,742 | ) | | | 10,012 | |
| | | | | | | | | | | | | | | | |
|
|
| |
|
|
| |
|
|
|
| | | | | | Total where Fund pays a floating rate | | | | 15,754 | | | | (5,742 | ) | | | 10,012 | |
| | | | | | | | | | | | | | | | |
|
|
| |
|
|
| |
|
|
|
| | | | | | | | | | | | | | Total | | | | 248,639 | | | | (162,113 | ) | | | 86,526 | |
| | | | |
| 50 | | | | OPPENHEIMER GLOBAL STRATEGIC INCOME FUND/VA |
| | | | | | | | | | | | | | | | | | | | | | | | | | |
| As of December 31, 2012, the Fund had entered into the following written swaption contracts: Continued | | | | | | | |
Reference Entity/
Swaption Counterparty | | Swaption Description | | Underlying
Swap Type
from Fund
Perspective | | | Notional
Amount
(000’s) | | | Expiration
Date | | | Premium
Received | | | Value | | | Unrealized
Appreciation
(Depreciation) | |
| Six-Month EUR EURIBOR: | | | | | | | | | | | | | | | | | | | | | | | | |
| Bank of America NA | | Interest Rate Swaption
(European); Swap Terms: Paid: 2.86%; Received: Six-Month EUR EURIBOR; Termination Date: 4/18/23 | |
| Interest Rate
Swap; Pay Fixed |
| | | 15,050 | EUR | | | 4/19/13 | | | $ | 216,422 | | | $ | (370,646 | ) | | $ | (154,224 | ) |
| Barclays Bank plc | | Interest Rate Swaption
(European); Swap Terms: Paid: 2.91%; Received: Six-Month EUR EURIBOR; Termination Date: 4/19/23 | |
| Interest Rate
Swap; Pay Fixed |
| | | 25,050 | EUR | | | 4/18/13 | | | | 348,428 | | | | (706,858 | ) | | | (358,430 | ) |
| Goldman Sachs Bank USA | | Interest Rate Swaption
(European); Swap Terms: Paid: 2.919% ; Received: Six-Month EUR EURIBOR; Termination Date: 4/19/43 | |
| Interest Rate
Swap; Pay Fixed |
| | | 15,050 | EUR | | | 4/18/13 | | | | 644,791 | | | | (738,490 | ) | | | (93,699 | ) |
| | | | | | | | | | | | | | | | |
|
|
| |
|
|
| |
|
|
|
| | | | | | | | | | | | | | | | | | 1,209,641 | | | | (1,815,994 | ) | | | (606,353 | ) |
| Six-Month GBP BBA LIBOR: | | | | | | | | | | | | | | | | | | | | | | | | |
| Barclays Bank plc | | Interest Rate Swaption
(European); Swap Terms: Paid:
1.85%; Received: Six-Month
GBP BBA LIBOR; Termination
Date: 5/20/23 | |
| Interest Rate
Swap; Pay Fixed |
| | | 13,000 | GBP | | | 5/3/13 | | | | 166,587 | | | | (186,018 | ) | | | (19,431 | ) |
| JPMorgan Chase Bank NA | | Interest Rate Swaption
(European); Swap Terms: Paid:
3.231%; Received: Six-Month
GBP BBA LIBOR; Termination
Date: 2/14/43 | |
| Interest Rate
Swap; Pay Fixed |
| | | 500 | GBP | | | 2/15/13 | | | | 49,596 | | | | (44,447 | ) | | | 5,149 | |
| | | | | | | | | | | | | | | | |
|
|
| |
|
|
| |
|
|
|
| | | | | | Total where Fund pays a fixed rate | | | | 216,183 | | | | (230,465 | ) | | | (14,282 | ) |
| | | | | | | | | | | | | | | | |
|
|
| |
|
|
| |
|
|
|
| Goldman Sachs Bank USA | | Interest Rate Swaption
(European); Swap Terms: Paid:
Six-Month GBP BBA LIBOR;
Received: 2.055%; Termination
Date: 12/4/20 | |
| Interest Rate
Swap; Pay Floating |
| | | 5,020 | GBP | | | 12/7/15 | | | | 189,330 | | | | (175,537 | ) | | | 13,793 | |
| | | | | | | | | | | | | | | | |
|
|
| |
|
|
| |
|
|
|
| | | | |
| Total where Fund pays a floating rate
|
| | | 189,330 | | | | (175,537 | ) | | | 13,793 | |
| | | | | | | | | | | | | | | | |
|
|
| |
|
|
| |
|
|
|
| | | | | | | | | | | | | | Total | | | | 405,513 | | | | (406,002 | ) | | | (489 | ) |
| Three-Month CAD BA CDOR | | | | | | | | | | | | | | | | | | | | | | | | |
| Bank of America NA | | Interest Rate Swaption (European); Swap Terms: Paid: Three-Month CAD BA CDOR; Received: 2.1025%; Termination Date: 1/16/23 | |
| Interest Rate
Swap; Pay Floating |
| | | 3,180 | CAD | | | 1/17/13 | | | | 66,129 | | | | (41,859 | ) | | | 24,270 | |
| Three-Month USD BBA LIBOR: | | | | | | | | | | | | | | | | | | | | | | | | |
| Bank of America NA | | Interest Rate Swaption (European); Swap Terms: Paid: 1.343%; Received: Three-Month USD BBA LIBOR; Termination Date: 2/5/20 | |
| Interest Rate
Swap; Pay Fixed |
| | | 33,500 | | | | 2/4/13 | | | | 304,850 | | | | (194,035 | ) | | | 110,815 | |
| | | | | | | | | | | | | | | | |
|
|
| |
|
|
| |
|
|
|
| | | | | | Total where Fund pays a fixed rate | | | | 304,850 | | | | (194,035 | ) | | | 110,815 | |
| | | | |
| 51 | | | | OPPENHEIMER GLOBAL STRATEGIC INCOME FUND/VA |
STATEMENT OF INVESTMENTS Continued
Footnotes to Statement of Investments Continued
| | | | | | | | | | | | | | | | | | | | | | | | | | |
| As of December 31, 2012, the Fund had entered into the following written swaption contracts: Continued | | | | | | | |
Reference Entity/
Swaption Counterparty | | Swaption Description | | Underlying
Swap Type
from Fund
Perspective | | | Notional
Amount
(000’s) | | | Expiration
Date | | | Premium
Received | | | Value | | | Unrealized
Appreciation
(Depreciation) | |
| Three-Month USD BBA LIBOR: Continued | | | | | | | | | | | | | | | | |
| Bank of America NA | | Interest Rate Swaption (European); Swap Terms: Paid: Three-Month USD BBA LIBOR;Received: 2.50%; Termination Date: 9/3/23 | |
| Interest Rate
Swap; Pay Floating |
| | $ | 20,395 | | | | 9/3/13 | | | $ | 336,518 | | | $ | (187,707 | ) | | $ | 148,811 | |
| Barclays Bank plc | | Interest Rate Swaption (European); Swap Terms: Paid: Three-Month USD BBA LIBOR; Received: 2.6775%; Termination Date: 12/16/25 | |
| Interest Rate
Swap; Pay Floating |
| | | 10,450 | | | | 12/15/15 | | | | 536,608 | | | | (553,185 | ) | | | (16,577 | ) |
| Barclays Bank plc | | Interest Rate Swaption (European); Swap Terms: Paid: Three-Month USD BBA LIBOR; Received: 2.25%; Termination Date: 11/24/20 | |
| Interest Rate
Swap; Pay Floating |
| | | 26,150 | | | | 11/23/15 | | | | 537,383 | | | | (567,167 | ) | | | (29,784 | ) |
| Barclays Bank plc | | Interest Rate Swaption (European); Swap Terms: Paid: Three-Month USD BBA LIBOR; Received: 3.10%; Termination Date: 4/27/22 | |
| Interest Rate
Swap; Pay Floating |
| | | 20,415 | | | | 4/26/17 | | | | 528,749 | | | | (522,430 | ) | | | 6,319 | |
| Barclays Bank plc | | Interest Rate Swaption (European); Swap Terms: Paid: Three-Month USD BBA LIBOR; Received: 1.935%; Termination Date: 9/30/20 | |
| Interest Rate
Swap; Pay Floating |
| | | 20,017 | | | | 9/29/15 | | | | 512,445 | | | | (497,379 | ) | | | 15,066 | |
| Goldman Sachs International | | Interest Rate Swaption (European); Swap Terms: Paid: Three-Month USD BBA LIBOR; Received: 1.875%; Termination Date: 9/24/20 | |
| Interest Rate
Swap; Pay Floating |
| | | 28,560 | | | | 9/23/13 | | | | 347,004 | | | | (233,232 | ) | | | 113,772 | |
| | | | | | | | | | | | | | | | |
|
|
| |
|
|
| |
|
|
|
| | | | | | Total where Fund pays a floating rate | | | | 2,798,707 | | | | (2,561,100 | ) | | | 237,607 | |
| | | | | | | | | | | | | | | | |
|
|
| |
|
|
| |
|
|
|
| | | | | | | | | | | | | | Total | | | | 3,103,557 | | | | (2,755,135 | ) | | | 348,422 | |
| | | | | | | | | | | | | | | | |
|
|
| |
|
|
| |
|
|
|
| | | | | | Total Written Swaptions | | | $ | 5,033,479 | | | $ | (5,181,103 | ) | | $ | (147,624 | ) |
| | | | | | | | | | | | | | | | |
|
|
| |
|
|
| |
|
|
|
Notional amount is reported in U.S. Dollars (USD), except for those denoted in the following currencies:
| | |
| AUD | | Australian Dollar |
| CAD | | Canadian Dollar |
| EUR | | Euro |
| GBP | | British Pound Sterling |
Abbreviations/Definitions are as follows:
| | |
| BA CDOR | | Canada Bankers Acceptances Deposit Offering Rate |
| BBA LIBOR | | British Bankers’ Association London-Interbank Offered Rate |
| BBR BBSW | | Bank Bill Swap Reference Rate (Australian Financial Market) |
| EURIBOR | | Euro Interbank Offered Rate |
| | | | |
| 52 | | | | OPPENHEIMER GLOBAL STRATEGIC INCOME FUND/VA |
STATEMENT OF ASSETS AND LIABILITIES December 31, 2012
| | | | |
| Assets | | | |
| Investments, at value—see accompanying statement of investments: | | | | |
| Unaffiliated companies (cost $2,566,744,356) | | $ | 2,613,685,534 | |
| Affiliated companies (cost $432,931,400) | | | 436,542,786 | |
| Wholly-owned subsidiary (cost $1,500,000) | |
| 1,434,967
|
|
| | | | 3,051,663,287 | |
| Cash | | | 45,765 | |
| Cash used for collateral on OTC derivatives | | | 111,720 | |
| Unrealized appreciation on foreign currency exchange contracts | | | 9,056,616 | |
| Appreciated swaps, at value (net upfront payments paid $123,789) | | | 1,402,298 | |
| Depreciated swaps, at value (upfront payments paid $1,722,801) | | | 1,529,738 | |
| Receivables and other assets: | | | | |
| Interest, dividends and principal paydowns | | | 29,499,566 | |
| Investments sold (including $16,533,671 sold on a when-issued or delayed delivery basis) | | | 17,038,621 | |
| Shares of beneficial interest sold | | | 1,414,706 | |
| Closed foreign currency contracts | | | 1,054,219 | |
| Futures margins | | | 399,782 | |
| Other | |
| 2,578,082
|
|
| Total assets | | | 3,115,794,400 | |
| Liabilities | | | |
| Bank overdraft-foreign currencies (cost $2,590,489) | | | 2,590,501 | |
| Appreciated options written, at value (premiums received $1,268,276) | | | 453,800 | |
| Depreciated options written, at value (premiums received $456,379) | | | 712,330 | |
| Appreciated swaptions written, at value (premiums received $2,583,260) | | | 2,058,739 | |
| Depreciated swaptions written, at value (premiums received $2,450,219) | | | 3,122,364 | |
| Unrealized depreciation on foreign currency exchange contracts | | | 9,690,019 | |
| Appreciated swaps, at value (upfront payments received $306,195) | | | 278,342 | |
| Depreciated swaps, at value (upfront payments received $1,093,173) | | | 2,215,518 | |
| Payables and other liabilities: | | | | |
| Investments purchased (including $501,794,026 purchased on a when-issued or delayed delivery basis) | | | 502,280,443 | |
| Shares of beneficial interest redeemed | | | 3,096,060 | |
| Closed foreign currency contracts | | | 2,744,413 | |
| Futures margins | | | 1,888,722 | |
| Foreign capital gains tax | | | 911,516 | |
| Distribution and service plan fees | | | 389,088 | |
| Transfer and shareholder servicing agent fees | | | 217,145 | |
| Shareholder communications | | | 123,899 | |
| Trustees’ compensation | | | 68,608 | |
| Other | |
| 235,737
|
|
| Total liabilities | | | 533,077,244 | |
| Net Assets | | $
| 2,582,717,156
|
|
| Composition of Net Assets | | | |
| Par value of shares of beneficial interest | | $ | 448,908 | |
| Additional paid-in capital | | | 2,442,740,074 | |
| Accumulated net investment income | | | 132,359,464 | |
| Accumulated net realized loss on investments and foreign currency transactions | | | (40,735,407 | ) |
| Net unrealized appreciation on investments and translation of assets and liabilities denominated in foreign currencies | |
| 47,904,117
|
|
| Net Assets | | $
| 2,582,717,156
|
|
| | | | |
| 53 | | | | OPPENHEIMER GLOBAL STRATEGIC INCOME FUND/VA |
STATEMENT OF ASSETS AND LIABILITIES Continued
| | | | |
| Net Asset Value Per Share | | | |
| Non-Service Shares: | | | | |
Net asset value, redemption price per share and offering price per share (based on net assets of $741,996,174
and 130,893,580 shares of beneficial interest outstanding) | | | $5.67 | |
| Service Shares: | | | | |
Net asset value, redemption price per share and offering price per share (based on net assets of $1,840,720,982
and 318,014,171 shares of beneficial interest outstanding) | | | $5.79 | |
See accompanying Notes to Financial Statements.
| | | | |
| 54 | | | | OPPENHEIMER GLOBAL STRATEGIC INCOME FUND/VA |
STATEMENT OF OPERATIONS For the Year Ended December 31, 2012
| | | | |
| Allocation of Income and Expenses from Master Funds1 | | | |
| Net investment income allocated from Oppenheimer Master Event-Linked Bond Fund, LLC: | | | | |
| Interest | | $ | 5,056,704 | |
| Dividends | | | 4,714 | |
| Expenses2 | |
| (238,546
| )
|
| Net investment income allocated from Oppenheimer Master Event-Linked Bond Fund, LLC | | | 4,822,872 | |
| Net investment income allocated from Oppenheimer Master Loan Fund, LLC: | | | | |
| Interest | | | 23,288,563 | |
| Dividends | | | 27,474 | |
| Expenses3 | |
| (1,056,490
| )
|
| Net investment income allocated from Oppenheimer Master Loan Fund, LLC | |
| 22,259,547
|
|
| Total allocation of net investment income from master funds | | | 27,082,419 | |
| Investment Income | | | | |
| Interest (net of foreign withholding taxes of $57,755) | | | 128,345,275 | |
| Dividends: | | | | |
| Unaffiliated companies (net of foreign withholding taxes of $2,358) | | | 183,031 | |
| Affiliated companies | | | 142,534 | |
| Fee income on when-issued securities | |
| 4,653,359
|
|
| Total investment income | | | 133,324,199 | |
| Expenses | | | |
| Management fees | | | 13,867,182 | |
| Distribution and service plan fees—Service shares | | | 4,289,482 | |
| Transfer and shareholder servicing agent fees: | | | | |
| Non-Service shares | | | 690,089 | |
| Service shares | | | 1,715,312 | |
| Shareholder communications: | | | | |
| Non-Service shares | | | 81,051 | |
| Service shares | | | 202,206 | |
| Custodian fees and expenses | | | 291,898 | |
| Trustees’ compensation | | | 58,504 | |
| Administration service fees | | | 1,500 | |
| Other | |
| 238,616
|
|
| Total expenses | | | 21,435,840 | |
| Less waivers and reimbursements of expenses | |
| (1,291,417
| )
|
| Net expenses | | | 20,144,423 | |
| Net Investment Income | | | 140,262,195 | |
| | | | |
| 55 | | | | OPPENHEIMER GLOBAL STRATEGIC INCOME FUND/VA |
STATEMENT OF OPERATIONS Continued
| | | | |
| Realized and Unrealized Gain (Loss) | | | |
| Net realized gain (loss) on: | | | | |
| Investments from unaffiliated companies (including premiums on options and swaptions exercised) (net of foreign capital gains tax of $282,000) | | $ | (17,842,670 | ) |
| Distributions received from affiliated companies | | | 10,085 | |
| Closing and expiration of option contracts written | | | 12,537,661 | |
| Closing and expiration of swaption contracts written | | | 10,464,267 | |
| Closing and expiration of futures contracts | | | 3,640,584 | |
| Foreign currency transactions | | | (40,247,900 | ) |
| Swap contracts | | | 216,818 | |
| Net realized loss allocated from: | | | | |
| Oppenheimer Master Event-Linked Bond Fund, LLC | | | (2,117,483 | ) |
| Oppenheimer Master Loan Fund, LLC | |
| (2,074,299
| )
|
| Total net realized loss | | | (35,412,937 | ) |
| Net change in unrealized appreciation/depreciation on: | | | | |
| Investments (net of foreign capital gains tax of $861,091) | | | 155,173,767 | |
| Translation of assets and liabilities denominated in foreign currencies | | | 29,913,306 | |
| Futures contracts | | | (3,402,379 | ) |
| Option contracts written | | | (549,703 | ) |
| Swaption contracts written | | | (767,560 | ) |
| Swap contracts | | | (1,223,186 | ) |
| Net change in unrealized appreciation/deprecation allocated from: | | | | |
| Oppenheimer Master Event-Linked Bond Fund, LLC | | | 2,482,399 | |
| Oppenheimer Master Loan Fund, LLC | |
| 10,668,786
|
|
| Total net change in unrealized appreciation/depreciation | | | 192,295,430 | |
| Net Increase in Net Assets Resulting from Operations | | $
| 297,144,688
|
|
1. The Fund invests in certain affiliated mutual funds that expect to be treated as partnerships for tax purposes. See Note 1 of the accompanying Notes.
2. Net of expense waivers and/or reimbursements of $2,327.
3. Net of expense waivers and/or reimbursements of $13,584.
See accompanying Notes to Financial Statements.
| | | | |
| 56 | | | | OPPENHEIMER GLOBAL STRATEGIC INCOME FUND/VA |
STATEMENTS OF CHANGES IN NET ASSETS
| | | | | | | | |
| | | Year Ended
December 31,
2012 | | | Year Ended
December 30,
20111 | |
| Operations | | | | | | |
| Net investment income | | $ | 140,262,195 | | | $ | 149,720,270 | |
| Net realized gain (loss) | | | (35,412,937 | ) | | | 38,586,175 | |
| Net change in unrealized appreciation/depreciation | |
| 192,295,430
|
| |
| (168,669,648
| )
|
| Net increase in net assets resulting from operations | | | 297,144,688 | | | | 19,636,797 | |
| Dividends and/or Distributions to Shareholders | | | | | | |
| Dividends from net investment income: | | | | | | | | |
| Non-Service shares | | | (41,097,829 | ) | | | (23,004,040 | ) |
| Service shares | |
| (95,632,597
| )
| |
| (46,831,691
| )
|
| | | | (136,730,426 | ) | | | (69,835,731 | ) |
| Distributions from net realized gain: | | | | | | | | |
| Non-Service shares | | | (7,582,316 | ) | | | (8,843,118 | ) |
| Service shares | |
| (18,415,501
| )
| |
| (20,376,612
| )
|
| | | | (25,997,817 | ) | | | (29,219,730 | ) |
| Beneficial Interest Transactions | | | | | | |
| Net increase (decrease) in net assets resulting from beneficial interest transactions: | | | | | | | | |
| Non-Service shares | | | 56,198,952 | | | | (39,359,888 | ) |
| Service shares | |
| 139,111,661
|
| |
| (10,325,962
| )
|
| | | | 195,310,613 | | | | (49,685,850 | ) |
| Net Assets | | | | | | |
| Total increase (decrease) | | | 329,727,058 | | | | (129,104,514 | ) |
| Beginning of period | |
| 2,252,990,098
|
| |
| 2,382,094,612
|
|
| End of period (including accumulated net investment income of $132,359,464 and $151,980,652, respectively) | | $
| 2,582,717,156
|
| | $
| 2,252,990,098
|
|
1. December 30, 2011 represents the last business day of the fund’s 2011 fiscal year. See Note 1 of the accompanying Notes.
See accompanying Notes to Financial Statements.
| | | | |
| 57 | | | | OPPENHEIMER GLOBAL STRATEGIC INCOME FUND/VA |
FINANCIAL HIGHLIGHTS
| | | | | | | | | | | | | | | | | | | | |
| | | Year Ended
December 31, | | | Year Ended
December 30, | | | Year Ended December 31, | |
| Non-Service Shares | | 2012 | | | 20111 | | | 2010 | | | 2009 | | | 2008 | |
| | | | | | | | | | | | | | | | | | | | | |
| Per Share Operating Data | | | | | | | | | | | | | | | |
| Net asset value, beginning of period | | $ | 5.38 | | | $ | 5.58 | | | $ | 5.30 | | | $ | 4.49 | | | $ | 5.56 | |
| Income (loss) from investment operations: | | | | | | | | | | | | | | | | | | | | |
| Net investment income2 | | | .33 | | | | .36 | | | | .34 | | | | .30 | | | | .30 | |
| Net realized and unrealized gain (loss) | |
| .36
|
| |
| (.31
| )
| |
| .40
|
| |
| .53
|
| |
| (1.04
| )
|
| Total from investment operations | | | .69 | | | | .05 | | | | .74 | | | | .83 | | | | (.74 | ) |
| Dividends and/or distributions to shareholders: | | | | | | | | | | | | | | | | | | | | |
| Dividends from net investment income | | | (.34 | ) | | | (.18 | ) | | | (.46 | ) | | | (.02 | ) | | | (.27 | ) |
| Distributions from net realized gain | |
| (.06
| )
| |
| (.07
| )
| |
| —
|
| |
| —
| 3
| |
| (.06
| )
|
| Total dividends and distributions to shareholders | | | (.40 | ) | | | (.25 | ) | | | (.46 | ) | | | (.02 | ) | | | (.33 | ) |
| Net asset value, end of period | | $
| 5.67
|
| | $
| 5.38
|
| | $
| 5.58
|
| | $
| 5.30
|
| | $
| 4.49
|
|
| Total Return, at Net Asset Value4 | | | 13.53 | % | | | 0.85 | % | | | 14.97 | % | | | 18.83 | % | | | (14.21 | )% |
| | | | | | | | | | | | | | | | | | | | | |
| Ratios/Supplemental Data | | | | | | | | | | | | | | | |
| Net assets, end of period (in thousands) | | $ | 741,996 | | | $ | 648,084 | | | $ | 711,755 | | | $ | 757,772 | | | $ | 648,570 | |
| Average net assets (in thousands) | | $ | 690,351 | | | $ | 694,868 | | | $ | 737,071 | | | $ | 681,926 | | | $ | 753,062 | |
| Ratios to average net assets:5,6 | | | | | | | | | | | | | | | | | | | | |
| Net investment income | | | 6.01 | % | | | 6.50 | % | | | 6.47 | % | | | 6.20 | % | | | 5.78 | % |
| Total expenses | | | 0.77 | %7 | | | 0.77 | %7 | | | 0.75 | %8 | | | 0.67 | %8 | | | 0.59 | %8 |
| Expenses after payments, waivers and/or reimbursements and reduction to custodian expenses | | | 0.71 | %9 | | | 0.71 | %9 | | | 0.71 | % | | | 0.64 | % | | | 0.57 | % |
| Portfolio turnover rate10 | | | 78 | % | | | 49 | % | | | 99 | % | | | 110 | % | | | 86 | % |
1. December 30, 2011 represents the last business day of the Fund’s 2011 fiscal year. See Note 1 of the accompanying Notes.
2. Per share amounts calculated based on the average shares outstanding during the period.
3. Less than $0.005 per share.
4. Assumes an initial investment on the business day before the first day of the fiscal period, with all dividends and distributions reinvested in additional shares on the reinvestment date, and redemption at the net asset value calculated on the last business day of the fiscal period. Total returns are not annualized for periods less than one full year. Total return information does not reflect expenses that apply at the separate account level or to related insurance products. Inclusion of these charges would reduce the total return figures for all periods shown. Returns do not reflect the deduction of taxes that a shareholder would pay on fund distributions or the redemption of fund shares.
5. Annualized for periods less than one full year.
6. Includes the Fund’s share of the allocated expenses and/or net investment income from the master funds.
7. Ratio including all expenses of the wholly-owned subsidiary and indirect expenses from affiliated fund were as follows:
| | | | |
| Year Ended December 31, 2012 | | | 0.78 | % |
| Year Ended December 30, 2011 | | | 0.78 | % |
8. Total expenses including all affiliated fund expenses were as follows:
| | | | |
| Year Ended December 31, 2010 | | | 0.75 | % |
| Year Ended December 31, 2009 | | | 0.68 | % |
| Year Ended December 31, 2008 | | | 0.60 | % |
9. Ratio including expenses of the wholly-owned subsidiary and indirect expenses from affiliated fund were as follows:
| | | | |
| Year Ended December 31, 2012 | | | 0.72 | % |
| Year Ended December 30, 2011 | | | 0.72 | % |
10. The portfolio turnover rate excludes purchase and sale transactions of To Be Announced (TBA) mortgage-related securities as follows:
| | | | | | | | |
| | | Purchase Transactions | | | Sale Transactions | |
| Year Ended December 31, 2012 | | $ | 3,862,820,437 | | | $ | 3,466,796,223 | |
| Year Ended December 30, 2011 | | $ | 1,050,654,783 | | | $ | 1,039,506,614 | |
| Year Ended December 31, 2010 | | $ | 1,034,550,699 | | | $ | 1,085,289,655 | |
| Year Ended December 31, 2009 | | $ | 1,909,574,925 | | | $ | 1,836,038,328 | |
| Year Ended December 31, 2008 | | $ | 634,319,548 | | | $ | 594,845,589 | |
See accompanying Notes to Financial Statements.
| | | | |
| 58 | | | | OPPENHEIMER GLOBAL STRATEGIC INCOME FUND/VA |
FINANCIAL HIGHLIGHTS Continued
| | | | | | | | | | | | | | | | | | | | |
| | | Year Ended
December 31,
2012 | | | Year Ended
December 30,
20111 | | | Year Ended December 31, | |
| Service Shares | | | | 2010 | | | 2009 | | | 2008 | |
| | | | | | | | | | | | | | | | | | | | | |
| Per Share Operating Data | | | | | | | | | | | | | | | | | | | | |
| Net asset value, beginning of period | | $ | 5.49 | | | $ | 5.68 | | | $ | 5.38 | | | $ | 4.56 | | | $ | 5.65 | |
| Income (loss) from investment operations: | | | | | | | | | | | | | | | | | | | | |
| Net investment income2 | | | .33 | | | | .35 | | | | .33 | | | | .29 | | | | .29 | |
| Net realized and unrealized gain (loss) | |
| .36
|
| |
| (.31
| )
| |
| .42
|
| |
| .54
|
| |
| (1.06
| )
|
| Total from investment operations | | | .69 | | | | .04 | | | | .75 | | | | .83 | | | | (.77 | ) |
| Dividends and/or distributions to shareholders: | | | | | | | | | | | | | | | | | | | | |
| Dividends from net investment income | | | (.33 | ) | | | (.16 | ) | | | (.45 | ) | | | (.01 | ) | | | (.26 | ) |
| Distributions from net realized gain | |
| (.06
| )
| |
| (.07
| )
| |
| —
|
| |
| —
| 3
| |
| (.06
| )
|
| Total dividends and distributions to shareholders | | | (.39 | ) | | | (.23 | ) | | | (.45 | ) | | | (.01 | ) | | | (.32 | ) |
| Net asset value, end of period | | $
| 5.79
|
| | $
| 5.49
|
| | $
| 5.68
|
| | $
| 5.38
|
| | $
| 4.56
|
|
| Total Return, at Net Asset Value4 | | | 13.15 | % | | | 0.65 | % | | | 14.77 | % | | | 18.41 | % | | | (14.49 | )% |
| | | | | | | | | | | | | | | | | | | | | |
| Ratios/Supplemental Data | | | | | | | | | | | | | | | | | | | | |
| Net assets, end of period (in thousands) | | $ | 1,840,721 | | | $ | 1,604,906 | | | $ | 1,670,340 | | | $ | 3,656,726 | | | $ | 2,810,315 | |
| Average net assets (in thousands) | | $ | 1,715,995 | | | $ | 1,673,715 | | | $ | 2,485,427 | | | $ | 3,143,836 | | | $ | 3,152,967 | |
| Ratios to average net assets:5,6 | | | | | | | | | | | | | | | | | | | | |
| Net investment income | | | 5.76 | % | | | 6.25 | % | | | 6.15 | % | | | 5.95 | % | | | 5.54 | % |
| Total expenses | | | 1.02 | %7 | | | 1.02 | %7 | | | 0.99 | %8 | | | 0.92 | %8 | | | 0.84 | %8 |
| Expenses after payments, waivers and/or reimbursements and reduction to custodian expenses | | | 0.96 | %9 | | | 0.96 | %9 | | | 0.95 | % | | | 0.89 | % | | | 0.82 | % |
| Portfolio turnover rate10 | | | 78 | % | | | 49 | % | | | 99 | % | | | 110 | % | | | 86 | % |
1. December 30, 2011 represents the last business day of the Fund’s 2011 fiscal year. See Note 1 of the accompanying Notes.
2. Per share amounts calculated based on the average shares outstanding during the period.
3. Less than $0.005 per share.
4. Assumes an initial investment on the business day before the first day of the fiscal period, with all dividends and distributions reinvested in additional shares on the reinvestment date, and redemption at the net asset value calculated on the last business day of the fiscal period. Total returns are not annualized for periods less than one full year. Total return information does not reflect expenses that apply at the separate account level or to related insurance products. Inclusion of these charges would reduce the total return figures for all periods shown. Returns do not reflect the deduction of taxes that a shareholder would pay on fund distributions or the redemption of fund shares.
5. Annualized for periods less than one full year.
6. Includes the Fund’s share of the allocated expenses and/or net investment income from the master funds.
7. Ratio including all expenses of the wholly-owned subsidiary and indirect expenses from affiliated fund were as follows:
| | | | |
| Year Ended December 31, 2012 | | | 1.03 | % |
| Year Ended December 30, 2011 | | | 1.03 | % |
8. Total expenses including all affiliated fund expenses were as follows:
| | | | |
| Year Ended December 31, 2010 | | | 0.99 | % |
| Year Ended December 31, 2009 | | | 0.93 | % |
| Year Ended December 31, 2008 | | | 0.85 | % |
9. Ratio including expenses of the wholly-owned subsidiary and indirect expenses from affiliated fund were as follows:
| | | | |
| Year Ended December 31, 2012 | | | 0.97 | % |
| Year Ended December 30, 2011 | | | 0.97 | % |
10. The portfolio turnover rate excludes purchase and sale transactions of To Be Announced (TBA) mortgage-related securities as follows:
| | | | | | | | |
| | | Purchase Transactions | | | Sale Transactions | |
| Year Ended December 31, 2012 | | $ | 3,862,820,437 | | | $ | 3,466,796,223 | |
| Year Ended December 30, 2011 | | $ | 1,050,654,783 | | | $ | 1,039,506,614 | |
| Year Ended December 31, 2010 | | $ | 1,034,550,699 | | | $ | 1,085,289,655 | |
| Year Ended December 31, 2009 | | $ | 1,909,574,925 | | | $ | 1,836,038,328 | |
| Year Ended December 31, 2008 | | $ | 634,319,548 | | | $ | 594,845,589 | |
See accompanying Notes to Financial Statements.
| | | | |
| 59 | | | | OPPENHEIMER GLOBAL STRATEGIC INCOME FUND/VA |
NOTES TO FINANCIAL STATEMENTS
1. Significant Accounting Policies
Oppenheimer Global Strategic Income Fund/VA (the “Fund”) is a separate series of Oppenheimer Variable Account Funds, a diversified open-end management investment company registered under the Investment Company Act of 1940, as amended. The Fund’s investment objective is to seek total return. The Fund’s investment adviser is OppenheimerFunds, Inc. (the “Manager”).
The Fund offers two classes of shares. Both classes are sold at their offering price, which is the net asset value per share, to separate investment accounts of participating insurance companies as an underlying investment for variable life insurance policies, variable annuity contracts or other investment products. The class of shares designated as Service shares is subject to a distribution and service plan. Both classes of shares have identical rights and voting privileges with respect to the Fund in general and exclusive voting rights on matters that affect that class alone. Earnings, net assets and net asset value per share may differ due to each class having its own expenses, such as transfer and shareholder servicing agent fees and shareholder communications, directly attributable to that class.
The following is a summary of significant accounting policies consistently followed by the Fund.
Previous Annual Period. The last day of the Fund’s fiscal year was the last day the New York Stock Exchange was open for trading. The Fund’s financial statements have been presented through that date to maintain consistency with the Fund’s net asset value calculations used for shareholder transactions.
Structured Securities. The Fund invests in structured securities whose market values, interest rates and/or redemption prices are linked to the performance of underlying foreign currencies, interest rate spreads, stock market indices, prices of individual securities, commodities or other financial instruments or the occurrence of other specific events. The structured securities are often leveraged, increasing the volatility of each note’s market value relative to the change in the underlying linked financial element or event. Fluctuations in value of these securities are recorded as unrealized gains and losses in the accompanying Statement of Operations. The Fund records a realized gain or loss when a structured security is sold or matures.
Securities on a When-Issued or Delayed Delivery Basis. The Fund may purchase securities on a “when-issued” basis, and may purchase or sell securities on a “delayed delivery” basis. “When-issued” or “delayed delivery” refers to securities whose terms and indenture are available and for which a market exists, but which are not available for immediate delivery. Delivery and payment for securities that have been purchased by the Fund on a when-issued basis normally takes place within six months and possibly as long as two years or more after the trade date. During this period, such securities do not earn interest, are subject to market fluctuation and may increase or decrease in value prior to their delivery. The purchase of securities on a when-issued basis may increase the volatility of the Fund’s net asset value to the extent the Fund executes such transactions while remaining substantially fully invested. When the Fund engages in when-issued or delayed delivery transactions, it relies on the buyer or seller, as the case may be, to complete the transaction. Their failure to do so may cause the Fund to lose the opportunity to obtain or dispose of the security at a price and yield it considers advantageous. The Fund may also sell securities that it purchased on a when-issued basis or forward commitment prior to settlement of the original purchase.
As of December 31, 2012, the Fund had purchased securities issued on a when-issued or delayed delivery basis and sold securities issued on a delayed delivery basis as follows:
| | | | |
| | | When-Issued or Delayed Delivery
Basis Transactions | |
| Purchased securities | | $ | 501,794,026 | |
| Sold securities | | | 16,533,671 | |
The Fund may enter into “forward roll” transactions with respect to mortgage-related securities. In this type of transaction, the Fund sells a mortgage-related security to a buyer and simultaneously agrees to repurchase a similar
| | | | |
| 60 | | | | OPPENHEIMER GLOBAL STRATEGIC INCOME FUND/VA |
security (same type, coupon and maturity) at a later date at a set price. During the period between the sale and the repurchase, the Fund will not be entitled to receive interest and principal payments on the securities that have been sold. The Fund records the incremental difference between the forward purchase and sale of each forward roll as realized gain (loss) on investments or as fee income in the case of such transactions that have an associated fee in lieu of a difference in the forward purchase and sale price.
Forward roll transactions may be deemed to entail embedded leverage since the Fund purchases mortgage-related securities with extended settlement dates rather than paying for the securities under a normal settlement cycle. This embedded leverage increases the Fund’s market value of investments relative to its net assets which can incrementally increase the volatility of the Fund’s performance. Forward roll transactions can be replicated over multiple settlement periods.
Risks of entering into forward roll transactions include the potential inability of the counterparty to meet the terms of the agreement; the potential of the Fund to receive inferior securities at redelivery as compared to the securities sold to the counterparty; and counterparty credit risk.
Credit Risk. The Fund invests in high-yield, non-investment-grade bonds, which may be subject to a greater degree of credit risk. Credit risk relates to the ability of the issuer to meet interest or principal payments or both as they become due. The Fund may acquire securities that have missed an interest payment, and is not obligated to dispose of securities whose issuers or underlying obligors subsequently miss an interest payment. Information concerning securities not accruing interest as of December 31, 2012 is as follows:
| | | | |
| Cost | | $ | 29,390,735 | |
| Market Value | | $ | 6,605,850 | |
| Market Value as a % of Net Assets | | | 0.26 | % |
Investment in Oppenheimer Global Strategic Income Fund (Cayman) Ltd. The Fund has established a Cayman Islands company that is wholly-owned and controlled by the Fund (the “Subsidiary”). The Fund may invest up to 25% of its total assets in the Subsidiary. The Subsidiary invests primarily in commodity-linked derivatives (including commodity related futures, options and swap contracts), exchange traded funds and certain fixed-income securities and other investments that may serve as margin or collateral for its derivatives positions. Investments in the Subsidiary are expected to provide the Fund with exposure to commodities markets within the limitations of the federal tax requirements that apply to the Fund. The Subsidiary is subject to the same investment restrictions and guidelines, and follows the same compliance policies and procedures, as the Fund. The Fund wholly owns and controls the Subsidiary, and the Fund and Subsidiary are both managed by the Manager.
The Fund does not consolidate the assets, liabilities, capital or operations of the Subsidiary into its financial statements. Rather, the Subsidiary is separately presented as an investment in the Fund’s Statement of Investments. Shares of the Subsidiary are valued at their net asset value per share. Gains or losses on withdrawals of capital from the Subsidiary by the Fund are recognized on an average cost basis. Unrealized appreciation or depreciation on the Fund’s investment in the Subsidiary is recorded in the Fund’s Statement of Assets and Liabilities and the Fund’s Statement of Operations. Distributions received from the Subsidiary are recorded as income on the ex-dividend date.
For tax purposes, the Subsidiary is an exempted Cayman investment company. The Subsidiary has received an undertaking from the Government of the Cayman Islands exempting it from all local income, profits and capital gains taxes through September of 2030. No such taxes are levied in the Cayman Islands at the present time. For U.S. income tax purposes, the Subsidiary is a Controlled Foreign Corporation and as such is not subject to U.S. income tax. However, as a wholly-owned Controlled Foreign Corporation, the Subsidiary’s net income and capital gain, to the extent of its earnings and profits, will be included each year in the Fund’s investment company taxable income. For the year ended December 31, 2012, the Subsidiary has a deficit of $47,552 in its taxable earnings and profits. In addition, any in-kind capital contributions made by the Fund to the Subsidiary will result in the Fund recognizing taxable gain to
| | | | |
| 61 | | | | OPPENHEIMER GLOBAL STRATEGIC INCOME FUND/VA |
NOTES TO FINANCIAL STATEMENTS Continued
1. Significant Accounting Policies Continued
the extent of unrealized gain, if any, on securities transferred to the Subsidiary while any unrealized losses on securities so transferred will not be recognized at the time of transfer.
Investment in Oppenheimer Institutional Money Market Fund. The Fund is permitted to invest daily available cash balances in an affiliated money market fund. The Fund may invest the available cash in Class E shares of Oppenheimer Institutional Money Market Fund (“IMMF”) to seek current income while preserving liquidity. IMMF is a registered open-end management investment company, regulated as a money market fund under the Investment Company Act of 1940, as amended. The Manager is also the investment adviser of IMMF. When applicable, the Fund’s investment in IMMF is included in the Statement of Investments. Shares of IMMF are valued at their net asset value per share. As a shareholder, the Fund is subject to its proportional share of IMMF’s Class E expenses, including its management fee. The Manager will waive fees and/or reimburse Fund expenses in an amount equal to the indirect management fees incurred through the Fund’s investment in IMMF.
Investment in Oppenheimer Master Funds. The Fund is permitted to invest in entities sponsored and/or advised by the Manager or an affiliate. Certain of these entities in which the Fund invests are mutual funds registered under the Investment Company Act of 1940 that expect to be treated as partnerships for tax purposes, specifically Oppenheimer Master Loan Fund, LLC and Oppenheimer Master Event-Linked Bond Fund, LLC (the “Master Funds”). Each Master Fund has its own investment risks, and those risks can affect the value of the Fund’s investments and therefore the value of the Fund’s shares. To the extent that the Fund invests more of its assets in one Master Fund than in another, the Fund will have greater exposure to the risks of that Master Fund.
The investment objective of Oppenheimer Master Loan Fund, LLC is to seek as high a level of current income and preservation of capital as is consistent with investing primarily in loans and other debt securities. The investment objective of Oppenheimer Master Event-Linked Bond Fund, LLC is to seek a high level of current income principally derived from interest on debt securities. The Fund’s investments in the Master Funds are included in the Statement of Investments. The Fund recognizes income and gain/(loss) on its investments in each Master Fund according to its allocated pro-rata share, based on its relative proportion of total outstanding Master Fund shares held, of the total net income earned and the net gain/(loss) realized on investments sold by the Master Funds. As a shareholder, the Fund is subject to its proportional share of the Master Funds’ expenses, including their management fee. The Manager will waive fees and/or reimburse Fund expenses in an amount equal to the indirect management fees incurred through the Fund’s investment in the Master Funds.
Foreign Currency Translation. The Fund’s accounting records are maintained in U.S. dollars. The values of securities denominated in foreign currencies and amounts related to the purchase and sale of foreign securities and foreign investment income are translated into U.S. dollars as of the close of the Exchange, normally 4:00 P.M. Eastern time, on each day the Exchange is open for trading. Foreign exchange rates may be valued primarily using a reliable bank, dealer or service authorized by the Board of Trustees.
Reported net realized gains and losses from foreign currency transactions arise from sales of portfolio securities, sales and maturities of short-term securities, sales of foreign currencies, exchange rate fluctuations between the trade and settlement dates on securities transactions, and the difference between the amounts of dividends, interest, and foreign withholding taxes recorded on the Fund’s books and the U.S. dollar equivalent of the amounts actually received or paid. Net unrealized appreciation and depreciation on the translation of assets and liabilities denominated in foreign currencies arise from changes in the values of assets and liabilities, including investments in securities at fiscal period end, resulting from changes in exchange rates.
The effect of changes in foreign currency exchange rates on investments is separately identified from the fluctuations arising from changes in market values of securities held and reported with all other foreign currency gains and losses in the Fund’s Statement of Operations.
| | | | |
| 62 | | | | OPPENHEIMER GLOBAL STRATEGIC INCOME FUND/VA |
Allocation of Income, Expenses, Gains and Losses. Income, expenses (other than those attributable to a specific class), gains and losses are allocated on a daily basis to each class of shares based upon the relative proportion of net assets represented by such class. Operating expenses directly attributable to a specific class are charged against the operations of that class.
Federal Taxes. The Fund intends to comply with provisions of the Internal Revenue Code applicable to regulated investment companies and to distribute substantially all of its investment company taxable income, including any net realized gain on investments not offset by capital loss carryforwards, if any, to shareholders. Therefore, no federal income or excise tax provision is required. The Fund files income tax returns in U.S. federal and applicable state jurisdictions. The statute of limitations on the Fund’s tax return filings generally remain open for the three preceding fiscal reporting period ends.
The tax components of capital shown in the following table represent distribution requirements the Fund must satisfy under the income tax regulations, losses the Fund may be able to offset against income and gains realized in future years and unrealized appreciation or depreciation of securities and other investments for federal income tax purposes.
| | | | | | | | | | |
Undistributed
Net Investment Income | | Undistributed
Long-Term
Gain | | Accumulated
Loss
Carryforward1,2 | | | Net Unrealized
Appreciation
Based on Cost of
Securities and
Other Investments
forFederal Income
Tax Purposes | |
| $120,250,280 | | $— | | | $30,263,215 | | | | $56,927,747 | |
1. As of December 31, 2012, the Fund had $30,263,215 of net capital loss carryforwards available to offset future realized capital gains, if any, and thereby reduce future taxable gain distributions. Details of the capital loss carryforwards are included in the table below. Capital loss carryovers with no expiration, if any, must be utilized prior to those with expiration dates.
| | | | |
| Expiring | | | |
| 2015 | | $ | 5,751,368 | |
| 2016 | | | 3,339,490 | |
| No expiration | | | 21,172,357 | |
| | |
|
|
|
| Total | | $ | 30,263,215 | |
| | |
|
|
|
Of these losses, $13,943,514 are subject to Sec. 382 loss limitation rules resulting from merger activity. These limitations generally reduce the utilization of these losses to a maximum of $3,339,490 per year.
2. During the fiscal year ended December 31, 2012, the Fund did not utilize any capital loss carryforward.
Net investment income (loss) and net realized gain (loss) may differ for financial statement and tax purposes. The character of dividends and distributions made during the fiscal year from net investment income or net realized gains may differ from their ultimate characterization for federal income tax purposes. Also, due to timing of dividends and distributions, the fiscal year in which amounts are distributed may differ from the fiscal year in which the income or net realized gain was recorded by the Fund.
Accordingly, the following amounts have been reclassified for December 31, 2012. Net assets of the Fund were unaffected by the reclassifications.
| | | | | | | | |
Increase to
Paid-in Capital | | Reduction
to Accumulated
Net Investment
Income | | | Reduction
to Accumulated Net
Realized Loss
on Investments | |
$13,763,668 | | | $23,152,957 | | | | $9,389,289 | |
| | | | |
| 63 | | | | OPPENHEIMER GLOBAL STRATEGIC INCOME FUND/VA |
NOTES TO FINANCIAL STATEMENTS Continued
1. Significant Accounting Policies Continued
The tax character of distributions paid during the years ended December 31, 2012 and December 30, 2011 was as follows:
| | | | | | | | |
| | | Year Ended
December 31, 2012 | | | Year Ended
December 30, 2011 | |
| Distributions paid from: | | | | | | | | |
| Ordinary income | | | $148,472,568 | | | | $69,835,731 | |
| Long-term capital gain | | | 14,255,675 | | | | 29,219,730 | |
| | |
|
|
| |
|
|
|
| Total | | $ | 162,728,243 | | | $ | 99,055,461 | |
| | |
|
|
| |
|
|
|
The aggregate cost of securities and other investments and the composition of unrealized appreciation and depreciation of securities and other investments for federal income tax purposes as of December 31, 2012 are noted in the following table. The primary difference between book and tax appreciation or depreciation of securities and other investments, if applicable, is attributable to the tax deferral of losses or tax realization of financial statement unrealized gain or loss.
| | | | |
| Federal tax cost of securities | | $ | 2,994,359,724 | |
Federal tax cost of other investments | | | (602,985,170) | |
| | |
|
|
|
| Total federal tax cost | | $ | 2,391,374,554 | |
| | |
|
|
|
| |
| Gross unrealized appreciation | | $ | 225,474,099 | |
Gross unrealized depreciation | | | (168,546,352) | |
| | |
|
|
|
| Net unrealized appreciation | | $ | 56,927,747 | |
| | |
|
|
|
Certain foreign countries impose a tax on capital gains which is accrued by the Fund based on unrealized appreciation, if any, on affected securities. The tax is paid when the gain is realized.
Trustees’ Compensation. The Board of Trustees has adopted a compensation deferral plan for independent trustees that enables trustees to elect to defer receipt of all or a portion of the annual compensation they are entitled to receive from the Fund. For purposes of determining the amount owed to the Trustee under the plan, deferred amounts are treated as though equal dollar amounts had been invested in shares of the Fund or in other Oppenheimer funds selected by the Trustee. The Fund purchases shares of the funds selected for deferral by the Trustee in amounts equal to his or her deemed investment, resulting in a Fund asset equal to the deferred compensation liability. Such assets are included as a component of “Other” within the asset section of the Statement of Assets and Liabilities. Deferral of trustees’ fees under the plan will not affect the net assets of the Fund, and will not materially affect the Fund’s assets, liabilities or net investment income per share. Amounts will be deferred until distributed in accordance with the compensation deferral plan.
Dividends and Distributions to Shareholders. Dividends and distributions to shareholders, which are determined in accordance with income tax regulations and may differ from U.S. generally accepted accounting principles, are recorded on the ex-dividend date. Income and capital gain distributions, if any, are declared and paid annually or at other times as deemed necessary by the Manager.
Investment Income. Dividend income is recorded on the ex-dividend date or upon ex-dividend notification in the case of certain foreign dividends where the ex-dividend date may have passed. Non-cash dividends included in dividend income, if any, are recorded at the fair market value of the securities received. Interest income is recognized on an accrual basis. Discount and premium, which are included in interest income on the Statement of Operations, are amortized or accreted daily.
Custodian Fees. “Custodian fees and expenses” in the Statement of Operations may include interest expense incurred by the Fund on any cash overdrafts of its custodian account during the period. Such cash overdrafts may result from the
| | | | |
| 64 | | | | OPPENHEIMER GLOBAL STRATEGIC INCOME FUND/VA |
effects of failed trades in portfolio securities and from cash outflows resulting from unanticipated shareholder redemption activity. The Fund pays interest to its custodian on such cash overdrafts, to the extent they are not offset by positive cash balances maintained by the Fund, at a rate equal to the Federal Funds Rate plus 0.50%. The “Reduction to custodian expenses” line item, if applicable, represents earnings on cash balances maintained by the Fund during the period. Such interest expense and other custodian fees may be paid with these earnings.
Security Transactions. Security transactions are recorded on the trade date. Realized gains and losses on securities sold (except for the investments in the Subsidiary) are determined on the basis of identified cost.
Indemnifications. The Fund’s organizational documents provide current and former trustees and officers with a limited indemnification against liabilities arising in connection with the performance of their duties to the Fund. In the normal course of business, the Fund may also enter into contracts that provide general indemnifications. The Fund’s maximum exposure under these arrangements is unknown as this would be dependent on future claims that may be made against the Fund. The risk of material loss from such claims is considered remote.
Other. The preparation of financial statements in conformity with accounting principles generally accepted in the United States of America requires management to make estimates and assumptions that affect the reported amounts of assets and liabilities and disclosure of contingent assets and liabilities at the date of the financial statements and the reported amounts of increases and decreases in net assets from operations during the reporting period. Actual results could differ from those estimates.
2. Securities Valuation
The Fund calculates the net asset value of its shares as of the close of the New York Stock Exchange (the “Exchange”), normally 4:00 P.M. Eastern time, on each day the Exchange is open for trading.
The Fund’s Board has adopted procedures for the valuation of the Fund’s securities and has delegated the day-to-day responsibility for valuation determinations under those procedures to the Manager. The Manager has established a Valuation Committee which is responsible for determining a “fair valuation” for any security for which market quotations are not “readily available.” The Valuation Committee’s fair valuation determinations are subject to review, approval and ratification by the Fund’s Board at its next regularly scheduled meeting covering the calendar quarter in which the fair valuation was determined.
Valuation Methods and Inputs
Securities are valued using unadjusted quoted market prices, when available, as supplied primarily by third party pricing services or dealers.
The following methodologies are used to determine the market value or the fair value of the types of securities described below:
Securities traded on a registered U.S. securities exchange (including exchange-traded derivatives other than futures and futures options) are valued based on the last sale price of the security reported on the principal exchange on which it is traded, prior to the time when the Fund’s assets are valued. In the absence of a sale, the security is valued at the last sale price on the prior trading day, if it is within the spread of the current day’s closing “bid” and “asked” prices, and if not, at the current day’s closing bid price. A security of a foreign issuer traded on a foreign exchange but not listed on a registered U.S. securities exchange is valued based on the last sale price on the principal exchange on which the security is traded, as identified by the third party pricing service used by the Manager, prior to the time when the Fund’s assets are valued. If the last sale price is unavailable, the security is valued at the most recent official closing price on the principal exchange on which it is traded. If the last sales price or official closing price for a foreign security is not available, the security is valued at the mean between the bid and asked price per the exchange or, if not available from the exchange, obtained from two dealers. If bid and asked prices are not available from either the exchange or two dealers,
| | | | |
| 65 | | | | OPPENHEIMER GLOBAL STRATEGIC INCOME FUND/VA |
NOTES TO FINANCIAL STATEMENTS Continued
2. Securities Valuation Continued
the security is valued by using one of the following methodologies (listed in order of priority); (1) using a bid from the exchange, (2) the mean between the bid and asked price as provided by a single dealer, or (3) a bid from a single dealer.
Shares of a registered investment company that are not traded on an exchange are valued at that investment company’s net asset value per share.
Corporate and government debt securities (of U.S. or foreign issuers) and municipal debt securities, event-linked bonds, loans, mortgage-backed securities, collateralized mortgage obligations, and asset-backed securities are valued at the mean between the “bid” and “asked” prices utilizing evaluated prices obtained from third party pricing services or broker-dealers who may use matrix pricing methods to determine the evaluated prices.
Short-term money market type debt securities with a remaining maturity of sixty days or less are valued at cost adjusted by the amortization of discount or premium to maturity (amortized cost), which approximates market value. Short-term debt securities with a remaining maturity in excess of sixty days are valued at the mean between the “bid” and “asked” prices utilizing evaluated prices obtained from third party pricing services or broker-dealers.
Structured securities, swaps, swaptions, and other over-the-counter derivatives are valued utilizing evaluated prices obtained from third party pricing services or broker-dealers.
Forward foreign currency exchange contracts are valued utilizing current and forward currency rates obtained from third party pricing services. When the settlement date of a contract is an interim date for which a quotation is not available, interpolated values are derived using the nearest dated forward currency rate.
Futures contracts and futures options traded on a commodities or futures exchange will be valued at the final settlement price or official closing price on the principal exchange as reported by such principal exchange at its trading session ending at, or most recently prior to, the time when the Fund’s assets are valued.
A description of the standard inputs that may generally be considered by the third party pricing vendors in determining their evaluated prices is provided below.
| | |
| Security Type | | Standard inputs generally considered by third-party pricing vendors |
| Corporate debt, government debt, municipal, mortgage-backed and asset-backed securities | | Reported trade data, broker-dealer price quotations, benchmark yields, issuer spreads on comparable securities, the credit quality, yield, maturity, and other appropriate factors. |
| Loans | | Information obtained from market participants regarding reported trade data and broker-dealer price quotations. |
| Event-linked bonds | | Information obtained from market participants regarding reported trade data and broker-dealer price quotations. |
| Structured securities | | Relevant market information such as the price of underlying financial instruments, stock market indices, foreign currencies, interest rate spreads, commodities, or the occurrence of other specific events. |
| Swaps | | Relevant market information, including underlying reference assets such as credit spreads, credit event probabilities, index values, individual security values, forward interest rates, variable interest rates, volatility measures, and forward currency rates. |
If a market value or price cannot be determined for a security using the methodologies described above, or if, in the “good faith” opinion of the Manager, the market value or price obtained does not constitute a “readily available market quotation,” or a significant event has occurred that would materially affect the value of the security the security is fair valued either (i) by a standardized fair valuation methodology applicable to the security type or the significant event as previously approved by the Valuation Committee and the Fund’s Board or (ii) as determined in good faith by the Manager’s Valuation Committee. The Valuation Committee considers all relevant facts that are reasonably available, through either public information or information available to the Manager, when determining the fair value of a security. Fair value determinations by the Manager are subject to review, approval and ratification by the Fund’s Board at its next regularly scheduled meeting covering the calendar quarter in which the fair valuation was determined. Those fair valuation standardized methodologies include, but are not limited to, valuing securities at the last sale price or initially at
| | | | |
| 66 | | | | OPPENHEIMER GLOBAL STRATEGIC INCOME FUND/VA |
cost and subsequently adjusting the value based on: changes in company specific fundamentals, changes in an appropriate securities index, or changes in the value of similar securities which may be further adjusted for any discounts related to security-specific resale restrictions. When possible, such methodologies use observable market inputs such as unadjusted quoted prices of similar securities, observable interest rates, currency rates and yield curves. The methodologies used for valuing securities are not necessarily an indication of the risks associated with investing in those securities nor can it be assured that the Fund can obtain the fair value assigned to a security if it were to sell the security.
To assess the continuing appropriateness of security valuations, the Manager, or its third party service provider who is subject to oversight by the Manager, regularly compares prior day prices, prices on comparable securities, and sale prices to the current day prices and challenges those prices exceeding certain tolerance levels with the third party pricing service or broker source. For those securities valued by fair valuations, whether through a standardized fair valuation methodology or a fair valuation determination, the Valuation Committee reviews and affirms the reasonableness of the valuations based on such methodologies and fair valuation determinations on a regular basis after considering all relevant information that is reasonably available.
Classifications
Each investment asset or liability of the Fund is assigned a level at measurement date based on the significance and source of the inputs to its valuation. Various data inputs are used in determining the value of each of the Fund’s investments as of the reporting period end. These data inputs are categorized in the following hierarchy under applicable financial accounting standards:
| | 1) | Level 1—unadjusted quoted prices in active markets for identical assets or liabilities (including securities actively traded on a securities exchange) |
| | 2) | Level 2—inputs other than unadjusted quoted prices that are observable for the asset or liability (such as unadjusted quoted prices for similar assets and market corroborated inputs such as interest rates, prepayment speeds, credit risks, etc.) |
| | 3) | Level 3—significant unobservable inputs (including the Manager’s own judgments about assumptions that market participants would use in pricing the asset or liability). |
The inputs used for valuing securities are not necessarily an indication of the risks associated with investing in those securities.
The table below categorizes amounts that are included in the Fund’s Statement of Assets and Liabilities as of December 31, 2012 based on valuation input level:
| | | | | | | | | | | | | | | | |
| | | Level 1—
Unadjusted
Quoted
Prices | | | Level 2—
Other Significant
Observable Inputs | | | Level 3—
Significant
Unobservable
Inputs | | | Value | |
| Assets Table | | | | | | | | | | | | | | | | |
| Investments, at Value: | | | | | | | | | | | | | | | | |
| Wholly-Owned Subsidiary | | $ | — | | | $ | 1,434,967 | | | $ | — | | | $ | 1,434,967 | |
| Asset-Backed Securities | | | — | | | | 59,567,699 | | | | 13,833,500 | | | | 73,401,199 | |
| Corporate Loans | | | — | | | | 31,288,907 | | | | 4,212,575 | | | | 35,501,482 | |
| Mortgage-Backed Obligations | | | — | | | | 873,061,311 | | | | 4,785,844 | | | | 877,847,155 | |
| U.S. Government Obligations | | | — | | | | 107,462,179 | | | | — | | | | 107,462,179 | |
| Foreign Government Obligations | | | — | | | | 677,647,810 | | | | — | | | | 677,647,810 | |
| Loan Participations | | | — | | | | 2,286,600 | | | | — | | | | 2,286,600 | |
| Corporate Bonds and Notes | | | — | | | | 748,152,511 | | | | 1,357,068 | | | | 749,509,579 | |
| Preferred Stocks | | | — | | | | 2,577,342 | | | | 2,778,825 | | | | 5,356,167 | |
| Common Stocks | | | 1,423,249 | | | | 1,035,957 | | | | 2,939,696 | | | | 5,398,902 | |
| Rights, Warrants and Certificates | | | — | | | | — | | | | 816 | | | | 816 | |
| Structured Securities | | | — | | | | 52,489,573 | | | | 19,537,403 | | | | 72,026,976 | |
| | | | |
| 67 | | | | OPPENHEIMER GLOBAL STRATEGIC INCOME FUND/VA |
NOTES TO FINANCIAL STATEMENTS Continued
2. Securities Valuation Continued
| | | | | | | | | | | | | | | | |
| | | Level 1—
Unadjusted
Quoted
Prices | | | Level 2—
Other Significant
Observable Inputs | | | Level 3—
Significant
Unobservable
Inputs | | | Value | |
| Assets Table | | | | | | | | | | | | | | | | |
| Investments, at Value Continued | | | | | | | | | | | | | | | | |
| Options Purchased | | $ | 421,131 | | | $ | 1,821,234 | | | $ | — | | | $ | 2,242,365 | |
| Swaptions Purchased | | | — | | | | 5,004,304 | | | | — | | | | 5,004,304 | |
| Investment Companies | | | 44,214,104 | | | | 392,328,682 | | | | — | | | | 436,542,786 | |
| | |
|
|
| |
|
|
| |
|
|
| |
|
|
|
| Total Investments, at Value | | | 46,058,484 | | | | 2,956,159,076 | | | | 49,445,727 | | | | 3,051,663,287 | |
| Other Financial Instruments: | | | | | | | | | | | | | | | | |
| Appreciated swaps, at value | | | — | | | | 1,402,298 | | | | — | | | | 1,402,298 | |
| Depreciated swaps, at value | | | — | | | | 1,529,738 | | | | — | | | | 1,529,738 | |
| Futures margins | | | 399,782 | | | | — | | | | — | | | | 399,782 | |
| Foreign currency exchange contracts | | | — | | | | 9,056,616 | | | | — | | | | 9,056,616 | |
| | |
|
|
| |
|
|
| |
|
|
| |
|
|
|
| Total Assets | | $ | 46,458,266 | | | $ | 2,968,147,728 | | | $ | 49,445,727 | | | $ | 3,064,051,721 | |
| | |
|
|
| |
|
|
| |
|
|
| |
|
|
|
| Liabilities Table | | | | | | | | | | | | | | | | |
| Other Financial Instruments: | | | | | | | | | | | | | | | | |
| Swaps, at value | | $ | — | | | $ | — | | | $ | — | | | $ | — | |
| Appreciated swaps, at value | | | — | | | | (278,342 | ) | | | — | | | | (278,342 | ) |
| Depreciated swaps, at value | | | — | | | | (2,215,518 | ) | | | — | | | | (2,215,518 | ) |
| Appreciated options written, at value | | | (48,494 | ) | | | (405,306 | ) | | | | | | | (453,800 | ) |
| Depreciated options written, at value | | | (135,079 | ) | | | (577,251 | ) | | | — | | | | (712,330 | ) |
| Appreciated swaptions written, at value | | | — | | | | (2,058,739 | ) | | | — | | | | (2,058,739 | ) |
| Depreciated swaptions written, at value | | | — | | | | (3,122,364 | ) | | | — | | | | (3,122,364 | ) |
| Futures margins | | | (1,888,722 | ) | | | — | | | | — | | | | (1,888,722 | ) |
| Foreign currency exchange contracts | | | — | | | | (9,690,019 | ) | | | — | | | | (9,690,019 | ) |
| | |
|
|
| |
|
|
| |
|
|
| |
|
|
|
| Total Liabilities | | $ | (2,072,295 | ) | | $ | (18,347,539 | ) | | $ | — | | | $ | (20,419,834 | ) |
| | |
|
|
| |
|
|
| |
|
|
| |
|
|
|
Currency contracts and forwards, if any, are reported at their unrealized appreciation/depreciation at measurement date, which represents the change in the contract’s value from trade date. Futures, if any, are reported at their variation margin at measurement date, which represents the amount due to/from the Fund at that date. All additional assets and liabilities included in the above table are reported at their market value at measurement date.
The table below shows the transfers between Level 2 and Level 3. The Fund’s policy is to recognize transfers in and transfers out as of the beginning of the reporting period.
| | | | | | | | |
| | | Transfers out of
Level 2* | | | Transfers into
Level 3* | |
| Assets Table | | | | | | | | |
| Investments, at Value: | | | | | | | | |
| Corporate Bonds and Notes | | $ | (792,000 | ) | | $ | 792,000 | |
| Mortgage-Backed Obligations | | | (4,698,349 | ) | | | 4,698,349 | |
| Preferred Stocks | | | — | | | | — | |
| Common Stocks | | | (2,587,696 | ) | | | 2,587,696 | |
| Structured Securities | | | (19,001,064 | ) | | | 19,001,064 | |
| | |
|
|
| |
|
|
|
| Total Assets | | $ | (27,079,109 | ) | | $ | 27,079,109 | |
| | |
|
|
| |
|
|
|
* Transferred from Level 2 to Level 3 because of the lack of observable market data.
| | | | |
| 68 | | | | OPPENHEIMER GLOBAL STRATEGIC INCOME FUND/VA |
The following is a reconciliation of assets in which significant unobservable inputs (level 3) were used in determining fair value:
| | | | | | | | | | | | | | | | | | | | |
| | | Value as of
December 30, 2011 | | | Realized
gain (loss) | | | Change in
unrealized
appreciation/
depreciation | | | Accretion/
(amortization) of
premium/discounta | | | Purchases | |
| Assets Table | | | | | | | | | | | | | | | | | | | | |
| Investments, at Value: | | | | | | | | | | | | | | | | | | | | |
| Asset-Backed Securities | | $ | 11,861,100 | | | $ | (1,820,063 | ) | | $ | 3,739,995 | | | $ | 52,468 | | | $ | — | |
| Common Stocks | | | 209,932 | | | | — | | | | (3,047,279 | ) | | | — | | | | 3,189,347 | |
| Corporate Bonds and Notes | | | — | | | | — | | | | (198,981 | ) | | | 6,130 | | | | 757,919 | |
| Corporate Loans | | | — | | | | — | | | | (37,738 | ) | | | — | | | | 4,250,313 | |
| Mortgage-Backed Obligations | | | 1,423,222 | | | | (56,547 | ) | | | (762,674 | ) | | | (35,682 | ) | | | 584,494 | |
| Preferred Stocks | | | 2,968,560 | | | | (457,765 | ) | | | 665,165 | | | | — | | | | 723,600 | |
| Rights, Warrants, and Certificates | | | 420 | | | | — | | | | (3,168,099 | ) | | | — | | | | 3,168,495 | |
| Structured Securities | | | 7,194,032 | | | | (8,636,774 | ) | | | 6,320,704 | | | | 451,777 | | | | — | |
| | |
|
|
| |
|
|
| |
|
|
| |
|
|
| |
|
|
|
| Total Assets | | $ | 23,657,266 | | | $ | (10,971,149 | ) | | $ | 3,511,093 | | | $ | 474,693 | | | $ | 12,674,168 | |
| | |
|
|
| |
|
|
| |
|
|
| |
|
|
| |
|
|
|
| | | | | | | | | | | | | | | | |
| | | Sales | | | Transfers into
Level 3 | | | Transfers out of
Level 3 | | | Value as of
December 31,
2012 | |
| Assets Table (continued) | | | | | | | | | | | | | | | | |
| Investments, at Value: | | | | | | | | | | | | | | | | |
| Asset-Backed Securities | | $ | — | | | $ | — | | | $ | — | | | $ | 13,833,500 | |
| Common Stocks | | | — | | | | 2,587,696 | | | | — | | | | 2,939,696 | |
| Corporate Bonds and Notes | | | — | | | | 792,000 | | | | — | | | | 1,357,068 | |
| Corporate Loans | | | — | | | | — | | | | — | | | | 4,212,575 | |
| Mortgage-Backed Obligations | | | (1,065,318 | ) | | | 4,698,349 | | | | — | | | | 4,785,844 | |
| Preferred Stocks | | | (1,120,735 | ) | | | — | | | | — | | | | 2,778,825 | |
| Rights, Warrants, and Certificates | | | — | | | | — | | | | — | | | | 816 | |
| Structured Securities | | | (4,793,400 | ) | | | 19,001,064 | | | | — | | | | 19,537,403 | |
| | |
|
|
| |
|
|
| |
|
|
| |
|
|
|
| Total Assets | | $ | (6,979,453 | ) | | $ | 27,079,109 | | | $ | — | | | $ | 49,445,727 | |
| | |
|
|
| |
|
|
| |
|
|
| |
|
|
|
| | | | | | | | | | | | | | | | | |
a. Included in net investment income.
The total change in unrealized appreciation/depreciation included in the Statement of Operations attributable to level 3 investments still held at December 31, 2012 includes:
| | | | |
| | | Change in unrealized
appreciation/depreciation | |
| Asset-Backed Securities | | $ | 1,919,932 | |
| Common Stocks | | | (3,047,279 | ) |
| Preferred Stocks | | | 665,165 | |
| Corporate Bonds and Notes | | | (198,981 | ) |
| Corporate Loans | | | (37,738 | ) |
| Mortgage-Backed Obligations | | | 56,962 | |
| Rights, Warrants and Certificates | | | (3,168,099 | ) |
| Structured Securities | | | 1,041,984 | |
| | |
|
|
|
| Total | | $ | (2,768,054 | ) |
| | |
|
|
|
| | | | |
| 69 | | | | OPPENHEIMER GLOBAL STRATEGIC INCOME FUND/VA |
NOTES TO FINANCIAL STATEMENTS Continued
2. Securities Valuation Continued
The following table summarizes the valuation techniques and significant unobservable inputs used in determining fair value measurements for those investments classified as Level 3 as of December 31, 2012:
| | | | | | | | | | | | | | | | | | |
| | | Value as of
December 31,
2012 | | | Valuation Technique | | | Unobservable Input | | | Range of
Unobservable Inputs | | Unobservable
Input Used | |
| Assets Table | | | | | | | | | | | | | | | | | | |
| Investments, at Value: | | | | | | | | | | | | | | | | | | |
| Asset-Backed Securities | | | $13,833,500 | | | | Broker quotes | | | | Broker Bid | | | N/A | | | N/A (a | ) |
| Corporate Loans | | | 4,212,575 | | | | Discount to appraised value | | |
| Discount rate
Appraisal of Collateral |
| | N/A
$30—35 million | |
| 35%
$32.5 million (b |
) |
| Mortgage-Backed Obligations | | | 4,278,799 | | |
| Broker quotes through Pricing
Service |
| | | Broker Bid | | | N/A | | | N/A (c | ) |
| Mortgage-Backed Obligations | | | 507,045 | | | | Broker quotes | | | | Broker Bid and Ask | | | N/A | | | N/A (c | ) |
| Corporate Bonds and Notes | | | 817,068 | | | | Cost | | | | N/A | | | N/A | | | 97% of par (d | ) |
| Corporate Bonds and Notes | | | 540,000 | | | | Market Comparables | | | | Broker Bid | | | N/A | | | 7.5% of par (e | ) |
| Preferred Stocks | | | 2,778,825 | | | | Broker quotes | | | | Broker Bid and Ask | | | N/A | | | N/A (c | ) |
| Common Stock | | | 2,527,654 | | | | Broker quotes | | | | Proprietary model | | | N/A | | | N/A (c | ) |
| Common Stock | | | 268,088 | | | | Broker quotes | | | | Broker Bid and Ask | | | N/A | | | N/A (c | ) |
| Common Stock | | | 143,954 | | |
| Broker quotes through Pricing
Service |
| | | Proprietary model | | | N/A | | | N/A (c | ) |
| Rights, Warrants and Certificates | | | 816 | | | | Estimated Recovery proceeds | | | | Nominal value | | | N/A | | | 0.01% of par (f | ) |
| Structured securities | | | 19,501,016 | | | | Broker quotes | | | | Proprietary model | | | N/A | | | N/A (c | ) |
| Structured securities | | | 36,387 | | | | Estimated Recovery proceeds | | |
| Probability of favorable
litigation outcome |
| | N/A | | | 10% of par (g | ) |
| | |
|
|
| | | | | | | | | | | | | | |
| Total | | | $49,445,727 | | | | | | | | | | | | | | | |
| | | | | |
| | |
|
|
| | | | | | | | | | | | | | |
(a) The Fund fair values certain asset-backed securities using broker-dealer price quotations provided on a monthly basis. The Manager periodically reviews broker methodologies and inputs to confirm they are determined using unobservable inputs and have been appropriately classified. Such securities’ fair valuations could change significantly based on changes in unobservable inputs used by the broker.
(b) The Fund fair values its proportionate ownership of certain loans at a discount to an appraised value of underlying collateral to reflect the age of the appraisal, uncertainty of the sales price as compared to the appraised value, and illiquidity. A significant decrease (increase) to the discount rate, or a significant increase (decrease) to the underlying collateral’s appraised value, will result in a significant increase (decrease) to the fair value of the investment.
(c) Securities classified as Level 3 whose unadjusted values were provided by a pricing service or broker-dealer for which such inputs are unobservable. The Manager periodically reviews pricing vendor and broker methodologies and inputs to confirm they are determined using unobservable inputs and have been appropriately classified. Such securities’ fair valuations could change significantly based on changes in unobservable inputs used by the pricing service or broker.
(d) The Fund fair values certain corporate bonds received through bankruptcy distributions using prior transaction price (acquisition cost). The Manager monitors such investments for additional market information or the occurrence of a significant event which would warrant a re-evaluation of the security’s fair valuation.
(e) The Fund fair values certain corporate bonds using the issuing company’s public debt as a comparable. Given the uncertainty of recovery value, the bid quote of the company’s debt was used. A significant increase (decrease) to the broker’s bid on the company’s public debt will result in an significant increase (decrease) to the value of the investment.
(f) The Fund fair values certain warrants received through bankruptcy distributions using a nominal value as a percentage of par of the bonds previously held to reflect the low probability of future value. The Manager monitors such investments for additional market information or the occurrence of a significant event which would warrant a re-evaluation of the security’s fair valuation.
(g) The Fund fair values certain structured securities using a discount to par to reflect the low probability of future distributions resulting from litigation. A significant increase (decrease) to the estimated probability of cash flows resulting from the litigation proceedings will result in a significant increase (decrease) to the value of the investment.
There have been no significant changes to the fair valuation methodologies of the Fund during the period.
The net asset value per share of the Subsidiary is determined as of the close of the Exchange, on each day the Exchange is open for trading. The net asset value per share is determined by dividing the value of the Subsidiary’s net assets by the number of shares that are outstanding. The Subsidiary values its investments in the same manner as the Fund as described above.
| | | | |
| 70 | | | | OPPENHEIMER GLOBAL STRATEGIC INCOME FUND/VA |
3. Shares of Beneficial Interest
The Fund has authorized an unlimited number of $0.001 par value shares of beneficial interest of each class. Transactions in shares of beneficial interest were as follows:
| | | | | | | | | | | | | | | | |
| | | Year Ended December 31, 2012 | | | Year Ended December 30, 2011 | |
| | | Shares | | | Amount | | | Shares | | | Amount | |
| Non-Service Shares | | | | | | | | | | | | | | | | |
| Sold | | | 11,893,556 | | | $ | 65,980,860 | | | | 11,331,249 | | | $ | 62,405,055 | |
| Dividends and/or distributions reinvested | | | 9,254,780 | | | | 48,680,145 | | | | 5,843,515 | | | | 31,847,158 | |
| Acquisition—Note 9 | | | 9,127,251 | | | | 50,838,789 | | | | — | | | | — | |
| Redeemed | | | (19,793,962 | ) | | | (109,300,842 | ) | | | (24,340,756 | ) | | | (133,612,101 | ) |
| | |
|
|
| |
|
|
| |
|
|
| |
|
|
|
| Net increase (decrease) | | | 10,481,625 | | | $ | 56,198,952 | | | | (7,165,992 | ) | | $ | (39,359,888 | ) |
| | |
|
|
| |
|
|
| |
|
|
| |
|
|
|
| | | | | | | | | | | | | |
| Service Shares | | | | | | | | | | | | | | | | |
| Sold | | | 29,727,051 | | | $ | 168,387,762 | | | | 30,704,662 | | | $ | 172,623,711 | |
| Dividends and/or distributions reinvested | | | 21,198,531 | | | | 114,048,098 | | | | 12,087,824 | | | | 67,208,303 | |
| Acquisition—Note 9 | | | 10,563,745 | | | | 60,107,709 | | | | — | | | | — | |
| Redeemed | | | (35,968,087 | ) | | | (203,431,908 | ) | | | (44,589,582 | ) | | | (250,157,976 | ) |
| | |
|
|
| |
|
|
| |
|
|
| |
|
|
|
| Net increase (decrease) | | | 25,521,240 | | | $ | 139,111,661 | | | | (1,797,096 | ) | | $ | (10,325,962 | ) |
| | |
|
|
| |
|
|
| |
|
|
| |
|
|
|
| | | | | | | | | | | | | |
4. Purchases and Sales of Securities
The aggregate cost of purchases and proceeds from sales of securities, other than short-term obligations and investments in the Subsidiary and IMMF, for the year ended December 31, 2012, were as follows:
| | | | | | | | |
| | | Purchases | | | Sales | |
| Investment securities | | $ | 1,223,283,601 | | | $ | 1,205,299,167 | |
| U.S. government and government agency obligations | | | 287,859,030 | | | | 280,456,208 | |
| To Be Announced (TBA) mortgage-related securities | | | 3,862,820,437 | | | | 3,466,796,223 | |
5. Fees and Other Transactions with Affiliates
Management Fees. Under the investment advisory agreement, the Fund pays the Manager a management fee based on the daily net assets of the Fund at an annual rate as shown in the following table:
| | | | |
| Fee Schedule | | | |
| Up to $200 million | | | 0.75 | % |
| Next $200 million | | | 0.72 | |
| Next $200 million | | | 0.69 | |
| Next $200 million | | | 0.66 | |
| Next $200 million | | | 0.60 | |
| Over $1 billion | | | 0.50 | |
Administration Service Fees. The Fund pays the Manager a fee of $1,500 per year for preparing and filing the Fund’s tax returns.
Transfer Agent Fees. OppenheimerFunds Services (“OFS”), a division of the Manager, acts as the transfer and shareholder servicing agent for the Fund. For the year ended December 31, 2012, the Fund paid $2,379,561 to OFS for services to the Fund.
Distribution and Service Plan for Service Shares. The Fund has adopted a Distribution and Service Plan (the “Plan”) in accordance with Rule 12b-1 under the Investment Company Act of 1940 for Service shares to pay OppenheimerFunds
| | | | |
| 71 | | | | OPPENHEIMER GLOBAL STRATEGIC INCOME FUND/VA |
NOTES TO FINANCIAL STATEMENTS Continued
5. Fees and Other Transactions with Affiliates Continued
Distributor, Inc. (the “Distributor”), for distribution related services, personal service and account maintenance for the Fund’s Service shares. Under the Plan, payments are made periodically at an annual rate of 0.25% of the daily net assets of Service shares of the Fund. The Distributor currently uses all of those fees to compensate sponsors of the insurance product that offers Fund shares, for providing personal service and maintenance of accounts of their variable contract owners that hold Service shares. These fees are paid out of the Fund’s assets on an on-going basis and increase operating expenses of the Service shares, which results in lower performance compared to the Fund’s shares that are not subject to a service fee. Fees incurred by the Fund under the Plan are detailed in the Statement of Operations.
Waivers and Reimbursements of Expenses. The Manager has voluntarily agreed to limit the Fund’s expenses after payments, waivers and/or reimbursements and reduction to custodian expenses, excluding expenses incurred directly or indirectly by the Fund as a result of investments in wholly-owned subsidiaries and pooled investment vehicles; so that those expenses, as percentages of daily net assets, will not exceed the annual rate of 0.75% for Non-Service shares and 1.00% for Service shares. During the year ended December 31, 2012, the Manager reimbursed the Fund $5,488 and $13,862 for Non-Service and Service shares, respectively.
The Manager has contractually agreed to waive the management fee it receives from the Fund in an amount equal to the management fee it receives from the Subsidiary. This undertaking will continue in effect for so long as the Fund invests in the Subsidiary and may not be terminated unless approved by the Fund’s Board of Trustees. During the year ended December 31, 2012, the Manager waived $10,926.
The Manager will waive fees and/or reimburse Fund expenses in an amount equal to the indirect management fees incurred through the Fund’s investments in IMMF, Oppenheimer Short Duration Fund and the Master Funds. During the year ended December 31, 2012, the Manager waived fees and/or reimbursed the Fund $1,261,141 for management fees.
Some of these undertakings may be modified or terminated at any time; some may not be modified or terminated until after one year from the date of the current prospectus, as indicated therein.
6. Risk Exposures and the Use of Derivative Instruments
The Fund’s investment objectives not only permit the Fund to purchase investment securities, they also allow the Fund to enter into various types of derivatives contracts, including, but not limited to, futures contracts, forward foreign currency exchange contracts, credit default swaps, interest rate swaps, total return swaps, and purchased and written options. In doing so, the Fund will employ strategies in differing combinations to permit it to increase, decrease, or change the level or types of exposure to market risk factors. Central to those strategies are features inherent to derivatives that make them more attractive for this purpose than equity and debt securities: they require little or no initial cash investment, they can focus exposure on only certain selected risk factors, and they may not require the ultimate receipt or delivery of the underlying security (or securities) to the contract. This may allow the Fund to pursue its objectives more quickly and efficiently than if it were to make direct purchases or sales of securities capable of effecting a similar response to market factors.
Market Risk Factors. In accordance with its investment objectives, the Fund may use derivatives to increase or decrease its exposure to one or more of the following market risk factors:
Commodity Risk. Commodity risk relates to the change in value of commodities or commodity indexes as they relate to increases or decreases in the commodities market. Commodities are physical assets that have tangible properties. Examples of these types of assets are crude oil, heating oil, metals, livestock, and agricultural products.
Credit Risk. Credit risk relates to the ability of the issuer to meet interest and principal payments, or both, as they come due. In general, lower-grade, higher-yield bonds are subject to credit risk to a greater extent than lower-yield, higher-quality bonds.
Equity Risk. Equity risk relates to the change in value of equity securities as they relate to increases or decreases in the general market.
| | | | |
| 72 | | | | OPPENHEIMER GLOBAL STRATEGIC INCOME FUND/VA |
Foreign Exchange Rate Risk. Foreign exchange rate risk relates to the change in the U.S. dollar value of a security held that is denominated in a foreign currency. The U.S. dollar value of a foreign currency denominated security will decrease as the dollar appreciates against the currency, while the U.S. dollar value will increase as the dollar depreciates against the currency.
Interest Rate Risk. Interest rate risk refers to the fluctuations in value of fixed-income securities resulting from the inverse relationship between price and yield. For example, an increase in general interest rates will tend to reduce the market value of already issued fixed-income investments, and a decline in general interest rates will tend to increase their value. In addition, debt securities with longer maturities, which tend to have higher yields, are subject to potentially greater fluctuations in value from changes in interest rates than obligations with shorter maturities.
Volatility Risk. Volatility risk refers to the magnitude of the movement, but not the direction of the movement, in a financial instrument’s price over a defined time period. Large increases or decreases in a financial instrument’s price over a relative time period typically indicate greater volatility risk, while small increases or decreases in its price typically indicate lower volatility risk.
The Fund’s actual exposures to these market risk factors during the period are discussed in further detail, by derivative type, below.
Risks of Investing in Derivatives. The Fund’s use of derivatives can result in losses due to unanticipated changes in the market risk factors and the overall market. In instances where the Fund is using derivatives to decrease, or hedge, exposures to market risk factors for securities held by the Fund, there are also risks that those derivatives may not perform as expected resulting in losses for the combined or hedged positions.
Derivatives may have little or no initial cash investment relative to their market value exposure and therefore can produce significant gains or losses in excess of their cost. This use of embedded leverage allows the Fund to increase its market value exposure relative to its net assets and can substantially increase the volatility of the Fund’s performance.
Additional associated risks from investing in derivatives also exist and potentially could have significant effects on the valuation of the derivative and the Fund. Typically, the associated risks are not the risks that the Fund is attempting to increase or decrease exposure to, per its investment objectives, but are the additional risks from investing in derivatives. Examples of these associated risks are liquidity risk, which is the risk that the Fund will not be able to sell the derivative in the open market in a timely manner, and counterparty credit risk, which is the risk that the counterparty will not fulfill its obligation to the Fund. Associated risks can be different for each type of derivative and are discussed by each derivative type in the notes that follow.
Counterparty Credit Risk. Certain derivative positions are subject to counterparty credit risk, which is the risk that the counterparty will not fulfill its obligation to the Fund. The Fund’s derivative counterparties are financial institutions who are subject to market conditions that may weaken their financial position. The Fund intends to enter into financial transactions with counterparties that the Manager believes to be creditworthy at the time of the transaction. As of December 31, 2012, the maximum amount of loss that the Fund would incur if the counterparties to its derivative transactions failed to perform would be $19,868,409, which represents gross payments to be received by the Fund on these derivative contracts were they to be unwound as of period end. To reduce this risk the Fund has entered into master netting arrangements, established within the Fund’s International Swap and Derivatives Association, Inc. master agreements, which allow the Fund to net unrealized appreciation and depreciation for certain positions in swaps, over-the-counter options, swaptions, and forward currency exchange contracts for each individual counterparty. The amount of loss that the Fund would incur taking into account these master netting arrangements would be $8,516,456 as of December 31, 2012. In addition, the Fund may require that certain counterparties post cash and/or securities in collateral accounts to cover their net payment obligations for those derivative contracts subject to International Swap and Derivatives Association, Inc. master agreements. If the counterparty fails to perform under these contracts and agreements, the cash and/or securities will be made available to the Fund.
| | | | |
| 73 | | | | OPPENHEIMER GLOBAL STRATEGIC INCOME FUND/VA |
NOTES TO FINANCIAL STATEMENTS Continued
6. Risk Exposures and the Use of Derivative Instruments Continued
As of December 31, 2012 the Fund has required certain counterparties to post collateral of $8,479,291.
Credit Related Contingent Features. The Fund’s agreements with derivative counterparties have several credit related contingent features that if triggered would allow its derivatives counterparties to close out and demand payment or additional collateral to cover their exposure from the Fund. Credit related contingent features are established between the Fund and its derivatives counterparties to reduce the risk that the Fund will not fulfill its payment obligations to its counterparties. These triggering features include, but are not limited to, a percentage decrease in the Fund’s net assets and or a percentage decrease in the Fund’s Net Asset Value or NAV. The contingent features are established within the Fund’s International Swap and Derivatives Association, Inc. master agreements which govern certain positions in swaps, over-the-counter options and swaptions, and forward currency exchange contracts for each individual counterparty.
As of December 31, 2012, the aggregate fair value of derivative instruments with credit related contingent features in a net liability position was $8,377,173 for which the Fund has posted collateral of $9,335,399. If a contingent feature would have been triggered as of December 31, 2012, the Fund could have been required to pay this amount in cash to its counterparties. If the Fund fails to perform under these contracts and agreements, the cash and/or securities posted as collateral will be made available to the counterparty. Cash posted as collateral for these contracts, if any, is reported on the Statement of Assets and Liabilities; securities posted as collateral, if any, are reported on the Statement of Investments.
Valuations of derivative instruments as of December 31, 2012 are as follows:
| | | | | | | | | | | | |
| | | Asset Derivatives
| | | Liability Derivatives
| |
Derivatives Not
Accounted for as
Hedging Instruments | | Statement of Assets
and Liabilities Location | | Value | | | Statement of Assets
and Liabilities Location | | Value | |
| Credit contracts | | Appreciated swaps, at value | | $ | 144,664 | | | Appreciated swaps, at value | | $ | 278,342 | |
| Credit contracts | | Depreciated swaps, at value | | | 1,529,738 | | | Depreciated swaps, at value | | | 1,214,353 | |
| Equity contracts | | Appreciated swaps, at value | | | 517,079 | | | Depreciated swaps, at value | | | 96,875 | |
| Interest rate contracts | | Appreciated swaps, at value | | | 568,606 | | | Depreciated swaps, at value | | | 169,826 | |
| Volatility contracts | | Appreciated swaps, at value | | | 171,949 | | | Depreciated swaps, at value | | | 734,464 | |
| Equity contracts | | Futures margins | | | 31,291 | * | | Futures margins | | | 1,182,543 | * |
| Foreign exchange contracts | | Futures margins | | | 16,553 | * | | Futures margins | | | 16,875 | * |
| Interest rate contracts | | Futures margins | | | 351,938 | * | | Futures margins | | | 689,304 | * |
| Foreign exchange contracts | | Closed currency contracts | | | 1,054,219 | | | Closed currency contracts | | | 2,744,413 | |
| Foreign exchange contracts | | Unrealized appreciation on foreign currency exchange contracts | | | 9,056,616 | | | Unrealized depreciation on foreign currency exchange contracts | | | 9,690,019 | |
| Foreign exchange contracts | | | | | | | | Appreciated options written, at value | | | 412,081 | |
| Foreign exchange contracts | | | | | | | | Depreciated options written, at value | | | 614,239 | |
| Interest rate contracts | | | | | | | | Appreciated options written, at value | | | 41,719 | |
| Interest rate contracts | | | | | | | | Depreciated options written, at value | | | 98,091 | |
| Interest rate contracts | | | | | | | | Appreciated swaptions written, at value | | | 2,058,739 | |
| Interest rate contracts | | | | | | | | Depreciated swaptions written, at value | | | 3,122,364 | |
| Foreign exchange contracts | | Investments, at value | | | 1,979,553 | ** | | | | | | |
| Interest rate contracts | | Investments, at value | | | 5,267,116 | ** | | | | | | |
| | | | |
|
|
| | | |
|
|
|
| Total | | | | $ | 20,689,322 | | | | | $ | 23,164,247 | |
| | | | |
|
|
| | | |
|
|
|
*Includes only the current day’s variation margin. Prior variation margin movements have been reflected in cash on the Statement of Assets and Liabilities upon receipt or payment.
**Amounts relate to purchased options and purchased swaptions.
| | | | |
| 74 | | | | OPPENHEIMER GLOBAL STRATEGIC INCOME FUND/VA |
The effect of derivative instruments on the Statement of Operations is as follows:
| | | | | | | | | | | | | | | | | | | | | | | | | | | | |
| Amount of Realized Gain or (Loss) Recognized on Derivatives | |
Derivatives Not Accounted
for as Hedging Instruments | | Investments
from
unaffiliated
companies
(including
premiums on
options
exercised)* | | | Closing and
expiration
of swaption
contracts
written | | | Closing and
expiration
of option
contracts
written | | | Closing and
expiration
of futures
contracts | | | Foreign
currency
transactions | | | Swap
contracts | | | Total | |
| Credit contracts | | $ | (5,339,295 | ) | | $ | 412,955 | | | $ | — | | | $ | — | | | $ | — | | | $ | (2,985,354 | ) | | $ | (7,911,694 | ) |
| Equity contracts | | | — | | | | — | | | | — | | | | (6,617,570 | ) | | | — | | | | 874,210 | | | | (5,743,360 | ) |
| Foreign exchange contracts | | | (7,842,413 | ) | | | — | | | | 7,585,231 | | | | 451,729 | | | | (10,028,584 | ) | | | 16,034 | | | | (9,818,003 | ) |
| Interest rate contracts | | | (23,804,536 | ) | | | 10,051,312 | | | | 4,952,430 | | | | 9,366,766 | | | | — | | | | (296,886 | ) | | | 269,086 | |
| Volatility contracts | | | — | | | | — | | | | — | | | | 439,659 | | | | — | | | | 2,608,814 | | | | 3,048,473 | |
| | |
|
|
| |
|
|
| |
|
|
| |
|
|
| |
|
|
| |
|
|
| |
|
|
|
| Total | | $ | (36,986,244 | ) | | $ | 10,464,267 | | | $ | 12,537,661 | | | $ | 3,640,584 | | | $ | (10,028,584 | ) | | $ | 216,818 | | | $ | (20,155,498 | ) |
| | |
|
|
| |
|
|
| |
|
|
| |
|
|
| |
|
|
| |
|
|
| |
|
|
|
*Includes purchased option contracts, purchased swaption contracts and written option contracts exercised, if any.
| | | | | | | | | | | | | | | | | | | | | | | | | | | | |
| Amount of Change in Unrealized Gain or (Loss) Recognized on Derivatives | |
Derivatives Not Accounted
for as Hedging Instruments | | Investments* | | | Option
contracts
written | | | Swaption
contracts
written | | | Futures
contracts | | | Translation
of assets
and
liabilities
denominated
in foreign
currencies | | | Swap
contracts | | | Total | |
| Credit contracts | | $ | — | | | $ | — | | | $ | — | | | $ | — | | | $ | — | | | $ | (315,476 | ) | | $ | (315,476 | ) |
| Equity contracts | | | — | | | | — | | | | — | | | | (300,562 | ) | | | — | | | | 50,840 | | | | (249,722 | ) |
| Foreign exchange contracts | | | 597,232 | | | | (237,646 | ) | | | — | | | | (51,728 | ) | | | 2,102,514 | | | | 573 | | | | 2,410,945 | |
| Interest rate contracts | | | (2,176,949 | ) | | | (312,057 | ) | | | (767,560 | ) | | | (3,050,089 | ) | | | — | | | | (134,107 | ) | | | (6,440,762 | ) |
| Volatility contracts | | | — | | | | — | | | | — | | | | — | | | | — | | | | (825,016 | ) | | | (825,016 | ) |
| | |
|
|
| |
|
|
| |
|
|
| |
|
|
| |
|
|
| |
|
|
| |
|
|
|
| Total | | $ | (1,579,717 | ) | | $ | (549,703 | ) | | $ | (767,560 | ) | | $ | (3,402,379 | ) | | $ | 2,102,514 | | | $ | (1,223,186 | ) | | $ | (5,420,031 | ) |
| | |
|
|
| |
|
|
| |
|
|
| |
|
|
| |
|
|
| |
|
|
| |
|
|
|
*Includes purchased option contracts and purchased swaption contracts, if any.
Foreign Currency Exchange Contracts
The Fund may enter into foreign currency exchange contracts (“forward contracts”) for the purchase or sale of a foreign currency at a negotiated rate at a future date.
Forward contracts are reported on a schedule following the Statement of Investments. The unrealized appreciation (depreciation) is reported in the Statement of Assets and Liabilities as a receivable or payable and in the Statement of Operations within the change in unrealized appreciation (depreciation). At contract close, the difference between the original cost of the contract and the value at the close date is recorded as a realized gain (loss) in the Statement of Operations.
The Fund has purchased and sold certain forward foreign currency exchange contracts of different currencies in order to acquire currencies to pay for or sell currencies to acquire related foreign securities purchase and sale transactions, respectively, or to convert foreign currencies to U.S. dollars from related foreign securities transactions. These foreign currency exchange contracts are negotiated at the current spot exchange rate with settlement typically within two business days thereafter.
The Fund has entered into forward foreign currency exchange contracts with the obligation to purchase specified foreign currencies in the future at a currently negotiated forward rate in order to take a positive investment perspective on the related currency. These forward foreign currency exchange contracts seek to increase exposure to foreign exchange rate risk.
| | | | |
| 75 | | | | OPPENHEIMER GLOBAL STRATEGIC INCOME FUND/VA |
NOTES TO FINANCIAL STATEMENTS Continued
6. Risk Exposures and the Use of Derivative Instruments Continued
The Fund has entered into forward foreign currency exchange contracts with the obligation to purchase specified foreign currencies in the future at a currently negotiated forward rate in order to decrease exposure to foreign exchange rate risk associated with foreign currency denominated securities held by the Fund.
The Fund has entered into forward foreign currency exchange contracts with the obligation to sell specified foreign currencies in the future at a currently negotiated forward rate in order to take a negative investment perspective on the related currency. These forward foreign currency exchange contracts seek to increase exposure to foreign exchange rate risk.
The Fund has entered into forward foreign currency exchange contracts with the obligation to sell specified foreign currencies in the future at a currently negotiated forward rate in order to decrease exposure to foreign exchange rate risk associated with foreign currency denominated securities held by the Fund.
During the year ended December 31, 2012, the Fund had daily average contract amounts on forward foreign currency contracts to buy and sell of $304,248,255 and $632,014,969, respectively.
Additional associated risk to the Fund includes counterparty credit risk. Counterparty credit risk arises from the possibility that the counterparty will default.
Futures Contracts
A futures contract is a commitment to buy or sell a specific amount of a financial instrument, or currency, at a negotiated price on a stipulated future date. The Fund may buy and sell futures contracts and may also buy or write put or call options on these futures contracts.
Futures contracts traded on a commodities or futures exchange will be valued at the final settlement price or official closing price on the principal exchange as reported by such principal exchange at its trading session ending at, or most recently prior to, the time when the Fund’s assets are valued.
Upon entering into a futures contract, the Fund is required to deposit either cash or securities (initial margin) in an amount equal to a certain percentage of the contract value. Subsequent payments (variation margin) are made or received by the Fund each day. The variation margin payments are equal to the daily changes in the contract value and are recorded as unrealized gains and losses.
Futures contracts are reported on a schedule following the Statement of Investments. Securities held in collateralized accounts to cover initial margin requirements on open futures contracts are noted in the Statement of Investments. Cash held by the broker to cover initial margin requirements on open futures contracts and the receivable and/or payable for the daily mark to market for the variation margin are noted in the Statement of Assets and Liabilities. The net change in unrealized appreciation and depreciation is reported in the Statement of Operations. Realized gains (losses) are reported in the Statement of Operations at the closing or expiration of futures contracts.
The Fund has purchased futures contracts on various bonds and notes to increase exposure to interest rate risk.
The Fund has sold futures contracts on various bonds and notes to decrease exposure to interest rate risk.
The Fund has purchased futures contracts on various equity indexes to increase exposure to equity risk.
The Fund has sold futures contracts on various equity indexes to decrease exposure to equity risk.
The Fund has purchased futures contracts on various currencies to increase exposure to foreign exchange rate risk.
The Fund has sold futures contracts on various currencies to decrease exposure to foreign exchange rate risk.
The Fund has sold futures contracts, which have values that are linked to the price movement of the related volatility indexes, in order to decrease exposure to volatility risk.
During the year ended December 31, 2012, the Fund had an ending monthly average market value of $269,369,878 and $342,818,391 on futures contracts purchased and sold, respectively.
Additional associated risks of entering into futures contracts (and related options) include the possibility that there may be an illiquid market where the Fund is unable to liquidate the contract or enter into an offsetting position and, if used for hedging purposes, the risk that the price of the contract will correlate imperfectly with the prices of the Fund’s securities.
| | | | |
| 76 | | | | OPPENHEIMER GLOBAL STRATEGIC INCOME FUND/VA |
Option Activity
The Fund may buy and sell put and call options, or write put and call options. When an option is written, the Fund receives a premium and becomes obligated to sell or purchase the underlying security at a fixed price, upon exercise of the option.
Options are valued daily based upon the last sale price on the principal exchange on which the option is traded. The difference between the premium received or paid, and market value of the option, is recorded as unrealized appreciation or depreciation. The net change in unrealized appreciation or depreciation is reported in the Statement of Operations. When an option is exercised, the cost of the security purchased or the proceeds of the security sale are adjusted by the amount of premium received or paid. Upon the expiration or closing of the option transaction, a gain or loss is reported in the Statement of Operations.
The Fund has purchased call options on currencies to increase exposure to foreign exchange rate risk. A purchased call option becomes more valuable as the price of the underlying financial instrument appreciates relative to the strike price.
The Fund has purchased put options on currencies to decrease exposure to foreign exchange rate risk. A purchased put option becomes more valuable as the price of the underlying financial instrument depreciates relative to the strike price.
The Fund has purchased call options on treasury and/or euro futures to increase exposure to interest rate risk. A purchased call option becomes more valuable as the price of the underlying financial instrument appreciates relative to the strike price.
The Fund has purchased put options on treasury and/or euro futures to decrease exposure to interest rate risk. A purchased put option becomes more valuable as the price of the underlying financial instrument depreciates relative to the strike price.
During the year ended December 31, 2012, the Fund had an ending monthly average market value of $2,994,382 and $1,030,725 on purchased call options and purchased put options, respectively.
Options written, if any, are reported in a schedule following the Statement of Investments and as a liability in the Statement of Assets and Liabilities. Securities held in collateralized accounts to cover potential obligations with respect to outstanding written options are noted in the Statement of Investments.
The risk in writing a call option is that the Fund gives up the opportunity for profit if the market price of the security increases and the option is exercised. The risk in writing a put option is that the Fund may incur a loss if the market price of the security decreases and the option is exercised. The risk in buying an option is that the Fund pays a premium whether or not the option is exercised. The Fund also has the additional risk that there may be an illiquid market where the Fund is unable to close the contract.
The Fund has written put options on currencies to increase exposure to foreign exchange rate risk. A written put option becomes more valuable as the price of the underlying financial instrument appreciates relative to the strike price.
The Fund has written call options on currencies to decrease exposure to foreign exchange rate risk. A written call option becomes more valuable as the price of the underlying financial instrument depreciates relative to the strike price.
The Fund has written call options on treasury and/or euro futures to decrease exposure to interest rate risk. A written call option becomes more valuable as the price of the underlying financial instrument depreciates relative to the strike price.
The Fund has written put options on treasury and/or euro futures to increase exposure to interest rate risk. A written put option becomes more valuable as the price of the underlying financial instrument appreciates relative to the strike price.
During the year ended December 31, 2012, the Fund had an ending monthly average market value of $588,395 and $980,124 on written call options and written put options, respectively.
Additional associated risks to the Fund include counterparty credit risk for over-the-counter options and liquidity risk.
| | | | |
| 77 | | | | OPPENHEIMER GLOBAL STRATEGIC INCOME FUND/VA |
NOTES TO FINANCIAL STATEMENTS Continued
6. Risk Exposures and the Use of Derivative Instruments Continued
Written option activity for the year ended December 31, 2012 was as follows:
| | | | | | | | | | | | | | | | |
| | | Call Options
| | | Put Options
| |
| | | Number of
Contracts | | | Amount of
Premiums | | | Number of
Contracts | | | Amount of
Premiums | |
| Options outstanding as of December 30, 2011 | | | 115,871,391,682 | | | $ | 2,007,763 | | | | 134,242,404,666 | | | $ | 1,464,690 | |
| Options written | | | 43,523,916,313 | | | | 11,262,642 | | | | 12,267,498,770 | | | | 15,451,116 | |
| Options closed or expired | | | (149,178,257,053 | ) | | | (11,470,720 | ) | | | (139,793,328,592 | ) | | | (15,230,222 | ) |
| Options exercised | | | (8,581,515,000 | ) | | | (1,054,515 | ) | | | (4,571,255,445 | ) | | | (706,099 | ) |
| | |
|
|
| |
|
|
| |
|
|
| |
|
|
|
| Options outstanding as of December 31, 2012 | | | 1,635,535,942 | | | $ | 745,170 | | | | 2,145,319,399 | | | $ | 979,485 | |
| | |
|
|
| |
|
|
| |
|
|
| |
|
|
|
Swap Contracts
The Fund may enter into swap contract agreements with a counterparty to exchange a series of cash flows based on either specified reference rates, or the occurrence of a credit event, over a specified period. Such contracts may include interest rate, equity, debt, index, total return, credit and currency swaps.
Swaps are marked to market daily using primarily quotations from pricing services, counterparties and brokers. Swap contracts are reported on a schedule following the Statement of Investments. The values of swap contracts are aggregated by positive and negative values and disclosed separately on the Statement of Assets and Liabilities by contracts in unrealized appreciation and depreciation positions. Upfront payments paid or received, if any, affect the value of the respective swap. Therefore, to determine the unrealized appreciation (depreciation) on swaps, upfront payments paid should be subtracted from, while upfront payments received should be added to, the value of contracts reported as an asset on the Statement of Assets and Liabilities. Conversely, upfront payments paid should be added to, while upfront payments received should be subtracted from the value of contracts reported as a liability. The unrealized appreciation (depreciation) related to the change in the valuation of the notional amount of the swap is combined with the accrued interest due to (owed by) the Fund at termination or settlement. The net change in this amount during the period is included on the Statement of Operations. The Fund also records any periodic payments received from (paid to) the counterparty, including at termination, under such contracts as realized gain (loss) on the Statement of Operations.
Swap contract agreements are exposed to the market risk factor of the specific underlying reference asset. Swap contracts are typically more attractively priced compared to similar investments in related cash securities because they isolate the risk to one market risk factor and eliminate the other market risk factors. Investments in cash securities (for instance bonds) have exposure to multiple risk factors (credit and interest rate risk). Because swaps require little or no initial cash investment, they can expose the Fund to substantial risk in the isolated market risk factor.
Credit Default Swap Contracts. A credit default swap is a bilateral contract that enables an investor to buy or sell protection on a debt security against a defined-issuer credit event, such as the issuer’s failure to make timely payments of interest or principal on the debt security, bankruptcy or restructuring. The Fund may enter into credit default swaps either by buying or selling protection on a single security sovereign debt, or a basket of securities (the “reference asset”).
The buyer of protection pays a periodic fee to the seller of protection based on the notional amount of debt securities underlying the swap contract. The seller of protection agrees to compensate the buyer of protection for future potential losses as a result of a credit event on the reference asset. The contract effectively transfers the credit event risk of the reference asset from the buyer of protection to the seller of protection.
The ongoing value of the contract will fluctuate throughout the term of the contract based primarily on the credit risk of the reference asset. If the credit quality of the reference asset improves relative to the credit quality at contract initiation, the buyer of protection may have an unrealized loss greater than the anticipated periodic fee owed. This unrealized loss would be the result of current credit protection being cheaper than the cost of credit protection at
| | | | |
| 78 | | | | OPPENHEIMER GLOBAL STRATEGIC INCOME FUND/VA |
contract initiation. If the buyer elects to terminate the contract prior to its maturity, and there has been no credit event, this unrealized loss will become realized. If the contract is held to maturity, and there has been no credit event, the realized loss will be equal to the periodic fee paid over the life of the contract.
If there is a credit event, the buyer of protection can exercise its rights under the contract and receive a payment from the seller of protection equal to the notional amount of the reference asset less the market value of the reference asset. Upon exercise of the contract the difference between the value of the underlying reference asset and the notional amount is recorded as realized gain (loss) and is included on the Statement of Operations.
The Fund has sold credit protection through credit default swaps to increase exposure to the credit risk of individual securities and/or, indexes that are either unavailable or considered to be less attractive in the bond market.
The Fund has purchased credit protection through credit default swaps to decrease exposure to the credit risk of individual securities and/or, indexes.
For the year ended December 31, 2012, the Fund had ending monthly average notional amounts of $44,365,745 and $37,846,026 on credit default swaps to buy protection and credit default swaps to sell protection, respectively.
Additional associated risks to the Fund include counterparty credit risk and liquidity risk.
Interest Rate Swap Contracts. An interest rate swap is an agreement between counterparties to exchange periodic payments based on interest rates. One cash flow stream will typically be a floating rate payment based upon a specified interest rate while the other is typically a fixed interest rate.
The Fund has entered into interest rate swaps in which it pays a floating interest rate and receives a fixed interest rate in order to increase exposure to interest rate risk. Typically, if relative interest rates rise, payments made by the Fund under a swap agreement will be greater than the payments received by the Fund.
The Fund has entered into interest rate swaps in which it pays a fixed interest rate and receives a floating interest rate in order to decrease exposure to interest rate risk. Typically, if relative interest rates rise, payments received by the Fund under the swap agreement will be greater than the payments made by the Fund.
For the year ended December 31, 2012, the Fund had ending monthly average notional amounts of $32,330,764 and $68,837,744 on interest rate swaps which pay a fixed rate and interest rate swaps which receive a fixed rate, respectively.
Additional associated risks to the Fund include counterparty credit risk and liquidity risk.
Total Return Swap Contracts. A total return swap is an agreement between counterparties to exchange periodic payments based on asset or non-asset references. One cash flow is typically based on a non-asset reference (such as an interest rate or index) and the other on the total return of a reference asset (such as a security or a basket of securities). The total return of the reference asset typically includes appreciation or depreciation on the reference asset, plus any interest or dividend payments.
Total return swap contracts are exposed to the market risk factor of the specific underlying financial instrument or index. Total return swaps are less standard in structure than other types of swaps and can isolate and/or, include multiple types of market risk factors including equity risk, credit risk, and interest rate risk.
The Fund has entered into total return swaps on various equity securities or indexes to increase exposure to equity risk. These equity risk related total return swaps require the Fund to pay a floating reference interest rate, or an amount equal to the negative price movement of securities or an index multiplied by the notional amount of the contract. The Fund will receive payments equal to the positive price movement of the same securities or index multiplied by the notional amount of the contract.
The Fund has entered into total return swaps on various equity securities or indexes to decrease exposure to equity risk. These equity risk related total return swaps require the Fund to pay an amount equal to the positive price movement of securities or an index multiplied by the notional amount of the contract. The Fund will receive payments of a floating reference interest rate or an amount equal to the negative price movement of the same securities or index multiplied by the notional amount of the contract.
| | | | |
| 79 | | | | OPPENHEIMER GLOBAL STRATEGIC INCOME FUND/VA |
NOTES TO FINANCIAL STATEMENTS Continued
6. Risk Exposures and the Use of Derivative Instruments Continued
For the year ended December 31, 2012, the Fund had ending monthly average notional amounts of $48,430,308 and $8,759,135 on total return swaps which are long the reference asset and total return swaps which are short the reference asset, respectively.
Additional associated risks to the Fund include counterparty credit risk and liquidity risk.
Currency Swaps. A currency swap is an agreement between counterparties to exchange different currencies equivalent to the notional value at contract inception and reverse the exchange of the same notional values of those currencies at contract termination. The contract may also include periodic exchanges of cash flows based on a specified index or interest rate.
The Fund has entered into currency swap contracts with the obligation to pay an interest rate on various foreign currency notional amounts and receive an interest rate on the dollar notional amount in order to take a negative investment perspective on the related currencies for which the Fund receives a payment. These currency swap contracts seek to decrease exposure to foreign exchange rate risk.
For the year ended December 31, 2012, the Fund had ending monthly average notional amounts of $169,231 on currency swaps.
Additional associated risks to the Fund include counterparty credit risk and liquidity risk.
As of December 31, 2012, the Fund had no such currency swap agreements outstanding.
Volatility Swap Contracts. A volatility swap is an agreement between counterparties to exchange periodic payments based on the measured volatility of a reference security, index, currency or other reference investment over a specified time frame. One cash flow is typically based on the volatility of the reference investment as measured by changes in its price or level while the other cash flow is based on an interest rate or the measured volatility of a different reference investment. The appreciation or depreciation on a volatility swap will typically depend on the magnitude of the reference investment’s volatility, or size of the movement, rather than general directional increases or decreases in its price.
Volatility swaps are less standard in structure than other types of swaps and provide pure, or isolated, exposure to volatility risk of the specific underlying reference investment. Volatility swaps are typically used to speculate on future volatility levels, to trade the spread between realized and expected volatility, or to decrease the volatility exposure of investments held by the Fund.
The Fund has entered into volatility swaps to increase exposure to the volatility risk of various reference investments. These types of volatility swaps require the fund to pay the measured volatility and receive a fixed interest payment over the period of the contract. If the measured volatility of the related reference investment increases over the period, the swaps will depreciate in value. Conversely, if the measured volatility of the related reference investment decreases over the period, the swaps will appreciate in value.
The Fund has entered into volatility swaps to decrease exposure to the volatility risk of various reference investments. These types of volatility swaps require the fund to pay a fixed interest payment and receive the measured volatility over the period of the contract. If the measured volatility of the related reference investment increases over the period, the swaps will appreciate in value. Conversely, if the measured volatility of the related reference investment decreases over the period, the swaps will depreciate in value.
For the year ended December 31, 2012, the Fund had ending monthly average notional amounts of $498,453 and $599,160 on volatility swaps which pay volatility and volatility swaps which receive volatility, respectively.
Additional associated risks to the Fund include counterparty credit risk and liquidity risk.
Swaption Transactions
The Fund may enter into a swaption contract which grants the purchaser the right, but not the obligation, to enter into a swap transaction at preset terms detailed in the underlying agreement within a specified period of time. The purchaser pays a premium to the swaption writer who bears the risk of unfavorable changes in the preset terms on the underlying swap.
| | | | |
| 80 | | | | OPPENHEIMER GLOBAL STRATEGIC INCOME FUND/VA |
Swaptions are marked to market daily using primarily portfolio pricing services or quotations from counterparties and brokers. Purchased swaptions are reported as a component of investments in the Statement of Investments, the Statement of Assets and Liabilities and the Statement of Operations. Written swaptions are reported on a schedule following the Statement of Investments and their value is reported as a separate asset or liability line item in the Statement of Assets and Liabilities. The net change in unrealized appreciation or depreciation on written swaptions is separately reported in the Statement of Operations. When a swaption is exercised, the cost of the swap is adjusted by the amount of premium paid or received. Upon the expiration or closing of an unexercised swaption contract, a gain or loss is reported in the Statement of Operations for the amount of the premium paid or received.
The Fund generally will incur a greater risk when it writes a swaption than when it purchases a swaption. When the Fund writes a swaption it will become obligated, upon exercise of the swaption, according to the terms of the underlying agreement. Swaption contracts written by the Fund do not give rise to counterparty credit risk as they obligate the Fund, not its counterparty, to perform. When the Fund purchases a swaption it only risks losing the amount of the premium it paid if the swaption expires unexercised. However, when the Fund exercises a purchased swaption there is a risk that the counterparty will fail to perform or otherwise default on its obligations under the swaption contract.
The Fund purchased swaptions which gives it the option to enter into an interest rate swap in which it pays a floating interest rate and receives a fixed interest rate in order to increase exposure to interest rate risk. A purchased swaption of this type becomes more valuable as the reference interest rate depreciates relative to the preset interest rate.
The Fund has purchased swaptions which gives it the option to enter into an interest rate swap in which it pays a fixed interest rate and receives a floating interest rate in order to decrease exposure to interest rate risk. A purchased swaption of this type becomes more valuable as the reference interest rate appreciates relative to the preset interest rate.
The Fund has purchased swaptions which gives it the option to sell credit protection through credit default swaps in order to increase exposure to the credit risk of individual securities and, or, indexes. A purchased swaption of this type becomes more valuable as the likelihood of a credit event on the reference asset decreases.
The Fund has purchased swaptions which gives it the option to buy credit protection through credit default swaps in order to decrease exposure to the credit risk of individual securities and, or, indexes. A purchased swaption of this type becomes more valuable as the likelihood of a credit event on the reference asset increases.
The Fund has written swaptions which gives it the obligation, if exercised by the purchaser, to enter into an interest rate swap in which it pays a floating interest rate and receives a fixed interest rate in order to increase exposure to interest rate risk. A written swaption of this type becomes more valuable as the reference interest rate depreciates relative to the preset interest rate.
The Fund has written swaptions which gives it the obligation, if exercised by the purchaser, to enter into an interest rate swap in which it pays a fixed interest rate and receives a floating interest rate in order to decrease exposure to interest rate risk. A written swaption of this type becomes more valuable as the reference interest rate appreciates relative to the preset interest rate.
The Fund has written swaptions which give it the obligation, if exercised by the purchaser, to sell credit protection through credit default swaps in order to increase exposure to the credit risk of individual securities and/or, indexes. A written swaption of this type becomes more valuable as the likelihood of a credit event on the reference asset decreases.
The Fund has written swaptions which give it the obligation, if exercised by the purchaser, to buy credit protection through credit default swaps in order to decrease exposure to the credit risk of individual securities and, or, indexes. A written swaption of this type becomes more valuable as the likelihood of a credit event on the reference asset increases.
During the year ended December 31, 2012, the Fund had an ending monthly average market value of $6,243,283 and $7,396,368 on purchased and written swaptions, respectively.
| | | | |
| 81 | | | | OPPENHEIMER GLOBAL STRATEGIC INCOME FUND/VA |
NOTES TO FINANCIAL STATEMENTS Continued
6. Risk Exposures and the Use of Derivative Instruments Continued
Written swaption activity for the year ended December 31, 2012 was as follows:
| | | | | | | | |
| | | Call Swaptions
| |
| | | Notional
Amount | | | Amount of
Premiums | |
Swaptions outstanding as of December 30, 2011 | | | 385,315,000 | | | $ | 8,188,797 | |
Swaptions written | | | 2,958,587,387 | | | | 24,839,618 | |
Swaptions closed or expired | | | (2,996,250,000 | ) | | | (27,126,512 | ) |
Swaptions exercised | | | (94,385,000 | ) | | | (868,424 | ) |
| | |
|
|
| |
|
|
|
| Swaptions outstanding as of December 31, 2012 | | | 253,267,387 | | | $ | 5,033,479 | |
| | |
|
|
| |
|
|
|
7. Restricted Securities
As of December 31, 2012, investments in securities included issues that are restricted. A restricted security may have a contractual restriction on its resale and is valued under methods approved by the Board of Directors as reflecting fair value. Securities that are restricted are marked with an applicable footnote on the Statement of Investments. Restricted securities are reported on a schedule following the Statement of Investments.
8. Loan Commitments
Pursuant to the terms of certain credit agreements, the Fund has unfunded loan commitments of 154,574 at December 31, 2012. The Fund generally will maintain with its custodian, liquid investments having an aggregate value at least equal to the par value of unfunded loan commitments. At December 31, 2012, these commitments have a market value of $137,699 and have been included as Corporate Loans in the Statement of Investments.
9. Acquisition of Oppenheimer High Income Fund/VA
On October 25, 2012, the Fund acquired all of the net assets of Oppenheimer High Income Fund/VA at fair market value, pursuant to an Agreement and Plan of Reorganization approved by the Oppenheimer High Income Fund/VA shareholders on September 14, 2012. The purpose of this acquisition is to combine two funds with similar investment objectives, strategies and risks to allow shareholders to benefit from greater asset growth potential, as well as lowered total expenses.
The transaction qualified as a tax-free reorganization, (the “merger”) for federal income tax purposes allowing the Fund to use the original cost basis of the investments received to calculate subsequent gains and losses for tax reporting purposes.
Details of the merger are shown in the following table:
| | | | | | | | | | | | | | | | |
| | | Exchange
Ratio to One
Share of the
Oppenheimer
High Income
Fund/VA | | | Shares of
Beneficial
Interest
Issued by
the Fund | | | Value of
Issued
Shares of
Beneficial
Interest | | | Combined Net Assets on
October 25, 20121 | |
Non-Service | | | 0.3227303411 | | | | 8,294,514 | | | $ | 46,200,443 | | | | $739,622,804 | |
Service | | | 0.3184024605 | | | | 9,433,727 | | | $ | 53,677,909 | | | | $1,819,058,909 | |
Class 3 | | | 0.3263655296 | | | | 832,737 | | | $ | 4,638,346 | | | | See Non-Service shares above | |
Class 4 | | | 0.3240643234 | | | | 1,130,018 | | | $ | 6,429,800 | | | | See Service shares above | |
1. The net assets acquired included net unrealized depreciation of $3,949,765 and an unused capital loss carryforward of $225,414,822, potential utilization subject to tax limitations.
| | | | |
| 82 | | | | OPPENHEIMER GLOBAL STRATEGIC INCOME FUND/VA |
Had the merger occurred at the beginning of the reporting period, the Fund’s Statement of Operations would have been adjusted to the following amounts:
| | | | |
Net investment income | | $ | 147,886,894 | |
Net gain on investments | | | 162,844,456 | |
Net increase in net assets resulting from operations | | | 310,711,350 | |
10. Subsequent Event
The Board of Trustees of the Fund recently approved a series of modifications to the Fund’s investment advisory and transfer agency arrangements in connection with internal corporate restructuring efforts at OppenheimerFunds, Inc. (“OFI”). As a result of these modifications, on January 1, 2013 (the “Effective Date”), OFI Global Asset Management, Inc. (“OFI Global”), a wholly-owned subsidiary of OFI, became the investment adviser and transfer agent to the Fund under the terms of the Fund’s advisory agreement and transfer agency agreement, respectively. OFI Global, in turn, entered into a new sub-advisory agreement for the Fund, on the Effective Date, whereby OFI Global will have oversight and supervisory responsibilities and OFI will choose the Fund’s investments and provide related advisory services to the Fund. In addition, on the Effective Date, OFI Global entered into a sub-transfer agency agreement with Shareholder Services, Inc. doing business as OppenheimerFunds Services, a wholly-owned subsidiary of OFI, under which it will be responsible for providing transfer agency services to the Fund.
The realignment of advisory service responsibility between OFI Global and OFI did not result in any change in the persons managing the assets of the Fund, the level or nature of the advisory services provided to the Fund, or the fees charged to the Fund.
11. Pending Litigation
Since 2009, a number of class action lawsuits have been pending in federal courts against OppenheimerFunds, Inc., the Fund’s Adviser through December 31, 2012 and Sub-Adviser effective January 1, 2013 (the “Manager”), OppenheimerFunds Distributor, Inc., the Fund’s principal underwriter and distributor (the “Distributor”), and certain funds (but not including the Fund) advised by the Manager and distributed by the Distributor (the “Defendant Funds”). Several of these lawsuits also name as defendants certain officers and current and former trustees of the respective Defendant Funds. The lawsuits raise claims under federal securities law and allege, among other things, that the disclosure documents of the respective Defendant Funds contained misrepresentations and omissions and that the respective Defendant Funds’ investment policies were not followed. The plaintiffs in these actions seek unspecified damages, equitable relief and awards of attorneys’ fees and litigation expenses. The Defendant Funds’ Boards of Trustees have also engaged counsel to represent the Funds and the present and former Independent Trustees named in those suits.
Other class action and individual lawsuits have been filed since 2008 in various state and federal courts against the Manager and certain of its affiliates by investors seeking to recover investments they allegedly lost as a result of the “Ponzi” scheme run by Bernard L. Madoff and his firm, Bernard L. Madoff Investment Securities, LLC (“BLMIS”). Plaintiffs in these suits allege that they suffered losses as a result of their investments in several funds managed by an affiliate of the Manager and assert a variety of claims, including breach of fiduciary duty, fraud, negligent misrepresentation, unjust enrichment, and violation of federal and state securities laws and regulations, among others. They seek unspecified damages, equitable relief and awards of attorneys’ fees and litigation expenses. Neither the Distributor, nor any of the Oppenheimer mutual funds, their independent trustees or directors are named as defendants in these lawsuits. None of the Oppenheimer mutual funds invested in any funds or accounts managed by Madoff or BLMIS. On February 28, 2011, a stipulation of partial settlement of three groups of consolidated putative class action lawsuits relating to these matters was filed in the U.S. District Court for the Southern District of New York. On August 19, 2011, the court entered an order and final judgment approving the settlement as fair, reasonable and adequate. In September 2011, certain parties filed notices of appeal from the court’s order approving the settlement. The settlement does not resolve other outstanding lawsuits against the Manager and its affiliates relating to BLMIS.
| | | | |
| 83 | | | | OPPENHEIMER GLOBAL STRATEGIC INCOME FUND/VA |
NOTES TO FINANCIAL STATEMENTS Continued
11. Pending Litigation Continued
On April 16, 2010, a lawsuit was filed in New York state court against the Manager, an affiliate of the Manager and AAArdvark IV Funding Limited (“AAArdvark IV”), an entity advised by the Manager’s affiliate, in connection with investments made by the plaintiffs in AAArdvark IV. Plaintiffs allege breach of contract against the defendants and seek compensatory damages, costs and disbursements, including attorney fees. On July 15, 2011, a lawsuit was filed in New York state court against the Manager, an affiliate of the Manager and AAArdvark Funding Limited (“AAArdvark I”), an entity advised by the Manager’s affiliate, in connection with investments made by the plaintiffs in AAArdvark I. The complaint alleges breach of contract against the defendants and seeks compensatory damages, costs and disbursements, including attorney fees. On November 9, 2011, a lawsuit was filed in New York state court against the Manager, an affiliate of the Manager and AAArdvark XS Funding Limited (“AAArdvark XS”), an entity advised by the Manager’s affiliate, in connection with investments made by the plaintiffs in AAArdvark XS. The complaint alleges breach of contract against the defendants and seeks compensatory damages, costs and disbursements, including attorney fees.
The Manager believes the lawsuits and appeals described above are without legal merit and, with the exception of actions it has settled, is defending against them vigorously. While it is premature to render any opinion as to the outcome in these lawsuits, or whether any costs that the Defendant Funds may bear in defending the suits might not be reimbursed by insurance, the Manager believes that these suits should not impair the ability of the Manager or the Distributor to perform their respective duties to the Fund, and that the outcome of all of the suits together should not have any material effect on the operations of any of the Oppenheimer mutual funds.
| | | | |
| 84 | | | | OPPENHEIMER GLOBAL STRATEGIC INCOME FUND/VA |
REPORT OF INDEPENDENT REGISTERED PUBLIC ACCOUNTING FIRM
The Board of Trustees and Shareholders of Oppenheimer Variable Account Funds:
We have audited the accompanying statement of assets and liabilities of Oppenheimer Global Strategic Income Fund/VA (a separate series of Oppenheimer Variable Account Funds), including the statement of investments, as of December 31, 2012, and the related statement of operations for the year then ended, the statements of changes in net assets for each of the years in the two-year period then ended and the financial highlights for each of the years in the four-year period then ended. These financial statements and financial highlights are the responsibility of the Fund’s management. Our responsibility is to express an opinion on these financial statements and financial highlights based on our audits. The accompanying financial highlights of Oppenheimer Global Strategic Income Fund/VA for the year ended December 31, 2008 were audited by other auditors whose report dated February 11, 2009 expressed an unqualified opinion on those financial highlights.
We conducted our audits in accordance with the standards of the Public Company Accounting Oversight Board (United States). Those standards require that we plan and perform the audit to obtain reasonable assurance about whether the financial statements and financial highlights are free of material misstatement. An audit includes examining, on a test basis, evidence supporting the amounts and disclosures in the financial statements. Our procedures included confirmation of securities owned as of December 31, 2012, by correspondence with the custodian, transfer agent and brokers, or by other appropriate auditing procedures where replies from brokers were not received. An audit also includes assessing the accounting principles used and significant estimates made by management, as well as evaluating the overall financial statement presentation. We believe that our audits provide a reasonable basis for our opinion.
In our opinion, the financial statements and financial highlights referred to above present fairly, in all material respects, the financial position of Oppenheimer Global Strategic Income Fund/VA as of December 31, 2012, the results of its operations for the year then ended, the changes in its net assets for each of the years in the two-year period then ended and the financial highlights for each of the years in the four-year period then ended, in conformity with U.S. generally accepted accounting principles.
KPMGLLP
Denver, Colorado
February 19, 2013
| | | | |
| 85 | | | | OPPENHEIMER GLOBAL STRATEGIC INCOME FUND/VA |
FEDERAL INCOME TAX INFORMATION Unaudited
In early 2013, if applicable, shareholders of record received information regarding all dividends and distributions paid to them by the Fund during calendar year 2012.
Capital gain distributions of $0.03471 per share were paid to Non-Service and Service shareholders, respectively, on June 20, 2012. Whether received in stock or in cash, the capital gain distribution should be treated by shareholders as a gain from the sale of the capital assets held for more than one year (long-term capital gains).
Dividends, if any, paid by the Fund during the fiscal year ended December 31, 2012 which are not designated as capital gain distributions should be multiplied by the maximum amount allowable but not less than 0.14% to arrive at the amount eligible for the corporate dividend-received deduction.
The foregoing information is presented to assist shareholders in reporting distributions received from the Fund to the Internal Revenue Service. Because of the complexity of the federal regulations which may affect your individual tax return and the many variations in state and local tax regulations, we recommend that you consult your tax advisor for specific guidance.
| | | | |
| 86 | | | | OPPENHEIMER GLOBAL STRATEGIC INCOME FUND/VA |
BOARD APPROVAL OF THE FUND’S INVESTMENT
ADVISORY AGREEMENT Unaudited
Each year, the Board of Trustees (the “Board”), including a majority of the independent Trustees, is required to determine whether to renew the Fund’s investment advisory agreement (the “Agreement”). The Investment Company Act of 1940, as amended, requires that the Board request and evaluate, and that the Manager provide, such information as may be reasonably necessary to evaluate the terms of the Agreement. The Board employs an independent consultant to prepare a report that provides information, including comparative information that the Board requests for that purpose. In addition to in-person meetings focused on this evaluation, the Board receives information throughout the year regarding Fund services, fees, expenses and performance.
The Manager and the independent consultant provided information to the Board on the following factors: (i) the nature, quality and extent of the Manager’s services, (ii) the investment performance of the Fund and the Manager, (iii) the fees and expenses of the Fund, including comparative expense information, (iv) the profitability of the Manager and its affiliates, including an analysis of the cost of providing services, (v) whether economies of scale are realized as the Fund grows and whether fee levels reflect these economies of scale for Fund investors and (vi) other benefits to the Manager from its relationship with the Fund. The Board was aware that there are alternatives to retaining the Manager.
Outlined below is a summary of the principal information considered by the Board as well as the Board’s conclusions.
Nature, Quality and Extent of Services. The Board considered information about the nature, quality and extent of the services provided to the Fund and information regarding the Manager’s key personnel who provide such services. The Manager’s duties include providing the Fund with the services of the portfolio managers and the Manager’s investment team, who provide research, analysis and other advisory services in regard to the Fund’s investments; securities trading services; oversight of third-party service providers; monitoring compliance with applicable Fund policies and procedures and adherence to the Fund’s investment restrictions; and risk management. The Manager is responsible for providing certain administrative services to the Fund as well. Those services include providing and supervising all administrative and clerical personnel who are necessary in order to provide effective corporate administration for the Fund; compiling and maintaining records with respect to the Fund’s operations; preparing and filing reports required by the Securities and Exchange Commission; preparing periodic reports regarding the operations of the Fund for its shareholders; preparing proxy materials for shareholder meetings; and preparing the registration statements required by Federal and state securities laws for the sale of the Fund’s shares. The Manager also provides the Fund with office space, facilities and equipment.
The Board also considered the quality of the services provided and the quality of the Manager’s resources that are available to the Fund. The Board took account of the fact that the Manager has had over fifty years of experience as an investment adviser and that its assets under management rank it among the top mutual fund managers in the United States. The Board evaluated the Manager’s advisory, administrative, accounting, legal, compliance services and risk management, and information the Board has received regarding the experience and professional qualifications of the Manager’s key personnel and the size and functions of its staff. In its evaluation of the quality of the portfolio management services provided, the Board considered the experience of Arthur Steinmetz, Krishna Memani, Joseph Welsh, and Sara Zervos, the portfolio managers for the Fund, and the Manager’s investment team and analysts. The Board members also considered the totality of their experiences with the Manager as directors or trustees of the Fund and other funds advised by the Manager. The Board considered information regarding the quality of services provided by affiliates of the Manager, which its members have become knowledgeable about in connection with the renewal of the Fund’s service agreements. The Board concluded, in light of the Manager’s experience, reputation, personnel, operations and resources that the Fund benefits from the services provided under the Agreement.
Investment Performance of the Manager and the Fund. Throughout the year, the Manager provided information on the investment performance of the Fund, including comparative performance information. The Board also reviewed information, prepared by the Manager and by the independent consultant, comparing the Fund’s historical performance to relevant market indices and to the performance of other global income funds underlying variable insurance products. The Board considered that the Fund outperformed its performance universe median during the three-year period,
| | | | |
| 87 | | | | OPPENHEIMER GLOBAL STRATEGIC INCOME FUND/VA |
BOARD APPROVAL OF THE FUND’S INVESTMENT
ADVISORY AGREEMENT Unaudited / Continued
although the Fund underperformed its performance universe median during the one-, five- and ten-year periods. The Board noted that the Fund’s underperformance for the one-year period was due to the Fund’s overweight to credit risk, with exposure to high yield bonds and senior loans which underperformed in the second half of 2011 in a flight to quality. The Board noted that exposure to commercial mortgages, non-agency mortgages, and emerging market currencies also detracted from relative performance. The Board noted that in response to heightened volatility in the markets, the Fund adjusted its high yield exposure, reduced overall foreign currency exposure and neutralized its duration posture. The Board considered that for the 2012 year-to-date period ended April 30, 2012, the Fund’s performance was in the second quintile of its performance universe.
Costs of Services by the Manager. The Board reviewed the fees paid to the Manager and the other expenses borne by the Fund. The Board also considered the comparability of the fees charged and the services provided to the Fund to the fees and services for other clients or accounts advised by the Manager. The independent consultant provided comparative data in regard to the fees and expenses of the Fund and other global income funds underlying variable insurance products. In reviewing the fees and expenses charged to the VA funds, the Board considered the Manager’s assertion that, because there is much greater disparity in the fees and services that may be provided by a manager to a VA fund as opposed to a retail fund, when comparing the expenses of the various VA funds to those of retail funds, it is most appropriate to focus on total expenses (rather than on the management fees). Accordingly, while the Board reviewed and considered all expenses, it focused on total expenses. The Board considered that the Fund’s total expenses were above the expense group median and average. The Board also considered that the Fund’s actual management fees were lower than its expense group median and expense group average. The Board noted that the Manager has voluntarily agreed to waive fees and/or reimburse the Fund for certain expenses in order to limit total annual fund operating expenses after any fee waiver and/or expense reimbursement (excluding (i) interest, taxes, dividends tied to short sales, brokerage commissions, and other expenditures which are capitalized in accordance with generally accepted accounting principles; (ii) expenses incurred directly or indirectly by the Fund as a result of investments in other investment companies, wholly-owned subsidiaries and pooled investment vehicles; (iii) certain other expenses attributable to, and incurred as a result of, a Fund’s investments; and (iv) other extraordinary expenses (including litigation expenses) not incurred in the ordinary course of the Fund’s business) to annual rates of 0.75% for Non-Service shares and 1.00% for Service shares. This voluntary expense limitation may be amended or withdrawn at any time without prior notice to shareholders.
Economies of Scale and Profits Realized by the Manager. The Board considered information regarding the Manager’s costs in serving as the Fund’s investment adviser, including the costs associated with the personnel and systems necessary to manage the Fund, and information regarding the Manager’s profitability from its relationship with the Fund. The Board reviewed whether the Manager may realize economies of scale in managing and supporting the Fund. The Board noted that the Fund currently has management fee breakpoints, which are intended to share with Fund shareholders economies of scale that may exist as the Fund’s assets grow.
Other Benefits to the Manager. In addition to considering the profits realized by the Manager, the Board considered information that was provided regarding the direct and indirect benefits the Manager receives as a result of its relationship with the Fund, including compensation paid to the Manager’s affiliates. The Board also considered that the Manager must be able to pay and retain experienced professional personnel at competitive rates to provide quality services to the Fund.
Conclusions. These factors were also considered by the independent Trustees meeting separately from the full Board, assisted by experienced counsel to the Fund and to the independent Trustees. Fund counsel and the independent Trustees’ counsel are independent of the Manager within the meaning and intent of the Securities and Exchange Commission Rules.
Based on its review of the information it received and its evaluations described above, the Board, including a majority of the independent Trustees, decided to continue the Agreement. In addition, the Board, including a majority of the
| | | | |
| 88 | | | | OPPENHEIMER GLOBAL STRATEGIC INCOME FUND/VA |
Independent Trustees, approved the restructuring of the Fund’s investment advisory arrangement so that effective January 1, 2013, (i) OFI Global Asset Management, Inc. (“OFI Global”), a wholly owned subsidiary of the Manager, will serve as the investment adviser to the Fund in place of the Manager under a Restated Advisory Agreement (“Restated Advisory Agreement”), and (ii) OFI Global will enter into a Sub-Advisory Agreement (“Sub-Advisory Agreement”) with the Manager to provide investment sub-advisory services to the Fund. OFI Global will pay the Manager a percentage of the net investment advisory fee (after all applicable waivers have been deducted) that it receives from the Fund. The Agreement will continue until earlier of August 31, 2013 or the effective date of the Restated Advisory Agreement between the Fund and OFI Global. The Restated Advisory Agreement and Sub-Advisory Agreement will continue until August 31, 2013.
In arriving at its decisions, the Board did not single out any factor or factors as being more important than others, but considered all of the above information, and considered the terms and conditions of the Agreement, Restated Advisory Agreement and Sub-Advisory Agreement, including the management fees, in light of all the surrounding circumstances.
| | | | |
| 89 | | | | OPPENHEIMER GLOBAL STRATEGIC INCOME FUND/VA |
PORTFOLIO PROXY VOTING POLICIES AND PROCEDURES;
UPDATES TO STATEMENTS OF INVESTMENTS Unaudited
The Fund has adopted Portfolio Proxy Voting Policies and Procedures under which the Fund votes proxies relating to securities (“portfolio proxies”) held by the Fund. A description of the Fund’s Portfolio Proxy Voting Policies and Procedures is available (i) without charge, upon request, by calling the Fund toll-free at 1.800.525.7048, (ii) on the Fund’s website at oppenheimerfunds.com, and (iii) on the SEC’s website at www.sec.gov. In addition, the Fund is required to file Form N-PX, with its complete proxy voting record for the 12 months ended June 30th, no later than August 31st of each year. The Fund’s voting record is available (i) without charge, upon request, by calling the Fund toll-free at 1.800.525.7048, and (ii) in the Form N-PX filing on the SEC’s website at www.sec.gov.
The Fund files its complete schedule of portfolio holdings with the SEC for the first quarter and the third quarter of each fiscal year on Form N-Q. The Fund’s Form N-Q filings are available on the SEC’s website at www.sec.gov. Those forms may be reviewed and copied at the SEC’s Public Reference Room in Washington, D.C. Information on the operation of the Public Reference Room may be obtained by calling 1-800-SEC-0330.
| | | | |
| 90 | | | | OPPENHEIMER GLOBAL STRATEGIC INCOME FUND/VA |
TRUSTEES AND OFFICERS
| | |
| Name, Position(s) Held with the Fund, Length of Service, Age | | Principal Occupation(s) During the Past 5 Years; Other Trusteeships/Directorships Held; Number of Portfolios in the Fund Complex Currently Overseen |
| |
| INDEPENDENT TRUSTEES | | The address of each Trustee in the chart below is 6803 S. Tucson Way, Centennial, Colorado 80112-3924. Each Trustee serves for an indefinite term, or until his or her resignation, retirement, death or removal. |
| |
Sam Freedman, Chairman of the Board of Trustees (since 2012) and Trustee (since 1996) Age: 72 | | Director of Colorado UpLIFT (charitable organization) (since September 1984). Mr. Freedman held several positions with the Sub-Adviser and with subsidiary or affiliated companies of the Sub-Adviser (until October 1994). Oversees 36 portfolios in the OppenheimerFunds complex. Mr. Freedman has served on the Boards of certain Oppenheimer funds since 1996, during which time he has become familiar with the Fund’s (and other Oppenheimer funds’) financial, accounting, regulatory and investment matters and has contributed to the Boards’ deliberations. |
| |
Edward L. Cameron, Trustee (since 1999) Age: 74 | | Member of The Life Guard of Mount Vernon (George Washington historical site) (June 2000-June 2006); Partner of PricewaterhouseCoopers LLP (accounting firm) (July 1974-June 1999); Chairman of Price Waterhouse LLP Global Investment Management Industry Services Group (accounting firm) (July 1994-June 1998). Oversees 36 portfolios in the OppenheimerFunds complex. Mr. Cameron has served on the Boards of certain Oppenheimer funds since 1999, during which time he has become familiar with the Fund’s (and other Oppenheimer funds’) financial, accounting, regulatory and investment matters and has contributed to the Boards’ deliberations. |
| |
Jon S. Fossel, Trustee (since 1993) Age: 70 | | Chairman of the Board (2006-December 2011) and Director (June 2002-December 2011) of UNUMProvident (insurance company); Director of Northwestern Energy Corp. (public utility corporation) (November 2004-December 2009); Director of P.R. Pharmaceuticals (October 1999-October 2003); Director of Rocky Mountain Elk Foundation (non-profit organization) (February 1998-February 2003 and February 2005-February 2007); Chairman and Director (until October 1996) and President and Chief Executive Officer (until October 1995) of the Sub-Adviser; President, Chief Executive Officer and Director of the following: Oppenheimer Acquisition Corp. (“OAC”) (parent holding company of the Sub-Adviser), Shareholders Services, Inc. and Shareholder Financial Services, Inc. (until October 1995). Oversees 36 portfolios in the OppenheimerFunds complex. Mr. Fossel has served on the Boards of certain Oppenheimer funds since 1990, during which time he has become familiar with the Fund’s (and other Oppenheimer funds’) financial, accounting, regulatory and investment matters and has contributed to the Boards’ deliberations. |
| |
Richard F. Grabish, Trustee (since 2012) Age: 64 | | Formerly Senior Vice President and Assistant Director of Sales and Marketing (March 1997-December 2007), Director (March 1987-December 2007) and Manager of Private Client Services (June 1985-June 2005) of A.G. Edwards & Sons, Inc. (broker/dealer and investment firm); Chairman and Chief Executive Officer of A.G. Edwards Trust Company, FSB (March 2001-December 2007); President and Vice Chairman of A.G. Edwards Trust Company, FSB (investment adviser) (April 1987-March 2001); President of A.G. Edwards Trust Company, FSB (investment adviser) (June 2005-December 2007). Oversees 36 portfolios in the OppenheimerFunds complex. Mr. Grabish has served on the Boards of certain Oppenheimer funds since 2001, during which time he has become familiar with the Fund’s (and other Oppenheimer funds’) financial, accounting, regulatory and investment matters and has contributed to the Boards’ deliberations. |
| |
Beverly L. Hamilton, Trustee (since 2002) Age: 66 | | Trustee of Monterey Institute for International Studies (educational organization) (since February 2000); Board Member of Middlebury College (educational organization) (December 2005-June 2011); Chairman (since 2010) of American Funds’ Emerging Markets Growth Fund, Inc. (mutual fund); Director of The California Endowment (philanthropic organization) (April 2002-April 2008); Director (February 2002-2005) and Chairman of Trustees (2006-2007) of the Community Hospital of Monterey Peninsula; Director (October 1991-2005); Vice Chairman (2006-2009) of American Funds’ Emerging Markets Growth Fund, Inc. (mutual fund); President of ARCO Investment Management Company (February 1991-April 2000); Member of the investment committees of The Rockefeller Foundation (2001-2006) and The University of Michigan (since 2000); Advisor at Credit Suisse First Boston’s Sprout venture capital unit (venture capital fund) (1994-January 2005); Trustee of MassMutual Institutional Funds (investment company) (1996-June 2004); Trustee of MML Series Investment Fund (investment company) (April 1989-June 2004); Member of the investment committee of Hartford Hospital (2000-2003); and Advisor to Unilever (Holland) pension fund (2000-2003). Oversees 36 portfolios in the OppenheimerFunds complex. Ms. Hamilton has served on the Boards of certain Oppenheimer funds since 2002, during which time she has become familiar with the Fund’s (and other Oppenheimer funds’) financial, accounting, regulatory and investment matters and has contributed to the Boards’ deliberations. |
| | | | |
| 91 | | | | OPPENHEIMER GLOBAL STRATEGIC INCOME FUND/VA |
TRUSTEES AND OFFICERS Continued
| | |
Victoria J. Herget, Trustee (since 2012) Age: 61 | | Independent Director of the First American Funds (mutual fund family) (2003-2011); former Managing Director (1993-2001), Principal (1985-1993), Vice President (1978-1985) and Assistant Vice President (1973-1978) of Zurich Scudder Investments (and its predecessor firms); Board Chair (2008-Present) and Director (2004-Present), United Educators (insurance company); Trustee (1992-2007), Chair of the Board of Trustees (1999-2007), Investment Committee Chair (1994-1999) and Investment Committee member (2007-2010) of Wellesley College; Trustee (since 2000) and Chair (since 2010), Newberry Library; Trustee, Mather LifeWays (since 2001); Trustee, BoardSource (2006-2009) and Chicago City Day School (1994-2005). Oversees 36 portfolios in the OppenheimerFunds complex. Ms. Herget has served on the Boards of certain Oppenheimer funds since 2012, during which time she has become familiar with the Fund’s (and other Oppenheimer funds’) financial, accounting, regulatory and investment matters and has contributed to the Boards’ deliberations. |
| |
Robert J. Malone, Trustee (since 2002) Age: 68 | | Board of Directors of Opera Colorado Foundation (non-profit organization) (since March 2008); Director of Jones Knowledge, Inc. (2006-2010); Director of Jones International University (educational organization) (since August 2005); Chairman, Chief Executive Officer and Director of Steele Street Bank & Trust (commercial banking) (since August 2003); Director of Colorado UpLIFT (charitable organization) (1986-2010); Trustee of the Gallagher Family Foundation (non-profit organization) (since 2000); Former Chairman of U.S. Bank-Colorado (subsidiary of U.S. Bancorp and formerly Colorado National Bank) (July 1996-April 1999); Director of Commercial Assets, Inc. (real estate investment trust) (1993-2000); Director of Jones Knowledge, Inc. (2001-July 2004); Director of U.S. Exploration, Inc. (oil and gas exploration) (1997-February 2004); Chairman of the Board (1991-1994) and Trustee (1985-1994) of Regis University; and Chairman of the Board (1990-1991) and Trustee (1984-1999) of Young Presidents Organization. Oversees 36 portfolios in the OppenheimerFunds complex. Mr. Malone has served on the Boards of certain Oppenheimer funds since 2002, during which time he has become familiar with the Fund’s (and other Oppenheimer funds’) financial, accounting, regulatory and investment matters and has contributed to the Boards’ deliberations. |
| |
F. William Marshall, Jr., Trustee (since 2000) Age: 69 | | Trustee Emeritus of Worcester Polytech Institute (WPI) (private university) (since 2009); Trustee of MassMutual Select Funds (formerly MassMutual Institutional Funds) (investment company) (since 1996) and MML Series Investment Fund (investment company) (since 1996) and Mass Mutual Premier Funds (investment company) (since January 2012); President and Treasurer of the SIS Funds (private charitable fund) (January 1999-March 2011); Former Trustee of WPI (1985-2008); Former Chairman of the Board (2004-2006) and Former Chairman of the Investment Committee of WPI (1994-2008); Chairman of SIS & Family Bank, F.S.B. (formerly SIS Bank) (commercial bank) (January 1999-July 1999); Executive Vice President of Peoples Heritage Financial Group, Inc. (commercial bank) (January 1999-July 1999); and Former President and Chief Executive Officer of SIS Bancorp. (1993-1999). Oversees 40 portfolios in the OppenheimerFunds complex. Mr. Marshall has served on the Boards of certain Oppenheimer funds since 2000, during which time he has become familiar with the Fund’s (and other Oppenheimer funds’) financial, accounting, regulatory and investment matters and has contributed to the Boards’ deliberations. |
| |
Karen L. Stuckey, Trustee (since 2012) Age: 59 | | Partner (1990-2012) of PricewaterhouseCoopers LLP (held various positions 1975-1990); Trustee (1992-2006) and member of Executive, Nominating and Audit Committees and Chair of Finance Committee of Lehigh University; and member, Women’s Investment Management Forum since inception. Oversees 36 portfolios in the OppenheimerFunds complex. Ms. Stuckey has served on the Boards of certain Oppenheimer funds since 2012, during which time she has become familiar with the Fund’s (and other Oppenheimer funds’) financial, accounting, regulatory and investment matters and has contributed to the Boards’ deliberations. |
| |
James D. Vaughn, Trustee (since 2012) Age: 67 | | Retired; former managing partner (1994-2001) of Denver office of Deloitte & Touche LLP, (held various positions 1969-1993); Trustee and Chairman of the Audit Committee of Schroder Funds (2003-2012); Board member and Chairman of Audit Committee of AMG National Trust Bank (since 2005); Trustee, Audit Committee member and Investment Committee member, University of South Dakota Foundation (since 1996); Board member, Executive Committee Member, Audit Committee Member and past Board Chair, Junior Achievement (since 1993); former Board member, Mile High United Way, Boys and Girls Clubs, Boy Scouts, Colorado Business Committee for the Arts, Economic Club of Colorado and Metro Denver Network. Oversees 36 portfolios in the OppenheimerFunds complex. Mr. Vaughn has served on the Boards of certain Oppenheimer funds since 2012, during which time he has become familiar with the Fund’s (and other Oppenheimer funds’) financial, accounting, regulatory and investment matters and has contributed to the Boards’ deliberations. |
| | | | |
| 92 | | | | OPPENHEIMER GLOBAL STRATEGIC INCOME FUND/VA |
| | |
| INTERESTED TRUSTEE AND OFFICER | | The address of Mr. Glavin is Two World Financial Center, 225 Liberty Street, 11th Floor, New York, New York 10281-1008. Mr. Glavin serves as a Trustee for an indefinite term, or until his resignation, retirement, death or removal and as an Officer for an indefinite term, or until his resignation, retirement, death or removal. Mr. Glavin is an Interested Trustee due to his positions with OppenheimerFunds, Inc. and its affiliates. |
| |
William F. Glavin, Jr., Trustee, President and Principal Executive Officer (since 2009) Age: 54 | | Chief Executive Officer of OppenheimerFunds (since January 2013); Director, Chief Executive Officer and President of the Manager (since January 2013); Chairman of the Sub-Adviser (December 2009-December 2012); Chief Executive Officer (January 2009-December 2012) and Director of the Sub-Adviser (since January 2009); President of the Sub-Adviser (May 2009-December 2012); Management Director (since June 2009), President (since December 2009) and Chief Executive Officer (since January 2011) of Oppenheimer Acquisition Corp. (“OAC”) (the Sub-Adviser’s parent holding company); Director of Oppenheimer Real Asset Management, Inc. (since March 2010); Executive Vice President (March 2006-February 2009) and Chief Operating Officer (July 2007-February 2009) of Massachusetts Mutual Life Insurance Company (OAC’s parent company); Director (May 2004-March 2006) and Chief Operating Officer and Chief Compliance Officer (May 2004-January 2005), President (January 2005-March 2006) and Chief Executive Officer (June 2005-March 2006) of Babson Capital Management LLC; Director (March 2005-March 2006), President (May 2003-March 2006) and Chief Compliance Officer (July 2005-March 2006) of Babson Capital Securities, Inc. (a broker-dealer); President (May 2003-March 2006) of Babson Investment Company, Inc.; Director (May 2004-August 2006) of Babson Capital Europe Limited; Director (May 2004-October 2006) of Babson Capital Guernsey Limited; Director (May 2004-March 2006) of Babson Capital Management LLC; Non-Executive Director (March 2005-March 2007) of Baring Asset Management Limited; Director (February 2005-June 2006) Baring Pension Trustees Limited; Director and Treasurer (December 2003-November 2006) of Charter Oak Capital Management, Inc.; Director (May 2006-September 2006) of C.M. Benefit Insurance Company; Director (May 2008-June 2009) and Executive Vice President (June 2007-July 2009) of C.M. Life Insurance Company; President (March 2006-May 2007) of MassMutual Assignment Company; Director (January 2005-December 2006), Deputy Chairman (March 2005-December 2006) and President (February 2005-March 2005) of MassMutual Holdings (Bermuda) Limited; Director (May 2008-June 2009) and Executive Vice President (June 2007-July 2009) of MML Bay State Life Insurance Company; Chief Executive Officer and President (April 2007-January 2009) of MML Distributors, LLC; and Chairman (March 2006-December 2008) and Chief Executive Officer (May 2007-December 2008) of MML Investors Services, Inc. An officer of 86 portfolios in the OppenheimerFunds complex. |
| OTHER OFFICERS OF THE FUND | | The addresses of the Officers in the chart below are as follows: for Messrs. Steinmetz, Memani, Welsh, Gabinet and Mss. Zervos and Nasta, Two World Financial Center, 225 Liberty Street, New York, New York 10281-1008, for Messrs. Welsh, Vandehey and Wixted, 6803 S. Tucson Way, Centennial, Colorado 80112-3924. Each Officer serves for an indefinite term or until his or her resignation, retirement, death or removal. |
| |
Arthur P. Steinmetz, Vice President
(since 1993) Age: 54 | | Chief Investment Officer of OppenheimerFunds (since January 2013); Executive Vice President and Director of the Manager (since January 2013); Chief Investment Officer of the Sub-Adviser (October 2010-December 2012), Chief Investment Officer of Fixed-Income Investments of the Sub-Adviser (April 2009-October 2010) and Executive Vice President of the Sub-Adviser (from October 2009-December 2012). He was a Senior Vice President of the Sub-Adviser (March 1993-September 2009) and Director of Fixed-Income Investments of the Sub-Adviser (January 2009-April 2009). A portfolio manager and an officer of 5 portfolios in the OppenheimerFunds complex. |
| |
Krishna Memani, Vice President
(since 2009) Age: 52 | | President of the Sub-Adviser (since January 2013); Chief Investment Officer, Fixed Income of the Sub-Adviser (since January 2013) and Head of the Investment Grade Fixed Income Team of the Sub-Adviser (since March 2009). Director of Fixed Income of the Sub-Adviser (October 2010-December 2012) and Senior Vice President (March 2009-December 2012). Mr. Memani was a Managing Director and Head of the U.S. and European Credit Analyst Team at Deutsche Bank Securities (June 2006-January 2009). He was the Chief Credit Strategist at Credit Suisse Securities (August 2002-March 2006). He was a Managing Director and Senior Portfolio Manager at Putnam Investments (September 1998-June 2002). A portfolio manager and an officer of 14 portfolios in the OppenheimerFunds complex. |
| |
Joseph Welsh, Vice President
(since 2009) Age: 48 | | Head of the Sub-Adviser’s High Yield Corporate Debt Team (since April 2009); Senior Vice President of the Sub-Adviser (since May 2009); Vice President of the Sub-Adviser (December 2000-April 2009); Assistant Vice President of the Sub-Adviser (December 1996-November 2000); a high yield bond analyst of the Sub-Adviser (January 1995-December 1996); a CFA. A portfolio manager and officer of 5 portfolios in the OppenheimerFunds complex. |
| | | | |
| 93 | | | | OPPENHEIMER GLOBAL STRATEGIC INCOME FUND/VA |
TRUSTEES AND OFFICERS Continued
| | |
Sara J. Zervos, Ph.D., Vice President (since 2010) Age: 43 | | Head of the Global Debt Team (since October 2010); Senior Vice President of the Sub-Adviser (since January 2011); Vice President of the Sub-Adviser (April 2008-December 2010). Prior to joining the Sub-Adviser, a portfolio manager with Sailfish Capital Management (May 2007-February 2008) and a portfolio manager for emerging market debt at Dillon Read Capital Management and OTA Asset Management (June 2004-April 2007). A portfolio manager and officer of 4 portfolios in the OppenheimerFunds complex. |
| |
Arthur S. Gabinet, Secretary and
Chief Legal Officer
(since 2011) Age: 54 | | General Counsel of OppenheimerFunds (since January 2013); Executive Vice President, Secretary and General Counsel of the Manager (since January 2013); General Counsel OFI SteelPath, Inc. (since January 2013); Executive Vice President (May 2010-December 2012) and General Counsel (since January 2011) of the Sub-Adviser; General Counsel of the Distributor (since January 2011); General Counsel of Centennial Asset Management Corporation (January 2011-December 2012); Executive Vice President (January 2011-December 2012) and General Counsel of HarbourView Asset Management Corporation (since January 2011); Assistant Secretary (since January 2011) and Director (since January 2011) of OppenheimerFunds International Ltd. and OppenheimerFunds plc; Director of Oppenheimer Real Asset Management, Inc. (January 2011-December 2012) and General Counsel (since January 2011); Executive Vice President (January 2011-December 2011) and General Counsel of Shareholder Financial Services, Inc. and Shareholder Services, Inc. (since January 2011); Executive Vice President (January 2011-December 2012) and General Counsel of OFI Private Investments Inc. (since January 2011); Vice President of OppenheimerFunds Legacy Program (January 2011-December 2011); Executive Vice President (January 2011-December 2012) and General Counsel of OFI Institutional Asset Management, Inc. (since January 2011); General Counsel, Asset Management of the Sub-Adviser (May 2010-December 2010); Principal, The Vanguard Group (November 2005-April 2010); District Administrator, U.S. Securities and Exchange Commission (January 2003-October 2005). An officer of 86 portfolios in the OppenheimerFunds complex. |
| |
Christina M. Nasta, Vice President and
Chief Business Officer (since 2011) Age: 39 | | Senior Vice President of OppenheimerFunds Distributor, Inc. (since January 2013); Senior Vice President of the Sub-Adviser (July 2010-December 2012); Vice President of the Sub-Adviser (January 2003-July 2010); Vice President of OppenheimerFunds Distributor, Inc. (January 2003-July 2010). An officer of 86 portfolios in the OppenheimerFunds complex. |
| |
Mark S. Vandehey, Vice President and
Chief Compliance Officer (since 2004) Age: 62 | | Chief Compliance Officer of OppenheimerFunds (since January 2013); Senior Vice President and Chief Compliance Officer of the Manager (since January 2013); Chief Compliance Officer of OFI SteelPath, Inc. (since January 2013); Senior Vice President of the Sub-Adviser (March 2004-December 2012); Chief Compliance Officer of the Sub-Adviser, OppenheimerFunds Distributor, Inc., OFI Trust Company, OFI Institutional Asset Management, Inc., Oppenheimer Real Asset Management, Inc., OFI Private Investments, Inc., Harborview Asset Management Corporation, Trinity Investment Management Corporation, and Shareholder Services, Inc. (since March 2004); Vice President of OppenheimerFunds Distributor, Inc., Centennial Asset Management Corporation and Shareholder Services, Inc. (June 1983-December 2012). An officer of 86 portfolios in the OppenheimerFunds complex. |
| |
Brian W. Wixted, Treasurer and Principal Financial & Accounting Officer (since 1999) Age: 53 | | Senior Vice President of the Manager (since January 2013); Treasurer of the Sub-Adviser, HarbourView Asset Management Corporation, Shareholder Financial Services, Inc., Shareholder Services, Inc., and Oppenheimer Real Asset Management, Inc. (March 1999-June 2008), OFI Private Investments, Inc. (March 2000-June 2008), OppenheimerFunds International Ltd. and OppenheimerFunds plc (since May 2000), OFI Institutional Asset Management, Inc. (November 2000-June 2008), and OppenheimerFunds Legacy Program (charitable trust program established by the Sub-Adviser) (June 2003-December 2011); Treasurer and Chief Financial Officer of OFI Trust Company (since May 2000); Assistant Treasurer of Oppenheimer Acquisition Corporation (March 1999-June 2008). An officer of 86 portfolios in the OppenheimerFunds complex. |
The Fund’s Statement of Additional Information contains additional information about the Fund’s Trustees and Officers and is available without charge, upon request, by calling 1.800.988.8287.
| | | | |
| 94 | | | | OPPENHEIMER GLOBAL STRATEGIC INCOME FUND/VA |
| | | | |
| 95 | | | | OPPENHEIMER GLOBAL STRATEGIC INCOME FUND/VA |
OPPENHEIMER GLOBAL STRATEGIC INCOME FUND/VA (CAYMAN) LTD.
STATEMENT OF ASSETS AND LIABILITIES December 31, 2012
| | | | |
| Assets | | | |
| Cash | | $
| 1,455,203
|
|
| Total assets | | | 1,455,203 | |
| Liabilities | | | |
| Payables and other liabilities: | | | | |
| Auditing and other professional fees | | | 19,425 | |
| Other | |
| 811
|
|
| Total liabilities | | | 20,236 | |
| Net Assets | | $
| 1,434,967
|
|
| Composition of Net Assets | | | | |
| Par value of shares of beneficial interest | | $ | 150 | |
| Additional paid-in capital | | | 1,499,850 | |
| Accumulated net investment loss | |
| (65,033
| )
|
| Net Assets—applicable to 15,000 shares of beneficial interest outstanding | | $
| 1,434,967
|
|
| Net Asset Value, Redemption Price Per Share and Offering Price Per Share | | $ | 95.66 | |
See accompanying Notes to Financial Statements.
| | | | |
| 96 | | | | OPPENHEIMER GLOBAL STRATEGIC INCOME FUND/VA |
OPPENHEIMER GLOBAL STRATEGIC INCOME FUND/VA (CAYMAN) LTD.
STATEMENT OF OPERATIONS For the Year Ended December 31, 2012
| | | | |
| Expenses | | | |
| Management fees | | $ | 10,926 | |
| Legal, auditing and other professional fees | | | 20,491 | |
| Trustees’ compensation | | | 12,500 | |
| Custodian fees and expenses | | | 3,235 | |
| Other | |
| 400
|
|
| Total expenses | | | 47,552 | |
| Net Investment Loss | | | (47,552 | ) |
| Net Decrease in Net Assets Resulting from Operations | | $
| (47,552
| )
|
See accompanying Notes to Financial Statements.
| | | | |
| 97 | | | | OPPENHEIMER GLOBAL STRATEGIC INCOME FUND/VA |
OPPENHEIMER GLOBAL STRATEGIC INCOME FUND/VA (CAYMAN) LTD.
STATEMENTS OF CHANGES IN NET ASSETS
| | | | | | | | |
| | | Year Ended
December 31,
2012 | | | Period Ended
December 30,
20111,2 | |
| Operations | | | | | | |
| Net investment loss | | $ | (47,552 | ) | | $ | (17,481 | ) |
| Net decrease in net assets resulting from operations | | | (47,552 | ) | | | (17,481 | ) |
| Capital Transactions | | | | | | |
| Net increase in net assets resulting from capital transactions | | | — | | | | 1,500,000 | |
| Net Assets | | | | | | |
| Total increase (decrease) | | | (47,552 | ) | | | 1,482,519 | |
| Beginning of period | |
| 1,482,519
|
| |
| —
|
|
| End of period (including accumulated net investment loss of $65,033 and $17,481, respectively) | | $
| 1,434,967
|
| | $
| 1,482,519
|
|
1. December 30, 2011 represents the last business day of the Fund’s 2011 fiscal year. See Note 1 of the accompanying Notes.
2. For the period from November 21, 2011 (commencement of operations) to December 30, 2011.
See accompanying Notes to Financial Statements.
| | | | |
| 98 | | | | OPPENHEIMER GLOBAL STRATEGIC INCOME FUND/VA |
OPPENHEIMER GLOBAL STRATEGIC INCOME FUND/VA (CAYMAN) LTD.
NOTES TO FINANCIAL STATEMENTS
1. Significant Accounting Policies
Oppenheimer Global Strategic Income Fund/VA (Cayman) Ltd. (the “Fund”) is organized as a Cayman Islands Company Limited by Shares. The Fund intends to carry on the business of an investment company and to acquire, invest in and hold by way of investment, sell and deal primarily in commodity-linked derivatives (including commodity futures, financial futures, options and swap contracts) and exchange traded funds (“ETF”). The Fund’s investment adviser is OppenheimerFunds, Inc. (the “Manager”). The Sub-Adviser is Oppenheimer Real Asset Management, Inc. (“ORAMI” or the “Sub-Adviser”), a wholly-owned subsidiary of the Manager. As of December 31, 2012, 100% of the Fund was owned by Oppenheimer Global Strategic Income Fund/VA (“OGSIFVA”). The Manager is also the investment adviser of OGSIFVA.
The beneficial interest of each investor in the Fund is represented by units of participating shares. The Fund’s directors may further designate classes of participating shares and series within each class. As of December 31, 2012, the directors have not designated classes or series of outstanding participating shares. During the year ended December 31, 2012, all income, profits, losses and expenses, if any, of the Fund were allocated pro rata to all participating shares of the Fund. Issuance of additional participating shares is at the discretion of the Fund’s directors.
The following is a summary of significant accounting policies consistently followed by the Fund.
Previous Annual Period. The last day of the Fund’s fiscal year was the last day the New York Stock Exchange was open for trading. The Fund’s financial statements have been presented through that date to maintain consistency with the Fund’s net asset value calculations used for shareholder transactions.
Income Taxes. The Fund has received an undertaking from the Government of the Cayman Islands exempting it from all local income, profits and capital gains taxes through September of 2030. No such taxes are levied in the Cayman Islands at the present time. The Fund is a Controlled Foreign Corporation under U.S. tax laws and as such is not subject to U.S. income tax. Therefore, the Fund is not required to record a tax provision.
Dividends and Distributions to Shareholders. Dividends and distributions to shareholders, if any, are declared and paid annually from the Fund’s tax basis earnings and profits. Distributions are recorded on ex-dividend date.
Investment Income. Dividend income is recorded on the ex-dividend date or upon ex-dividend notification in the case of certain foreign dividends where the ex-dividend date may have passed. Non-cash dividends included in dividend income, if any, are recorded at the fair market value of the securities received. Interest income is recognized on an accrual basis. Discount and premium, which are included in interest income on the Statement of Operations, are amortized or accreted daily.
Custodian Fees. “Custodian fees and expenses” in the Statement of Operations may include interest expense incurred by the Fund on any cash overdrafts of its custodian account during the period. Such cash overdrafts may result from the effects of failed trades in portfolio securities and from cash outflows resulting from unanticipated shareholder redemption activity. The Fund pays interest to its custodian on such cash overdrafts, to the extent they are not offset by positive cash balances maintained by the Fund, at a rate equal to the Federal Funds Rate plus 0.50%. The “Reduction to custodian expenses” line item, if applicable, represents earnings on cash balances maintained by the Fund during the period. Such interest expense and other custodian fees may be paid with these earnings.
Security Transactions. Security transactions are recorded on the trade date. Realized gains and losses on securities sold are determined on the basis of identified cost.
Indemnifications. The Fund’s organizational documents provide current and former trustees and officers with a limited indemnification against liabilities arising in connection with the performance of their duties to the Fund. In the normal course of business, the Fund may also enter into contracts that provide general indemnifications. The Fund’s maximum
| | | | |
| 99 | | | | OPPENHEIMER GLOBAL STRATEGIC INCOME FUND/VA |
OPPENHEIMER GLOBAL STRATEGIC INCOME FUND/VA (CAYMAN) LTD.
NOTES TO FINANCIAL STATEMENTS Continued
1. Significant Accounting Policies Continued
exposure under these arrangements is unknown as this would be dependent on future claims that may be made against the Fund. The risk of material loss from such claims is considered remote.
Other. The preparation of financial statements in conformity with accounting principles generally accepted in the United States of America requires management to make estimates and assumptions that affect the reported amounts of assets and liabilities and disclosure of contingent assets and liabilities at the date of the financial statements and the reported amounts of increases and decreases in net assets from operations during the reporting period. Actual results could differ from those estimates.
2. Capital Transactions
The Fund has authorized 5,000,000 participating shares of $0.01 par value per share. The Fund issued 15,000 participating shares for $1,500,000 on November 21, 2011 in conjunction with OGSIFVA’s initial capitalization of the Fund. All subsequent capital contributions and withdrawals did not have participating shares associated with the transaction.
Capital transactions were as follows:
| | | | | | | | |
| | | Year Ended
December 31, 2012 | | | Period Ended
December 30, 20111 | |
| | | Amount | | | Amount | |
Contributions | | $ | — | | | $ | 1,500,000 | |
Withdrawals | | | — | | | | — | |
| | |
|
|
| |
|
|
|
| Net increase | | $ | — | | | $ | 1,500,000 | |
| | |
|
|
| |
|
|
|
1. For the period from November 21, 2011 (commencement of operations) to December 30, 2011.
3. Expenses
Management Fees. Under the investment advisory agreement, the Fund pays the Manager a management fee based on the daily net assets of the Fund at an annual rate as shown in the following table:
| | | | |
| Fee Schedule | | | |
| Up to $200 million | | | 0.75 | % |
| Next $200 million | | | 0.72 | |
| Next $200 million | | | 0.69 | |
| Next $200 million | | | 0.66 | |
| Next $200 million | | | 0.60 | |
| Over $1 billion | | | 0.50 | |
Sub-Adviser Fees. The Manager retains the Sub-Adviser to provide the day-to-day portfolio management of the Fund. Under the Sub-Advisory Agreement, the Manager pays the Sub-Adviser a fee in monthly installments, based on the daily net assets of the Fund at an annual rate as shown in the following table:
| | | | |
| Fee Schedule | | | |
| Up to $200 million | | | 0.375 | % |
| Next $200 million | | | 0.360 | |
| Next $200 million | | | 0.345 | |
| Next $200 million | | | 0.330 | |
| Next $200 million | | | 0.300 | |
| Over $1 billion | | | 0.250 | |
The Fund shall bear all fees and expenses related to the business and affairs of the Fund, including among others, directors’ fees, audit fees, custodian fees and expenses in connection with the purchase and sale of securities and other Fund assets.
| | | | |
| 100 | | | | OPPENHEIMER GLOBAL STRATEGIC INCOME FUND/VA |
4. Financial Highlights
The following represents certain financial ratios of the Fund for the periods noted. The computation of the net investment income and total expense ratios was based upon the daily net assets of the Fund during these periods. Unless otherwise noted, the calculations have been annualized for reporting purposes:
| | | | | | | | |
| | | Year Ended
December 31, 2012 | | | Period Ended
December 30, 20111 | |
| | | | | | | | | |
| Per Share Operating Data | | | | | | | | |
| Net asset value, beginning of period | | $ | 98.83 | | | $ | 100.00 | |
| Income (loss) from investment operations: | | | | | | | | |
| Net investment loss | | | (3.17 | ) | | | (1.17 | ) |
| Capital Transactions | | | — | | | | — | |
| Net asset value, end of period | | $
| 95.66
|
| | $
| 98.83
|
|
| Total Return, at Net Asset Value2 | | | (3.21 | )% | | | (1.17 | )% |
| Ratios to Average Net Assets: | | | | | | | | |
| Net investment loss | | | (3.26 | )% | | | (10.44 | )% |
| Total expenses | | | 3.26 | % | | | 10.44 | % |
1. For the period from November 21, 2011 (commencement of operations) through December 30, 2011.
2. The total return was calculated based upon the daily returns of the Fund during this period. The calculation has not been annualized for reporting purposes.
5. Subsequent Event
The Board of Trustees of the Fund recently approved a series of modifications to the Fund’s investment advisory and transfer agency arrangements in connection with internal corporate restructuring efforts at OppenheimerFunds, Inc. (“OFI”). As a result of these modifications, on January 1, 2013 (the “Effective Date”), OFI Global Asset Management, Inc. (“OFI Global”), a wholly-owned subsidiary of OFI, became the investment adviser and transfer agent to the Fund under the terms of the Fund’s advisory agreement and transfer agency agreement, respectively. OFI Global, in turn, entered into a new sub-advisory agreement for the Fund, on the Effective Date, whereby OFI Global will have oversight and supervisory responsibilities and OFI will choose the Fund’s investments and provide related advisory services to the Fund. In addition, on the Effective Date, OFI Global entered into a sub-transfer agency agreement with Shareholder Services, Inc. doing business as OppenheimerFunds Services, a wholly-owned subsidiary of OFI, under which it will be responsible for providing transfer agency services to the Fund.
The realignment of advisory service responsibility between OFI Global and OFI did not result in any change in the persons managing the assets of the Fund, the level or nature of the advisory services provided to the Fund, or the fees charged to the Fund.
6. Pending Litigation
Since 2009, a number of class action lawsuits have been pending in federal courts against OppenheimerFunds, Inc., the Fund’s Adviser through December 31, 2012 and Sub-Adviser effective January 1, 2013 (the “Manager”), OppenheimerFunds Distributor, Inc., the Fund’s principal underwriter and distributor (the “Distributor”), and certain funds (but not including the Fund) advised by the Manager and distributed by the Distributor (the “Defendant Funds”). Several of these lawsuits also name as defendants certain officers and current and former trustees of the respective Defendant Funds. The lawsuits raise claims under federal securities law and allege, among other things, that the disclosure documents of the respective Defendant Funds contained misrepresentations and omissions and that the respective Defendant Funds’ investment policies were not followed. The plaintiffs in these actions seek unspecified
| | | | |
| 101 | | | | OPPENHEIMER GLOBAL STRATEGIC INCOME FUND/VA |
OPPENHEIMER GLOBAL STRATEGIC INCOME FUND/VA (CAYMAN) LTD.
NOTES TO FINANCIAL STATEMENTS Continued
6. Pending Litigation Continued
damages, equitable relief and awards of attorneys’ fees and litigation expenses. The Defendant Funds’ Boards of Trustees have also engaged counsel to represent the Funds and the present and former Independent Trustees named in those suits.
Other class action and individual lawsuits have been filed since 2008 in various state and federal courts against the Manager and certain of its affiliates by investors seeking to recover investments they allegedly lost as a result of the “Ponzi” scheme run by Bernard L. Madoff and his firm, Bernard L. Madoff Investment Securities, LLC (“BLMIS”). Plaintiffs in these suits allege that they suffered losses as a result of their investments in several funds managed by an affiliate of the Manager and assert a variety of claims, including breach of fiduciary duty, fraud, negligent misrepresentation, unjust enrichment, and violation of federal and state securities laws and regulations, among others. They seek unspecified damages, equitable relief and awards of attorneys’ fees and litigation expenses. Neither the Distributor, nor any of the Oppenheimer mutual funds, their independent trustees or directors are named as defendants in these lawsuits. None of the Oppenheimer mutual funds invested in any funds or accounts managed by Madoff or BLMIS. On February 28, 2011, a stipulation of partial settlement of three groups of consolidated putative class action lawsuits relating to these matters was filed in the U.S. District Court for the Southern District of New York. On August 19, 2011, the court entered an order and final judgment approving the settlement as fair, reasonable and adequate. In September 2011, certain parties filed notices of appeal from the court’s order approving the settlement. The settlement does not resolve other outstanding lawsuits against the Manager and its affiliates relating to BLMIS.
On April 16, 2010, a lawsuit was filed in New York state court against the Manager, an affiliate of the Manager and AAArdvark IV Funding Limited (“AAArdvark IV”), an entity advised by the Manager’s affiliate, in connection with investments made by the plaintiffs in AAArdvark IV. Plaintiffs allege breach of contract against the defendants and seek compensatory damages, costs and disbursements, including attorney fees. On July 15, 2011, a lawsuit was filed in New York state court against the Manager, an affiliate of the Manager and AAArdvark Funding Limited (“AAArdvark I”), an entity advised by the Manager’s affiliate, in connection with investments made by the plaintiffs in AAArdvark I. The complaint alleges breach of contract against the defendants and seeks compensatory damages, costs and disbursements, including attorney fees. On November 9, 2011, a lawsuit was filed in New York state court against the Manager, an affiliate of the Manager and AAArdvark XS Funding Limited (“AAArdvark XS”), an entity advised by the Manager’s affiliate, in connection with investments made by the plaintiffs in AAArdvark XS. The complaint alleges breach of contract against the defendants and seeks compensatory damages, costs and disbursements, including attorney fees.
The Manager believes the lawsuits and appeals described above are without legal merit and, with the exception of actions it has settled, is defending against them vigorously. While it is premature to render any opinion as to the outcome in these lawsuits, or whether any costs that the Defendant Funds may bear in defending the suits might not be reimbursed by insurance, the Manager believes that these suits should not impair the ability of the Manager or the Distributor to perform their respective duties to the Fund, and that the outcome of all of the suits together should not have any material effect on the operations of any of the Oppenheimer mutual funds.
| | | | |
| 102 | | | | OPPENHEIMER GLOBAL STRATEGIC INCOME FUND/VA |
OPPENHEIMER GLOBAL STRATEGIC INCOME FUND/VA (CAYMAN) LTD.
INDEPENDENT AUDITORS’ REPORT
The Board of Directors Oppenheimer Global Strategic Income Fund/VA (Cayman) Ltd.:
We have audited the accompanying financial statements of Oppenheimer Global Strategic Income Fund/VA (Cayman) Ltd., which comprise the statement of assets and liabilities, as of December 31, 2012, and the related statement of operations for the year then ended, the statements of changes in net assets and the financial highlights for the year then ended and for the period from November 21, 2011 (commencement of operations) to December 30, 2011, and the related notes to the financial statements.
Management’s Responsibility for the Financial Statements
Management is responsible for the preparation and fair presentation of these financial statements in accordance with U.S. generally accepted accounting principles; this includes the design, implementation, and maintenance of internal control relevant to the preparation and fair presentation of financial statements that are free from material misstatement, whether due to fraud or error.
Auditors’ Responsibility
Our responsibility is to express an opinion on these financial statements based on our audits. We conducted our audits in accordance with auditing standards generally accepted in the United States of America. Those standards require that we plan and perform the audit to obtain reasonable assurance about whether the financial statements are free from material misstatement.
An audit involves performing procedures to obtain audit evidence about the amounts and disclosures in the financial statements. The procedures selected depend on the auditors’ judgment, including the assessment of the risks of material misstatement of the financial statements, whether due to fraud or error. In making those risk assessments, the auditor considers internal control relevant to the entity’s preparation and fair presentation of the financial statements in order to design audit procedures that are appropriate in the circumstances, but not for the purpose of expressing an opinion on the effectiveness of the entity’s internal control. Accordingly, we express no such opinion. An audit also includes evaluating the appropriateness of accounting policies used and the reasonableness of significant accounting estimates made by management, as well as evaluating the overall presentation of the financial statements.
We believe that the audit evidence we have obtained is sufficient and appropriate to provide a basis for our audit opinion.
Opinion
In our opinion, the financial statements referred to above present fairly in all material respects, the financial position of Oppenheimer Global Strategic Income Fund/VA (Cayman) Ltd. as of December 31, 2012, the results of its operations for the year then ended, and the changes in its net assets and financial highlights for the year then ended and the period from November 21, 2011 (commencement of operations) to December 30, 2011, in accordance with U.S. generally accepted accounting principles.
KPMG LLP
Denver, Colorado
February 19, 2013
| | | | |
| 103 | | | | OPPENHEIMER GLOBAL STRATEGIC INCOME FUND/VA |
OPPENHEIMER GLOBAL STRATEGIC INCOME FUND/VA
| | |
| A Series of Oppenheimer Variable Account Funds |
| Manager | | OFI Global Asset Management, Inc. |
| Sub-Adviser | | OppenheimerFunds, Inc. |
| Distributor | | OppenheimerFunds Distributor, Inc. |
| Transfer and Shareholder Servicing Agent | | OFI Global Asset Management, Inc. |
| Sub-Transfer Agent | | Shareholder Services, Inc. DBA OppenheimerFunds Services |
| Independent Registered Public Accounting Firm | | KPMGLLP |
| Counsel | | K&L Gates LLP |
Before investing, investors should carefully consider a fund’s investment objectives, risks, charges and expenses. Fund prospectuses and summary prospectuses contain this and other information about the funds, and may be obtained by asking your financial advisor, or calling us at 1.800.988.8287. Read prospectuses and summary prospectuses carefully before investing.
| | |
| ©2013 OppenheimerFunds, Inc. All rights reserved. | | |
December 31, 2012
| | | | |
| | | |
| | | Oppenheimer Value Fund/VA A Series of Oppenheimer Variable Account Funds | | Annual Report |
ANNUAL REPORT
Listing of Top Holdings
Fund Performance Discussion
Financial Statements
OPPENHEIMER VALUE FUND/VA
Portfolio Manager: Mitch Williams, CFA
| | | | | | |
Average Annual Total Returns For the Periods Ended 12/31/12 |
| | | |
| | | 1-Year | | 5-Year | | Since Inception (1/2/03) |
| Non-Service Shares | | 16.08% | | 3.88% | | 8.61% |
| | | |
| | | 1-Year | | 5-Year | | Since Inception (9/18/06) |
| Service Shares | | 13.09% | | –0.82% | | 1.29% |
The performance data quoted represents past performance, which does not guarantee future results. The investment return and principal value of an investment in the Fund will fluctuate so that an investor’s shares, when redeemed, may be worth more or less than their original cost. Current performance may be lower or higher than the performance quoted. For performance data current to the most recent month end, call us at 1.800.988.8287. The Fund’s total returns should not be expected to be the same as the returns of other funds, whether or not both funds have the same portfolio managers and/or similar names. The Fund’s total returns include changes in share price and reinvested distributions but do not include the charges associated with the separate account products that offer this Fund. Such performance would have been lower if such charges were taken into account.
| | | | |
| Top Ten Common Stock Holdings | | | |
| Chevron Corp. | | | 5.7 | % |
| Humana, Inc. | | | 4.9 | |
| Honeywell International, Inc. | | | 3.6 | |
| Merck & Co., Inc. | | | 3.4 | |
| Exxon Mobil Corp. | | | 3.3 | |
| Marsh & McLennan Cos., Inc. | | | 3.2 | |
| Wells Fargo & Co. | | | 3.2 | |
| Verizon Communications, Inc. | | | 3.1 | |
| Lowe’s Cos., Inc. | | | 2.9 | |
| Target Corp. | | | 2.9 | |
Portfolio holdings and allocations are subject to change. Percentages are as of December 31, 2012, and are based on net assets.
|
Sector Allocation 
|
Portfolio holdings and allocations are subject to change. Percentages are as of December 31, 2012, and are based on the total market value of common stocks.
| | | | |
| 2 | | | | OPPENHEIMER VALUE FUND/VA |
FUND PERFORMANCE DISCUSSION
During the reporting period, the Fund’s Non-Service shares produced a return of 16.08%. In comparison, the Fund underperformed the Russell 1000 Value Index (the “Index”), which returned 17.51%. The Fund underperformed the Index primarily in the health care and energy sectors due to weaker relative stock selection. The Fund benefited from stronger performance in the consumer discretionary and financials sectors.
Economic and Market Environment
Domestic equities generally produced positive returns this period. The period began during a time of improved market sentiment in which the United States managed to avoid a return to recession and European policymakers appeared to take steps to address the region’s sovereign debt and banking sector crises. Renewed investor optimism helped produce gains in the U.S. equity market as well as across a number of international equity markets over the first three months of 2012. The rebound across equities gained momentum after the European Central Bank (the “ECB”) implemented dual Long-Term Refinancing Operations (“LTRO”) to enhance liquidity for troubled banks and reduce rates on newly issued sovereign debt securities.
The second quarter was more volatile for the equity markets. In the U.S., slower than expected first quarter growth contributed to a sell-off in the U.S. stock market. Consumer confidence dropped as U.S. unemployment figures ticked slightly upwards after showing signs of improvement from the recession highs. In addition, uncertainty around the November 2012 elections and the potential removal of a significant amount of government stimulus in the beginning of 2013, resulted in companies stalling spending and hiring, contributing to the economic slowdown. The reduction in growth outside of the U.S. also negatively impacted exports, which was exacerbated by a strengthening dollar. Outside of the U.S., the fear of contagion from the worsening European sovereign debt crisis and a recession across much of Europe also resulted in increased market volatility.
In the second half of the period, the equity markets generally resumed an upward trend despite ongoing concerns. In the U.S., the Fed introduced QE3, under which it announced plans to purchase mortgage-backed bonds on a monthly basis until the labor market shows signs of substantial improvement. Equities in the U.S. were also bolstered by the continued improvement of the housing market. However, the market did experience volatility due to uncertainty over the outcome of the Presidential election. In addition, the lack of visibility about resolution of the “fiscal cliff” weighed further on both business and consumer spending. These concerns were not enough to offset earlier gains, and immediately following the close of the period, the U.S. Congress enacted a last minute temporary resolution to the fiscal cliff.
Outside of the U.S., the results of elections in Greece and continued efforts by European policymakers to stabilize the situation in the region made far less likely the imminent fracturing of the Eurozone and the serious consequences that might have for the euro. The ECB also increased its efforts to stimulate economic growth, as it committed to potentially unlimited bond purchases to ease financing pressure on countries like Spain and Italy. Under the plan, these and other members of the European Union (excluding Greece) would be able to maintain access to funding at sustainable interest rates, on the condition that they continue with strict reform programs.
Top Individual Contributors
During the period, four of the top five performing stocks for the Fund were within the financials sector. Following several moves by the Fed to help spur growth, bank stocks generally rallied during the period and financials was among the top performing index sectors. Bank stocks benefited as tier one capital ratios improved faster than expected, the housing market continued to improve and mortgage-related headline risk decreased. The Goldman Sachs Group, Inc., Wells Fargo & Co., JPMorgan Chase & Co. and U.S. Bancorp all were top performers for the Fund.
Goldman showed strong revenue and earnings results and beat analysts’ estimates. The bank’s investments in stock and bond securities and its trading in mortgage products benefited results. Wells Fargo saw growth in different segments including auto, credit card and private student lending while reducing expenses. With a large exposure to mortgages, Wells Fargo was also the beneficiary of an improving housing market. JPMorgan’s share price was driven higher by market expectations it too would benefit from the general rise in home prices and increases in both existing home sales and new housing starts. Also, management re-instated its aggressive share repurchase program after it was suspended in response to the trading debacle earlier in the year. As a consequence, earnings revisions have been on an upward trajectory, helping to buoy the stock price higher. U.S. Bancorp had a higher credit quality than many of its peers in part due to its limited international exposure and well-capitalized balance sheet. We exited our position in the stock by period end.
Also contributing to performance was consumer discretionary stock Comcast Corp. The cable provider’s high-speed Internet subscriptions increased during the period, which contributed to a positive earnings surprise. Additionally, Comcast aggressively repurchased shares and substantially increased its dividend.
Top Individual Detractors
The top detractors from Fund performance included Navistar International Corp., Humana, Inc., The PNC Financial Services Group, Inc. and Penn West Petroleum Ltd. Navistar, which we established a position in this period, is a manufacturer of commercial and military trucks. The stock was negatively impacted by higher costs and declining share in the Heavy Duty Class 8 truck market as it seeks to comply with new emissions rules for certain engines. Humana, Inc. detracted from results as the managed health care company reported a decrease in profit in its first quarter, breaking a streak of four straight profit increases. The PNC Financial Services Group was a new position established by the Fund and experienced some near-term volatile performance at the outset. Penn West, an oil and gas exploration and production company struggled during the period as the fluctuating price of oil during the period resulted in volatility in the commodities markets, putting pressure on energy stocks. We exited our position in Penn West by period end.
| | | | |
| 3 | | | | OPPENHEIMER VALUE FUND/VA |
FUND PERFORMANCE DISCUSSION
Investors should consider the Fund’s investment objective, risks, charges and expenses carefully before investing. The Fund’s prospectus and summary prospectus contain this and other information about the Fund, and may be obtained by asking your financial advisor or calling us at 1.800.988.8287. Read prospectuses and summary prospectuses carefully before investing.
Total returns include changes in share price and reinvestment of dividends and capital gains distributions in a hypothetical investment for the periods shown.
The Fund’s investment strategy and focus can change over time. The mention of specific fund holdings does not constitute a recommendation by OppenheimerFunds, Inc. or its affiliates.
Shares of Oppenheimer funds are not deposits or obligations of any bank, are not guaranteed by any bank, are not insured by the FDIC or any other agency, and involve investment risks, including the possible loss of the principal amount invested.
Comparing the Fund’s Performance to the Market. The graphs that follow show the performance of a hypothetical $10,000 investment in each share class of the Fund held until December 31, 2012. In the case of Non-Service shares, performance is measured from inception of the Class on January 2, 2003. In the case of Service shares, performance is measured from inception of the Class on September 18, 2006. Performance information does not reflect charges that apply to separate accounts investing in the Fund. If these charges were taken into account, performance would be lower. The graphs assume that all dividends and capital gains distributions were reinvested in additional shares.
The Fund’s performance is compared to the performance of the Russell 1000 Value Index, an index of equity securities of large capitalization value companies. The Index is unmanaged and cannot be purchased directly by investors. Index performance is shown for illustrative purposes only and does not predict or depict the performance of the Fund. While index comparisons may be useful to provide a benchmark for the Fund’s performance, it must be noted that the Fund’s investments are not limited to the investments comprising the Index.
| | | | |
| 4 | | | | OPPENHEIMER VALUE FUND/VA |
OPPENHEIMER BALANCED FUND/VA
Non-Service Shares
Comparison of Change in Value of $10,000 Hypothetical Investments in:
Average Annual Total Returns of Non-Service Shares of the Fund at 12/31/12
| | | | | | | | | | |
| 1-Year | | 16.08% | | 5-Year | | 3.88% | | Since Inception (1/2/03) | | 8.61% |
Service Shares
Comparison of Change in Value of $10,000 Hypothetical Investments in:
Average Annual Total Returns of Service Shares of the Fund at 12/31/12
| | | | | | | | | | |
| 1-Year | | 13.09% | | 5-Year | | -0.82% | | Since Inception (9/18/06) | | 1.29% |
The performance data quoted represents past performance, which does not guarantee future results. The investment return and principal value of an investment in the Fund will fluctuate so that an investor’s shares, when redeemed, may be worth more or less than their original cost. Current performance may be lower or higher than the performance quoted. For performance data current to the most recent month end, call us at 1.800.988.8287. The Fund’s total returns should not be expected to be the same as the returns of other funds, whether or not both funds have the same portfolio managers and/or similar names. The Fund’s total returns include changes in share price and reinvested distributions but do not include the charges associated with the separate account products that offer this Fund. Such performance would have been lower if such charges were taken into account.
| | | | |
| 5 | | | | OPPENHEIMER VALUE FUND/VA |
FUND EXPENSES
Fund Expenses. As a shareholder of the Fund, you incur two types of costs: (1) transaction costs and (2) ongoing costs, including management fees; distribution and service fees; and other Fund expenses. These examples are intended to help you understand your ongoing costs (in dollars) of investing in the Fund and to compare these costs with the ongoing costs of investing in other mutual funds.
The examples are based on an investment of $1,000.00 invested at the beginning of the period and held for the entire 6-month period ended December 31, 2012.
Actual Expenses. The first section of the table provides information about actual account values and actual expenses. You may use the information in this section for the class of shares you hold, together with the amount you invested, to estimate the expense that you paid over the period. Simply divide your account value by $1,000.00 (for example, an $8,600.00 account value divided by $1,000.00 = 8.60), then multiply the result by the number in the first section under the heading entitled “Expenses Paid During Period” to estimate the expenses you paid on your account during this period.
Hypothetical Example for Comparison Purposes. The second section of the table provides information about hypothetical account values and hypothetical expenses based on the Fund’s actual expense ratio for each class of shares, and an assumed rate of return of 5% per year for each class before expenses, which is not the actual return. The hypothetical account values and expenses may not be used to estimate the actual ending account balance or expenses you paid for the period. You may use this information to compare the ongoing costs of investing in the Fund and other funds. To do so, compare this 5% hypothetical example for the class of shares you hold with the 5% hypothetical examples that appear in the shareholder reports of the other funds.
Please note that the expenses shown in the table are meant to highlight your ongoing costs only and do not reflect any charges associated with the separate accounts that offer this Fund. Therefore, the “hypothetical” lines of the table are useful in comparing ongoing costs only, and will not help you determine the relative total costs of owning different funds. In addition, if these separate account charges were included your costs would have been higher.
| | | | | | | | | | | | |
| Actual | | Beginning Account Value July 1, 2012 | | | Ending Account Value December 31, 2012 | | | Expenses Paid During 6 Months Ended December 31, 2012 | |
| Non-Service shares | | $ | 1,000.00 | | | $ | 1,098.40 | | | $ | 4.17 | |
| Service shares | | | 1,000.00 | | | | 1,083.00 | | | | 5.46 | |
| | | |
Hypothetical 5% return before expenses) | | | | | | | | | |
| Non-Service shares | | | 1,000.00 | | | | 1,021.17 | | | | 4.02 | |
| Service shares | | | 1,000.00 | | | | 1,019.91 | | | | 5.29 | |
Expenses are equal to the Fund’s annualized expense ratio for that class, multiplied by the average account value over the period, multiplied by 184/366 (to reflect the one-half year period). Those annualized expense ratios, excluding indirect expenses from affiliated funds, based on the 6-month period ended December 31, 2012 are as follows:
| | | | |
| Class | | Expense Ratios | |
| Class Non-Service | | | 0.79 | % |
| Class Service | | | 1.04 | |
The expense ratios reflect voluntary waivers and/or reimbursements of expenses by the Fund’s Manager. Some of these undertakings may be modified or terminated at any time, as indicated in the Fund’s prospectus. The “Financial Highlights” tables in the Fund’s financial statements, included in this report, also show the gross expense ratios, without such waivers or reimbursements and reduction to custodian expenses, if applicable.
| | | | |
| 6 | | | | OPPENHEIMER VALUE FUND/VA |
STATEMENT OF INVESTMENTS December 31, 2012
| | | | | | | | |
| | |
Shares | | | Value | |
| | | | | | | | | |
| Common Stocks—99.5% | | | | | | | | |
| Consumer Discretionary—9.2% | |
| Automobiles—1.9% | | | | | | | | |
| Ford Motor Co. | | | 10,530 | | | $ | 136,363 | |
| Media—1.5% | | | | | | | | |
| Comcast Corp., Cl. A | | | 3,000 | | | | 112,140 | |
| Multiline Retail—2.9% | | | | | | | | |
| Target Corp. | | | 3,400 | | | | 201,178 | |
| Specialty Retail—2.9% | | | | | | | | |
| Lowe’s Cos., Inc. | | | 5,670 | | | | 201,398 | |
| Consumer Staples—9.7% | | | | | | | | |
| Beverages—3.6% | | | | | | | | |
| Coca-Cola Co. (The) | | | 2,020 | | | | 73,225 | |
Molson Coors Brewing Co., Cl. B,
Non-Vtg. | | | 2,570 | | | | 109,970 | |
| PepsiCo, Inc. | | | 1,020 | | | | 69,799 | |
| | | | | | |
|
|
|
| | | | | | | | 252,994 | |
| Food & Staples Retailing—2.5% | | | | | | | | |
| Walgreen Co. | | | 4,710 | | | | 174,317 | |
| Food Products—2.6% | | | | | | | | |
| Kellogg Co. | | | 3,340 | | | | 186,539 | |
| Household Products—1.0% | | | | | | | | |
| Procter & Gamble Co. (The) | | | 1,090 | | | | 74,000 | |
| Energy—12.1% | |
| Energy Equipment & Services—1.6% | | | | | |
| Baker Hughes, Inc. | | | 2,710 | | | | 110,676 | |
| Oil, Gas & Consumable Fuels—10.5% | | | | | |
| Apache Corp. | | | 720 | | | | 56,520 | |
| Chevron Corp. | | | 3,710 | | | | 401,199 | |
| Devon Energy Corp. | | | 940 | | | | 48,918 | |
| Exxon Mobil Corp. | | | 2,704 | | | | 234,031 | |
| | | | | | |
|
|
|
| | | | | | | | 740,668 | |
| Financials—23.1% | | | | | | | | |
| Capital Markets—2.4% | | | | | | | | |
| Goldman Sachs Group, Inc. (The) | | | 1,310 | | | | 167,104 | |
| Commercial Banks—9.1% | | | | | | | | |
| M&T Bank Corp. | | | 1,730 | | | | 170,353 | |
| PNC Financial Services Group, Inc. | | | 1,260 | | | | 73,471 | |
| SunTrust Banks, Inc. | | | 6,120 | | | | 173,502 | |
| Wells Fargo & Co. | | | 6,620 | | | | 226,272 | |
| | | | | | |
|
|
|
| | | | | | | | 643,598 | |
| Diversified Financial Services—3.3% | | | | | |
| Bank of America Corp. | | | 7,420 | | | | 86,072 | |
| Citigroup, Inc. | | | 930 | | | | 36,791 | |
| JPMorgan Chase & Co. | | | 2,600 | | | | 114,322 | |
| | | | | | |
|
|
|
| | | | | | | | 237,185 | |
| Insurance—8.3% | | | | | | | | |
| ACE Ltd. | | | 2,490 | | | | 198,702 | |
| Marsh & McLennan Cos., Inc. | | | 6,610 | | | | 227,847 | |
| MetLife, Inc. | | | 2,170 | | | | 71,480 | |
| Travelers Cos., Inc. (The) | | | 1,320 | | | | 94,802 | |
| | | | | | |
|
|
|
| | | | | | | | 592,831 | |
| Health Care—15.2% | | | | | | | | |
| Health Care Equipment & Supplies—2.1% | |
| Baxter International, Inc. | | | 2,230 | | | | 148,652 | |
| Health Care Providers & Services—7.7% | |
| Humana, Inc. | | | 5,000 | | | | 343,150 | |
| UnitedHealth Group, Inc. | | | 3,620 | | | | 196,349 | |
| | | | | | |
|
|
|
| | | | | | | | 539,499 | |
| Pharmaceuticals—5.4% | | | | | | | | |
| Merck & Co., Inc. | | | 5,910 | | | | 241,955 | |
| Teva Pharmaceutical Industries Ltd., Sponsored ADR | | | 3,800 | | | | 141,892 | |
| | | | | | |
|
|
|
| | | | | | | | 383,847 | |
| | | | | | | | |
| | |
Shares | | | Value | |
| | | | | | | | | |
| Industrials—9.9% | | | | | | | | |
| Aerospace & Defense—3.6% | | | | | | | | |
| Honeywell International, Inc. | | | 3,950 | | | $ | 250,706 | |
| Commercial Services & Supplies—1.2% | | | | | |
| Tyco International Ltd. | | | 2,830 | | | | 82,778 | |
| Construction & Engineering—1.6% | | | | | | | | |
| Quanta Services, Inc.1 | | | 4,040 | | | | 110,252 | |
| Machinery—2.6% | | | | | | | | |
| AGCO Corp.1 | | | 2,620 | | | | 128,694 | |
| Navistar International Corp.1 | | | 2,480 | | | | 53,990 | |
| | | | | | |
|
|
|
| | | | | | | | 182,684 | |
| Trading Companies & Distributors—0.9% | | | | | |
| AerCap Holdings NV1 | | | 4,450 | | | | 61,054 | |
| Information Technology—7.4% | | | | | | | | |
| Communications Equipment—2.5% | | | | | |
| Juniper Networks, Inc.1 | | | 8,820 | | | | 173,489 | |
| Computers & Peripherals—1.1% | | | | | | | | |
| Apple, Inc. | | | 140 | | | | 74,624 | |
| Electronic Equipment, Instruments, & Components—1.2% | |
| TE Connectivity Ltd. | | | 2,280 | | | | 84,634 | |
| Semiconductors & Semiconductor Equipment—2.6% | |
| Analog Devices, Inc. | | | 2,080 | | | | 87,485 | |
| Xilinx, Inc. | | | 2,770 | | | | 99,443 | |
| | | | | | |
|
|
|
| | | | | | | | 186,928 | |
| Materials—5.7% | | | | | | | | |
| Chemicals—4.3% | | | | | | | | |
| LyondellBasell Industries NV, Cl. A | | | 2,220 | | | | 126,740 | |
| Mosaic Co. (The) | | | 3,150 | | | | 178,384 | |
| | | | | | |
|
|
|
| | | | | | | | 305,124 | |
| Containers & Packaging—1.4% | | | | | | | | |
| Rock-Tenn Co., Cl. A | | | 1,390 | | | | 97,175 | |
| Telecommunication Services—3.8% | | | | | |
| Diversified Telecommunication Services—3.8% | |
| AT&T, Inc. | | | 1,432 | | | | 48,273 | |
| Verizon Communications, Inc. | | | 5,080 | | | | 219,812 | |
| | | | | | |
|
|
|
| | | | | | | | 268,085 | |
| Utilities—3.4% | | | | | | | | |
| Electric Utilities—2.5% | | | | | | | | |
| American Electric Power Co., Inc. | | | 2,280 | | | | 97,310 | |
| Edison International | | | 1,650 | | | | 74,563 | |
| | | | | | |
|
|
|
| | | | | | | | 171,873 | |
| Multi-Utilities—0.9% | | | | | | | | |
| Public Service Enterprise Group, Inc. | | | 2,100 | | | | 64,260 | |
| Total Common Stocks (Cost $6,242,367) | | | | 7,016,655 | |
| Investment Company—0.9% | | | | | | | | |
| Oppenheimer Institutional Money Market Fund, Cl. E, 0.15%2,3 | | | | | | | | |
| (Cost $60,104) | | | 60,104 | | | | 60,104 | |
Total Investments, at Value
(Cost $6,302,471) | | | 100.4 | % | | | 7,076,759 | |
| Liabilities in Excess of Other Assets | |
| (0.4)
|
| |
| (25,423
| )
|
| Net Assets | |
| 100.0
| %
| | $
| 7,051,336
|
|
| | | | |
| 7 | | | | OPPENHEIMER VALUE FUND/VA |
STATEMENT OF INVESTMENTS Continued
Footnotes to Statement of Investments
1. Non-income producing security.
2. Is or was an affiliate, as defined in the Investment Company Act of 1940, at or during the period ended December 31, 2012, by virtue of the Fund owning at least 5% of the voting securities of the issuer or as a result of the Fund and the issuer having the same investment adviser. Transactions during the period in which the issuer was an affiliate are as follows:
| | | | | | | | | | | | | | | | |
| | | Shares
December 30,
2011a | | | Gross
Additions | | | Gross
Reductions | | | Shares
December 31,
2012 | |
| Oppenheimer Institutional Money Market Fund, Cl. E | | | 374,186 | | | | 3,773,269 | | | | 4,087,351 | | | | 60,104 | |
| | | | |
| | | | | | | | | Value | | | Income | |
| Oppenheimer Institutional Money Market Fund, Cl. E | | | | | | | | | | $ | 60,104 | | | $ | 581 | |
a. December 30, 2011 represents the last business day of the Fund’s 2011 fiscal year. See Note 1 of the accompanying Notes.
3. Rate shown is the 7-day yield as of December 31, 2012.
See accompanying Notes to Financial Statements.
| | | | |
| 8 | | | | OPPENHEIMER VALUE FUND/VA |
STATEMENT OF ASSETS AND LIABILITIES
| | | | |
| December 31, 2012 | | | |
| Assets | | | |
| Investments, at value—see accompanying statement of investments: | | | | |
| Unaffiliated companies (cost $6,242,367) | | $ | 7,016,655 | |
| Affiliated companies (cost $60,104) | |
| 60,104
|
|
| | | | 7,076,759 | |
| Cash | | | 1,701 | |
| Receivables and other assets: | | | | |
| Dividends | | | 6,329 | |
| Shares of beneficial interest sold | | | 536 | |
| Other | |
| 8,731
|
|
| Total assets | | | 7,094,056 | |
| Liabilities | | | |
| Payables and other liabilities: | | | | |
| Shareholder communications | | | 8,509 | |
| Trustees’ compensation | | | 6,704 | |
| Shares of beneficial interest redeemed | | | 3,946 | |
| Distribution and service plan fees | | | 1,415 | |
| Transfer and shareholder servicing agent fees | | | 618 | |
| Other | |
| 21,528
|
|
| Total liabilities | | | 42,720 | |
| Net Assets | | $
| 7,051,336
|
|
| Composition of Net Assets | | | |
| Par value of shares of beneficial interest | | $ | 654 | |
| Additional paid-in capital | | | 7,289,364 | |
| Accumulated net investment income | | | 84,332 | |
| Accumulated net realized loss on investments and foreign currency transactions | | | (1,097,302 | ) |
| Net unrealized appreciation on investments and translation of assets and liabilities denominated in foreign currencies | |
| 774,288
|
|
| Net Assets | | $
| 7,051,336
|
|
| Net Asset Value Per Share | | | |
| Non-Service Shares: | | | | |
Net asset value, redemption price per share and offering price per share (based on net assets of $154,512 and 16,891 shares of beneficial interest outstanding) | | | $9.15 | |
| Service Shares: | | | | |
Net asset value, redemption price per share and offering price per share (based on net assets of $6,896,824 and 636,722 shares of beneficial interest outstanding) | | | $10.83 | |
See accompanying Notes to Financial Statements.
| | | | |
| 9 | | | | OPPENHEIMER VALUE FUND/VA |
STATEMENT OF OPERATIONS
| | | | |
| For the Year Ended December 31, 2012 | | | |
| Investment Income | | | |
| Dividends: | | | | |
| Unaffiliated companies (net of foreign withholding taxes of $973) | | $ | 166,643 | |
| Affiliated companies | | | 581 | |
| Interest | |
| 18
|
|
| Total investment income | | | 167,242 | |
| Expenses | | | |
| Management fees | | | 54,356 | |
| Distribution and service plan fees—Service shares | | | 17,737 | |
| Transfer and shareholder servicing agent fees: | | | | |
| Non-Service shares | | | 132 | |
| Service shares | | | 7,115 | |
| Shareholder communications: | | | | |
| Non-Service shares | | | 269 | |
| Service shares | | | 14,562 | |
| Legal, auditing and other professional fees | | | 27,279 | |
| Trustees’ compensation | | | 9,853 | |
| Administration service fees | | | 1,500 | |
| Custodian fees and expenses | | | 1,142 | |
| Other | |
| 4,996
|
|
| Total expenses | | | 138,941 | |
| Less waivers and reimbursements of expenses | |
| (63,766
| )
|
| Net expenses | | | 75,175 | |
| Net Investment Income | | | 92,067 | |
| Realized and Unrealized Gain (Loss) | | | |
| Net realized gain on: | | | | |
| Investments from unaffiliated companies | | | 255,100 | |
| Foreign currency transactions | |
| 2
|
|
| Total net realized gain | | | 255,102 | |
| Net change in unrealized appreciation/depreciation on: | | | | |
| Investments | | | 530,264 | |
| Translation of assets and liabilities denominated in foreign currencies | |
| (5
| )
|
| Total net change in unrealized appreciation/depreciation | | | 530,259 | |
| Net Increase in Net Assets Resulting from Operations | | $
| 877,428
|
|
See accompanying Notes to Financial Statements.
| | | | |
| 10 | | | | OPPENHEIMER VALUE FUND/VA |
STATEMENT OF CHANGES IN NET ASSETS December 31, 2012
| | | | | | | | |
| | | Year Ended
December 31, 2012 | | | Year Ended
December 30, 20111 | |
| Operations | | | | | | |
| Net investment income | | $ | 92,067 | | | $ | 82,226 | |
| Net realized gain | | | 255,102 | | | | 600,874 | |
| Net change in unrealized appreciation/depreciation | |
| 530,259
|
| |
| (1,040,601
| )
|
| Net increase (decrease) in net assets resulting from operations | | | 877,428 | | | | (357,501 | ) |
| Dividends and/or Distributions to Shareholders | | | | | | |
| Dividends from net investment income: | | | | | | | | |
| Non-Service shares | | | (1,809 | ) | | | (904 | ) |
| Service shares | |
| (81,182
| )
| |
| (66,745
| )
|
| | | | (82,991 | ) | | | (67,649 | ) |
| Beneficial Interest Transactions | | | | | | |
| Net increase (decrease) in net assets resulting from beneficial interest transactions: | | | | | | | | |
| Non-Service shares | | | 33,842 | | | | 17,714 | |
| Service shares | |
| (766,376
| )
| |
| (6,322
| )
|
| | | | (732,534 | ) | | | 11,392 | |
| Net Assets | | | | | | |
| Total increase (decrease) | | | 61,903 | | | | (413,758 | ) |
| Beginning of period | |
| 6,989,433
|
| |
| 7,403,191
|
|
| End of period (including accumulated net investment income of $84,332 and $75,254, respectively) | | $
| 7,051,336
|
| | $
| 6,989,433
|
|
1. December 30, 2011 represents the last business day of the Fund’s 2011 fiscal year. See Note 1 of the accompanying Notes.
See accompanying Notes to Financial Statements.
| | | | |
| 11 | | | | OPPENHEIMER VALUE FUND/VA |
FINANCIAL HIGHLIGHTS
| | | | | | | | | | | | | | | | | | | | |
| Non-Service Shares | | Year Ended
December 31,
2012 | | | Year Ended
December 30,
20111 | | | Year Ended
December 31,
2010 | | | Year Ended
December 31,
2009 | | | Year Ended
December 31,
2008 | |
| Per Share Operating Data | | | | | | | | | | | | | | | |
| Net asset value, beginning of period | | $ | 8.00 | | | $ | 8.49 | | | $ | 7.22 | | | $ | 4.99 | | | $ | 11.73 | |
| Income (loss) from investment operations: | | | | | | | | | | | | | | | | | | | | |
| Net investment income2 | | | 0.16 | | | | 0.15 | | | | 0.11 | | | | 0.11 | | | | 0.12 | |
| Net realized and unrealized gain (loss) | |
| 1.11
|
| |
| (0.56
| )
| |
| 1.24
|
| |
| 2.14
|
| |
| (4.44
| )
|
| Total from investment operations | | | 1.27 | | | | (0.41 | ) | | | 1.35 | | | | 2.25 | | | | (4.32 | ) |
| Dividends and/or distributions to shareholders: | | | | | | | | | | | | | | | | | | | | |
| Dividends from net investment income | | | (0.12 | ) | | | (0.08 | ) | | | (0.08 | ) | | | (0.02 | ) | | | (2.42 | ) |
| Net asset value, end of period | | $
| 9.15
|
| | $
| 8.00
|
| | $
| 8.49
|
| | $
| 7.22
|
| | $
| 4.99
|
|
| Total Return, at Net Asset Value3 | | | 16.08 | % | | | (4.93 | )% | | | 18.85 | % | | | 45.08 | % | | | (36.43 | )% |
| | | | | | | | | | | | | | | | | | | | | |
| Ratios/Supplemental Data | | | | | | | | | | | | | | | |
| Net assets, end of period (in thousands) | | $ | 154 | | | $ | 104 | | | $ | 92 | | | $ | 38 | | | $ | 6 | |
| Average net assets (in thousands) | | $ | 132 | | | $ | 101 | | | $ | 57 | | | $ | 20 | | | $ | 857 | |
| Ratios to average net assets:4 | | | | | | | | | | | | | | | | | | | | |
| Net investment income | | | 1.82 | % | | | 1.78 | % | | | 1.46 | % | | | 1.75 | % | | | 1.07 | % |
| Total expenses5 | | | 1.75 | % | | | 1.83 | % | | | 2.05 | % | | | 2.30 | % | | | 1.48 | % |
| Expenses after payments, waivers and/or reimbursements and reduction to custodian expenses | | | 0.80 | % | | | 0.80 | % | | | 0.57 | % | | | 0.85 | % | | | 1.25 | % |
| Portfolio turnover rate | | | 87 | % | | | 86 | % | | | 109 | % | | | 122 | % | | | 175 | % |
1. December 30, 2011 represents the last business day of the Fund’s 2011 fiscal year. See Note 1 of the accompanying Notes.
2. Per share amounts calculated based on the average shares outstanding during the period.
3. Assumes an initial investment on the business day before the first day of the fiscal period, with all dividends and distributions reinvested in additional shares on the reinvestment date, and redemption at the net asset value calculated on the last business day of the fiscal period. Total returns are not annualized for periods less than one full year. Total return information does not reflect expenses that apply at the separate account level or to related insurance products. Inclusion of these charges would reduce the total return figures for all periods shown. Returns do not reflect the deduction of taxes that a shareholder would pay on fund distributions or the redemption of fund shares.
4. Annualized for periods less than one full year.
5. Total expenses including indirect expenses from affiliated fund were as follows:
| | | | |
| Year Ended December 31, 2012 | | | 1.75 | % |
| Year Ended December 30, 2011 | | | 1.83 | % |
| Year Ended December 31, 2010 | | | 2.05 | % |
| Year Ended December 31, 2009 | | | 2.31 | % |
| Year Ended December 31, 2008 | | | 1.48 | % |
See accompanying Notes to Financial Statements.
| | | | |
| 12 | | | | OPPENHEIMER VALUE FUND/VA |
FINANCIAL HIGHLIGHTS Continued
| | | | | | | | | | | | | | | | | | | | |
| Service Shares | | Year Ended
December 31,
2012 | | | Year Ended
December 30,
20111 | | | Year Ended
December 31,
2010 | | | Year Ended
December 31,
2009 | | | Year Ended
December 31,
2008 | |
| Per Share Operating Data | | | | | | | | | | | | | | | |
| Net asset value, beginning of period | | $ | 9.69 | | | $ | 10.23 | | | $ | 8.99 | | | $ | 6.79 | | | $ | 11.75 | |
| Income (loss) from investment operations: | | | | | | | | | | | | | | | | | | | | |
| Net investment income2 | | | 0.13 | | | | 0.11 | | | | 0.08 | | | | 0.09 | | | | 0.08 | |
| Net realized and unrealized gain (loss) | |
| 1.13
|
| |
| (0.56
| )
| |
| 1.24
|
| |
| 2.12
|
| |
| (4.97
| )
|
| Total from investment operations | | | 1.26 | | | | (0.45 | ) | | | 1.32 | | | | 2.21 | | | | (4.89 | ) |
| Dividends and/or distributions to shareholders: | | | | | | | | | | | | | | | | | | | | |
| Dividends from net investment income | | | (0.12 | ) | | | (0.09 | ) | | | (0.08 | ) | | | (0.01 | ) | | | (0.07 | ) |
| Net asset value, end of period | | $
| 10.83
|
| | $
| 9.69
|
| | $
| 10.23
|
| | $
| 8.99
|
| | $
| 6.79
|
|
| Total Return, at Net Asset Value3 | | | 13.09 | % | | | (4.48 | )% | | | 14.81 | % | | | 32.57 | % | | | (41.62 | )% |
| | | | | | | | | | | | | | | | | | | | | |
| Ratios/Supplemental Data | | | | | | | | | | | | | | | |
| Net assets, end of period (in thousands) | | $ | 6,897 | | | $ | 6,885 | | | $ | 7,311 | | | $ | 7,505 | | | $ | 4,690 | |
| Average net assets (in thousands) | | $ | 7,095 | | | $ | 7,449 | | | $ | 7,008 | | | $ | 5,501 | | | $ | 5,561 | |
| Ratios to average net assets:4 | | | | | | | | | | | | | | | | | | | | |
| Net investment income | | | 1.26 | % | | | 1.08 | % | | | 0.85 | % | | | 1.10 | % | | | 0.84 | % |
| Total expenses5 | | | 1.93 | % | | | 1.90 | % | | | 2.08 | % | | | 2.17 | % | | | 2.13 | % |
| Expenses after payments, waivers and/or reimbursements and reduction to custodian expenses | | | 1.04 | % | | | 1.05 | % | | | 0.93 | % | | | 1.15 | % | | | 1.50 | % |
| Portfolio turnover rate | | | 87 | % | | | 86 | % | | | 109 | % | | | 122 | % | | | 175 | % |
1. December 30, 2011 represents the last business day of the Fund’s 2011 fiscal year. See Note 1 of the accompanying Notes.
2. Per share amounts calculated based on the average shares outstanding during the period.
3. Assumes an initial investment on the business day before the first day of the fiscal period, with all dividends and distributions reinvested in additional shares on the reinvestment date, and redemption at the net asset value calculated on the last business day of the fiscal period. Total returns are not annualized for periods less than one full year. Total return information does not reflect expenses that apply at the separate account level or to related insurance products. Inclusion of these charges would reduce the total return figures for all periods shown. Returns do not reflect the deduction of taxes that a shareholder would pay on fund distributions or the redemption of fund shares.
4. Annualized for periods less than one full year.
5. Total expenses including indirect expenses from affiliated fund were as follows:
| | | | |
| Year Ended December 31, 2012 | | | 1.93 | % |
| Year Ended December 30, 2011 | | | 1.90 | % |
| Year Ended December 31, 2010 | | | 2.08 | % |
| Year Ended December 31, 2009 | | | 2.18 | % |
| Year Ended December 31, 2008 | | | 2.13 | % |
See accompanying Notes to Financial Statements.
| | | | |
| 13 | | | | OPPENHEIMER VALUE FUND/VA |
NOTES TO FINANCIAL STATEMENTS
1. Significant Accounting Policies
Oppenheimer Value Fund/VA (the “Fund”) is a separate series of Oppenheimer Variable Account Funds, an open-end management investment company registered under the Investment Company Act of 1940, as amended. The Fund’s investment objective is to seek long-term growth of capital by investing primarily in common stocks with low price earnings ratios and better-than-anticipated earnings. Realization of current income is a secondary consideration. The Fund’s investment adviser is OppenheimerFunds, Inc. (the “Manager”).
The Fund offers two classes of shares. Both classes are sold at their offering price, which is the net asset value per share, to separate investment accounts of participating insurance companies as an underlying investment for variable life insurance policies, variable annuity contracts or other investment products. The class of shares designated as Service shares is subject to a distribution and service plan. Both classes of shares have identical rights and voting privileges with respect to the Fund in general and exclusive voting rights on matters that affect that class alone. Earnings, net assets and net asset value per share may differ due to each class having its own expenses, such as transfer and shareholder servicing agent fees and shareholder communications, directly attributable to that class.
The following is a summary of significant accounting policies consistently followed by the Fund.
Previous Annual Period. The last day of the Fund’s fiscal year was the last day the New York Stock Exchange was open for trading. The Fund’s financial statements have been presented through that date to maintain consistency with the Fund’s net asset value calculations used for shareholder transactions.
Investment in Oppenheimer Institutional Money Market Fund. The Fund is permitted to invest daily available cash balances in an affiliated money market fund. The Fund may invest the available cash in Class E shares of Oppenheimer Institutional Money Market Fund (“IMMF”) to seek current income while preserving liquidity. IMMF is a registered open-end management investment company, regulated as a money market fund under the Investment Company Act of 1940, as amended. The Manager is also the investment adviser of IMMF. When applicable, the Fund’s investment in IMMF is included in the Statement of Investments. Shares of IMMF are valued at their net asset value per share. As a shareholder, the Fund is subject to its proportional share of IMMF’s Class E expenses, including its management fee. The Manager will waive fees and/or reimburse Fund expenses in an amount equal to the indirect management fees incurred through the Fund’s investment in IMMF.
Foreign Currency Translation. The Fund’s accounting records are maintained in U.S. dollars. The values of securities denominated in foreign currencies and amounts related to the purchase and sale of foreign securities and foreign investment income are translated into U.S. dollars as of the close of the Exchange, normally 4:00 P.M. Eastern time, on each day the Exchange is open for trading. Foreign exchange rates may be valued primarily using a reliable bank, dealer or service authorized by the Board of Trustees.
Reported net realized gains and losses from foreign currency transactions arise from sales of portfolio securities, sales and maturities of short-term securities, sales of foreign currencies, exchange rate fluctuations between the trade and settlement dates on securities transactions, and the difference between the amounts of dividends, interest, and foreign withholding taxes recorded on the Fund’s books and the U.S. dollar equivalent of the amounts actually received or paid. Net unrealized appreciation and depreciation on the translation of assets and liabilities denominated in foreign currencies arise from changes in the values of assets and liabilities, including investments in securities at fiscal period end, resulting from changes in exchange rates.
The effect of changes in foreign currency exchange rates on investments is separately identified from the fluctuations arising from changes in market values of securities held and reported with all other foreign currency gains and losses in the Fund’s Statement of Operations.
Allocation of Income, Expenses, Gains and Losses. Income, expenses (other than those attributable to a specific class), gains and losses are allocated on a daily basis to each class of shares based upon the relative proportion of net assets represented by such class. Operating expenses directly attributable to a specific class are charged against the operations of that class.
Federal Taxes. The Fund intends to comply with provisions of the Internal Revenue Code applicable to regulated investment companies and to distribute substantially all of its investment company taxable income, including any net realized gain on investments not offset by capital loss carryforwards, if any, to shareholders. Therefore, no federal income or excise tax provision is required. The Fund files income tax returns in U.S. federal and applicable state jurisdictions. The statute of limitations on the Fund’s tax return filings generally remain open for the three preceding fiscal reporting period ends.
The tax components of capital shown in the following table represent distribution requirements the Fund must satisfy under the income tax regulations, losses the Fund may be able to offset against income and gains realized in future years and unrealized appreciation or depreciation of securities and other investments for federal income tax purposes.
| | | | | | | | | | | | |
Undistributed Net Investment Income | | Undistributed Long-Term Gain | | | Accumulated Loss Carryforward1,2,3 | | | Net Unrealized Appreciation Based on cost of Securities and Other Investments for Federal Income Tax Purposes | |
| $93,306 | | | $— | | | | $995,284 | | | | $669,998 | |
| | | | |
| 14 | | | | OPPENHEIMER VALUE FUND/VA |
1. As of December 31, 2012, the Fund had $973,499 of net capital loss carryforwards available to offset future realized capital gains, if any, and thereby reduce future taxable gain distributions. Details of the capital loss carryforwards are included in the table below. Capital loss carryovers with no expiration, if any, must be utilized prior to those with expiration dates.
2. During the fiscal year ended December 31, 2012, the Fund utilized $231,212 of capital loss carryforward to offset capital gains realized in that fiscal year.
3. During the fiscal year ended December 30, 2011, the Fund utilized $652,156 of capital loss carryforward to offset capital gains realized in that fiscal year.
Net investment income (loss) and net realized gain (loss) may differ for financial statement and tax purposes. The character of dividends and distributions made during the fiscal year from net investment income or net realized gains may differ from their ultimate characterization for federal income tax purposes. Also, due to timing of dividends and distributions, the fiscal year in which amounts are distributed may differ from the fiscal year in which the income or net realized gain was recorded by the Fund.
Accordingly, the following amounts have been reclassified for December 31, 2012. Net assets of the Fund were unaffected by the reclassifications.
| | | | |
Increase to Accumulated Net Investment Income | | Increase to Accumulated Net Realized Loss on Investments | |
| $2 | | | $2 | |
The tax character of distributions paid during the years ended December 31, 2012 and December 31, 2011 was as follows:
| | | | | | | | |
| | | Year Ended
December 31, 2012 | | | Year Ended
December 31, 2011 | |
| Distributions paid from: | | | | | | | | |
| Ordinary income | | $ | 82,991 | | | $ | 67,649 | |
The aggregate cost of securities and other investments and the composition of unrealized appreciation and depreciation of securities and other investments for federal income tax purposes as of December 31, 2012 are noted in the following table. The primary difference between book and tax appreciation or depreciation of securities and other investments, if applicable, is attributable to the tax deferral of losses or tax realization of financial statement unrealized gain or loss.
| | | | |
| Federal tax cost of securities | | $ | 6,406,761 | |
| | |
|
|
|
| |
| Gross unrealized appreciation | | $ | 777,524 | |
| Gross unrealized depreciation | | | (107,526) | |
| | |
|
|
|
| Net unrealized appreciation | | $ | 669,998 | |
| | |
|
|
|
Trustees’ Compensation. The Board of Trustees has adopted a compensation deferral plan for independent trustees that enables trustees to elect to defer receipt of all or a portion of the annual compensation they are entitled to receive from the Fund. For purposes of determining the amount owed to the Trustee under the plan, deferred amounts are treated as though equal dollar amounts had been invested in shares of the Fund or in other Oppenheimer funds selected by the Trustee. The Fund purchases shares of the funds selected for deferral by the Trustee in amounts equal to his or her deemed investment, resulting in a Fund asset equal to the deferred compensation liability. Such assets are included as a component of “Other” within the asset section of the Statement of Assets and Liabilities. Deferral of trustees’ fees under the plan will not affect the net assets of the Fund, and will not materially affect the Fund’s assets, liabilities or net investment income per share. Amounts will be deferred until distributed in accordance with the compensation deferral plan.
Dividends and Distributions to Shareholders. Dividends and distributions to shareholders, which are determined in accordance with income tax regulations and may differ from U.S. generally accepted accounting principles, are recorded on the ex-dividend date. Income and capital gain distributions, if any, are declared and paid annually or at other times as deemed necessary by the Manager.
Investment Income. Dividend income is recorded on the ex-dividend date or upon ex-dividend notification in the case of certain foreign dividends where the ex-dividend date may have passed. Non-cash dividends included in dividend income, if any, are recorded at the fair market value of the securities received. Interest income is recognized on an accrual basis. Discount and premium, which are included in interest income on the Statement of Operations, are amortized or accreted daily.
Custodian Fees. “Custodian fees and expenses” in the Statement of Operations may include interest expense incurred by the Fund on any cash overdrafts of its custodian account during the period. Such cash overdrafts may result from the effects of failed trades in portfolio securities and from cash outflows resulting from unanticipated shareholder redemption activity. The Fund pays interest to its custodian on such cash overdrafts, to the extent they are not offset by positive cash balances maintained by the Fund, at a rate equal to the Federal Funds Rate plus 0.50%. The “Reduction to custodian expenses” line item, if applicable, represents earnings on cash balances maintained by the Fund during the period. Such interest expense and other custodian fees may be paid with these earnings.
| | | | |
| 15 | | | | OPPENHEIMER VALUE FUND/VA |
NOTES TO FINANCIAL STATEMENTS Continued
1. Significant Accounting Policies Continued
Security Transactions. Security transactions are recorded on the trade date. Realized gains and losses on securities sold are determined on the basis of identified cost.
Indemnifications. The Fund’s organizational documents provide current and former trustees and officers with a limited indemnification against liabilities arising in connection with the performance of their duties to the Fund. In the normal course of business, the Fund may also enter into contracts that provide general indemnifications. The Fund’s maximum exposure under these arrangements is unknown as this would be dependent on future claims that may be made against the Fund. The risk of material loss from such claims is considered remote.
Other. The preparation of financial statements in conformity with accounting principles generally accepted in the United States of America requires management to make estimates and assumptions that affect the reported amounts of assets and liabilities and disclosure of contingent assets and liabilities at the date of the financial statements and the reported amounts of increases and decreases in net assets from operations during the reporting period. Actual results could differ from those estimates.
2. Securities Valuation
The Fund calculates the net asset value of its shares as of the close of the New York Stock Exchange (the “Exchange”), normally 4:00 P.M. Eastern time, on each day the Exchange is open for trading.
The Fund’s Board has adopted procedures for the valuation of the Fund’s securities and has delegated the day-to-day responsibility for valuation determinations under those procedures to the Manager. The Manager has established a Valuation Committee which is responsible for determining a “fair valuation” for any security for which market quotations are not “readily available.” The Valuation Committee’s fair valuation determinations are subject to review, approval and ratification by the Fund’s Board at its next regularly scheduled meeting covering the calendar quarter in which the fair valuation was determined.
Valuation Methods and Inputs
Securities are valued using unadjusted quoted market prices, when available, as supplied primarily by third party pricing services or dealers.
The following methodologies are used to determine the market value or the fair value of the types of securities described below:
Securities traded on a registered U.S. securities exchange (including exchange-traded derivatives other than futures and futures options) are valued based on the last sale price of the security reported on the principal exchange on which it is traded, prior to the time when the Fund’s assets are valued. In the absence of a sale, the security is valued at the last sale price on the prior trading day, if it is within the spread of the current day’s closing “bid” and “asked” prices, and if not, at the current day’s closing bid price. A security of a foreign issuer traded on a foreign exchange but not listed on a registered U.S. securities exchange is valued based on the last sale price on the principal exchange on which the security is traded, as identified by the third party pricing service used by the Manager, prior to the time when the Fund’s assets are valued. If the last sale price is unavailable, the security is valued at the most recent official closing price on the principal exchange on which it is traded. If the last sales price or official closing price for a foreign security is not available, the security is valued at the mean between the bid and asked price per the exchange or, if not available from the exchange, obtained from two dealers. If bid and asked prices are not available from either the exchange or two dealers, the security is valued by using one of the following methodologies (listed in order of priority); (1) using a bid from the exchange, (2) the mean between the bid and asked price as provided by a single dealer, or (3) a bid from a single dealer.
Shares of a registered investment company that are not traded on an exchange are valued at that investment company’s net asset value per share.
Corporate and government debt securities (of U.S. or foreign issuers) and municipal debt securities, event-linked bonds, loans, mortgage-backed securities, collateralized mortgage obligations, and asset-backed securities are valued at the mean between the “bid” and “asked” prices utilizing evaluated prices obtained from third party pricing services or broker-dealers who may use matrix pricing methods to determine the evaluated prices.
Short-term money market type debt securities with a remaining maturity of sixty days or less are valued at cost adjusted by the amortization of discount or premium to maturity (amortized cost), which approximates market value. Short-term debt securities with a remaining maturity in excess of sixty days are valued at the mean between the “bid” and “asked” prices utilizing evaluated prices obtained from third party pricing services or broker-dealers.
Forward foreign currency exchange contracts are valued utilizing current and forward currency rates obtained from third party pricing services. When the settlement date of a contract is an interim date for which a quotation is not available, interpolated values are derived using the nearest dated forward currency rate.
A description of the standard inputs that may generally be considered by the third party pricing vendors in determining their evaluated prices is provided below.
| | |
| Security Type | | Standard inputs generally considered by third-party pricing vendors |
| Corporate debt, government debt, municipal, mortgage-backed and asset-backed securities | | Reported trade data, broker-dealer price quotations, benchmark yields,
issuer spreads on comparable securities, the credit quality, yield, maturity,
and other appropriate factors. |
| Loans | | Information obtained from market participants regarding reported trade
data and broker-dealer price quotations. |
| Event-linked bonds | | Information obtained from market participants regarding reported trade
data and broker-dealer price quotations. |
| | | | |
| 16 | | | | OPPENHEIMER VALUE FUND/VA |
If a market value or price cannot be determined for a security using the methodologies described above, or if, in the “good faith” opinion of the Manager, the market value or price obtained does not constitute a “readily available market quotation,” or a significant event has occurred that would materially affect the value of the security the security is fair valued either (i) by a standardized fair valuation methodology applicable to the security type or the significant event as previously approved by the Valuation Committee and the Fund’s Board or (ii) as determined in good faith by the Manager’s Valuation Committee. The Valuation Committee considers all relevant facts that are reasonably available, through either public information or information available to the Manager, when determining the fair value of a security. Fair value determinations by the Manager are subject to review, approval and ratification by the Fund’s Board at its next regularly scheduled meeting covering the calendar quarter in which the fair valuation was determined. Those fair valuation standardized methodologies include, but are not limited to, valuing securities at the last sale price or initially at cost and subsequently adjusting the value based on: changes in company specific fundamentals, changes in an appropriate securities index, or changes in the value of similar securities which may be further adjusted for any discounts related to security-specific resale restrictions. When possible, such methodologies use observable market inputs such as unadjusted quoted prices of similar securities, observable interest rates, currency rates and yield curves. The methodologies used for valuing securities are not necessarily an indication of the risks associated with investing in those securities nor can it be assured that the Fund can obtain the fair value assigned to a security if it were to sell the security.
To assess the continuing appropriateness of security valuations, the Manager, or its third party service provider who is subject to oversight by the Manager, regularly compares prior day prices, prices on comparable securities, and sale prices to the current day prices and challenges those prices exceeding certain tolerance levels with the third party pricing service or broker source. For those securities valued by fair valuations, whether through a standardized fair valuation methodology or a fair valuation determination, the Valuation Committee reviews and affirms the reasonableness of the valuations based on such methodologies and fair valuation determinations on a regular basis after considering all relevant information that is reasonably available.
Classifications
Each investment asset or liability of the Fund is assigned a level at measurement date based on the significance and source of the inputs to its valuation. Various data inputs are used in determining the value of each of the Fund’s investments as of the reporting period end. These data inputs are categorized in the following hierarchy under applicable financial accounting standards:
1) Level 1-unadjusted quoted prices in active markets for identical assets or liabilities (including securities actively traded on a securities exchange)
2) Level 2-inputs other than unadjusted quoted prices that are observable for the asset or liability (such as unadjusted quoted prices for similar assets and market corroborated inputs such as interest rates, prepayment speeds, credit risks, etc.)
3) Level 3-significant unobservable inputs (including the Manager’s own judgments about assumptions that market participants would use in pricing the asset or liability).
The inputs used for valuing securities are not necessarily an indication of the risks associated with investing in those securities.
The table below categorizes amounts that are included in the Fund’s Statement of Assets and Liabilities as of December 31, 2012 based on valuation input level:
| | | | | | | | | | | | | | | | |
| | | Level 1—
Unadjusted
Quoted Prices | | | Level 2—
Other Significant
Observable Inputs | | | Level 3—
Significant
Unobservable
Inputs | | | Value | |
| Assets Table | | | | | | | | | | | | | | | | |
| Investments, at Value: | | | | | | | | | | | | | | | | |
| Common Stocks | | | | | | | | | | | | | | | | |
Consumer Discretionary | | | $651,079 | | | | $— | | | | $— | | | | $651,079 | |
Consumer Staples | | | 687,850 | | | | — | �� | | | — | | | | 687,850 | |
Energy | | | 851,344 | | | | — | | | | — | | | | 851,344 | |
Financials | | | 1,640,718 | | | | — | | | | — | | | | 1,640,718 | |
Health Care | | | 1,071,998 | | | | — | | | | — | | | | 1,071,998 | |
Industrials | | | 687,474 | | | | — | | | | — | | | | 687,474 | |
Information Technology | | | 519,675 | | | | — | | | | — | | | | 519,675 | |
Materials | | | 402,299 | | | | — | | | | — | | | | 402,299 | |
Telecommunication Services | | | 268,085 | | | | — | | | | — | | | | 268,085 | |
Utilities | | | 236,133 | | | | — | | | | — | | | | 236,133 | |
| Investment Company | | | 60,104 | | | | — | | | | — | | | | 60,104 | |
| Total Assets | | | $7,076,759 | | | | — | | | | — | | | | $7,076,759 | |
Currency contracts and forwards, if any, are reported at their unrealized appreciation/ depreciation at measurement date, which represents the change in the contract’s value from trade date. Futures, if any, are reported at their variation margin at measurement date, which represents the amount due to/from the Fund at that date. All additional assets and liabilities included in the above table are reported at their market value at measurement date.
There have been no significant changes to the fair valuation methodologies of the Fund during the period.
| | | | |
| 17 | | | | OPPENHEIMER VALUE FUND/VA |
NOTES TO FINANCIAL STATEMENTS Continued
3. Shares of Beneficial Interest
The Fund has authorized an unlimited number of $0.001 par value shares of beneficial interest of each class. Transactions in shares of beneficial interest were as follows:
| | | | | | | | | | | | | | | | |
| | | Year Ended December 31, 2012 | | | Year Ended December 30, 2011 | |
| | | Shares | | | Amount | | | Shares | | | Amount | |
| Non-Service Shares | | | | | | | | | | | | | | | | |
| Sold | | | 5,406 | | | | $47,076 | | | | 4,906 | | | | $40,931 | |
| Dividends and/or distributions reinvested | | | 219 | | | | 1,809 | | | | 101 | | | | 904 | |
| Redeemed | | | (1,790 | ) | | | (15,043 | ) | | | (2,787 | ) | | | (24,121 | ) |
| | |
|
|
| |
|
|
| |
|
|
| |
|
|
|
| Net increase | | | 3,835 | | | | $33,842 | | | | 2,220 | | | | $17,714 | |
| | |
|
|
| |
|
|
| |
|
|
| |
|
|
|
| | | | | | | | | | | | | |
| Service Shares | | | | | | | | | | | | | | | | |
| Sold | | | 50,121 | | | | $518,469 | | | | 114,846 | | | | $1,183,318 | |
| Dividends and/or distributions reinvested | | | 8,159 | | | | 81,182 | | | | 6,285 | | | | 66,745 | |
| Redeemed | | | (132,292 | ) | | | (1,366,027 | ) | | | (125,191 | ) | | | (1,256,385 | ) |
| | |
|
|
| |
|
|
| |
|
|
| |
|
|
|
| Net decrease | | | (74,012 | ) | | | $(766,376 | ) | | | (4,060 | ) | | | $(6,322 | ) |
| | |
|
|
| |
|
|
| |
|
|
| |
|
|
|
4. Purchases and Sales of Securities
The aggregate cost of purchases and proceeds from sales of securities, other than short-term obligations and investments in IMMF, for the year ended December 31, 2012, were as follows:
| | | | | | | | |
| | | Purchases | | | Sales | |
| Investment securities | | | $6,037,222 | | | | $6,514,943 | |
5. Fees and Other Transactions with Affiliates
Management Fees. Under the investment advisory agreement, the Fund pays the Manager a management fee based on the daily net assets of the Fund at an annual rate as shown in the following table:
| | | | |
| Fee Schedule | | | |
| Up to $200 million | | | 0.75 | % |
| Next $200 million | | | 0.72 | |
| Next $200 million | | | 0.69 | |
| Next $200 million | | | 0.66 | |
| Over $800 million | | | 0.60 | |
Administrative Service Fees. The Fund pays the Manager a fee of $1,500 per year for preparing and filing the Fund’s tax returns.
Transfer Agent Fees. OppenheimerFunds Services (“OFS”), a division of the Manager, acts as the transfer and shareholder servicing agent for the Fund. For the year ended December 31, 2012, the Fund paid $7,223 to OFS for services to the Fund.
Distribution and Service Plan for Service Shares. The Fund has adopted a Distribution and Service Plan (the “Plan”) in accordance with Rule 12b-1 under the Investment Company Act of 1940 for Service shares to pay OppenheimerFunds Distributor, Inc. (the “Distributor”), for distribution related services, personal service and account maintenance for the Fund’s Service shares. Under the Plan, payments are made periodically at an annual rate of 0.25% of the daily net assets of Service shares of the Fund. The Distributor currently uses all of those fees to compensate sponsors of the insurance product that offers Fund shares, for providing personal service and maintenance of accounts of their variable contract owners that hold Service shares. These fees are paid out of the Fund’s assets on an on-going basis and increase operating expenses of the Service shares, which results in lower performance compared to the Fund’s shares that are not subject to a service fee. Fees incurred by the Fund under the Plan are detailed in the Statement of Operations.
Waivers and Reimbursements of Expenses. The Manager has voluntarily agreed to limit the Fund’s expenses after payments, waivers and/or reimbursements and reduction to custodian expenses, excluding expenses incurred directly or indirectly by the Fund as a result of investments in other investment companies, wholly-owned subsidiaries and pooled investment vehicles; so that those expenses, as percentages of daily net assets, will not exceed the annual rate of 0.80% for Non-Service shares and 1.05% for Service shares. During the year ended December 31, 2012, the Manager waived fees and/or reimbursed the Fund $1,253 and $62,229 for Non-Service and Service shares, respectively.
The Manager will waive fees and/or reimburse Fund expenses in an amount equal to the indirect management fees incurred through the Fund’s investment in IMMF. During the year ended December 31, 2012, the Manager waived fees and/or reimbursed the Fund $284 for IMMF management fees.
Some of these undertakings may be modified or terminated at any time; some may not be modified or terminated until after one year from the date of the current prospectus, as indicated therein.
| | | | |
| 18 | | | | OPPENHEIMER VALUE FUND/VA |
6. Risk Exposures and the Use of Derivative Instruments
The Fund’s investment objectives not only permit the Fund to purchase investment securities, they also allow the Fund to enter into various types of derivatives contracts, including, but not limited to, futures contracts, forward foreign currency exchange contracts, credit default swaps, interest rate swaps, total return swaps, and purchased and written options. In doing so, the Fund will employ strategies in differing combinations to permit it to increase, decrease, or change the level or types of exposure to market risk factors. Central to those strategies are features inherent to derivatives that make them more attractive for this purpose than equity and debt securities: they require little or no initial cash investment, they can focus exposure on only certain selected risk factors, and they may not require the ultimate receipt or delivery of the underlying security (or securities) to the contract. This may allow the Fund to pursue its objectives more quickly and efficiently than if it were to make direct purchases or sales of securities capable of effecting a similar response to market factors.
Market Risk Factors. In accordance with its investment objectives, the Fund may use derivatives to increase or decrease its exposure to one or more of the following market risk factors:
Commodity Risk. Commodity risk relates to the change in value of commodities or commodity indexes as they relate to increases or decreases in the commodities market. Commodities are physical assets that have tangible properties. Examples of these types of assets are crude oil, heating oil, metals, livestock, and agricultural products.
Credit Risk. Credit risk relates to the ability of the issuer to meet interest and principal payments, or both, as they come due. In general, lower-grade, higher-yield bonds are subject to credit risk to a greater extent than lower-yield, higher-quality bonds.
Equity Risk. Equity risk relates to the change in value of equity securities as they relate to increases or decreases in the general market.
Foreign Exchange Rate Risk. Foreign exchange rate risk relates to the change in the U.S. dollar value of a security held that is denominated in a foreign currency. The U.S. dollar value of a foreign currency denominated security will decrease as the dollar appreciates against the currency, while the U.S. dollar value will increase as the dollar depreciates against the currency.
Interest Rate Risk. Interest rate risk refers to the fluctuations in value of fixed-income securities resulting from the inverse relationship between price and yield. For example, an increase in general interest rates will tend to reduce the market value of already issued fixed-income investments, and a decline in general interest rates will tend to increase their value. In addition, debt securities with longer maturities, which tend to have higher yields, are subject to potentially greater fluctuations in value from changes in interest rates than obligations with shorter maturities.
Volatility Risk. Volatility risk refers to the magnitude of the movement, but not the direction of the movement, in a financial instrument’s price over a defined time period. Large increases or decreases in a financial instrument’s price over a relative time period typically indicate greater volatility risk, while small increases or decreases in its price typically indicate lower volatility risk.
The Fund’s actual exposures to these market risk factors during the period are discussed in further detail, by derivative type, below.
Risks of Investing in Derivatives. The Fund’s use of derivatives can result in losses due to unanticipated changes in the market risk factors and the overall market. In instances where the Fund is using derivatives to decrease, or hedge, exposures to market risk factors for securities held by the Fund, there are also risks that those derivatives may not perform as expected resulting in losses for the combined or hedged positions.
Derivatives may have little or no initial cash investment relative to their market value exposure and therefore can produce significant gains or losses in excess of their cost. This use of embedded leverage allows the Fund to increase its market value exposure relative to its net assets and can substantially increase the volatility of the Fund’s performance.
Additional associated risks from investing in derivatives also exist and potentially could have significant effects on the valuation of the derivative and the Fund. Typically, the associated risks are not the risks that the Fund is attempting to increase or decrease exposure to, per its investment objectives, but are the additional risks from investing in derivatives. Examples of these associated risks are liquidity risk, which is the risk that the Fund will not be able to sell the derivative in the open market in a timely manner, and counterparty credit risk, which is the risk that the counterparty will not fulfill its obligation to the Fund. Associated risks can be different for each type of derivative and are discussed by each derivative type in the notes that follow.
Counterparty Credit Risk. Certain derivative positions are subject to counterparty credit risk, which is the risk that the counterparty will not fulfill its obligation to the Fund. The Fund’s derivative counterparties are financial institutions who are subject to market conditions that may weaken their financial position. The Fund intends to enter into financial transactions with counterparties that the Manager believes to be creditworthy at the time of the transaction.
Credit Related Contingent Features. The Fund’s agreements with derivative counterparties have several credit related contingent features that if triggered would allow its derivatives counterparties to close out and demand payment or additional collateral to cover their exposure from the Fund. Credit related contingent features are established between the Fund and its derivatives counterparties to reduce the risk that the Fund will not fulfill its payment obligations to its counterparties. These triggering features include, but are not limited to, a percentage decrease in the Fund’s net assets and or a percentage decrease in the Fund’s Net Asset Value or NAV. The contingent features are established within the Fund’s International Swap and Derivatives Association, Inc. master agreements which govern certain positions in swaps, over-the-counter options and swaptions, and forward currency exchange contracts for each individual counterparty.
| | | | |
| 19 | | | | OPPENHEIMER VALUE FUND/VA |
NOTES TO FINANCIAL STATEMENTS Continued
6. Risk Exposures and the Use of Derivative Instruments (Continued)
The effect of derivative instruments on the Statement of Operations is as follows:
| | | | |
| Amount of Realized Gain or (Loss) Recognized on Derivatives | |
Derivatives Not Accounted for as Hedging Instruments | | Investments from
unaffiliated
companies* | |
| Equity contracts | | | $240 | |
| Volatility contracts | | | (25,532 | ) |
| | |
|
|
|
| Total | | | $(25,532 | ) |
| | |
|
|
|
*Includes purchased option contracts, purchased swaption contracts and written option contracts exercised, if any.
| | | | |
| Amount of Change in Unrealized Gain or (Loss) Recognized on Derivatives | |
Derivatives Not Accounted for as Hedging Instruments | | Investments | |
| Volatility contracts | | | $14,149 | |
Option Activity
The Fund may buy and sell put and call options, or write put and call options. When an option is written, the Fund receives a premium and becomes obligated to sell or purchase the underlying security at a fixed price, upon exercise of the option.
Options are valued daily based upon the last sale price on the principal exchange on which the option is traded. The difference between the premium received or paid, and market value of the option, is recorded as unrealized appreciation or depreciation. The net change in unrealized appreciation or depreciation is reported in the Statement of Operations. When an option is exercised, the cost of the security purchased or the proceeds of the security sale are adjusted by the amount of premium received or paid. Upon the expiration or closing of the option transaction, a gain or loss is reported in the Statement of Operations.
The Fund has purchased put options on individual equity securities and/or equity indexes to decrease exposure to equity risk. A purchased put option becomes more valuable as the price of the underlying financial instrument depreciates relative to the strike price.
The Fund has purchased call options on volatility indexes to increase exposure to volatility risk. A purchased call option becomes more valuable as the level of the underlying volatility index increases relative to the strike price.
During the year ended December 31, 2012, the Fund had an ending monthly average market value of $687 and $95 on purchased call options and purchased put options, respectively.
Options written, if any, are reported in a schedule following the Statement of Investments and as a liability in the Statement of Assets and Liabilities. Securities held in collateralized accounts to cover potential obligations with respect to outstanding written options are noted in the Statement of Investments.
The risk in writing a call option is that the Fund gives up the opportunity for profit if the market price of the security increases and the option is exercised. The risk in writing a put option is that the Fund may incur a loss if the market price of the security decreases and the option is exercised. The risk in buying an option is that the Fund pays a premium whether or not the option is exercised. The Fund also has the additional risk that there may be an illiquid market where the Fund is unable to close the contract.
Additional associated risks to the Fund include counterparty credit risk for over-the-counter options and liquidity risk.
As of December 31, 2012, the Fund had no outstanding written or purchased options.
7. Subsequent Event
The Board of Trustees of the Fund recently approved a series of modifications to the Fund’s investment advisory and transfer agency arrangements in connection with internal corporate restructuring efforts at OppenheimerFunds, Inc. (“OFI”). As a result of these modifications, on January 1, 2013 (the “Effective Date”), OFI Global Asset Management, Inc. (“OFI Global”), a wholly-owned subsidiary of OFI, became the investment adviser and transfer agent to the Fund under the terms of the Fund’s advisory agreement and transfer agency agreement, respectively. OFI Global, in turn, entered into a new sub-advisory agreement for the Fund, on the Effective Date, whereby OFI Global will have oversight and supervisory responsibilities and OFI will choose the Fund’s investments and provide related advisory services to the Fund. In addition, on the Effective Date, OFI Global entered into a sub-transfer agency agreement with Shareholder Services, Inc. doing business as OppenheimerFunds Services, a wholly-owned subsidiary of OFI, under which it will be responsible for providing transfer agency services to the Fund.
The realignment of advisory service responsibility between OFI Global and OFI did not result in any change in the persons managing the assets of the Fund, the level or nature of the advisory services provided to the Fund, or the fees charged to the Fund.
8. Pending Litigation
Since 2009, a number of class action lawsuits have been pending in federal courts against OppenheimerFunds, Inc., the Fund’s Adviser through December 31, 2012 and Sub-Adviser effective January 1, 2013 (the “Manager”), OppenheimerFunds Distributor, Inc., the Fund’s principal underwriter and distributor (the “Distributor”), and certain funds (but not including the Fund) advised by the Manager and distributed by the Distributor (the “Defendant Funds”). Several of these lawsuits also name as defendants certain officers and current and former trustees of the respective Defendant Funds. The lawsuits raise claims under federal securities law and allege, among other things, that the disclosure documents of the respective Defendant Funds contained misrepresentations and omissions and that the respective Defendant Funds’ investment policies were not followed. The plaintiffs in
| | | | |
| 20 | | | | OPPENHEIMER VALUE FUND/VA |
these actions seek unspecified damages, equitable relief and awards of attorneys’ fees and litigation expenses. The Defendant Funds’ Boards of Trustees have also engaged counsel to represent the Funds and the present and former Independent Trustees named in those suits.
Other class action and individual lawsuits have been filed since 2008 in various state and federal courts against the Manager and certain of its affiliates by investors seeking to recover investments they allegedly lost as a result of the “Ponzi” scheme run by Bernard L. Madoff and his firm, Bernard L. Madoff Investment Securities, LLC (“BLMIS”). Plaintiffs in these suits allege that they suffered losses as a result of their investments in several funds managed by an affiliate of the Manager and assert a variety of claims, including breach of fiduciary duty, fraud, negligent misrepresentation, unjust enrichment, and violation of federal and state securities laws and regulations, among others. They seek unspecified damages, equitable relief and awards of attorneys’ fees and litigation expenses. Neither the Distributor, nor any of the Oppenheimer mutual funds, their independent trustees or directors are named as defendants in these lawsuits. None of the Oppenheimer mutual funds invested in any funds or accounts managed by Madoff or BLMIS. On February 28, 2011, a stipulation of partial settlement of three groups of consolidated putative class action lawsuits relating to these matters was filed in the U.S. District Court for the Southern District of New York. On August 19, 2011, the court entered an order and final judgment approving the settlement as fair, reasonable and adequate. In September 2011, certain parties filed notices of appeal from the court’s order approving the settlement. The settlement does not resolve other outstanding lawsuits against the Manager and its affiliates relating to BLMIS.
On April 16, 2010, a lawsuit was filed in New York state court against the Manager, an affiliate of the Manager and AAArdvark IV Funding Limited (“AAArdvark IV”), an entity advised by the Manager’s affiliate, in connection with investments made by the plaintiffs in AAArdvark IV. Plaintiffs allege breach of contract against the defendants and seek compensatory damages, costs and disbursements, including attorney fees. On July 15, 2011, a lawsuit was filed in New York state court against the Manager, an affiliate of the Manager and AAArdvark Funding Limited (“AAArdvark I”), an entity advised by the Manager’s affiliate, in connection with investments made by the plaintiffs in AAArdvark I. The complaint alleges breach of contract against the defendants and seeks compensatory damages, costs and disbursements, including attorney fees. On November 9, 2011, a lawsuit was filed in New York state court against the Manager, an affiliate of the Manager and AAArdvark XS Funding Limited (“AAArdvark XS”), an entity advised by the Manager’s affiliate, in connection with investments made by the plaintiffs in AAArdvark XS. The complaint alleges breach of contract against the defendants and seeks compensatory damages, costs and disbursements, including attorney fees.
The Manager believes the lawsuits and appeals described above are without legal merit and, with the exception of actions it has settled, is defending against them vigorously. While it is premature to render any opinion as to the outcome in these lawsuits, or whether any costs that the Defendant Funds may bear in defending the suits might not be reimbursed by insurance, the Manager believes that these suits should not impair the ability of the Manager or the Distributor to perform their respective duties to the Fund, and that the outcome of all of the suits together should not have any material effect on the operations of any of the Oppenheimer mutual funds.
| | | | |
| 21 | | | | OPPENHEIMER VALUE FUND/VA |
REPORT OF INDEPENDENT REGISTERED PUBLIC ACCOUNTING FIRM
The Board of Trustees and Shareholders of Oppenheimer Variable Account Funds:
We have audited the accompanying statement of assets and liabilities of Oppenheimer Value Fund/VA (a separate series of Oppenheimer Variable Account Funds), including the statement of investments, as of December 31, 2012, and the related statement of operations for the year then ended, the statements of changes in net assets for each of the years in the two-year period then ended and the financial highlights for each of the years in the four-year period then ended. These financial statements and financial highlights are the responsibility of the Fund’s management. Our responsibility is to express an opinion on these financial statements and financial highlights based on our audits. The accompanying financial highlights of Oppenheimer Value Fund/VA for the year ended December 31, 2008 were audited by other auditors whose report dated February 11, 2009 expressed an unqualified opinion on those financial highlights.
We conducted our audits in accordance with the standards of the Public Company Accounting Oversight Board (United States). Those standards require that we plan and perform the audit to obtain reasonable assurance about whether the financial statements and financial highlights are free of material misstatement. An audit includes examining, on a test basis, evidence supporting the amounts and disclosures in the financial statements. Our procedures included confirmation of securities owned as of December 31, 2012, by correspondence with the custodian and transfer agent. An audit also includes assessing the accounting principles used and significant estimates made by management, as well as evaluating the overall financial statement presentation. We believe that our audits provide a reasonable basis for our opinion.
In our opinion, the financial statements and financial highlights referred to above present fairly, in all material respects, the financial position of Oppenheimer Value Fund/VA as of December 31, 2012, the results of its operations for the year then ended, the changes in its net assets for each of the years in the two-year period then ended and the financial highlights for each of the years in the four-year period then ended, in conformity with U.S. generally accepted accounting principles.
KPMG LLP
Denver, Colorado
February 19, 2013
| | | | |
| 22 | | | | OPPENHEIMER VALUE FUND/VA |
FEDERAL INCOME TAX INFORMATION Unaudited
In early 2013, if applicable, shareholders of record received information regarding all dividends and distributions paid to them by the Fund during calendar year 2012.
Dividends, if any, paid by the Fund during the fiscal year ended December 31, 2012 which are not designated as capital gain distributions should be multiplied by the maximum amount allowable but not less than 100% to arrive at the amount eligible for the corporate dividend-received deduction.
The foregoing information is presented to assist shareholders in reporting distributions received from the Fund to the Internal Revenue Service. Because of the complexity of the federal regulations which may affect your individual tax return and the many variations in state and local tax regulations, we recommend that you consult your tax advisor for specific guidance.
| | | | |
| 23 | | | | OPPENHEIMER VALUE FUND/VA |
BOARD APPROVAL OF THE FUND’S INVESTMENT
ADVISORY AGREEMENT Unaudited
Each year, the Board of Trustees (the “Board”), including a majority of the independent Trustees, is required to determine whether to renew the Fund’s investment advisory agreement (the “Agreement”). The Investment Company Act of 1940, as amended, requires that the Board request and evaluate, and that the Manager provide, such information as may be reasonably necessary to evaluate the terms of the Agreement. The Board employs an independent consultant to prepare a report that provides information, including comparative information that the Board requests for that purpose. In addition to in-person meetings focused on this evaluation, the Board receives information throughout the year regarding Fund services, fees, expenses and performance.
The Manager and the independent consultant provided information to the Board on the following factors: (i) the nature, quality and extent of the Manager’s services, (ii) the investment performance of the Fund and the Manager, (iii) the fees and expenses of the Fund, including comparative expense information, (iv) the profitability of the Manager and its affiliates, including an analysis of the cost of providing services, (v) whether economies of scale are realized as the Fund grows and whether fee levels reflect these economies of scale for Fund investors and (vi) other benefits to the Manager from its relationship with the Fund. The Board was aware that there are alternatives to retaining the Manager.
Outlined below is a summary of the principal information considered by the Board as well as the Board’s conclusions.
Nature, Quality and Extent of Services. The Board considered information about the nature, quality and extent of the services provided to the Fund and information regarding the Manager’s key personnel who provide such services. The Manager’s duties include providing the Fund with the services of the portfolio manager and the Manager’s investment team, who provide research, analysis and other advisory services in regard to the Fund’s investments; securities trading services; oversight of third-party service providers; monitoring compliance with applicable Fund policies and procedures and adherence to the Fund’s investment restrictions; and risk management. The Manager is responsible for providing certain administrative services to the Fund as well. Those services include providing and supervising all administrative and clerical personnel who are necessary in order to provide effective corporate administration for the Fund; compiling and maintaining records with respect to the Fund’s operations; preparing and filing reports required by the Securities and Exchange Commission; preparing periodic reports regarding the operations of the Fund for its shareholders; preparing proxy materials for shareholder meetings; and preparing the registration statements required by Federal and state securities laws for the sale of the Fund’s shares. The Manager also provides the Fund with office space, facilities and equipment.
The Board also considered the quality of the services provided and the quality of the Manager’s resources that are available to the Fund. The Board took account of the fact that the Manager has had over fifty years of experience as an investment adviser and that its assets under management rank it among the top mutual fund managers in the United States. The Board evaluated the Manager’s advisory, administrative, accounting, legal, compliance services and risk management, and information the Board has received regarding the experience and professional qualifications of the Manager’s key personnel and the size and functions of its staff. In its evaluation of the quality of the portfolio management services provided, the Board considered the experience of Mitch Williams, the portfolio manager for the Fund, and the Manager’s investment team and analysts. The Board members also considered the totality of their experiences with the Manager as directors or trustees of the Fund and other funds advised by the Manager. The Board considered information regarding the quality of services provided by affiliates of the Manager, which its members have become knowledgeable about in connection with the renewal of the Fund’s service agreements. The Board concluded, in light of the Manager’s experience, reputation, personnel, operations and resources that the Fund benefits from the services provided under the Agreement.
Investment Performance of the Manager and the Fund. Throughout the year, the Manager provided information on the investment performance of the Fund, including comparative performance information. The Board also reviewed information, prepared by the Manager and by the independent consultant, comparing the Fund’s historical performance to relevant market indices and to the performance of other large-cap value funds underlying variable insurance products. The Board considered that the Fund outperformed its performance universe median during the three- and five-year periods but underperformed its performance universe median during the one-year period.
Costs of Services by the Manager. The Board reviewed the fees paid to the Manager and the other expenses borne by the Fund. The Board also considered the comparability of the fees charged and the services provided to the Fund to the fees and services for other clients or accounts advised by the Manager. The independent consultant provided comparative data in regard to the fees and expenses of the Fund and other large-cap value funds underlying variable insurance products. In reviewing the fees and expenses charged to the VA funds, the Board considered the Manager’s assertion that, because there is much greater disparity in the fees and services that may be provided by a manager to a VA fund as opposed to a retail fund, when comparing the expenses of the various VA funds to those of retail funds, it is most appropriate to focus on total expenses (rather than on the management fees). Accordingly, while the Board reviewed and considered all expenses, it focused on total expenses. The Board considered that the Fund’s total expenses were lower than its expense group median but higher than its expense group average. The Board also considered that the Fund’s actual management fees were lower than its expense group median and average. The Board noted that the Manager has voluntarily agreed to waive fees and/or reimburse the Fund for certain expenses in order to limit “Total Annual Fund Operating Expenses After Fee Waivers and/or Expense Reimbursement” (excluding (i) interest, taxes, dividends tied to short sales, brokerage commissions, and other expenditures which are capitalized in accordance with generally accepted accounting principles; (ii) expenses incurred directly or indirectly by the Fund as a result of investments in other investment companies, wholly-owned subsidiaries and pooled investment vehicles; (iii) certain other expenses attributable to, and incurred as a result of, a Fund’s investments; and (iv) other extraordinary expenses (including litigation expenses) not incurred in the ordinary course of the Fund’s business) to the annual rates of 0.80% for Non-Service Shares and 1.05% for Service Shares as calculated on the daily net assets of the Fund. This waiver and/or reimbursement may not be amended or withdrawn until one year after the date of the Fund’s prospectus.
Economies of Scale and Profits Realized by the Manager. The Board considered information regarding the Manager’s costs in serving as the Fund’s investment adviser, including the costs associated with the personnel and systems necessary to manage the Fund, and information regarding the Manager’s profitability from its relationship with the Fund. The Board reviewed whether the Manager may realize economies of scale in managing and supporting the Fund. The Board noted that the Fund currently has management fee breakpoints, which are intended to share with Fund shareholders economies of scale that may exist as the Fund’s assets grow.
| | | | |
| 24 | | | | OPPENHEIMER VALUE FUND/VA |
Other Benefits to the Manager. In addition to considering the profits realized by the Manager, the Board considered information that was provided regarding the direct and indirect benefits the Manager receives as a result of its relationship with the Fund, including compensation paid to the Manager’s affiliates and research provided to the Manager in connection with permissible brokerage arrangements (soft dollar arrangements). The Board also considered that the Manager must be able to pay and retain experienced professional personnel at competitive rates to provide quality services to the Fund.
Conclusions. These factors were also considered by the independent Trustees meeting separately from the full Board, assisted by experienced counsel to the Fund and to the independent Trustees. Fund counsel and the independent Trustees’ counsel are independent of the Manager within the meaning and intent of the Securities and Exchange Commission Rules.
Based on its review of the information it received and its evaluations described above, the Board, including a majority of the independent Trustees, decided to continue the Agreement. In addition, the Board, including a majority of the Independent Trustees, approved the restructuring of the Fund’s investment advisory arrangement so that effective January 1, 2013, (i) OFI Global Asset Management, Inc. (“OFI Global”), a wholly owned subsidiary of the Manager, will serve as the investment adviser to the Fund in place of the Manager under a Restated Advisory Agreement (“Restated Advisory Agreement”), and (ii) OFI Global will enter into a Sub-Advisory Agreement (“Sub-Advisory Agreement”) with the Manager to provide investment sub-advisory services to the Fund. OFI Global will pay the Manager a percentage of the net investment advisory fee (after all applicable waivers have been deducted) that it receives from the Fund. The Agreement will continue until earlier of August 31, 2013 or the effective date of the Restated Advisory Agreement between the Fund and OFI Global. The Restated Advisory Agreement and Sub-Advisory Agreement will continue until August 31, 2013.
In arriving at its decisions, the Board did not single out any factor or factors as being more important than others, but considered all of the above information, and considered the terms and conditions of the Agreement, Restated Advisory Agreement and Sub-Advisory Agreement, including the management fees, in light of all the surrounding circumstances.
| | | | |
| 25 | | | | OPPENHEIMER VALUE FUND/VA |
PORTFOLIO PROXY VOTING POLICIES AND PROCEDURES;
UPDATES TO STATEMENTS OF INVESTMENTS Unaudited/(Continued)
The Fund has adopted Portfolio Proxy Voting Policies and Procedures under which the Fund votes proxies relating to securities (“portfolio proxies”) held by the Fund. A description of the Fund’s Portfolio Proxy Voting Policies and Procedures is available (i) without charge, upon request, by calling the Fund toll-free at 1.800.525.7048, (ii) on the Fund’s website at oppenheimerfunds.com, and (iii) on the SEC’s website at www.sec.gov. In addition, the Fund is required to file Form N-PX, with its complete proxy voting record for the 12 months ended June 30th, no later than August 31st of each year. The Fund’s voting record is available (i) without charge, upon request, by calling the Fund toll-free at 1.800.525.7048, and (ii) in the Form N-PX filing on the SEC’s website at www.sec.gov.
The Fund files its complete schedule of portfolio holdings with the SEC for the first quarter and the third quarter of each fiscal year on Form N-Q. The Fund’s Form N-Q filings are available on the SEC’s website at www.sec.gov. Those forms may be reviewed and copied at the SEC’s Public Reference Room in Washington, D.C. Information on the operation of the Public Reference Room may be obtained by calling 1-800-SEC-0330.
| | | | |
| 26 | | | | OPPENHEIMER VALUE FUND/VA |
TRUSTEES AND OFFICERS BIOS Unaudited
| | |
| Name, Position(s) Held with the Fund, Length of Service, Age | | Principal Occupation(s) During the Past 5 Years; Other Trusteeships/Directorships Held; Number of Portfolios in the Fund Complex Currently Overseen |
| |
INDEPENDENT TRUSTEES | | The address of each Trustee in the chart below is 6803 S. Tucson Way, Centennial, Colorado 80112-3924. Each Trustee serves for an indefinite term, or until his or her resignation, retirement, death or removal. |
| |
Sam Freedman, Chairman of the Board of Trustees (since 2012) and Trustee (since 2002) Age: 72 | | Director of Colorado UpLIFT (charitable organization) (since September 1984). Mr. Freedman held several positions with the Sub-Adviser and with subsidiary or affiliated companies of the Sub-Adviser (until October 1994). Oversees 36 portfolios in the OppenheimerFunds complex. Mr. Freedman has served on the Boards of certain Oppenheimer funds since 1996, during which time he has become familiar with the Fund’s (and other Oppenheimer funds’) financial, accounting, regulatory and investment matters and has contributed to the Boards’ deliberations. |
| |
Edward L. Cameron, Trustee (since 2002) Age: 74 | | Member of The Life Guard of Mount Vernon (George Washington historical site) (June 2000 – June 2006); Partner of PricewaterhouseCoopers LLP (accounting firm) (July 1974-June 1999); Chairman of Price Waterhouse LLP Global Investment Management Industry Services Group (accounting firm) (July 1994-June 1998). Oversees 36 portfolios in the OppenheimerFunds complex. Mr. Cameron has served on the Boards of certain Oppenheimer funds since 1999, during which time he has become familiar with the Fund’s (and other Oppenheimer funds’) financial, accounting, regulatory and investment matters and has contributed to the Boards’ deliberations. |
| |
Jon S. Fossel, Trustee (since 2002) Age: 70 | | Chairman of the Board (2006-December 2011) and Director (June 2002-December 2011) of UNUMProvident (insurance company); Director of Northwestern Energy Corp. (public utility corporation) (November 2004-December 2009); Director of P.R. Pharmaceuticals (October 1999-October 2003); Director of Rocky Mountain Elk Foundation (non-profit organization) (February 1998-February 2003 and February 2005-February 2007); Chairman and Director (until October 1996) and President and Chief Executive Officer (until October 1995) of the Sub-Adviser; President, Chief Executive Officer and Director of the following: Oppenheimer Acquisition Corp. (“OAC”) (parent holding company of the Sub-Adviser), Shareholders Services, Inc. and Shareholder Financial Services, Inc. (until October 1995). Oversees 36 portfolios in the OppenheimerFunds complex. Mr. Fossel has served on the Boards of certain Oppenheimer funds since 1990, during which time he has become familiar with the Fund’s (and other Oppenheimer funds’) financial, accounting, regulatory and investment matters and has contributed to the Boards’ deliberations. |
| |
Richard F. Grabish, Trustee (since 2012) Age: 64 | | Formerly Senior Vice President and Assistant Director of Sales and Marketing (March 1997-December 2007), Director (March 1987-December 2007) and Manager of Private Client Services (June 1985-June 2005) of A.G. Edwards & Sons, Inc. (broker/dealer and investment firm); Chairman and Chief Executive Officer of A.G. Edwards Trust Company, FSB (March 2001-December 2007); President and Vice Chairman of A.G. Edwards Trust Company, FSB (investment adviser) (April 1987-March 2001); President of A.G. Edwards Trust Company, FSB (investment adviser) (June 2005-December 2007). Oversees 36 portfolios in the OppenheimerFunds complex. Mr. Grabish has served on the Boards of certain Oppenheimer funds since 2001, during which time he has become familiar with the Fund’s (and other Oppenheimer funds’) financial, accounting, regulatory and investment matters and has contributed to the Boards’ deliberations. |
| |
Beverly L. Hamilton, Trustee (since 2002) Age: 66 | | Trustee of Monterey Institute for International Studies (educational organization) (since February 2000); Board Member of Middlebury College (educational organization) (December 2005-June 2011); Chairman (since 2010) of American Funds’ Emerging Markets Growth Fund, Inc. (mutual fund); Director of The California Endowment (philanthropic organization) (April 2002-April 2008); Director (February 2002-2005) and Chairman of Trustees (2006-2007) of the Community Hospital of Monterey Peninsula; Director (October 1991-2005); Vice Chairman (2006-2009) of American Funds’ Emerging Markets Growth Fund, Inc. (mutual fund); President of ARCO Investment Management Company (February 1991-April 2000); Member of the investment committees of The Rockefeller Foundation (2001-2006) and The University of Michigan (since 2000); Advisor at Credit Suisse First Boston’s Sprout venture capital unit (venture capital fund) (1994-January 2005); Trustee of MassMutual Institutional Funds (investment company) (1996-June 2004); Trustee of MML Series Investment Fund (investment company) (April 1989-June 2004); Member of the investment committee of Hartford Hospital (2000-2003); and Advisor to Unilever (Holland) pension fund (2000-2003). Oversees 36 portfolios in the OppenheimerFunds complex. Ms. Hamilton has served on the Boards of certain Oppenheimer funds since 2002, during which time she has become familiar with the Fund’s (and other Oppenheimer funds’) financial, accounting, regulatory and investment matters and has contributed to the Boards’ deliberations. |
| |
Victoria J. Herget, Trustee (since 2012) Age: 61 | | Independent Director of the First American Funds (mutual fund family) (2003-2011); former Managing Director (1993-2001), Principal (1985-1993), Vice President (1978-1985) and Assistant Vice President (1973-1978) of Zurich Scudder Investments (and its predecessor firms); Board Chair (2008-Present) and Director (2004-Present), United Educators (insurance company); Trustee (1992-2007), Chair of the Board of Trustees (1999-2007), Investment Committee Chair (1994-1999) and Investment Committee member (2007-2010) of Wellesley College; Trustee (since 2000) and Chair (since 2010), Newberry Library; Trustee, Mather LifeWays (since 2001); Trustee, BoardSource (2006-2009) and Chicago City Day School (1994-2005). Oversees 36 portfolios in the OppenheimerFunds complex. Ms. Herget has served on the Boards of certain Oppenheimer funds since 2012, during which time she has become familiar with the Fund’s (and other Oppenheimer funds’) financial, accounting, regulatory and investment matters and has contributed to the Boards’ deliberations. |
| |
Robert J. Malone, Trustee (since 2002) Age: 68 | | Board of Directors of Opera Colorado Foundation (non-profit organization) (since March 2008); Director of Jones Knowledge, Inc. (2006-2010); Director of Jones International University (educational organization) (since August 2005); Chairman, Chief Executive Officer and Director of Steele Street Bank & Trust (commercial banking) (since August 2003); Director of Colorado UpLIFT (charitable organization) (1986-2010); Trustee of the Gallagher Family Foundation (non-profit organization) (since 2000); Former Chairman of U.S. Bank-Colorado (subsidiary of U.S. Bancorp and formerly Colorado National Bank) (July 1996-April 1999); Director of Commercial Assets, Inc. (real estate investment trust) (1993-2000); Director of Jones Knowledge, Inc. (2001-July 2004); Director of U.S. Exploration, Inc. (oil and gas exploration) (1997-February 2004); Chairman of the Board (1991-1994) and Trustee (1985-1994) of Regis University; and Chairman of the Board (1990-1991) and Trustee (1984-1999) of Young Presidents Organization. Oversees 36 portfolios in the OppenheimerFunds complex. Mr. Malone has served on the Boards of certain Oppenheimer funds since 2002, during which time he has become familiar with the Fund’s (and other Oppenheimer funds’) financial, accounting, regulatory and investment matters and has contributed to the Boards’ deliberations. |
| |
F. William Marshall, Jr., Trustee (since 2002) Age: 70 | | Trustee Emeritus of Worcester Polytech Institute (WPI) (private university) (since 2009); Trustee of MassMutual Select Funds (formerly MassMutual Institutional Funds) (investment company) (since 1996) and MML Series Investment Fund (investment company) (since 1996) and Mass Mutual Premier Funds (investment company) (since January 2012); President and Treasurer of the SIS Funds (private charitable fund) (January 1999 – March 2011); Former Trustee of WPI (1985-2008); Former Chairman of the Board (2004-2006) and Former Chairman of the Investment Committee of WPI (1994-2008); Chairman of SIS & Family Bank, F.S.B. (formerly SIS Bank) (commercial bank) (January 1999-July 1999); Executive Vice President of Peoples Heritage Financial Group, Inc. (commercial bank) (January 1999-July 1999); and Former President and Chief Executive Officer of SIS Bancorp. (1993-1999). Oversees 40 portfolios in the OppenheimerFunds complex. Mr. Marshall has served on the Boards of certain Oppenheimer funds since 2000, during which time he has become familiar with the Fund’s (and other Oppenheimer funds’) financial, accounting, regulatory and investment matters and has contributed to the Boards’ deliberations. |
| | | | |
| 27 | | | | OPPENHEIMER VALUE FUND/VA |
TRUSTEES AND OFFICERS BIOS Unaudited/Continued
| | |
Karen L. Stuckey, Trustee (since 2012) Age: 59 | | Partner (1990-2012) of PricewaterhouseCoopers LLP (held various positions 1975-1990); Trustee (1992-2006) and member of Executive, Nominating and Audit Committees and Chair of Finance Committee of Lehigh University; and member, Women’s Investment Management Forum since inception. Oversees 36 portfolios in the OppenheimerFunds complex. Ms. Stuckey has served on the Boards of certain Oppenheimer funds since 2012, during which time she has become familiar with the Fund’s (and other Oppenheimer funds’) financial, accounting, regulatory and investment matters and has contributed to the Boards’ deliberations. |
| |
James D. Vaughn, Trustee (since 2012) Age: 67 | | Retired; former managing partner (1994-2001) of Denver office of Deloitte & Touche LLP, (held various positions 1969-1993); Trustee and Chairman of the Audit Committee of Schroder Funds (2003-2012); Board member and Chairman of Audit Committee of AMG National Trust Bank (since 2005); Trustee, Audit Committee member and Investment Committee member, University of South Dakota Foundation (since 1996); Board member, Executive Committee Member, Audit Committee Member and past Board Chair, Junior Achievement (since 1993); former Board member, Mile High United Way, Boys and Girls Clubs, Boy Scouts, Colorado Business Committee for the Arts, Economic Club of Colorado and Metro Denver Network. Oversees 36 portfolios in the OppenheimerFunds complex. Mr. Vaughn has served on the Boards of certain Oppenheimer funds since 2012, during which time he has become familiar with the Fund’s (and other Oppenheimer funds’) financial, accounting, regulatory and investment matters and has contributed to the Boards’ deliberations. |
INTERESTED TRUSTEE
AND OFFICER | | The address of Mr. Glavin is Two World Financial Center, 225 Liberty Street, 11th Floor, New York, New York 10281-1008. Mr. Glavin serves as a Trustee for an indefinite term, or until his resignation, retirement, death or removal and as an Officer for an indefinite term, or until his resignation, retirement, death or removal. Mr. Glavin is an Interested Trustee due to his positions with OppenheimerFunds, Inc. and its affiliates. |
| |
William F. Glavin, Jr., Trustee, President and Principal Executive Officer (since 2009) Age: 53 | | Chief Executive Officer of OppenheimerFunds (since January 2013); Director, Chief Executive Officer and President of the Manager (since January 2013); Chairman of the Sub-Adviser (December 2009-December 2012); Chief Executive Officer (January 2009-December 2012) and Director of the Sub-Adviser (since January 2009); President of the Sub-Adviser (May 2009-December 2012); Management Director (since June 2009), President (since December 2009) and Chief Executive Officer (since January 2011) of Oppenheimer Acquisition Corp. (“OAC”) (the Sub-Adviser’s parent holding company); Director of Oppenheimer Real Asset Management, Inc. (since March 2010); Executive Vice President (March 2006-February 2009) and Chief Operating Officer (July 2007-February 2009) of Massachusetts Mutual Life Insurance Company (OAC’s parent company); Director (May 2004-March 2006) and Chief Operating Officer and Chief Compliance Officer (May 2004-January 2005), President (January 2005-March 2006) and Chief Executive Officer (June 2005-March 2006) of Babson Capital Management LLC; Director (March 2005-March 2006), President (May 2003-March 2006) and Chief Compliance Officer (July 2005-March 2006) of Babson Capital Securities, Inc. (a broker-dealer); President (May 2003-March 2006) of Babson Investment Company, Inc.; Director (May 2004-August 2006) of Babson Capital Europe Limited; Director (May 2004-October 2006) of Babson Capital Guernsey Limited; Director (May 2004-March 2006) of Babson Capital Management LLC; Non-Executive Director (March 2005-March 2007) of Baring Asset Management Limited; Director (February 2005-June 2006) Baring Pension Trustees Limited; Director and Treasurer (December 2003-November 2006) of Charter Oak Capital Management, Inc.; Director (May 2006-September 2006) of C.M. Benefit Insurance Company; Director (May 2008-June 2009) and Executive Vice President (June 2007-July 2009) of C.M. Life Insurance Company; President (March 2006-May 2007) of MassMutual Assignment Company; Director (January 2005-December 2006), Deputy Chairman (March 2005-December 2006) and President (February 2005-March 2005) of MassMutual Holdings (Bermuda) Limited; Director (May 2008-June 2009) and Executive Vice President (June 2007-July 2009) of MML Bay State Life Insurance Company; Chief Executive Officer and President (April 2007-January 2009) of MML Distributors, LLC; and Chairman (March 2006-December 2008) and Chief Executive Officer (May 2007-December 2008) of MML Investors Services, Inc. An officer of 86 portfolios in the OppenheimerFunds complex. |
| OTHER OFFICERS OF THE FUND | | The addresses of the Officers in the chart below are as follows: for Messrs. Williams, Gabinet and Ms. Nasta, Two World Financial Center, 225 Liberty Street, New York, New York 10281-1008, for Messrs. Vandehey and Wixted, 6803 S. Tucson Way, Centennial, Colorado 80112-3924. Each Officer serves for an indefinite term or until his or her resignation, retirement, death or removal. |
| |
Mitch Williams, Vice President (since 2008) Age: 44 | | Vice President of the Sub-Adviser (since July 2006); CFA and a Senior Research Analyst of the Sub-Adviser (since April 2002). Prior to joining the Sub-Adviser, Vice President and Research Analyst for Evergreen Funds (October 2000-January 2002). A portfolio manager and officer of 5 portfolios in the OppenheimerFunds complex. |
| |
Arthur S. Gabinet, Secretary and Chief Legal Officer (since 2011) Age: 54 | | General Counsel of OppenheimerFunds (since January 2013); Executive Vice President, Secretary and General Counsel of the Manager (since January 2013); General Counsel OFI SteelPath, Inc. (since January 2013); Executive Vice President (May 2010-December 2012) and General Counsel (since January 2011) of the Sub-Adviser; General Counsel of the Distributor (since January 2011); General Counsel of Centennial Asset Management Corporation (January 2011-December 2012); Executive Vice President (January 2011-December 2012) and General Counsel of HarbourView Asset Management Corporation (since January 2011); Assistant Secretary (since January 2011) and Director (since January 2011) of OppenheimerFunds International Ltd. and OppenheimerFunds plc; Director of Oppenheimer Real Asset Management, Inc. (January 2011-December 2012) and General Counsel (since January 2011); Executive Vice President (January 2011-December 2011) and General Counsel of Shareholder Financial Services, Inc. and Shareholder Services, Inc. (since January 2011); Executive Vice President (January 2011-December 2012) and General Counsel of OFI Private Investments Inc. (since January 2011); Vice President of OppenheimerFunds Legacy Program (January 2011-December 2011); Executive Vice President (January 2011-December 2012) and General Counsel of OFI Institutional Asset Management, Inc. (since January 2011); General Counsel, Asset Management of the Sub-Adviser (May 2010-December 2010); Principal, The Vanguard Group (November 2005-April 2010); District Administrator, U.S. Securities and Exchange Commission (January 2003-October 2005). An officer of 86 portfolios in the OppenheimerFunds complex. |
| |
Christina M. Nasta, Vice President and Chief Business Officer
(since 2011) Age: 39 | | Senior Vice President of OppenheimerFunds Distributor, Inc. (since January 2013); Senior Vice President of the Sub-Adviser (July 2010-December 2012); Vice President of the Sub-Adviser (January 2003-July 2010); Vice President of OppenheimerFunds Distributor, Inc. (January 2003-July 2010). An officer of 86 portfolios in the OppenheimerFunds complex. |
| |
Mark S. Vandehey, Vice President and Chief Compliance Officer
(since 2004) Age: 62 | | Chief Compliance Officer of OppenheimerFunds (since January 2013); Senior Vice President and Chief Compliance Officer of the Manager (since January 2013); Chief Compliance Officer of OFI SteelPath, Inc. (since January 2013); Senior Vice President of the Sub-Adviser (March 2004-December 2012); Chief Compliance Officer of the Sub-Adviser, OppenheimerFunds Distributor, Inc., OFI Trust Company, OFI Institutional Asset Management, Inc., Oppenheimer Real Asset Management, Inc., OFI Private Investments, Inc., Harborview Asset Management Corporation, Trinity Investment Management Corporation, and Shareholder Services, Inc. (since March 2004); Vice President of OppenheimerFunds Distributor, Inc., Centennial Asset Management Corporation and Shareholder Services, Inc. (June 1983-December 2012). An officer of 86 portfolios in the OppenheimerFunds complex. |
| | | | |
| 28 | | | | OPPENHEIMER VALUE FUND/VA |
| | |
Brian W. Wixted,
Treasurer and Principal Financial & Accounting Officer
(since 2002)
Age: 53 | | Senior Vice President of the Manager (since January 2013); Treasurer of the Sub-Adviser, HarbourView Asset Management Corporation, Shareholder Financial Services, Inc., Shareholder Services, Inc., and Oppenheimer Real Asset Management, Inc. (March 1999-June 2008), OFI Private Investments, Inc. (March 2000-June 2008), OppenheimerFunds International Ltd. and OppenheimerFunds plc (since May 2000), OFI Institutional Asset Management, Inc. (November 2000-June 2008), and OppenheimerFunds Legacy Program (charitable trust program established by the Sub-Adviser) (June 2003-December 2011); Treasurer and Chief Financial Officer of OFI Trust Company (since May 2000); Assistant Treasurer of Oppenheimer Acquisition Corporation (March 1999-June 2008). An officer of 86 portfolios in the OppenheimerFunds complex. |
The Fund’s Statement of Additional Information contains additional information about the Fund’s Trustees and Officers and is available without charge, upon request, by calling 1.800.988.8287.
| | | | |
| 29 | | | | OPPENHEIMER VALUE FUND/VA |
OPPENHEIMER VALUE FUND/VA
| | |
| A Series of Oppenheimer Variable Account Funds |
| Manager | | OFI Global Asset Management, Inc. |
| Sub-Adviser | | OppenheimerFunds, Inc. |
| Distributor | | OppenheimerFunds Distributor, Inc. |
| Transfer and Shareholder Servicing Agent | | OFI Global Asset Management, Inc. |
| Sub-Transfer Agent | | Shareholder Services, Inc. DBA OppenheimerFunds Services |
| Independent Registered Public Accounting Firm | | KPMGLLP |
| Counsel | | K&L Gates LLP |
| |
| | | Before investing, investors should carefully consider a fund’s investment objectives, risks, charges and expenses. Fund prospectuses and summary prospectuses contain this and other information about the funds, and may be obtained by asking your financial advisor, or calling us at 1.800.988.8287. Read prospectuses and summary prospectuses carefully before investing. |
| | |
| ©2013 OppenheimerFunds, Inc. All rights reserved. | | |
The registrant has adopted a code of ethics that applies to the registrant’s principal executive officer, principal financial officer, principal accounting officer or controller or persons performing similar functions.
| Item 3. | Audit Committee Financial Expert. |
The Board of Trustees of the registrant has determined that F. William Marshall, Jr., the Chairman of the Board’s Audit Committee, is the audit committee financial expert and that Mr. Marshall is “independent” for purposes of this Item 3.
| Item 4. | Principal Accountant Fees and Services. |
The principal accountant for the audit of the registrant’s annual financial statements billed $288,400 in fiscal 2012 and $287,200 in fiscal 2011.
The principal accountant for the audit of the registrant’s annual financial statements billed $13,050 in fiscal 2012 and no such fees in fiscal 2011.
The principal accountant for the audit of the registrant’s annual financial statements billed $264,139 in fiscal 2012 and $414,870 in fiscal 2011 to the registrant’s investment adviser or any entity controlling, controlled by, or under common control with the adviser that provides ongoing services to the registrant.
Such services include: Internal control reviews, compliance procedures, GIPS attestation procedures, internal audit training, surprise exams, and system conversion testing.
The principal accountant for the audit of the registrant’s annual financial statements billed $6,785 in fiscal 2012 and $5,090 in fiscal 2011.
The principal accountant for the audit of the registrant’s annual financial statements billed $451,924 in fiscal 2012 and no such fees in fiscal 2011 to the registrant’s investment adviser or any entity controlling, controlled by, or under common control with the adviser that provides ongoing services to the registrant.
Such services include: tax compliance, tax planning and tax advice. Tax compliance generally involves preparation of original and amended tax returns, claims for a refund and tax payment-planning services. Tax planning and tax advice includes assistance with tax audits and appeals, tax advice related to mergers and acquisitions and requests for rulings or technical advice from taxing authorities.
The principal accountant for the audit of the registrant’s annual financial statements billed no such fees in fiscal 2012 and no such fees in fiscal 2011.
The principal accountant for the audit of the registrant’s annual financial statements billed no such fees in fiscal 2012 and no such fees in fiscal 2011 to the registrant’s investment adviser or any entity controlling, controlled by, or under common control with the adviser that provides ongoing services to the registrant.
Such fees would include the cost to the principal accountant of attending audit committee meetings and consultations regarding the registrant’s retirement plan with respect to its Trustees.
| (e) | (1) During its regularly scheduled periodic meetings, the registrant’s audit committee will pre-approve all audit, audit-related, tax and other services to be provided by the principal accountants of the registrant. |
The audit committee has delegated pre-approval authority to its Chairman for any subsequent new engagements that arise between regularly scheduled meeting dates provided that any fees such pre-approved are presented to the audit committee at its next regularly scheduled meeting.
Under applicable laws, pre-approval of non-audit services may be waived provided that: 1) the aggregate amount of all such services provided constitutes no more than five percent of the total amount of fees paid by the registrant to its principal accountant during the fiscal year in which services are provided 2) such services were not recognized by the registrant at the time of engagement as non-audit services and 3) such services are promptly brought to the attention of the audit committee of the registrant and approved prior to the completion of the audit.
(2) 0%
| (f) | Not applicable as less than 50%. |
| (g) | The principal accountant for the audit of the registrant’s annual financial statements billed 7180465 in fiscal 2012 and 4153790 in fiscal 2011 to the registrant and the registrant’s investment adviser or any entity controlling, controlled by, or under common control with the adviser that provides ongoing services to the registrant related to non-audit fees. Those billings did not include any prohibited non-audit services as defined by the Securities Exchange Act of 1934. |
| (h) | The registrant’s audit committee of the board of Trustees has considered whether the provision of non-audit services that were rendered to the registrant’s investment adviser, and any entity controlling, controlled by, or under common control with the investment adviser that provides ongoing services to the registrant that were not pre-approved pursuant to paragraph (c)(7)(ii) of Rule 2-01 of Regulation S-X is compatible with maintaining the principal accountant’s independence. No such services were rendered. |
| Item 5. | Audit Committee of Listed Registrants |
Not applicable.
| Item 6. | Schedule of Investments. |
a) Not applicable. The complete schedule of investments is included in Item 1 of this Form N-CSR.
b) Not applicable.
| Item 7. | Disclosure of Proxy Voting Policies and Procedures for Closed-End Management Investment Companies. |
Not applicable.
| Item 8. | Portfolio Managers of Closed-End Management Investment Companies. |
Not applicable.
| Item 9. | Purchases of Equity Securities by Closed-End Management Investment Company and Affiliated Purchasers. |
Not applicable.
| Item 10. | Submission of Matters to a Vote of Security Holders. |
The Fund’s Governance Committee Provisions with Respect to Nominations of Directors/Trustees to the Respective Boards
None
| Item 11. | Controls and Procedures. |
Based on their evaluation of the registrant’s disclosure controls and procedures (as defined in rule 30a-3(c) under the Investment Company Act of 1940 (17 CFR 270.30a-3(c)) as of 12/31/2012, the registrant’s principal executive officer and principal financial officer found the registrant’s disclosure controls and procedures to provide reasonable assurances that information required to be disclosed by the registrant in the reports that it files under the Securities Exchange Act of 1934 (a) is accumulated and communicated to registrant’s management, including its principal executive officer and principal financial officer, to allow timely decisions regarding required disclosure, and (b) is recorded, processed, summarized and reported, within the time periods specified in the rules and forms adopted by the U.S. Securities and Exchange Commission.
There have been no changes in the registrant’s internal controls over financial reporting that occurred during the registrant’s second fiscal quarter of the period covered by this report that have materially affected, or are reasonably likely to materially affect, the registrant’s internal control over financial reporting.
| (a) | (1) Exhibit attached hereto. |
(2) Exhibits attached hereto.
(3) Not applicable.
| (b) | Exhibit attached hereto. |
SIGNATURES
Pursuant to the requirements of the Securities Exchange Act of 1934 and the Investment Company Act of 1940, the registrant has duly caused this report to be signed on its behalf by the undersigned, thereunto duly authorized.
| | |
| Oppenheimer Variable Account Funds |
| |
| By: | | /s/ William F. Glavin, Jr. |
| | William F. Glavin, Jr. |
| | Principal Executive Officer |
| Date: 2/11/2013 |
Pursuant to the requirements of the Securities Exchange Act of 1934 and the Investment Company Act of 1940, this report has been signed below by the following persons on behalf of the registrant and in the capacities and on the dates indicated.
| | |
| By: | | /s/ William F. Glavin, Jr. |
| | William F. Glavin, Jr. |
| | Principal Executive Officer |
| Date: 2/11/2013 |
| |
| By: | | /s/ Brian W. Wixted |
| | Brian W. Wixted |
| | Principal Financial Officer |
| Date: 2/11/2013 |